Embed Size (px)
Citation preview

Copyright 2003Ingram Technologies, LLC
All Rights Reserved
TrafficCount
TrafficCount

Table of Contents
Section I - AT Download
Section II - Traffic Count
Introduction:Welcome to Auto-Trax Traffic Count ............................... Terms and conventionsInstallation of Software ..................................................Technical Support ..........................................................
Download process overview ..........................................Setting up the Download ................................................Download Step by Step ..................................................
Comm Port..........................................................Log File Name & Location....................................Start data stream .................................................Close & Save data ...............................................
Raw Data vs Open Data File...........................................Opening a “Raw Data” file...............................................Processing “Raw Data” files...........................................
Modify the Header...............................................Setting Headway & Range ..................................Modify “Raw Data” ..............................................
Opening a Survey ..........................................................Survey Summary ...........................................................
Speed ProfileVehicle Speeds ..............................................................Daily Volume / Time Counts ...........................................85th Percentile ..............................................................15 Minute Breakdown ....................................................Weekly Summary ..........................................................Administration Setup .....................................................
Adding & Deleting OfficersDatabase ......................................................................
Backup & RestoreDeleting
Sample Graphs & Reports .............................................Traffic Count Notes ........................................................
1
2
3
4555667
889
101011111213141516171819
20
2128

Welcome to AutoTrax Traffic Count
Welcome to the Traffic Count User Manual -a complete guide to exploring and using the Auto-Trax Traffic Count traffic management system. Traffic Count is a combination of both hardware and PC-based software, with a strong emphasis on data analysis and traffic pattern interpretation. In connection with the Ingram-Technologies speed signs with the data collection option all the tools necessary to regulate and manage traffic flow and distribution in a given municipality can be accplished.
The Traffic Count philosophy is to record and store each vehicle count - both approaching and receding from the speed sign. Data collection is unconstrained by units of measure and classification schemes as data is analyzed from raw data collection files. With Traffic Count traffic management program, traffic analysis and reports need not be a time consuming and tedious process. Complete survey data is displayed by a single click of the mouse. Graphic displays of bar charts, traffic flows, percentage and time graphs are also a single click of the mouse. In total, one click reporting is a reality with the new Traffic Count program.
- Comm 1, 2, - has reference to the serial port located on the back of your portable or your desktop computer. This port is usually used for communication devices, mouse connections, and occasionally some types of printers. If it is not identified by name (comm 1, comm 2) then you can identify it as a small rounded corner plug with nine male pins.
Instructions on using the software will often refer to a particular menu item in a given menu. For example, when you see REPORTS >> 85th Percentile >> Both Directions, goto the REPORTS menu, select 85th Percentile followed by Both Directions.
Terms and Conventions Used in This Manual
Formatting
Page 1

Installation of Software Page 2
AT Download (pronounced A-T-Download) - use this program to retrievedata from the roadside unit and copy data to your process computer.
Autorun Menu: Insert the Traffic Count CD into the computer CD reader to launch the menu. If the CD does not auto-load, double clickon My Computer and explore the CD in the drive. Double-click onsetup.exe to run/install the menu program.
Traffic Count: - this is the main process program for data analysis and reporting.
Acrobat Reader: - Adobe product used to read Acrobat PDF files. TheTraffic Count manual is in PDF format.
TC Manual: Adobe PDF format of the operation manual for TrafficCount.
Setup - a small application menu to simplify the installation of the TrafficCount programs.
CD Program Content:
Bypass menu: you can bypass the menu and just install the desiredprograms by accessing the CD and double-clicking on the programyou wsh to install. Select My Computer >> CD Drive >> Explore... Autorun >> Installs >> Program to Install

Package Contents:
Page 3
Technical Support:Technical support is only provided to registered users of Ingram Technologies porducts. Our records will confirm current users of the data collection program for the Ingram Technologies speed signs or speed trailers.
Technical support is first provided by Email at “[email protected]”. We will try and resolve any problems or concerns within 24 hours of your email contact with us.If your problem is immediate and cannot wait for an email response, you may contact us at (435) 722-2597 from 9:AM to 4:PM weekdays (Mountain Time Zone)
Your package should include:- This printed manual (An Adobe “PDF” format version of the manual is included on the enclosed CD)- A CD Rom disc containing the programs and manuals- Download cables (included with the sign / trailer) (For connecting the remote speed sign to the download computer - Cb4 to Db9 - this is only necessary where the sign is not equipped with a removable data chip)

Auto-Trax
AT Download

Unloading Data From the Roadside Unit
The unload process allows you to transfers data from the roadside units memory bank to your PC. Data is downloaded in a proprietory data format that is recognized by the Traffic Count program. The data can then be transferred to any computer or location where it can be processed by the Traffic Count program.
The Unload Process
AT Download
There are two methods to retrieve data from the Ingram Technologies roadiside speed sign units. The first method would be to attach a serial cable from the host computer directly to the speed sign and download the data via the serial port. The second is to remove the data chip* from the sign and read the data via a card reader to your process PC. *(This option is available only with the new generation Ingram Technologies speed signs)
Data File Location
The suggested file location is based by default on the install directory where the Traffic Count software is installed. Traffic Count by default looks to its own installation directory for raw <.atx> data files.
Naming File Conventions
For the download raw data file from the roadside unit, a name that suggests the survey location is suggested. ATDownload will automatically supply the proper <.atx> filename extension.
Communicating With the Roadside Unit
ATDownload communicates with Ingram-Technologies roadside units via a standard PC serial communications port and the supplied serial communications cable. This requires a spare 9-pin communications port on the PC you intend to use with Traffic Count. If necessary you can use a standard 9-pin to 25-pin adapter to use a 25 pin communications port. Avoid using an adapter that was supplied with a mouse, however as these usually do not contain all the required connections. An alternative is to place your mouse on the adapter which will free up your 9-pin port.
Page 4

Page 5
Setting Up The Download
To set up your system for downloading remote sign data, you must first connect the radar sign to your download computer with the serial cables supplied with your data collection package.. Connect the CB4 cable with the 2 wires to the sign and the other Cb4 end of the cable to the power jack on the trailer box. Next connect the Db9 plug to the #1 comm port on the computer you plan to use for the download. Usually this would be a laptop computer. To perform a download of data, you must first have the program “AT Download” installed on this computer. You will also need to connect a standard computer keyboard (supplied with the download kit) to the keyboard input of the sign to allow activation of the download process.
Running the Download Program (ATDowlnoad)
AT Download
Select an available comm port on the download computer by clicking on ComPort >> Comm Port Setting
DB
-9
CB
-4
CB
-4
DB-9
Plug End View
CB-4
Radar Sign
12VDCPower Supply
Orientationnotch
Select com 1-4 from the drop down list of available ports. If there is a conflict with the port, a message box will appear suggesting that you choose another port.
Click on CommPort >> Port Open to Receive Data. If the port is activated, a check mark will appear next to the selection and the Status frame will show “Comm Port open for download”. You will need to click on ComPort again to see the check mark. Clicking on Port Open to Receive Data again will remove the check mark and turn the port off.
Step 1
Alternate “SSF Reader”: If you have the newer sign with removable data chip, refer to the addendum before running the Download Program
Page 6AT Download
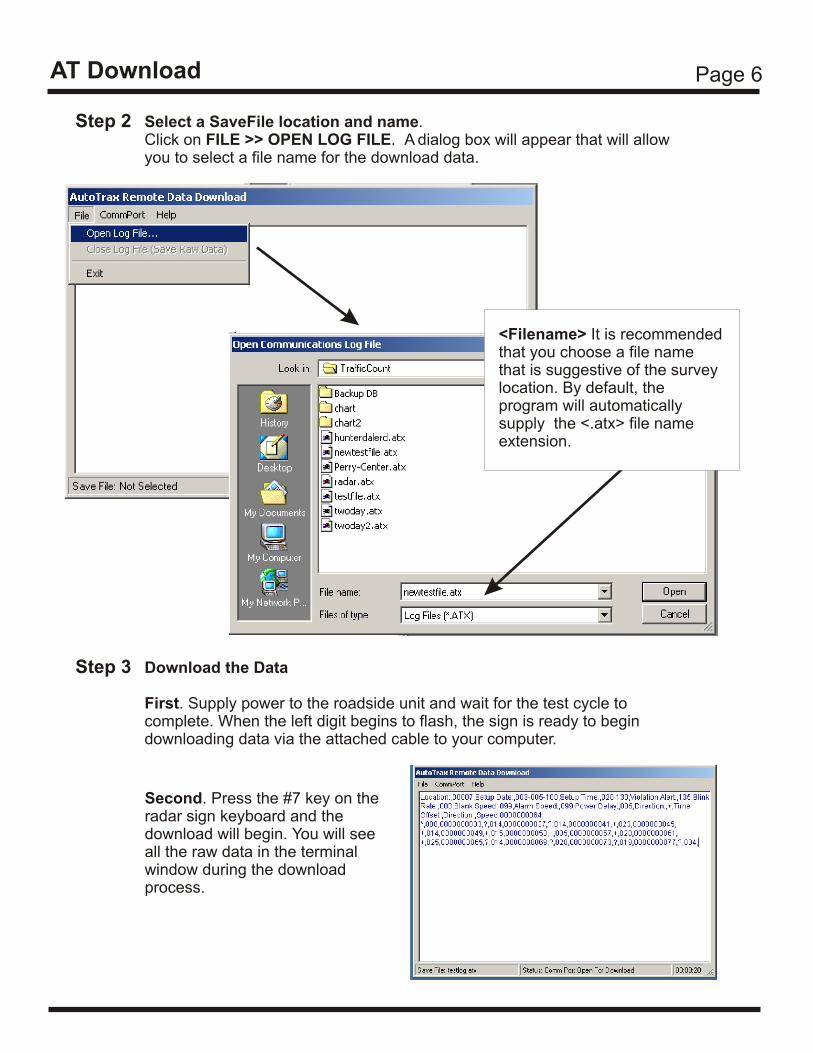
Step 2 Select a SaveFile location and name. Click on FILE >> OPEN LOG FILE. A dialog box will appear that will allow you to select a file name for the download data.
Step 3 Download the Data
First. Supply power to the roadside unit and wait for the test cycle to complete. When the left digit begins to flash, the sign is ready to begin downloading data via the attached cable to your computer.
Second. Press the #7 key on the radar sign keyboard and the download will begin. You will see all the raw data in the terminal window during the download process.
<Filename> It is recommended that you choose a file name that is suggestive of the survey location. By default, the program will automatically supply the <.atx> file name extension.
Page 7AT Download
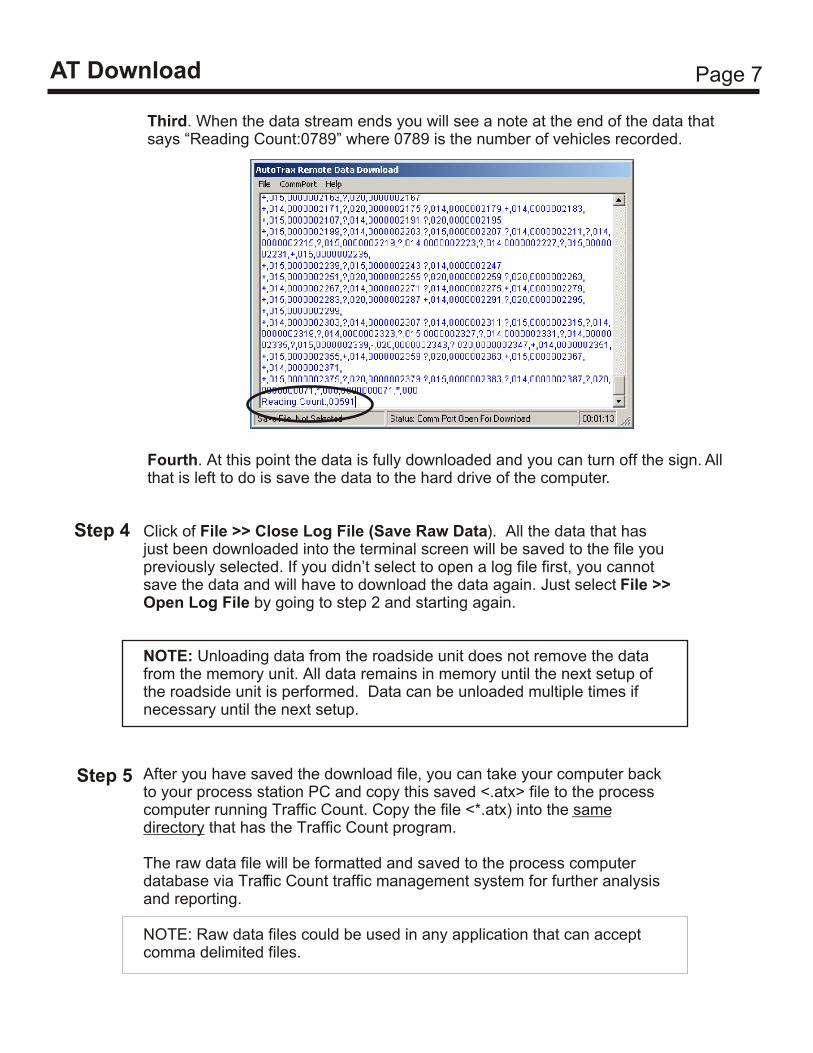
Step 4 Click of File >> Close Log File (Save Raw Data). All the data that has just been downloaded into the terminal screen will be saved to the file you previously selected. If you didn’t select to open a log file first, you cannot save the data and will have to download the data again. Just select File >> Open Log File by going to step 2 and starting again.
NOTE: Unloading data from the roadside unit does not remove the data from the memory unit. All data remains in memory until the next setup of the roadside unit is performed. Data can be unloaded multiple times if necessary until the next setup.
Step 5 After you have saved the download file, you can take your computer back to your process station PC and copy this saved <.atx> file to the process computer running Traffic Count. Copy the file <*.atx) into the same directory that has the Traffic Count program.
The raw data file will be formatted and saved to the process computer database via Traffic Count traffic management system for further analysis and reporting.
NOTE: Raw data files could be used in any application that can accept comma delimited files.
Third. When the data stream ends you will see a note at the end of the data that says “Reading Count:0789” where 0789 is the number of vehicles recorded.
Fourth. At this point the data is fully downloaded and you can turn off the sign. All that is left to do is save the data to the hard drive of the computer.

Auto-Trax
Traffic Count

Process “Raw Data” vs “Open Data File”
Raw data files are a collection of time/speed/direction with no summarized structure and are not meaningful without further processing. On the other hand, data files are fully structured, summarized and categorized for display and analysis.
Page 8Traffic Count
To “open” any survey for analysis or reporting you must first process the raw sign data into the Traffic Count database. Once the data is filtered into the database, multiple types of analysis and reports can be performed against the data.
Opening a “Raw” data file to process.
Select File >> Process Raw Data Files from the drop down menu or alternatively click on the “Process raw data” button on the opening screen of Traffic Count. Clicking on either choice will activate the file choice window.
Highlight a “raw” data file by clicking on the name desires. After the file is highlighted, click on Load File button to load this raw data file into the computer memory. After the file is loaded into memory, you are then able to proceed with the process routine to make the chosen file available to the Traffic Count data analysis program.
The open filter will look to the install directory path for any available <.atx> files to process.
Note: You can also use the File >> Process Raw Data to delete any unwanted “raw” data files from your system
Page 9Traffic Count
Processing a “Raw” data file.
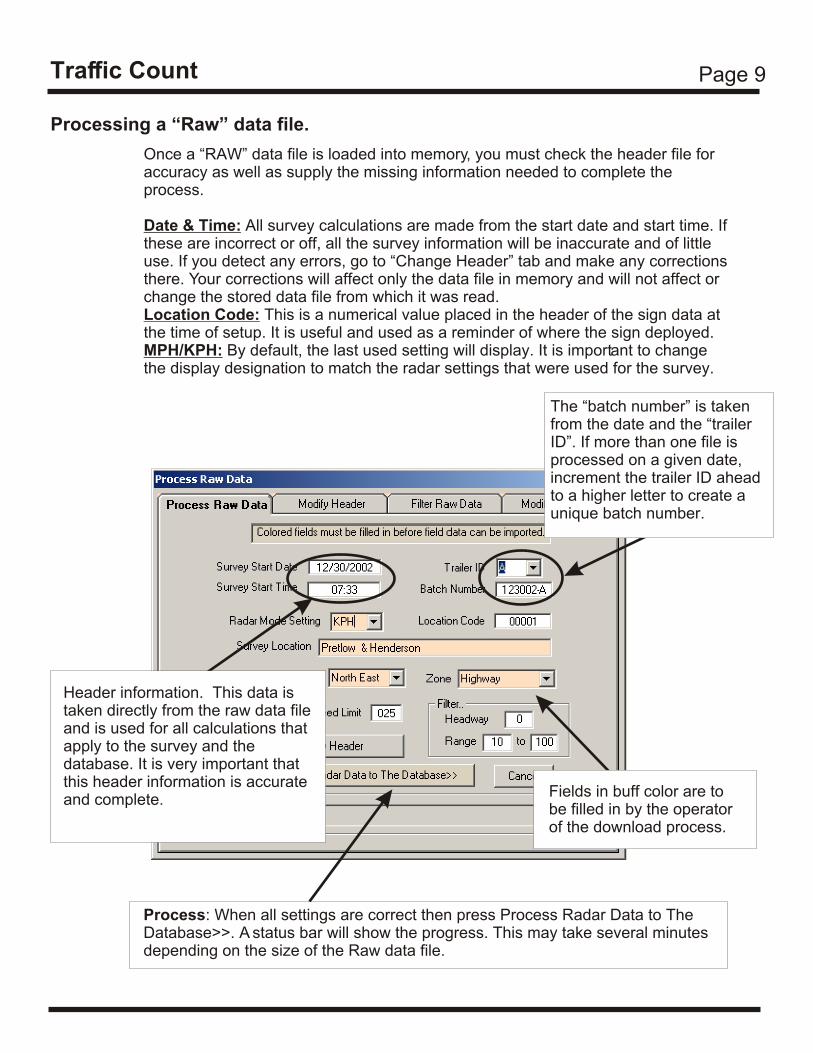
Once a “RAW” data file is loaded into memory, you must check the header file for accuracy as well as supply the missing information needed to complete the process.
Date & Time: All survey calculations are made from the start date and start time. If these are incorrect or off, all the survey information will be inaccurate and of little use. If you detect any errors, go to “Change Header” tab and make any corrections there. Your corrections will affect only the data file in memory and will not affect or change the stored data file from which it was read.Location Code: This is a numerical value placed in the header of the sign data at the time of setup. It is useful and used as a reminder of where the sign deployed.MPH/KPH: By default, the last used setting will display. It is important to change the display designation to match the radar settings that were used for the survey.
Process: When all settings are correct then press Process Radar Data to The Database>>. A status bar will show the progress. This may take several minutes depending on the size of the Raw data file.
Header information. This data is taken directly from the raw data file and is used for all calculations that apply to the survey and the database. It is very important that this header information is accurate and complete.
Fields in buff color are to be filled in by the operator of the download process.
The “batch number” is taken from the date and the “trailer ID”. If more than one file is processed on a given date, increment the trailer ID ahead to a higher letter to create a unique batch number.

Page 10Traffic Count
Modify Header: If you encounter any errors in the header, you may change them by simply pressing “Modify Header Information”. Here you may change one field or all at any time and you can repeat the process as many times as needed. Accuracy in the header is necessary for a meaningful survey.
Headway Filter: Headway is the gap between successive vehicles in a traffic stream, travelling in the same direction. Excluding vehicles with a headway less than a given time removes congested traffic from a report and gives true, free flowing vehicle statistics. The default is to ignore headway.
CAUTION: Invalid data in these text boxes can cause the program to fail and you will have to exit and restart again.
After you select the settings desired for “Headway” and “Speed Range” you then click on the “Process Raw Data” tab to complete the process routine and write the new data to the database for further analysis.
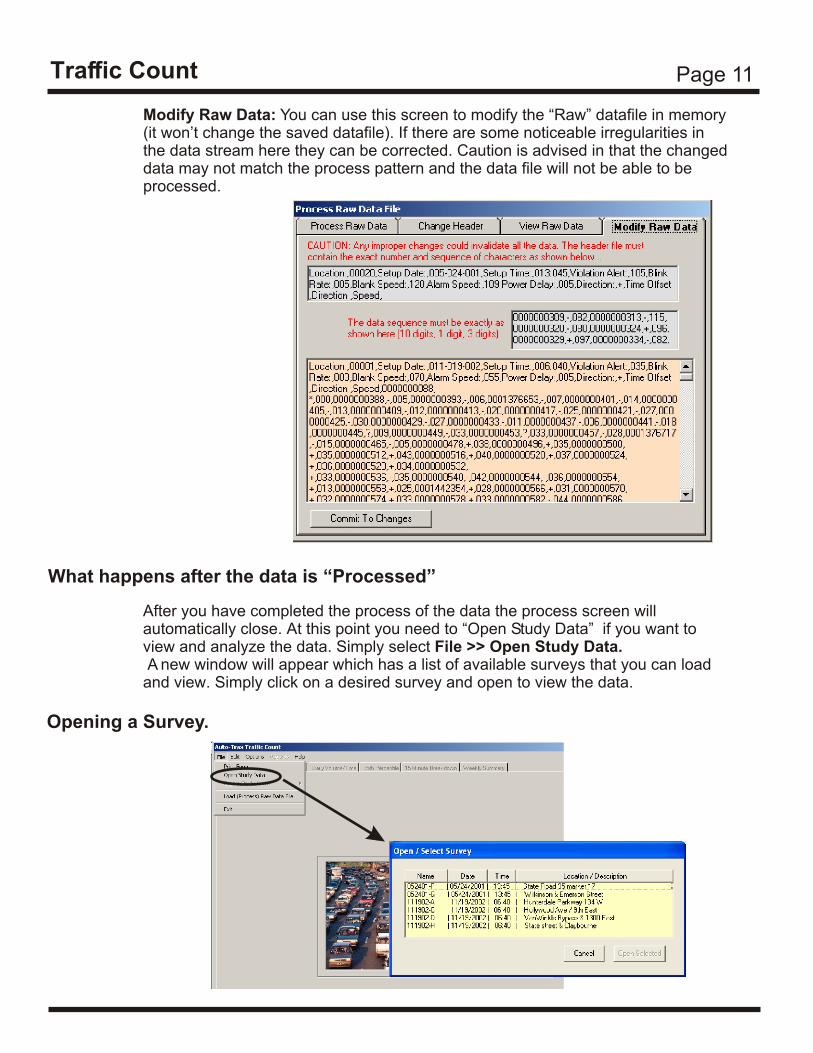
Page 11Traffic Count
Opening a Survey.
Modify Raw Data: You can use this screen to modify the “Raw” datafile in memory (it won’t change the saved datafile). If there are some noticeable irregularities in the data stream here they can be corrected. Caution is advised in that the changed data may not match the process pattern and the data file will not be able to be processed.
What happens after the data is “Processed”
After you have completed the process of the data the process screen will automatically close. At this point you need to “Open Study Data” if you want to view and analyze the data. Simply select File >> Open Study Data. A new window will appear which has a list of available surveys that you can load and view. Simply click on a desired survey and open to view the data.

Page 12Traffic Count
The first tab of Traffic Count will display a summary of a complete survey. All the data of the survey is available with only a few interactions of the users part.To see the “speed bins” you must first select a “Display Scheme” from the drop down list. There are 2 schemes for KPH and 3 for MPH. After selecting a scheme, you need to select the traffic view (approaching, receding or both).
Survey Summary:
Select Survey Schemeand
Direction of Travel
To change the document/report title, click on menu Option >> Admin Setup
You can print a report of the above screen in two ways. Either click on Print Report button or select menu Reports >> Survey Summary

Page 13Traffic Count
Clicking on View Speeding Vehicle Profile will bring up this pop up screen. From this you can easily see a pattern of speeders as to the time of day, the direction and the speed they are traveling. Like any other reports, this screen can easily be printed by clicking on the “Print This Profile” at the bottom of the screen.
Speed Profile:

Page 14Traffic Count
Displayed is a graph of all the vehicles in the selected survey. You can select vehicles approaching the sign, vehicles receding from the sign or vehicles traveling in both directions.The green portion of the graph shows all vehicles that are under the speed limit, the black bar is the speed limit and the red bars show the number of vehicles that are above the speed limit.
Vehicle Speeds:
To print this graph to a printer, simply click on “Print Graph” button at the bottom of the screen. You can also select Reports >> Vehicle Speeds and select the direction that you want to send to the printer.To aid in viewing the graph on a black and white laser printer, select “Printer Mode” located just above the Print Graph button.
Printing the graph:
UnderLimit
SpeedLimit
OverLimit

Page 15Traffic Count
To view a Vehicle Volume/Time graph you must first select a direction of travel. You can choose approaching, receding or both as a direction. After a direction is chosen the Date box becomes active and you can then choose a day for the chart. A drop-down list will show all the days available for a given survey.Volume/Time graphs display a complete 24 hour day and you can print a graph for each day of your survey.
Daily Volume / Time:
To print this graph to a printer, simply click on “Print Graph” button at the bottom of the screen. You can also select Reports >> Daily Volume / Time and select the direction as well as the date that you want to send to the printer.
Printing the graph:

Page 16Traffic Count
Displayed is a graph of all the vehicles in the selected survey showing the 85th percentile as well as the pace range. You can select vehicles traveling in both directions, vehicles approaching the sign or vehicles receding from the sign.The green portion of the graph shows all vehicles that are traveling in the pace, and the red bar shows the speed at which the 85th percentile falls. Vehicles above and below the pace are shown in light blue.
85th Percentile Graph:
To print this graph to a printer, simply click on “Print Graph” button at the bottom of the screen. You can also select Reports >> 85th Percentile and select the direction that you want to send to the printer.To aid in viewing the graph on a black and white laser printer, select “Printer Mode” located just above the Print Graph button.
Printing the graph:
PaceRange
85thPercentile

Page 17Traffic Count
To view a 15 minute traffic breakdown you must first select a direction of travel that you want to see. You can select approaching vehicles, receding vehicles or vehicles in both directions. After selecting a direction, you can select a date you want to view. The chart will show one complete day of data only. The data will show the number of vehicles traveling in each 15 minute period and after each four 15 minute blocks an hour total is shown. Analysis as to peak flow and percentages is automatically calculated.
15 Minute Breakdown:
To print this graph to a printer, simply click on “Print Graph” button at the bottom of the screen. You can also select Reports >> 15 Minute Breakdown and select the direction that you want to send to the printer as well as the desired date.
Printing the graph:
Four fifteenminute time
blocksTotal forone hour

Page 18Traffic Count
Data is calculated on a weekly basis by clicking on “Calculate Weekly Totals”.The data is calculated from the first available date in the survey and this date will be placed in the proper day of the week. The data will then flow to the end of the survey or the end of the week - whichever comes first. The data does not wrap around to Monday again and you can only display one week total data. It is suggested that surveys be set up at the first of the week and run for a one week period to obtain a meaningful traffic flow pattern.
Weekly Summary:
To print this graph to a printer, simply click on “Print Graph” button at the bottom of the screen. You can also select Reports >> Vehicle Speeds and select the direction that you want to send to the printer.To aid in viewing the graph on a black and white laser printer, select “Printer Mode” located just above the Print Graph button.
Printing the graph:

Page 19
Option > Admin Setup:
Traffic Count provides a simple way to modify the header of all reports as well as the title display on the main screen (Survey). Through this setup you can enter the officer responsible for the surveys and reports and have this name printed on all reports as well.
To change the agency name or address, simply highlight the text with the mouse and retype with the desired text. Changes will reflect automatically on the main screen, reports and be saved to the database.
View the list:
Adding an Officer:
Deleting an Officer:
To view the current list of Officers, click the refresh button.
1. Click on “Add Officer” button2. Click on the data input box (cursor will change to an I beam)3. Type the name of the officer as you wish it to appear on the reports4. Press the enter key or click on the refresh list button to add the name.The name you just entered will now be available for printed reports.
1. Refresh the list if necessary2. Click on the name you want to delete (name will be highlighted)3. Click on the delete button below the list4. Name will be removed from database list5. Refresh list if necessary
ATLite Reporter
Highlight and change
Page 20Traffic Count
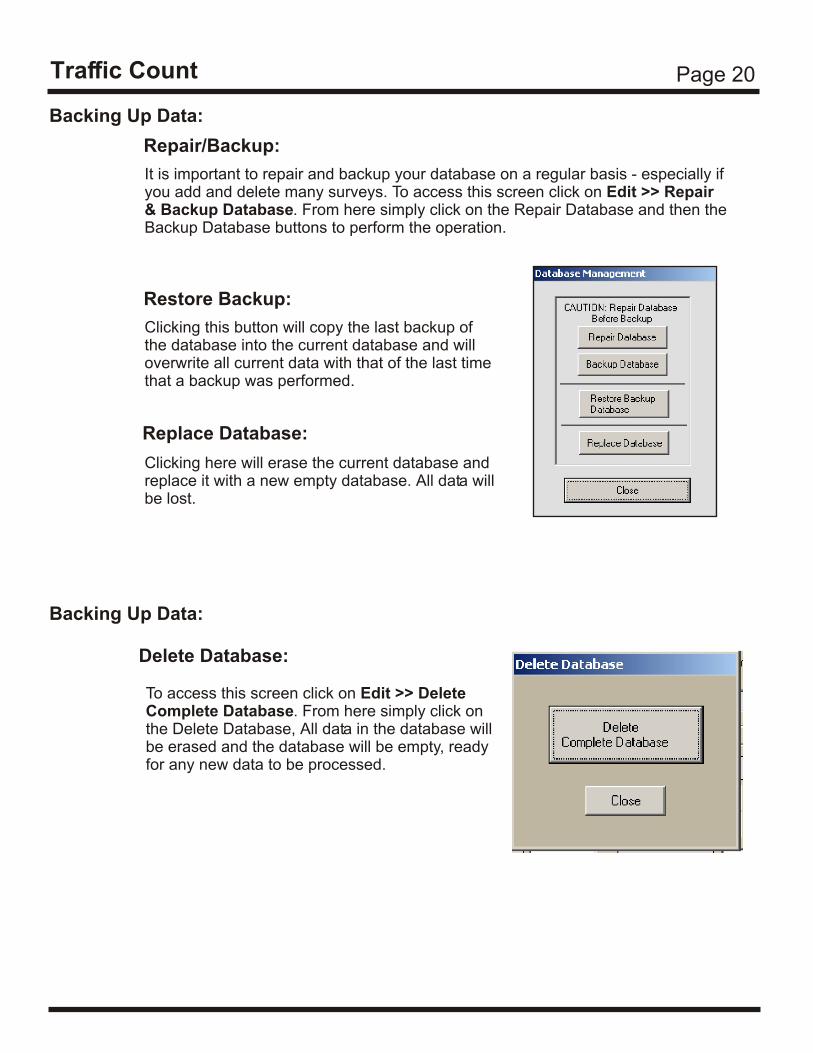
It is important to repair and backup your database on a regular basis - especially if you add and delete many surveys. To access this screen click on Edit >> Repair & Backup Database. From here simply click on the Repair Database and then the Backup Database buttons to perform the operation.
Backing Up Data:
To access this screen click on Edit >> Delete Complete Database. From here simply click on the Delete Database, All data in the database will be erased and the database will be empty, ready for any new data to be processed.
Delete Database:
Repair/Backup:
Clicking this button will copy the last backup of the database into the current database and will overwrite all current data with that of the last time that a backup was performed.
Restore Backup:
Clicking here will erase the current database and replace it with a new empty database. All data will be lost.
Replace Database:
Backing Up Data:

Page 21Traffic Count - Survey Summary
Hanksville Traffic Control Agency 3546 Western Blvd Plaza - Suite 243 Hanksville, Summit Co, Utah 34567
Tr a f f i c Sur ve y S um ma ry
Batch Number: 123002-B
Start Date: 01/06/03End Date: 01/07/03
Zone: HighwayLocation: New test for Jan 2003
Start Time: 07:33 AMEnd Time: 12:53 PM
Direction of Travel: North East
Speed 1 - 14 15 - 19 20 - 24 25 - 29 30 - 34 35 - 39 40 - 44 45 - 49 50 - 54 55 - 59 60 - 64 65 - 6970 -999
Volume 302 279 632 1577 1464 833 215 56 13 6 8 0 12
% of Total 5.6% 5.17% 11.71% 29.22% 27.13% 15.43% 3.98% 1.04% .24% .11% .15% .% .22%
Unknown: 0 Approaching: 2706 Receeding: 2691 Total Vehicles: 5397
Speed Statistics 10 MPH Pace Number Exceeding Limit
Posted 025 Pace Speed 24 to 34 Speed 025+ 35+ 45+ Total
# At/Under Limit 1513 # in Pace 3229 Number 2975 829 80 3884
# Over Limit 3884 % in Pace 60 % Percent 55.12% 15.36% 1.48% 71.97%
Average Speed 29.0 85th Percentile 34
Display Scheme: ** Select Display Scheme ** - Vehicles Both Directions
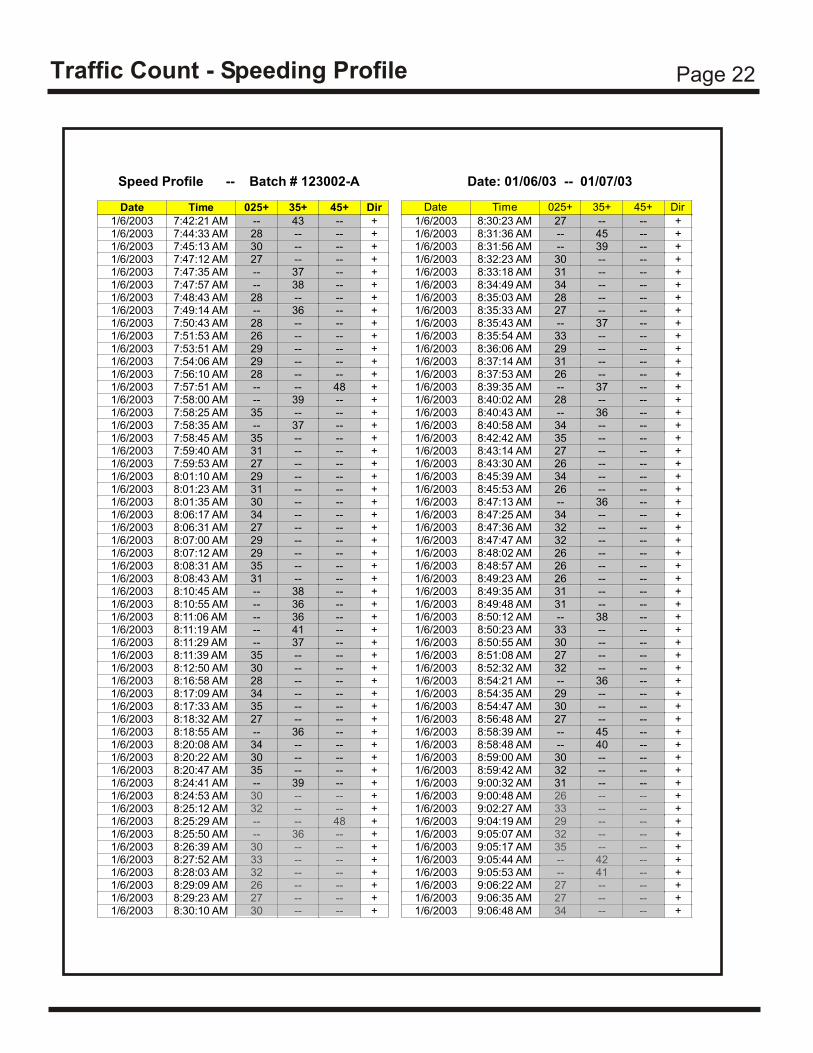
Page 22Traffic Count - Speeding Profile
Date Time 025+ 35+ 45+ Dir1/6/2003 7:42:21 AM -- 43 -- +1/6/2003 7:44:33 AM 28 -- -- +1/6/2003 7:45:13 AM 30 -- -- +1/6/2003 7:47:12 AM 27 -- -- +1/6/2003 7:47:35 AM -- 37 -- +1/6/2003 7:47:57 AM -- 38 -- +1/6/2003 7:48:43 AM 28 -- -- +1/6/2003 7:49:14 AM -- 36 -- +1/6/2003 7:50:43 AM 28 -- -- +1/6/2003 7:51:53 AM 26 -- -- +1/6/2003 7:53:51 AM 29 -- -- +1/6/2003 7:54:06 AM 29 -- -- +1/6/2003 7:56:10 AM 28 -- -- +1/6/2003 7:57:51 AM -- -- 48 +1/6/2003 7:58:00 AM -- 39 -- +1/6/2003 7:58:25 AM 35 -- -- +1/6/2003 7:58:35 AM -- 37 -- +1/6/2003 7:58:45 AM 35 -- -- +1/6/2003 7:59:40 AM 31 -- -- +1/6/2003 7:59:53 AM 27 -- -- +1/6/2003 8:01:10 AM 29 -- -- +1/6/2003 8:01:23 AM 31 -- -- +1/6/2003 8:01:35 AM 30 -- -- +1/6/2003 8:06:17 AM 34 -- -- +1/6/2003 8:06:31 AM 27 -- -- +1/6/2003 8:07:00 AM 29 -- -- +1/6/2003 8:07:12 AM 29 -- -- +1/6/2003 8:08:31 AM 35 -- -- +1/6/2003 8:08:43 AM 31 -- -- +1/6/2003 8:10:45 AM -- 38 -- +1/6/2003 8:10:55 AM -- 36 -- +1/6/2003 8:11:06 AM -- 36 -- +1/6/2003 8:11:19 AM -- 41 -- +1/6/2003 8:11:29 AM -- 37 -- +1/6/2003 8:11:39 AM 35 -- -- +1/6/2003 8:12:50 AM 30 -- -- +1/6/2003 8:16:58 AM 28 -- -- +1/6/2003 8:17:09 AM 34 -- -- +1/6/2003 8:17:33 AM 35 -- -- +1/6/2003 8:18:32 AM 27 -- -- +1/6/2003 8:18:55 AM -- 36 -- +1/6/2003 8:20:08 AM 34 -- -- +1/6/2003 8:20:22 AM 30 -- -- +1/6/2003 8:20:47 AM 35 -- -- +1/6/2003 8:24:41 AM -- 39 -- +1/6/2003 8:24:53 AM 30 -- -- +1/6/2003 8:25:12 AM 32 -- -- +1/6/2003 8:25:29 AM -- -- 48 +1/6/2003 8:25:50 AM -- 36 -- +1/6/2003 8:26:39 AM 30 -- -- +1/6/2003 8:27:52 AM 33 -- -- +1/6/2003 8:28:03 AM 32 -- -- +1/6/2003 8:29:09 AM 26 -- -- +1/6/2003 8:29:23 AM 27 -- -- +1/6/2003 8:30:10 AM 30 -- -- +
Date Time 025+ 35+ 45+ Dir
1/6/2003 8:30:23 AM 27 -- -- +1/6/2003 8:31:36 AM -- 45 -- +1/6/2003 8:31:56 AM -- 39 -- +1/6/2003 8:32:23 AM 30 -- -- +1/6/2003 8:33:18 AM 31 -- -- +1/6/2003 8:34:49 AM 34 -- -- +1/6/2003 8:35:03 AM 28 -- -- +1/6/2003 8:35:33 AM 27 -- -- +1/6/2003 8:35:43 AM -- 37 -- +1/6/2003 8:35:54 AM 33 -- -- +1/6/2003 8:36:06 AM 29 -- -- +1/6/2003 8:37:14 AM 31 -- -- +1/6/2003 8:37:53 AM 26 -- -- +1/6/2003 8:39:35 AM -- 37 -- +1/6/2003 8:40:02 AM 28 -- -- +1/6/2003 8:40:43 AM -- 36 -- +1/6/2003 8:40:58 AM 34 -- -- +1/6/2003 8:42:42 AM 35 -- -- +1/6/2003 8:43:14 AM 27 -- -- +1/6/2003 8:43:30 AM 26 -- -- +1/6/2003 8:45:39 AM 34 -- -- +1/6/2003 8:45:53 AM 26 -- -- +1/6/2003 8:47:13 AM -- 36 -- +1/6/2003 8:47:25 AM 34 -- -- +1/6/2003 8:47:36 AM 32 -- -- +1/6/2003 8:47:47 AM 32 -- -- +1/6/2003 8:48:02 AM 26 -- -- +1/6/2003 8:48:57 AM 26 -- -- +1/6/2003 8:49:23 AM 26 -- -- +1/6/2003 8:49:35 AM 31 -- -- +1/6/2003 8:49:48 AM 31 -- -- +1/6/2003 8:50:12 AM -- 38 -- +1/6/2003 8:50:23 AM 33 -- -- +1/6/2003 8:50:55 AM 30 -- -- +1/6/2003 8:51:08 AM 27 -- -- +1/6/2003 8:52:32 AM 32 -- -- +1/6/2003 8:54:21 AM -- 36 -- +1/6/2003 8:54:35 AM 29 -- -- +1/6/2003 8:54:47 AM 30 -- -- +1/6/2003 8:56:48 AM 27 -- -- +1/6/2003 8:58:39 AM -- 45 -- +1/6/2003 8:58:48 AM -- 40 -- +1/6/2003 8:59:00 AM 30 -- -- +1/6/2003 8:59:42 AM 32 -- -- +1/6/2003 9:00:32 AM 31 -- -- +1/6/2003 9:00:48 AM 26 -- -- +1/6/2003 9:02:27 AM 33 -- -- +1/6/2003 9:04:19 AM 29 -- -- +1/6/2003 9:05:07 AM 32 -- -- +1/6/2003 9:05:17 AM 35 -- -- +1/6/2003 9:05:44 AM -- 42 -- +1/6/2003 9:05:53 AM -- 41 -- +1/6/2003 9:06:22 AM 27 -- -- +1/6/2003 9:06:35 AM 27 -- -- +1/6/2003 9:06:48 AM 34 -- -- +
Speed Profile -- Batch # 123002-A Date: 01/06/03 -- 01/07/03

Page 23Traffic Count - Vehicle Speeds
Hanksville Traffic Control Agency 3546 Western Blvd Plaza - Suite 243 Hanksville, Summit Co, Utah 34567Veh i c le Spe ed C omp ar i so n
Batch Number: 123002-A
Survey Location: Pretlow test file
Posted Speed Limit: # At/Under Posted Speed:
# Over Posted Speed: Average Speed:
Pace Range: Total Vehicles in Pace: % of Vehicles in Pace:
85th Percentile: Total # Veh Surveyed:
Approaching: Receeding:
025 MPH
Number Unknown:
921168327.4 MPH22 to 32 MPH156560 %325179260425750
Start Date: 01/06/03
End Date: 01/07/03
Start Time: 07:33 AM
End Time: 12:53 PM
Total Time:
1 Days, 5 Hrs, 20 Min
Survey Zone: School
Direction of travel..
North
(Approaching Sign)

Page 24Traffic Count - Daily Volume / Time
Hanksville Traffic Control Agency 3546 Western Blvd Plaza - Suite 243 Hanksville, Summit Co, Utah 34567Da i ly Vo lu me Tra f f i c F low
Batch Number: 123002-A
Survey Location: Pretlow test file
Posted Speed Limit: # At/Under Posted Speed:
# Over Posted Speed: Average Speed:
Pace Range: Total Vehicles in Pace: % of Vehicles in Pace:
85th Percentile: Total # Veh Surveyed:
Approaching: Receeding:
Number Unknown:
025 MPH921168327.4 MPH22 to 32 MPH156560 %325179260425750
Start Date: 01/06/03
End Date: 01/07/03
Start Time: 07:33 AM
End Time: 12:53 PM
Total Time:
1 Days, 5 Hrs, 20 Min
Survey Zone: School
Direction of travel..
North
(Approaching Sign)
Survey: Traffic Both Directions
AM Time PM Time
Vehicle Volume / Hour

Page 25Traffic Count - 85th Percentile
Hanksville Traffic Control Agency 3546 Western Blvd Plaza - Suite 243 Hanksville, Summit Co, Utah 34567
85 th Perc en t i l e Spe ed and Pac e D is t r i bu t ion
Batch Number: 111902-C
Survey Location: Hunterdale test
Posted Speed Limit: # At/Under Posted Speed:
# Over Posted Speed: Average Speed:
Pace Range: Total Vehicles in Pace: % of Vehicles in Pace:
85th Percentile: Total # Veh Surveyed:
Approaching: Receeding:
Number Unknown:
035 MPH23717334.8 MPH30 to 40 MPH33882 %4164741020433
Start Date: 11/19/02
End Date: 11/19/02
Start Time: 06:40 AM
End Time: 07:44 AM
Total Time:
0 Days, 1 Hrs, 04 Min
Survey Zone: Railroad
Direction of travel..
North East
(Approaching Sign)
85th Percentile ---->
Pace Low <---------> Pace High

Page 26Traffic Count - 15 minute Breakdown
Hanksville Traffic Control Agency 3546 Western Blvd Plaza - Suite 243 Hanksville, Summit Co, Utah 34567
Daily Traffic Flow - (15 Minute Interval)
Batch Number: 123002-A Survey Period: 01/06/03 - 01/07/03Survey Zone: SchoolSurvey Location: Pretlow test file
Date: Monday, Jan 6 (Vehicles Both Directions)
Time AM A R Hour Total Time PM A R Hour Total00:00 - 00:14 * * 12:00 - 12:14 40 3000:15 - 00:29 * * 12:15 - 12:29 26 3700:30 - 00:44 * * 12:30 - 12:44 41 3500:45 - 00:59 * * * 12:45 - 12:59 32 38 27901:00 - 01:14 * * 13:00 - 13:14 31 2701:15 - 01:29 * * 13:15 - 13:29 36 2001:30 - 01:44 * * 13:30 - 13:44 26 3201:45 - 01:59 * * * 13:45 - 13:59 30 36 23802:00 - 02:14 * * 14:00 - 14:14 24 3402:15 - 02:29 * * 14:15 - 14:29 28 4002:30 - 02:44 * * 14:30 - 14:44 36 3602:45 - 02:59 * * * 14:45 - 14:59 32 35 26503:00 - 03:14 * * 15:00 - 15:14 37 2203:15 - 03:29 * * 15:15 - 15:29 26 3103:30 - 03:44 * * 15:30 - 15:44 29 3403:45 - 03:59 * * * 15:45 - 15:59 35 33 24704:00 - 04:14 * * 16:00 - 16:14 37 3404:15 - 04:29 * * 16:15 - 16:29 27 2904:30 - 04:44 * * 16:30 - 16:44 40 2804:45 - 04:59 * * * 16:45 - 16:59 29 34 25805:00 - 05:14 * * 17:00 - 17:14 42 2305:15 - 05:29 * * 17:15 - 17:29 41 2405:30 - 05:44 * * 17:30 - 17:44 26 2705:45 - 05:59 * * * 17:45 - 17:59 19 27 22906:00 - 06:14 * * 18:00 - 18:14 21 2406:15 - 06:29 * * 18:15 - 18:29 27 3006:30 - 06:44 * * 18:30 - 18:44 17 2806:45 - 06:59 * * * 18:45 - 18:59 24 19 19007:00 - 07:14 * * 19:00 - 19:14 23 2007:15 - 07:29 * * 19:15 - 19:29 17 1807:30 - 07:44 6 14 19:30 - 19:44 25 1507:45 - 07:59 26 23 69 19:45 - 19:59 18 20 15608:00 - 08:14 20 33 20:00 - 20:14 35 1708:15 - 08:29 29 22 20:15 - 20:29 19 1508:30 - 08:44 40 12 20:30 - 20:44 24 1608:45 - 08:59 29 36 221 20:45 - 20:59 8 9 14309:00 - 09:14 32 36 21:00 - 21:14 10 1509:15 - 09:29 35 33 21:15 - 21:29 10 1009:30 - 09:44 45 25 21:30 - 21:44 18 1409:45 - 09:59 34 36 276 21:45 - 21:59 14 15 10610:00 - 10:14 35 32 22:00 - 22:14 15 1410:15 - 10:29 22 23 22:15 - 22:29 20 1710:30 - 10:44 40 28 22:30 - 22:44 5 1610:45 - 10:59 40 24 244 22:45 - 22:59 17 13 11711:00 - 11:14 35 34 23:00 - 23:14 10 711:15 - 11:29 37 30 23:15 - 23:29 6 511:30 - 11:44 34 35 23:30 - 23:44 14 511:45 - 11:59 36 31 272 23:45 - 23:59 * 13 60
Total AM: 1082Peak Hour AM: 09:00 - 09:59Peak Flow AM: 276/hrPeak % of AM: 25.51%Peak AM % of 24 Hr: 8.19%
Total PM: 2288Peak Hour PM: 12:00 - 12:59Peak Flow PM: 279/hrPeak % of PM: 12.19%Peak PM % of 24 Hr: 8.28%

Page 27Traffic Count - Weekly Summary

Page 28Addendum SSF (Smart Media) Card Reader

Page 29Traffic Count Notes

Page 30Traffic Count Notes