Embed Size (px)
Citation preview
TB/H
IV/S
TD E
pide
mio
logy
and
Sur
veilla
nce
Bra
nch
First Annual Report, Dated 12/31/2009
2
This Enhanced Perinatal Surveillance Report is the first annual report generated by the Texas Department of State Health Services, TB/HIV/STD Epidemiology and Surveillance Branch. This report describes pediatric HIV/AIDS cases and perinatal exposures reported to the Texas Department of State Health Services Surveillance Program through July 2007 and children born through December 31, 2005.
Texas Department of State Health Services P.O. 149347
Austin, Texas 78714
TB/HIV/STD Epidemiology and Surveillance Branch (512) 533-3000
3
TABLE OF CONTENTS
List of Figures and Tables ...............................................................................................................3 I. General Background .............................................................................................................5 II. Overview of Pediatric HIV Infection in Texas ....................................................................7 III. Overview of Perinatal HIV Transmission in the United States............................................9 IV. Overview of Perinatal HIV Transmission in Texas ...........................................................10 Geographic Breakdown of Perinatal Exposures ............................................14 Fertility Rates .................................................................................................16 V. Enhanced Perinatal Surveillance Data ...............................................................................18
Demographics of Women Delivering Perinatally HIV Exposed Infants.............................................................................................................18
Preventative Factors to Reduce Perinatal HIV Transmission ........................20 VII. References ..........................................................................................................................28
FIGURES
1. Geographic Areas of Interest .............................................................................................. 6 2. Children Diagnosed with HIV Infection Before 13 Years of Age (N=876), by
Year of HIV Diagnosis and Current Vital Status, as of July 2007, Texas.......................... 7 3. Current Age of Persons Living with HIV/AIDS Who Were Diagnosed with HIV
Before 13 Years of Age (N=602), by Current Clinical Status, as of July 2007, Texas ................................................................................................................................... 8
4. Number of Deaths Among Persons Diagnosed with HIV Before 13 Years of Age (N=274), by Age at Death, 1981-2005, Texas.................................................................... 9
5. Current HIV Classification of Children Born to HIV-Infected Women in Texas, 1974-2005 ......................................................................................................................... 11
6. Children Classified as HIV-Infected (n=709) and Born to HIV-Infected Women in Texas, 1974-2005.............................................................................................................. 11
7. Racial/Ethnic Distribution of Living Perinatally HIV-Infected Children (N=514) by Year of Birth, 1984-2005, Texas ................................................................................. 12
8. Age at HIV Diagnosis of Perinatally HIV-Infected Children (N=709) by Year of Diagnosis, 1984-2005, Texas............................................................................................ 13
9. Age at AIDS Diagnosis of Perinatally HIV-Infected Children (N=349) by Year of Diagnosis, 1984-2005, Texas............................................................................................ 14
10. Comparison of Fertility Rates among Texas Women and HIV+ Women........................ 16 11. Fertility Rates for Texas Women and HIV+ Women by Race/Ethnicity ......................... 16 12. Fertility Rate by Region and Year of Birth: All Women, TX .......................................... 17 13. Fertility Rate by Region and Year of Birth: HIV+ Women, TX ...................................... 17 14. Adequacy of Care among HIV+ Women Delivering and Proportion of Infected
Children in Texas, 1999-2005........................................................................................... 21 15. Receipt of Antiretroviral Therapy among HIV+ Women Delivering and
Proportion of Infected Children in Texas, 1999-2005 ...................................................... 24
4
TABLES
1. Children Diagnosed with HIV Infection Before 13 years of Age, by HIV Transmission Risk Category and Latest HIV Status, as of July 2007, Texas...................... 7
2. Perinatal HIV/AIDS among Children in the United States in 2005................................... 10 3. Current HIV Status of Children Born to HIV-Infected Women, as of July 2007,
Texas .................................................................................................................................. 10 4. Live Births to Texas Women and HIV Positive Women by Year of
Infant Birth and Area of Residence at Birth, 2001-2005 .................................................. 15 5. Select Demographics for All Texas Women Delivering and for HIV+ Women
Delivering, Texas, 2001-2005............................................................................................ 19 6. HIV+ Women Delivering by Year of Delivery and Mode of Exposure, Texas,
2001-2005 .......................................................................................................................... 19 7. Prenatal care of HIV-infected women, by year of infant birth, 1999-2005, Texas............ 20 8. Adequacy of prenatal care based on the Kessner Index for HIV infected women,
by year of infant birth, 1999-2005, Texas*........................................................................ 21 9. Receipt of antiretroviral therapy by HIV-infected women and HIV-exposed
infants, by timing of receipt and year of infant birth, 1999-2005, Texas .......................... 23 10. Timing of HIV Diagnosis for HIV Positive Women Delivering, 1999-2005, Texas ........ 25 11. Timing of HIV Diagnosis for Women Diagnosed Prior to Current Pregnancy,
Texas, 1999-2005............................................................................................................... 26 12. Timing of HIV Diagnosis for Women Diagnosed During Pregnancy, Texas, 1999-
2005.................................................................................................................................... 26
5
I. GENERAL BACKGROUND Pediatric and perinatal HIV/AIDS surveillance in Texas measures trends in human immunodeficiency virus (HIV) pediatric/perinatal transmission rates, prevalence of receipt of prenatal care and antiretroviral treatment by HIV infected mother’s and their infants and morbidity and mortality of HIV-infected children who were first diagnosed with HIV infection before 13 years of age. For purposes of this report, pediatric and perinatal HIV infection status is defined according to the Centers for Disease Control and Prevention (CDC) definition (MMWR 1999; 48 (RR-13): 1-36). This report provides an overview of pediatric HIV transmission in Texas, an overview of perinatal transmission in the United States and Texas and an analysis of Enhanced Perinatal Surveillance (EPS) data. The first part of this report provides an overview of 876 infants infected perinatally or non-perinatally in Texas and reported through the HIV/AIDS Reporting System (HARS) as of July 2007. Of these 876 infants, 709 children contracted HIV perinatally, were diagnosed through July 2007 and were born through December 31, 2005. The remaining 167 children were infected through non-perinatal transmission. The second part of this report provides data for perinatally exposed infants born through December 31, 2005 and reported through HARS as of July 2007. The last part of this report, the analysis of Enhanced Perinatal Surveillance data, provides data on 2,468 perinatally HIV-exposed children (i.e., infected, non-infected, and children of indeterminate status). The information in this last section is based on data updated as of January 2008 which includes 2,468 mother-infant pairs, representing 2,400 pregnancies. These perinatally exposed infants were reported through EPS and/or HARS and this data has been collected by twelve regional public health departments and local city/county health departments across Texas from 1999-2005. Data collection systems from which this report was generated include:
1. HIV/AIDS Reporting System (HARS): Name based reporting began in Texas in 1999.
2. Enhanced Perinatal Surveillance (EPS): Initiated in 1999 as an adjunct to Pediatric HIV/AIDS surveillance. EPS is a surveillance system for HIV-infected women and their infants. In order to reduce perinatal transmission in areas with high prevalence, the CDC implemented activities such as the EPS Project (EPS) throughout the United States.
3. The overall goals of EPS are: a. to monitor the implementation of the United States Public Health Service
(USPHS) recommendations for counseling and voluntary testing of pregnant women,
b. to monitor the use of ZDV and other antiretrovirals to prevent perinatal HIV transmission and monitor potentially adverse outcomes of antiretroviral exposure among infected and uninfected children in the short and long term, and
c. to ascertain complete reporting of HIV positive women who deliver an infant.
6
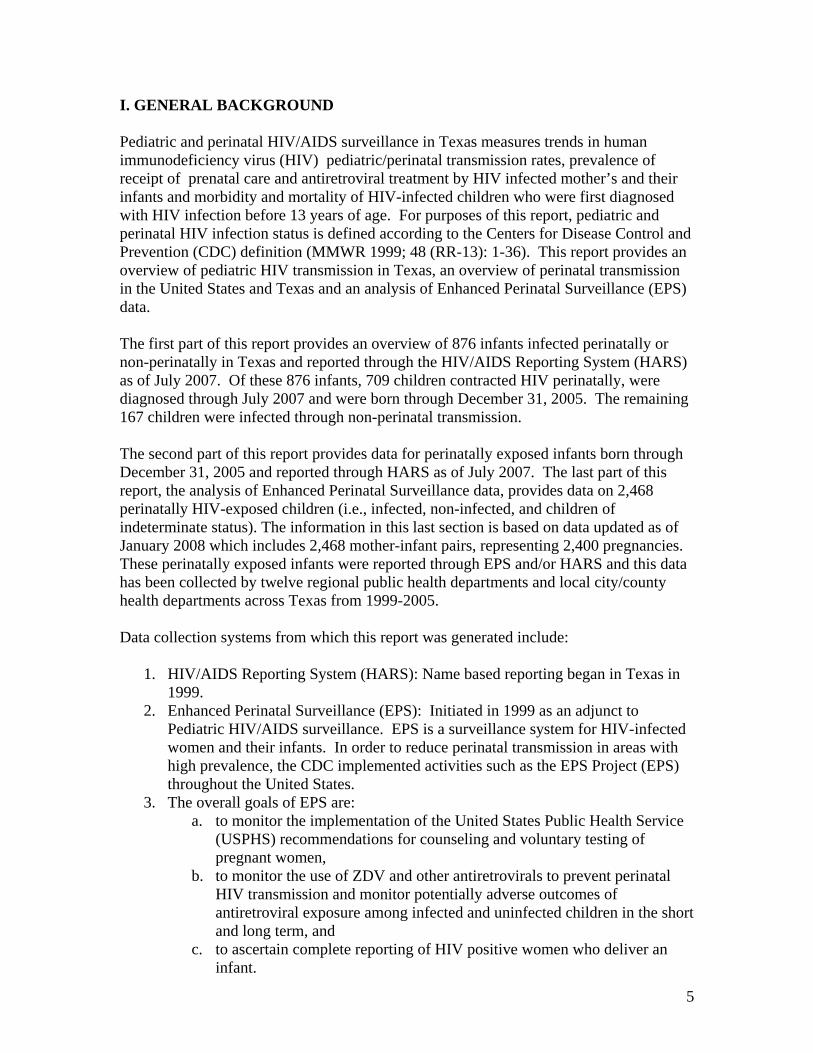
Note: Data presented by geographic area has been broken down according to the Health Resources and Services Administration (HRSA) designations of counties as an Eligible Metropolitan Area (EMA) or a Transitional Grant Area (TGA). The five areas in Texas designated by HRSA (Figure 1) as EMAs or TGAs are Austin, Dallas, Fort Worth, Houston and San Antonio. For this report, we define the border area as those 32 counties within 100 kilometers of the U.S.-Mexico border, a standard definition in health and human services reports. The East Texas area includes all counties in Texas Health Service Regions (HSR) 4, 5, and 6, excluding the Houston EMA and Henderson County, which is included in the Dallas EMA. Figure 1: Geographic Areas of Interest
7
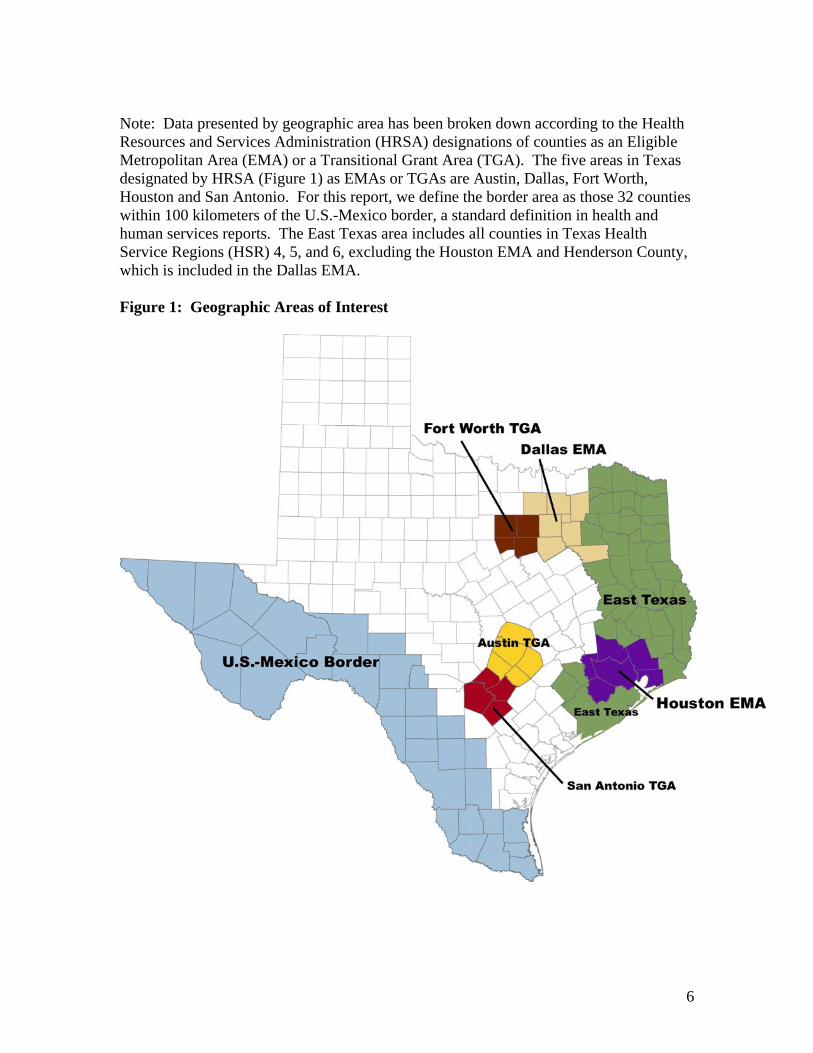
II. OVERVIEW OF PEDIATRIC HIV INFECTION IN TEXAS At the end of 2005, more than 80% of the 876 children diagnosed with HIV were infected through mother to child transmission, and more than half of all the HIV-infected children developed AIDS (Table 1). The majority of children diagnosed with AIDS were diagnosed prior to 13 years of age. Of the 876 children diagnosed with HIV, 31% (n=274) have died. (Figure 2) Among those who have died, 95% (n=260) were diagnosed with AIDS and 5% (n=14) were HIV-infected but had not yet progressed to AIDS. Table 1: Children Diagnosed with HIV Infection Before 13 Years of Age, by HIV Transmission Risk Category and Latest HIV Status, as of July 2007 (a), Texas HIV-
Infected, non-AIDS
AIDS Diagnosed before 13 years
AIDS diagnosed at 13 years or older
Total
Perinatal HIV Risk (a) 360 325 24 709 Non-perinatal HIV risk: Coagulation Disorder Unknown/Other Transfusion
14 39
1
18 8
35
32 9
11
167
64 56 47
Total (%) 414 (47%) 386 (44%) 76 (9%) 876 (100%) a-Excluding births for years 2006 and 2007 due to reporting delay. Figure 2: Children Diagnosed with HIV Infection before 13 Years of Age (N=876), by Year of HIV Diagnosis and Current Vital Status, as of July 2007(a), Texas
0
10
20
30
40
50
60
70
80
1981
1982
1983
1984
1985
1986
1987
1988
1989
1990
1991
1992
1993
1994
1995
1996
1997
1998
1999
2000
2001
2002
2003
2004
2005
2006
2007
Alive Dead
Year of Diagnosis
Num
ber o
f Chi
ldre
n
a-Excluding births for years 2006 and 2007 due to reporting delay.
8
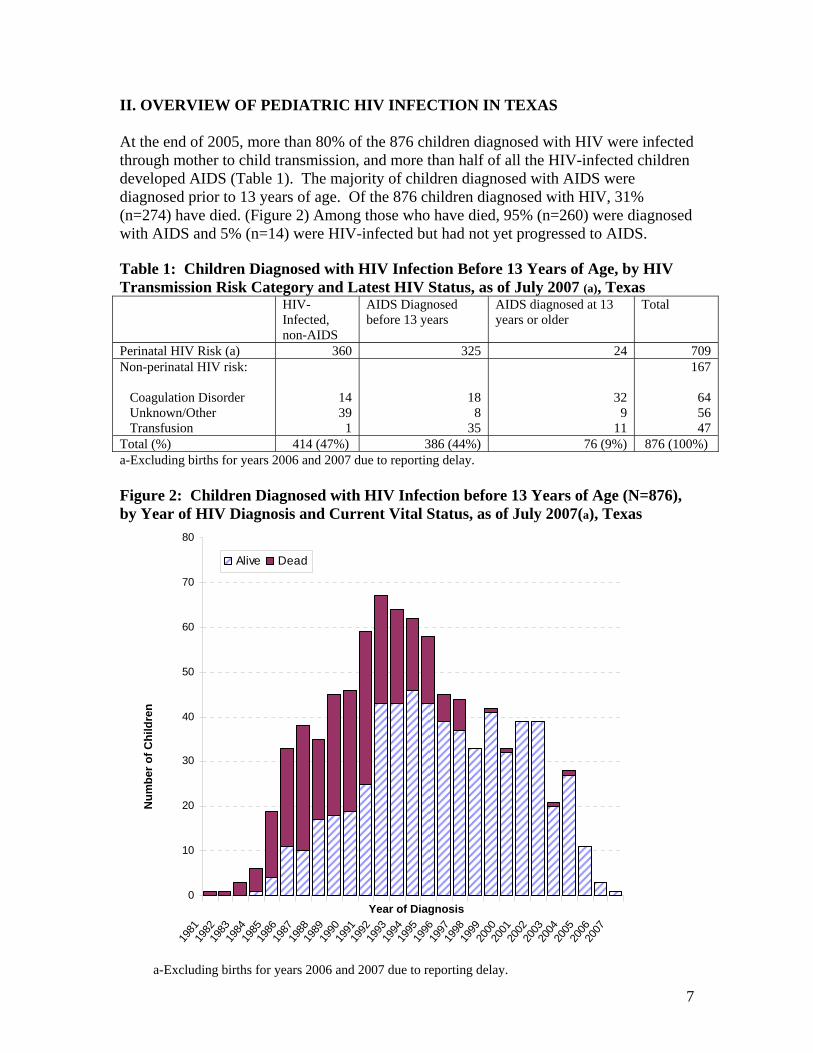
Figure 3: Current Age of Persons Living with HIV/AIDS Who Were Diagnosed with HIV before 13 Years of Age (N=602), by Current Clinical Status, as of July 2007, Texas
0
50
100
150
200
250
300
0-5 Years 6-12 Years 13-19 Years 20-24 Years 25-29 Years 30-35 Years
AIDS Diagnosis at>= 13 years of age
AIDS Diagnosis at<13 years of age
HIV, non-AIDS
As shown in Figure 3, of living persons diagnosed with HIV before 13 years of age, 55% were 13 years of age or older as of July 2007. This figure represents a growing population of pediatric cases surviving into adolescence and early adulthood.
Num
ber o
f Per
sons
Current Age
9
Figure 4: Number of Deaths among Persons Diagnosed with HIV before 13 Years of Age (N=274), by Age at Death, 1981-2005, Texas
0
5
10
15
20
25
30
35
1984
1985
1986
1987
1988
1989
1990
1991
1992
1993
1994
1995
1996
1997
1998
1999
2000
2001
2002
2003
2004
2005
2007
25-29 Years20-24 Years13-19 Years6-12 Years1-5 Years<1 Year
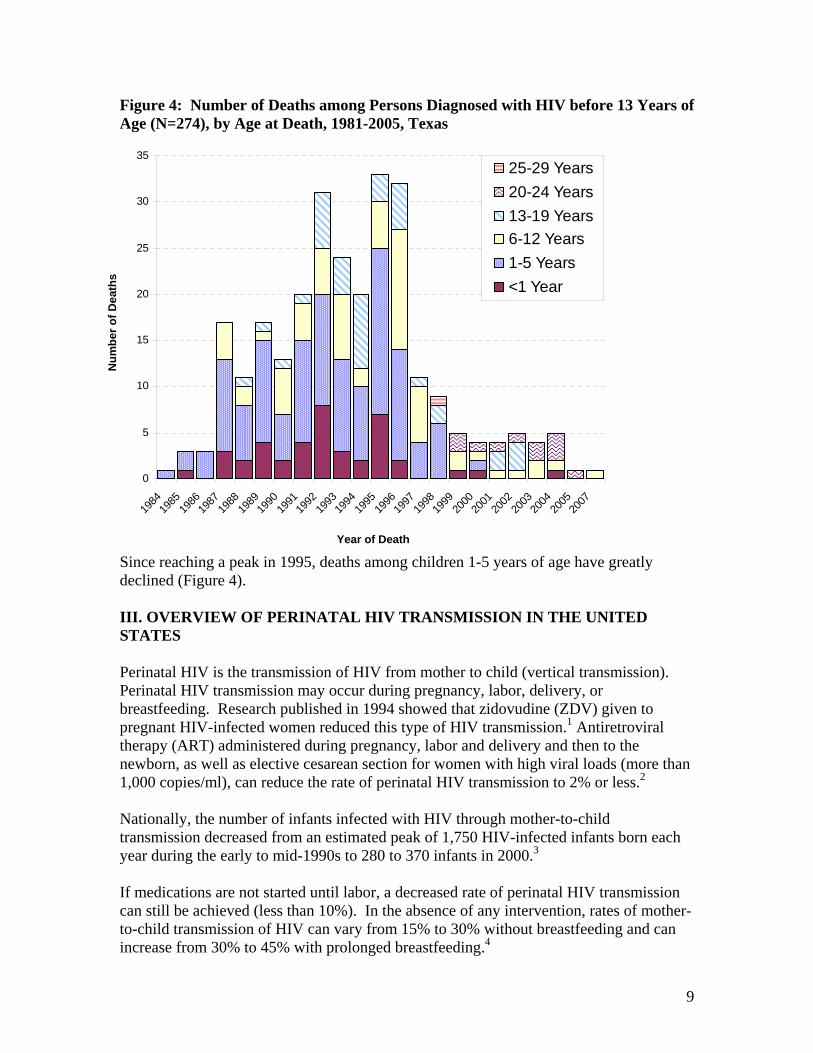
Since reaching a peak in 1995, deaths among children 1-5 years of age have greatly declined (Figure 4). III. OVERVIEW OF PERINATAL HIV TRANSMISSION IN THE UNITED STATES Perinatal HIV is the transmission of HIV from mother to child (vertical transmission). Perinatal HIV transmission may occur during pregnancy, labor, delivery, or breastfeeding. Research published in 1994 showed that zidovudine (ZDV) given to pregnant HIV-infected women reduced this type of HIV transmission.1 Antiretroviral therapy (ART) administered during pregnancy, labor and delivery and then to the newborn, as well as elective cesarean section for women with high viral loads (more than 1,000 copies/ml), can reduce the rate of perinatal HIV transmission to 2% or less.2 Nationally, the number of infants infected with HIV through mother-to-child transmission decreased from an estimated peak of 1,750 HIV-infected infants born each year during the early to mid-1990s to 280 to 370 infants in 2000.3
If medications are not started until labor, a decreased rate of perinatal HIV transmission can still be achieved (less than 10%). In the absence of any intervention, rates of mother-to-child transmission of HIV can vary from 15% to 30% without breastfeeding and can increase from 30% to 45% with prolonged breastfeeding.4
Year of Death
Num
ber o
f Dea
ths
10
In the United States, perinatal HIV transmission is the most common route of HIV infection among children and is now the source of almost all AIDS cases in children.5 An estimated 9,101 children have been diagnosed with AIDS and more than 90% of these children have been perinatally infected as of 2005. In addition, the majority of children diagnosed with AIDS were among children of minority races or ethnicities. For diagnoses occurring in 2005, 70% of perinatal infections occurred among African Americans in the United States. Table 2: Perinatal HIV/AIDS among Children in the United States in 2005 Total Estimated number of children <13 years of age at diagnosis living with HIV/AIDS
6,051
Estimated number of children <13 years of age at diagnosis who died of HIV/AIDS
46
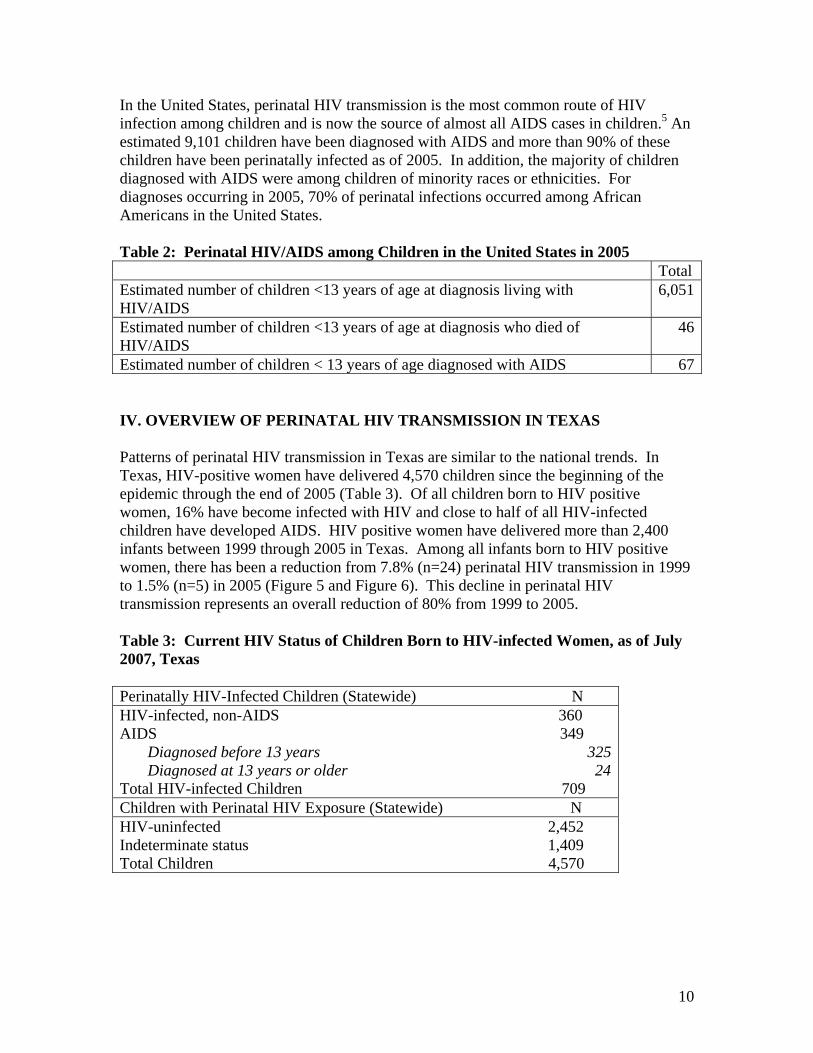
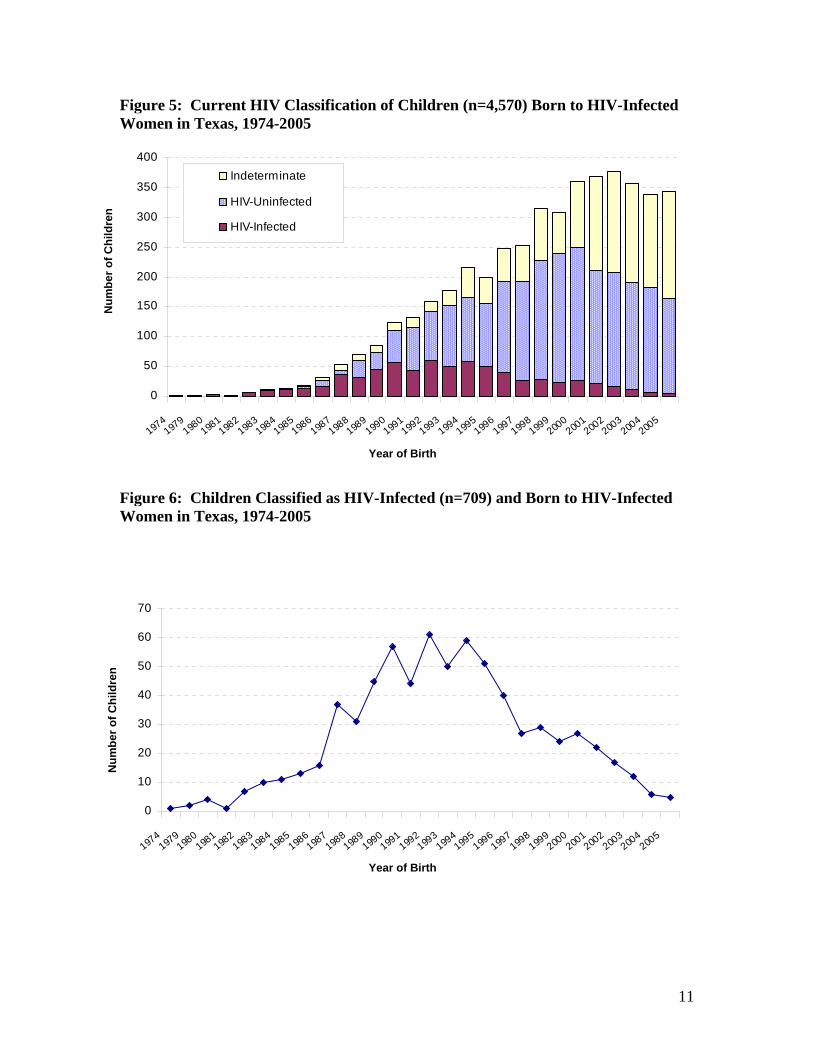
Estimated number of children < 13 years of age diagnosed with AIDS 67 IV. OVERVIEW OF PERINATAL HIV TRANSMISSION IN TEXAS Patterns of perinatal HIV transmission in Texas are similar to the national trends. In Texas, HIV-positive women have delivered 4,570 children since the beginning of the epidemic through the end of 2005 (Table 3). Of all children born to HIV positive women, 16% have become infected with HIV and close to half of all HIV-infected children have developed AIDS. HIV positive women have delivered more than 2,400 infants between 1999 through 2005 in Texas. Among all infants born to HIV positive women, there has been a reduction from 7.8% (n=24) perinatal HIV transmission in 1999 to 1.5% (n=5) in 2005 (Figure 5 and Figure 6). This decline in perinatal HIV transmission represents an overall reduction of 80% from 1999 to 2005. Table 3: Current HIV Status of Children Born to HIV-infected Women, as of July 2007, Texas Perinatally HIV-Infected Children (Statewide) N HIV-infected, non-AIDS 360 AIDS 349 Diagnosed before 13 years 325 Diagnosed at 13 years or older 24 Total HIV-infected Children 709 Children with Perinatal HIV Exposure (Statewide) N HIV-uninfected 2,452 Indeterminate status 1,409 Total Children 4,570
11
Figure 5: Current HIV Classification of Children (n=4,570) Born to HIV-Infected Women in Texas, 1974-2005
0
50
100
150
200
250
300
350
400
1974197
9198
0198
1198
2198
3198
4198
5198
6198
7198
8198
9199
0199
1199
2199
3199
4199
5199
6199
7199
8199
9200
0200
1200
2200
3200
4200
5
Indeterminate
HIV-Uninfected
HIV-Infected
Figure 6: Children Classified as HIV-Infected (n=709) and Born to HIV-Infected Women in Texas, 1974-2005
0
10
20
30
40
50
60
70
1974
1979198
0198
1198
2198
3198
4198
5198
6198
7198
8198
9199
0199
1199
2199
3199
4199
5199
6199
7199
8199
9200
0200
1200
2200
3200
4200
5
Year of Birth
Num
ber o
f Chi
ldre
n N
umbe
r of C
hild
ren
Year of Birth
12
Figure 7: Racial/Ethnic Distribution of Living* Perinatally HIV-Infected Children (N=514) by Year of Birth, 1984-2005, Texas
0
10
20
30
40
5019
8019
8119
8219
8319
8419
8519
8619
8719
8819
8919
9019
9119
9219
9319
9419
9519
9619
9719
9819
9920
0020
0120
0220
0320
0420
05
Black Hispanic White Other
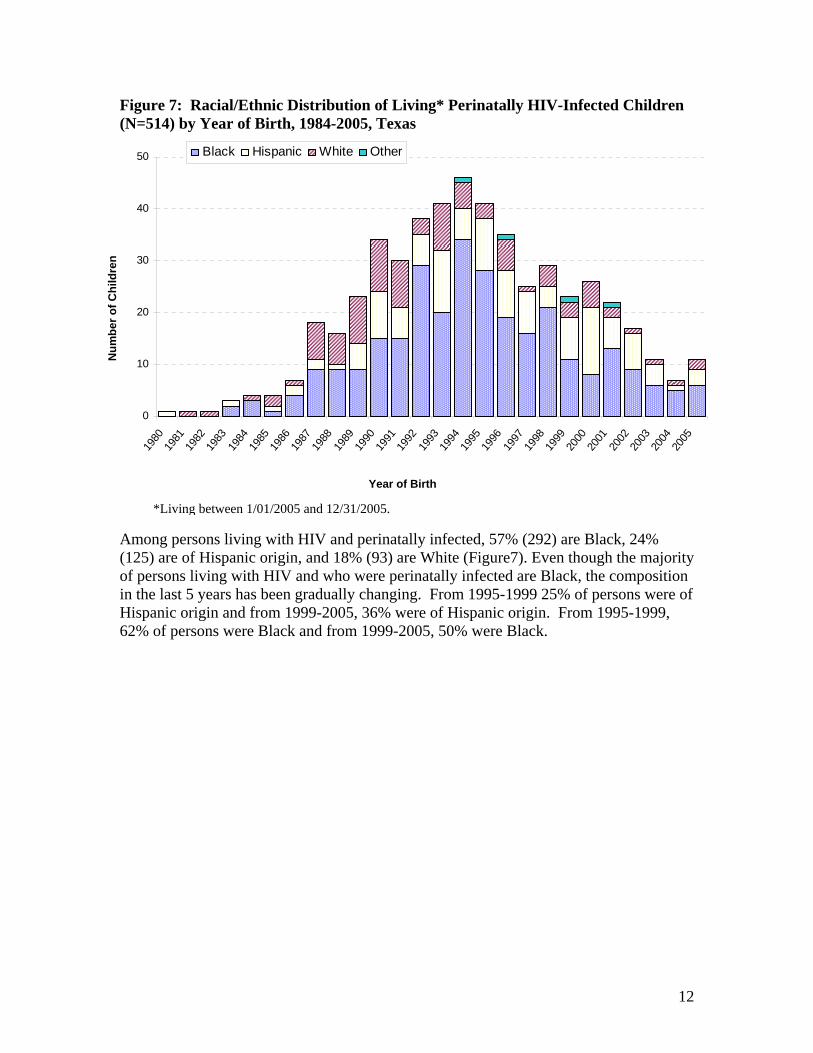
Among persons living with HIV and perinatally infected, 57% (292) are Black, 24% (125) are of Hispanic origin, and 18% (93) are White (Figure7). Even though the majority of persons living with HIV and who were perinatally infected are Black, the composition in the last 5 years has been gradually changing. From 1995-1999 25% of persons were of Hispanic origin and from 1999-2005, 36% were of Hispanic origin. From 1995-1999, 62% of persons were Black and from 1999-2005, 50% were Black.
Year of Birth
Num
ber o
f Chi
ldre
n
*Living between 1/01/2005 and 12/31/2005.
13
Figure 8: Age at HIV Diagnosis of Perinatally HIV-Infected Children (N=709) by Year of Diagnosis, 1984-2005, Texas
0
10
20
30
40
50
60
70
1984
1985
1986
1987
1988
1989
1990
1991
1992
1993
1994
1995
1996
1997
1998
1999
2000
2001
2002
2003
2004
2005
2006
13 to 19 years
6 to 12 years
1 to 5 years
<1 Year
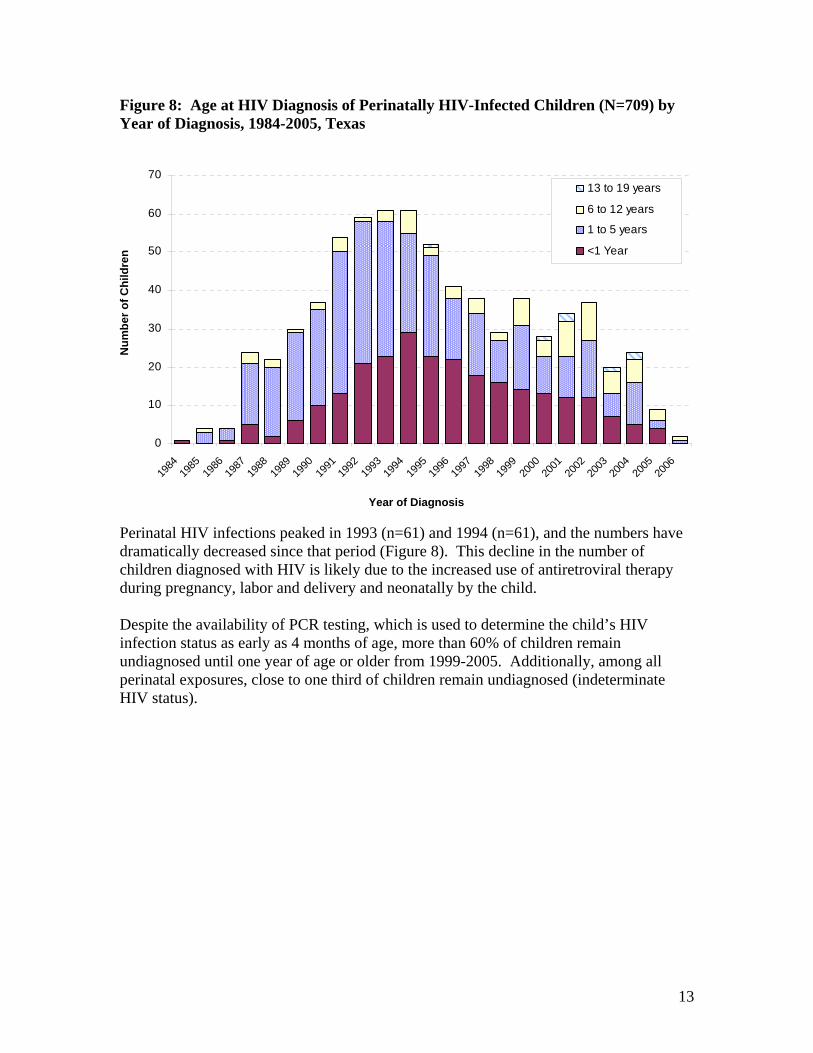
Perinatal HIV infections peaked in 1993 (n=61) and 1994 (n=61), and the numbers have dramatically decreased since that period (Figure 8). This decline in the number of children diagnosed with HIV is likely due to the increased use of antiretroviral therapy during pregnancy, labor and delivery and neonatally by the child. Despite the availability of PCR testing, which is used to determine the child’s HIV infection status as early as 4 months of age, more than 60% of children remain undiagnosed until one year of age or older from 1999-2005. Additionally, among all perinatal exposures, close to one third of children remain undiagnosed (indeterminate HIV status).
Num
ber o
f Chi
ldre
n
Year of Diagnosis
14
Figure 9: Age at AIDS Diagnosis of Perinatally HIV-Infected Children (N=349) by Year of Diagnosis, 1984-2005, Texas
0
5
10
15
20
25
30
35
40
45
50
1984
1985
1986
1987
1988
1989
1990
1991
1992
1993
1994
1995
1996
1997
1998
1999
2000
2001
2002
2004
13 to 19 years
6 to 12 years
1 to 5 years
<1 Year
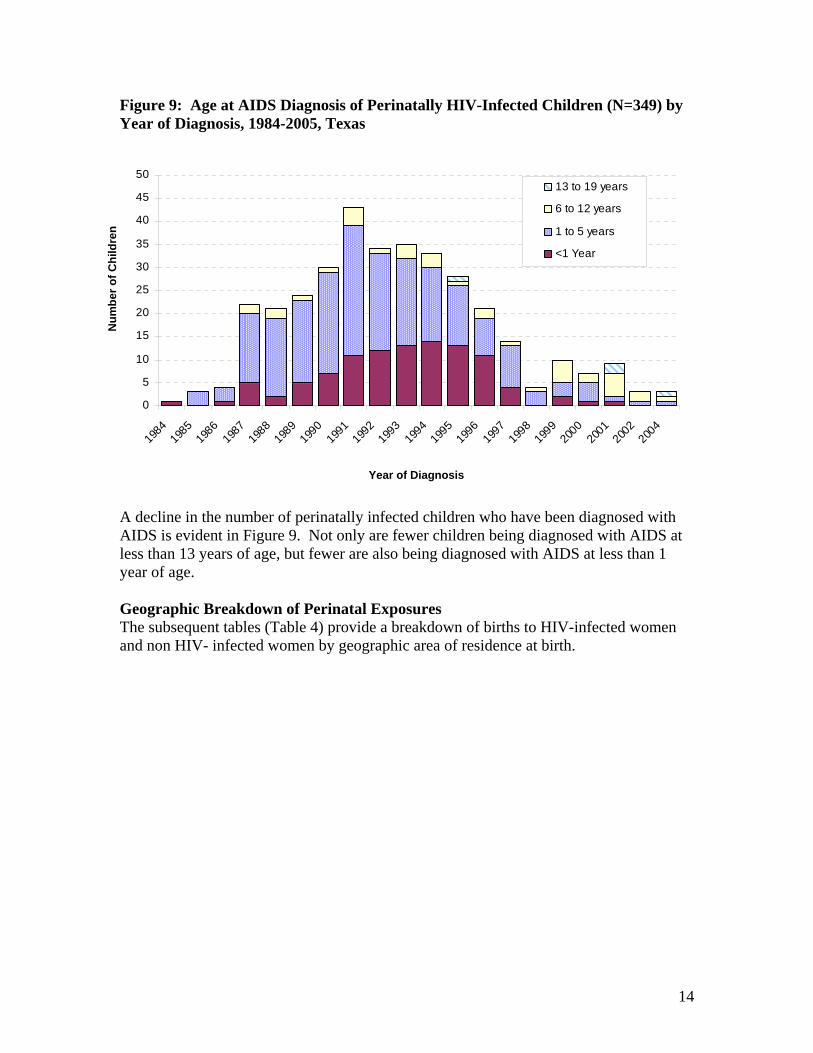
A decline in the number of perinatally infected children who have been diagnosed with AIDS is evident in Figure 9. Not only are fewer children being diagnosed with AIDS at less than 13 years of age, but fewer are also being diagnosed with AIDS at less than 1 year of age. Geographic Breakdown of Perinatal Exposures The subsequent tables (Table 4) provide a breakdown of births to HIV-infected women and non HIV- infected women by geographic area of residence at birth.
Num
ber o
f Chi
ldre
n
Year of Diagnosis
15
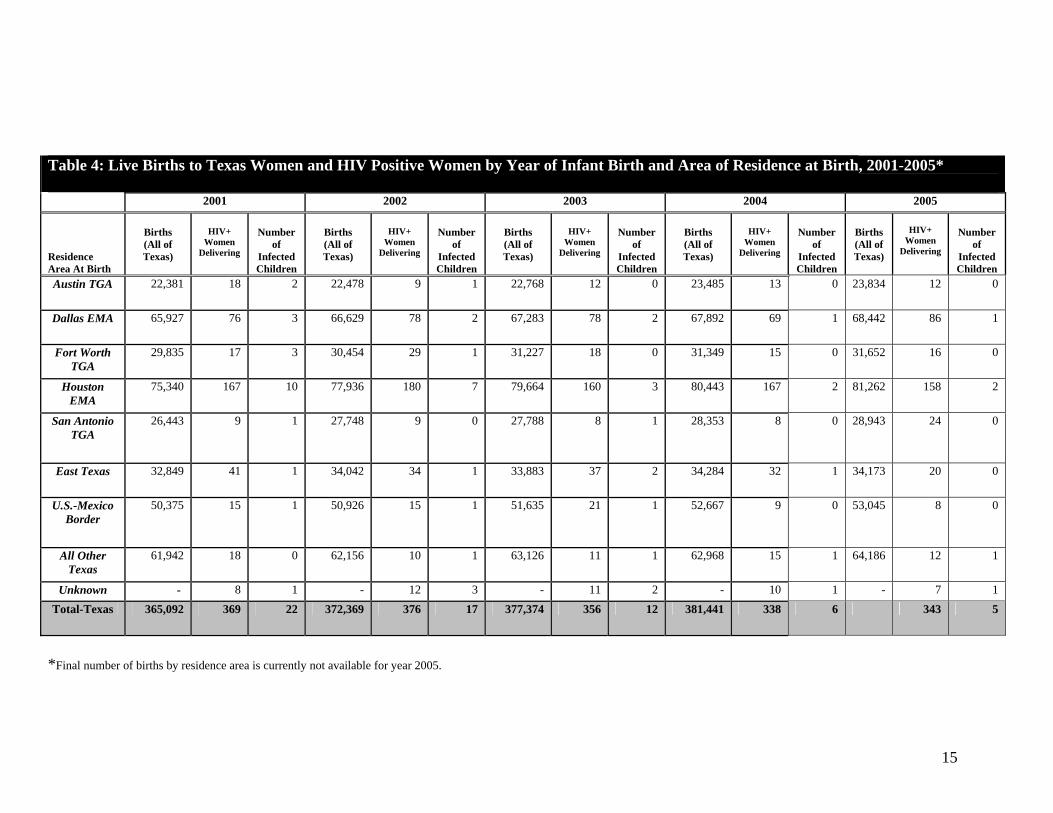
*Final number of births by residence area is currently not available for year 2005.
Table 4: Live Births to Texas Women and HIV Positive Women by Year of Infant Birth and Area of Residence at Birth, 2001-2005* 2001 2002 2003 2004 2005
Residence Area At Birth
Births (All of Texas)
HIV+
Women Delivering
Number
of Infected Children
Births (All of Texas)
HIV+
Women Delivering
Number
of Infected Children
Births (All of Texas)
HIV+
Women Delivering
Number
of Infected Children
Births (All of Texas)
HIV+
Women Delivering
Number
of Infected Children
Births (All of Texas)
HIV+
Women Delivering
Number
of Infected Children
Austin TGA 22,381 18 2 22,478 9 1 22,768 12 0 23,485 13 0 23,834
12 0
Dallas EMA 65,927 76 3 66,629 78 2 67,283 78 2 67,892 69 1 68,442
86 1
Fort Worth TGA
29,835 17 3 30,454 29 1 31,227 18 0 31,349 15 0 31,652
16 0
Houston EMA
75,340 167 10 77,936 180 7 79,664 160 3 80,443 167 2 81,262
158 2
San Antonio TGA
26,443 9 1 27,748 9 0 27,788 8 1 28,353 8 0 28,943
24 0
East Texas 32,849 41 1 34,042 34 1 33,883 37 2 34,284 32 1 34,173
20 0
U.S.-Mexico Border
50,375 15 1 50,926 15 1 51,635 21 1 52,667 9 0 53,045
8 0
All Other Texas
61,942 18 0 62,156 10 1 63,126 11 1 62,968 15 1 64,186
12 1
Unknown - 8 1 - 12 3 - 11 2 - 10 1 - 7 1 Total-Texas 365,092 369 22 372,369 376 17 377,374 356 12 381,441 338 6 343 5
16
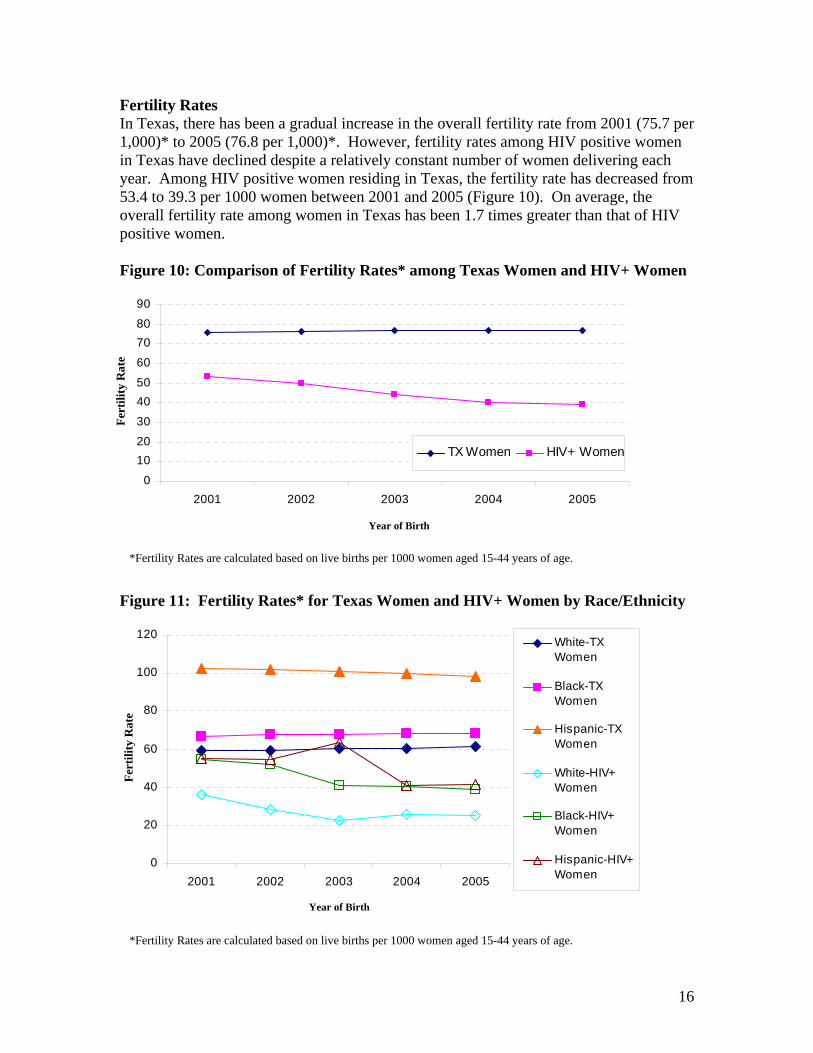
Fertility Rates In Texas, there has been a gradual increase in the overall fertility rate from 2001 (75.7 per 1,000)* to 2005 (76.8 per 1,000)*. However, fertility rates among HIV positive women in Texas have declined despite a relatively constant number of women delivering each year. Among HIV positive women residing in Texas, the fertility rate has decreased from 53.4 to 39.3 per 1000 women between 2001 and 2005 (Figure 10). On average, the overall fertility rate among women in Texas has been 1.7 times greater than that of HIV positive women. Figure 10: Comparison of Fertility Rates* among Texas Women and HIV+ Women
0
102030
4050
60
7080
90
2001 2002 2003 2004 2005
TX Women HIV+ Women
Figure 11: Fertility Rates* for Texas Women and HIV+ Women by Race/Ethnicity
0
20
40
60
80
100
120
2001 2002 2003 2004 2005
White-TXWomen
Black-TXWomen
Hispanic-TXWomen
White-HIV+Women
Black-HIV+Women
Hispanic-HIV+Women
*Fertility Rates are calculated based on live births per 1000 women aged 15-44 years of age.
Year of Birth
Fert
ility
Rat
e
Year of Birth
Fert
ility
Rat
e
*Fertility Rates are calculated based on live births per 1000 women aged 15-44 years of age.
17
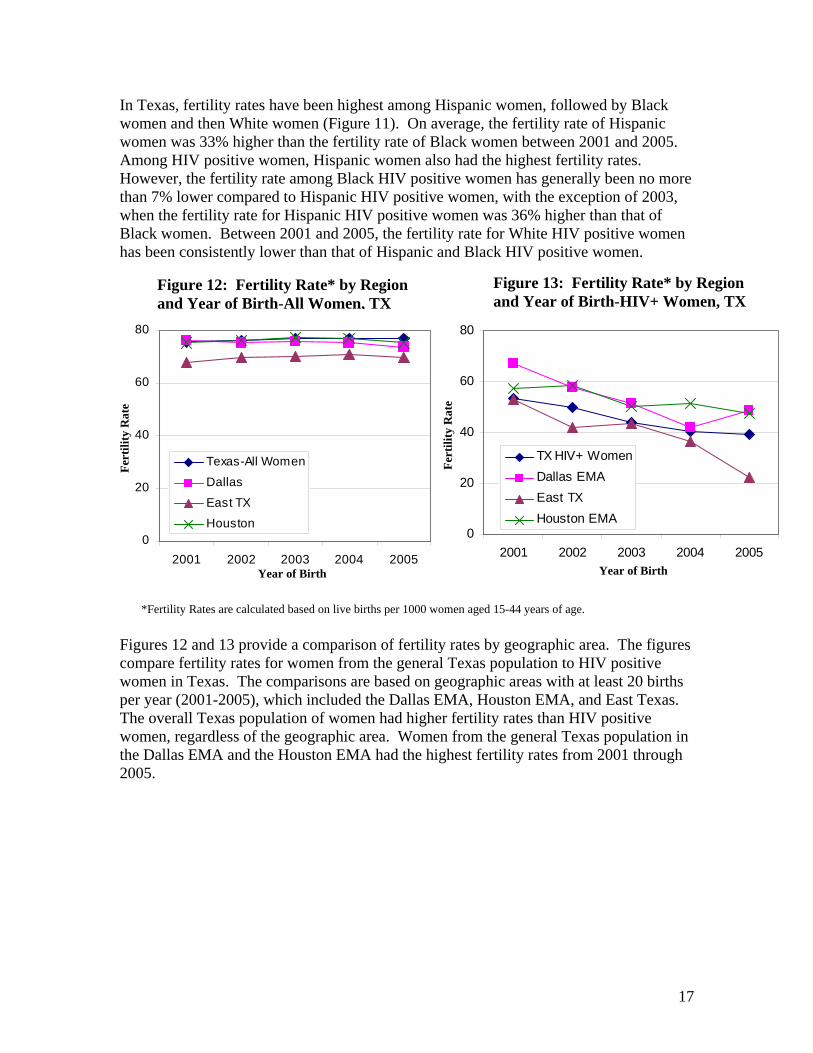
In Texas, fertility rates have been highest among Hispanic women, followed by Black women and then White women (Figure 11). On average, the fertility rate of Hispanic women was 33% higher than the fertility rate of Black women between 2001 and 2005. Among HIV positive women, Hispanic women also had the highest fertility rates. However, the fertility rate among Black HIV positive women has generally been no more than 7% lower compared to Hispanic HIV positive women, with the exception of 2003, when the fertility rate for Hispanic HIV positive women was 36% higher than that of Black women. Between 2001 and 2005, the fertility rate for White HIV positive women has been consistently lower than that of Hispanic and Black HIV positive women.
Figures 12 and 13 provide a comparison of fertility rates by geographic area. The figures compare fertility rates for women from the general Texas population to HIV positive women in Texas. The comparisons are based on geographic areas with at least 20 births per year (2001-2005), which included the Dallas EMA, Houston EMA, and East Texas. The overall Texas population of women had higher fertility rates than HIV positive women, regardless of the geographic area. Women from the general Texas population in the Dallas EMA and the Houston EMA had the highest fertility rates from 2001 through 2005.
Figure 12: Fertility Rate* by Region and Year of Birth-All Women, TX
Figure 13: Fertility Rate* by Region and Year of Birth-HIV+ Women, TX
0
20
40
60
80
2001 2002 2003 2004 2005
TX HIV+ WomenDallas EMAEast TXHouston EMA
0
20
40
60
80
2001 2002 2003 2004 2005
Texas-All Women
Dallas
East TXHouston
Fert
ility
Rat
e
Fert
ility
Rat
e
Year of Birth Year of Birth
*Fertility Rates are calculated based on live births per 1000 women aged 15-44 years of age.
18
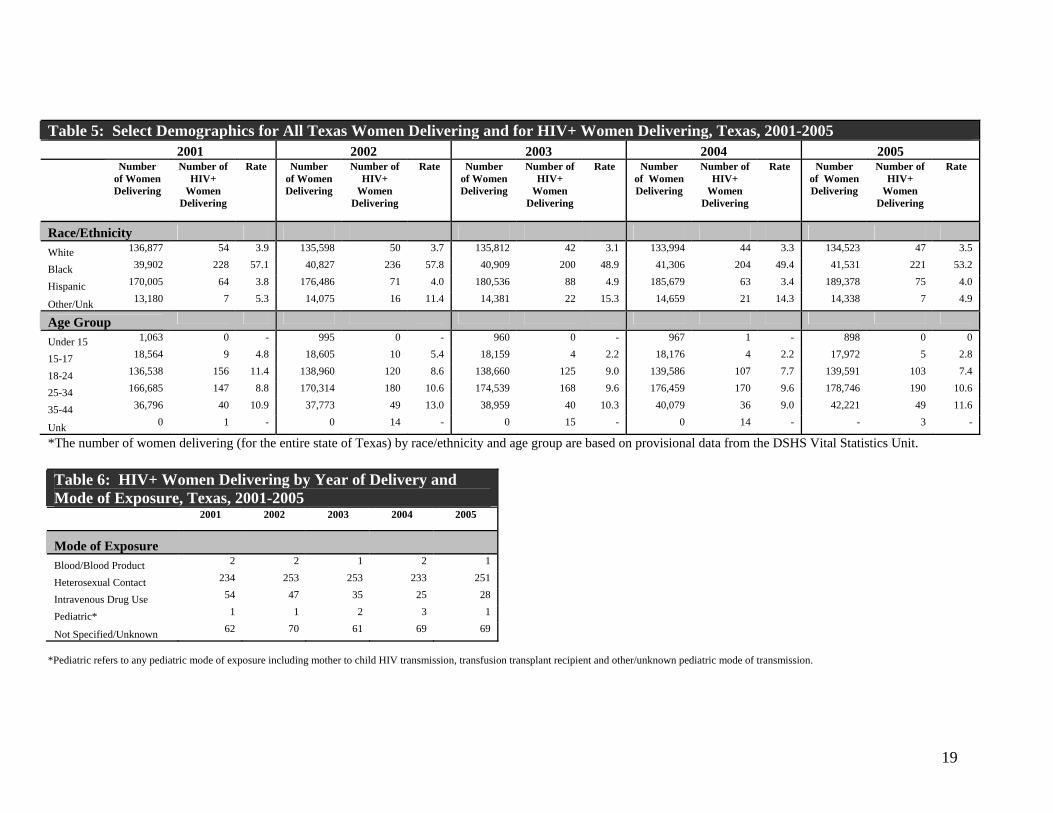
V. ENHANCED PERINATAL SURVEILLANCE DATA As of January 2008, a total of 2,261 mother-infant pairs, representing 2,196 pregnancies, had been reported through EPS from 1999-2005. However, there are an additional 207 mother-infant pairs that have been reported into HARS but for which no EPS data has been collected. These 207 mother-infant pairs have limited information available but have also been included in this report. Within this time period, 116 infants were diagnosed with HIV. This section describes the population of HIV-infected women who gave birth to live infants from 1999-2005. This information can be used to further focus perinatal prevention efforts in Texas. The data are presented by child’s birth year to allow the reader to better understand the characteristics of this population for each year. Demographics of Women Delivering Perinatally HIV Exposed Infants The racial/ethnic distributions of HIV-infected women who resided in Texas and delivered an infant between 2001 and 2005 show that Black women were disproportionately represented in this group. Sixty-two percent of women who delivered an infant between 2001 through 2005 were Black, 21% were Hispanic and 13% were White. From 2001-2005, close to half of all women who delivered an infant were 25-34 years of age, and 35% were 18-24 years of age. Heterosexual contact was the most commonly reported (70%) mode of exposure among women who resided in Texas and delivered an infant from 2001-2005, while a smaller percentage of women (11%) reported intravenous drug use. The demographic breakdown of HIV positive women delivering in Texas follows in Tables 5 and 6.
19
*The number of women delivering (for the entire state of Texas) by race/ethnicity and age group are based on provisional data from the DSHS Vital Statistics Unit. Table 6: HIV+ Women Delivering by Year of Delivery and Mode of Exposure, Texas, 2001-2005
2001 2002 2003 2004 2005
Mode of Exposure Blood/Blood Product 2 2 1 2 1
Heterosexual Contact 234 253 253 233 251
Intravenous Drug Use 54 47 35 25 28
Pediatric* 1 1 2 3 1
Not Specified/Unknown 62 70 61 69 69
*Pediatric refers to any pediatric mode of exposure including mother to child HIV transmission, transfusion transplant recipient and other/unknown pediatric mode of transmission.
Table 5: Select Demographics for All Texas Women Delivering and for HIV+ Women Delivering, Texas, 2001-2005 2001 2002 2003 2004 2005
Number of Women Delivering
Number of HIV+
Women Delivering
Rate Number of Women Delivering
Number of HIV+
Women Delivering
Rate Number of Women Delivering
Number of HIV+
Women Delivering
Rate Number of Women Delivering
Number of HIV+
Women Delivering
Rate Number of Women Delivering
Number of HIV+
Women Delivering
Rate
Race/Ethnicity White 136,877 54 3.9 135,598 50 3.7 135,812 42 3.1 133,994 44 3.3 134,523 47 3.5
Black 39,902 228 57.1 40,827 236 57.8 40,909 200 48.9 41,306 204 49.4 41,531 221 53.2
Hispanic 170,005 64 3.8 176,486 71 4.0 180,536 88 4.9 185,679 63 3.4 189,378 75 4.0
Other/Unk 13,180 7 5.3 14,075 16 11.4 14,381 22 15.3 14,659 21 14.3 14,338 7 4.9
Age Group
Under 15 1,063 0 - 995 0 - 960 0 - 967 1 - 898 0 0
15-17 18,564 9 4.8 18,605 10 5.4 18,159 4 2.2 18,176 4 2.2 17,972 5 2.8
18-24 136,538 156 11.4 138,960 120 8.6 138,660 125 9.0 139,586 107 7.7 139,591 103 7.4
25-34 166,685 147 8.8 170,314 180 10.6 174,539 168 9.6 176,459 170 9.6 178,746 190 10.6
35-44 36,796 40 10.9 37,773 49 13.0 38,959 40 10.3 40,079 36 9.0 42,221 49 11.6
Unk 0 1 - 0 14 - 0 15 - 0 14 - - 3 -
20
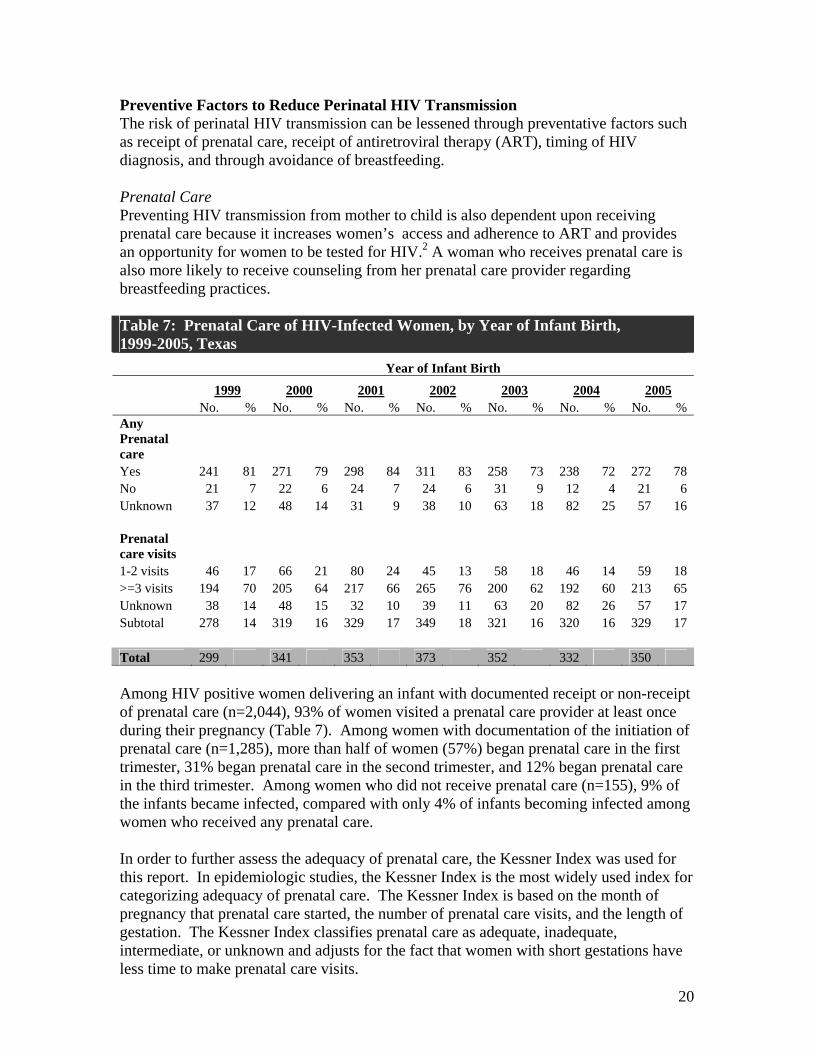
Preventive Factors to Reduce Perinatal HIV Transmission The risk of perinatal HIV transmission can be lessened through preventative factors such as receipt of prenatal care, receipt of antiretroviral therapy (ART), timing of HIV diagnosis, and through avoidance of breastfeeding. Prenatal Care Preventing HIV transmission from mother to child is also dependent upon receiving prenatal care because it increases women’s access and adherence to ART and provides an opportunity for women to be tested for HIV.2 A woman who receives prenatal care is also more likely to receive counseling from her prenatal care provider regarding breastfeeding practices. Table 7: Prenatal Care of HIV-Infected Women, by Year of Infant Birth, 1999-2005, Texas Year of Infant Birth
1999 2000 2001 2002 2003 2004 2005 No. % No. % No. % No. % No. % No. % No. % Any Prenatal care Yes 241 81 271 79 298 84 311 83 258 73 238 72 272 78 No 21 7 22 6 24 7 24 6 31 9 12 4 21 6 Unknown 37 12 48 14 31 9 38 10 63 18 82 25 57 16 Prenatal care visits 1-2 visits 46 17 66 21 80 24 45 13 58 18 46 14 59 18 >=3 visits 194 70 205 64 217 66 265 76 200 62 192 60 213 65 Unknown 38 14 48 15 32 10 39 11 63 20 82 26 57 17 Subtotal 278 14 319 16 329 17 349 18 321 16 320 16 329 17 Total 299 341 353 373 352 332 350 Among HIV positive women delivering an infant with documented receipt or non-receipt of prenatal care (n=2,044), 93% of women visited a prenatal care provider at least once during their pregnancy (Table 7). Among women with documentation of the initiation of prenatal care (n=1,285), more than half of women (57%) began prenatal care in the first trimester, 31% began prenatal care in the second trimester, and 12% began prenatal care in the third trimester. Among women who did not receive prenatal care (n=155), 9% of the infants became infected, compared with only 4% of infants becoming infected among women who received any prenatal care. In order to further assess the adequacy of prenatal care, the Kessner Index was used for this report. In epidemiologic studies, the Kessner Index is the most widely used index for categorizing adequacy of prenatal care. The Kessner Index is based on the month of pregnancy that prenatal care started, the number of prenatal care visits, and the length of gestation. The Kessner Index classifies prenatal care as adequate, inadequate, intermediate, or unknown and adjusts for the fact that women with short gestations have less time to make prenatal care visits.
21
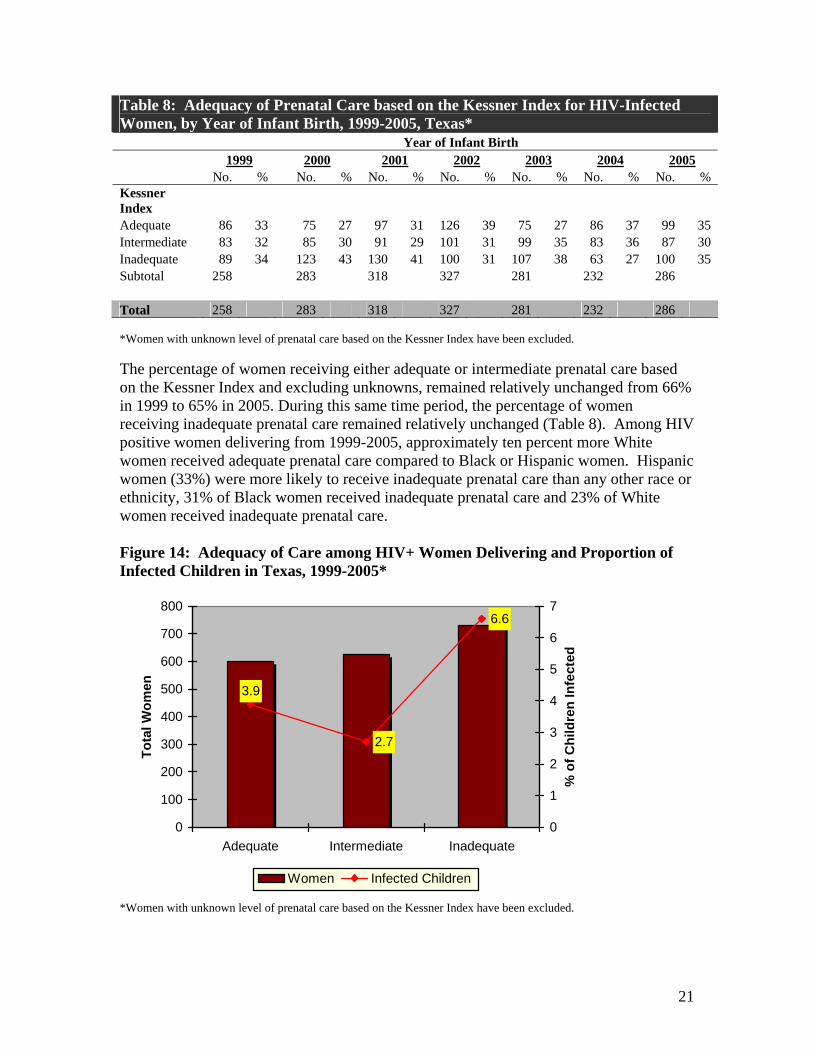
Table 8: Adequacy of Prenatal Care based on the Kessner Index for HIV-Infected Women, by Year of Infant Birth, 1999-2005, Texas* Year of Infant Birth 1999 2000 2001 2002 2003 2004 2005 No. % No. % No. % No. % No. % No. % No. % Kessner Index Adequate 86 33 75 27 97 31 126 39 75 27 86 37 99 35 Intermediate 83 32 85 30 91 29 101 31 99 35 83 36 87 30 Inadequate 89 34 123 43 130 41 100 31 107 38 63 27 100 35 Subtotal 258 283 318 327 281 232 286 Total 258 283 318 327 281 232 286 *Women with unknown level of prenatal care based on the Kessner Index have been excluded. The percentage of women receiving either adequate or intermediate prenatal care based on the Kessner Index and excluding unknowns, remained relatively unchanged from 66% in 1999 to 65% in 2005. During this same time period, the percentage of women receiving inadequate prenatal care remained relatively unchanged (Table 8). Among HIV positive women delivering from 1999-2005, approximately ten percent more White women received adequate prenatal care compared to Black or Hispanic women. Hispanic women (33%) were more likely to receive inadequate prenatal care than any other race or ethnicity, 31% of Black women received inadequate prenatal care and 23% of White women received inadequate prenatal care. Figure 14: Adequacy of Care among HIV+ Women Delivering and Proportion of Infected Children in Texas, 1999-2005*
3.9
2.7
6.6
0
100
200
300
400
500
600
700
800
Adequate Intermediate Inadequate
Tota
l Wom
en
0
1
2
3
4
5
6
7
% o
f Chi
ldre
n In
fect
ed
Women Infected Children
*Women with unknown level of prenatal care based on the Kessner Index have been excluded.
22
In Texas, 3.3% of infants born to HIV positive women who delivered between 1999-2005 and received adequate or intermediate prenatal care based on the Kessner Index became infected with HIV. On the other hand, close to 7% of infants born to HIV positive women who received inadequate prenatal care became infected with HIV (Figure 14). When comparing adequacy of prenatal care within racial/ethnic groups, the highest percentage of HIV-infected infants occurred among women receiving an inadequate level of care : among Black women 46% of infants were infected; among Hispanic women 42% of infants were infected; and among White women 36% of infants were infected. Antiretroviral Therapy The transmission of HIV from mother to child can be decreased through the administration of antiretroviral therapy (ART) at the recommended periods: during pregnancy, at labor and delivery, and neonatally by the child (Table 9.) For purposes of this report ART is defined as any type of antiretroviral medication including combination drugs, entry and fusion inhibitors, integrase inhibitors, non-nucleoside reverse transcriptase inhibitors, nucleoside reverse transcriptase inhibitors or protease inhibitors. Among women with documented receipt or non-receipt of ART during the prenatal period, an average of 84% of women received ART from 1999-2005. In birth year 1999, 84% of women received ART during the prenatal period and in 2005, 83% of women received ART during the prenatal period. Among women with documented receipt or non receipt of ART during labor and delivery, an average of 86% of women received ART from 1999-2005. In birth year 1999, 88% of women received ART during labor and delivery and in 2005, 85% of women received ART during labor and delivery. Among infants with documented receipt or non receipt of ART, an average of 97% of infants received ART neonatally from 1999-2005. In birth year 1999, 98% of infants received ART neonatally and in 2005, 98% of infants received ART neonatally.
23
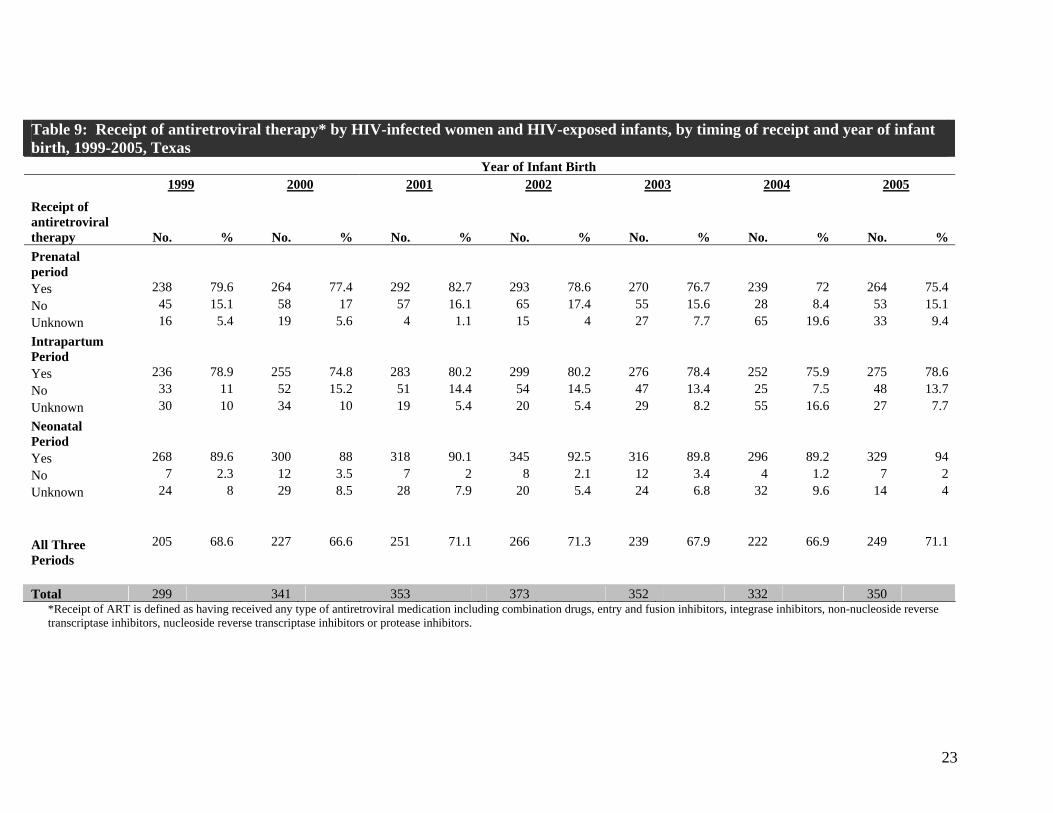
Table 9: Receipt of antiretroviral therapy* by HIV-infected women and HIV-exposed infants, by timing of receipt and year of infant birth, 1999-2005, Texas Year of Infant Birth 1999 2000 2001 2002 2003 2004 2005
Receipt of antiretroviral therapy No. % No. % No. % No. % No. % No. % No. % Prenatal period Yes 238 79.6 264 77.4 292 82.7 293 78.6 270 76.7 239 72 264 75.4 No 45 15.1 58 17 57 16.1 65 17.4 55 15.6 28 8.4 53 15.1 Unknown 16 5.4 19 5.6 4 1.1 15 4 27 7.7 65 19.6 33 9.4 Intrapartum Period Yes 236 78.9 255 74.8 283 80.2 299 80.2 276 78.4 252 75.9 275 78.6 No 33 11 52 15.2 51 14.4 54 14.5 47 13.4 25 7.5 48 13.7 Unknown 30 10 34 10 19 5.4 20 5.4 29 8.2 55 16.6 27 7.7 Neonatal Period Yes 268 89.6 300 88 318 90.1 345 92.5 316 89.8 296 89.2 329 94 No 7 2.3 12 3.5 7 2 8 2.1 12 3.4 4 1.2 7 2 Unknown 24 8 29 8.5 28 7.9 20 5.4 24 6.8 32 9.6 14 4
All Three Periods
205 68.6 227 66.6 251 71.1 266 71.3 239 67.9 222 66.9 249 71.1
Total 299 341 353 373 352 332 350
*Receipt of ART is defined as having received any type of antiretroviral medication including combination drugs, entry and fusion inhibitors, integrase inhibitors, non-nucleoside reverse transcriptase inhibitors, nucleoside reverse transcriptase inhibitors or protease inhibitors.
24
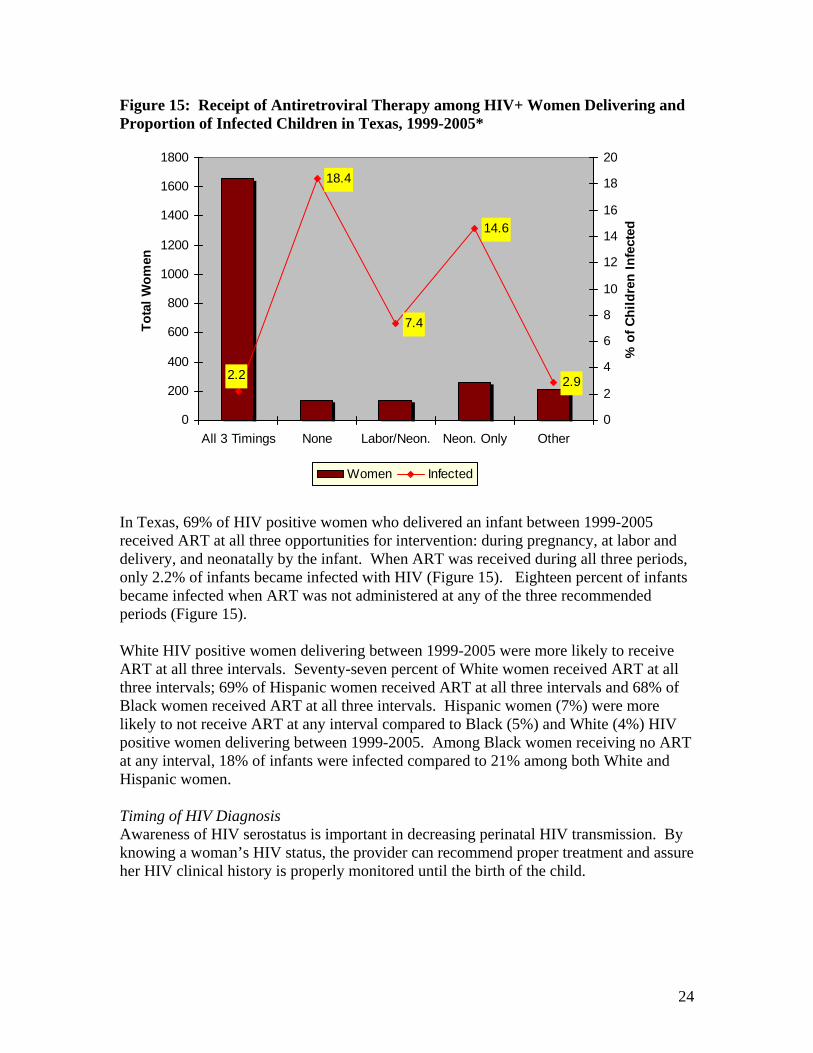
Figure 15: Receipt of Antiretroviral Therapy among HIV+ Women Delivering and Proportion of Infected Children in Texas, 1999-2005*
7.4
18.4
2.2
14.6
2.9
0
200
400
600
800
1000
1200
1400
1600
1800
All 3 Timings None Labor/Neon. Neon. Only Other
Tota
l Wom
en
0
2
4
6
8
10
12
14
16
18
20
% o
f Chi
ldre
n In
fect
ed
Women Infected
In Texas, 69% of HIV positive women who delivered an infant between 1999-2005 received ART at all three opportunities for intervention: during pregnancy, at labor and delivery, and neonatally by the infant. When ART was received during all three periods, only 2.2% of infants became infected with HIV (Figure 15). Eighteen percent of infants became infected when ART was not administered at any of the three recommended periods (Figure 15). White HIV positive women delivering between 1999-2005 were more likely to receive ART at all three intervals. Seventy-seven percent of White women received ART at all three intervals; 69% of Hispanic women received ART at all three intervals and 68% of Black women received ART at all three intervals. Hispanic women (7%) were more likely to not receive ART at any interval compared to Black (5%) and White (4%) HIV positive women delivering between 1999-2005. Among Black women receiving no ART at any interval, 18% of infants were infected compared to 21% among both White and Hispanic women. Timing of HIV Diagnosis Awareness of HIV serostatus is important in decreasing perinatal HIV transmission. By knowing a woman’s HIV status, the provider can recommend proper treatment and assure her HIV clinical history is properly monitored until the birth of the child.
25
Table 10: Timing of HIV Diagnosis for HIV Positive Women Delivering, 1999-2005, Texas
Year of Infant Birth 1999 2000 2001 2002 2003 2004 2005
Timing of HIV Diagnosis
HIV+ Women
% Infected Infants
HIV+ Women
% Infected Infants
HIV+ Women
% Infected Infants
HIV+ Women
% Infected Infants
HIV+ Women
% Infected Infants
HIV+ Women
% Infected Infants
HIV+ Women
% Infected Infants
Before This Pregnancy 157 3.2 165 3.6 189 3.2 216 4.2 227 1.8 228 1.3 230 0.4
During This Pregnancy 94 4.3 125 5.6 133 9.0 131 3.1 103 3.9 83 2.4 89 1.1
At Delivery or After Delivery 35 42.9 38 34.2 27 14.8 24 12.5 21 28.6 18 5.6 30 10.0
HIV Infected-Unknown When Diagnosed 13 0.0 12 0.0 4 0.0 2 100.0 1 0.0 3 0.0 1 0.0
Mom Refused HIV Testing 0 --- 1 100.0 0 --- 0 --- 0 --- 0 --- 0 ---
Total 299 341 353 373 352 332 350
26
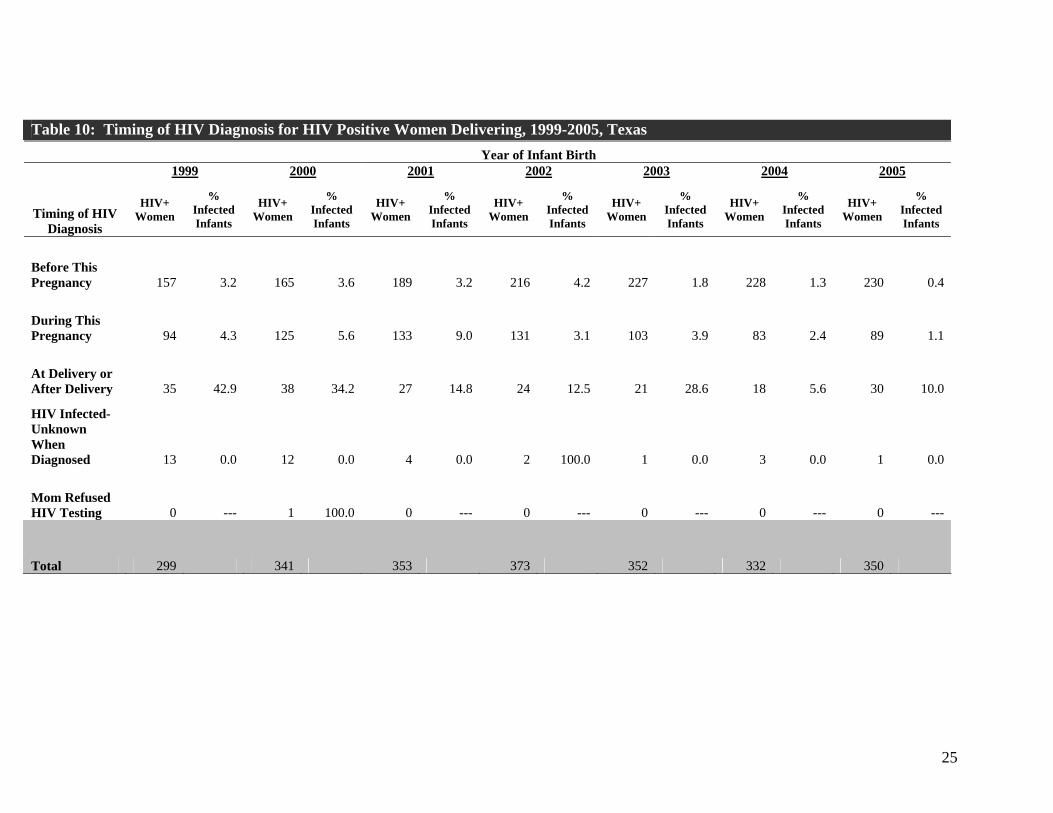
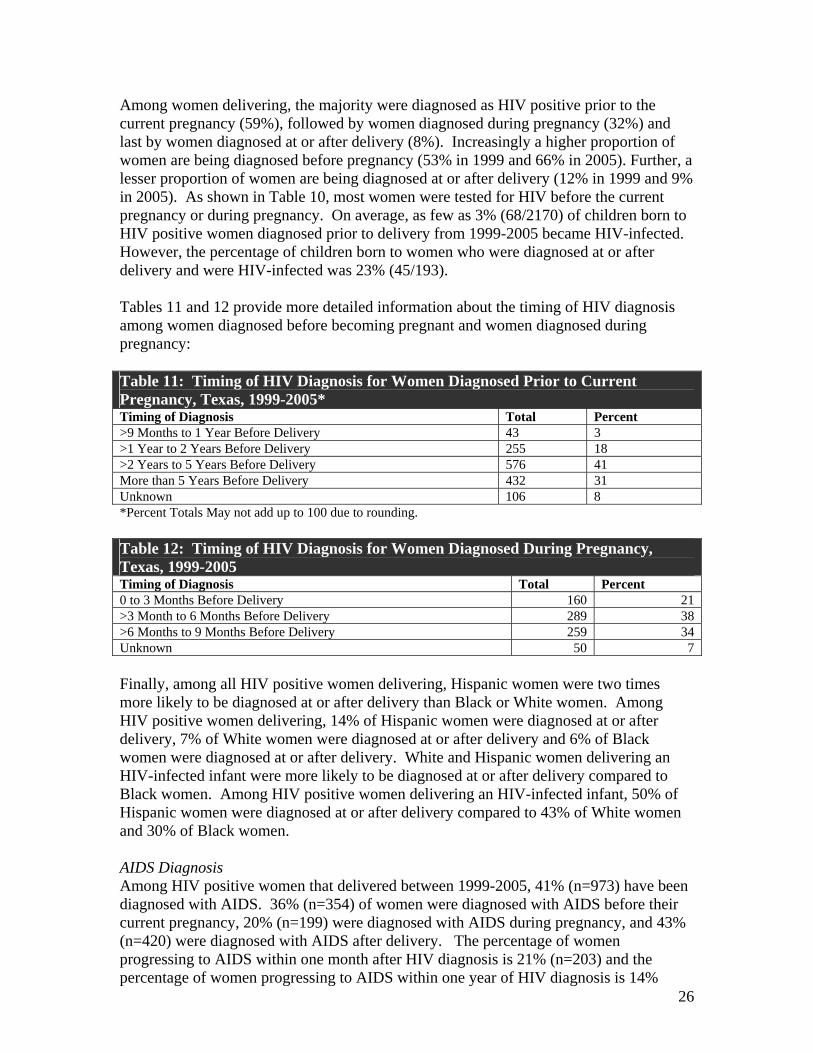
Among women delivering, the majority were diagnosed as HIV positive prior to the current pregnancy (59%), followed by women diagnosed during pregnancy (32%) and last by women diagnosed at or after delivery (8%). Increasingly a higher proportion of women are being diagnosed before pregnancy (53% in 1999 and 66% in 2005). Further, a lesser proportion of women are being diagnosed at or after delivery (12% in 1999 and 9% in 2005). As shown in Table 10, most women were tested for HIV before the current pregnancy or during pregnancy. On average, as few as 3% (68/2170) of children born to HIV positive women diagnosed prior to delivery from 1999-2005 became HIV-infected. However, the percentage of children born to women who were diagnosed at or after delivery and were HIV-infected was 23% (45/193). Tables 11 and 12 provide more detailed information about the timing of HIV diagnosis among women diagnosed before becoming pregnant and women diagnosed during pregnancy: Table 11: Timing of HIV Diagnosis for Women Diagnosed Prior to Current Pregnancy, Texas, 1999-2005* Timing of Diagnosis Total Percent >9 Months to 1 Year Before Delivery 43 3 >1 Year to 2 Years Before Delivery 255 18 >2 Years to 5 Years Before Delivery 576 41 More than 5 Years Before Delivery 432 31 Unknown 106 8 *Percent Totals May not add up to 100 due to rounding. Table 12: Timing of HIV Diagnosis for Women Diagnosed During Pregnancy, Texas, 1999-2005 Timing of Diagnosis Total Percent 0 to 3 Months Before Delivery 160 21 >3 Month to 6 Months Before Delivery 289 38 >6 Months to 9 Months Before Delivery 259 34 Unknown 50 7 Finally, among all HIV positive women delivering, Hispanic women were two times more likely to be diagnosed at or after delivery than Black or White women. Among HIV positive women delivering, 14% of Hispanic women were diagnosed at or after delivery, 7% of White women were diagnosed at or after delivery and 6% of Black women were diagnosed at or after delivery. White and Hispanic women delivering an HIV-infected infant were more likely to be diagnosed at or after delivery compared to Black women. Among HIV positive women delivering an HIV-infected infant, 50% of Hispanic women were diagnosed at or after delivery compared to 43% of White women and 30% of Black women. AIDS Diagnosis Among HIV positive women that delivered between 1999-2005, 41% (n=973) have been diagnosed with AIDS. 36% (n=354) of women were diagnosed with AIDS before their current pregnancy, 20% (n=199) were diagnosed with AIDS during pregnancy, and 43% (n=420) were diagnosed with AIDS after delivery. The percentage of women progressing to AIDS within one month after HIV diagnosis is 21% (n=203) and the percentage of women progressing to AIDS within one year of HIV diagnosis is 14%

27
(n=134). Fifty-six percent of women that progressed to AIDS within one year of HIV diagnosis are Black, followed by Hispanic women (26%), and White women (15%).
28
REFERENCES 1. Connor EM, Sperling RS, Gelber R, et al. Reduction of maternal-infant
transmission of human immunodeficiency virus type 1 with zidovudine treatment. New England Journal of Medicine 1994;331:1173-1180.
2. Centers for Disease Control and Prevention. Revised recommendations for HIV screening of pregnant women. MMWR 2001;50(No. RR-19):59–85.
3. Centers for Disease Control and Prevention. (2006, May) Mother-to-Child (Perinatal) HIV Transmission and Prevention. Retrieved July 9, 2007 from http://www.cdc.gov/hiv/resources/factsheets/perinatl.htmDe Cock KM, Fowler MG, Mercier E, et al. Prevention of Mother-to-child transmission in resource-poor countries: Translating research into policy and practice. JAMA 2000;283:1175-1182.
4. Centers for Disease Control and Prevention. HIV/AIDS Surveillance Report, 2005. Vol. 17. Rev ed. Atlanta: U.S. Department of Health and Human Services, Centers for Disease Control and Prevention; 2007: [inclusive page numbers].
5. Ziegler JB, Cooper DA, Johnson RO, Gold J. Postnatal transmissions of AIDS-associated retrovirus from mother to infant. Lancet 1985; 1:896-8.


![TB Activist Toolkit - TB/HIV Epidemiology and Impact [PowerPoint Slides]](https://img.pdfslide.us/doc/110x75/568c39d21a28ab0235a3d21b/tb-activist-toolkit-tbhiv-epidemiology-and-impact-powerpoint-slides.jpg)