Embed Size (px)
Citation preview

Available online at www.sciencedirect.com
www.elsevier.com/locate/paid
Personality and Individual Differences 44 (2008) 1640–1651
Taxometric analysis supports a dimensional latent structurefor schizotypy
David Rawlings a,*, Ben Williams b, Nick Haslam a, Gordon Claridge c
a Department of Psychology, University of Melbourne, VIC 3052, Australiab Department of Psychology, Swinburne University of Technology, Hawthorn VIC 3122, Australia
c Department of Experimental Psychology, South Parks Road, Oxford OX1 3UD, UK
Received 19 January 2007; received in revised form 24 May 2007; accepted 1 June 2007Available online 8 August 2007
Abstract
The existence of a discrete class of people vulnerable to schizophrenia spectrum disorders is the mostreplicated finding of taxometric research. Evidence for such a ‘‘taxon’’ has been obtained with diverse mea-sures of schizotypy in clinical, high-risk, and normal samples. However, recent demonstrations that skewedindicators of a latent dimension can yield a spuriously taxonic pattern of results may call some of thesefindings into question. Normal adults (N = 1073) completed measures of positive (perceptual aberration,magical ideation) and negative (physical and social anhedonia) components of schizotypy. Taxometriccurves resembled those obtained previously, but when a simulation procedure took skew into account,dimensional models of schizotypy received stronger support than taxonic models for most schizotypy com-ponents, with findings for magical thinking inconclusive. A re-evaluation of previous taxonic conclusionsregarding the latent structure of schizotypy is indicated.� 2007 Elsevier Ltd. All rights reserved.
Keywords: Schizotypy; Psychosis proneness; Taxometric analysis; Taxon; Dimensionality
0191-8869/$ - see front matter � 2007 Elsevier Ltd. All rights reserved.doi:10.1016/j.paid.2007.06.005
* Corresponding author. Tel.: +61 3 83446358; fax: +61 3 93476618.E-mail address: [email protected] (D. Rawlings).

D. Rawlings et al. / Personality and Individual Differences 44 (2008) 1640–1651 1641
1. Introduction
A distinction exists within the schizotypy literature between those writers who conceptualise thespectrum of schizophrenia-related characteristics as a continuous dimension, akin to other dimen-sions of personality, and those writers who argue for a more categorical, clinically-based frame-work. The first view has been championed by writers such as Eysenck (Eysenck & Eysenck, 1976)and, more recently, Claridge (1997). The opposing position was led by the late Paul Meehl (1995),who noted that the question ‘‘is not a matter of convention or preference’’ (p. 266), but is bothextremely important theoretically and empirically answerable. He argued that the available evi-dence strongly supports a categorical position.
Much of the evidence supporting the categorical view of schizotypy comes from taxometricanalysis (Waller & Meehl, 1998), a methodology developed by Meehl and his associates to clar-ify the latent structure of psychological constructs. The taxometric method comprises a family ofprocedures (e.g., MAXCOV, MAXEIG, MAMBAC, L-Mode) that examine patterns of covari-ation among manifest indicators of a latent variable for evidence diagnostic of a latent category(‘‘taxon’’) or dimension. In the MAXCOV procedure, for example, the covariance of two indi-cators, such as alternative measures of a personality trait, is plotted as a function of a third. Ifthe sample contains two latent classes – a taxon and its complement – then the covariance of thetwo indicators should reach a maximum at the point on the third indicator where the two classesoverlap most, resulting in a peaked plot. No such peak should arise when indicators of a latentdimension are examined. Distinctive features of the taxometric method are its seeking of consis-tency among multiple procedures, its reliance on graphical plots rather than null hypothesis sig-nificance testing, and its lack of bias for or against the existence of latent categories, unlikestructure-assuming methods such as factor analysis (dimensions) and cluster analysis(categories).
Taxometric procedures have been employed in more than 80 published studies (for reviews seeHaslam & Kim, 2002; Schmidt, Kotov, & Joiner, 2004), including many investigations of person-ality structure (e.g., Arnau, Green, Rosen, Gleaves, & Melancon, 2003; Strong, Brown, Kahler,Lloyd-Richardson, & Niaura, 2004). They were initially developed to test Meehl’s theory ofschizophrenia (Meehl, 1962, 1990); this holds that genetic liability to the disorder is confined toa discrete class of people, dubbed ‘‘schizotypes’’. Since then, schizotypy has become easily themost taxometrically studied construct. The nineteen published findings on schizotypy, coveringfourteen separate studies, are summarised in Table 1. These studies mostly involved self-reportmeasures of ‘‘positive’’ and ‘‘negative’’ features of schizotypy in large undergraduate samples,with a few using individual examination of smaller at-risk samples. All but four findings wereinterpreted to support a taxonic model. Taxon base rate estimates fell between 0.03 and 0.13,agreeing with Meehl’s (1990) prediction of a 10% population prevalence of schizotypy.
Despite the consistency of its findings, taxometric research on schizotypy has several limita-tions. All studies of clinical or at-risk individuals have employed samples that fall below or barelyabove the recommended minimum N (300) for taxometric studies (Meehl & Yonce, 1994), whilestudies with larger samples have exclusively used student samples. Most studies have used dichot-omous indicators; yet the risk that these can yield unreliable and pseudotaxonic inferences hasbeen widely noted (e.g., Ruscio, 2000). Data analysis has almost exclusively relied on one proce-dure (MAXCOV) and, to a lesser extent, a latent class procedure developed by Golden and Meehl

Table 1Summary of published taxometric findings on schizotypy components
Publication Sample Measuresa Proceduresb Conclusionc
Positive features
Lenzenweger and Korfine (1992) 1093 Undergraduates PAb X TaxKorfine and Lenzenweger (1995) 1646 Undergraduates PAb X TaxLenzenweger (1999) 429 Undergraduates PAb, MgI, RT X TaxKeller et al. (2001) 1103 Undergraduates Positive symptoms X DimMeyer and Keller (2001) 809 Undergraduates PAb X Tax
MgI X DimHoran et al. (2004, Study 1) 1560 Undergraduates MgI M, X InconHoran et al. (2004, Study 2) 2574 Undergraduates PAb M, X Tax
MgI M, X InconLinscott et al. (2006) 387 Secondary students PAb,MgI,RT,HT, E,L, X Tax
Negative features
Blanchard et al. (2000) 1526 Undergraduates SoA E, X TaxKeller et al. (2001) 1103 Undergraduates Negative symptoms X TaxMeyer and Keller (2001) 809 Undergraduates PhA X TaxHoran et al. (2004, Study 1) 1560 Undergraduates SoA M, X TaxHoran et al. (2004, Study 2) 2574 Undergraduates SoA M, X Tax
Other
Golden and Meehl (1979) 211 inpatient adults MMPI items L, X TaxErlenmeyer-Kimling et al. (1989) 185 & 150 children Neuromotor L TaxTyrka et al. (1995a) 311 children Int, behaviour ratings X TaxTyrka et al. (1995b) 311 adults Int X Tax
a PAb: perceptual aberration, MgI: magical thinking, RT: referential thinking, HT: hallucinatory tendency, PhA:physical anhedonia, SoA: social anhedonia, Int: interview.
b E: MAXEIG, L: latent class method, M: MAMBAC, X: MAXCOV.c Tax: taxonic, Dim: dimensional, Incon: inconclusive.
1642 D. Rawlings et al. / Personality and Individual Differences 44 (2008) 1640–1651
(1979) that has since fallen out of favour. Most researchers have examined only a single measureor dimension of schizotypy.
Most importantly, recent simulation studies have demonstrated that positively skewed data canyield taxometric plots that are frequently interpreted as evidence of a low base rate taxon (Ruscio,Ruscio, & Keane, 2004). Such data produce plots that rise to the right in a similar manner to theplots produced by such a taxon. This finding suggests that previous studies may have drawn tax-onic conclusions, not because schizotypy has a taxonic latent structure but because indicators of itare skewed. Indeed, the Chapman schizotypy scales, which many previous studies have used, weredeliberately designed to have high levels of positive skew (Chapman, Chapman, & Kwapil, 1995),especially the Perceptual Aberration scale. Inspection of previous taxometric studies of schizotypyindicates that most have drawn taxonic conclusions from rising but unpeaked (i.e., potentiallydimensional) MAXCOV plots. A major aim of the present study was to rule out the possibilitythat previous categorical conclusions were due to the distribution of the data rather than to thepresence of a taxon.

D. Rawlings et al. / Personality and Individual Differences 44 (2008) 1640–1651 1643
Using an approach employed in recent studies of borderline personality disorder (Rothschild,Cleland, Haslam, & Zimmerman, 2003) and depression (Ruscio et al., 2004), the present study fol-lowed a procedure developed by Ruscio, Ruscio, and Meron (2007) to generate simulated datasets that precisely duplicate the intercorrelations and distributional properties (i.e., skew and kur-tosis) of the empirical data. One set of simulations are based on a dimensional (single factor) mod-el, whereas the other is based on a model containing two admixed latent classes. Identicaltaxometric analyses are then conducted on the research data and the two sets of matched simu-lations. In essence, this procedure allows the taxometric plots obtained from the research datato be directly compared with those that would be obtained if taxonic or dimensional data sets withthe same idiosyncrasies were analyzed. For example, these simulations may show that idiosyncra-sies of the research data might yield plots that appear taxonic, but could in fact have been gen-erated from dimensional data. If the research data plots consistently resemble those generatedfrom one of the simulations more than the other, support for the corresponding latent structurecan be inferred. This procedure has received extensive support from simulation studies (Ruscio,Haslam, & Ruscio, 2006), which also validate a statistic that quantifies the comparative fit ofthe empirical data to the two simulations (i.e., the ratio of the respective fit values).
An attempt was also made to address the other weaknesses of previous studies in the area.Thus, in contrast to most previous studies which have relied exclusively on MAXCOV, two dis-tinct taxometric procedures were employed, and a largely non-student adult sample was em-ployed. Unlike many earlier studies, we examined multiple measures of schizotypal traits.Furthermore, the problem of dichotomous data was avoided by the construction of continuousindicator measures. We made no predictions about which if any components of schizotypy wouldbe taxonic, but expected that at least some previous taxonic findings might be called into questiononce skew was taken into account.
2. Method
2.1. Participants
The sample comprised 1073 non-clinical adults (711 women, 362 men) with mean age 40.0(SD = 16.9), who completed the study instrument in the course of experimental and statisticalinvestigations of schizotypy, especially a previous factor-analytic study reported by Claridgeet al. (1996). Participants were recruited from a variety of sources, and included student andhealth professionals in courses at the universities of Oxford and Liverpool, both student and com-munity members of the Oxford University Department of Experimental Psychology Subject Paneland, in the case of the largest subset of 408 participants, through a media appeal in connectionwith a study of out-of-the-body experiences.
2.2. Materials
All participants completed the 420-item Combined Schizotypal Traits Questionnaire (CSTQ;Bentall, Claridge, & Slade, 1989), which collects 18 published scales into a single instrument.

1644 D. Rawlings et al. / Personality and Individual Differences 44 (2008) 1640–1651
Of these, the four measures of psychosis proneness developed by the Chapmans and their col-leagues were selected for the present study. Each has a ‘‘True/False’’ item format.
Perceptual aberration (PAb): The most widely used measure in previous taxometric stud-ies, the PAb (Chapman, Edell, & Chapman, 1980) contains 35 items that refer to unusual per-ceptual experiences (e.g., ‘‘I have felt as though my head or limbs were somehow not myown’’).
Magical ideation (MgI): This 30-item scale (Eckblad & Chapman, 1983) refers to beliefs in oc-cult forms of influence or meaning (e.g., ‘‘If reincarnation were true, it would explain some unu-sual experiences I have had’’).
Social anhedonia (SoA): This 40-item scale (Chapman, Chapman, & Raulin, 1976) refers to feel-ings of social detachment, alienation, and preference for solitude (e.g., ‘‘When someone else is de-pressed it brings me down also’’: reverse scored).
Physical anhedonia (PhA): The content of this 59-item scale (Chapman et al., 1976) involves thelack of pleasure in sensuous experience and general affective flatness (e.g., ‘‘One food tastes asgood as another to me’’).
Factor-analytic research (Mason, Claridge, & Williams, 1997) indicates that measures ofschizotypal traits load on three or four factors in normal individuals, and that the four scales em-ployed here normally load on the two strongest of these factors. Thus, PAb and MgI tend to loadon a factor involving ‘‘positive’’ aspects of schizotypy, and particularly perceptual and cognitiveabnormalities, whereas the anhedonia scales (SoA and PhA) load on a factor involving ‘‘negative’’schizotypal features.
3. Results
Descriptive statistics for the four original scales were calculated. All showed adequate reliabil-ity, varying from 0.86 (PAb) to 0.80 (PhA and SoA), and all revealed some degree of positiveskew. Skew was particularly high for PAb (1.79), varying between 0.78 and 0.87 for the otherthree scales. Intercorrelations among the original scales showed that the strongest correlationswere indeed between the two measures of positive schizotypy (r = 0.67) and the two measuresof negative schizotypy (r = 0.40), with no other correlation greater than 0.18.
Two distinct taxometric procedures were employed for all analyses. MAXEIG (Waller &Meehl, 1998) is a multivariate variant of MAXCOV, in which the eigenvalue of the first factorcalculated from two ‘‘output’’ indicators, rather than their covariance, is plotted. The MAMBACprocedure (Meehl & Yonce, 1994), in which the difference on one output indicator between peoplefalling above and below sliding cutpoints on another indicator is plotted, was also employed. Bothprocedures are extensively described elsewhere (Ruscio et al., 2006), and tend to yield peakedtaxometric plots when a taxon exists, its base rate lower the farther to the right the peaks are ob-served. Both procedures tend to yield flat and dish-shaped plots, respectively, when latent struc-ture is dimensional. However, these plots are tilted upward when indicators of a latent dimensionare positively skewed. Each procedure also yields multiple estimates of the taxon base rate,whether or not the respective plot shapes favour the existence of a taxon. If base rate estimatesfail to converge, it is unlikely that a taxon exists. In addition, we employed (Ruscio et al.,2007) data simulation technique, subjecting ten matched taxonic and dimensional data sets to
D. Rawlings et al. / Personality and Individual Differences 44 (2008) 1640–1651 1645
the same analyses as the research data, and assessing the comparative fit of the research data plotsto the simulation data plots.
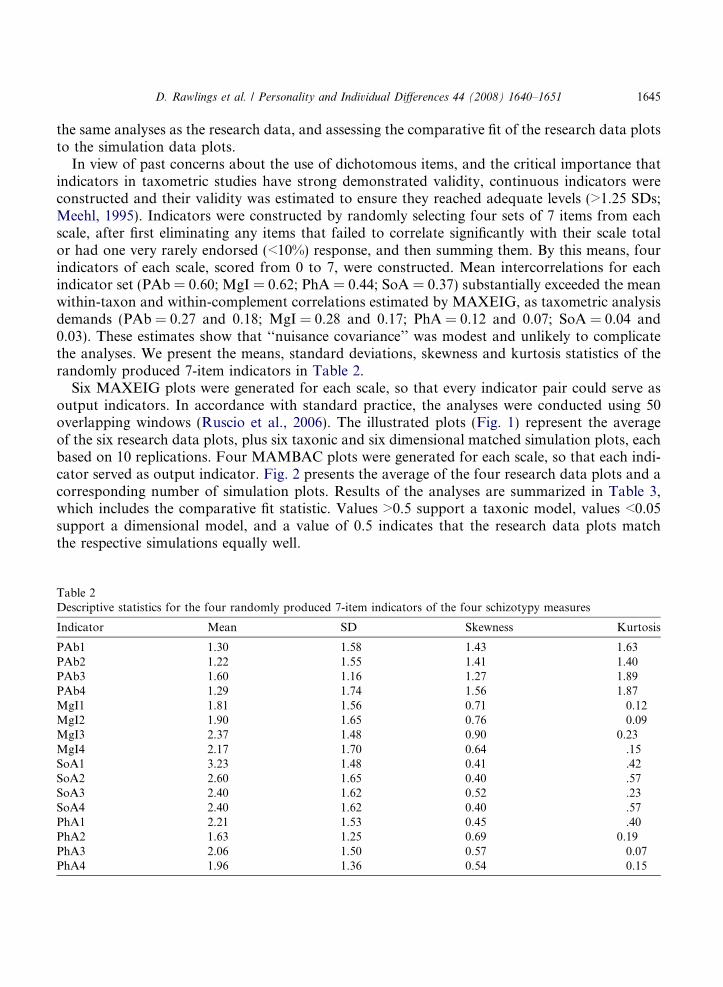
In view of past concerns about the use of dichotomous items, and the critical importance thatindicators in taxometric studies have strong demonstrated validity, continuous indicators wereconstructed and their validity was estimated to ensure they reached adequate levels (>1.25 SDs;Meehl, 1995). Indicators were constructed by randomly selecting four sets of 7 items from eachscale, after first eliminating any items that failed to correlate significantly with their scale totalor had one very rarely endorsed (<10%) response, and then summing them. By this means, fourindicators of each scale, scored from 0 to 7, were constructed. Mean intercorrelations for eachindicator set (PAb = 0.60; MgI = 0.62; PhA = 0.44; SoA = 0.37) substantially exceeded the meanwithin-taxon and within-complement correlations estimated by MAXEIG, as taxometric analysisdemands (PAb = 0.27 and 0.18; MgI = 0.28 and 0.17; PhA = 0.12 and 0.07; SoA = 0.04 and0.03). These estimates show that ‘‘nuisance covariance’’ was modest and unlikely to complicatethe analyses. We present the means, standard deviations, skewness and kurtosis statistics of therandomly produced 7-item indicators in Table 2.
Six MAXEIG plots were generated for each scale, so that every indicator pair could serve asoutput indicators. In accordance with standard practice, the analyses were conducted using 50overlapping windows (Ruscio et al., 2006). The illustrated plots (Fig. 1) represent the averageof the six research data plots, plus six taxonic and six dimensional matched simulation plots, eachbased on 10 replications. Four MAMBAC plots were generated for each scale, so that each indi-cator served as output indicator. Fig. 2 presents the average of the four research data plots and acorresponding number of simulation plots. Results of the analyses are summarized in Table 3,which includes the comparative fit statistic. Values >0.5 support a taxonic model, values <0.05support a dimensional model, and a value of 0.5 indicates that the research data plots matchthe respective simulations equally well.
Table 2Descriptive statistics for the four randomly produced 7-item indicators of the four schizotypy measures
Indicator Mean SD Skewness Kurtosis
PAb1 1.30 1.58 1.43 1.63PAb2 1.22 1.55 1.41 1.40PAb3 1.60 1.16 1.27 1.89PAb4 1.29 1.74 1.56 1.87MgI1 1.81 1.56 0.71 �0.12MgI2 1.90 1.65 0.76 �0.09MgI3 2.37 1.48 0.90 0.23MgI4 2.17 1.70 0.64 �.15SoA1 3.23 1.48 0.41 �.42SoA2 2.60 1.65 0.40 �.57SoA3 2.40 1.62 0.52 �.23SoA4 2.40 1.62 0.40 �.57PhA1 2.21 1.53 0.45 �.40PhA2 1.63 1.25 0.69 0.19PhA3 2.06 1.50 0.57 �0.07PhA4 1.96 1.36 0.54 �0.15

0.0
0.5
1.0
1.5
2.0
Research Data
Eige
nval
ue
0.0
0.5
1.0
1.5
2.0
Simulated Taxonic Data
Eige
nval
ue
0.0
0.5
1.0
1.5
2.0
Simulated Dimensional Data
Eige
nval
ue
0.0
0.4
0.8
1.2
Eige
nval
ue
0.0
0.4
0.8
1.2
Eige
nval
ue
0.0
0.4
0.8
1.2
Eige
nval
ue
0.0
0.2
0.4
0.6
0.8
1.0
Eige
nval
ue
0.0
0.2
0.4
0.6
0.8
1.0
Eige
nval
ue
0.0
0.2
0.4
0.6
0.8
1.0
Eige
nval
ue
-1.0 -0.5 0.0 0.5 1.0 1.5 2.0
0.0
0.4
0.8
1.2
100 Windows
Eige
nval
ue
-1.0 -0.5 0.0 0.5 1.0 1.5 2.0
0.0
0.4
0.8
1.2
100 Windows
Eige
nval
ue
-1.0 -0.5 0.0 0.5 1.0 1.5 2.0
0.0
0.4
0.8
1.2
100 Windows
Eige
nval
ue
Fig. 1. Averaged MAXEIG plot for the four scales (PAb,MgI, SoA,PhA) with matched simulation plots.
1646 D. Rawlings et al. / Personality and Individual Differences 44 (2008) 1640–1651
Table 3 shows that the indicators of all scales were adequately valid, every one exceeding the1.25 SD threshold (i.e., all would separate a putative taxon from its complement class with thisdegree of power). The table also reports the base rate mean estimates of the MAXEIG and MAM-BAC plots, and their variability. The MAXEIG-based PAb base rate (8%) was consistent withpast research, but all other estimates were implausibly high, implying rates of schizotypy in thegeneral population of 19% or greater. MAXEIG-based SoA and PhA base rate estimates alsofailed to converge, arguing against the existence of a taxon underlying these scales (Schmidtet al., 2004).

0.05
0.15
0.25
Research Data
Mea
n D
iffer
ence
0.05
0.15
0.2
5
Simulated Taxonic Data
Mea
n D
iffer
ence
0.05
0.15
0.2
5
Simulated Dimensional Data
Mea
n D
iffer
ence
0.03
0.05
0.07
Mea
n D
iffer
ence
0.03
0.05
0.07
Mea
n D
iffer
ence
0.03
0.05
0.07
Mea
n D
iffer
ence
0.06
0.10
0.14
0.18
Mea
n D
iffer
ence
0.06
0.10
0.14
0.18
Mea
n D
iffer
ence
0.06
0.10
0.14
0.18
Mea
n D
iffer
ence
0 200 400 600 800 1000
0.04
0.08
0.12
Input (Cases)
Mea
n D
iffer
ence
0 200 400 600 800 1000
0.04
0.08
0.12
Input (Cases)
Mea
n D
iffer
ence
0 200 400 600 800 1000
0.04
0.08
0.12
Input (Cases)
Mea
n D
iffer
ence
Fig. 2. Averaged MAMBAC plot for the four scales (PAb,MgI,SoA, PhA) with matched simulation plots.
D. Rawlings et al. / Personality and Individual Differences 44 (2008) 1640–1651 1647
Fig. 1 shows that the research data MAXEIG plots all rise to the right as would be expected forpositively skewed indicators. No taxonic peaks are apparent for PAb or PhA, although the MgIplot has a potentially taxonic ‘‘hump’’ and there is a small left-side peak for the SoA indicators,which could indicate a high base-rate taxon. However, the matched taxonic simulations all showclear peaks, which do not resemble the potential peaks in the MgI and SoA research data plots.Instead, the research plots appear to resemble the dimensional simulations better. This observa-tion is supported by the comparative fit indices. In every case the index is <0.5, favouring a dimen-sional model.

Table 3Summary of taxometric findings
MAXEIG MAMBAC
Validitymean (SD)
Base ratemean (SD)
Comparativefit index
Validitymean (SD)
Base ratemean (SD)
Comparativefit index
Positive features
PAb 3.04 (0.32) 0.08 (0.02) 0.36 2.61 (0.56) 0.19 (0.02) 0.47MgI 2.30 (0.20) 0.25 (0.06) 0.38 2.17 (0.13) 0.34 (0.03) 0.58
Negative features
SoA 1.76 (0.20) 0.27 (0.19) 0.29 1.64 (0.20) 0.39 (0.06) 0.39PhA 1.57 (0.21) 0.28 (0.15) 0.25 1.47 (0.12) 0.43 (0.05) 0.21
1648 D. Rawlings et al. / Personality and Individual Differences 44 (2008) 1640–1651
The research data MAMBAC plots (Fig. 2) again rise to the right, consistent with the presenceof skewed indicators, but display no obvious taxonic peaks. The dimensional simulations are sim-ilarly concave and unpeaked, whereas the taxonic simulations show peaks for SoA and PhA, andapparent humps for PAb and MgI. The comparative fit statistics clearly favour dimensional mod-els of SoA and PhA, but are inconclusive for PAb and MgI, the former being slightly better fit bythe dimensional model and the latter by the taxonic model. The mean fit index is 0.41, implyingthat overall dimensional models of the schizotypy measures fit the research data better than tax-onic models.
4. Discussion
The findings of the present study contrast with those of most previous taxometric investigationsby favouring a dimensional view of schizotypy. First, although the study consistently obtainedrising taxometric plots resembling those presented in previous work, none of these plots showedunambiguous taxonic peaks. Second, dimensional data sets matched to the research data in skewand other properties yielded very similar plots, whereas simulated taxonic data sets generallyyielded peaks where the research plots did not. Third, a well-validated comparative fit indexshowed that dimensional models fitted the research data better than taxonic models in sevenout of eight analyses. Finally, base rate estimates for SoA and PhA failed to converge withinone taxometric procedure; a taxonic model would require them to do so.
In sum, our findings challenge all previous taxometric findings for negative components ofschizotypy, as well as the majority of analyses of its positive components, with the exception ofKeller, Jahn, and Klein (2001) analysis of positive features, and Meyer and Keller’s (2001) andHoran, Blanchard, Gangestad, and Kwapil’s (2004) analyses of MgI. The only partial exceptionto this otherwise consistent evidence against the taxonicity of schizotypy was MgI, where MAM-BAC suggested a weakly superior fit for the taxonic model. Although MAXEIG favoured adimensional model for MgI, its MAXEIG and MAMBAC plots did not have an unambiguouslytaxonic shape, and its base rate estimates were questionably high. A conservative conclusion isthat our findings regarding MgI are inconclusive.
We note that the present findings represent just one study, and must be considered in light ofthe numerous taxometric studies that have drawn taxonic conclusions. Nevertheless, we believe

D. Rawlings et al. / Personality and Individual Differences 44 (2008) 1640–1651 1649
the present study deserves serious attention for several reasons. Unlike most previous studies itemployed more than one taxometric procedure, and did not rely exclusively on MAXCOV. Itdid not employ dichotomous indicators. Finally, it employed several recent refinements of taxo-metric practice, including matched simulations, a fit statistic, and calculation of indicator validi-ties to ensure their adequacy.
While employing an older, more diverse sample than in earlier large-scale studies, the presentstudy most closely resembles previous studies of schizotypy among undergraduates, most of whichused the same scales and none of which yielded robustly peaked taxometric plots. The study is lesssimilar to studies of inpatient (Golden & Meehl, 1979) and high-risk samples (Erlenmeyer-Kim-ling, Golden, & Cornblatt, 1989; Tyrka et al., 1995a, Tyrka, Haslam, & Cannon, 1995b), some ofwhich used different assessment tools and yielded peaked plots. It is possible that schizotypy istaxonic in these contexts or with individually-based measures, but not in normal samples assessedby self-report questionnaire. It may be, for example, that in the normal range of variation mostcomponents of schizotypy are dimensional, like many predispositions, but that among patientsschizotypal features emerge as a discontinuous syndrome. This would be consistent with a pro-posal that distinguishes between schizotypal traits that describe a healthy personality dimensionand schizotypal symptomatology that forms part of the clinical schizophrenia spectrum (Claridge& Davis, 2003).
Recognizing a dimensional structure for most components of schizotypy would have severalimportant implications. It would argue against etiological models of the construct that proposespecific causes such as major gene effects (Meehl, 1990) or threshold models (Korfine & Lenzenwe-ger, 1995), and in favour of models that produce dimensional variation. It would argue against thepractice of assessing schizotypy categorically, and support the theoretical view that variationalong the entire schizotypy continuum is psychologically interesting (e.g., Claridge, 1997).
In conclusion, the findings of the present study imply that taxonic inferences about the latentstructure of schizotypy may have been mistaken, despite being consistently replicated in previousresearch. A taxometric analysis that took indicator skew into account and employed a tested datasimulation procedure repeatedly obtained results that challenged the taxonic model for severalestablished measures of schizotypy. By implication, the apparently taxonic plots obtained in pre-vious work may reflect the positive skew of schizotypy indicators rather than the latent structureof the construct.
References
Arnau, R. C., Green, B. A., Rosen, D. H., Gleaves, D. H., & Melancon, J. G. (2003). Are Jungian preferences reallycategorical?: An empirical investigation using taxometric analysis. Personality and Individual Differences, 34,233–251.
Bentall, R. P., Claridge, G. S., & Slade, P. D. (1989). The multidimensional nature of schizotypal traits: A factoranalytic study with normal subjects. British Journal of Clinical Psychology, 28, 363–375.
Blanchard, J. J., Gangestad, S. W., Brown, S. A., & Horan, W. P. (2000). Hedonic capacity and schizotypy revisited: Ataxometric analysis of social anhedonia. Journal of Abnormal Psychology, 109, 87–95.
Chapman, J. P., Chapman, L. J., & Kwapil, T. R. (1995). Scales for the measurement of schizotypy. In A. Raine, T.Lencz, & S. A. Mednick (Eds.), Schizotypal personality (pp. 79–106). Cambridge: Cambridge University Press.
Chapman, L. J., Chapman, J. P., & Raulin, M. L. (1976). Scales for physical and social anhedonia. Journal of Abnormal
Psychology, 85, 374–382.

1650 D. Rawlings et al. / Personality and Individual Differences 44 (2008) 1640–1651
Chapman, L. J., Edell, W. S., & Chapman, J. (1980). Anhedonia, perceptual aberration, and psychosis proneness.Schizophrenia Bulletin, 6, 639–653.
Claridge, G. (1997). Theoretical background and issues. In G. Claridge (Ed.), Schizotypy: Implications for illness and
health (pp. 3–18). Oxford: Oxford University Press.Claridge, G., & Davis, C. (2003). Personality and psychological disorders. London: Arnold.Claridge, G., McCreery, C., Mason, O., Bentall, R., Boyle, G., Slade, P., et al. (1996). The factor structure of
‘schizotypal’ traits: A large replication study. British Journal of Clinical Psychology, 35, 103–115.Eckblad, M., & Chapman, L. J. (1983). Magical ideation as an indicator of schizotypy. Journal of Consulting and
Clinical Psychology, 51, 215–225.Erlenmeyer-Kimling, L., Golden, R. R., & Cornblatt, B. A. (1989). A taxonometric analysis of cognitive and
neuromotor variables in children at risk for schizophrenia. Journal of Abnormal Psychology, 98, 203–208.Eysenck, H. J., & Eysenck, S. B. G. (1976). Psychoticism as a dimension of personality. London: Hodder and Stoughton.Golden, R. R., & Meehl, P. E. (1979). Detection of the schizoid taxon with MMPI indicators. Journal of Abnormal
Psychology, 88, 217–233.Haslam, N., & Kim, H. (2002). Categories and continua: A review of taxometric research. Genetic, Social and General
Psychology Monographs, 128, 271–320.Horan, W. P., Blanchard, J. J., Gangestad, S. W., & Kwapil, T. R. (2004). The psychometric detection of schizotypy:
Do putative schizotypy indicators identify the same latent class? Journal of Abnormal Psychology, 113, 339–357.Keller, F., Jahn, T., & Klein, C. (2001). Anwendung von taxometrischen methoden und von mischverteilungsmodellen
zur erfassung von schizotypie [Application of taxometric methods and mixture distribution models for theassessment of schizotypy]. In B. Andresen & R. Mass (Eds.), Schizotypie. Psychometrische entwicklungen und
biopsychologische forschungsansatze (pp. 391–412). Gottingen: Hogrefe.Korfine, L., & Lenzenweger, M. F. (1995). The taxonicity of schizotypy: A replication. Journal of Abnormal Psychology,
104, 26–31.Lenzenweger, M. F. (1999). Deeper into the schizotypy taxon: On the robust nature of maximum covariance analysis.
Journal of Abnormal Psychology, 108, 182–187.Lenzenweger, M. F., & Korfine, L. (1992). Confirming the latent structure and base rate of schizotypy: A taxometric
analysis. Journal of Abnormal Psychology, 101, 567–571.Linscott, R. J., Marie, D., Arnott, K. L., & Clarke, B. L. (2006). Over-representation of Maori New Zealanders among
adolescents in a schizotypy taxon. Schizophrenia Research, 84, 289–296.Mason, O., Claridge, G., & Williams, L. (1997). Questionnaire measurement. In G. Claridge (Ed.), Schizotypy:
Implications for illness and health (pp. 19–37). Oxford: Oxford University Press.Meehl, P. E. (1962). Schizotaxia, schizotypy, schizophrenia. American Psychologist, 17, 827–838.Meehl, P. E. (1990). Toward an integrated theory of schizotaxia, schizotypy, and schizophrenia. Journal of Personality
Disorders, 4, 1–99.Meehl, P. E. (1995). Bootstraps taxometrics: Solving the classification problem in psychopathology. American
Psychologist, 50, 266–275.Meehl, P. E., & Yonce, L. J. (1994). Taxometric analysis: I. Detecting taxonicity with two quantitative indicators using
means above and below a sliding cut (MAMBAC procedure). Psychological Reports, 74, 1059–1274.Meyer, T., & Keller, F. (2001). Exploring the latent structure of the perceptual aberration, magical ideation
and physical anhedonia scales in a german sample – a partial replication. Journal of Personality Disorders, 15,521–535.
Rothschild, L., Cleland, C., Haslam, N., & Zimmerman, M. (2003). Taxometric analysis of borderline personalitydisorder. Journal of Abnormal Psychology, 112, 657–666.
Ruscio, J. (2000). Taxometric analysis with dichotomous indicators: The modified MAXCOV procedure and a caseremoval consistency test. Psychological Reports, 87, 929–939.
Ruscio, J., Haslam, N., & Ruscio, A. M. (2006). Introduction to the taxometric method: A practical guide. Mahwah, NJ:Erlbaum.
Ruscio, J., Ruscio, A. M., & Keane, T. M. (2004). Using taxometric analysis to distinguish a small latent taxon from alatent dimension with positively skewed indicators: The case of involuntary defeat syndrome. Journal of Abnormal
Psychology, 113, 145–154.

D. Rawlings et al. / Personality and Individual Differences 44 (2008) 1640–1651 1651
Ruscio, J., Ruscio, A. M., & Meron, M. (2007). Applying the bootstrap to taxometric analysis: Generating empiricalsampling distributions to help interpret results. Multivariate Behavioral Research, 44, 349–386.
Schmidt, N. B., Kotov, R., & Joiner, T. E. Jr., (2004). Taxometrics: Towards a new diagnostic system for
psychopathology. Washington, DC: American Psychological Association.Strong, D. R., Brown, R. A., Kahler, C. W., Lloyd-Richardson, E. E., & Niaura, R. (2004). Depression proneness in
treatment-seeking smokers: A taxometric analysis. Personality and Individual Differences, 36, 1155–1170.Tyrka, A., Cannon, T. D., Haslam, N., Mednick, S. A., Schulsinger, F., Schulsinger, H., et al. (1995a). The latent
structure of schizotypy: I. Premorbid indicators of a taxon of individuals at risk for schizophrenia-spectrumdisorders. Journal of Abnormal Psychology, 104, 173–183.
Tyrka, A., Haslam, N., & Cannon, T. D. (1995b). Detection of a longitudinally-stable taxon of individuals at risk forschizophrenia spectrum disorders. In A. Raine, T. Lencz, & S. A. Mednick (Eds.), Schizotypal personality disorder
(pp. 168–191). New York: Cambridge University Press.Waller, N. G., & Meehl, P. E. (1998). Multivariate taxometric procedures: Distinguishing types from continua. Thousand
Oaks, CA: Sage.