Embed Size (px)
Citation preview
31
x
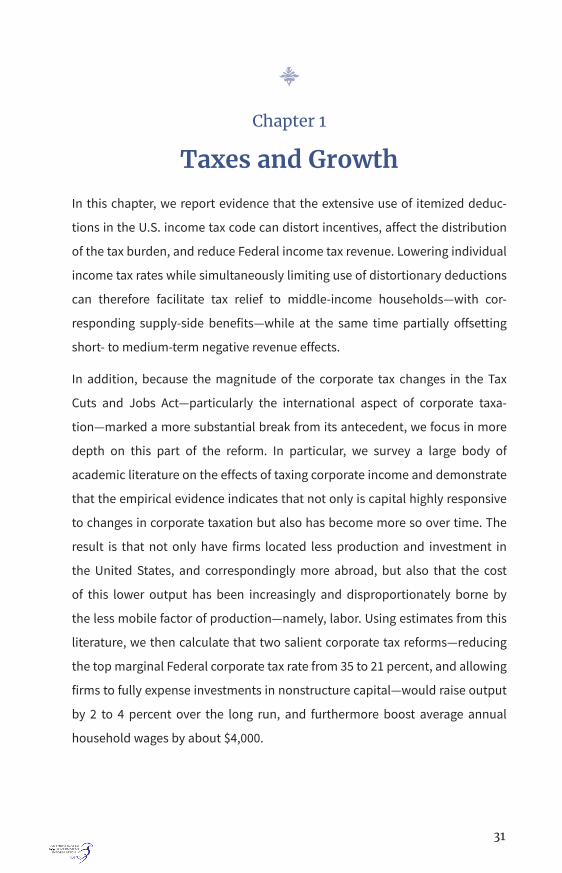
Chapter 1
Taxes and Growth
In this chapter, we report evidence that the extensive use of itemized deduc-
tions in the U.S. income tax code can distort incentives, affect the distribution
of the tax burden, and reduce Federal income tax revenue. Lowering individual
income tax rates while simultaneously limiting use of distortionary deductions
can therefore facilitate tax relief to middle-income households—with cor-
responding supply-side benefits—while at the same time partially offsetting
short- to medium-term negative revenue effects.
In addition, because the magnitude of the corporate tax changes in the Tax
Cuts and Jobs Act—particularly the international aspect of corporate taxa-
tion—marked a more substantial break from its antecedent, we focus in more
depth on this part of the reform. In particular, we survey a large body of
academic literature on the effects of taxing corporate income and demonstrate
that the empirical evidence indicates that not only is capital highly responsive
to changes in corporate taxation but also has become more so over time. The
result is that not only have firms located less production and investment in
the United States, and correspondingly more abroad, but also that the cost
of this lower output has been increasingly and disproportionately borne by
the less mobile factor of production—namely, labor. Using estimates from this
literature, we then calculate that two salient corporate tax reforms—reducing
the top marginal Federal corporate tax rate from 35 to 21 percent, and allowing
firms to fully expense investments in nonstructure capital—would raise output
by 2 to 4 percent over the long run, and furthermore boost average annual
household wages by about $4,000.
32 | Chapter 1
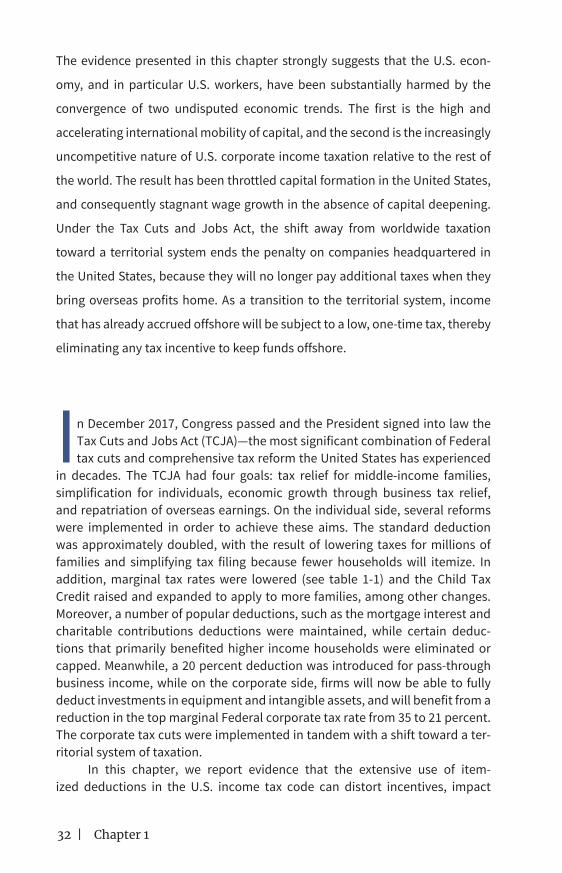
The evidence presented in this chapter strongly suggests that the U.S. econ-
omy, and in particular U.S. workers, have been substantially harmed by the
convergence of two undisputed economic trends. The first is the high and
accelerating international mobility of capital, and the second is the increasingly
uncompetitive nature of U.S. corporate income taxation relative to the rest of
the world. The result has been throttled capital formation in the United States,
and consequently stagnant wage growth in the absence of capital deepening.
Under the Tax Cuts and Jobs Act, the shift away from worldwide taxation
toward a territorial system ends the penalty on companies headquartered in
the United States, because they will no longer pay additional taxes when they
bring overseas profits home. As a transition to the territorial system, income
that has already accrued offshore will be subject to a low, one-time tax, thereby
eliminating any tax incentive to keep funds offshore.
In December 2017, Congress passed and the President signed into law the Tax Cuts and Jobs Act (TCJA)—the most significant combination of Federal tax cuts and comprehensive tax reform the United States has experienced
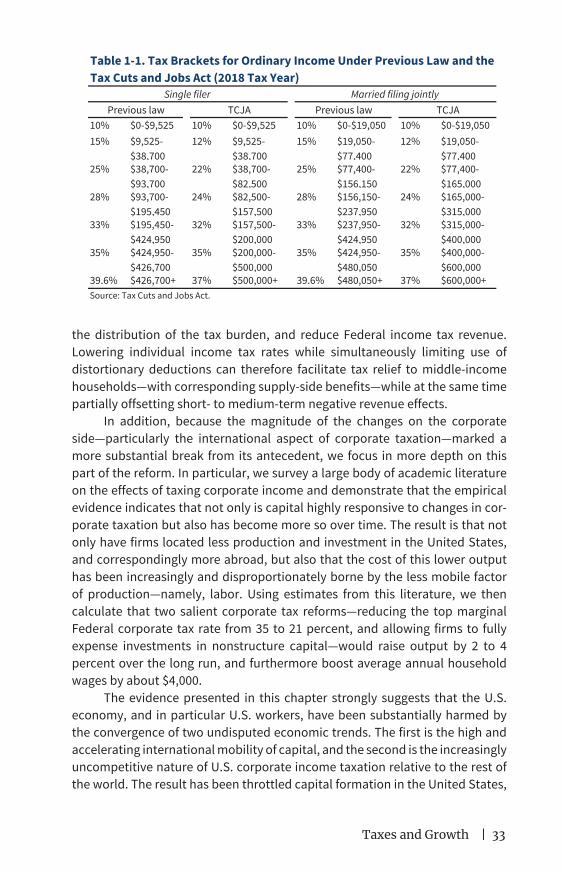
in decades. The TCJA had four goals: tax relief for middle-income families, simplification for individuals, economic growth through business tax relief, and repatriation of overseas earnings. On the individual side, several reforms were implemented in order to achieve these aims. The standard deduction was approximately doubled, with the result of lowering taxes for millions of families and simplifying tax filing because fewer households will itemize. In addition, marginal tax rates were lowered (see table 1-1) and the Child Tax Credit raised and expanded to apply to more families, among other changes. Moreover, a number of popular deductions, such as the mortgage interest and charitable contributions deductions were maintained, while certain deduc-tions that primarily benefited higher income households were eliminated or capped. Meanwhile, a 20 percent deduction was introduced for pass-through business income, while on the corporate side, firms will now be able to fully deduct investments in equipment and intangible assets, and will benefit from a reduction in the top marginal Federal corporate tax rate from 35 to 21 percent. The corporate tax cuts were implemented in tandem with a shift toward a ter-ritorial system of taxation.
In this chapter, we report evidence that the extensive use of item-ized deductions in the U.S. income tax code can distort incentives, impact
Taxes and Growth | 33
the distribution of the tax burden, and reduce Federal income tax revenue. Lowering individual income tax rates while simultaneously limiting use of distortionary deductions can therefore facilitate tax relief to middle-income households—with corresponding supply-side benefits—while at the same time partially offsetting short- to medium-term negative revenue effects.
In addition, because the magnitude of the changes on the corporate side—particularly the international aspect of corporate taxation—marked a more substantial break from its antecedent, we focus in more depth on this part of the reform. In particular, we survey a large body of academic literature on the effects of taxing corporate income and demonstrate that the empirical evidence indicates that not only is capital highly responsive to changes in cor-porate taxation but also has become more so over time. The result is that not only have firms located less production and investment in the United States, and correspondingly more abroad, but also that the cost of this lower output has been increasingly and disproportionately borne by the less mobile factor of production—namely, labor. Using estimates from this literature, we then calculate that two salient corporate tax reforms—reducing the top marginal Federal corporate tax rate from 35 to 21 percent, and allowing firms to fully expense investments in nonstructure capital—would raise output by 2 to 4 percent over the long run, and furthermore boost average annual household wages by about $4,000.
The evidence presented in this chapter strongly suggests that the U.S. economy, and in particular U.S. workers, have been substantially harmed by the convergence of two undisputed economic trends. The first is the high and accelerating international mobility of capital, and the second is the increasingly uncompetitive nature of U.S. corporate income taxation relative to the rest of the world. The result has been throttled capital formation in the United States,
10% $0-$9,525 10% $0-$9,525 10% $0-$19,050 10% $0-$19,05015% $9,525-
$38,70012% $9,525-
$38,70015% $19,050-
$77,40012% $19,050-
$77,40025% $38,700-
$93,70022% $38,700-
$82,50025% $77,400-
$156,15022% $77,400-
$165,00028% $93,700-
$195,45024% $82,500-
$157,50028% $156,150-
$237,95024% $165,000-
$315,00033% $195,450-
$424,95032% $157,500-
$200,00033% $237,950-
$424,95032% $315,000-
$400,00035% $424,950-
$426,70035% $200,000-
$500,00035% $424,950-
$480,05035% $400,000-
$600,00039.6% $426,700+ 37% $500,000+ 39.6% $480,050+ 37% $600,000+Source: Tax Cuts and Jobs Act.
Table 1-1. Tax Brackets for Ordinary Income Under Previous Law and the Tax Cuts and Jobs Act (2018 Tax Year)
Single filer Married filing jointlyPrevious law TCJA Previous law TCJA
34 | Chapter 1
and consequently stagnant wage growth in the absence of capital deepening. Under the TCJA, the shift away from worldwide taxation toward a territorial system ends the penalty on companies headquartered in the United States because they will no longer pay additional taxes when they bring overseas profits home. As a transition to the territorial system, income that has already accrued offshore will be subject to a low, one-time tax, thereby eliminating any tax incentive to keep funds offshore.
We begin this chapter with a brief overview of U.S. taxation in histori-cal and international perspective, focusing on the declining competitiveness of U.S. taxation of corporate income relative to other advanced economies. We turn next to the costs of taxation and a short review of the theory of tax incidence with two examples that are relevant to the TCJA—the incidence of corporate taxation and the mortgage interest tax deduction. Finally, we provide an in-depth review of the growth literature in the context of corporate taxation, focusing on the effects of the user cost of capital on optimal capital accumulation and long-run growth.
U.S. Taxation in Historical and International Perspective
Since before Independence, public taxation has been a contentious issue in the politics of what is now the United States. In the wake of the Seven Years’ War, repeated attempts by successive British governments to raise revenue from the North American colonies to cover the costs of colonial defense—the Sugar Act, Stamp Act, and Townshend Acts—were met with increasing hostility from colonial taxpayers, culminating with the Boston Tea Party after passage of the so-called Tea Act in 1773. Within a decade of the Constitution’s com-mencement, efforts by the Federal government to assess taxes on whiskey and property resulted in armed insurrections in the Whiskey Rebellion and Fries’s Rebellion, the former of which required President Washington to lead a 13,000-strong army to confront the insurrectionists.
Perhaps not surprisingly, then, for the Republic’s first 150 years, taxation at the Federal level remained a relatively small fraction of the nation’s total economic output, as shown in figure 1-1. Before World War II, total Federal gov-ernment revenue never exceeded 10 percent of gross domestic product (GDP) and—with brief exceptions during wartime and the Great Depression—never exceeded 5 percent of GDP. World War II thus marked a sharp discontinuity in Federal taxation—by the end of the war, Federal tax revenues had grown from 6.7 to 19.9 percent of GDP, and thereafter never fell below 14 percent.
Moreover, the world wars also marked sharp discontinuities in the com-position of Federal tax revenues. Before World War I, the Federal government relied almost exclusively on excise taxes for revenue, and the single largest source of revenue was tariffs on imported goods. While the Administration of

Taxes and Growth | 35
President Lincoln implemented a tax of 3 percent on income over $800 in 1861 dollars (amended in 1862 to 3 percent on income between $600 and $10,000 and 5 percent on incomes exceeding $10,000), the tax was poorly enforced, generated little revenue, and was ultimately repealed by the Revenue Act of 1870. A subsequent Federal income tax levied in 1894 was ruled unconstitu-tional by the U.S. Supreme Court a year later, in Pollock v. Farmers’ Loan & Trust Co.
It was only after intense lobbying, particularly by the prohibitionist movement, that the Sixteenth Amendment to the U.S. Constitution was ratified in 1913, thereby granting the Federal government the authority to levy direct taxes on income. The prohibitionists’ aim was to provide the Federal govern-ment an alternative source of funding, given that excise taxes on alcohol com-prised 40 percent of revenue (Okrent 2010). Thereafter, the individual income tax grew steadily as a share of Federal government revenue, reaching a peak of 50 percent in 2001.
Taxation of corporate income, meanwhile, began in 1909, when Congress enacted an income-based tax on corporations. After ratification of the Sixteenth Amendment, this constituted the corporate portion of the Federal income tax. Though the statutory rate was initially a low 1 percent of corporate income, it was repeatedly raised throughout the Great Depression and after, eventu-ally reaching a peak of 52.8 percent in 1968, with intermediate rates as high as 53 percent during World War II (IRS 2010). Thereafter, rates were gradually reduced and thresholds raised, settling at a top statutory rate of 35 percent in
0
5
10
15
20
25
1790 1830 1870 1910 1950 1990
Individual income Corporate income Social insuranceExcise Miscellaneous other
Figure 1-1. Federal Tax Revenue as a Percentage of GDP, 1792–2017
Percent
Sources: Office of Management and Budget Historical Table 2.3 (2017); U.S. Census Historical Statistics of the United States (1975).

36 | Chapter 1
1993. In the entire postwar period, the corporate tax contribution to Federal revenue peaked in 1952, at 32.1 percent, before steadily declining to just over 9 percent in 2016 (OMB 2017).
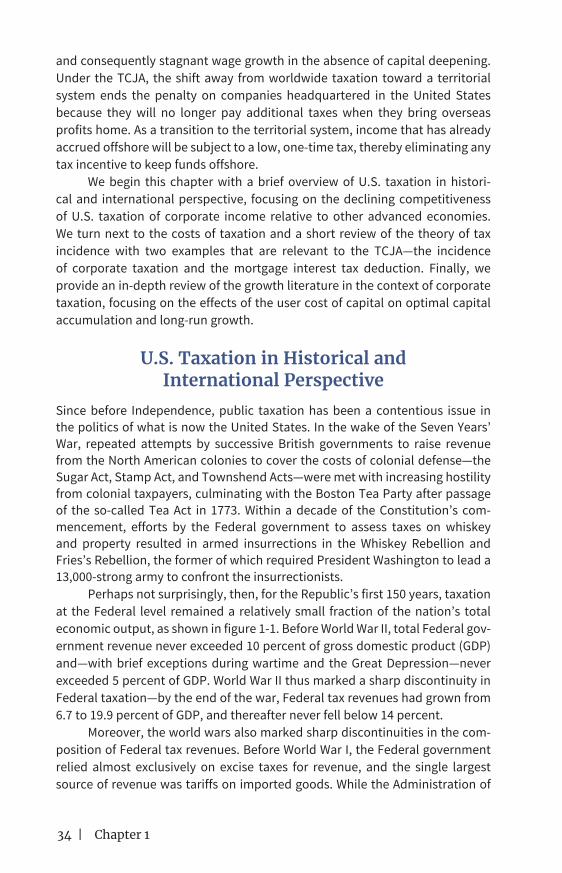
While the U.S. held steady at a top Federal statutory tax rate of 35 percent through 2017, the same was not true for other developed economies belonging to the Organization for Economic Cooperation and Development (OECD) that have experienced a steady downward trend in rates. Figure 1-2 shows the top U.S. statutory corporate tax rate versus the OECD average (combined national and subnational), excluding the U.S., since 2000. Though the latter declined from 32.3 percent in 2000 to 23.8 in 2017, the combined U.S. rate only declined from 39.3 to 38.9 percent, driven by reductions at the State level. During this time, the U.S. went from being the developed economy with the seventh-highest corporate tax rate to that with the highest.
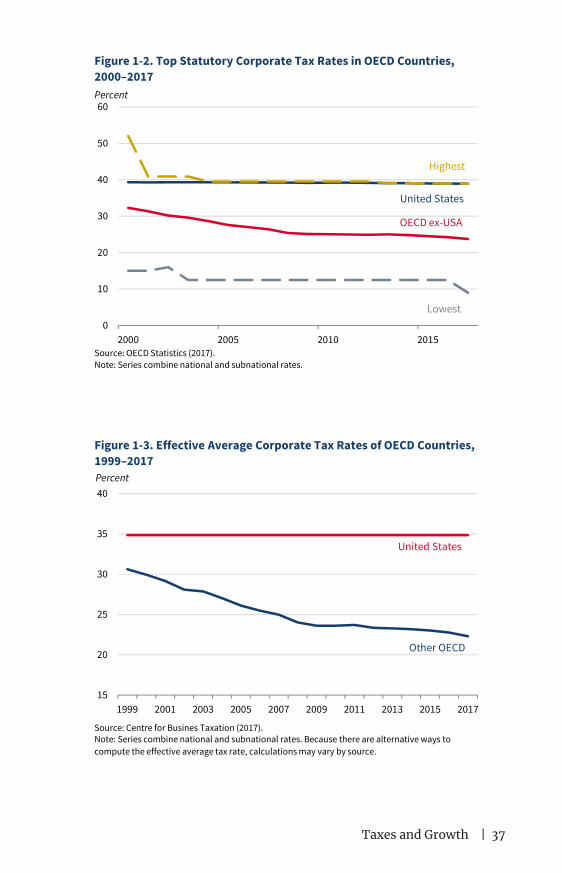
Relative to the rest of the world, the United States had the fourth-highest combined statutory corporate income tax rate, after the United Arab Emirates, Comoros, and the U.S. territory of Puerto Rico. It was one of only 13 national jurisdictions levying corporate tax rates of 35 percent or more. Fourteen jurisdictions levy no tax on corporate income at all. The global distribution of corporate tax rates, moreover, has been consistently shifting toward a lower average rate since 1980. Unsurprisingly, then, Spengel and others (2017) calcu-late that a reduction in the effective average U.S. corporate tax rate from 36.5 to 22.7 percent (Federal plus State, assuming a 20 percent corporate income tax rate—the rate that was initially under consideration until it was amended to 21 percent)—compared with a European Union average of 20.9 percent—would substantially improve U.S. competitiveness, contributing to sharp shifts in foreign direct investment toward capital projects in the U.S. The effective average tax rate, a measure of the after-tax profit of an investment project over its lifetime, is a crucial determinant of investment location. Reflecting the declining competitiveness of U.S. statutory corporate tax rates, figure 1-3 reveals that before the TCJA’s enactment, the effective average tax rate of the rest of the developed world was declining substantially relative to that of the United States.
Costs of Taxation in the United StatesIf there is one principle on which economists agree—and, indeed, that in large measure defines the profession—it is that people and firms respond to incen-tives. We may dispute the magnitudes of these responses, and sometimes even their direction, particularly in the aggregate, but their existence is universally acknowledged by economists of all stripes. The study of the economic effects of taxation is, fundamentally, the study of responses to such incentives and how these responses may offset—partly or, occasionally, totally—the benefits of taxation.
Taxes and Growth | 37
United States
OECD ex-USA
Lowest
Highest
0
10
20
30
40
50
60
2000 2005 2010 2015
Figure 1-2. Top Statutory Corporate Tax Rates in OECD Countries, 2000–2017Percent
Source: OECD Statistics (2017).Note: Series combine national and subnational rates.
Other OECD
United States
15
20
25
30
35
40
1999 2001 2003 2005 2007 2009 2011 2013 2015 2017
Figure 1-3. Effective Average Corporate Tax Rates of OECD Countries, 1999–2017Percent
Source: Centre for Busines Taxation (2017).Note: Series combine national and subnational rates. Because there are alternative ways to compute the effective average tax rate, calculations may vary by source.
38 | Chapter 1
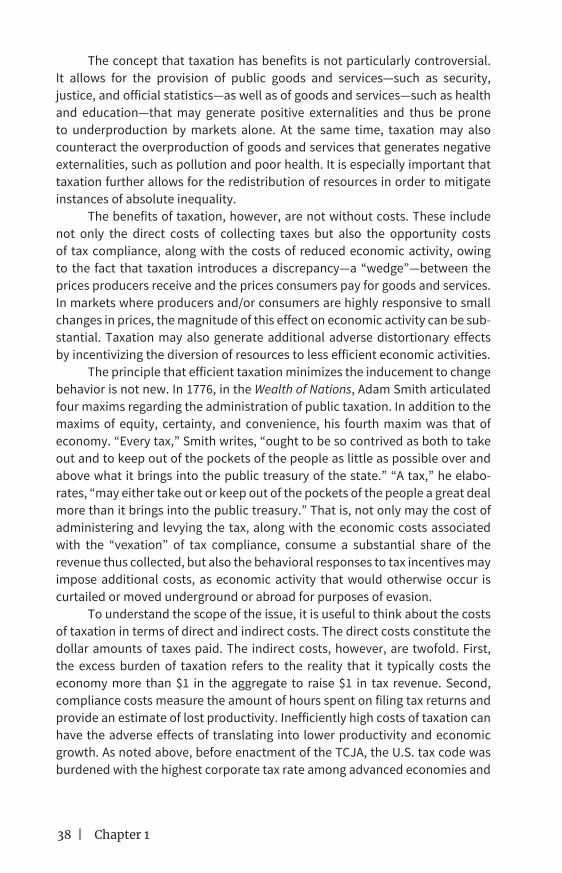
The concept that taxation has benefits is not particularly controversial. It allows for the provision of public goods and services—such as security, justice, and official statistics—as well as of goods and services—such as health and education—that may generate positive externalities and thus be prone to underproduction by markets alone. At the same time, taxation may also counteract the overproduction of goods and services that generates negative externalities, such as pollution and poor health. It is especially important that taxation further allows for the redistribution of resources in order to mitigate instances of absolute inequality.
The benefits of taxation, however, are not without costs. These include not only the direct costs of collecting taxes but also the opportunity costs of tax compliance, along with the costs of reduced economic activity, owing to the fact that taxation introduces a discrepancy—a “wedge”—between the prices producers receive and the prices consumers pay for goods and services. In markets where producers and/or consumers are highly responsive to small changes in prices, the magnitude of this effect on economic activity can be sub-stantial. Taxation may also generate additional adverse distortionary effects by incentivizing the diversion of resources to less efficient economic activities.
The principle that efficient taxation minimizes the inducement to change behavior is not new. In 1776, in the Wealth of Nations, Adam Smith articulated four maxims regarding the administration of public taxation. In addition to the maxims of equity, certainty, and convenience, his fourth maxim was that of economy. “Every tax,” Smith writes, “ought to be so contrived as both to take out and to keep out of the pockets of the people as little as possible over and above what it brings into the public treasury of the state.” “A tax,” he elabo-rates, “may either take out or keep out of the pockets of the people a great deal more than it brings into the public treasury.” That is, not only may the cost of administering and levying the tax, along with the economic costs associated with the “vexation” of tax compliance, consume a substantial share of the revenue thus collected, but also the behavioral responses to tax incentives may impose additional costs, as economic activity that would otherwise occur is curtailed or moved underground or abroad for purposes of evasion.
To understand the scope of the issue, it is useful to think about the costs of taxation in terms of direct and indirect costs. The direct costs constitute the dollar amounts of taxes paid. The indirect costs, however, are twofold. First, the excess burden of taxation refers to the reality that it typically costs the economy more than $1 in the aggregate to raise $1 in tax revenue. Second, compliance costs measure the amount of hours spent on filing tax returns and provide an estimate of lost productivity. Inefficiently high costs of taxation can have the adverse effects of translating into lower productivity and economic growth. As noted above, before enactment of the TCJA, the U.S. tax code was burdened with the highest corporate tax rate among advanced economies and
Taxes and Growth | 39
an international tax system that encouraged capital outflows and the offshor-ing of profits.
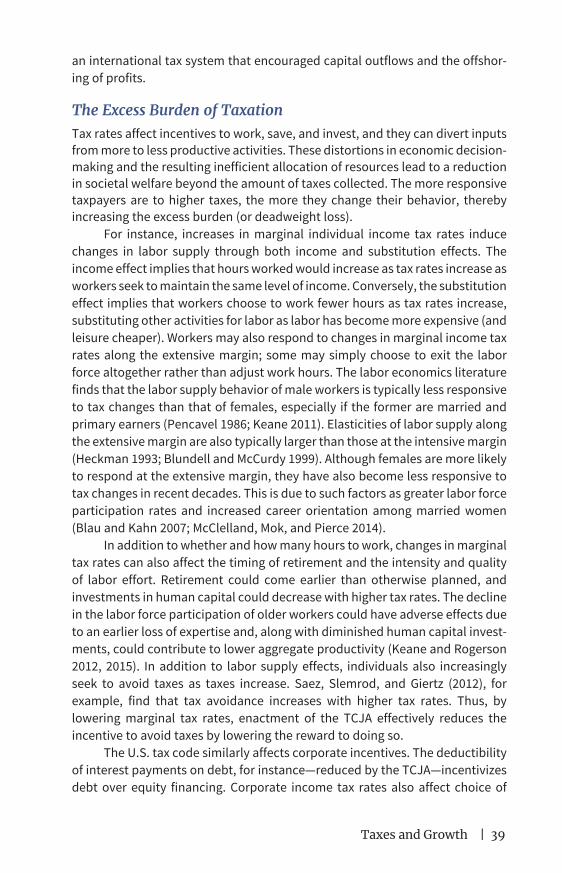
The Excess Burden of TaxationTax rates affect incentives to work, save, and invest, and they can divert inputs from more to less productive activities. These distortions in economic decision-making and the resulting inefficient allocation of resources lead to a reduction in societal welfare beyond the amount of taxes collected. The more responsive taxpayers are to higher taxes, the more they change their behavior, thereby increasing the excess burden (or deadweight loss).
For instance, increases in marginal individual income tax rates induce changes in labor supply through both income and substitution effects. The income effect implies that hours worked would increase as tax rates increase as workers seek to maintain the same level of income. Conversely, the substitution effect implies that workers choose to work fewer hours as tax rates increase, substituting other activities for labor as labor has become more expensive (and leisure cheaper). Workers may also respond to changes in marginal income tax rates along the extensive margin; some may simply choose to exit the labor force altogether rather than adjust work hours. The labor economics literature finds that the labor supply behavior of male workers is typically less responsive to tax changes than that of females, especially if the former are married and primary earners (Pencavel 1986; Keane 2011). Elasticities of labor supply along the extensive margin are also typically larger than those at the intensive margin (Heckman 1993; Blundell and McCurdy 1999). Although females are more likely to respond at the extensive margin, they have also become less responsive to tax changes in recent decades. This is due to such factors as greater labor force participation rates and increased career orientation among married women (Blau and Kahn 2007; McClelland, Mok, and Pierce 2014).
In addition to whether and how many hours to work, changes in marginal tax rates can also affect the timing of retirement and the intensity and quality of labor effort. Retirement could come earlier than otherwise planned, and investments in human capital could decrease with higher tax rates. The decline in the labor force participation of older workers could have adverse effects due to an earlier loss of expertise and, along with diminished human capital invest-ments, could contribute to lower aggregate productivity (Keane and Rogerson 2012, 2015). In addition to labor supply effects, individuals also increasingly seek to avoid taxes as taxes increase. Saez, Slemrod, and Giertz (2012), for example, find that tax avoidance increases with higher tax rates. Thus, by lowering marginal tax rates, enactment of the TCJA effectively reduces the incentive to avoid taxes by lowering the reward to doing so.
The U.S. tax code similarly affects corporate incentives. The deductibility of interest payments on debt, for instance—reduced by the TCJA—incentivizes debt over equity financing. Corporate income tax rates also affect choice of
40 | Chapter 1
investment location. As noted above, the top marginal statutory corporate tax rate in the U.S. before the TCJA was the highest among advanced economies, and much higher than the OECD average. However, the U.S. collected less in corporate taxes, relative to GDP, than the OECD average, due largely to high capital mobility and corporate profit shifting, the latter in response to tax rate differentials. In 2016, the average top statutory corporate tax rate (combined subnational and national) in OECD countries excluding the U.S. was 24.2 per-cent, and corporate tax revenue totaled 3.0 percent of GDP. In comparison, the combined (State and Federal) top statutory corporate tax rate in the U.S. was 38.9 percent, while corporate tax revenue was only 2.2 percent of GDP. Figure 1-4 plots top statutory corporate tax rates and corporate tax revenue (as a per-centage of GDP) in all OECD countries since 2000. This figure shows that higher rates do not necessarily lead to higher revenue collected as a fraction of GDP.
In addition, before the passage of the TCJA, and unlike any other devel-oped country, the United States operated a system of worldwide taxation that taxed U.S. corporations on their net income from any source, once repatriated. This system encouraged deferral of overseas profit reporting by U.S. multina-tionals, as firms were incentivized to hold large volumes of cash at their foreign subsidiaries in lower-tax jurisdictions. Other OECD countries instead follow either a territorial tax system, whereby corporations are taxed only on income generated domestically, or a hybrid tax system, whereby foreign income is taxed only if the foreign country’s tax system is significantly different from that at home. Due to the worldwide tax system, deferral, and high domestic corpo-rate tax rates, U.S. companies were highly incentivized to shift their reported income abroad, leading to lower domestic investment, to less physical and intellectual capital formation within the United States, and to lost productivity due to the offshoring of operations.
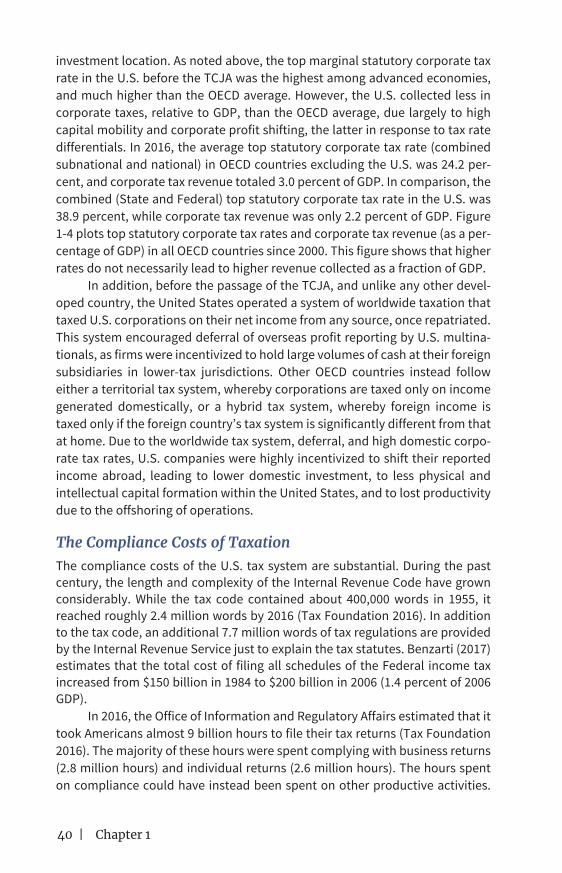
The Compliance Costs of TaxationThe compliance costs of the U.S. tax system are substantial. During the past century, the length and complexity of the Internal Revenue Code have grown considerably. While the tax code contained about 400,000 words in 1955, it reached roughly 2.4 million words by 2016 (Tax Foundation 2016). In addition to the tax code, an additional 7.7 million words of tax regulations are provided by the Internal Revenue Service just to explain the tax statutes. Benzarti (2017) estimates that the total cost of filing all schedules of the Federal income tax increased from $150 billion in 1984 to $200 billion in 2006 (1.4 percent of 2006 GDP).
In 2016, the Office of Information and Regulatory Affairs estimated that it took Americans almost 9 billion hours to file their tax returns (Tax Foundation 2016). The majority of these hours were spent complying with business returns (2.8 million hours) and individual returns (2.6 million hours). The hours spent on compliance could have instead been spent on other productive activities.

Taxes and Growth | 41
Rather than hiring tax professionals to file highly complex returns, businesses could instead have invested in new plant and equipment. This opportunity cost of compliance can reduce productivity in the long run. Based on the Bureau of Labor Statistics’ hourly compensation estimates of $52.05 for professional workers and $37.28 for all private sector workers in 2015, the hours spent on complying with the tax code cost the U.S. economy an amount exceeding $400 billion, or 2.4 percent of 2016 GDP (Tax Foundation 2016).
Slemrod (2006) discusses the nature of compliance costs for corpora-tions. Though compliance costs are higher for larger firms, the costs are regres-sive, in the sense that they constitute a relatively lower percentage of operating costs for larger firms. In other words, the burden of complexity falls dispropor-tionately on smaller firms. Costs include audits, planning, research, appeals, litigation, and filing returns. Such costs also vary widely across industries, with the highest costs incurred by firms in the communication, technology, and media sectors, and the lowest costs by firms in the retail, food, and healthcare industries. Multinational companies face higher compliance costs, especially those with operations in multiple foreign countries. In addition, because larger corporations often have the resources to navigate tax complexity to achieve a lower effective rate, the recently enacted tax reform has the added benefit of leveling the playing field between large multinational firms and smaller domestic firms.
0
2
4
6
8
10
12
14
0 10 20 30 40 50 60
Figure 1-4. Corporate Tax Rates and Corporate Tax Revenue, 2000–2016Corporate tax revenue (% of GDP)
Source: OECD Statistics (2017).
Top statutory corporate tax rate

42 | Chapter 1
Unfortunately, while tax complexity is costly, it is sometimes a necessary consequence of the need to balance multiple objectives of tax policy, particu-larly efficiency and progressivity (economy and equity, according to Smith’s maxims), that are not always in harmony. For example, the introduction of targeted tax deductions and credits for reasons of economic efficiency may also require the implementation of phase-outs at higher income levels so that low- and middle-income households benefit relatively as well as absolutely. While such provisions may add to complexity, they are nonetheless necessary for the maintenance of a progressive tax code.
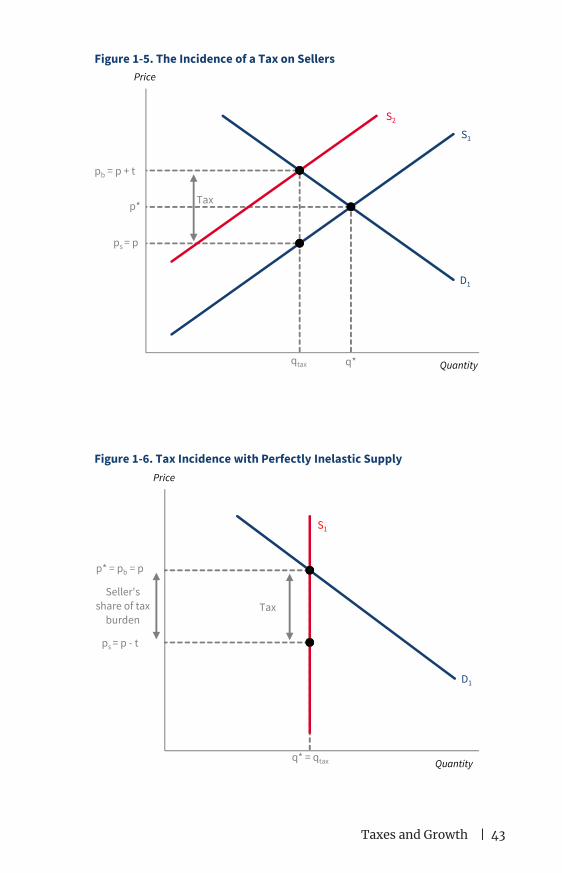
Tax IncidenceIt is well known in economic theory that the individual (or corporation) who makes a tax payment to the government is not necessarily the one who bears the burden of this payment; this burden is the incidence of the tax. Legally, the incidence of a tax is determined by who actually pays the tax to the govern-ment. For example, the statutory incidence of sales taxes is typically on the seller of the goods sold. This incidence, however, does not take into account the fact that markets adjust in response to the imposition of the tax—and it is this market reaction that determines who actually bears the burden or economic incidence of a particular tax. We illustrate this concept using a simple graph of demand and supply (figure 1-5). Absent any intervention in the mar-ket, q* units would be sold at a price of p* per unit. We illustrate the imposition of a per-unit tax by shifting the supply curve in by $t units.
An alternative to a per-unit tax is an ad valorem tax, such as a sales tax. Rather than shift the supply curve in by $t units, the supply curve would instead rotate by t percent. In addition, for simplicity, we focus on shifting the supply curve. The demand curve could, alternatively, shift in by the same number of units. Economic theory shows that it does not matter who bears the statutory incidence of the tax, as the economic incidence is the same in either case.
As figure 1-6 shows, even though the supplier is responsible for remitting the money to the government, the increase in price to the consumer means that the consumer is responsible for at least part of the tax. Crucially, the amount born by the consumer depends upon the relative elasticities of supply and demand. After the tax is implemented, consumers pay pb = p + t (> p*) per unit, producers keep ps = p (< p*), and the government collects $t per unit sold. Consider figures 1-6 and 1-7, which are variants of figure 1-5.
In figure 1-6, suppliers exhibit perfectly inelastic supply. That is, for a given change in price, suppliers continue to supply the exact same quantity of the good. In this case, the entire tax will be pushed onto them in the form of lower prices (ps = p – t < p*). This result is very intuitive; if suppliers are completely unresponsive to price then it makes sense to push the tax onto them. The after-tax price for consumers will stay the same as the pretax price.
Taxes and Growth | 43
D1
p*
pb = p + t
ps = p
qtax q*
S1
S2
Figure 1-5. The Incidence of a Tax on Sellers
Quantity
Price
Tax
q* = qtax
D1
S1
p* = pb = p
ps = p - t
Figure 1-6. Tax Incidence with Perfectly Inelastic Supply
Quantity
Price
TaxSeller's
share of tax burden

44 | Chapter 1
A typical example of perfectly inelastic supply is land. The United States, for example, has a fixed amount of land. Likewise, geography can sometimes limit usable land, rendering its supply more inelastic. Local ordinances and regulations can also impact the supply of land available for building, making the supply of housing inelastic—an example we will turn to below. Under this scenario, suppliers will bear the burden of the tax. The after-tax price will not change from the pretax price for consumers. Because suppliers must remit the tax, they collect $p from the consumer, send $t to the government and are left with $(p – t). In figure 1-7, however, sellers exhibit perfectly elastic supply. That is, if the price falls below p*, the supply falls to zero. Thus, in this case, the entire tax will be paid by consumers (the price they pay increases to p* + t), and sellers continue to receive p*.
One final detail in these figures is important in our subsequent discussion on tax incidence in the TCJA. Until now, we have considered the impact of a tax on prices. Now we consider the impact of a tax on the quantity of the good sold. Returning to figure 1-5, before the imposition of the tax, q* units of the good were sold at a price of p*. After the tax, only qtax units are sold. The triangular area between the demand and supply curves between qtax and q* is known as deadweight loss or the excess burden, as discussed above. Because the com-petitive equilibrium at p* and q* maximizes social efficiency, any movement away from that caused by per unit or ad valorem taxation is an efficiency loss to society. This is the price that we pay for a redistributive tax system. Deadweight loss is higher when demand and/or supply are very elastic—that is, the imposi-tion of a tax generates large behavioral responses. On the opposite side, when either demand or supply are perfectly inelastic—that is, when the imposition of the tax does not generate any movement away from the efficient quantity, deadweight loss is equal to zero. It is true that suppliers may bear the entire burden of the tax (in the case of perfectly inelastic supply) but, given that they still provide q*, there is no loss to society overall—simply a transfer of income from suppliers to the government.
The incidence of a tax has important implications for the distributional aspects of tax reform. Much of the argument on whether particular tax reforms help or hurt certain groups depends upon how elastic we believe demand or supply to be. Here, we highlight two important elements of the TCJA whereby tax incidence has played a key role in our understanding of how taxes ulti-mately affect households. We first consider the corporate tax. Though cor-porations pay the tax, they do not ultimately bear its burden. A main tenet of public economics is that people—whether they are shareholders, the owners of capital, or workers—bear the burden of a corporate tax. Therefore, which people in particular pay the tax is an empirical question. A second example is the incidence of the mortgage interest deduction (MID), which is a subsidy for home ownership given to households that itemize their taxes. Though the MID is not eliminated in the new tax law, fewer households will claim the deduction

Taxes and Growth | 45
because they will be better off claiming the higher standard deduction. This has the potential to have an impact on home prices, though evidence indicates that the impact will be quite modest.
The Incidence of the Corporate Income TaxIn analyzing where the burden of the corporate tax falls on capital relative to labor, it is important to distinguish between short-run and long-run burdens. In the short run, increases in the corporate tax are borne by current owners of corporate capital, through a drop in asset values, and by investors, through lower after-tax rates of return. In the long run, labor bears more of the burden of the corporate tax. This is because an increase in the effective tax rate on capital income from new saving and investment leads to a reduction in capital accumulation. The resulting decline in the capital-to-labor ratio decreases labor productivity and leads to a fall in wages.
Exactly how much of the burden labor bears is a subject of much aca-demic research. Piketty and Saez (2007) assume that the burden of the cor-porate income tax falls on owners of capital income. Several think tanks and public research services—including the Tax Policy Center and Congressional Budget Office—assume in their current tax models that most of the corporate tax burden (about 80 percent) is borne by capital, and the rest by labor. The empirical literature places the corporate tax burden borne by workers at between 21 and 75 percent, with higher figures generally representing more recent studies that assume freer movement of capital across borders. These
q*
p* = ps = p
qtax
D1
S1
pb = p + t
Figure 1-7. Tax Incidence with Perfectly Elastic Supply
Quantity
Price
TaxBuyers'
share of tax burden
46 | Chapter 1
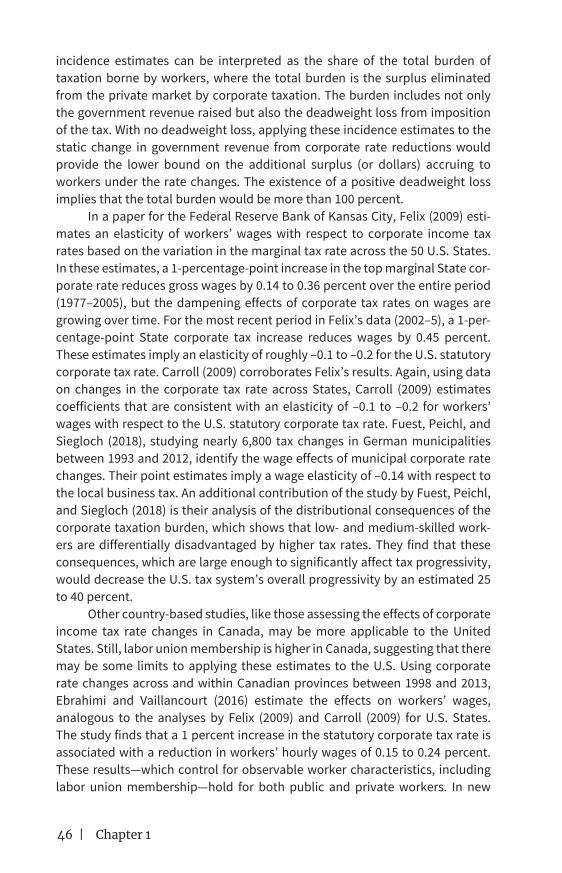
incidence estimates can be interpreted as the share of the total burden of taxation borne by workers, where the total burden is the surplus eliminated from the private market by corporate taxation. The burden includes not only the government revenue raised but also the deadweight loss from imposition of the tax. With no deadweight loss, applying these incidence estimates to the static change in government revenue from corporate rate reductions would provide the lower bound on the additional surplus (or dollars) accruing to workers under the rate changes. The existence of a positive deadweight loss implies that the total burden would be more than 100 percent.
In a paper for the Federal Reserve Bank of Kansas City, Felix (2009) esti-mates an elasticity of workers’ wages with respect to corporate income tax rates based on the variation in the marginal tax rate across the 50 U.S. States. In these estimates, a 1-percentage-point increase in the top marginal State cor-porate rate reduces gross wages by 0.14 to 0.36 percent over the entire period (1977–2005), but the dampening effects of corporate tax rates on wages are growing over time. For the most recent period in Felix’s data (2002–5), a 1-per-centage-point State corporate tax increase reduces wages by 0.45 percent. These estimates imply an elasticity of roughly –0.1 to –0.2 for the U.S. statutory corporate tax rate. Carroll (2009) corroborates Felix’s results. Again, using data on changes in the corporate tax rate across States, Carroll (2009) estimates coefficients that are consistent with an elasticity of –0.1 to –0.2 for workers’ wages with respect to the U.S. statutory corporate tax rate. Fuest, Peichl, and Siegloch (2018), studying nearly 6,800 tax changes in German municipalities between 1993 and 2012, identify the wage effects of municipal corporate rate changes. Their point estimates imply a wage elasticity of –0.14 with respect to the local business tax. An additional contribution of the study by Fuest, Peichl, and Siegloch (2018) is their analysis of the distributional consequences of the corporate taxation burden, which shows that low- and medium-skilled work-ers are differentially disadvantaged by higher tax rates. They find that these consequences, which are large enough to significantly affect tax progressivity, would decrease the U.S. tax system’s overall progressivity by an estimated 25 to 40 percent.
Other country-based studies, like those assessing the effects of corporate income tax rate changes in Canada, may be more applicable to the United States. Still, labor union membership is higher in Canada, suggesting that there may be some limits to applying these estimates to the U.S. Using corporate rate changes across and within Canadian provinces between 1998 and 2013, Ebrahimi and Vaillancourt (2016) estimate the effects on workers’ wages, analogous to the analyses by Felix (2009) and Carroll (2009) for U.S. States. The study finds that a 1 percent increase in the statutory corporate tax rate is associated with a reduction in workers’ hourly wages of 0.15 to 0.24 percent. These results—which control for observable worker characteristics, including labor union membership—hold for both public and private workers. In new

Taxes and Growth | 47
research, McKenzie and Ferede (2017) also use changes in corporate tax rates within Canada to develop an estimate of the impact on workers’ wages. The baseline elasticity estimate is –0.11, with alternative estimates giving absolute values as large as –0.15.
Looking at other countries with similar market-based economies, Dwenger, Rattenhuber, and Steiner (2013) estimate the effects on work-ers’ wages of corporate tax rate changes in Germany. Their results imply a semielasticity of wages of about –1.24 with respect to the average tax rate, without accounting for employment effects, and of –2.36 when employment effects are included.
A cross-country study by Hassett and Mathur (2015), based on 65 coun-tries and 25 years of data, finds that the elasticity of workers’ wages in manu-facturing after 5 years with respect to the highest marginal tax rate in a country is –0.5 in the baseline case, which includes the addition of spatial tax variables. An expanded analysis by Felix (2007) follows the strategy used by Hassett and Mathur (2006), but incorporates additional control variables, including work-ers’ education levels and countries’ degree of economic openness. Felix’s esti-mates imply a semielasticity of between –0.7 and –1.23. When she replicates Hassett and Mathur’s specification, the semielasticity is –0.43.
A set of recent papers also seeks to measure the rent-sharing, or “bar-gaining,” channel directly, including papers by Liu and Altshuler (2013) and by Arulampalam, Devereux, and Maffini (2012). Liu and Altshuler measure an elasticity of between –0.03 and –0.04 for U.S. workers’ wages with respect to effective marginal tax rates, which represent these workers’ profit sharing with respect to their employers’ tax liabilities. Research by Desai, Foley, and Hines (2004) also relies on wage data for U.S. multinationals to assess the relative share of the corporate tax burden borne by labor, measuring the labor share at between 45 and 75 percent, near the higher end of theoretical predictions. However, because these papers do not assess the economy-wide effects of corporate tax reform, they are excluded from figure 1-9, which summarized the studies discussed here.
Results from Azémar and Hubbard (2015) also utilize cross-country changes in the corporate tax rates of OECD countries (generally high-income, developed countries, like the U.S.) to measure the effects of corporate tax rate changes on workers’ wages. The paper measures changes in workers’ wages with and without controls for changes in value added (labor productivity). The results imply a semielasticity of –0.43 (–0.17 for the U.S.) for workers’ wages with respect to the corporate tax rate, of which about three-fourths is related to the indirect channel and one-fourth to the direct channel. Azémar and Hubbard note that the estimates without value added (those corresponding to the com-bination of both direct and indirect channels) may be overestimates, given the correlation between value added and corporate tax rates. We include them in figure 1-8, but note this caution on interpretation.
48 | Chapter 1
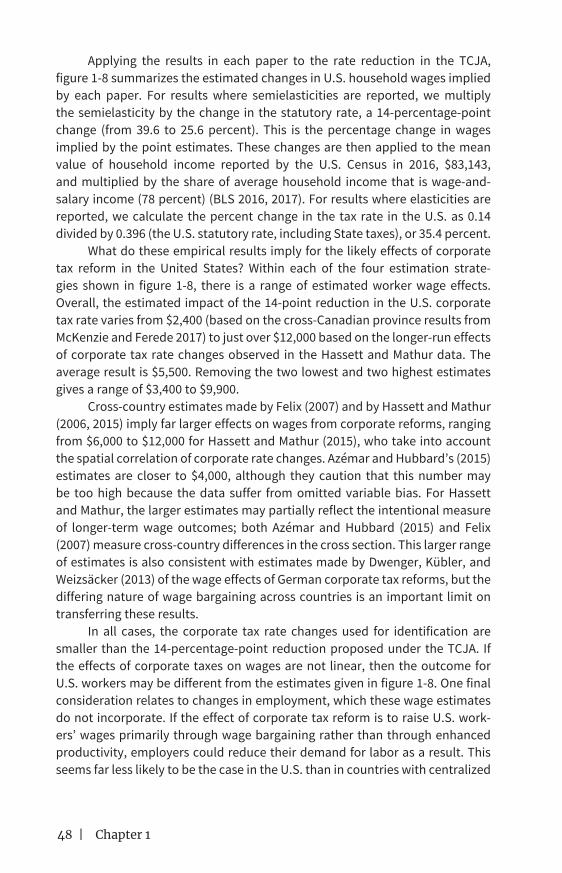
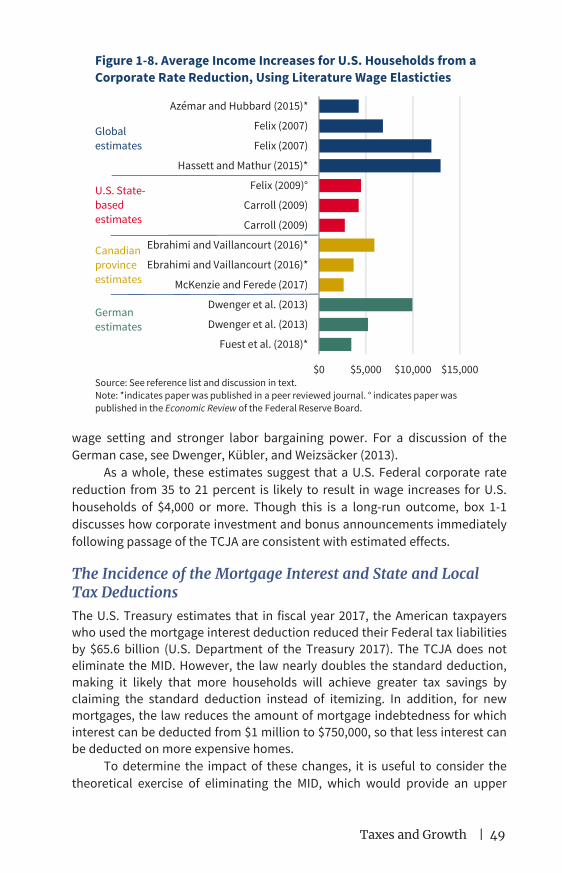
Applying the results in each paper to the rate reduction in the TCJA, figure 1-8 summarizes the estimated changes in U.S. household wages implied by each paper. For results where semielasticities are reported, we multiply the semielasticity by the change in the statutory rate, a 14-percentage-point change (from 39.6 to 25.6 percent). This is the percentage change in wages implied by the point estimates. These changes are then applied to the mean value of household income reported by the U.S. Census in 2016, $83,143, and multiplied by the share of average household income that is wage-and-salary income (78 percent) (BLS 2016, 2017). For results where elasticities are reported, we calculate the percent change in the tax rate in the U.S. as 0.14 divided by 0.396 (the U.S. statutory rate, including State taxes), or 35.4 percent.
What do these empirical results imply for the likely effects of corporate tax reform in the United States? Within each of the four estimation strate-gies shown in figure 1-8, there is a range of estimated worker wage effects. Overall, the estimated impact of the 14-point reduction in the U.S. corporate tax rate varies from $2,400 (based on the cross-Canadian province results from McKenzie and Ferede 2017) to just over $12,000 based on the longer-run effects of corporate tax rate changes observed in the Hassett and Mathur data. The average result is $5,500. Removing the two lowest and two highest estimates gives a range of $3,400 to $9,900.
Cross-country estimates made by Felix (2007) and by Hassett and Mathur (2006, 2015) imply far larger effects on wages from corporate reforms, ranging from $6,000 to $12,000 for Hassett and Mathur (2015), who take into account the spatial correlation of corporate rate changes. Azémar and Hubbard’s (2015) estimates are closer to $4,000, although they caution that this number may be too high because the data suffer from omitted variable bias. For Hassett and Mathur, the larger estimates may partially reflect the intentional measure of longer-term wage outcomes; both Azémar and Hubbard (2015) and Felix (2007) measure cross-country differences in the cross section. This larger range of estimates is also consistent with estimates made by Dwenger, Kübler, and Weizsäcker (2013) of the wage effects of German corporate tax reforms, but the differing nature of wage bargaining across countries is an important limit on transferring these results.
In all cases, the corporate tax rate changes used for identification are smaller than the 14-percentage-point reduction proposed under the TCJA. If the effects of corporate taxes on wages are not linear, then the outcome for U.S. workers may be different from the estimates given in figure 1-8. One final consideration relates to changes in employment, which these wage estimates do not incorporate. If the effect of corporate tax reform is to raise U.S. work-ers’ wages primarily through wage bargaining rather than through enhanced productivity, employers could reduce their demand for labor as a result. This seems far less likely to be the case in the U.S. than in countries with centralized
Taxes and Growth | 49
wage setting and stronger labor bargaining power. For a discussion of the German case, see Dwenger, Kübler, and Weizsäcker (2013).
As a whole, these estimates suggest that a U.S. Federal corporate rate reduction from 35 to 21 percent is likely to result in wage increases for U.S. households of $4,000 or more. Though this is a long-run outcome, box 1-1 discusses how corporate investment and bonus announcements immediately following passage of the TCJA are consistent with estimated effects.
The Incidence of the Mortgage Interest and State and Local Tax DeductionsThe U.S. Treasury estimates that in fiscal year 2017, the American taxpayers who used the mortgage interest deduction reduced their Federal tax liabilities by $65.6 billion (U.S. Department of the Treasury 2017). The TCJA does not eliminate the MID. However, the law nearly doubles the standard deduction, making it likely that more households will achieve greater tax savings by claiming the standard deduction instead of itemizing. In addition, for new mortgages, the law reduces the amount of mortgage indebtedness for which interest can be deducted from $1 million to $750,000, so that less interest can be deducted on more expensive homes.
To determine the impact of these changes, it is useful to consider the theoretical exercise of eliminating the MID, which would provide an upper
$0 $5,000 $10,000 $15,000
Fuest et al. (2018)*
Dwenger et al. (2013)
Dwenger et al. (2013)
McKenzie and Ferede (2017)
Ebrahimi and Vaillancourt (2016)*
Ebrahimi and Vaillancourt (2016)*
Carroll (2009)
Carroll (2009)
Felix (2009)°
Hassett and Mathur (2015)*
Felix (2007)
Felix (2007)
Azémar and Hubbard (2015)*
Globalestimates
U.S. State-basedestimates
Canadianprovince estimates
German estimates
Figure 1-8. Average Income Increases for U.S. Households from a Corporate Rate Reduction, Using Literature Wage Elasticties
Source: See reference list and discussion in text.Note: *indicates paper was published in a peer reviewed journal. ° indicates paper was published in the Economic Review of the Federal Reserve Board.
50 | Chapter 1
bound on any potential effects from the TCJA. When considering the tax inci-dence of the MID, it may be that buyers gain and current homeowners lose (or are at least made no worse off). The opposite may also be true. The statu-tory incidence falls upon the potential homebuyer because he or she can no longer use mortgage interest to reduce his or her Federal income tax burden. In other words, the subsidy for housing is removed, and a subsidy is just a negative tax—the economic theory discussed above applies in the same way, except that the government, rather than collecting taxes, provides a financial
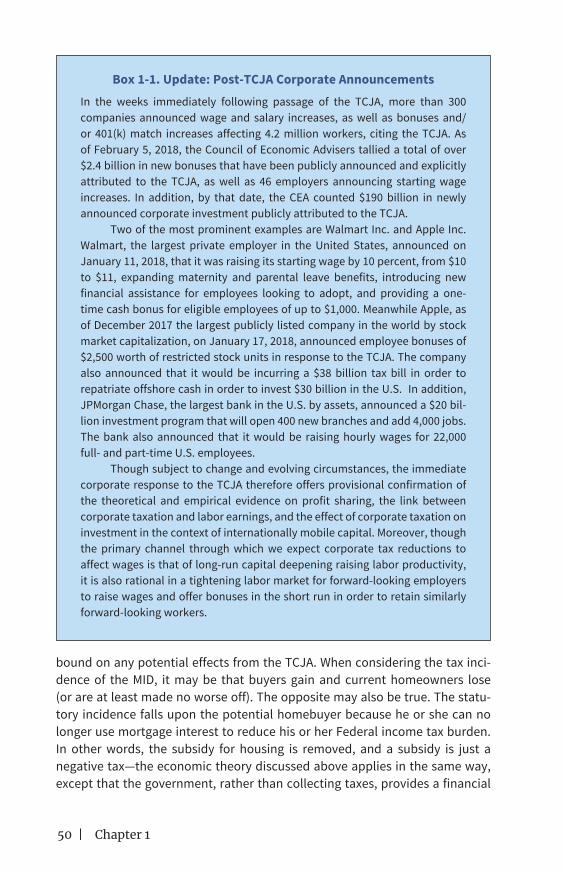
Box 1-1. Update: Post-TCJA Corporate AnnouncementsIn the weeks immediately following passage of the TCJA, more than 300 companies announced wage and salary increases, as well as bonuses and/or 401(k) match increases affecting 4.2 million workers, citing the TCJA. As of February 5, 2018, the Council of Economic Advisers tallied a total of over $2.4 billion in new bonuses that have been publicly announced and explicitly attributed to the TCJA, as well as 46 employers announcing starting wage increases. In addition, by that date, the CEA counted $190 billion in newly announced corporate investment publicly attributed to the TCJA.
Two of the most prominent examples are Walmart Inc. and Apple Inc. Walmart, the largest private employer in the United States, announced on January 11, 2018, that it was raising its starting wage by 10 percent, from $10 to $11, expanding maternity and parental leave benefits, introducing new financial assistance for employees looking to adopt, and providing a one-time cash bonus for eligible employees of up to $1,000. Meanwhile Apple, as of December 2017 the largest publicly listed company in the world by stock market capitalization, on January 17, 2018, announced employee bonuses of $2,500 worth of restricted stock units in response to the TCJA. The company also announced that it would be incurring a $38 billion tax bill in order to repatriate offshore cash in order to invest $30 billion in the U.S. In addition, JPMorgan Chase, the largest bank in the U.S. by assets, announced a $20 bil-lion investment program that will open 400 new branches and add 4,000 jobs. The bank also announced that it would be raising hourly wages for 22,000 full- and part-time U.S. employees.
Though subject to change and evolving circumstances, the immediate corporate response to the TCJA therefore offers provisional confirmation of the theoretical and empirical evidence on profit sharing, the link between corporate taxation and labor earnings, and the effect of corporate taxation on investment in the context of internationally mobile capital. Moreover, though the primary channel through which we expect corporate tax reductions to affect wages is that of long-run capital deepening raising labor productivity, it is also rational in a tightening labor market for forward-looking employers to raise wages and offer bonuses in the short run in order to retain similarly forward-looking workers.
Taxes and Growth | 51
payment. Thus, both home buyers and sellers benefit to some extent from the subsidy—the subsidy allows sellers to receive a higher price and allows buyers to pay a lower price (assuming standard demand and supply curves, but, unlike figure 1-6, the demand curve shifts out with a subsidy for buyers.) Removing the subsidy (and moving back toward the competitive equilibrium) has the effect of potentially modestly lowering the price that sellers receive and raising the price that buyers pay. As always, the precise economic incidence is determined by the relative price-elasticities of demand for and supply of the housing stock.
There is a body of academic literature that has studied the effect of the MID on housing prices. Early studies found substantial effects on hous-ing prices. For example, Poterba (1984) estimates that there would be a very large housing price response to the MID’s elimination—a 26 percent decline. However, this result was estimated more than 30 years ago, in an environment of 10 percent inflation and may not be relevant in today’s economic setting. Capozza, Green, and Hendershott (1996) estimate that eliminating the MID (along with ending the deduction for property taxes) would decrease house prices by an estimated 13 percent. Harris (2013) estimates that eliminating the MID would reduce home prices by 12 to 19 percent, depending upon the model.
Other contributions to the academic literature that consider the MID within the context of the larger economy find significantly lower price effects from its elimination. These studies examine a more flexible model of the hous-ing market that allows demand and supply to respond to reductions in the demand for housing, or incorporate spillover effects in the rental housing mar-ket. Most recently, Sommer and Sullivan (2017) find that eliminating the MID would reduce home prices by 4.2 percent in the long run, although the effect is only half this size in an environment with the low interest rates observed today. In a similar model, Floetotto, Kirker, and Stroebel (2016) estimate that eliminating the MID would decrease home prices by only 1 percent in the long run. Given that the value of housing is equal to roughly 30 percent of total household wealth, a 4 percent fall in housing prices translates into about a 1.2 percent decline in total household net wealth (Federal Reserve Board 2017).
Recent research (e.g., Hilber and Turner 2014) also indicates that the impact of eliminating the MID would vary depending on the elasticity of supply of housing in different areas. In markets where supply is constrained, eliminat-ing the MID is more likely to reduce prices because supply does not adjust downward in the long run and with little to no impact on homeownership rates. Rappoport (2016) uses a structural model, which allows housing supply elasticities to vary across areas, and he finds that eliminating the MID would decrease house prices by 6.9 percent on average, but with considerable varia-tion across markets, again, depending on the elasticity of supply.
In sum, the most recent academic literature suggests that the impact of eliminating the MID on house prices is likely to be more modest than those in the earlier literature, and its magnitude in different areas will depend on the
52 | Chapter 1
extent to which housing supply can respond to reduced demand. Cities like San Francisco, where the housing stock is relatively inelastic, may experience greater price responses compared to cities with relatively few land-use restric-tions, like Dallas.
As noted above, the TCJA does not eliminate the MID. As a result, any potential impact on housing prices is expected to be more muted than that suggested by this review of the literature. The proportion of households item-izing is estimated to decrease from 29.2 percent to 13.4 percent—that is, 23.1 million more filers taking the standard deduction as a result of the TCJA. Many of these households would have claimed the MID in the past, but after the enactment of the TCJA no longer find it beneficial to do so. In the same vein, other households with particularly large mortgage interest obligations may still find it in their interest to claim the MID. As such, the studies that consider the full elimination of the MID can be considered as upper bounds on the antici-pated impact of the TCJA and, in all likelihood, ultimately will be far smaller. Nonetheless, the TCJA is likely to offset any potential harm by nearly doubling the standard deduction, lowering statutory tax rates and substantially increas-ing the Child Tax Credit.
Similarly, the extant academic literature suggests that capping the Federal income tax deductibility of State and local taxes at $10,000 would have only modest, though potentially progressive, economic impacts. Feldstein and Metcalf (1987) find strong evidence that deductibility affects how State and local governments finance spending, and limited evidence that it affects overall levels of State and local government spending. Specifically, they find that States where Federal deductibility implies a relatively low cost of financ-ing via deductible personal taxes (e.g., income, sales, and property taxes), rely more heavily on those taxes versus business taxes and other revenue sources.
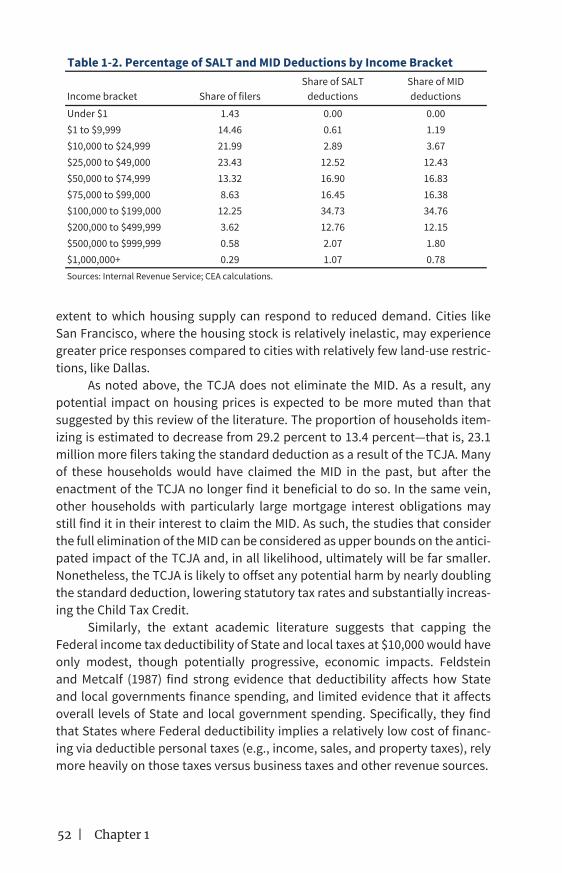
Income bracket Share of filersShare of SALT
deductionsShare of MID deductions
Under $1 1.43 0.00 0.00$1 to $9,999 14.46 0.61 1.19$10,000 to $24,999 21.99 2.89 3.67$25,000 to $49,000 23.43 12.52 12.43$50,000 to $74,999 13.32 16.90 16.83$75,000 to $99,000 8.63 16.45 16.38$100,000 to $199,000 12.25 34.73 34.76$200,000 to $499,999 3.62 12.76 12.15$500,000 to $999,999 0.58 2.07 1.80$1,000,000+ 0.29 1.07 0.78Sources: Internal Revenue Service; CEA calculations.
100
Table 1-2. Percentage of SALT and MID Deductions by Income Bracket
Taxes and Growth | 53
Inman (1989) and Metcalf (2011) observe similar outcomes. Inman finds that though eliminating State and local income tax (SALT) deductibility would increase the progressivity of the Federal income tax code, it could also result in higher local property taxation and lower fees in larger U.S. cities. Elimination would only reduce total local government spending in large cities if property taxes are constrained, in which case local government revenues and spending would be expected to decline by roughly 3 to 7 percent. Inman further finds that the Federal government would unambiguously collect more tax revenue from taxpayers in large cities. Metcalf, meanwhile, shows that deductibility leads to greater reliance on income and property taxes at the State and local levels, while having no observable impact on nondeductible taxes and fees. Though the deduction is significantly regressive at the Federal level, he finds some evidence that the SALT deduction may support progressive taxes at the subnational level.
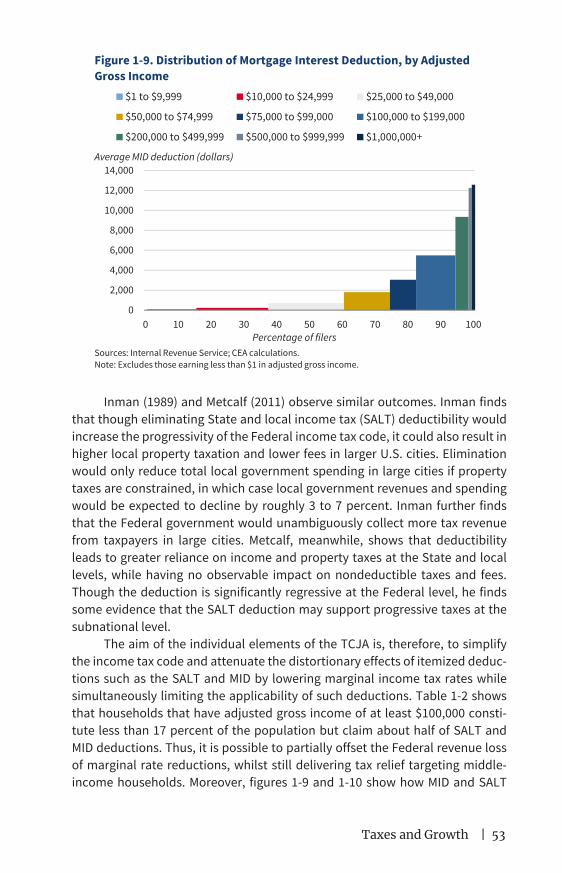
The aim of the individual elements of the TCJA is, therefore, to simplify the income tax code and attenuate the distortionary effects of itemized deduc-tions such as the SALT and MID by lowering marginal income tax rates while simultaneously limiting the applicability of such deductions. Table 1-2 shows that households that have adjusted gross income of at least $100,000 consti-tute less than 17 percent of the population but claim about half of SALT and MID deductions. Thus, it is possible to partially offset the Federal revenue loss of marginal rate reductions, whilst still delivering tax relief targeting middle-income households. Moreover, figures 1-9 and 1-10 show how MID and SALT
0
2,000
4,000
6,000
8,000
10,000
12,000
14,000
0 10 20 30 40 50 60 70 80 90 100
$1 to $9,999 $10,000 to $24,999 $25,000 to $49,000
$50,000 to $74,999 $75,000 to $99,000 $100,000 to $199,000
$200,000 to $499,999 $500,000 to $999,999 $1,000,000+
Figure 1-9. Distribution of Mortgage Interest Deduction, by Adjusted Gross Income
Average MID deduction (dollars)
Sources: Internal Revenue Service; CEA calculations.Note: Excludes those earning less than $1 in adjusted gross income.
Percentage of filers

54 | Chapter 1
deductions are concentrated at the upper end of the income distribution—higher income households disproportionately take advantage of such deduc-tions. Accordingly, the nonpartisan Joint Committee on Taxation (2017a)—the official scorer of legislative bills—finds that by 2025, before the scheduled expiration of the individual elements of the TCJA, households earning between $40,000 and $100,000 will enjoy a net reduction in their total Federal tax liabil-ity of between 2 and 5 percent. Meanwhile, the share of Federal taxes paid by households earning more than $1,000,000 is estimated to increase slightly, from 19.1 to 19.5 percent. The persistence of this middle-class income tax relief will then depend on whether Congressional representatives elect to extend the reforms enacted under the TCJA or allow them to expire.
Evidence on Taxes and GrowthA fundamental challenge to estimating the effects of changes in income tax rates on economic growth is that the timing of the tax changes are not ran-dom. Historically, legislators have tended to lower tax rates during periods of economic contraction and raise taxes during periods of expansion. This high correlation of tax changes with economic conditions can negatively bias esti-mates of the effect of tax rate reductions on investment and output. Estimated effects of tax changes may also be biased by the correlation of those changes with unobserved factors.
0
50,000
100,000
150,000
200,000
250,000
300,000
0 10 20 30 40 50 60 70 80 90 100
$1 to $9,999 $10,000 to $24,999 $25,000 to $49,000
$50,000 to $74,999 $75,000 to $99,000 $100,000 to $199,000
$200,000 to $499,999 $500,000 to $999,999 $1,000,000+
Figure 1-10. Distribution of State and Local Tax Deduction, by Adjusted Gross Income
Average SALT deduction (dollars)
Sources: Internal Revenue Service; CEA calculations.Note: Excludes those earning less than $1 in adjusted gross income.
Percentage of filers

Taxes and Growth | 55
Recent empirical studies have employed two techniques to address these challenges. One is the approach called structural vector autoregression, following Blanchard and Perotti (2002), in which the identification of causal effects relies on institutional information about tax and transfer systems and the timing of tax collections to construct automatic fiscal policy responses to economic activity. In their original study, Blanchard and Perotti (2002) find an initial tax multiplier of 0.7 on impact, with a peak impact of 1.33 after seven quarters. In contrast, using sign restrictions to identify tax shocks, Mountford and Uhlig (2009) find a peak-to-impact multiplier that is substantially larger.
A second technique, originating with Romer and Romer (2010), uses narrative history from Presidential speeches and Congressional reports to identify exogenous tax changes with political or philosophical, as opposed to economic, motivations. These changes are unlikely to be correlated with other factors affecting output. Tax changes unrelated to the business cycle can be used as a quasi-natural experiment to estimate the effect on economic output; this matters because if tax cuts are a response to deteriorating economic con-ditions, the data will show a spurious negative correlation between taxes and growth. Romer and Romer estimate that a 1-percentage-point increase in the total tax share of GDP decreases GDP by 1 percent in the first year and up to 3 percent by the third year. They further find that a 1-percentage-point increase in the total tax share of GDP decreases investment by 1.5 percent in the first year and up to 11.2 percent by the third year.
Using Romer and Romer’s (2010) series as an external instrument for changes in average individual marginal tax rates, Barro and Redlick (2011) simi-larly find that a permanent 1-percentage-point reduction in the average mar-ginal tax rate raises real GDP per capita by 0.5 percent in the subsequent year, corresponding to a conventional tax multiplier of 1.1. Applying the narrative approach to U.K. data, Cloyne (2013) finds that a 1-percentage-point reduction in the total tax share of GDP increases GDP by 0.6 percent on impact and by 2.5 percent over three years, and raises investment by 1.2 percent immediately and by 4.6 percent by the third year. Hayo and Uhl (2014), using German output data, estimate a maximum response to a 1-percentage-point drop in total tax liability (as a percentage of GDP) of 2.4 percent. Applying a similar approach to fiscal consolidations (tax revenue increases) across the OECD countries, Leigh, Pescatori, and Guajardo (2011) find that a tax-based fiscal consolidation of 1 percentage point of GDP reduces GDP by 1.29 percent.
Mertens and Ravn (2013) develop a hybrid approach that combines both methods. Because narratively identified shocks may be prone to measurement error, and identification in a structural vector autoregression framework can require questionable parameter restrictions, Mertens and Ravn develop an estimation strategy that utilizes Romer and Romer’s (2010) narrative tax shock series as an external instrument to identify structural tax shocks, avoiding the need to impose parameter restrictions. Utilizing this hybrid approach to

56 | Chapter 1
analyze U.S. data, they estimate that a 1-percentage-point cut in the average corporate income tax rate raises real GDP per capita by 0.4 percent in the first quarter and by 0.6 percent after a full year, with the effect persisting through 20 quarters. Mertens and Ravn additionally estimate that a 1-percentage-point cut in the average corporate income tax rate generates an increase in nonresi-dential investment of 0.5 percent on impact, with a peak increase of 2.3 percent after six quarters. Also employing a hybrid approach, Mertens and Montiel-Olea (2017) find that in the first two years following a tax decrease of 1 percentage point, real GDP is expected to be higher by about 1 percentage point.
On the individual side, meanwhile, Mertens and Ravn estimate that a 1-percentage-point cut in the average personal income tax rate raises real GDP per capita by 1.4 percent on impact and by a peak of 1.8 percent after three quarters. Though they find that a 1-percentage-point reduction in the aver-age personal income tax rate has a negligible impact on inflation, short-term nominal interest rates, and government debt, they do find significant positive effects on employment, hours worked, consumption, and durable goods pur-chases and nonresidential fixed investment. In particular, they observe that a 1-percentage-point decrease in the average personal income tax rate results in a peak employment response of 0.8 percent after 5 quarters, and peak durable goods and nonresidential investment effects of 5 and 4 percent, respectively, beyond one year.
Though the estimated coefficients found in these studies are not directly comparable, the signs, sizes, and statistical significance of the estimates—combined with their replication across time and geography—provide strong evidence of a positive effect of tax cuts on economic growth. Although some of this literature relies on changes in overall tax liabilities, the most recent research allows us to specifically simulate the impact of corporate tax changes. Moreover, dynamic stochastic general equilibrium models of newer vintage—for example, research by Lizarazo Ruiz, Peralta-Alva, and Puy (2017)—are now generating growth effects from changes in income tax rates that are in the range of the findings of Mertens and Ravn (2013) and Barro and Redlick (2011), which suggests an increasing convergence of estimates derived under alterna-tive modeling frameworks. This development is important, because some crit-ics of the macroeconometric literature have asserted that the results are too large to be theoretically plausible.
Moreover, recent academic research suggests that labor supply effects among older workers may be contributing to observed growth effects of reduc-tions in marginal individual income tax rates. Keane and Rogerson (2012, 2015) observe that the effect of work experience and on-the-job training on the net present value of lifetime earnings will vary with worker age. Because the net present value of additional human capital acquisition on the job is quite large for younger and relatively less experienced workers, labor supply responses to marginal income tax rates are low among these workers. In contrast, labor

Taxes and Growth | 57
supply responses to marginal income tax rates are much higher among older, more experienced workers, which implies potentially significant effects on productivity.
Effects on the Cost of CapitalA primary mechanism through which changes in corporate tax rates and depreciation allowances affect business investment is their effect on the user cost of a capital investment—which can be thought of as the rental price of capital, and is the minimum return required to cover taxes, depreciation, and the opportunity costs of investing in capital accumulation versus financial alternatives. A decrease in the user cost increases the desired capital stock, and thereby induces gross investment.
By increasing the after-tax return on capital assets, a decrease in the tax rate on corporate profits decreases the before-tax rate of return required for the marginal product of new physical assets to exceed the cost of producing and using these assets, increasing firms’ desired capital stock. Conversely, by decreasing the after-tax return on physical assets, a decrease in the net present value of tax deductions for investment expenses increases the before-tax rate of return required.
Several factors may tend to bias empirical estimates of the user-cost elasticity of investment, and early studies (e.g., Eisner and Nadiri 1968) tended to find estimates that were considerably smaller than the benchmark unit elasticity of demand for capital of Jorgenson (1963) and Hall and Jorgenson (1967). First, a reliance on aggregate data potentially biases elasticity esti-mates downward, due to simultaneity between the user cost of capital and investment shocks. Second, aggregate data suffer from limited variation and unobserved firm heterogeneity, as demonstrated by Goolsbee (1998, 2004). Second, as Goolsbee (2000) and Cummins, Hassett, and Oliner (2006) dem-onstrate, Tobin’s q-based empirical evaluations of neoclassical models will tend to suffer attenuation bias when the fundamentals that drive investment are mismeasured. Third, as noted above, estimates of the effects of changes in corporate taxes on economic output can be biased by the timing of tax reform. Historically, legislators have tended to lower corporate tax rates and raise investment tax incentives during periods of economic contraction, and to raise corporate taxes (and withdraw investment credits and other incentives) during periods of economic expansion. Insofar as investment is correlated with general economic conditions—for instance, in standard accelerator models, in which the change in the growth of output drives investment—estimates of the user-cost elasticity of investment will therefore be biased toward zero. Studies that fully address these biases therefore tend to exploit large tax events that differentially affect various types of firms or asset classes; in these instances, the change in tax “treatment” is plausibly uncorrelated with underlying eco-nomic conditions.

58 | Chapter 1
Exploiting instances of major corporate tax reforms, Cummins and Hassett (1992) estimate user-cost elasticities of investment of roughly –1.1 for equipment and –1.2 for structures. Auerbach and Hassett (1992) and Cummins, Hassett, and Hubbard (1994, 1996) exploit differences in the composition of investment across industries to identify user-cost elasticities, and they find an estimated long-run elasticity of the capital stock of –0.67. Djankov and others (2010) find an elasticity of –0.835 at the mean, based on their own database of corporate income tax rates for 85 countries in 2004.
Using cointegration and plant-level microeconomic data, Caballero, Engel, and Haltiwanger (1995) report estimated long-run user-cost elasticities of investment by Standard Industrial Classification, two-digit industry codes ranging from –0.01 for transportation to –2.0 for textiles and –1.0 on average. These results imply a generally high long-run responsiveness of investment to changes in the user cost of capital. Schaller (2006) also uses cointegration techniques to estimate long-run user-cost elasticity. Assuming that user costs will largely be exogenous in a small, open economy, Schaller estimates a user-cost elasticity of –1.6 from quarterly Canadian aggregate data spanning 1962 through 1999. Using Bundesbank data to specifically estimate user-cost elasticities with respect to the German tax system, and employing generalized-method-of-moment techniques to instrument for potentially endogenous investment decisions, Harhoff and Ramb (2001) find a smaller user-cost elastic-ity of –0.42.
More recently, Dwenger (2014) has used German panel data and a dis-tributed lag model based on research by Chirinko, Fazzari, and Meyer (1999). Dwenger’s baseline estimates are about twice as large as the elasticity of –0.25 estimated by Chirinko and colleagues. However, after properly accounting for the equilibrium relationship in the error correlation model, Dwenger (2014) finds point estimates of the user-cost elasticity of investment to be –0.9; and a two-sided, chi-square test suggests that the elasticity is not statistically differ-ent from the neoclassical benchmark of –1.0.
Approaching the question from a somewhat different angle, Giroud and Rauh (2017) employ Romer and Romer’s (2010) narrative approach to estimate the impact of U.S. State-level corporate taxes on establishment counts, employment, and capital. They find short-run statutory corporate tax elasticities of both employment and establishment counts of about –0.5 (–1.2 over a 10-year horizon), and short-run statutory corporate tax elasticities of capital of –0.24 to –0.25. Exploiting quasi-experimental variation created by the Domestic Production Activities Deduction, which allowed firms to deduct a percentage of their “qualified production activities income” from their taxable income, Ohrn (2017) finds that a 1-percentage-point reduction in the corporate tax rate increases investment by 4.7 percent of installed capital and decreases debt by 5.3 percent of total assets.
Taxes and Growth | 59
There is, therefore, a generally emerging consensus within the academic literature, as summarized by Hassett and Hubbard (2002) and Dwenger (2014), that places the estimated user-cost elasticity of investment at about –1.0, consistent with the neoclassical benchmark. These estimates imply that a tax change that lowers the user cost of capital by 10 percent would raise demand for capital by up to 10 percent. The tax rate or deduction change required to affect a 10 percent reduction in the user cost of capital varies with the values of other relevant user cost parameters, which we discuss below.
As evidence of the need for increased capital investment in the United States, figure 1-11 shows that business equipment investment has weakened substantially since 2014. The figure shows the contribution to GDP growth from each of three business investment categories: equipment, structures, and intel-lectual property. Investment in equipment and structures, and their resulting contribution to real GDP growth, has slowed in recent years and was negative in 2016, as gross investment was less than depreciation, with the result that net investment turned negative. In contrast, growth in intellectual property invest-ment remained positive in 2016. Reductions in the user cost of capital that spur equipment investment could reverse these trends and boost GDP growth.
Effects on Net Capital OutflowsOne component of investment is foreign direct investment (FDI), and numer-ous empirical studies, which are discussed below, have observed that FDI is highly responsive to cross-border differences in tax rates. Furthermore, this responsiveness may have increased in recent years. These predictions are rel-evant to GDP estimates because, for a given level of domestic savings (S), any increase in inward FDI constitutes a decline in net capital outflows (NCO) and a corresponding decline in net exports (NX), in accordance with the national income accounting identity S = I + NX = I + NCO. Intuitively, a decline in the user cost of capital attracts capital inflows (both foreign firms investing more in U.S. capital stock formation and U.S. firms choosing domestic capital stock formation over foreign), leading to an exchange rate appreciation that lowers exports and raises imports, resulting in a decline in net exports. As a capital inflow, however, FDI is an important funding source for increased investment, because I = S – NCO.
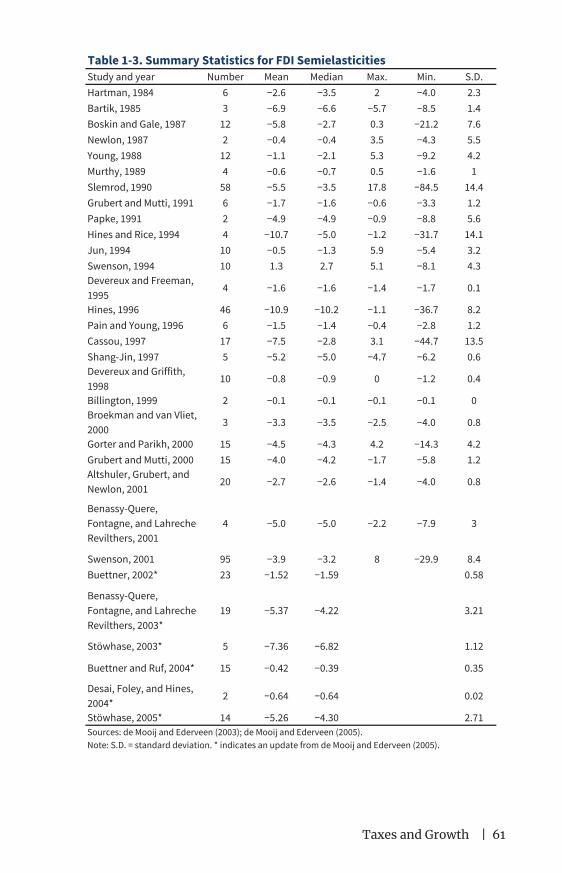
De Mooij and Ederveen (2003, 2005, 2008) provide extensive literature reviews of the impact of tax rates on FDI. As most papers utilize different data and empirical specifications to isolate this impact, these literature reviews transform the coefficients in each study into a uniform semielasticity of FDI with respect to the corporate tax rate. In their 2003 paper, de Mooij and Ederveen average across 351 elasticity estimates, finding a mean elasticity value of –0.7, which corresponds to a mean semielasticity (with respect to a percentage point on the tax rate) of –3.3. In their 2005 paper, they extend the 2003 result by considering alternative classifications of literature and including new studies.

60 | Chapter 1
Instead of averaging across all studies, they estimate average semielasticities by study type: time series, cross-sectional, discrete choice, and panel. They find an average semielasticity of –2.61 across time series studies, –7.16 across cross-sectional studies, –3.43 across discrete choice models, and –2.73 across panel data studies. Across all 427 estimates, they find an average semielasticity of –3.72. In their most recent paper (de Mooij and Ederveen 2008), they predict semielasticities based on study characteristics. For studies that use financial data such as FDI or property, plant, and equipment, they predict an effective marginal tax rate semielasticity of –4.0, an effective average tax rate semielas-ticity of –5.9, and a country statutory tax rate semielasticity of –2.4. For count data, such as the number of new plants and/or plant expansions, they find an effective marginal tax rate semielasticity of –1.3, an effective average tax rate semielasticity of –3.2, and a country statutory tax rate semielasticity of 0.3. Summarizing their work, table 1-3 contains semielasticities based on the coef-ficients within the described studies.
In the first study on taxation and FDI, Hartman (1984) examined aggre-gate inflows into the U.S. between 1965 and 1979 as a ratio of gross national product, leading to a mean elasticity of –2.6, as calculated by de Mooij and Ederveen (2003). Several papers then extend Hartman’s analysis by using a longer time series and slightly adapting Hartman’s model (Boskin and Gale 1987; Young 1988; Murthy 1989), suggesting mean semielasticities of –5.8, –1.1, and –0.6 (de Mooij and Ederveen 2003). Newlon (1987) criticized the data on
-0.80
-0.40
0.00
0.40
0.80
1.20
2010 2011 2012 2013 2014 2015 2016
Intellectual property Equipment
Structures Business fixed investment (net)
Figure 1-11. Contribution of Business Investment to Real GDP Growth, 2010–16
Percentage points (annual rate)
Source: Bureau of Economic Analysis (2017), private fixed investment by type.Note: Business fixed investment contribution shows the net contribution of private nonresidential structures, equipment, and intellectual property spending to real GDP growth.
Taxes and Growth | 61
Study and year Number Mean Median Max. Min. S.D.Hartman, 1984 6 −2.6 −3.5 2 −4.0 2.3Bartik, 1985 3 −6.9 −6.6 −5.7 −8.5 1.4Boskin and Gale, 1987 12 −5.8 −2.7 0.3 −21.2 7.6Newlon, 1987 2 −0.4 −0.4 3.5 −4.3 5.5Young, 1988 12 −1.1 −2.1 5.3 −9.2 4.2Murthy, 1989 4 −0.6 −0.7 0.5 −1.6 1Slemrod, 1990 58 −5.5 −3.5 17.8 −84.5 14.4Grubert and Mutti, 1991 6 −1.7 −1.6 −0.6 −3.3 1.2Papke, 1991 2 −4.9 −4.9 −0.9 −8.8 5.6Hines and Rice, 1994 4 −10.7 −5.0 −1.2 −31.7 14.1Jun, 1994 10 −0.5 −1.3 5.9 −5.4 3.2Swenson, 1994 10 1.3 2.7 5.1 −8.1 4.3Devereux and Freeman, 1995
4 −1.6 −1.6 −1.4 −1.7 0.1
Hines, 1996 46 −10.9 −10.2 −1.1 −36.7 8.2Pain and Young, 1996 6 −1.5 −1.4 −0.4 −2.8 1.2Cassou, 1997 17 −7.5 −2.8 3.1 −44.7 13.5Shang-Jin, 1997 5 −5.2 −5.0 −4.7 −6.2 0.6Devereux and Griffith, 1998
10 −0.8 −0.9 0 −1.2 0.4
Billington, 1999 2 −0.1 −0.1 −0.1 −0.1 0Broekman and van Vliet, 2000
3 −3.3 −3.5 −2.5 −4.0 0.8
Gorter and Parikh, 2000 15 −4.5 −4.3 4.2 −14.3 4.2Grubert and Mutti, 2000 15 −4.0 −4.2 −1.7 −5.8 1.2Altshuler, Grubert, and Newlon, 2001
20 −2.7 −2.6 −1.4 −4.0 0.8
Benassy-Quere, Fontagne, and Lahreche-Revilthers, 2001
4 −5.0 −5.0 −2.2 −7.9 3
Swenson, 2001 95 −3.9 −3.2 8 −29.9 8.4Buettner, 2002* 23 −1.52 −1.59 0.58
Benassy-Quere, Fontagne, and Lahreche-Revilthers, 2003*
19 −5.37 −4.22 3.21
Stöwhase, 2003* 5 −7.36 −6.82 1.12
Buettner and Ruf, 2004* 15 −0.42 −0.39 0.35
Desai, Foley, and Hines, 2004*
2 −0.64 −0.64 0.02
Stöwhase, 2005* 14 −5.26 −4.30 2.71
Table 1-3. Summary Statistics for FDI Semielasticities
Sources: de Mooij and Ederveen (2003); de Mooij and Ederveen (2005).Note: S.D. = standard deviation. * indicates an update from de Mooij and Ederveen (2005).
62 | Chapter 1
the rate of return for FDI used by Hartman and similar studies and highlighted spurious correlation in the data, but found a similar semielasticity of –0.4 (de Mooij and Ederveen 2003). Slemrod (1990) also criticized Hartman’s use of FDI flows, raising concerns about using aggregate FDI flows to analyze the rela-tionship between FDI and tax rates. Auerbach and Hassett (1992) then showed that different components of FDI respond differently to tax rates, with mergers and acquisitions constituting a particularly responsive form of FDI, moving researchers to use data on property, plant, and equipment (PPE).
Grubert and Mutti (1991) analyzed the distribution of plant and equip-ment in manufacturing affiliates in 33 countries, leading to a mean semielas-ticity of investment of –1.7 with respect to foreign effective tax rates (de Mooij and Ederveen 2003). Hines and Rice (1994) consider the distribution of PPE in all affiliates in 73 countries, and they estimate a much larger semielasticity of PPE ownership with respect to tax rates of –10.7, though the mean significant semielasticity is –5.0 (de Mooij and Ederveen 2003; they estimate the mean sig-nificant semielasticities in their earlier working paper, De Mooij and Ederveen 2001). Altshuler, Grubert, and Newlon (2001) similarly compared the tax sen-sitivity of PPE and inventories in 58 countries between 1984 and 1992, finding that the elasticity of both to changes in after-tax returns increased between 1984 and 1992, leading to an estimated average semielasticity of –2.7 across both years (de Mooij and Ederveen 2003).
Another set of studies analyzes the impact of a host country’s tax rates on firms’ location choices using discrete choice models. For example, Bartik (1985) estimates the probability that a multinational chooses a given U.S. State for the location of new plants as a function of State statutory corporate income tax rates. De Mooij and Ederveen (2003) estimate that Bartik’s mean semielasticity is –6.9. Using the same concept, Papke (1991) also finds a negative relationship between U.S. States’ corporate income tax rates and location decisions, with a mean semielasticity of –4.9 (de Mooij and Ederveen 2003). Devereux and Griffith (1998) expand the discrete choice model outside the United States, by looking at U.S. firms’ decisions to locate in France, Germany, and the United Kingdom. De Mooij and Ederveen (2003) show that Devereux and Griffith’s logit model implies an average semielasticity of –0.8. Buettner; and Ruf (2004) and Stöwhase (2003) look at the location choices of German multinationals in the European Union’s member countries. Buettner and Ruf find mixed results, while Stöwhase find that firms respond to effective tax rates but not statutory tax rates. The average semielasticity from Buettner and Ruf is –0.42, compared with –7.36 from Stöwhase (de Mooij and Ederveen 2005).
Since de Mooij and Ederveen’s (2008) meta-analysis, several notable studies have been published. Using a novel data set on corporate tax rates across 85 countries in 2004, Djankov and others (2010) find large effects of corporate tax rates on FDI where raising the effective tax rate by 10 percentage points reduces FDI by 2.3 percentage points after one year. Looking at affiliates
Taxes and Growth | 63
in low-tax jurisdictions, Dischinger and Riedel (2011) find a significant inverse relationship between the average tax differential to other group affiliates and a subsidiary’s intangible (intellectual) property investment, with estimates sug-gesting a semielasticity of about –1.1. Karkinsky and Riedel (2012), meanwhile, examine whether patent applications are more likely to be made by lower-tax affiliates, and find a semielasticity evaluated at the sample mean of –2.3, mean-ing that a 1-percentage-point increase in the corporate tax rate differential reduces the number of patent applications by 2.3 percent.
The estimated tax elasticities and semielasticities of cross-border invest-ment and of profit shifting (the latter are discussed below) are relevant to an analysis of the effects of changes in the user cost of capital on investment—not only because they have a direct bearing on investment financing but also because they help explain weak investment and the absence of capital deep-ening in the U.S. before the TCJA. Elasticities from this literature suggest that reducing the U.S. corporate tax rate will have two effects. First, U.S. net capital outflows (NCO) would decline. This is both because foreign firms would invest more in U.S. capital and because U.S. firms would invest less in capital abroad. Second, U.S. firms would be less incentivized to shift their profits abroad, as discussed below. The former effect will tend to result in a dollar apprecia-tion, which will reduce net exports (NX). The latter effect will tend to raise net exports. Provisions of the Tax Cut and Jobs Act to reduce the abuses of a ter-ritorial tax system would be critical to the realization of these gains.
Effects on Profit ShiftingAn additional margin along which changes in corporate tax rates are likely to affect growth is through profit shifting by U.S. firms to their foreign subsidiaries or by U.S. subsidiaries to their foreign parents, typically by mispricing sales of goods, services, and intangible capital between affiliates in high- and low-tax jurisdictions. (Profit shifting, otherwise referred to as base erosion and profit shifting, refers to tax avoidance strategies that exploit gaps and mismatches in tax rules to artificially shift profits to low- or no-tax locations. This is different from the legitimate earning of profits abroad from investment.) Guvenen and others (2017) focus their analysis on U.S. multinational enterprises, and argue that profit shifting by these enterprises leads to some economic activity being credited to their foreign affiliates, resulting in an understatement of U.S. GDP. This profit shifting has increased substantially since the 1990s. The authors correct for this mismeasurement by “reweighting” the amount of consolidated firm profits that should be attributed to the United States by apportioning profits according to the locations of labor compensation and sales to unaffili-ated parties.
Applying these new weights to all U.S. multinational firms and aggregat-ing to the national level, the authors calculate that in 2012, about $280 billion in so-called foreign profits could be reattributed to the United States. Given
64 | Chapter 1
that the trade deficit was equal to about $540 billion, this reattribution would have reduced the trade deficit by over half in that year. Extrapolating the 2012 findings to subsequent years, the CEA estimates that transfer pricing continued to account for at least half the trade deficit between 2013 and 2016.
Crucially, firms’ propensity to engage in profit shifting is highly respon-sive to tax rate differentials. Hines and Rice (1994), using aggregate country-level data from the Bureau of Economic Analysis, estimate a tax semielasticity of profit shifting of –2.25, indicating that a 1-percentage-point decrease in a country’s corporate tax rate is associated with an increase of 2.25 percent in reported corporate income.
As discussed in a recent white paper on this topic, “Corporate Tax Reform and Wages: Theory and Evidence” (CEA 2017), the tendency of U.S. firms to hold corporate profits overseas reduces the wages of U.S. workers. Engaging in profit shifting is highly responsive to tax rate differentials, as discussed above, and corporate rate reductions are therefore likely to affect the share of profits that is repatriated. Under the assumption that U.S. workers would retain 30 percent of the 2016 profits of U.S. firms that were earned abroad and not currently repatriated, U.S. households could earn a raise of up to 1 percent, depending on the share of profits that was repatriated. (For an example of workers capturing 29 percent of firm operating surplus, see Kline et al. 2017.) The trajectory of foreign profits indicates that the value of these profit shifts for U.S. workers would increase in the future. Household income boosts from this channel may be additive to the estimated $4,000 in household income discussed above, because the empirical literature is largely based on countries and time periods with less foreign profit activity, and less existing capital parked overseas as taxes changed.
In general, profits earned abroad show the willingness of U.S. firms to invest in production and business operations overseas, at the expense of domestic investment. Reductions in the corporate tax rate create an opportu-nity for U.S. firms to instead increase their domestic investment. Furthermore, these multinationals are among the class of high-paying employers in the United States. The rent-sharing literature discussed above implies that incen-tivizing these high-paying firms to locate more of their operations in the U.S. is again constructive for U.S. wage growth.
Effects of Crowding OutDecades of research suggest that the long-term benefits of tax reform may be attenuated by the revenue changes in the Federal budget. Decreases in tax revenues that enlarge the government deficit and thus raise public borrowing may crowd out private sector investment, which reduces long-term economic activity. In the literature, crowding out occurs in both real and financial ways (Blinder and Solow 1973). There is real crowding out when increased public investment displaces private capital formation. This direct crowding out occurs
Taxes and Growth | 65
through public consumption and investment (Buiter 1990). Conversely, finan-cial crowding out influences private behavior by altering budget constraints or by affecting prices through interest rates. Increased interest rates, a result of the Federal Reserve’s bond-financing of fiscal deficits, can lead to the partial loss of private capital formation.
The effect of increasing public spending or lowering taxes on future national income is dependent on the return from public investment. Gale and Orszag (2004) examine three models of how fiscal policy affects the economy. The Ricardian equivalence theorem holds that government deficits will be off-set by private saving through the purchase of public bonds, so that there are no resulting changes in interest rates or capital flows. The small, open economy view suggests private savings is less than the deficit, but that capital inflows make up the shortfall. This means that economic growth and interest rates remain stable. The conventional view is that private savings and capital inflows are less than the change in deficit, so that GDP falls and interest rates rise to induce more savings. If this holds, then public debt would be expansionary in the short term and contractionary in the long term. Using reduced-form mod-els, they conclude that increases in the budget deficit by $1 reduces national savings by 50 to 80 cents. This suggests that Ricardian equivalence does not hold.
Gale and Orszag (2004) also compare the small, open economy and con-ventional views by testing whether budget deficits affect interest rates. They find that larger projected budget deficits equivalent to 1 percent of GDP are associated with increases in long-term interest rates of 25 to 35 basis points. Calomiris and Hassett (2002), however, observe little evidence that modest temporary increases in government deficits have a significant effect on interest rates, and further provide evidence that the empirical counterfactual should account for the probability that a substantial portion of additional Federal tax revenue would be spent rather than saved.
Laubach (2009) controls for the business cycle and monetary policy effects on deficits by examining the relationship between the long-term for-ward rate and projected deficits projected by the Congressional Budget Office. He finds that a 1 percent increase in the projected debt-to-GDP ratio raises future interest rates by about 4 to 5 basis points. When the deficit increased by the same measure, interest rates increased by 25 basis points. Engen and Hubbard (2005) also find that when government’s debt increased by the equiv-alent of 1 percent of GDP, interest rates rose by 2 to 3 basis points. They find that these results are sensitive to model specification. When the dependent variable is the change in the forward rate rather than the interest rate level, the result is statistically insignificant. Results from several economic studies suggest that a deficit increase over the long term would result in higher interest rates. Some researchers consider these results evidence that the conventional view is a more accurate model than a small, open economy view.
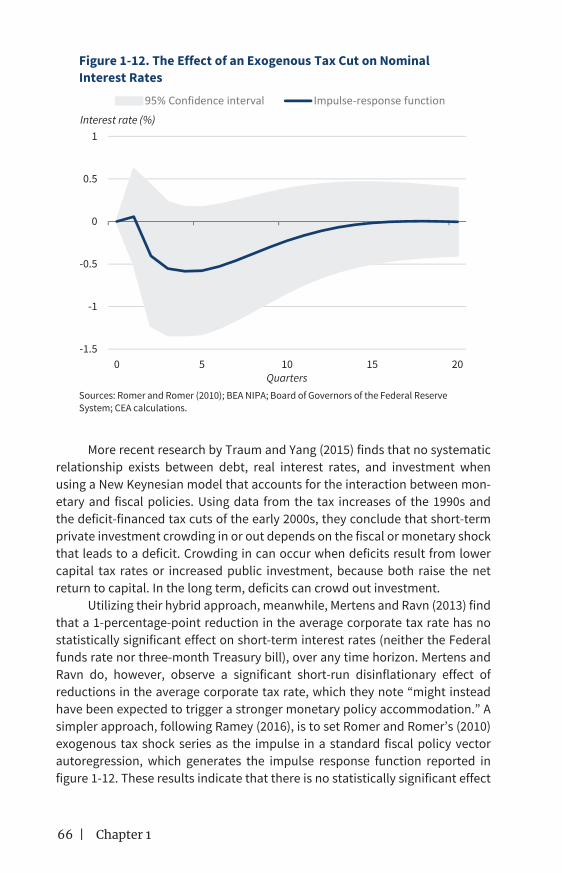
66 | Chapter 1
More recent research by Traum and Yang (2015) finds that no systematic relationship exists between debt, real interest rates, and investment when using a New Keynesian model that accounts for the interaction between mon-etary and fiscal policies. Using data from the tax increases of the 1990s and the deficit-financed tax cuts of the early 2000s, they conclude that short-term private investment crowding in or out depends on the fiscal or monetary shock that leads to a deficit. Crowding in can occur when deficits result from lower capital tax rates or increased public investment, because both raise the net return to capital. In the long term, deficits can crowd out investment.
Utilizing their hybrid approach, meanwhile, Mertens and Ravn (2013) find that a 1-percentage-point reduction in the average corporate tax rate has no statistically significant effect on short-term interest rates (neither the Federal funds rate nor three-month Treasury bill), over any time horizon. Mertens and Ravn do, however, observe a significant short-run disinflationary effect of reductions in the average corporate tax rate, which they note “might instead have been expected to trigger a stronger monetary policy accommodation.” A simpler approach, following Ramey (2016), is to set Romer and Romer’s (2010) exogenous tax shock series as the impulse in a standard fiscal policy vector autoregression, which generates the impulse response function reported in figure 1-12. These results indicate that there is no statistically significant effect
-1.5
-1
-0.5
0
0.5
1
0 5 10 15 20
95% Confidence interval Impulse‐response function
Figure 1-12. The Effect of an Exogenous Tax Cut on Nominal Interest Rates
Interest rate (%)
Sources: Romer and Romer (2010); BEA NIPA; Board of Governors of the Federal Reserve System; CEA calculations.
Quarters
Taxes and Growth | 67
on short-term nominal interest rates, and possibly even a slight negative effect over the first two years, which is consistent with Romer and Romer (2010), whose results are generally inconsistent with large interest rate effects of tax changes. In contrast, to completely offset our estimated long-run increase in GDP of 2 to 4 percent due to the corporate rate cut to 21 percent and the introduction of full expensing, discussed below, real interest rates would need to rise by between 300 and 400 basis points.
Estimating the Growth Effects of Tax ReformThe particular challenge in translating the Mertens and Ravn (2013) estimates into growth projections is that their estimated coefficients are based on an explanatory variable equal to Federal tax receipts on corporate income relative to corporate profits. Applying these estimates to a reduction in the statutory corporate income tax rate from 35 to 21 percent and the simultaneous intro-duction of full expensing for nonstructure investment requires calculating the effect these changes would have on Federal tax liabilities. As such, it is not valid to simply treat changes in average effective tax rates as changes in the relevant independent variable of Mertens and Ravn’s model. Corporate profits in 2017 and preliminary estimates of the combined 2018 revenue effect (Joint Committee on Taxation 2017b) suggest a roughly 5.7-percentage-point decline in the ratio of Federal corporate tax liabilities to corporate profits in the first year of implementation. Mertens and Ravn’s estimates suggest this could raise GDP per capita by as much as 3.4 percent. Their estimates further suggest that the proposed reduction in the average corporate tax rate would generate an increase in nonresidential investment of about 13 percent.
Alternatively, converting the estimated 2018 revenue effect (Joint Committee on Taxation 2017b) of the 14-percentage-point statutory rate reduction plus full expensing into a change in the total tax liability share of GDP of 0.8 percent, Romer and Romer’s (2010) estimates suggest these two reforms will raise GDP by 0.8 percent in year one, and by 2.4 percent over three years. Romer and Romer’s estimates also imply an increase in investment of about 9 percent by year three.
Approaching the question from a more structural angle, a primary mechanism by which changes in corporate tax rates affect business investment is through their effect on the user cost of capital. As discussed previously, by increasing the after-tax return on capital assets, a decrease in the rate of tax on corporate profits decreases the before-tax rate of return required for the marginal product of new capital assets to exceed the cost of producing and using those assets, thereby increasing firms’ desired capital stock. By raising firms’ desired capital stock relative to current stock, decreases in the user cost of capital thereby require positive net investment to offset depreciation, imply-ing an increase in gross investment.
68 | Chapter 1
The user cost modeling is simple if expensing is permanent, and though the Administration expects Congress to eventually make the provision perma-nent, the TCJA as passed calls for 100 percent bonus depreciation to expire after five years. In a forward-looking, rational expectations model, firms would look ahead to the expiration of the provision and respond less to the tax change because their long-run target capital stock would be lower than for a permanent change in policy.
Accordingly, estimating the impact of an expiring provision necessitates estimating the impact of permanent expensing and the impact of the expir-ing expensing. The correct growth effect would then be between the two, depending on the extent to which firms expect the provision to be renewed in subsequent legislation.
We begin with the effect of permanent expensing. The emerging consen-sus in the academic literature places the user-cost elasticity of investment at –1.0, which implies that a tax change that lowers the user cost of capital by 10 percent would raise demand for capital by 10 percent. Computing the effect on the average user cost of capital of reducing the statutory corporate tax rate to 21 percent and introducing immediate full expensing of nonstructure capital investment depends on the values of the relevant parameters. Calculations of these parameters—following Devereux, Griffith, and Klemm (2002); and Bilicka and Devereux (2012)—yield an estimated decline in the average user cost of capital of about 9 percent, though the percentage change in the user cost var-ies across asset types. Assuming a consensus user-cost elasticity of investment of -1.0, a 9 percent decline in the average user cost of capital would induce a 9 percent increase in the demand for capital. Following Jensen, Mathur, and Kallen (2017), it is then possible to use the Multifactor Productivity Tables from the Bureau of Labor Statistics in a growth accounting framework to increment the Congressional Budget Office’s 10-year GDP growth projections by the addi-tional contribution to output from a larger capital stock, assuming constant capital income shares, until we attain a new steady state.
Based upon user-cost elasticity estimates, our calculations show that a reduction in the statutory Federal corporate tax rate to 21 percent combined with full expensing of capital investment would raise long-run GDP by between 2 and 4 percent. Our estimates indicate a 0.4 percent increase over the base-line forecast by the Congressional Budget Office in year one and a 3.8 percent increase in the long-run steady state if full expensing is made permanent. If full expensing of nonstructure assets expires in year five as legislated, however,
Taxes and Growth | 69
the long-run steady state increase in GDP will be 2.9 percent. The economy will achieve the higher growth path if firms expect the policy to be continued.1
Previous estimates of similar tax reform proposals yielded similar results. A report released by the President’s Advisory Panel on Federal Tax Reform (2005) evaluated a “Growth and Investment Tax Plan” that implemented a business cash flow tax, allowed for the immediate expensing of capital invest-ment, and set a flat corporate tax rate of 30 percent. Analysis of this plan by the U.S. Treasury Department using a variety of alternative models found that these reforms would have generated an increase in the capital stock by 5.6 to 20.4 percent over the long run, raising output by 1.4 to 4.8 percent during the same period.
Financing of the additional investment implied by the reduction in the user cost of capital would depend, as noted above, partly on repatriation of previous profits and decreased profits attributed to foreign subsidiaries, and partly on changes in savings and capital flows. Our preliminary calcula-tions suggest that funding the estimated increase in gross investment could potentially be achieved almost entirely by increased capital inflows by both U.S. and foreign multinational firms. Given that in 2016 private nonresidential fixed investment totaled $2.3 trillion, a 9 percent change would constitute an increase of about $207 billion in investment. The mean estimate of the tax semielasticity of FDI of -3.3 reported in de Mooij and Ederveen (2003), cor-respondingtoauser-costelasticityof2.8(Δlog[I]=αlog[ϰ]=[α/(1–EMTR)] ΔEMTR), suggests that a 14-point reduction in the statutory Federal corporate tax rate along with the introduction of full expensing would raise FDI in the United States by $121 billion and reduce U.S. direct investment abroad by $79 billion, for a combined reduction in net capital outflows of $200 billion. As noted above, increased capital inflows would result in an appreciation of the dollar, thereby reducing net export demand in tandem with the increase in net capital inflows.
Moreover, our calculations also indicate a positive contribution to growth from reduced profit shifting by U.S. firms to foreign affiliates. Applying Hines and Rice’s (1994) estimate of the tax semielasticity of profit reporting to a statutory corporate rate reduction of 14 percentage points suggests that reduced profit shifting could add up to $142 billion to GDP (0.8 percent), based on 2016 numbers. Analyzing the TCJA specifically, private subscriber reports
1 Devereux and Griffith (1998) have argued that marginal analysis like this may be less relevant for high-value, discrete projects that should be more responsive to average tax rates over time. They develop a measure of the effective average tax rate, EATR, and show that capital spending is highly responsive to it. Jensen, Mathur, and Kallen (2017) calculate the impact of moving toward full expensing and dropping the statutory corporate tax rate to 20 percent, finding that the EATR declines by about 11 percentage points. They estimate that, under the assumption that the move to full expensing remains permanent, corporate investment would increase as a result by up to 34 percent in certain asset classes, thereby raising GDP by 4.7 percent over 10 years and by 8.4 percent in the long run.

70 | Chapter 1
from Goldman Sachs and Deutsche Bank estimated in late 2017 that the reduced incentives to shift profits overseas could reduce the U.S. trade deficit by as much as 50 percent on impact, with a permanent level shift. Along with the lower corporate tax rate that would make profit shifting less attractive for many firms, the TCJA has also put in place a number of significant anti-base erosion measures such as the “global intangible low-taxed income” provision that imposes a minimum tax on foreign earnings, and the “base erosion anti-abuse tax.”
On the individual side, Barro (2018), using estimates from Barro and Redlick (2011), finds that the tax bill’s cut to the weighted-average marginal individual income tax rate will expand the economy by 1.6 percent through 2019, corresponding to additional growth of 0.8 percent a year. Barro notes that though the growth effect is temporary, the extra contribution to the level of GDP is permanent. Using the Joint Committee on Taxation’s (2017b) 2018 revenue score and applying Mertens and Montiel-Olea’s (2017), Romer and Romer’s (2010), and Mertens and Ravn’s (2013) estimates to the TCJA, mean-while, suggest that the reductions in individual tax liability will raise GDP by 0.4 to 1.3 percent within three years.
ConclusionWe started this chapter with a look back at the United States’ tax system in a historical and international perspective and the major tax reform achievement of 2017—the enactment of the Tax Cuts and Jobs Act. On the individual side, we demonstrated that the extensive use of itemized deductions in the U.S. income tax code not only generates regressivity at the Federal level but also can distort incentives and reduce Federal income tax revenue. Lowering individual income tax rates while simultaneously raising the standard deduction and limiting the use of distortionary deductions—as the TCJA does—can therefore facilitate tax relief for middle-income households. These changes also provide supply-side benefits to economic growth, while at the same time partially offsetting short- to medium-term negative revenue effects. Specifically, we find that the net individual tax cuts of the TCJA can be expected to raise GDP by up to 1.6 percent by 2020.
On the corporate side, the TCJA is meant to address, in large part, the increasing uncompetitiveness of U.S. corporate income taxation relative to the rest of the world, due to a relatively high statutory rate and worldwide taxa-tion. This, along with the observed high and increasing international mobility of capital in recent years, has deterred U.S. capital formation. An analysis of tax incidence also reveals that labor—as the relatively less mobile factor of production—has borne a disproportionate burden of high corporate taxation.
We have cited a wide range of academic studies demonstrating that reductions in corporate tax liabilities have significant, positive short- and

Taxes and Growth | 71
long-run effects on GDP growth and wages—in particular by lowering the user cost of capital and thereby inducing higher investment in capital formation, financed principally by increased capital inflows. On the basis of these studies, we have calculated that a reduction in the statutory Federal corporate income tax rate from 35 to 21 percent, simultaneously with the introduction of imme-diate full expensing of capital investment, would generate an increase in GDP of between 2 and 4 percent over time. We have also studied the impact of this growth on a typical household, and find that the average household would, conservatively, realize an increase in wage and salary income of $4,000.
In addition, estimated user-cost elasticities of foreign direct investment suggest that the corporate tax changes of the TCJA will not only mitigate the migration of U.S. investment capital abroad but also will serve to attract inward capital investment by foreign companies, including overseas affiliates of U.S. companies that are currently holding an estimated $2.6 trillion in unrepatri-ated profits. Increased international tax competitiveness will also contribute to the net export component of GDP—by as much as 50 percent—by attenuating corporate profit shifting through transfer pricing, and thereby partly offset the effects of increased capital inflows on exchange rates.