Embed Size (px)
Citation preview
Taxes and Development in the Philippines Towards enhancing domestic resource mobilization for development
By IBON Foundation 09 September 21
Abstract
This paper provides a brief overview of tax reforms in the Philippines over the last two decades. It shows that tax reforms initiated by the government after the Martial Law years resulted in an improvement in tax effort. But neoliberal restructuring in the 1990s eventually undermined these gains by dramatically lowering tax collection from import tariffs and customs duties, and providing overly generous fiscal incentives to foreign investors and other rent‐seeking groups within the local business community. Recent reforms introduced to avert another fiscal crisis has resulted in a slight improvement in tax effort but has worsened the regressivity of the tax burden. These gains are also proving to be unsustainable due to a decline in collection efficiency, reduction in corporate income tax rates and higher personal exemptions. The paper argues against the introduction of new regressive tax measures or further spending cutbacks in response to another looming fiscal crisis. Rather, the paper draws attention to major leakages in the public treasury that need to be plugged urgently: 1. debt servicing which is equivalent to as much as 60 percent of the
national government's annual tax collection; 2. tax evasion which is around one‐third of the potential tax take from
individual, corporate and Value‐Added Tax; 3. Smuggling which costs the government upwards of 2% of GDP per year
in lost tax revenue; and 4. Redundant fiscal incentives worth approximately 1% of GDP or close to
half of the financing gap for the attainment of the millennium development goals (MDG)
The paper also argues that tax reforms in the Philippines cannot work unless they form part of a more comprehensive public sector reform program. Fiscal policy must move away from prioritizing debt servicing and competing for foreign investment to active state promotion of the people's well‐being above all. The paper concludes with policy recommendations for enhancing domestic resource mobilization for development in the Philippines.
Introduction Developing countries, almost by definition, have scarce domestic resources hence rely significantly on external sources for financing development. However, relying on external financing is fraught with dangers for developing countries. Foreign investors and creditors are motivated by profit; foreign aid is wedded to the commercial and geopolitical interests of donor countries; and export
earnings may be shallow and volatile. Hence, it has become increasingly evident that developing countries cannot rely principally on external sources to finance national or social goals (Culpeper and Bhushan 2008). For self‐reliant development, domestic resource moblization is the key. The state has a central role to play in creating the conditions for sustained development not just through the provision of infrastructure and basic services but by establishing entitlements that allow all citizens, especially the poor, to develop their capabilities. The state, therefore, must be able to raise revenues and spend these in ways that promote the people's well‐being. But developing country governments face numerous problems in raising revenues to finance development. Widespread poverty and low productivity means having a low tax base in absolute terms. Developing countries, moreover, typically have large shadow economies beyond the reach of formal regulatory institutions and tax authorities. Tax administrations are often weak and hardpressed to prevent tax evasion and tax avoidance. Many developing countries are unduly dependent on commodity exports and participation in the global supply chain of transnational corporations (TNCs) which systematically misprice trade transactions in order to reduce tax payments (SOMO 2008). These conditions are made worse under neoliberal globalization. Trade liberalization has meant lower collections from trade taxes and duties which, for many developing countries, make up a significant portion of total government revenues (Koshy 2006). Competition for foreign investments has also led to the lowering of tax rates and raising fiscal incentives for foreign capital (Tax Justice Network 2007). Financial liberalization has made developing countries more prone to capital flight (Epstein 2005) while conditionalities attached by International Financial Institutions (IFIs) to their loan packages prioritize sustainable debt servicing over sustainable development. All these diminish the capacity of developing country governments to finance domestic development and engenders greater reliance on external funds. This is amply demonstrated by the Philippine experience. The country is overly dependent on financing from abroad to augment low domestic capital accumulation and obtain foreign exchange needed to pay for current expenditure. But the country ends up borrowing more to pay for older debts in a vicious cycle of debt and deficits that perennially sparks a fiscal crisis. The government relies on a small tax and revenue base because the economy is basically stunted. It relies heavily on regressive consumption and indirect taxation that unfairly burdens low and middle income families. On the other hand, the government preserves tax breaks and subsidies for special interests and foreign capital. Large corporations and high‐income individuals are easily able to exploit loopholes in tax policy and take advantage of weaknesses in tax administration. Poor tax and revenue generation is exacerbated by trade liberalization, rampant smuggling and systemic corruption. The net result is that the masses suffer underdevelopment at the same time that they are made to pay for the continuation of this deplorable condition. II. Tax Effort Tax effort has always been dismally low in the Philippines. It had been practically flat at around 11.1 percent in the first half of the 1980s. After the overthrow of the Marcos dictatorship, the Aquino government implemented a tax reform program in 1986. Some 29 tax measures were introduced including:
• the introduction of a 10% Value‐Added Tax (VAT) in place of various sales taxes; • an additional 20% VAT imposed on luxury goods; • a unified tax schedule for compensation and professional income; • personal exemptions were increased to spare those below the poverty line; • the dual rate of 25 and 35 percent tax on corporate income was replaced by a uniform rate
of 35 percent; • new taxes on franchisees
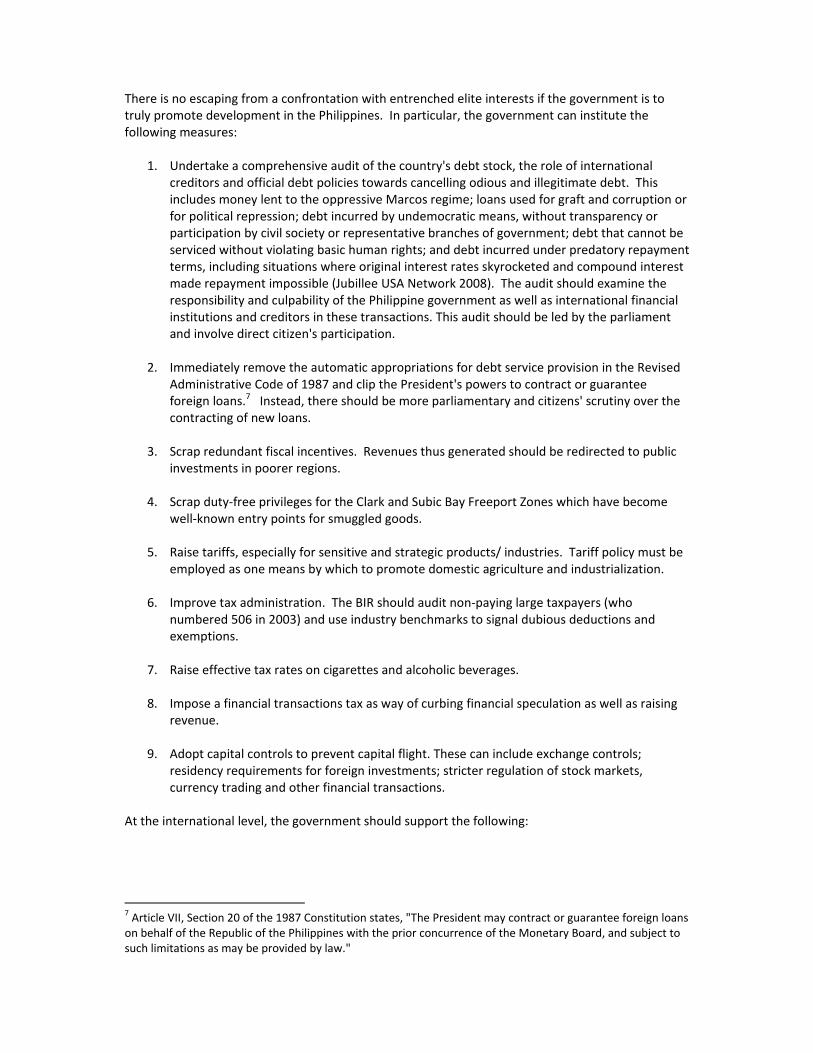
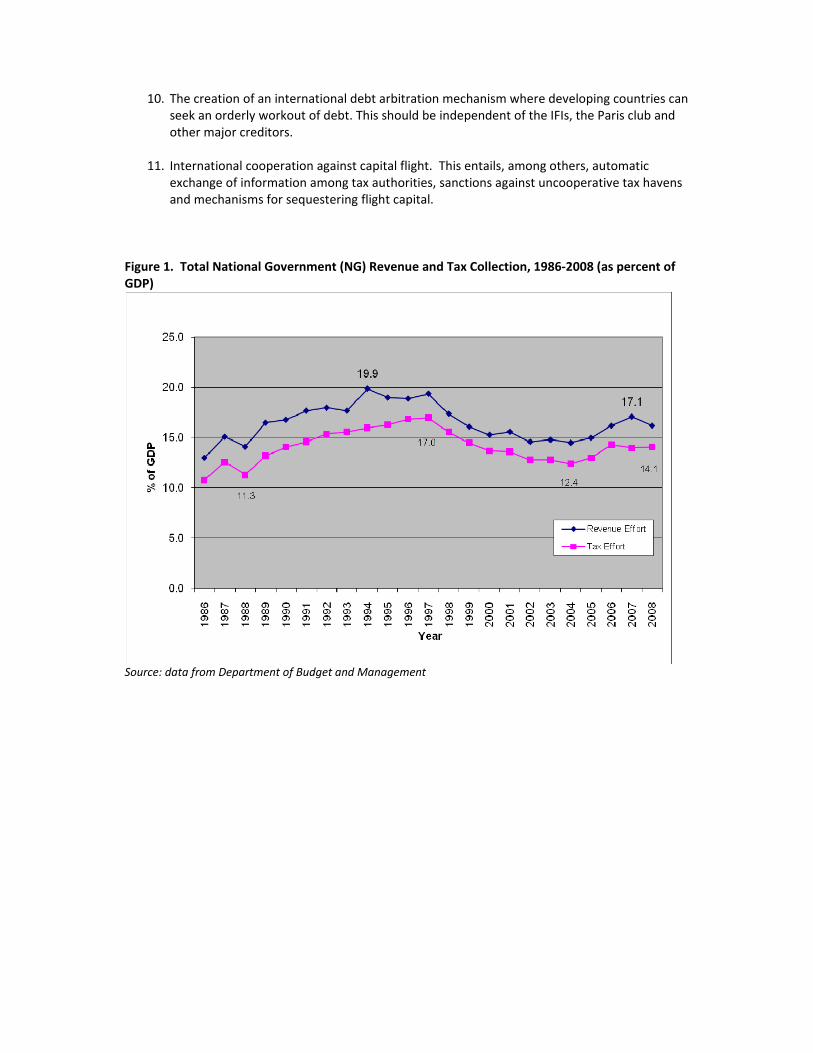
Figure 1. Total National Government (NG) Revenue and Tax Collection, 1986‐2008 (as percent of GDP) As a result, tax effort rose steadily from 11.3 percent in 1988 to a peak of 17 percent in 1997. More income taxes could have been collected and fairness enhanced if the proposed ceilings on allowable business deductions were not ignored due to the strong lobbying of various professional and business groups (Diokno 2005). Nevertheless, the improved tax effort combined with one‐off privatization revenues and restrained public spending managed to yield a budget surplus for the government from 1994‐97. But the aggressive neoliberal restructuring of the Philippine economy during the 1990s eventually undermined tax effort as well. First, the government's trade liberalization program slashed weighted average nominal tariffs from 28 percent in 1991 to 20 percent in 1995, to 13.4 percent in 19971 (Tariff Commission n.d.). So imports climbed steeply in the 1990s but import duties and taxes dropped from over 5 percent of GDP during the first half of the 1990s to under 3 percent from 1998 onwards. Figure 2. NG Tax Effort by Source, 1986‐2008 (as percent of GDP) Second, Congress passed 38 new tax measures from 1992 to 1998, about two‐thirds of which had the effect of giving away incentives or raising tax exemptions (Diokno 2005). Most of these measures were enacted for the purpose of encouraging foreign investments and export manufacturing including:
• tax and duty free importation in the former US bases (Republic Act 7227 of 1992) • tax and Duty Exemption and Tax Credit on Capital Equipment (RA 7396 of 1992) • tax incentives for firms using dual training system (RA 7686 of 1994) • tax credits for exporters (RA 7844 of 1994) • preferential tax treatment for special economic zones (RA 7916 of 1995) • deregulation of the downstream oil industry which included tax credit and tax holidays (RA
8479 of 1998) Third, the government's Comprehensive Tax Reform Program (CTRP) initiated in 1997 included measures that further eroded the tax base. Among other provisions, the CTRP introduced additional exemptions for VAT coverage, reduced the corporate income tax (CIT) rate from 35 to 32 percent, and lowered effective tax rates for three major types of commodities: alcohol products, cigarettes, and petroleum products by shifting from ad valorem to specific taxes. The law provided for inflation‐indexing of the specific taxes on alcohol and cigarettes but this provision has never been implemented due to the political influence of the affected businesses (ibid.).
1 This corresponded to Phase 3 and 4 of the Philippine government’s Tariff Reform Program.
So while the increase in tax collection from domestic goods and services offset the decline in import taxes up to 1997, the tax reforms of the mid‐1990s and especially the CTRP of 1997 eroded the tax base, pulling down tax effort from its peak of 17 percent in 1997 to 12.4 percent in 2004. Faced with a fullblown fiscal crisis, the government passed three new laws in 2004‐2005 for the purpose of fiscal consolidation (Manasan 2008):
• RA 9334 which provides for discrete increases in the tax rate on cigarettes (15–80%) and alcoholic products (22%) beginning 2005 and every other year thereafter until 2011;
• RA 9335 (or the Lateral Attrition Law) which provides for the creation of a reward and incentives fund at the BIR and Bureau of Customs (BOC) equal to at least 15 percent of the difference between their actual collection and revenue targets. The proceeds are to be apportioned to the various units, officials, and employees relative to their contribution to the “excess” collection. The law also provides that officials and employees of these bureaus may be removed from the service if their revenue collection performance falls short of the target by at least 7.5 percent.
• RA 9337 (Reformed VAT law) which expands the coverage of the VAT to include previously exempt services and commodities such as electricity and petroleum products at a time of skyrocketing oil prices. It also limits the input VAT credit to 70 percent of the output VAT and increased the VAT rate by from 10 to 12 percent in January 2006. It also temporarily raised the corporate income tax rate to 35.
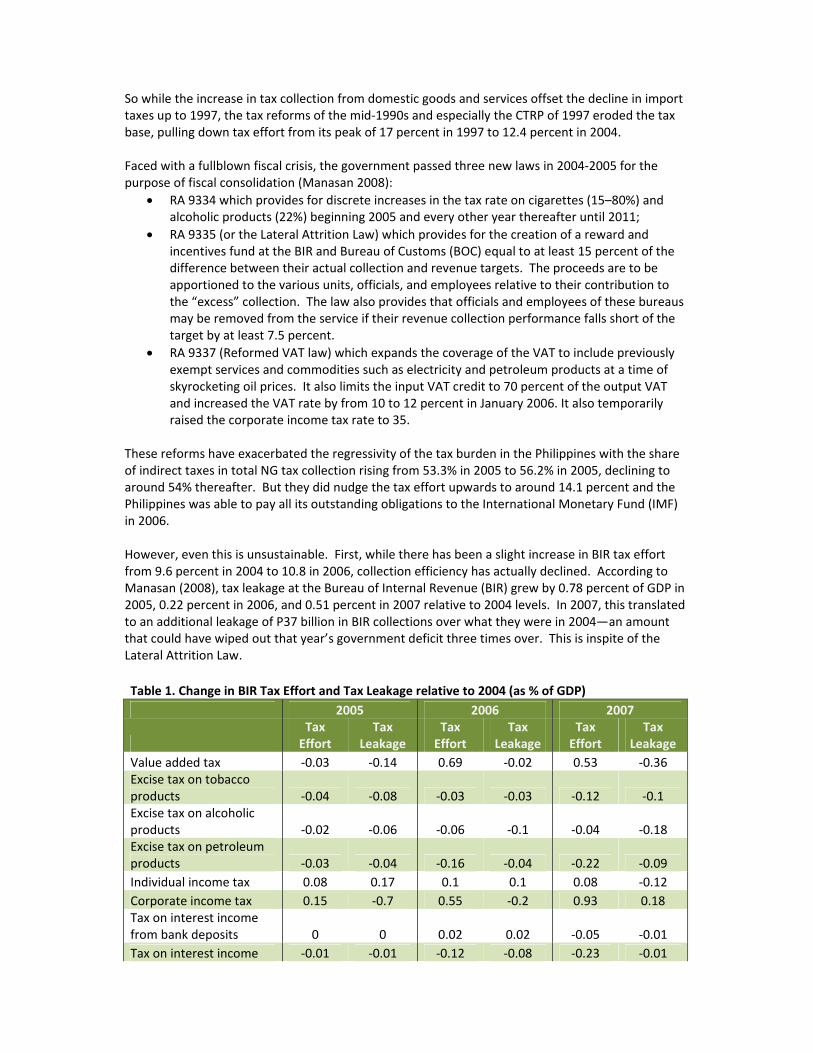
These reforms have exacerbated the regressivity of the tax burden in the Philippines with the share of indirect taxes in total NG tax collection rising from 53.3% in 2005 to 56.2% in 2005, declining to around 54% thereafter. But they did nudge the tax effort upwards to around 14.1 percent and the Philippines was able to pay all its outstanding obligations to the International Monetary Fund (IMF) in 2006. However, even this is unsustainable. First, while there has been a slight increase in BIR tax effort from 9.6 percent in 2004 to 10.8 in 2006, collection efficiency has actually declined. According to Manasan (2008), tax leakage at the Bureau of Internal Revenue (BIR) grew by 0.78 percent of GDP in 2005, 0.22 percent in 2006, and 0.51 percent in 2007 relative to 2004 levels. In 2007, this translated to an additional leakage of P37 billion in BIR collections over what they were in 2004—an amount that could have wiped out that year’s government deficit three times over. This is inspite of the Lateral Attrition Law. Table 1. Change in BIR Tax Effort and Tax Leakage relative to 2004 (as % of GDP) 2005 2006 2007
Tax Effort
Tax Leakage
Tax Effort
Tax Leakage
Tax Effort
Tax Leakage
Value added tax ‐0.03 ‐0.14 0.69 ‐0.02 0.53 ‐0.36 Excise tax on tobacco products ‐0.04 ‐0.08 ‐0.03 ‐0.03 ‐0.12 ‐0.1 Excise tax on alcoholic products ‐0.02 ‐0.06 ‐0.06 ‐0.1 ‐0.04 ‐0.18 Excise tax on petroleum products ‐0.03 ‐0.04 ‐0.16 ‐0.04 ‐0.22 ‐0.09 Individual income tax 0.08 0.17 0.1 0.1 0.08 ‐0.12 Corporate income tax 0.15 ‐0.7 0.55 ‐0.2 0.93 0.18 Tax on interest income from bank deposits 0 0 0.02 0.02 ‐0.05 ‐0.01 Tax on interest income ‐0.01 ‐0.01 ‐0.12 ‐0.08 ‐0.23 ‐0.01
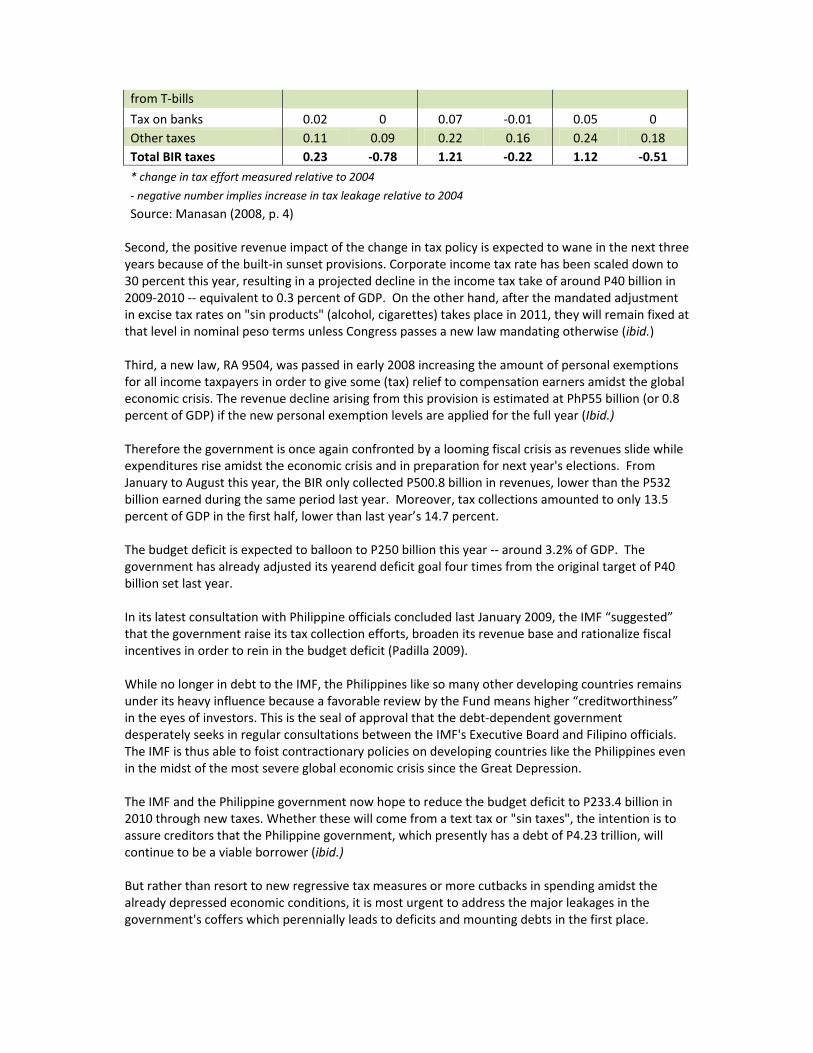
from T‐bills
Tax on banks 0.02 0 0.07 ‐0.01 0.05 0 Other taxes 0.11 0.09 0.22 0.16 0.24 0.18 Total BIR taxes 0.23 ‐0.78 1.21 ‐0.22 1.12 ‐0.51
* change in tax effort measured relative to 2004
‐ negative number implies increase in tax leakage relative to 2004
Source: Manasan (2008, p. 4) Second, the positive revenue impact of the change in tax policy is expected to wane in the next three years because of the built‐in sunset provisions. Corporate income tax rate has been scaled down to 30 percent this year, resulting in a projected decline in the income tax take of around P40 billion in 2009‐2010 ‐‐ equivalent to 0.3 percent of GDP. On the other hand, after the mandated adjustment in excise tax rates on "sin products" (alcohol, cigarettes) takes place in 2011, they will remain fixed at that level in nominal peso terms unless Congress passes a new law mandating otherwise (ibid.) Third, a new law, RA 9504, was passed in early 2008 increasing the amount of personal exemptions for all income taxpayers in order to give some (tax) relief to compensation earners amidst the global economic crisis. The revenue decline arising from this provision is estimated at PhP55 billion (or 0.8 percent of GDP) if the new personal exemption levels are applied for the full year (Ibid.) Therefore the government is once again confronted by a looming fiscal crisis as revenues slide while expenditures rise amidst the economic crisis and in preparation for next year's elections. From January to August this year, the BIR only collected P500.8 billion in revenues, lower than the P532 billion earned during the same period last year. Moreover, tax collections amounted to only 13.5 percent of GDP in the first half, lower than last year’s 14.7 percent. The budget deficit is expected to balloon to P250 billion this year ‐‐ around 3.2% of GDP. The government has already adjusted its yearend deficit goal four times from the original target of P40 billion set last year. In its latest consultation with Philippine officials concluded last January 2009, the IMF “suggested” that the government raise its tax collection efforts, broaden its revenue base and rationalize fiscal incentives in order to rein in the budget deficit (Padilla 2009). While no longer in debt to the IMF, the Philippines like so many other developing countries remains under its heavy influence because a favorable review by the Fund means higher “creditworthiness” in the eyes of investors. This is the seal of approval that the debt‐dependent government desperately seeks in regular consultations between the IMF's Executive Board and Filipino officials. The IMF is thus able to foist contractionary policies on developing countries like the Philippines even in the midst of the most severe global economic crisis since the Great Depression. The IMF and the Philippine government now hope to reduce the budget deficit to P233.4 billion in 2010 through new taxes. Whether these will come from a text tax or "sin taxes", the intention is to assure creditors that the Philippine government, which presently has a debt of P4.23 trillion, will continue to be a viable borrower (ibid.) But rather than resort to new regressive tax measures or more cutbacks in spending amidst the already depressed economic conditions, it is most urgent to address the major leakages in the government's coffers which perennially leads to deficits and mounting debts in the first place.
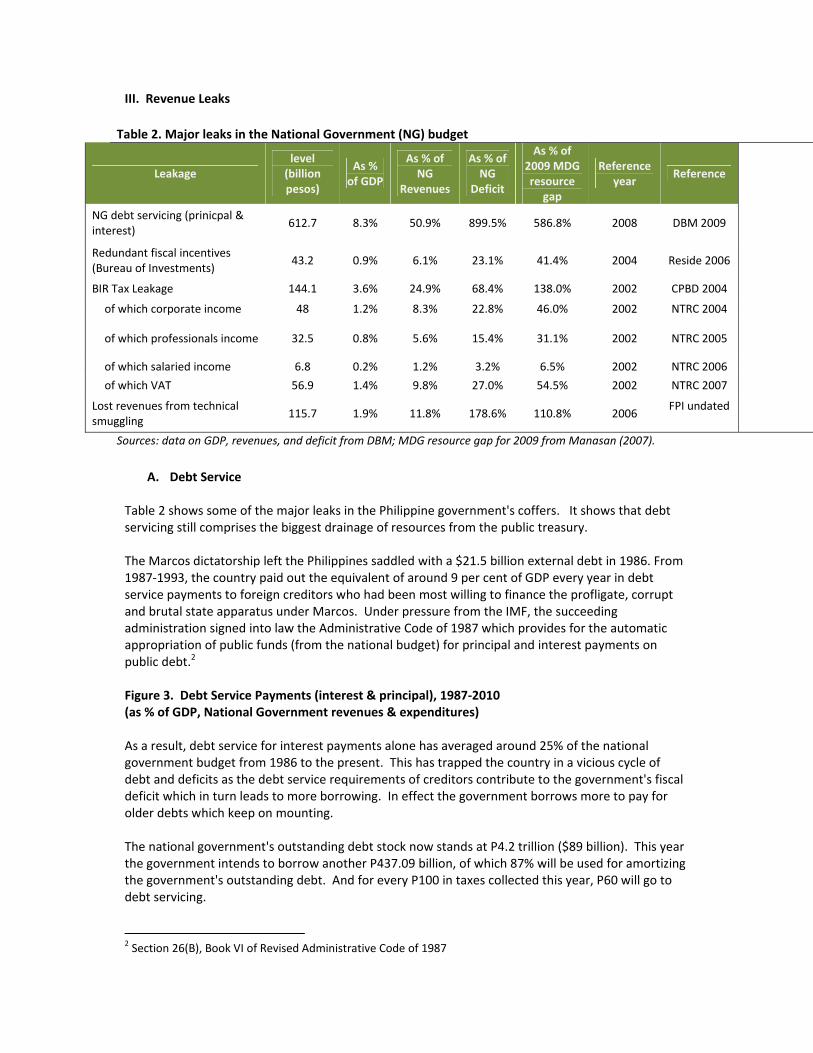
III. Revenue Leaks
Table 2. Major leaks in the National Government (NG) budget
Leakage level (billion pesos)
As % of GDP
As % of NG
Revenues
As % of NG
Deficit
As % of 2009 MDG resource
gap
Reference year
Reference
NG debt servicing (prinicpal & interest)
612.7 8.3% 50.9% 899.5% 586.8% 2008 DBM 2009
Redundant fiscal incentives (Bureau of Investments)
43.2 0.9% 6.1% 23.1% 41.4% 2004 Reside 2006
BIR Tax Leakage 144.1 3.6% 24.9% 68.4% 138.0% 2002 CPBD 2004
of which corporate income 48 1.2% 8.3% 22.8% 46.0% 2002 NTRC 2004
of which professionals income 32.5 0.8% 5.6% 15.4% 31.1% 2002 NTRC 2005
of which salaried income 6.8 0.2% 1.2% 3.2% 6.5% 2002 NTRC 2006
of which VAT 56.9 1.4% 9.8% 27.0% 54.5% 2002 NTRC 2007
Lost revenues from technical smuggling
115.7 1.9% 11.8% 178.6% 110.8% 2006 FPI undated
Sources: data on GDP, revenues, and deficit from DBM; MDG resource gap for 2009 from Manasan (2007).
A. Debt Service
Table 2 shows some of the major leaks in the Philippine government's coffers. It shows that debt servicing still comprises the biggest drainage of resources from the public treasury. The Marcos dictatorship left the Philippines saddled with a $21.5 billion external debt in 1986. From 1987‐1993, the country paid out the equivalent of around 9 per cent of GDP every year in debt service payments to foreign creditors who had been most willing to finance the profligate, corrupt and brutal state apparatus under Marcos. Under pressure from the IMF, the succeeding administration signed into law the Administrative Code of 1987 which provides for the automatic appropriation of public funds (from the national budget) for principal and interest payments on public debt.2 Figure 3. Debt Service Payments (interest & principal), 1987‐2010 (as % of GDP, National Government revenues & expenditures) As a result, debt service for interest payments alone has averaged around 25% of the national government budget from 1986 to the present. This has trapped the country in a vicious cycle of debt and deficits as the debt service requirements of creditors contribute to the government's fiscal deficit which in turn leads to more borrowing. In effect the government borrows more to pay for older debts which keep on mounting. The national government's outstanding debt stock now stands at P4.2 trillion ($89 billion). This year the government intends to borrow another P437.09 billion, of which 87% will be used for amortizing the government's outstanding debt. And for every P100 in taxes collected this year, P60 will go to debt servicing. 2 Section 26(B), Book VI of Revised Administrative Code of 1987
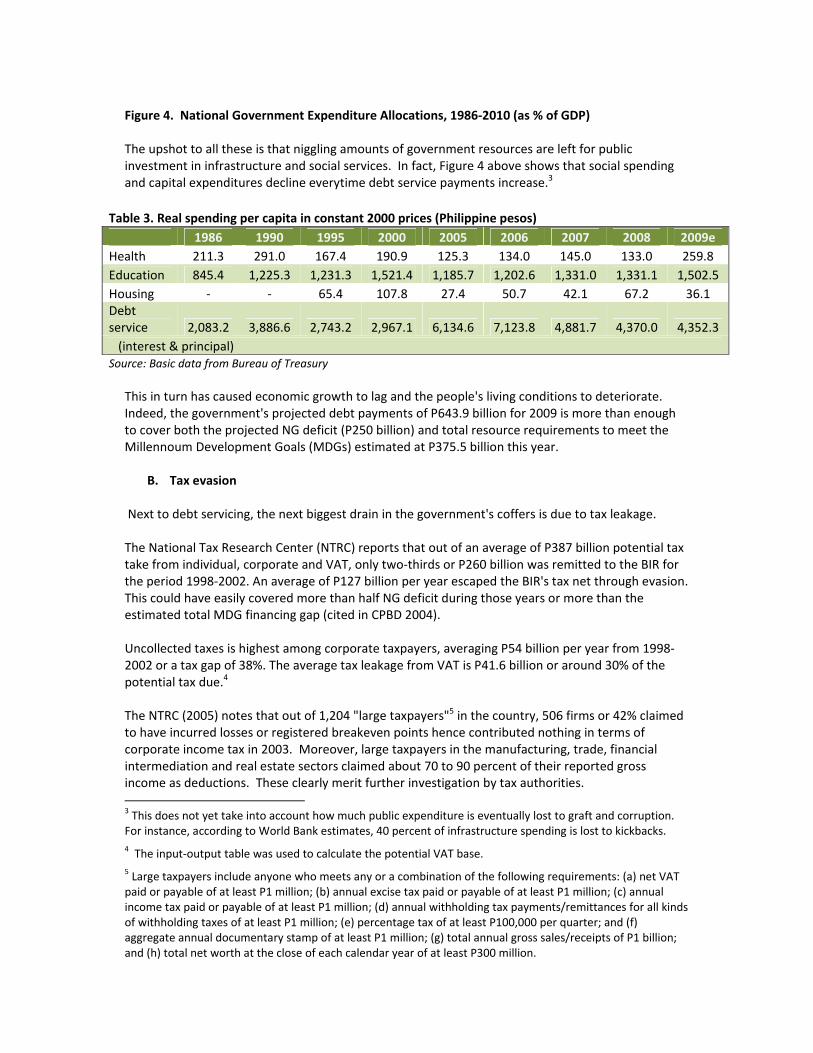
Figure 4. National Government Expenditure Allocations, 1986‐2010 (as % of GDP) The upshot to all these is that niggling amounts of government resources are left for public investment in infrastructure and social services. In fact, Figure 4 above shows that social spending and capital expenditures decline everytime debt service payments increase.3
Table 3. Real spending per capita in constant 2000 prices (Philippine pesos) 1986 1990 1995 2000 2005 2006 2007 2008 2009e
Health 211.3 291.0 167.4 190.9 125.3 134.0 145.0 133.0 259.8 Education 845.4 1,225.3 1,231.3 1,521.4 1,185.7 1,202.6 1,331.0 1,331.1 1,502.5 Housing ‐ ‐ 65.4 107.8 27.4 50.7 42.1 67.2 36.1 Debt service 2,083.2 3,886.6 2,743.2 2,967.1 6,134.6 7,123.8 4,881.7 4,370.0 4,352.3 (interest & principal) Source: Basic data from Bureau of Treasury
This in turn has caused economic growth to lag and the people's living conditions to deteriorate. Indeed, the government's projected debt payments of P643.9 billion for 2009 is more than enough to cover both the projected NG deficit (P250 billion) and total resource requirements to meet the Millennoum Development Goals (MDGs) estimated at P375.5 billion this year.
B. Tax evasion Next to debt servicing, the next biggest drain in the government's coffers is due to tax leakage. The National Tax Research Center (NTRC) reports that out of an average of P387 billion potential tax take from individual, corporate and VAT, only two‐thirds or P260 billion was remitted to the BIR for the period 1998‐2002. An average of P127 billion per year escaped the BIR's tax net through evasion. This could have easily covered more than half NG deficit during those years or more than the estimated total MDG financing gap (cited in CPBD 2004). Uncollected taxes is highest among corporate taxpayers, averaging P54 billion per year from 1998‐2002 or a tax gap of 38%. The average tax leakage from VAT is P41.6 billion or around 30% of the potential tax due.4 The NTRC (2005) notes that out of 1,204 "large taxpayers"5 in the country, 506 firms or 42% claimed to have incurred losses or registered breakeven points hence contributed nothing in terms of corporate income tax in 2003. Moreover, large taxpayers in the manufacturing, trade, financial intermediation and real estate sectors claimed about 70 to 90 percent of their reported gross income as deductions. These clearly merit further investigation by tax authorities. 3 This does not yet take into account how much public expenditure is eventually lost to graft and corruption. For instance, according to World Bank estimates, 40 percent of infrastructure spending is lost to kickbacks. 4 The input‐output table was used to calculate the potential VAT base. 5 Large taxpayers include anyone who meets any or a combination of the following requirements: (a) net VAT paid or payable of at least P1 million; (b) annual excise tax paid or payable of at least P1 million; (c) annual income tax paid or payable of at least P1 million; (d) annual withholding tax payments/remittances for all kinds of withholding taxes of at least P1 million; (e) percentage tax of at least P100,000 per quarter; and (f) aggregate annual documentary stamp of at least P1 million; (g) total annual gross sales/receipts of P1 billion; and (h) total net worth at the close of each calendar year of at least P300 million.
Among individuals, the tax gap as percentage of potential income is highest among businessmen and professionals, averaging 68% or P26. billion from 2001‐2005. The NTRC (2006) identifies the following sources of leakages among professionals :
• underdeclaration of business/ professional income; • overstatement of expenses; • abuses in the availment of the tax exemptions/incentives; • non‐reporting of second, third, etc. employment income; and • non‐filing of returns
On the other hand, tax evasion is relatively lower among pure compensation income earners or salaried individuals due to the withholding tax scheme. The estimated uncollected income taxes from wage and salary workers is less than B10 billion per year from 2001‐2005, for an average tax gap of 10.9%. In fact, in some years, the BIR has been able to collect almost 100% of the potential tax due from compensation income. (ibid.)
C. Smuggling Another major source of revenue losses is rampant smuggling. Physical smuggling refers to importation of goods that evades inspection of Customs personnel and payment of tariff duties. Technical smuggling, on the other hand, involves fraud through the use of incorrect information in bringing the goods through legal points of entry. Physical smuggling takes place not just in the remote reaches of the arhipelago, but also in principal ports entry. There are so‐called swing operations where containers are spirited away with the connivance of Customs personnel for a fee of P80,000 to P200,000 per container. Another forms is through the transhipment of cargo wherein incoming cargo allegedly bound for other final destinations are surreptitiously unloaded and replaced with local products which are then unloaded in the final port of destination (FPI n.d.). The most common types of technical smuggling are:
(a) under‐valuation or under‐statement of import values; (b) misdeclaration or the use of fake identities/addresses and product description outside the
appropriate tariff heading, e.g. car parts declared as electric fans; and (c) misclassification or the use of another tariff line within the same heading, i.e. leather shoes
declared as slippers. Smuggling has become much more rampant in the Philippines since the proliferation of freeports and bonded warehouses for exporters. According to the Federation of Philippine Industries (FPI), IMF data showed that from years 2002 ‐ 2006, the value of goods shipped to the Philippines from other countries totaled $227.1 billion. On the other hand, data from the Bureau of Customs report only $159 billion worth of imports over the same period ‐‐ a huge discrepancy of $68 billion. This suggests that an annual average of $13.61 billion worth of goods were sold to the Philippines but were not captured by official Philippine government data. Assuming an average duty of 5% and a VAT of 12% should have been paid for those goods, then the government lost P115.7 billion in revenues annually due to technical smuggling ‐‐ almost 2% of GDP during those years (FPI n.d.).
D. Redundant Fiscal Incentives
A fourth major source of leakage is the government’s overly generous fiscal incentives program for investors. According to Reside (2006), close to 90 percent of the fiscal incentives granted by the Board of Investments are redundant ‐‐ worth approximately P43.2 billion or almost 1% of GDP in 2004. These consist of incentives that benefit corporations who would have made those same investments even without those subsidies. These take the form of income tax holidays, tax and duty exemptions for capital goods, raw materials, deductions on labor expenses, and others. In fact Reside's estimates may be an understatement since he associates redundant incentives only with non‐exporting domestic market‐seeking investments by corporations who are already enjoying high rates of return (above 15%) even before receiving incentives. Thus he has low estimates for the redundancy rate of fiscal incentives given by the Philippine Economic Zone Authority (PEZA) by the mere fact that they largely benefit exporters in special economic zones (SEZs). The assumption is that export‐oriented, "efficiency‐seeking" FDI ‐‐ such as those that locate in SEZs ‐‐ are deserving of incentives since they generate positive spillovers, and that these investments would not have located in the country had it not been for these incentives. But this is the logic of tax competition which only leads to a race to the bottom. Numerous other studies attest to the limited positive externalities of these export enclaves. Indeed, economic zones are known to present high infrastructure, administrative/regulatory costs; exploit low‐wage, unskilled (mostly female) labor; generate small domestic value added; transfer little technology; and pose environmental risks (McKay 2006, AMRC 1999). Therefore it is legitimate to question the social desirability of allocating scarce public funds to attract such investments while other social needs ‐‐ education, health, even infrastructure ‐‐ are neglected. Indeed Reside found no evidence that the generous fiscal incentives to businesses locating in regions considered to be less developed actually encouraged industrial dispersion. Instead, investments continue to gravitate towards regions with stronger and richer economies, better infrastructure and greater levels of functional literacy – factors that, compared to incentives, are more fundamental inducers of investment. So even by the logic of competition for FDI, the granting of generous tax incentives is counterproductive. Moreover, Reside found very low correlations between actual regional gross capital formation and prior BOI‐approved investment flows. This means that the investment commitments simply did not materialize to the extent promised, suggesting that incentives were not motivated by investment motives, but by other motives, such as tax avoidance.
E. Capital flight Capital flight involves both private and public funds. It is difficult to measure capital flight directly due to the illicit nature of much of these flows (e.g. money laundering, smuggling, graft, tax evasion, etc.). But available estimates of capital flight from the Philippines suggest that it represents an enormous and recurrent loss of financing for development in the country. For instance Beja (2006) has come up with estimates of capital flight by measuring the net unrecorded capital outflow or the residual of officially recorded sources and uses of funds.6 Using 6 Recorded sources of funds are net additions to external debt (CDET) and net nondebt creating capital inflows (NKI), where NKI is the net direct foreign Investments (FDI), net portfolio investment equities (PORT), and
this measure, Beja estimates that the Philippines lost $131 billion (in 1995 constant prices) in capital flight between 1970 and 2002. In fact he estimates that the outflows have been increasing over the decades, from around $16 billion in the 1970s, $36 billion in the 1980s, and $43 billion in the 1990s. He observed a cyclical pattern mirroring the economic boom‐bust cycle that has characterized the Philippine economy in the post‐World War II period. Capital flight increases during economic busts and tapers off in the later stage of a political/economic crisis, presumably when most of the capital had left. This was true of the dying years of Marcos dictatorship, the power crisis in the early 1990s, the Asian financial crisis, the ouster of former President Estrada in 2001 and has continued up to the present with a crisis of legitimacy still haunting the current administration over charges of electoral fraud, corruption and human rights violations. Beja also found that this process became more pronounced with financial liberalization in the 1990s as capital flight found wider avenues for escape. If the actual amounts of capital flight are anywhere near Beja's estimates, then these represent a massive hemmorhaging of the Philippine economy. Beja estimates that capital flight has resulted in an average loss of between 1 per cent to 2.3 per cent in the growth rate of Philippine GDP between 1970 and 1999 (Beja 2007). He concludes that capital flight has resulted in the hollowing out of the Philippine economy ‐‐ a process underpinned by financial liberalization and deregulation. IV. Policy Implications There is certainly a need to improve the tax system in the Philippines. It needs to be more equitable, easing the burden on low and middle‐income earners while raising the contribution of large foreign and domestic corporations who profit the most from the domestic economy. It needs to be more robust and responsive to the public financing needs of the population rather than prone to corruption and rent‐seeking of foreign and domestic elite interests. And of course it also needs to be more efficient in terms of plugging loopholes, preventing tax evasion and improving tax administration. However, the foregoing analysis shows that any tax reform program will not work without a comprehensive public sector reform program that can truly enhance domestic resource mobilization for development. The government must shift from from prioritizing debt servicing and competing for foreign direct investment to active state promotion of the people's well‐being above all. In terms of generating or freeing up more resources for development, it is far more justifiable to plug the leaks rather than reducing public spending or resorting to new regressive taxes such as upping the VAT rate or imposing a tax on text messaging services. The urgency of the fiscal crisis in 2004 was used to justify the reformed VAT law rather than push for a decisive policy on dealing with the debt overhang and eliminating redundant fiscal incentives because the latter were considered politically untenable. Yet these reforms only bought temporary breathing space for the government but more hardship to the people. other investment assets (OTH); recorded uses of funds are the current account deficits (CAD) and accumulation of international reserves, including Central Bank‐sanctioned uses of foreign exchange (CRES). Thus a baseline measure of capital flight (KF) is as follows: KF = CDET + NKI – CAD – CRES. Beja includes adjustments for the impact of exchange‐rate fluctuations on long‐term external debts (i.e., CDETADJ), trade misinvoicing (MIS), and unrecorded remittances (UNREMIT) to get KF = CDETADJ + NKI – CAD – CRES + MIS + UNREMIT.
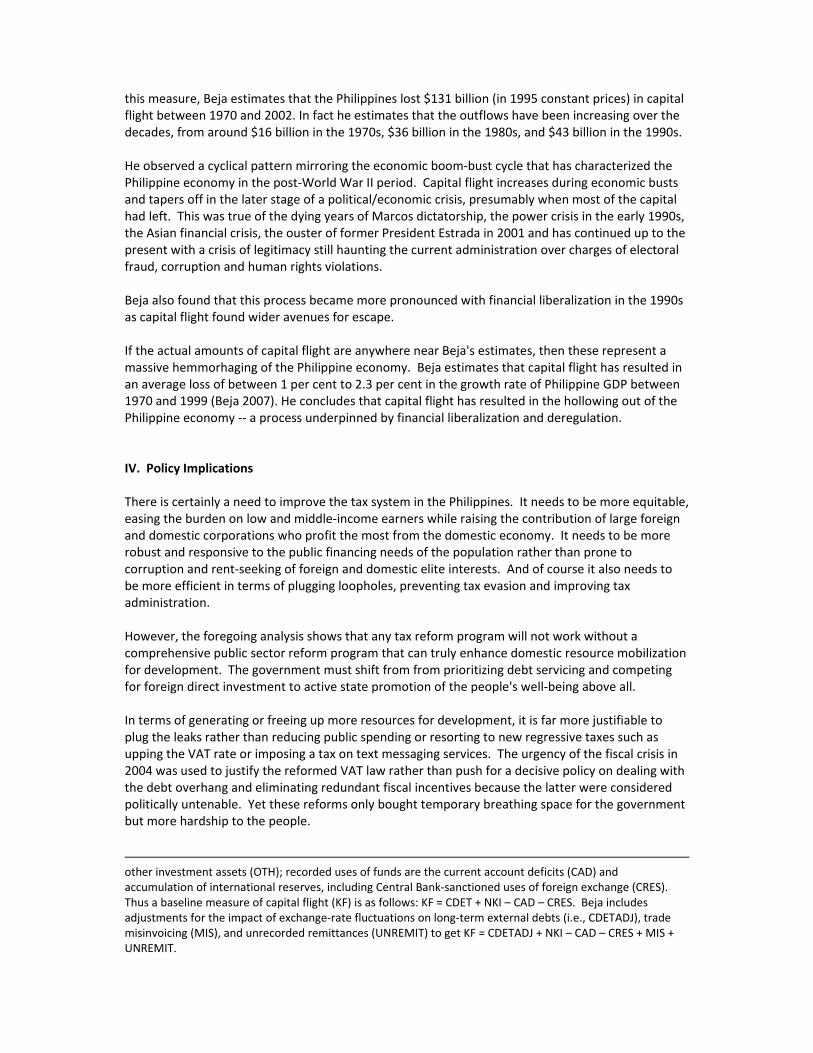
There is no escaping from a confrontation with entrenched elite interests if the government is to truly promote development in the Philippines. In particular, the government can institute the following measures:
1. Undertake a comprehensive audit of the country's debt stock, the role of international creditors and official debt policies towards cancelling odious and illegitimate debt. This includes money lent to the oppressive Marcos regime; loans used for graft and corruption or for political repression; debt incurred by undemocratic means, without transparency or participation by civil society or representative branches of government; debt that cannot be serviced without violating basic human rights; and debt incurred under predatory repayment terms, including situations where original interest rates skyrocketed and compound interest made repayment impossible (Jubillee USA Network 2008). The audit should examine the responsibility and culpability of the Philippine government as well as international financial institutions and creditors in these transactions. This audit should be led by the parliament and involve direct citizen's participation.
2. Immediately remove the automatic appropriations for debt service provision in the Revised
Administrative Code of 1987 and clip the President's powers to contract or guarantee foreign loans.7 Instead, there should be more parliamentary and citizens' scrutiny over the contracting of new loans.
3. Scrap redundant fiscal incentives. Revenues thus generated should be redirected to public
investments in poorer regions.
4. Scrap duty‐free privileges for the Clark and Subic Bay Freeport Zones which have become well‐known entry points for smuggled goods.
5. Raise tariffs, especially for sensitive and strategic products/ industries. Tariff policy must be employed as one means by which to promote domestic agriculture and industrialization.
6. Improve tax administration. The BIR should audit non‐paying large taxpayers (who numbered 506 in 2003) and use industry benchmarks to signal dubious deductions and exemptions.
7. Raise effective tax rates on cigarettes and alcoholic beverages.
8. Impose a financial transactions tax as way of curbing financial speculation as well as raising revenue.
9. Adopt capital controls to prevent capital flight. These can include exchange controls; residency requirements for foreign investments; stricter regulation of stock markets, currency trading and other financial transactions.
At the international level, the government should support the following:
7 Article VII, Section 20 of the 1987 Constitution states, "The President may contract or guarantee foreign loans on behalf of the Republic of the Philippines with the prior concurrence of the Monetary Board, and subject to such limitations as may be provided by law."
10. The creation of an international debt arbitration mechanism where developing countries can seek an orderly workout of debt. This should be independent of the IFIs, the Paris club and other major creditors.
11. International cooperation against capital flight. This entails, among others, automatic
exchange of information among tax authorities, sanctions against uncooperative tax havens and mechanisms for sequestering flight capital.
Figure 1. Total National Government (NG) Revenue and Tax Collection, 1986‐2008 (as percent of GDP)
Source: data from Department of Budget and Management
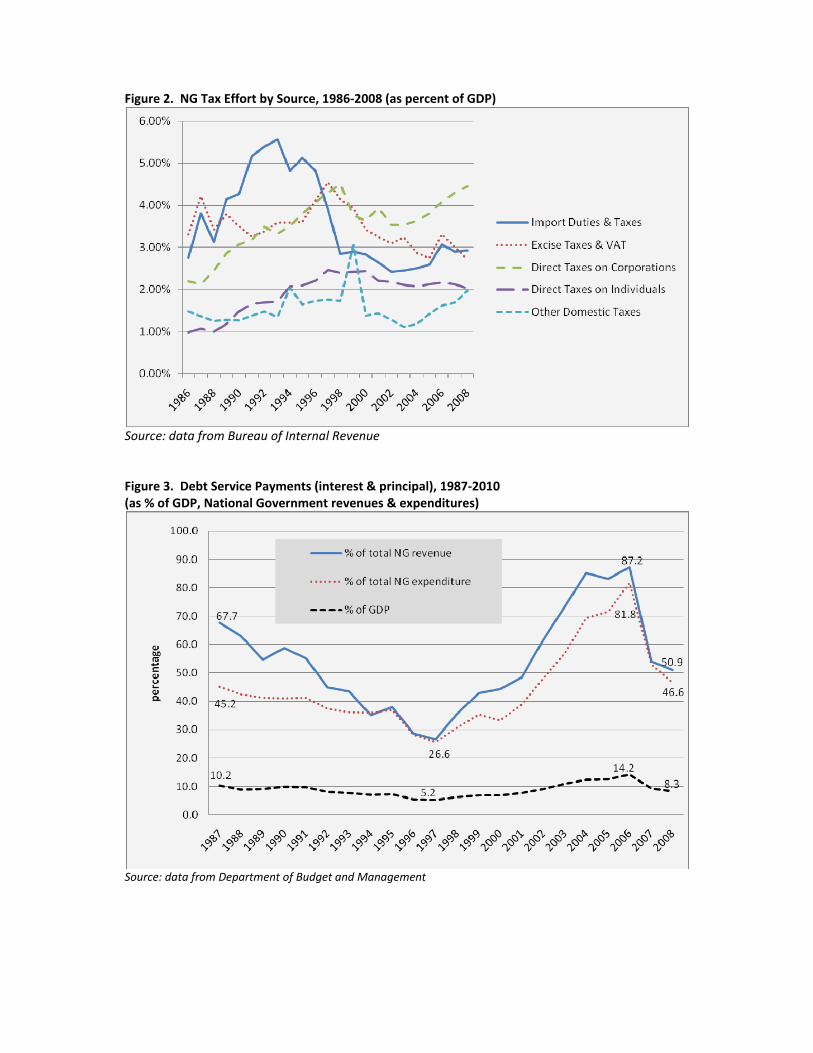
Figure 2. NG Tax Effort by Source, 1986‐2008 (as percent of GDP)
Source: data from Bureau of Internal Revenue Figure 3. Debt Service Payments (interest & principal), 1987‐2010 (as % of GDP, National Government revenues & expenditures)
Source: data from Department of Budget and Management
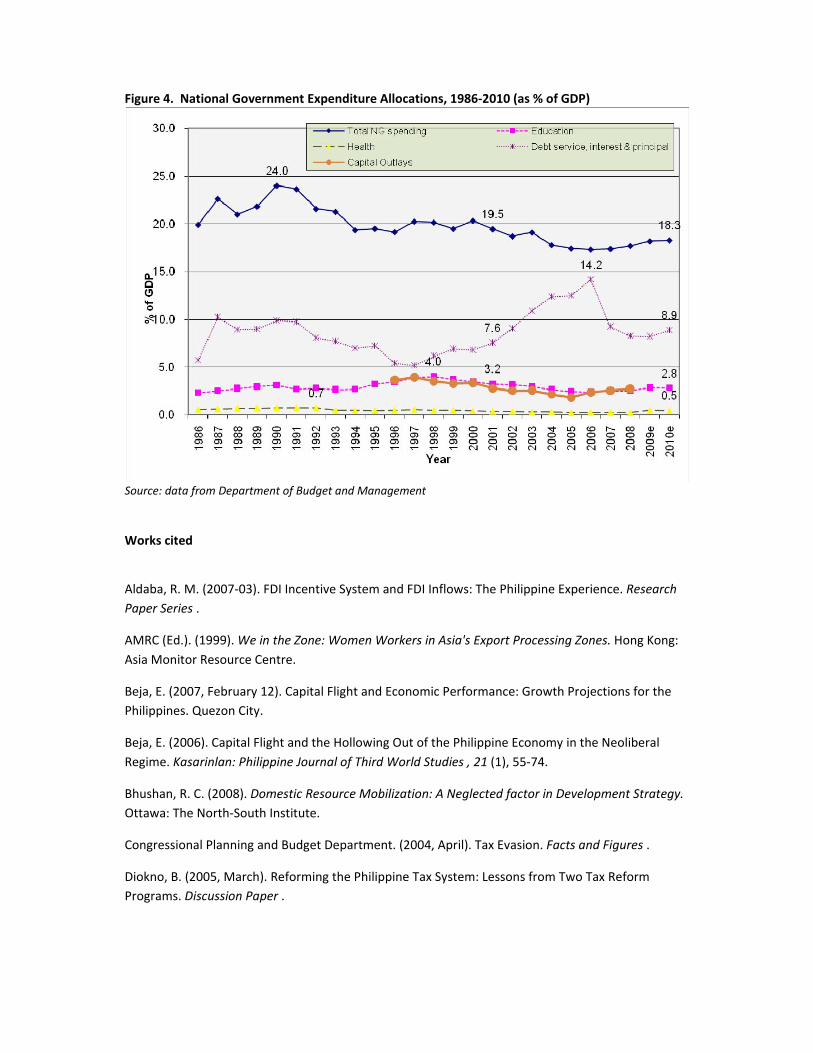
Figure 4. National Government Expenditure Allocations, 1986‐2010 (as % of GDP)
Source: data from Department of Budget and Management Works cited
Aldaba, R. M. (2007‐03). FDI Incentive System and FDI Inflows: The Philippine Experience. Research Paper Series .
AMRC (Ed.). (1999). We in the Zone: Women Workers in Asia's Export Processing Zones. Hong Kong: Asia Monitor Resource Centre.
Beja, E. (2007, February 12). Capital Flight and Economic Performance: Growth Projections for the Philippines. Quezon City.
Beja, E. (2006). Capital Flight and the Hollowing Out of the Philippine Economy in the Neoliberal Regime. Kasarinlan: Philippine Journal of Third World Studies , 21 (1), 55‐74.
Bhushan, R. C. (2008). Domestic Resource Mobilization: A Neglected factor in Development Strategy. Ottawa: The North‐South Institute.
Congressional Planning and Budget Department. (2004, April). Tax Evasion. Facts and Figures .
Diokno, B. (2005, March). Reforming the Philippine Tax System: Lessons from Two Tax Reform Programs. Discussion Paper .
Epstein, G. A. (2005). Capital Flight and Capital Controls in Developing Countries: An Introduction. In G. Epstein (Ed.), Capital Flight And Capital Controls In Developing Countries (pp. 3‐14). Edward Elgar Publishing.
FPI. (n.d.). FPI Bares Huge Customs Revenue Losses from Technical Smuggling. undated media release .
Jubillee USA Network. (2008, April). Recent Developments on Odious and Illegitimate Debt. Retrieved September 4, 2009, from Jubillee USA: http://www.jubileeusa.org/fileadmin/user_upload/Resources/Policy_Archive/408briefnoteodiousilldebt.pdf
Koshy, R. (2006, October‐December). Transforming Aid for Trade and Development: Transforming a Mirage into Reality. Trading Up , 2 (4), pp. 3‐8.
Manasan, R. G. (2008, December). Are recent gains in BIR tax effort sustainable? Policy Notes .
McKay, S. C. (2006). Satanic Mills or Silicon Islands? The Politics of High‐Tech Production in the Philippines. Ithaca: Cornell University Press.
Padilla, A. (2009, September 14). Text Tax: An IMF Imposition That Could Blow in Arroyo’s Face. Retrieved September 15, 2009, from Bulatlat: http://www.bulatlat.com/main/2009/09/14/text‐tax‐the‐bigger‐picture/
Reside, R. E. (2006). Towards Rational Fiscal Incentives: Good Investments or Wasted Gifts? Quezon City: Economic Policy Reform and Advocacy (EPRA) Consortium.
SOMO. (2008, October). Taxation and Financing for Development. Retrieved August 21, 2009, from SOMO (Centre for Research on Multinational Corporations): http://somo.nl/publications‐en/Publication_2955/view
Tariff Commission. (n.d.). The Tariff Reform Program. Retrieved August 30, 2009, from http://www.tariffcommission.gov.ph/trp.html
Tax Justice Network. (2007). Closing the Floodgates: Collecting tax to pay for development. Retrieved August 25, 2009, from Tax Justice Network: http://www.taxjustice.net/cms/upload/pdf/Closing_the_Floodgates_‐_1‐FEB‐2007.pdf