Embed Size (px)
DESCRIPTION
Taxation paper
Citation preview
STU
DY
ON
THE EFFEC
TS A
ND
INC
IDEN
CE O
F LAB
OU
R TA
XA
TION
— FIN
AL R
EPO
RT
TAXATION PAPERS
Taxation and Customs Union
WORKING PAPER N. 56 – 2015
CPB in consortium with:CAPPCASECEPIIETLA
IFOIFS
Study on the effects and incidence of labour taxation
Final report
ISSN 1725-7565 (PDF) ISSN 1725-7557 (Printed)

Taxation Papers are written by the staff of the European Commission’s Directorate-General for Taxation and Customs Union, or by experts working in association with them. Taxation Papers are intended to increase awareness of the work being done by the staff and to seek comments and suggestions for further analyses. These papers often represent preliminary work, circulated to encourage discussion and comment. Citation and use of such a paper should take into account of its provisional character. The views expressed in the Taxation Papers are solely those of the authors and do not necessarily reflect the views of the European Commission.
Comments and inquiries should be addressed to:TAXUD [email protected]
Cover photo made by Milan Pein
Despite all our efforts, we have not yet succeeded in identifying the authors and rights holders for some of the images. If you believe that you may be a rights holder, we invite you to contact the Central Audiovisual Library of the European Commission.
This paper is available in English only.
Europe Direct is a service to help you find answersto your questions about the European UnionFreephone number:
00 800 6 7 8 9 10 11A great deal of additional information on the European Union is available on the Internet.It can be accessed through EUROPA at: http://europa.eu.
For information on EU tax policy visit the European Commission’s website at:http://ec.europa.eu/taxation_customs/taxation/index_en.htm
Do you want to remain informed of EU tax and customs initiatives? Subscribe now to the Commission’s e-mail newsflash at: http://ec.europa.eu/taxation_customs/common/newsflash/index_en.htm
Cataloguing data can be found at the end of this publication.
Luxembourg: Office for Official Publications of the European Communities, 2015
doi:10.2778/88441 (printed) doi:10.2778/1807 (PDF)ISBN 978-92-79-48353-0 (printed) ISBN 978-92-79-44439-5 (PDF)
© European Union, 2015Reproduction is authorised provided the source is acknowledged.
PRINTED ON WHITE CHLORINE-FREE PAPER
mmmll
Study on the effects and incidence of labour taxation
Final Report
TAXUD/2014/DE/313
FWC No. TAXUD/2010/CC/104
IHS Institute for Advances Studies (Project leader)
CPB Netherlands Bureau for Economic Policy Analysis (Consortium leader)
In consortium with:
CAPP CASE
CEPII ETLA
IFO IFS

European Commission
Study on the effects and incidence of labour taxation
May 2015 | 2
Preface
This report has been prepared for the project “Study on the effects and incidence of
labour taxation”, Specific Contract No. TAXUD/2014/DE/313 implementing the
Framework Service Contract No. TAXUD/2010/CC/104 for the provision of economic
analysis in the area of taxation. We are grateful for the valuable feedback of the
steering group and the external reviewers.
The following institutions and persons contributed to this project
IHS - Institute for Advanced Studies, Vienna (project leader)
Helmut Hofer, Raphaela Hyee, Simon Loretz, and Sandra Müllbacher
CAPP - Centre for the Analysis of Public Policies, Modena
Massimo Baldini and Giovanni Gallo
CASE - Center for Social and Economic Research, Warsaw
Izabela Styczyńska and Gokben Aydilek
ETLA - The Research Institute of the Finnish Economy, Helsinki
Tarmo Valkonen
IFS – Institute for fiscal studies, London
Stuart Adam and David Philips
The information and views set out in this report are those of the author(s) and do not
necessarily reflect the official opinion of the Commission. The Commission does not
guarantee the accuracy of the data included in this study. Neither the Commission nor
any person acting on the Commission’s behalf may be held responsible for the use
which may be made of the information contained therein.
European Commission
Study on the effects and incidence of labour taxation
May 2015 | 3
Table of contents
Preface ............................................................................................................. 2 Table of contents ............................................................................................... 3 List of tables ..................................................................................................... 5 List of figures .................................................................................................... 5 List of abbreviations ........................................................................................... 7 Executive Summary ........................................................................................... 8 Résumé ...........................................................................................................14 1. Introduction ............................................................................................21
1.1. Background .........................................................................................21 1.2. Objective and tasks ..............................................................................24
2. Review of the sources of employment problems ..........................................25 2.1. A broad characterisation of employment problems ....................................25
2.1.1. Cyclical and structural employment problems ....................................27 2.1.2. Mismatch between labour supply and labour demand ..........................28 2.1.3. Rigidities in wages and the labour market .........................................29 2.1.4. Incentive problems .........................................................................30
2.2. Changes in Labour supply and demand as sources of employment problems 31 2.2.1. Factors affecting labour supply .........................................................32 2.2.2. Factor affecting labour demand ........................................................36
2.3. Groups vulnerable to employment problems ............................................38 2.3.1. Low-skilled ....................................................................................39 2.3.2. Youth ............................................................................................41 2.3.3. Elderly ..........................................................................................43 2.3.4. Women .........................................................................................44 2.3.5. Migrants ........................................................................................45
2.4. Summary ............................................................................................47 3. Review of the tax incidence on labour ........................................................49
3.1. How can one identify the incidence of a tax? ............................................49 3.2. Direct estimates of the incidence of labour taxation ..................................53
3.2.1. Meta-analysis of results ..................................................................53 3.2.2. Macro-studies ................................................................................55 3.2.3. Within-country studies ....................................................................61 3.2.4. Summary ......................................................................................67
3.3. Review of the literature on labour supply elasticities .................................68 3.3.1. Economic model and interpretation of the wage elasticity of labour supply
68 3.3.2. Econometric issues and identification ................................................70 3.3.3. Empirical evidence on labour supply elasticities ..................................73 3.3.4. Labour supply and household decision making ...................................76 3.3.5. Using tax return data to estimate behavioural responses to taxation.....78
3.4. Review of the literature on labour demand elasticities ...............................82 3.5. Learning about labour tax incidence in CGE models ..................................83
3.5.1. Properties, which are important for incidence of taxes ........................84 3.5.2. Reviewing the incidence of labour income taxes in CGE models ............87 3.5.3. An illustration of the link between contributions and benefits ...............93
3.6. Summary ............................................................................................95 4. Review of the interplay between labour market institutions/regulations and
labour taxation .................................................................................................98 4.1. Wage setting institutions .......................................................................98 4.2. Welfare state and labour supply ........................................................... 104
4.2.1. Incentive issues of the tax and transfer system ................................ 105 4.2.2. Opportunity costs of work and the welfare system ............................ 109
European Commission
Study on the effects and incidence of labour taxation
May 2015 | 4
4.3. Summary .......................................................................................... 116 5. Framework with indicators to identify the role of labour taxation in causing and
solving employment problems .......................................................................... 118 5.1. Value-added and limitations of indicators .............................................. 118
5.1.1. Key benefits and value-added of LAF .............................................. 118 5.1.2. Main limitations and caveats of LAF ................................................ 119 5.1.3. Dealing with limitations of the LAF .................................................. 120
5.2. Indicators group 1: Identification of employment problems ..................... 122 5.2.1. Group 1a: Unemployment, non-employment and structural
unemployment ......................................................................................... 122 5.2.2. Group 1b: Employment problems and vulnerable groups ................... 125 5.2.3. Group 1c: Non-tax factors contributing to structural unemployment ... 129
5.3. Indicators group 2: Potential approaches for labour tax reforms ............... 131 5.3.1. Group 2a: Fiscal challenges and tax space ....................................... 131 5.3.2. Group 2b: Overall and labour tax structure ...................................... 132
5.4. Indicators group 3: Identification of factors affecting the incidence of labour
taxation ...................................................................................................... 134 5.4.1. Group 3a: Labour tax structure in a broader context......................... 134 5.4.2. Group 3b: Link between contributions and benefits .......................... 135 5.4.3. Group 3c: Other factors influencing labour tax effects ....................... 137
5.5. Overview and structure of framework of indicators ................................. 138 6. Country examples for the framework of indicators ..................................... 143
6.1. Austria .............................................................................................. 143 6.2. Spain ................................................................................................ 150 6.3. Italy ................................................................................................. 154 6.4. Conclusion ......................................................................................... 157
References..................................................................................................... 160 Appendix ....................................................................................................... 179
European Commission
Study on the effects and incidence of labour taxation
May 2015 | 5
List of tables
Table 1: Broad classification of employment problems ...........................................26 Table 2: Socio-economic trends affecting labour market outcomes .........................32 Table 3: Labour supply characteristics affecting labour market outcomes.................33 Table 4: Labour demand characteristics affecting labour market outcomes ..............38 Table 5: Modelling choices in CGE models affecting tax incidence ...........................84 Table 6: Changes in contributions, wages and pensions, in percent .........................94 Table 7: Overview of results of survey on labour tax incidence ...............................96 Table 8: Average duration and payment rate for type of leave, 2013 .................... 111 Table 9: Indicator group 1a: Values for 2013 ..................................................... 124 Table 10: Overview of framework of indicators (first part) ................................... 139 Table 11: Overview of framework of indicators (second part) ............................... 140 Table 12: Overview of framework of indicators (third part) .................................. 141 Table 13: Earnings distribution and tax wedges in Austria, 2013 .......................... 149
Appendix Table 1: Short description of studies directly investigating tax incidence .. 179 Appendix Table 2: Indicator group 1c: Values for 2013 ....................................... 181 Appendix Table 3: Indicator group 2a: Values for 2014 ....................................... 182 Appendix Table 4: Indicator group 2b: Implicit tax rates, values for 2012 .............. 183 Appendix Table 5: Indicator group 2b: Statutory tax burden, values for 2013 ........ 184 Appendix Table 6: Indicator group 2b: Progressivity index, values for 2013 ........... 185 Appendix Table 7: Indicator group 3b: Link between contribution and benefits, values
for 2013 ........................................................................................................ 186 Appendix Table 8: Indicator group 3c: Bargaining and minimum wages, values for
2011 ............................................................................................................. 187 Appendix Table 9: Indicator group 3c: Earnings distribution, values for 2013 ......... 188
List of figures
Figure 1: GDP growth and unemployment in the EU 28, 2000-2014 ........................21 Figure 2: Unemployment rates in EU 28 Member States 2002-2013 ........................22 Figure 3: Debt levels in the EU 28 Member States 2006 and 2014 ..........................23 Figure 4: NEETs position within the labour market classification .............................42 Figure 5: The relationship between behavioural response to taxation and tax incidence
......................................................................................................................50 Figure 6: The invariance of incidence proposition (IIP) ..........................................51 Figure 7: Share of part-time employment (in %) in 2012 .................................... 114 Figure 8: Female part-time workers as in % of total employment and female
employment rate (15 to 64 years) in 2013 ........................................................ 115 Figure 9: Proposed extension to the LAF ............................................................ 121 Figure 10: Unemployment rate, participation rate and NAWRU, 2013 .................... 125 Figure 11: Unemployment and rate participation rate, by gender, 2013................. 126 Figure 12: Unemployment and rate participation rate, by age groups, 2013 ........... 127 Figure 13: Unemployment and rate participation rate, by migration status, 2013 ... 128 Figure 14: Unemployment and rate participation rate, by skill class, 2013 ............. 128 Figure 15: Unemployment rate, participation rate and NAWRU, Austria ................. 143 Figure 16: Unemployment rate, participation rate, by gender, Austria ................... 144 Figure 17: Unemployment rate, participation rate, by age class, Austria ................ 144 Figure 18: Unemployment rate, participation rate, foreigners and low-skilled, Austria
.................................................................................................................... 145 Figure 19: Skill, regional and sectoral changes and mismatches, Austria ............... 145
European Commission
Study on the effects and incidence of labour taxation
May 2015 | 6
Figure 20: Debt and net lending, Austria ........................................................... 146 Figure 21: Overall tax structure, Austria ............................................................ 146 Figure 22: Structure of labour tax burden, Austria .............................................. 147 Figure 23: Structure of labour tax burden in 2013 .............................................. 147 Figure 24: Unemployment rate, participation rate and NAWRU, Spain ................... 150 Figure 25: Unemployment rate, participation rate, by gender, Spain ..................... 150 Figure 26: Unemployment rate, participation rate, by age class, Spain .................. 151 Figure 27: Unemployment rate, participation rate, foreigners and low-skilled, Spain
.................................................................................................................... 151 Figure 28: Skill, regional and sectoral changes and mismatches, Spain ................. 152 Figure 29: Debt and net lending, Spain ............................................................. 152 Figure 30: Overall tax structure, Spain .............................................................. 153 Figure 31: Structure of labour tax burden, Spain ................................................ 153 Figure 32: Unemployment rate, participation rate and NAWRU, Italy ..................... 154 Figure 33: Unemployment rate, participation rate, by gender, Italy ...................... 154 Figure 34: Unemployment rate, participation rate, by age class, foreigners and low-
skilled, Italy ................................................................................................... 155 Figure 35: Skill, regional and sectoral changes and mismatches, Italy ................... 156 Figure 36: Debt and net lending, Italy ............................................................... 156 Figure 37: Structure of labour tax burden, Italy ................................................. 157 Figure 38: Structure of labour tax burden, Spain ................................................ 157

European Commission
Study on the effects and incidence of labour taxation
May 2015 | 7
List of abbreviations
ACAS Advisory, Conciliation and Arbitration Service
AETR Average effective tax rate
CES Constant elasticity of substitution
CGE Computable general equilibrium
DiD Difference-in-differences
ECHP European Community Household Panel
EET Exempt contributions, exempt accumulations, taxed withdrawals
EITC Earned income tax credit
EU European Union
EU-SILC European Union Statistics on Income and Living Conditions
EMU European monetary union
ETI Elasticity of taxable income
ICT Information and communications technology
ICTWSS Institutional Characteristics of Trade Unions, Wage Setting, State
Intervention and Social Pacts
IIP Invariance of incidence proposition
ILO International labour organization
ISCED International standard classification of education
ITR Implicit tax rate
LAF LIME assessment framework
LIME Lisbon Methodology Working Group
LIS Luxembourg Income Study
LFS Labour force survey
METR Marginal effective tax rate
NAWRU Non-accelerating wage rate of unemployment
NDC Notional defined contribution
NEET rate Neither in employment nor in education and training rate
OLG Overlapping generations
PAYG Pay-as-you-go
PIT Personal income tax
SSC Social security contributions
UI Unemployment insurance
TEE Taxed contributions, exempt accumulations, exempt withdrawals
VAT Value added tax
WFTC Working families’ tax credit
European Commission
Study on the effects and incidence of labour taxation
May 2015 | 8
Executive Summary
In the aftermath of the financial crisis most European countries are continuing to face
employment problems. In a number of Member States government intervention has
further resulted in increasing debt levels and high tax burdens overall and in particular
on labour. Therefore well-targeted tax reforms seem to be in order to improve the
labour market outcomes. It is often implicitly assumed that a decrease on the
employee side, i.e. in the personal income tax rate or the employee part of social
security contribution, leads to a higher labour supply. Similarly, a decrease in the
employer labour taxes is often assumed to raise the demand of labour. However, the
economic literature argues that in the presence of labour market imperfection
economic incidence of a tax change is often different from the legal incidence. In this
case the impact of a tax change on labour market outcomes depends on the
interaction of the demand and the supply side of the market. This interaction is
determined by the behavioural responses of economic operators, measured by
elasticities. Higher (demand or supply) elasticities will cause larger responses to tax
changes, with the relatively less elastic side bearing a higher tax burden. Against this
background four main goals of this study emerge. First, is to identify from the
literature which labour market imperfections result in employment problems and to
attribute them to the labour supply or on the labour demand side. Given the
heterogeneity in the labour market situation of different groups, we also set out to
identify which socioeconomic groups are most vulnerable to employment problems.
The next step is to review the literature which assesses the short-run and long-run
economic incidence of labour taxation. To further break down the incidence into its
underlying determinants we also review the literature on the (tax) elasticities of labour
supply and labour demand. Then the literature on the influence of the economic
environment on the tax incidence outcome, most notably the wage setting
mechanisms and the institutional background, is reviewed. Finally the findings of the
literature review are brought together in a framework of indicators to identify the
potential of tax reforms to reduce tax related employment problems.
Labour demand and supply side reasons for unemployment
The study starts with a breakdown of employment problems into unemployment and
non-employment. We argue that unemployment is more originating from the labour
demand side and non-employment is more a labour supply side issue. This implies
that cyclical unemployment can be attributed to the labour demand side, albeit only
indirectly through the lack of aggregate demand which results in a lack of labour
demand. It proves to be difficult to draw a clear line between cyclical and structural
unemployment since unwinding of previously unsustainable situations, like necessary
fiscal consolidation because of excessive public debt, can also result in longer term
lack of aggregate demand.
A key part of structural unemployment is due to mismatches between labour demand
and labour supply and therefore inherently difficult to attribute to one of the two
labour market sides. We investigate how recent socio-economic changes like
population ageing, falling fertility levels, increasing female labour force participation
and increasing migration contribute to a change in labour supply and the composition
European Commission
Study on the effects and incidence of labour taxation
May 2015 | 9
of the workforce. At the same time a probably even larger share of short to medium
term unemployment can be attributed to broad changes in labour demand as a result
of occupational and sectoral changes and structural changes in the workplace. These
shifts increase the labour demand for certain skills while others become obsolete. This
highlights to the necessity of indicators looking into changes in labour supply as well
as labour demand and how these coincide. Such indicators can help to allocate the
source of employment problems to either side of the labour market. At the same time,
it is noteworthy that these indicators are also highlighting more fundamental structural
problems in the labour market, which are not the result of labour taxation. Therefore
tax reforms may not be the best way to address these issues.
The broad characterisation of employment problems further highlights the impact of
wage rigidities in the labour market contributing to a labour demand problem. Also,
incentive problems because of the tax and transfer system and the opportunity costs
are key determinants of labour supply side problems.
Vulnerable groups in the labour market
Changes both in labour demand and labour supply leave some socio-economic groups
at a vulnerable position in the labour market. First and foremost the low-skilled
workers are facing a labour demand problem as a result of the sectoral shifts which
substantially reduced the need for low-skilled workforce. Additionally the low-skilled
are among those most affected by rigidities which prevent wages to adjust
downwards. For example, binding minimum wages can result in a lack of labour
demand for low-productivity low-skilled workforce. Given the relatively low wages of
low-skilled people adverse incentives of the tax and transfer system can also result in
a labour supply problem further adding to the employment problem.
Another vulnerable group in the labour market are the young people. Their perception
as unstable employees who would leave an employer in order to gain more experience
before they settle into a permanent role contributes to this problem. In addition, they
usually have temporary, flexible contracts that do not secure their employment. Due
to their lack of experience, they are also seen as less productive than the rest of the
workforce. Consequently, youth unemployment can be largely attributed to a labour
demand problem. Migrants, in particular those from non-European countries, face a
similar situation in the labour market. Often their previous work experience and
foreign education is not adequately valued by employers and therefore they are facing
a labour demand problem. Furthermore, while the increase in migration can help to
mitigate geographical mismatches, it also contributes to a relative fast change in
labour supply. As a result there can be an oversupply of specific types of workers.
While the situation of the elderly has been steadily improving during the last decade,
they are still facing relevant employment problems. Due to population ageing the
labour supply of elderly people is increasing. At the same time the labour demand is
not keeping up, because the elderly are often perceived as people of lower
productivity, who are not keen on investing in themselves, and who are unable to
acquire new skills and adapt to rapid changes in the market. Currently, permanent
contracts, which protect them from instant loss of employment, help them to maintain
their employment level. However, once they lose their employment, it is difficult for
them to become employed again, often due to a shrinking labour demand for their
specific skills.
European Commission
Study on the effects and incidence of labour taxation
May 2015 | 10
The role of women in the labour market has undergone a profound change, not least
due to decades of initiatives and debates on this issue. The gender employment gap
decreased significantly during the last decade and the labour market participation of
women increased. Despite the achievements relevant disparities between the labour
market attachment of women and men remain. To a large extent these differences are
related to labour supply issues since women are still largely responsible for child care,
care of elderly relatives and other non-market household activities. As a result the
reconciliation between work and household activities often results in weaker labour
market attachment for women. In terms of indicators this section suggests that the
first step should be to break down the employment problems into its category.
Separately looking at unemployment and non-employment will give a first impression
as to on which side of the labour market the problems are located.
Survey of the labour tax incidence literature
A review of the literature on tax incidence of labour taxation shows that there is no
clear consensus on who ultimately bears the burden of labour taxes. In a recent meta-
analysis Melguizo and González-Páramo (2013) find that on average about two thirds
of the incidence of labour taxes falls on workers. However, there is too much variation
across different countries to view this result as a precise estimate. There are however
a number of intermediate results which can be taken away from the survey of the
literature.
Despite the absence of a clear answer to the tax incidence question, the literature still
does indicate that there is some degree of sharing even in the long run. The second
key finding is that the estimation of the long run tax incidence is struggling with
identification issues. Further, up to our knowledge, there are no convincing studies
available so far looking at medium-term effects or adjustment processes. Whether the
legal incidence matters is also empirically unanswered, but the lack of clear evidence
on the invariance of incidence proposition allows the tentative conclusion that the legal
incidence matters at least in the short run.
There are differences in the tax incidence results across countries which can be at
least partly attributed to the non-trivial role of centralisation of bargaining. The
evidence is relatively robust that more centralised bargaining shifts the tax burden
towards labour, while intermediate levels of coordination result in a partial shift of the
tax incidence on employers.
Review of labour supply and labour demand elasticities literature
Following the argumentation of Metcalf (2002) the question of tax incidence can also
be seen as a question of the relative elasticity of labour demand and labour supply.
The review of these two strands of the literature allows some tentative conclusions.
First, labour supply elasticities appear to be falling over time and recent meta-
analyses place them around 0.4 to 0.3. The overall elasticity is driven to a very large
extent through the extensive margin, whereas the elasticities at the intensive margin
are close to zero. Furthermore recent studies, as discussed in Saez et al. (2012b),
exploiting tax return data find that the elasticities at the intensive margin can mostly
be attributed to reporting effects. The literature is also relatively clear as to how the
elasticity at the extensive margin varies across different socioeconomic groups.
Women and in particular single mothers have a more elastic labour supply. Men

European Commission
Study on the effects and incidence of labour taxation
May 2015 | 11
typically have a higher labour supply elasticity at the extensive margin at the
beginning or the end of the career when they face trade-offs with further education
respectively early retirement.
Concerning the labour demand elasticities a recent meta-analysis by Lichter et al.
(2014) suggests that the elasticities are increasing over time with a best guess of -0.3
as the average labour demand elasticity. The long-run elasticity is found to be higher,
as well as higher labour demand elasticities are observable for fixed term contracts
and low-skilled workers.
Framework of indicators
The review of the different strands of literature guides the development of a
framework of 25 data indicators. These indicators are then evaluated in a simple
framework to break down the employment problems and to gain further
understanding which tax reform have the potential to improve the labour market
outcome.
From the initial classification of employment problem we derive the first set of
indicators which breaks down the employment problem into non-employment,
unemployment and structural unemployment. Following the discussion about the
vulnerable groups we dissect the unemployment and non-participation among socio-
economic groups. The contribution of labour supply and demand mismatches is taken
into account through skill and sectoral mismatch indicators. The labour supply side
contribution to the mismatches is additionally accounted for through sectoral and skill
change indicators.
The most important conclusion from survey of the tax incidence literature is that legal
tax incidence likely to matter. This demands a more detailed look at the composition
of the tax burden on labour. To this end we include measures of the implicit tax
burden as well as statutory tax measures for personal income tax, social security
contributions of both employers and employees
The review of the labour supply literature reinforced the importance of distinguishing
between different socio-economic groups. Additionally, labour supply is more
responsive at the extensive margin, especially for the young who face a trade-off
between work and education and for mothers who face a trade-off between work and
child care and home production. This highlights that aspects of the welfare state can
alter the work incentives.
Among the wage settings institutions the role of wage bargaining is once more
stressed, with a more centralised bargaining resulting in more incidence on workers
than bargaining at the industry level. Furthermore minimum wages will affect the
labour market outcome. In case they are binding the incidence result is clear, with the
incidence fully falling on the employers. However, even in the case of non-binding
minimum wages the literature suggests that they contribute to labour tax induced
employment problems.
Theoretical results suggest that the progressivity of the personal income tax affects
the labour market outcome in the presence of matching inefficiencies. For a given tax
burden a more progressive tax system will reduce the search effort of unemployed
people because a higher part of the additional match-specific rent will be taxed away.
European Commission
Study on the effects and incidence of labour taxation
May 2015 | 12
Similarly the incentive to pay efficiency wages above the market clearing wage rate is
reduced in progressive tax system. Despite the lack of conclusive evidence for these
theories so far, we therefore will also include progressivity measures in our framework
of indicators.
A review of the impact of welfare state on labour supply stresses the importance of
measures of unemployment or participation trap. The withdrawal of cash benefits or
transfers in-kind can create adverse incentive problems which can translate into
employment problems through the labour supply side. Another important aspect
affecting especially female labour supply is the availability of part-time work and
possibility of parental or maternity leave.
Country examples for Austria, Italy and Spain
The last section uses the developed framework of indicators for Austria, Spain and
Italy. Despite the common feature of a comparatively high tax burden on labour, the
labour market outcomes in these three countries differ widely. Austria has a low level
of unemployment and a slightly above average participation rate. Italy has an
unemployment rate somewhat above average but also one of the lowest participation
rates. Spain in contrast has a very high unemployment rate but an above average
participation rate.
Broadly speaking our framework of indicators suggest that there seems to be a strong
labour demand problem in Spain and a moderate labour demand and labour supply
problem in Italy. Taking into account cyclical aspects of the unemployment rate
confirms that at least part of the labour demand problem in Spain and Italy is due to
business cycle reasons.
Despite an increase in female labour force participation Italy still faces a labour supply
problem here. The participation rate of elderly has been increasing steadily in all three
countries, but while in Austria this did not increase the unemployment rate, the
unemployment rate rose since 2007 in Italy and Spain. Especially for the latter this
indicates a labour demand problem for the elderly. We find high youth unemployment
in both Italy and Spain. The constantly dropping participation rate in Italy points in
addition to the apparent labour demand problem also to a labour supply issue.
Unemployment rates for foreigners and low-skilled workers have increased
dramatically in Spain since the crisis in 2007. This indicates a labour demand problem
for these groups.
The mismatch and change indicators identify a strong sectoral change and an
increasing skill mismatch as labour demand side sources of the employment problems
for Spain. For Austria and Italy there seems to be relevant regional variation in the
level of unemployment, but the development is not clearly identifying whether the
regional mismatch is contributing to the employment problems.
The general fiscal situation in all three countries is such that all of them are struggling
with increasing debt levels and persistent deficits. Further all three countries have a
high implicit tax rate on labour relative to the implicit tax rate on consumption.
Dissecting the tax burden of labour into its components one finds that social security
contributions of employees make up a large part of the tax burden on labour in
Austria. In Spain and Italy the social security contributions of employers make up a
bigger share of the tax burden. This is also reflected in a high statutory total tax
European Commission
Study on the effects and incidence of labour taxation
May 2015 | 13
wedge for an average workers income. Contrasting this with our measure of the
statutory progressivity one finds that Austria and Spain have clearly regressive SSC
for both employers and employees. According to predictions from the theoretical
literature a less progressive tax burden should - for a given tax burden – result in
more unemployment. This argument should be even strong since the tax burden in
question is levied on the employers’ side. Hence the statutory structure of the tax
burden indicates a contribution of labour taxation to demand side problems, especially
for Austria and Spain. The high statutory tax burden in Italy will also contribute to the
labour demand problem.
In Italy the wage bargaining at the industry level is expected to result in shifting the
tax incidence only partially to labour further contributing to the labour demand
problem. A more – but not fully – centralized wage bargaining in Austria and Spain
should result in more tax burden shifted to workers and therefore reduce the labour
employment effects of the high tax labour burden. Additionally the link between the
social security contributions should contribute to the tax incidence of employees’ social
security contribution falling on labour. Hence a tentative conclusion from our country
examples could be that Italy should envisage a reform which reduces the employers’
social security contributions. For Austria and Spain the prediction from the tax
incidence literature indicates that the tax burden of either side of the social security
contributions should fall on the workers, at least in the longer run. Therefore a
planned reduction in the tax burden could be directed to either side. Any reform of the
social security contributions should maintain the link between the contributions and
the entitlements which further strengthens the shift of the incidence on labour. With
the incidence more likely to fall on labour in Austria or Spain, tax reforms have less
scope to reduce the labour demand problems, such as the one cause through the
sectoral shift in Spain. Nevertheless, the increase in net disposable income should at
least help to reduce the cyclical component of the employment problem in Spain.
European Commission
Study on the effects and incidence of labour taxation
May 2015 | 14
Résumé
Bien après la crise financière, la plupart des pays européens continuent d’être
confrontés à des problèmes sur le marché de l’emploi. Dans un certain nombre de
pays membres de l’Union Européenne, les interventions de l’Etat ont par ailleurs mené
à une hausse de la dette publique et à des taux d’impositions globalement élevés, en
particulier sur le facteur travail. Des réformes fiscales ciblées peuvent en conséquence
être appropriées pour améliorer le fonctionnement et les performances du marché du
travail. Une hypothèse fréquente est qu’une baisse de l’imposition du côté des
employés, c’est-à-dire une baisse des impôts sur le revenu ou des cotisations sociales
payées par les ménages, engendre une hausse de l’offre sur le marché du travail. De
manière symétrique, une baisse de la charge fiscale et des charges sociales sur les
entreprises est censée augmenter la demande sur ce marché. Cependant, la littérature
économique scientifique attire l’attention sur le fait que l’incidence économique d’une
charge fiscale est souvent différente de son incidence juridique, en présence
d’imperfections sur le marché du travail. Dans ce cas, l’impact d’une réforme fiscale
sur les performances du marché du travail dépend des interactions entre offre et
demande sur ce marché. Ces interactions sont déterminées par les changements de
comportement des agents économiques et mesurées par des élasticités. Une plus
grande élasticité, du côté de la demande ou de l’offre, donne un impact plus fort aux
réformes fiscales, le côté le moins élastique du marché portant une plus grande part
de la charge fiscale. Etant donné ce contexte, cette étude comporte quatre objectifs
principaux. Le premier est l’identification des imperfections du marché du travail qui
mènent à des problèmes d’emploi et leur attribution soit à l’offre soit à la demande de
travail, basée sur une analyse de la littérature scientifique. Comme la situation des
différentes catégories de personnes sur le marché du travail est hétérogène, nous
identifions par ailleurs les catégories socio-professionnelles les plus vulnérables aux
problèmes sur ce marché. La deuxième étape est une revue de la littérature qui
évalue l’incidence économique de la fiscalité du travail à court et long terme. Pour
connaître les déterminants de l’incidence de la fiscalité du travail, nous réalisons
également une revue de la littérature qui s’attèle aux élasticités (fiscales) de l’offre et
la demande de travail. En troisième lieu, nous passons en revue la littérature qui
étudie l’influence de l’environnement économique sur l’incidence de la fiscalité, en
particulier les mécanismes de fixation des salaires et l’environnement institutionnel.
Pour finir, les conclusions que nous dérivons de la revue de la littérature sont
amalgamées en un cadre d’analyse basé sur des indicateurs, qui permet d’identifier le
potentiel des réformes fiscales pour réduire les problèmes du marché de l’emploi liés à
la fiscalité.
Facteurs de chômage liés à l’offre et la demande de travail
L’étude commence par séparer les problèmes du marché du travail entre chômage et
non-emploi. Nous présentons l’argumentation selon laquelle le chômage tient en
majeure partie sa source du côté de la demande sur le marché du travail tandis que le
non-emploi est principalement une question d’offre sur ce marché. A titre de
conséquence, le chômage conjoncturel peut être attribué à un problème de demande
sur le marché du travail, même si cela se produit de manière indirecte par
l’intermédiaire d’une faiblesse de la demande globale et, partant, de la demande de
European Commission
Study on the effects and incidence of labour taxation
May 2015 | 15
main-d’œuvre. Dans ce contexte, il s’avère difficile de séparer clairement chômage
conjoncturel et chômage structurel, dans la mesure où les conséquences d’une
situation fiscale intenable, nécessitant par exemple un programme d’austérité,
peuvent également comprendre une baisse de la demande globale sur le long terme.
Un élément clef du chômage structurel est la présence d’inadéquations entre demande
et offre de travail. Il est par conséquent difficile d’attribuer le chômage structurel à
l’une ou l’autre des parties prenantes sur le marché du travail. Nous analysons de
quelle façon des changements socio-économiques récents – comme le vieillissement
de la population, le déclin de la fertilité, l’accroissement de la participation des
femmes sur le marché du travail ou encore l’augmentation de l’immigration –
influencent les changements d’offre et de composition de la main-d’œuvre. Dans le
même temps, une proportion probablement plus large du chômage de moyen et long
terme peut être attribuée à des changements d’envergure dans la demande de main-
d’œuvre, résultants d’évolutions au niveau des occupations et des secteurs ainsi que
de changements structurels du milieu de travail. Ces évolutions augmentent la
demande pour certaines compétences, tandis que d’autres compétences deviennent
obsolètes. Cela souligne l’importance d’indicateurs qui prennent en compte tant les
changements de l’offre que de la demande de travail, et la manière dont ces
changements coïncident. De tels indicateurs aident à l’attribution des causes des
problèmes du marché du travail à l’une ou l’autre des parties prenantes sur ce
marché. Ces indicateurs soulignent par ailleurs des problèmes structurels
fondamentaux du marché du travail qui ne sont pas la conséquence de la fiscalité du
travail. Les réformes fiscales ne sont par conséquent pas forcément la meilleure façon
de résorber les problèmes du marché de l’emploi.
L’analyse générale des problématiques de marché de l’emploi souligne par ailleurs
l’impact de la rigidité des salaires et leur contribution à un problème de demande sur
le marché du travail. Finalement, les problèmes d’incitations que génère le système
fiscal et de transfert, ainsi que les coûts d’opportunités, sont des déterminants
importants des problèmes d’offre de main-d’œuvre.
Groupes vulnérables sur le marché du travail
Les changements à la fois dans la demande et l’offre de travail laissent certaines
catégories socio-économiques dans une position vulnérable sur le marché du travail.
D’abord et avant tout les travailleurs à faible niveau de qualification sont confrontés à
des problèmes de faible demande, des transformations sectorielles réduisant la
demande pour la main-d’œuvre à faible qualification. Cette même catégorie de
travailleurs est par ailleurs celle qui est parmi la plus affectée par les rigidités qui
empêchent les ajustements par le bas des salaires. Par exemple, un salaire minimal
contraignant peut aboutir à une absence de demande pour de la main-d’œuvre à faible
productivité nécessitant un faible niveau de qualification. Etant donné les salaires
relativement peu élevés de cette main-d’œuvre, les impacts incitatifs négatifs du
système de transferts et d’impôts peuvent par ailleurs conduire à un problème d’offre
de main-d’œuvre, ce qui ajoute une dimension au problème de faible emploi de cette
catégorie de socio-économiques.
Les jeunes sont un autre groupe vulnérable sur le marché du travail. Un problème est
le fait qu’ils soient perçus comme étant instables, prêts à quitter leur employeur dès
qu’une opportunité de gagner plus d’expérience se manifeste, avant de se stabiliser
European Commission
Study on the effects and incidence of labour taxation
May 2015 | 16
dans une occupation permanente. Ils ont par ailleurs souvent des contrats flexibles et
temporaires qui ne leur garantit pas une activité professionnelle sur la durée. En
raison de leur manque d’expérience, ils sont également vus comme étant moins
productifs que le reste de la main-d’œuvre. Le problème du chômage des jeunes peut
par conséquent être largement attribué à un problème de demande sur le marché du
travail. Les immigrants, en particulier ceux venant de pays non-européens, sont
confrontés à une situation similaire sur le marché du travail. Leur éducation et
expérience professionnelle préalable, acquises à l’étranger, n’est souvent pas
reconnue de manière adéquate par les employeurs, de sorte que les immigrants soient
confrontés à un problème de demande sur le marché du travail. De plus, si
l’augmentation des flux d’immigration permet de réduire les problèmes de disparités
géographiques, elle contribue également à un changement relativement rapide de
l’offre de main-d’œuvre. Une résultante potentielle est un excédent de certains types
de travailleurs. Bien que la situation des personnes âgées se soit améliorée de
manière régulière durant la dernière décennie, elles sont toujours confrontées à
certaines difficultés sur le marché de l’emploi. En raison du vieillissement de la
population, l’offre de travailleurs âgés est croissante. Dans le même temps, la
demande pour ces travailleurs ne suit pas, en raison de la perception fréquente que
ces travailleurs sont de plus faible productivité, qu’ils sont peu intéressés à investir
dans leur développement et incapables d’acquérir de nouvelles compétences ni de
suivre les changements rapides du marché. A l’heure actuelle, les contrats à durée
indéterminée, qui les protègent contre les pertes immédiates d’emplois, contribuent à
maintenir leur taux d’emploi. Cependant, il leur est difficile de retrouver un emploi s’ils
se trouvent au chômage, souvent en raison d’une baisse de la demande pour leurs
compétences.
Le rôle des femmes sur le marché du travail s’est transformé de manière profonde, en
particulier en raison des initiatives et des débats sur ce sujet qui ont eu lieu sur
plusieurs décennies. L’écart entre taux d’emploi des femmes et des hommes s’est
encore réduit de manière significative ces dix dernières années et le taux de
participation des femmes sur le marché du travail a encore augmenté. Malgré ces
accomplissements, il reste une disparité entre participation des femmes et des
hommes. Pour une grande part, cette disparité est due à des problématiques d’offre
de main-d’œuvre, dans la mesure où les femmes restent largement en charge de la
garde des enfants, de celles des personnes âgées de la famille ou d’autres activités
non marchandes du ménage. L’équilibre entre activité professionnelle et activités du
ménage débouche donc souvent sur une participation au marché du travail plus faible
pour les femmes. En termes d’indicateurs, cette section suggère que la première étape
soit une séparation des problématiques du marché de l’emploi. Considérer de manière
séparée chômage et non-emploi doit fournir une première impression sur la partie du
marché du travail, offre ou demande, qui recèle les plus grands problèmes.
Revue de la littérature sur l’incidence de la fiscalité du travail
L’analyse de la littérature sur l’incidence de la fiscalité du travail révèle une absence
de consensus sur qui, de l’employé ou de l’employeur, porte la charge fiscale. Dans
une méta-analyse récente, Melguizo et González-Páramo (2013) parviennent à la
conclusion qu’en moyenne deux tiers de la charge fiscale liée au travail est portée par
les employés. Cependant, la variation d’un pays à l’autre est trop grande pour que
European Commission
Study on the effects and incidence of labour taxation
May 2015 | 17
cette estimation soit considérée comme précise. Il est néanmoins possible de dériver
un certain nombre de résultats intermédiaires de la revue de la littérature.
Malgré l’absence d’une réponse claire sur la question de l’incidence fiscale, la
littérature indique toutefois qu’il y a un degré de partage de la charge fiscale, sur le
court et le long terme. La deuxième conclusion majeure est que l’estimation de
l’incidence fiscale sur le long terme n’arrive pas à traiter facilement les problématiques
d’identification statistique. A notre connaissance, il n’existe pas à l’heure actuelle
d’étude convaincante sur les effets à moyen terme ni sur les processus d’ajustements.
La question de savoir si l’incidence juridique joue un rôle ou non demeure également
sans véritable réponse empirique. L’absence de preuve empirique ferme sur la
proposition d’invariance de l’incidence fournit une conclusion provisoire, à savoir que
l’incidence juridique joue un rôle, au moins sur le court terme.
Les résultats sur l’incidence fiscale varient d’un pays à l’autre. Une partie de la
différence de ces résultats peut être attribuée au rôle non-négligeable de la
centralisation dans le processus de négociation entre acteurs du marché du travail.
Les analyses empiriques montrent de manière relativement robuste qu’un plus grand
degré de centralisation fait porter une plus grande partie de la charge fiscale sur
l’employé, tandis que des niveaux intermédiaires de coordination mènent à faire
porter une plus grande partie de la charge fiscale sur l’employeur.
Revue de la littérature sur les élasticités de l’offre et de la demande de travail
En suivant l’argumentation de Metcalf (2002), la question de l’incidence fiscale peut
aussi être vue comme la question des élasticités relatives de l’offre et de la demande
sur le marché du travail. L’analyse des deux parties correspondantes de la littérature
permet de former quelques conclusions provisoires. Premièrement, les élasticités
concernant l’offre de main-d’œuvre apparaissent déclinantes au cours du temps. Des
méta-analyses récentes les situent aux alentours de 0.3 à 0.4. L’élasticité totale est
définie pour une large part par la marge extensive, tandis que les élasticités à la
marge intensive sont proches de zéro. De plus, les études récentes analysées par Saez
et al. (2012b) et qui exploitent des données de déclaration fiscale parviennent à la
conclusion que les élasticités à la marge intensive sont surtout dues à des effets de
déclaration. La littérature est également assez claire sur les différences d’élasticités à
la marge extensive d’un groupe socio-économique à l’autre. Les femmes, et en
particulier les mères élevant leurs enfants seules, offrent leur travail de manière plus
élastique. Les hommes offrent en général leur travail de manière plus élastique à la
marge extensive au début et à la fin de leur carrière, périodes de leur vie pendant
lesquelles ils sont confrontés à un choix entre travail et éducation, respectivement
retraite précoce.
En ce qui concerne les élasticités de demande de main-d’œuvre, une méta-analyse
récente réalisée par Lichter et al. (2014) suggère que les élasticités augmentent au
cours du temps, une élasticité moyenne de -0.3 représentant la valeur la plus
probable pour les auteurs de l’analyse. Des valeurs plus élevées sont trouvées pour
l’élasticité sur le long terme, les contrats à durée déterminée ainsi que pour la main-
d’œuvre faiblement qualifiée.
European Commission
Study on the effects and incidence of labour taxation
May 2015 | 18
Cadre d’analyse à base d’indicateurs
La revue des différentes branches de la littérature fournit un guide pour le
développement d’un cadre de 25 indicateurs basés sur des données. Ces indicateurs
sont rassemblés dans un cadre simple et utilisés pour différencier les problèmes
rencontrés sur le marché de l’emploi et pour développer notre compréhension sur la
capacité des réformes fiscales à améliorer le fonctionnement du marché de l’emploi.
A partir de la classification initiale des problèmes du marché de l’emploi, nous dérivons
un premier ensemble d’indicateurs pour établir une séparation de ces problèmes entre
non-emploi, chômage et chômage structurel. En nous basant sur la discussion des
groupes vulnérables sur le marché du travail, nous établissons une séparation entre
chômage et non-participation pour chaque catégorie socio-économique. L’impact des
inadéquations entre demande et offre de travail est pris en compte par des indicateurs
sur les inadéquations de compétence et de secteur. La responsabilité de l’offre de
main-d’œuvre dans les inadéquations est de plus prise en compte par des indicateurs
de changements dans les secteurs et les compétences.
La conclusion la plus importante d’une revue de la littérature sur l’incidence fiscale est
que l’incidence juridique joue un rôle probable. Cela requiert un examen plus détaillé
de la composition de la charge fiscale liée au travail. A cette fin nous incluons des
mesures de la charge fiscale implicite, des mesures sur les taux d'imposition légaux
pour l’imposition des personnes et pour les contributions sociales tant des employeurs
que des employés.
L’analyse de la littérature sur l’offre de main-d’œuvre renforce l’importance
d’indicateurs qui fassent une distinction entre groupes socio-économiques. Par ailleurs,
l’offre de main-d’œuvre est plus élastique à la marge extensive, en particulier pour les
jeunes qui sont confrontés à un choix entre travail et éducation ainsi que pour les
mères, confrontées à un choix entre travail et production domestique. Cela souligne le
rôle des politiques publiques de l’état, qui peuvent modifier les incitations à travailler.
Parmi les institutions qui influencent la fixation des salaires, le rôle de la négociation
salariale est encore une fois souligné, un mécanisme centralisé conduisant à une
charge fiscale plus forte pour les employés qu’avec des négociations au niveau des
secteurs. Des salaires minimaux vont par ailleurs influencer les résultats sur le marché
du travail. Dans le cas où ils sont contraignants, l’incidence fiscale est claire et repose
uniquement sur l’employeur. Même dans le cas où ils ne sont pas contraignants, la
littérature suggère de plus que les salaires minimaux contribuent aux problèmes sur le
marché du travail dus à la fiscalité du travail.
Les résultats théoriques suggèrent que l’imposition progressive des revenus des
personnes a un impact sur le marché du travail, lorsque l’efficacité de celui-ci est
pénalisée par la présence d’inadéquations. Pour un niveau de charge fiscale donné, un
système fiscal plus progressif diminue les efforts de recherche de travail des
personnes au chômage parce qu’une plus grande part du gain monétaire généré en
cas d’obtention d’un emploi est perdue sous forme d’impôts. De manière similaire, les
incitations à payer des salaires d’efficiences supérieurs au seuil d’équilibre entre offre
et demande sont diminuées en présence d’un système fiscal progressif. Malgré
l’absence de validation empirique robuste de ces théories, nous incluons tout de même
des mesures de progressivité du système fiscal parmi les indicateurs.

European Commission
Study on the effects and incidence of labour taxation
May 2015 | 19
Une analyse de la littérature sur l’impact des systèmes de sécurité sociale sur l’offre
de main-d’œuvre souligne l’importance de mesures liées au chômage et au « piège de
participation ». La réception d’allocations sociales en espèces ou en nature peut créer
des incitations négatives, lesquelles peuvent se transformer en problèmes d’offre de
main-d’œuvre et au final, d’emploi. Un autre aspect particulièrement important pour
l’offre de main-d’œuvre des femmes est la disponibilité d’emplois à temps partiel et la
possibilité de congés de maternité ou de congés parentaux.
L’exemple de l’Autriche, de l’Espagne et de l’Italie
Cette dernière section utilise les indicateurs du cadre d’analyse pour l’Autriche,
l’Espagne et l’Italie. Malgré le fait que ces pays aient tous une charge fiscale sur le
travail comparativement élevée, l’état du marché du travail dans ces trois pays diffère
fortement. L’Autriche a un taux de chômage bas et le taux de participation est
légèrement au-dessus de la moyenne. L’Italie a un taux de chômage quelque peu au-
dessus de la moyenne mais également un des taux de participation les plus faibles.
L’Espagne, par contraste, a un taux de chômage très élevé ainsi qu’un taux de
participation plus large que la moyenne.
En termes généraux, notre cadre d’analyse suggère un problème important de
demande de main-d’œuvre en Espagne ainsi que des problèmes modérés d’offre et de
demande de travail en Italie. Tenir compte des aspects cycliques du taux de chômage
confirme l’hypothèse qu’une partie des problèmes de demande de main-d’œuvre en
Italie et en Espagne soit conjoncturelle.
Malgré l’augmentation de la participation des femmes sur le marché du travail en
Italie, le pays continue d’être confronté à des problèmes d’offre de main-d’œuvre. Le
taux de participation des personnes âgées s’est élevé de manière continue dans les
trois pays. Alors que cette augmentation n’a pas été accompagnée d’une
augmentation du taux de chômage en Autriche, ce n’est pas le cas pour l’Espagne et
l’Italie, où le taux de chômage s’est accru depuis 2007. En particulier pour l’Espagne,
ces transformations mettent en évidence un problème de demande de main-d’œuvre
pour les travailleurs âgés. Le problème du chômage des jeunes se retrouve aussi bien
en Espagne qu’en Italie. En plus d’un problème de demande de main-d’œuvre, la
diminution régulière du taux de participation des jeunes en Italie suggère la présence
d’un problème d’offre pour cette catégorie de la population. Le taux de chômage des
étrangers et des personnes à faible qualification s’est accru de manière dramatique en
Espagne depuis la crise de 2007, ce qui indique un problème de demande sur le
marché du travail pour ces groupes.
Les indicateurs d’inadéquations de compétence, secteur et de changement permettent
d’identifier en Espagne de forts changements sectoriels ainsi qu’une augmentation des
inadéquations de compétences, tous deux attribuant à la demande de main-d’œuvre la
source des problèmes sur le marché de l’emploi. Aussi bien en Autriche qu’en Italie,
on observe une variation du niveau de chômage d’une région à une autre, mais leur
développement ne permet pas de conclure clairement que la disparité régionale
contribue aux problèmes du marché de l’emploi.
La situation fiscale générale dans chacun des trois pays est difficile, tous étant
confrontés à des dettes publiques croissantes et des déficits persistants. Les trois pays
ont par ailleurs un taux implicite d’imposition du travail qui est supérieur aux taux
European Commission
Study on the effects and incidence of labour taxation
May 2015 | 20
implicite sur la consommation. Décomposant la charge fiscale sur le travail en Autriche
montre que les cotisations sociales des employés constituent une grande part de la
charge totale. En Espagne et en Italie, les cotisations sociales des employeurs
représentent la plus grande part de la charge fiscale. Ces conclusions sont également
reflétées par des hautes valeurs des taux d’impositions légaux totaux pour un revenu
de travailler moyen. Par contraste, utilisant notre mesure de progressivité de
l’imposition légale, il s’avère que le système de cotisations sociales est clairement
régressif en Autriche et en Espagne, aussi bien pour les cotisations des employés que
pour celles des employeurs. Selon la littérature théorique, un système de taxation
moins progressif doit, à charge fiscale équivalente, résulter en un taux de chômage
plus élevé. Ces prédictions sont encore renforcées par le fait que la charge fiscale est
collectée du côté des employeurs. Il apparaît ainsi de la structure légale de
l’imposition que la fiscalité du travail contribue aux problèmes de demande de main-
d’œuvre, en particulier pour l’Autriche et pour l’Espagne. Le taux d’imposition légal
élevé en Italie doit par ailleurs également contribuer aux problèmes de demande de
main-d’œuvre.
En Italie, le fait que la négociation salariale se situe au niveau des secteurs doit placer
une plus grande partie de l’incidence fiscale sur les employeurs, ce qui doit contribuer
aux problèmes de demande de main-d’œuvre. Un mécanisme de négociation plus
centralisé en Autriche et en Espagne, sans toutefois être complètement central, doit
conduire à placer une plus grande partie de la charge fiscale sur les employés,
réduisant les effets d’une taxation élevée sur l’emploi. De plus, le lien entre cotisations
sociales devrait aussi contribuer à ce que la charge des cotisations sociales des
employés soit portée par le travail. Une conclusion possible de notre analyse de ces
trois pays est que l’Italie pourrait faire une réforme visant à réduire les cotisations
sociales des employeurs. Pour l’Autriche et l’Espagne, les prévisions de la littérature
sur l’incidence fiscale suggèrent que la charge fiscale émanant des cotisations sociales
à la fois des employés et des employeurs repose sur les épaules des employés, du
moins sur le long terme. Une réduction planifiée de la charge fiscale de l’une ou l’autre
des parties pourrait par conséquent être envisagée. Toute réforme du système de
cotisations sociales doit maintenir le lien entre contributions et prestations, ce qui
affermit le transfert de la charge sur le travail. L’incidence fiscale reposant moins sur
les épaules des employés en Autriche et en Espagne, les réformes fiscales dans ces
pays ont moins de chance de réduire les problèmes de demande de main-d’œuvre, tel
que celui qui est créé par les changements sectoriels en Espagne. Toutefois,
l’accroissement du revenu disponible net devrait aider à la réduction des problèmes
conjoncturels d’emploi en Espagne.
European Commission
Study on the effects and incidence of labour taxation
May 2015 | 21
1. Introduction
1.1. Background
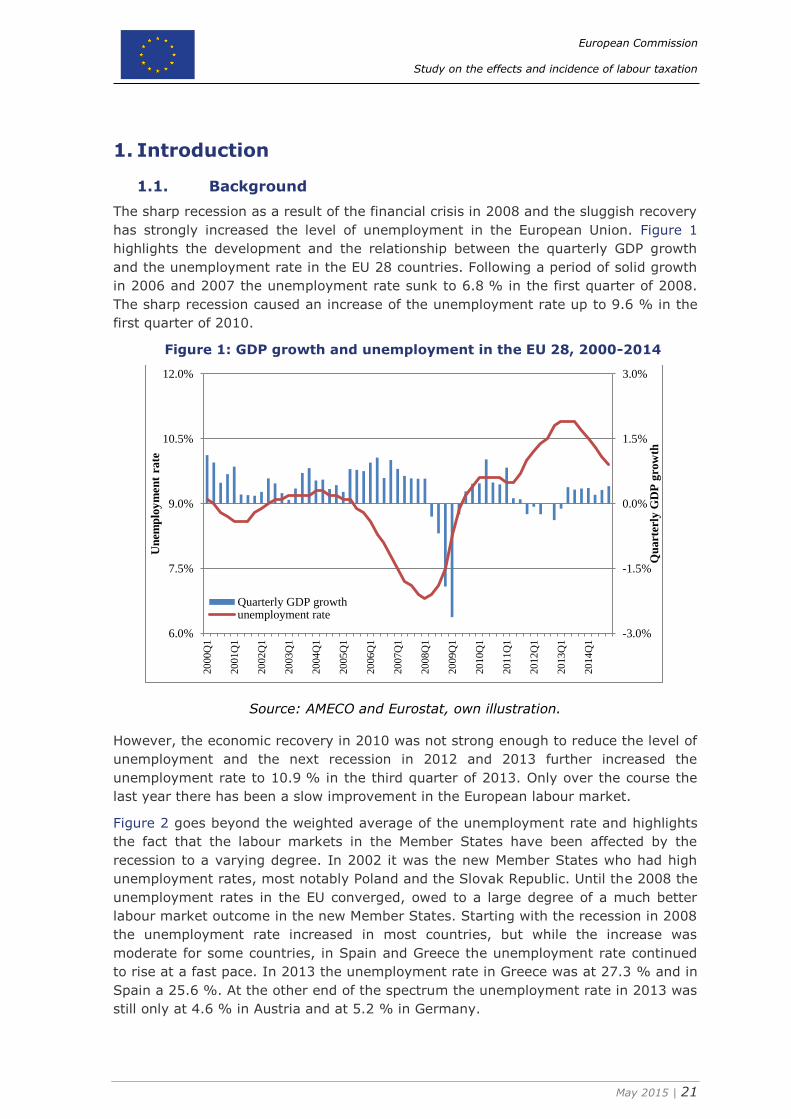
The sharp recession as a result of the financial crisis in 2008 and the sluggish recovery
has strongly increased the level of unemployment in the European Union. Figure 1
highlights the development and the relationship between the quarterly GDP growth
and the unemployment rate in the EU 28 countries. Following a period of solid growth
in 2006 and 2007 the unemployment rate sunk to 6.8 % in the first quarter of 2008.
The sharp recession caused an increase of the unemployment rate up to 9.6 % in the
first quarter of 2010.
Figure 1: GDP growth and unemployment in the EU 28, 2000-2014
Source: AMECO and Eurostat, own illustration.
However, the economic recovery in 2010 was not strong enough to reduce the level of
unemployment and the next recession in 2012 and 2013 further increased the
unemployment rate to 10.9 % in the third quarter of 2013. Only over the course the
last year there has been a slow improvement in the European labour market.
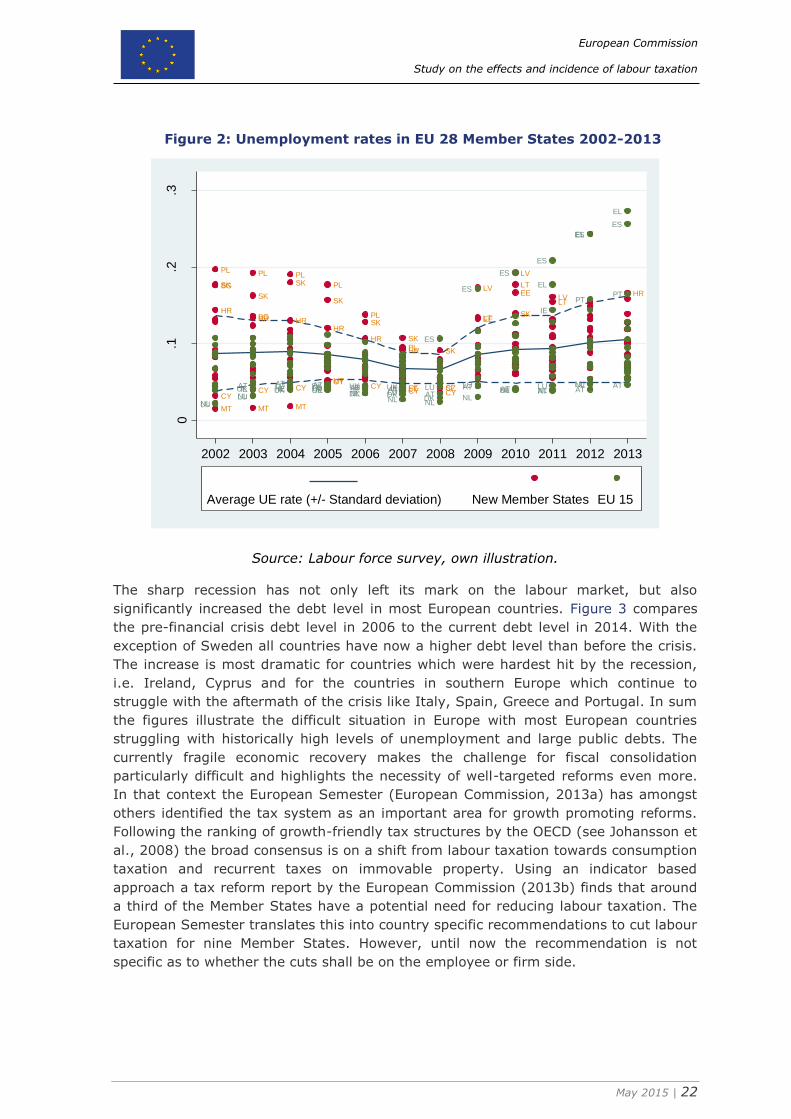
Figure 2 goes beyond the weighted average of the unemployment rate and highlights
the fact that the labour markets in the Member States have been affected by the
recession to a varying degree. In 2002 it was the new Member States who had high
unemployment rates, most notably Poland and the Slovak Republic. Until the 2008 the
unemployment rates in the EU converged, owed to a large degree of a much better
labour market outcome in the new Member States. Starting with the recession in 2008
the unemployment rate increased in most countries, but while the increase was
moderate for some countries, in Spain and Greece the unemployment rate continued
to rise at a fast pace. In 2013 the unemployment rate in Greece was at 27.3 % and in
Spain a 25.6 %. At the other end of the spectrum the unemployment rate in 2013 was
still only at 4.6 % in Austria and at 5.2 % in Germany.
-3.0%
-1.5%
0.0%
1.5%
3.0%
6.0%
7.5%
9.0%
10.5%
12.0%
20
00Q
1
20
01Q
1
20
02Q
1
20
03Q
1
20
04Q
1
20
05Q
1
20
06Q
1
20
07Q
1
20
08Q
1
20
09Q
1
20
10Q
1
20
11Q
1
20
12Q
1
20
13Q
1
20
14Q
1
Qu
art
erly
GD
P g
row
th
Un
emp
loy
men
t ra
te
Quarterly GDP growthunemployment rate
European Commission
Study on the effects and incidence of labour taxation
May 2015 | 22
Figure 2: Unemployment rates in EU 28 Member States 2002-2013
Source: Labour force survey, own illustration.
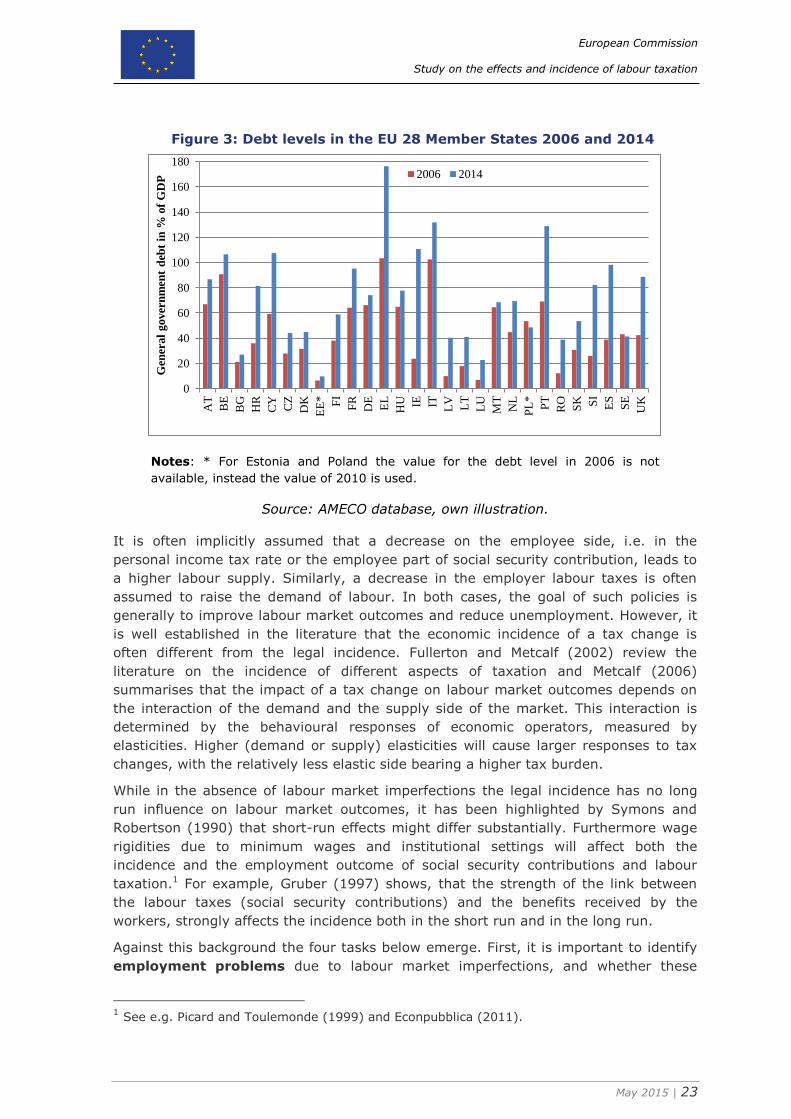
The sharp recession has not only left its mark on the labour market, but also
significantly increased the debt level in most European countries. Figure 3 compares
the pre-financial crisis debt level in 2006 to the current debt level in 2014. With the
exception of Sweden all countries have now a higher debt level than before the crisis.
The increase is most dramatic for countries which were hardest hit by the recession,
i.e. Ireland, Cyprus and for the countries in southern Europe which continue to
struggle with the aftermath of the crisis like Italy, Spain, Greece and Portugal. In sum
the figures illustrate the difficult situation in Europe with most European countries
struggling with historically high levels of unemployment and large public debts. The
currently fragile economic recovery makes the challenge for fiscal consolidation
particularly difficult and highlights the necessity of well-targeted reforms even more.
In that context the European Semester (European Commission, 2013a) has amongst
others identified the tax system as an important area for growth promoting reforms.
Following the ranking of growth-friendly tax structures by the OECD (see Johansson et
al., 2008) the broad consensus is on a shift from labour taxation towards consumption
taxation and recurrent taxes on immovable property. Using an indicator based
approach a tax reform report by the European Commission (2013b) finds that around
a third of the Member States have a potential need for reducing labour taxation. The
European Semester translates this into country specific recommendations to cut labour
taxation for nine Member States. However, until now the recommendation is not
specific as to whether the cuts shall be on the employee or firm side.
BG
HR
CY
MT
PL
SK
BGHR
CY
MT
PL
SK
HR
CY
MT
PLSK
HR
CYMT
PL
SK
HR
CY
PLSK
HR
CYEELT
PLSK
CYCZ
SK
SI
EE
LV
LT
EE
LV
LT
SK
LVLT
HR
LUNL
ATIELUNLUK
ATIELUNLUK
ATDKIELUNLUK AT
DKIELU
NLUK
ATDKIE
LUNL
UKATDK
LU
NL
ES
ATLU
NL
ES
ATLUNL
ES
AT
EL
IE
LUNL
ES
AT
EL
LUNL
PT
ES
AT
EL
PT
ES
0.1
.2.3
Une
mplo
ym
ent ra
te
2002 2003 2004 2005 2006 2007 2008 2009 2010 2011 2012 2013
Average UE rate (+/- Standard deviation) New Member States EU 15
European Commission
Study on the effects and incidence of labour taxation
May 2015 | 23
Figure 3: Debt levels in the EU 28 Member States 2006 and 2014
Notes: * For Estonia and Poland the value for the debt level in 2006 is not
available, instead the value of 2010 is used.
Source: AMECO database, own illustration.
It is often implicitly assumed that a decrease on the employee side, i.e. in the
personal income tax rate or the employee part of social security contribution, leads to
a higher labour supply. Similarly, a decrease in the employer labour taxes is often
assumed to raise the demand of labour. In both cases, the goal of such policies is
generally to improve labour market outcomes and reduce unemployment. However, it
is well established in the literature that the economic incidence of a tax change is
often different from the legal incidence. Fullerton and Metcalf (2002) review the
literature on the incidence of different aspects of taxation and Metcalf (2006)
summarises that the impact of a tax change on labour market outcomes depends on
the interaction of the demand and the supply side of the market. This interaction is
determined by the behavioural responses of economic operators, measured by
elasticities. Higher (demand or supply) elasticities will cause larger responses to tax
changes, with the relatively less elastic side bearing a higher tax burden.
While in the absence of labour market imperfections the legal incidence has no long
run influence on labour market outcomes, it has been highlighted by Symons and
Robertson (1990) that short-run effects might differ substantially. Furthermore wage
rigidities due to minimum wages and institutional settings will affect both the
incidence and the employment outcome of social security contributions and labour
taxation.1 For example, Gruber (1997) shows, that the strength of the link between
the labour taxes (social security contributions) and the benefits received by the
workers, strongly affects the incidence both in the short run and in the long run.
Against this background the four tasks below emerge. First, it is important to identify
employment problems due to labour market imperfections, and whether these
1 See e.g. Picard and Toulemonde (1999) and Econpubblica (2011).
0
20
40
60
80
100
120
140
160
180
AT
BE
BG
HR
CY
CZ
DK
EE
* FI
FR
DE
EL
HU IE IT LV
LT
LU
MT
NL
PL
*
PT
RO
SK SI
ES
SE
UK
Gen
eral
gover
nm
ent
deb
t in
% o
f G
DP
2006 2014
European Commission
Study on the effects and incidence of labour taxation
May 2015 | 24
problems originate more on the labour supply or on the labour demand side. The
next step is to review the literature which assesses the short-run and long-run
economic incidence of labour taxation. To further break down the incidence into its
underlying determinants we also review the literature on the (tax) elasticities of labour
supply and labour demand. Then the literature on the influence of the economic
environment on the tax incidence outcome, most notably the wage setting
mechanisms and the institutional background, is reviewed. Finally the findings of
the literature review are brought together in a framework to identify the potential
of tax reforms to reduce tax related employment problems.
1.2. Objective and tasks
The specific tasks of the study are structured along the tasks stated in the terms of
reference and include:
a review of the economic literature on the identification of labour demand and
labour supply as source of employment problems;
a review of the economic literature on short-term and long-term tax incidence on
labour;
a review of the economic literature on how the different labour market
institutions/regulations (employment protection legislation, unemployment benefits,
minimum wage, wage setting institutions and trade unions etc.) influence the
incidence and effects of labour taxation on employment outcomes, also across
various categories of workers such as e.g. the low-skilled, women the young and
older workers;
from the above analysis a framework to identify when employment problems are
tax-related and the estimated efficiency of tax measures to fix these problems.
European Commission
Study on the effects and incidence of labour taxation
May 2015 | 25
2. Review of the sources of employment problems
It is beyond the scope of this study to exhaustively cover all the literature on
employment problems.2 Rather than trying to do so, we aim for a general overview,
which will guide us in the development of indicators. Based on the idea, that in the
presence of labour market imperfections, the effectiveness of labour tax cuts in
increasing employment could be improved by directing reductions towards the side of
the market which is the source of employment problems, the focus of this overview is
therefore the question whether the sources of the employment problems can be
attributed to mainly the labour demand or the labour supply side.
2.1. A broad characterisation of employment problems
Before we set out to review the literature on the sources of employment problems, it
is useful to broadly classify and describe what we intend to capture with the term
employment problems. Table 1 provides a summary of our classification of
employment problems and their main sources. We broadly distinguish between
unemployment, and under- and non-employment, also referred to as out of the
workforce. While the necessity and usefulness of this distinction was debated in the
earlier literature, it was stressed prominently by Flinn and Heckman (1983) analysing
the transition between the different employment states. Similarly, Murphy and Topel
(1997) show that focusing exclusively on unemployment may increasingly fall short of
capturing the full extent of employment problems, as many workers may decide to
stop looking for a job and leave the workforce if their job prospects are bleak.3
Therefore we subsume under the term employment problems unemployment, under-
employment and a large part of non-employment. The most obvious aspect and most
visible part of the employment problem consists of unemployment, defined as the
share of the workforce who wants to work and does not find employment. Hence the
defining feature of unemployment is that it is involuntary and that those afflicted
actively search for a job. There are various different definitions for unemployment
which vary mostly along the criteria of active job search. For example Eurostat – in
line with the International Labour Organization (ILO) - defines unemployed persons as
someone aged 15 to 74 without work during the reference week who is available to
start work within the next two weeks and who has actively sought employment at
some time during the last four weeks.4 Unless otherwise specified we follow this
definition of unemployment throughout this study. However, the ILO definition of
unemployment is rather narrow, since it excludes everyone, who stopped actively
searching for a job, is not immediately available for work or has a temporary
employment during the observation period. Therefore simply looking at unemployment
would fall short of covering the full extent of the employment problems. Therefore we
also include under- and non-employment, defined as the share of the population
2 The broader overview can be found in three partly complementing books on unemployment:
Layard et al. (2005), Pissarides (2000) and Phelps (1994). See also Blanchard (2007) for a discussion about the relative strength and weaknesses of the respective books. 3 For a more recent discussion see also Jones and Riddell (2006). 4 For the exact definition see the glossary for unemployment on the Eurostat webpage:
http://ec.europa.eu/eurostat/statistics-explained/index.php/Glossary.
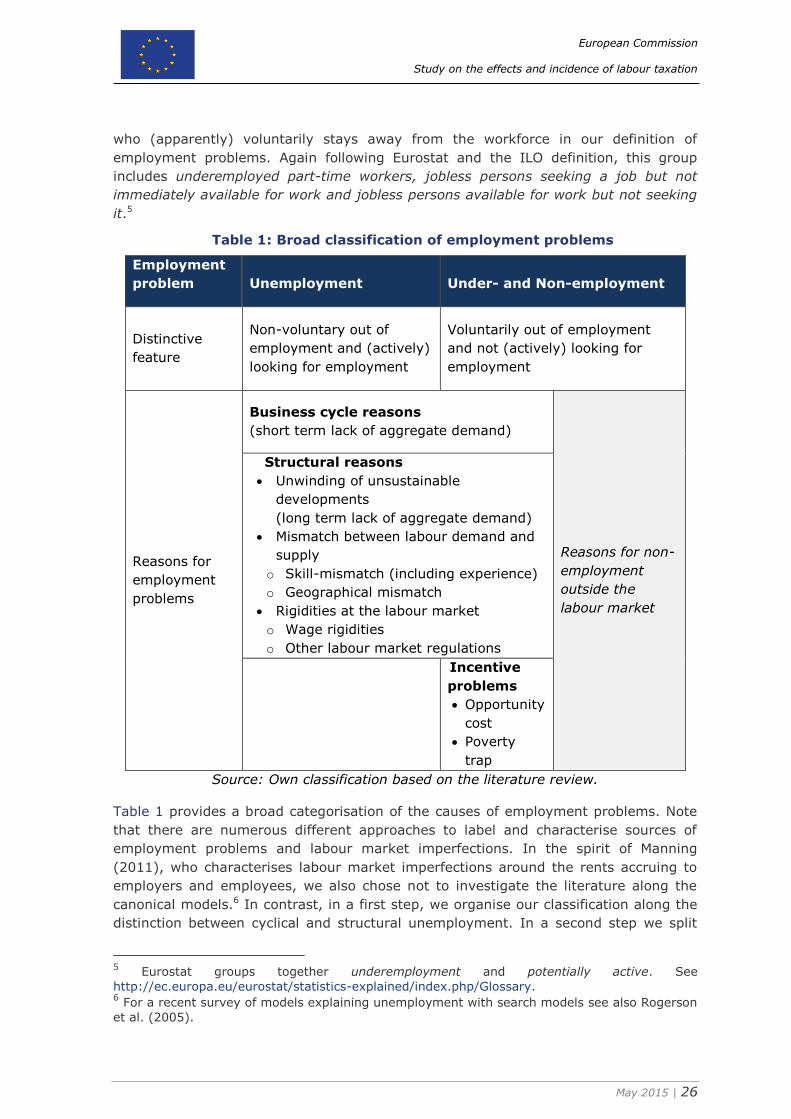
European Commission
Study on the effects and incidence of labour taxation
May 2015 | 26
who (apparently) voluntarily stays away from the workforce in our definition of
employment problems. Again following Eurostat and the ILO definition, this group
includes underemployed part-time workers, jobless persons seeking a job but not
immediately available for work and jobless persons available for work but not seeking
it.5
Table 1: Broad classification of employment problems
Employment
problem Unemployment Under- and Non-employment
Distinctive
feature
Non-voluntary out of
employment and (actively)
looking for employment
Voluntarily out of employment
and not (actively) looking for
employment
Reasons for
employment
problems
Business cycle reasons
(short term lack of aggregate demand)
Reasons for non-
employment
outside the
labour market
Structural reasons
Unwinding of unsustainable
developments
(long term lack of aggregate demand)
Mismatch between labour demand and
supply
o Skill-mismatch (including experience)
o Geographical mismatch
Rigidities at the labour market
o Wage rigidities
o Other labour market regulations
Incentive
problems
Opportunity
cost
Poverty
trap
Source: Own classification based on the literature review.
Table 1 provides a broad categorisation of the causes of employment problems. Note
that there are numerous different approaches to label and characterise sources of
employment problems and labour market imperfections. In the spirit of Manning
(2011), who characterises labour market imperfections around the rents accruing to
employers and employees, we also chose not to investigate the literature along the
canonical models.6 In contrast, in a first step, we organise our classification along the
distinction between cyclical and structural unemployment. In a second step we split
5 Eurostat groups together underemployment and potentially active. See
http://ec.europa.eu/eurostat/statistics-explained/index.php/Glossary. 6 For a recent survey of models explaining unemployment with search models see also Rogerson
et al. (2005).
European Commission
Study on the effects and incidence of labour taxation
May 2015 | 27
the reasons for structural unemployment into problems resulting from a mismatch
between labour supply and demand and problems resulting from rigidities in the
labour market. Additionally there are specific incentive problems that only contribute
to under- and non-employment.
One needs to bear in mind that not all persons voluntarily staying away from the
workforce are effectively contributing to an employment problem. Ideally, we would
only want to include those who are interested to participate (more) in the workforce,
but choose not to actively seek (more) work, because of discouraging circumstances
at the labour market. In our classification in Table 1 the share of non-employment
which is not caused by adverse labour market conditions is represented by the shaded
area. This part of non-employment includes for example women preferring to care for
their children at home despite the sufficiently profitable opportunities to go back to
work, young people choosing to travel, or older people choosing early retirement
despite the availability of suitable positions.
In terms of the distinction between labour demand and labour supply as the source of
the employment problems, one can start from the broad categorisation that
unemployment is the result of a labour demand problem and under- or non-
employment stems from a labour supply problem. This relationship only partly holds,
since the underlying reason for persons not seeking employment can be the lack of
suitable positions because of a labour demand problem. Similarly the reason for firms
not hiring available workforce could ultimately be due to inadequate quality of the
labour supplied or other underlying causes. Nevertheless it can be useful as a starting
point to attribute unemployment more to the labour demand side and non-
employment more to the labour supply side. In the following we will briefly discuss
where this generalisation appropriate and where caution is in order.
2.1.1. Cyclical and structural employment problems
It is useful to first distinguish short-term and demand-driven problems from longer
term structural problems. In recessionary times the aggregate demand falls and in
consequence the labour demand is also subdued. While this also creates an
employment problem which is due to labour demand problems, this is not the type of
labour demand problems, which should primarily be addressed by directed labour
taxation reforms. In practice it is however difficult to separate short-term cyclical from
structural long-term employment problems. One concept of the structural
unemployment rate is the non-accelerating wage rate of unemployment (NAWRU), the
level of unemployment the economy would settle into in the absence of shocks (see
e.g. Orlandi, 2012). The remaining part of unemployment is then solely due to
business cycle effects, the short term lack of aggregate demand resulting in higher
unemployment. For the purpose of this report we are less interested in business cycle
effects, but rather in the structural unemployment resulting from labour market
imperfections. However, the distinction is not as clear as it appears, since large shocks
in aggregate demand can result in an increase in the structural unemployment. For
example, Orlandi (2012) mentions the bust of the housing price bubble, which can
result in a long term reduction of demand to unwind a previously unsustainable
European Commission
Study on the effects and incidence of labour taxation
May 2015 | 28
development.7 Similarly, the necessary longer-term fiscal consolidation to reduce
excessive public debt can be seen as a situation where the previously unsustainably
high level of public consumption needs to be corrected. Therefore, some of the
previously cyclical employment problems can manifest themselves in structural
unemployment problems if a long term adjustment is necessary.
In particular the concurrence of the strict fiscal consolidation, also debated as
austerity programs, and the continuing employment problems in Europe have
provoked an emotional debate, whether and to which the sudden withdrawal of public
expenditure is contributing to the employment problems. The economic literature has
largely focussed on the growth effects of government consumption and only recently
addressed the employment effects of government consumption. Using a structural
VAR approach Brückner and Pappa (2012) find that government spending can increase
both unemployment and employment as a result of an increased participation rate.
Dallari (2014) relies also on a structural VAR approach to directly address how recent
cuts in government expenditures have affected unemployment in a number of
European countries and find very heterogeneous results among countries. In contrast,
Turrini (2013) analyses the same question using a narrative approach, i.e. he
identifies episodes of discretionary fiscal consolidation, and finds a negative
employment effect overall. However, at closer inspection fiscal consolidation result
affects job separation and job finding rates differently depending on the strength of
employment protection measures. In consequence the impact of fiscal consolidation
may well be different in the longer run, depending on the labour market institutions.
The tentative conclusion from the existing literature therefore is that necessary
austerity programs are likely to contribute to short term cyclical unemployment.
Whether this unemployment manifest itself in longer term structural unemployment
depends on other aspects of the labour market.
2.1.2. Mismatch between labour supply and labour demand
Structural unemployment because of a mismatch between the labour supplied by the
workforce and the labour demanded has per definition both a labour supply and a
labour demand dimension. The underlying assumption that employment problem can
be reduced by a labour tax reduction on the appropriate side might be less applicable
here, since labour taxation only affects the incentives to overcome the mismatch. The
mismatch itself cannot be directly addressed by labour taxation reforms.
The mismatch between labour demand and can have different causes. The jobs
offered might require specific qualifications and skills which are not sufficiently
offered by the available workforce because they lack the necessary education or
experience. From the outset, it seems somewhat puzzling that in times with high
unemployment and the easy dissemination of information via the internet, firms
struggle to find the matching employees. However, as Manning (2011) highlights, job
and employee specific idiosyncrasies can create a match-specific rents, resulting in
frictions in the matching function. Therefore even with an apparent abundance of
adequate work force it can be difficult to find the worker which is suitable for the
7 Orlandi (2012) refers to evidence for US states provided by Estevão and Tsounta (2011), but
the results are easily transferable to Europe for countries like Spain and to a somewhat lesser extent Ireland.
European Commission
Study on the effects and incidence of labour taxation
May 2015 | 29
vacancy. Another aspect of these idiosyncrasies implies that even workers with
sufficient formal education may fall short of the necessary job related skills. Chevalier
(2003) also points out skill heterogeneity within the same educational group. Thus, in
the more recent literature there has been a clearer focus on the distinction between
the level of education and the skill level (see for example Quintini, 2011).8
While the discussion about search and matching problems in the labour market has
seen a strong increase following the seminal contribution by Mortenson and Pissarides
(1994), the consensus at the moment appears to be that these mismatches are
insufficient to fully explain patterns in cyclical unemployment (for an overview see
Rogerson and Shimer, 2011) and structural unemployment (see Barlevy, 2011, for an
application to the US labour market).
A further reason for matching problems can be geographical distance between the
residence of the employees and the work place. Whereas migration caused by the
pursuit of employment opportunities has been of longstanding interest in countries
with high labour mobility like the United States (see e.g. Pissarides and Wadworth,
1989), the view that the low geographical mobility of the workforce in continental
Europe creates employment problems is somewhat newer.9
Irrespective of the kind of mismatch, there is always a labour demand and labour
supply side aspect to the disparity. While it is not always straightforward to attribute
the cause of the mismatch to one side only, section 2.2 sets out to classify the most
important aspects of changes and trends contributing to mismatches in the labour
market.
2.1.3. Rigidities in wages and the labour market
Rigidities in the labour market can cause employment problems if they result in a
wage rate above the market clearing rate. Standard reasoning sees a high wage
rate as a labour demand problem since employers are not willing to hire sufficient
people at this wage rate. An alternative view would be to treat a high wage as a
labour supply problem if the workforce is not sufficiently productive for the going wage
rate. For the purpose of this study, however, we will stick to the standard
interpretation and see employment problems due to wage rigidities as primarily labour
demand problems.
The economic literature offers a number of reasons for why wages do not sufficiently
adjust downwards to enable market clearing in the labour market. For example,
Manning (2011) distinguishes between collusion and institutional reasons. The most
obvious form of collusion is collective bargaining of the workforce organised in unions.
The role of collective bargaining in creating unemployment has for example been
addressed by Blanchard (1991). A different aspect of collusion is, when firms pay
efficiency wages, i.e. wages above the market clearing rate to maintain
8 See also McGuiness (2006) for a survey of overeducation in the labour market, which
constitutes yet another aspect of skill mismatch. 9 See for example Tatsiramos (2009) for a recent analysis how unemployment benefits interact
with labour mobility in a number of European countries.
European Commission
Study on the effects and incidence of labour taxation
May 2015 | 30
unemployment in order to keep employees motivated (see Shapiro and Stiglitz,
1984).10
On the institutional side, the most obvious labour market regulation is a binding
minimum wage. Although, the clear-cut economic prediction of Stigler (1946) that the
introduction of a minimum wage would result in more unemployment, was challenged
by Card and Krueger (1994) using a quasi-experimental approach, the recent evidence
indicates that binding minimum wages increase unemployment.11 More generally, the
institutional setting, such as employment protection legislation, unemployment
benefits, active labour market policies, and taxation of labour has a large influence on
the labour market, as recently surveyed by Boeri (2011). Overly generous labour
market protection legislation can result in a dual labour market, if firms become
reluctant to hire new employees on fixed contracts.12 In a dual labour market one part
of the workforce is in relatively well paid and stable jobs, while the other part of the
workforce is in unstable jobs with lower wages. Boeri (2011) points out that the share
of temporary workers exhibits a strong positive correlation (0.73) with employment
protection legislation. Hence, strong employment protection seems to lead to more
temporary contracts, which can lead to large increases in unemployment during
economic downturns, because firms find it easy to lay off these workers, just as it has
happened in some southern Member States in the wake of the recent economic crises.
Young workers and workers in the construction sector in countries with a housing
bubble such as Spain were particularly hit.13 While the earlier literature based on
cross-country comparison struggled to differentiate the effects of the institutions from
other country characteristic, the more recent literature learns primarily from within
country variation through reforms.
Given the importance of these different labour market institutions, and the complex
interaction between them and with labour taxation, Section 4 will be devoted to these
potential sources of employment problems.
2.1.4. Incentive problems
Adverse incentives of the tax-benefit systems can also cause non-employment or
under-employment. Of all the mentioned reasons for employment problems, the
assignment to labour supply is the clearest here. The incentives directly affect labour
supply and have no connection to the labour demand.
There is a longstanding debate about poverty or unemployment traps, where
income related benefits create situations for unemployed people where they are better
off staying outside the workforce.14 For example, Pedersen and Smith (2002) use
detailed data from Denmark and show that especially for women, the disincentives for
work (i.e. the unemployment benefit is higher than the disposable income under full-
10 See also Yellen (1984) for a broader discussion of the different efficiency wage theories,
some of which see the efficiency wages as a motivational device and unemployment as a side effect. 11 See Neumark et al. (2014) for a recent survey of this strand of the literature. 12 The term dual labour markets stems back to at least Bulow and Summers (1986). 13 See Bentolila et al. (2010) for a discussion about the effects of the crisis in countries with
dual labour market. 14 See Havemann (1996) for a discussion of these problems and some potential approaches to
mitigate them.
European Commission
Study on the effects and incidence of labour taxation
May 2015 | 31
time work) dominate other considerations and lead to a significant increase in non-
participation in the labour force. Similarly, progressive tax systems can create
incentives for secondary earners to reduce their work effort or to decide to opt for
part-time employment. Even stronger disincentives for secondary earners can result
from joint filing for couples, because the marginal tax rate depends on the joint
income and as a result can be very even for high low income levels of the secondary
earner.15
One final aspect we want to cover with the term incentive problems is the concept of
opportunity costs of work. We interpret this term rather broadly and also include the
costs which arise to the household through labour force participation. A prominent
example is the cost of child care. That the rise in female labour force participation was
in part driven by the falling cost of child care was already pointed out by Connelly
(1992). More recently, Compton and Pollak (2014) find that geographical proximity to
grandparents significantly increases the labour force participation of married women
with young children. This allows the conclusion that there are still relevant opportunity
costs for those mothers without family support. Therefore section 4.2 will be devoted
to analyse the impact of family policies on the employment outcome.
2.2. Changes in Labour supply and demand as sources of employment problems
There are several ongoing socio-economic trends which already have affected both
labour demand and supply, and even more importantly are expected to have a lasting
impact on employment in Europe. Two main research projects have identified and
summarised the key challenges lying ahead.16 For example NeuJobs (2014), sees the
main challenges ahead in natural megatrends such as energy transition and climate
change as well as in societal megatrends as population dynamics and changes in the
way work is organised. The adaptation to the current employment problems and
raising challenges in Europe result in innovative agricultural, industrial and service
activities that will shape the skills, jobs and work organization.
Table 2 classifies the socio-economic trends in factors affecting labour demand and
labour supply. Changes in demography and educational attainment will influence the
workforce available and their attachment to the labour market. While population
ageing will reduce the workforce available, lower fertility rates and changing family
structures contribute to raising female labour force participation. Together with
migration these trends can significantly alter the workforce available. On the labour
demand side the occupational shifts between sectors and other structural changes will
affect the extent and quality of labour input required.
15 For a recent discussion about labour force participation of secondary workers in the US see
McClelland et al. (2014). 16 The European Commission (2009) analyses the general outlook for the world in 2025,
whereas NeuJobs (2014) directly investigates the future for work in Europe.
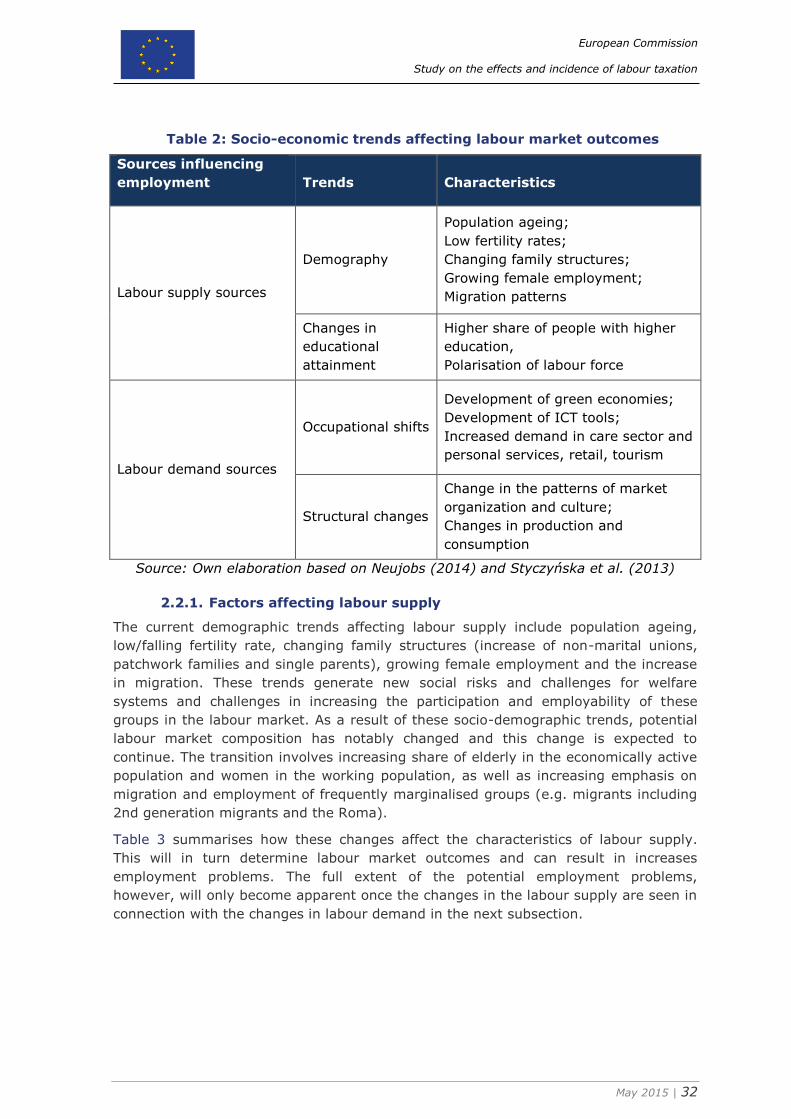
European Commission
Study on the effects and incidence of labour taxation
May 2015 | 32
Table 2: Socio-economic trends affecting labour market outcomes
Sources influencing
employment Trends Characteristics
Labour supply sources
Demography
Population ageing;
Low fertility rates;
Changing family structures;
Growing female employment;
Migration patterns
Changes in
educational
attainment
Higher share of people with higher
education,
Polarisation of labour force
Labour demand sources
Occupational shifts
Development of green economies;
Development of ICT tools;
Increased demand in care sector and
personal services, retail, tourism
Structural changes
Change in the patterns of market
organization and culture;
Changes in production and
consumption
Source: Own elaboration based on Neujobs (2014) and Styczyńska et al. (2013)
2.2.1. Factors affecting labour supply
The current demographic trends affecting labour supply include population ageing,
low/falling fertility rate, changing family structures (increase of non-marital unions,
patchwork families and single parents), growing female employment and the increase
in migration. These trends generate new social risks and challenges for welfare
systems and challenges in increasing the participation and employability of these
groups in the labour market. As a result of these socio-demographic trends, potential
labour market composition has notably changed and this change is expected to
continue. The transition involves increasing share of elderly in the economically active
population and women in the working population, as well as increasing emphasis on
migration and employment of frequently marginalised groups (e.g. migrants including
2nd generation migrants and the Roma).
Table 3 summarises how these changes affect the characteristics of labour supply.
This will in turn determine labour market outcomes and can result in increases
employment problems. The full extent of the potential employment problems,
however, will only become apparent once the changes in the labour supply are seen in
connection with the changes in labour demand in the next subsection.
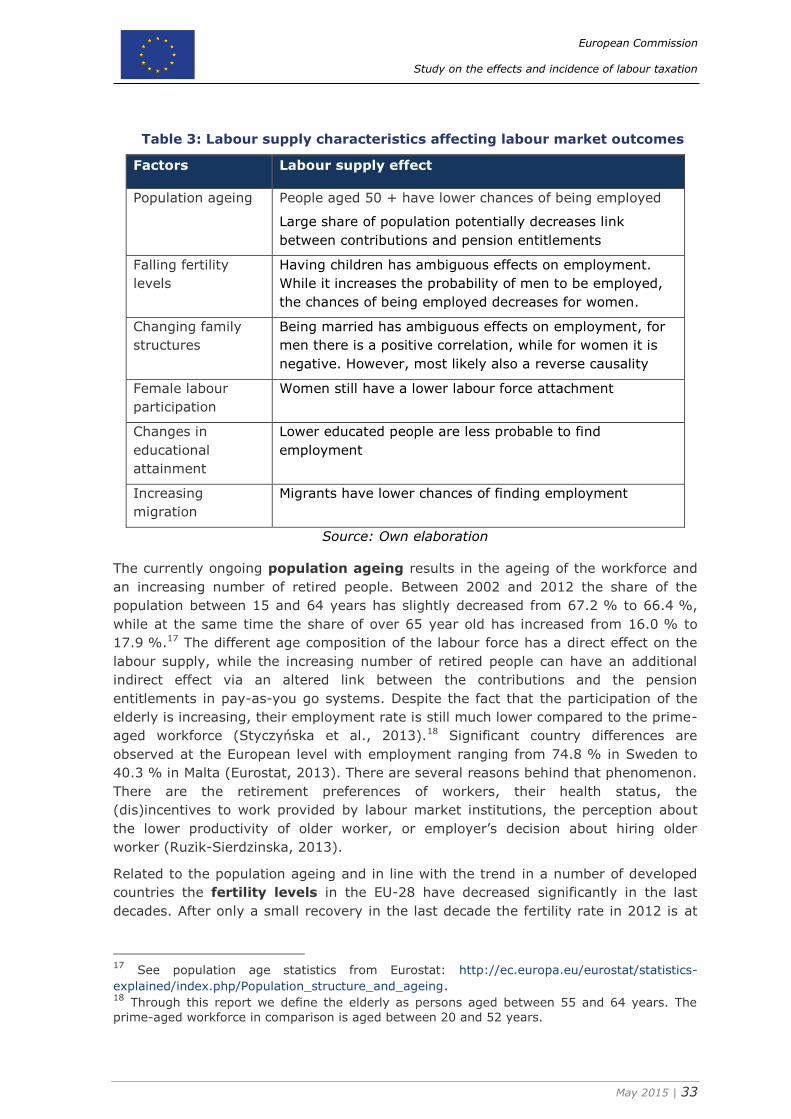
European Commission
Study on the effects and incidence of labour taxation
May 2015 | 33
Table 3: Labour supply characteristics affecting labour market outcomes
Factors Labour supply effect
Population ageing People aged 50 + have lower chances of being employed
Large share of population potentially decreases link
between contributions and pension entitlements
Falling fertility
levels
Having children has ambiguous effects on employment.
While it increases the probability of men to be employed,
the chances of being employed decreases for women.
Changing family
structures
Being married has ambiguous effects on employment, for
men there is a positive correlation, while for women it is
negative. However, most likely also a reverse causality
Female labour
participation
Women still have a lower labour force attachment
Changes in
educational
attainment
Lower educated people are less probable to find
employment
Increasing
migration
Migrants have lower chances of finding employment
Source: Own elaboration
The currently ongoing population ageing results in the ageing of the workforce and
an increasing number of retired people. Between 2002 and 2012 the share of the
population between 15 and 64 years has slightly decreased from 67.2 % to 66.4 %,
while at the same time the share of over 65 year old has increased from 16.0 % to
17.9 %.17 The different age composition of the labour force has a direct effect on the
labour supply, while the increasing number of retired people can have an additional
indirect effect via an altered link between the contributions and the pension
entitlements in pay-as-you go systems. Despite the fact that the participation of the
elderly is increasing, their employment rate is still much lower compared to the prime-
aged workforce (Styczyńska et al., 2013).18 Significant country differences are
observed at the European level with employment ranging from 74.8 % in Sweden to
40.3 % in Malta (Eurostat, 2013). There are several reasons behind that phenomenon.
There are the retirement preferences of workers, their health status, the
(dis)incentives to work provided by labour market institutions, the perception about
the lower productivity of older worker, or employer’s decision about hiring older
worker (Ruzik-Sierdzinska, 2013).
Related to the population ageing and in line with the trend in a number of developed
countries the fertility levels in the EU-28 have decreased significantly in the last
decades. After only a small recovery in the last decade the fertility rate in 2012 is at
17 See population age statistics from Eurostat: http://ec.europa.eu/eurostat/statistics-
explained/index.php/Population_structure_and_ageing. 18 Through this report we define the elderly as persons aged between 55 and 64 years. The
prime-aged workforce in comparison is aged between 20 and 52 years.
European Commission
Study on the effects and incidence of labour taxation
May 2015 | 34
1.58 live births per women in the EU-28 countries.19 This downward trend in the
fertility rates is associated with numerous social and economic factors, but the
causality of the relationship is unclear. A strong negative relationship between the
increased participation level of women in the labour market and fertility rates has
been observed in a large number of countries since 1960, (e.g. see Becker and Lewis,
1973 and Butz and Ward, 1979, for the US). In addition, the opportunity costs of
childbearing, the individualisation and changes in the family structures are the other
social aspects affecting women’s decisions on motherhood. Additionally, participating
in higher education also plays a role in women’s postponing their decision. The
economic factors discouraging the parenthood decisions are economic uncertainty and
drops in the household income as a result of labour market and financial instabilities.20
Changing family structures have an ambiguous effect on the labour force
attachment of individuals. A study conducted by US Urban Institute shows that the
unemployment level of married men and women is significantly lower than that of
unmarried, and labour force participation rates are much higher among married
people (Lerman and Schmidt, 1999). The study also finds higher unemployment rates
in the never-married group and that the labour market outcomes of men living with at
least one of their own children are better than those of with no children. On the other
hand, it has been shown that unemployment affects the individuals’ decision on
marriage. Ackers (2002) collects several case studies of European countries to find
that the impact of changing family structures on employment is strongly affected by
the cultural background, which is also reflected in the resulting public policies. For
example, Iza and de la Rica, (2005) find for Spain that holding unstable contracts or
being unemployed strongly negatively affects the individuals’ decision on getting
married in comparison with that of holding permanent contracts In contrast, for
women fixed term contracts are a less strong determinant in their marriage decision.
This trend might be explained by Becker’s theory of marriage, based on rational
choice, which suggests that since men are more likely to specialise in the labour
market than women, i.e. from the traditional perspective still being affective on the
individuals’ view that “men are the main breadwinner”, the worsening of the labour
market conditions for men reduces the gain of marriage, as a result the incidence of
marriage among young people decreases (see Becker, 1973).
Moving to employment of women, the last decade saw a gradual rise in labour
market participation of women, and their employment rate. Despite recent
improvements, a gender employment gap is still observed in all European countries.
Women continue to deal with the challenges keeping them away from or limiting their
participation in the labour market (e.g. see Tembon and Fort, 2008). Two aspects are
crucial for the improved position of women on the labour market: the processes of
school-to-work transitions and reconciling motherhood and work, through their
relative importance and performance. Understanding these processes and their
contribution to the overall improvement of female labour market participation is
necessary to make policy recommendations for the employment strategy and to make
predictions about the potential changes in the future.
19 Eurostat, Fertility Statistics, 2014. 20 Tausig and Fenwick, 1999, Neels and de Wachter, 2010, Van Bavel 2001 for Belgium; Yule
1906, Teitelbaum 1984, for Great Britain and Bengtsson, and Lee 2004 for the Eurasian region.
European Commission
Study on the effects and incidence of labour taxation
May 2015 | 35
Changes in educational attainment can also play an important role for the
composition of workforce. Education plays a major role in the probability of finding a
job (see Ridell and Song, 2011). Data from the Labour Force Survey (LFS) in Europe
show that highly educated have higher chances of being employed than their lower-
educated counterparts. This is common for all EU countries (Nunez and Livanos,
2010). Low skilled make up 34 % of the EU population and their labour market
attachment is significantly lower than for their more skilled counterparts.21 The
European Strategy for Employment and Growth 2020 estimates that just over a
quarter of the population in Europe, about 80 million people, has low or basic skills
and therefore are less likely to benefit from life-long learning. In contrast, additional
education improves the ability of the labour force to adjust to economic shocks,
enhances adaptability to change and in consequence increase the probability of being
employed. Low-skilled workers encounter increasing difficulties to find a job, face
lower job stability and are out-competed by medium-skilled workers even in
elementary occupations (European Commission, 2014a)
Europe has a history of migration. And the removal of internal barriers further
contributed to the strong increase in migration in all EU countries. In 2012, about 1.7
million people migrated to the EU from a non-EU country and 1.7 million previously
residing in one of the EU-27 Member States migrated to another one.22 The
unemployment level of migrants in the EU is significantly increasing since 2007 and
remaining much higher than that of the total population. 2013 Eurostat data show that
the unemployment level of the migrants in EU-28 is 18 % in comparison to 10.4 % for
the native population (Eurostat, Indicators of Immigrant Integration, 2013). This level
substantially differs across the population depending on the citizenship of the migrant.
The largest difference is observed in Belgium, as non-EU born unemployment level is
14 percentage points higher than that of total population, while for EU-born migrants
this difference is only 2 percentage points. Studies suggest that migrants arriving to
EU may suffer in the labour market of the host country for several reasons. First, the
educational qualifications provided by the country of origin might not provide the
necessary qualifications in the host country and put migrants in a position where their
competencies are much lower than the native workers in the country. Second,
because the human-capital has a limited level of mobility, and therefore is mostly
country specific, most migrants find it hard to translate their knowledge and adapt the
system and qualifications in the host country (Chiswick, 1978, Borjas, 1994,
Friedberg, 2000). In addition, if the employer perceives that the migrant is not willing
to work permanently, then both parties refrain from investing in human-capital since it
is not likely that it will pay off in the future (Dustman, 2000). Similarly, if the job
search costs are so high for the migrants or if they are unlikely to become a resident
in the host country, they may refrain from undertaking long searches for a better job
and prefer the one immediately available even if it is low-status, therefore they are
overqualified for the job (Kalter and Kogan, 2006; Dustman, 2000).
21 Low skilled adults are defined as people over 25 with lower secondary education at most,
which includes International Standard Classification of Education (ISCED) categories 0 to 2. 22 Eurostat, Migration and Migrant Population Statistics, 2014.
European Commission
Study on the effects and incidence of labour taxation
May 2015 | 36
2.2.2. Factor affecting labour demand
When considering the demand side of the labour market, we should ask the questions
of how many jobs will be created, or destroyed on the market, in what sectors, and
what would be the reason of such a change. During the last decade we observe a
relatively fast evolution in the consumption of goods and services, changes in the
structure of products demanded, introduction of modern technologies, changes in the
lifestyle of people. All these evolutions, which are broadly called in the literature socio-
ecological transformation, result in changes in the labour market demand for specific
skills, education, or abilities. Changes in the demand for labour can be characterised
by two phenomena: occupational shifts in labour demand, and structural changes in
labour market organization and working conditions due to the introduction of
information and communications technology (ICT) measures. These changes will
significantly affect the creation of jobs, and employment overall in the medium- and
long-run.
There is a longstanding debate over the impact of occupational shifts on labour
market outcomes. On the one hand, the sectoral shifts hypothesis developed by Lilien
(1982) states that occupational shifts tend to be slow and typically involve significant
unemployment before labour fully adjusts to new patterns of labour demand. This can
generate considerable fluctuations in the unemployment rate that are not directly
related to the fluctuations in aggregate demand. On the other hand, some studies
tend to reject the hypothesis, showing that it has small and insignificant impact on
aggregate unemployment rate (Abraham-Katz, 1986).
Empirical studies - at least superficially - seem support both hypotheses. Van Ours
and Van der Tak (1992) show that sectoral shifts do not have a substantial influence
on the unemployment rate in the Netherlands. Fluctuations of unemployment rate are
mainly due to aggregate demand factors. Similarly, Sakata and McKenzie (2001) find
no relation between sectoral shifts and the unemployment rate in the long run in
Japan. When analysing the same hypothesis for different groups of workers, Sakata
and McKenzie (2004) confirm that sectoral shifts do not have any long-term impacts
on unemployment. They contribute, however, to the unemployment of old males in
the short-run.
In contrast, Pelloni and Polasek (2003) show that sectoral re-allocations in Germany,
UK, and the US account for a substantial share of aggregate employment variation,
while the effects of aggregate shocks for sectoral shares are of smaller magnitude. In
contrast Also, Grubb (2002) finds that due to the rapid increase in the information
society, communication revolution, or the hi-tech revolution the nature of work has
changed. It shifts from occupations rooted in industrial production to occupations
associated with knowledge and information. In order to moderate the negative effect
of occupational shifts the idea of career information and career guidance is supported.
Due to these rapid changes the more recent European studies point to a problem of
skill shortages, when higher demand than supply exist for certain occupations, such as
ICT professionals, nurses, or engineers. They also highlight the problem of skill
obsolescence related to the risk of losing acquired skills and abilities, due to the rapid
introduction of new technologies and innovation in the market.
Summing up, the empirical results confirm that occupational shifts are likely to
increase the unemployment rate, but mostly in the short- to medium-run. When
European Commission
Study on the effects and incidence of labour taxation
May 2015 | 37
considering the problem in the long-run, occupational shifts are insignificant for
(un)employment level of individuals. In terms of shifting sectoral structure of
employment, several studies document the structural shift from manufacturing to
services in developed countries (Schettkat and Yocarini, 2006). The service sector has
become the most important sector in all OECD economies. It is, however, composed of
a wide variety of different activities ranging from fast food to brain surgery. An
increase in the demand for social services, healthcare, and education is observed. The
most recent data on occupational shortages show that in Austria in 2014 registered
nurses, data processing technicians, and technicians in engineering were highly
demanded. Other more recent studies (Beblavy et al., 2013) confirm that due to the
technological and ecological transformation, we observe the decrease of employment
demand in agriculture, non-market services, and the increase in employment demand
in transport, energy, construction, and private services. The projections of the future
labour market show that employment growth will be mainly driven by job creations in
private services sector. The same changes will be observed in transport. The industry
sector and agriculture will lose around 30 % of their jobs in 2030 (Boitier et al.,
2013).
In Employment in Europe 2009, the European Commission clearly summarises the
state of the art on the impact on employment of the socio-ecological transition to a
low carbon economy. Sectors directly involved in the adaptation are those especially
related to (i) the efforts to increase energy efficiency and (ii) renewable energies. In
the long run the net effect on employment is expected to be neutral or slightly
positive. The main impact will occur on redistribution across sectors and regions.
Intra-sectors redistribution is deemed smoother since it is easier for a worker to
change company within the same sector rather than to find an entirely different job.
Structural changes in the labour market are characterised by several factors
affecting the workplace. Prominent examples are the as the introduction of ICT tools in
the workplace, which fundamentally alter the tasks of jobs. Modern communication
has further allowed work reorganisation through international division of labour. This
often leads to highly specialised jobs in Europe, while simple mechanical tasks are
either substituted by technology or outsourced to low-income countries. The
remaining and newly emerging jobs in Europe often require a very different skill set,
which in conjunction with a slowly adjusting workforce results in skills gaps,
characterised through the fact that workers’ skills are not up to requirements of the
jobs. These were highlighted by a recent study on adult skills revealing proficiency
problems in basic literacy, numeracy and ICT skills (OECD, 2013a). Despite the fact
that measuring the impact of technological change on labour market has proved
difficult, there is agreed consensus that the world is changing faster and more severe
consequences are expected in the labour market (OECD, 2012a). There is a general
agreement that the long-term trend has been toward jobs requiring more education
and cognitive skills, but the level and types of skills in demand, and the drivers of
change are matters of debate and are difficult to understand. Growing development of
ICT tools and increasing use of ICT and knowledge-sharing in the workplace might be
assumed as significant determinant of unemployment increase. OECD (2012b) shows
the demand for educational, cognitive and interpersonal skill increases, while craft
skills, physical demands and the frequency of repetitive physical tasks declined. This is
related to the facilitation of handling of complex systems, speeding up the process of

European Commission
Study on the effects and incidence of labour taxation
May 2015 | 38
knowledge-sharing worldwide and across all areas, and creating a cheap
communications space for new world views and lifestyles (NeuJobs, 2014).
Table 4 summarises the changes in labour demand and how they will contribute to the
skill mismatch. While the findings in the literature and consequently this short survey
here suggest that the skill mismatch is primarily a short run problem, the speed of
adjustment will crucially depend on the labour supply side as well. Higher education
and increasing mobility of the workforce positively contributes and reduces the length
and the extent of the mismatch resulting from changes in labour demand.
Table 4: Labour demand characteristics affecting labour market outcomes
Factors Labour demand
Occupational
shifts
Shifts of production between occupations/sectors cause
increased demand for one type of skills, and decreasing
demand for different type of skills. In the short- to
medium-run such shifts can results in a skill-mismatch,
i.e. mismatch between skills that are demanded on the
labour market and skills that are available. It causes the
increase of unemployment and the increase in vacancies
at the same time.
In the long run the market should adjust and the
unemployment should decrease and employment
increase.
Structural
changes in
labour market
Introduction of innovative tools in the workplace,
changing nature of the workplace induce demand for
different types of skills, often unavailable on the labour
market. Again, we observe a skill shortage, which creates
unemployment and lower employment.
Source: Own elaboration
Given the differences between different socio-economic groups with respect to their
ability to adapt to changes in labour demand, the respective labour market outcome
will be different. Therefore the next subsection will shed some light on how this
manifests into employment problems for different vulnerable groups of the
population.23
2.3. Groups vulnerable to employment problems
The interplay of changes in labour demand and labour supply can create labour
market outcome which are less favourable for specific socio-economic groups. Both, a
strongly increasing labour supply or a sharply falling labour demand can put a socio-
economic group into a vulnerable position. Therefore we review the situation of some
groups to highlight their relative exposure to employment problems. Specifically we
look at the low-skilled, the youth, the elderly, women and migrants.
23 Note that the matching problems in the labour market are an inherently two-sided problem,
but it is beyond the scope of this particular project to also investigate the role of employers in detail.
European Commission
Study on the effects and incidence of labour taxation
May 2015 | 39
2.3.1. Low-skilled
The level of education and the resulting skill level of the workforce is a key
determinant of the labour market outcome. Despite this importance there is an
ongoing debate how to adequate measure the skill-level. There are several schools
explaining how the concept should be defined and measured (CEDEFOP, 2010).
Therefore, before proceeding, we outline the problem of the definition and the
challenges that this entails for policy makers and analysts. There is a tendency to
define low-skilled adults on the basis of their prior qualification attainment, in
comparison to that of the population as a whole. This is driven largely by the fact that
comprehensive data on the labour forces of individual Member States is not readily
available. Nevertheless, measurement by educational attainment alone sterilises the
concept of low-skilled adults and obscures it from the sources of the low-skilled that
are important for a better understanding of the heterogeneity of low-skilled workers
within and across countries. Rather, factors such as the characteristics of individuals,
which relate more to their employability (i.e. how they are regarded by employers in
terms of being work-ready, trainable, and having the appropriate attitudes and
aptitudes), should be taken into account. At the same time, it is important to
recognise that qualifications (and other characteristics or factors on which employer
hiring decisions are based) tend to operate as proxies for these wider attributes that
are sought by employers. Nevertheless, the lack of data prevents researchers from
providing such analyses.
To proceed, we follow Eurostat and define low-skilled adults as people over 25 with
lower secondary education at most, including ISCED 0 to 2. Therefore, due to data
availability and in order to maintain comparability with the majority of studies at the
European level, we use Eurostat’s definition for measuring low-skilled workers.
Since 2002, the ratio of employment rate of the low-skilled has constantly decreased
to a level of 60 % of the employment rate of the rest of the working population in
2013. This trend has been fuelled by the fact that low-skilled workers were the ones
mostly affected by the crisis, also mirrored in the continuously increasing
unemployment rate of the low-skilled. At the end of 2013, the unemployment rate of
low-skilled workers was over 2 times higher than the unemployment rate of the rest of
the workforce. The participation rate of low-skilled workers is much more responsive
to business cycles than for the rest of the population, suggesting that they are easier
discouraged to participate in the labour market and seek employment.
Low-skilled adults constitute a significant proportion of the workforce: in 2013, around
25 % of the EU-28 population aged 25 to 64 had an education level of ISCED of 2 or
less (Eurostat, 2014). Low-skilled workers encounter increasing difficulties finding a
job, face lower job stability, and are out-competed by medium-skilled workers even in
elementary occupations (European Commission, 2014a). The need for (continuous)
upgrading of the skill level in most occupational fields threatens the labour market
position of low-skilled workers who are crowded out of their traditional occupational
domains (Borghans and Groot, 1999; Jacobebbinghaus and Zwick, 2002). Low-skilled
workers are often either locked up in poorly paid elementary jobs with flexible
contracts that further weaken their labour market position. Furthermore, low-skilled
are increasing crowded out of employment, by better skilled people taking jobs for
which they are over-qualified because of a lack of jobs for which their qualification and

European Commission
Study on the effects and incidence of labour taxation
May 2015 | 40
skill level are commensurate. A further problem constitutes the increasing number of
people at high risk of becoming low-skilled workers. Fast sectoral structural change in
economies and globalization, which result in a shift towards a service-sector economy
and away from the primary sector and select manufacturing activities in Europe,
imposes the risk of increased number of low-skilled people in society. Since the issue
of inadequate skill levels can not sufficiently be addressed through tax reforms,
further policy measures are necessary. Box 1 describes a few approaches.
Box 1: Examples for policy measure for low-skilled workforce
Low-skilled make up an especially vulnerable group since they are confronted with a
lack of labour demand which cannot be easily addressed through labour cost
reduction because of tax reforms. Therefore additional policy measures are
necessary to improve the labour market situation of the low-skilled. To this end the
OECD (2014c) indicates several policy measures to adapt individuals’ level of
specialised skills to the changing nature of jobs and the changing demand for skills.
One of the measures mentioned includes full involvement of employers in designing
and delivering training. Employers themselves are asking for a more active role in
designing and delivering training programs to ensure that programs provide skills
they need in their workforce.
A stronger network between small and medium enterprises, collaboration between
public employment services and companies is recommended. In Sweden, for
example, every higher vocational education and training programme has a steering
group involving employers that advise on provision and ensure programmes and
qualifications that are in line with the needs of labour markets. In the USA
Community colleges can rapidly develop courses demanded by employers, as they
use industry representatives as trainers. The increase in funding for firms, that see
the need of upskilling, or re-skilling of their low-skilled employers should be made
available.
Other measures proposed for upskilling are related to flexible lifelong learning
opportunities for individuals. Flexible training systems can build the skills necessary
to activate and connect unemployed individuals, especially low-skilled individuals,
to the labour market during the life course at different stages of the employment
path. For employed individuals, the opportunities to further develop skills are an
important condition in preventing unemployment and building career progression.
To decrease the risk of falling in low-skilled employment traps further measures are
proposed. They include helping employers to upgrade their management practices
and introduce practices that enable skill improvement (like shifting employees into
different jobs and positions within the company in order to facilitate the learning of
news skills, employee participation in discussion on business strategies, knowledge
transfer and several others). Policy makers should also provide guidance, and
incentives in order to increase the collaboration and networking across firms,
universities and colleges to help them share knowledge, new technologies and
innovation. In addition, the public sector should give an example and should also
implement human resource management, and incentivise the collaboration between
different stakeholders on the labour market.
European Commission
Study on the effects and incidence of labour taxation
May 2015 | 41
2.3.2. Youth
The unemployment rates of young people have reached alarmingly high rates in some
European countries. The scale of the problem is exemplified by Eurostat statistics
which show that in August 2013 more than half of young workforce in Greece
(57.9 %) and Spain (55.2 %) were unemployed. Only Germany (7.9 %) and Austria
(8.7 %) had levels below ten per cent. More widely, the International Labour
Organization (ILO, 2013, p. 3) stated that “since 2009, little progress has been made
in reducing youth unemployment in the advanced economies”, with both the level and
duration of unemployment increasingly significantly. There are a number of causes of
youth unemployment. Apart from poor macroeconomic performance, which affects all
groups of workers, young people face higher barriers to entry into the labour market
due to their lack of job-specific experience relative to adult experienced workers.
Youth are also perceived to be more likely than adult workers to resign voluntarily
because they are more likely to explore different opportunities before they settle
(Görlich et al., 2013).
The youth labour force is further characterised by flexible contracts. Given the
common practice to offer temporary contracts to young people, the recession hit this
group particularly hard. Among the first one to lose their jobs, the unemployed youth
population is also finding it particularly difficult to find a new one (OECD, 2009). This
effect is again aggravated by lower levels of education. While the unemployment level
among the youth with tertiary education is 19 %, this level reaches 34 % in the lower
education group.
Contrary to the overall labour market, there no is significant difference between the
unemployment rates of young men and women; this holds both in lower and higher
education groups. However, in the labour market participation the difference
reappears. Young female activity rate between the ages of 20 and 24 is 56.8 % while
this rate among young males is 65.6 %.24 This difference is most pronounced in the
lower education group, decreases with an increased level of education and completely
disappears in the tertiary education group. Hence the lack of a gender gap in youth
unemployment is primarily driven by less educated young women staying away from
the labour market.
Therefore, the European Commission clearly states that it is important to measure the
situation of young people that are out of the labour market as well. The European
2020 flagship initiative “Youth on the Move” aims at “unleashing all young people’s
potential” and clearly emphasises the importance of focusing on youth, in general, and
on young people who are neither in employment or in education or training (NEETs),
in particular (European Commission, 2010). Figure 4 places the NEET category in the
general labour market classification. NEETs includes young people aged 15-29
discouraged from seeking employment and unwilling to take up any kind of training.
This includes a variety of subgroups that have very different personal experiences,
characteristics, education levels, and attitudes toward job seeking.
24 Eurostat, 2014.

European Commission
Study on the effects and incidence of labour taxation
May 2015 | 42
Figure 4: NEETs position within the labour market classification
Source: Styczyńska (2013)
The NEET rate for the young people aged 15 to 24 has been increasing since 2008 and
reaches 13 % in 2013 in the EU-28, while their unemployment rate is at 23.5 %. NEET
rate for people aged 25-29 is even higher and reached the level of 20.9 % in the EU-
28 in 2013.25 Eurofound (2012) studies the NEET and suggests that the main reason
for not seeking employment is the belief that there is no work available. Other studies
find that strict employment protection regulations for adults are the main reasons of
higher unemployment rates among young people (Breen, 2005; Esping-Andersen,
2000), lower youth employment rates (Bassanini and Duval, 2006), longer job search
periods (Wolbers, 2007), and lower chances of getting reemployed (Russell and
O’Connell, 2001); hence, pushing them towards NEET. In addition, the youth labour
force is characterised by flexible contracts as compared to the type of contracts of the
rest of the population (Eurostat, 2014). During crises, it is more difficult for an
employer to dismiss a permanent worker than the temporary employee on a zero-
hours contract.26 Therefore, young people are the first to lose employment in the case
of the reduction of short-term adjustments (OECD, 2009).
Consequently, young people have a much weaker labour force attachment with an
employment rate of only 43 % of the employment rate of the adult population. Their
unemployment rate is constantly around 2.4 times higher than the unemployment rate
of their older counterparts.
While some young people withdrawing from the labour market choose to stay in the
education system, many young people end up in inactivity because of discouragement
and marginalisation of the labour market. This position of the youth in the labour
25 See Eurostat (2014) for the latest data on the NEET rate. 26 The term zero-hours contract is not legally defined, but usually refers to very flexible
contracts, where the employer has the option to offer any number of hours between zero and
full time, but has no obligation to offer any. At the same time the employee does have no obligation to accept any work hours. See also the website of ACAS (Advisory, Conciliation and Arbitration Service) for a more thorough discussion.
European Commission
Study on the effects and incidence of labour taxation
May 2015 | 43
market can result in multiple disadvantages such as the lack of qualifications, health
problems, poverty and other type of social exclusions. For example, Bell and
Blanchflower (2010) estimate that a 6-month unemployment spell of young workers
aged 22 results in an 8 % decrease in wage preference. At the age of 30, the wage is
expected to be lower by 2-3 percentage points than it would have been otherwise.
Moreover, some young people who are NEET for a long period of time are trapped into
a vicious cycle hard to escape, and, as a result, they quit the labour market entirely
(Quintini and Manfredi, 2009).
2.3.3. Elderly
The labour market situation of the elderly has been steadily improving since 2002.
Both the employment rate of the elderly and their activity rate have been increasing
steadily. At the same time the unemployment rate of the elderly was significantly
lower than the unemployment rate of their younger counterparts during the whole
period. It fluctuated around the level of 65-70 % of the unemployment rate of their
younger counterparts. Despite the fact that the situation of the elderly is improving,
several issues are masked by these data.
First of all, it is important to note that the positive change in the employment rate of
the elderly was supported by enormous policy efforts, numerous initiatives and
monetary subsidies, which have been undertaken in order to encourage and improve
the labour market activity and employability of the elderly.
We should also note that the ratio of activity rate of the elderly has been increasing,
but to a very limited extent (by 1.5 percentage points during last 10 years). The
elderly still do prefer to leave the labour market when they have the possibility and to
stop participating in the workforce (Styczyńska, 2013).
Further, it is noteworthy that the elderly are very strongly protected by their
permanent contracts and labour code and they cannot be dismissed instantly.
Nevertheless, once they are dismissed, their probability of finding employment
decreases significantly. Therefore, their long-term unemployment rate as a percentage
of total unemployment remains substantially higher among older workers than any
other group in the labour market. With an increasing trend after the crisis, the long-
term unemployment rates as a percentage of the total unemployment among the
elderly reached its highest level in 2013 at 59 % (Eurostat, 2014). The data implies
that more than half of the unemployed elderly could not find a job for over one year
from when they became unemployed. There are several reasons behind this fact. First,
the elderly are perceived as people less productive and unwilling to undertake any
type of training (Ruzik- Sierdzinska, 2014). Gelderblom et al. (2011) also find that
after the age of 55 workers’ own human capital investment declines sharply.
Additionally, the elderly are perceived as people with inadequate IT and ICT skills
(Arias et al., 2014). In addition to the perceptions of older workers, the high long-
term unemployment level is also a result of job immobility. A study in Netherlands
finds that starting with the age of 45, the level of job mobility declines sharply, and by
the age of 55, it drops even to a level that is less than 1 % (INSPIRES, 2014). In line
with expectation, the unemployment rate among the elderly with the lowest level of
education is substantially higher than in the rest of the better-educated population
(Eurostat, 2014).
European Commission
Study on the effects and incidence of labour taxation
May 2015 | 44
Looking at within-group differences reveals that the activity rate of the female elderly
aged 50-64 is 12 percentage points lower than that of male elderly (Eurostat, 2014).
Still, in several European countries, gender stereotyping continues to be an issue
despite the majority of people accepting gender equality in the labour market (ISTAT,
2011). Older women tend to be the main providers of care for their family members,
namely grandchildren and the elderly.
2.3.4. Women
The ratio of the employment rate for women has been increasing from 77 % of the
employment rate of men in 2002 to 87 % in 2013. This is a result of a faster increase
in the employment rate of women than men. In addition, during the crisis, women’s
employment was affected to a lesser extent than men’s. Moreover, women managed
to recover much quicker after the crisis while men are still struggling with decreasing
employment rates. Similar to the improvement in the employment ratio, the ratio for
the unemployment rate has also improved. While in 2002, the unemployment rate of
women was 1.2 times higher than that of men, it is at a comparable level since 2009.
In addition, a constant increase in the activity rate of women is observed. In 2013, the
activity rate of women was at 85 % of the activity rate of men.
Nevertheless, the cultural expectation of women remains one of the biggest
challenges. In many European countries, women are expected to take care of the
children and the elderly as well as doing the housework. These views on the traditional
role of women appear to be still present among young people (Vella, 1994; Guiso
et.al, 2003; Algan and Cahuc, 2004)27. As a result, women experience more difficulties
in reconciling their career with their non-market household activities. When they are
employed, they tend to spend less time in the workplace as compared to their male
counterparts, since they are more likely to work part-time (Bardasi and Gornick,
2000; Jacobs and Gornick, 2002). Consequently, their salary and pensions are lower
than that of men.
Furthermore, for women having young child(ren) has a negative impact on finding
employment, their employment duration, and their employability (see e.g. Wolff,
1990; Phipps, 1990; Knudsen and Peters, 1994; Gornick et al. 1996; Pettit and Hook,
2002). The opposite holds for men in that fatherhood increases the labour force
participation of men (Gornick, 1999). Working mothers report a higher level of stress
in their lives than other workers. To overcome this, jobs may allow workers to work
flexible hours to allow them to manage family responsibilities during normal work
hours. The longer women stay outside the labour market as a result of child or elderly
care duties, the harder it is for them to become reemployed again, which further
deteriorates the gender gap in the labour market and creates serious consequences in
women’s lives.
The other factor shaping the labour market position of women is the level of
education. While the employment rate is only 36.5 % among women with primary
education, this level increases to 78 % among the women with tertiary education.
Similarly, in line with the well-established view on the effect of education,
unemployment rates are much lower in the tertiary education group than in the
27 Thornton et al. (1983) also find an profound impact of fundamental religious beliefs on the
role of women in the society.
European Commission
Study on the effects and incidence of labour taxation
May 2015 | 45
primary education group, at 6.9 % and 18.7 % respectively (Eurostat, 2014).
Women’s employment rate and working hours increase with their educational level;
this suggests that earnings capacity affects the labour market behaviour of women
(Phipps, 1990; Knudsen and Peters, 1994; Gornick et al. 1996; Pettit and Hook,
2002). This relationship is observed in the available data for the female labour force in
the EU.
Additionally, due to changes in family structures, the number of single mothers has
increased over the last 50 years. The labour force participation rates of mothers with
partners are significantly higher when compared to lone mothers. With some
exceptions (i.e. Luxembourg and the Netherlands), younger single mothers are less
likely to fully participate in the labour market (RAND Europe, 2014). In addition, single
mothers working part-time are more likely to be in low-skilled jobs.
2.3.5. Migrants
Eurostat defines a migrant as a person [who] establishes his or her usual residence in
the territory of a Member State for a period that is, or is expected to be, of at least
twelve months, having previously been usually resident in another Member State or a
third country (Poulain, 2008). Here, a distinction between migrant groups is necessary
since the groups are too heterogeneous in terms of their labour market
characteristics. The first group are European migrants who migrate between Member
States while the second group are non-European or third country migrants who
migrate to the EU from a non-Member State.
The employment patterns of migrants show a high degree of cyclical sensitivity. Since
2002, the employment rate of migrants (both European and non-European migrants)
had been increasing. However, the financial and economic crisis particularly affected
the non-EU migrants. Their employment rate decreased by over 4 percentage points
right after the crisis in 2009 and in contrast to EU migrants and natives has not yet
fully recovered after the crisis. This suggests that in times of economic difficulties,
non-EU migrants are the ones who lose their jobs first and are struggle to get back
into employment.
This is even more visible in the unemployment rates, which remain substantially
higher for the migrants in comparison to the natives. However, this still hides the real
picture of the labour market problems that third country migrants experience. A
recent study presenting multi-level analysis of migrant unemployment rates finds that
migrants coming from Islamic countries have higher rates of unemployment than
those who originate from Western Europe (Fleischmann and Dronkers, 2010).
Kogan (2007) suggests that labour market regulations which are aimed at
employment protection impose high firing costs on the employer. This can result in
employers being reluctant to hire migrants as they are considered riskier and making
a mistake in the hiring process is costly. This tendency results in discrimination,
therefore resulting in hiring natives over migrants. In addition, the motivation to avoid
the costs of job search causes migrants to end up in poor jobs. In the long run, this
aversion might trap them in low status, badly paid, and unpleasant jobs (Reyneri and
Fullin, 2011). According to a study by the European Commission (2011) based on
2009 data, while the over-qualification rate for the total population is 21 %, the rate is
33 % for foreign-born persons. The over-qualification rate was even higher among
European Commission
Study on the effects and incidence of labour taxation
May 2015 | 46
people born outside the EU, at 36 % (European Commission, 2011). This difference
holds for both women and men, but women suffer at a higher level than men, as they
do almost in every other position.
Gender studies confirm the disadvantaged situation of female third country migrants
as well. A recent study focusing on migrant women in the EU (RAND Europe, 2008)
finds that non-EU migrant women are much more intensely concentrated in a few low-
skilled jobs than that the EU-born group. The study also finds that having a child
under five years old decreases the labour force participation of migrant women further
than it does for native women. Considering the fact that third-country migrant women
are much more likely to have younger children compared to native-born women, this
finding is particularly important in explaining the differences in the labour force
participation of women. The study also suggests that how the recently arrived migrant
woman determines the labour market achievements of migrant women. The
differences between the labour market achievements of women in old and new
migrant-receiving countries are mostly a result of the fact that the migrant women in
the new migrant-receiving countries are, on average, younger. The study on migrant
women also finds that in the new migrant-receiving countries, when differences in
education, marital, and family status are controlled for, the results show no significant
difference between native-born and migrant women.28 On the other hand, the same
methodology results in only minor changes in the labour-force participation of migrant
women in the old migrant-receiving and Nordic countries. Therefore, this might imply
a potential negative discrimination towards non-EU migrants.
Even though the data and literature show that the integration of migrants is not well
achieved yet, and there still are labour market penalties for migrants, when education
is introduced to the estimation models, the penalty in terms of the probability of
entering the white-collar class increases instead of decreasing, unlike the situation in
the past (Reyneri and Fullin, 2011). Although, in the EU-28, there is no substantial
difference between the tertiary education achievement rate of the total population and
foreign-born persons (28 % and 32 %, respectively), the significant difference is
mostly pronounced in the lower level of education. There is a 10 % difference between
the share of foreign-born people with low education attainment and that of total
population. This is the result of the migration of a large number of people from outside
the EU with a low level of education. While the share of population with primary or
less education is lower in the total population and not significantly different for the EU-
born migrants, this share is significantly higher for third country migrants (27 %,
28 %, and 40 %, respectively, Eurostat, 2014).
Considering the future path of the European labour market, where unemployment
among the low-skilled is likely increase while there will be excess demand for skilled
workers (Constant and Zimmermann, 2005), as a result of the large numbers of non-
EU born persons having the lowest level of education, their level of vulnerability will
become much more noticeable.
28 RAND Europe (2008) defines Belgium, France, Luxembourg, the Netherlands, the United
Kingdom and, to a lesser extent, Austria, as the old migrant receiving countries, while Spain, Greece and Portugal are defined as the new migrant receiving countries.
European Commission
Study on the effects and incidence of labour taxation
May 2015 | 47
2.4. Summary
The aim of this section was to gain an understanding whether the observed
employment problems in Europe are mainly due to a labour demand or a labour
supply problem. Starting with the observation that unemployment is more originating
from the labour demand side and non-employment is more a labour supply side issue,
cyclical unemployment can be attributed to the labour demand side, albeit only
indirectly through the lack of aggregate demand which results in a lack of labour
demand. It is difficult to draw a clear line between cyclical and structural
unemployment since unwinding of previously unsustainable situations, like necessary
fiscal consolidation because of excessive public debt, can result in longer term lack of
aggregate demand.
A key part of structural unemployment is due to mismatches between labour demand
and labour supply and therefore inherently difficult to attribute to one of the two
labour market sides. Looking at recent trends one can make progress in attributing
the employment problems to the labour supply side where socio-economic changes
like population ageing, falling fertility levels, increasing female labour force
participation and increasing migration change the composition of the workforce. At the
same time a probably even larger share of short to medium term unemployment can
be attributed to broad changes in labour demand as a result of occupational and
sectoral changes and structural changes in the workplace. These shifts increase the
labour demand for certain skills while others become obsolete.
Changes both in labour demand and labour supply leave some socio-economic groups
at a vulnerable position in the labour market. First and foremost the low-skilled part
of the population is facing a labour demand problem as a result of the sectoral shifts
which substantially reduced the need for low-skilled workforce. Additionally the low-
skilled are among those most affected by rigidities which prevent wages to adjust
downwards. For example, binding minimum wages can result in a lack of labour
demand for low-productivity low-skilled workforce. Given the relatively low wages of
low-skilled people adverse incentives of the tax and transfer system can also result in
a labour supply problem further adding to the employment problem.
Another vulnerable group in the labour market are the young people. There are
several reasons behind this phenomenon. Young people are usually perceived as
unstable employees who would leave an employer in order to gain more experience
before they settle into a permanent role. In addition, they usually have temporary,
flexible contracts that do not secure their employment. Due to their lack of
experience, they are also perceived as less productive than the rest of the workforce.
Consequently, youth unemployment can be largely attributed to a labour demand
problem. Migrants, in particular those from non-European countries, face a similar
situation in the labour market. Often their previous work experience and foreign
education is not adequately valued by employers and therefore they are facing a
labour demand problem. Furthermore, while the increase in migration can help to
mitigate geographical mismatches, it also contributes to a relative fast change in
labour supply. As a result there can be an oversupply of specific types of workers.
While the situation of the elderly has been steadily improving during the last decade,
they are still facing relevant employment problems. Due to population ageing the
labour supply of elderly people is increasing. At the same time the labour demand is
European Commission
Study on the effects and incidence of labour taxation
May 2015 | 48
not keeping up, because the elderly are often perceived as people of lower
productivity, who are not keen on investing in themselves, and who are unable to
acquire new skills and adapt to rapid changes in the market. Currently, permanent
contracts, which protect them from instant loss of employment, help them to maintain
their employment level. However, once they lose their employment, it is difficult for
them to become employed again, often due to a shrinking labour demand for their
specific skills.
The role of women in the labour market has undergone a profound change, not least
due to decades of initiatives and debates on this issue. The gender employment gap
decreased significantly during the last decade and the labour market participation of
women increased. Despite the achievements there relevant disparities between the
labour market attachment of women and men remain. To a large extent these
differences are related to labour supply issues since women are still largely
responsible for child care, care of elderly relatives and other non-market household
activities. As a result the reconciliation between work and household activities often
results in weaker labour market attachment for women.
In terms of indicators this section suggests that the first step should be to break down
the employment problems into its category. Separately looking at unemployment and
non-employment will give a first impression as to on which side of the labour market
the problems are located. Furthermore distinguishing between structural and cyclical
aspects of unemployment will give an indication on the part of unemployment which
can be traced back to a lack of aggregate demand and is therefore not the result of a
labour supply problem. The discussion of the vulnerable groups further highlights that
the overall employment situation can hide labour market problems of specific groups.
The above discussed socio-economic trends can result in a mismatch between labour
supply and labour demand. This highlights to the necessity of indicators looking into
changes in labour supply as well as labour demand and how these coincide. Such
indicators can help to allocate the source of employment problems to either side of the
labour market. At the same time, it is noteworthy that these indicators are also
highlighting more fundamental structural problems in the labour market, which are not
the result of labour taxation. Therefore tax reforms may not be the best way to
address these issues.
The broad characterisation of employment problems also revealed that rigidities in the
labour market and incentive problems because of the tax and transfer system are key
determinants of the labour market outcomes. These will be picked up in Section 4 to
further refine the need for appropriate indicators.
European Commission
Study on the effects and incidence of labour taxation
May 2015 | 49
3. Review of the tax incidence on labour
In this section of the report, we provide an overview of what is known about the
short- and long- run economic incidence of labour taxation. In doing this we first
examine the literature that directly assesses the incidence of taxation, utilisation both
cross-country and within-country variation in labour taxation. In a second step, we
make use of the much broader economic literature that examines labour demand, and
particularly labour supply: as highlighted in Fullerton and Metcalf (2002), in the
classical model of the labour market, incidence is determined by the relative
responsiveness of labour demand and labour supply. Finally, we move beyond
reduced-form and partial-equilibrium models to consider incidence in a general
equilibrium framework.
We begin, however, with a discussion of the conceptual and empirical difficulties that
arise in identifying the incidence of labour taxation.
3.1. How can one identify the incidence of a tax?
The extent to which workers or employers bear the burden of labour taxation is
intimately linked to the relative degree of responsiveness of each to the financial
(dis)incentives created by the tax: that is, to the relative elasticities of labour supply
and labour demand.29 This is most clearly seen in a simple representation of a classical
perfectly competitive labour market.
Figure 5 shows the situation where labour supply is somewhat elastic, and: in panel
(A) when labour demand is completely elastic; and in panel (B) when labour demand
is incompletely elastic. The labour supply curve is shown in orange, and the labour
demand curve shown in blue.
Initially, no taxes are levied. Market equilibrium is at the point at which labour
demand and labour supply are equal: let’s call the resulting level of employment “E*”,
and the resulting wage rate “w*”. Now let’s introduce a tax, in this case, formally
levied on workers, so, that for a given gross wage paid by employers, workers receive
a lower net wage. But who bears the economic burden of this tax? In the case of
completely elastic labour demand, panel (A) shows that the incidence is fully on the
worker: the gross wage remains unchanged, and the worker bears the full burden of
the tax in the form of a lower net wage. However, in the case of incompletely elastic
labour demand, panel (B) shows that the incidence of the tax is split between the
worker and the employer. Intuitively, as the workers reduce the amount they are
willing to work because of the lower net wage they receive when the tax is in place,
the employers are willing to pay a higher gross wage to help maintain supply of (the
now more scarce) labour. Thus the burden of taxation is split between employers who
29 An elasticity is a measure of the degree of responsiveness. In this context, for instance, an
elasticity of labour supply of 1 means that the amount of labour supplied increases by 1 % when the net wage increases by 1 % (or in the case of labour demand falls by 1 % when the cost to the employer increases by 1 %). If labour supply or demand is completely unresponsive to
changes in wages, this report terms it “completely inelastic”. If labour supply or demand responds infinitely to a small change in wages, we describe it as “completely elastic". See also Section 3.3 for a distinction of the different types of elasticities.
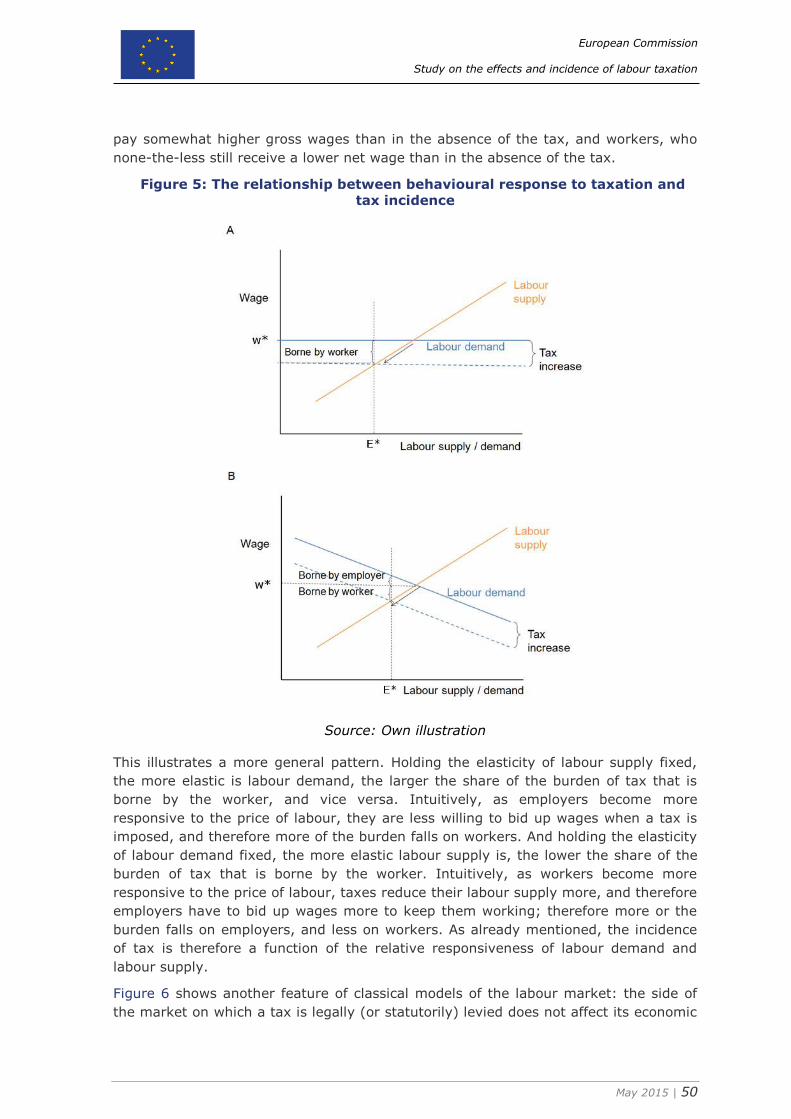
European Commission
Study on the effects and incidence of labour taxation
May 2015 | 50
pay somewhat higher gross wages than in the absence of the tax, and workers, who
none-the-less still receive a lower net wage than in the absence of the tax.
Figure 5: The relationship between behavioural response to taxation and
tax incidence
Source: Own illustration
This illustrates a more general pattern. Holding the elasticity of labour supply fixed,
the more elastic is labour demand, the larger the share of the burden of tax that is
borne by the worker, and vice versa. Intuitively, as employers become more
responsive to the price of labour, they are less willing to bid up wages when a tax is
imposed, and therefore more of the burden falls on workers. And holding the elasticity
of labour demand fixed, the more elastic labour supply is, the lower the share of the
burden of tax that is borne by the worker. Intuitively, as workers become more
responsive to the price of labour, taxes reduce their labour supply more, and therefore
employers have to bid up wages more to keep them working; therefore more or the
burden falls on employers, and less on workers. As already mentioned, the incidence
of tax is therefore a function of the relative responsiveness of labour demand and
labour supply.
Figure 6 shows another feature of classical models of the labour market: the side of
the market on which a tax is legally (or statutorily) levied does not affect its economic
European Commission
Study on the effects and incidence of labour taxation
May 2015 | 51
incidence – which is a function of labour supply and demand elasticities. The Figure
shows two scenarios. First, as in Figure 5, the case when the tax is legally levied on
the employee so that the net wage they receive (the dashed blue line) is lower than
the gross wage paid by the employer (the solid blue line). Second, is the case when
the tax is legally levied on the employer, so that the cost of employing the worker (the
dashed orange line) exceeds the gross (and net) wage the employee receives (the
solid orange line). In both cases the tax is of the same magnitude; just its legal
incidence differs. Figure 6 shows that the economic incidence is the same though – the
cost to the employer, and the net wage received by the employee adjust in exactly the
same way, irrespective of which side of the market the tax is legally levied. This is the
“invariance of incidence” proposition (IIP).
Figure 6: The invariance of incidence proposition (IIP)
Source: Own illustration
Of course, even in this simple model, it may take time for wages to adjust. In the
short run then, the legal incidence of a tax may matter for its economic incidence. And
in different models of the labour market – for instance, bargaining models where
workers and employers bargain over the gross wage –, perhaps formal incidence
matters in the long as well as short run. Testing whether the IIP holds is therefore key
to understanding the incidence of taxation, and the effects of employer versus
employee taxes on the labour market and economy more generally. It is perhaps
surprising therefore, that only a relatively small number of papers actually test this
proposition. However, rather than a lack of interest, this may reflect the fact that
changes in employer and employee social security contributions (SSCs) often occur in
conjunction, rather than separately, which presents problems for econometric
identification.
More generally, identifying the incidence of taxes from observable data is problematic.
Whilst the relationship between behavioural responses to taxation and the incidence of
taxation is relatively simple in theory, separately identifying behavioural effects from
the incidence of taxation is often more difficult in practise.
If one observed both gross earnings, and the amount of labour utilised, one could
calculate the wage rate paid. In this case, one could calculate everything that one
needs to separately identify labour supply, labour demand, and tax incidence:
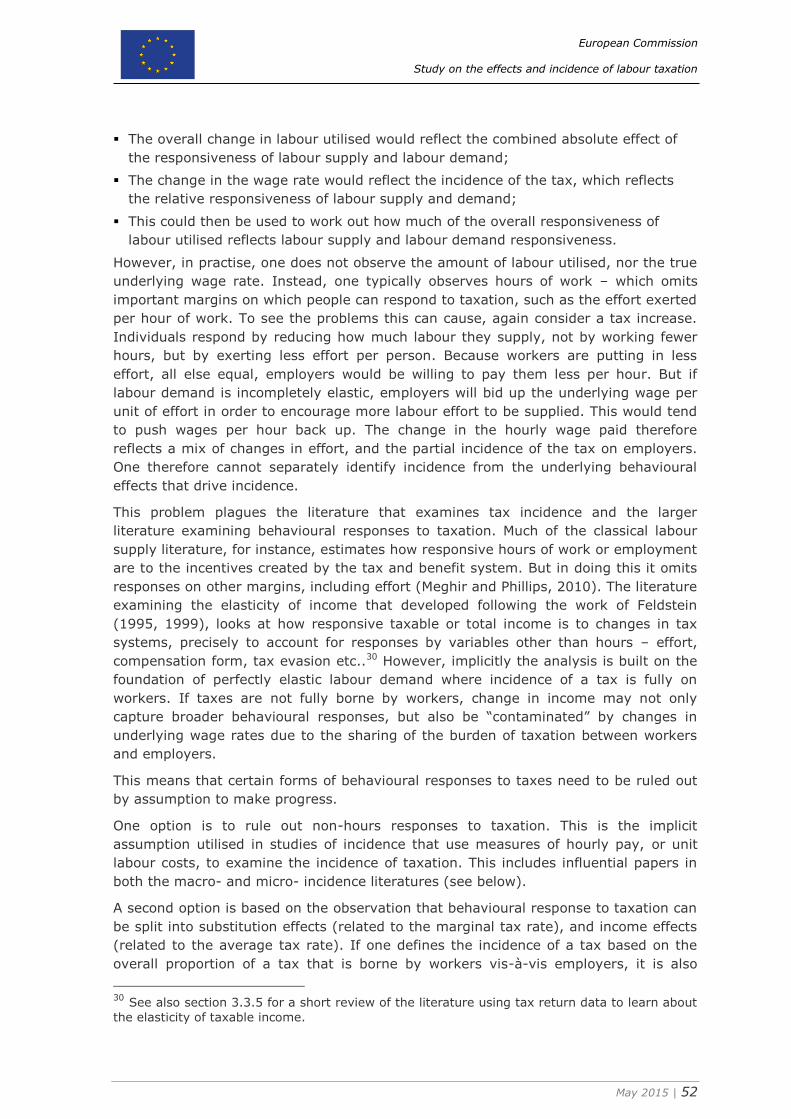
European Commission
Study on the effects and incidence of labour taxation
May 2015 | 52
The overall change in labour utilised would reflect the combined absolute effect of
the responsiveness of labour supply and labour demand;
The change in the wage rate would reflect the incidence of the tax, which reflects
the relative responsiveness of labour supply and demand;
This could then be used to work out how much of the overall responsiveness of
labour utilised reflects labour supply and labour demand responsiveness.
However, in practise, one does not observe the amount of labour utilised, nor the true
underlying wage rate. Instead, one typically observes hours of work – which omits
important margins on which people can respond to taxation, such as the effort exerted
per hour of work. To see the problems this can cause, again consider a tax increase.
Individuals respond by reducing how much labour they supply, not by working fewer
hours, but by exerting less effort per person. Because workers are putting in less
effort, all else equal, employers would be willing to pay them less per hour. But if
labour demand is incompletely elastic, employers will bid up the underlying wage per
unit of effort in order to encourage more labour effort to be supplied. This would tend
to push wages per hour back up. The change in the hourly wage paid therefore
reflects a mix of changes in effort, and the partial incidence of the tax on employers.
One therefore cannot separately identify incidence from the underlying behavioural
effects that drive incidence.
This problem plagues the literature that examines tax incidence and the larger
literature examining behavioural responses to taxation. Much of the classical labour
supply literature, for instance, estimates how responsive hours of work or employment
are to the incentives created by the tax and benefit system. But in doing this it omits
responses on other margins, including effort (Meghir and Phillips, 2010). The literature
examining the elasticity of income that developed following the work of Feldstein
(1995, 1999), looks at how responsive taxable or total income is to changes in tax
systems, precisely to account for responses by variables other than hours – effort,
compensation form, tax evasion etc..30 However, implicitly the analysis is built on the
foundation of perfectly elastic labour demand where incidence of a tax is fully on
workers. If taxes are not fully borne by workers, change in income may not only
capture broader behavioural responses, but also be “contaminated” by changes in
underlying wage rates due to the sharing of the burden of taxation between workers
and employers.
This means that certain forms of behavioural responses to taxes need to be ruled out
by assumption to make progress.
One option is to rule out non-hours responses to taxation. This is the implicit
assumption utilised in studies of incidence that use measures of hourly pay, or unit
labour costs, to examine the incidence of taxation. This includes influential papers in
both the macro- and micro- incidence literatures (see below).
A second option is based on the observation that behavioural response to taxation can
be split into substitution effects (related to the marginal tax rate), and income effects
(related to the average tax rate). If one defines the incidence of a tax based on the
overall proportion of a tax that is borne by workers vis-à-vis employers, it is also
30 See also section 3.3.5 for a short review of the literature using tax return data to learn about
the elasticity of taxable income.
European Commission
Study on the effects and incidence of labour taxation
May 2015 | 53
related to the average tax rate. If one is therefore willing to rule out income effects,
one can therefore interpret the relationship between average tax rates and individual
total or taxable earnings as providing information on the incidence of the tax. This
approach has been used in a single paper in the micro- literature (Lehmann et al.,
2013).
More novel identification techniques also exist – exploiting differences between intra-
firm and inter-firm differences in tax rates, for instance, as in Bingley and Lanot
(2002). However, as their approach relies on variation in the tax rate at the local level
and very detailed information it may only be applicable to a few countries.
3.2. Direct estimates of the incidence of labour taxation
There are two broad strands in the literature that attempts to directly estimate the
incidence of labour taxation. The first makes use of the non-linear structure of tax and
social security contributions – arising from tax-free allowances, contributions ceilings,
and multiple rates –, or differences in tax and social security contribution schedules
for different individuals or employers, to investigate the incidence of labour taxation
using within-country variation. Analyses using this micro-econometric approach
have found a range of results – with no real consensus as to whether employees or
employers bear the burden; or whether the formal legal incidence of a tax (i.e.
whether the employer or employee formally pay the tax) matters for its economic
incidence.
The macro-econometric literature makes use of cross-country and/or time-series
variation in labour taxation and aggregate measures of the compensation of
employees (such as labour income shares) to uncover the incidence of labour
taxation.31 In contrast to the mixed findings from the micro-econometric literature, the
macro-econometric approach has often been interpreted as finding that the burden of
labour taxation is largely borne by workers. In particular, analysis in Symons and
Robertson (1990) is often cited as evidence that the burden of employers’ social
security contributions is largely shifted on to workers. However, as we discuss below,
there are a number of problems with this analysis, and later macro-econometric
studies have actually found more mixed results.
3.2.1. Meta-analysis of results
Before discussing these literatures in more detail, we summarise the findings of a
recent meta-analysis of papers estimating the incidence of labour taxation.
31 Calling the cross-country time-series literature macro-econometric is actually somewhat of a
misnomer: rather than using the tools of macro-econometrics, such as time series
econometrics, most empirical studies actually utilise panel models, usually more associated with micro-econometrics. But because the literature makes use of aggregate (“macro”) employment, wage, and tax data, it seems more natural to think of it as macro-economic, rather than micro-economic. The use of panel models in many of these studies could be problematic though – it is a method designed for analyses where the number of observations (n, for instance, the number of countries) is relatively high, and the number of periods of observation (t, for instance, the number of years) is relatively low (see e.g. Greene, 2003, p. 283.). In contrast, in some
studies, the number of countries included is relatively small compared to the number of years of data available. This means results may not be as robust as we would like, since the standard fixed effects approach uses only the variation over time.
European Commission
Study on the effects and incidence of labour taxation
May 2015 | 54
Melguizo and González-Páramo (2013) include results from 52 empirical studies from
both the micro- and macro- literature. In a first stage, they provide some descriptive
statistics of the results of these papers. The mean proportion of the burden of labour
taxation borne by employees in the included studies is 66 %.32 However the standard
deviation is very high (51 %), reflecting the fact that different studies find everything
from labour taxes being more than fully borne by employees, through to them being
more than fully borne by employers. In other words, there is little consensus in the
literature.
In the meta-analysis itself they estimate that 66 % of the burden of labour taxation is
borne by employees in the form of lower wages; the standard error of this estimate is
actually quite low (4 %). This reflects the large sample sizes of many of the underlying
studies. When including controls for the institutional features of the countries included
in a study, or the methodology of a study, they find that:
Workers bear less of the burden of tax in the short run (43 %) than in the long run
(74 %).33
Workers bear a greater share of the burden of taxation (79-88 %) in “Nordic
economies” (with a highly centralised bargaining), than in “Continental-
Mediterranean economies”, with an intermediate degree of centralisation, (59-
70 %). In contrast, there is little difference in incidence between “Continental-
Mediterranean economies” and “Anglo-Saxon economies” (which have a low degree
of centralisation).
Different taxes have different effects on net real wages. In studies looking at income
tax, payroll tax and social security contributions only, employees are found to bear
59 % of the burden of taxes. But in studies that look at the overall fiscal or salary
wedge (including indirect taxes, or in the latter instance, all factors that contribute
to wedge between producer and consumer purchasing power), employees are found
to bear 79 % of the total burden. It is not clear whether these differences are a
short- or long-run phenomenon.
The degree of linkage between social security contributions and benefits does not
have a statistically significant effect on the proportion of labour taxation borne by
employees.
Unfortunately, they do not test for whether the invariance of incidence proposition
(IIP) holds – perhaps reflecting the fact that very few papers have explicitly tested
this, as our literature review will show.
32 As discussed above, while the remaining share of taxes is naturally thought of as being borne
by employers, of course this is true only in the first instance: ultimately the burden of the taxes may be shifted to consumers or suppliers via prices, or shareholders via dividends. 33 This is interpreted as evidence of “nominal rigidities”, but it is not clear that this
interpretation is correct, as “nominal rigidities” lead to economic incidence being affected by statutory incidence. A lower share being borne by workers in the short run does not necessarily mean that incidence is closer to statutory incidence – this is only the case where incidence is being identified primarily variation in employer social contributions (where statutory incidence is on the employer). If, instead, identification comes primarily from variation in taxes statutorily
incident on the employee (such as employee contributions, or income tax), the fact that incidence is less on the worker in the short run, would actually count against “nominal rigidities” being important in the short run.
European Commission
Study on the effects and incidence of labour taxation
May 2015 | 55
In this report, we utilise a narrative approach to reviewing the literature. While this
may seem less objective and rigorous than a meta-analysis approach it does have
some benefits. It allows a more nuanced evaluation of the quality of particular
analyses, and can help avoid the risk of drawing too strong conclusions from a
literature that actually finds a wide range of results. Our reading of the literature
suggests that some of the results suggested by Melguizo and González-Páramo (2013)
do seem relatively robust – in particular, a number of papers find that the degree of
centralisation of wage bargaining, and/or of the degree of labour market coordination,
matters for the incidence of labour taxation.34 And there is some evidence that
nominal wage rigidities mean that statutory incidence may matter more in the short
term than in the longer term, as one might expect (it takes time to re-negotiate
wages). On the other hand, we would caution against placing too much emphasis on
the central estimate that employees bear two-thirds of the burden of labour taxation.
The wide range of estimates obtained in different studies, in different countries, and
using different methodologies, mean that we believe that no strong conclusions on the
average proportion borne by workers can be drawn from the available evidence. And,
from a policy point of view, it is important to distinguish between shorter- and longer-
run effects, between the effects of different forms of taxation, and between different
countries and institutional contexts, meaning that such an average measure is of only
limited practical use.
3.2.2. Macro-studies
The OECD (1990) study
The seminal macro analysis was undertaken in Symons and Robertson (1990).35 Two
approaches were used: The first, and most widely known, utilised data from 16 OECD
countries in 1974 and 1986. Incidence of employer and employee social security
contributions was estimated by looking at the link between changes in real average
gross wages and average indirect tax, income tax, and employee and employer social
security contribution rates (measured as aggregate revenues divided by GDP) between
1974 and 1986. In particular, the following equation was estimated:
dln(w) = β0 + β1dtr + β2dte + β3dtc + β4dln (y
e) + dε 𝑑𝑙𝑛(𝑤) = 𝛽0 + 𝛽1𝑑𝑡𝑟 + 𝛽2𝑑𝑡𝑒 + 𝛽3𝑑𝑡𝑐 +
𝛽4𝑑𝑙𝑛 (𝑦
𝑒) + 𝑑휀dln(w) = β0 + β1dtr + β2dte + β3dtc + β4dln (
y
e) + dε (1)
where 𝑤 is the gross wage; 𝑡𝑟 is the employer’s SSC rate, 𝑡𝑒 is the sum of the
employee’s SSC rate and personal income tax rate; 𝑡𝑐 is the indirect tax rate; 𝑦
𝑒 is
average labour productivity, calculated as output divided by employment; and 휀 is the
error term. In such a framework, a coefficient of 0 is interpreted as indicating that full
incidence of employer’s SSCs is on employers, and full incidence of other taxes is on
employees (because the gross wage paid to employees in unaffected by taxes
formally levied on employers or employees). A coefficient of -1 on 𝑑𝑡𝑟 would instead
34 Section 4 of this report provides further discussion on how labour market institutions affect
the incidence and behavioural effects of taxes. In this section, we focus largely on empirical results. 35 The study formed chapter 6 of the economic outlook and is therefore also commonly referred
to as OECD (1990). We also use OECD (1990) for the ease of exposition.
European Commission
Study on the effects and incidence of labour taxation
May 2015 | 56
indicate full incidence of employer’s SSCs on employees (and a coefficient of +1 on
𝑑𝑡𝑒 and 𝑑𝑡𝑐 is interpreted as indicating full incidence of these taxes on employers).
Equation (2) shows the results of this regression:
𝑑𝑙𝑛(𝑤) = −0.05 − 0.91∗∗𝑑𝑡𝑟 + 0.33𝑑𝑡𝑒 + 0.68𝑑𝑡𝑐 + 0.97∗∗𝑑𝑙𝑛 (𝑦
𝑒) (2)
where ** indicates statistical significance. The results suggest that a 1 percentage
point increase in the rate of employer social security contribution rate reduces the rate
of growth of real wages by 0.9 %, on average. This is statistically significantly
different from 0 %, but not from 1 %: the result has therefore been interpreted as
indicating that employer social security contributions are fully incident on employees.
In contrast, the coefficients on employee contributions and income tax, and on indirect
taxes, are not statistically significantly different from 0, which is again interpreted as
indicating full incidence on employees. An f-test that tests whether the incidence of
each tax is the same (i.e. on employees) cannot be rejected – that is, the IIP cannot
be rejected.36 But nor are the coefficients for employee and indirect taxes statistically
significant from +1 meaning that we cannot reject that employers ultimately bear the
full incidence of these, – and indeed, for indirect taxes, the coefficient is closer to 1
than to 0, and the central estimate is that employers bear two thirds of the burden.
This indicates the weak statistical power of this particular analysis, based as it is on
only 16 pair-wise observations.
Given that it is based on 12-year difference, some have argued that these results are
likely to pick up the longer-run incidence of tax changes.37 This is not necessarily the
case though, and depends upon the exact pattern of tax changes that took place.38 A
second approach based on individual time series for each of the 16 countries, and
covering the period from 1955 to 1986, attempts to estimate long-run effects more
directly by estimating the following auto-regressive equation:
ln (𝑅𝑃𝑊)t = 𝛽1ln (𝑅𝑃𝑊)t−1 + 𝛽2(𝑙𝑛𝑘 − 𝑙𝑛𝑙) + 𝛽3𝑇𝑇 + 𝛽4𝑋 + 𝑑휀 (3)
where 𝑅𝑃𝑊 is the real product wage, defined as the gross wage plus employer social
security contributions, all deflated by the producer price index; 𝑘 is the capital stock; 𝑙
is the labour force; 𝑋 is a dummy for the period 1970 to 1976 to account for a “wage
explosion” during that period; and 𝑇𝑇 is the total tax wedge calculated as:
𝑇𝑇 = 𝑡𝑟 + 𝑡𝑒 + 𝑡𝑐 + 𝑡𝑚 (4)
36 The F-test performed tests whether 𝛽1 = (𝛽2 − 1) = (𝛽3 − 1). 37 Intuitively, this argument relies on the fact that the measured tax changes that occurred
between 1974 and 1986 are more likely to have taken place at some point prior to 1985, say, than in 1985. Thus taking differences over longer periods (e.g. a 12 year period) is more likely to pick up longer term effects that taking differences over shorter periods (e.g. a 1 year period). 38 Tax changes could have taken place between 1985 and 1986, for instance; or, perhaps, tax
changes later in the period reversed tax changes earlier in the period, so that the 12-year difference picks up the shorter-term impact of a later tax cut, say, and the longer term impact of an earlier tax rise.
European Commission
Study on the effects and incidence of labour taxation
May 2015 | 57
where the additional term 𝑡𝑚 reflects the difference between the pre-tax price of
consumption goods compared to produced output (which OECD (1990) terms an
“import tax”, as one reason a difference in these two price indices is difference
between the price of produced goods and consumed imports). Equation (5) shows the
result of averaging the coefficients from regression in each of the 16 countries:
ln(𝑅𝑃𝑊)t = 0.8 ln(𝑅𝑃𝑊)t−1 + 0.15(𝑙𝑛𝑘 − 𝑙𝑛𝑙) + 0.08𝑇𝑇 + 0.03𝑋 + dε (5) (8.4) (1.7) (0.5) (2.1)
where average t-statistics are in parentheses. Because coefficients from 16 individual
regressions have been averaged to obtain these results, under the assumption of
independence, an average t-statistic of 0.5 is “on the borderline of significance”, which
means that the results may indicate that employers bear a small positive fraction of
the tax burden in the first instance. A further regression is estimated to test for the IIP
by in addition including the term 𝑡𝑟- te in equation (5). The average coefficient on this
difference is -0.05, and the average t statistic is 0.1: this is far from significant,
meaning that the IIP cannot be rejected. But as the OECD (1990) points out “the
coefficient on 𝑡𝑟- te is not well determined”. Once the feedback effects of ln(𝑅𝑃𝑊)t on
ln(𝑅𝑃𝑊)t−1 ... in such an auto-regressive framework are taken into account, the 95 %
confidence of the effect of a 1 percentage point increase in employer SSCs combined
with a 1 percentage point reduction in employee taxes is a change in the real product
wage of between -1.6 % and +1.2 %. In other words, while the IIP cannot be
rejected, neither can the proposition that employer taxes are borne by the employer,
and employee taxes by the employee (or indeed, the reverse!).
Lastly, OECD (1990) undertakes a shorter-run analysis:
ln (𝑅𝑃𝑊)t = 𝛽1ln (𝑅𝑃𝑊)t−1 + 𝛽2(𝑙𝑛𝑘 − 𝑙𝑛𝑙) + 𝛽3𝑇𝑇 + 𝛽4𝑑𝑇𝑇 + 𝛽5𝑋 + 𝑑휀 (6)
where the change in the tax wedge (𝑑𝑇𝑇) is also included, either with, or instead of
the level of the tax wedge (𝑇𝑇). This finds a 𝛽4 coefficient of approximately 0.5,
suggesting that in the short run, around half the burden of taxes are borne by
employers in the form of a higher real product wage. This coefficient is very highly
significantly different from both 0 and 1. They also test whether the incidence of
employer’s SSCs differs from that of employee taxes and indirect taxes. They find that
Employers bear a relatively lower share of employee taxes than employer taxes,
meaning that the IIP can be rejected. However they also reject statutory incidence
as well, suggesting that even in the short term, some shifting may occur;
Employers bear more of the burden of indirect taxes than labour taxes, perhaps
reflecting the fact that employees and employers pay significant attention to
inflation (which will be affected by indirect tax changes) when negotiating pay.
The discussion so far has generated two findings from the OECD (1990) study. First, is
that the statistical power of its “longer run” analyses is weak. In the analysis making
use of 12-year differences in gross wages and tax rates, one can reject neither the
hypothesis that the full incidence of employee taxes and indirect taxes is on
employees, nor that it is fully incident on employers. In the long-run auto-
regressive model, one can reject neither statutory incidence nor the IIP. Second, in
European Commission
Study on the effects and incidence of labour taxation
May 2015 | 58
the “shorter run” analysis, where statistical power is stronger, taxes are found to be
partly incident on employers, and the IIP can be rejected. This latter finding is
something we will find further support for in other studies.
The OECD (1990) study has also been subject to a recent critique. In a forthcoming
review Geibel et al., look at the empirical methodology and data utilised in the study.
They highlight a number of problems with both. For instance, they criticise the use of
the following type of approximation ln (1 + 𝑡𝑟) ~𝑡𝑟 when deriving equation (1), pointing
out that it does not hold particularly well for large values of 𝑡𝑟.39 They also find
problems with the tax revenue data utilised by the OECD (1990) – and subsequently
by a number of other studies –, which differs from measures constructed directly from
published National Accounts data. Although unable to replicate the OECD (1990)’s
results using published OECD data, the results that are obtained are shown to be
highly sensitive to the choice of years and countries used (excluding Sweden, for
instance). For instance, if 6-year (rather than 12-year) differences are used, the
coefficient on 𝑑𝑡𝑟 is found to vary between 0.119 and -3.622, depending on which 6-
year pairs are used.
OECD (1990) – a seminal study which has done much to influence subsequent
thinking on labour taxation (see for instance, Saez et al. 2012a, and CPB and CAPP,
2013) – is therefore not a valid basis for concluding that the incidence of labour
taxation is shared in the short term, but borne fully by employees in the long term.
We now review other papers in the macro- literature, and find some support for
differences between short- and long- run incidence, but no firm consensus on whether
taxes are fully borne by workers in the long run. A summary of the papers and their
results can be found in Appendix Table 1. In what follows, we draw out the
implications of the literature, rather than assess each paper on a case-by-case basis.
Other macro studies
We have identified seven other studies that directly estimate the incidence of taxes
using macro cross-country data: Alesina and Perotti (1997); Arpaia and Carone
(2004); Azemar and Desbordes (2010); Daveri and Tabellini (2000); Nunziata (2005);
Ooghe et al. (2003); and Tyrvainen (1995). In general, these studies have improved
upon the methodology used in the OECD (1990) study – for instance, including
ln (1 + 𝑡𝑟) rather than making use of the aforementioned approximation –, although two
of the most cited studies use the same problematic OECD revenue statistics to derive
their measures of taxation (Alesina and Perotti, 1997, Daveri and Tabellini, 2000).
Measurement error in these tax variables may bias results.
As Appendix Table 1 shows, the studies find a range of results – with some suggesting
that labour taxes are borne almost entirely by workers, even in the short run (Arpaia
and Carone, 2004), whilst others find that a substantial degree of taxes are borne by
employers, even in the long run (for instance, Azemar and Desbordes, 2010), in some
contexts. There is also a significant degree of heterogeneity across countries
(Tyrvainen, 1995), which, as we discuss below, seems to be linked to wage bargaining
39 The regression model is derived from the first order condition of a profit maximising firm,
which includes the term ln (1 + 𝑡𝑟). They also point out the regression model includes average
labour productivity, whereas the underlying model of profit maximisation is based on marginal labour productivity.
European Commission
Study on the effects and incidence of labour taxation
May 2015 | 59
regimes. This means that no strong conclusions can be drawn about the incidence of
taxation in general. But what patterns emerge from the literature?
We first examine whether there are systematic differences between short- and long-
run tax incidence. The dynamic effects of labour taxation are accounted for in most of
the papers. Tyrvainen (1995) applies a vector auto-regressive model to look at the
long-term effects of taxation on wages. Arpaia and Carone (2004), Azemar and
Desbordes (2010), and Nunziata (2005) all include an auto-regressive component: by
modelling the persistence of wages, one can differentiate between short- and long-
term effects (as in the OECD study). And within the studies applying static panel
models, perhaps the most cited paper (Alesina and Perotti, 1997), examines whether
calculating changes in wages and taxes over 1-year or 2-year periods affects results.
Alesina and Perotti (1997), in fact, find little difference between such estimates: and if
anything, their results that employers bear part of the burden of labour taxation, and
the wage bargaining regime is important for tax incidence are stronger (rather than
weaker), for 2-year as opposed to 1-year differences. In addition, in Arpaia and
Carone (2004), Nunziata (2005), and Azemar and Desbordes (2010), the high degree
of persistence of labour costs implies that the long-run effects of taxes on labour costs
are larger than the short-run effects. Given that each of these studies finds that a part
of the burden of taxation is borne by employers in the short-run; the implication is
that employers bear more in the long term.
However, these results should be treated very cautiously. First, as in OECD (1990),
the longer-run models have weak statistical power: in Arpaia and Carone (2004), for
instance, the long-run effects of taxation on labour costs are statistically insignificant,
meaning that it cannot be rejected that the employee bears the entire burden,
whereas the (smaller) short-run effects are statistically significant. Second, accounting
for the persistence of employer costs is not a particularly convincing way of controlling
for the longer-run effect of taxes: it may be better to include lagged values of taxes,
or lagged values of changes in taxes. Unfortunately none of the studies examined does
this. Third, Azemar and Desbordes (2010) suggest that one should account for
feedback effects of the larger long-term effects of taxes on employer costs (on
unemployment, say). Doing this they find that the rather than bearing around 90 % of
the burden of taxation, falls in wages induced by higher unemployment, mean
employers bear only around 55 % of the burden of taxation in the longer term, close
to the share borne in the short term. We are less convinced by this argument (it could
surely apply to short-term effects too), but it does highlight the difficulty in separately
identifying the incidence of taxes from their behavioural effects, that we raised earlier.
Thus it seems difficult to conclude whether incidence differs between the long- and
short- run from the macro- evidence.
Estimating separately the effects of different components of the tax wedge – such as
employer SSCs, employee SSCs, income tax, and indirect taxes – allows one to test
the IIP. Only one study we have found undertakes such a test. Arpaia and Carone
(2004) find that employer SSCs and income taxes increase labour costs by a similar
statistically significant (but economically very modest) amount, whereas employee
SSCs are borne entirely by employees in the form of lower wages. However, in the
longer run, the IIP may hold: Arpaia and Carone cannot reject the IIP in the longer
run, although like their other long-term results, this may again reflect weak statistical
power.
European Commission
Study on the effects and incidence of labour taxation
May 2015 | 60
More studies examine whether social security contributions have different effects to
income taxes. Alesina and Perotti (1997) finds evidence for differences in the
incidence of income tax compared to SSCs (employer plus employee) in the short-
term – with employers bearing more of the burden of income tax than SSCs in
countries with highly centralised bargaining, and more of the burden of SSCs relative
to income tax in countries with moderate or low degrees of centralisation (only the
former result appears to be statistically significant though). The authors suggest this
may reflect the link between SSCs and benefit entitlements (see also Summers, 1989)
– which negotiators in more centralised wage bargaining systems are better able to
take account of. In support of this, Ooghe et al. (2003) also find hints that the share
of the burden of employer SSCs that is shifted to employees increases with the
strength of the link between contributions paid and benefit entitlements. Again, in the
long-term, these factors may matter less: Tyrvainen (1995) finds no difference
between the incidence of employer SSCs and income tax in 8 out of 10 countries in his
longer-run analysis.
Perhaps the most consistent result is that labour market institutions, and in particular,
the degree to which the wage bargaining process is centralised, plays a role in
determining the economic incidence of labour taxation. Following analyses of how
wage bargaining processes affected the link between taxation and unemployment,
Alesina and Perotti (1997) examined how they affected the link between taxation and
labour costs. They find that in countries with highly centralised wage bargaining
(between a general employers’ confederation, and the confederation of trade unions,
say), and in countries with strongly decentralised wage bargaining (such as between
individual firms and its workers, or individual workers), taxes are borne almost
entirely by workers. In contrast, in countries with an intermediate degree of
centralisation (e.g. industry-level bargaining), around two-thirds of the burden of
taxation is borne by employers. This is consistent with their theoretical model of the
labour market where as unions gain market power they are able to shift more taxes
on to employers but that when bargaining takes place at the economy-wide level, less
shifting occurs as unions then have more of an incentive to take account of the
negative effects of high labour costs on employment. This develops ideas from Olson
(1982), Calmfors and Drifill (1988) and others.
Following this work, four of the other studies also examine the role wage bargaining
plays in determining the incidence of taxation.40 Daveri and Tabellini (2000) find
similar (albeit less strong) effects, with employers bearing around 40 % of the burden
of labour taxation in countries with an intermediate degree of centralisation, and
relatively little elsewhere. Nunziata (2005) use a different measure of “labour market
coordination” and find employers bear a slightly higher fraction of taxes in countries
with a moderate degree of coordination, than in those with a lot or a little
coordination. However, when using the same measure of “centralisation” as in earlier
work, they find that employers bear part of the burden in countries with a moderate
and low degree of centralisation: only in countries with a high degree of centralisation
40 Tyrvainen (1995) find a significant degree of heterogeneity of incidence across countries.
Although not explicitly linked to bargaining institutions, the pattern is suggestive. Incidence is
more on workers in the US, UK and Sweden (highly centralised or decentralised countries), and more on employers in Germany and a number of other continental European countries (which have an intermediate degree of centralisation).
European Commission
Study on the effects and incidence of labour taxation
May 2015 | 61
do workers bear the entire burden. Azemar and Desbordes (2010) also find this
pattern: workers in countries with a high degree of centralisation, bear all of the tax,
but less than half in decentralised countries. Finally, Arpaia and Carone (2004), find
the opposite pattern – with countries with an intermediate degree of centralisation
exhibiting full incidence on workers, but those with a high degree of centralisation or
decentralisation showing some incidence on employers (albeit only a modest amount).
Whilst consistently finding an effect of bargaining institutions on tax incidence,
therefore, the literature does not provide a simple consensus on just what those
effects are.41
Taken together, the picture from that emerges from the macro literature is therefore a
little disappointing and more than a little confusing:
It is not clear what fraction of the burden of tax is borne by workers or employers in
either the short- or long-run, in part, reflecting the difficulty of estimating long-run
incidence;
Little work examines the IIP. More work examines differences between the incidence
of SSCs and income tax, a comparison to which the IIP need not apply – because of
the link between SSCs and benefit entitlements;
It is clear that wage bargaining institutions matter and most papers suggest a high
degree of centralisation is associated with a greater share of taxes being borne by
workers than an intermediate degree of centralisation. Furthermore, papers tend to
find that incidence under decentralised systems is closer to that under high degrees
of centralisation.
We now examine studies making use of within-country changes to SSCs and taxes to
see if stronger conclusions can be drawn from these.
3.2.3. Within-country studies
The literature that makes use of data from a single country, often in the form of micro
(employer- or worker-level) data, is larger, and growing more rapidly than the macro-
literature. It also differs in its scope: rather than examine how changes in the overall
tax wedge (including SSCs, income tax, and sometimes indirect taxes), papers in the
micro- literature typically examine the incidence of SSCs, or payroll taxes, only. Of the
studies we have identified, only 2 examine the incidence of income tax (although
rather more examine the incidence of tax credits, such as the Earned Income Tax
Credit in the US, and similar schemes in Europe). We therefore organise this part of
the review by tax rather than countries or econometric approach.
Studies of the incidence of SSCs
Turning first to SSCs and payroll taxes, the evidence does not support Fullerton’s and
Metcalf’s (2002) claims that studies have “consistently” found that the incidence of
such taxes is fully on workers. While three of the most influential studies find this to
be the case (Gruber, 1997, Anderson and Meyer, 1997 and 2000), a number of other
studies find incidence of the tax is shared between workers and employers, and that
the splitting of the legal incidence of SSCs (Saez et al., 2012a) translates into
economic incidence.
41 The review of the wage settings institutions in section 4.1 will shed some more light on the
differences in the results.
European Commission
Study on the effects and incidence of labour taxation
May 2015 | 62
The majority of the studies adopt a panel, or difference-in-difference (DiD) style
approach, making use of reforms to social security contributions that affect different
workers or different employers in different ways. Gruber (1997) is typical. Gruber uses
data from censuses (in 1979, 1980, 1984 and 1985) of all manufacturing plants in
Chile with more than 10 employees. A major reform to the Chilean social security
system in 1981 led to substantial changes in both employee and employer SSCs,
which differed substantially across different manufacturing plants, because of the
significant degree of heterogeneity in the amount of SSCs different employers were
liable to for a given wage bill, both pre- and post- reform. This reflects the wide range
of different social security institutions in Chile, with different tax rates, and features of
the SSC regime such as tax rates depending on assessed risks, and the exemption of
certain wage costs from SSCs. Gruber (1997) is only interested in estimating the
incidence of employer contributions: changes in employee SSCs are a confounding
factor in his model that he attempts to overcome. A number of different empirical
approaches are used, to try to overcome this, and other confounding factors. This
includes standard DiD (identifying from differential changes in wages between plants),
and difference-in-difference-in-difference (identifying from differential changes in
wages between blue and white collar workers within a plant). The results suggest that
there is full shifting of employer contributions to employees in the form of lower
wages. And for white collar workers in particular, there is evidence of more-than-full
shifting (with wages falling by more than the cash value of contributions). Gruber
interprets this as indicating that workers highly value the type of insurance provided
by the SSC system (which is often poorly provided for in the private sector), and are
therefore willing to pay a more than actuarially fair price for it. This suggests that the
link between SSCs and benefits may matter for incidence.
Anderson and Meyer (1997, 2000) use similar variation in SSCs across employers in
the United States to estimate the incidence of employer contributions there. In both
papers they find evidence that, aggregate or industry-level changes in employer SSCs
are borne to a significant extent by workers (point estimates from their 1997 paper
suggest there is a little less than full shifting, but those from their 2000 paper
suggests there may be more than full shifting to workers). However, two things are
worth noting. First, the standard errors associated with the estimated coefficients are
large – in a number of instances, the 95 % confidence intervals span the interval
between no shifting, and far more than full shifting. Second, employers are much less
able to shift firm-specific changes in employer SSCs to workers. This may reflect the
fact that firms are competing with other firms in the same industries for workers (as
well as for customers), and can therefore not pass on firm-specific costs, but only
costs that are common across firms in the industry. This can lead to employment
reallocation across firms, which the authors argue means the results confirm that “in
some cases, differences in taxes across employers lead to large dead-weight losses”.
This difference between “firm” (or individual) and “market” level incidence is important
and is something that the rest of the literature using micro- data has tended to not
pay close enough attention to.
Murphy (2007) uses variation in unemployment insurance (UI) taxes and wages
across US states in the period between 1992 and 2002 to look at the extent to which
the incidence of tax differs for different types of workers. He notes that with variation
in UI rates across states, workers (and employers) can respond by moving between
European Commission
Study on the effects and incidence of labour taxation
May 2015 | 63
states: those workers who are most mobile across states would be more “responsive”
to variation in UI rates and would therefore bear less of the burden of the tax than
those who are less geographically mobile. Based on data on inter-state mobility, those
aged 16-24 and working at least 20 hours a week, and married white women aged 25-
54 working full time are defined as “less mobile”; married white men aged 25-54
working full time are the “more mobile” group. He finds evidence that the falls in
wages when the UI base is extended or when there are unpredictable increases in UI
rates42 take two years to materialise, and are larger for the “less mobile” workers.
Depending on the method used, between one quarter and three quarters of UI
appears to be borne by married male workers (and the rest by employers); for
women, and youths, however, there is some evidence of more than full shifting of the
burden.
The US has, on the whole, highly decentralised wage bargaining, as does Chile. Taken
together, these papers therefore add to the impression that workers are likely to bear
a substantial part of the burden of employer (and likely employee) SSCs in countries
with decentralised bargaining. Within Europe, this includes countries like the UK and
Ireland. But what do studies undertaken in European countries themselves suggest?
Bell et al. (2002) use a DiD approach and industry-level data to analyse the incidence
of employer SSCs in the UK with identification provided by the differential impact
across sectors of a 1999 reform. Changes in the average wage in each industry are
related to the average change in employer SSCs paid by firms in that industry. Results
suggest that employer SSCs are fully borne by workers – indeed, there is some
evidence again, that workers bear more than the full burden, which is somewhat
strange in the UK context given the very weak link between contributions and benefits
(and the fact that the reform did not change benefits). However, estimates are
imprecise (the 95 % confidence is that workers bear anything from about a quarter of
the incidence, to more than two and a half times the incidence) and there is evidence
of output prices also responding to the change in SSCs, which would seem strange
SSCs if SSCs are quickly and fully reflected in changes in nominal wages. Results from
this study (the only published study for the UK we have found), should be treated with
caution.
Lehmann et al. (2013) look at the effect of changes in employer SSCs (and tax
credits) on the employer cost of labour in France. They make use of reforms in the
mid-2000s that differentially affected firms operating 35-hour and 39-hour contracts
to identify the behavioural effects of SSCs (identification for the impact of tax credits
comes from their differential affect according to income and number of children). A
model of the following form is estimated:
∆ ln(z) = 𝛼 + 𝛽𝑡𝑆𝑆𝐶∆ ln(1 − t𝑆𝑆𝐶) + 𝛽𝑡
𝑖𝑡∆ ln(1 − t𝑖𝑡) + 𝛽τ̅𝑆𝑆𝐶 ∆ln(1 − τ̅𝑆𝑆𝐶)
+ 𝛽τ̅𝑖𝑡∆ ln(1 − τ̅𝑖𝑡) + 𝑋𝛿 + 휀 (7)
where z is employer cost, t𝑆𝑆𝐶 and t𝑖𝑡 are marginal SSC and tax credit tax rates, and
τ̅𝑆𝑆𝐶 and τ̅𝑖𝑡 are the equivalent average tax rates. Coefficients on the marginal tax rates
pick up substitution effects, whilst those on average tax rates pick up either income
42 Murphy (2007) argues that many of the changes in UI rates are predictable based on the
economic cycle.
European Commission
Study on the effects and incidence of labour taxation
May 2015 | 64
effects, participation responses, or the incidence of a tax (the paper is agnostic about
which of these phenomenon it is investigating). The results show that changes in
employer payroll taxes are reflected almost one-for-one in employer cost (i.e. the
hypothesis 𝛽𝑡𝑆𝑆𝐶 = −1 cannot be rejected) indicating that employers bear almost the full
incidence of employer contributions, at least in the short run. Note, that income
effects and participation responses would tend to go in the opposite direction (i.e.
have a positive effect on 𝛽𝑡𝑆𝑆𝐶) meaning this result cannot be explained by these
effects confounding the effect of the incidence of employer SSCs. This result is in line
with results from Aeberhardt and Sraer (2009), who find that the reduction in
employers' payroll tax for low-wage workers did not generate wage moderation (see
also Lhommeau and Remy, 2009 and Bunel and L'Horty, 2012).
Saez et al. (2012a) find similar results for Greece but plausibly argue that their
method uncovers the long-term rather than short-term incidence of SSCs. They make
use of a reform in 1993 which led to new entrants to the labour market after that date
facing a permanently much higher earnings cap for payroll taxes than existing workers
did. This increased the amount of employer and employee contributions levied on the
earnings of those new workers who earned more than the initial cap. The analysis
uses a regression discontinuity design approach, comparing the earnings of people
entering the labour market just before and just after the reform took place. In their
main specification, “just before” is interpreted as the 5 years prior to the reform; and
“just after”, the 5 years after. Because these 5-year bands may seem too wide, they
also test the sensitivity of their results to using 2-year “before” and “after” bands.
Three measures of earnings are measured: the employer cost; the gross “posted”
earnings; and the net earnings received by the worker. If employers were able to shift
the burden of employer SSCs fully on to workers, the employer cost of people entering
the market “just before” and “just after” the reform should be the same; the gross
and net earnings would be lower though, reflecting the additional employee SSCs and
shifted employer SSCs being borne by workers. On the other hand, if workers were
able to fully shift the burden to employers, net earnings would remain unchanged and
gross wages and employer cost would be higher for those entering the labour market
after the reform.
In fact, it is gross earnings that are unchanged before and after the reform; employer
cost jumps up, and net earnings jumps down. The size of the discontinuities mirrors
the discontinuities in average employee and employer SSC rates caused by the
reforms. Saez et al. argue that this means that statutory incidence matters for
economic incidence: employers bear the cost of employer SSCs, and employees of
employee SSCs. This is rationalised by long-lasting nominal wage rigidities associated
with workers and employers bargaining over gross earnings, rather than net earnings
and employer costs. In other words, employers find it difficult to offer different gross
earnings to workers based only on the tax regime they face. However, this is not
necessarily the case: it could just be that the economic incidence of both employee
and employer contributions is the same and it just happens that the share formally
borne by workers versus employers happens to align well with the sharing of the
economic incidence of the tax. So Saez et al.’s approach – where the change in
employee and employer contributions is co-linear – cannot really allow one to test
whether the IIP holds or not. Nevertheless the results are fairly convincing indicative
evidence that the IIP may not hold in the long run.
European Commission
Study on the effects and incidence of labour taxation
May 2015 | 65
A number of studies look at the incidence of SSCs in Scandinavia.
Holmund (1983) is an early paper for Sweden, and uses a very simple time-series
model relating changes in average SSC rates to changes in average hourly wages and
prices in the mining and manufacturing sectors. The results suggest that around half
of the burden of employer social security contributions is borne by employers, and the
other half by employees, at least in the short term.
The more recent Scandinavian literature focuses on evaluating the impact on wages of
reforms to SSCs that target particular regions or parts of the population. A number
examine the effect of reductions in SSCs in so-called “regional support areas” in
Finland and Sweden. Bennmarker et al. (2009) looks at the impact of a 10 percentage
point reduction in employer SSCs in 2002 in northern Sweden. When looking at
existing firms only, they find that workers saw a 0.25 % increase in wages for every 1
percentage point decrease in the employer SSC tax rate. This would suggest workers
gained a little, but most of the gains from lower employer SSCs were retained by
employers. Interestingly, when allowing for entry and exit of firms, the effect on
wages becomes statistically insignificant (although this could relate to selection effects
– those firms who enter to take advantage of labour costs could be lower-paying
employers, for instance).43
Korkeamäki and Uusitalo (2009) and Korkeamäki (2011) look at the impact of similar
policies in Finland using a DiD approach. The former paper finds that wage increases
shifted about half of the gains from lower employer SSCs to workers in the form of
higher wages, although the estimates are unfortunately not statistically significantly
different from zero. However, the latter paper, which uses a larger sample of
employers, finds little effect on wages (suggesting that employers kept all the gains).
Delving deeper, Korkeamäki (2011) estimates the effect on wages to be positive and
significant in one region (Lapland) but negative and significant in the other (Kainuu).
It is possible that the results for Kainuu are impacted by a negative shock in that
region (a violation of the common trends assumption required for DiD analysis), but
equally, so could the results for Lapland.44 These papers therefore highlight the
difficulty in finding a plausible identification strategy.
Two other Swedish studies examine the impact of reforms to employers SSCs for
young people in 2007 and 2009, which reduced contribution rates by a total of around
16 percentage points (11 percentage points in 2007, and a further 5 percentage points
in 2009). Egebark and Kaunitz (2012) analyse the impact of the first round of cuts in
2007 across the economy as a whole. A DiD approach is used, where the treatment
group are aged 21–24 (those benefiting from the first round of the reform), and the
control group are those aged 25–26. The study finds a small positive effect on
employment, and virtually no effect on wages, implying that the cuts in employer
SSCs were incident on employers. Skedinger (2012) focuses on the impact of the
reforms on workers in the retail sector. Again a DiD approach is used, and he finds
that wages increased by between only 0.8 and 1.1 per cent as a result of the reforms,
which would mean an overwhelming majority of the incidence of the cut in SSCs was
enjoyed by employers in the form of lower labour costs.
43 Selin (2012) investigates the role of taxation for the SSC for self-employed and finds at tax
price elasticity of -0.5. 44 See section 3.3.2 for a short discussion of the common trend assumption.
European Commission
Study on the effects and incidence of labour taxation
May 2015 | 66
Along with the results for France and Greece, and those of Anderson and Meyer (1997,
2000), this Scandinavian literature highlights that the incidence of a change in labour
taxes is likely to vary according to how broad a group of people or employers that
change affects. For instance, in the US reforms, a large part of the change in employer
SSCs that was common across employers in their sector was passed on to workers,
but very little of the firm-specific change was. In France, 35-hour and 39-hour firms
faced differential changes in employer SSCs, and could not pass these on to workers.
And one interpretation of the results for Greece is that employers could not pass on a
large increase in employer SSCs to workers who entered the labour market after
reforms, but that workers did bear the effect of higher employee SSCs. Competition
between similar employers for workers, and between similar workers for jobs,
combined with firm-level bargaining over the nominal gross wage (rather than
employer cost and net wage) could explain such a pattern. It could also mean that
targeted reductions in employer SSCs are more likely to lead to reductions in
employer costs, than more broad-based reductions in employer SSCs.
These findings also have methodological implications though. One reason why studies
using micro- data may be more likely to find employers bear a substantial part of the
burden of SSCs than macro- studies do is the type of variation in tax rates utilised.
Micro- studies exploit variation between workers and employers, whereas macro-
studies exploit variation over time or between countries. Employers may not be
able to change gross wages for different employees, or offer different gross wages to
other employers, in order to pass on idiosyncratic variation in their SSC bills. But it
seems more likely that they can offer different wages over time, or compared to
employers in other countries (due to limited labour mobility, for instance, as
suggested by Murphy, 2007). And perhaps a note of caution should be sounded for the
results more generally. If employers pass on changes in SSCs to workers not by
changing individual wages, but by changing the average wage they pay across all
workers (that is the burden of SSCs is shared across workers), identification based on
comparing individuals directly affected by a reform with those not directly affected
would be inappropriate. This means DiD analysis comparing workers (or employers)
affected differentially by a reform may be drawing erroneous conclusions. Taxes may
be shifted from employers to workers (or vice versa) not at the individual level, but at
the employer or market level. This is a difficult issue to overcome, but has been
utilised as an identification strategy in a novel analysis of the incidence of income tax.
Studies of the incidence of income tax or tax credits
Bingley and Lanot (2002) make use of the variation in local income tax rates across
municipalities in Denmark to identify both the behavioural effects and incidence of
income tax. Tax rates vary based upon where the employee lives, rather than where
the employer is based. This means that a given employer (or establishment) will often
employ people who face a range of different income tax rates. At the same time, the
average tax rate faced by employees will differ across employers based on where they
are located, as employees tend to be drawn from a fairly local pool. Bingley and Lanot
assume that establishment- or employer- level wage setting means that employers
cannot vary wage rates paid to employees based solely differences in the income tax
rates they face. Any within-employer variation in the earnings of “similar employees”
associated with differences in the income tax rates they face, are therefore assumed
to be the result of behavioural response (e.g. working longer hours, or working harder
European Commission
Study on the effects and incidence of labour taxation
May 2015 | 67
per hour). Information on the incidence the income tax is then backed out using
information on between-employer variation in earnings and average income tax rates,
and what is known about behavioural response from the within-employer variation.
Results suggest there is partial shifting (40 %) of the burden of income tax from
workers to employers.
Kubik (2004) looks at the incidence of income tax using the American 1986 income
tax reforms. He looks at how hourly wages change for different occupations affected
differently by these tax reforms, implicitly assuming that behavioural change is
captured by hours of work and employment. The findings show that those occupations
that saw relatively large falls in their marginal tax rates also saw their relative wages
fall.45
A range of papers examine the incidence of tax credits. Azmat (2006), looks at the
incidence of the Working Families Tax Credit (WFTC) in the UK. Using a DiD approach
(comparing claimants with similarly skilled non-claimants), she finds that employers
captured about 35 % of the value of the tax credits paid to men, on average, by
reducing the gross hourly wage. Employers could not reduce wages below the National
Minimum Wage, however, meaning less of the incidence of the tax credit was on
employers for the lowest paid. This may be one reason why no robust effect of tax
credit receipt on the wages of women can be found (women tend to have lower hourly
wages). Azmat also finds evidence of spillover effects, with wages in industries and for
education groups with high numbers of WFTC claimants seeing a slow-down in wage
growth relative to other industries.
Leigh (2010) and Rothstein (2008) find similar results for the US Earned Income Tax
Credit (EITC). Rothstein’s identification is provided by the differential effect of the
EITC on individuals with different skill levels and different family structures. He finds
that for every $1 of EITC paid, recipients benefit by 70 cents, with reductions in their
gross wage benefiting their employer by 30 cents. Again, there is strong evidence of
spill-over effects on the wages of other ineligible low-skilled workers. Reductions in
their wages benefit employers of low-skilled labour more generally by 42 cents for
every $1 of EITC paid, increasing the overall benefit to employers to 72 cents.46 These
results therefore emphasise how different market-level and individual level incidence
can be. It is a weakness of the incidence literature that most papers do not distinguish
between these two phenomena.
3.2.4. Summary
A recent meta-analysis (Melguizo and González-Páramo, 2013) provides a relatively
precise estimate of the fraction of labour taxes borne by workers in the form of lower
wages: around two-thirds, on average. The narrative literature review undertaken
here, however, finds that the range of estimates is too broad, and too contextually
specific, to consider this to represent a consensus on how the incidence of labour
taxes are shared between workers and employers. However, the review has suggested
the following:
45 Unfortunately, Kubik (2004) relates changes in hourly wages to changes in marginal (and
not average) tax rates, meaning that results are not fully comparable to other studies. 46 In a follow up paper Rothstein (2010) simulates the incidence of the EITC and finds that
employers capture 0.36 cents from non-eligible low skilled workers.
European Commission
Study on the effects and incidence of labour taxation
May 2015 | 68
Although there is a wide-range of results, the balance of evidence suggests there is
likely to be some degree of sharing of the incidence of labour taxation between
workers and employers, possibly even in the long run. This includes income taxes as
well as social security contributions.
But the extent to which labour taxes are borne by workers or employers seems to
differ between different countries. In particular, incidence appears to be related to
the degree of centralisation in bargaining, in both theory and practise. There is
some evidence that more of the incidence of such taxes are borne by employers in
countries where bargaining takes place at the industry level (an “intermediate
degree of centralisation”), than at the firm/worker level (“low centralisation”) or at
the multi-sector or economy-wide level (“high centralisation”). Support for this is
strongest in the macro- as opposed to the micro- literature, perhaps reflecting that
many of the micro- studies for countries with a high degree of centralisation (like
Sweden) are based on reforms that affect only a subset of the labour market.
Tests of whether the legal incidence matters for economic incidence (i.e. whether
the IIP holds) are surprisingly few and far between. What evidence that does exist
suggests that legal incidence is likely to matter in the short term; whether it
matters in the long term is less clear, in part because standard errors are large in
many long-run models.
More generally, the literature examining long-run incidence is sparse and beset by
identification problems. More research is needed, using consistent methods on both
macro- and micro- data on a cross country basis. This includes application of true
time-series econometrics, rather than simple autoregressive models.
3.3. Review of the literature on labour supply elasticities
Individuals can respond to changes in (real) wage rates along three margins:
participation on the labour market (the extensive margin), hours worked (the
intensive margin) and taxable income (Blundell, 2012). The last margin includes
variations in work effort, as well as the shifting of wage income towards other forms of
taxable income (such as capital or corporate income), towards activities that reduce
the tax base (such as higher expenditures on housing or charitable giving), or towards
tax evasion (Saez et al., 2012b). In this section, we will first discuss the pure labour
supply response to changes in the real wage rate, starting with a brief description of
the economic model of labour supply, and the empirical strategies that have been
employed in the recent literature to estimate the size of responses, mentioning the
key econometric issues with each approach. Then we will aim to give an overview over
consensus estimates of labour supply elasticities for various socio-economic groups
relying on other surveys and recently published studies. We then discuss recent efforts
to incorporate family decision making into the standard labour supply model. In the
final part of this section, we review what can be learned from the literature about the
elasticity of taxable income from recently available tax return data.
3.3.1. Economic model and interpretation of the wage elasticity of
labour supply
The Marshallian (uncompensated) wage elasticity of labour supply is defined as the
percentage change in labour supply in response to a 1 percent change in the (net)
wage rate (holding non-labour income constant). In contrast, the Hicksian
European Commission
Study on the effects and incidence of labour taxation
May 2015 | 69
(compensated) elasticity holds utility constant, isolating the “pure price effect” of a
change in the wage rate. More studies report the uncompensated (Marshallian) than
the compensated wage elasticity, which is why we concentrate on this measure. In the
theoretical model, the income effect of a change in the net wage rate has to be
considered as well: as wages increase, budget sets expand, and individuals might
want to substitute time towards leisure, counteracting the price effect of a wage
increase. In the empirical literature, however, there is a consensus that the income
elasticity of labour supply is zero, or very close to zero, to the extent that the
literature on taxable income tends to assume income elasticities away (e.g. Bargain et
al. 2014, Saez et al. 2012b).47
A typical static model of labour supply could take the form
ln (ℎit) = 𝛼ln (𝑤it) + 𝛽𝑌𝑖𝑡 + 휀𝑖𝑡 (8)
Where 𝑤it is a measure of the after tax wage rate, 𝑌𝑖𝑡 is non-wage income, and 휀𝑖𝑡 is a
random disturbance, including influences that are not observable to the researcher. If
estimated correctly, 𝛼 is the Marshallian wage elasticity in a static model of labour
supply (holding non-wage income constant). As noted by Blundell and MaCurdy
(1999), this static model assumes individuals to be either myopic (they only consider
the present period when making their labour supply decisions) or credit constrained
(they are unable to transfer income across periods). Furthermore, this model ignores
the effect of current labour supply on future wages (Keane, 2011).
If individuals do shift income and consumption between periods (e.g. save income in
anticipation of idle periods over the life cycle), this elasticity confounds two different
labour supply adjustments: the labour supply response to anticipated wage
movements over time (the intertemporal or Frisch elasticity), and the response to
shifts in the entire wage profile (changes in the expected wage for each period over
the lifecycle, e.g. due to a permanent shift in the demand function, or a tax reform).
Blundell and MaCurdy (1999) call the first change an evolutionary change in the wage
rate, because it constitutes a move along the same individual wage profile, and the
second a parametric shift, because it alters the entire expected wage profile. To see
the difference between these concepts, consider a temporary reduction in the tax rate
that is expected to be rescinded in the future. Anticipating a lower after-tax wage rate
in the next period, an individual could decide to work and save more in the current
period, while reducing her labour supply in the future, when the tax reduction is
abolished. Estimating a model such as (8) would yield an inflated Marshallian
elasticity, since the individual plans to reduce her labour supply in the next period,
merely shifting it through time.
The direct assessment of labour supply elasticities over the life-cycle is
methodologically – and computationally – cumbersome, and the data requirements,
most importantly regarding information on savings and public pension entitlements
are difficult to meet in practice (Meghir and Phillips 2010).48 Also, the static labour
47 Blomquist and Selin (2010) estimate the taxable labour income elasticity at -0.07 for men,
implying that the compensated is about 5 percentage points higher than the uncompensated one. 48 Both types of elasticities stemming from a lifecycle model can in principle be estimated from
cross sectional data using the appropriate specification (Blundell and MaCurdy, 1999). The wage
European Commission
Study on the effects and incidence of labour taxation
May 2015 | 70
supply elasticity is the relevant concept for comparing steady state impacts of
differences in tax rates across countries (Chetty et al., 2011).We will therefore
concentrate on this literature.
3.3.2. Econometric issues and identification
A cross sectional analysis of labour supply usually estimates a (static) labour supply
function such as (8), where hours of work are regressed on a constant, the net wage
rate, a measure of non-wage income, the spouses’ wage rate where applicable, and a
vector of other individual characteristics that are thought to influence labour supply,
for example the presence of young children, indicating fixed costs of work (Blau and
Kahn, 2005).
Since wages are only observed for individuals with positive labour supply, they have to
be imputed for those who do not work during the relevant time period. This is usually
accomplished using wage information from those in the sample that do work,
correcting for selection bias into work.49
One major issue with the estimation of a model such as (8) is the endogeneity of the
wage rate. Hours worked can correlate with the wage rate not only because labour
supply curves are upward sloping (that is, those with higher wage offers tend to work
more hours) but also because wage rates and labour supply are both influenced by
another, unobserved variable, such as motivation, that leads to both higher wage
rates and more hours worked (Blau and Kahn, 2007). If this is the case, ε_it would be
correlated with the wage rate in the empirical model (8), which would lead to a biased
estimate of 𝛼. Willingness to work (or a low taste for leisure) could also be correlated
with present asset income, because it implies high past earnings (Keane, 2011).
Empirical models therefore often include taste-shifter variables assumed to be
correlated with, and thus to a certain degree to control for, taste for work, such as
education, number of children, marital status etc. Other empirical strategies to deal
with omitted variable bias are instrumental variable techniques and differencing
methods, discussed below.
Also, with a progressive tax schedule, hours worked directly influence the net-wage
rate, as the individual determines his or her own marginal tax rate by his or her hours
choice (Evers et al., 2008). An individual with weak preferences for leisure is likely to
elasticity corresponding to a move along the same wage profile can be estimated by regressing log hours on age, personal characteristics influencing the lifetime wage profile, preferences and permanent income, and the wage rate, which can be instrumented with higher order age
variables. Intuitively, this holds the wage profile fixed on the individual level, while letting the wage rate and age vary across individuals. Regressing log wages on property income, higher order age variables, and the wage rate (instrumented by personal characteristics) on the other hand yields the response to a shift in the entire wage profile. 49 Those who do not work either have higher fixed costs of work (or higher reservation wages),
or are offered lower wages than those who do work. Therefore, predicting their wages from the sample of those who participate in the labour market, using their observed characteristics, would lead to an overestimation of their wage offers. The standard approach to deal with this selection into work effect is the Heckman correction. Following Heckman (1979) this involves first the estimation of a selection equation using a probit estimate to derive the probability of working. In the second stage regression the derived inverse mills ratio is used to control for the selection bias. An exception is Blau and Kahn (2007) who predict wages using the observable
characteristics of those individuals with low working hours (below 20 hours). Löffler et al. (2014) have a critical discussion of the two-step approach and show that the results are sensitive to the treatment of wages.
European Commission
Study on the effects and incidence of labour taxation
May 2015 | 71
work more, and thus face higher marginal tax rates, which can lead the researcher to
underestimate the effect of tax rates on labour supply (Meghir and Phillips, 2010).
Non-labour income is also likely to depend directly on the wage rate and hours worked
since means-tested benefits are usually phased out as earnings rise. This will generate
a negative correlation between hours worked and non-labour income (because means-
tested benefits are withdrawn if total income rises) and hours worked and marginal,
net-of tax wage rates (because of the progressive tax system) (Keane, 2011).
Another concern with the direct estimation of a model such as (8) is measurement
error with regards to wages and hours worked (Blundell and MaCurdy, 1999). Even if
the measurement error is completely random and unrelated to any other included
variables it will bias the OLS estimator towards zero. Furthermore, the measurement
error can be considerable, and because hourly wage rates are typically computed by
dividing weekly, monthly or annual earnings by hours worked, Keane (2011) argues
that measurement error in this context is not random: If hours worked are measured
with error, and the error increases in absolute value with hours worked, reported
wages for individuals with high labour supply will be consistently lower than they
actually are (“denominator bias”), leading to deflated estimates of labour supply
elasticities.
Moreover, a labour supply curve such as (8) treats the wage rate as fixed, while
observed wage rates are equilibrium wage rates, determined by the interplay of
supply and demand. This model assumes that as 𝑤it varies across individuals, we are
moving along the labour supply curve which enables us to calculate the labour supply
elasticity, while in fact the demand curve might be shifting. One approach to deal with
this type of endogeneity is controlling for factors that determine the wage rate, but do
not influence the labour supply curve directly, e.g. through a correlation with
preferences for work. For example, education and age have been put forward in the
literature as instruments for labour demand. However, these controls are vulnerable to
criticism: someone with a high preference for work might have acquired more
education in the past, while preferences for leisure might well vary across the life-
cycle (Keane, 2011).
Instrumental variable approaches
One way to address these biases is to use instrumental variable approaches. An
instrument is a variable that is correlated with the independent variable of interest –
in this case the net, hourly wage rate – but affects the dependent variable of interest
(hours worked) only through the independent variable of interest. That is, an
instrument can be excluded from the main equation or model of interest (this is an
exclusion restriction). Intuitively, the instrumental variable approach looks for
exogenous variation in the wage rate, so that any labour supply response can be
thought of as being caused by exogenous factors. E.g. Keane (2011) suggests using
demand shocks as sources of exogenous variation: businesses might want to increase
production if the oil price falls, leading to a demand shock that increases wages. It is
unlikely that oil price increases directly affect preferences for work. The instrumental
variable approach is typically implemented by two-stage-least-squares: in a first
stage, the independent variable of interest is regressed against the instrument or
instruments, and against a vector of controls. The fitted values of this regression are
then used in the main model (Angrist and Krueger, 1999). Finding good instruments
that are both strongly correlated with the hourly net wage, and yet can be included
European Commission
Study on the effects and incidence of labour taxation
May 2015 | 72
from the labour supply model can be a challenge. Instruments for the hourly wage
rate that have been used in the literature include gross wage rates, deciles of the
wage distribution, and education (Blau and Kahn, 2007). Education was often used as
an instrument in earlier studies, but the assumption that education is not related to
tastes for work is increasingly called into question (Meghir and Phillips, 2010).
Therefore, estimates based on cross sectional studies can be viewed as somewhat less
reliable as those based on natural experiments or other forms of exogenous variation
in wages, such as changes in the wage structure over time.
Quasi Experiments
Quasi experiments are policy reforms that change the opportunities or incentives for
one group of people (treatment group), while another group sharing many of the
same characteristics remains unaffected (control group).50 DiD estimators then
compare the average change in the outcome of interest following the policy reform,
e.g. hours of work, between the treatment and the control group (average treatment
effect on the treated).
Fixed effects models that decompose the error term 휀𝑖𝑡 into an individual fixed effect,
capturing unobserved factors such as motivation or taste for leisure, and a “true
random effect”, that is not correlated with wages or non-wage income in a
specification such as (8), are computationally equivalent to DiD estimators (Blundell
and MaCurdy, 1999). If unobserved individual characteristics, such as preferences for
leisure, can be assumed to be time invariant, they can be differenced out using panel
data.
Besides its simplicity, the quasi-experimental approach is appealing because it avoids
many of the econometric issues discussed in this section. The drawback of this
approach is that any results are confined to the specific treatment group and policy
reform studied. Also, time effects must be the same for the treatment and control
group so any difference in (average) outcomes can be attributed to the policy reform,
and the composition of both the treatment and the control group must remain
constant before and after the reform (Blundell, 2012).51
Discrete Choice Models
Rather than estimating a continuous labour supply function such as (8), discrete
choice models assume that individuals (or households) choose from a set of discrete
hours options, such as non-participation, part-time, or full time work. For couple
households, the discrete options are husband-wife hours combinations. The advantage
of discrete choice models is that they directly account for the fact that observed hours
of work cluster around zero and full-time hours and incorporate both the intensive and
extensive margin of labour supply (Bargain et al., 2014). Furthermore, the use of a
maximum likelihood approach implies that the theoretical framework of the random
50 Blundell et al. (1998) and Burns and Zilliak (forthcoming) use tax reforms which affected
people differently as instruments to identify the labour supply elasticity, respectively the elasticity of taxable income. In a sense they are exploiting quasi experimental information, but use an IV approach. 51 This is also commonly known as the “common trend assumption”. Based on the seminal work
by Ashenfelter (1978) and Ashenfelter and Card (1985) is well established that a DiD approach
can only consistently identify the treatment effect if there is neither selection into the treatment, nor a different trend in the treatment group. See also Imbens and Wooldridge (2009) for further potentially confounding e.g. serial correlation) problems in DiD estimators.
European Commission
Study on the effects and incidence of labour taxation
May 2015 | 73
utility model coincides with the empirical approach.52 Also, the discrete choice
approach is well suited to the incorporation of the complexities of the tax benefit
system, and its interplay with means tested benefits given the labour supply of
different members of one household, because it is not necessary to specify the entire
budget constraint. For each hours choice, transfer entitlements and take home pay are
directly evaluated, typically using a micro-simulation model with tax benefit
calculation capabilities for the relevant country.53 Fixed costs of work, such as
childcare costs, transportation or work attire, can also be included in the model
specification (Blundell et al., 2000).54
These models allow the exploitation of the discontinuities and nonlinearities of tax
systems for identification: because they lead to individuals with the same gross wage
rates receiving different net wages, they provide exogenous variation (Bargain et al.,
2014).55
Discrete choice models require the specification of utility functions of individuals or
households including the parameterisation of preferences for leisure and consumption.
This involves making strong assumptions regarding preferences, which is the major
drawback of this approach (Blundell, 2012). While tastes for leisure and consumption,
as well as fixed costs of work are allowed to vary both with observed and unobserved
characteristics, this approach necessitates strong assumptions on the distribution of
unobserved heterogeneity, on budget constraints and fixed costs of work (Blundell,
2012).
3.3.3. Empirical evidence on labour supply elasticities
In this section, we aim to summarise the consensus on the absolute size of labour
supply elasticities as it emerges from recent surveys of the extensive literature on this
topic. We will add to this by citing examples of some recent studies.
Labour supply elasticities have been shown to vary significantly across demographic
groups and over the life cycle. It therefore makes sense to consider the labour supply
responses of men and women separately. Moreover, the response at the extensive
margin (participation elasticity) is generally found to be more important for the overall
response than adjustments in hours worked for those already employed (e.g. Blundell,
2012). For example, looking at 18 different countries, Bargain et al. (2014) find that
the intensive margin elasticity is very close to zero even for those socio-economic
groups that are expected to be most responsive to changes in the wage rate, such as
married women (see below). We therefore distinguish these two margins where
possible.
52 See for example Dagvik (1994) or Aaberge et al. (1999). 53 The take-up of benefits can be directly incorporated in such models, by allowing for disutility
due to the stigmatisation of welfare claimants, or because of time costs involved in applying for certain benefits (hassle-costs, Blundell and MaCurdy, 1999, Blundell and Shepard, 2011). 54 The omission of fixed costs of work might have led to an overestimation of the elasticity of
married women’s labour supply in earlier studies (Blundell et al., 2013). Fixed costs of work explain why small positive hours of work are rarely observed – once the offered wage rate exceeds the fixed cost of work, the labour supply jumps, leading the researcher to overestimate the effect of a marginal increase in the wage rate. 55 Structural models do not directly estimate elasticities, but preference parameters. Elasticities
are then calculated by marginally increasing net wage rates, and comparing the labour supply before and after the increase.
European Commission
Study on the effects and incidence of labour taxation
May 2015 | 74
Women’s labour supply elasticities are generally found to be considerably higher than
men’s, especially those of married women (the group most frequently studied in the
labour supply literature) and of women with young children. Generally, on the country
level, participation rates are negatively related to estimated wage elasticities, which is
consistent with the extensive margin of labour supply quantitatively dominating the
intensive margin (e.g. Evers et al., 2008). Women’s overall participation rate is still
below men’s. This is particularly true for married women and those with young
children who not only face a work – leisure, but a work – leisure – home production
trade off: they perform tasks that would otherwise have to be delegated to the market
at a cost, most prominently child care. Therefore, it is not surprising that their labour
supply elasticities exceed those of men (Blau and Kahn, 2007).
Estimates of female labour supply elasticities in the literature vary widely but tend to
be positive and below or close to 1. Overall, annual wage elasticities tend to be larger
than weekly or monthly elasticities, which is to be expected since longer terms allow
more time for labour supply adjustments that can include both adjustments at the
extensive and intensive margin. In their survey, Meghir and Phillips (2010) report a
“consensus estimate” for married women’s labour supply of close to 1, but warn that
these estimates should be regarded with caution, since most of these estimates rely
on cross sectional comparisons. Estimates of weekly elasticities, in contrast, vary
between zero and 0.3, which implies a quite inelastic labour supply, also for women.
Indeed, more recent reviews that concentrate on studies that do not rely on cross
sectional comparisons find lower mean values for married women’s labour supply
elasticities. Evers at al. (2008) construct a sample of 209 elasticities from 30 empirical
studies, excluding studies based on (cross sectional) OLS estimates because of the
endogeneity and consistency problems detailed above. They report a mean elasticity
for women of 0.43, with a wide range of estimates between 0.03 and 2.79. Similarly,
Bargain and Peichl (2013) collect 90 estimates from recent studies (mainly from the
1990’s and the 2000’s), also reporting a mean elasticity of 0.43, with estimates
clustering in the 0 to 0.5 interval.56 They find that elasticities decrease over time, and
that studies based on cross sectional-data tend to result in higher estimates of
married women’s labour supply, although this last result is more clear-cut for the US
than for Europe.57
In a recent study, Bargain et al. (2014) estimate the same discrete choice model for
17 European countries and the United States using a data set with comparable
variable definitions, covering the period 1998-2005. For married women, wage
elasticities are estimated to range between 0.1 and 0.4, with only small differences
between countries.58 Overall, elasticities for married women are found to be highest in
countries with the lowest female participation rates. Blau and Kahn (2007), using
56 Studies that use discrete choice estimates are overrepresented in their sample, because this
approach is most often used in the recent literature. 57 For the more recent time-period 1990-2010, their sample contains studies based on both OLS
regressions and discrete-choice models for the US, while for Europe, they almost exclusively rely on structural models. Therefore, it is less obvious whether the decline in labour supply elasticities is due to the estimation method or a time trend. 58 For married women, they identify a group of countries with slightly higher elasticities, ranging
between 0.2 and 0.4 (Austria, Belgium, Denmark, Germany, Italy and the Netherlands), a group
of countries with lower elasticities between 0.1 and 0.2 (France, Finland, Portugal, Sweden, Estonia, Hungary, Portugal, the UK and the US) and a group of outlier countries with elasticities between 0.4 and 0.6 (Ireland, Greece and Spain).
European Commission
Study on the effects and incidence of labour taxation
May 2015 | 75
cross sectional (Current Population Survey) data from the US to estimate labour
supply elasticities for married women for the years 1980, 1990 and 2000. They find
that (mean) labour supply elasticities decreased steadily over this time period: from
0.8 to 0.9 (depending on the model specification) in 1980 to 0.4 in 2000. Elasticities
fell at both margins: at the extensive margin from 0.5-0.6 1980 (again, depending on
the model specification) to 0.3 in 2000, and at the intensive margin from 0.3 to 0.1
during the same time period. Using the same data and a similar methodology, Heim
(2007) similarly estimates elasticities at the extensive margin to have declined from
0.7 in 1980 to 0.03 in 2000, while intensive margin elasticities decreased from 0.4 to
0.2 over the same time period. One reason for this change is mechanical: as the
female labour force participation rate accelerated throughout this period, a growing
share of married women was already in full time employment, and therefore unable to
further increase their labour supply in response to rising wages. But Blau and Kahn
(2007) also suggest that over time, women became more committed to their careers,
as they expect to spend a larger fraction of their life without a spouse. As a
consequence, their labour supply patterns increasingly resemble those of men.
One demographic group that has been shown to be particularly responsive to changes
in the net wage are women with small children. For this group the extensive margin is
particular important because they face high fixed costs of work (Blundell et al., 2013).
Lone mothers have received a lot of attention in the literature because they face a
higher risk of poverty, and are therefore often the object of targeted policies that can
be exploited for exogenous variation in wages. Meghir and Phillips (2008) report
participation elasticities of over 1 for this group. Bargain and Peichl (2013) note that
elasticity estimates for this group, although generally higher than for the overall
population, are quite dispersed - in their sample, the mean value is 0.6. In a recent
study, Blundell and Shepard (2011) develop a structural model of the labour supply of
parents with children in the UK, with a focus on lone mothers. They model the tax-
benefit system in detail, and allow for unobserved heterogeneity and fixed costs of
work, using data from 1998 to 2003. For single mothers, they report a total elasticity
of 1.5 (including the extensive and intensive margin). The participation elasticity is
more important than the hours elasticity, 0.8 vs. 0.04. The labour supply of women
with young children is significantly less elastic than the labour supply of mothers of
school-aged children, especially at the participation margin. For the US, using cross
sectional data for the years 1979 to 2003, Bishop et al. (2009) find very similar values
for the intensive margin with an elasticity of 0.05, while their estimate for the
extensive margin is significantly lower at 0.25. In line with the findings of Blau and
Kahn (2007) and Heim (2007) for married women for the same time period, Bishop et
al. (2009) find that the labour supply elasticities of single women (with and without
children) decreased significantly over the quarter of a century their data covers.59
For men, labour supply responses are strongest at the beginning of their careers,
reflecting the education/ training versus gainful employment decision, and at the end
of their careers, where the incentive structure of pension systems comes into play.
They also react mostly on the extensive margin. The consensus in the literature is that
labour supply elasticities for men on the intensive margin – adjustments in hours
worked while employed – are very small (close to zero) (Meghir and Phillips, 2008,
59 They report a drop of 82 % in the wage elasticity at the intensive, and of 36 % at the
extensive margin.
European Commission
Study on the effects and incidence of labour taxation
May 2015 | 76
Saez et al. 2012b).60 In their meta-study of 209 estimates of labour supply elasticities,
Evers et al. (2008) report a range of estimates between -0.08 and 0.18 for the male
labour supply elasticity, with a sample mean of 0.07. This is not surprising, given the
distribution of hours choices for men - men tend to either work full time, or not work
at all, leaving little room for adjustments on the intensive margin.61 In contrast,
Bargain et al. (2014) find own wage elasticities for married men that are, though
small, significantly different from zero, between 0.05 and 0.15. These responses are
almost exclusively driven by the extensive margin; hours elasticities are very close to
zero. The responses of single men are somewhat larger (between 0 and 0.4), mostly
driven by the responsiveness of younger men who have lower overall employment
rates.
Low wage elasticities at the mean can mask differences in the responsiveness of
labour supply across the income distribution. Bargain et al. (2014) show that for single
individuals, wage elasticities for the bottom 20 % of the income distribution can go up
to one, mainly due to responses at the extensive margin. For married women, the
opposite holds, with women at the top end of the (potential) wage distribution being
more responsive than those at the bottom.62
3.3.4. Labour supply and household decision making
Family decision making matters for labour supply because we would expect the labour
supply choices of an individual to be influenced by their spouse’s labour supply and
earnings, just as we would expect it to depend on unearned income. Families have to
decide jointly how to organise home production and consumption, and we would
expect some complementarity in leisure in the utility functions of couples. The
standard economic approach to modelling the labour supply and consumption
behaviour of couple households, the unitary model of household behaviour assumes
that couples act to maximise a unique household utility function. This assumption has
been criticised in the literature, primarily for violating the principle of methodological
individualism (the idea that the basic unit of decision making is the individual,
Chiappori, 1988), and for lacking empirical support.63
60 An exception is Keane (2011), who suggests a mean value of the (compensated) labour
supply elasticity for males of 0.31. He argues that the consensus in the literature of a zero or at least very small labour supply elasticity for males stems from the (flawed) assessment that many older studies that report higher labour supply elasticities failed to properly account for taxes, while there is actually a wide range of estimates irrespective of the estimation method. 61 For example, while across 32 % of employed women in the EU-28 Member States worked
part time in 2013, only 8 % of employed men worked part time (EUROSTAT database, http://ec.europa.eu/eurostat/web/lfs/data/database). 62 This is consistent with the “added worker effect” that emphasises the role of risk sharing in
marriage. When the main earner in the family – usually the husband – experiences a negative income shock, the labour supply of the secondary earner – usually the wife – becomes crucial
for household income. Hence, married women in families at the bottom of the income distribution make a more important contribution to family income than women at the top, which leads to their labour supply being more inelastic. In contrast, women living in households at the top of the income distribution are more responsive to financial incentives. See e.g. Blundell et al. (2012) for a recent discussion. 63 One particular empirical implication of the unitary model, income pooling, has been
repeatedly refuted empirically. Income pooling is a feature of unitary household demand that postulates that which member contributes what to joint household income should not matter for consumption decisions. Among others, Lundberg et al. (1997) and Ward-Batts (2008) show that
European Commission
Study on the effects and incidence of labour taxation
May 2015 | 77
Considering the household, rather than the individual, to be the relevant decision
making unit implies assuming the existence of some form of decision process within
the household. The literature on household decision making can be broadly
categorised in two strands: cooperative and non-cooperative bargaining models of
family decision making (the seminal contributions here are, Manser and Brown, 1980,
McElroy and Horney, 1981, Lundberg and Pollak, 1993) and the literature on the
collective model of household decision making, developed by Chiappori (1988).
Bargain models generally impose a lot of structure on the household decision making
process, complicating empirical implementation. The collective model on the other
hand only imposes that within household allocations be efficient. The individual utilities
of the spouses are determined through a generic decision making process that is
influenced by individual bargaining power, but this bargaining element only
determines the location of household demand on the Pareto frontier.64
It has been shown that, even without imposing much structure on the household
decision process, testable restrictions can be derived from the collective model, and
that it can be taken to data even if labour supply choices are discrete (that is, working
hours do not vary continuously between zero and full-time, but individuals are either
employed full time or do not work at all, as it tends to be the case for men, Blundell et
al., 2007).
As Meghir and Phillips (2010) point out, although there is a very active theoretical
literature on the empirical implication of the collective model, there are very few
actual empirical applications. An exception is Blundell et al. (2007), who estimate a
collective model of household labour supply using British survey data over two
decades. They assume that men’s labour supply decision is discrete (either work full
time or be idle), while women can choose their working hours continuously. While
preferences are allowed to depend on education, and education therefore cannot be
excluded from the labour supply function, education-time interactions (and age-time
interactions) can be excluded in their framework. That is, they assume that while
preferences towards work (and leisure) may change over time, this change is the
same for all educational groups. Because returns to education have changed in the
period they observe, this exclusion restriction allows them to exploit this exogenous
variation in the wage structure to identify the labour supply function. They find a wage
elasticity of 0.33 for married women, which is in line with previous estimates for the
UK.
Vermeulen et al. (2006) calibrate the collective model, assuming that preferences for
consumption and leisure do not change upon marriage; therefore, these parameters
can be estimated from data on singles using a standard labour supply model, which
allows residual calculation of the sharing rule. Using this model, Bargain et al. (2006)
compare labour supply elasticities based on the unitary and collective model. They find
that, if the unitary model is wrongly assumed to be correct, women’s labour supply
elasticities are understated, whereas men’s elasticities are overstated. However, these
this does not hold using a policy reform in the UK as a natural experiment. See Browning et al. (2014), chapter 5, for a recent survey. 64 More formally, the collective model assumes that household maximise the weighted sum of
the spouses’ individual utility function, where the weight is influenced by distribution factors. Some of these distribution factors influence the couple’s budget set, like wage rates, while others only influence the bargaining power, like the prevailing divorce law regime.
European Commission
Study on the effects and incidence of labour taxation
May 2015 | 78
differences could also be due to differently specified utility functions and identifying
assumptions (Bloemen, 2010). Although the household decision process does seem to
influence labour supply elasticities, the empirical literature providing concrete
estimates is still quite thin.
3.3.5. Using tax return data to estimate behavioural responses to
taxation
When studying the intensive margin of labour taxation, one is usually interested in
how hours of work respond to income taxation, i.e. the labour supply elasticity. Hence,
traditional labour supply literature focused purely on hours of work as the variable of
interest (in the intensive margin case). However, as already pointed out in section
3.2.2., hours worked by individuals are in most cases very difficult to observe, and
relying on survey responses often comes with large measurement errors (e.g. people
have a tendency to report 40 hours per week). Furthermore, difficulties arise because
income taxes might distort many other margins beyond hours of work, for instance
motivate to shift income between sources which are taxed at different rates. This is
why in recent years the public economics literature progressed using the elasticity of
taxable income (ETI) instead of pure labour supply, pioneered by the seminal work of
Feldstein (1995). Focusing on taxable income as a broader measure of labour supply
holds the potential to represent an upper bound of the labour supply elasticity since it
captures all potential responses to income taxation in a single elasticity measure.
Feldstein (1999) also puts forward the measure that the ETI is under some conditions
a sufficient measure for the overall deadweight loss of the income taxation. This holds,
since an optimising individual will reduce the hours worked or avoid taxation in such a
manner that the marginal costs will equalise. Given that both real and avoidance
responses to income taxation matter when aiming to understand the true impact of
labour taxation, the ETI has taken to a large degree the centre stage of many
normative questions in public economics. Furthermore, the increased availability of
high-quality administrative tax data offers researchers the opportunity to observe the
taxable income of large populations over many years. The use of administrative tax
return data instead of survey data is preferable since it offers much larger sample
sizes and has far fewer problems with attrition, non-response, and measurement
error. In recent years a fast-growing literature has emerged using these large
administrative datasets and compelling identification strategies to estimate
behavioural responses to income taxation.
The Feldstein (1995) study
To estimate (intensive-margin) elasticities of taxable income most studies are using
variation in tax rates for identification. In 1995, Feldstein published his influential work
using administrative tax panel data to estimate the ETI for the Tax Reform Act 1986
put into force by the Reagan government. This reform brought especially large tax
reductions for those at the top of the income distribution, with the top marginal tax
rate falling from 50 to 28 percent. Hence, Feldstein focuses on estimating the effect of
the reform on the taxable income of top earners. He groups taxpayers by their pre-
reform taxable income and looks at how their incomes evolve after the tax cuts of
1986. Specifically, Feldstein uses a DiD methodology to compare the percent change
in taxable income with the percent change in the net-of-tax-rate (= change in
marginal tax rate) between two income groups. By doing so he obtains very large
European Commission
Study on the effects and incidence of labour taxation
May 2015 | 79
elasticities of taxable income (above 1), with far-reaching implications for policy
conclusions, such as that the United States has been on the wrong side of the Laffer
curve for the rich and that cutting tax rates might raise tax revenue even further.
Partly due to this result, Feldstein’s study gained much attention, but also received
strong methodological criticism. For instance, grouping taxpayers in a way as Feldstein
does can result in very biased results for the DiD estimator when elasticities vary
greatly between these two groups already before the reform. Further, the sample size
Feldstein uses is rather small, and results are driven by few observations. Another
source of bias are underlying secular income trends such as skill-biased technical
progress that increase the income share of top earners but are unrelated to any tax-
driven changes in top incomes. When considering tax cuts at the top of the
distribution without accounting for underlying trends of increasing top income shares,
the obtained elasticity estimates might be substantially upward biased. Finally, mean
reversion can cause biased estimates when grouping taxpayers according to their pre-
reform income level, since taxpayers with a positive income shock in the pre-reform
year will tend to have a lower income in the following years, independently of the
reform (= problem of transitory incomes).65
Other studies identifying the ETI through a tax reform
Subsequent studies aimed to address these issues and re-estimated Feldstein (1995)
using both different methodological techniques and different tax variations as
identification. For instance, Auten and Carroll (1999) studied the same tax reform but
employed richer data and found much smaller elasticities (around 0.6). Gruber and
Saez (2002) carefully examine the effects of mean reversion and secular trends in
income inequality on the estimated ETI, using as well the Tax Reform Act of 1986 for
identification. Specifically, they controlled for base year income by including 10-piece
splines of pre-reform gross income. Furthermore, they emphasised the difference
between taxable income and broad income responses, where broad income is defined
as income before deductions. In Gruber and Saez (2002) the elasticity estimate of
0.12 for broad income is notably smaller than their corresponding estimate for taxable
income, suggesting that much of the taxable income response comes through
deductions, exemptions, and exclusions. Consistent with this conclusion, they find that
most of the response in taxable income can be attributed to itemisers (for itemisers,
the elasticity is 0.65, whereas for non-itemisers, it is negative and insignificant).
In a similar vein, Giertz (2007) investigates differences in elasticity estimates of
taxable income versus broad income when using several distinct tax reforms (US tax
reforms of 1986 and 1993 in particular) for identification. While finding large
differences in the ETI estimates depending on the reform used for identification, the
variation in elasticity estimates of broad income (e.g. wage earnings) was much
smaller between the single tax reforms. This let him conclude that differences in the
availability of deductions and exemptions matter in determining the ETI because
itemizing was much more common after the Tax Reform Act of 1986. In sum, his
findings support the argument that changes regarding the breadth of the tax base and
65 In the econometric terms, the systematic differences in elasticities already before the reform
constitute a selection problem, and different trends in wages for the top income earners constitute a violation of the common trend assumption, while the mean reversion can be seen as an example for the Ashenfelter (1978) dip.

European Commission
Study on the effects and incidence of labour taxation
May 2015 | 80
exemption rules (which usually occur when a tax reform is enacted) have a strong
effect on the ETI but leave the underlying elasticity of broad income rather unaffected.
Kleven and Schultz (2014) use a method similar to Gruber and Saez (2002) to
uncover the ETI from various income tax reforms over the period 1984 to 2005 in
Denmark. Methodological, their main advantage is a very stable income distribution in
Denmark, allowing to identify behavioural responses to tax reforms much easier.
Furthermore, they can rely on an impressive set of tax variation imposing different tax
rates on different income components. They estimate an overall ETI of around 0.05 for
wage earners and 0.10 for self-employed individuals. Moreover, they find larger
elasticities when focusing on large tax reforms, consistent with the argument that
taxpayers are more likely to overcome adjustment frictions when tax changes are
salient and substantial in size.
Recently the approach of Gruber and Saez (2002) has been criticised by Weber (2014)
for failing to adequately controlling for serial correlation and therefore mean reversion.
Using the same dataset as Gruber and Saez (2002), it is argued that a different choice
of instrumental variables can help to better overcome the endogeneity. In particular,
Weber (2014) finds significantly larger elasticities (0.858 for taxable income and 0.475
for broad income) using higher order lags of the instruments. In contrast to previous
studies the higher elasticities are interpreted as correctly estimated, rather than
reflecting a longer-run elasticity. At the same time, the study still suffers from a
number of the above mentioned limitations, most notably from the restricted sample
of top income earners and the potential differential trends for this income group.
Using nonlinearities in the tax schedules to identify the ETI
A promising new avenue was laid out by Saez (2010), proposing a bunching estimator
to uncover the elasticity of taxable income. His approach is based on the intuition that
discontinuous reductions in wage rates at kink points of a tax schedule yield a non-
parametric source of identification for the underlying elasticity. In other words, the
standard labour supply model where individuals choose to supply labour until the
marginal disutility of work equals marginal utility of disposable after-tax income
predicts the bunching of taxpayers at kink points of a tax schedule where marginal tax
rates increase discretely. Unlike other cross-sectional tax variations from tax reforms
used to identify real labour supply responses which are usually contaminated by
heterogeneity in tastes, this approach holds the potential to yield very credible
estimates (see Chetty, 2012). Saez (2010) finds significant bunching of taxpayers at
the first kink point of the US EITC as well as at the threshold of the first federal tax
bracket. However, he finds the observed bunching to be prevalent only among the
self-employed and largely due to reporting effects (e.g. itemised deductions), with no
evidence for bunching at any kink for wage earners. This evidence is broadly in line
with previous findings that the elasticity of wage income is close to zero while the
taxable income elasticity is positive and statistically significant (with a value of around
0.3).
In recent years, increasing evidence of the ETI has also been gathered for European
countries. A vocal point of empirical research on behavioural responses to taxation in
Europe has been Denmark, thanks to the availability of high-quality administrative
data containing detailed socio-economic information. Chetty et al. (2011) detect clear
bunching of taxable income for both self-employed and wage earners at a top kink of
European Commission
Study on the effects and incidence of labour taxation
May 2015 | 81
the Danish tax schedule, with corresponding elasticities of 0.02 for wage earners and
0.24 for the self-employed. This large difference in the ETI let them explore the role of
optimization frictions such as adjustment costs. They find that elasticities of wage
earners are positively associated with the flexibility of labour supply and collective
bargaining, two forces that appear to effectively reduce adjustment costs. Their
results suggest that adjustment frictions significantly attenuate the short-run ETI
especially for wage earners, something which has to be taken into account when
asking critical questions about the long-run elasticity of taxable income, a key
parameter of interest for policy making. Bastani and Selin (2014) use Swedish data
and find no bunching in the distribution of wage earnings, and only a very moderate
response for self-employed. Similarly Kosonen and Matikka (2014) find no bunching at
kink points in the Finnish income tax schedule. But studies argue that the lack of tax
payer responses is mostly due to salience and optimization frictions.66
Summarizing the existing evidence of behavioural responses to taxation using tax
return data, one can conclude that population-wide taxable income elasticities are
rather modest. Especially when taking into account the different sources of taxable
income (e.g. wage earners versus self-employed) which differ with respect to
avoidance opportunities, the real behavioural response to taxation appears to be quite
small. For instance, much of the evidence on the ETI suggests that it is higher for
high-income individuals who have more access to substantial tax planning, including
deductible expenses (Saez et al., 2012). Dörrenberg et al. (2014) confirm the
importance of reporting effects using German data. This is also in line with the
repeated findings that taxable income appears to be much more response than more
general income categories such as broad income. Hence, a broadening of the tax base,
the closing of loopholes and more effective tools of tax enforcement can have non-
negligible effects on the size of the ETI. In return, this also means that the “pure”
labour supply response of many taxpayers seems to be fairly inelastic (at least in the
short-run), especially for wage earners and prime income earners.
However, the finding that the observed elasticities for wage earners are rather small
does not mean that taxing labour comes without distortions. While it is difficult for
taxpayers to respond to tax changes in the short-run due to adjustment frictions such
as hours constraints and inattention, long-run responses to labour taxation might still
be substantial. In particular, long-run responses to taxes do not need to take place at
the individual level and as such, cannot be captured by conventional micro-economic
models. Chetty (2012) addresses this issue in his meta-analysis of various ETI studies
and proposes an econometric approach to put bounds on elasticities when responses
to taxation are incomplete due to adjustment costs. Pooling estimates from the
existing studies he calculates a structural (long-run) labour supply elasticity of 0.33.67
He concludes that small frictions can explain most differences found between micro
and macro elasticities, as well as between extensive and intensive margin elasticities.
In sum, what can be learned from the literature on the elasticity of taxable income is
the value of having low tax rates on a broad tax base, a position long advocated by
economists.
66 See also Kleven and Waseem (2013) who use Pakistani income tax data to analyse
optimisation frictions. 67 Jäntti et al. (forthcoming) find similar result in their approach, bridging the gap between
micro- and macro estimates of labour supply elasticities.
European Commission
Study on the effects and incidence of labour taxation
May 2015 | 82
3.4. Review of the literature on labour demand elasticities
The studies discussed above implicitly assume that labour demand is completely
elastic, and therefore changes in labour supply directly translate into changes in
employment. If labour demand is only somewhat elastic (downward sloping, as
depicted in Figure 5, panel B), a shift in the labour supply curve, e.g. following a tax
reduction, will decrease market wages, and hence dampen the employment effect of
the reform.
The consensus in the literature however does not support the notion that labour
supply is completely elastic. In his seminal work on labour demand, Hamermesh
(1993) reviews nearly 200 empirical studies on the static demand for labour. He
brackets the long run constant output68 demand elasticity of labour between 0.15
and 0.75, with a “best guess” point estimate at 0.3. He also notices that the demand
elasticity decreases with education, pointing to a better substitutability between low-
skilled workers and capital. In a recent study, Lichter et al. (2014) perform a meta-
regression analysis on 945 labour demand elasticity estimates from 105 micro-level
studies. They do include micro-level studies reviewed in Hamermesh (1993), but also
add newer research published up to 2012. They find
that the labour demand elasticity is higher in the long run than in the short run,
that it is higher for low-skilled workers, and somewhat lower for high skilled
workers, than for the general workforce (although this last difference is less clear)
there are no significant differences between genders,
demand elasticities are higher for atypical (fixed contract) workers and
labour demand elasticities are increasing over time.
This last effect might be related to globalisation and technological change giving firms
more opportunities to substitute away from (domestic) labour as an input. Based on
this analysis, they offer a new interval for the long run constant output labour demand
elasticity of 0.072 to 0.446, with a preferred estimate of 0.25, very close to the
Hamermesh’s (1993) “best guess”. Hence, assuming labour demand to be completely
elastic might lead to biased estimates of labour supply elasticities.
To allow for the interaction of labour supply and demand, Peichl and Siegloch (2012)
develop a structural labour demand model, to use alongside a structural labour supply
model (as discussed in section 3.3.2). Using matched firm – employee data from a
German administrative dataset, they estimate labour demand elasticities by imposing
a cost function and minimising costs given constant firm output and individual wage
rates. They distinguish three skill levels or educational groups. In line with
Hamermesh (1993), they find that labour demand elasticities vary across skill levels:
the demand elasticity is highest for low-skilled workers at -1.05, and lowest for
medium skill workers at -0.37. To link the demand and supply models, in a first step,
they estimate labour supply elasticities by marginally increasing wages in their
68 Two elasticity concepts are used in the literature: the constant output demand elasticity of
labour, which only captures the firm substituting between input factors, and the total demand elasticity of labour, that takes into account the effect of wage changes on output prices. The constant output elasticity is smaller in absolute terms than the total elasticity: a perfectly
competitive firm must raise prices as costs increase, which in turn decreases market demand, causing the firm’s labour demand to further decrease (Hamermesh, 1993). Here, we concentrate on the constant output elasticity.
European Commission
Study on the effects and incidence of labour taxation
May 2015 | 83
structural labour supply model. These elasticities are fed into the labour demand
model to calculate new wage rates given the new (increased) labour supply. These
new wage rates in turn serve as input for the labour supply model, and so on, until
changes in labour supply and wage rates become very small. The incorporation of
labour demand does work to offset the labour supply effect by about 25 %.
Another approach to allow for labour demand restrictions in a labour supply model is
to introduce the probability of involuntary unemployment into a discrete choice labour
supply model as discussed in section 3.3.2 without fully modelling the firm side.
Demand side frictions are introduced into the model only on the basis of worker
characteristics. These models are called Double Hurdle Models because the labour
supply decision can be seen as a two-step process: first, the worker determines her
preferred working hours category, and if she decides to work positive hours, she faces
the probability of not finding employment. The probability of involuntary
unemployment typically depends on worker characteristics (education, labour market
experience, industry and so on) as well as on local labour market characteristics
(Peichl and Siegloch, 2012, Bargain et al., 2010). A recent example of this approach is
Bargain et al. (2010). Using German survey data from 2002, they estimate two labour
supply models: as a benchmark, they use a standard structural labour supply model
(as discussed in section 3.3.2), which is unconstrained in the sense that it assumes
realised labour supply decisions to be the result of individual optimisation. In other
words, the model assumes that unemployed individuals choose to be so, given their
after-tax income and their preferences for consumption and leisure. This can lead to
overestimated preferences for leisure, especially for groups with a high incidence of
involuntary unemployment (such as single men). For the second, constrained, model,
the authors use information on desired working hours, as available for unemployed or
non-participating individuals in their data-set, as the optimal hours choice.
Additionally, the probability of not finding employment, conditional on moving from
non-participation into employment, is explicitly introduced into the model. They find
that labour supply (employment) reactions are overstated if all unemployment is
assumed to be voluntary: individuals who are involuntarily unemployed find
themselves unable to react to an increase in their wage rate, and individuals who want
to react face a risk to be rationed on the labour market. Simulating a policy reform
geared to encourage low-wage workers to work full-time, they find that this bias
amounts to about 60 % of the total employment effect.
3.5. Learning about labour tax incidence in CGE models
CGE models are general equilibrium models, which are calibrated to given economies.
The particularity of the models varies from simple extensions of theoretical models to
extensive versions with many countries, many production sectors and many household
types. Also the modelled behaviour of the households and firms vary from exogenous
supply or demand in some markets to dynamic optimization under uncertainty. In
basic models the prices in the labour, capital and goods markets adjust without
frictions to equalise demand and supply.
The benefits of the CGE models are well recognised. The models have sound
theoretical basis laid on the optimization decisions of firms and households. They allow
an analysis of the investment, labour demand and production decisions of the firms
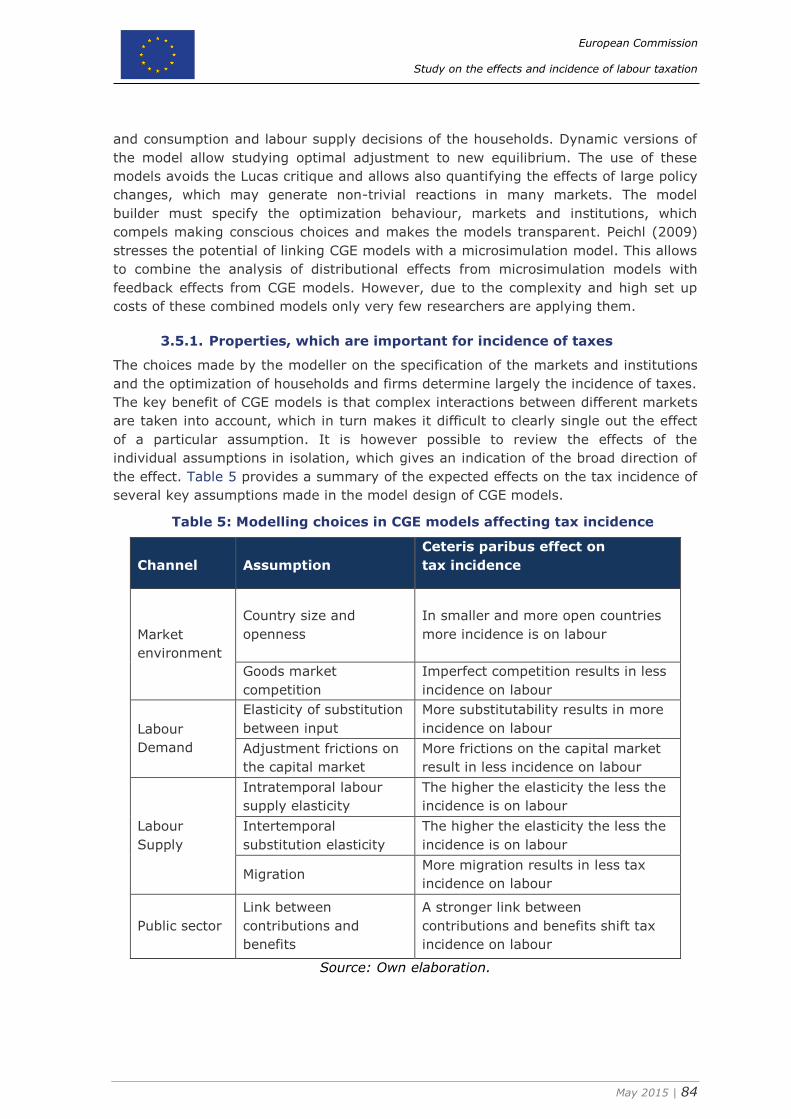
European Commission
Study on the effects and incidence of labour taxation
May 2015 | 84
and consumption and labour supply decisions of the households. Dynamic versions of
the model allow studying optimal adjustment to new equilibrium. The use of these
models avoids the Lucas critique and allows also quantifying the effects of large policy
changes, which may generate non-trivial reactions in many markets. The model
builder must specify the optimization behaviour, markets and institutions, which
compels making conscious choices and makes the models transparent. Peichl (2009)
stresses the potential of linking CGE models with a microsimulation model. This allows
to combine the analysis of distributional effects from microsimulation models with
feedback effects from CGE models. However, due to the complexity and high set up
costs of these combined models only very few researchers are applying them.
3.5.1. Properties, which are important for incidence of taxes
The choices made by the modeller on the specification of the markets and institutions
and the optimization of households and firms determine largely the incidence of taxes.
The key benefit of CGE models is that complex interactions between different markets
are taken into account, which in turn makes it difficult to clearly single out the effect
of a particular assumption. It is however possible to review the effects of the
individual assumptions in isolation, which gives an indication of the broad direction of
the effect. Table 5 provides a summary of the expected effects on the tax incidence of
several key assumptions made in the model design of CGE models.
Table 5: Modelling choices in CGE models affecting tax incidence
Channel Assumption
Ceteris paribus effect on
tax incidence
Market
environment
Country size and
openness
In smaller and more open countries
more incidence is on labour
Goods market
competition
Imperfect competition results in less
incidence on labour
Labour
Demand
Elasticity of substitution
between input
More substitutability results in more
incidence on labour
Adjustment frictions on
the capital market
More frictions on the capital market
result in less incidence on labour
Labour
Supply
Intratemporal labour
supply elasticity
The higher the elasticity the less the
incidence is on labour
Intertemporal
substitution elasticity
The higher the elasticity the less the
incidence is on labour
Migration More migration results in less tax
incidence on labour
Public sector
Link between
contributions and
benefits
A stronger link between
contributions and benefits shift tax
incidence on labour
Source: Own elaboration.
European Commission
Study on the effects and incidence of labour taxation
May 2015 | 85
Four broad channels are identified through which the tax incidence is determined. The
general market environment determines whether the tax burden ultimately can end up
on consumers rather than on capital owners or workers. The labour demand and
labour supply channels determine whether the tax incidence is borne by capital or
labour and features of the public sector can shift this balance.
The size and openness of the economy influence strongly the market conditions. In
one extreme there are small open economies, which have high, if not infinite, price
elasticities in capital and goods markets. If endogenous migration is ruled out, the
incidence of taxes is mainly on labour.69 In another extreme there are economies like
US, which influence both domestic and world market prices and interest rates. In this
case the incidence is rather complicated, because also foreign households are affected
by the price changes (see e.g. Bovenberg and Goulder, 1993 or Fehr et al., 2013).
Besides the size of the economy, also other market conditions can play a role on the
incidence result. For example, imperfect competition in goods markets is
sometimes assumed, which enables shifting the incidence of payroll taxes on
consumers.
Not surprisingly the modelling of the labour markets is fundamental to the incidence
outcome. Analysis of labour markets with CGE models is not very common. In many
historical models labour supply was exogenous and market-clearing wages balance
demand and supply. This is likely to be a sufficient description of the markets if the
studied policy does not change the after-tax wages much.
Studies directly aimed at analysing labour markets require naturally the specification
of supply, demand and market clearing. As discussed by Boeters and Savard (2012),
there are two ways to refine the analysis; either more detailed description of the
mechanisms or disaggregation of the relevant units.
The nation-wide labour supply potential is constrained by the working-age
population. Endogenous participation and hours of work decisions depend on
preferences for leisure, net wages and outside options like unemployment benefits or
pensions. In life-cycle models individuals may also have a hump-shaped productivity
profile, which has a different shape in different educational groups.70
The substitution elasticity in the utility function of individuals determines the
intratemporal labour supply and consumption reactions to changes in the relative
prices of leisure and consumption. The higher the elasticity, the more taxation of
labour increase consumption of leisure and the less the incidence is on labour.
In dynamic models the intertemporal substitution elasticity defines the substitution
between current and future leisure and consumption, when the prices change. The
higher the elasticity, the more individuals react to changes in taxation by smoothing
lifetime consumption and labour supply. Also the time preference of the individuals
matter: the more impatient the households are, the sooner they prefer to consume
69 Endogenous migration would increase the net wage elasticity of labour supply and may
amend the conclusion. 70 The heterogeneous productivity of households does not necessarily mean that there are
many wage levels. Assuming that the labour units supplied are homogenous, but various households have different productivity in supplying those, these units can be aggregated. The wage determined in markets is paid to these efficiency units.
European Commission
Study on the effects and incidence of labour taxation
May 2015 | 86
their lifetime resources. Correspondingly, higher probability of dying in future years
reduces the willingness to postpone consumption. These factors imply that the
reactions of individuals to changes in labour taxes depend both on the preferences and
the age of the individuals. On the other hand, borrowing constraints may restrict the
lifetime choices. If they are binding as young, labour supply is higher earlier in the
working life.
Additional richness to labour supply reactions and incidence comes from educational
differences. Well educated have typically rising lifetime productivity and wage profiles,
which start later and end later in the life cycle. Less educated have flatter labour
income profiles, which start and end earlier and bend downward near retirement.
The labour-leisure choices of individuals are described above. The number of
individuals supplying labour is determined by the size of the working age population,
participation rate and unemployment. The size of working age population can be
endogenous, if labour taxation influences immigration. The more elastic is
immigration, the more the incidence of labour taxes is on capital. Location, as well as
cultural and linguistic differences matter.
Heterogeneity among the utility maximizing individuals or households allows analysing
intra- and intergenerational incidence of taxes. Typical characteristic which
differentiate individuals are income, gender, education, age and birth cohort.71 The
typical optimization horizon of households is either one period, rest of the lifetime or
infinite.72 The information about the future may consist of perfect foresight,
idiosyncratic uncertainty regarding e.g. lifetime wages of the individual or aggregate
uncertainty regarding e.g. future prices in the economy.
The demand for labour is derived from production functions and is based on the
productivity of the marginal unit of labour and the price of output. Therefore the
production technology is also an important driver of the tax incidence results.
Especially the capital-labour ratio and the elasticity of substitution between
inputs matter. Both can vary among industries. Some models include also investment
adjustment cost to increase realism in the changes of the capital stock. There might
also be several types of labour with varying substitutability between each other and
with capital.73 The higher the elasticity, the easier is for firms to shift between labour
to capital when labour supply changes and the less the incidence of taxation of labour
incomes is on the yield of capital.
There might be also other technological constraints that influence the possibility for
substitution. In some dynamic models, the capital in use is determined by investments
done during the previous period, which means that the first period incidence of labour
71 CGE models seldom include very many types of households. It has been increasingly popular
to study redistribution of income by combining micro-simulation models and CGE models, see e.g. Hérault (2010). Another possibility is to generate ex post heterogeneity by introducing
idiosyncratic uncertainty in life cycle models, see e.g. Conesa and Krueger (1999). 72 Planning horizon of one period refers to static models, or sequential dynamic models with
myopic decision makers (e.g. Ballard et al., 1985), rest-of-lifetime horizon refers to lifecycle models with overlapping generations (OLG) structure (e.g. Auerbach and Kotlikoff, 1987) and infinite horizon refers to neoclassical growth models (e.g. Chamley, 1986). 73 The actual labour input in production is modelled often to include labour augmenting
productivity growth. There are also endogenous growth CGE models where tax reforms influence the decisions to accumulate human capital, see e.g. Granzau and Martin (2003).

European Commission
Study on the effects and incidence of labour taxation
May 2015 | 87
income tax change is on capital. A more advanced model type includes investment
adjustment costs, which also tend to increase the incidence on capital, but separates
between owners of old and new capital. If the required rate of return on capital is
fixed, as in case of frictionless capital movements, the tax changes are immediately
capitalised in the market value of the firms and the future owners of capital gets the
global market rate of return. Also anticipation interacts with frictions: if the tax rate
change is surprising, the investment adjustment costs become more important
determinant of incidence. More generally, the use of dynamic models means that the
incidence of a given tax can vary in time.
Restricted substitutability of different types of labour in production provides an
extension for the incidence results. Another extension is introduction of several
production sectors with varying production technologies.
Labour market mechanisms refer to choices between perfect competition and
various versions of imperfect competition. The dominating theories of endogenous
unemployment are based on search and matching, efficiency wages and collective
bargaining. These theories have been used as a basis of determining an empirically
estimated wage curve or the theories have been modelled explicitly and the structural
parameters have been estimated (Boeters and Savard, 2012). Search models create
involuntary unemployment due to frictions in the search for new jobs, e.g.
(Keuschnigg and Keuschnigg, 2004). Efficiency wage and collective bargaining models
create unemployment due to higher than market clearing wages. There might also be
an exogenous amount of unemployment in perfect competition models, but it must be
allocated to the individuals exogenously.
Finally the use of the tax revenues in the public sector can largely influence the tax
incidence result.74 One example is that any policy which influences wages in the
private sector also increases public expenditure since the wages of the public sector
employees are likely to rise as well as income transfers indexed to wages. Also the
social security system influences the labour supply elasticities by providing income
transfers, such as unemployment benefits and pensions, which are conditional on not
working and influence thereby the labour supply decision in extensive margin. On the
other hand, the more labour income generates (net-of-tax) pension rights, the more it
increases the price of leisure during working years. As an example, taxation of
earnings-related pensions reduces labour supply. Also the means tested basic income
transfers may affect the labour supply reactions of low income individuals.
3.5.2. Reviewing the incidence of labour income taxes in CGE models
CGE models are not very often used to study incidence of labour taxes. One reason
might be that the final tax burden of these taxes is generally considered to be anyhow
on labour. This section presents examples of representative studies, which analyse
74 Unfortunately, a typical limitation in the CGE models is that the existence of the
public sector is not well justified. Public services are typically assumed to generate no
utility to households or to enter household utility functions in a separable fashion.
Intra- and intergenerational redistribution with income transfers has often been
modelled, but a full recognition of the benefits of public policy would require modelling
insurance effects of taxes and transfers (see e.g. Harenberg and Ludwig, 2014) and
the influence of externalities and other market imperfections.
European Commission
Study on the effects and incidence of labour taxation
May 2015 | 88
comprehensive tax reforms, fiscal devaluations, pension reforms and the insurance
role of the progressive tax and transfer system. Even though these studies do not aim
directly the incidence of the labour income taxes, they provide also interesting
incidence results.
One popular policy issues studied with CGE models has been comprehensive tax
reforms in which the current progressive tax system is replaced by different versions
of a flat tax or a consumption tax. The aim of these reforms is to increase efficiency by
limiting progressivity in the labour income taxation and moving to cash flow taxation
of profits. The studies offer also rich results on intra- and intergenerational and in
some cases also international incidence of the tax system, see e.g. articles in Aaron
and Gale (1986), Auerbach and Hassett (2005) or Diamond and Zodrow (2008).
Altig et al. (2001) studies five alternatives to U.S. federal income tax with a large
scale dynamic life-cycle simulation model, which is an extension of the famous
Auerbach-Kotlikoff (1987) model. The tax reform alternatives are a proportional
income tax, a proportional consumption tax, a flat tax (Hall and Rabushka, 1995), a
flat tax with transition relief and X tax (Bradford, 1996), which is a progressive version
of the flat tax. The model used includes 12 types of households, which different
lifetime labour productivity profiles, and 55 birth cohorts. The changes in market
prices are strong since the economy is closed. There are no market imperfections.
A transition to a proportional wage income tax without exemptions would increase the
long run capital stock and output due to lower marginal tax rates on labour, which
increase overall labour supply. But the elimination of progressivity increases the tax
rates of the poor and reduces their incomes permanently.
A transition to a proportional consumption tax (actually implemented as a proportional
wage income tax and a business cash flow tax) has largely similar influence on growth
and income distribution. But it hurts also the initially rich due to the fall in the
purchasing power of wealth. The working-age generations compensate it by working
and saving more, but the retired generations suffer a loss of consumption.
A flat tax introduces a deduction in the consumption taxation, which eliminates some
of the adverse income distribution results. But now the reaction of labour supply and
economic growth is subdued and the loss of welfare extends also to middle income
citizens. The initial negative wealth effect remains.
Next the wealth effect is mitigated by allowing tax depreciations of the existing capital
stock. The subsequent loss of tax revenues compels to increase permanently the flat
tax rate and the labour supply effects and the overall long run gains from the reform
are small. Sheltering the poor and the current rich from the adverse outcomes lowers
the welfare of the current and future middle class citizens.
The last experiment was a transition to an X tax, which preserves the progressive
taxation of wages and combines it with cash flow taxation of capital incomes. The cash
flow tax rate is the same as the highest marginal tax rate of the wages. The growth
effects are large, since the cash flow tax allows immediate expensing of new
investments against the high tax rate. Also the distributional effects are more
favourable, except that the initial implicit wealth tax is now higher.
European Commission
Study on the effects and incidence of labour taxation
May 2015 | 89
The simulations of large scale CGE-OLG model highlight the diverse incidence
outcomes of the various fundamental tax reforms. The strongest limitations in the
used model are the closed economy assumption and perfect foresight of the agents.
Also a more detailed production and consumption structure would increase realism of
the results.
Fiscal devaluation aims to improve the international competitiveness of the
economy. Its effects are known to be mostly temporary and therefore it represents
counter-cyclical policy more than structural policy. In the most common version it is a
revenue neutral combination of a reduction in employers’ social insurance
contributions and an increase in the VAT rate. Actually this reform also increases
efficiency, since the burden of an increase in VAT rate is spread broadly to the
economy: in addition to wage incomes its falls on current wealth and income
transfers, which are not indexed to consumer prices. Therefore the needed increase in
the VAT rate is also smaller than the reduction in the contribution rate. The problems
of the reform are its potentially negative effects of income redistribution and short-
lived impact on external balance. The analysis can also be made stepwise to reveal the
different incidence effects of the reduction in the contribution rate and the VAT rate.
The crisis in the Euro area has increased interest in fiscal devaluations. There are
several recent simulation studies that focus on the Southern European members of the
EMU, such as Annicchiarico et al. (2014), Bosca et al. (2013), Gomes et al. (2014) and
Engler et al. (2014). Typical methods to analyse the outcomes are dynamic multi-
country CGE models or estimated macroeconometric models. Unfortunately these
types of models are not able to separate the incidence of the reform on income
redistribution. In some models also the important price and wage rigidities are lacking.
The study of CPB and CAPP (2013) covers both the macroeconomic and distributional
effects of fiscal devaluations. The macroeconomic effects were studied using the
macroeconometric multi-country model NiGEM and an OLG model and the
distributional effects with several microsimulation models. The NiGEM simulations
suggested that the balanced-budget reform increases GDP and employment, but has
little effect on the trade balance. The OLG model simulation revealed that there might
be permanent effects on the labour costs, if non-indexing the social transfers weakens
the bargaining power of labour unions. The microsimulations show that fiscal
devaluations are regressive, if the cut in social security contributions is not restricted
to low income workers.
The main motivation for pension reforms is population ageing, which has weakened
the fiscal sustainability of the pay-as-you-go (PAYG) financed defined benefit pension
systems. Smaller birth cohorts and longer lifetimes have resulted in an unfair
intergenerational allocation of the burden of financing pensions. Most of the reforms
also aim to improve efficiency by strengthening the link between paid contributions
and the received benefits. This reduces the degree to which the contributions are
considered as taxes. In most countries the majority of pension contributions are paid
by employers, which brings into question the final incidence of these taxes.
The realization of the full effects of pension reforms takes decades. Therefore
numerical OLG models are invaluable tools for the impact analysis. To cover the full
effects, models include heterogeneity in education, which influences lifetime
European Commission
Study on the effects and incidence of labour taxation
May 2015 | 90
productivity, length of working lives and life expectancy and risks related to
employment status, disability and longevity.
While the incidence of labour taxes is mainly determined by elasticities of labour
supply and demand, does the incidence of mandatory pension contributions depend on
both the incidence of labour income taxes in general and on the degree in which
contributions are considered as a tax. The latter varies in typical pension systems in
time, between birth cohorts and between income groups. The less the employees’
contributions are considered as a tax, the less they influence labour supply. The less
the employers’ contributions are considered as a tax, the more the employees are
willing to adjust their wages. Therefore strengthening the link between contributions
and benefits has shifted the incidence of employers’ contributions on labour and
reduced labour supply distortions.
A non-distorting mandatory pension scheme imitates the choices that a rationally
behaving person would have done, if the scheme did not exist. These choices may
include purchasing private pension insurance. Any deviation from this benchmark
changes labour supply and saving decisions and asset portfolios of the households.
The fact that there are mandatory pension systems reveals that the market solution is
not considered to maximise the welfare of the citizens. But the market solution
provides a useful point of comparison. So does another extreme, a mandatory tax-
financed flat rate pension scheme.
The closest substitute to the market solution is a mandatory fully funded defined
contribution pension scheme, especially if some additional conditions are fulfilled.
Benefits should be determined individually by the amount of paid contributions, the
yield of the funds, retirement age and actuarial longevity insurance. The contribution
rate should not be higher than the individual would have chosen if the pension scheme
had been voluntary, to avoid too large forced saving and longevity insurance and
liquidity problems. Also the portfolio of the pension fund should correspond to the one
that the individual would have chosen.
Full funding of contributions and investing the money in efficient portfolio corresponds
to private saving for old age if the mandatory contribution rate does not lead to higher
than optimal saving in any part of the life cycle. People are often liquidity constrained
during their early working years. Therefore a fixed contribution rate may be too high
during these years even though it would not lead a too high total saving for old age.
If a collective longevity insurance is actuarially neutral and compatible with longevity
risk aversion of the individual, it may even be more efficient than voluntary individual
pension insurance, which is vulnerable to adverse selection (and in some countries not
available at all). On the other hand a too high level of longevity insurance cannot be
neutralised by private actions. In an optimal situation the mandatory scheme would
not insure very high incomes, but there is a possibility to top up it with fairly priced
individual pension insurances.
Apart from a neutral pension scheme, also a neutral tax treatment of the contributions
and benefits is needed to avoid distortions. A flat income tax rate and either EET or
TEE taxation fulfils the criteria. In EET taxation the contributions are deductible from
the income tax base and are taxed with the yield accrued, when withdrawn. The
government participates in sharing of the rate-of-return risk, and is rewarded with
European Commission
Study on the effects and incidence of labour taxation
May 2015 | 91
positive expected tax revenues. In TEE taxation the contributions are not deductible
but the pension capital and its yield are not taxed when withdrawn. The income tax
rates should be fixed in time.
In the neutral scheme described above there is no intra- or intergenerational
redistribution between individuals and no distortions. A socially optimal pension
system deviates from this benchmark for several reasons. Redistribution increases
welfare in the society. Moreover, PAYG elements provide insurance against aggregate
shocks, such as variation in the yield of the pension funds, if labour productivity and
the yield are not strongly correlated. Therefore adding these elements to a pre-funded
pension scheme expands the set of available portfolios and allows risk sharing
between generations.
There are several aspects how the current pension systems deviate from the
neutral one. The link between paid contributions and received benefits is in current
pension systems weaker than in the non-distorting benchmark for many reasons.
Typical features in mandatory earnings-related pension systems are defined benefits
principle and PAYG financing. The monthly pension is determined typically by the
earned wages and a coefficient which translates the wages to pension rights. Basic
pension systems are typically tax-financed and provide flat rate residence-based
pensions.
There is often a ceiling for the wages that generate earnings-related pension rights. It
is also quite common that a limited amount of pensions is accrued during spells of
inactivity, like unemployment and maternity leave. The third extensively used
redistributing element is the means-testing of earnings-related pensions against basic
pensions.
An overwhelming share of the mandatory pension systems is funded following a PAYG
principle. Working generations pay the pensions of the retired. If the average growth
rate of wage bill falls short of the average yield of pension funds, the ratio of received
benefits to paid contributions is lower for an individual than in a fully funded system.
The PAYG funding principle is also sensitive to changes in demographics, employment
rates and the rate of productivity. A temporary increase in fertility or immigration
would lower the contribution rates of the large working cohorts, but increase those of
the next generations. Baby boom generations are a good example of this. An increase
in the growth rate of productivity would lower the contribution rates if the accrued
pension rights and paid pensions are not fully indexed to growth rate of the wage bill.
Realisation of these aggregate risks implies that in PAYG financed pension systems the
degree of which the contribution rate includes elements of tax varies in time and
between birth cohorts. The intergenerational variation in the tax contents is in many
cases obscured by pension reforms, which include birth cohort specific grandfathering
clauses.
Many of the recent pension reforms have tightened the link between the wages and
pensions.75 In some cases also elements of defined contribution pension scheme have
been introduced in defined pension systems. Pensions, retirement ages or required
contribution periods are linked to the remaining life expectancy of the retiring cohort.
75 This tightening has abolished the rather arbitrary redistribution related to final salary plans.
Other details of the recent reforms have been described e.g. in OECD (2012c, 2014b).
European Commission
Study on the effects and incidence of labour taxation
May 2015 | 92
The notional defined contribution (NDC) principle goes further towards a neutral
pension scheme. The benefits are determined by the amount of contributions paid
during the working life, even though funding of the scheme is based on PAYG
principle. Any variation in demographics or employment rates are reflected in the
indexation of accrued pension rights and paid pensions. In ageing societies this
indexation provides typically weaker average yield on pensions than a fully funded
scheme.
The adequacy of pensions is typically secured by high contribution rates in mandatory
pension schemes. But it means that these rates are likely to be too high to be optimal
for some stages of life. Also the amount of income insured against idiosyncratic and
aggregate longevity risk may be too high to be optimal. This issue may appear both in
defined benefit and defined contribution pension schemes, making it more likely that
contributions are considered as taxes. The recent cuts in pension benefits have
reduced the likelihood of having too high replacement rates.
Uncertainty and the insurance role of the tax system
The recent development in the numerical models has improved the potential of
studying new issues such as optimal progressivity of the income taxes, when there is
idiosyncratic uninsurable labour income uncertainty. The models are still rather simple
descriptions of the economies.
Conesa and Kruger (2006) compare the insurance benefits of progressive income
taxes and the efficiency losses due to lower labour supply and investments. They find
out that a transition to a flat tax system with a tax rate of 17.2 % and fixed deduction
of $ 9400 would be optimal for US. The lower labour income tax rate for the high
income earners increase labour supply so that initially the real wages fall and output
increases. In the long term also the capital stock increases allowing the productivity of
labour and real wages to rise above the initial level. The welfare calculations show that
income-poor gain from the tax deduction and income rich benefit from the lower tax
rate. It is not possible to separate the incidence of labour taxes due to the
comprehensive taxation of incomes.
Kindermann and Krueger (2014) simulate the optimal tax rate for the highest 1 % of
income earners. The simulation model is a large scale OLG model with uninsurable
labour productivity risk. The optimality criterion is the weighted sum of expected
lifetime utility of households currently alive and born in the future. With this kind of
measure, the welfare loss of the top income earners has little weight in the social
welfare function. They find out that the revenue maximising marginal tax rate for the
highest 1 % of income earners is 95 % and the welfare maximising tax rate is 89 % in
the long run. The jump in the tax rate reduces initially the labour supply of the top
income earners by 40 %. The aggregate labour input falls by 10 % and the output by
7 %. The tax transition is financed with public debt, which crowds out private
investments. In the long term the supply of labour recovers somewhat, but remains
lower than in the initial steady state. The aggregate consumption falls by 7 % in the
long term. The stochastic labour productivity process is the key element in the study.
It generates very high and somewhat persistent income with small probability. Badel
and Hugget (2014) suggest that if individuals have the possibility to accumulate
human capital, the optimal top marginal tax rate is substantially lower.
European Commission
Study on the effects and incidence of labour taxation
May 2015 | 93
3.5.3. An illustration of the link between contributions and benefits
We simulate the incidence of employers’ pension contribution rate using a numerical
OLG model. The aim of this example is to show the main driving forces of the
adjustments in the economy.
Description of the FOG model
The FOG model is of the type originated by Auerbach and Kotlikoff (1987). The model
is modified to describe an almost small open economy and calibrated to the Finnish
economy. The FOG model consists of four sectors and three markets. The sectors are
households, enterprises, foreign sector and a government sector. The general
government is divided further to central government, municipalities, two pension
funds and a social security institute. The labour, goods and capital markets are
competitive and prices balance supply and demand period-by-period. There is no
money or inflation in the model. The unit period is five years, and the model has 16
adult generations living in each period. The model is described in more detail e.g., in
Lassila and Valkonen (2007).
We assume that the pre-tax rate of return on saving and investments is determined in
global capital markets. Household and firms take the interest rate as fixed in their
plans. The stock market value of the firms adjusts to generate a stock market yield
which corresponds to the bond yield. Only immediately after an unexpected profit
shock there will be share price changes which deviate from this arbitrage rule.
The firms have some monopoly power in exports, which makes the terms of trade
endogenous. The goods that are used as intermediate good, in private consumption
and in investments are CES composites of the imported and domestic goods, implying
that their substitutability is imperfect. Foreign economies are assumed to grow with
the trend growth rate of the domestic labour productivity.
Labour input is determined partly by exogenous assumptions and partly due to
endogenous adjustments in the model. Hours of work are decided by households, but
age-specific participation rates and unemployment rates are exogenous. Real wage
adjusts to equalise the value of marginal product of labour and labour costs in the
production of domestic goods.
We assume that the modelled subsectors of the general government have their own
budgets, which are balanced either by social security contributions or earned income
taxes. The only exception is the state budget, which is balanced by using a lump sum
transfer. Earned income tax brackets are adjusted with the growth of the economy.
Households react to the income and substitution effects of taxation, social security
contributions and pension rules.
The current statutory Finnish pension system is modelled in detail. It consists of a flat
rate tax-financed basic pension scheme and an earnings-related scheme, which is
partially pre-funded. In the earnings-related scheme all earnings during the lifetime
accrue pension rights with age-specific accrual rate. The pension rights and paid
pensions are indexed to wage rate so that for the accrued rights the weight of the
wage increase is 80 % and weight of the consumer prices 20 %. The corresponding
weights in the indexation of pensions are 20 % and 80 %. The pensions are reduced
further by life expectancy adjustment. Pensions are taxed using the EET principle.
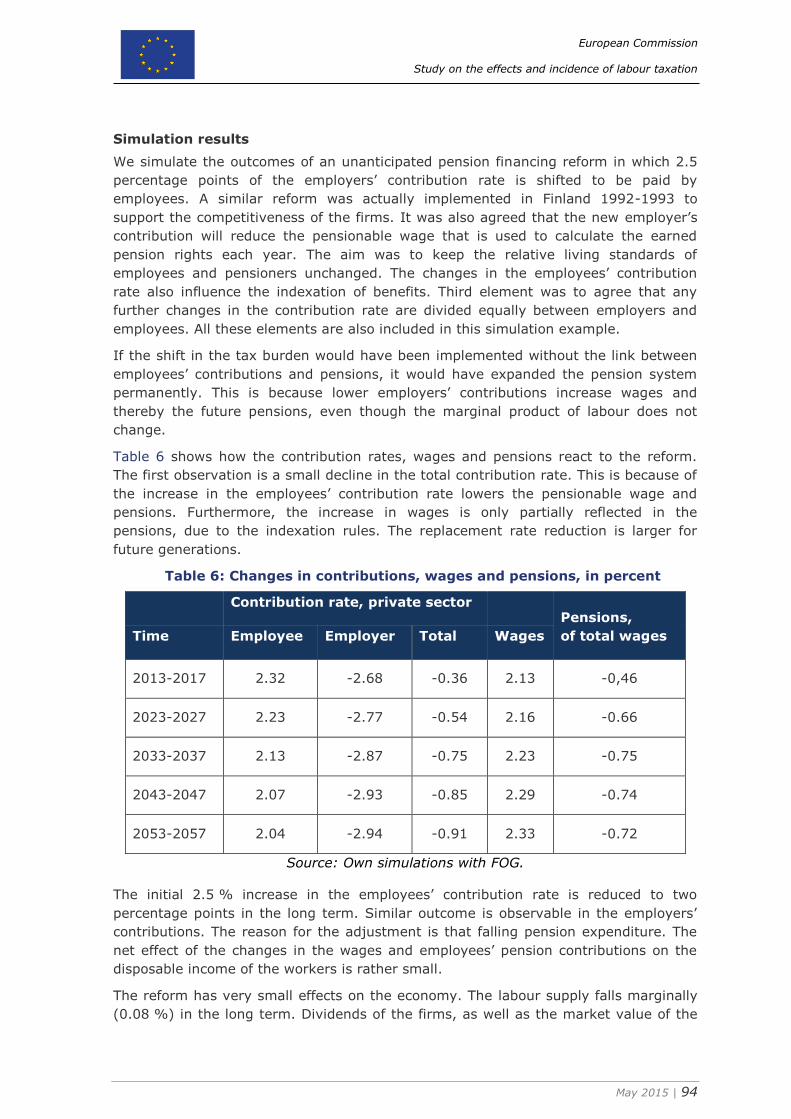
European Commission
Study on the effects and incidence of labour taxation
May 2015 | 94
Simulation results
We simulate the outcomes of an unanticipated pension financing reform in which 2.5
percentage points of the employers’ contribution rate is shifted to be paid by
employees. A similar reform was actually implemented in Finland 1992-1993 to
support the competitiveness of the firms. It was also agreed that the new employer’s
contribution will reduce the pensionable wage that is used to calculate the earned
pension rights each year. The aim was to keep the relative living standards of
employees and pensioners unchanged. The changes in the employees’ contribution
rate also influence the indexation of benefits. Third element was to agree that any
further changes in the contribution rate are divided equally between employers and
employees. All these elements are also included in this simulation example.
If the shift in the tax burden would have been implemented without the link between
employees’ contributions and pensions, it would have expanded the pension system
permanently. This is because lower employers’ contributions increase wages and
thereby the future pensions, even though the marginal product of labour does not
change.
Table 6 shows how the contribution rates, wages and pensions react to the reform.
The first observation is a small decline in the total contribution rate. This is because of
the increase in the employees’ contribution rate lowers the pensionable wage and
pensions. Furthermore, the increase in wages is only partially reflected in the
pensions, due to the indexation rules. The replacement rate reduction is larger for
future generations.
Table 6: Changes in contributions, wages and pensions, in percent
Contribution rate, private sector Pensions,
of total wages Time Employee Employer Total Wages
2013-2017 2.32 -2.68 -0.36 2.13 -0,46
2023-2027 2.23 -2.77 -0.54 2.16 -0.66
2033-2037 2.13 -2.87 -0.75 2.23 -0.75
2043-2047 2.07 -2.93 -0.85 2.29 -0.74
2053-2057 2.04 -2.94 -0.91 2.33 -0.72
Source: Own simulations with FOG.
The initial 2.5 % increase in the employees’ contribution rate is reduced to two
percentage points in the long term. Similar outcome is observable in the employers’
contributions. The reason for the adjustment is that falling pension expenditure. The
net effect of the changes in the wages and employees’ pension contributions on the
disposable income of the workers is rather small.
The reform has very small effects on the economy. The labour supply falls marginally
(0.08 %) in the long term. Dividends of the firms, as well as the market value of the
European Commission
Study on the effects and incidence of labour taxation
May 2015 | 95
firms decline a little due to the reduction of the labour supply. The effect on capital
stock is almost non-existing, as well as the change in the amount of domestic
production. In the short run, the reduction of pensions generates a marginal decline in
the private consumption. In the long term, wage income increases enough to reverse
the trend. The price of the domestic good falls initially somewhat, because the fall in
consumption requires an increase in exports. Also this trend reverses in the long term.
The influence of the reform on the public finances is rather complicated. The increase
in the wages both expands the tax base for income taxes and compounds the public
expenditure due to higher income transfers. The wages in the public sector increase,
but the need for employers’ contributions falls.
The employees’ contributions are deductible from taxable wages. With the high
marginal taxes prevailing in Finland approximately only a half of the increase in the
contribution rate would decrease the disposable income of the employees. Firms can
deduct the labour costs from the taxable profits. The more completely the wage reacts
to the cut in the employers’ contribution rate, the less the corporate income tax
revenues fall. The net outcome of all these changes is a marginal reduction of the
municipal income tax rate and a somewhat higher increase in the lump sum tax used
to balance the central government finances. The total tax revenues as a percentage of
GDP increase marginally.
Discussion
As noted earlier, the incidence of labour income taxes is largely determined by the
main features of the CGE simulation model. With the almost small open economy
structure and frictionless labour markets, the incidence of pension contributions should
be mainly on wages, with only small effects on profits, production, employment, prices
and public finances. Furthermore, the 5-year unit period in FOG rules out analysis of
short-term reactions. The results are largely as expected.
The details of the pension system matter however. Without a compensating link
between employees’ contributions and pensions, the reform would have expanded the
pension system. Another important rule is the indexation of pensions. In the Finnish
case, where the change in real wages has little effect on pensions, the reform causes a
rather large intergenerational shift in incomes. If the accrued pension rights and paid
pensions were indexed to total labour income costs of the employer, the incidence of
changes in pension contributions would be more equally distributed among the
households and even less important for the real economy. But this kind of indexation
does not exist in practice.
3.6. Summary
Who ultimately bears the burden of labour taxes is a question which has been around
in the academic literature for a while and yet there is no clear consensus in the
empirical evidence. In a recent meta-analysis Melguizo and González-Páramo (2013)
find that on average about two thirds of the incidence of labour taxes falls on workers.
However, there is too much variation across different countries to view this result as a
precise estimate. There are however a number of intermediate results which can be
taken away from the survey of the literature. Table 7 summarises the main points of
the three strands of literature considered.
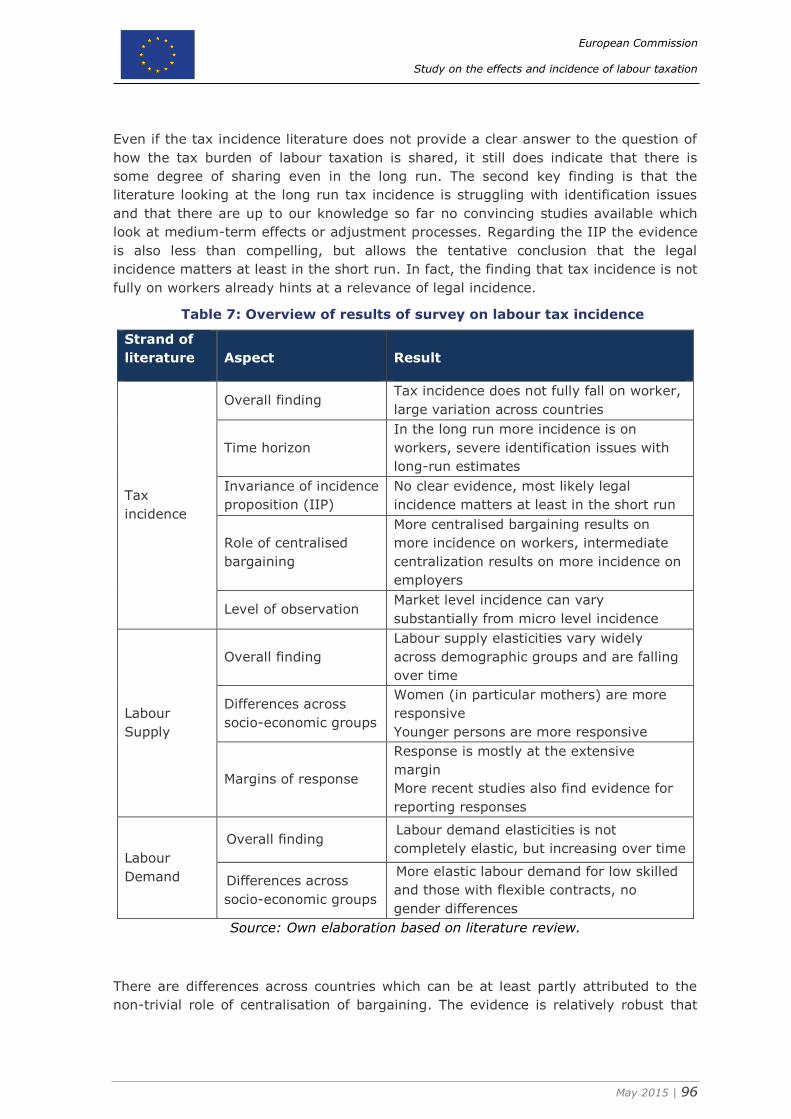
European Commission
Study on the effects and incidence of labour taxation
May 2015 | 96
Even if the tax incidence literature does not provide a clear answer to the question of
how the tax burden of labour taxation is shared, it still does indicate that there is
some degree of sharing even in the long run. The second key finding is that the
literature looking at the long run tax incidence is struggling with identification issues
and that there are up to our knowledge so far no convincing studies available which
look at medium-term effects or adjustment processes. Regarding the IIP the evidence
is also less than compelling, but allows the tentative conclusion that the legal
incidence matters at least in the short run. In fact, the finding that tax incidence is not
fully on workers already hints at a relevance of legal incidence.
Table 7: Overview of results of survey on labour tax incidence
Strand of
literature Aspect Result
Tax
incidence
Overall finding Tax incidence does not fully fall on worker,
large variation across countries
Time horizon
In the long run more incidence is on
workers, severe identification issues with
long-run estimates
Invariance of incidence
proposition (IIP)
No clear evidence, most likely legal
incidence matters at least in the short run
Role of centralised
bargaining
More centralised bargaining results on
more incidence on workers, intermediate
centralization results on more incidence on
employers
Level of observation Market level incidence can vary
substantially from micro level incidence
Labour
Supply
Overall finding
Labour supply elasticities vary widely
across demographic groups and are falling
over time
Differences across
socio-economic groups
Women (in particular mothers) are more
responsive
Younger persons are more responsive
Margins of response
Response is mostly at the extensive
margin
More recent studies also find evidence for
reporting responses
Labour
Demand
Overall finding Labour demand elasticities is not
completely elastic, but increasing over time
Differences across
socio-economic groups
More elastic labour demand for low skilled
and those with flexible contracts, no
gender differences
Source: Own elaboration based on literature review.
There are differences across countries which can be at least partly attributed to the
non-trivial role of centralisation of bargaining. The evidence is relatively robust that
European Commission
Study on the effects and incidence of labour taxation
May 2015 | 97
more centralised bargaining shifts the tax burden towards labour, while intermediate
levels of coordination result in a partial shift of the tax incidence on employers.
Following the argumentation of Metcalf (2002) the question of tax incidence can also
be seen as a question of the relative elasticity of labour demand and labour supply.
The review of these two strands of the literature in this section allows some tentative
conclusions. First, labour supply elasticities appear to be falling over time and recent
meta-analyses place them around 0.4 to 0.3. The overall elasticity is driven to a very
large extent through the extensive margin, whereas the elasticities at the intensive
margin are close to zero. Furthermore recent studies, as discussed in Saez et al.
(2012b), exploiting tax return data find that the elasticities at the intensive margin
can mostly be attributed to reporting effects. The literature is also relatively clear as to
how the elasticity at the extensive margin varies across different socioeconomic
groups. Women and in particular single mothers have a more elastic labour supply.
Men typically have a higher labour supply elasticity at the extensive margin at the
beginning or the end of the career when they face trade-offs with further education
respectively early retirement.
Concerning the labour demand elasticities a recent meta-analysis by Lichter et al.
(2014) suggests that the elasticities are increasing over time with a best guess of -0.3
as the average labour demand elasticity. The long-run elasticity is found to be higher,
as well as higher labour demand elasticities are observable for fixed term contracts
and low-skilled workers.
Finally a brief review of the CGE literature suggests that the incidence outcome will
depend on the size and openness of the country, the substitutability between capital
and labour and the migration patterns. Of further importance is the link between the
taxes and contributions and the benefits. This is in particular true for pension
contributions, where the incidence is likely to fall fully on workers if they acquire
pension entitlements and therefore do not perceive the pension contributions as taxes.
For our framework of indicators the most important conclusion is that legal tax
incidence matters, which demands a more detailed look at the composition of the tax
burden on labour. Furthermore the role of wage bargaining is found out to be an
important determinant of the tax incidence results. Therefore, together with further
labour market institutions discussed in the next subsection, the level of centralisation
of the wage bargaining will be a key indicator. The review of the labour supply
literature reinforced the importance of distinguishing between different socio-economic
groups. Additionally, the fact that labour supply is more responsive at the extensive
margin, especially for the young who face a trade-off between work and education and
for mothers who face a trade-off between work and child care and home production,
highlights that aspects of the welfare state can alter the work incentives. Therefore
the next subsection will also investigate how these aspects affect the labour supply
decisions.
European Commission
Study on the effects and incidence of labour taxation
May 2015 | 98
4. Review of the interplay between labour market institutions/regulations and labour taxation
This section of the study embeds the previous review of the literature on the economic
incidence of labour taxes into the context of labour market institutions and the
broader economic environment. To this end, we will focus on institutions that are
considered to be the most influential for the labour market outcomes and economic
incidence. Specifically two important aspects of the institutional environment of the
labour market will be considered: The wage setting process and the welfare system.
4.1. Wage setting institutions
Taxes do not create unemployment when they operate in isolation in a competitive
labour market. They may, however, reduce employment; the magnitude of this
reduction depends on the elasticities of supply and demand as broadly discussed in
section 3. However, labour market institutions such as unions influence the wage
setting process and change the labour supply curve faced by firms by imposing a
mark-up over the reservation wage of individuals (Boeri and van Ours, 2008).
The analysis of taxes in a labour market with perfect competition omits unemployment
entirely. In this section we discuss models of imperfect labour markets (union
bargaining, search und matching) to analyse the impact of taxes on unemployment
and on tax incidence. Cahuc et al. (2014) present a simple search and matching model
to analyse the impact of taxes and unemployment. First, the model illustrates that tax
has the same impact on unemployment whether it is paid by the firm or by the
employee. Second, increases in the level of taxes increase unemployment. Tax
increases reduce the surplus of jobs. It is the difference between the wages net of
taxes and the income of the unemployed that exerts an impact on unemployment.
Therefore, all taxes and transfers that decrease the income of the unemployed by the
same amount should have no effect on unemployment. Third, increases in tax
progressivity, keeping tax level constant, reduce unemployment because more
progressive taxation exerts a downward pressure on wages. As progressivity
increases, any wage rise produces a smaller utility for workers and entails a higher
marginal cost for the firm.
The seminal paper of Pissarides (1998) shows the dependence of the impact of taxes
on wages and employment on the structure of the labour market. In addition to the
competitive model he distinguishes three alternative settings: a labour market model
where unions and firms determine the wage through bargaining; a search model
where there are costs for firms and workers in finding each other – potential
transaction costs lead to rents both parties bargain about; an efficiency wage model in
which the firm sets the wage in order to avoid employees from shirking.
In the competitive model the tax structure does not matter. The same is true for the
efficiency wage model. The simulations show, however, that a tax cut leads to much
higher effects on employment in the efficiency wage model compared to the
competitive model, where most of the tax cut is absorbed in wages. This is due to the
no-shirking condition being flatter than the labour supply function in the competitive
model, what leads to a higher impact of taxes on employment.
European Commission
Study on the effects and incidence of labour taxation
May 2015 | 99
In the two models with bargaining over wages (between unions or individuals and
firms) the tax structure matters. In the union model introducing a progressive tax with
no tax revenue effects at all decreases unemployment with almost no effect on wages.
In this model the key factor is a flat labour demand curve. A shift in the wage curve
due to a change in the tax structure leads to considerable effects on labour demand
with only a small fall in wages. The search model shows similar, albeit smaller, results
of a change in the tax structure.
A second focus in Pissarides’ paper is on the design of unemployment benefits. He
distinguishes two scenarios: in the first unemployment benefits are determined by a
fixed ratio to wages, in the second unemployment benefits are kept constant. All four
labour market models imply that tax cuts have little impact on employment when the
ratio of unemployment benefits to wages is constant: If unemployment benefits are
increased in line with the wages the tax is more likely to be absorbed by the wage.
However, if unemployment benefits remain constant the employment effects of the
tax cuts can be large.
Summing up, different labour market models imply different results regarding the
impact of employment taxes on wages and employment. In some models the tax
structure matters considerably. In all models the design of unemployment benefits has
a large influence on the outcome.
Interactions between labour market institutions and labour taxation
Labour market institutions like taxes, unions, employment protection legislation,
unemployment benefits and active labour market policy interact with each other. The
effect of one policy cannot be analysed in isolation, as it depends on the
characteristics of other institutions. Thus, considering interdependencies between
institutional factors is important when identifying country-specific reform effects on
unemployment. For example, Belot and van Ours (2004) model and empirically test
interactions of labour market institutions and their impact on employment within a
right-to-manage union bargaining model. They focus on three particular interactions:
the interaction between the unemployment benefits system and labour taxes; the
interaction between the level of bargaining and employment protection legislation; and
the interaction between the level of bargaining and the union density. An increase in
the replacement rate of unemployment benefits shifts the wage curve upwards leading
to higher wages and less employment. However, the magnitude of this effect depends
on the value of the replacement rate as well as on the magnitude of labour taxes in
place. An equal sized shift of the wage-setting curve lowers employment more in case
of low tax rates (as the second derivate of the demand curve is negative). However,
the size of the shift in the wage-setting curve due to a change in the replacement rate
also depends on the tax level. Thus, whether the interaction is positive or negative
does not follow from the theoretical model. Empirically they find a positive interaction.
Various studies use cross-country panel data to investigate the impact of average
rates of taxation on unemployment. Reduced-form unemployment equations
consistent with standard-job-search and wage setting/price setting models are
estimated. The unemployment rate is regressed on usual labour market policies and
institutional variables (e.g. tax-wedge, unemployment benefit generosity, degree of
employment protection legislation, union membership rates, degree of centralisation in
European Commission
Study on the effects and incidence of labour taxation
May 2015 | 100
the wage bargaining, product market institutions).76 Control variables for the output
gap, country and time fixed effects and dummy variables for large idiosyncratic shocks
are also included. Generally this strand of literature finds that an increase in the tax
wedge leads to higher unemployment (see e.g. Bassanini and Duval, 2009).
From theoretical considerations (e.g. Belot and van Ours 2004, Coe and Snower 1997)
we know that the impact of labour taxes on employment depends on their interaction
with labour market institutions. When analysing the incidence of labour taxes it is thus
important to take these interactions into account. In this chapter we scan the
empirical literature for specifications that allow for interactions between labour taxes
and other institutions when analysing the impact of taxes on employment. Most
papers we found allow for interactions between labour taxes and the degree of
centralisation and coordination in wage bargaining. We found little empirical literature
on the interaction of taxes and minimum wages and taxes and unemployment
benefits.
Note, that the use of cross-country panel regressions to analyse the effects of labour
market reforms on unemployment has been heavily criticised. The results of
macroeconomic studies with short-time series have failed to provide convincing
evidence about the robustness of their results (Bassanini and Duval, 2009). Moreover,
theory suggests that interdependencies between institutional factors are important to
identify country-specific reform effects on unemployment. Sachs (2015) provides a
short methodical critic of the empirical cross-country literature that estimates the
impact of labour market institutions on unemployment considering interactions
between institutions. Several empirical papers have dealt with the identification of
interdependencies between individual labour market institutions to determine
conditional institutional effects on unemployment. However, interaction terms are
often selected in a subjective and unsystematic way. Unfortunately, the large number
of potential interactions hinders the construction of detailed and comprehensive
models, which would be able to provide clear-cut predictions on institutional effects.
Theory can only provide limited support which institutional interactions to consider.
Economic institutions matter for the impact of labour taxes on labour costs and
unemployment (see Melguizo and González-Páramo, 2013). Empirical evidence
indicates the impact of labour taxes is higher in economies with an intermediate
centralisation of the wage bargaining process and a strong trade union presence.
When looking at employment outcomes and the degree of centralisation and
coordination in wage bargaining Calmfors and Driffil (1988, p. 14) reason that
“extremes work best”. Highly centralised systems with national bargaining (Nordic
countries, Austria) or decentralised systems with wage bargaining at the firm level
(USA, Switzerland) perform best. Small unions on the firm level have little market
power. Large trade unions have market power, but take into account the potential
unemployment effects of wage increases when bargaining over wages. In contrast,
medium-sized unions have some market power, but do not consider macroeconomic
consequences of their bargaining results. Thus, the relationship between centralisation
of wage bargaining and wages is not monotonic but rather hump-shaped.
76 Alesina and Perotti (1997), Arpaia and Carone (2004), Nunziata (2005) and Azemar and
Desborde (2010) use labour costs as dependent variable.
European Commission
Study on the effects and incidence of labour taxation
May 2015 | 101
Summers et al. (1993) use the measure of corporatism developed by Calmfors and
Driffill (1988) to test their hypothesis that labour taxation is less distortionary on
labour supply when centralisation is higher. They find a linear connection between tax
distortions and centralisation in an estimate for 17 countries. In addition to the
reasoning of Calmfors and Driffill that macroeconomic consequences of bargaining
results are considered by the bargaining parties they argue that unions also take into
consideration that taxes raised lead to public goods benefiting their members. Thus,
although in countries with high centralisation taxes are higher, these are less
distorting.
There are some empirical studies measuring the impact of taxation on employment
outcomes in the presence of union bargaining.77 Alesina and Perotti (1997) analyse
the link between taxation and labour costs on a panel of 14 OECD countries for the
period 1965-1990. They find that the shifting of labour taxation to labour costs
increases with the degree of centralisation. However, in highly centralised labour
markets it is lower than in labour markets with negotiations on the level of industries.
They thus confirm the hump-shaped form of the relationship found by Calmfors and
Driffill (1988) and developed in their own theoretical model.
Elmeskov et al. (1999) assess the effectiveness of OECD policy recommendations
regarding unemployment by estimating the impact of labour market institutions. They
allow for interaction between labour taxes and degree of coordination in wage
bargaining. They find that the negative impact of labour taxes on unemployment is
especially high in countries with intermediate levels of coordination.
Nickell et al. (2000) analyse the determinants of the falling unemployment rates in the
United Kingdom and the Netherlands during the 1980s and 1990s (especially when
compared to other European countries). While the wage bargaining power in the
United Kingdom was reduced by legislation, the unions in the Netherlands have
operated very co-operative and co-ordinated. Both “extremes” led to only moderate
increases in wages and thus to a low level of unemployment.
Daveri and Tabellini (2000) distinguish three models of wage-setting institutions
across OECD countries: Anglo-Saxon countries (little centralisation in wage
bargaining), continental Europe (powerful trade unions with little coordination) and
Nordic countries (centralised wage bargaining). Estimating the effects of taxes on
employment and growth for a panel of 14 OECD countries from 1965-1995 they find
that negative effects of labour taxes on employment and growth are higher in
continental Europe. In these countries higher tax rates are shifted onto higher gross
wages, which is not the case in the other OECD countries analysed.
Arpaia and Carone (2004) use dynamic panel data techniques for a sample of EU-15
Member States and test whether the composition of labour taxes affects labour costs
(both in the short- and in the long-run) and whether employment performance is
better in highly centralised bargaining systems. They use three different measures of
centralisation of bargaining in their equations and assign countries to low,
intermediate and high levels of centralisation. While the first variable concentrates on
the wage-setting procedure, the latter two focus on coordination. Simulation results
77 See also Section 3.2 for a review of the literature which includes the centralisation of
bargaining in the analysis of tax incidence.

European Commission
Study on the effects and incidence of labour taxation
May 2015 | 102
do not differ strongly for the different variables used. In contrast to previous studies,
they find that labour costs are not influenced by the tax wedge in countries with
centralisation at intermediate level. Labour costs increase with an increase in the tax
wedge in countries with high or low level of centralisation. This diverging result can be
reconciled through their use of a dynamic panel estimator which includes the lagged
dependent variable. Indeed, the coefficient for the lagged real labour cost is around
0.95 for almost all regression, leaving very little room for other variables to explain
the variation of real labour costs.
Nickell et al. (2005) analyse the determinants of unemployment in 20 OECD countries
from 1961-1995. They interact labour taxes with an index of coordination (low,
middle, high) stemming from two different series. They find that the negative impact
of labour taxes on unemployment becomes stronger in countries with little
coordination. In general, they find a lower impact of labour taxes on unemployment in
the long-run than Daveri and Tabellini. For a country with medium coordination a 10
percentage points increase in employment tax leads to a 1 percentage points rise in
unemployment.
Alesina and Perotti (1997) and Daveri and Tabellini (2000) keep the assignment of
countries to a level of centralisation constant over the observation period. In contrast,
Nunziata (2005) uses a different measure of labour market coordination.78 He
constructs three variables: net union density (the ratio of total reported union
members to employees), bargaining coordination (an index with range 1 to 3
constructed from the OECD data on bargaining coordination) and dummy variables for
six different coordination types following a taxonomy by Traxler (1996) and Traxler
and Kittel (2000). With this specification he takes into account that countries change
their coordination and centralisation level over time. He finds that the impact of the
tax variable on labour costs is reduced in the presence of high bargaining
coordination. In order to test the hypothesis of the hump shape relationship between
tax wedge and labour costs in the presence of centralisation/coordination he then
divides the countries into three groups (again allowing the countries to move from one
group to the other over time). Although the tax variable has the highest impact on
labour costs in intermediate countries he finds a shift to labour costs in the long-run in
the other groups too. A 2 percentage points increase in the tax induces a 0.5 %
increase in labour costs in not coordinated and coordinated countries and a 0.6 %
increase in the intermediate countries. When focusing on centralisation only (like
Alesina and Perotti, 1997) he also finds slightly deviating results: While there is no
impact of taxes on labour costs in centralised countries, a 2 percentage points
increase in taxes induces a 0.6 % increase in labour costs in decentralised and
intermediate countries.
Azemar and Desborde (2010) use the index of bargaining coordination created by
OECD and provided in Nickell (2006).79 They estimate the impact of a rise in non-wage
labour costs on real manufacturing labour costs in OECD countries. This impact
78 While centralisation only refers to the level at which wages are bargained, coordination refers
to mechanisms where the aggregate employment implications of wage determination are taken into account. This can be due to highly centralised wage bargaining, but also due to institutions (e.g. employers’) assisting bargainers to act in concert although bargaining itself takes place on
industry or plant level. (Nickell et al., 2005). 79 The index ranges from 1 to 5 and increases in the degree of coordination.
European Commission
Study on the effects and incidence of labour taxation
May 2015 | 103
decreases with the degree of wage bargaining coordination. In the short-run in
countries with high coordination a rise in the tax rate by 1 percentage point would
lead to a fall in gross wages by 0.77 %, whereas in countries with low coordination
gross wages would decrease by 0.25 %. In the long run about 45 % of the tax
increase is shifted to employers in countries with little coordination, whereas in highly
coordinated regimes workers bear the tax increase entirely.
Sachs (2015) applies a Bayesian model approach on panel data for 17 countries from
1982-2005. This methodology allows him to test all relevant institutional interactions
for significance and he does not need to make a subjective selection of interactions.
He finds a negative interaction term between bargaining coordination and the tax
system, meaning that an increase in the income has a less adverse impact on the
labour market in case of coordinated wage setting. However, when it comes to a
reduction in the tax burden the negative coefficient of the interaction term implies that
a tax cut is more beneficial when bargaining coordination is low. Sachs argues that
coordination avoids a strong labour demand effect of a tax cut by letting employees
benefit from the tax gain. He finds no robust and significant interaction effects
between labour taxes and other labour market institutions (unemployment benefit
system, employment protection, product market regulation).
Next to the level of unionization and the wage-setting process the existence of a
minimum wage can influence the incidence of payroll taxes. When an employee
already receives the minimum wage, it is impossible to shift a rise in the payroll tax
onto the worker. The burden of the extra tax must fall on the employer (see Nickell,
1997).
Picard and Toulemonde (2001) derive conditions for taxes levied on workers to have
the same employment effects as taxes levied on firms considering processes of wage
determinations. They find that in a competitive labour market a budget neutral
restructuring of taxes levied on employers and employees is irrelevant to employment.
It is also irrelevant if unemployment benefits depend on the net wage and not on the
gross wage. However, it is not irrelevant when the employment level is determined by
a binding minimum wage. If the net wage is constrained by a binding minimum value
of the net wage then again it is irrelevant.
Bassanini and Duval (2006) study the determinants of structural unemployment in
OECD countries allowing for interactions between labour market institutions. They put
special emphasis on the complementarity of labour and product market institutions
and find a strong interaction between the minimum wage and the tax wedge: An
increase in the ratio of minimum to median wages by 10 percentage points would
increase the impact of the tax wedge on unemployment by 50 % in the average OECD
country. This is consistent with the theory that minimum wages prevent employers to
shift the incidence of pay-roll taxes to wages.
Some studies find interactions between the impact of taxes on employment outcomes
and the design of unemployment benefits. Belot and van Ours (2004) find that
taxes have a higher impact on the unemployment rate when the replacement rate of
unemployment benefits is high. High replacement rates and high taxes reduce the gap
between work and non-work income. Increasing one of the two variables has a more
negative impact on unemployment if the other is already at a high level.
European Commission
Study on the effects and incidence of labour taxation
May 2015 | 104
Overall, we found some empirical support for interactions between labour taxes and
the degree of centralisation and coordination in wage bargaining. There is however a
limited number of studies and consequently little empirical evidence for interactions of
taxes and minimum wages and taxes and unemployment benefits.
4.2. Welfare state and labour supply
Traditionally, theoretical models studying the relationship between public policies and
labour supply mainly focus on the role played by the tax system, and consider to what
extent labour supply decisions, either at the extensive or the intensive margin, are
influenced by taxation. However, a more elaborate and realistic model should
incorporate also two other sets of policy instruments that shape the budget constraints
of households and influence their decisions of whether to work or not, and for how
many hours: cash transfers for low income households and the subsidization of
services. Some micro studies (not the macro ones) include cash transfers in the
analysis (for example, Kaliskova, 2015), but usually neglect in-kind benefits. Further,
one should also consider the impact of the legislation regarding the rules about
maternal and paternal leave, as well as the regulation of the possibility to access part
time work or work sharing arrangements within firms. In this section we first provide a
synthetic description of the interrelationships between these variables and labour
supply decisions from a theoretical point of view and then present a synthesis of the
relevant empirical literature.
The effective tax burden depends not only on the structure of social security and
personal income taxation, but also on the interactions between these taxes and public
cash transfers to households with low incomes or with family burdens. Taking into
account transfers through the welfare system is particularly important for women with
children living in poor households, and for those with low education, especially in
countries with high unemployment rates. The presence of high withdrawal rates of
benefits or greater costs for accessing public services (e.g., kindergartens or health
care) when a person starts working may produce the risk of poverty, inactivity or
unemployment traps, even if the formal income tax rate is not particularly high
(Carone et al., 2004, and Maag et al., 2012).
The effects of a transfer on labour supply depend on its design and on its interaction
with the structure of the tax system. Means-tested cash transfers provide an
income for those who do not work or are in-work poor (i.e., they live in households
with disposable equivalent income lower than the poverty line). The benefit is then
reduced if hours of work and earnings increase. If leisure is a normal good, this kind of
transfer should unambiguously reduce labour supply. Its impact depends on the rate
at which the transfer is reduced when income from work rises, as well as on the
amount of the transfer, in the sense that small sums could be ignored in deciding how
much to work. If the cash transfer is provided only with a strict work requirement, it
should have a positive impact on labour supply. Earnings subsidies (or in-work
benefits) that increase the take-home pay of workers up to some point and then are
phased out act as a negative income tax first and then like a supplement to a
traditional income tax. Therefore they should increase work effort in the first phase, in
particular concerning the decision to work, and should have negative labour supply
effects in the second stage, i.e. in the withdrawal segment of the budget constraint.
European Commission
Study on the effects and incidence of labour taxation
May 2015 | 105
Benefits in kind, i.e. services provided for free or at prices lower than their market
value (housing, child care, health care, etc.) could have a positive effect on work
effort if they are complementary to labour supply (Gavhari, 1994). Their impact is,
therefore, an empirical question, and depends also on the size of the subsidy. If the
amount of the good or service provided by the government is higher than the optimal
amount that the beneficiary would choose, i.e. if the individual is obliged to consume
more of it than its optimal quantity, it is crucial to verify the relationship between the
in-kind transfer and labour supply: if they are complements (i.e. if the in-kind good or
service and leisure are substitutes), the demand for leisure should decrease, therefore
increasing labour supply (Moffitt, 2002). For example, the provision or subsidization of
housing services may be expected to have negative effects on labour supply because
housing and leisure are complements, while child care services could have a positive
impact on labour supply, because child care and labour are complements (child care is
a substitute for leisure).
The interaction between these different forms of transfers, together with the structure
of the personal income tax and of social security benefits, determines the change in
disposable income associated to the decision to start working, or to devote more time
to work. Following the reasoning in section 2.1 we group the incentive issues resulting
from the welfare system into adverse incentive problems of the tax benefit system and
a reduction of the opportunity costs of work.
4.2.1. Incentive issues of the tax and transfer system
Concerning the impact of cash transfers on labour supply, the review of Moffitt
(1992) concluded that the most important income tested benefits in the USA do
reduce work effort, but the effects are generally low. A similar conclusion is contained
in Ben Shalom et al. (2012). This means that these transfers are able to reduce
poverty even if we evaluate their effect against a counterfactual that incorporates the
correct number of hours of work without the transfers (higher than the number of
hours after the receipt of the transfer). A pure cash transfer that reaches it maximum
amount when earnings are zero and then falls with an implicit tax rate of 100 % when
the individual starts working has a very strong disincentive effect, but this case is
mainly theoretical, because beneficiaries of social assistance transfers are mostly
subject to a series of conditions (accepting reasonable job offers, participation to
training programs, school attendance, etc.) that they must accept if they do not want
to lose the benefit.
Unemployment benefits have a theoretically unambiguous effect on labour supply: the
more they last and the higher their amount, the lower should be the propensity of the
unemployed to seek work until they are available. High replacement rates can create
an “unemployment trap”. This fear has stirred a vast number of reforms of these
benefits in all advanced economies in the last few decades.
Replacement rates have been lowered and their length shortened. From “passive”
policies, aimed simply at providing income to the unemployed, there has been a shift
towards “active” policies, which underlines the importance of training and investing in
the human capital of the unemployed, so as to increase the likelihood of finding a new
occupation and to reduce the loss of capabilities during the period spent out of work.
The general consensus is that the predictions of the simple theoretical argument are
European Commission
Study on the effects and incidence of labour taxation
May 2015 | 106
difficult to observe in reality because there is a vast heterogeneity of particular cases,
regarding for example the presence and strength of active labour market policies and
job conditionality, and that as a consequence it is unlikely that unemployment
benefits, at least in their present configuration, exert a significant negative effect on
employment. The aim of recent reforms has been to “activate” the weaker segments
of the labour market (long-term unemployed, younger and older people, single
mothers, migrants, disabled), with important challenges for the organisation of
training services and local public authorities, cash transfers, patterns of human capital
formation. However, recent budget problems induced by the recession and austerity
measures have often reduced the resources available for forms of activation of high
quality, with negative effects on the skills of the unemployed and on their perspective
of finding new jobs (Graziano and Heidenreich, 2014). The set of these institutional,
political and cultural changes make, in any case, less relevant the possibility that
labour market policies may have important negative effects on labour supply.
The OECD has done an extensive work about the effects of cash benefits and taxes on
financial incentives to work. The results show that in many developed countries
implicit tax rates can be very high, although they are nearly always below 100 %,
indicating that in general household income rises after the decision to work more. An
important result from the comparative studies is that for jobless households the
marginal effective tax rates associated to a low-wage work are generally higher than
those associated to an average-wage work. The reason is simple: in a jobless
household when one of the adults starts working the household loses a substantial
part of assistance benefits. The combination of this loss of benefits with a small
income from work results in marginal effective tax rates that are often higher than
60 % and in some cases reach 90 % or more. In households where one member is
already working, the marginal effective tax rate associated to the beginning of a low-
wage activity for the partner is much lower than in jobless households, because if a
member is already working, the household has already lost much anti-poverty
benefits. The result is that if partner is already working, even a low paid work is a
convenient option for the partner, with marginal effective tax rates usually lower than
50 % (without considering child care costs). The transition from a low-wage job to an
occupation paid at the average wage is subject to not particularly high tax rates since,
again, only the personal income tax generally applies to these cases, not the loss of
benefits, in particular for two-earner households.
The effects on labour supply of changes in the amount or other institutional
characteristics of cash transfers to poor households may be evaluated with a rich set
of tools. The main distinction is between ex-ante and ex-post studies. The first ones
use simulation techniques to study the likely effect of these changes, while the second
group rely on data that refer to specific episodes of policy change, either experimental
or quasi-experimental. Ex-ante studies are typically divided into a first stage in which
a behavioural model of labour supply is estimated on existing data, and a second one
where the coefficients are applied to a hypothetical reform. Ex-post studies are based
either on a structural model of choice applied to the data or on a reduced form
estimation strategy. Many of the studies based on the microsimulation model Euromod
are examples of ex-ante simulations of the potential effects of a tax or transfer
scheme (Figari et al. 2013). Some of these analyses do not account for behavioural
reactions and are therefore able to simulate the immediate distributional impact of a
European Commission
Study on the effects and incidence of labour taxation
May 2015 | 107
policy change, evaluating the potential disincentive effects only through an
examination of the changes in average and marginal tax rates. Other papers apply to
the simulated distribution of incomes and policy parameters the labour supply
elasticities estimated on the same dataset or taken from other studies (Colombino and
Narazani, 2013). Examples of ex-post studies based on “real” policy changes, with
data collected both before and after the reform, either experimental or quasi-
experimental, are provided in the following subsection on in-work benefits.
What are the effects of the basic form of cash transfers, i.e. minimum-income
schemes (cash transfers aimed at providing a basic income for those without other
sources of income) on labour supply? A first important factor is the design of the
scheme with respect to other possible sources of income: its amount when there are
no other resources, its level with respect to average earnings or to the national
poverty line, and its relationship with the level of unemployment benefits. Further, it is
important to observe the speed with which the benefit declines for each additional unit
of income from work, in particular the phase-out point and the marginal effective tax
rate over the phase-out range. Second, the presence of work-related requirements for
the receipt of the transfer means that the effects of minimum income benefits on
labour supply is typically very different from what can be inferred from the
examination of the individual budget line in a simple graph linking net income with
hours of work. A survey conducted by the OECD (Immervoll, 2009) shows that all
OECD countries providing minimum income benefits impose on beneficiaries a
(variable) series of conditions, for example the willingness to accept suitable job offers
for those who are able to work, the registration to the local employment office,
participation in integration measures like training so as to improve their employability
without losing a contact with the labour market. A constant monitoring of current
circumstances can also guarantee that benefits are not wasted and do not encourage
a state of dependency. These characteristics should greatly reduce the risk of
distortions of minimum income schemes on labour supply. Some caveats are however
important. First of all, it is not always clear whether the formal rule governing benefit
administration and eligibility conditions are tightly or loosely applied in the different
countries. Second, it is important to reduce the risk that, in case the beneficiaries do
not comply with the rules, other family members unable to work (children, disabled,
etc.) may suffer the consequences of a reduction or a withdrawal of the benefit.
Further, not all the poor adults are able to work, for a variety of reasons, so that only
a fraction of the beneficiaries will manage to be “activated” and reach self-sufficiency.
Bargain and Doorley (2011) find that the French guaranteed minimum income
(Revenu Minimum d'Insertion) for young uneducated men reduces the participation at
the labour force by 7–10 %. Other national experiences however show, in general, a
significant effect of minimum income schemes on the extent and gravity of poverty,
although the level of protection is almost always not enough to reach the commonly
used relative poverty line set at 60 % of median disposable income. The impact on the
number of beneficiaries who find a job is much more limited: it is usually positive but
low, ranging between 12 % and 35 % (Blommesteijn and Malee, 2009, Marchal and
Van Mechelen, 2013).
In-work benefits are tax credits or direct cash transfers reserved to people who are
working but are earning low wages, or live in households with low total disposable

European Commission
Study on the effects and incidence of labour taxation
May 2015 | 108
income. When they take the form of tax credits, they are refundable, i.e. they turn
into cash benefits, so as to guarantee in any case an increase in disposable income for
the worker. The main difference to traditional transfers aimed at supporting the
incomes of poor households, is that the subsidy is zero for those who are not working.
In contrast, a more standard anti-poverty subsidy would reach its maximum amount
exactly for households with zero incomes from work. Such schemes, many argue,
have the drawback of stimulating passivity and dependency, while the main effect of
an in-work benefit consists in making low-paid or unqualified jobs attractive. One of
the main reasons that justify the widespread interest for this kind of benefit is the by
now general awareness of the importance of in-work poverty: many persons are still
in poverty (defined at the household, not personal level) despite being engaged in a
working activity. It is deemed that such a situation can be ameliorated either by way
of an increase in the labour intensity within the household, i.e. through an increase in
the number of workers, or with a greater take-home pay of those who are already
working. For both these aims, an in-work benefit can be useful, since it increases the
wage of workers with low market incomes, and provides a stimulus for currently non-
working members of the household. In-work benefits are also judged to be more
consistent than passive cash transfers with a series of measures aimed at improving
self-sufficiency and individual activity, like child care services, investment in education
and training, and active labour market policies. In general, the impact of in-work
benefits on labour supply is a problem that deserves to be studied because these
benefits are targeted to some of the groups of the population with a more elastic
labour supply, in particular low-income workers, lone parents, women earning low
wages. We therefore expect a positive effect on labour supply, at least at the
extensive margin.
Concerning the effects of in-work benefits on labour supply (Immervoll and Pearson,
2009), there have been numerous studies of their most important application, the
Earned income tax credit in the USA. The EITC is zero for those who are not working,
then provides a positive transfer (negative income tax) if household income is below a
certain amount, remains constant for a segment of the earning-labour supply line and
finally decreases with increasing values of household income, until it becomes zero. It
should therefore have a positive effect on the extensive margin, inducing some non-
workers to start working, while it should have a negative impact on the phase-out
region. Numerous empirical studies suggest that the EITC has actually increased the
number of single mothers who are employed: Meyer and Rosenbaum (2001) for
example found that 60 % of the increase in the employment rate for single mothers
between 1984 and 1996 was due to the EITC. Further, the program has virtually zero
impact on labour supply of married men, and a small negative effect on the occupation
rate (-1 %) and on the number of hours worked by married women, i.e. the secondary
earners in the family, by between -1 % and -4 % (Eissa and Hoynes, 2006, Hotz and
Scholz, 2003). The negative effects on hours worked are however small, so that the
net effect of the EITC on labour supply is surely positive (Keane and Moffitt, 1998;
Ellwood, 2000; Hotz and Scholz, 2003; Eissa and Hoynes, 2006).
Blundell et al. (2000) use simulation techniques to study the impact of the UK Working
families tax credit (later replaced by the Working tax credit and the Child tax credit)
on labour supply. They use a discrete behavioural model of household labour supply
with controls for fixed and childcare costs, and unobserved heterogeneity. Their main
European Commission
Study on the effects and incidence of labour taxation
May 2015 | 109
finding is a substantial increase in labour supply for single mothers (+2.2 % in
participation rates), and a modest reduction in labour supply for married women as a
result of the EITC. Brewer et al. (2006) found similar results.
In France, a small in-work benefit (Prime pour l’emploi) has been introduced in 2001.
Various studies, using in part simulation methods and in part ex-post evaluation
techniques on quasi-experimental “real” data distinguishing between a treatment and
a control group, have found that this scheme, which was inspired by the American and
UK examples, has a very small, almost negligible positive effect on the labour supply
of women. The main reason is the limited amount of the benefit (no more than 600
yearly euro per recipient), as well as the significant lag between the moment when
one starts working and the receipt of the incentive, reducing its visibility (Cochard et
al., 2008).
Simulation studies have stressed the preference, from an efficiency point of view, for
the determination of the benefit on the basis of the income of the single individual
involved, and not of the total household income. The reason is that the individual basis
avoids the possible negative effect on the labour supply of secondary earners deriving
from the means-test on household income (Blundell et al., 2007).
Given these generally small negative effects on the number of hours of those who are
already working and a positive impact on the number of workers, one can conclude
that the positive impact of the EITC on the living standards of workers are not
significantly weakened by incentive effects. Programs of this kind should therefore be
able to improve the living standards of those earning modest wages without negative
behavioural reactions on labour supply, and with positive results on the participation
rates of some of the weaker segments of the population, in particular women with low
earning potentials.
4.2.2. Opportunity costs of work and the welfare system
For a given structure of labour supply elasticities, the actual effects of current personal
income and payroll taxation, and of their possible reforms, also depend on the socio-
economic environment. For example, women’s labour supply is influenced by the
availability and cost of social services like child care and care for the elderly. The
absence of a satisfactory public provision of these services, at prices lower than in the
corresponding private markets, may significantly reduce female labour supply through
their effects on the cost of work (Gornick and Meyers, 2003, Del Boca and Wetzels,
2008). More generally, the study of the effects of public policies on labour supply
cannot be confined to personal income taxation, social security contributions and
means-tested cash transfers, but must also consider how the revenue is spent, and in
particular if public expenditure is designed also with the aim of favouring labour
supply. As already discussed, if the state provides or subsidises in-kind transfers
that are complementary to work effort, like child or elderly care or public transport,
then the distortionary impact of taxes and transfers on labour can be significantly
reduced, particularly at the extensive margin, which is generally considered as the
most important dimension for the study of the effects of the tax-benefit system on
labour supply. Kleven (2014) builds from aggregate data of a sample of advanced
economies a measure of the participation tax rate, i.e. an average net tax rate
representing the share of earnings that remain to the worker after he/she decides to
European Commission
Study on the effects and incidence of labour taxation
May 2015 | 110
take a job. A simple plot of the employment rate (either of the whole population or
only of women) against this measure should provide a negative relationship, but the
striking result is that the relationship is clearly positive, i.e. nations with the highest
participation tax rates (notably the Scandinavian countries) have also the highest
employment rates. In other words, the elasticity of labour supply with respect to the
overall tax rate at the extensive margin could be positive. The difference with respect
to other macro studies, which usually provide a more standard negative correlation
between average tax and employment, may be due (apart from the time span covered
by the data) to the neglect of an important factor that can have an effect on
incentives: the provision or subsidization of services that are complementary to
labour: across OECD countries, there is a positive relationship between the
employment rate and the share of GDP that goes to public expenditure on child care,
preschool and elderly care. Countries may compensate the heavy distortions caused
by their tax burdens with public spending for services that lower the costs associated
to work effort, therefore benefiting in particular the group of the population with the
highest labour supply elasticities, i.e. women with family burdens and low or average
earning potentials.
Empirical research on the effects of child care provision consistently finds a positive
effect of the availability of places on mothers’ labour supply, as well as a favourable
impact deriving from a reduction in the cost of the service. In the UK and the USA,
where the service is mainly privately provided, women’s labour supply is mainly
dependent on the cost of the service, while in continental and south European
countries the more relevant variable is the availability of subsidised places. Del Boca
et al. (2004) study the impact of child care provision on labour supply and child care
demand of Italian mothers aged from 18 to 45 years. They simulate the effect of
changes in the cost of the service and in its availability. Public services are mainly
used by working mothers with high education. An increase in cost reduces the demand
for public child care and also labour supply, while an increase in the supply of public
child care has a strong positive impact on female labour supply. An increase in the
degree of subsidization of the service would have a positive effect on labour supply
only in the absence of rationing in service provision. Vandellannoote et al. (2014), for
the Flanders region, find again a strong impact of the service provision on labour
supply, while the effect of the cost of the service is lower.
Having a child is a happy event for a family, nevertheless it also entails economic
costs for parents. The costs of a child can be divided into two components: a rise of
family expenditures and an increase of opportunity costs, i.e. foregone earnings (Del
Boca et al., 2003). As a result, the government could be interested to reduce the cost
of this precious “good”. Given the high cost that a state has to face to provide a
reliable and universally accessible system of public childcare for children under six,
several countries found an alternative in the system of child-related leaves (De Henau
et al., 2008). The public option to set up an adequate system of child-related leave
is supported by the fact that, for most parents, home represents the safest and coziest
place for their children. Moreover, parents often consider themselves the best
caregivers when their child is very young.
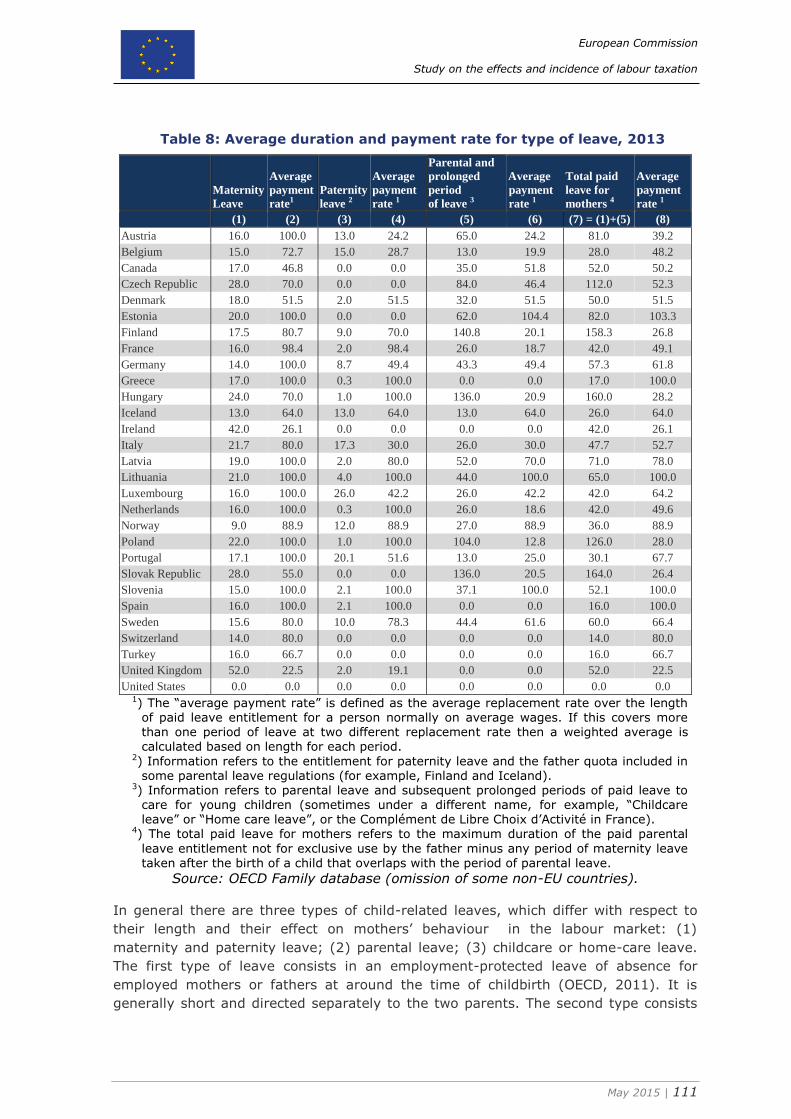
European Commission
Study on the effects and incidence of labour taxation
May 2015 | 111
Table 8: Average duration and payment rate for type of leave, 2013
Maternity
Leave
Average
payment
rate1
Paternity
leave 2
Average
payment
rate 1
Parental and
prolonged
period
of leave 3
Average
payment
rate 1
Total paid
leave for
mothers 4
Average
payment
rate 1
(1) (2) (3) (4) (5) (6) (7) = (1)+(5) (8)
Austria 16.0 100.0 13.0 24.2 65.0 24.2 81.0 39.2
Belgium 15.0 72.7 15.0 28.7 13.0 19.9 28.0 48.2
Canada 17.0 46.8 0.0 0.0 35.0 51.8 52.0 50.2
Czech Republic 28.0 70.0 0.0 0.0 84.0 46.4 112.0 52.3
Denmark 18.0 51.5 2.0 51.5 32.0 51.5 50.0 51.5
Estonia 20.0 100.0 0.0 0.0 62.0 104.4 82.0 103.3
Finland 17.5 80.7 9.0 70.0 140.8 20.1 158.3 26.8
France 16.0 98.4 2.0 98.4 26.0 18.7 42.0 49.1
Germany 14.0 100.0 8.7 49.4 43.3 49.4 57.3 61.8
Greece 17.0 100.0 0.3 100.0 0.0 0.0 17.0 100.0
Hungary 24.0 70.0 1.0 100.0 136.0 20.9 160.0 28.2
Iceland 13.0 64.0 13.0 64.0 13.0 64.0 26.0 64.0
Ireland 42.0 26.1 0.0 0.0 0.0 0.0 42.0 26.1
Italy 21.7 80.0 17.3 30.0 26.0 30.0 47.7 52.7
Latvia 19.0 100.0 2.0 80.0 52.0 70.0 71.0 78.0
Lithuania 21.0 100.0 4.0 100.0 44.0 100.0 65.0 100.0
Luxembourg 16.0 100.0 26.0 42.2 26.0 42.2 42.0 64.2
Netherlands 16.0 100.0 0.3 100.0 26.0 18.6 42.0 49.6
Norway 9.0 88.9 12.0 88.9 27.0 88.9 36.0 88.9
Poland 22.0 100.0 1.0 100.0 104.0 12.8 126.0 28.0
Portugal 17.1 100.0 20.1 51.6 13.0 25.0 30.1 67.7
Slovak Republic 28.0 55.0 0.0 0.0 136.0 20.5 164.0 26.4
Slovenia 15.0 100.0 2.1 100.0 37.1 100.0 52.1 100.0
Spain 16.0 100.0 2.1 100.0 0.0 0.0 16.0 100.0
Sweden 15.6 80.0 10.0 78.3 44.4 61.6 60.0 66.4
Switzerland 14.0 80.0 0.0 0.0 0.0 0.0 14.0 80.0
Turkey 16.0 66.7 0.0 0.0 0.0 0.0 16.0 66.7
United Kingdom 52.0 22.5 2.0 19.1 0.0 0.0 52.0 22.5
United States 0.0 0.0 0.0 0.0 0.0 0.0 0.0 0.0 1) The “average payment rate” is defined as the average replacement rate over the length
of paid leave entitlement for a person normally on average wages. If this covers more than one period of leave at two different replacement rate then a weighted average is calculated based on length for each period.
2) Information refers to the entitlement for paternity leave and the father quota included in some parental leave regulations (for example, Finland and Iceland).
3) Information refers to parental leave and subsequent prolonged periods of paid leave to care for young children (sometimes under a different name, for example, “Childcare leave” or “Home care leave”, or the Complément de Libre Choix d’Activité in France).
4) The total paid leave for mothers refers to the maximum duration of the paid parental
leave entitlement not for exclusive use by the father minus any period of maternity leave
taken after the birth of a child that overlaps with the period of parental leave.
Source: OECD Family database (omission of some non-EU countries).
In general there are three types of child-related leaves, which differ with respect to
their length and their effect on mothers’ behaviour in the labour market: (1)
maternity and paternity leave; (2) parental leave; (3) childcare or home-care leave.
The first type of leave consists in an employment-protected leave of absence for
employed mothers or fathers at around the time of childbirth (OECD, 2011). It is
generally short and directed separately to the two parents. The second type consists
European Commission
Study on the effects and incidence of labour taxation
May 2015 | 112
in an employment-protected leave of absence for employed parents, which is often
supplementary to specific maternity and paternity leave periods, and usually, but not
in all countries, follows the period of maternity leave (OECD, 2011). Although the
entitlement to this (generally long) leave period is individual, it is addressed to both
parents to allow them to stay close to their child during his early life. The third type of
leave is very similar with the second one, but, in this case, payments are not
restricted to parents with a prior work attachment (OECD, 2011).
The ILO, within the framework of the Maternity Protection Convention (2000),
recommended a minimum period of “not less than 14 weeks” of paid leave. Nowadays
almost all OECD countries have ratified this recommendation, but many countries
have fixed maternity leave entitlements just above this minimum (ILO, 2010). Indeed,
across the OECD, the average duration of maternity leave was around 18.1 weeks in
2013. Table 8 summarises the situation in the OECD countries.
Women are entitled to the longest maternity leaves in the United Kingdom (52 weeks)
and Ireland (42 weeks). In the United States, instead, there is no statutory right to
any of the types of leave or other statutory measures. Only some individual States
provide income support during leave through either sick-leave insurance or maternity
leave programmes (OECD, 2011; Kamerman and Waldfogel, 2011).
Entitlements to parental, home-care or childcare leaves vary widely in their length
across the OECD: from no parental leave (Greece, Ireland, Mexico, New Zealand,
Spain, Switzerland, Turkey, United Kingdom and the United States) to about 141
weeks in 2013 in Finland. Moreover, parental leave payment rates are often
considerably lower than maternity pay, and income support often only covers a limited
part of the parental leave period (OECD, 2011).
The impact of child-related leave on female labour supply has been analyzed by
several studies (Klerman and Leibowitz, 1997; Waldfogel et al., 1999; Del Boca et al.,
2003; Pronzato, 2009). According to most of these, the impact on the mothers’
participation in the labour market is very ambiguous (Klerman and Leibowitz, 1997;
Del Boca et al., 2003). In general, child-related leaves rise female participation
because women are not forced to exit the labour market after the birth of their
children to better care them (Waldfogel et al., 1999; Del Boca et al., 2003). Moreover,
the higher the replacement income provided to the mothers during leave period, the
higher the increase of their participation (Klerman and Leibowitz, 1997). On the other
hand, when leaves become significantly long, they run the risk of determining a rise of
dismissal probability during pregnancy, a deterioration of the mothers’ skills and
therefore to compromise their long-run employment prospects, in terms of promotions
and opportunities for work experience (Klerman and Leibowitz, 1997; Del Boca et al.,
2003). Too long child-related leaves can, contrary to what is expected, produce
negative effects both on female employment rate and on mothers wage (for an
employer the cost of hiring a woman is bigger). In support of this finding, OECD
(2011) shows that: countries with shorter periods of leave had, in 2008, higher
employment rates among mothers with young children than countries with prolonged
periods of paid leave; prolonged periods spent out of work significantly affect career
development and the so-called “family pay gap” that measures the lifetime differential
in earnings between mothers and childless women.
European Commission
Study on the effects and incidence of labour taxation
May 2015 | 113
Further, there are differences on the impact of child-related leaves on female
participation in the labour market according to their voluntary or compulsory character
and the mother education level. First of all, a comparison of leave policies
implemented in the different EU countries showed that only a lengthy compulsory
maternity leave has a negative effect on the work probability of a woman, while the
length of an optional maternity leave determines a positive effect on the female
employment rate (Del Boca et al., 2003). Secondly, several studies state that highly
educated mothers are less likely to take a long time out of work after childbirth
(because of their elevated opportunity costs), while low-educated mothers (generally
also low-income earners) are most likely to make full use of prolonged leave
arrangements and, in many cases, exit the labour market (Del Boca et al., 2003; Del
Boca et al., 2009; Pronzato, 2009; OECD, 2011). Waldfogel et al. (1999) perform their
analysis on the effects of family leave coverage on women's employment using
microdata from the United States, Britain and Japan. To better assess the effects of
family leave policies on women’s labour supply, they use panel data to track women’s
employment path after childbirth. In all countries the retention rate (percentage of
women that return to work for their previous employer within 12 months of their most
recent birth) was clearly higher for those who were covered by maternity leave than
those who were not covered (especially in Japan). Moreover, the increase in retention
probability due to maternity leave coverage is 16 % in Britain, 23 % in the United
States and 76 % in Japan. Del Boca et al. (2003) review the main factors that may
affect women’s participation in the labour market: availability and costs of childcare,
child-related leaves, own characteristics of the labour market, child benefit and so on.
Using the European Community Household Panel (ECHP) and selecting all women aged
21-45, married (or cohabitant) from Italy, Spain, Denmark, the Netherlands available
for the years 1994-1999, they develop several logit estimations on the probability of
working. The results show that the length of maternity leave has a negative impact on
participation, because the longer women stay out of the labour force, the greater the
loss they incur in terms of skill deterioration and lost opportunities.
Another way to reduce the incompatibility between motherhood and career prospect,
reducing the potential opportunity costs of children, may be increasing employment
flexibility in the labour market (Del Boca and Locatelli, 2008), particularly when other
policies to improve female labour supply are underdeveloped (Hegewish and Gornick,
2011).
Part-time work allows mothers to have more time in the day and, therefore, it is more
suitable for workers who have family responsibilities and care commitments (Del Boca
et al., 2009). Indeed, according to an OECD report (2011), the recent wide
mobilization of unused labour supply, particularly among women, is attributable to the
strong growth in part-time work since the 1980s. Moreover, to highlight the
importance of part-time jobs in balancing family and work, many OECD countries have
set statutory rights for parents to request part-time work, usually as long as the child
reaches primary school age (OECD, 2011).
The positive effect of part-time work on women’s labour supply has been reported in
numerous studies generally based on cross-country analyses. Del Boca et al. (2003),
using the ECHP for the years 1994-1999, showed a positive impact of the diffusion of
part-time jobs on the women’s probability of working in Italy, the Netherlands,
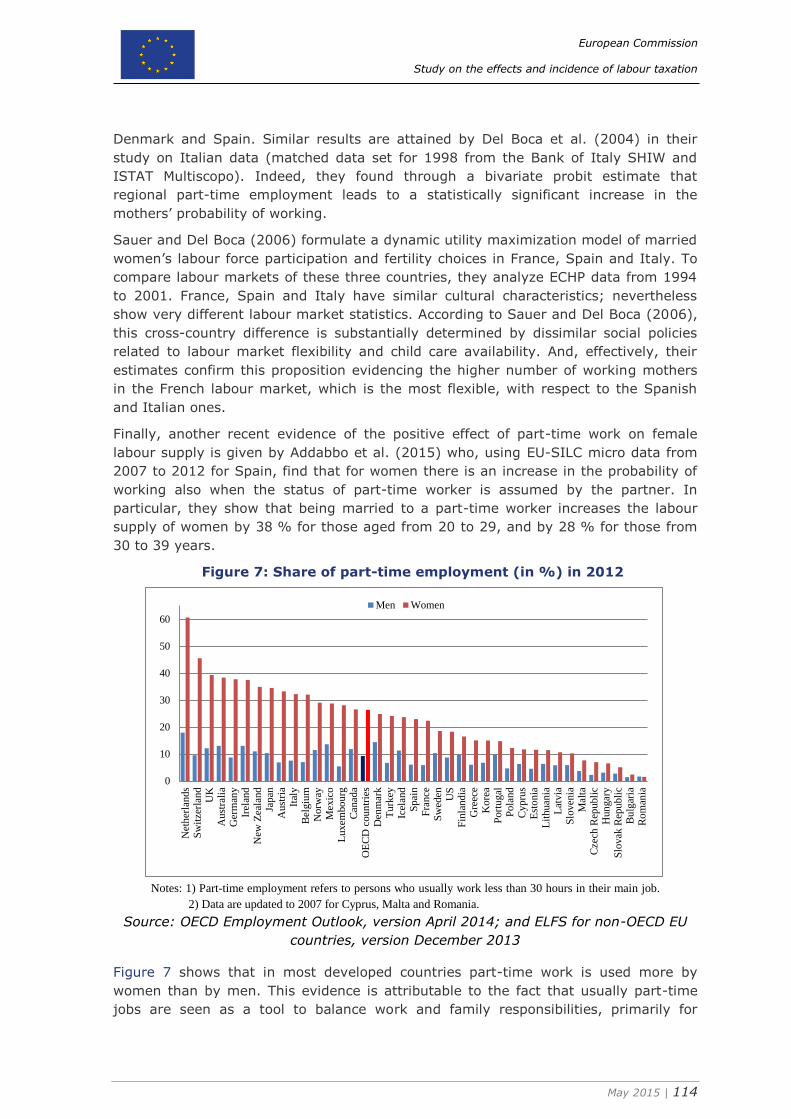
European Commission
Study on the effects and incidence of labour taxation
May 2015 | 114
Denmark and Spain. Similar results are attained by Del Boca et al. (2004) in their
study on Italian data (matched data set for 1998 from the Bank of Italy SHIW and
ISTAT Multiscopo). Indeed, they found through a bivariate probit estimate that
regional part-time employment leads to a statistically significant increase in the
mothers’ probability of working.
Sauer and Del Boca (2006) formulate a dynamic utility maximization model of married
women’s labour force participation and fertility choices in France, Spain and Italy. To
compare labour markets of these three countries, they analyze ECHP data from 1994
to 2001. France, Spain and Italy have similar cultural characteristics; nevertheless
show very different labour market statistics. According to Sauer and Del Boca (2006),
this cross-country difference is substantially determined by dissimilar social policies
related to labour market flexibility and child care availability. And, effectively, their
estimates confirm this proposition evidencing the higher number of working mothers
in the French labour market, which is the most flexible, with respect to the Spanish
and Italian ones.
Finally, another recent evidence of the positive effect of part-time work on female
labour supply is given by Addabbo et al. (2015) who, using EU-SILC micro data from
2007 to 2012 for Spain, find that for women there is an increase in the probability of
working also when the status of part-time worker is assumed by the partner. In
particular, they show that being married to a part-time worker increases the labour
supply of women by 38 % for those aged from 20 to 29, and by 28 % for those from
30 to 39 years.
Figure 7: Share of part-time employment (in %) in 2012
Notes: 1) Part-time employment refers to persons who usually work less than 30 hours in their main job.
2) Data are updated to 2007 for Cyprus, Malta and Romania.
Source: OECD Employment Outlook, version April 2014; and ELFS for non-OECD EU
countries, version December 2013
Figure 7 shows that in most developed countries part-time work is used more by
women than by men. This evidence is attributable to the fact that usually part-time
jobs are seen as a tool to balance work and family responsibilities, primarily for
0
10
20
30
40
50
60
Net
her
lands
Sw
itze
rlan
dU
KA
ust
rali
aG
erm
any
Irel
and
New
Zea
land
Japan
Aust
ria
Ital
yB
elgiu
mN
orw
ayM
exic
oL
uxem
bo
urg
Can
ada
OE
CD
coun
trie
sD
enm
ark
Turk
eyIc
elan
dS
pai
nF
rance
Sw
eden US
Fin
land
iaG
reec
eK
ore
aP
ort
ugal
Pola
nd
Cy
pru
sE
sto
nia
Lit
huan
iaL
atvia
Slo
ven
iaM
alta
Cze
ch R
epubli
cH
un
gar
yS
lovak
Rep
ubli
cB
ulg
aria
Ro
man
ia
Men Women
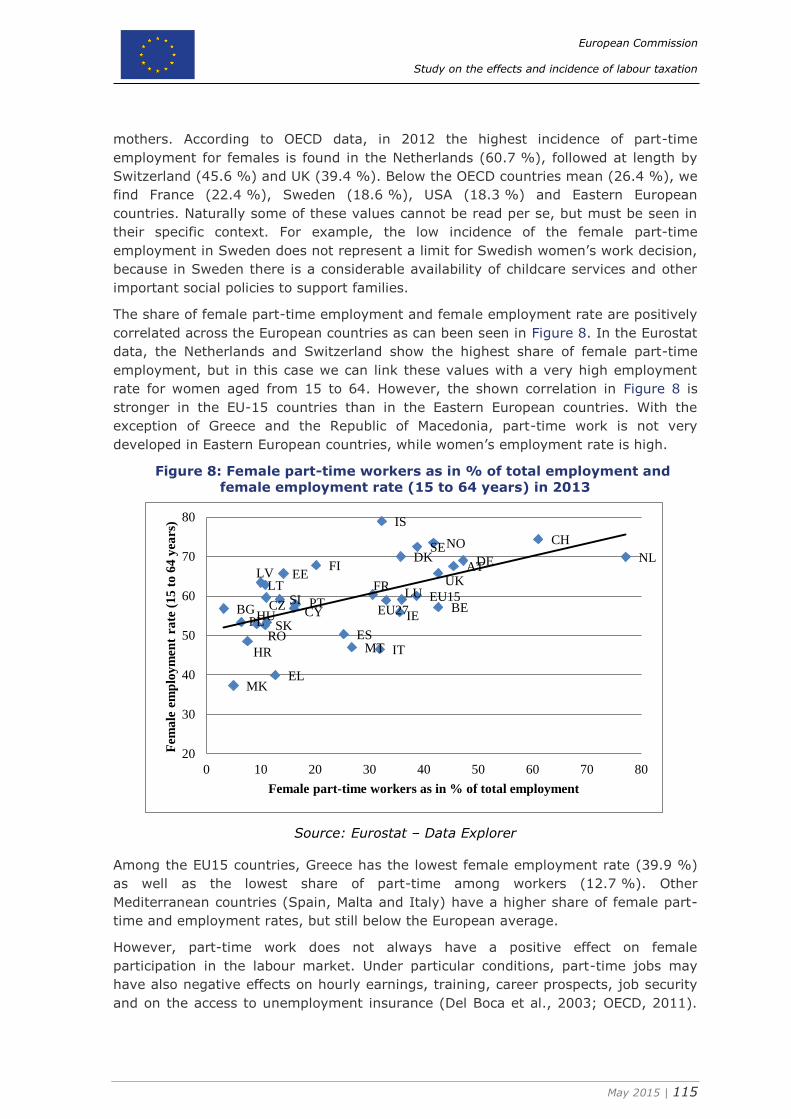
European Commission
Study on the effects and incidence of labour taxation
May 2015 | 115
mothers. According to OECD data, in 2012 the highest incidence of part-time
employment for females is found in the Netherlands (60.7 %), followed at length by
Switzerland (45.6 %) and UK (39.4 %). Below the OECD countries mean (26.4 %), we
find France (22.4 %), Sweden (18.6 %), USA (18.3 %) and Eastern European
countries. Naturally some of these values cannot be read per se, but must be seen in
their specific context. For example, the low incidence of the female part-time
employment in Sweden does not represent a limit for Swedish women’s work decision,
because in Sweden there is a considerable availability of childcare services and other
important social policies to support families.
The share of female part-time employment and female employment rate are positively
correlated across the European countries as can been seen in Figure 8. In the Eurostat
data, the Netherlands and Switzerland show the highest share of female part-time
employment, but in this case we can link these values with a very high employment
rate for women aged from 15 to 64. However, the shown correlation in Figure 8 is
stronger in the EU-15 countries than in the Eastern European countries. With the
exception of Greece and the Republic of Macedonia, part-time work is not very
developed in Eastern European countries, while women’s employment rate is high.
Figure 8: Female part-time workers as in % of total employment and
female employment rate (15 to 64 years) in 2013
Source: Eurostat – Data Explorer
Among the EU15 countries, Greece has the lowest female employment rate (39.9 %)
as well as the lowest share of part-time among workers (12.7 %). Other
Mediterranean countries (Spain, Malta and Italy) have a higher share of female part-
time and employment rates, but still below the European average.
However, part-time work does not always have a positive effect on female
participation in the labour market. Under particular conditions, part-time jobs may
have also negative effects on hourly earnings, training, career prospects, job security
and on the access to unemployment insurance (Del Boca et al., 2003; OECD, 2011).
EU27 EU15
BE BG CZ
DK DE EE
IE
EL
ES
FR
HR IT
CY
LV LT
LU
HU
MT
NL AT
SK
PT
RO
SI
PL
FI
SE
UK
IS
NO CH
MK
20
30
40
50
60
70
80
0 10 20 30 40 50 60 70 80
Fem
ale
em
plo
ym
ent
rate
(1
5 t
o 6
4 y
ears
)
Female part-time workers as in % of total employment
European Commission
Study on the effects and incidence of labour taxation
May 2015 | 116
Part-time jobs tend to be more frequent in low-qualified occupations (Del Boca et al.,
2003), often leading to very fragile work positions especially for young women
(Addabbo et al., 2015), and if part-time workers living in families with low disposable
incomes have high probabilities to leave the labour market (OECD, 2011).
Bardasi and Gornick (2008), investigating the wage gaps between part-time and full-
time women workers in six OECD countries (Canada, Germany, Italy, Sweden, the UK
and the US) in the mid-1990s, find the existence of a part-time wage penalty among
women in all countries except Sweden. For their analysis the authors use comparable
micro-data from the Luxembourg Income Study (LIS). According to Bardasi and
Gornick (2008) there are several factors that lead to expect part-time pay penalties:
unadjusted wage differentials that favour full-time workers, because full-time work
may be seen as a signal of higher levels of human capital; the existence of a pay gap
between full-time and part-time workers that depends on unobserved characteristics
(for example, the attention level). Generally women with a part-time employment are
presumed to be less productive on the job because their energy and attention are
divided between employment and caregiving. The results of their analysis across
countries reveal that the highest wage gaps between part- and full-time workers are
found in the US (18 % in less for part-time workers) and in Italy (15 %), while
Canada and Germany stay close the average values (8-9 %). Moreover, while the UK
difference is not statistically significant, the Swedish wage gap is even positive
(+2.8 %).
Matteazzi et al. (2012) compare Austria, Italy, Poland and the UK in the EU-SILC data
for the year 2009 and conclude that different profiles of female participation and part-
time employment can be observed within Europe. The statistics analysed show that
the largest full-time/part-time wage differentials, in percentage terms, are found in
the United Kingdom and Poland where, on average, a full-time worker earns about
15 % more than a part-time one, while the wage gap is significantly smaller in Austria
(8.9 %) and Italy (10.3 %). In conclusion of their study, Matteazzi et al. (2012)
divided the four countries under examination into two groups: in Austria and the UK
part-time employment is widespread, while in Italy and Poland it is still rare and
underdeveloped. Nevertheless, within both of these groups, there is heterogeneity in
the entity of the wage gap.
4.3. Summary
This section reviewed the literature on the broader economic environment affecting
the incidence of labour taxation. Among the wage settings institutions the role of wage
bargaining is once more stressed, with a more centralised bargaining resulting in more
incidence on workers than bargaining at the industry level. Furthermore minimum
wages will affect the labour market outcome. In case they are binding the incidence
result is clear, with the incidence fully falling on the employers. However, even in the
case of non-binding minimum wages the literature suggests that they contribute to
labour tax induced employment problems.
Theoretical results suggest that the progressivity of the personal income tax affects
the labour market outcome in the presence of matching inefficiencies. For a given tax
burden a more progressive tax system will reduce the search effort of unemployed
people because a higher part of the additional match-specific rent will be tax away.

European Commission
Study on the effects and incidence of labour taxation
May 2015 | 117
Similarly the incentive to pay efficiency wages above the market clearing wage rate is
reduced in progressive tax system. Despite the lack of conclusive evidence for these
theories so far, we therefore will also include progressivity measures in our framework
of indicators.
A review of the impact of welfare state on labour supply stresses the importance of
measures of unemployment or participation trap. The withdrawal of cash benefits or
transfers in-kind can create adverse incentive problems which can translate into
employment problems through the labour supply side. Another important aspect
affecting especially female labour supply is the availability of part-time work and
possibility of parental or maternity leave.
European Commission
Study on the effects and incidence of labour taxation
May 2015 | 118
5. Framework with indicators to identify the role of labour taxation in causing and solving employment problems
This section aims to unify the findings of the study so far and embed them in a
framework, which allows identifying the scope of labour taxation reforms to improve
the labour market outcomes in the different Member States. We will develop a number
of indicators, which will break down the question of how effective tax measures are to
solve employment problems into components.
The first set of indicators aims to identify the extent of the unemployment, non- or
underemployment and whether these are mainly structural in nature or whether these
can be traced back to business cycle reasons. The second set of indicators sheds some
light on the tax structure and the public finance situation in the Member States and
therefore evaluates the potential role of labour taxation in causing or solving
employment problems. The third set of indicators tackles the question what will affect
the incidence of labour taxation.
Before we set out to derive a framework of indicators, we take a step back and
highlight the value-added and the limitations of indicators in the next subsection. To
this end we will have a closer look at the Lisbon Methodology Working Group (LIME)
assessment framework (LAF) as it is developed by the European Commission (2008).
Where appropriate we will also consider the comparison to the simple averages and to
best practice examples additionally to the LAF.
5.1. Value-added and limitations of indicators
The LAF is very prominent analytical tool to systematically compare the GDP growth
performance and 20 policy areas affecting growth in the individual Member States to a
benchmark. The heart of the LAF is a standardised continuous score system where the
score of each indicator is defined as
Score=[(Indicator-EU15 average)/Standard deviation]*10
with a cap at 3 standard deviations.80 However, as the European Commission (2008)
very clearly pointed out it is neither a rule nor is it free from caveats or limitations. In
the following we briefly summarise the main benefits and drawbacks already
mentioned by the European Commission, and add a few additional limitations in the
context of this study and how we aim to circumvent these.
5.1.1. Key benefits and value-added of LAF
The most obvious advantages of the LAF are the systematic approach and its
transparency. Given the clear documentation and the simple formula used there is a
straightforward answer provided to the question which in growth relevant aspect
Member States under- or over-perform. Additionally the framework is flexible in two
key aspects. First it is easily possible to introduce additional policy areas or to replace
current policy areas with more fitting ones. And secondly the transparent list of
qualification reasons can be expanded to cover extraordinary circumstances for
80 See also European Commission (2008) for a description and discussion of the methodology.
European Commission
Study on the effects and incidence of labour taxation
May 2015 | 119
particular circumstances in Member States. In sum, the LAF can be very useful to
identify policy areas to enhance the growth potential in the Member States, but only if
one bears in mind a number of limitations as the next subsection will show.
5.1.2. Main limitations and caveats of LAF
Following the European Commission (2008) we start with the limitation of the LAF
which were already pointed out by the developers themselves. A lot of this critique is
not specific to the LAF, but rather general in nature. First and foremost, the
framework of indicators is showing a correlation and does not provide any
information about causality. This limitation will also apply to the framework of
indicators developed in this study. To say anything about causality one would either
have to find exogenous variation in indicators or make strong (most likely non-
testable) theoretical assumptions. Since this is beyond the scope of this study, the
limitation of non-causal interpretation is also applicable for all our indicators.
Secondly a very general limitation of LAF is the problem of inevitable time lags, which
will result in many indicators used in the LAF not reflecting the impact of recently
adopted reforms. This problem exists for very data-based indicator and highlights
potential a trade-off between more recent data and more reliable data. For complex
information like GDP and corresponding growth rates, output gaps, tax revenues and
public expenditures there is likely to be a bigger chance of revision if the Member
States need to provide the necessary information at short notice. This problem is even
more pronounced if major reforms have been implemented. The provision of very
recent data is then often only possible with a prediction of the impact of the reforms.
Hence relevant reforms contribute to the trade-off between timeliness of the data and
reliability.
A further caveat is the level of aggregation. Again, this is a very general limitation
which not only applies to the LAF. Similar to the timeliness, there is a clear trade-off
between data availability and comparability and the level of aggregation. The more
disaggregated the data is used, the better the actual situation in the Member States is
represented. At the same time the more disaggregated the individual indicators
become, the less comparable they will get across the Member States. In consequence
one needs to strike a balance between comparability and availability and level of detail
to make comparisons amongst all Member States.
An additional issue may arise when two sets of indicators are to be interpreted
together because of spill overs or complementarities between them. If the level of
the score in one particular indicator depends either directly (in some instances even
mechanically) or indirectly through a third latent variable on the score of another
indicator the isolated interpretation of this indicator can be misleading. A prominent
example is the youth unemployment rate which is strongly dependent on the labour
force participation of the young population. If a large fraction of the youth is still in
education, this can drive up the youth unemployment rate and therefore lead to wrong
conclusions.
Two further aspects of (potential) limitations are pointed out by the European
Commission (2008). The first one is the fact that LAF is not covering all relevant
aspects of policies which might be growth relevant and the second one is the fact that
no relative importance can be assigned to the individual indicators. These are again
European Commission
Study on the effects and incidence of labour taxation
May 2015 | 120
very general aspects which are not met by any set of indicators and therefore also
apply to any indicators put forward in this study.
More importantly there are some aspects of the LAF framework, which are clearly
limitations and are not fully addressed in European Commission (2008) and relevant
for the framework of indicators in this study. The first one is the fact that the main
benchmark in the LAF is the average of the EU15 countries. By fixing this
benchmark a lot of weight is given to the value of the large Member States like France
and Germany. The LAF does somehow acknowledge this by allowing a qualification
rule if the average is not ambitious enough, but there is no clear discussion of the role
of the big countries in the average.81
Furthermore the comparison to an average does not necessarily provide the correct
answers if the indicator has a non-linear impact of the outcome in question. This
could create a simple under- or overestimation of the relevance of the indicator if the
relationship is not monotonous but progressive/regressive. Or in the case of a non-
monotonous impact the result could be meaningless. To provide an example in our
context, take the degree of centralisation in the bargaining process. If intermediate
levels of centralisation, i.e. bargaining at the industry level, are associated with the
biggest share of incidence on the employers a comparison to the average level of
centralisation of bargaining will not be very informative.
5.1.3. Dealing with limitations of the LAF
Most of the above mentioned limitations of the LAF are inherent to any data-based
indicators. While this should not allow the potential users of indicators or any
framework of indicators to ignore the limitations, it is little more which can be done,
other than openly discuss the inherent problems. It is noteworthy that the European
Commission (2008) does raise most of the problems themselves, like the trade-off
between timeliness of the data and data availability/quality, the trade-off between the
level of aggregation and data comparability/availability and the impossibility to use the
framework of indicators for causal interference. It is also beyond the scope of this
study to address these issues, but for the last two points of criticism at the LAF, i.e.
the weight of the large countries in the benchmark and potentially non-linear impact,
we want to offer an additional approach to complement the approach of LAF.
Particular aspects we want to address are the complementarities, the potential
weighting problem through using the average of the EU15 as a benchmark and non-
linear relationships. To identify these issues and to make further progress in
understanding the potentially complex relationship between indicators we propose a
simple extension of the LAF framework. We start to plot indicators which are
theoretically linked to each other against each other. Figure 9 sketches the idea. The
simple scatter plot of two indicators can reveal a number of things.
81 The LAF framework has more recently been used with the EU28 as benchmark, which
mitigated, but not solves the problem with the weight of large countries. Additionally the use of averages for ordinal scales or categorical data is not appropriate.
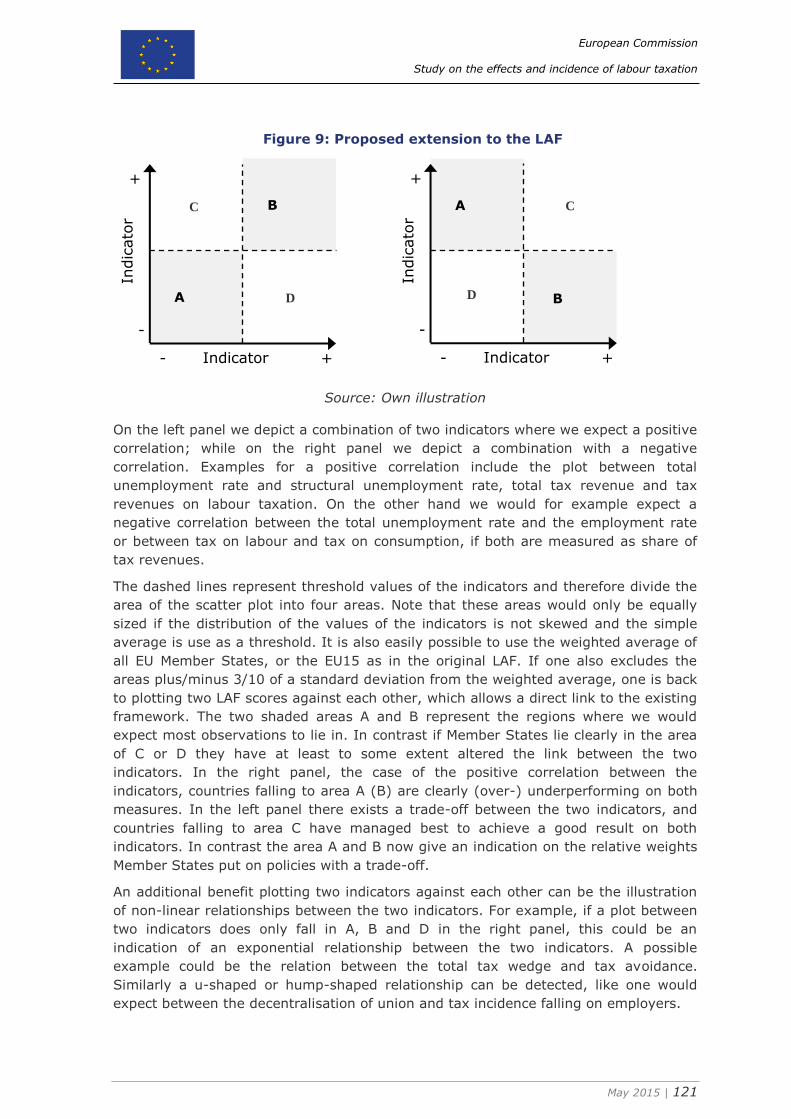
European Commission
Study on the effects and incidence of labour taxation
May 2015 | 121
Figure 9: Proposed extension to the LAF
Source: Own illustration
On the left panel we depict a combination of two indicators where we expect a positive
correlation; while on the right panel we depict a combination with a negative
correlation. Examples for a positive correlation include the plot between total
unemployment rate and structural unemployment rate, total tax revenue and tax
revenues on labour taxation. On the other hand we would for example expect a
negative correlation between the total unemployment rate and the employment rate
or between tax on labour and tax on consumption, if both are measured as share of
tax revenues.
The dashed lines represent threshold values of the indicators and therefore divide the
area of the scatter plot into four areas. Note that these areas would only be equally
sized if the distribution of the values of the indicators is not skewed and the simple
average is use as a threshold. It is also easily possible to use the weighted average of
all EU Member States, or the EU15 as in the original LAF. If one also excludes the
areas plus/minus 3/10 of a standard deviation from the weighted average, one is back
to plotting two LAF scores against each other, which allows a direct link to the existing
framework. The two shaded areas A and B represent the regions where we would
expect most observations to lie in. In contrast if Member States lie clearly in the area
of C or D they have at least to some extent altered the link between the two
indicators. In the right panel, the case of the positive correlation between the
indicators, countries falling to area A (B) are clearly (over-) underperforming on both
measures. In the left panel there exists a trade-off between the two indicators, and
countries falling to area C have managed best to achieve a good result on both
indicators. In contrast the area A and B now give an indication on the relative weights
Member States put on policies with a trade-off.
An additional benefit plotting two indicators against each other can be the illustration
of non-linear relationships between the two indicators. For example, if a plot between
two indicators does only fall in A, B and D in the right panel, this could be an
indication of an exponential relationship between the two indicators. A possible
example could be the relation between the total tax wedge and tax avoidance.
Similarly a u-shaped or hump-shaped relationship can be detected, like one would
expect between the decentralisation of union and tax incidence falling on employers.
B
A
Indicator 1
Indic
ato
r
2
+
+
-
-
B
A
Indicator 1
Indic
ato
r 2
+
+
-
-
C C
D D
European Commission
Study on the effects and incidence of labour taxation
May 2015 | 122
In the following we will illustrate the benefit of the additional graphical analysis
through the plots for some of the indicators aiming to identify employment problems
and the socio-economic groups especially vulnerable to the employment problems. It
is beyond the scope of this study to collect data of sufficient quality for all proposed
indicators and all countries. Therefore and for reasons of space and to keep the length
of this study manageable we abstain from presenting full tables or graphical
representation of all indicators. In this section we present data for the first indicator
groups, but limit the exposition to the latest year available. This could easily be an
extreme value; hence it is advisable to also consider the recent changes in the
individual indicators, to see the historical path leading to current outcome. To further
illustrate this section 6 will go further and work out more of the framework for a
number of countries.
5.2. Indicators group 1: Identification of employment problems
The results of the indicators in this first group set the background and clarify how big
the need for labour market improving tax reforms is. Building on the short discussion
in section 2.1 we start with the distinction of different employment problems. After
establishing a broad overview of the general situation of the employment problems in
the Member States the indicators go one step further to identify the situation in the
various groups of vulnerable persons, namely women, the youth, the elderly, migrants
and persons with low levels of education. The third aspect in this first indicators group
is to highlights mismatches between labour supply and demand as non-tax factors
influencing structural unemployment.
5.2.1. Group 1a: Unemployment, non-employment and structural
unemployment
Obvious starting point for the identification of employment problems is the level of the
unemployment rate. Following the discussion about the non- and underemployment
in section 2.1 simply looking at the unemployment rate would fall short of capturing
the full extent of the employment problems. Consequently the second indicator we
propose to use is the participation rate to capture the share of the population which
stays outside the workforce. Also along the crude distinction we propose in section 2.1
the differences between unemployment and non-employment can already hint at the
employment problem being more on the labour demand side if both the
unemployment rate and the participation rate are high. Put differently, if the
participation rate is low, the employment problem is more likely also due to labour
supply problems.
Furthermore, since the recent recession has had an important influence on the cyclical
part of unemployment the third indicator in this group is the NAWRU, aiming to
describe the level of structural unemployment. While the discussion in Box 2 highlights
that the NAWRU is only an approximate measure of structural unemployment, the
difference between the unemployment rate and the NAWRU will give at least an
indication how much of the unemployment is due to cyclical reasons. The bigger the
difference between the two concepts of the unemployment rate the more is the
employment problem due to an indirect labour demand problem because of a lack of
aggregate demand.
European Commission
Study on the effects and incidence of labour taxation
May 2015 | 123
Box 2: On NAWRU as a measure of structural unemployment
For this first group of indicators Table 9 shows both the values and the corresponding
scores calculated according to the LAF.82 The three indicators aim to pin down where
the overall employment problems are most pronounced. Starting with the
unemployment rate the countries already discussed in the introduction (Greece, Spain,
Portugal and Croatia) emerge as those with the biggest employment problems.83
The participation rate reveals different countries with employment problems. Simply
looking at the LAF score the countries which are identified as having a low
participation rate include Croatia, Hungary, Italy, Malta and Romania. While at this
stage the underlying causes for the differences in the participation rate are not clear,
it seems natural to go beyond the overall participation rate and evaluate the
participation rate for the identified vulnerable groups. This will be done in the next
subsection.
Before turning to the vulnerable groups, Table 9 also reports a measure of structural
unemployment. The idea behind the use of NAWRU is to filter out unemployment
which is driven by cyclical factors. However a closer look at the values and LAF scores
for the NAWRU already points at the very close relationship to the actual
unemployment rate. The countries with the highest structural unemployment are
again Greece, Spain and Croatia.
82 We deviate somewhat from the original calculation, since we use the average of the EU 28
countries as benchmark. 83 We calculate the unemployment rate for the active population in working age, defined as 20
to 64 years.
The concept of NAWRU to measure the structural unemployment is controversial.
The European Commission (2013c) investigates the concept of the NAWRU
further and finds that this measure indeed includes significant cyclical variation.
If the real wages only adjust slowly to large cyclical shocks the labour demand
will be cyclical in nature and the NAWRU consequently will contain a cyclical
component. To gain further understanding of the extent of the cyclical part in the
NAWRU the analysis of the European Commission (2013c) predicts the NAWRU
only on structural features (labour market institutions, tax wedge etc.) of the
individual Member States. The result show that this predicted part of the NAWRU
is markedly lower in most Member States. In particular the difference is most
pronounced for some southern countries like Spain, Portugal and Greece where
the aggregate demand shock was very large. However, since there is no
comprehensive data for structural unemployment available, the first set of
indicators still relies on the NAWRU. A further reason for not relying on a
measure derived from estimations based on institutional features is that this
measure will be endogenous to the question we aim to address in this study.
Therefore, in the absence of a better measure of structural unemployment, we
have to rely on the NAWRU and the caveat, that this measure may still contain a
significant share of cyclical variation needs to be borne in mind.
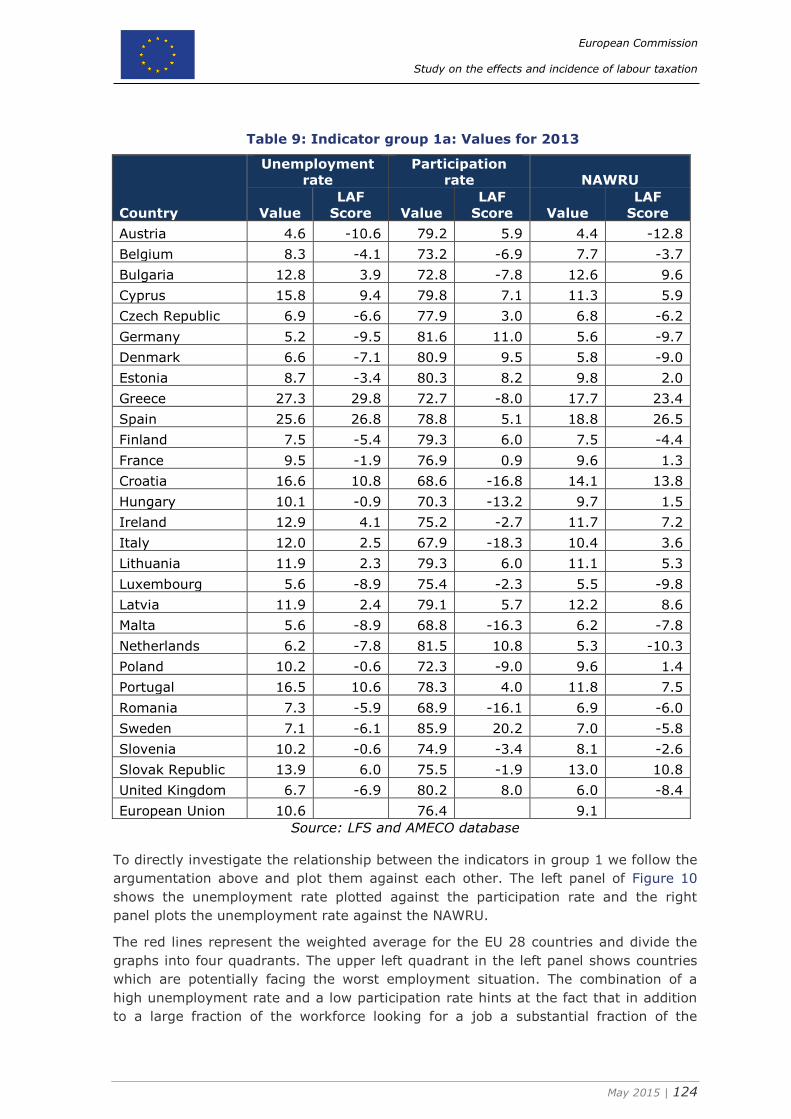
European Commission
Study on the effects and incidence of labour taxation
May 2015 | 124
Table 9: Indicator group 1a: Values for 2013
Country
Unemployment
rate
Participation
rate NAWRU
Value
LAF
Score Value
LAF
Score Value
LAF
Score
Austria 4.6 -10.6 79.2 5.9 4.4 -12.8
Belgium 8.3 -4.1 73.2 -6.9 7.7 -3.7
Bulgaria 12.8 3.9 72.8 -7.8 12.6 9.6
Cyprus 15.8 9.4 79.8 7.1 11.3 5.9
Czech Republic 6.9 -6.6 77.9 3.0 6.8 -6.2
Germany 5.2 -9.5 81.6 11.0 5.6 -9.7
Denmark 6.6 -7.1 80.9 9.5 5.8 -9.0
Estonia 8.7 -3.4 80.3 8.2 9.8 2.0
Greece 27.3 29.8 72.7 -8.0 17.7 23.4
Spain 25.6 26.8 78.8 5.1 18.8 26.5
Finland 7.5 -5.4 79.3 6.0 7.5 -4.4
France 9.5 -1.9 76.9 0.9 9.6 1.3
Croatia 16.6 10.8 68.6 -16.8 14.1 13.8
Hungary 10.1 -0.9 70.3 -13.2 9.7 1.5
Ireland 12.9 4.1 75.2 -2.7 11.7 7.2
Italy 12.0 2.5 67.9 -18.3 10.4 3.6
Lithuania 11.9 2.3 79.3 6.0 11.1 5.3
Luxembourg 5.6 -8.9 75.4 -2.3 5.5 -9.8
Latvia 11.9 2.4 79.1 5.7 12.2 8.6
Malta 5.6 -8.9 68.8 -16.3 6.2 -7.8
Netherlands 6.2 -7.8 81.5 10.8 5.3 -10.3
Poland 10.2 -0.6 72.3 -9.0 9.6 1.4
Portugal 16.5 10.6 78.3 4.0 11.8 7.5
Romania 7.3 -5.9 68.9 -16.1 6.9 -6.0
Sweden 7.1 -6.1 85.9 20.2 7.0 -5.8
Slovenia 10.2 -0.6 74.9 -3.4 8.1 -2.6
Slovak Republic 13.9 6.0 75.5 -1.9 13.0 10.8
United Kingdom 6.7 -6.9 80.2 8.0 6.0 -8.4
European Union 10.6
76.4
9.1
Source: LFS and AMECO database
To directly investigate the relationship between the indicators in group 1 we follow the
argumentation above and plot them against each other. The left panel of Figure 10
shows the unemployment rate plotted against the participation rate and the right
panel plots the unemployment rate against the NAWRU.
The red lines represent the weighted average for the EU 28 countries and divide the
graphs into four quadrants. The upper left quadrant in the left panel shows countries
which are potentially facing the worst employment situation. The combination of a
high unemployment rate and a low participation rate hints at the fact that in addition
to a large fraction of the workforce looking for a job a substantial fraction of the
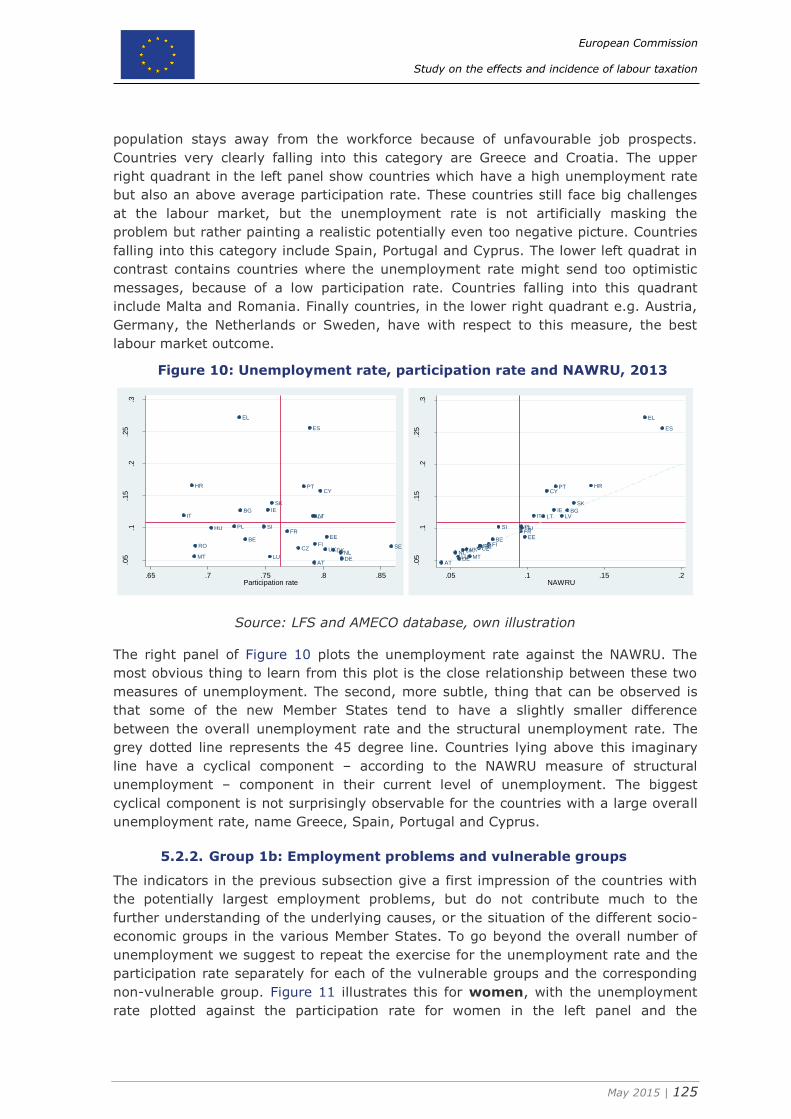
European Commission
Study on the effects and incidence of labour taxation
May 2015 | 125
population stays away from the workforce because of unfavourable job prospects.
Countries very clearly falling into this category are Greece and Croatia. The upper
right quadrant in the left panel show countries which have a high unemployment rate
but also an above average participation rate. These countries still face big challenges
at the labour market, but the unemployment rate is not artificially masking the
problem but rather painting a realistic potentially even too negative picture. Countries
falling into this category include Spain, Portugal and Cyprus. The lower left quadrat in
contrast contains countries where the unemployment rate might send too optimistic
messages, because of a low participation rate. Countries falling into this quadrant
include Malta and Romania. Finally countries, in the lower right quadrant e.g. Austria,
Germany, the Netherlands or Sweden, have with respect to this measure, the best
labour market outcome.
Figure 10: Unemployment rate, participation rate and NAWRU, 2013
Source: LFS and AMECO database, own illustration
The right panel of Figure 10 plots the unemployment rate against the NAWRU. The
most obvious thing to learn from this plot is the close relationship between these two
measures of unemployment. The second, more subtle, thing that can be observed is
that some of the new Member States tend to have a slightly smaller difference
between the overall unemployment rate and the structural unemployment rate. The
grey dotted line represents the 45 degree line. Countries lying above this imaginary
line have a cyclical component – according to the NAWRU measure of structural
unemployment – component in their current level of unemployment. The biggest
cyclical component is not surprisingly observable for the countries with a large overall
unemployment rate, name Greece, Spain, Portugal and Cyprus.
5.2.2. Group 1b: Employment problems and vulnerable groups
The indicators in the previous subsection give a first impression of the countries with
the potentially largest employment problems, but do not contribute much to the
further understanding of the underlying causes, or the situation of the different socio-
economic groups in the various Member States. To go beyond the overall number of
unemployment we suggest to repeat the exercise for the unemployment rate and the
participation rate separately for each of the vulnerable groups and the corresponding
non-vulnerable group. Figure 11 illustrates this for women, with the unemployment
rate plotted against the participation rate for women in the left panel and the
AT
BE
BG
CY
CZ
DE
DK
EE
EL
ES
FI
FR
HR
HU
IEIT LT
LU
LV
MTNL
PL
PT
RO SE
SI
SK
UK
.05
.1.1
5.2
.25
.3
Une
mplo
ym
ent ra
te
.65 .7 .75 .8 .85Participation rate
AT
BE
BG
CY
CZ
DE
DK
EE
EL
ES
FI
FR
HR
HU
IEIT LT
LU
LV
MTNL
PL
PT
ROSE
SI
SK
UK
.05
.1.1
5.2
.25
.3
Une
mplo
ym
ent ra
te
.05 .1 .15 .2NAWRU
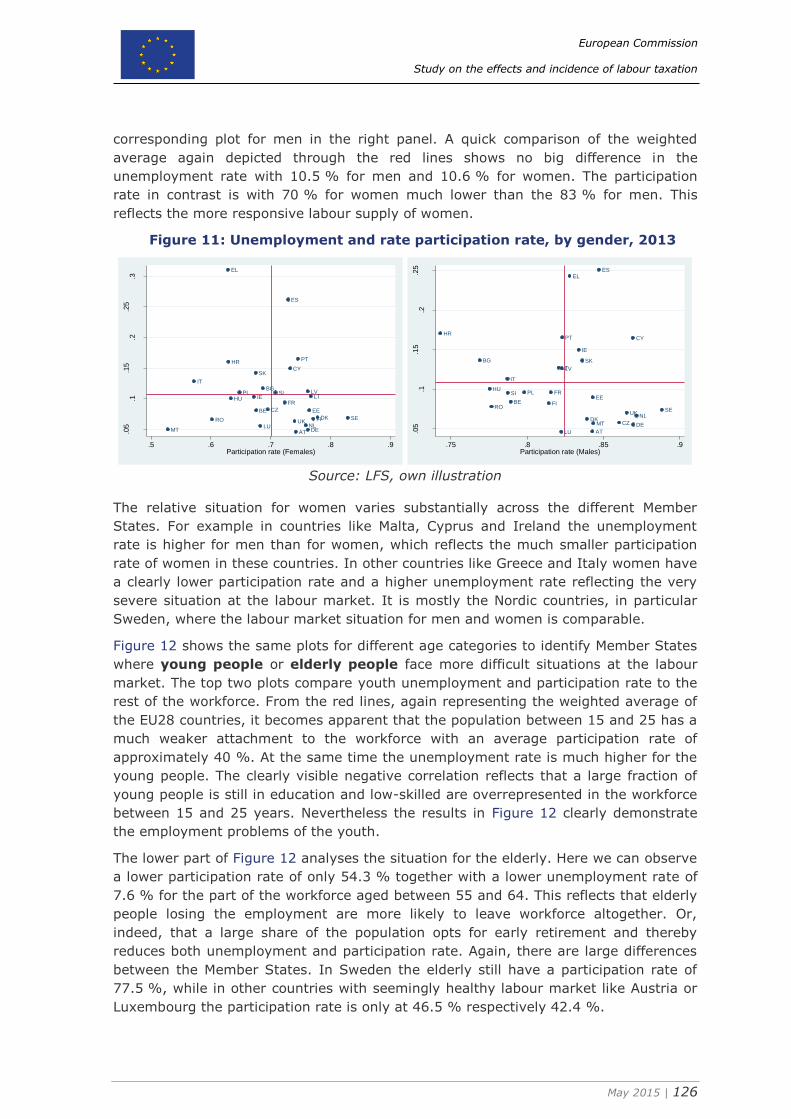
European Commission
Study on the effects and incidence of labour taxation
May 2015 | 126
corresponding plot for men in the right panel. A quick comparison of the weighted
average again depicted through the red lines shows no big difference in the
unemployment rate with 10.5 % for men and 10.6 % for women. The participation
rate in contrast is with 70 % for women much lower than the 83 % for men. This
reflects the more responsive labour supply of women.
Figure 11: Unemployment and rate participation rate, by gender, 2013
Source: LFS, own illustration
The relative situation for women varies substantially across the different Member
States. For example in countries like Malta, Cyprus and Ireland the unemployment
rate is higher for men than for women, which reflects the much smaller participation
rate of women in these countries. In other countries like Greece and Italy women have
a clearly lower participation rate and a higher unemployment rate reflecting the very
severe situation at the labour market. It is mostly the Nordic countries, in particular
Sweden, where the labour market situation for men and women is comparable.
Figure 12 shows the same plots for different age categories to identify Member States
where young people or elderly people face more difficult situations at the labour
market. The top two plots compare youth unemployment and participation rate to the
rest of the workforce. From the red lines, again representing the weighted average of
the EU28 countries, it becomes apparent that the population between 15 and 25 has a
much weaker attachment to the workforce with an average participation rate of
approximately 40 %. At the same time the unemployment rate is much higher for the
young people. The clearly visible negative correlation reflects that a large fraction of
young people is still in education and low-skilled are overrepresented in the workforce
between 15 and 25 years. Nevertheless the results in Figure 12 clearly demonstrate
the employment problems of the youth.
The lower part of Figure 12 analyses the situation for the elderly. Here we can observe
a lower participation rate of only 54.3 % together with a lower unemployment rate of
7.6 % for the part of the workforce aged between 55 and 64. This reflects that elderly
people losing the employment are more likely to leave workforce altogether. Or,
indeed, that a large share of the population opts for early retirement and thereby
reduces both unemployment and participation rate. Again, there are large differences
between the Member States. In Sweden the elderly still have a participation rate of
77.5 %, while in other countries with seemingly healthy labour market like Austria or
Luxembourg the participation rate is only at 46.5 % respectively 42.4 %.
AT
BE
BG
CY
CZ
DE
DK
EE
EL
ES
FI
FR
HR
HU IE
IT
LT
LU
LV
MTNL
PL
PT
RO SE
SI
SK
UK
.05
.1.1
5.2
.25
.3
Une
mplo
ym
ent ra
te (
Fe
male
s)
.5 .6 .7 .8 .9Participation rate (Females)
AT
BE
BG
CY
CZ DEDK
EE
ELES
FI
FR
HR
HU
IE
IT
LT
LU
LV
MT
NL
PL
PT
ROSE
SI
SK
UK.0
5.1
.15
.2.2
5
Une
mplo
ym
ent ra
te (
Male
s)
.75 .8 .85 .9Participation rate (Males)
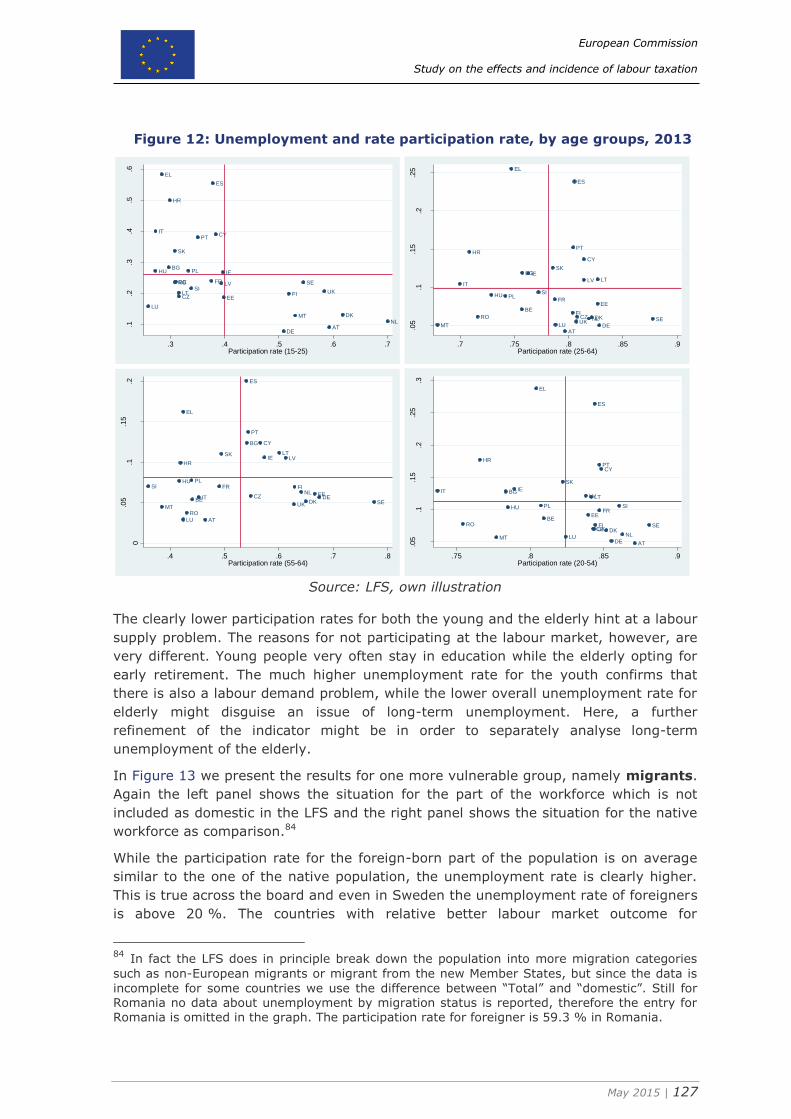
European Commission
Study on the effects and incidence of labour taxation
May 2015 | 127
Figure 12: Unemployment and rate participation rate, by age groups, 2013
Source: LFS, own illustration
The clearly lower participation rates for both the young and the elderly hint at a labour
supply problem. The reasons for not participating at the labour market, however, are
very different. Young people very often stay in education while the elderly opting for
early retirement. The much higher unemployment rate for the youth confirms that
there is also a labour demand problem, while the lower overall unemployment rate for
elderly might disguise an issue of long-term unemployment. Here, a further
refinement of the indicator might be in order to separately analyse long-term
unemployment of the elderly.
In Figure 13 we present the results for one more vulnerable group, namely migrants.
Again the left panel shows the situation for the part of the workforce which is not
included as domestic in the LFS and the right panel shows the situation for the native
workforce as comparison.84
While the participation rate for the foreign-born part of the population is on average
similar to the one of the native population, the unemployment rate is clearly higher.
This is true across the board and even in Sweden the unemployment rate of foreigners
is above 20 %. The countries with relative better labour market outcome for
84 In fact the LFS does in principle break down the population into more migration categories
such as non-European migrants or migrant from the new Member States, but since the data is
incomplete for some countries we use the difference between “Total” and “domestic”. Still for Romania no data about unemployment by migration status is reported, therefore the entry for Romania is omitted in the graph. The participation rate for foreigner is 59.3 % in Romania.
AT
BE
BG
HR
CY
CZ
DK
EEFI
FR
DE
EL
HU IE
IT
LV
LT
LU
MTNL
PL
PT
RO
SK
SI
ES
SE
UK
.1.2
.3.4
.5.6
Une
mplo
ym
ent ra
te (
15
-25
)
.3 .4 .5 .6 .7Participation rate (15-25)
AT
BE
BG
HR
CY
CZ DK
EE
FI
FR
DE
EL
HU
IE
ITLV LT
LUMTNL
PL
PT
RO
SK
SI
ES
SEUK
.05
.1.1
5.2
.25
Une
mplo
ym
ent ra
te (
25
-64
)
.7 .75 .8 .85 .9Participation rate (25-64)
AT
BE
BG
HR
CY
CZDK
EE
FIFR
DE
EL
HU
IE
IT
LVLT
LU
MT
NL
PL
PT
RO
SK
SI
ES
SEUK
0
.05
.1.1
5.2
Une
mplo
ym
ent ra
te (
55
-64
)
.4 .5 .6 .7 .8Participation rate (55-64)
AT
BE
BG
HR
CY
CZ DK
EE
FI
FR
DE
EL
HU
IEITLVLT
LUMTNL
PL
PT
RO
SK
SI
ES
SEUK
.05
.1.1
5.2
.25
.3
Une
mplo
ym
ent ra
te (
20
-54
)
.75 .8 .85 .9Participation rate (20-54)
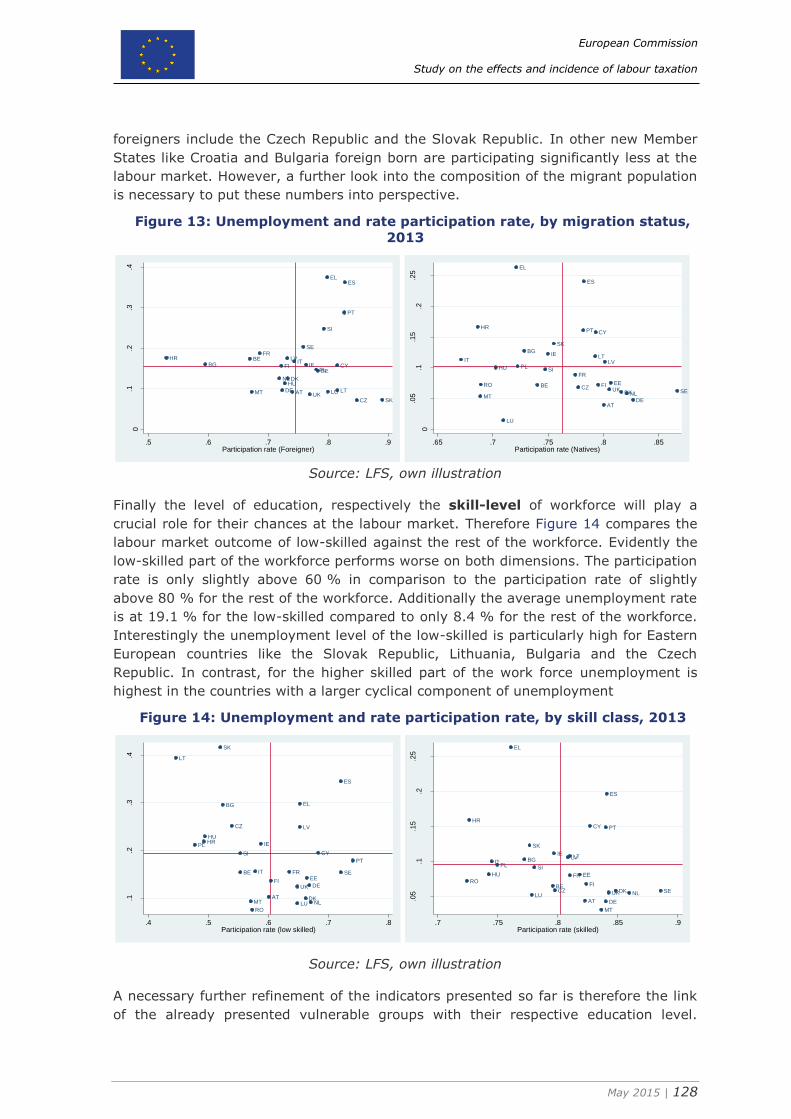
European Commission
Study on the effects and incidence of labour taxation
May 2015 | 128
foreigners include the Czech Republic and the Slovak Republic. In other new Member
States like Croatia and Bulgaria foreign born are participating significantly less at the
labour market. However, a further look into the composition of the migrant population
is necessary to put these numbers into perspective.
Figure 13: Unemployment and rate participation rate, by migration status,
2013
Source: LFS, own illustration
Finally the level of education, respectively the skill-level of workforce will play a
crucial role for their chances at the labour market. Therefore Figure 14 compares the
labour market outcome of low-skilled against the rest of the workforce. Evidently the
low-skilled part of the workforce performs worse on both dimensions. The participation
rate is only slightly above 60 % in comparison to the participation rate of slightly
above 80 % for the rest of the workforce. Additionally the average unemployment rate
is at 19.1 % for the low-skilled compared to only 8.4 % for the rest of the workforce.
Interestingly the unemployment level of the low-skilled is particularly high for Eastern
European countries like the Slovak Republic, Lithuania, Bulgaria and the Czech
Republic. In contrast, for the higher skilled part of the work force unemployment is
highest in the countries with a larger cyclical component of unemployment
Figure 14: Unemployment and rate participation rate, by skill class, 2013
Source: LFS, own illustration
A necessary further refinement of the indicators presented so far is therefore the link
of the already presented vulnerable groups with their respective education level.
AT
BEBG
HR
CY
CZ
DK
EEFI
FR
DE
EL
HU
IEIT
LV
LTLUMT
NL
PL
PT
SK
SI
ES
SE
UK
0.1
.2.3
.4
Une
mplo
ym
ent ra
te (
Fo
reig
ner)
.5 .6 .7 .8 .9Participation rate (Foreigner)
AT
BE
BG
HRCY
CZDK
EEFI
FR
DE
EL
HU
IEIT LV
LT
LU
MTNL
PL
PT
RO
SK
SI
ES
SEUK
0
.05
.1.1
5.2
.25
Une
mplo
ym
ent ra
te (
Na
tives)
.65 .7 .75 .8 .85Participation rate (Natives)
AT
BE
BG
HR
CY
CZ
DK
EEFI
FR
DE
EL
HU
IE
IT
LV
LT
LUMT NL
PL
PT
RO
SK
SI
ES
SE
UK
.1.2
.3.4
Une
mplo
ym
ent ra
te (
low
skill
ed)
.4 .5 .6 .7 .8Participation rate (low skilled)
AT
BE
BG
HRCY
CZ DK
EE
FI
FR
DE
EL
HU
IE
ITLVLT
LU
MT
NL
PL
PT
RO
SK
SI
ES
SEUK
.05
.1.1
5.2
.25
Une
mplo
ym
ent ra
te (
skill
ed)
.7 .75 .8 .85 .9Participation rate (skilled)
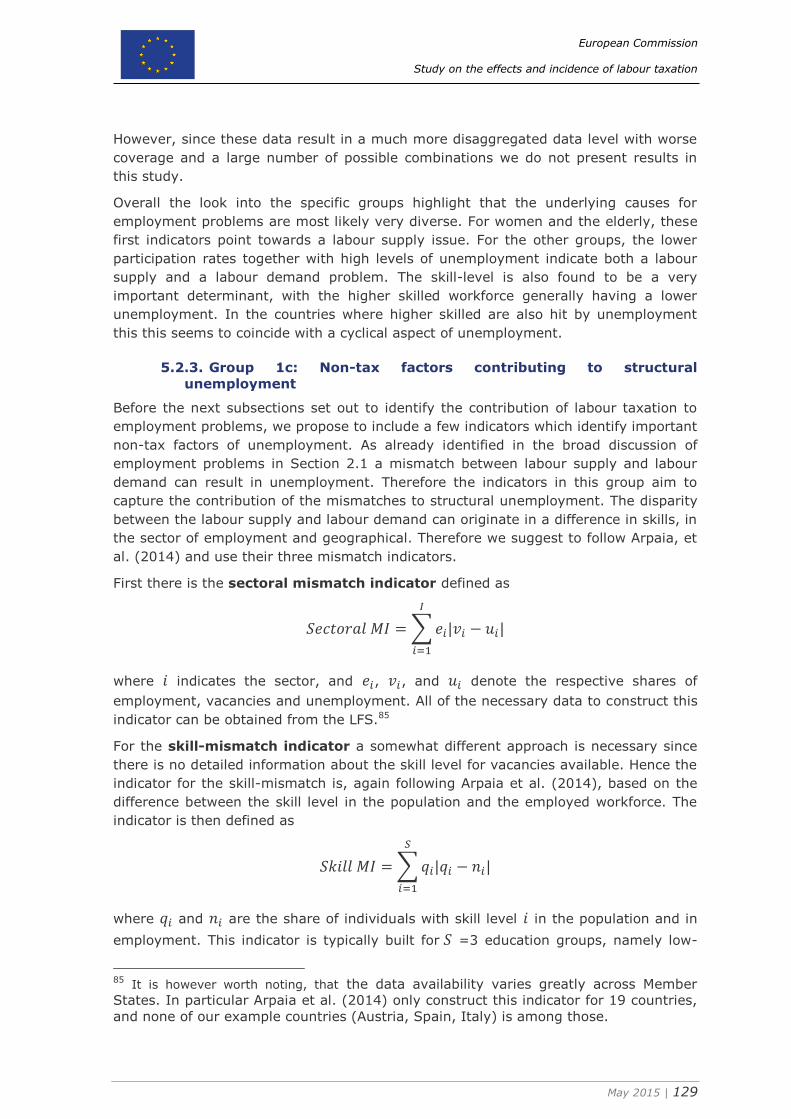
European Commission
Study on the effects and incidence of labour taxation
May 2015 | 129
However, since these data result in a much more disaggregated data level with worse
coverage and a large number of possible combinations we do not present results in
this study.
Overall the look into the specific groups highlight that the underlying causes for
employment problems are most likely very diverse. For women and the elderly, these
first indicators point towards a labour supply issue. For the other groups, the lower
participation rates together with high levels of unemployment indicate both a labour
supply and a labour demand problem. The skill-level is also found to be a very
important determinant, with the higher skilled workforce generally having a lower
unemployment. In the countries where higher skilled are also hit by unemployment
this this seems to coincide with a cyclical aspect of unemployment.
5.2.3. Group 1c: Non-tax factors contributing to structural
unemployment
Before the next subsections set out to identify the contribution of labour taxation to
employment problems, we propose to include a few indicators which identify important
non-tax factors of unemployment. As already identified in the broad discussion of
employment problems in Section 2.1 a mismatch between labour supply and labour
demand can result in unemployment. Therefore the indicators in this group aim to
capture the contribution of the mismatches to structural unemployment. The disparity
between the labour supply and labour demand can originate in a difference in skills, in
the sector of employment and geographical. Therefore we suggest to follow Arpaia, et
al. (2014) and use their three mismatch indicators.
First there is the sectoral mismatch indicator defined as
𝑆𝑒𝑐𝑡𝑜𝑟𝑎𝑙 𝑀𝐼 = ∑ 𝑒𝑖|𝑣𝑖 − 𝑢𝑖|
𝐼
𝑖=1
where 𝑖 indicates the sector, and 𝑒𝑖, 𝑣𝑖, and 𝑢𝑖 denote the respective shares of
employment, vacancies and unemployment. All of the necessary data to construct this
indicator can be obtained from the LFS.85
For the skill-mismatch indicator a somewhat different approach is necessary since
there is no detailed information about the skill level for vacancies available. Hence the
indicator for the skill-mismatch is, again following Arpaia et al. (2014), based on the
difference between the skill level in the population and the employed workforce. The
indicator is then defined as
𝑆𝑘𝑖𝑙𝑙 𝑀𝐼 = ∑ 𝑞𝑖|𝑞𝑖 − 𝑛𝑖|
𝑆
𝑖=1
where 𝑞𝑖 and 𝑛𝑖 are the share of individuals with skill level 𝑖 in the population and in
employment. This indicator is typically built for 𝑆 =3 education groups, namely low-
85 It is however worth noting, that the data availability varies greatly across Member
States. In particular Arpaia et al. (2014) only construct this indicator for 19 countries,
and none of our example countries (Austria, Spain, Italy) is among those.
European Commission
Study on the effects and incidence of labour taxation
May 2015 | 130
skilled, which are defined as having only pre-primary, primary or lower secondary
education (ISCED levels 0-2), medium-skilled with upper secondary and post-
secondary non-tertiary education (ISCED levels 3 and 4) and high-skilled with tertiary
education (ISCED levels 5 and 6). The data is again available from the LFS.
The third mismatch indicator aims at geographical mismatches between the labour
supply and labour demand. This regional mismatch indicator is defined as
𝑅𝑒𝑔𝑖𝑜𝑛𝑎𝑙 𝑀𝐼 =√∑ (𝑢𝑖 − �̅�𝑖)2𝑅
𝑖=1
∑ 𝑢𝑖𝑅𝑖=1 /𝑅
where 𝑢𝑖 describes the unemployment in region 𝑖 and �̅�𝑖 the average unemployment
over all regions 𝑅. Data for regional unemployment rates at the NUTS 3 level is again
available from the LFS.
To learn more about the origins of the mismatch between labour supply and demand
two more sets of indicators can be useful. First the mismatch can originate more from
the labour demand side, which will be reflected in changes in vacancies and
employment. Secondly the mismatch can result from the labour supply side if the
characteristics of the population and consequently the workforce change due to socio-
demographic trends.
Therefore the three mismatch indicators are complemented through adding
corresponding indicators measuring the change in employments.86 For a sectoral
employment change index one can define
𝑆𝑒𝑐𝑡𝑜𝑟𝑎𝑙 𝑒𝑚𝑝𝑙𝑜𝑦𝑚𝑒𝑛𝑡 𝐶𝐼 = ∑ |𝑛𝑖𝑡
𝑁𝑡−
𝑛𝑖𝑡−𝑠
𝑁𝑡−𝑠|
𝐼
𝑖=1
where 𝑛𝑖𝑡 denotes the employment in sector 𝑖 in time 𝑡 and 𝑁𝑡 is the total
employment. Correspondingly the 𝑛𝑖𝑡−𝑠 and 𝑁𝑡−𝑠 describe the situation 𝑠 periods
before. This indicator gives a broad idea of shifts in the relative employment in the
sectors. The higher the value in this indicator is, the higher is the pressure on the
workforce to adopt to avoid unemployment. Following the exact same logic one can
derive corresponding employment change indicators for skill-levels and regions.
To capture changes in the labour supply side a corresponding measure of changes in
the socioeconomic characteristics of the population can be derived. Specifically the
indicator for change in skill-levels in the workforce can be defined as
𝑆𝑘𝑖𝑙𝑙 𝑐𝑜𝑚𝑝𝑜𝑠𝑖𝑡𝑖𝑜𝑛 𝐶𝐼 = ∑ |𝑙𝑖𝑡
𝐿𝑡−
𝑙𝑖𝑡−𝑠
𝐿𝑡−𝑠|
𝑆
𝑖=1
where 𝑙𝑖𝑡 denotes the workforce in skill category 𝑖 in time 𝑡 and 𝐿𝑡 is the total
workforce. It is noteworthy that this change indicator is expected to change slower
86 If available, disaggregated information about vacancies would be even more suitable.
However, to have some consistence we propose to use employment information which is sufficiently available at this level of disaggregation.
European Commission
Study on the effects and incidence of labour taxation
May 2015 | 131
than the employment change indicators above, therefore the length of the period 𝑠
could be adjusted accordingly. Two additional workforce composition indicators which
can provide useful insights are the age categories and the migrations status.
As a last step in this group of indicators we propose again to graphically analyse the
relationship between the change and the mismatch indicators. In combination these
indicators can give an indication about the extent of unemployment which is due to
shifts in labour demand or labour supply and resulting mismatches in the labour
market. Appendix Table 2 lists the values for some of the mismatch and change
indicators. Apart from a few outliers, which include a large sectoral change in Hungary
and a substantial skill mismatch in Malta the results show that there is a relatively
strong regional variation in unemployment in Austria, Italy and Romania. The sectoral
shifts seem to play a role in Spain, Ireland, Poland and Greece. This is, however, only
a static view in one particular year, that’s why will look at the change over time in the
worked out examples in section 6.
5.3. Indicators group 2: Potential approaches for labour tax
reforms
Indicators in group 2 will shed more light on how a reform of labour related taxes
could look like. To this end the first set of indicators in group 2 follow the reasoning in
Wöhlbier et al, (2014) and first identify fiscal challenges and the availability of “tax
space”. The second part of the indicators investigates the structure of the tax burden
and thereby identifies the scope and need of labour tax reforms.
5.3.1. Group 2a: Fiscal challenges and tax space
As a first indicator in this category we propose to measure the fiscal challenges
through the use of general government debt as share of GDP and the net
lending of general government as share of GDP. Both of these indicators are
available from the AMECO database, which is the main advantage of these indicators
over the composite fiscal sustainability indicators as developed in Berti et al. (2012).
The composite indicator does necessarily come with a longer time lag because of the
greater data and computational requirements. In combination debt level and the
deficit give an impression of the fiscal challenges of the Member States. Countries with
high levels in both indicators will have to find a way to finance an eventual cut in
labour taxation by either fiscal consolidation or increases in other taxes.
Similar reasoning applies to the second indicator in this group. The tax-to-GDP ratio
aims at measuring the “tax space” for a reduction of labour taxation. In contrast to
Wöhlbier et al. (2014) we see the tax space not as a room for further tax increases,
but rather as space for labour taxation reforms, which reduce the tax burden on
labour. Hence a high value in the tax-to-GDP ratio does primarily indicate that the tax
pressure is high. If the indicators of the fiscal pressure do not show a strong need for
more tax revenues this indicates that there is room for reforms, which reduce the tax
burden on labour. A further explanation and reason why to include this indicator is the
fact that a high tax-to-GDP ratio can contribute to the aggregate demand problem.
Appendix Table 3 list the values for this group of indicators, showing the well-known
fact that Greece, Italy and Portugal face a public debt problem with a debt level of
more than 120 % of GDP. With net lending of more than 5 % of GDP the United
European Commission
Study on the effects and incidence of labour taxation
May 2015 | 132
Kingdom, Spain and Slovenia are not in a position to lower labour taxation without
finding other ways to reduce the deficit. In contrast, Germany and Luxembourg have a
small surplus. The overall tax burden, measured through the tax-to-GDP ratio, is
highest in Austria, Belgium, Denmark, Finland, France, Italy and Sweden with values
clearly above 40 % of GDP. Therefore, in these countries a reduction of the overall tax
burden might be in order.
5.3.2. Group 2b: Overall and labour tax structure
The first indicator in this group is the ratio between the implicit tax rate on
labour and consumption. These implicit tax rates are based on the national
accounts and are regularly published by the European Commission (2014b). The way
the implicit tax rates are constructed is at the same time a benefit and a limitation of
the indicator. On the positive side the very broad nature of this indicator does take
into account all the aspects of taxation on labour respectively consumption. That also
includes taxes which are levied on employers such as employers’ contribution to social
security and further payroll taxes. On the negative side these indicators do not
recognise differences with respect to benefit entitlements linked to these
contributions. Nevertheless the ratio between the implicit tax rate on labour and
consumption gives a first indication of the overall tax burden on labour compared to
consumption and a high value hints at room for tax shift towards consumption. The
first column of Appendix Table 4 shows that in countries like Croatia, Luxembourg or
Denmark the tax burden on labour is not much higher than on consumption. At the
other end of the spectrum are Italy and Spain with a labour tax burden which is
almost two and half time higher than the tax burden on consumption. A further
refinement of this indicator is the ratio between the implicit rate on labour and
the implicit tax rate on immoveable property. This follows the ranking of growth-
friendly tax structures as proposed by Johansson et al. (2008).87 Given the relative
small denominator in this ratio the variation is likely to be rather large and the values
need to be seen with some caution.
The next group of indicators is concerned with the structure of the labour taxes
themselves. The first indicator is the implicit tax rate on labour split up into the
components as it is regularly done by the European Commission in their publication
Taxation Trends in the European Union.88 Specifically this includes a split into
employers’ SSC, employees’ SSC and personal income tax. These indicators provide a
first insight on the legal incidence of the tax burden on labour. It is however important
to see these indicators as a group of indicators since a low value on one or two
aspects of the labour tax components can be misleading if the remaining part is high
to compensate for this difference. Appendix Table 4 clearly illustrates this for the
example Denmark, where the personal income tax makes up the lions’ share of the
tax burden on labour. Hence investigating only the personal income tax part would
indicate a very high tax burden on labour while looking only at SSC would indicate a
87 It is however noteworthy, that the national accounts data on the tax burden on property or
more general on capital might be less accurate, since some countries do not tax a large proportion of property directly but rather finance their public services through fees which are only indirectly linked to the property. We therefore do not put too much emphasis on this
indicator and do not collect data for it in this study. 88 For the most recent edition see European Commission (2014b).
European Commission
Study on the effects and incidence of labour taxation
May 2015 | 133
low tax burden. In combination one can learn that the labour tax burden is average in
Denmark, and that the legal incidence is almost entirely on the worker.89
In addition to the implicit tax rates the statutory tax rate and social security
contribution rates should be used as indicators. This immediately raises a number of
questions since these rates are depending on a number of additional characteristics,
like the income level, marital status and number of children. As a starting point we
therefore suggest to use the information for a single person without children at the
average workers wage.90 Since labour taxation is typically not proportional but
progressive it is important to use two measures of the statutory tax burden. First the
marginal effective tax rate (METR) which describes the tax burden on an additional
Euro of income and the average effective tax rate (AETR) which describes the share
of the tax burden in the gross income. We suggest to start with these two statutory
tax measures for the overall tax wedge, i.e. the sum of both employers’ and
employees’ social security contribution and the personal income tax should be used.
Furthermore, as already mentioned in the discussion of the implicit tax rates, each of
the individual components should be used separately in comparison to the total
wedge. Appendix Table 5 displays the values for an average worker, single and no
children, in 2013. The average total tax wages is highest in Belgium with 55.8 %.
Further in Austria, France, Germany and Hungary the total tax wedge for the average
workers income is close to 50 %. This average total tax burden is equally split
between employers SSC, employees SSC and personal income tax in Germany, while
in other countries with a higher tax burden the employers SSC plays a dominant role.
The marginal tax burden is about then percentage points higher in most countries,
reflecting the progressive nature of the income tax schedules.
The tax burden for the average person needs to be put into context of the
progressivity of the labour taxation. We think of a tax system as being progressive if
a higher income will be taxed at a higher rate. This is reflected in the fact that the
METR is higher than the AETR. However, no system of labour taxation will have the
same ratio between the METR and AETR over the whole income range. To nevertheless
have a simple and comparable measure we propose the following progressivity
indicator
𝑃𝑟𝑜𝑔𝑟𝑒𝑠𝑠𝑖𝑣𝑖𝑡𝑦 𝐼𝑛𝑑𝑖𝑐𝑎𝑡𝑜𝑟 =1
𝑁∑ (
𝑀𝐸𝑇𝑅𝑖
𝐴𝐸𝑇𝑅𝑖)
𝑁
𝑖=1
where 𝑀𝐸𝑇𝑅𝑖 and 𝐴𝐸𝑇𝑅𝑖 are the marginal and average tax rate for income 𝑖 and 𝑁 is
the total number of income levels considered.91 To operationalise this indicator we
propose to draw on the “Taxing Wages” publications by the OECD. The latter provides
the necessary tax rates for income levels from 50 % of the average workers income
up to 250 % of the average workers income. Therefore the progressivity measure will
89 See graph 13 in European Commission (2014b, p.14) for an illustration of the decomposition
of the labour tax wedge. 90 This is one of the baseline scenarios in the data provided by the OECD. For more information
on the OECD taxing wage database see: http://www.oecd.org/tax/taxing-wages-20725124.htm 91 If the AETR is zero this indicator not defined. In these cases we suggest to replace the value
in the bracket with 0, since - apart from the exact value of the threshold for the starting rate – the METR is also zero.
European Commission
Study on the effects and incidence of labour taxation
May 2015 | 134
be based on N=201 income levels. This progressivity measure can be calculated for
the overall tax wedge as well as for the components (income tax, employers’ and
employees social security contributions) separately. This yields most likely very
different results since especially the employees’ social security contributions are to
some extent regressive in a most Member States because of upper earnings limits
above which no more social security contributions are levied. Appendix Table 6 shows
the results for the different progressivity indices for the year 2013. The Irish tax
system is found to be the most progressive system overall, while the tax system in
Hungary is a flat tax. Some of the systems are hardly progressive overall, because of
the regressive nature of the social security system. Typical examples are here Austria,
Germany or Spain. Looking only at the personal income tax system, Greece stands out
with a very progressive system, according to our measure of the progressivity.
A limitation of the progressivity index so far is that is not taking into account the
actual income distribution in the Member States. In fact if one wants to use the
statutory tax rate and progressivity indicators for an evaluation of the development
over time, it would also be possible that changes purely originate from changes in the
average workers income. Hence in the next set of indicators we propose to link the tax
measures with the income distribution to find out more about the broader context in
which the labour taxation is set. An alternative approach would be to use the Kakwani
(1977) index, which is based on the Gini index of both the tax burden and the taxable
income. Provided that the necessary data is available the Kakwani index is be able to
show the actual progressivity of any tax system. However, since the calculation of the
Kakwani index is much more data demanding, we propose to initially use a simple
measure of progressivity until the necessary data for the more elaborate measure is
available.
5.4. Indicators group 3: Identification of factors affecting the
incidence of labour taxation
The two groups of indicators describe the situation of labour taxation in the Member
States, whether there is room and a need for a reduction in the taxation of labour, but
have not put the situation into the broader context in the individual Member States.
This is the aim of the third group of indicators. The first subgroup of indicators puts
the level and the progressivity of labour taxation into the context of the income
distribution. The second group highlights links between the contributions and the
benefits and the third one aims to capture further aspects in the Member States which
are likely to influence the labour market outcomes as a result of labour taxation.
5.4.1. Group 3a: Labour tax structure in a broader context
Starting point here are the indicators of the previous subsection. The level and
progressivity of taxes on labour need to be put into the context of the income
distribution in the Member States. To measure this we propose an income adjusted
progressivity indicator defined as
𝐴𝑑𝑗𝑢𝑠𝑡𝑒𝑑 𝑝𝑟𝑜𝑔𝑟𝑒𝑠𝑠𝑖𝑣𝑖𝑡𝑦 𝐼𝑛𝑑𝑖𝑐𝑎𝑡𝑜𝑟 =1
𝑁∑ 𝜃𝑖 (
𝑀𝐸𝑇𝑅𝑖
𝐴𝐸𝑇𝑅𝑖)
𝑁
𝑖=1
European Commission
Study on the effects and incidence of labour taxation
May 2015 | 135
where 𝜃𝑖 represent the share of the population which has an income of 𝑖. To
operationalise this indicator we propose the use of the EU-SILC. The EU-SILC reports
the income deciles of households in the individual Member States. The cut-offs for the
deciles are reported in equalised disposable households incomes. This implies that the
household income is divided by the number of consumption equivalents in the
household to get comparable information about the disposable income. While this is
not the taxable income of the individual workers it still gives a reasonable
approximation of the income distribution of the households.92 Grossing up the cut-off
points and taking the average between the upper and lower cut-off point gives the
income levels 𝑖 for the adjusted progressivity indicator. The share of the population is
either 1 % for the top and bottom 5 percentiles, 5 % for the remainder of the top and
bottom decile and 10 % for the deciles in between.93
A related indicator is the weighted statutory tax rate which can be defined as
𝑊𝑒𝑖𝑔ℎ𝑡𝑒𝑑 𝑠𝑡𝑎𝑡𝑢𝑡𝑜𝑟𝑦 𝑡𝑎𝑥 𝑟𝑎𝑡𝑒 = ∑ 𝜔𝑖𝐴𝐸𝑇𝑅𝑖
𝑁
𝑖=1
where 𝜔𝑖 is the fraction of the income of the population with an income level of 𝑖. This
will result in a weighted average tax burden for the population, and can again be
calculated for employers’ and employees’ SSC and the personal income tax. Despite
the above mentioned issues in using the SILC information for the earnings
distribution, this indicator provides us with some information for the overall statutory
tax burden in the Member States. Relating this to the implicit tax burden indicators
gives an impression of the width of the tax base definitions.
The second indicator which can be approximated with the use of the EU-SILC income
distribution is the fraction of the population which falls below the first tax
income bracket. The grossed-up cut off points from the EU-SILC income distribution
can be compared to the thresholds of income tax as reported by the OECD in their
Taxing Wags database. This shows what fraction of the workforce will not be able to
benefit from a cut in labour taxation because their income level is so low that they fall
below the first tax threshold.
5.4.2. Group 3b: Link between contributions and benefits
If there are strong links between SSC contributions and entitlements to benefits the
labour market outcome will most likely be different since these parts of the labour tax
burden will not be seen as taxes. The most obvious case for a link between the
contribution and benefits entitlements is in the pension system. The OECD (2013b)
92 The use of equalised disposable household income can be problematic because of a number
of reasons. First it may contain government transfers which are not taxable, secondly it may contain other income (capital income) which is taxed at different rates, and thirdly the household composition can affect the tax burden on the income, especially in countries with joint filing. Therefore much more detailed research should go into the use of EU-SILC data as weights. Nevertheless, we think that due to the ease of availability and the standardisation the EU-SILC can serve as very useful starting point. 93 Since there is no top cut off point for the top 1 percentile an assumption needs to be made.
For a more sophisticated approach one could also estimate the appropriate mean through assuming a pareto distribution.
European Commission
Study on the effects and incidence of labour taxation
May 2015 | 136
reports the gross pension entitlements as a proportion of economy-wide
average earnings which can be used as an indicator for the strength of the link
between the contributions and the benefits entitlement. The OECD (2013b, p. 155)
depicts the link graphically and categories countries into groups with weak, strong and
intermediate links. To move for this broad categorisation to an indicator we suggest
the following approach:
𝑃𝑒𝑛𝑠𝑖𝑜𝑛 𝑏𝑒𝑛𝑒𝑓𝑖𝑡 𝑙𝑖𝑛𝑘 𝑖𝑛𝑑𝑖𝑐𝑎𝑡𝑜𝑟 =1
(𝑁 − 50) + 1∑ − (
𝑃𝐸𝑖
𝑃𝐸𝑁− 1)
𝑁
𝑖=50
Here 𝑃𝐸𝑖 and 𝑃𝐸𝑁 denote the gross pension entitlements at an income level 𝑖 % of
the average worker income. The OECD (2013b) reports gross pension entitlements for
income levels between 50 % and 200 % of an average workers income resulting in
151 observations. This indicator will be zero if the gross pension entitlement is
constant over the whole income range and positive if the gross pension entitlements
increase over the income range examined. The higher the value of this indicator the
more likely is a stronger link between the contributions and the benefits entitlement.
Note that to fully measure the link one would also need to take into account eventual
caps to the SSC contributions.
The second aspect covered in this subgroup of indicators is the interaction between
the welfare system and the tax system. To this end we suggest to draw on the tax and
benefits database by the European Commission. Specifically we propose the use of
two indicators to measure the (dis-)incentives to take up work, namely the inactivity
trap and the unemployment trap. Both these indicators measure the marginal tax
burden for a labour market transition. While for the inactivity trap measures the METR
for a transition into the workforce, the unemployment trap measures the tax burden
on a transition from unemployment into employment. The key difference is that the
inactivity trap includes the loss of social assistance while the unemployment trap
includes the loss of unemployment benefits; see Carone et al. (2004) for an in-depth
discussion.94 Both indicators are targeted to shed light on tax effects on the labour
supply at the extensive margin and ceteris paribus a higher value on these indicators
will result in worse effects for the labour supply. Given the discussion about the link to
benefits entitlement the METR measuring both inactivity and unemployment trap
should also be split into the components. A high marginal burden may be much less
harmful for labour supply effects if a benefit entitlement is linked to the SSC
contributions. Appendix Table 7 summarizes the pension entitlement index, the
unemployment and the inactivity trap indicators. The link between the earnings and
the pension entitlement is strongest in Sweden, while it is weak in the United Kingdom
and not existing in Ireland. Evaluated at a very low level of income, namely at 33 % of
the average workers earnings, the inactivity trap results in net earning losses in
Denmark and Ireland. In contrast in Italy and Romania the incentive to take up work
is very strong because of a low share of the additional income taken away through
taxes and reduced benefits. The situation is different for the unemployment trap
indicator, which shows a net income loss in Denmark, Lithuania and the Netherlands.
The incentives for moving from unemployment back to employment are strongest in
94 The OECD tax benefits database is available at http://www.oecd.org/social/benefits-and-
wages.htm.
European Commission
Study on the effects and incidence of labour taxation
May 2015 | 137
the United Kingdom and the Slovak Republic with a more than 60 percent increase in
net disposable income.
5.4.3. Group 3c: Other factors influencing labour tax effects
The literature review in section 3 and 4 has uncovered two further key aspects which
should affect the employment effects of labour taxation. First there is the role of wage
bargaining through unions and secondly there is the role of a binding minimum wage.
To tackle the first aspect we suggest to draw on the Institutional Characteristics of
Trade Unions, Wage Setting, State Intervention and Social Pacts (ICTWSS) database
provided by the Amsterdam Institute for Advanced Labour Studies. This
comprehensive database contains an indicator for centralisation of the wage
bargaining process. This indicator assigns a value from 1 (very decentralised
bargaining at the firm level) to 5 (very centralised bargaining). The assignment of
values from 1 to 5 already indicates that the level of decentralisation is not necessarily
a continuous variable. Indeed, the review of the literature seems to suggest that the
impact of the degree of centralisation to the outcome of bargaining is non-linear.
Therefore the position relative to the average will be meaningless for this indicator.
Instead intermediate values for the centralisation of bargaining should give an
indication of more sharing of the tax burden while both low and high levels of this
index point towards more incidence of labour taxation on workers. The second aspect
of the wage bargaining process is the strength of unions, measured as the union
density rate. This indicator is defined as the union membership as a proportion of
wage and salary earners in employment, again available from the ICTWSS database.95
A higher value for this indicator reflects a stronger bargaining position of the union
and should therefore increase the share of tax burden borne by the employers.
A binding minimum wage rules out that the tax incidence of an employers’ SSC or
payroll tax increase falls on the worker. Therefore another indicator should be the
nominal monthly minimum wage. Data on the nominal monthly minimum wage is
available from the ILO. Since a number of countries do not have a nationwide
minimum wage, but rather have sector specific minimum wages they will not appear
in this dataset. To nevertheless get an idea of government intervention in the area of
minimum wages we suggest to supplement the minimum wage indicator with the
index for minimum wage setting by the ICTWSS. This index ranges from 0 to 8,
where 0 stands for no minimum wage legislation and therefore no government
intervention and 8 stands for a freely set minimum wage by the government.
Intermediate values represent different levels of intervention. Values of 1 and 2
describe not nationwide minimum wage setting and values between 3 and 7 describe
nationwide minimum wages with decreasing consultation and influence of businesses.
Appendix Table 8 collects the information of centralisation of wage bargaining, union
density and the minimum wage setting. The United Kingdom, Poland and the Baltic
countries are classified to have very decentralised wage bargaining, while Belgium,
Finland and Greece are characterised through very centralised bargaining. In line with
95 The ICTWSS does provide two alternative measures for the net union density. First as a
fraction of wage and salary earners as in the national labour force survey and the union coverage, defined as employees in workplaces or establishments covered by unions or works councils as a proportion of all wage and salary earners in employment.
European Commission
Study on the effects and incidence of labour taxation
May 2015 | 138
expectation the union density is highest in the Scandinavian countries. At the same
time Denmark, Finland and Sweden are along with Austria, Cyprus and Italy the only
countries not to have a national minimum wage. Of the other countries having
national minimum wage the value varies from 184 Euro monthly in Bulgaria to 1,923
Euro monthly in Luxembourg.
To get an impression whether the minimum wages are binding we propose to compare
the nominal minimum wages to the median monthly earnings from the Structure of
Earnings database as provided by Eurostat. Using the median rather than an average
gives a better approximation of the share of the workforce for which the minimum
wage is binding. The database does further allow to distinguish between gender,
education and occupation.96 This can give further insights whether the minimum wage
is more binding for the above identified vulnerable groups. An alternative measure of
the income distribution can be drawn from the EU-SILC. Appendix Table 9 compares
the median monthly earnings to the top cut off value of the 2nd, 5th and 8th decile of
the net equalised household income in the EU-SILC. The comparison shows that there
is a significant dispersion of the income levels both across Member States and within
Member States. A comparison between the information for the Structure of Earnings
dataset and with the net equalised income from the EU-SILC shows that there is a
considerable difference. This is due to the fact that the Structure of Earnings is
measuring the gross labour income while the EU-SILC is looking at net income
including other income.97
5.5. Overview and structure of framework of indicators
The subgroups of indicators in the previous subsections form an overall framework
which helps to identify the scope of labour tax reforms to mitigate employment
problems. The indicators in the different subgroups identify specific aspects on their
own, but sometimes more information can be extracted if the indicators are viewed in
the conjunction with each other. To facilitate a better overview Table 10, Table 11 and
Table 12 summarise the indicators, their source and their use and interpretation.
The indicators in Table 10 quantify the extent of employment problems, how the
different vulnerable groups are affected by them and to which extent non-tax factor
determine employment problems. For example high levels of unemployment [1],
which are not artificially inflated through a low level of participation rate [2] hint at a
problem of unemployment. If primarily the participation rate [2] is low the country is
dealing more with a non-employment problem. Comparing these results with the
NAWRU [3] as a measure of structural unemployment and the mismatch indicators in
[6] puts the employment problems into the context of business cycle fluctuations and
matching efficiency as factors contributing to unemployment and non-employment.
Repeating this exercise with the unemployment and participation rate for the
vulnerable groups in indicators [4] and [5] further narrows down the employment
problems.
96 Again, this is seen as a first step to further the knowledge of the income distribution.
Refinement of the use of the structure of earnings database should be subject to further research. 97 A potential limitation is the fact that the Structure of Earnings Survey only includes
employers from establishment with ten of more subsidiaries.
European Commission
Study on the effects and incidence of labour taxation
May 2015 | 139
Table 10: Overview of framework of indicators (first part)
Indicator Source Use and interpretation
Indicator group 1a: Unemployment, Non-employment and structural
unemployment
[1] Unemployment rate LFS
Higher values indicate employment
problems, especially in conjunction with
low values of [2] and high values of [3]
[2] Participation rate LFS
Lower values indicate employment
problems, especially in conjunction with
high values of [1]
[3] NAWRU AMECO
Higher values indicate structural
unemployment problems. Big
differences to [1] indicate a large
cyclical part of unemployment
Indicator group 1b: Employment problems and vulnerable groups
[4] Unemployment rate,
by(gender, age group,
migrant status, skill
levels)
LFS
Higher values indicate employment
problems, especially in conjunction with
low values of the corresponding
indicator in [5]. Differences to [1]
highlight the vulnerability of particular
groups
[5] Participation rate, by
(gender, age group,
migrant status, skill
levels)
LFS
Lower values indicate employment
problems, especially in conjunction with
high values of the corresponding
indicator in [4]. Differences to [2]
highlight the vulnerability of particular
groups
Indicator group 1c: Non-tax factors contributing to structural unemployment
[6] Mismatch indicators
(skill, sectoral, regional) LFS
High values indicate non-tax related
employment problems
[7] Employment change
indicators
(skill, sectoral, regional)
LFS,
AMECO
High values indicate a labour demand
side contribution to employment
problems as indicated in [6]
[8] Workforce composition
change indicators
(skill, age, migrant
status)
LFS
High values indicate a labour supply
side contribution to employment
problems as indicated in [6]
Source: Own elaboration.
The second set of indicators in Table 11 looks at the overall fiscal situation and the
structure of taxation to identify whether there is room for reductions in the tax burden
on labour. High levels of government debt [9] and a large fiscal deficit [10] especially
in conjunction with a high tax-to-GDP ratio [11] indicate that any significant reduction
of the labour tax burden needs to be financed through fiscal consolidation. A high ratio
between the implicit tax rate on labour and the implicit tax rate on consumption [12]
indicates the potential to shift the tax burden away from labour. The analysis of the
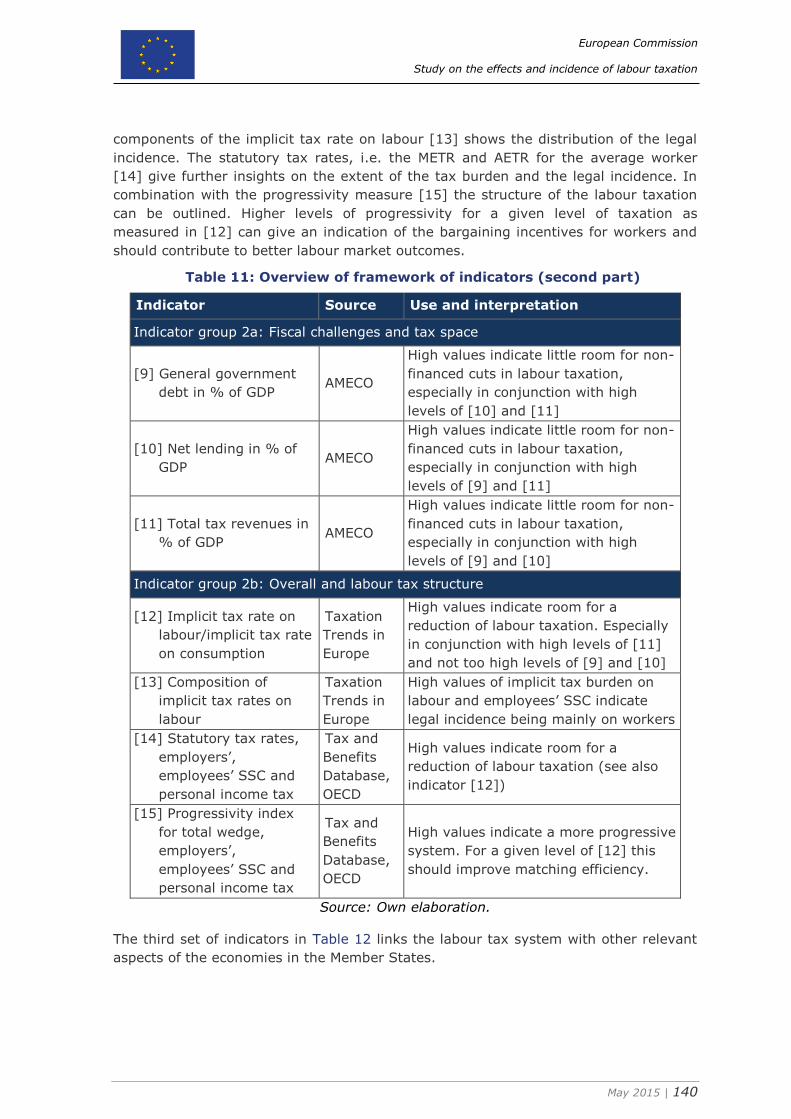
European Commission
Study on the effects and incidence of labour taxation
May 2015 | 140
components of the implicit tax rate on labour [13] shows the distribution of the legal
incidence. The statutory tax rates, i.e. the METR and AETR for the average worker
[14] give further insights on the extent of the tax burden and the legal incidence. In
combination with the progressivity measure [15] the structure of the labour taxation
can be outlined. Higher levels of progressivity for a given level of taxation as
measured in [12] can give an indication of the bargaining incentives for workers and
should contribute to better labour market outcomes.
Table 11: Overview of framework of indicators (second part)
Indicator Source Use and interpretation
Indicator group 2a: Fiscal challenges and tax space
[9] General government
debt in % of GDP AMECO
High values indicate little room for non-
financed cuts in labour taxation,
especially in conjunction with high
levels of [10] and [11]
[10] Net lending in % of
GDP AMECO
High values indicate little room for non-
financed cuts in labour taxation,
especially in conjunction with high
levels of [9] and [11]
[11] Total tax revenues in
% of GDP AMECO
High values indicate little room for non-
financed cuts in labour taxation,
especially in conjunction with high
levels of [9] and [10]
Indicator group 2b: Overall and labour tax structure
[12] Implicit tax rate on
labour/implicit tax rate
on consumption
Taxation
Trends in
Europe
High values indicate room for a
reduction of labour taxation. Especially
in conjunction with high levels of [11]
and not too high levels of [9] and [10]
[13] Composition of
implicit tax rates on
labour
Taxation
Trends in
Europe
High values of implicit tax burden on
labour and employees’ SSC indicate
legal incidence being mainly on workers
[14] Statutory tax rates,
employers’,
employees’ SSC and
personal income tax
Tax and
Benefits
Database,
OECD
High values indicate room for a
reduction of labour taxation (see also
indicator [12])
[15] Progressivity index
for total wedge,
employers’,
employees’ SSC and
personal income tax
Tax and
Benefits
Database,
OECD
High values indicate a more progressive
system. For a given level of [12] this
should improve matching efficiency.
Source: Own elaboration.
The third set of indicators in Table 12 links the labour tax system with other relevant
aspects of the economies in the Member States.
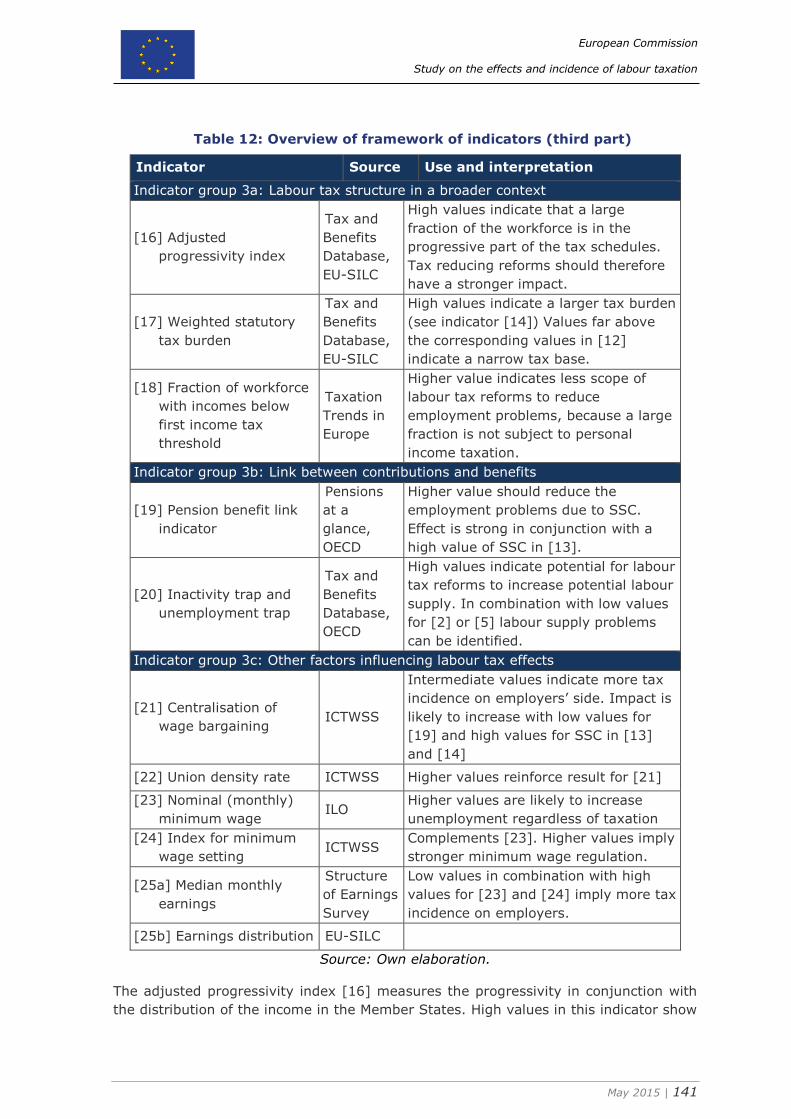
European Commission
Study on the effects and incidence of labour taxation
May 2015 | 141
Table 12: Overview of framework of indicators (third part)
Indicator Source Use and interpretation
Indicator group 3a: Labour tax structure in a broader context
[16] Adjusted
progressivity index
Tax and
Benefits
Database,
EU-SILC
High values indicate that a large
fraction of the workforce is in the
progressive part of the tax schedules.
Tax reducing reforms should therefore
have a stronger impact.
[17] Weighted statutory
tax burden
Tax and
Benefits
Database,
EU-SILC
High values indicate a larger tax burden
(see indicator [14]) Values far above
the corresponding values in [12]
indicate a narrow tax base.
[18] Fraction of workforce
with incomes below
first income tax
threshold
Taxation
Trends in
Europe
Higher value indicates less scope of
labour tax reforms to reduce
employment problems, because a large
fraction is not subject to personal
income taxation.
Indicator group 3b: Link between contributions and benefits
[19] Pension benefit link
indicator
Pensions
at a
glance,
OECD
Higher value should reduce the
employment problems due to SSC.
Effect is strong in conjunction with a
high value of SSC in [13].
[20] Inactivity trap and
unemployment trap
Tax and
Benefits
Database,
OECD
High values indicate potential for labour
tax reforms to increase potential labour
supply. In combination with low values
for [2] or [5] labour supply problems
can be identified.
Indicator group 3c: Other factors influencing labour tax effects
[21] Centralisation of
wage bargaining ICTWSS
Intermediate values indicate more tax
incidence on employers’ side. Impact is
likely to increase with low values for
[19] and high values for SSC in [13]
and [14]
[22] Union density rate ICTWSS Higher values reinforce result for [21]
[23] Nominal (monthly)
minimum wage ILO
Higher values are likely to increase
unemployment regardless of taxation
[24] Index for minimum
wage setting ICTWSS
Complements [23]. Higher values imply
stronger minimum wage regulation.
[25a] Median monthly
earnings
Structure
of Earnings
Survey
Low values in combination with high
values for [23] and [24] imply more tax
incidence on employers.
[25b] Earnings distribution EU-SILC
Source: Own elaboration.
The adjusted progressivity index [16] measures the progressivity in conjunction with
the distribution of the income in the Member States. High values in this indicator show
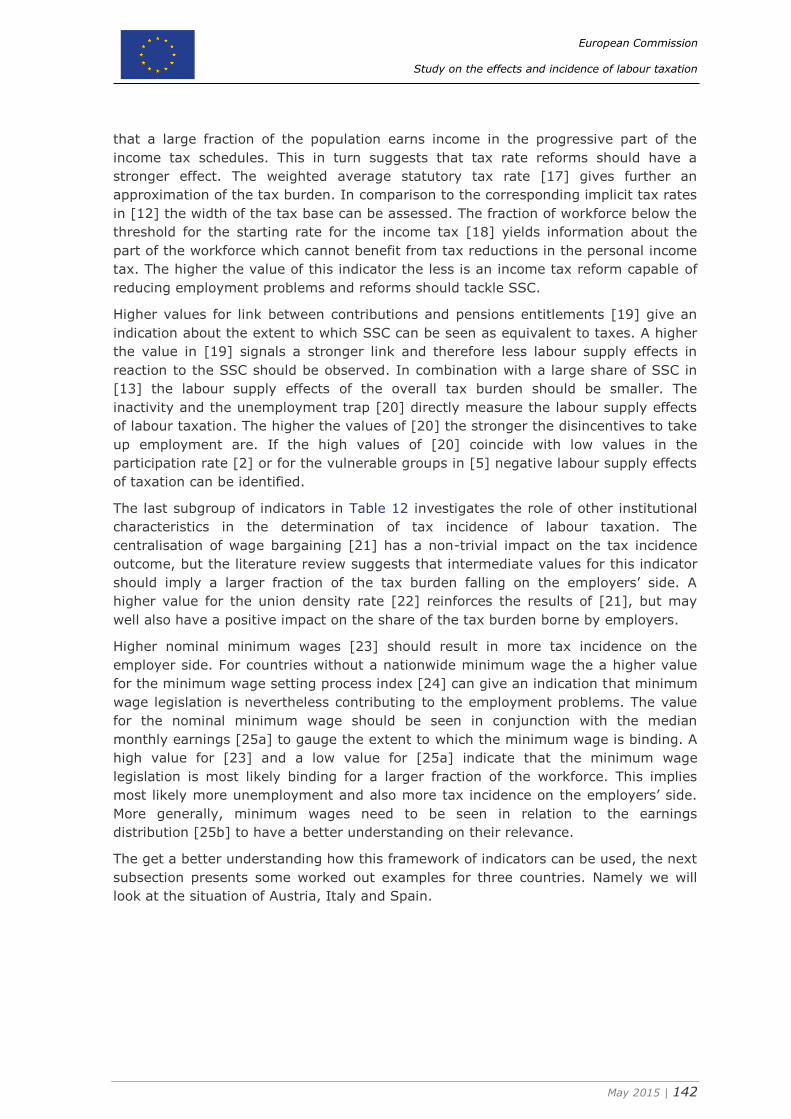
European Commission
Study on the effects and incidence of labour taxation
May 2015 | 142
that a large fraction of the population earns income in the progressive part of the
income tax schedules. This in turn suggests that tax rate reforms should have a
stronger effect. The weighted average statutory tax rate [17] gives further an
approximation of the tax burden. In comparison to the corresponding implicit tax rates
in [12] the width of the tax base can be assessed. The fraction of workforce below the
threshold for the starting rate for the income tax [18] yields information about the
part of the workforce which cannot benefit from tax reductions in the personal income
tax. The higher the value of this indicator the less is an income tax reform capable of
reducing employment problems and reforms should tackle SSC.
Higher values for link between contributions and pensions entitlements [19] give an
indication about the extent to which SSC can be seen as equivalent to taxes. A higher
the value in [19] signals a stronger link and therefore less labour supply effects in
reaction to the SSC should be observed. In combination with a large share of SSC in
[13] the labour supply effects of the overall tax burden should be smaller. The
inactivity and the unemployment trap [20] directly measure the labour supply effects
of labour taxation. The higher the values of [20] the stronger the disincentives to take
up employment are. If the high values of [20] coincide with low values in the
participation rate [2] or for the vulnerable groups in [5] negative labour supply effects
of taxation can be identified.
The last subgroup of indicators in Table 12 investigates the role of other institutional
characteristics in the determination of tax incidence of labour taxation. The
centralisation of wage bargaining [21] has a non-trivial impact on the tax incidence
outcome, but the literature review suggests that intermediate values for this indicator
should imply a larger fraction of the tax burden falling on the employers’ side. A
higher value for the union density rate [22] reinforces the results of [21], but may
well also have a positive impact on the share of the tax burden borne by employers.
Higher nominal minimum wages [23] should result in more tax incidence on the
employer side. For countries without a nationwide minimum wage the a higher value
for the minimum wage setting process index [24] can give an indication that minimum
wage legislation is nevertheless contributing to the employment problems. The value
for the nominal minimum wage should be seen in conjunction with the median
monthly earnings [25a] to gauge the extent to which the minimum wage is binding. A
high value for [23] and a low value for [25a] indicate that the minimum wage
legislation is most likely binding for a larger fraction of the workforce. This implies
most likely more unemployment and also more tax incidence on the employers’ side.
More generally, minimum wages need to be seen in relation to the earnings
distribution [25b] to have a better understanding on their relevance.
The get a better understanding how this framework of indicators can be used, the next
subsection presents some worked out examples for three countries. Namely we will
look at the situation of Austria, Italy and Spain.
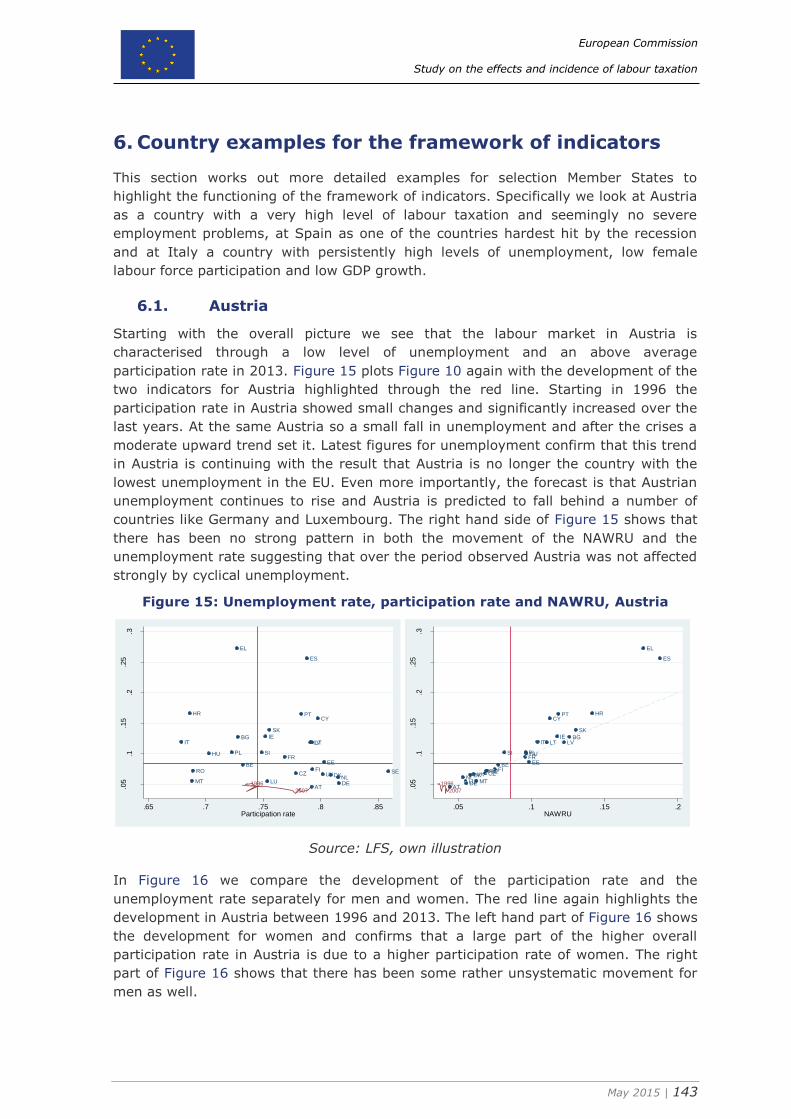
European Commission
Study on the effects and incidence of labour taxation
May 2015 | 143
6. Country examples for the framework of indicators
This section works out more detailed examples for selection Member States to
highlight the functioning of the framework of indicators. Specifically we look at Austria
as a country with a very high level of labour taxation and seemingly no severe
employment problems, at Spain as one of the countries hardest hit by the recession
and at Italy a country with persistently high levels of unemployment, low female
labour force participation and low GDP growth.
6.1. Austria
Starting with the overall picture we see that the labour market in Austria is
characterised through a low level of unemployment and an above average
participation rate in 2013. Figure 15 plots Figure 10 again with the development of the
two indicators for Austria highlighted through the red line. Starting in 1996 the
participation rate in Austria showed small changes and significantly increased over the
last years. At the same Austria so a small fall in unemployment and after the crises a
moderate upward trend set it. Latest figures for unemployment confirm that this trend
in Austria is continuing with the result that Austria is no longer the country with the
lowest unemployment in the EU. Even more importantly, the forecast is that Austrian
unemployment continues to rise and Austria is predicted to fall behind a number of
countries like Germany and Luxembourg. The right hand side of Figure 15 shows that
there has been no strong pattern in both the movement of the NAWRU and the
unemployment rate suggesting that over the period observed Austria was not affected
strongly by cyclical unemployment.
Figure 15: Unemployment rate, participation rate and NAWRU, Austria
Source: LFS, own illustration
In Figure 16 we compare the development of the participation rate and the
unemployment rate separately for men and women. The red line again highlights the
development in Austria between 1996 and 2013. The left hand part of Figure 16 shows
the development for women and confirms that a large part of the higher overall
participation rate in Austria is due to a higher participation rate of women. The right
part of Figure 16 shows that there has been some rather unsystematic movement for
men as well.
AT
BE
BG
CY
CZ
DE
DK
EE
EL
ES
FI
FR
HR
HU
IEIT LT
LU
LV
MTNL
PL
PT
RO SE
SI
SK
UK
1996
2007
.05
.1.1
5.2
.25
.3
Une
mplo
ym
ent ra
te
.65 .7 .75 .8 .85Participation rate
AT
BE
BG
CY
CZ
DE
DK
EE
EL
ES
FI
FR
HR
HU
IEIT LT
LU
LV
MTNL
PL
PT
ROSE
SI
SK
UK
1996
2007
.05
.1.1
5.2
.25
.3
Une
mplo
ym
ent ra
te
.05 .1 .15 .2NAWRU
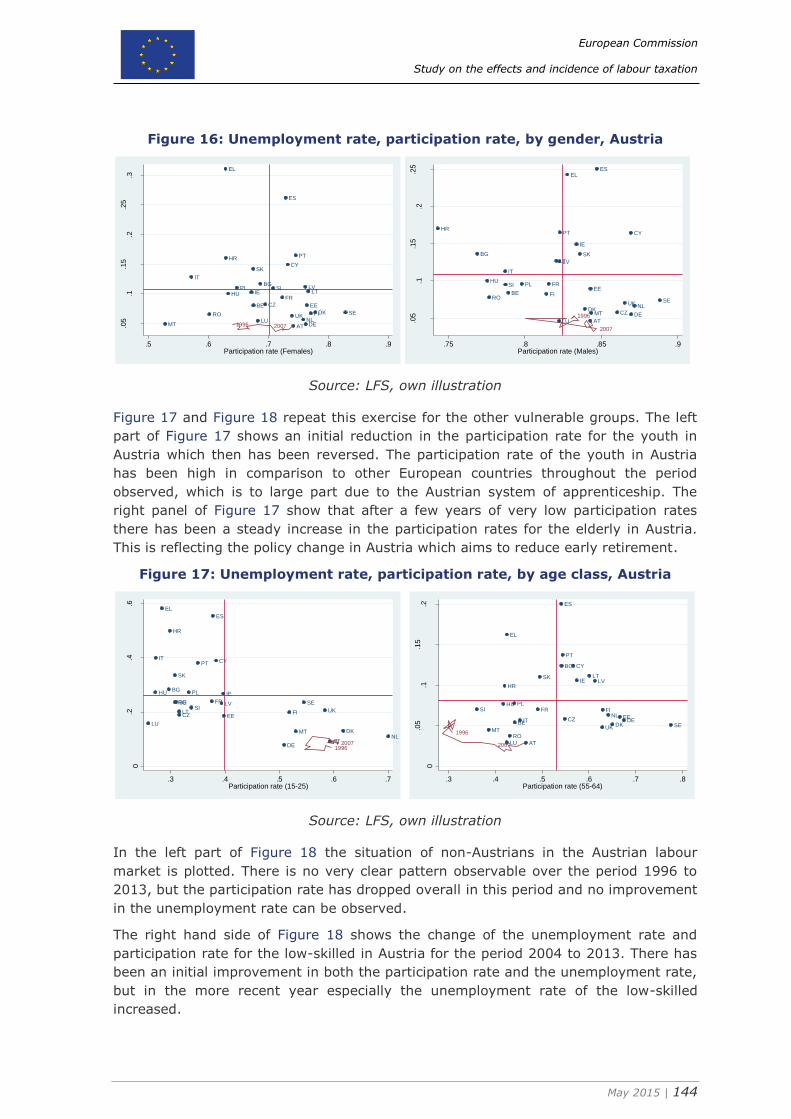
European Commission
Study on the effects and incidence of labour taxation
May 2015 | 144
Figure 16: Unemployment rate, participation rate, by gender, Austria
Source: LFS, own illustration
Figure 17 and Figure 18 repeat this exercise for the other vulnerable groups. The left
part of Figure 17 shows an initial reduction in the participation rate for the youth in
Austria which then has been reversed. The participation rate of the youth in Austria
has been high in comparison to other European countries throughout the period
observed, which is to large part due to the Austrian system of apprenticeship. The
right panel of Figure 17 show that after a few years of very low participation rates
there has been a steady increase in the participation rates for the elderly in Austria.
This is reflecting the policy change in Austria which aims to reduce early retirement.
Figure 17: Unemployment rate, participation rate, by age class, Austria
Source: LFS, own illustration
In the left part of Figure 18 the situation of non-Austrians in the Austrian labour
market is plotted. There is no very clear pattern observable over the period 1996 to
2013, but the participation rate has dropped overall in this period and no improvement
in the unemployment rate can be observed.
The right hand side of Figure 18 shows the change of the unemployment rate and
participation rate for the low-skilled in Austria for the period 2004 to 2013. There has
been an initial improvement in both the participation rate and the unemployment rate,
but in the more recent year especially the unemployment rate of the low-skilled
increased.
AT
BE
BG
CY
CZ
DE
DK
EE
EL
ES
FI
FR
HR
HU IE
IT
LT
LU
LV
MTNL
PL
PT
RO SE
SI
SK
UK
1996 2007.05
.1.1
5.2
.25
.3
Une
mplo
ym
ent ra
te (
Fe
male
s)
.5 .6 .7 .8 .9Participation rate (Females)
AT
BE
BG
CY
CZ DEDK
EE
ELES
FI
FR
HR
HU
IE
IT
LT
LU
LV
MT
NL
PL
PT
ROSE
SI
SK
UK
1996
2007
.05
.1.1
5.2
.25
Une
mplo
ym
ent ra
te (
Male
s)
.75 .8 .85 .9Participation rate (Males)
AT
BE
BG
HR
CY
CZ
DK
EEFI
FR
DE
EL
HU IE
IT
LV
LT
LU
MTNL
PL
PT
RO
SK
SI
ES
SE
UK
19962007
0.2
.4.6
Une
mplo
ym
ent ra
te (
15
-25
)
.3 .4 .5 .6 .7Participation rate (15-25)
AT
BE
BG
HR
CY
CZDK
EE
FIFR
DE
EL
HU
IE
IT
LVLT
LU
MT
NL
PL
PT
RO
SK
SI
ES
SEUK1996
2007
0
.05
.1.1
5.2
Une
mplo
ym
ent ra
te (
55
-64
)
.3 .4 .5 .6 .7 .8Participation rate (55-64)
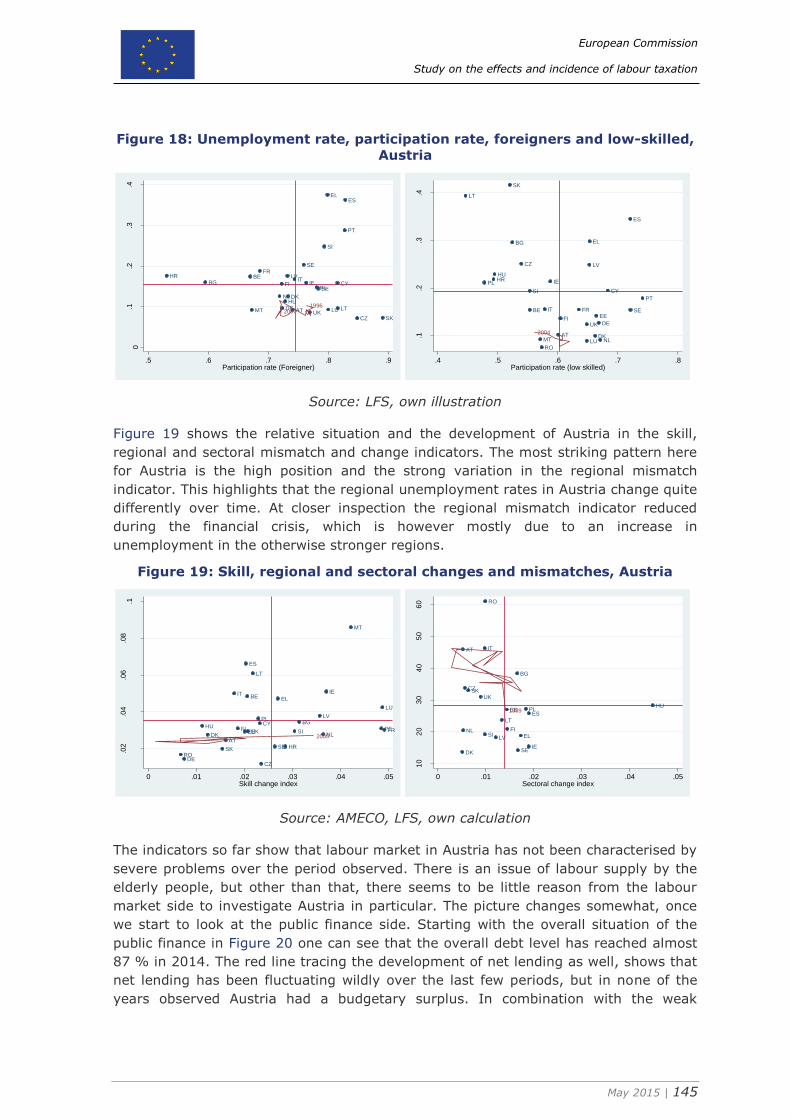
European Commission
Study on the effects and incidence of labour taxation
May 2015 | 145
Figure 18: Unemployment rate, participation rate, foreigners and low-skilled,
Austria
Source: LFS, own illustration
Figure 19 shows the relative situation and the development of Austria in the skill,
regional and sectoral mismatch and change indicators. The most striking pattern here
for Austria is the high position and the strong variation in the regional mismatch
indicator. This highlights that the regional unemployment rates in Austria change quite
differently over time. At closer inspection the regional mismatch indicator reduced
during the financial crisis, which is however mostly due to an increase in
unemployment in the otherwise stronger regions.
Figure 19: Skill, regional and sectoral changes and mismatches, Austria
Source: AMECO, LFS, own calculation
The indicators so far show that labour market in Austria has not been characterised by
severe problems over the period observed. There is an issue of labour supply by the
elderly people, but other than that, there seems to be little reason from the labour
market side to investigate Austria in particular. The picture changes somewhat, once
we start to look at the public finance side. Starting with the overall situation of the
public finance in Figure 20 one can see that the overall debt level has reached almost
87 % in 2014. The red line tracing the development of net lending as well, shows that
net lending has been fluctuating wildly over the last few periods, but in none of the
years observed Austria had a budgetary surplus. In combination with the weak
AT
BEBG
HR
CY
CZ
DK
EEFI
FR
DE
EL
HU
IEIT
LV
LTLUMT
NL
PL
PT
SK
SI
ES
SE
UK
19962007
0.1
.2.3
.4
Une
mplo
ym
ent ra
te (
Fo
reig
ner)
.5 .6 .7 .8 .9Participation rate (Foreigner)
AT
BE
BG
HR
CY
CZ
DK
EEFI
FR
DE
EL
HU
IE
IT
LV
LT
LUMT NL
PL
PT
RO
SK
SI
ES
SE
UK
2004
.1.2
.3.4
Une
mplo
ym
ent ra
te (
low
skill
ed)
.4 .5 .6 .7 .8Participation rate (low skilled)
AT
BE
BG
HR
CY
CZ
DKEE
FI FR
DE
EL
HU
IEIT
LV
LT
LU
MT
NL
PL
PT
ROSK
SI
ES
SE
UK2005
.02
.04
.06
.08
.1
Skill
mis
matc
h in
dex
0 .01 .02 .03 .04 .05Skill change index
AT
BG
CZ
DK
EE
FIEL
HU
IE
IT
LV
LT
NL
PL
RO
SK
SI
ES
SE
UK
1999
10
20
30
40
50
60
Reg
iona
l m
ism
atc
h in
de
x
0 .01 .02 .03 .04 .05Sectoral change index
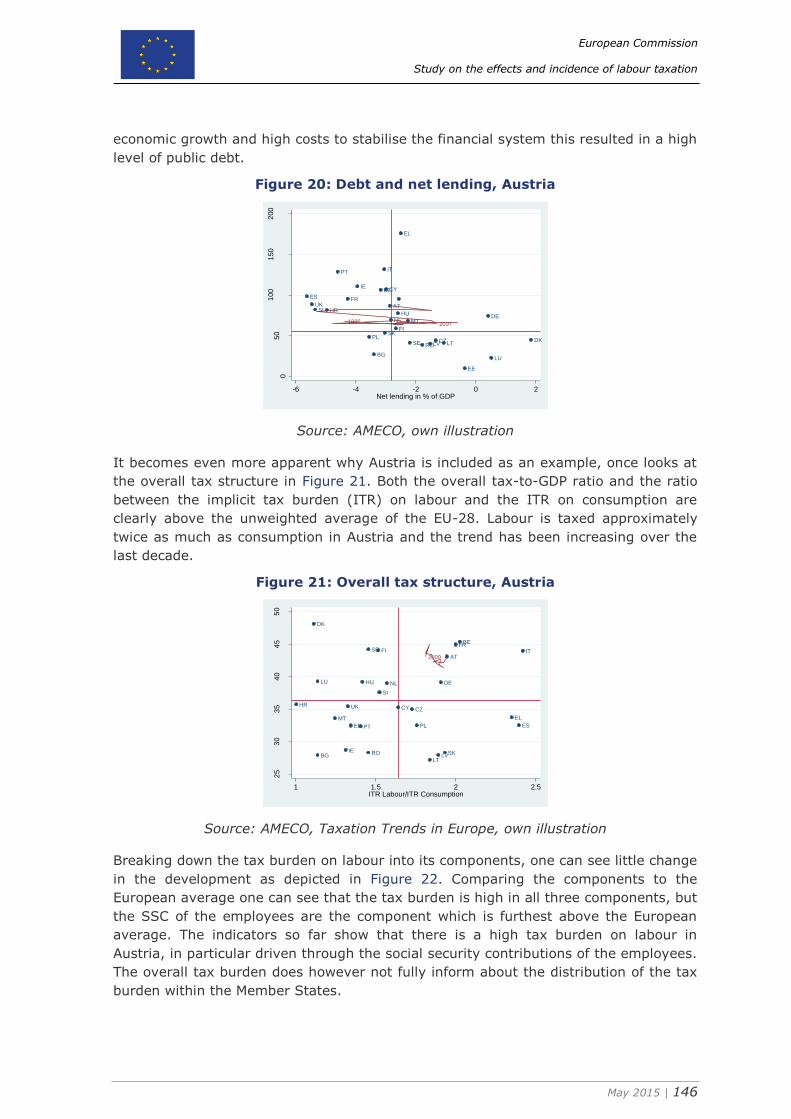
European Commission
Study on the effects and incidence of labour taxation
May 2015 | 146
economic growth and high costs to stabilise the financial system this resulted in a high
level of public debt.
Figure 20: Debt and net lending, Austria
Source: AMECO, own illustration
It becomes even more apparent why Austria is included as an example, once looks at
the overall tax structure in Figure 21. Both the overall tax-to-GDP ratio and the ratio
between the implicit tax burden (ITR) on labour and the ITR on consumption are
clearly above the unweighted average of the EU-28. Labour is taxed approximately
twice as much as consumption in Austria and the trend has been increasing over the
last decade.
Figure 21: Overall tax structure, Austria
Source: AMECO, Taxation Trends in Europe, own illustration
Breaking down the tax burden on labour into its components, one can see little change
in the development as depicted in Figure 22. Comparing the components to the
European average one can see that the tax burden is high in all three components, but
the SSC of the employees are the component which is furthest above the European
average. The indicators so far show that there is a high tax burden on labour in
Austria, in particular driven through the social security contributions of the employees.
The overall tax burden does however not fully inform about the distribution of the tax
burden within the Member States.
AT
BE
BG
HR
CY
CZ DK
EE
FI
FR
DE
EL
HU
IE
IT
LV LT
LU
MTNL
PL
PT
RO
SK
SI
ES
SE
UK
1996 2007
05
01
00
150
200
Deb
t in
% o
f G
DP
-6 -4 -2 0 2Net lending in % of GDP
AT
BE
BG
HRCY CZ
DK
EE
FIFR
DE
EL
HU
IE
IT
LVLT
LU
MT
NL
PLPT
RO SK
SI
ES
SE
UK
2000
25
30
35
40
45
50
Tax-t
o-G
DP
ratio
1 1.5 2 2.5ITR Labour/ITR Consumption
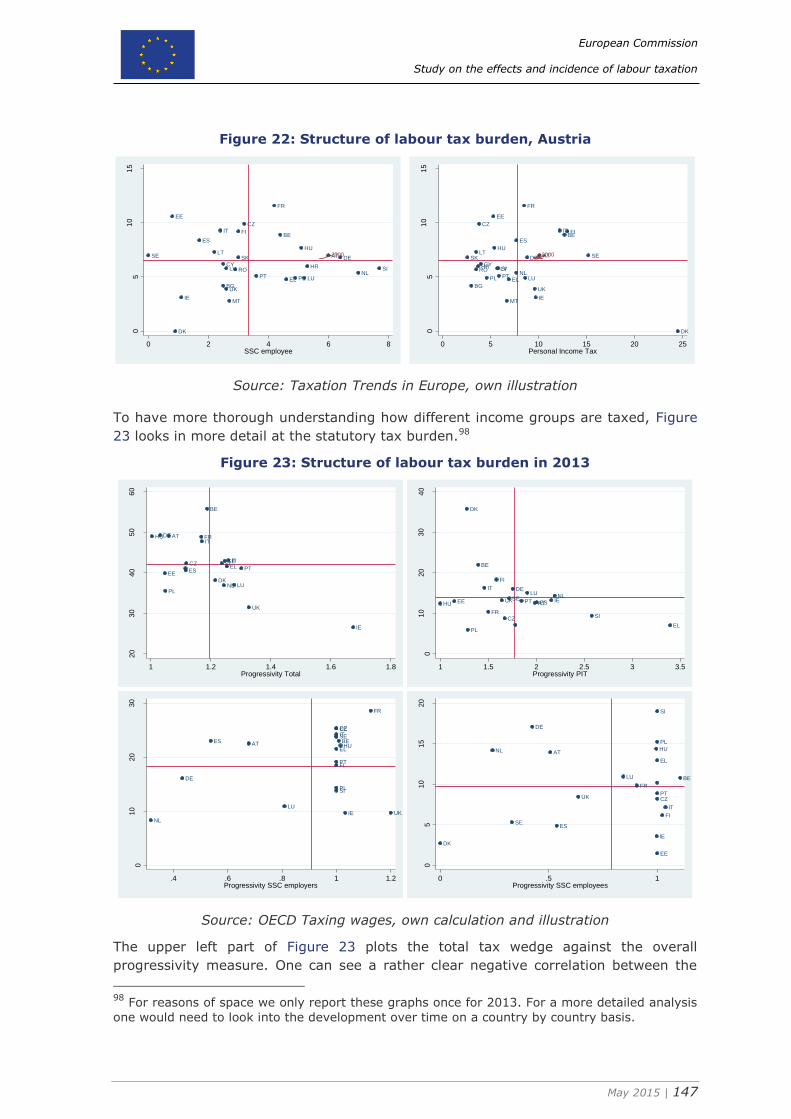
European Commission
Study on the effects and incidence of labour taxation
May 2015 | 147
Figure 22: Structure of labour tax burden, Austria
Source: Taxation Trends in Europe, own illustration
To have more thorough understanding how different income groups are taxed, Figure
23 looks in more detail at the statutory tax burden.98
Figure 23: Structure of labour tax burden in 2013
Source: OECD Taxing wages, own calculation and illustration
The upper left part of Figure 23 plots the total tax wedge against the overall
progressivity measure. One can see a rather clear negative correlation between the
98
For reasons of space we only report these graphs once for 2013. For a more detailed analysis
one would need to look into the development over time on a country by country basis.
AT
BE
BG
HRCY
CZ
DK
EE
FI
FR
DE
EL
HU
IE
IT
LV
LT
LU
MT
NLPLPT
RO
SK
SI
ES
SE
UK
2000
05
10
15
SS
C e
mplo
ye
r
0 2 4 6 8SSC employee
AT
BE
BG
HRCY
CZ
DK
EE
FI
FR
DE
EL
HU
IE
IT
LV
LT
LU
MT
NLPL PT
RO
SK
SI
ES
SE
UK
2000
05
10
15
SS
C e
mplo
ye
r
0 5 10 15 20 25Personal Income Tax
AT
BE
CZ
DK
EE
FI
FRDE
EL
HU
IE
LU
IT
NLPL
PTSI
ES
SE
UK
20
30
40
50
60
Avera
ge t
ax w
edg
e
1 1.2 1.4 1.6 1.8Progressivity Total
AT
BE
CZ
DK
EE
FI
FR
DE
EL
HUIE
LUIT
NL
PL
PT
SI
ESSEUK
010
20
30
40
Avera
ge t
ax P
IT
1 1.5 2 2.5 3 3.5Progressivity PIT
AT BE
CZEE
FI
FR
DE
ELHU
IE
LU
IT
NL
PL
PT
SI
ESSE
UK
010
20
30
Avera
ge t
ax S
SC
em
plo
yers
.4 .6 .8 1 1.2Progressivity SSC employers
AT
BE
CZ
DK
EE
FI
FR
DE
EL
HU
IE
LU
IT
NL
PL
PT
SI
ESSE
UK
05
10
15
20
Avera
ge t
ax S
SC
em
plo
yees
0 .5 1Progressivity SSC employees
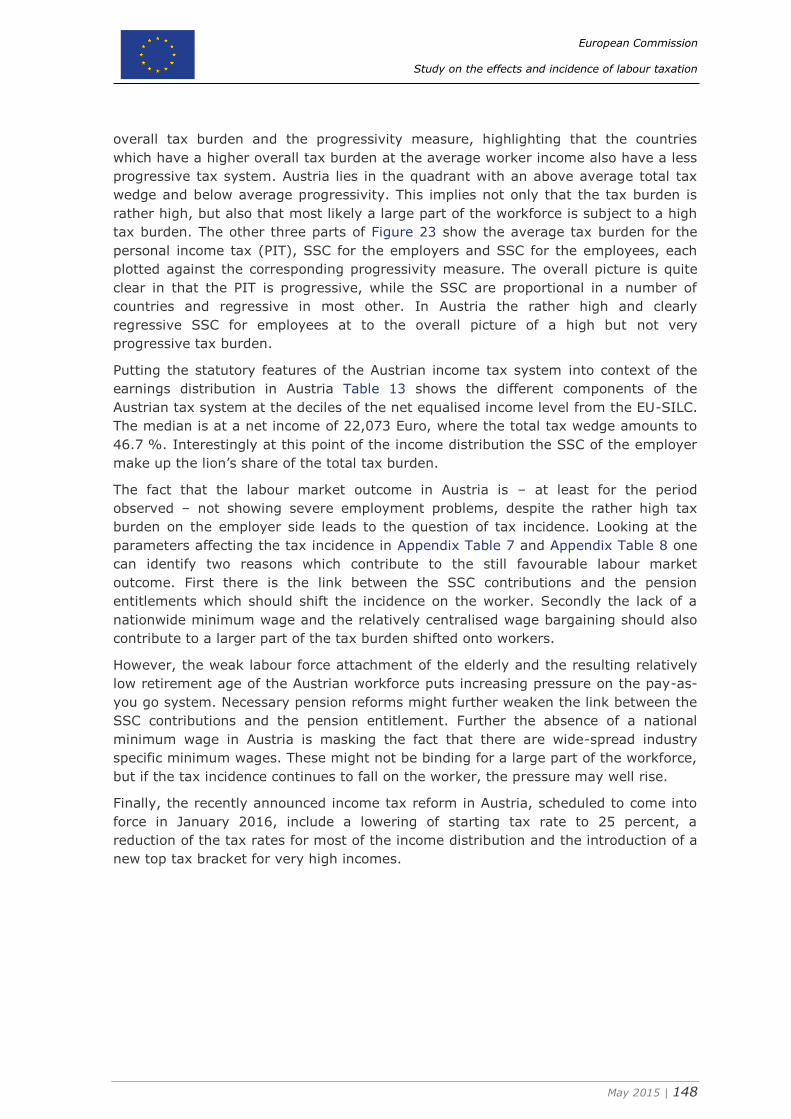
European Commission
Study on the effects and incidence of labour taxation
May 2015 | 148
overall tax burden and the progressivity measure, highlighting that the countries
which have a higher overall tax burden at the average worker income also have a less
progressive tax system. Austria lies in the quadrant with an above average total tax
wedge and below average progressivity. This implies not only that the tax burden is
rather high, but also that most likely a large part of the workforce is subject to a high
tax burden. The other three parts of Figure 23 show the average tax burden for the
personal income tax (PIT), SSC for the employers and SSC for the employees, each
plotted against the corresponding progressivity measure. The overall picture is quite
clear in that the PIT is progressive, while the SSC are proportional in a number of
countries and regressive in most other. In Austria the rather high and clearly
regressive SSC for employees at to the overall picture of a high but not very
progressive tax burden.
Putting the statutory features of the Austrian income tax system into context of the
earnings distribution in Austria Table 13 shows the different components of the
Austrian tax system at the deciles of the net equalised income level from the EU-SILC.
The median is at a net income of 22,073 Euro, where the total tax wedge amounts to
46.7 %. Interestingly at this point of the income distribution the SSC of the employer
make up the lion’s share of the total tax burden.
The fact that the labour market outcome in Austria is – at least for the period
observed – not showing severe employment problems, despite the rather high tax
burden on the employer side leads to the question of tax incidence. Looking at the
parameters affecting the tax incidence in Appendix Table 7 and Appendix Table 8 one
can identify two reasons which contribute to the still favourable labour market
outcome. First there is the link between the SSC contributions and the pension
entitlements which should shift the incidence on the worker. Secondly the lack of a
nationwide minimum wage and the relatively centralised wage bargaining should also
contribute to a larger part of the tax burden shifted onto workers.
However, the weak labour force attachment of the elderly and the resulting relatively
low retirement age of the Austrian workforce puts increasing pressure on the pay-as-
you go system. Necessary pension reforms might further weaken the link between the
SSC contributions and the pension entitlement. Further the absence of a national
minimum wage in Austria is masking the fact that there are wide-spread industry
specific minimum wages. These might not be binding for a large part of the workforce,
but if the tax incidence continues to fall on the worker, the pressure may well rise.
Finally, the recently announced income tax reform in Austria, scheduled to come into
force in January 2016, include a lowering of starting tax rate to 25 percent, a
reduction of the tax rates for most of the income distribution and the introduction of a
new top tax bracket for very high incomes.
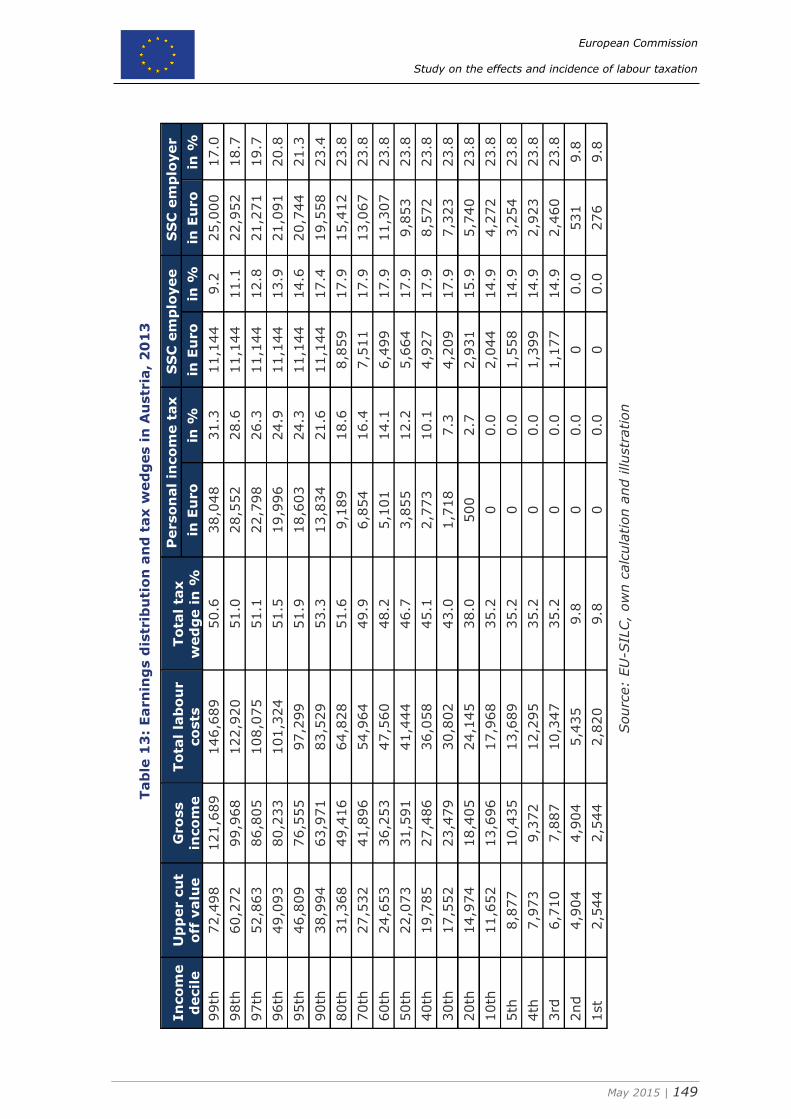
European Commission
Study on the effects and incidence of labour taxation
May 2015 | 149
Tab
le 1
3:
Earn
ing
s d
istr
ibu
tio
n a
nd
tax w
ed
ges i
n A
ustr
ia,
20
13
In
co
me
decil
e
Up
per c
ut
off
valu
e
Gro
ss
inco
me
To
tal
lab
ou
r
co
sts
To
tal
tax
wed
ge in
%
Perso
nal
inco
me t
ax
S
SC
em
plo
yee
SS
C e
mp
loyer
in E
uro
in
%
in E
uro
in
%
in E
uro
in
%
99th
72,4
98
121,6
89
146,6
89
50.6
38,0
48
31.3
11,1
44
9.2
25,0
00
17.0
98th
60,2
72
99,9
68
122,9
20
51.0
28,5
52
28.6
11,1
44
11.1
22,9
52
18.7
97th
52,8
63
86,8
05
108,0
75
51.1
22,7
98
26.3
11,1
44
12.8
21,2
71
19.7
96th
49,0
93
80,2
33
101,3
24
51.5
19,9
96
24.9
11,1
44
13.9
21,0
91
20.8
95th
46,8
09
76,5
55
97,2
99
51.9
18,6
03
24.3
11,1
44
14.6
20,7
44
21.3
90th
38,9
94
63,9
71
83,5
29
53.3
13,8
34
21.6
11,1
44
17.4
19,5
58
23.4
80th
31,3
68
49,4
16
64,8
28
51.6
9,1
89
18.6
8,8
59
17.9
15,4
12
23.8
70th
27,5
32
41,8
96
54,9
64
49.9
6,8
54
16.4
7,5
11
17.9
13,0
67
23.8
60th
24,6
53
36,2
53
47,5
60
48.2
5,1
01
14.1
6,4
99
17.9
11,3
07
23.8
50th
22,0
73
31,5
91
41,4
44
46.7
3,8
55
12.2
5,6
64
17.9
9,8
53
23.8
40th
19,7
85
27,4
86
36,0
58
45.1
2,7
73
10.1
4,9
27
17.9
8,5
72
23.8
30th
17,5
52
23,4
79
30,8
02
43.0
1,7
18
7.3
4,2
09
17.9
7,3
23
23.8
20th
14,9
74
18,4
05
24,1
45
38.0
500
2.7
2,9
31
15.9
5,7
40
23.8
10th
11,6
52
13,6
96
17,9
68
35.2
0
0.0
2,0
44
14.9
4,2
72
23.8
5th
8,8
77
10,4
35
13,6
89
35.2
0
0.0
1,5
58
14.9
3,2
54
23.8
4th
7,9
73
9,3
72
12,2
95
35.2
0
0.0
1,3
99
14.9
2,9
23
23.8
3rd
6,7
10
7,8
87
10,3
47
35.2
0
0.0
1,1
77
14.9
2,4
60
23.8
2nd
4,9
04
4,9
04
5,4
35
9.8
0
0.0
0
0.0
531
9.8
1st
2,5
44
2,5
44
2,8
20
9.8
0
0.0
0
0.0
276
9.8
Sourc
e:
EU
-SIL
C,
ow
n c
alc
ula
tion a
nd illustr
ation
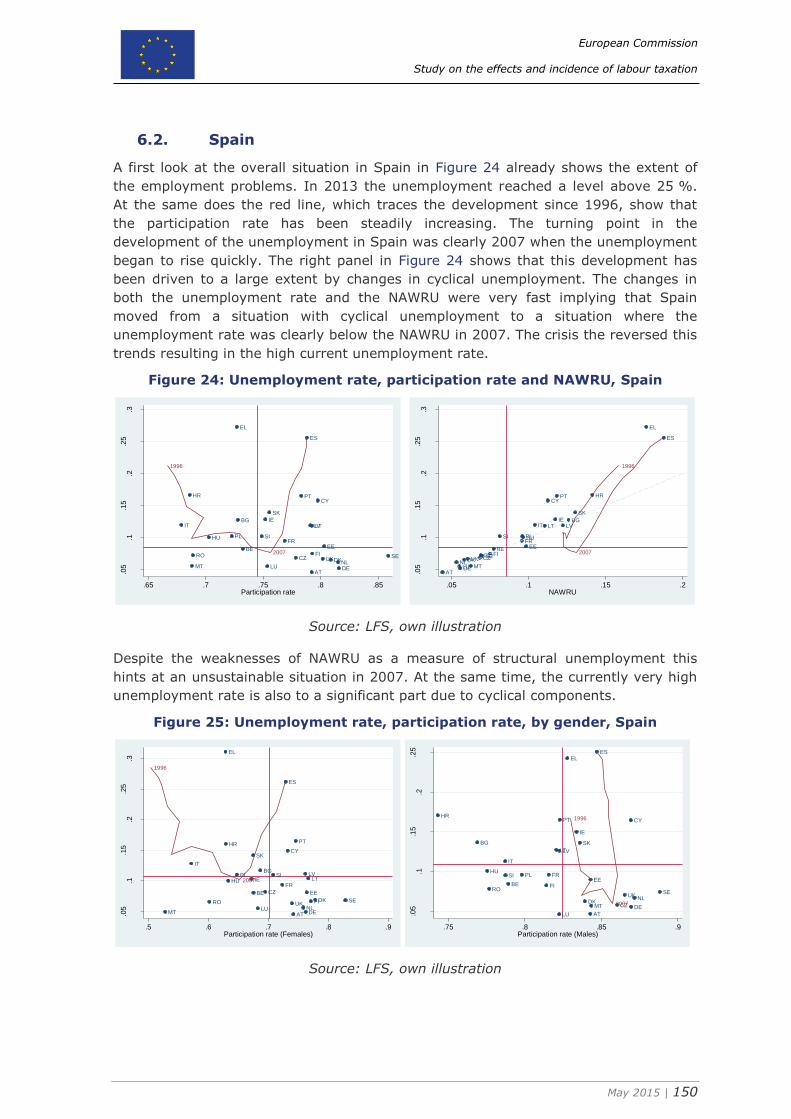
European Commission
Study on the effects and incidence of labour taxation
May 2015 | 150
6.2. Spain
A first look at the overall situation in Spain in Figure 24 already shows the extent of
the employment problems. In 2013 the unemployment reached a level above 25 %.
At the same does the red line, which traces the development since 1996, show that
the participation rate has been steadily increasing. The turning point in the
development of the unemployment in Spain was clearly 2007 when the unemployment
began to rise quickly. The right panel in Figure 24 shows that this development has
been driven to a large extent by changes in cyclical unemployment. The changes in
both the unemployment rate and the NAWRU were very fast implying that Spain
moved from a situation with cyclical unemployment to a situation where the
unemployment rate was clearly below the NAWRU in 2007. The crisis the reversed this
trends resulting in the high current unemployment rate.
Figure 24: Unemployment rate, participation rate and NAWRU, Spain
Source: LFS, own illustration
Despite the weaknesses of NAWRU as a measure of structural unemployment this
hints at an unsustainable situation in 2007. At the same time, the currently very high
unemployment rate is also to a significant part due to cyclical components.
Figure 25: Unemployment rate, participation rate, by gender, Spain
Source: LFS, own illustration
AT
BE
BG
CY
CZ
DE
DK
EE
EL
ES
FI
FR
HR
HU
IEIT LT
LU
LV
MTNL
PL
PT
RO SE
SI
SK
UK
1996
2007
.05
.1.1
5.2
.25
.3
Une
mplo
ym
ent ra
te
.65 .7 .75 .8 .85Participation rate
AT
BE
BG
CY
CZ
DE
DK
EE
EL
ES
FI
FR
HR
HU
IEIT LT
LU
LV
MTNL
PL
PT
ROSE
SI
SK
UK
1996
2007
.05
.1.1
5.2
.25
.3
Une
mplo
ym
ent ra
te
.05 .1 .15 .2NAWRU
AT
BE
BG
CY
CZ
DE
DK
EE
EL
ES
FI
FR
HR
HU IE
IT
LT
LU
LV
MTNL
PL
PT
RO SE
SI
SK
UK
1996
2007
.05
.1.1
5.2
.25
.3
Une
mplo
ym
ent ra
te (
Fe
male
s)
.5 .6 .7 .8 .9Participation rate (Females)
AT
BE
BG
CY
CZ DEDK
EE
ELES
FI
FR
HR
HU
IE
IT
LT
LU
LV
MT
NL
PL
PT
ROSE
SI
SK
UK
1996
2007
.05
.1.1
5.2
.25
Une
mplo
ym
ent ra
te (
Male
s)
.75 .8 .85 .9Participation rate (Males)
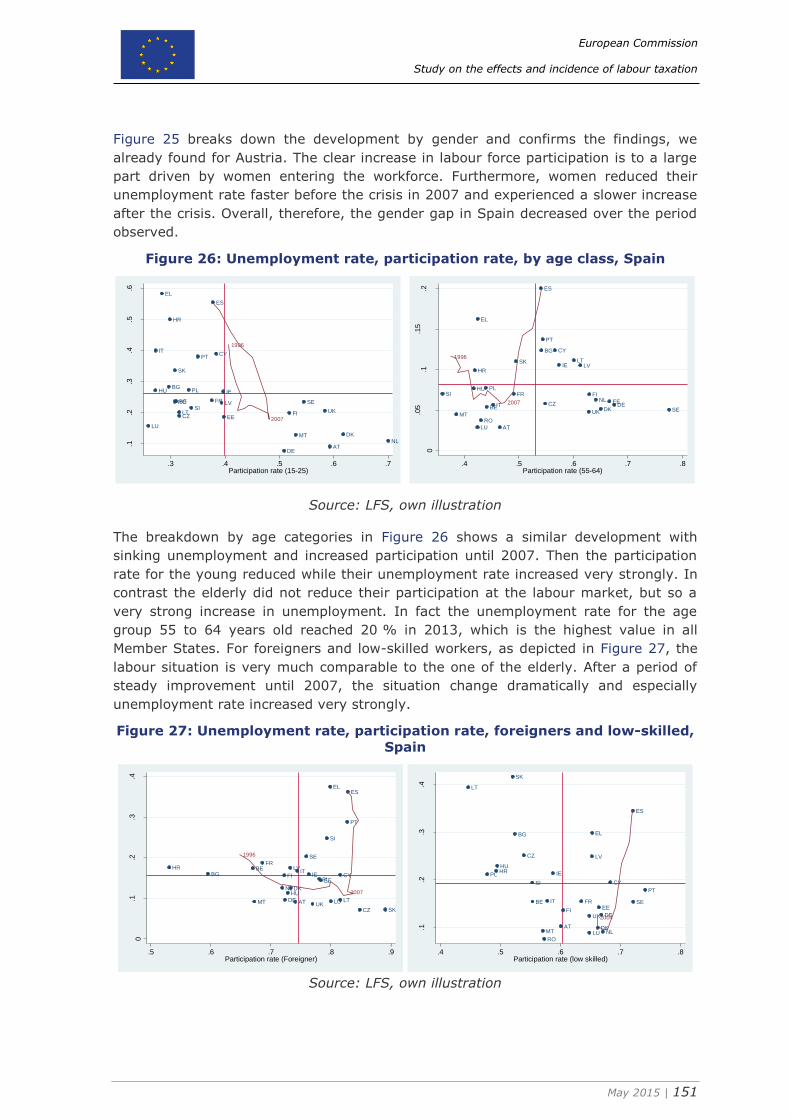
European Commission
Study on the effects and incidence of labour taxation
May 2015 | 151
Figure 25 breaks down the development by gender and confirms the findings, we
already found for Austria. The clear increase in labour force participation is to a large
part driven by women entering the workforce. Furthermore, women reduced their
unemployment rate faster before the crisis in 2007 and experienced a slower increase
after the crisis. Overall, therefore, the gender gap in Spain decreased over the period
observed.
Figure 26: Unemployment rate, participation rate, by age class, Spain
Source: LFS, own illustration
The breakdown by age categories in Figure 26 shows a similar development with
sinking unemployment and increased participation until 2007. Then the participation
rate for the young reduced while their unemployment rate increased very strongly. In
contrast the elderly did not reduce their participation at the labour market, but so a
very strong increase in unemployment. In fact the unemployment rate for the age
group 55 to 64 years old reached 20 % in 2013, which is the highest value in all
Member States. For foreigners and low-skilled workers, as depicted in Figure 27, the
labour situation is very much comparable to the one of the elderly. After a period of
steady improvement until 2007, the situation change dramatically and especially
unemployment rate increased very strongly.
Figure 27: Unemployment rate, participation rate, foreigners and low-skilled,
Spain
Source: LFS, own illustration
AT
BE
BG
HR
CY
CZ
DK
EEFI
FR
DE
EL
HU IE
IT
LV
LT
LU
MTNL
PL
PT
RO
SK
SI
ES
SE
UK
1996
2007
.1.2
.3.4
.5.6
Une
mplo
ym
ent ra
te (
15
-25
)
.3 .4 .5 .6 .7Participation rate (15-25)
AT
BE
BG
HR
CY
CZDK
EE
FIFR
DE
EL
HU
IE
IT
LVLT
LU
MT
NL
PL
PT
RO
SK
SI
ES
SEUK
1996
2007
0
.05
.1.1
5.2
Une
mplo
ym
ent ra
te (
55
-64
)
.4 .5 .6 .7 .8Participation rate (55-64)
AT
BEBG
HR
CY
CZ
DK
EEFI
FR
DE
EL
HU
IEIT
LV
LTLUMT
NL
PL
PT
SK
SI
ES
SE
UK
1996
2007
0.1
.2.3
.4
Une
mplo
ym
ent ra
te (
Fo
reig
ner)
.5 .6 .7 .8 .9Participation rate (Foreigner)
AT
BE
BG
HR
CY
CZ
DK
EEFI
FR
DE
EL
HU
IE
IT
LV
LT
LUMT NL
PL
PT
RO
SK
SI
ES
SE
UK2004
.1.2
.3.4
Une
mplo
ym
ent ra
te (
low
skill
ed)
.4 .5 .6 .7 .8Participation rate (low skilled)
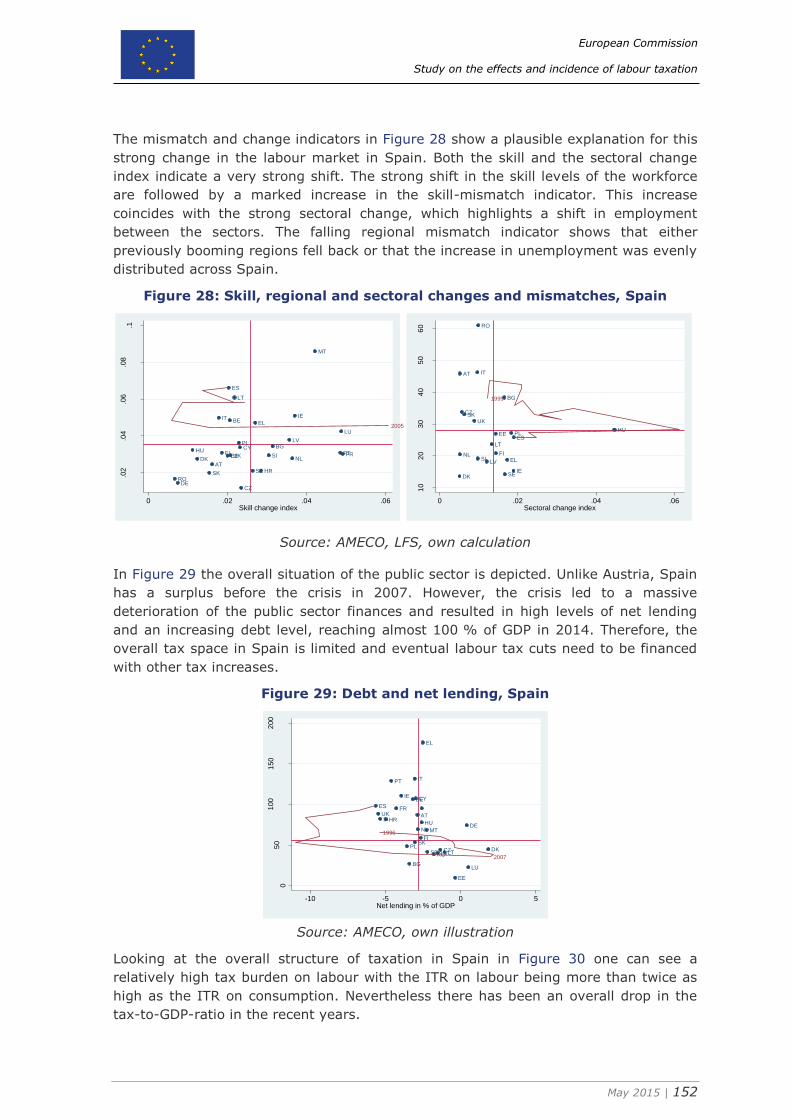
European Commission
Study on the effects and incidence of labour taxation
May 2015 | 152
The mismatch and change indicators in Figure 28 show a plausible explanation for this
strong change in the labour market in Spain. Both the skill and the sectoral change
index indicate a very strong shift. The strong shift in the skill levels of the workforce
are followed by a marked increase in the skill-mismatch indicator. This increase
coincides with the strong sectoral change, which highlights a shift in employment
between the sectors. The falling regional mismatch indicator shows that either
previously booming regions fell back or that the increase in unemployment was evenly
distributed across Spain.
Figure 28: Skill, regional and sectoral changes and mismatches, Spain
Source: AMECO, LFS, own calculation
In Figure 29 the overall situation of the public sector is depicted. Unlike Austria, Spain
has a surplus before the crisis in 2007. However, the crisis led to a massive
deterioration of the public sector finances and resulted in high levels of net lending
and an increasing debt level, reaching almost 100 % of GDP in 2014. Therefore, the
overall tax space in Spain is limited and eventual labour tax cuts need to be financed
with other tax increases.
Figure 29: Debt and net lending, Spain
Source: AMECO, own illustration
Looking at the overall structure of taxation in Spain in Figure 30 one can see a
relatively high tax burden on labour with the ITR on labour being more than twice as
high as the ITR on consumption. Nevertheless there has been an overall drop in the
tax-to-GDP-ratio in the recent years.
AT
BE
BG
HR
CY
CZ
DKEE
FI FR
DE
EL
HU
IEIT
LV
LT
LU
MT
NL
PL
PT
ROSK
SI
ES
SE
UK
2005
.02
.04
.06
.08
.1
Skill
mis
matc
h in
dex
0 .02 .04 .06Skill change index
AT
BG
CZ
DK
EE
FIEL
HU
IE
IT
LV
LT
NL
PL
RO
SK
SI
ES
SE
UK
1999
10
20
30
40
50
60
Reg
iona
l m
ism
atc
h in
de
x
0 .02 .04 .06Sectoral change index
AT
BE
BG
HR
CY
CZ DK
EE
FI
FR
DE
EL
HU
IE
IT
LVLT
LU
MTNL
PL
PT
RO
SK
SI
ES
SE
UK
1996
2007
05
01
00
150
200
Deb
t in
% o
f G
DP
-10 -5 0 5Net lending in % of GDP
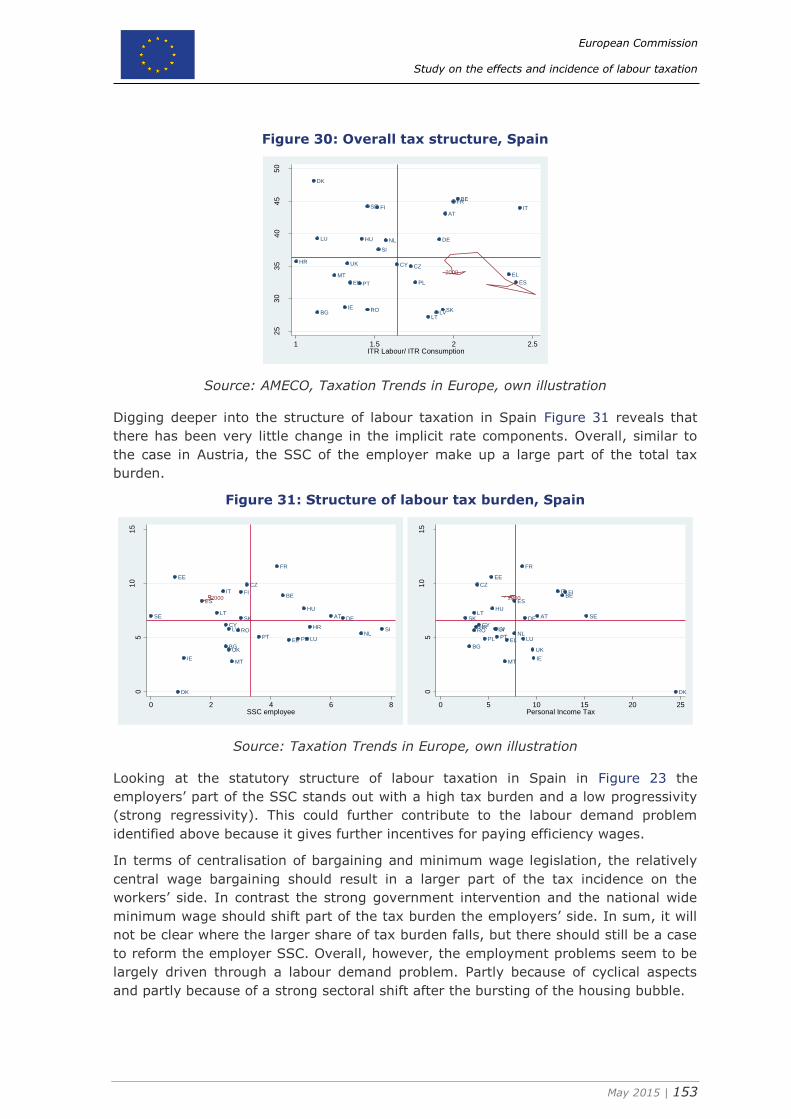
European Commission
Study on the effects and incidence of labour taxation
May 2015 | 153
Figure 30: Overall tax structure, Spain
Source: AMECO, Taxation Trends in Europe, own illustration
Digging deeper into the structure of labour taxation in Spain Figure 31 reveals that
there has been very little change in the implicit rate components. Overall, similar to
the case in Austria, the SSC of the employer make up a large part of the total tax
burden.
Figure 31: Structure of labour tax burden, Spain
Source: Taxation Trends in Europe, own illustration
Looking at the statutory structure of labour taxation in Spain in Figure 23 the
employers’ part of the SSC stands out with a high tax burden and a low progressivity
(strong regressivity). This could further contribute to the labour demand problem
identified above because it gives further incentives for paying efficiency wages.
In terms of centralisation of bargaining and minimum wage legislation, the relatively
central wage bargaining should result in a larger part of the tax incidence on the
workers’ side. In contrast the strong government intervention and the national wide
minimum wage should shift part of the tax burden the employers’ side. In sum, it will
not be clear where the larger share of tax burden falls, but there should still be a case
to reform the employer SSC. Overall, however, the employment problems seem to be
largely driven through a labour demand problem. Partly because of cyclical aspects
and partly because of a strong sectoral shift after the bursting of the housing bubble.
AT
BE
BG
HRCY CZ
DK
EE
FIFR
DE
EL
HU
IE
IT
LVLT
LU
MT
NL
PLPT
RO SK
SI
ES
SE
UK
20002
53
03
54
04
55
0
Tax-t
o-G
DP
ratio
1 1.5 2 2.5ITR Labour/ ITR Consumption
AT
BE
BG
HRCY
CZ
DK
EE
FI
FR
DE
EL
HU
IE
IT
LV
LT
LU
MT
NLPLPT
RO
SK
SI
ES
SE
UK
2000
05
10
15
SS
C e
mplo
ye
r
0 2 4 6 8SSC employee
AT
BE
BG
HRCY
CZ
DK
EE
FI
FR
DE
EL
HU
IE
IT
LV
LT
LU
MT
NLPL PT
RO
SK
SI
ES
SE
UK
2000
05
10
15
SS
C e
mplo
ye
r
0 5 10 15 20 25Personal Income Tax
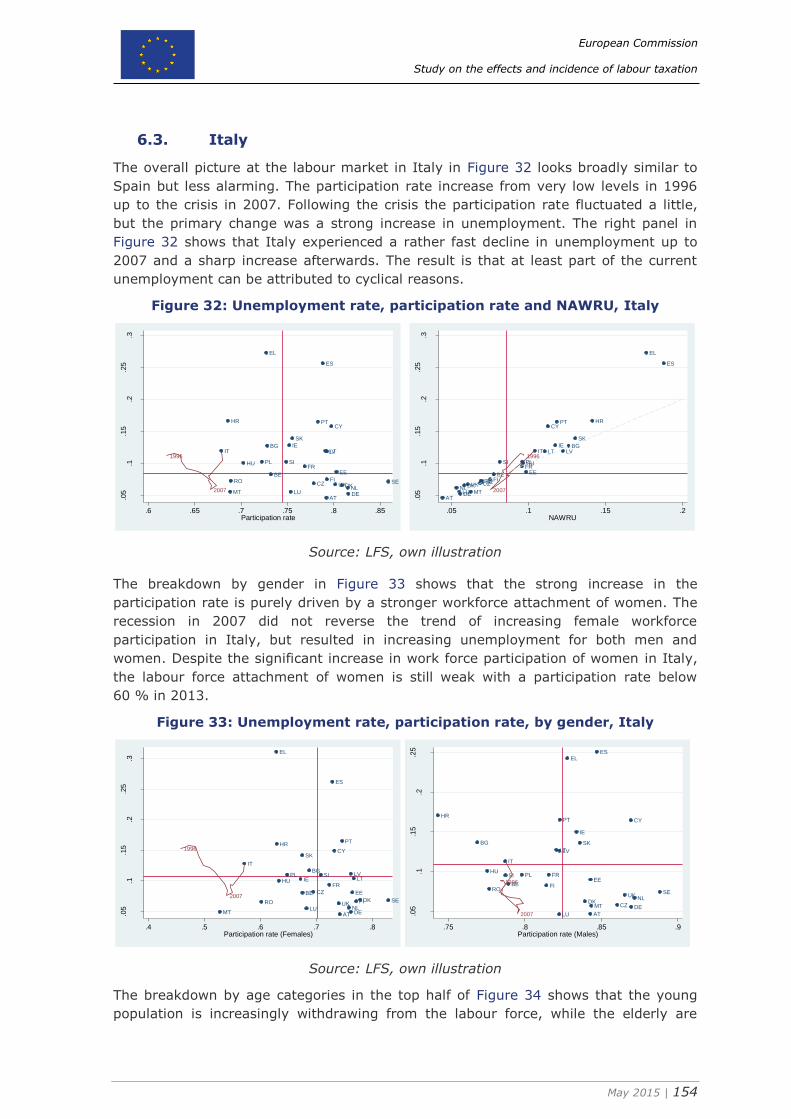
European Commission
Study on the effects and incidence of labour taxation
May 2015 | 154
6.3. Italy
The overall picture at the labour market in Italy in Figure 32 looks broadly similar to
Spain but less alarming. The participation rate increase from very low levels in 1996
up to the crisis in 2007. Following the crisis the participation rate fluctuated a little,
but the primary change was a strong increase in unemployment. The right panel in
Figure 32 shows that Italy experienced a rather fast decline in unemployment up to
2007 and a sharp increase afterwards. The result is that at least part of the current
unemployment can be attributed to cyclical reasons.
Figure 32: Unemployment rate, participation rate and NAWRU, Italy
Source: LFS, own illustration
The breakdown by gender in Figure 33 shows that the strong increase in the
participation rate is purely driven by a stronger workforce attachment of women. The
recession in 2007 did not reverse the trend of increasing female workforce
participation in Italy, but resulted in increasing unemployment for both men and
women. Despite the significant increase in work force participation of women in Italy,
the labour force attachment of women is still weak with a participation rate below
60 % in 2013.
Figure 33: Unemployment rate, participation rate, by gender, Italy
Source: LFS, own illustration
The breakdown by age categories in the top half of Figure 34 shows that the young
population is increasingly withdrawing from the labour force, while the elderly are
AT
BE
BG
CY
CZ
DE
DK
EE
EL
ES
FI
FR
HR
HU
IEIT LT
LU
LV
MTNL
PL
PT
RO SE
SI
SK
UK
1996
2007
.05
.1.1
5.2
.25
.3
Une
mplo
ym
ent ra
te
.6 .65 .7 .75 .8 .85Participation rate
AT
BE
BG
CY
CZ
DE
DK
EE
EL
ES
FI
FR
HR
HU
IEIT LT
LU
LV
MTNL
PL
PT
ROSE
SI
SK
UK
1996
2007
.05
.1.1
5.2
.25
.3
Une
mplo
ym
ent ra
te
.05 .1 .15 .2NAWRU
AT
BE
BG
CY
CZ
DE
DK
EE
EL
ES
FI
FR
HR
HU IE
IT
LT
LU
LV
MTNL
PL
PT
RO SE
SI
SK
UK
1996
2007
.05
.1.1
5.2
.25
.3
Une
mplo
ym
ent ra
te (
Fe
male
s)
.4 .5 .6 .7 .8Participation rate (Females)
AT
BE
BG
CY
CZ DEDK
EE
ELES
FI
FR
HR
HU
IE
IT
LT
LU
LV
MT
NL
PL
PT
ROSE
SI
SK
UK
1996
2007.05
.1.1
5.2
.25
Une
mplo
ym
ent ra
te (
Male
s)
.75 .8 .85 .9Participation rate (Males)
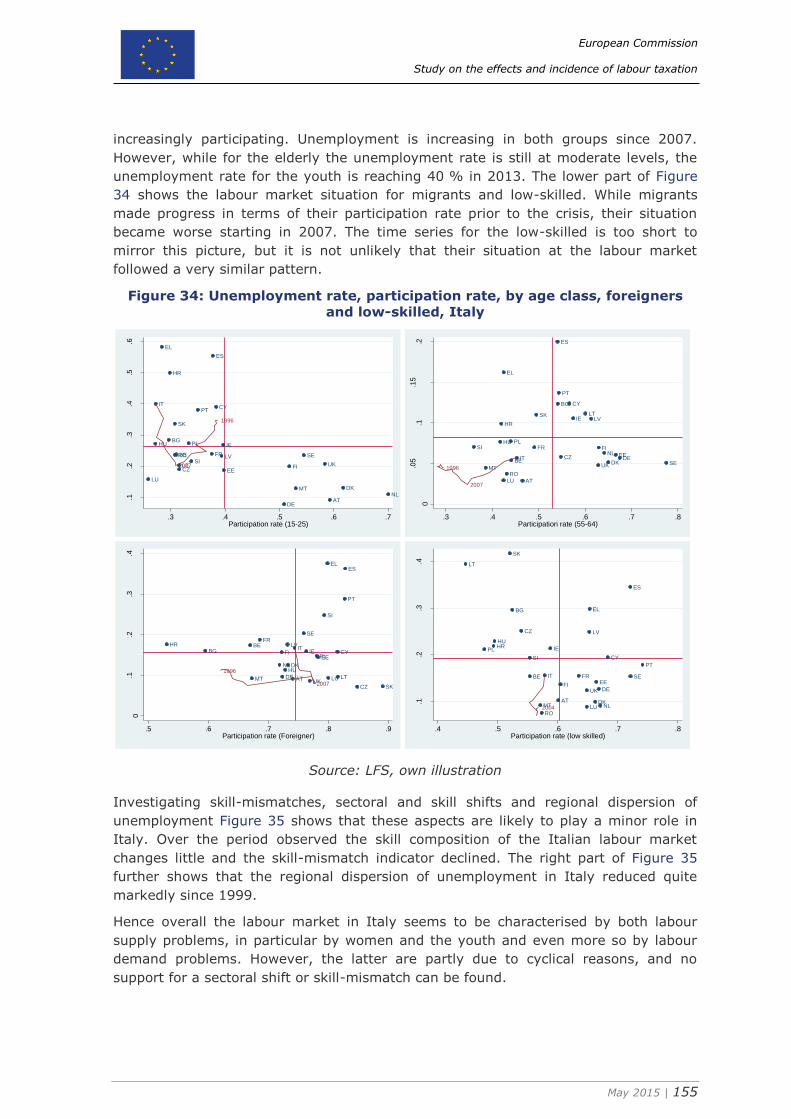
European Commission
Study on the effects and incidence of labour taxation
May 2015 | 155
increasingly participating. Unemployment is increasing in both groups since 2007.
However, while for the elderly the unemployment rate is still at moderate levels, the
unemployment rate for the youth is reaching 40 % in 2013. The lower part of Figure
34 shows the labour market situation for migrants and low-skilled. While migrants
made progress in terms of their participation rate prior to the crisis, their situation
became worse starting in 2007. The time series for the low-skilled is too short to
mirror this picture, but it is not unlikely that their situation at the labour market
followed a very similar pattern.
Figure 34: Unemployment rate, participation rate, by age class, foreigners
and low-skilled, Italy
Source: LFS, own illustration
Investigating skill-mismatches, sectoral and skill shifts and regional dispersion of
unemployment Figure 35 shows that these aspects are likely to play a minor role in
Italy. Over the period observed the skill composition of the Italian labour market
changes little and the skill-mismatch indicator declined. The right part of Figure 35
further shows that the regional dispersion of unemployment in Italy reduced quite
markedly since 1999.
Hence overall the labour market in Italy seems to be characterised by both labour
supply problems, in particular by women and the youth and even more so by labour
demand problems. However, the latter are partly due to cyclical reasons, and no
support for a sectoral shift or skill-mismatch can be found.
AT
BE
BG
HR
CY
CZ
DK
EEFI
FR
DE
EL
HU IE
IT
LV
LT
LU
MTNL
PL
PT
RO
SK
SI
ES
SE
UK
1996
2007
.1.2
.3.4
.5.6
Une
mplo
ym
ent ra
te (
15
-25
)
.3 .4 .5 .6 .7Participation rate (15-25)
AT
BE
BG
HR
CY
CZDK
EE
FIFR
DE
EL
HU
IE
IT
LVLT
LU
MT
NL
PL
PT
RO
SK
SI
ES
SEUK1996
2007
0
.05
.1.1
5.2
Une
mplo
ym
ent ra
te (
55
-64
)
.3 .4 .5 .6 .7 .8Participation rate (55-64)
AT
BEBG
HR
CY
CZ
DK
EEFI
FR
DE
EL
HU
IEIT
LV
LTLUMT
NL
PL
PT
SK
SI
ES
SE
UK
1996
2007
0.1
.2.3
.4
Une
mplo
ym
ent ra
te (
Fo
reig
ner)
.5 .6 .7 .8 .9Participation rate (Foreigner)
AT
BE
BG
HR
CY
CZ
DK
EEFI
FR
DE
EL
HU
IE
IT
LV
LT
LUMT NL
PL
PT
RO
SK
SI
ES
SE
UK
2004
.1.2
.3.4
Une
mplo
ym
ent ra
te (
low
skill
ed)
.4 .5 .6 .7 .8Participation rate (low skilled)
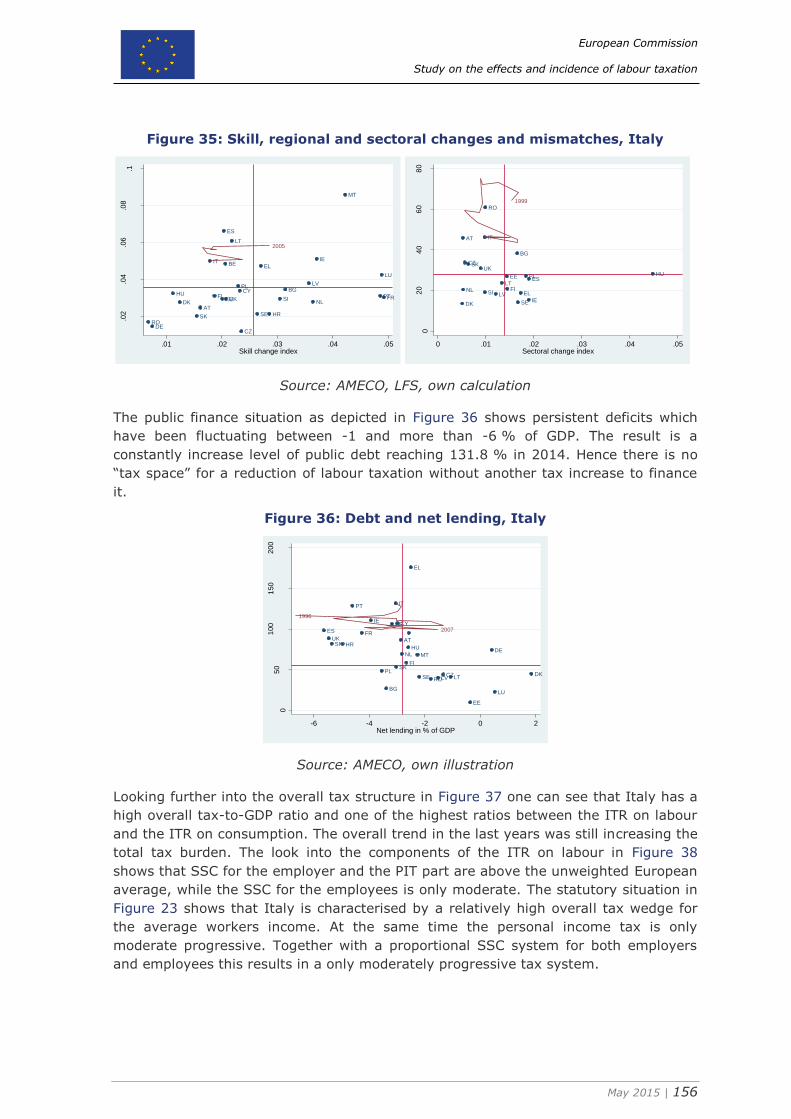
European Commission
Study on the effects and incidence of labour taxation
May 2015 | 156
Figure 35: Skill, regional and sectoral changes and mismatches, Italy
Source: AMECO, LFS, own calculation
The public finance situation as depicted in Figure 36 shows persistent deficits which
have been fluctuating between -1 and more than -6 % of GDP. The result is a
constantly increase level of public debt reaching 131.8 % in 2014. Hence there is no
“tax space” for a reduction of labour taxation without another tax increase to finance
it.
Figure 36: Debt and net lending, Italy
Source: AMECO, own illustration
Looking further into the overall tax structure in Figure 37 one can see that Italy has a
high overall tax-to-GDP ratio and one of the highest ratios between the ITR on labour
and the ITR on consumption. The overall trend in the last years was still increasing the
total tax burden. The look into the components of the ITR on labour in Figure 38
shows that SSC for the employer and the PIT part are above the unweighted European
average, while the SSC for the employees is only moderate. The statutory situation in
Figure 23 shows that Italy is characterised by a relatively high overall tax wedge for
the average workers income. At the same time the personal income tax is only
moderate progressive. Together with a proportional SSC system for both employers
and employees this results in a only moderately progressive tax system.
AT
BE
BG
HR
CY
CZ
DKEE
FI FR
DE
EL
HU
IEIT
LV
LT
LU
MT
NL
PL
PT
ROSK
SI
ES
SE
UK
2005
.02
.04
.06
.08
.1
Skill
mis
matc
h in
dex
.01 .02 .03 .04 .05Skill change index
AT
BG
CZ
DK
EE
FIEL
HU
IE
IT
LV
LTNL
PL
RO
SK
SI
ES
SE
UK
1999
02
04
06
08
0
Reg
iona
l m
ism
atc
h in
de
x
0 .01 .02 .03 .04 .05Sectoral change index
AT
BE
BG
HR
CY
CZ DK
EE
FI
FR
DE
EL
HU
IE
IT
LV LT
LU
MTNL
PL
PT
RO
SK
SI
ES
SE
UK
1996
2007
05
01
00
150
200
Deb
t in
% o
f G
DP
-6 -4 -2 0 2Net lending in % of GDP
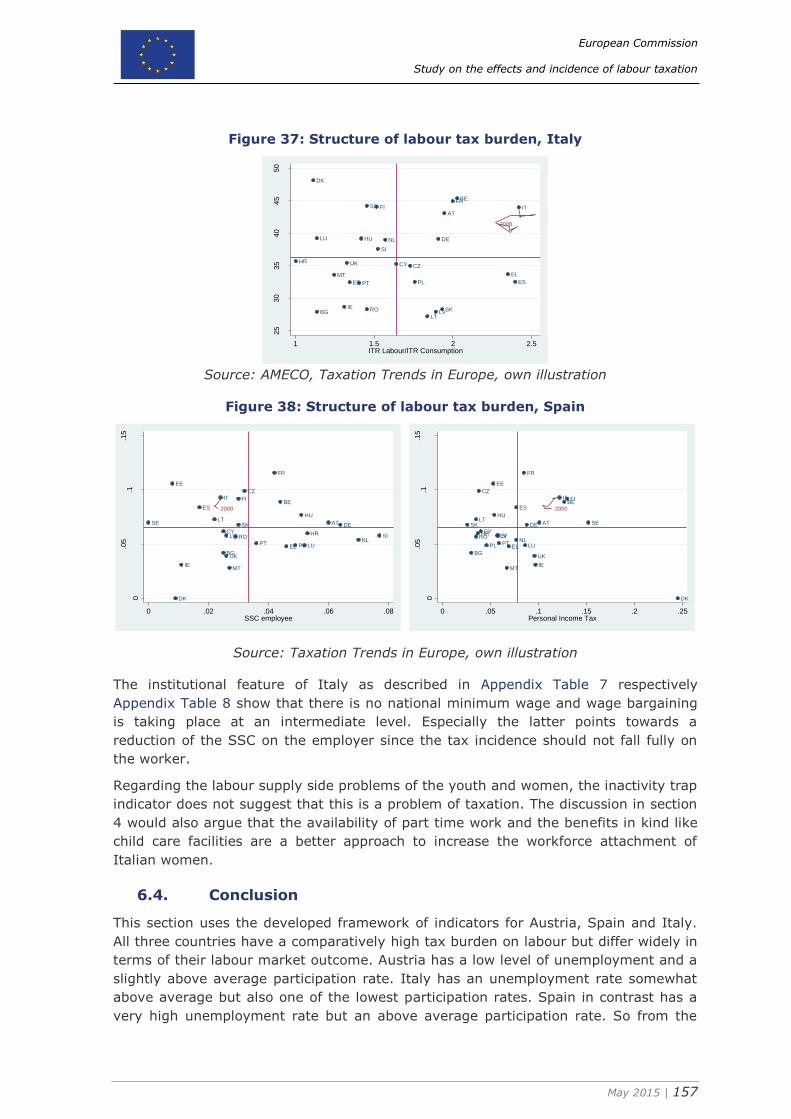
European Commission
Study on the effects and incidence of labour taxation
May 2015 | 157
Figure 37: Structure of labour tax burden, Italy
Source: AMECO, Taxation Trends in Europe, own illustration
Figure 38: Structure of labour tax burden, Spain
Source: Taxation Trends in Europe, own illustration
The institutional feature of Italy as described in Appendix Table 7 respectively
Appendix Table 8 show that there is no national minimum wage and wage bargaining
is taking place at an intermediate level. Especially the latter points towards a
reduction of the SSC on the employer since the tax incidence should not fall fully on
the worker.
Regarding the labour supply side problems of the youth and women, the inactivity trap
indicator does not suggest that this is a problem of taxation. The discussion in section
4 would also argue that the availability of part time work and the benefits in kind like
child care facilities are a better approach to increase the workforce attachment of
Italian women.
6.4. Conclusion
This section uses the developed framework of indicators for Austria, Spain and Italy.
All three countries have a comparatively high tax burden on labour but differ widely in
terms of their labour market outcome. Austria has a low level of unemployment and a
slightly above average participation rate. Italy has an unemployment rate somewhat
above average but also one of the lowest participation rates. Spain in contrast has a
very high unemployment rate but an above average participation rate. So from the
AT
BE
BG
HRCY CZ
DK
EE
FIFR
DE
EL
HU
IE
IT
LVLT
LU
MT
NL
PLPT
RO SK
SI
ES
SE
UK
2000
25
30
35
40
45
50
Tax-t
o-G
DP
ratio
1 1.5 2 2.5ITR Labour/ITR Consumption
AT
BE
BG
HRCY
CZ
DK
EE
FI
FR
DE
EL
HU
IE
IT
LV
LT
LU
MT
NLPLPT
RO
SK
SI
ES
SE
UK
2000
0
.05
.1.1
5
SS
C e
mp
loyer
0 .02 .04 .06 .08SSC employee
AT
BE
BG
HRCY
CZ
DK
EE
FI
FR
DE
EL
HU
IE
IT
LV
LT
LU
MT
NLPL PT
RO
SK
SI
ES
SE
UK
2000
0
.05
.1.1
5
SS
C e
mp
loyer
0 .05 .1 .15 .2 .25Personal Income Tax
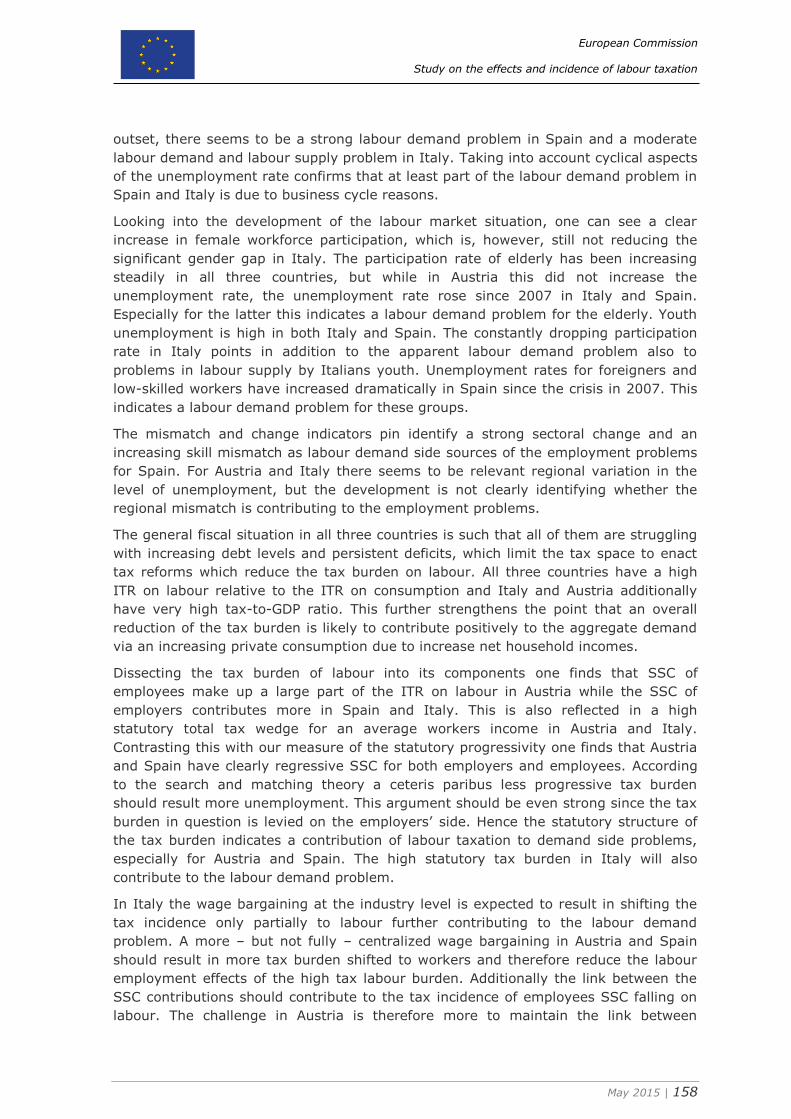
European Commission
Study on the effects and incidence of labour taxation
May 2015 | 158
outset, there seems to be a strong labour demand problem in Spain and a moderate
labour demand and labour supply problem in Italy. Taking into account cyclical aspects
of the unemployment rate confirms that at least part of the labour demand problem in
Spain and Italy is due to business cycle reasons.
Looking into the development of the labour market situation, one can see a clear
increase in female workforce participation, which is, however, still not reducing the
significant gender gap in Italy. The participation rate of elderly has been increasing
steadily in all three countries, but while in Austria this did not increase the
unemployment rate, the unemployment rate rose since 2007 in Italy and Spain.
Especially for the latter this indicates a labour demand problem for the elderly. Youth
unemployment is high in both Italy and Spain. The constantly dropping participation
rate in Italy points in addition to the apparent labour demand problem also to
problems in labour supply by Italians youth. Unemployment rates for foreigners and
low-skilled workers have increased dramatically in Spain since the crisis in 2007. This
indicates a labour demand problem for these groups.
The mismatch and change indicators pin identify a strong sectoral change and an
increasing skill mismatch as labour demand side sources of the employment problems
for Spain. For Austria and Italy there seems to be relevant regional variation in the
level of unemployment, but the development is not clearly identifying whether the
regional mismatch is contributing to the employment problems.
The general fiscal situation in all three countries is such that all of them are struggling
with increasing debt levels and persistent deficits, which limit the tax space to enact
tax reforms which reduce the tax burden on labour. All three countries have a high
ITR on labour relative to the ITR on consumption and Italy and Austria additionally
have very high tax-to-GDP ratio. This further strengthens the point that an overall
reduction of the tax burden is likely to contribute positively to the aggregate demand
via an increasing private consumption due to increase net household incomes.
Dissecting the tax burden of labour into its components one finds that SSC of
employees make up a large part of the ITR on labour in Austria while the SSC of
employers contributes more in Spain and Italy. This is also reflected in a high
statutory total tax wedge for an average workers income in Austria and Italy.
Contrasting this with our measure of the statutory progressivity one finds that Austria
and Spain have clearly regressive SSC for both employers and employees. According
to the search and matching theory a ceteris paribus less progressive tax burden
should result more unemployment. This argument should be even strong since the tax
burden in question is levied on the employers’ side. Hence the statutory structure of
the tax burden indicates a contribution of labour taxation to demand side problems,
especially for Austria and Spain. The high statutory tax burden in Italy will also
contribute to the labour demand problem.
In Italy the wage bargaining at the industry level is expected to result in shifting the
tax incidence only partially to labour further contributing to the labour demand
problem. A more – but not fully – centralized wage bargaining in Austria and Spain
should result in more tax burden shifted to workers and therefore reduce the labour
employment effects of the high tax labour burden. Additionally the link between the
SSC contributions should contribute to the tax incidence of employees SSC falling on
labour. The challenge in Austria is therefore more to maintain the link between

European Commission
Study on the effects and incidence of labour taxation
May 2015 | 159
benefits and entitlement in the pay-as-you-go system with a continuing low
participation rate of the elderly.
European Commission
Study on the effects and incidence of labour taxation
May 2015 | 160
References Aaberge, R., U. Colombino and S. Strøm (1999), Labor Supply in Italy: An
Empirical Analysis of Joint Household Decisions, with Taxes and Quantity Constraints,
Journal of Applied Econometrics, Vol. 14, pp. 403-422.
Aaron, H. J. and W. G. Gale (1986) Economic Effects of Fundamental Tax Reform,
Brookings Institution Press.
Abraham, K. G., and L. F. Katz (1986), Cyclical Unemployment: Sectoral Shifts or
Aggregate Disturbances? Journal of Political Economy, Vol. 94, pp. 507-522.
Ackers, P. (Ed.) (2002), The Employment Relationship and Family Life, Cross-
National Research Papers 6 (4).
Addabbo, T., Rodríguez-Modroño, P. and L. Gálvez-Muñoz (2015), Young people
living as couples: How women's labour supply is adapting to the crisis. Spain as a case
study, Economic Systems, in press.
Aeberhardt, R. and D. Sraer (2009), Allegements de cotisations patronales et
dynamique salariale, Economie et Statistique, Vol. 429 – 430, pp. 177 – 189.
Alesina, A. and R. Perotti (1997), The Welfare State and Competitiveness, The
American Economic Review, Vol. 87, No. 5, pp. 929 – 939.
Algan, Y. and P. Cahuc (2006), Job Protection and Family Policies: the Macho
Hypothesis, Oxford Review of Economic Policy, Vol. 22, No. 3, pp. 390-410.
Altig, D., Auerbach, A. J., Kotlikoff, L. J., Smetters, K. A. and J. Walliser
(2001), Simulating Fundamental Tax Reform in the United States, American Economic
Review, Vol. 91, No. 3, pp. 574-595.
Anderson, P. M., and B. D. Meyer (1997), The effects of firm specific taxes and
government mandate with an application to the US unemployment insurance program,
Journal of Public Economics, Vol. 75, No. 2, pp 119 – 145.
Anderson, P. M. and B. D. Meyer (2000), The effects of the unemployment
insurance payroll tax on wages, employment, claims and denials, Journal of Public
Economics, Vol. 78, No. 1, pp. 81 – 106.
Angrist, J. D and A. B. Krueger (1999), Empirical strategies in Labor Economics, in:
Handbook of labor economics, vol. 3A, Ed. Orley Ashenfelter and David Card,
Amsterdam: Elsevier, pp. 1277-1366.
Annicchiarico, B., Di Dio, F. and F. Felici (2014), Fiscal devaluation scenarios: a
quantitative assessment for the Italian economy, Department of the Treasury, Ministry
of the Economy and of Finance Working Papers No. 1.
Arias, O. S., Sánchez-Páramo, C., Dávalos, M. E.; Santos, I., Tiongson, E. R.;
Gruen, Cola; de Andrade Falcão, N., Saiovici, G., Cancho, C. A. (2014), Back to
Work: Growing with Jobs in Europe and Central Asia. Washington, DC: World Bank.
Arpaia, A. and G. Carone (2004), Do labour taxes (and their composition) affect
wages in the short and the long run, Economic Papers No. 216, European Commission.
European Commission
Study on the effects and incidence of labour taxation
May 2015 | 161
Arpaia, A., Kiss, A. and A. Turrini (2014) Is unemployment structural or cyclical?
Main features of job matching in the EU after the crisis, Economic and Financial Affairs
Economic Papers No. 527.
Ashenfelter, O. 1978, Estimating the Effect of Training Programs on Earnings,
Review of Economics and Statistics, Vol. 6, No. 1, pp. 47–57.
Ashenfelter, O., and D. Card 1985, Using the Longitudinal Structure of Earnings to
Estimate the Effect of Training Programs, Review of Economics and Statistics, Vol. 67,
No. 4, pp. 648–60.
Auerbach, A. J. and K. A. Hassett (eds, 2005), Toward Fundamental Tax Reform,
American Enterprise Institute, No. 49492.
Auerbach A. J. and L. J. Kotlikoff (1987), Dynamic fiscal policy, Cambridge
University Press, 1987.
Auten, G. and R. Caroll (1999), The Effect of Income Taxes on Household Income,
Review of Economics and Statistics, Vol. 81, No. 4, pp. 681–693.
Azemar, C. and R. Desbordes (2010), Who ultimately bears the burden of greater
non-wage costs?, Strathclyce Discussion Papers in Economics, No. 10-04.
Azmat, G. Y. (2006), The incidence of an earned income tax credit: evaluating the
impact on wages in the UK, CEP Discussion Paper No. 724, Centre for Economic
Performance.
Badel, A. and M. Huggett (2014), Taxing Top Earners: A Human Capital Perspective,
Federal Reserve Bank of St. Louis Working Paper, 2014-017A.
Ballard, C. L., D. Fullerton, J. B. Shoven, and J. Whalley (1985), A General
Equilibrium Model for Tax Policy Evaluation, University of Chicago Press.
Bardasi E. and J. C. Gornick (2000), Women and Part-time Employment: Workers’
‘Choices’ and Wage Penalties in Five Industrialised Countries’, Luxembourg Income
Study Working Paper 233.
Bardasi, E. and J. C. Gornick (2008), Working for less? Women's part-time wage
penalties across countries, Feminist Economics, Vol.14, No. 1, pp. 37-72.
Bargain, O., Beblo, M., Beninger, D., Blundell, R., Carrasco, R., Chiuri, M.-C.,
Laisney, F., Lechene, V., Moreau, N., Myck, M., Ruiz-Castillo, J. and F. M. P.
Vermeulen (2006), Evaluating the move to a linear tax system in Germany and other
European countries, Review of Economics of the Household, Vol. 4, No. (2), pp. 159-
180.
Bargain, O., Caliendo, M., Haan, P. and K. Orsini (2010), Making Work Pay in a
rationed labour market, Journal of Population Economics, Vol. 23, No. 1, pp. 323-35.
Bargain, O. and K. Doorley (2011) Caught in the trap? Welfare's disincentive and
the labor supply of single men, Journal of Public Economics, Vol. 95, pp. 1096–1110.
Bargain, O., Orsini, K. and Andreas Peichl (2014), Comparing Labor Supply
Elasticities in Europe and the United States: New Results, Journal of Human
Resources, Vol. 49, No. 3, pp. 723-838.
European Commission
Study on the effects and incidence of labour taxation
May 2015 | 162
Bargain, O. and A. Peichl (2013), Steady-state labor supply elasticities: A survey,
IZA Discussion Paper No. 7698.
Barlevy, G. (2011), Evaluating the role of labor market mismatch in rising
unemployment, Economic Perspectives, 3Q/2011, pp. 82-96.
Bassanini, A. and R. Duval (2006), Employment patterns in OECD Countries:
Reassessing the role of policies and institutions, OECD Social, Employment and
Migration Working Papers No. 35, OECD, Paris.
Bassanini, A., and R. Duval (2009), Unemployment, Institutions, and Reform
Complementarities: Re-assessing the Aggregate Evidence for OECD Countries, Oxford
Review of Economic Policy, Vol. 25, No. 1, pp. 40-59.
Bastani, S. and H. Selin (2014), Bunching and Non-Bunching at Kink Points of the
Swedish Tax Schedule, Journal of Public Economics, Vol. 109, pp. 36-49.
Beblavy, M., Lehouelleur, S. and I. Maselli (2013), Useless Degrees of Useless
Statistics? A Comparison of the Net Present Value of Higher Education by Field of
Study, NEUJOBS WORKING PAPER NO. D4.4.2.A.
Becker, G. S. (1973), A Theory of Marriage: Part I, Journal of Political Economy, Vol.
81, No. 4, pp. 813-846.
Becker, G.S. and H. G. Lewis (1973), On the interaction between the quantity and
quality of children, Journal of Political Economy, Vol. 18, pp. 1063–1093.
Bell, D. N. F. and D. G. Blanchflower (2010), UK Unemployment in the Great
Recession, National Institute Economic Review, Vol. 214, pp. 3-25.
Bell, B., J. Jones, and J. Thomas (2002), Estimating the impact of changes in
employer’s National Insurance Contributions on wages, prices and employment, Bank
of England Quarterly Bulletin, Winter, pp. 384 – 390.
Belot, M. and J. C. van Ours (2004), Does the recent success of some OECD
countries in lowering their unemployment rates lie in the clever design of their labor
market reforms?, Oxford Economic Papers, Vol. 56, pp. 621-642.
Ben-Shalom, Y., Moffitt, R. and J.K. Scholz (2012), An Assessment of the
Effectiveness of Antipoverty Programs in the United States, in The Oxford Handbook of
the Economics of Poverty, Oxford University Press.
Bengtsson, T., and J. Z. Lee, (2004), Economic Stress and Mortality, in Life under
Pressure: Mortality and Living Standards in Europe and Asia, 1700-1900, Bengtsson,
T., C. Campbell, J. Z. Lee, and al.,(eds.), pp. 31-84.
Bennmarker, H., E Mellander, and B. Ockert (2009), Do regional payroll tax
reductions boost employment?, Labour Economics, Vol. 16, pp. 480 – 489.
Bentolila, S., Boeri, T. and P. Cahuc (2010), Ending the scourge of dual labour
markets in Europe, online available at:
http://www.voxeu.org/article/ending-scourge-dual-labour-markets-europe.
Berti, K., Salto, M. and M. Lequien (2012) An early-detection index of fiscal stress
for EU countries Economic Papers 475, Directorate General Economic and Monetary
Affairs (DG ECFIN), European Commission.
European Commission
Study on the effects and incidence of labour taxation
May 2015 | 163
Bingley, P. and G. Lanot (2002), The incidence of income tax on wages and labour
supply, Journal of Public Economics, Vol. 83, No. 2, pp. 153-171.
Bishop, K., B. Heim and K. Mihaly (2009) Single Women’s Labor Supply Elasticities:
Trends and Policy Implications, Industrial and Labor Relations Review, Vol. 63, No. 1,
pp.146-168.
Blanchard, O. J. (1991) Wage Bargaining and Unemployment Persistence, Journal of
Money, Credit and Banking, Vol. 23, No. 3, pp. 277-292.
Blanchard, O. J. (2007), A Review of Richard Layard, Stephen Nickell, and Richard
Jackman's Unemployment: Macroeconomic Performance and the Labour Market,
Journal of Economic Literature, Vol. 45, No. 2, pp. 410-418.
Blau, F. and L. Kahn (2007), Changes in the Labor Supply Behavior of Married
Women: 1980-2000, Journal of Labor Economics, Vol. 25, No. 3, pp. 393-438.
Bloemen, H. G. (2010), Income Taxation in an Empirical Collective Household Labour
Supply Model with Discrete Hours, IZA Discussion Paper, No 4697.
Blommesteijn, M. and L. Malee (2009), The Netherlands. Minimum income scheme:
Work and Social Assistance Act, Peer Review in Social Protection and Social Inclusion
and Assessment in Social Inclusion.
Blomquist, S. and H. Selin (2010), Hourly wage rate and taxable labor income
responsiveness to changes in marginal tax rates, Journal of Public Economics, Vol. 94,
pp. 878–889.
Blundell, R. (2012), Tax Policy Reform: the Role of Empirical Evidence, Journal of the
European Economic Association, Vol. 10, No. 1, pp. 43-77.
Blundell, R., Bozio, A. and G. Laroque (2013) Extensive and Intensive Margins of
Labour Supply: Work and Working Hours in the US, the UK and France, Fiscal Studies,
Vol. 34, No. 1, pp. 1-29.
Blundell, R., Brewer, M., Browne, J., Haan, P., Myck, M. and V. Steiner (2007),
Optimal In-work Support and Employment in Ageing Societies – Britain and Germany
Compared, Anglo-German Foundation for the Study of Industrial Society, London.
Blundell, R., Chiappori, P.-A and C. Meghir (2007), Collective labour supply:
heterogeneity and non-participation, Review of Economic Studies, Vol. 74, No. 2, pp.
417-445.
Blundell, R., Duncan, A., C. Meghir (1998) Estimating labor supply responses using
tax reforms, Econometrica, Vol. 66, pp. 827–861.
Blundell, R., A. Duncan, J. McCrae and C. Meghir (2000), The Labour Market
Impact of the Working Families’ Tax Credit, Fiscal Studies, Vol. 21, No. 1, pp 75-103.
Blundell, R. and T. MaCurdy (1999), Labor supply: A review of alternative
approaches, in: Handbook of labor economics, Vol 3A. Eds.: Orley Ashenfelter and
David Card, Amsterdam: Elsevier, pp. 1559-1696.
Blundell, R and A. Shephard (2011), Employment, Hours of Work and the Optimal
Taxation of Low-Income Families, Review of Economic Studies, Vol. 79, No. 2, pp.
481-510.
European Commission
Study on the effects and incidence of labour taxation
May 2015 | 164
Boeri, T. (2011), Institutional reforms and dualism in European Labour Markets, in
Handbooks in Economics: Labour Economics, Volume 4B, Ashenfelter, O. and D. Card
(Eds.) North-Holland, pp. 1173-1236.
Boeri, T. and J.C. van Ours (2008), The Economics of Imperfect Labor Markets,
Princeton University Press.
Boeters, S. and L. Savard (2012), Labor market modeling in a CGE context, in P.
Dixon and D. Jorgenson (eds.) Handbook of CGE Modeling.
Borghans, L. and L. Groot (1999), Educational presorting and occupational
segregation, Labor Economics, Vol. 6, No. 3, pp. 375-395.
Borjas, G. (1994), The economics of immigration, Journal of Economic Literature, Vol.
32, pp. 1667–1717.
Boscá, J. E., Domenech, R. and J. Ferri (2013), Fiscal Devaluations in EMU,
Hacienda Pública Española, Vol. 206, No. 3, pp. 27-56.
Bovenberg, A. L. and L. H. Goulder (1993), Promoting Investment under
International Capital Mobility: An Intertemporal General Equilibrium Analysis,
Scandinavian Journal of Economics, Vol. 95, No. 2, pp. 133–56.
Bradford, D. F. (1996), Fundamental Issues in Consumption Taxation, American
Enterprise Institute Press, Washington, DC.
Breen, R. (2005), Explaining cross-national variation in youth unemployment. Market
and institutional factors, European Sociological Review, Vol. 21, pp. 125–134.
Brewer, M., Duncan, A., Shephard, A. and M. J. Suárez (2006), Did working
families’ tax credit work? The impact of in-work support on labour supply in Great
Britain, Labour Economics, Vol. 13, pp. 699-720.
Browning, M., P.-A. Chiappori and Y. Weiss (2014), Economics of the Family, New
York: Cambridge University Press.
Brückner M. and E. Pappa (2012), Fiscal expansions, unemployment, and labour
force participation: theory and evidence, International Economic Review, Vol. 53, pp.
1205–28.
Bulow, J. I., and L. H. Summers (1986), A Theory of Dual Labor Markets with
Application to Industrial Policy, Discrimination, and Keynesian Unemployment, Journal
of Labor Economics, Vol. 4, No. 3, pp. 376-414.
Bunel, M. and Y. L’Horty (2012), The effects of reduced social security contributions
on employment: an evaluation of the 2003 French reforms, Fiscal Studies, Vol. 33, No.
3, pp. 371 – 398.
Burns, S. K. and J. P. Ziliak (forthcoming), Identifying the Elasticity of Taxable
Income, The Economic Journal.
Butz, W.P. and M. P. Ward (1979), Will US Fertility Remain Low? A New Economic
Interpretation, Population and Development Review, Vol. 5, No. 4, pp. 663-688.
Cahuc, P., Carcillo, S. and A. Zylberberg (2014), Labor Economics, The MIT Press.
European Commission
Study on the effects and incidence of labour taxation
May 2015 | 165
Calmfors, L. and J. Driffill (1988), Bargaining Structure, Corporatism and
Macroeconomic Performance, Economic Policy, Vol. 3, No. 6, pp. 13-61.
Card, D. and A. B. Krueger (1994), Minimum Wages and Employment: A Case Study
of the Fast-Food Industry in New Jersey and Pennsylvania, The American Economic
Review, Vol. 84, No. 4, pp. 772-793.
Carone G., Immervoll H., Paturot D., and A. Salomäki (2004), Indicators of
unemployment and low-wage traps (Marginal Effective Tax Rates on Employment
Incomes), OECD Social, employment and migration working paper No. 18, OECD.
CEDEFOP (2010), Skills supply and demand in Europe: Medium-term forecast up to
2020.
Chamley, C. (1986), Optimal Taxation of Capital Income in General Equilibrium with
Infinite Lives, Econometrica, Vol. 54, pp. 607-622.
Chetty, R. (2012), Bounds on Elasticities With Optimization Frictions: A Synthesis of
Micro and Macro Evidence on Labor Supply, Econometrica, Vol. 80, No. 3, pp. 969-
1018.
Chetty, R., Friedman, J. N., Olsen, T. and L. Pistaferri (2011), Adjustment Costs,
Firm Responses, and Micro vs. Macro Labor Supply Elasticities: Evidence from Danish
Tax Records, The Quarterly Journal of Economics, Vol. 126, No. 2, pp. 749-804.
Chetty, R., A. Guren, D. Manoli and A. Weber (2011), Are Micro and Macro Labor
Supply Elasticities Consistent? A Review of Evidence on the Intensive and Extensive
Margins, American Economic Review, Vol. 101, No. 3, pp. 471-75.
Chevalier, A. (2003), Measuring Over-Education, Economica, Vol. 70, pp. 509-531.
Chiappori, P.-A. (1988), Rational household labor supply, Econometrica, Vol. 56, No.
1, pp 63–90.
Chiswick, B. (1978), The effect of Americanisation on the earnings of foreign-born
men, Journal of Political Economy, Vol. 86, No. 5, pp. 897-921.
Cochard, M., Junod-Mesqui, B., Arnaud, F. and S. Vermare (2008), Les effets
incitatifs de la prime pour l’emploi : une évaluation difficile, Économie et Statistique,
No. 412, pp. 57-80.
Coe, D. and D. Snower (1997), Policy Complementarities: The Case for Fundamental
Labor Market Reform, Staff Papers – International Monetary Fund, Vol. 44, No. 1, pp.
1-35.
Colombino, U. and E. Narazani (2013), What’s Best for Women: Gender Based
Taxation, Wage Subsidies or Basic Income?, Euromod Working Paper series EM10/13.
Compton, J. and R. A. Pollak (2014), Family proximity, childcare, and women’s
labor force attachment, Journal of Urban Economics, Vol. 79, No. 3, pp. 72-90.
Conesa, J. C. and D. Krueger (1999), Social Security Reform with Heterogeneous
Agents, Review of Economic Dynamics, Vol. 2, No. 4, pp. 757–795.
Conesa, J. C. and D. Krueger (2006), On the optimal progressivity of the income tax
code, Journal of Monetary Economics, Vol. 53, No. 7, pp. 1425 - 1450.
European Commission
Study on the effects and incidence of labour taxation
May 2015 | 166
Connelly, R. (1992), The Effect of Child Care Costs on Married Women's Labor Force
Participation, The Review of Economics and Statistics, Vol. 74, No. 1, pp. 83-90.
Constant A. and K. F. Zimmermann (2005), Immigrant Performance and Selective
Immigration Policy: A European Perspective, National Institute Economic Review, Vol.
194, pp. 94-105.
CPB and CAPP (2013), Study on the impact of fiscal devaluation, Taxation Paper No
36.
Dagsvik, J. K. (1994), Discrete and continuous choice, max-stable processes and
independence from irrelevant attributes, Econometrica, Vol. 62, pp. 1179-1205.
Dallari, P. (2014), The labor market outcomes of austerity. Evidence for Europe.
Mimeo.
Daveri, F., and G. Tabellini (2000), Unemployment, Growth and Taxation in
Industrial Countries, Economic Policy, Vol. 15, No. 30, pp. 47-104.
De Grip, A. and T. Zwick (2000), The employability of low-skilled workers in the
knowledge economy, London School of Economics, LoWER Final Paper.
De Henau, J., Meulders, D. and S. O’Dorchai (2008), Making time for working
parents: comparing public childcare provision, in D. Del Boca and C. Wetzels (eds.),
Social Policies, Labour Markets and Motherhood. A comparative Analysis of European
Countries, Cambridge University Press.
Del Boca, D., Aaberge, R., Colombino, U., Ermisch, J., Francesconi, M., Pasqua,
S. and S. Strøm (2003), Labour Market Participation of Women and Fertility: the
Effect of Social Policies, Fondazione Rodolfo De Benedetti.
Del Boca, D., Locatelli, M. and D. Vuri (2004), Child-care choices by working
mothers: The case of Italy, IZA Discussion Paper No. 983.
Del Boca, D. and M. Locatelli (2008), Motherhood and participation, in D. Del Boca
and C. Wetzels (eds.), Social Policies, Labour Markets and Motherhood. A comparative
Analysis of European Countries, Cambridge University Press.
Del Boca, D., Pasqua, S. and C. Pronzato (2009), Motherhood and market work
decisions in institutional context: a European perspective, Oxford Economic Papers,
Vol. 61, Suppl. 1, i147-i171.
Del Boca D., Wetzels C. (eds, 2008), Social policies, labour markets and
motherhood: A comparative analysis of European countries, Cambridge University
Press.
Diamond, J. W. and G. R. Zodrow (eds, 2008), Fundamental tax reform: issues,
choices, and implications, MIT Press.
Dörrenberg, P., Peichl, A. and S. Siegloch (2014), Sufficient Statistic or Not? The
Elasticity of Taxable Income in the Presence of Deduction Possibilities, ZEW Discussion
Paper No. 14-078.
Dustman C. (2000), Temporary Migration and Economic Assimilation, 2000. Swedish
Economic Policy Review, Vol. 7, pp. 213-244.
European Commission
Study on the effects and incidence of labour taxation
May 2015 | 167
Econpubblica (2011), The Role and Impact of Labour Taxation Policies, Universita'
Bocconi, Econpubblica – Centre for Research on the Public Sector, Milan, available
online at: http://ec.europa.eu/social/BlobServlet?docId=7404&langId=en
Ebebark, J. and N. Kaunitz (2012), Payroll taxes and youth unemployment, Mimeo.
Eissa N. and H. Hoynes (2006), Behavioural responses to taxes: lessons from the
EITC and labor supply, Tax policy and the economy, Vol. 20, pp. 74-110.
Ellwood, D.T. (2000), The impact of the Earned Income Tax Credit and social policy
on work, marriage, and living arrangements, National Tax Journal, Vol. 53, No. 4, pp.
1063-1105.
Elmeskov, J. J., Martin, J. and S. Scarpetta (1998), Key Lessons for Labour Market
Reforms: Evidence from OECD Countries’ Experiences, Swedish Economic Policy
Review, Vol. 5, No. 2, pp. 205-252.
Engler, P., Ganelli, G., Tervala, J. and S. Voigts (2014), Fiscal Devaluation in a
Monetary Union, IMF Working Paper No. 14/201.
Eurofound (2012), NEETs - Young people not in employment, education or training:
Characteristics, costs and policy responses in Europe.
European Commission (2008), The LIME assessment framework (LAF): a
methodological tool to compare, in the context of the Lisbon Strategy, the
performance of EU Member States in terms of GDP and in terms of twenty policy areas
affecting growth, European Economy, Occasional Paper N°41, Directorate General for
Economic and Financial Affairs.
European Commission (2009), The world in 2025: Contributions from an expert
group, Faroult, E. (Ed.), Directorate-General for research, Brussels.
European Commission (2010), Youth on the move, Publication Office of the
European Union, Luxembourg.
European Commission (2011), Indicators of Immigrant Integration - A Pilot Study,
Eurostat.
European Commission (2013a), Annual Growth Survey 2014, COM(2013)800.
available online at: http://ec.europa.eu/europe2020/pdf/2014/ags2014_en.pdf
European Commission (2013b), Tax reforms in EU Member States 2013: Tax policy
challenges for economic growth and fiscal sustainability, Taxation Paper No. 38.
European Commission (2013c), Labour market developments in Europe 2013,
European Economy series No. 6.
European Commission (2014a), European Vacancy and Employment Report 2014,
Directorate-General for Employment, Social Affairs and Inclusion Brussels.
European Commission (2014b) Taxation Trends in the European Union,
Luxembourg: Publications Office of the European Union.
Esping-Andersen, G. (1985), Politics against markets, Princeton University Press,
Princeton, New Jersey.
European Commission
Study on the effects and incidence of labour taxation
May 2015 | 168
Evers, M., De Mooij, R., and D. Van Vuuren (2008), The Wage Elasticity of Labour
Supply: A Synthesis of Empirical Estimates, De Economist, Vol. 156, No. 1, pp. 25–43.
Fehr, H., Jokisch, S., Kambhampati, A. and L. J. Kotlikoff (2013), Simulating the
elimination of the US corporate income tax, NBER Working Paper No. 19757.
Feldstein, M. (1995), The Effect of Marginal Tax Rates on Taxable Income: A Panel
Study of the 1986 Tax Reform Act, The Journal of Political Economy, Vol. 103, No. 3,
pp. 551 – 572.
Feldstein, M. (1999), Tax Avoidance and the Deadweight Loss of the Income Tax,
The Review of Economics and Statistics, Vol. 81, No. 4, pp. 674 – 680.
Figari, F., Paulus, A. and H. Sutherland (2013), Microsimulation and Policy
Analysis, in A. B. Atkinson and F. Bourguignon (eds.), Handbook of Income
Distribution Vol. 2, Elsevier.
Fleischmann, F. and J. Dronkers (2010), Unemployment among Immigrants in
European Labour Markets. An Analysis of Origin and Destination Effects, Work,
Employment & Society, Vol. 24, No. 2, pp. 337-354
Flinn, C. J. and J. J. Heckman (1983), Are Unemployment and Out of the Labor
Force Behaviorally Distinct Labor Force States?, Journal of Labour Economics, Vol. 1,
No. 1, pp. 28-42.
Friedberg, R. M. (2000), You can’t take it with you? Immigrant assimilation and the
portability of human capital, Journal of Labor Economics Vol. 18, No. 2, pp. 221-251.
Fullerton, D. and G. E. Metcalf (2002), Tax Incidence, in Handbook of Public
Economics. Ed. A.J. Auerbach and M. Feldstein. Amsterdam: Elsevier Science B.V.: pp.
1788- 1839.
Gavhari, F. (1994), In-kind transfers, cash grants and labor supply, Journal of Public
Economics Vol. 55, pp. 495–504.
Gelderblom, A., Zandvliet, K., and Gravenstein, J., (2011),
Werkgeversbenadering UWV gericht op het aannemen van ouderen, [PES approach to
employers’, aimed at recruitment of older workers], Report 11-2011, PES.
Giertz, S. H. 2007, The Elasticity of Taxable Income over the 1980s and 1990s,
National Tax Journal, Vol. 60, No. 4, pp. 743-68.
Gomes, S, Jacquinot, P, and M. Pisani (2014), Fiscal Devaluation in the Euro Area:
A Model-Based Analysis, ECB Working Paper No. 1725.
Gornick J. C. (1999), Gender Equality in the Labour Market: Women’s Employment
and Earnings, Luxembourg Income Studies Working Paper Series No. 206.
Gornick J. C., and M. K. Meyers (2003), Families That Work: Policies for Reconciling
Parenthood and Employment, New York: Russell Sage Foundation Press.
Gornick J. C., Meyers M. and K. Ross (1996), Public Policies and the Employment of
Mothers: A Cross-National Study, Luxembourg Income Studies Working Paper Series
No. 140.
Görlich, D. Stepanok, I. and F. Al-Hussami (2013), Youth Unemployment in
Europe and the World: Causes, Consequences and Solutions, Kiel Policy Brief 59.
European Commission
Study on the effects and incidence of labour taxation
May 2015 | 169
Granzau, M. and M. Martin (2003), Progressive skatter, uddannelse og vaekst,
Nationalokonomisk Tidsskrift, Vol. 141, No. 1, pp. 89-111.
Graziano, P. and M. Heidenreich (2014), Lost in activation? The governance of
activation policies in Europe, International Journal of Social Welfare, Vol. 23, Suppl. 1,
pp. s1-s5.
Greene, W. H. (2003), Econometric Analysis, Fifth edition, Prentice Hall New Jersey.
Grubb, W.N. (2002), An Occupation In Harmony: The Roles Of Markets And
Governments In Career Information And Career Guidance, OECD and EC,
http://www.oecd.org/education/innovation-education/1954694.pdf.
Gruber, J. (1997), The incidence of payroll taxation: evidence from Chile, Journal of
Labor Economics, Vol. 15, No. 3, pp. 72- 101.
Guiso, L., P. Sapienza and L. Zingales (2009), Cultural Biases in Economic
Exchange, The Quarterly Journal of Economics, Vol. 124, No. 3, pp. 1095-1131.
Hall, R. E. and A. Rabushka (1995), The Flat Tax, Hoover Institution Press:
Stanford, 1983; 2nd ed., Hoover Institution Press: Stanford.
Hamermesh D. S. (1993), Labor demand. Princeton: Princeton University Press.
Harenberg, D. and A. Ludwig (2014), Social Security and the Interactions between
Aggregate and Idiosyncratic Risk, SAFE Working Paper Series, No. 59.
Havemann, R. (1996), Reducing Poverty while increasing employment: A primer on
alternative Strategies and a blueprint, OECD Economic Studies No. 26.
Heckman, J. (1979), Sample selection bias as a specification error, Econometrica,
Vol. 47, No. 1, pp. 153–61.
Hegewish, A. and J. C. Gornick (2011), The Impact of Work-Family Policies on
Women’s Employment: A Review of Research from OECD Countries, Community, Work
& Family, Vol. 14, No. 2, pp. 119-138.
Hérault, N. (2010), Sequential linking of Computable General Equilibrium and micro-
simulation models: a comparison of behavioural and reweighting techniques,
International Journal of Microsimulation, Vol. 3, No. 1, pp. 35-42.
Holmund, B. (1983), Payroll taxes and welfare inflation: the Swedish experience,
Scandinavian Journal of Economics, Vol. 85, No. 1, pp. 1 – 15.
Hotz, V.J. and J.K. Scholz (2003), The earned income tax credit, in Means tested
transfer programs in the United States, R. Moffitt (ed.), University of Chicago press,
pp. 141-197.
Imbens, G. W. and J. M. Wooldridge (2009), Recent Developments in the
Econometrics of Program Evaluation, Journal of Economic Literature, Vol. 47, No. 1,
pp. 5–86.
Immervoll, E. (2009), Minimum-Income Benefits in OECD Countries: Policy Design,
Effectiveness and Challenges, IZA Discussion Paper No. 4627.
European Commission
Study on the effects and incidence of labour taxation
May 2015 | 170
Immervoll, H. and M. Pearson (2009), A good time for making work pay? Taking
stock of in-work benefits and related measures across the OECD, IZA Policy Paper No.
3.
International Labour Organisatio (ILO) (2010), Maternity Protection Convention
2000, www.ilo.org/ilolex/cgi-lex/convde.pl?C183.
International Labour Organisatio (ILO) (2013), Global Employment Trends for
Youth 2013.
INSPIRES (2014), Project, National Report on the Labour Market Position of the
Vulnerable Groups in the Netherlands.
ISTAT (2011), Gender Stereotypes, Disclaimers and Discrimination Italian National
Bureau of Statistics, Department for Equal Opportunities
Iza A. and S. De La Rica (2005), Career Planning in Spain: Do Fixed-term Contracts
Delay Marriage and Parenthood?, Review of Economics of the Household, Vol. 3, pp.
49-73.
Jacobebbinghaus, P. and T. Zwick (2001), New technologies and the demand for
medium qualified labour in Germany, ZEW Discussion Papers 01-12.
Jacobs J. and J. C. Gornick (2002), Hours of Paid Work in Dual Earner Couples: The
US in Cross-National Perspective, Sociological Focus, Vol. 35, No. 2, pp. 169-187.
Jäntti, M., Pirttilä, J. and H. Selin (forthcoming), Estimating Labour Supply
Elasticities Based on Cross-Country Micro Data: A Bridge between Micro and Macro
Estimates?, Journal of Public Economics.
Johansson, A., Heady, C., Arnold, J., Brys, B. and L. Vartia (2008), Tax and
economic growth, OECD Economics Department Working Papers, No. 620.
Jones, S. R. G. and W. C. Riddell (2006), Unemployment and Nonemployment:
Heterogeneities in Labour Market States, The Review of Economics and Statistics, Vol.
88, No. 2, pp. 314–323.
Kakwani, N. C. (1977), Measurement of Tax Progressivity: An International
Comparison, The Economic Journal, Vol. 87, pp. 71–80.
Kaliskova, K. (2015), Tax and transfer policies and female labor supply in the EU,
Euromod Working Paper series EM1/15.
Kalter, F., and I. Kogan (2006), Ethnic inequalities at the transition from school to
work in Belgium and Spain: discrimination or self-exclusion?, Research in Social
Stratification and Mobility, Vol. 24, No. 3, pp. 259-274.
Kamerman, S. and J. Waldfogel (2011), United States, in P. Moss (ed.),
International Review of Leave Policies and Related Research 2012, London, pp. 286-
289.
Keane, M. P. (2011) Labour Supply and Taxes: A survey, Journal of Economic
Literature, Vol. 49, No. 4, pp. 961-1075.
Keane, M. and R. Moffitt (1998), A Structural Model of Multiple Welfare Program
Participation and Labor Supply, International Economic Review, Vol. 39, No. 3, pp.
553-589.
European Commission
Study on the effects and incidence of labour taxation
May 2015 | 171
Keuschnigg, C. and M. Keuschnigg, (2004), Aging, Labor Markets, and Pension
Reform in Austria, FinanzArchiv: Public Finance Analysis, Vol. 60, No. 3, pp. 359-392.
Kindermann, F. and D. Krueger (2014), High Marginal Tax Rates on the Top 1%?
Lessons from a Life Cycle Model with Idiosyncratic Income Risk, NBER Working Paper
No. 20601.
Klerman, J. A. and A. Leibowitz (1997), Labor supply effects of state maternity
leave legislation, in F.D. Blau and R.G. Ehrenberg (eds.), Gender and Family Issues in
the Workplace, New York: Russell Sage Foundation.
Kleven, H .J. (2014), How Can Scandinavians Tax So Much?, Journal of Economic
Perspectives, Vol. 28, No. 4, pp. 77-98.
Kleven H. J. and E. A. Schultz (2014), Estimating Taxable Income Responses Using
Danish Tax Reforms, American Economic Journal: Economic Policy, Vol. 6, No. 4, pp.
271–301.
Kleven H. J. and M. Waseem (2013) Using Notches to uncover optimization frictions
and structural elasticities: Theory and evidence from Pakistan, Quarterly Journal of
Economics, Vol. 128, No. 2, pp.669–723.
Knudsen C and H. E. Peters (1994), An International Comparison of Married
Women’s Labour Supply, Luxembourg Income Studies Working Paper Series No. 106.
Kogan, I. (2007), Working Through Barriers. Host Countries Institutions and
Immigrant Labour Market Performance in Europe, Springer.
Korkeamaki, O. (2011), The Finnish payroll tax cut experiment revisited, Working
Paper 22, Government Institute for Economic Research.
Korkeamaki, O. and R. Uusitalo (2009), Employment and wage effects of a payroll
tax cut – evidence from a regional experiment, VATT Discussion Paper 443, VATT-
Keskustelualoitteita.
Kosonen T. and T. Matikka (2014), Unwilling, Unable or Unaware to Respond?
Decomposing Behavioral Responses to Tax Incentives, Paper presented at the CESifo
Area Conference on Public Economics.
Kubik, J. D. (2004), The incidence of personal income taxation: evidence from the
tax reform act of 1986, Journal of Public Economics, Vol. 88, pp. 1567 – 1588.
Lassila J. and T. Valkonen (2007), The Finnish Pension Reform of 2005, Geneva
Papers on Risk and Insurance – Issues and Practice, Vol. 32, pp. 75-94.
Layard, R., Nickell, S. and R. Jackmann (2005), Unemployment: Macroeconomic
Performance and the Labour Market, Second edition, Oxford, Oxford University Press.
Lehmann, E., F. Marical and L. Rioux (2013), Labor income responds differently to
income-tax and payroll-tax, Journal of Public Economics, Vol. 99, No. 1, pp. 66-84.
Lerman, R. I. and S. R. Schmidt (1999), An overview of economic, social and
demographic trends affecting the U.S. labor market, The Urban Institute, Washington,
D.C., The Final Report.
European Commission
Study on the effects and incidence of labour taxation
May 2015 | 172
Leigh, A. (2010), Who Benefits from the Earned Income Tax Credit? Incidence among
Recipients, Co-Workers and Firms, The B. E. Journal of Economic Analysis and Policy,
Vol. 10, No. 1, Article 45.
Lhommeau, B. and V. Remy (2009), Les politiques d’allgements ont-elles un effet
sur la mobilite salariale des travailleurs a bas salaires, Economie et Statistique, Vol,
429 – 430, pp. 21 – 49.
Lichter, A., Peichl, A. and S. Siegloch (2014), The Own-Wage Elasticity of Labor
Demand: A Meta-Regression Analysis, IZA Discussion Paper No 7958.
Lilien, D. (1982), Sectoral shifts and cyclical unemployment, Journal of Political
Economy, Vol. 90, pp. 777–793.
Löffler, M., Peichl, A. and S. Siegloch (2014), Structural Labor Supply Models and
Wage Exogeneity, ZEW Discussion Paper No. 14-040.
Lundberg, S. J. and R. A. Pollak (1993), Separate spheres bargaining and the
marriage market, The Journal of Political Economy, Vol. 101, No 6, pp. 988-1010.
Lundberg, S. J., Pollak, R. A. and T. J. Wales (1997), Do husbands and wives pool
their resources? Evidence from the United Kingdom child benefit, The Journal of
Human Resources, Vol. 32, No. 3, pp. 463–480.
Maag E., Steuerle C. E., Chakravarti R. and C. Quakenbush (2012), How
marginal tax rates affect families at various levels of poverty, National Tax Journal,
Vol. 65, No. 4, pp. 759–782.
Manning, A. (2011), Imperfect Competition in the Labour Market in Handbooks, in
Handbook in Economics: Labour Economics, Volume 4B, Ashenfelter, O. and D. Card
(Eds.) North-Holland, pp. 973-1041.
Manser, M. and M. Brown (1980), Marriage and Household Decision-making: A
Bargaining Analysis, International Economic Review, Vol. 21, No. 1, pp. 31–44.
Marchal, S., and N. Van Mechelen (2013), Activation strategies within European
minimum income schemes, GINI Discussion Paper 87.
Matteazzi, E., Pailhé, A. and A. Solaz (2012), Part-time wage penalties in Europe:
A matter of selection or segregation?, ECINEQ, Society for the Study of Economic
Inequality Working Papers No. 293.
McClelland, R., Mok, S. and K. Pierce (2014), Labor Force Participation Elasticities
of Women and Secondary Earners within Married Couples. Mimeo.
Mc Elroy, M. B, and M. J. Horney (1981), Nash-Bargained Household Decisions:
Toward a Generalization of the Theory of Demand, International Economic Review,
Vol. 22, No. 2, pp. 333-349.
McGuinness, S. (2006), Overeducation in the Labour Market, Journal of Economic
Surveys, Vol. 20, pp. 387-418.
Melguizo, Á. and J. M. González-Páramo (2013), Who bears labour taxes and
social contributions? A meta-analysis approach, SERIEs, 4, pp. 247–271.
Meghir, C. and D. Phillips (2010), Labour supply and taxes, in The Mirrlees Review:
Dimensions of Tax Design, J. Mirrlees et al. (eds), pp. 202-274.
European Commission
Study on the effects and incidence of labour taxation
May 2015 | 173
Metcalf G. E. (2006), Tax Incidence, Department of Economics, Tufts University and
NBER, Working Paper, March 2006.
Meyer, B. and D. Rosenbaum (2001), Welfare, the earned income tax credit, and
the labour supply of single mothers, Quarterly Journal of Economics, Vol. 116, No. 3,
pp. 1063-1114.
Moffitt, R. (1992), Incentive effects of the US welfare system: a review, Journal of
Economic Literature, Vol. 30, No. 1, pp.30-61.
Moffitt, R. (2002), Welfare programs and labour supply, in A.J. Auerbach and M.
Feldstein (eds.), Handbook of public economics Vol. 4, pp. 2394-2430, Elsevier.
Mortensen, D. T and C. A. Pissarides (1994), Job Creation and Job Destruction in
the Theory of Unemployment, The Review of Economic Studies, Vol. 61, No. 3, pp.
397-415.
Murphy, K. J. (2007), The impact of unemployment insurance taxes on wage, Labour
Economics, Vol. 14, No. 3, pp. 457 – 484.
Murphy, K. and R. Topel (1997), Unemployment and Nonemployment, The
American Economic Review, Vol. 87, No. 2, pp. 295-300.
Neels, K. and D. De Wachter (2010), Postponement and recuperation of Belgian
fertility: how are they related to rising female educational attainment?, Vienna
Yearbook of Population Research, Vol. 8, Education and demography, pp. 77-106.
Neujobs (2014) Let’s Get to work! The future of Labour in Europe, Vol. 1 Bablavy, M.
Maselli, I and M. Veselková (Eds). CEPS, Brussels.
Neumark, D., Salas, J. M. I. and W. Wascher (2014), Revisiting the Minimum
Wage-Employment Debate: Throwing Out the Baby with the Bathwater?, Industrial
and Labor Relations Review, Vol. 67, No. 5, pp. 608-648.
Nickell, S. (1997), Unemployment and Labor Market Rigidities: Europe versus North
America, Journal of Economic Perspectives, Vol. 11, No. 3, pp. 55-74.
Nickell, S., van Ours, J. C. and H. Huizinga (2000), The Netherlands and the
United Kingdom: A European Unemployment Miracle?, Economic Policy, Vol. 15, No.
30, pp. 135-180.
Nickell, S. J., Nunziata, L. and W. Ochel (2005), Unemployment in the OECD since
the 1960s. What do we know?, Economic Journal, Vol. 115, pp. 1–27.
Nickell, W. (2006), The CEP-OECD Institutions Data Set (1960-2004), CEP Discussion
Paper, No. 759.
Nunez, I. and I. Livanos (2010), The Effect of Higher Education on Gender Wage-
Gap, Mimeo.
Nunziata, L. (2005), Institutions and Wage Determination: A Multi-country Approach,
Oxford Bulletin of Economics and Statistics, Vol. 67, No. 4, pp. 435 – 466.
OECD (2009), Employment Outlook, OECD Publishing, Paris.
OECD (2011), Doing Better for Families, OECD Publishing, Paris.
European Commission
Study on the effects and incidence of labour taxation
May 2015 | 174
OECD (2012a), Trade, Employment and Structural Change: The Australian
Experience, OECD Publishing, Paris.
OECD (2012b), Trends in job skill demands in OECD countries, Social, Employment
And Migration Working Papers, No. 143.
OECD (2012c), Pension Reform during the Crisis and Beyond, OECD Pensions Outlook
2012, OECD Publishing, Paris.
OECD (2013a), OECD Skills Outlook 2013 First Results from the Survey of Adult Skills,
OECD Publishing, Paris.
OECD (2013b) Pensions at a glance, OECD Publishing, Paris.
OECD (2014a), Taxing Wages 2014, Special feature: changes in structural labour
income tax progressivity over the 2000-12 period in OECD member countries, OECD
Publishing, Paris.
OECD (2014b), Post-crisis pension reforms, OECD Pensions Outlook 2014, OECD
Publishing, Paris.
OECD (2014c), Job Creation and Local Economic Development, OECD Publishing,
Paris.
Olson, M. (1982) The Rise and Decline of Nations. New Haven: Yale University Press
Ooghe, E., E. Schokkaert and J. Flechet (2003), The incidence of social security
contributions: an empirical analysis, Empirica, Vol. 30, No. 2, pp 81 – 106.
Orlandi, F. (2012), Structural unemployment and its determinants in the EU
countries, European Economy - Economic Papers 455, Directorate General Economic
and Monetary Affairs (DG ECFIN), European Commission.
Pedersen P, Smith N. (2002), Unemployment traps: do financial disincentives
matter, European Sociological Review, Vol. 18, No. 3, pp. 271-288.
Peichl, A. (2009), The Benefits and Problems of Linking Micro and Macro Models -
Evidence from a Flat Tax Analysis, Journal of Applied Economics. XII (2), pp. 301-329.
Peichl, A. and S. Siegloch (2012), Accounting for labor demand effects in structural
labor supply models, Labour Economics 19, pp. 129–138.
Pelloni, G. and W. Polasek (2003), Macroeconomic Effects of Sectoral Shocks in
Germany, The U.K. and, The U.S. A VAR-GARCH-M Approach, Computational
Economics, Vol. 21, No. 1-2, pp. 65-85.
Pettit B. and J. Hook (2005), The Structure of Women’s Employment in Comparative
Perspective, Social Forces, Vol. 84, No. 2, pp. 779-801.
Phelps, E. S. (1994), Structural Slumps: The Modern Equilibrium Theory of
Unemployment, Interest, and Assets, In collaboration with Hian Teck Hoon, George
Kanaginis, and Gylfi Zoega. Cambridge and London: Harvard University Press.
Phipps S. (1990), Gender wage differences in Australia, Sweden, and the United
States, Review of Economic Wealth, Vol. 36, No. 4, pp. 365-379.
European Commission
Study on the effects and incidence of labour taxation
May 2015 | 175
Picard, M. P. and E. Toulemond (2001), On the Equivalence of taxes paid by
employers and employees, Scottish Journal of Political Economy, Vol. 48, No. 4, pp.
46.
Pissarides, C. A. (1998), The impact of employment tax cuts on unemployment and
wages; The role of unemployment benefits and tax structure, European Economic
Review, Vol. 42, pp. 155-183.
Pissarides, C. A. (2000), Equilibrium Unemployment Theory. Second edition.
Cambridge and London: MIT Press.
Pissarides C, Wadsworth J. (1989), Unemployment and the inter-regional mobility
of labour, Economic Journal, Vol. 99, No. 397, pp. 739-755.
Poulain, M. (2008) European Migration Statistics: Definitions, Data and Challenges.
Pronzato, C. (2009), Return to Work after Childbirth: Does Parental Leave Matter in
Europe?, Review of the Economics of Households, Vol. 7, pp. 341-360.
Quintini, G. (2011), Right for the Job: Over-qualified or Under-skilled?, OECD Social,
Employment and Migration Working Papers, No. 120, OECD Publishing.
Quintini, G., and. T. Manfredi (2009), Going Separate Ways? School-to-Work
Transitions in the United States and Europe, OECD Social, Employment and Migration
Working Papers No. 90.
RAND Europe (2008), Migrant Women in the European Labour Force.
RAND Europe (2014), Single Parents and Employment in Europe.
Riddell, W. C. and X. Song (2011). The Impact of Education on Unemployment
Incidence and Re-employment Success: Evidence from the U.S. Labour Market, IZA
Discussion Paper No. 5572.
Reed, H. and M. Latorre (2009), The Economic Impacts of Migration on the UK
Labour Market, IPPR Economics of Migration Working Paper 3, Institute for Public
Policy Research, London.
Reyneri E. (2001), Migrants’ involvement in irregular employment in the
Mediterranean countries of the European Union, International Migration Papers,
International Labour Organistaion, Geneva.
Reyneri E. and G. Fullin (2011), Labour Market Penalties of New Immigrants in New
and Old Receiving West European Countries, International Migration, Vol. 49, No. 1,
pp. 31–57.
Rogerson, R. and R. Shimer (2011), Search in Macroeconomic Models of the Labor
Market, in Handbooks in Economics: Labour Economics, Volume 4A, Ashenfelter, O.
and D. Card (Eds.) North-Holland, pp. 619-700.
Rogerson, R., Shimer, R. And R. Wright (2005), Search-Theoretic Models of the
Labor Market: A Survey, Journal of Economic Literature, Vol. 53, No. 1, pp. 959–988.
Rothstein, J. (2008), The Unintended Consequences of Encouraging Work: Tax
Incidence and the EITC, CEPS Working Paper No. 165, Centre for Economic Policy
Studies.
European Commission
Study on the effects and incidence of labour taxation
May 2015 | 176
Rothstein, J. (2010) Is the EITC as Good as an NIT? Conditional Cash Transfers and
Tax Incidence, American Economic Journal: Economic Policy, Vol. 2, No. 1, pp. 177-
208.
Russell, H. and P. J. O’Connell (2001), Getting a job in Europe: the transition from
unemployment to work among young people in nine European countries, Work,
Employment and Society, Vol. 15, pp. 1–24.
Ruzik-Sierdzinska, A. (2014), Future scenarios for the development of the European
labour force, CASE Network E-Briefs, No. 01/2014.
Sachs, A. (2015), Unemployment, institutions, and interdependencies: identifying
successful reforms, Journal of Economic Policy Reform, Vol. 18, No. 1, pp. 34-50.
Saez, E. (2010), Do Taxpayers Bunch at Kink Points? American Economic Journal:
Economic Policy, Vol. 2, No. 3, pp. 180-212.
Saez, E., M. Matsaganis, and P. Tsakloglou (2012a), Earnings determination and
taxes: evidence from a cohort-based payroll tax reform in Greece, Quarterly Journal of
Economics, Vol. 127, No. 1, pp. 493 – 533.
Saez E, Slemrod J. B. and S. H. Giertz (2012b), The Elasticity of Taxable Income
with Respect to Marginal Tax Rates: A Critical Review, Journal of Economic Literature,
Vol. 50, No. 1, pp. 3–50.
Sakata, K. and C. R. McKenzie (2001), The Impact of Sectoral Shifts on the
Unemployment Rate of Different Age Groups, 2001, OSIPP Discussion Paper : DP-
2001-E-003.
Sakata, K. and C.R. McKenzie (2004),The accumulation of human capital and the
sectoral shifts hypothesis for different age groups, Mathematics and Computers in
Simulation, Vol. 64, No. 3–4, pp. 459–465.
Sauer, R.M., and D. Del Boca (2006), Life Cycle Employment and Fertility across
Institutional Environments, IZA Discussion Paper No. 2285.
Schettkat, R. and L. Yocarini (2006), The shift to services employment: A review of
the literature, Structural Change and Economic Dynamics, Vol. 17, No. 2, pp. 127–
147.
Selin, H. (2012) Marginal Tax Rates and Tax-Favoured Pension Savings of the Self-
Employed: Evidence from Sweden, Scandinavian Journal of Economics, Vol. 114, No.
1, pp. 79–100.
Shapiro, C. and J. E. Stiglitz (1984), Equilibrium Unemployment as a Worker
Discipline Device, The American Economic Review, Vol. 74, No. 3, pp. 433-444.
Skedinger, P. (2012), Effects of payroll tax cuts for young workers: evidence from
Swedish retail, Mimeo.
Stigler, G. J. (1946), The Economics of Minimum Wage Legislation, American
Economic Review, Vol. 36, No. 3, pp. 358-365.
Styczyńska, I. (2013), The impact of institutional and socio-ecological drivers on
activity at older ages, CASE Network Reports No. 115.
European Commission
Study on the effects and incidence of labour taxation
May 2015 | 177
Styczyńska, I., Najman, B. and A. Neumann (2013), The impact of Socio-
Ecological Transition on Employment Structure and Patterns in the Context of (Non)
Rural Regions, CASE Network Studies and analyses, No. 456.
Summers, L., Gruber, J. and R. Vergara (1993), Taxation and the structure of
labour markets: the case of corporatism, Quarterly Journal of Economics, Vol. 108,
No. 82, pp 385-411.
Symons, J. and D. Robertson (1990), Employer versus Employee Taxation: the
Impact on Employment, in: OECD Employment Outlook, chapter 6, Paris, pp. 153-177.
Tatsiramos, K. (2009), Geographic Labour Mobility and Unemployment Insurance in
Europe, Journal of Population Economics, Vol. 22, No. 2, pp. 267-283.
Tausig, M. and R. Fenwick (1999), Recession and Well-Being, Journal of Health and
Social Behavior, Vol. 40, No. 1, pp. 1-16.
Teitelbaum, M.S. (1984), The British Fertility Decline, Princeton University Press.
Tembon, M. and Fort, L. (2008), Girls' Education in the 21st Century: Gender
Equality, Empowerment, and Economic Growth. Washington, DC: World Bank.
Thornton, A., Alwin, D.F., and D. Camburn (1983), Causes and consequences of
sex-role attitudes and attitude change, American Sociological Review Vol. 48, pp.
211–227.
Turrini, A. (2013) Fiscal consolidation and unemployment: does EPL matter? A look
at EU countries, IZA Journal of Labor Policy, Vol. 2, No. 8.
Traxler, F. (1996) Collective bargaining and industrial change: a case of
disorganization? A comparative analysis of eighteen OECD countries, European
Sociological Review, Vol. 3, pp. 271–287.
Traxler, F. and B. Kittel (2000), The bargaining system and performance: a
comparison of 18 OECD countries, Comparative Political Studies, Vol. 33, pp. 1154–
1190.
Tyrvainen, T. (1995), Real wage resistance and unemployment: multivariate analysis
of cointegrating relations in 10 OECD economies, OECD Jobs Study Working Paper
Series, No. 10.
Van Bavel, J., (2001), Family control, bridal pregnancy, and illegitimacy. An event
history analysis in Leuven, Belgium, 1846-1856, Social Science History, Vol. 25, No.3,
pp. 449-479.
Van Ours, J.C. and C. M. Van der Tak (1992), Sectoral shifts, unemployment and
vacancies – An empirical analysis for the Netherlands, Economics Letters, Vol. 39, No.
1, pp. 111–116.
Vandelannoote, D., Vanleenhove, P., Decoster, A., Ghysels, J. and G. Verbist
(2014), Maternal employment: the impact of triple rationing in childcare in Flanders,
Review of Economics of the Household, pp. 1-23.
Vella, F. (1994), Gender Roles and Human Capital Investment: The Relationship
between Traditional Attitudes and Females Labour Market Performance, Economica,
Vol. 61, No. 242, pp.191-211.
European Commission
Study on the effects and incidence of labour taxation
May 2015 | 178
Vermeulen, F., Bargain, O., Beblo, M., Beninger, D., Blundell, R., Carrasco, R.,
Chiuri, M.-C., Laisney, F., Lechene, V., Moreau, N. and M. Myck. (2006),
Collective models of labor supply with nonconvex budget sets and nonparticipation: A
calibration approach. Review of Economics of the Household, Vol. 4, No. 2, pp. 113–
127.
Waldfogel, J., Higuchi, Y. and M. Abe (1999), Family leave policies and women’s
retention after childbirth: evidence from the United States, Britain and Japan, Journal
of Population Economics Vol. 12, pp. 523-545.
Ward-Batts, J. (2008), Out of the wallet and into the purse: using micro data to test
income pooling, Journal of Human Resources, Vol. 43, No. 2, pp. 325-351.
Weber, C. E. (2014), Toward obtaining a consistent estimate of the elasticity of
taxable income using difference-in-differences, Journal of Public Economics, Vol. 117,
(1), pp. 90-103.
Wöhlbier, F. Astarita, C. and G. Mourre (2014), Consolidation on the revenue side
and growth-friendly tax structures: an indicator based approach, European Economy -
Economic Papers 513, Directorate General Economic and Monetary Affairs (DG ECFIN),
European Commission.
Wolbers, M. H. J. (2007), Patterns of labour market entry: A comparative
perspective on school-to work transitions in 11 European countries, Acta Sociologica,
Vol. 50, pp. 189–210.
Wolff K. (1990), An International Comparison of Married Women’s Labour Force
Participation: A Cross Country Analysis for Employees in Seven Countries’,
Luxembourg Income Study Working Paper No. 48.
Yellen, J. L. (1984), Efficiency Wage Models of Unemployment, The American
Economic Review, Vol. 74, No. 2, Papers and Proceedings of the Ninety-Sixth Annual
Meeting of the American Economic Association, pp. 200-205.
Yule, G.U. (1906), On the Changes in the Marriage- and Birth-Rates in England and
Wales during the Past Half Century; with an Inquiry as to their Probable Causes,
Journal of the Royal Statistical Society, Vol. 69, No. 1, pp. 88-147.

European Commission
Study on the effects and incidence of labour taxation
May 2015 | 179
Appendix
Ap
pen
dix
Tab
le 1
: S
ho
rt
descrip
tio
n o
f stu
die
s d
irectl
y i
nvesti
gati
ng
tax i
ncid
en
ce
Stu
dy
Co
un
trie
s a
nd
tim
e c
overed
E
mp
iric
al
ap
pro
ach
C
on
clu
sio
n
OE
CD
(1
99
0)
16 O
ECD
countr
ies;
1974-1
986 (
Cro
ss-
section a
naly
sis
)
1955-1
986 (
tim
e-
seri
es a
naly
sis
)
Cro
ss-s
ecti
on
an
aly
sis
:
Takin
g s
imple
12-y
ear
diffe
rences
Tim
e-s
erie
s a
naly
sis
:
Estim
ation o
f annual tim
e-
seri
es s
tatistics for
1955 1
986
for
all c
ountr
ies indiv
idually,
then t
akin
g s
imple
avera
ges o
f
the 1
6 o
rdin
ary
least
square
s
(OLS)
regre
ssio
ns:
Cro
ss-s
ecti
on
an
aly
sis
: In
the long-r
un,
the
em
plo
yer
tax h
as a
sta
t. s
ignific
ant
negative im
pact
on t
he w
age level (g
ross w
ages)
of
clo
se t
o -
1.
This
is c
onsis
tent
with full t
ax s
hifting t
o e
mplo
yees.
Tim
e-s
erie
s a
naly
sis
: In
the s
hort
run,
a 1
%
incre
ase in t
ota
l ta
xes incre
ases r
eal pro
duct
wages
by r
oughly
0.5
% in t
he s
hort
run (
no full s
hifting t
o
the e
mplo
yees).
Tyrväin
en
(1
99
5)
10 O
ECD
countr
ies);
1972-1
992;
only
pri
vate
secto
r
Estim
ation o
f an u
nre
str
icte
d
vecto
r auto
regre
ssiv
e (
VAR)
model estim
ate
d b
y m
axim
um
likelihood (
ML)
estim
ation
pro
cedure
for
each c
ountr
y
indiv
idually
The e
ffect
of
the t
ota
l ta
x w
edge (
em
plo
yer
SSC
,
consum
ption a
nd incom
e t
ax)
on r
eal w
ages in t
he
long r
un d
iffe
rs f
or
each c
ountr
y a
nd v
ari
es b
etw
een
full s
hifting t
o t
he e
mplo
yee a
nd full s
hifting t
o t
he
em
plo
yer.
Full-s
hifting o
f th
e t
ax b
urd
en t
o
em
plo
yers
is f
ound for
Germ
any a
nd C
anada;
full-
shifting t
o e
mplo
yees f
or
Sw
eden a
nd t
he U
S.
For
the r
est
of th
e c
ountr
y s
am
ple
results a
re
som
ew
here
in b
etw
een indic
ating a
burd
en s
hari
ng
betw
een e
mplo
yees a
nd e
mplo
yers
.
Ale
sin
a a
nd
Pero
tti
(1
99
7)
14 O
ECD
countr
ies;
1965-1
990
(som
e c
ountr
ies
short
er)
; Annual data
on t
he m
anufa
ctu
ring
secto
r,
Sta
tic p
anel m
odel w
ith
countr
y fix
ed e
ffects
(FE).
All
vari
able
s a
re log d
iffe
renced
due t
o h
igh p
ers
iste
nce o
f th
e
data
.
1.
A 1
% incre
ase in t
axes o
n labour
(at
sam
ple
avera
ge o
f 25 %
) le
ads t
o a
n incre
ase in u
nit labour
costs
in c
ountr
ies w
ith a
n inte
rmedia
te d
egre
e o
f
centr
alisation incre
ase b
y u
p t
o 2
.5 %
rela
tive t
o
com
petito
rs.
2.
Tax b
urd
en o
n e
mplo
yees if w
age b
arg
ain
ing is
either
hig
hly
and low
ly c
entr
alised;
if inte
rmedia
te,
the e
mplo
yers
bear
2/3
of th
e t
ax b
urd
en.

European Commission
Study on the effects and incidence of labour taxation
May 2015 | 180
Ap
pen
dix
Tab
le 1
: S
ho
rt
descrip
tio
n o
f stu
die
s d
irectl
y i
nvesti
gati
ng
tax i
ncid
en
ce (
co
nti
nu
ed
)
Stu
dy
Co
un
trie
s a
nd
tim
e c
overed
E
mp
iric
al
ap
pro
ach
C
on
clu
sio
n
Daveri
an
d
Tab
ell
ini
(2
00
0)
14 O
ECD
countr
ies;
1965 –
1995;
sam
ple
siz
e is d
icta
ted b
y
availability o
f data
on
tax r
ate
s.
Panel estim
ate
s w
ith c
ountr
y
FE;
2SLS.
Fiv
e-y
ear
avera
ges a
re
taken t
o r
em
ove c
yclical
fluctu
ations a
nd fir
st
diffe
rences u
sed d
ue t
o h
igh
pers
iste
nce in t
he d
ata
Hig
her
labour
taxes incre
ase r
eal
wages for
countr
ies w
ith inte
rmedia
te d
egre
e o
f
centr
alisation:
a 1
% incre
ase in labour
taxes
incre
ase r
eal w
ages b
y a
round 0
.4 %
. N
o s
tat.
sig
nific
ant
effect
is found for
countr
ies w
ith h
igh o
r
low
centr
alisation.
Oo
gh
e,
Sch
okkaert
an
d F
lech
et
(2
00
3)
6 E
U c
ountr
ies;
Secto
ral panel data
1978,
1981,
1984,
1988
Sta
tic p
anel m
odel w
ith
countr
y a
nd s
ecto
r FE
Positiv
e e
ffect
on labour
costs
. Share
of burd
en o
n
em
plo
yees incre
ases if link b
etw
een c
ontr
ibutions
and b
enefits
gets
str
onger
Arp
aia
an
d
Caro
ne (
20
04
)
15 E
U c
ountr
ies;
1979 –
2000
Dynam
ic p
anel m
odel by
(syste
m)
GM
M,
with t
akin
g t
he
firs
t la
g o
f th
e R
L;
als
o f
irst
diffe
rence
GM
M.
1.
Short
-run:
(very
modest)
positiv
e e
ffect
on
labour
costs
for
countr
ies w
ith a
hig
h o
r lo
w d
egre
e
of
centr
alisation c
ate
gory
, but
not
for
those w
ith a
n
inte
rmedia
te d
egre
e o
f centr
alisation.
Contr
adic
ts
pre
vio
us f
indin
gs b
y A
lesin
a a
nd P
ero
tti (1
997)
and
Daveri
and T
abellin
i (2
000).
2.
Sym
metr
y r
esult:
sam
e c
oeffic
ients
irr
espective
of w
heth
er
the t
ax w
edge incre
ases o
r decre
ases.
Nu
nzia
ta
(2
00
5)
20 O
ECD
countr
ies;
1960 -
1994
Dynam
ic A
R(1
) panel m
odel,
estim
ate
d u
sin
g G
LS w
ith
countr
y F
E.
Equilib
rium
corr
ection m
odel (E
CM
) fo
r
long-r
un e
stim
ate
s (
inclu
des
lagged m
easure
s o
f ta
xes t
oo)
Sig
nific
ant
positiv
e e
ffect
of ta
xes o
n labour
costs
,
while c
oord
ination
has a
negative e
ffect,
both
in levels
and t
hro
ugh inte
raction w
ith t
axes.
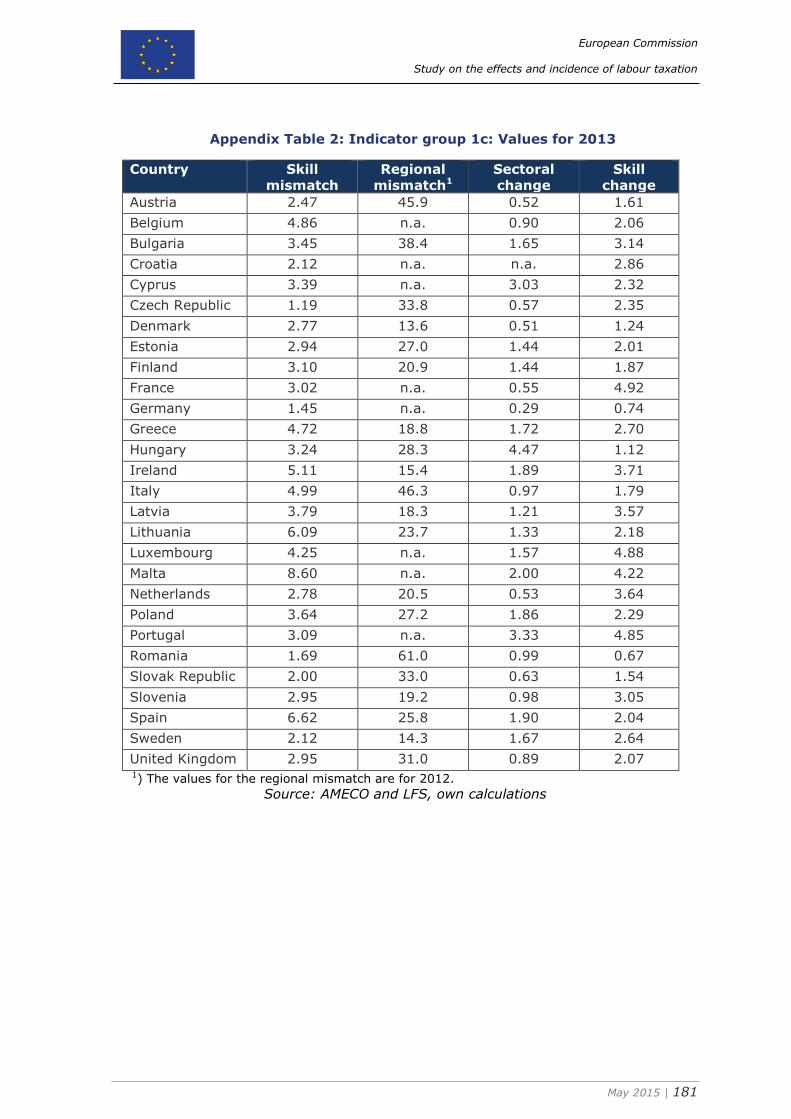
European Commission
Study on the effects and incidence of labour taxation
May 2015 | 181
Appendix Table 2: Indicator group 1c: Values for 2013
Country Skill
mismatch
Regional
mismatch1
Sectoral
change
Skill
change
Austria 2.47 45.9 0.52 1.61
Belgium 4.86 n.a. 0.90 2.06
Bulgaria 3.45 38.4 1.65 3.14
Croatia 2.12 n.a. n.a. 2.86
Cyprus 3.39 n.a. 3.03 2.32
Czech Republic 1.19 33.8 0.57 2.35
Denmark 2.77 13.6 0.51 1.24
Estonia 2.94 27.0 1.44 2.01
Finland 3.10 20.9 1.44 1.87
France 3.02 n.a. 0.55 4.92
Germany 1.45 n.a. 0.29 0.74
Greece 4.72 18.8 1.72 2.70
Hungary 3.24 28.3 4.47 1.12
Ireland 5.11 15.4 1.89 3.71
Italy 4.99 46.3 0.97 1.79
Latvia 3.79 18.3 1.21 3.57
Lithuania 6.09 23.7 1.33 2.18
Luxembourg 4.25 n.a. 1.57 4.88
Malta 8.60 n.a. 2.00 4.22
Netherlands 2.78 20.5 0.53 3.64
Poland 3.64 27.2 1.86 2.29
Portugal 3.09 n.a. 3.33 4.85
Romania 1.69 61.0 0.99 0.67
Slovak Republic 2.00 33.0 0.63 1.54
Slovenia 2.95 19.2 0.98 3.05
Spain 6.62 25.8 1.90 2.04
Sweden 2.12 14.3 1.67 2.64
United Kingdom 2.95 31.0 0.89 2.07 1) The values for the regional mismatch are for 2012.
Source: AMECO and LFS, own calculations
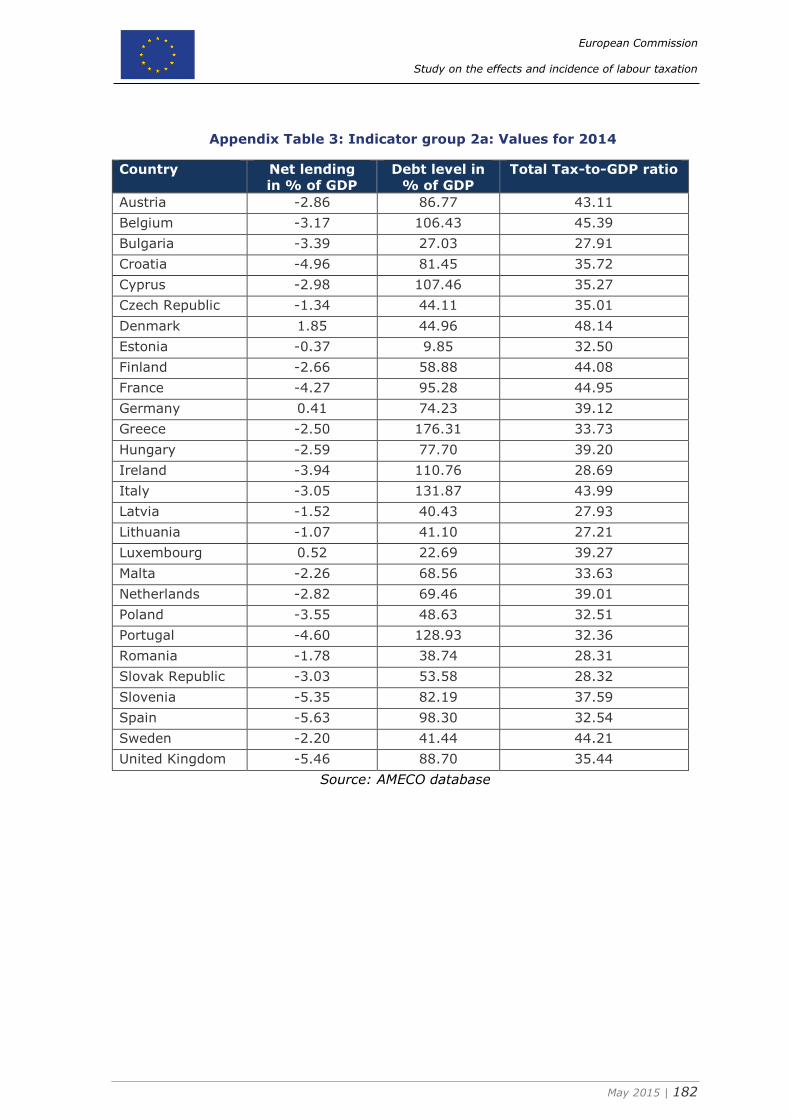
European Commission
Study on the effects and incidence of labour taxation
May 2015 | 182
Appendix Table 3: Indicator group 2a: Values for 2014
Country Net lending
in % of GDP
Debt level in
% of GDP
Total Tax-to-GDP ratio
Austria -2.86 86.77 43.11
Belgium -3.17 106.43 45.39
Bulgaria -3.39 27.03 27.91
Croatia -4.96 81.45 35.72
Cyprus -2.98 107.46 35.27
Czech Republic -1.34 44.11 35.01
Denmark 1.85 44.96 48.14
Estonia -0.37 9.85 32.50
Finland -2.66 58.88 44.08
France -4.27 95.28 44.95
Germany 0.41 74.23 39.12
Greece -2.50 176.31 33.73
Hungary -2.59 77.70 39.20
Ireland -3.94 110.76 28.69
Italy -3.05 131.87 43.99
Latvia -1.52 40.43 27.93
Lithuania -1.07 41.10 27.21
Luxembourg 0.52 22.69 39.27
Malta -2.26 68.56 33.63
Netherlands -2.82 69.46 39.01
Poland -3.55 48.63 32.51
Portugal -4.60 128.93 32.36
Romania -1.78 38.74 28.31
Slovak Republic -3.03 53.58 28.32
Slovenia -5.35 82.19 37.59
Spain -5.63 98.30 32.54
Sweden -2.20 41.44 44.21
United Kingdom -5.46 88.70 35.44
Source: AMECO database
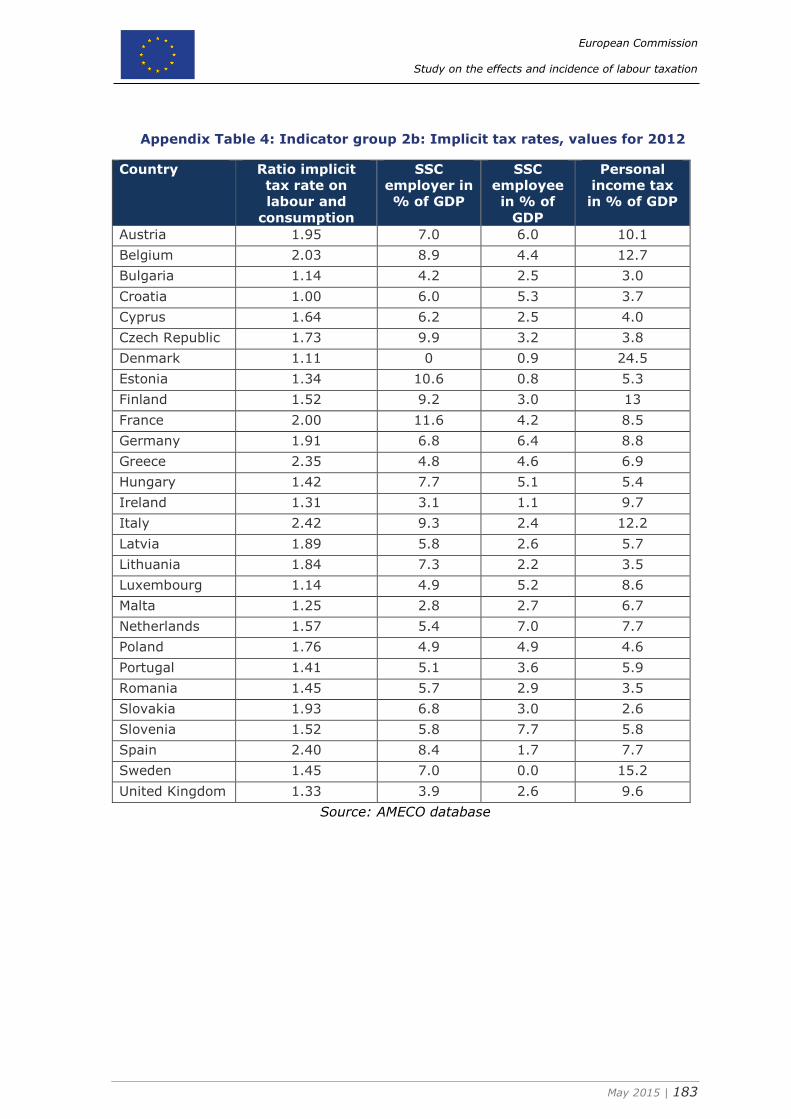
European Commission
Study on the effects and incidence of labour taxation
May 2015 | 183
Appendix Table 4: Indicator group 2b: Implicit tax rates, values for 2012
Country Ratio implicit
tax rate on
labour and
consumption
SSC
employer in
% of GDP
SSC
employee
in % of
GDP
Personal
income tax
in % of GDP
Austria 1.95 7.0 6.0 10.1
Belgium 2.03 8.9 4.4 12.7
Bulgaria 1.14 4.2 2.5 3.0
Croatia 1.00 6.0 5.3 3.7
Cyprus 1.64 6.2 2.5 4.0
Czech Republic 1.73 9.9 3.2 3.8
Denmark 1.11 0 0.9 24.5
Estonia 1.34 10.6 0.8 5.3
Finland 1.52 9.2 3.0 13
France 2.00 11.6 4.2 8.5
Germany 1.91 6.8 6.4 8.8
Greece 2.35 4.8 4.6 6.9
Hungary 1.42 7.7 5.1 5.4
Ireland 1.31 3.1 1.1 9.7
Italy 2.42 9.3 2.4 12.2
Latvia 1.89 5.8 2.6 5.7
Lithuania 1.84 7.3 2.2 3.5
Luxembourg 1.14 4.9 5.2 8.6
Malta 1.25 2.8 2.7 6.7
Netherlands 1.57 5.4 7.0 7.7
Poland 1.76 4.9 4.9 4.6
Portugal 1.41 5.1 3.6 5.9
Romania 1.45 5.7 2.9 3.5
Slovakia 1.93 6.8 3.0 2.6
Slovenia 1.52 5.8 7.7 5.8
Spain 2.40 8.4 1.7 7.7
Sweden 1.45 7.0 0.0 15.2
United Kingdom 1.33 3.9 2.6 9.6
Source: AMECO database
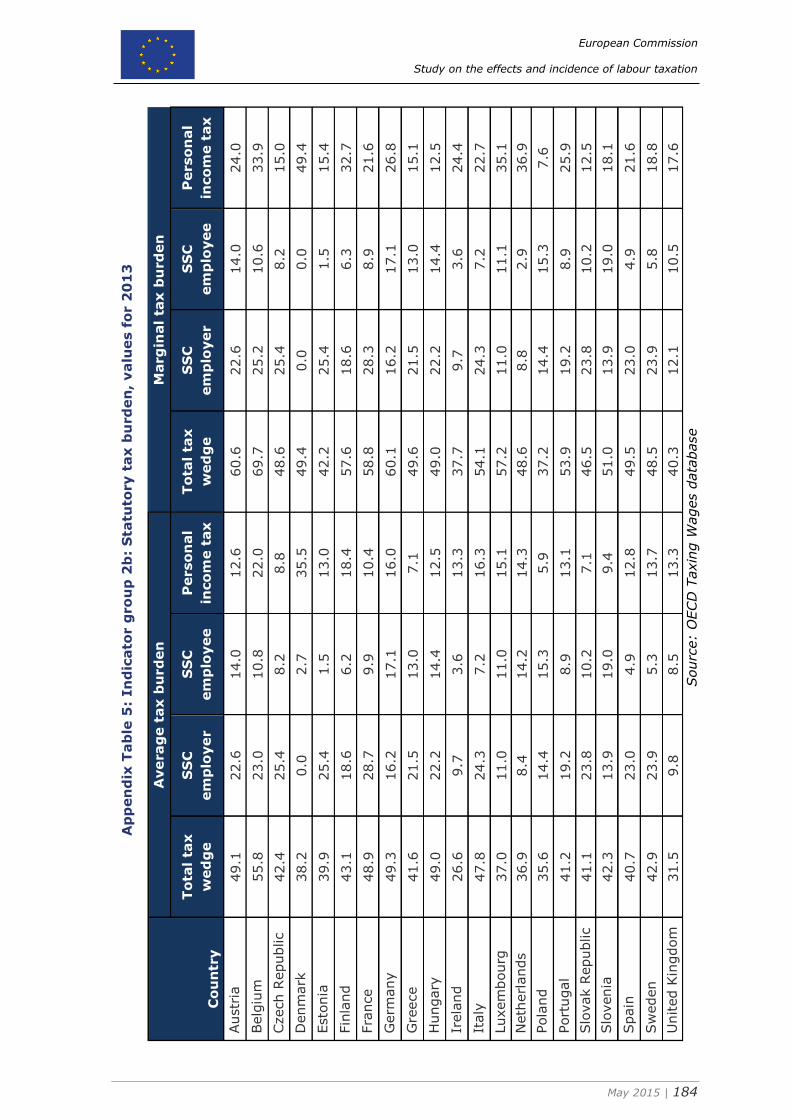
European Commission
Study on the effects and incidence of labour taxation
May 2015 | 184
Ap
pen
dix
Tab
le 5
: In
dic
ato
r g
ro
up
2b
: S
tatu
tory t
ax
bu
rd
en
, valu
es f
or 2
01
3
Co
un
try
Averag
e t
ax b
urd
en
M
arg
inal
tax
bu
rd
en
To
tal
tax
wed
ge
SS
C
em
plo
yer
SS
C
em
plo
yee
Perso
nal
inco
me t
ax
To
tal
tax
wed
ge
SS
C
em
plo
yer
SS
C
em
plo
yee
Perso
nal
inco
me t
ax
Austr
ia
49.1
22.6
14.0
12.6
60.6
22.6
14.0
24.0
Belg
ium
55.8
23.0
10.8
22.0
69.7
25.2
10.6
33.9
Czech R
epublic
42.4
25.4
8.2
8.8
48.6
25.4
8.2
15.0
Denm
ark
38.2
0.0
2.7
35.5
49.4
0.0
0.0
49.4
Esto
nia
39.9
25.4
1.5
13.0
42.2
25.4
1.5
15.4
Fin
land
43.1
18.6
6.2
18.4
57.6
18.6
6.3
32.7
Fra
nce
48.9
28.7
9.9
10.4
58.8
28.3
8.9
21.6
Germ
any
49.3
16.2
17.1
16.0
60.1
16.2
17.1
26.8
Gre
ece
41.6
21.5
13.0
7.1
49.6
21.5
13.0
15.1
Hungary
49.0
22.2
14.4
12.5
49.0
22.2
14.4
12.5
Irela
nd
26.6
9.7
3.6
13.3
37.7
9.7
3.6
24.4
Italy
47.8
24.3
7.2
16.3
54.1
24.3
7.2
22.7
Luxem
bourg
37.0
11.0
11.0
15.1
57.2
11.0
11.1
35.1
Neth
erl
ands
36.9
8.4
14.2
14.3
48.6
8.8
2.9
36.9
Pola
nd
35.6
14.4
15.3
5.9
37.2
14.4
15.3
7.6
Port
ugal
41.2
19.2
8.9
13.1
53.9
19.2
8.9
25.9
Slo
vak R
epublic
41.1
23.8
10.2
7.1
46.5
23.8
10.2
12.5
Slo
venia
42.3
13.9
19.0
9.4
51.0
13.9
19.0
18.1
Spain
40.7
23.0
4.9
12.8
49.5
23.0
4.9
21.6
Sw
eden
42.9
23.9
5.3
13.7
48.5
23.9
5.8
18.8
United K
ingdom
31.5
9.8
8.5
13.3
40.3
12.1
10.5
17.6
Sourc
e:
OECD
Taxin
g W
ages d
ata
base
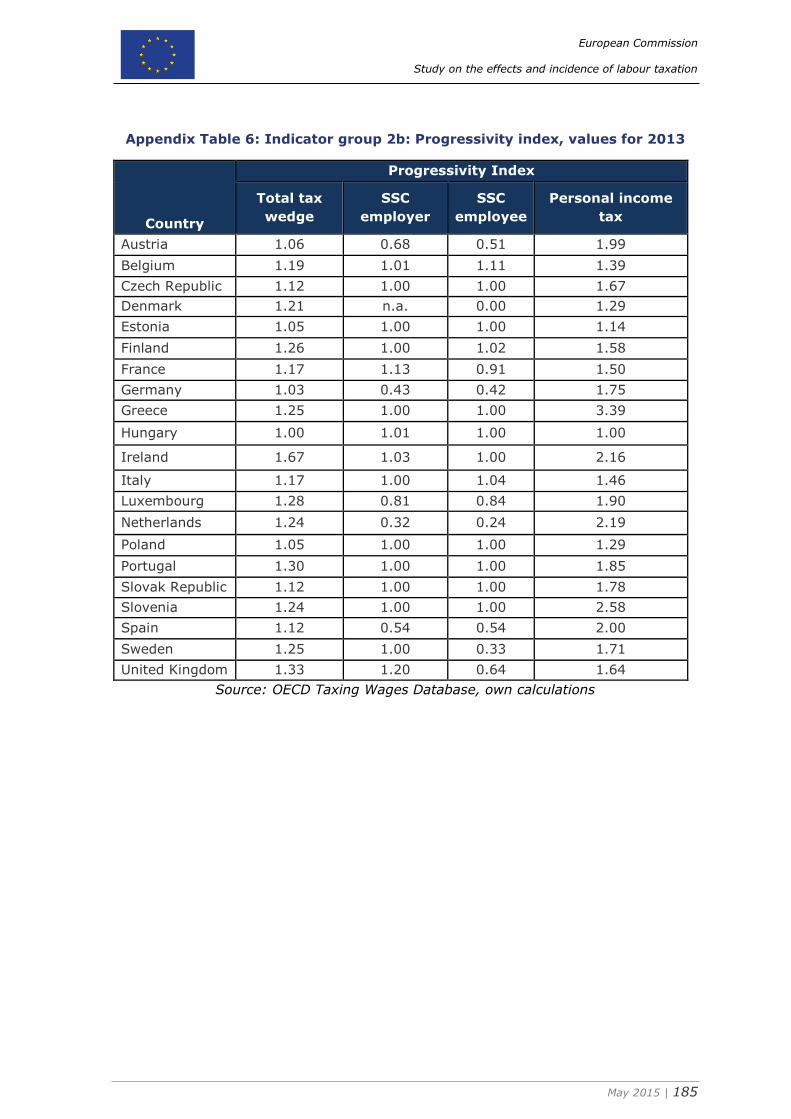
European Commission
Study on the effects and incidence of labour taxation
May 2015 | 185
Appendix Table 6: Indicator group 2b: Progressivity index, values for 2013
Country
Progressivity Index
Total tax
wedge
SSC
employer
SSC
employee
Personal income
tax
Austria 1.06 0.68 0.51 1.99
Belgium 1.19 1.01 1.11 1.39
Czech Republic 1.12 1.00 1.00 1.67
Denmark 1.21 n.a. 0.00 1.29
Estonia 1.05 1.00 1.00 1.14
Finland 1.26 1.00 1.02 1.58
France 1.17 1.13 0.91 1.50
Germany 1.03 0.43 0.42 1.75
Greece 1.25 1.00 1.00 3.39
Hungary 1.00 1.01 1.00 1.00
Ireland 1.67 1.03 1.00 2.16
Italy 1.17 1.00 1.04 1.46
Luxembourg 1.28 0.81 0.84 1.90
Netherlands 1.24 0.32 0.24 2.19
Poland 1.05 1.00 1.00 1.29
Portugal 1.30 1.00 1.00 1.85
Slovak Republic 1.12 1.00 1.00 1.78
Slovenia 1.24 1.00 1.00 2.58
Spain 1.12 0.54 0.54 2.00
Sweden 1.25 1.00 0.33 1.71
United Kingdom 1.33 1.20 0.64 1.64
Source: OECD Taxing Wages Database, own calculations
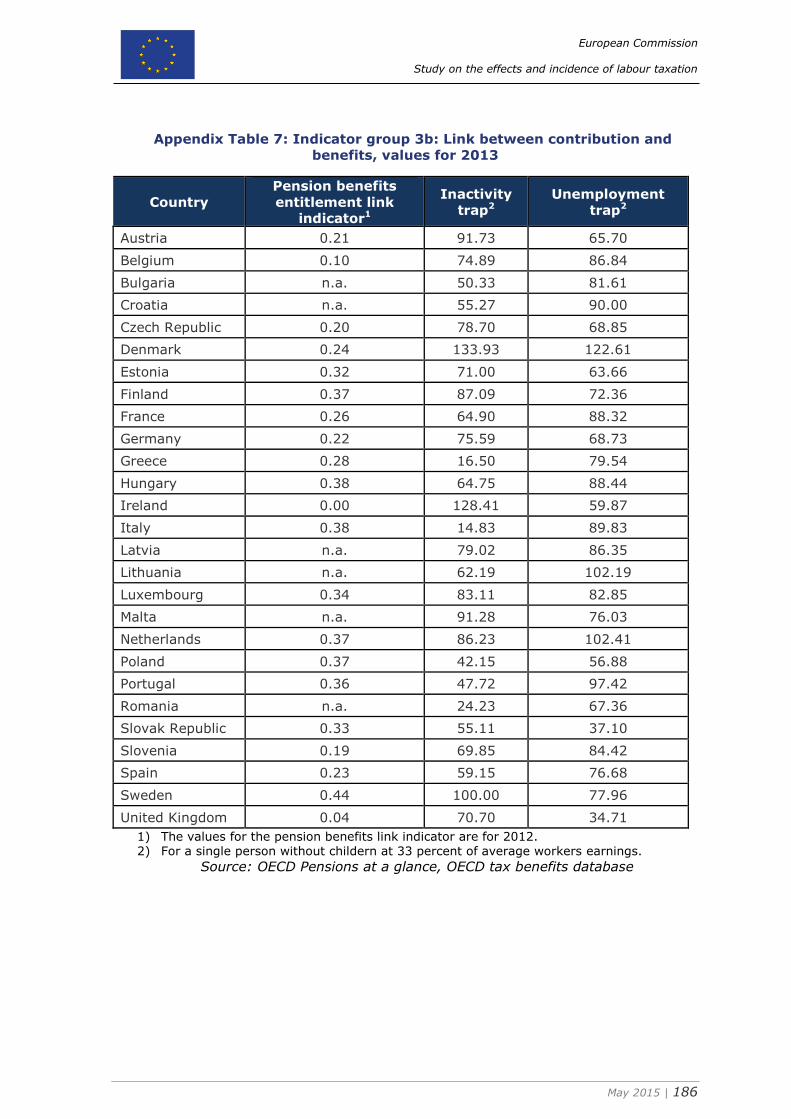
European Commission
Study on the effects and incidence of labour taxation
May 2015 | 186
Appendix Table 7: Indicator group 3b: Link between contribution and
benefits, values for 2013
Country
Pension benefits
entitlement link
indicator1
Inactivity
trap2 Unemployment
trap2
Austria 0.21 91.73 65.70
Belgium 0.10 74.89 86.84
Bulgaria n.a. 50.33 81.61
Croatia n.a. 55.27 90.00
Czech Republic 0.20 78.70 68.85
Denmark 0.24 133.93 122.61
Estonia 0.32 71.00 63.66
Finland 0.37 87.09 72.36
France 0.26 64.90 88.32
Germany 0.22 75.59 68.73
Greece 0.28 16.50 79.54
Hungary 0.38 64.75 88.44
Ireland 0.00 128.41 59.87
Italy 0.38 14.83 89.83
Latvia n.a. 79.02 86.35
Lithuania n.a. 62.19 102.19
Luxembourg 0.34 83.11 82.85
Malta n.a. 91.28 76.03
Netherlands 0.37 86.23 102.41
Poland 0.37 42.15 56.88
Portugal 0.36 47.72 97.42
Romania n.a. 24.23 67.36
Slovak Republic 0.33 55.11 37.10
Slovenia 0.19 69.85 84.42
Spain 0.23 59.15 76.68
Sweden 0.44 100.00 77.96
United Kingdom 0.04 70.70 34.71
1) The values for the pension benefits link indicator are for 2012. 2) For a single person without childern at 33 percent of average workers earnings.
Source: OECD Pensions at a glance, OECD tax benefits database
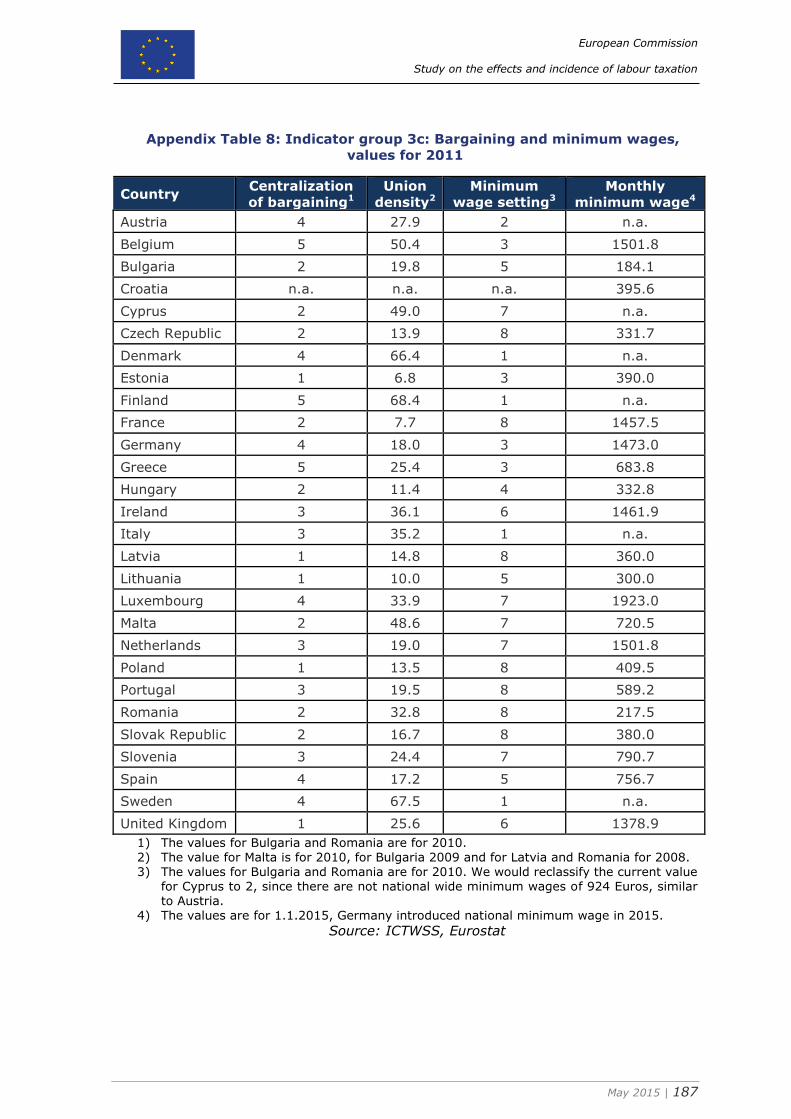
European Commission
Study on the effects and incidence of labour taxation
May 2015 | 187
Appendix Table 8: Indicator group 3c: Bargaining and minimum wages,
values for 2011
Country Centralization
of bargaining1
Union
density2 Minimum
wage setting3 Monthly
minimum wage4
Austria 4 27.9 2 n.a.
Belgium 5 50.4 3 1501.8
Bulgaria 2 19.8 5 184.1
Croatia n.a. n.a. n.a. 395.6
Cyprus 2 49.0 7 n.a.
Czech Republic 2 13.9 8 331.7
Denmark 4 66.4 1 n.a.
Estonia 1 6.8 3 390.0
Finland 5 68.4 1 n.a.
France 2 7.7 8 1457.5
Germany 4 18.0 3 1473.0
Greece 5 25.4 3 683.8
Hungary 2 11.4 4 332.8
Ireland 3 36.1 6 1461.9
Italy 3 35.2 1 n.a.
Latvia 1 14.8 8 360.0
Lithuania 1 10.0 5 300.0
Luxembourg 4 33.9 7 1923.0
Malta 2 48.6 7 720.5
Netherlands 3 19.0 7 1501.8
Poland 1 13.5 8 409.5
Portugal 3 19.5 8 589.2
Romania 2 32.8 8 217.5
Slovak Republic 2 16.7 8 380.0
Slovenia 3 24.4 7 790.7
Spain 4 17.2 5 756.7
Sweden 4 67.5 1 n.a.
United Kingdom 1 25.6 6 1378.9
1) The values for Bulgaria and Romania are for 2010. 2) The value for Malta is for 2010, for Bulgaria 2009 and for Latvia and Romania for 2008.
3) The values for Bulgaria and Romania are for 2010. We would reclassify the current value for Cyprus to 2, since there are not national wide minimum wages of 924 Euros, similar to Austria.
4) The values are for 1.1.2015, Germany introduced national minimum wage in 2015.
Source: ICTWSS, Eurostat
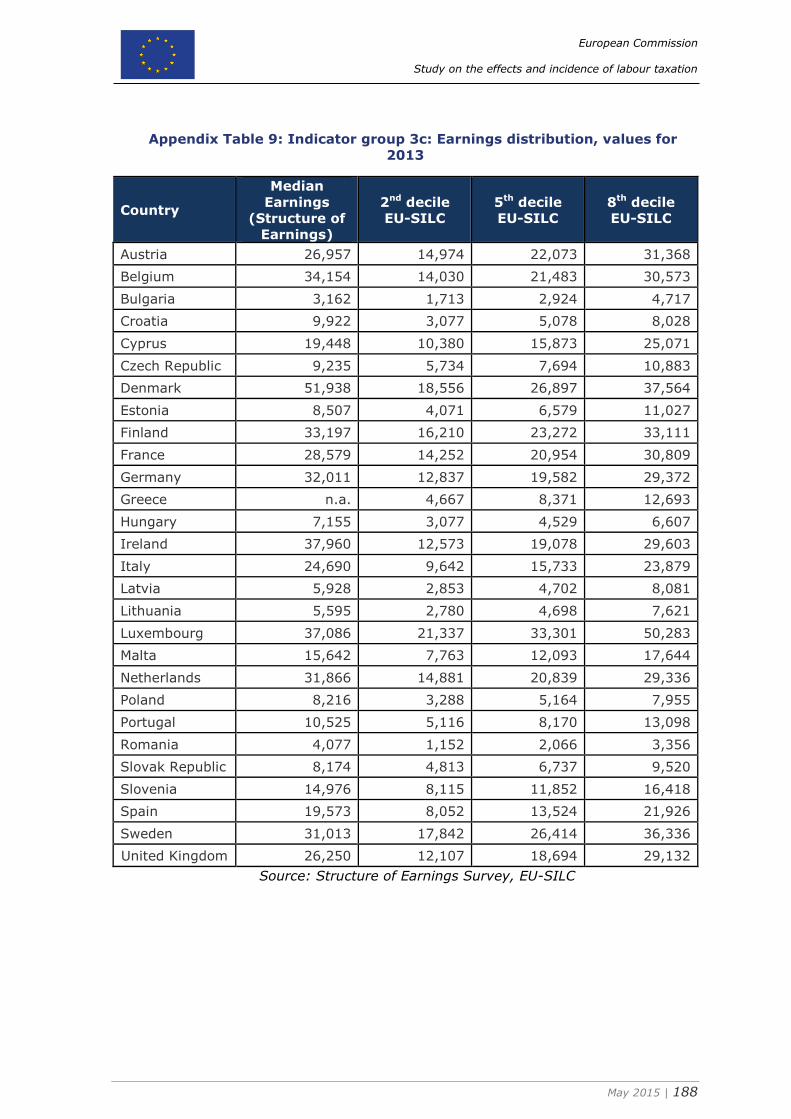
European Commission
Study on the effects and incidence of labour taxation
May 2015 | 188
Appendix Table 9: Indicator group 3c: Earnings distribution, values for
2013
Country
Median
Earnings
(Structure of
Earnings)
2nd decile
EU-SILC
5th decile
EU-SILC
8th decile
EU-SILC
Austria 26,957 14,974 22,073 31,368
Belgium 34,154 14,030 21,483 30,573
Bulgaria 3,162 1,713 2,924 4,717
Croatia 9,922 3,077 5,078 8,028
Cyprus 19,448 10,380 15,873 25,071
Czech Republic 9,235 5,734 7,694 10,883
Denmark 51,938 18,556 26,897 37,564
Estonia 8,507 4,071 6,579 11,027
Finland 33,197 16,210 23,272 33,111
France 28,579 14,252 20,954 30,809
Germany 32,011 12,837 19,582 29,372
Greece n.a. 4,667 8,371 12,693
Hungary 7,155 3,077 4,529 6,607
Ireland 37,960 12,573 19,078 29,603
Italy 24,690 9,642 15,733 23,879
Latvia 5,928 2,853 4,702 8,081
Lithuania 5,595 2,780 4,698 7,621
Luxembourg 37,086 21,337 33,301 50,283
Malta 15,642 7,763 12,093 17,644
Netherlands 31,866 14,881 20,839 29,336
Poland 8,216 3,288 5,164 7,955
Portugal 10,525 5,116 8,170 13,098
Romania 4,077 1,152 2,066 3,356
Slovak Republic 8,174 4,813 6,737 9,520
Slovenia 14,976 8,115 11,852 16,418
Spain 19,573 8,052 13,524 21,926
Sweden 31,013 17,842 26,414 36,336
United Kingdom 26,250 12,107 18,694 29,132
Source: Structure of Earnings Survey, EU-SILC

TAXATION PAPERS Taxation Papers can be accessed and downloaded free of charge at the following address: http://ec.europa.eu/taxation_customs/taxation/gen_info/economic_analysis/tax_papers/index_en.htm The following papers have been issued. Taxation Paper No 55 (2015): Experiences with cash-flow taxation and prospects. Final report. Written by Ernst & Young Taxation Paper No 54 (2015): Revenue for EMU: a contribution to the debate on fiscal union. Written by Anna Iara Taxation Paper No 53 (2015): An Assessment of the Performance of the Italian Tax Debt Collection System. Written by Margherita Ebraico and Savino Ruà Taxation Paper No 52 (2014): A Study on R&D Tax Incentives. Final report. Written by CPB in consortium with: CAPP, CASE, CEPII, ETLA, IFO, IFS, HIS. Taxation Paper No 51 (2014): Improving VAT compliance – random awards for tax compliance. Written by Jonas Fooken, Thomas Hemmelgarn, Benedikt Herrmann Taxation Paper No 50 (2014): Debt Bias in Corporate Taxation and the Costs of Banking Crises in the EU. Written by Sven Langedijk, Gaëtan Nicodème, Andrea Pagano, Alessandro Rossi Taxation Paper No 49 (2014): A wind of change? Reforms of Tax Systems since the launch of Europe 2020. Written by Gaëlle Garnier , Endre György, Kees Heineken, Milena Mathé, Laura Puglisi, Savino Ruà, Agnieszka Skonieczna and Astrid Van Mierlo Taxation Paper No 48 (2014): Tax reforms in EU Member States: 2014 Report. Written by Directorate-General for Taxation and Customs Union and Directorate-General for Economic and Financial Affairs, European Commission Taxation Paper No 47 (2014): Fiscal Devaluations in the Euro Area: What has been done since the crisis? Written by Laura Puglisi Taxation Paper No 46 (2014): Tax Compliance Social Norms and Institutional Quality: An Evolutionary Theory of Public Good Provision. Written by Panayiotis Nicolaides Taxation Paper No 45 (2014): Effective Corporate Taxation, Tax Incidence and Tax Reforms: Evidence from OECD Countries. Written by Salvador Barrios, Gaëtan Nicodème, Antonio Jesus Sanchez Fuentes Taxation Paper No 44 (2014): Addressing the Debt Bias: A Comparison between the Belgian and the Italian ACE Systems. Written by Ernesto Zangari Taxation Paper No 43 (2014): Financial Activities Taxes, Bank Levies and Systemic Risk. Written by Giuseppina Cannas, Jessica Cariboni, Massimo Marchesi, Gaëtan Nicodème, Marco Petracco Giudici, Stefano Zedda Taxation Paper No 42 (2014): Thin Capitalization Rules and Multinational Firm Capital Structure. Written by Jennifer Blouin, Harry Huizinga, Luc Laeven and Gaëtan Nicodème Taxation Paper No 41 (2014): Behavioural Economics and Taxation. Written by Till Olaf Weber, Jonas Fooken and Benedikt Herrmann.

Taxation Paper No 40 (2013): A Review and Evaluation of Methodologies to Calculate Tax Compliance Costs. Written by The Consortium consisting of Ramboll Management Consulting, The Evaluation Partnership and Europe Economic Research Taxation Paper No 39 (2013): Recent Reforms of Tax Systems in the EU: Good and Bad News. Written by Gaëlle Garnier, Aleksandra Gburzynska, Endre György, Milena Mathé, Doris Prammer, Savino Ruà, Agnieszka Skonieczna. Taxation Paper No 38 (2013): Tax reforms in EU Member States: Tax policy challenges for economic growth and fiscal sustainability, 2013 Report. Written by Directorate-General for Taxation and Customs Union and Directorate-General for Economic and Financial Affairs, European Commission Taxation Paper No 37 (2013): Tax Reforms and Capital Structure of Banks. Written by Thomas Hemmelgarn and Daniel Teichmann Taxation Paper No 36 (2013): Study on the impacts of fiscal devaluation. Written by a consortium under the leader CPB Taxation Paper No 35 (2013): The marginal cost of public funds in the EU: the case of labour versus green taxes Written by Salvador Barrios, Jonathan Pycroft and Bert Saveyn Taxation Paper No 34 (2012): Tax reforms in EU Member States: Tax policy challenges for economic growth and fiscal sustainability. Written by Directorate-General for Taxation and Customs Union and Directorate-General for Economic and Financial Affairs, European Commission. Taxation Paper No 33 (2012): The Debt-Equity Tax Bias: consequences and solutions. Written by Serena Fatica, Thomas Hemmelgarn and Gaëtan Nicodème Taxation Paper No 32 (2012): Regressivity of environmental taxation: myth or reality? Written by Katri Kosonen Taxation Paper No 31 (2012): Review of Current Practices for Taxation of Financial Instruments, Profits and Remuneration of the Financial Sector. Written by PWC Taxation Paper No 30 (2012): Tax Elasticities of Financial Instruments, Profits and Remuneration. Written by Copenhagen Economics. Taxation Paper No 29 (2011): Quality of Taxation and the Crisis: Tax shifts from a growth perspective. Written by Doris Prammer. Taxation Paper No 28 (2011): Tax reforms in EU Member States. Written by European Commission Taxation Paper No 27 (2011): The Role of Housing Tax Provisions in the 2008 Financial Crisis. Written by Thomas Hemmelgarn, Gaetan Nicodeme, and Ernesto Zangari Taxation Paper No 26 (2010): Financing Bologna Students' Mobility. Written by Marcel Gérard. Taxation Paper No 25 (2010): Financial Sector Taxation. Written by European Commission. Taxation Paper No 24 (2010): Tax Policy after the Crisis – Monitoring Tax Revenues and Tax Reforms in EU Member States – 2010 Report. Written by European Commission. Taxation Paper No 23 (2010): Innovative Financing at a Global Level. Written by European Commission. Taxation Paper No 22 (2010): Company Car Taxation. Written by Copenhagen Economics. Taxation Paper No 21 (2010): Taxation and the Quality of Institutions: Asymmetric Effects on FDI. Written by Serena Fatica.

Taxation Paper No 20 (2010): The 2008 Financial Crisis and Taxation Policy. Written by Thomas Hemmelgarn and Gaëtan Nicodème. Taxation Paper No 19 (2009): The role of fiscal instruments in environmental policy.' Written by Katri Kosonen and Gaëtan Nicodème. Taxation Paper No 18 (2009): Tax Co-ordination in Europe: Assessing the First Years of the EU-Savings Taxation Directive. Written by Thomas Hemmelgarn and Gaëtan Nicodème. Taxation Paper No 17 (2009): Alternative Systems of Business Tax in Europe: An applied analysis of ACE and CBIT Reforms. Written by Ruud A. de Mooij and Michael P. Devereux. Taxation Paper No 16 (2009): International Taxation and multinational firm location decisions. Written by Salvador Barrios, Harry Huizinga, Luc Laeven and Gaëtan Nicodème. Taxation Paper No 15 (2009): Corporate income tax and economic distortions. Written by Gaëtan Nicodème. Taxation Paper No 14 (2009): Corporate tax rates in an enlarged European Union. Written by Christina Elschner and Werner Vanborren. Taxation Paper No 13 (2008): Study on reduced VAT applied to goods and services in the Member States of the European Union. Final report written by Copenhagen Economics. Taxation Paper No 12 (2008): The corporate income tax rate-revenue paradox: evidence in the EU. Written by Joanna Piotrowska and Werner Vanborren. Taxation Paper No 11 (2007): Corporate tax policy and incorporation in the EU. Written by Ruud A. de Mooij and Gaëtan Nicodème. Taxation Paper No 10 (2007): A history of the 'Tax Package': The principles and issues underlying the Community approach. Written by Philippe Cattoir. Taxation Paper No 9 (2006): The Delineation and Apportionment of an EU Consolidated Tax Base for Multi-jurisdictional Corporate Income Taxation: a Review of Issues and Options. Written by Ana Agúndez-García. Taxation Paper No 8 (2005): Formulary Apportionment and Group Taxation in the European Union: Insights from the United States and Canada. Written by Joann Martens Weiner. Taxation Paper No 7 (2005): Measuring the effective levels of company taxation in the new member States : A quantitative analysis. Written by Martin Finkenzeller and Christoph Spengel. Taxation Paper No 6 (2005): Corporate income tax and the taxation of income from capital. Some evidence from the past reforms and the present debate on corporate income taxation in Belgium. Written by Christian Valenduc. Taxation Paper No 5 (2005): An implicit tax rate for non-financial corporations: Definition and comparison with other tax indicators. Written by Claudius Schmidt-Faber. Taxation Paper No 4 (2005): Examination of the macroeconomic implicit tax rate on labour derived by the European Commission. Written by Peter Heijmans and Paolo Acciari. Taxation Paper No 3 (2005): European Commission Staff Working Paper. Taxation Paper No 2 (2004): VAT indicators. Written by Alexandre Mathis. Taxation Paper No 1 (2004): Tax-based EU own resources: an assessment. Written by Philippe Cattoir.


HOW TO OBTAIN EU PUBLICATIONS
Free publications: • one copy:
via EU Bookshop (http://bookshop.europa.eu);
• more than one copy or posters/maps: from the European Union’s representations (http://ec.europa.eu/represent_en.htm); from the delegations in non-EU countries (http://eeas.europa.eu/delegations/index_en.htm); by contacting the Europe Direct service (http://europa.eu/europedirect/index_en.htm) or calling 00 800 6 7 8 9 10 11 (freephone number from anywhere in the EU) (*). (*) The information given is free, as are most calls (though some operators, phone boxes or hotels may charge you).
Priced publications: • via EU Bookshop (http://bookshop.europa.eu).

KP-A
C-15-056-EN-N
ISBN 978-92-79-48353-0doi:10.2778/88441
STU
DY
ON
THE EFFEC
TS A
ND
INC
IDEN
CE O
F LAB
OU
R TA
XA
TION
— FIN
AL R
EPO
RT