Embed Size (px)
Citation preview
TAXATION OF SUPERANNUATION AND DISPOSABLE INCOME INRETIREMENT
Anne McDiarmid
Retirement Income Modelling Task Force*
c/- The Treasury, Parkes Place, PARKES ACT
Paper prepared for the Women and Superannuation Seminar,
Canberra 24 and 25 February 1994
ABSTRACT
This paper examines the taxation treatment of superannuation and the effect of interactingsuperannuation, taxation and Social Security policies on retirement incomes, with a particularemphasis on women. Some of the implications for progressivity and equity are discussed.
The comparative effects of superannuation provisions on women in various circumstances arediscussed using results obtained from the Retirement Income Modelling Task Force's hypotheticalmodel, INDMOD.
* The Retirement Income Modelling (RIM) Task Force is equally financed by the Departments ofTreasury, Finance and Social Security from the reallocation of existing resources.

2
ACKNOWLEDGMENTS
The author would like to thank Phil Gallagher, Director of the RIM Task Force, and Colin Brown,also of the Task Force for their assistance in drafting this paper and modelling the examplespresented.
The views expressed in this paper are those of the author and do not necessarily reflect the views ofthe Departments financing RIM or of their Ministers or advisers.

3
1. INTRODUCTION
Tax assisted superannuation has, until the last decade, played a relatively subordinate role in theGovernment's retirement incomes policy. Superannuation tended to be the preserve of better off,male white collar workers. For most Australians, the Social Security or Veteran's Age Pension, wasseen as the foundation of income in retirement, supplemented by whatever savings people were ableand willing to make in their working years. In the 1980's it became clear that the continuance of this tradition was neither desirable norsustainable. Both the community and pensioners themselves expect that the living standards of theaged should rise in line with those of the general community. On the other hand, the ageing of the'baby boom' generation and increased longevity mean that better retirement incomes would need tobe provided for a much larger number of retirees for a longer duration. With Australia's 'pay as yougo' financing of the Social Security system and our low savings ratio (Fitzgerald, 1993), this wouldplace an enormous burden on the comparatively small workforce of the next generation.
Both prudence and considerations of intergenerational equity require that provision is begun nowfor the retirement of the present generation of workers. To meet demands for better provisionrequires contributions from both individuals and the Government. Workers contribute bysacrificing present consumption and the Government through forgone revenue, that is, taxconcessions on superannuation.
The aim of the Government's superannuation policy is to ensure, in a cost efficient manner, thatmore future retirees enjoy a standard of living closer to that which they had before retirement. Thatis, in the context of superannuation policy, the goal is income maintenance rather than povertyalleviation, and adequacy is relative to the individual rather than some absolute universal measure.Poverty alleviation is properly the function of the Social Security system and the age pension willcontinue to act both as a safety net for those who are unable to provide for themselves, and as asupplement to most people's superannuation income. The interaction of superannuation, the agepension income and assets tests and taxation is intended to ensure the progressivity of theGovernment's retirement incomes policy.
Section 2 of this paper briefly outlines the taxation provisions relating to superannuation in both itsaccrual and payout phases. The effect of the interaction of the taxation and social security systemsis described and some of the implications for progressivity and equity discussed.
Section 3 discusses the comparative effects of superannuation provisions on women and couples invarious hypothetical situations. This discussion is based on results obtained from the RetirementIncome Modelling Task Force's hypothetical model, INDMOD.
4
2. TAXATION PROVISIONS
Tax on contributions
Contributions by an employer on behalf of an employee are a deductible expense of the employer.From 1 July 1994 an employer's deductions for superannuation contributions will be limited to$9,000 for employees aged less than 35, $25,000 for those aged 35 to 49 and $62,000 for those agedover 50. These amounts are indexed for future years. Employers with more than 10 employees canelect to be limited instead by a standard contribution limit of $25,000 (indexed) multiplied by thenumber of full year employee positions. At present there is no limit on non-deductiblecontributions.
Employer contributions are effectively made from untaxed income but are include in the assessableincome of the superannuation fund and taxed at the fund rate of 15%. The effective employercontribution is thus reduced to 85%.
Contributions by the member are made from ordinary taxed income. As they have effectivelyalready been taxed at the member's marginal rate, they are not included in the taxable income of thefund.
Self employed persons and employees with no employer superannuation employer support(including no SGC ) are entitled to a tax deduction for contributions up to $3,000, plus 75% ofcontributions in excess of $3,000 up to the annual limits which apply in respect of employercontributions. Where the member claims this deduction, the deductible contributions are includedin the fund's assessable income and taxed at 15%.
Employees with assessable income less than $31,000 and with employer support can claim a taxrebate of 10% for personal contributions of up to $1,000 per year. The maximum level ofcontributions is reduced by 25 cents for each dollar of assessable income over $27,000. Rebatablecontributions are not assessable income of the fund and count as undeducted contributions in theassessment of lump sums, superannuation pensions and rollover annuities.
Tax on fund earnings
Superannuation funds are subject to a nominal tax rate of 15% their assessable income, whichincludes employer and deductible member contributions and investment earnings. However,superannuation funds can often face a considerably lower effective tax rate on their investment
5
earnings. Dividend imputation rebates reduce the tax payable and capital gains tax provisionsreduce the tax base of the fund by taxing only real capital gains on realisation.
The tax rate on the assessable income of superannuation funds is lower than the company rate or therate for life offices. Both the nominal and the effective tax rates on fund earnings are lower than thelowest non-zero personal tax rate of 20%. This means that investment in superannuation funds istax advantaged for almost all members, including married women who interrupt their careers to carefor children, leaving their accrued superannuation in the fund.
For a woman in this situation, with no other income, the only savings vehicle more tax effectivethan leaving the money in the superannuation fund (as she must with preserved amounts) would beto invest in the family home. However, the purpose of superannuation policy ( and the taxconcessions) is to assure and increase retirement incomes, and this purpose would be compromisedby such a switch in savings.
The effective tax rate on other investments the woman might make is not necessarily her personalmarginal tax rate. For example, if the woman had no other income and were to invest heraccumulation elsewhere, receiving a return of less than the tax threshold, her personal tax ratewould be zero. However her husband's tax liability would be affected. The dependent spouserebate* would be reduced by 25 cents for each dollar of income over $282 per annum the womanearned from investments. In the case of a low income family, the husband's medicare liability couldalso be increased by up to 20 cents for each dollar of the wife's income, giving an effective marginaltax rate of 45%. Low income families could also lose additional family payments from SocialSecurity at the rate of 50 cents in the dollar, whilst higher income couples could lose all entitlementto basic family payment. In contrast, earnings on preserved superannuation are not consideredincome for either personal income tax or Social Security purposes.
The tax rate of an alternative investment vehicle will be higher than that of a superannuation fund,effectively adding a further tax on investment income. Unlike the superannuation fund, neitherpartner would be able to take advantage of any imputation credits in respect of the woman'sinvestment earnings. The woman has no tax liability against which to offset the credit and it cannotbe offset against her separate net income in assessing the husband's entitlement to a dependentspouse rebate or her entitlement to a home child care allowance.
Earnings on the woman's superannuation accumulation will be subject to tax at the time ofretirement. However, the deferral of tax means tax has been saved and earnings have been greater.The end taxation is also concessional, with smaller amounts being effectively tax free.
Provisions permitting contributions to continue for up to two years while a person is not in paidemployment allow women to take further advantage of tax assisted savings. It should be noted thatwhere a woman has only a small accumulation, fees and charges may offset any tax advantage.

6
* Legislation currently before Parliament will replace the dependent spouse rebate for couples withchildren with a home child care allowance
7
Tax on Benefits
Essentially concessional rates of tax on end benefits compensate for tax on contributions and fundearnings, but with limits on concessions to high income earners. The taxation provisions are alsointended to encourage retirees to invest their benefit in a continuing income stream. Differentcomponents of the final benefit paid to a person on retirement are subject to different taxationtreatment.
Benefits in Excess of RBL
A person's gross superannuation benefits (less undeducted contributions) are subject to assessmentagainst the Reasonable Benefit Limit (RBL). Presently the person's RBL is expressed as a multipleof the person's highest average salary in any 3 consecutive years. From 1 July 1994 this rule will bereplaced by a flat dollar amount for all people. The limit will be $400,000 for benefits taken as alump sum, and $800,000 for people who take at least half their total benefits as a complyingpension or annuity. These limits are indexed to average weekly ordinary time earnings.
The new RBL arrangements are not only simpler but limit the degree of tax concessions given tovery high income earners. The new limits also permit a relatively higher level of benefit to lowincome earners. This will allow women with lower levels of personal income but limited calls onthat income, to top up their superannuation and benefit from concessionally taxed savings. Themajority of employees will have benefits below the RBL.
The treatment of excessive benefits will depend upon whether they are taken as a lump sum or as apension or annuity. Currently, a person must commute to a lump sum the excessive component ofthe capital value of a pension or annuity. From 1 July 1994 this will no longer be required. Instead,a proportion of the pension or annuity payments equal to the proportion of the capital value that isexcessive will not be rebatable. That is, it will be taxed at the person's full marginal rate in the yearof receipt. Currently excess lump sum benefits are included in the person's assessable income andtherefore effectively taxed at the person's marginal rate plus the medicare levy. From 1 July 1994they will be taxed at a flat rate equal to the highest marginal personal tax rate plus the medicare levy(ie, 48.4%).
Lump sum benefits
The portion of a lump sum benefit attributable to service prior to July 1983 is comparatively lightlytaxed. Only 5% of this amount is included in the recipient's assessable income and taxed at theperson's marginal rate. Thus, for example, a person with a marginal tax rate (with medicare) of31.4% would effectively pay tax of 1.57% on this part of the benefit.
8
The amount of the lump sum attributable to service after June 1983 is taxed after deducting themember's own undeducted contributions included in the lump sum. That is, only the employercontributions and the earnings on all contributions are taxed. If the person is aged less than 55,except in cases of invalidity, tax applies at the greater of the person's marginal rate or 20%, plus theMedicare levy. For those over 55, the first $77,769 (indexed to average weekly ordinary timeearnings) is tax free. The remainder is taxed at the greater of the person's marginal rate or 20%,plus the Medicare levy.
Benefits paid from untaxed funds (for example, the employer component of an unfunded definedbenefit) are subject to an additional tax of 15%, including benefits below the zero tax threshold.
Superannuation pensions and rollover annuities
Superannuation pensions and rollover annuities are both continuing income streams. Asuperannuation pension is paid from a continuing superannuation fund and payment is by right offund membership. A rollover annuity is purchased from a life office. Since 1 July 1983 there hasbeen little distinction between them for most taxation purposes. Both are included in the recipient'sassessable income in the year of receipt.
A deduction is allowed for the return of the portion of the person's own undeducted contributionsincluded in the purchase price of the pension or annuity. The undeducted purchase price (UPP)deduction for each year is calculated by dividing the UPP, less any residual capital value, by thenumber of years the pension or annuity is expected to be paid. Currently, the UPP for a rolloverannuity, but not a superannuation pension, includes the whole of the pre-July 1983 component ofthe purchase price. From 1 July 1994 the UPP will be limited to the person's post-June 1983undeducted contributions. Because the value of the UPP deduction is not indexed, and a complyingpension or annuity is, the relative value of the deduction will decline over time.
From 1 July 1994 the person is entitled to a rebate of 15% of the assessable amount of a rebatablepension or annuity. Any amount of pension or annuity payments attributable to an untaxed sourceor an excessive component is not rebatable. The 15% rebate replaces a rebate of between 3% and15% phased in, depending on commencement date, for pensions and annuities that became payableafter 30 June 1988.
Under the new rebate arrangements tax will not be payable on a rebatable pension or annuity underabout $21,600, where the person has no other income. However, the person's medicare liabilitycannot be offset by this rebate. Tax may also be payable if the person receives the age pension orother income. Any age or service pension rebate and the age or service pension itself may be alsoreduced.
9
The taxation arrangements for superannuation can, in general, be summarised as follows:
MEMBER CONTRIBUTIONS Taxed once only, at the time ofcontribution and at member's thenmarginal rate
EMPLOYER CONTRIBUTIONS Untaxed at source, concessionally taxedon receipt by fund, concessionally taxedat payout
FUND EARNINGS Concessionally taxed in the fund,concessionally taxed at payout
Age and Service pensioner rebates
Age and Service (age) pensioners are entitled to a tax rebate equal to the amount of tax that wouldnormally be payable on the full year maximum base pension plus the annual income test free area.The rebate is reduced by 12.5 cents for each dollar of taxable income in excess of the pensioner taxthreshold. This threshold is calculated each year and equals the maximum base pension plus thefree area. Where one partner of a couple does not use the whole rebate, the excess is transferred tothe other partner and that partner's threshold recalculated. Since the age pension is reduced by 50cents for each dollar over the free area, the effective reduction in the rebate is only 6.25 cents foreach dollar of other income.
Where one spouse has more income than the other, the higher income spouse may also be entitled tothe dependent spouse rebate.
Effective marginal tax rates
For some years there has been criticism of the high effective marginal tax rates (EMTRs) affectingwelfare recipients. While EMTRs resulting in negative gain for additional private income are anobvious policy problem, critics often ignore the reality that EMTRs in excess of ordinary marginaltax rates are an essential element in directing adequate assistance to those most in need and limitingconcessions for the more affluent.
The age pension provides a safety net for those unable to save for their retirement and a supplementfor those able to make some provision. At the same time, the income and assets tests withdrawassistance as private means increase. The progressive tax scale and tax rebates adjust the taxburden according to ability to pay and claw back assistance and concessions from the better off.The 'tax' rates of the two systems are not cumulative but interactive.
10
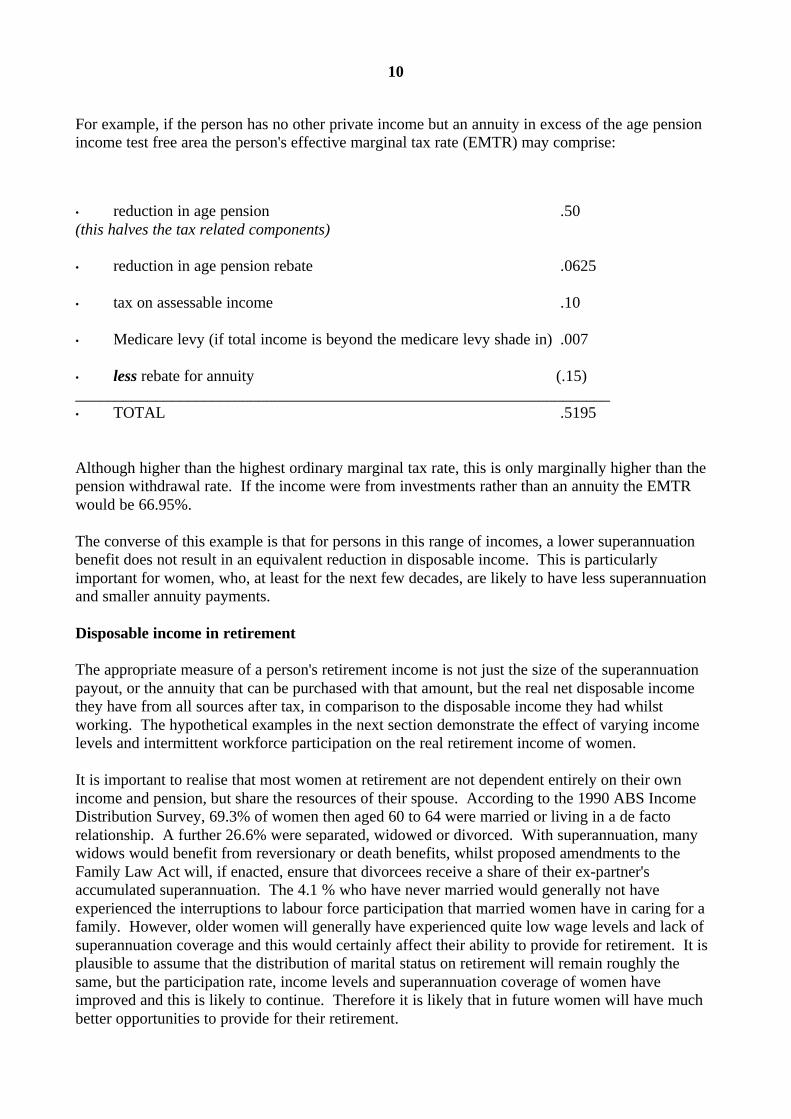
For example, if the person has no other private income but an annuity in excess of the age pensionincome test free area the person's effective marginal tax rate (EMTR) may comprise:
• reduction in age pension .50(this halves the tax related components)
• reduction in age pension rebate .0625
• tax on assessable income .10
• Medicare levy (if total income is beyond the medicare levy shade in) .007
• less rebate for annuity (.15)___________________________________________________________________• TOTAL .5195
Although higher than the highest ordinary marginal tax rate, this is only marginally higher than thepension withdrawal rate. If the income were from investments rather than an annuity the EMTRwould be 66.95%.
The converse of this example is that for persons in this range of incomes, a lower superannuationbenefit does not result in an equivalent reduction in disposable income. This is particularlyimportant for women, who, at least for the next few decades, are likely to have less superannuationand smaller annuity payments.
Disposable income in retirement
The appropriate measure of a person's retirement income is not just the size of the superannuationpayout, or the annuity that can be purchased with that amount, but the real net disposable incomethey have from all sources after tax, in comparison to the disposable income they had whilstworking. The hypothetical examples in the next section demonstrate the effect of varying incomelevels and intermittent workforce participation on the real retirement income of women.
It is important to realise that most women at retirement are not dependent entirely on their ownincome and pension, but share the resources of their spouse. According to the 1990 ABS IncomeDistribution Survey, 69.3% of women then aged 60 to 64 were married or living in a de factorelationship. A further 26.6% were separated, widowed or divorced. With superannuation, manywidows would benefit from reversionary or death benefits, whilst proposed amendments to theFamily Law Act will, if enacted, ensure that divorcees receive a share of their ex-partner'saccumulated superannuation. The 4.1 % who have never married would generally not haveexperienced the interruptions to labour force participation that married women have in caring for afamily. However, older women will generally have experienced quite low wage levels and lack ofsuperannuation coverage and this would certainly affect their ability to provide for retirement. It isplausible to assume that the distribution of marital status on retirement will remain roughly thesame, but the participation rate, income levels and superannuation coverage of women haveimproved and this is likely to continue. Therefore it is likely that in future women will have muchbetter opportunities to provide for their retirement.

11
3. DISPOSABLE INCOMES AND COST/BENEFIT ANALYSIS
Cost/Benefit methodology
The following examples use the methodology developed for the RIM project and set out in Brown(1993) for measuring the costs and benefits of retirement income policy in terms of net presentvalue.
The benefit to the individual is defined as the increase in the present value of net disposable incomein retirement for the person or couple. The costs to the Government are the net present value of:
the difference between tax on contributions, fund earnings and payouts under the concessionalprovisions and the tax that would have been payable in a non-concessional environment;
plus the difference between the age pension payable with a concessionally taxed superannuationaccumulation and the age pension payable with a non-concessionally taxed accumulation.
The calculations for the non-concessional environment assume that the employer contributions arepaid, and taxed, as wages. It is then assumed that a proportion (50% in the following examples) ofthe increased wage income is saved for retirement and the interest taxed at the individual's marginalrate.
The net policy gain or loss for the Government is the net gain to the person's retirement income (thegoal of the policy) less the net cost to Government.
Analysis of projected outcomes for individuals
The following examples are the result of modelling a set of plausible assumptions on the RIMmodel INDMOD. The results cannot be read as 'predictions', due to the sensitivity of results to theassumptions made, particularly over a period of some forty years. The model cannot capture thediversity of human circumstances or even of economic factors. What they do demonstrate is thedifference the Government's policy or an individual's behaviour and characteristics make, all otherthings being equal. For this purpose somewhat simplistic scenarios are adequate.

12
The scenarios modelled are:
For single women:
A. A woman aged 25 in 1992 with SGC employer support only. The woman's salary is a setpercentage of AWE throughout her working life. She retires at age 65 and uses all of her benefit topurchase a rollover annuity.
B. A member co-contribution is phased in, commencing at 1 % in 1998-99 and rising to 3% in2000-01. This example is merely illustrative of one way in which a member contribution could beimplemented. No decision has yet been made by the Government as to the timing of this measure.Otherwise the same as for A.
C. Instead of purchasing an annuity, the woman takes the entire lump sum, invests it and draws onit in an annuity pattern. The woman's life expectancy is factored into the annuity drawdownpattern. Otherwise the same as for A.
D. The woman was born in 1950. Otherwise the same as for A.
For Couples:
A. Both partners are aged 25 in 1992 and have SGC employer cover only. Both have the samelevel of full time equivalent salary and retire at age 65, taking all benefits as rollover annuities. Thewoman leaves work for six years at age 27 and, on return, works 67% of full time hours for afurther six years. Thereafter she is employed full time.
B. Both partners were born in 1950. The woman earns half as much as the man, but has nointerruptions to her career after the SGC start date of 1992. Otherwise the same as for A.
General assumptions
13
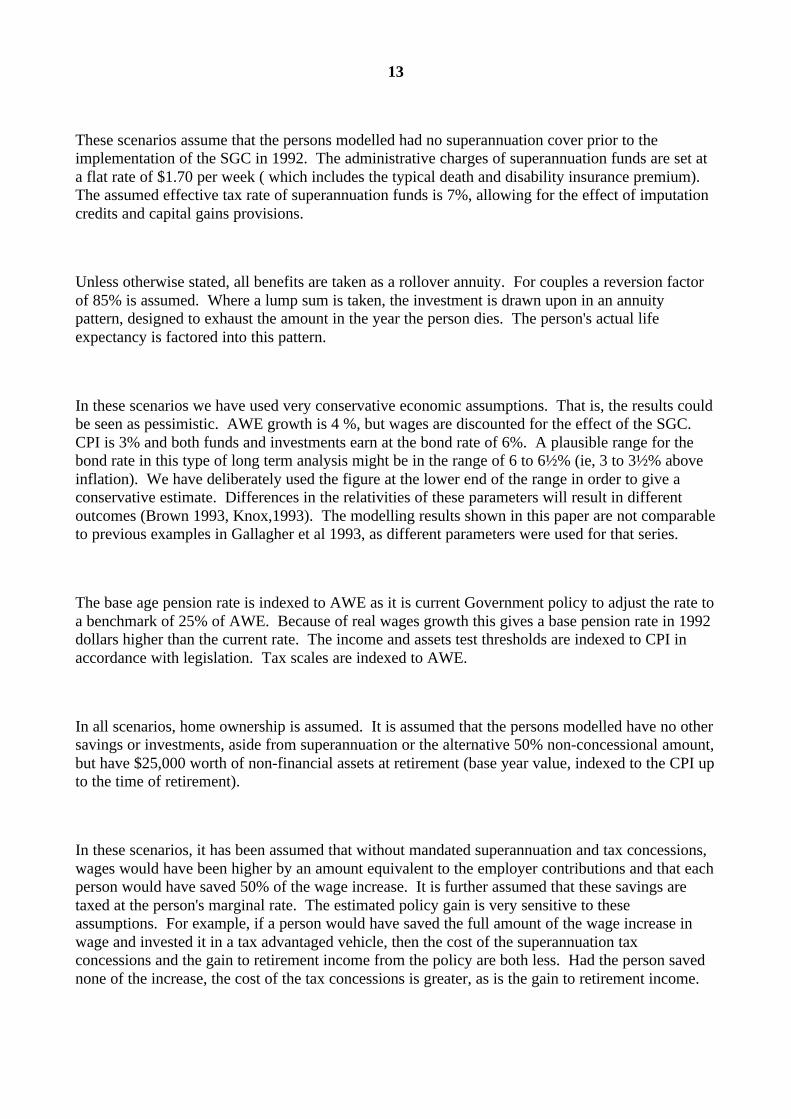
These scenarios assume that the persons modelled had no superannuation cover prior to theimplementation of the SGC in 1992. The administrative charges of superannuation funds are set ata flat rate of $1.70 per week ( which includes the typical death and disability insurance premium).The assumed effective tax rate of superannuation funds is 7%, allowing for the effect of imputationcredits and capital gains provisions.
Unless otherwise stated, all benefits are taken as a rollover annuity. For couples a reversion factorof 85% is assumed. Where a lump sum is taken, the investment is drawn upon in an annuitypattern, designed to exhaust the amount in the year the person dies. The person's actual lifeexpectancy is factored into this pattern.
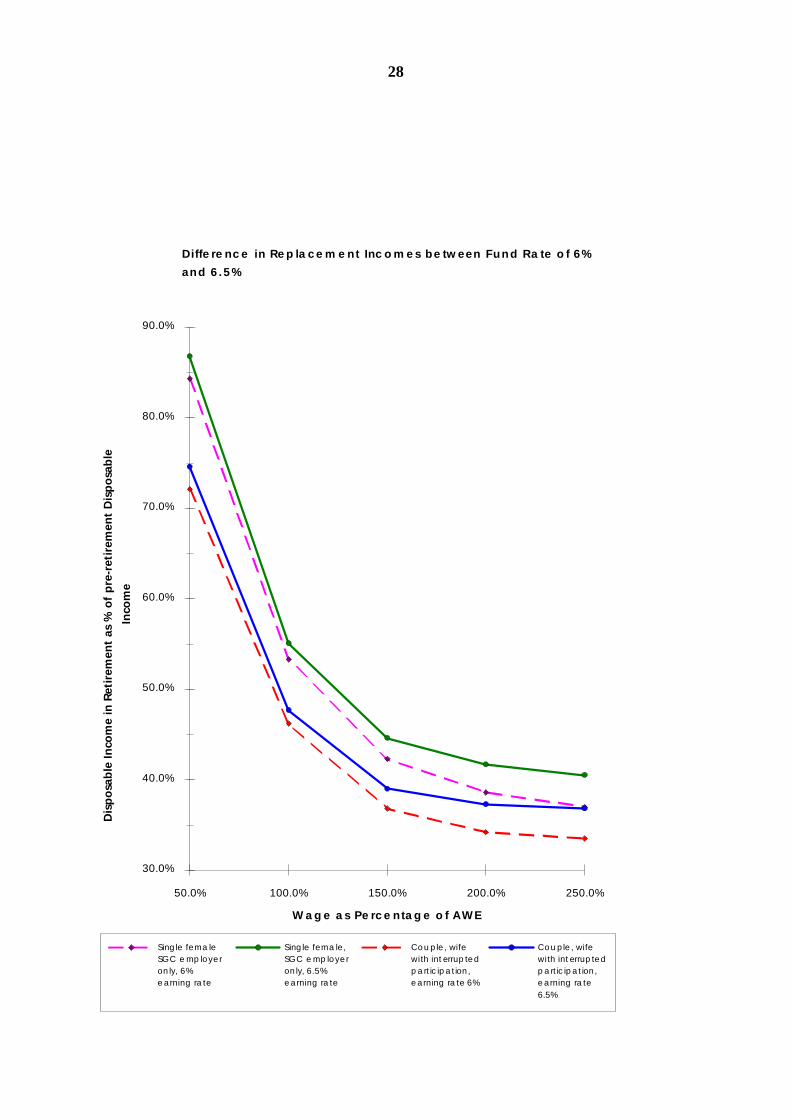
In these scenarios we have used very conservative economic assumptions. That is, the results couldbe seen as pessimistic. AWE growth is 4 %, but wages are discounted for the effect of the SGC.CPI is 3% and both funds and investments earn at the bond rate of 6%. A plausible range for thebond rate in this type of long term analysis might be in the range of 6 to 6½% (ie, 3 to 3½% aboveinflation). We have deliberately used the figure at the lower end of the range in order to give aconservative estimate. Differences in the relativities of these parameters will result in differentoutcomes (Brown 1993, Knox,1993). The modelling results shown in this paper are not comparableto previous examples in Gallagher et al 1993, as different parameters were used for that series.
The base age pension rate is indexed to AWE as it is current Government policy to adjust the rate toa benchmark of 25% of AWE. Because of real wages growth this gives a base pension rate in 1992dollars higher than the current rate. The income and assets test thresholds are indexed to CPI inaccordance with legislation. Tax scales are indexed to AWE.
In all scenarios, home ownership is assumed. It is assumed that the persons modelled have no othersavings or investments, aside from superannuation or the alternative 50% non-concessional amount,but have $25,000 worth of non-financial assets at retirement (base year value, indexed to the CPI upto the time of retirement).
In these scenarios, it has been assumed that without mandated superannuation and tax concessions,wages would have been higher by an amount equivalent to the employer contributions and that eachperson would have saved 50% of the wage increase. It is further assumed that these savings aretaxed at the person's marginal rate. The estimated policy gain is very sensitive to theseassumptions. For example, if a person would have saved the full amount of the wage increase inwage and invested it in a tax advantaged vehicle, then the cost of the superannuation taxconcessions and the gain to retirement income from the policy are both less. Had the person savednone of the increase, the cost of the tax concessions is greater, as is the gain to retirement income.

14
It should be noted that because those born in 1950 retire in 2014-15 rather than 2031-32, both thenominal and real values will be less than for those aged 25 in 1992, as will their pre-retirementdisposable income.
15
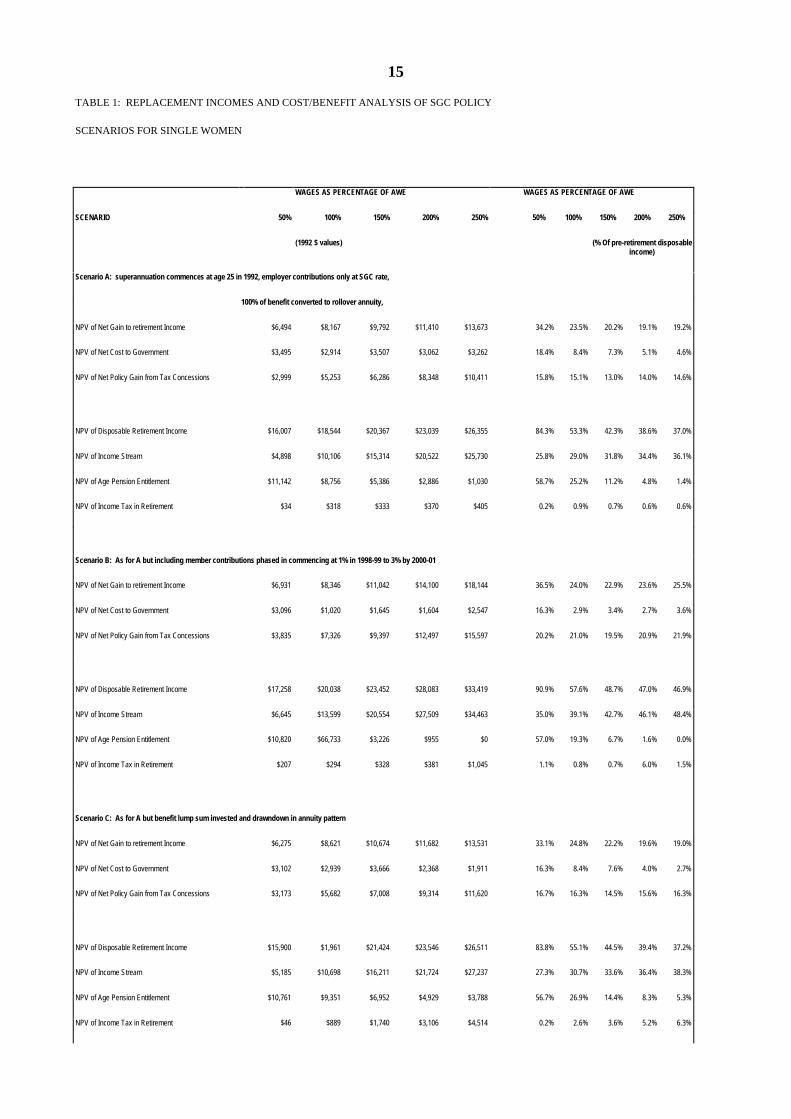
TABLE 1: REPLACEMENT INCOMES AND COST/BENEFIT ANALYSIS OF SGC POLICY
SCENARIOS FOR SINGLE WOMEN
WAGES AS PERCENTAGE OF AWE WAGES AS PERCENTAGE OF AWE
SCENARIO 50% 100% 150% 200% 250% 50% 100% 150% 200% 250%
(1992 $ values) (% Of pre-retirement disposableincome)
Scenario A: superannuation commences at age 25 in 1992, employer contributions only at SGC rate,
100% of benefit converted to rollover annuity,
NPV of Net Gain to retirement Income $6,494 $8,167 $9,792 $11,410 $13,673 34.2% 23.5% 20.2% 19.1% 19.2%
NPV of Net Cost to Government $3,495 $2,914 $3,507 $3,062 $3,262 18.4% 8.4% 7.3% 5.1% 4.6%
NPV of Net Policy Gain from Tax Concessions $2,999 $5,253 $6,286 $8,348 $10,411 15.8% 15.1% 13.0% 14.0% 14.6%
NPV of Disposable Retirement Income $16,007 $18,544 $20,367 $23,039 $26,355 84.3% 53.3% 42.3% 38.6% 37.0%
NPV of Income Stream $4,898 $10,106 $15,314 $20,522 $25,730 25.8% 29.0% 31.8% 34.4% 36.1%
NPV of Age Pension Entitlement $11,142 $8,756 $5,386 $2,886 $1,030 58.7% 25.2% 11.2% 4.8% 1.4%
NPV of Income Tax in Retirement $34 $318 $333 $370 $405 0.2% 0.9% 0.7% 0.6% 0.6%
Scenario B: As for A but including member contributions phased in commencing at 1% in 1998-99 to 3% by 2000-01
NPV of Net Gain to retirement Income $6,931 $8,346 $11,042 $14,100 $18,144 36.5% 24.0% 22.9% 23.6% 25.5%
NPV of Net Cost to Government $3,096 $1,020 $1,645 $1,604 $2,547 16.3% 2.9% 3.4% 2.7% 3.6%
NPV of Net Policy Gain from Tax Concessions $3,835 $7,326 $9,397 $12,497 $15,597 20.2% 21.0% 19.5% 20.9% 21.9%
NPV of Disposable Retirement Income $17,258 $20,038 $23,452 $28,083 $33,419 90.9% 57.6% 48.7% 47.0% 46.9%
NPV of Income Stream $6,645 $13,599 $20,554 $27,509 $34,463 35.0% 39.1% 42.7% 46.1% 48.4%
NPV of Age Pension Entitlement $10,820 $66,733 $3,226 $955 $0 57.0% 19.3% 6.7% 1.6% 0.0%
NPV of Income Tax in Retirement $207 $294 $328 $381 $1,045 1.1% 0.8% 0.7% 6.0% 1.5%
Scenario C: As for A but benefit lump sum invested and drawndown in annuity pattern
NPV of Net Gain to retirement Income $6,275 $8,621 $10,674 $11,682 $13,531 33.1% 24.8% 22.2% 19.6% 19.0%
NPV of Net Cost to Government $3,102 $2,939 $3,666 $2,368 $1,911 16.3% 8.4% 7.6% 4.0% 2.7%
NPV of Net Policy Gain from Tax Concessions $3,173 $5,682 $7,008 $9,314 $11,620 16.7% 16.3% 14.5% 15.6% 16.3%
NPV of Disposable Retirement Income $15,900 $1,961 $21,424 $23,546 $26,511 83.8% 55.1% 44.5% 39.4% 37.2%
NPV of Income Stream $5,185 $10,698 $16,211 $21,724 $27,237 27.3% 30.7% 33.6% 36.4% 38.3%
NPV of Age Pension Entitlement $10,761 $9,351 $6,952 $4,929 $3,788 56.7% 26.9% 14.4% 8.3% 5.3%
NPV of Income Tax in Retirement $46 $889 $1,740 $3,106 $4,514 0.2% 2.6% 3.6% 5.2% 6.3%
16
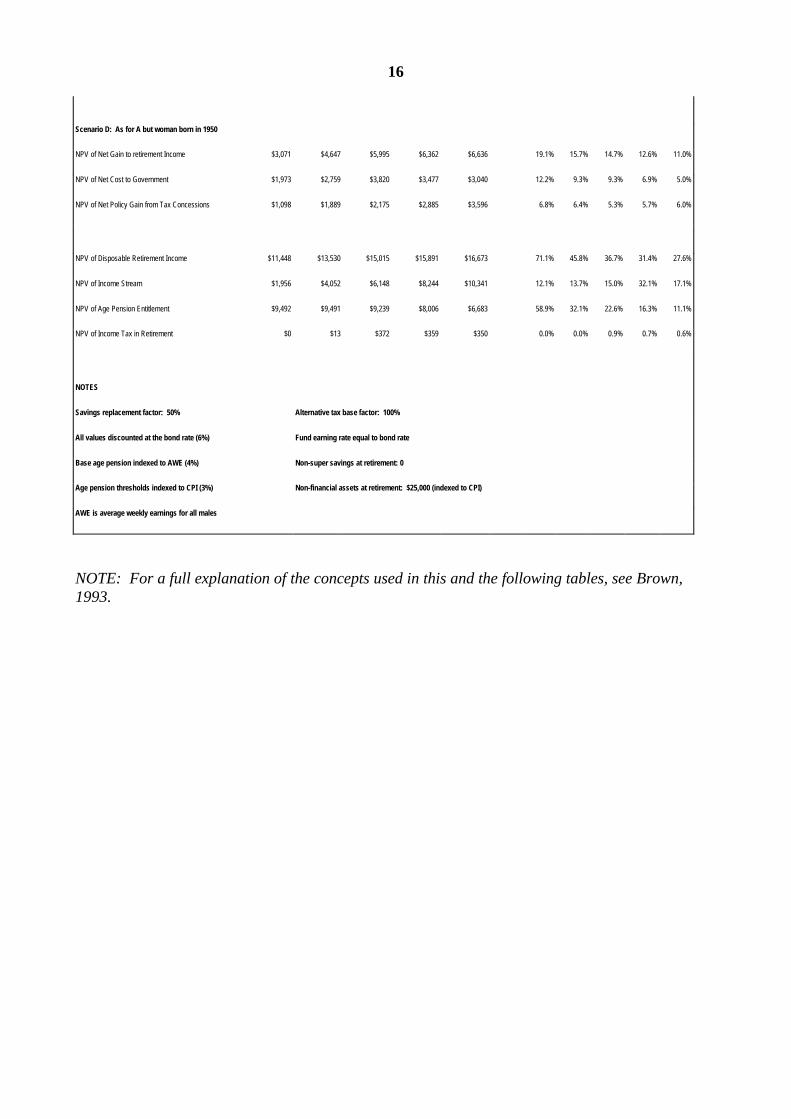
Scenario D: As for A but woman born in 1950
NPV of Net Gain to retirement Income $3,071 $4,647 $5,995 $6,362 $6,636 19.1% 15.7% 14.7% 12.6% 11.0%
NPV of Net Cost to Government $1,973 $2,759 $3,820 $3,477 $3,040 12.2% 9.3% 9.3% 6.9% 5.0%
NPV of Net Policy Gain from Tax Concessions $1,098 $1,889 $2,175 $2,885 $3,596 6.8% 6.4% 5.3% 5.7% 6.0%
NPV of Disposable Retirement Income $11,448 $13,530 $15,015 $15,891 $16,673 71.1% 45.8% 36.7% 31.4% 27.6%
NPV of Income Stream $1,956 $4,052 $6,148 $8,244 $10,341 12.1% 13.7% 15.0% 32.1% 17.1%
NPV of Age Pension Entitlement $9,492 $9,491 $9,239 $8,006 $6,683 58.9% 32.1% 22.6% 16.3% 11.1%
NPV of Income Tax in Retirement $0 $13 $372 $359 $350 0.0% 0.0% 0.9% 0.7% 0.6%
NOTES
Savings replacement factor: 50% Alternative tax base factor: 100%
All values discounted at the bond rate (6%) Fund earning rate equal to bond rate
Base age pension indexed to AWE (4%) Non-super savings at retirement: 0
Age pension thresholds indexed to CPI (3%) Non-financial assets at retirement: $25,000 (indexed to CPI)
AWE is average weekly earnings for all males
NOTE: For a full explanation of the concepts used in this and the following tables, see Brown,1993.
17
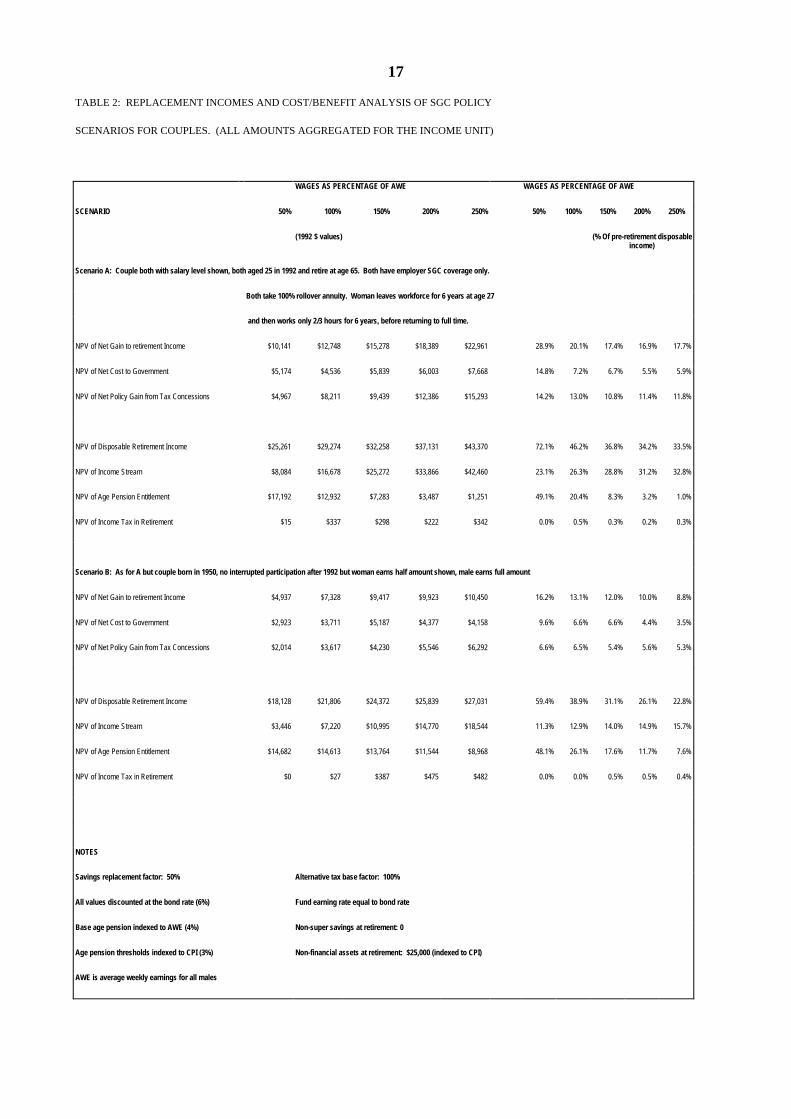
TABLE 2: REPLACEMENT INCOMES AND COST/BENEFIT ANALYSIS OF SGC POLICY
SCENARIOS FOR COUPLES. (ALL AMOUNTS AGGREGATED FOR THE INCOME UNIT)
WAGES AS PERCENTAGE OF AWE WAGES AS PERCENTAGE OF AWE
SCENARIO 50% 100% 150% 200% 250% 50% 100% 150% 200% 250%
(1992 $ values) (% Of pre-retirement disposableincome)
Scenario A: Couple both with salary level shown, both aged 25 in 1992 and retire at age 65. Both have employer SGC coverage only.
Both take 100% rollover annuity. Woman leaves workforce for 6 years at age 27
and then works only 2/3 hours for 6 years, before returning to full time.
NPV of Net Gain to retirement Income $10,141 $12,748 $15,278 $18,389 $22,961 28.9% 20.1% 17.4% 16.9% 17.7%
NPV of Net Cost to Government $5,174 $4,536 $5,839 $6,003 $7,668 14.8% 7.2% 6.7% 5.5% 5.9%
NPV of Net Policy Gain from Tax Concessions $4,967 $8,211 $9,439 $12,386 $15,293 14.2% 13.0% 10.8% 11.4% 11.8%
NPV of Disposable Retirement Income $25,261 $29,274 $32,258 $37,131 $43,370 72.1% 46.2% 36.8% 34.2% 33.5%
NPV of Income Stream $8,084 $16,678 $25,272 $33,866 $42,460 23.1% 26.3% 28.8% 31.2% 32.8%
NPV of Age Pension Entitlement $17,192 $12,932 $7,283 $3,487 $1,251 49.1% 20.4% 8.3% 3.2% 1.0%
NPV of Income Tax in Retirement $15 $337 $298 $222 $342 0.0% 0.5% 0.3% 0.2% 0.3%
Scenario B: As for A but couple born in 1950, no interrupted participation after 1992 but woman earns half amount shown, male earns full amount
NPV of Net Gain to retirement Income $4,937 $7,328 $9,417 $9,923 $10,450 16.2% 13.1% 12.0% 10.0% 8.8%
NPV of Net Cost to Government $2,923 $3,711 $5,187 $4,377 $4,158 9.6% 6.6% 6.6% 4.4% 3.5%
NPV of Net Policy Gain from Tax Concessions $2,014 $3,617 $4,230 $5,546 $6,292 6.6% 6.5% 5.4% 5.6% 5.3%
NPV of Disposable Retirement Income $18,128 $21,806 $24,372 $25,839 $27,031 59.4% 38.9% 31.1% 26.1% 22.8%
NPV of Income Stream $3,446 $7,220 $10,995 $14,770 $18,544 11.3% 12.9% 14.0% 14.9% 15.7%
NPV of Age Pension Entitlement $14,682 $14,613 $13,764 $11,544 $8,968 48.1% 26.1% 17.6% 11.7% 7.6%
NPV of Income Tax in Retirement $0 $27 $387 $475 $482 0.0% 0.0% 0.5% 0.5% 0.4%
NOTES
Savings replacement factor: 50% Alternative tax base factor: 100%
All values discounted at the bond rate (6%) Fund earning rate equal to bond rate
Base age pension indexed to AWE (4%) Non-super savings at retirement: 0
Age pension thresholds indexed to CPI (3%) Non-financial assets at retirement: $25,000 (indexed to CPI)
AWE is average weekly earnings for all males

18
19
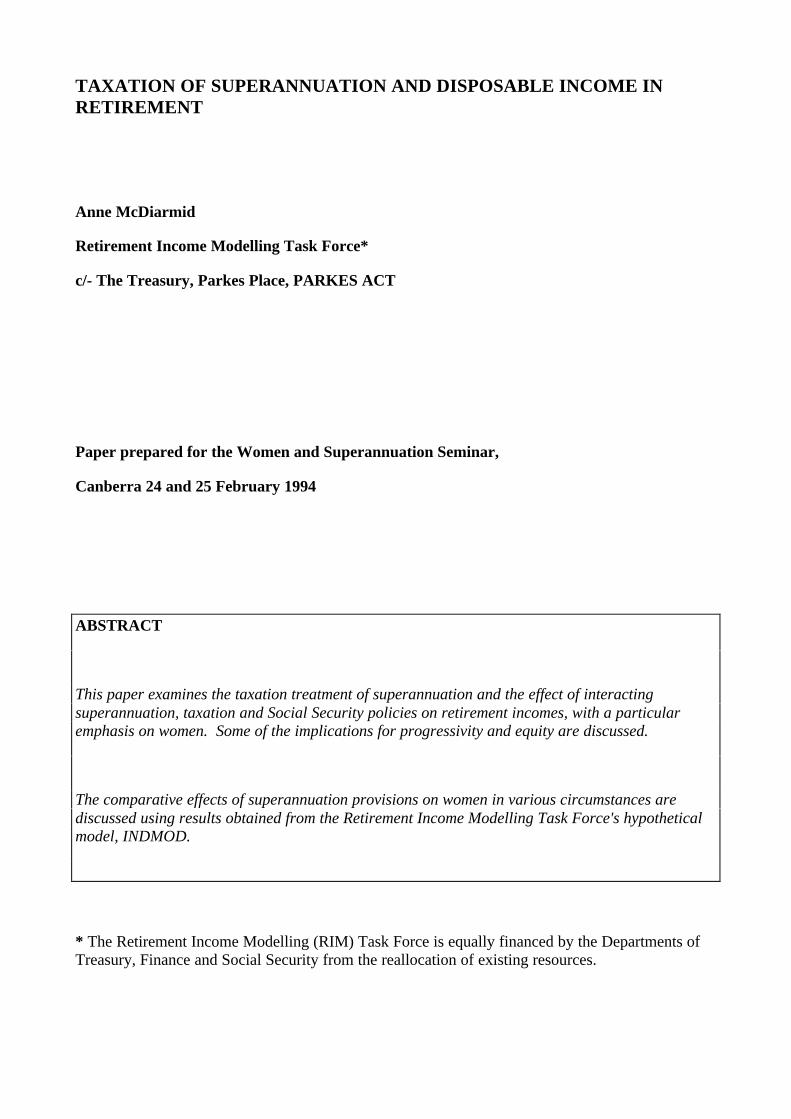
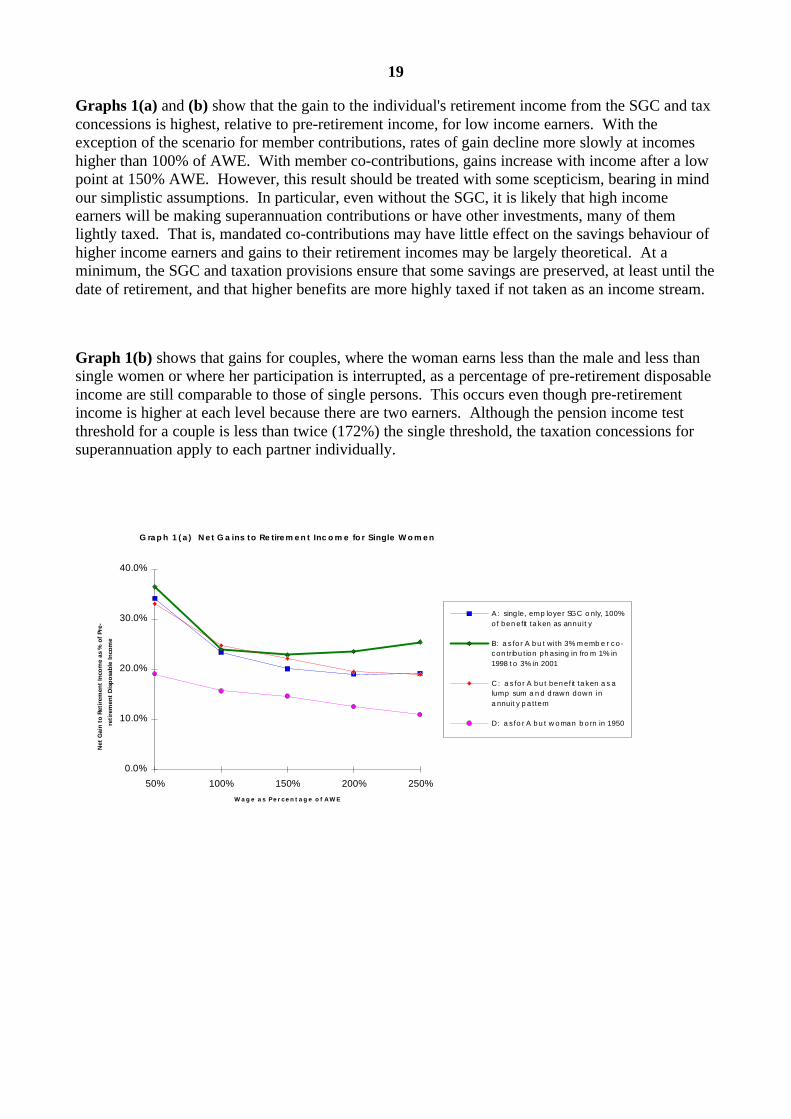
Graphs 1(a) and (b) show that the gain to the individual's retirement income from the SGC and taxconcessions is highest, relative to pre-retirement income, for low income earners. With theexception of the scenario for member contributions, rates of gain decline more slowly at incomeshigher than 100% of AWE. With member co-contributions, gains increase with income after a lowpoint at 150% AWE. However, this result should be treated with some scepticism, bearing in mindour simplistic assumptions. In particular, even without the SGC, it is likely that high incomeearners will be making superannuation contributions or have other investments, many of themlightly taxed. That is, mandated co-contributions may have little effect on the savings behaviour ofhigher income earners and gains to their retirement incomes may be largely theoretical. At aminimum, the SGC and taxation provisions ensure that some savings are preserved, at least until thedate of retirement, and that higher benefits are more highly taxed if not taken as an income stream.
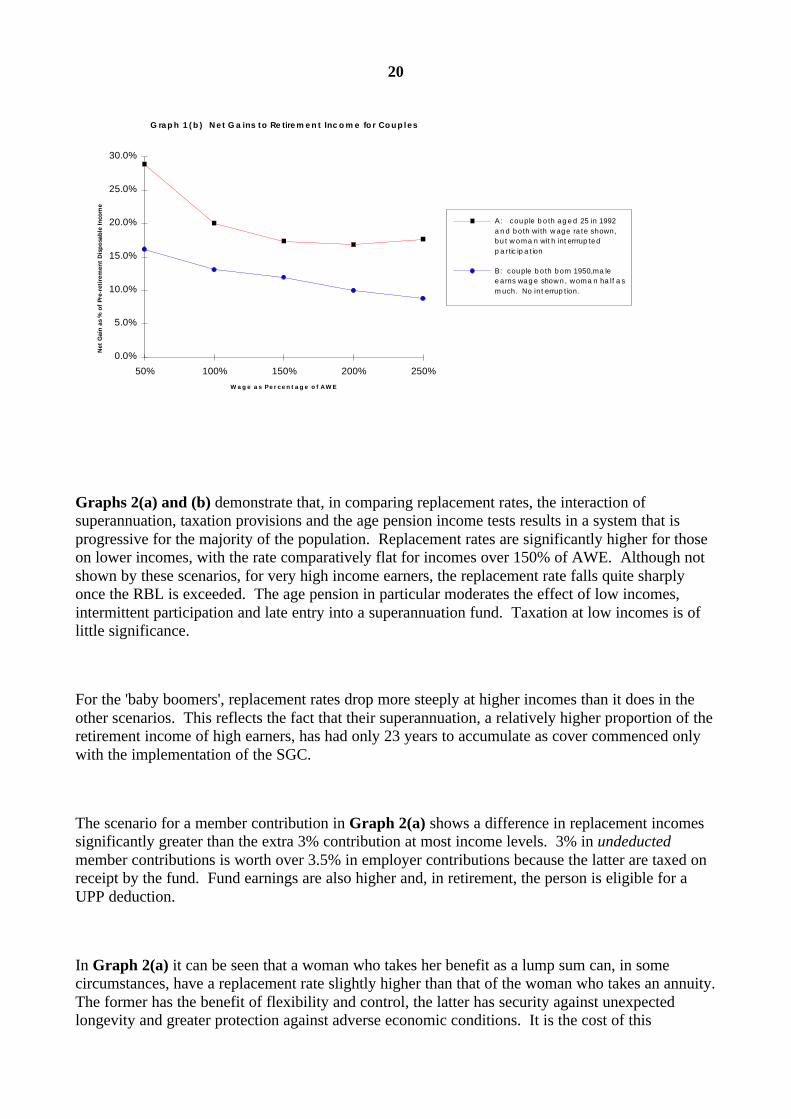
Graph 1(b) shows that gains for couples, where the woman earns less than the male and less thansingle women or where her participation is interrupted, as a percentage of pre-retirement disposableincome are still comparable to those of single persons. This occurs even though pre-retirementincome is higher at each level because there are two earners. Although the pension income testthreshold for a couple is less than twice (172%) the single threshold, the taxation concessions forsuperannuation apply to each partner individually.
G ra p h 1 ( a ) N e t G a ins to Re tire m e n t Inc o m e fo r Single W o m e n
W a g e a s P e r c e n t a g e o f A W E
Net
Gai
n t
o R
etir
emen
t In
com
e as
% o
f Pr
e-
reti
rem
ent
Dis
po
sab
le In
com
e
0.0%
10.0%
20.0%
30.0%
40.0%
50% 100% 150% 200% 250%
A: single, em p loyer SG C o nly, 100%
of benefit ta ken as annuity
B: a s for A but with 3% m ember co-
contribution phasing in fro m 1% in
1998 to 3% in 2001
C : a s for A but benefit taken a s a
lum p sum a nd drawn down in
a nnuity pattern
D: a s for A but woman born in 1950
20
G raph 1 (b ) Net G a ins to Re tire m e n t Inc o m e fo r Couples
W a g e a s P e r c e n t a g e o f A W E
Net
Gai
n a
s %
of
Pre-
reti
rem
ent
Dis
po
sab
le In
com
e
0.0%
5.0%
10.0%
15.0%
20.0%
25.0%
30.0%
50% 100% 150% 200% 250%
A: couple both aged 25 in 1992
a nd both with wage rate shown,
but wom a n with interrrupted
p a rtic ip a tion
B: couple both born 1950,m a le
earns wage shown, wom a n ha lf a s
m uch. No interruption.
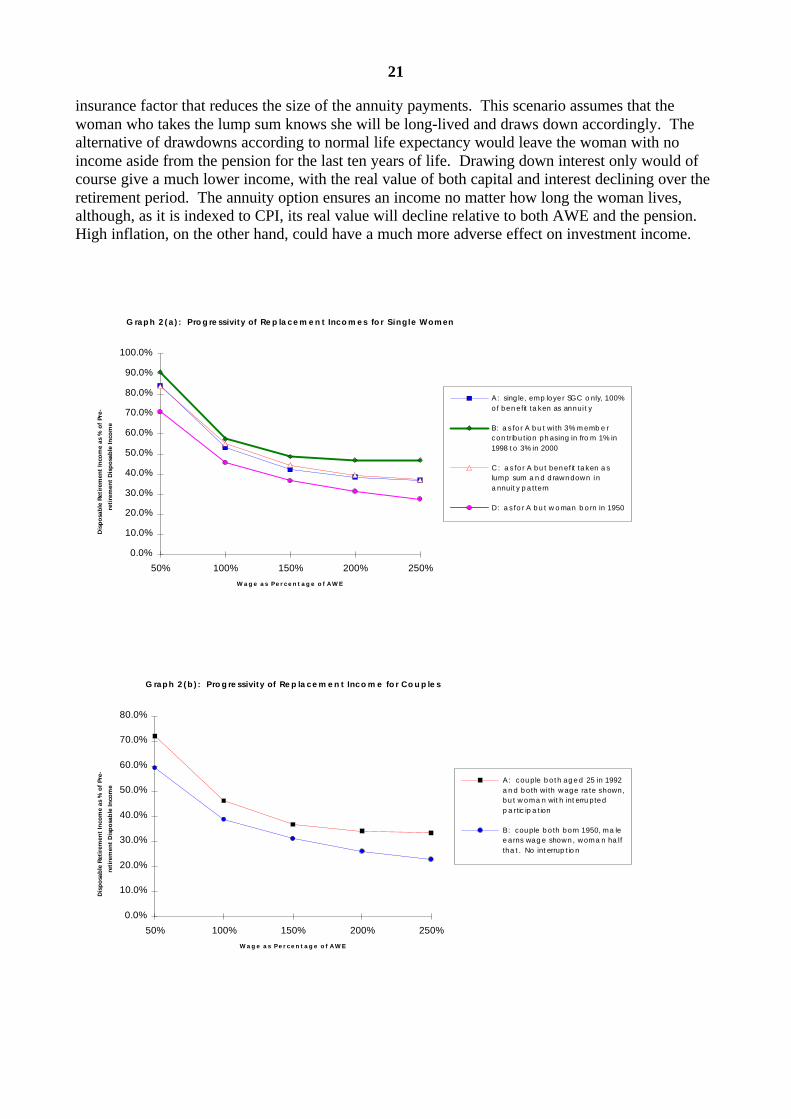
Graphs 2(a) and (b) demonstrate that, in comparing replacement rates, the interaction ofsuperannuation, taxation provisions and the age pension income tests results in a system that isprogressive for the majority of the population. Replacement rates are significantly higher for thoseon lower incomes, with the rate comparatively flat for incomes over 150% of AWE. Although notshown by these scenarios, for very high income earners, the replacement rate falls quite sharplyonce the RBL is exceeded. The age pension in particular moderates the effect of low incomes,intermittent participation and late entry into a superannuation fund. Taxation at low incomes is oflittle significance.
For the 'baby boomers', replacement rates drop more steeply at higher incomes than it does in theother scenarios. This reflects the fact that their superannuation, a relatively higher proportion of theretirement income of high earners, has had only 23 years to accumulate as cover commenced onlywith the implementation of the SGC.
The scenario for a member contribution in Graph 2(a) shows a difference in replacement incomessignificantly greater than the extra 3% contribution at most income levels. 3% in undeductedmember contributions is worth over 3.5% in employer contributions because the latter are taxed onreceipt by the fund. Fund earnings are also higher and, in retirement, the person is eligible for aUPP deduction.
In Graph 2(a) it can be seen that a woman who takes her benefit as a lump sum can, in somecircumstances, have a replacement rate slightly higher than that of the woman who takes an annuity.The former has the benefit of flexibility and control, the latter has security against unexpectedlongevity and greater protection against adverse economic conditions. It is the cost of this
21
insurance factor that reduces the size of the annuity payments. This scenario assumes that thewoman who takes the lump sum knows she will be long-lived and draws down accordingly. Thealternative of drawdowns according to normal life expectancy would leave the woman with noincome aside from the pension for the last ten years of life. Drawing down interest only would ofcourse give a much lower income, with the real value of both capital and interest declining over theretirement period. The annuity option ensures an income no matter how long the woman lives,although, as it is indexed to CPI, its real value will decline relative to both AWE and the pension.High inflation, on the other hand, could have a much more adverse effect on investment income.
G raph 2(a ) : P ro g re ssivity of Re p la c e m e n t Inc o m e s fo r Single Women
W a g e a s P e r c e n t a g e o f A W E
Dis
po
sab
le R
etir
emen
t In
com
e as
% o
f Pr
e-
reti
rem
ent
Dis
po
sab
le In
com
e
0.0%
10.0%
20.0%
30.0%
40.0%
50.0%
60.0%
70.0%
80.0%
90.0%
100.0%
50% 100% 150% 200% 250%
A: single, em p loyer SG C o nly, 100%
of benefit ta ken as annuity
B: a s for A but with 3% m ember
contribution phasing in fro m 1% in
1998 to 3% in 2000
C : a s for A but benefit taken a s
lum p sum a nd drawndown in
a nnuity pattern
D: a s for A but woman born in 1950
G raph 2(b) : Pro g re ssivity of Re p la c e m e n t Inc o m e fo r C o u p le s
W a g e a s P e r c e n t a g e o f A W E
Dis
po
sab
le R
etir
emen
t In
com
e as
% o
f Pr
e-
reti
rem
ent
Dis
po
sab
le In
com
e
0.0%
10.0%
20.0%
30.0%
40.0%
50.0%
60.0%
70.0%
80.0%
50% 100% 150% 200% 250%
A: couple both aged 25 in 1992
a nd both with wage rate shown,
but wom a n with interrupted
p a rtic ip a tion
B: couple both born 1950, m a le
earns wage shown, wom a n ha lf
tha t. No interruption
22
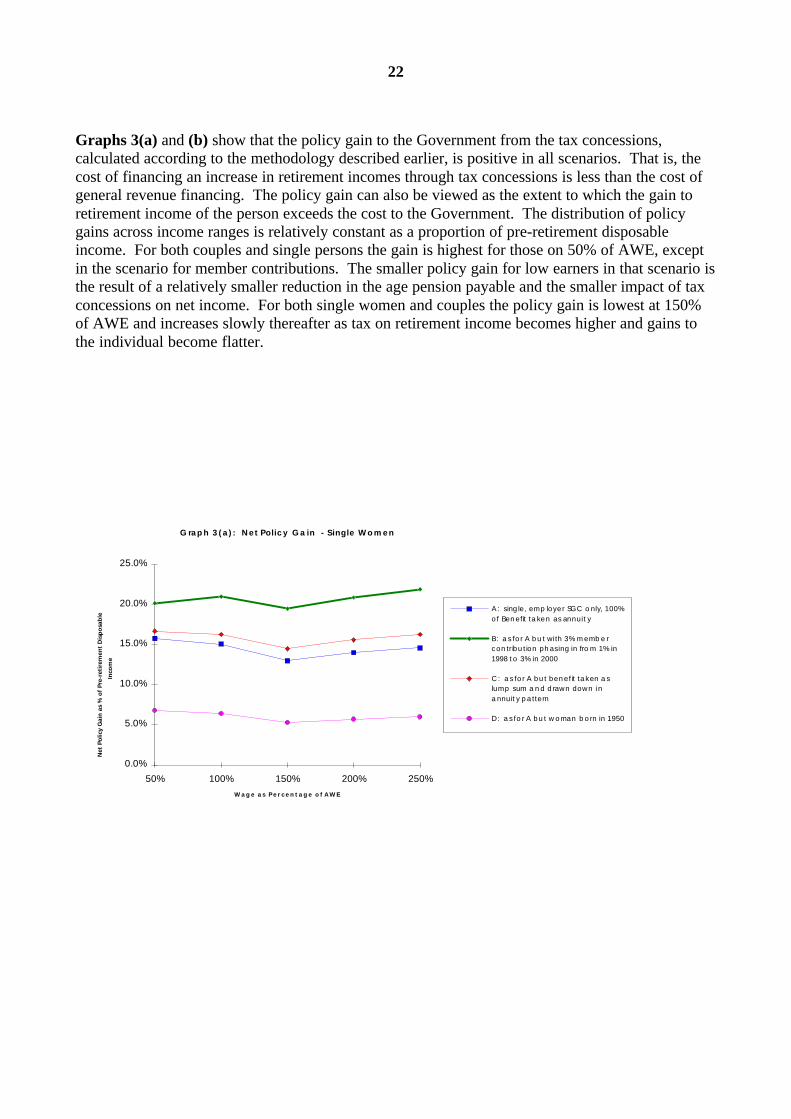
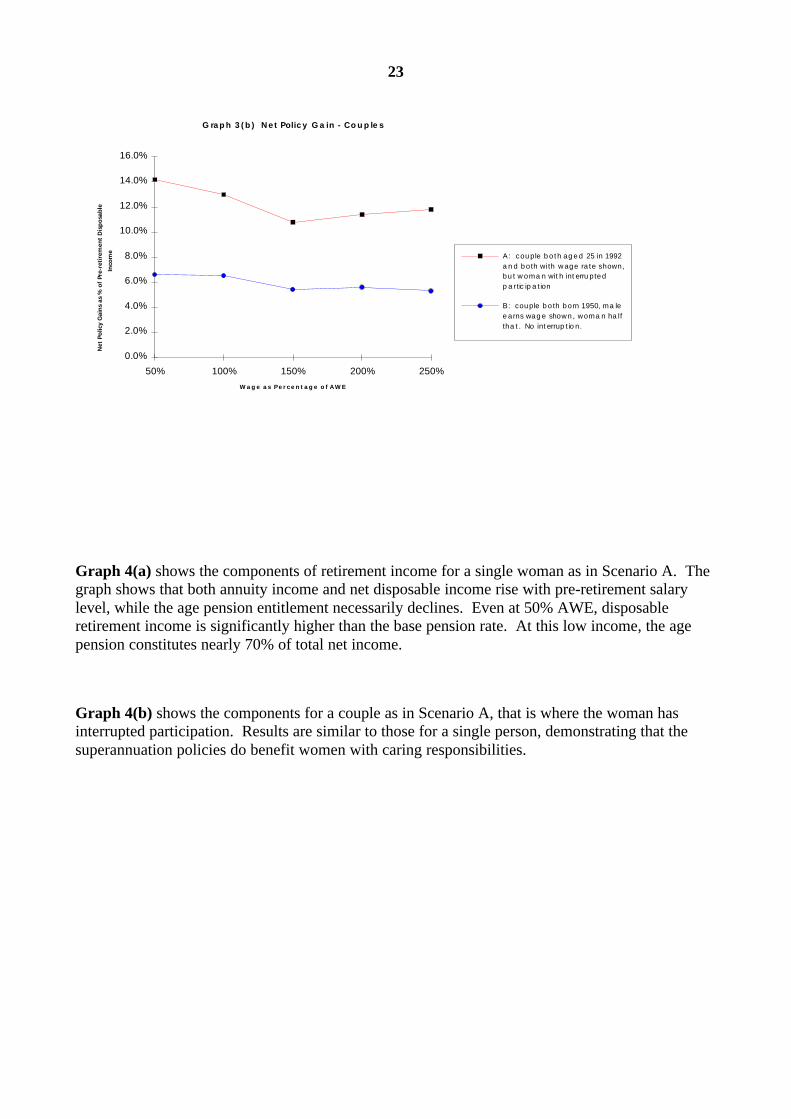
Graphs 3(a) and (b) show that the policy gain to the Government from the tax concessions,calculated according to the methodology described earlier, is positive in all scenarios. That is, thecost of financing an increase in retirement incomes through tax concessions is less than the cost ofgeneral revenue financing. The policy gain can also be viewed as the extent to which the gain toretirement income of the person exceeds the cost to the Government. The distribution of policygains across income ranges is relatively constant as a proportion of pre-retirement disposableincome. For both couples and single persons the gain is highest for those on 50% of AWE, exceptin the scenario for member contributions. The smaller policy gain for low earners in that scenario isthe result of a relatively smaller reduction in the age pension payable and the smaller impact of taxconcessions on net income. For both single women and couples the policy gain is lowest at 150%of AWE and increases slowly thereafter as tax on retirement income becomes higher and gains tothe individual become flatter.
G raph 3 (a ) : Ne t Polic y G a in - Single W o m e n
W a g e a s P e r c e n t a g e o f A W E
Net
Po
licy
Gai
n a
s %
of
Pre-
reti
rem
ent
Dis
po
sab
le
Inco
me
0.0%
5.0%
10.0%
15.0%
20.0%
25.0%
50% 100% 150% 200% 250%
A: single, em p loyer SG C o nly, 100%
of Benefit ta ken as annuity
B: a s for A but with 3% m ember
contribution phasing in fro m 1% in
1998 to 3% in 2000
C : a s for A but benefit taken a s
lum p sum a nd drawn down in
a nnuity pattern
D: a s for A but woman born in 1950
23
G raph 3 (b ) Net Polic y G a in - C o u p le s
W a g e a s P e r c e n t a g e o f A W E
Net
Po
licy
Gai
ns
as %
of
Pre-
reti
rem
ent
Dis
po
sab
le
Inco
me
0.0%
2.0%
4.0%
6.0%
8.0%
10.0%
12.0%
14.0%
16.0%
50% 100% 150% 200% 250%
A: couple both aged 25 in 1992
a nd both with wage rate shown,
but wom a n with interrupted
p a rtic ip a tion
B: couple both born 1950, m a le
earns wage shown, wom a n ha lf
tha t. No interruption.
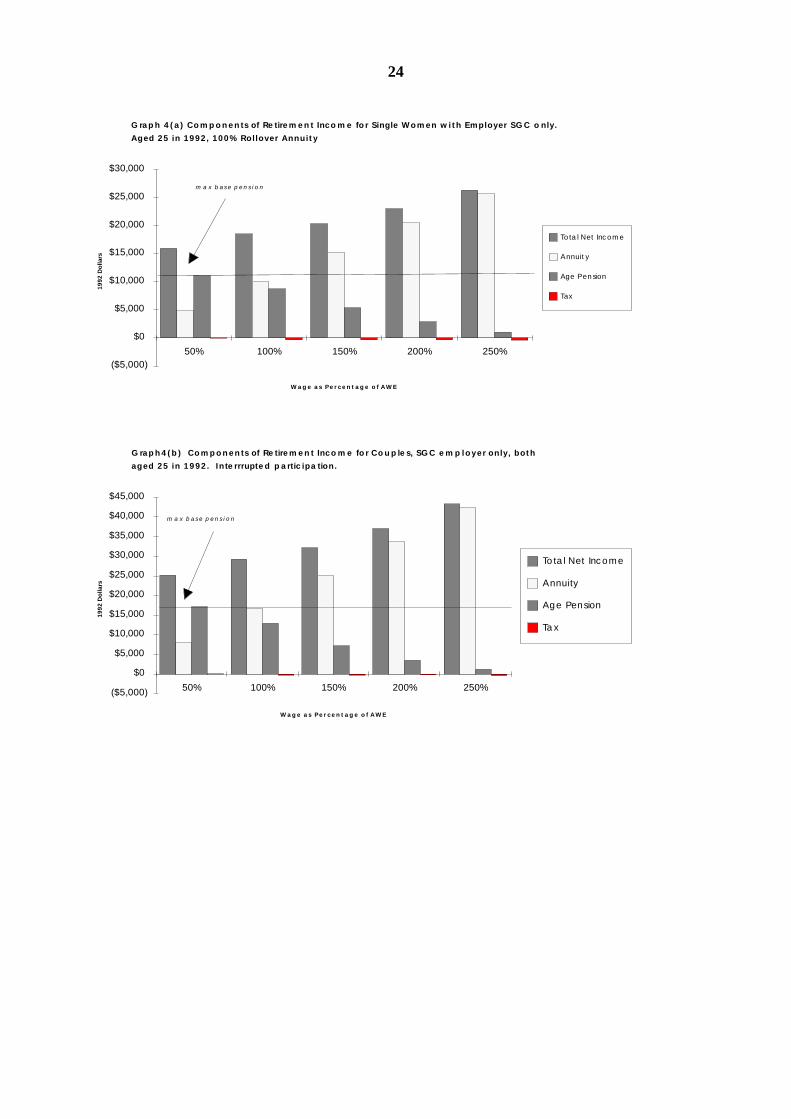
Graph 4(a) shows the components of retirement income for a single woman as in Scenario A. Thegraph shows that both annuity income and net disposable income rise with pre-retirement salarylevel, while the age pension entitlement necessarily declines. Even at 50% AWE, disposableretirement income is significantly higher than the base pension rate. At this low income, the agepension constitutes nearly 70% of total net income.
Graph 4(b) shows the components for a couple as in Scenario A, that is where the woman hasinterrupted participation. Results are similar to those for a single person, demonstrating that thesuperannuation policies do benefit women with caring responsibilities.
24
G ra p h 4 ( a ) C o m p o n e n ts of Re tire m e n t Inc o m e fo r Single Women with Employer SG C o nly.
Aged 25 in 1992, 100% Rollover Annuity
W a g e a s P e r c e n t a g e o f A W E
1992
Do
llars
($5,000)
$0
$5,000
$10,000
$15,000
$20,000
$25,000
$30,000
50% 100% 150% 200% 250%
Tota l Net Incom e
Annuity
Age Pension
Tax
m a x base pension
G raph4(b ) Components of Re tire m e n t Inc o m e fo r C o u p le s, SG C e m p loyer only, both
aged 25 in 1992. Inte rrrupte d p a rtic ipa tion.
W a g e a s P e r c e n t a g e o f A W E
1992
Do
llars
($5,000)
$0
$5,000
$10,000
$15,000
$20,000
$25,000
$30,000
$35,000
$40,000
$45,000
50% 100% 150% 200% 250%
Total Net Incom e
Annuity
Age Pension
Ta x
m a x base pension
25
4. CONCLUSION
The objective of the Government's superannuation policy is to improve retirement incomes in anequitable and cost efficient manner by increaasing vested and preserved superannuation savings.The policy must also balance the revenue and expenditure needs of today against those of thefuture, and address issues of equity between generations as well as between groups in the samegeneration. Future generations would not have thanked us for the unfunded liability of our own agepensions. This would have involved difficult choices between pension adequacy, increases intaxation or decreased expenditure on social programs.
There are costs to individuals in providing for their retirement. It is generally assumed that in thenear future at least, the SGC will slow real wages growth. However, there is still likely to be realwages growth, even during the SGC phase in period. There is no doubt that many people wouldmuch rather have the money in their younger years to invest in their own home, education, orsimply to raise their present standard of living. These factors are important, but need to be balancedwith the urgent need to address the future costs of an ageing population, and the interests of the nextgeneration who would bear the costs of general revenue financing. Given competing pressures toincrease age pensions or provide for the needs of their own families, tomorrow's workers may quiteunderstandably opt for the latter.
On the whole, the interaction of superannuation, taxation and age pension provisions is progressivein terms of replacement income rates. Equity is enhanced by the increased scope and improvedcoverage of superannuation for those who were previously had little or no access to tax advantagedsavings vehicles. Improvements in retirement income are highest for low income earners.However, progressivity is by no means incompatible with high effective marginal tax rates andthese could be considered a policy problem for low income earners.
The longer average life expectancy of women poses particular problems. Because of this, a womanpays more than a man for an annuity of equivalent annual value. However a lifetime annuityprotects a woman from the adverse financial effects of unexpected longevity. Her income will lastfor as long as she lives and will be protected against inflation. As the CPI indexed annuity falls invalue in comparison to wage levels, age pension entitlement will increase to compensate. Amarried woman, on the other hand, can generally expect to outlive her spouse. Her own annuityand a reversionary annuity or death benefit in respect of her spouse will give her an income streamhigher than a single person (male or female) with a similar pre-retirement income.
The above examples demonstrate that both single and married women gain in retirement from thesuperannuation policies. Never-married women are increasingly experiencing work patterns, wagelevels and retirement incomes similar to those of men. Married women who curtail theirparticipation or work at lower paid jobs in order to care for their family will share the increasedretirement income of their spouse as well as the (smaller) increase in their own retirement income.

26
It is also likely that the participation and earnings of married women will continue to increase. Fordivorced women, the issue of the treatment of superannuation assets in property settlements is animportant issue which the Government has announced it intends to address in the near future.
27
REFERENCES
Australian Bureau of Statistics 1990, '1990 Survey of Income and Housing Costs and Amenities:Unit Record File on Magnetic Tape and Floppy Disk", Catalogue No.65430, Canberra.
Bateman, H. and Piggott, J. 1993, 'Senate Select Committee On Superannuation, Submission No.2',Superannuation Economics Research Group, No. 11 of Research Paper Series, University of NewSouth Wales.
Brown, C.L., 1993, 'Tax Expenditures and Measuring the Long Term Costs and Benefits ofRetirement Incomes Policy', Paper to Colloquium of Superannuation Researchers, University ofMelbourne, July 1993.
Dawkins, J 1992, 'Security in Retirement - Planning for Tomorrow Today', a statement delivered on30 June 1992 by the Honourable John Dawkins, MP, then Treasurer of the Commonwealth ofAustralia, AGPS, Canberra.
Fitzgerald, V. W., 1993, 'National Saving: A Report to The Treasurer', AGPS, Canberra
Gallagher, P., Rothman, G. and Brown, C. (1993), 'Saving for Retirement: The Benefits ofSuperannuation for Individuals and the Nation', Paper presented to the National Social PolicyConference, University of New South Wales, 14 July, 1993.
Kingston, G., Bateman, H. and Piggott, J., 1993, 'Equity, Efficiency and the SuperannuationGuarantee', Superannuation Economics Research Group, No. 13 of Research Paper Series,University of New South Wales.
Knox, D. M., 1993, 'A Critique of the Direction of Current Superannuation Developments Using aSimulation Approach', Paper to Colloquium of Superannuation Researchers, University ofMelbourne, July 1993.
Knox, D. and Piggott, J., 1993, 'Contemporary Issues In Australian Superannuation - A ConferenceSummary', Superannuation Economics Research Group, No. 12 of Research Paper Series,University of New South Wales.
28
Diffe re nc e in Re p la c e m e nt Inc o m e s be tween Fund Ra te o f 6%
and 6.5%
W a g e a s Pe rc e nta g e o f AWE
Dis
po
sab
le In
com
e in
Ret
irem
ent
as %
of
pre
-ret
irem
ent
Dis
po
sab
le
Inco
me
30.0%
40.0%
50.0%
60.0%
70.0%
80.0%
90.0%
50.0% 100.0% 150.0% 200.0% 250.0%
Single fem a le
SG C e m p loyer
only, 6%
earning ra te
Single fem a le,
SG C e m p loyer
only, 6.5%
earning ra te
Couple, wife
with interrupted
p a rticipation,
earning ra te 6%
Couple, wife
with interrupted
p a rticipation,
earning ra te
6.5%

29