Embed Size (px)
Citation preview

This PDF is a selection from an out-of-print volume from the NationalBureau of Economic Research
Volume Title: Tax Policy and the Economy, Volume 9
Volume Author/Editor: James M. Poterba
Volume Publisher: MIT Press
Volume ISBN: 0-262-16153-2
Volume URL: http://www.nber.org/books/pote95-1
Conference Date: November 15, 1994
Publication Date: January 1995
Chapter Title: Taxation and Mutual Funds: An Investor Perspective
Chapter Author: Joel M. Dickson, John B. Shoven
Chapter URL: http://www.nber.org/chapters/c10894
Chapter pages in book: (p. 151 - 180)
TAXATION AND MUTUALFUNDS: AN INVESTORPERSPECTIVE
Joel M DicksonBoard of Governors, Federal Reserve System
John B. ShovenStanford University and NBER
EXECUTIVE SUMMARY
Shareholder level taxes are taken into account in determining the perfor-mance of growth and growth and income mutual funds over the 1963-1992 period. We rank a sample of funds on a before- and after-tax basisfor investors in different income classes facing various investment hori-zons. The differences between the relative rankings of funds on a before-and after-tax basis are dramatic, especially for middle- and high-incomeinvestors. For instance, one fund that ranks in the 19th percentile on apretax basis ranks in the 63rd percentile for an upper-income, taxableinvestor. We also present an analysis of the extra taxes that shareholdersbear because of the failure of mutual funds to manage their realizedcapital gains in such a way as to permit a substantial deferral of taxes.
This research was undertaken while Dickson was a doctoral candidate in the Departmentof Economics at Stanford University. The research presented and opinions expressed aresolely those of the authors and do not necessarily reflect those of the Board of Governors,the Federal Reserve Banks, or other members of its staff. The authors would like to thankVictor Fuchs, John Andrew McQuown, James Poterba, Charles Schwab, William Sharpe,Mark Wolfson, and seminar participants at Stanford University, UCSD, and NBER forhelpful comments and discussions. Financial support was provided by Charles Schwab &Company.

152 Dickson & Shoven
While it is not possible to determine precisely this magnitude, the extrataxes almost certainly amounted to more than $1 billion in 1993.
1. INTRODUCTIONAmerican households invest vast sums of money in U.S. equity marketsthrough mutual funds. According to the Federal Reserve's Flow of FundsAccounts, investors purchased an additional $67.1 billion in corporateequity via mutual funds in 1992 alone. By the end of 1992, individualassets in equity mutual funds totalled $466.4 billion versus $181.7 billionjust five years prior. The result has been a huge demand for informationabout the performance of mutual funds in all types of media Magazinessuch as Consumer Reports, Forbes, Fortune, Business Week, and Money Maga-zine frequently feature mutual fund performance rankings. Newspapersand public television cover these matters, and a small industry has devel-oped providing newsletters and tabulated data regarding mutual funds.
Are the media and the funds themselves providing the most relevantperformance information for most investors? Our answer is "no." Thisnegative response results because tax considerations matter a great dealfor most mutual fund investors, while many published performancemeasures and rankings ignore taxes.1 As Table 1 suggests, a significantportion of the total assets of growth and growth and income funds aresubject to shareholder level taxation. As of December 31, 1992, at least58.6 percent of the total assets of growth and growth and income fundswere subject to shareholder level taxes. In this paper we document thattaxes not only affect the level of returns of equity mutual funds fortaxable investors, but also that taxes dramatically affect the relative rank-ings of the funds.
A mutual fund's returns can be described in at least three ways. First,there is the return on the fund's underlying portfolio. Second, the gross-of-tax return is the return on the fund's portfolio after fees, loads, andbid/ask spread losses due to a fund's turnover are taken into account.This gross-of-tax return (usually without load adjustments) is the returnreported by the funds themselves and used by academics and the popu-lar press to determine mutual fund rankings. The third measure, and the
I Prior to 1993, only Fortune magazine regularly published after-tax returns. In general,mutual fund returns are ranked over relatively short horizonsone, three, or five years. Afund's sensitivity to the taxes of its shareholders, however, can not be easily determinedover such a short horizon, since variations in pretax returns among equity mutual fundsmay mask the beneficial or detrimental tax management of a fund's advisor. This paperconsiders much longer investment horizons (10 years at a minimum) when a fund's "taxsensitivity" can be discerned with more confidence.

Taxation and Mutual Funds 153
TABLE 1.Mutual Fund Asset Composition of Growth and Growth and Income
Funds, Year-end 1992 (millions of dollars)
Source: Investment Company Institute (1993).
Fiduciaries, Corporations, Retirement Plans, and Other Institutions are included in the category "Institu-tional Assets," which is not available by investment objective. At the end of 1992, institutional assetsrepresented 31.73 percent of the total assets of equity, bond, and income funds. The estimate ofinstitutional assets, therefore, is taken to be 31.73 percent of the total net assets within each classifica-tion. The estimates for retirement plans and other institutions (assumed to be tax exempt) representeach component's share in the institutional assets category.
one we argue is the relevant statistic for investors subject to shareholderlevel taxation, is the net-of-tax return. The net-of-tax return equals thegross return minus the amount of taxes that the shareholder must payon dividend and realized capital gains distributions.
Many people need both pretax and posttax performance information.Consider an equity investor who is accumulating money in a tax-sheltered 401(k) pension plan and also investing after-tax income in anequity mutual fund outside the pension system. It matters a great dealwhich fund is used in each case, but the published information giveslittle, if any, guidance as to which funds have been most appropriateunder each scenario. This paper provides a substantial amount of infor-mation that should be valuable to investors with both taxable and taxdeferred mutual fund accounts.
Since the seminal work of Treynor (1965), Sharpe (1966), and Jensen(1968, 1969,. 1972), there have been hundreds of academic papers onmutual fund performance and evaluation. One class of these papers(e.g., Kon and Jen, 1978, 1979; Lehmann and Modest, 1987; Grinblattand Titman, 1993) compares and contrasts the myriad ways to evaluateperformance relative to some benchmark. The other class of papers onthis topic (e.g., Chang and Lewellen, 1984; Henriksson, 1984; Ippolito,1989) focuses more on the opportunity cost of mutual fund investing.Topics in the second class include whether mutual funds are able to"outperform" the market through timing and selection ability and
Growth and growth and income fundsTotal net assets 301,496.3IRA assets 61,729.0Self-employed retirement plan assets 10,193.1Other retirement plans (est.) 23,633.3Other nontaxable institutions (est). 29,398.9
Taxable assets 176,542.0(58.6%)
154 Dickson & Shoven
whether mutual funds offer superior returns to the market as a whole inorder to offset their expenses, fees, and load charges. In the context ofacademic research, only Horowitz (1965), who focuses on the internalrate of return of alternative mutual fund investments, and Jeffrey andArnott (1993), who focus on the relationship between turnover and net-of-tax performance, adjust mutual fund returns for the effects of per-sonal taxes.
Instead of focusing solely on the pretax performance of mutual fundsprevalent in both academic studies and the popular press, we will con-sider three different performance measures. The pretax return is rele-vant for those individual investors who enjoy tax-deferred status ontheir asset accumulations (e.g., IRA accounts). For individuals subject toshareholder level taxation, we compute posttax returns by adjusting thepretax return for any required tax payments. Posttax returns are calcu-lated for individuals in three different tax brackets. We also calculateliquidation values for each of the three tax rates. The liquidation value isthe amount that an individual would receive by selling all of her mutualfund shares and subtracting the required tax payments for previouslyunrealized capital gains.
The remainder of the paper proceeds as follows: Section 2 describesthe data used in our analysis. Section 3 presents our basic methodology.Section 4 demonstrates how startling mutual fund performance changescan be when shareholder taxes are considered. Section 5 discusses risk-adjusting the mutual fund returns. Section 6 looks at the aggregate taxsaving that might be possible if mutual funds distributed less realizedcapital gains and allowed shareholders to defer taxes. Section 7 exam-ines the contention that a fund's turnover rate is related to its posttaxperformance, while Section 8 concludes and summarizes.
2. DATAWe compiled a data set of mutual funds using the following criteria. Asof October 31, 1992, the fund must have been classified as a Growth orGrowth and Income fund in the Morningstar Mutual Funds data base.Since the tax effects we wish to consider should compound over a longtime horizon, we required the fund to have been in existence for at least10 years. Each fund meeting these criteria was ranked on total net assetswith the largest 150 funds chosen.2 Our largest fund is Fidelity Magellan
2 There is certainly a selection bias induced by choosing, ex post, the 150 largest funds.Since our focus is how taxes change the relative rankings of mutual funds and not onquantifying the return of a representative fund over a particular horizon, this bias shouldnot affect our basic conclusions.

Taxation and Mutual Funds 155
with $20.55 billion in total assets. The 150th fund, Eaton Vance Stock,had total assets of $86.91 million as of October 31, 1992. As of December31, 1992, these funds had combined total net assets of $209,104.1 million,or 69.4 percent of the total reported in Table 1.
Investment Company Data Institute (ICDI) maintains a data base ofmutual fund disbursements dating back approximately 30 years. Foreach fund in our sample, we obtained from ICDI month-end net assetvalues (NAV), dividend and realized capital gains payments per share,"ex" dates for the dividend and capital gains distributions, reinvestmentprices for the distributions, and split dates and ratios.4 NAVs are net ofexpenses and fees but not adjusted for any load charges. The data coverthe entire history of the mutual fund or the 30-year span 1963-1992 forthose funds in existence for more than 30 years.5 Sixty-two of the 147funds had data for the entire 30-year period, and 126 funds had beenoperating for at least 20 years.
The data from ICDI combine short-term and long-term realized capitalgains distributions in the reported capital gains distribution amounts.Under the United States Tax Code, however, short-term realized capitalgains are taxed as ordinary income and do not qualify for the preferentialtax treatment historically afforded long-term realized capital gains. TheICDI data, then, overstate the posttax return of those funds that distrib-ute short-term capital gains.
The capital gains distributions reported by ICDI are checked againstboth Moody's Annual Dividend Record and Standard and Poor's AnnualDividend Record. Both the Moody and Standard and Poor's publicationsreport the short-term and long-term realized capital gains distributionsby mutual funds. If either issue reports short-term capital gains, then thecapital gains distribution reported by ICDI is adjusted to reflect the re-spective short-term and long-term realized capital gains components.6
Three funds had to be deleted from our original list. In November 1992, the ShearsonAppreciation Portfolio Fund was merged into the Shearson Appreciation Fund. Data acqui-sition problems led to the deletion of the General Electric S&S Program Fund. Finally,Lexington Corporate Leaders is set up as a unit investment trust whose distributionsinclude nontaxable return of capital. Since our data do not break down the taxable andnontaxable portions of their payments to shareholders, we deleted Lexington CorporateLeaders from our list of funds. Our total sample, therefore, consists of 147 growth andgrowth and income funds.
We are indebted to Bill Crawford, Sr. of ICDI for making this data available to us.
ICDI data for four funds are available only quarterly from January 1963 through Septem-ber 1967 and are not included in our analysis over that time period.
6 Prior to the late 1970s, short-term capital gains breakouts in the Moody's and Standardand Poor's publications are more limited, a fact that could result in some short-term gainsstifi being treated as long-term gains in the data.

156 Dickson & Shoven
3. RETURN CALCULATIONS
We define the monthly total return as the percentage change in value atthe end of the current month of one mutual fund share purchased at theend of the previous month. Returns are calculated on both a pretax and aposttax basis. Intuitively, the pretax measure reinvests the entire distri-bution while the posttax measure reinvests only the after-tax payment.In notational terms:
R(shares * NAV - NAV_1)
NAV1
where
flat
pretax: shares = 1 + Divs1+
KGains1
PD PKGJ
dt (1 - Tdt)DiV5 nt (1 - rjKGains.posttax: shares = 1 +
PD,+
Returns are adjusted for splits as necessary. NAVE is the fund's net assetvalue at the end of month t. Divs and KGains are the dividend and realizedcapital gains payments per share that are reinvested at prices PD andPKG, respectively. There are nd dividend distributions and capital gainsdistributions in a given month. Dividends are taxed at the marginal rateon ordinary income, Tdt, and realized capital gains are taxed at A provi-sion of the tax code is that long-term realized capital gains distributed bymutual funds are taxable as long-term gains, even though, at the time ofthe distribution, an individual might not have held her mutual fundshares for the time normally required for an investment to qualify for thepreferential long-term rate.
Since our data report "ex"-dates instead of actual payment dates, ourmethodology assumes that a distribution's "ex"-date and payment datefall within the same month. For the long horizons we consider in thispaper such an assumption should not adversely affect accumulations. Inaddition, the tax code currently states that any distribution announcedin October, November, or December is treated as income in that calen-dar year even if the payment is not disbursed until January of the follow-ing calendar year. The tax code, therefore, treats any payment with aDecember "ex"-date, when many distributions are made, as payable inDecember.
(1)

Taxation and Mutual Funds 157
There are two additional assumptions embedded in equation (1). First,all distributions are taxed immediately. Second, for multiple distribu-tions on different days within the month, we assume that the fund hasalready gone "ex." In other words, the new shares received from re-investing one payment have no claim on any further distributions madewithin the same month.
Posttax returns are computed for investors in three different tax brack-ets. Using the Internal Revenue Service's Statistics of Income, we calculatethe median adjusted gross income (AGI) for each year between 1963 and1989. Median AGI is assumed to grow at the rate of the consumer priceindex from 1990 to 1992. These calculations lead to a value of $21,314 formedian AGI in 1992. We define a "low-tax" individual as having taxableincome equal to the median AGI less the standard deduction for marriedpersons and three exemptions. We feel that such an individual probablyrepresents the low end of the mutual fund marketplace. A "middle-tax"and "high-tax" individual are similarly defined using three times medianAGI and 10 times median AGI, respectively. Investors are assumed toretain their tax status (low, middle, high) throughout the analysis.7
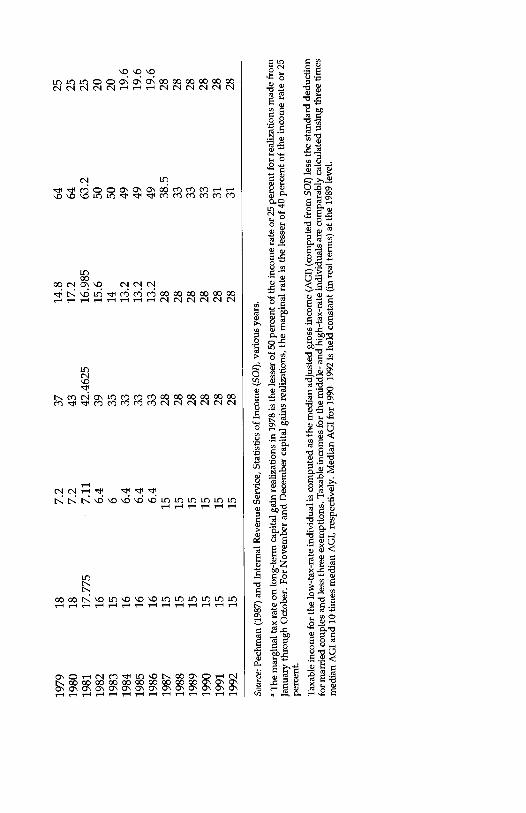
Table 2 presents the annual marginal tax rates for ordinary income andlong-term realized capital gains based on the taxable income of each of ourthree individuals. These rates are compiled from Pechman (1987) andvarious issues of IRS Publication No. 17. Throughout most of this period,the first $200 of dividend income could be excluded from taxation formarried persons filing jointly. We assume that any dividends paid by themutual funds in our analysis are not subject to the dividend exclusion.
Prior to the 1986 tax reform, an individual was allowed to exclude 60percent of his realized long-term capital gains (50 percent prior to No-vember 1978) from the ordinary income tax, and the marginal tax rate ongains was limited to a maximum of 25 percent for most investors. Duringthe 1970s, however, gains in excess of $50,000 were subject to an addi-tional tax on the excluded portion of the gain, resulting in a highermarginal rate that varied with the amount of the realized gain (seeMinarik, 1981). We assume that realized capital gains for each of ourindividuals total less than $50,000 annually over this period. Beginningin 1987, realized long-term capital gains are taxed at the maximum of theordinary income rate or 28 percent.8
We consider only federal tax rates. Returns can differ even more when state and localtaxes are taken into account.8 The reader should note that our posttax return calculations discount realized capitalgains distributions by the full marginal tax rate on long-term gains. This implicitly assumesthat the taxpayer either does not realize capital losses on other assets or uses losses tooffset realized gains from investments other than the mutual fund.

TA
BL
E 2
.M
argi
nal T
ax R
ates
for
Thr
ee I
nves
tor
Typ
es
Yea
r
Low
tax
rate
Mid
dle
tax
rate
Hig
h ta
x ra
teIn
com
eK
Gai
nsIn
com
eK
Gai
nsIn
com
eK
Gai
ns
1963
2010
2613
5925
1964
17.5
8.75
2713
.553
.525
1965
168
2512
.550
2519
6617
8.5
2512
.550
2519
6717
8.5
2512
.553
2519
6818
.275
9.13
7526
.875
13.4
375
56.9
7525
1969
18.7
9.35
30.8
15.4
58.3
2519
7019
.475
9.73
7528
.714
.35
56.3
7525
1971
178.
528
1455
2519
7219
9.5
2814
5525
1973
199.
528
1458
2519
7419
9.5
3216
5825
1975
199.
532
1658
2519
7619
9.5
3216
6025
1977
199.
536
1860
2519
7819
a36
62a
Sour
ce: P
echm
an (
1987
) an
d In
tern
al R
even
ue S
ervi
ce, S
tatis
tics
of I
ncom
e (S
O))
, var
ious
yea
rs.
"The
mar
gina
l tax
rat
e on
long
-ter
m c
apita
l gai
n re
aliz
atio
ns in
197
8 is
the
less
er o
f 50
per
cent
of
the
inco
me
rate
or
25 p
erce
nt f
orre
aliz
atio
ns m
ade
from
Janu
ary
thro
ugh
Oct
ober
. For
Nov
embe
r an
d D
ecem
ber
capi
tal g
ains
rea
lizat
ions
, the
mar
gina
l rat
e is
the
less
er o
f 40
per
cent
of
the
inco
me
rate
or2
5
perc
ent.
Tax
able
inco
me
for
the
low
-tax
-rat
e in
divi
dual
is c
ompu
ted
as th
e m
edia
n ad
just
ed g
ross
inco
me
(AG
I) (
com
pute
d fr
om S
O))
less
the
stan
dard
ded
uctio
nfo
r m
arri
ed c
oupl
es a
nd le
ss th
ree
exem
ptio
ns. T
axab
le in
com
es f
or th
e m
iddl
e- a
nd h
igh-
tax-
rate
indi
vidu
als
are
com
para
blyc
alcu
late
d us
ing
thre
e tim
esm
edia
n A
GI
and
10 ti
mes
med
ian
AG
I, r
espe
ctiv
ely.
Med
ian
AG
I fo
r 19
90-1
992
is h
eld
cons
tant
(in
rea
l ter
ms)
at t
he 1
989
leve
l.
1979
187.
237
14.8
6425
1980
187.
243
17.2
6425
1981
17.7
757.
1142
.462
516
.985
63.2
25
1982
166.
439
15.6
5020
1983
156
3514
5020
1984
166.
433
13.2
4919
.6
1985
166.
433
13.2
4919
.6
1986
166.
433
13.2
4919
.6
1987
1515
2828
38.5
28
1988
1515
2828
3328
1989
1515
2828
3328
1990
1515
2828
3328
1991
1515
2828
3128
1992
1515
2828
3128

160 Dickson & Shoven
4. RESULTS
We generate mutual fund returns under three different scenarios. Thepretax return is relevant for investors whose assets are in tax deferredaccounts (e.g., IRAs and Keoghs). The posttax return is most relevantfor those taxable investors with long holding periods or who plan to passtheir assets through their estate.9 The liquidation value is the amount ofmoney an investor would receive if he were to liquidate his mutual fundposition at the end of the holding period. This value best describes theopportunities for those investors divesting assets at the end of the pe-riod for a specified purpose (e.g., tuition payments, down-payment for ahouse, purchasing a yacht). The liquidation value for a $1 initial invest-ment is calculated by the following formula:
T T
LT= fl (1 + R) - TCT ( [1(1 + R) - basisT);t=i t=1
1 / 'dl cl
basisT= 1 + (1 - Tdl)DivsIl + (1 - rci)KGainsji) (2)NAy0 j1
1 T fi / di
+NAy0 [( sharesk) (1 - Tdt)Divsf + (1 - rct)KGainsit)].
R and sharesk are the monthly posttax return and shares calculated fromequation (1), and NAy0 is the share price of the fund at the beginning ofthe holding period. The number of shares are adjusted for splits asnecessary. equation (2) shows that the end-of-period liquidation value,LT, is simply the accumulation of the posttax returns less the amount oftaxes that must be paid at the time of sale on previously unrealizedcapital gains.10
Table 3 presents our results for the 30-year period 1963-1992. Thistable shows the end-of-period value of a $1 investment made at thebeginning of the holding period. The top half of the table shows that themedian result for the 62 mutual funds with 30-year returns was that $1 in1963 would have grown to a pretax $21.89 by the end of 1992. Over thisperiod, investing $1 in the S&P 500 index would have resulted in
Because of the step-up in basis at the time of death, any unrealized capital gains wouldnot be taxed if an heir were to immediately liquidate a decedent's holdings.
10 As shown in equation (2), the liquidation value would be greater than the posttax valueif the accumulated basis is greater than the posttax value of the mutual fund at the time ofliquidation. Implicitly this assumes full loss offsets.

Taxation and Mutual Funds 161
TABLE 3.Mutual Fund Returns, 1963-1992 (nominal value of $1 investment)
Table 3 reports the value of a $1 initial investment at the end of the 30-year period concluding in 1992.Thills is the terminal value of a T-Bill investment, while all of the other columns refer to results obtainedwith the sample of 62 mutual funds with 30-year returns described in the text. Posttax values arecomputed for hypothetical investors facing three different sets of tax rates (low, mid, high) and assumethat the investment is not sold at the end of 1992. The liquidation values assume that the mutual fundinvestment is sold at the end of 1992 and any remaining capital gains (or losses) are taxed according tothe tax rates at the end of 1992.
$22.13. The numbers for the median posttax numbers are $16.51, $12.75and $9.82 for the low, middle, and high income investors respectively.The median liquidation values are $16.04, $12.04, and $8.93 for taxableholders in our three different tax circumstances.11 The differences inactual return over the 30-year period to a taxable investor are immedi-ately evident. The high-tax investor who reinvests only after-tax distribu-tions has an accumulated wealth per dollar invested on the order of 45percent of the amount published by the funds in their prospectuses andpromotional material..
Table 3 also reports the value of a $1 investment in Treasury Bills (T-Bifis) (the risk-free investment in our analysis) over the relevant period.12Notice that over the 30-year period, even the worst performer in ourmutual fund sample did better than T-Bills. For tax-free investors, thelast place fund outdistanced T-Bills by 22 percent, the median fundproduced 217 percent more, and the best fund resulted in 11 times asmuch wealth per dollar invested as T-Bills.13 The return multiples rela-
11 Table 3 presents results for the median fund within each category. Because of differ-ences in the pretax and posttax rankings, the median fund is not the same mutual fundunder each case.12 S&P 500 and T-Bill returns are taken from Ibbotson (1993).13 Because of the selection bias in our data set, it is quite likely that the worst growth orgrowth and income mutual fund investment over this period involved an investment in afund that was not included in our data.
Method Regime
Number of funds = 62(Pretax S&P 500 = 22.13)
TBills Mm Median Max Std Dev
Pretax N/A 6.91 8.45 21.89 76.03 12.99Posttax Low tax 4.97 7.06 16.51 61.02 10.01values Mid tax 3.69 5.97 12.75 50.14 8.05
High tax 2.53 4.63 9.82 40.26 6.41Liquidation Low tax 4.97 6.59 16.04 55.56 9.24values Mid tax 3.69 5.29 12.04 41.49 6.77
High tax 2.53 4.46 8.93 33.17 5.34

162 Dickson & Shoven
five to T-Bills are larger for taxable investors since T-Bils are more heav-ily taxed than equity mutual funds, at least at the federal level. This isbecause T-Bill interest is taxed at full ordinary rates (as are dividends),while realized capital gains have usually been taxed at lower rates (SeeTable 2). 14 Even if a high-tax-rate individual had the misfortune of invest-ing in the worst of our funds, she would have 84 percent more moneyaccumulated (77 percent if she were to liquidate her position) between1963 and 1992 than if she had invested and accumulated with 1-Bills.The median and best performing funds generate 3.9 and 15.9 times morewealth (3.5 and 13.1 times as much wealth upon liquidation) for thehigh-tax investor than T-Bills.
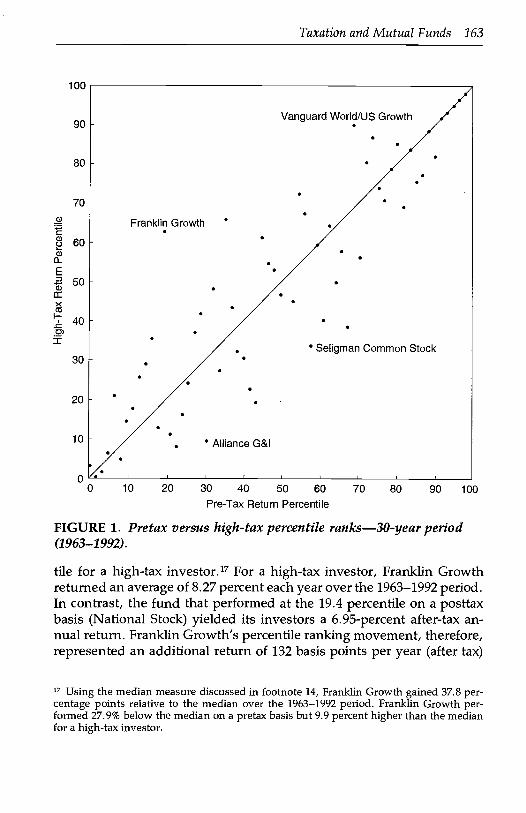
Figure 1 illustrates the degree to which the pre- and posttax rankings ofour funds differ (for a high-tax investor) over the 30-year horizon.15 Tofacilitate comparisons across different horizons where the number offunds change, we report the rankings in terms of percentiles. The worstfund has a percentile rank of zero, and the best fund ranks at the 100 (1 -1/n) percentile, where n is the number of funds ranked.16 Figure 1 plots afund's after-tax percentile ranking versus its pretax percentile ranking. Iftax considerations did not change the relative performance of these mu-tual funds, then the rankings would be unchanged, and all funds wouldshow up on the 45-degree line shown in Figure 1. One glance at the figureindicates that shareholder level taxes cause considerable changes in therelative ranking of funds. Obviously, funds appearing above the 45-degree line have a higher after-tax ranking than before-tax ranking andvice versa.
Table 4 presents summary statistics on the ranking differences shownin Figure 1. The movement of an average fund in our sample is plus orminus 9.8 percentile points. The maximum change in relative positionwas Franklin Growth, which improved its rank by an enormous 43.6points going from the 19.4 percentile on a pretax basis to the 63.0 percen-
14 The monthly post-tax return on T-Bils is R1 = (1 - Ta1) TBi1,, where TBiI1 is the nominal,pretax T-Bffl return in month t.
15 A previous version of this paper entitled "Ranking Mutual Funds on an After-Tax Basis"(National Bureau of Economic Research Working Paper No. 4393), provides an appendixdetailing the individual performance of the funds pictured in Figure 1.
16 We also considered another performance measure based on a fund's return relative tothe median return. Fund X, for example, might have a pretax value 20 percent greater thanthe median pretax value, while its posttax value might be 10 percent above the medianposttax value. We would then say Fund X lost 10 percentage points relative to the median.This median performance measure, unlike the percentile rankings, might be able to distin-guish large relative movements if funds' returns are tightly bunched. In the text we reportthe percentile differences. Results for the median measure are available from the authorsupon request.
100
90
80
70
60
50
40
30
20
10
0"0
Taxation and Mutual Funds 163
10 20 30 40 50 60
Pre-Tax Return Percentile
FIGURE 1. Pretax versus high-tax percentile ranks-30-year period(1963-1992).
tile for a high-tax investor.17 For a high-tax investor, Franklin Growthreturned an average of 8.27 percent each year over the 1963-1992 period.In contrast, the fund that performed at the 19.4 percentile on a posttaxbasis (National Stock) yielded its investors a 6.95-percent after-tax an-nual return. Franklin Growth's percentile ranking movement, therefore,represented an additional return of 132 basis points per year (after tax)
17 Using the median measure discussed in footnote 14, Franklin Growth gained 37.8 per-centage points relative to the median over the 1963-1992 period. Franklin Growth per-formed 27.9% below the median on a pretax basis but 9.9 percent higher than the medianfor a high-tax investor.
70 80 90 100

164 Dickson & Shoven
TABLE 4.Percentile Differences of Rankings over a 30-Year Period (1963-1992)
Number of Funds = 62 (absolute deviations)
Max(-) reports the percentile point reduction for the fund with the largest relative ranking decrease.Med is the median absolute value difference among the sample of funds. Max(+) gives the percentilepoint increase for the fund with the largest relative ranking increase. Mean is the average absolutepercentile change within the sample.
over the 1963-1992 horizon. Overall, our interpretation of Figure 1 andTable 4 is that the pretax rankings, which are the rankings usually pro-vided to investors, are inappropriate for providing necessary perfor-mance information to taxable investors.
As shown in Table 4, the difference between the pretax and the posttaxrankings of funds over the 30-year horizon is still considerable forintermediate-tax-rate investors. The average absolute value percentilechange between pre- and posttax rankings is 6.2 points for our middle-tax-rate investor, with the maximum change still being Franklin Growth,which gained 25.8 percentiles. The additional return for our midtax inves-tor in this case represented a 111-basis-point increase per year in after-taxreturn over the amount the investor would have received if FranklinGrowth's pretax and midtax percentile ranking remained constant. Asone would expect, the difference between the pre- and posttax rankings isnot terribly great for our low-tax-rate investor where the average percen-tile change (in absolute value) drops to 3.1 points.
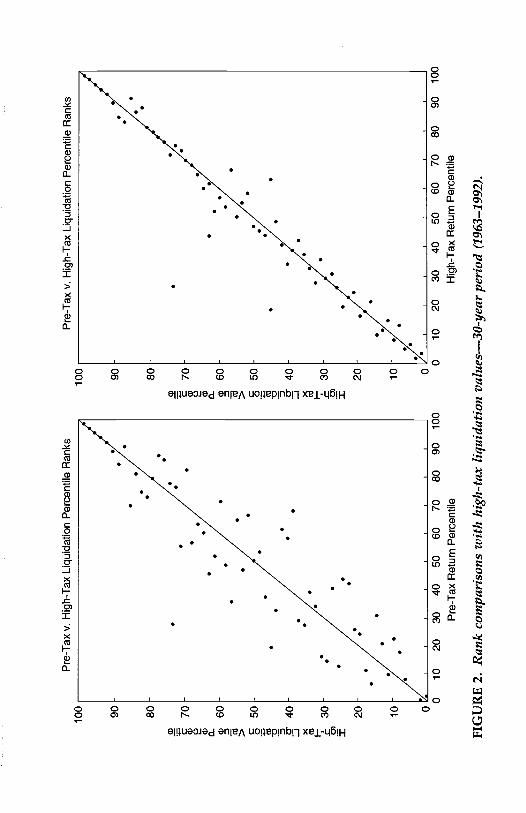
The liquidation value rankings for the 1963-1992 period are muchcloser to the posttax rankings than the pretax rankings as shown inFigure 2 for high-tax investors.18 Figure 2 contains two panels. The leftpanel plots a fund's liquidation value ranking versus pretax ranking,whereas the right panel plots a fund's liquidation ranking versus posttaxranking. The mean absolute value change between liquidation value and
18 Previous versions of this paper contain similar graphs for midtax and low-tax individuals.
Comparison Tax regime Max(-) Med Max(+) Mean
Posttax Low 9.7 1.6 12.9 3.1vs. Mid 19.4 4.8 25.8 6.2pretax High 29.0 8.1 43.6 9.8Liquidation Low 8.1 1.6 8.1 2.4vs. Mid 12.9 4.8 14.5 4.9pretax High 29.0 8.1 25.8 8.6Liquidation Low 6.5 1.6 4.8 1.8vs. Mid 16.1 1.6 9.7 3.1posttax High 17.7 1.6 9.7 2.9
100 90 80
ci)
700 ci
) a 60
cci >
50cc
i
.240 30 20 10
Pre
-Tax
v. H
igh-
Tax
Liq
uida
tion
Per
cent
ile R
anks
00
1020
3040
5060
7080
9010
0
Pre
-Tax
Ret
urn
Per
cent
ile
Pre
-Tax
v. H
igh-
Tax
Liq
uida
tion
Per
cent
ile R
anks
FIG
UR
E 2
. Ran
k co
mpa
riso
ns w
ith h
igh-
tax
liqui
datio
n va
lues
-30-
year
per
iod
(196
3-19
92).
010
2030
4050
6070
8090
100
Hig
h-T
ax R
etur
n P
erce
ntile
100 90 80
a)
700 a a. a
60cc
i >50
cci = C-
40x
20 10 0

166 Dickson & Shoven
pretax return rankings reported in Table 4 is 8.6 points for the high-taxinvestor, 4.9 points for the midtax people, and only 2.4 percentile pointsfor the low-tax investor. The average absolute value change in positionbetween the liquidation ranking and the posttax ranking was roughlythree percentiles for both the high- and middle-tax-rate investors butonly 1.8 points for the low-tax asset holder.
These results show that the differences between the various after-taxrankings and the published pretax rankings are large over a 30-yearhorizon, particularly for middle- and high-income investors. A naturalquestion that arises is whether it takes a 30-year period for these taxdifferences to become important. To provide the answer, we separatelycalculated mutual fund performance rankings for the three 10-yearsubperiods within our 30-year data set.
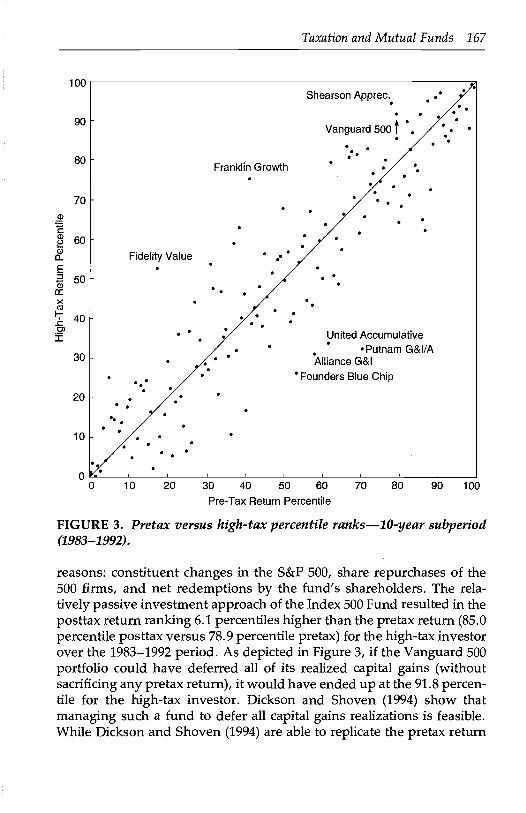
Our conclusion is that the ranking differences are still considerablefor 10-year intervals. For example, the average absolute value change inrank for high-tax investors between the posttax and pretax rankingswas roughly five percentile points for the first two 10-year periods and8.7 points (7.1 and 3.7 points for midtax and low-tax investors, respec-tively) for the most recent 1983-1992 period. The performance rankchanges over the most recent decade, in fact, are not that much smallerthan for the entire 30-year period. Once again we see that the effect ofshareholder taxation is quite important for the midtax investor butmuch less significant for the low-tax household. Figure 3 plots theposttax return rank for high-tax investors against the pretax return rankfor the 1983-1992 period.19 The largest increase in rank between thetwo concepts was 35.4 percentile points (Fidelity Value), which movedfrom the 17.0 percentile (pretax) to the 52.4 percentile (high-tax). Fidel-ity Value earned 10.94 percent per year for a high-tax investor, whereasif it would have remained in the 17th percentile, the fund would haveearned only 9.08 percent annually. The biggest downward movementwas Putnam Growth & Income (A), which fell a total of 37.4 percentilepoints, a movement that represented a 247-basis-point decrease relativeto the after-tax return Putnam would have posted had it maintained itspretax return percentile.
The case of Vanguard's Index 500 Fund illustrates how a tax consciousfund could improve its relative performance. The Index 500 Fund fol-lows the passive strategy of investing in the component stocks of theStandard and Poor's 500 (S&P 500) index in the same value-weightedproportions as the index. This fund realizes capital gains for three main
A detailed list of the 147 mutual funds with computed pretax and posttax returns isavailable from the authors.
100
90
Taxation and Mutual Funds 167
Fidelity Value
Franklin Growth
Shearson Apprec.
Vanguard soot .
40
United AccumulativePutnam G&IIA
30 Alliance G&I
Founders Blue Chip
20
10
00 10 20 30 40 50 60 70 80 90 100
Pre-Tax Return Percentile
FIGURE 3. Pretax versus high-tax percentile ranksb-year subperiod(1983-1992).
reasons: constituent changes in the S&P 500, share repurchases of the500 firms, and net redemptions by the fund's shareholders. The rela-tively passive investment approach of the Index 500 Fund resulted in theposttax return ranking 6.1 percentiles higher than the pretax return (85.0percentile posttax versus 78.9 percentile pretax) for the high-tax investorover the 1983-1992 period. As depicted in Figure 3, if the Vanguard 500portfolio could have deferred all of its realized capital gains (withoutsacrificing any pretax return), it would have ended up at the 91.8 percen-tile for the high-tax investor. Dickson and Shoven (1994) show thatmanaging such a fund to defer all capital gains realizations is feasible.While Dickson and Shoven (1994) are able to replicate the pretax return
80
70

168 Dickson & Shoven
of the Index 500 within a few basis points, the after-tax return to high-income investors is increased by as much as 97 basis points per yearrelative to the Index 500. This result is solely from the deferral of allrealized capital gains that Dickson and Shoven (1994) show could beeasily attained through the use of simple accounting and trading strate-gies over the sample period.20
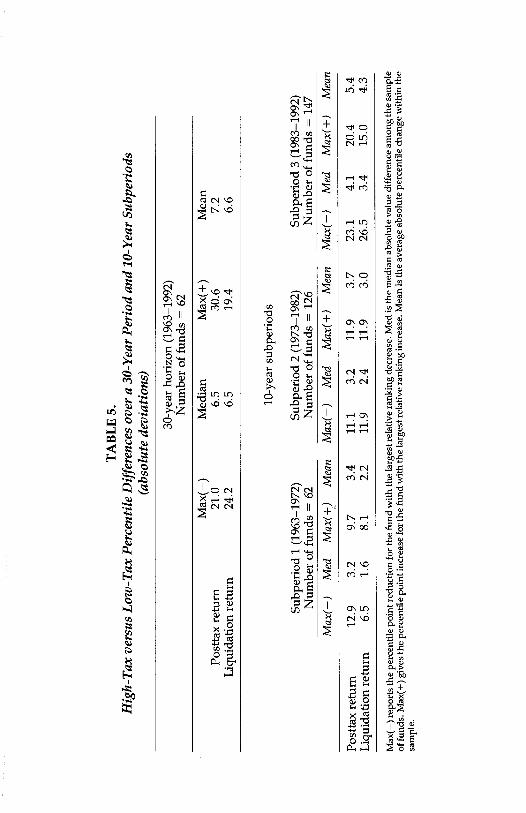
Mutual fund rankings change dramatically not only for taxable versusnontaxable investors but also for high-tax versus low-tax investors. Table5 clearly shows there is a considerable difference in the standings of thevarious funds in our sample for the two different types of investors. Theaverage absolute movement between low-tax and high-tax percentileranking is 7.2 points (6.6 points upon liquidation) over the 1963-1992period. The relative movements are still considerable over each of thethree 10-year subperiods. In the 1983-1992 period, for example, theaverage movement is plus or minus 5.4 points (4.3 points upon liquida-tion). This table suggests that it is not merely sufficient to choose one taxrate to measure after-tax returns. Individual taxable investors, instead,should be able to determine relative rankings based on their own mar-ginal rates.
5. RISK-ADJUSTED RETURNSAll of the above rankings consider only the average return over the 10-and 30-year horizons and do not take risk into account. We recognizethat investors are risk averse and, in general, would be willing to tradesome expected return for increased safety. Since our focus is on therelative rankings when shareholder taxation is taken into account, anyrisk-adjusting measure we use must allow for straightforward compari-son on both a pre- and posttax basis.
The usual starting point when one risk adjusts mutual fund returns isthe method first employed by Jensen (1968). Jensen uses the capital assetpricing model (CAPM) as a benchmark to determine whether or not amutual fund manager is able to engage in successful stock selection andmarket timing activities. The assumptions underlying the CAPM ap-proach are that the investor holds the market portfolio, is only interestedin the riskiness of the entire portfolio, and, therefore, needs to ascertainthe contribution of each asset to the riskiness of the total portfolio. Oneproblem with this approach is that many mutual fund investors are not
20 As Dickson and Shoven (1994) show, a tax conscious fund that tracks the S&P 500 is notan index fund in the usual sense, since it has to deviate slightly from the true portfolioweights in order to offset realized capital gains with capital losses while adhering to thewash-sale restrictions.
TA
BL
E 5
.H
igh-
Tax
ver
sus
Low
-Tax
Per
cent
ile D
iffe
renc
es o
ver
a 30
-Yea
r Pe
riod
and
10-
Yea
r Su
bper
iods
(abs
olut
e de
viat
ions
)
Subp
erio
d 1
(196
3-19
72)
Num
ber
of f
unds
= 6
2
30-y
ear
hori
zon
(196
3-19
92)
Num
ber
of f
unds
= 6
2
10-y
ear
subp
erio
ds
Subp
erio
d 2
(197
3-19
82)
Num
ber
of f
unds
= 1
26Su
bper
iod
3 (1
983-
1992
)N
umbe
r of
fun
ds =
147
Max
(-)
Med
Max
(±)
Mea
nM
ax(-
)M
edM
ax(+
)M
ean
Max
(-)
Med
Max
(+)
Mea
n
Max
(-)
repo
rts
the
perc
entil
e po
int r
educ
tion
for
the
fund
with
the
larg
est r
elat
ive
rank
ing
decr
ease
. Med
is th
e m
edia
n ab
solu
te v
alue
dif
fere
nce
amon
g th
e sa
mpl
eof
fun
ds. M
ax(+
) gi
ves
the
perc
entil
e po
int i
ncre
ase
for
the
fund
with
the
larg
est r
elat
ive
rank
ing
incr
ease
. Mea
n is
the
aver
age
abso
lute
per
cent
ile c
hang
e w
ithin
the
sam
ple.
Post
tax
retu
rn12
.93.
29.
73.
411
.13.
211
.93.
723
.14.
120
.45.
4L
iqui
datio
n re
turn
6.5
1.6
8.1
2.2
11.9
2.4
11.9
3.0
26.5
3.4
15.0
4.3
Max
(-)
Med
ian
Max
(+)
Mea
nPo
stta
x re
turn
21.0
6.5
30.6
7.2
Liq
uida
tion
retu
rn24
.26.
519
.46.
6
170 Dickson & Shoven
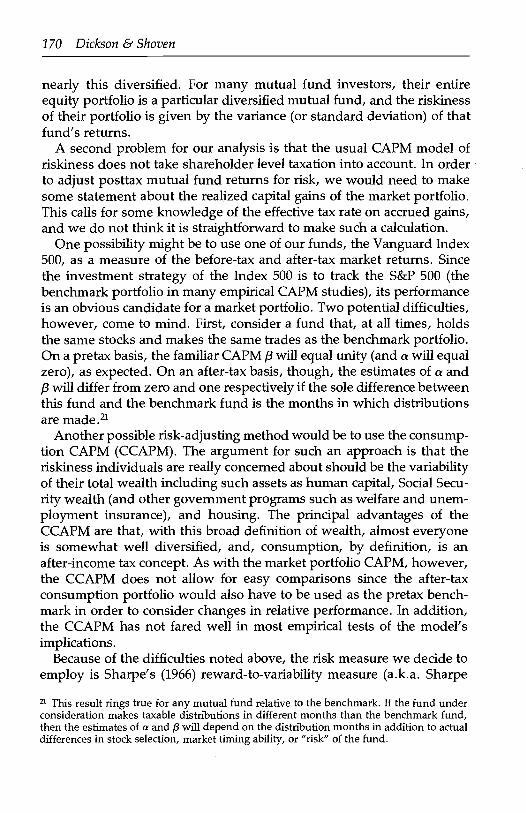
nearly this diversified. For many mutual fund investors, their entireequity portfolio is a particular diversified mutual fund, and the riskinessof their portfolio is given by the variance (or standard deviation) of thatfund's returns.
A second problem for our analysis is that the usual CAPM model ofriskiness does not take shareholder level taxation into account. In orderto adjust posttax mutual fund returns for risk, we would need to makesome statement about the realized capital gains of the market portfolio.This calls for some knowledge of the effective tax rate on accrued gains,and we do not think it is straightforward to make such a calculation.
One possibility might be to use one of our funds, the Vanguard Index500, as a measure of the before-tax and after-tax market returns. Sincethe investment strategy of the Index 500 is to track the S&P 500 (thebenchmark portfolio in many empirical CAPM studies), its performanceis an obvious candidate for a market portfolio. Two potential difficulties,however, come to mind. First, consider a fund that, at all times, holdsthe same stocks and makes the same trades as the benchmark portfolio.On a pretax basis, the familiar CAPM p will equal unity (and a will equalzero), as expected. On an after-tax basis, though, the estimates of a and/3 will differ from zero and one respectively if the sole difference betweenthis fund and the benchmark fund is the months in which distributionsare made.21
Another possible risk-adjusting method would be to use the consump-tion CAPM (CCAPM). The argument for such an approach is that theriskiness individuals are really concerned about should be the variabilityof their total wealth including such assets as human capital, Social Secu-rity wealth (and other government programs such as welfare and unem-ployment insurance), and housing. The principal advantages of theCCAPM are that, with this broad definition of wealth, almost everyoneis somewhat well diversified, and, consumption, by definition, is anafter-income tax concept. As with the market portfolio CAPM, however,the CCAPM does not allow for easy comparisons since the after-taxconsumption portfolio would also have to be used as the pretax bench-mark in order to consider changes in relative performance. In addition,the CCAPM has not fared well in most empirical tests of the model'simplications.
Because of the difficulties noted above, the risk measure we decide toemploy is Sharpe's (1966) reward-to-variability measure (a.k.a. Sharpe
21 This result rings true for any mutual fund relative to the benchmark. If the fund underconsideration makes taxable distributions in different months than the benchmark fund,then the estimates of a and f3 will depend on the distribution months in addition to actualdifferences in stock selection, market timing ability, or "risk" of the fund.

Taxation and Mutual Funds 171
ratio), which is simply the ratio of the average monthly excess return ofthe mutual fund to the standard deviation of its monthly excess returns.This measure is admittedly crude. Implicitly, it assumes that the mutualfund is the whole portfolio of the investor or, at least, that its riskiness isassessed separately from that of other assets. While this sounds ex-treme, it may not be further from the truth than the assumptions of thestandard CAPM involving the level of diversification in the investor'sportfolio. The main advantage of the Sharpe ratio, however, is that it caneasily be calculated on a posttax basis as well as on a pretax basis,allowing relative comparisons to be made.
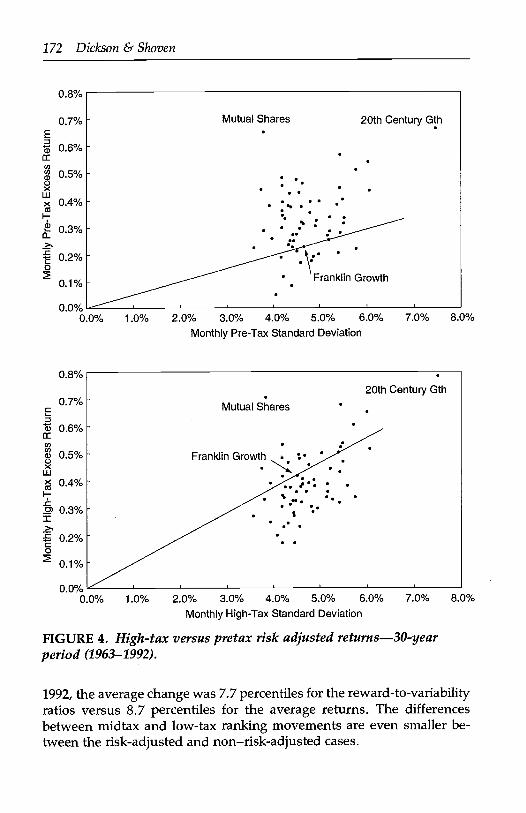
The results of the Sharpe ratio are depicted in Figure 4. The top half ofthe figure plots pretax average excess return against pretax standarddeviation, whereas the bottom half plots both concepts for an upper-income, taxable investor. The importance of adjusting returns for riskcan be seen by the considerable horizontal spread in the funds in bothpanels. (Their monthly standard deviations range from roughly 3.5 per-cent to 7.5 percent.) We implicitly assume that investors have the oppor-tunity to invest in T-BiIls (and also to borrow at that rate).
The optimal fund for all investors is the one with the largest ratio ofaverage excess return to standard deviation. If you consider running aline from each point in Figure 4 to the origin, the highest ranked fundwill be the one whose corresponding line has the steepest slope. Everyhigh-tax investor, regardless of their degree of risk aversion, shouldchoose this fund (Mutual Shares) in preference to all others. The linethrough the fund represents the opportunities that investors have bychoosing different combinations of this fund and T-BiIls.
Figure 4 shows that our earlier story that taxes dramatically affectrelative rankings is still true when the rankings are risk adjusted. Thelargest improvement in ranking due to tax considerations is FranklinGrowth. The top half of the figure shows that roughly 80 percent of thefunds offered a better opportunity set (when combined with T-Bills) thandoes Franklin Growth. However, the bottom half of the figure showsthat only about 35 percent of the funds offered a better after-tax opportu-nity set than Franklin Growth. Tax considerations caused it to "pass"more than half of the funds that ranked higher on a pretax basis.
The amount by which the risk-adjusted rankings vary from tax effectsare very similar to the nonrisk-adjusted returns. For the 30-year hori-zon, the average absolute value change in the high-tax, risk-adjustedrankings was 9.2 percentiles compared to 9.8 percentiles shown in Table4 for the nonrisk-adjusted case. In the 10-year subperiod from 1983 to
We are, of course, using ex post returns and make no claim about future performance.
172 Dickson & Shoven
0.8%
0.7%
0.6%
ci,
0.5%C)xwx 0.4%ci,F-
0.3%
0.2%
0.1%
0.0%0 0%
0.8%
0.7%C
0.6%
0.5%0xw
0.4%I-
0.3%I>,
0.2%C0
0.1%
0.0%0 0%
1.0% 2.0% 3.0% 4.0% 5.0% 6.0%
Monthly Pre-Tax Standard Deviation
1.0% 2.0% 3.0% 4.0% 5.0% 6.0% 7.0% 8.0%
Monthly High-Tax Standard Deviation
FIGURE 4. High-tax versus pretax risk adjusted returns-30-yearperiod (1963-1992).
1992, the average change was 7.7 percentiles for the reward-to-variabilityratios versus 8.7 percentiles for the average returns. The differencesbetween midtax and low-tax ranking movements are even smaller be-tween the risk-adjusted and non-risk-adjusted cases.
7.0% 8.0%

Taxation and Mutual Funds 173
6. THE POSSIBLE AGGREGATE TAX SAVINGA natural question to ask is how much money could investors save intaxes if mutual funds became more conscious of shareholder level taxesand adopted strategies to defer the net realization of capital gains? Ofcourse, it must be recognized from the outset that the flip side of share-holder tax saving is a loss of revenue to the Treasury Department. Esti-mating the aggregate amount of the possible tax saving is difficult in theextreme, and we can only hope to arrive at the approximate order ofmagnitude.
The first step in making the calculation is to examine the amount ofcapital gains distributed by mutual funds. Table 6 displays the dollaramount of net realized capital gains distributions of equity, bond, andincome funds from 1970 to 1993. It should be emphasized that this is amuch broader universe of funds than the sample of large growth andgrowth and income funds discussed in all of the other analyses of thispaper. Nonetheless, the vast bulk of the net realized capital gains in thelarger set of funds result from net realized appreciation on commonstock positions and could conceivably be eliminated or deferred if themanagers of the mutual funds were so inclined. The Potential Gross TaxSaving column of Table 6 results from a multiplication of the Net Real-ized Capital Gains figures by the estimated fraction of equity mutualfund assets held by taxable shareholders (58.6 percent) as of the end of1992 and then by the marginal personal income tax rates for realizedcapital gains for our middle-income investors from Table 2. These num-bers bound from above the amount of money that investors might save.In fact, the saving would certainly be less for several reasons.
If mutual funds permit their shareholders to defer capital gains bymanaging the portfolio in such a way that capital gains distributions arenot required, then shareholders will have larger realized capital gainswhen they liquidate or exchange their mutual fund shares. By and large,the shareholders would be postponing taxes, not eliminating them. Ta-ble 7 provides some information about how long people remain in agiven mutual fund. A survey of those who fully or partially redeemedtheir shares in 1991-1992 indicated the distribution of tenures with thefund as shown in Table 7. The median person in the sample had been
It should be noted that there is a selection bias problem with this data source. Thesample is taken from those who sell their shares, whereas we would like to have informa-tion about how much longer a person who currently owns a fund (and who is able to defercapital gains because of the policies of the mutual fund manager) will continue to own it. Itmust be acknowledged that the information in Table 7 is only suggestive, but it is notexactly appropriate to the problem at hand.

174 Dickson & Shoven
TABLE 6.Distributions to Mutual Fund Shareholders and Gross Potential Tax
Saving: Equity, Bond, and Income Funds (millions of dollars)
Source: First two columns, 1994 Mutual Fund Fact Book, p. 112; third column, authors' computations.
TABLE 7.Tenure in Fund From Which Shares Were Redeemed, 1991-1992
Source: 1993 Mutual Fund Fact Book, p. 85.
Year DividendsNet realizedcapital gain
Potential grosstax saving
1970 1,414.1 922.1 77.51971 1,330.7 775.5 63.61972 1,286.6 1,402.6 115.11973 1,300.2 943.3 77.41974 1,563.2 484.3 45.41975 1,449.1 219.2 20.61976 1,580.0 470.9 44.21977 1,789.7 634.8 67.01978 2,116.0 710.6 75.01979 2,451.4 929.0 80.61980 2,669.0 1,774.2 178.81981 3,143.0 2,697.2 268.51982 3,832.9 2,350.1 214.81983 4,981.0 4,391.6 360.31984 7,238.4 6,019.2 465.61985 12,864.2 4,984.6 385.61986 22,273.4 17,463.8 1,350.91987 31,823.7 22,975.6 3,769.81988 31,078.3 6,345.3 1,041.11989 34,096.1 14,802.8 2,428.81990 32,917.7 8,054.6 1,321.61991 35,322.2 14,116.1 2,316.21992 59,177.0 22,335.6 3,664.81993 73,302.4 36,105.3 5,942.2
TenureFull redemptions
(percent)Partial redemptions
(percent)
2 Years or less 24 233-4 Years 20 185-6 Years 23 177-9 Years 19 2010+ Years 14 22
Taxation and Mutual Funds 175
with the fund for five years. Fifty-four percent of the sellers were fullyliquidating their positions, whereas 46 percent were only selling part oftheir holdings. It is difficult to know whether people would be signifi-cantly less inclined to sell their holdings or switch between funds if thatwould trigger a large and taxable realization of previously accrued capitalgains. Certainly, given the current practice of most funds of realizinggains quickly after they accrue, tax considerations have not been a majorconsideration in determining the behavior summarized in Table 7. If theturnover of mutual fund shares remained approximately what is shown inTable 7, the Treasury would still collect, at least in present-value terms,taxes on most of the capital gains realized within mutual funds. Five yearsof deferral would save the investor in present value terms a maximum of25 percent of the bill, meaning that the investors' gains and the Treasury'sloss would only be roughly one-fourth the potential gross magnitudesshown in Table 6. There are even additional complications, of course.
If mutual funds allowed their investors the opportunity to defer capi-tal gains by refraining from annual net realized capital gains distribu-tions, the shareholders would then have some discretion about the taxyear in which to realize the gains. A household whose income fluctuatedsufficiently would have the opportunity to realize the gain when theirmarginal tax rate was lower (15 percent rather than 28 percent, e.g.).Some investors would be able to postpone the realization until retire-ment, which often involves lower marginal tax rates. Finally, due to thestep up of cost bases at death, there is some probability that a deferral ofcapital gains taxes will result in the effective elimination of the taxationof the gains. It is considerations such as these that make impossible aprecise estimate of the magnitude of the tax advantage of mutual fundspermitting the deferral of capital gains.24
Our guess is that investors could gain between one-quarter and one-half of the potential gross tax saving shown in Table 6. These savingswould be available annually and in 1993 would have been between $1.5and $3 billion. This would be the impact of allowing mutual fund share-holders to benefit from the same tax strategies that people who holdstocks directly have employed for decades. No government regulationsneed to be changed, simply the behavior of the money managers whoare, after all, paid handsomely for acting in the best interests of theirshareholders.
It is interesting to note that the level of awareness of shareholder level
24 In the analysis of Section 4 we assumed that investors' incomes were relatively constant(i.e., high-income investors always had high incomes, etc.). Widely fluctuating incomes(and therefore widely fluctuating marginal income tax rates) would have complicated theprevious analysis of the changes in pre- and posttax percentile rankings as well.
176 Dickson & Shoven
taxes seems to be increasing in the mutual fund industry. CharlesSchwab introduced the Schwab 1000, the first fund that we are aware ofthat explicitly managed realized capital gains in April 1991. The firmnow offers three index funds with this feature (the Schwab 1000, theSchwab Small-Cap Index Fund, and the Schwab International IndexFund). Recently, Vanguard has introduced its Tax-Managed Portfolios,which include a growth and income fund, a capital appreciation fund,and a "balanced" portfolio. It will be interesting to see the market recep-tivity to these tax sensitive offerings.
7. AFTER-TAX RETURNS AND TURNOVER
We have shown that shareholder level taxation can dramatically changethe relative rankings of mutual funds. An important issue for taxableinvestors deciding between the plethora of funds available is whether afund's future relative posttax performance movements might be inferredfrom its investment policies. Our basic intuition is that the amount afund "turns over" its portfolio should be related to the amount of itstaxable distributions to shareholders. Many of our funds churn theirportfolios significantly over a single year (100 percent is not uncommon),possibly realizing capital gains as they accrue and, thus, subjecting theirshareholders to tax liabilities. Those funds that do not turnover theirportfolios and more closely adhere to a buy-and-hold strategy, the argu-ment continues, realize less of their accrued gains, allowing their inves-tors to defer capital gains taxes into the future.
The relationship between turnover and mutual fund performance hasbeen discussed by a couple of authors. Ippolito (1989) presents evidenceof no relationship between turnover and pretax performance net of feesand expenses. In other words, Ippolito finds that funds with high turn-over rates earn sufficiently greater risk-adjusted returns to offset the costs(other than taxes) associated with increased turnover. Jeffrey and Arnott(1993) consider the relationship between turnover and after-tax returns.Assuming a 35-percent marginal tax rate for realized capital gains over the1982-1991 period, they report a statistically significant correlation coeffi-cient of approximately 0.4 between a fund's average turnover and theamount of taxes due from its capital gains distributions.
Jeffrey and Arnott (1993) conclude that taxable investors should con-sider funds with relatively passive investment strategies (i.e., low turn-over) to avoid large tax liabilities. A conclusion that high turnover fundsmay be unwise for shareholders subject to taxation, however, does notimmediately follow. Consider a mutual fund with a high turnover ratethat is successful at stock selection and market timing activities. A higher

Taxation and Mutual Funds 177
pretax return (if one assumes a dividend yield commensurate with otherfunds) implies there are more capital gains to realize. Hence, this fund willmost likely impose a larger capital gains tax burden on its shareholdersrelative to other funds. However, if its pretax return is sufficiently large,taxable investors may still want to invest in this fund even if the sharehold-ers will have to pay large amounts of realized capital gains taxes.
To consider the effect of turnover on after-tax performance, we com-puted average annual turnover rates for each of our funds over the 10-year period 1983-1992 from Morningstar. Consistent with our intuition,the fund with the lowest average turnover (Franklin Growth-3.2 per-cent) jumped from the 40.8 pretax percentile to the 75.5 percentile for ahigh-tax investor over the 1983-1992 period. The fund with the highestaverage turnover (Fidelity Value-296 percent), however, also dramati-cally improved its posttax performance, jumping 35.4 percentiles (thelargest increase over this period).
Table 8 reports sample correlation coefficients between average turn-over rates and the ratio of posttax value (liquidation) to pretax value.25The numbers in parentheses are P values under the null hypothesis ofzero correlation between after-tax performance and average turnover.The P value represents the minimum level of statistical significance atwhich we would reject the null hypothesis. We use ratios of posttax topretax measures instead of rank changes since the best performing fundstypically outdistance other funds by large amounts, and their rankingsmay not change even if their posttax to pretax ratios are lower than thoseof most other funds. If our intuition is correct, we would expect negativecorrelations between turnover rates and the posttax to pretax perfor-mance ratios. Table 8 shows that the intuition is basically correct. All ofthe computed correlations are negative, and most correlations are signifi-cant at the 5% level. Overall, for high-tax investors over this period, thecorrelation between average turnover and the ratio of high-tax to pretaxvalue was 0.20 (P value = 0.015).26 These results suggest that turnovercan be an indicator of a fund's relative posttax performance.
Table 8 is certainly not a formal test of the relationship between turn-
Because of the problems associated with risk-adjusting after-tax returns discussed in theprevious section, we do not consider the relationship between turnover and risk-adjustedperformance. This analysis is consistent with Jeffrey and Arnott (1993).26 The corresponding table in previous versions of this paper showed that, in general,turnover was not strongly correlated with posttax performance. Those earlier calculationswere undertaken before we had broken out the short-term versus long-term capital gains.The fact that the turnover correlations are significant when short-term capital gains areexplicitly accounted for strengthens our argument that many managers sacrifice their share-holders' after-tax returns not only by realizing capital gains but also by realizing relativelymore tax disadvantaged short-term capital gains instead of long-term capital gains.

178 Dickson & Shoven
TABLE 8.Turnover Correlations over a 10-Year Subperiod (1983-1992) (p-values
in parentheses)
Average turnover is the annual average of turnover percentages reported by Morningstar. Turnoverdata for 1992 were not yet available, and a nine-year average was computed for 27 of the funds in oursample.
The numbers in the table refer to the correlation across the sample of funds between a fund's averageturnover and its ratio of posttax value (liquidation) to pretax value over the 10-year sample period. Thenumbers in parentheses represent P values under the null hypothesis of zero correlation.
over and relative posttax performance. In fact, funds with higher turn-over rates may still be good investments for the tax conscious investor.This point is illustrated by the example of Vanguard's Index 500 Funddiscussed earlier. If this fund were able to defer all capital gains disburse-ments to its shareholders, it would have performed even better on anafter-tax basis. Deferring capital gains relative to the S&P 500 index,however, necessarily implies that the fund would turn over its portfolioat a greater rate (7 percentage points per year in Dickson and Shoven,1994).
8. CONCLUSIONMutual funds seem to pay very little attention to shareholder level taxes.Funds publish iong-term performance statistics that ignore taxes, andthe financial press ranks them on these pretax measures. Most fundsrealize large fractions of their accrued capital gains each year. This typeof investment policy eliminates an investor's opportunity to defer taxes
Number of fundsAverage turnover (%)
Growth96
84.83
Growth and income51
65.99
Overall147
78.29
Posttax value over Pretax Low -0.16 -0.33 -0.17value (0.130) (0.018) (0.045)
Mid -0.16 -0.34 -0.17(0.110) (0.015) (0.037)
High -0.20 -0.39 -0.20(0.057) (0.005) (0.015)
Posttax Liquidation over Low -0.25 -0.20 -0.20Pretax Value (0.015) (0.165) (0.013)
Mid -0.25 -0.18 -0.20(0.012) (0.194) (0.014)
High -0.29 -0.33 -0.25(0.003) (0.019) (0.003)

Taxation and Mutual Funds 179
on accrued capital gains and adversely affects after-tax returns to afund's shareholders.
We have calculated both pre- and posttax mutual fund returns forindividuals in different tax brackets over various investment horizons.While it is not surprising that taxes lower the accumulations that one canachieve with mutual fund investments over all holding periods, ourcalculations show that the relative rankings of funds on a posttax basis(and on our liquidation basis) differ quite dramatically from the pub-lished pretax rankings. That is, taxable investors cannot easily and reli-ably determine which of two funds would have offered them a betterafter-tax return with the publicly available information. While we feelthat more work is necessary to account satisfactorily for risk, this consid-eration does not dampen our main conclusion that after-tax performancerankings are very different from pretax performance rankings.
Our analysis of the aggregate impact of the failure of mutual funds totax manage their portfolios indicates that the consequence is that thepresent value of investors' tax bills is raised considerably. In 1993, whenmutual funds distributed $36 billion in net realized capital gains, taxpay-ers probably paid more than $1 billion in extra (present value) taxes overand above what would have been required with tax sensitive manage-ment of the funds.
REFERENCES
Chang, Eric C., and Wilbur G. Lewellen (1984). "Market Timing and MutualFund Investment Performance." Journal of Business 57:57-72.
Dickson, Joel M., and John B. Shoven (1994). "A Stock Index Mutual FundWithout Net Capital Gains Realizations." NBER Working Paper no. 4717.
Federal Reserve Board of Governors (1993). Flow of Fund Accounts, second quar-ter. Washington, DC: U.S. Government Printing Office.
Grinblatt, Mark, and Sheridan Titman (1993). "Performance Measurement with-out Benchmarks: An Examination of Mutual Fund Returns." Journal of Business66:47-68.
Henriksson, Roy D. (1984). "Market Timing and Mutual Fund Performance: AnEmpirical Investigation." Journal of Business 57:73-96.
Horowitz, Ira (1965). "A Model for the Evaluation of Various Mutual Funds asInvestment Alternatives." Industrial Management Review 6 (Spring):81-92.
Ibbotsori and Associates (1993). Stocks, Bonds, Bills, and Inflation. Chicago, IL:Ibbotson and Associates.
Internal Revenue Service. Statistics of Income, various years.Publication 17, various years.
Investment Company Institute (1993). Mutual Fund Fact Book. Washington, DC.(1994). Mutual Fund Fact Book. Washington, DC.
Ippolito, Richard A. (1989). "Efficiency with Costly Information: A Study of Mu-tual Fund Performance, 1965-1984." Quarterly Journal of Economics 104:1-23.

180 Dickson & Shoven
Jeffrey, Robert H., and Robert D. Arnott (1993). "Is Your Alpha Big Enough toCover Its Taxes?" Journal of Portfolio Management Spring:15-25.
Jensen, Michael C. (1968). "The Performance of Mutual Funds in the Period1945-1964." Journal of Finance 23:389-416.
(1969). "Risk, the Pricing of Capital Assets, and the Evaluation of Invest-ment Portfolios." Journal of Business 42:167-247.
(1972). "Optimal Utilization of Market Forecasts of the Evaluation of In-vestment Portfolio Performance." Mathematical Methods in Investment and Fi-nance, C. P. Szego and Karl Shell (eds.). Amsterdam: North-Holland.
Kon, Stanley J., and Frank C. Jen (1978). "Estimation of Time-Varying System-atic Risk and Performance for Mutual Fund Portfolios: An Application ofSwitching Regression." Journal of Finance 33:457-76.
(1979). "The Investment Performance of Mutual Funds: An EmpiricalInvestigation of Timing, Selectivity, and Market Efficiency." Journal of Business52:263-289.
Lehmann, Bruce N., and David M. Modest (1987). "Mutual Fund PerformanceEvaluation: A Comparison of Benchmarks and Benchmark Comparisons." Jour-nal of Finance 42:233-265.
Minarik, Joseph J. (1981). "Capital Gains." In How Taxes Affect Economic Behavior,Henry J. Aaron and Joseph A. Pechman (eds.). Washington, DC: BrookingsInstitution.
Moody Corporation. Annual Dividend Record, various years.Pechman, Joseph A. (1987). Federal Tax Policy, 5th ed., Washington, DC: Brook-
ings Institution.Sharpe, William F. (1966). "Mutual Fund Performance." Journal of Business 39
(supplement):119-130.Standard and Poor's Corporation. Annual Dividend Record, various years.Treynor, Jack L. (1965). "How to Rate Management of Investment Funds." Har-
vard Business Review 43:63-75.