Embed Size (px)
Citation preview
Munich Personal RePEc Archive
Tax transition in developing countries:
Do VAT and excises really work?
Adandohoin, Kodjo
University of Auvergne
19 October 2018
Online at https://mpra.ub.uni-muenchen.de/91522/
MPRA Paper No. 91522, posted 21 Jan 2019 14:36 UTC
Tax transition in developing countries : Do value added tax and
excises really work ?
Kodjo ADANDOHOIN
October, 2018
Abstract
This paper investigates the role of Value Added Tax (VAT) and excises as first wave tax tran-
sition tools in developing countries. Focusing on a sample of 96 developing countries over the
period 1985-2013, we investigate whether the adoption of VAT enable developing countries to
increase the likelihood of succeeding tax transition. Results indicate that having a VAT, allow
developing countries to increase the probability of succeeding tax transition by near 10%. We
further investigate the extent to which VAT and excises offset trade tax revenue losses of trade
liberalization in these countries. Our estimates reveal that VAT is offsetting by 67% trade tax
revenue losses in developing countries with an U relationship, while this effect holds for excises
duties with an U inverted relationship. The study also points out heterogeneities (while VAT
tax transition effect is robust to African and Asian countries, it seems not for Latin American
countries), as well as asymmetries (the revenue collection of VAT and excises didn’t increase
the period over which developing countries face an increase in trade tax). Overall, the study
concludes that, first wave tax transition even strengthened by these instruments, seems not
irreversible. It suggests to take with more close attention VAT and excises as performant first
wave tax transition tools in developing countries.
Keywords : Tax transition, VAT, Excises, Developing countries.
1
1 Introduction
The power to tax is a major concern in developing countries, where the ability to raise revenue
remains challenging. Stylized facts bring out that, developing countries do recover only about
15-20 percentage points of their GDP in tax revenues, whereas this average is about 40 per-
centage points of GDP in developed countries (Besley & Persson, 2014). Following the United
Nations Financing for Development Conference (Addis Ababa, 2015) the role of taxation is to
be re-legitimized in developing countries, considering the volatility of foreign development assis-
tance, and in order to reach millennium development goals. As pointed out by Brautigam et al.
(2008) tax revenues are the first and most predictable development finance that enable countries
to achieve sustainable tax space and ensure the provision of public goods.
Yet, in developing countries, before trade liberalization, international trade taxes accounted for
the most of tax revenues of these countries, allowing them to finance public expenditures (Tanzi
& Zee, 2000). Due to trade openness policies, these countries like developed countries, face a
sharp fall in their custom duties. A number of empirical studies bring out the negative effect of
trade liberalization on trade tax revenues in developing countries (Bevan, 1995; Khattry & Rao,
2002; Keen & Ligthart, 2002; Keen & Simone, 2004). While developing countries made substan-
tial progress towards more open trade regimes in the context of World Bank and World Trade
Organization policies guidelines (Jones et al., 2011), the major problem of the fiscal consequences
of their trade liberalization remains to offset revenue losses related to tariff disarmament. Over
the past three decades, these countries strengthened their domestic tax revenues through a tax
transition process (Chambas, 2005a). Tax transition consists in a move from public revenues,
long dominated by international trade taxes, to public revenues levied on domestic inside activ-
ities.
The preference for a value added tax (VAT) as a tax transition instrument, or as a first wave tax
transition instrument, is strongly motivated by the fact that, VAT concerns a broad tax base,
that can spread tax burden throughout the economy. VAT is also neutral, and can be imple-
mented with ease in many developing countries (Chambas, 2005b; Bird & Gendron, 2007). It
doesn’t affect the competitiveness of exports, as exports are taxed with zero-rate, and exporters
can enjoy the right of VAT refunds, from VAT charged on their inputs1. It doesn’t increase local
producers’ costs since they can also deduct VAT on their intermediate inputs. Thus, tax transi-
tion reforms initiated in developing countries during the 1980s and the 1990s had the common
leitmotiv of more adoption of VAT (Bird, 1989 ; Bird & Gendron, 2007) recognizing resource
mobilization constraints on direct taxes of these countries (Chambas, 2005b). Excise duties,
levied at high rates on specific goods such as alcohol, tobacco and cigarettes, can also provide
significant revenues, most time due to the inelasticity of consumer price to these goods (Bolnick
1For a review of VAT mechanisms see (Ebrill 2001) :The modern VAT (International Monetary Fund)
2
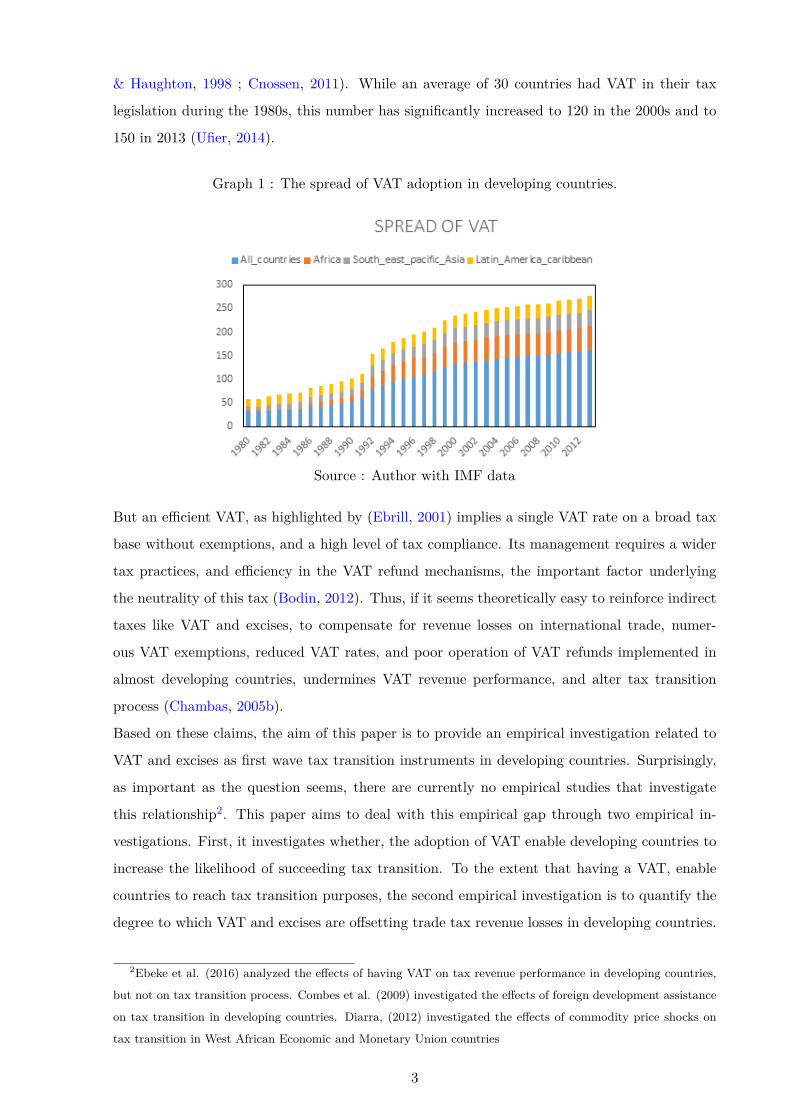
& Haughton, 1998 ; Cnossen, 2011). While an average of 30 countries had VAT in their tax
legislation during the 1980s, this number has significantly increased to 120 in the 2000s and to
150 in 2013 (Ufier, 2014).
Graph 1 : The spread of VAT adoption in developing countries.
Source : Author with IMF data
But an efficient VAT, as highlighted by (Ebrill, 2001) implies a single VAT rate on a broad tax
base without exemptions, and a high level of tax compliance. Its management requires a wider
tax practices, and efficiency in the VAT refund mechanisms, the important factor underlying
the neutrality of this tax (Bodin, 2012). Thus, if it seems theoretically easy to reinforce indirect
taxes like VAT and excises, to compensate for revenue losses on international trade, numer-
ous VAT exemptions, reduced VAT rates, and poor operation of VAT refunds implemented in
almost developing countries, undermines VAT revenue performance, and alter tax transition
process (Chambas, 2005b).
Based on these claims, the aim of this paper is to provide an empirical investigation related to
VAT and excises as first wave tax transition instruments in developing countries. Surprisingly,
as important as the question seems, there are currently no empirical studies that investigate
this relationship2. This paper aims to deal with this empirical gap through two empirical in-
vestigations. First, it investigates whether, the adoption of VAT enable developing countries to
increase the likelihood of succeeding tax transition. To the extent that having a VAT, enable
countries to reach tax transition purposes, the second empirical investigation is to quantify the
degree to which VAT and excises are offsetting trade tax revenue losses in developing countries.
2Ebeke et al. (2016) analyzed the effects of having VAT on tax revenue performance in developing countries,
but not on tax transition process. Combes et al. (2009) investigated the effects of foreign development assistance
on tax transition in developing countries. Diarra, (2012) investigated the effects of commodity price shocks on
tax transition in West African Economic and Monetary Union countries
3
The rest of the paper is organized as follows : Section 2 refines the concept of tax transition
and proposes our measure of tax transition, while section 3 presents stylized facts related to
the phenomenon. Section 4 focuses on VAT and excises as tax transition tools. In section 5
we emphasize with the empirical framework followed by results in section 6. Then, we deal in
section 7 with robustness checks and conclude the paper in its last part.
2. Sound concept and attempts of measuring tax transition.
2.1 Concept of tax transition.
Tax transition is a concept that cover a multidemensional area of meaning. Yet, in the weak hy-
pothesis, it refers to the balancing role of international trade taxes through increases in domestic
inside revenue. This substitution effect can occur through indirect taxes (VAT and excises) or
through direct taxes (corporate and income taxes). Because of the particular revenue raising
power of VAT and excises, it is more convenient that a country undertakes first generation tax
transition features with these instruments. On the stronger hypothesis, tax transition consists in
reducing the social cost of public revenue through a best composition of tax, while maintaining
an appropriate level of tax revenue. This last assumption imply that, a tax transition criteria
can be derived from the evolution of tax revenue around a certain threshold of revenue that can
be determined endogenously. Besides, tax authorities have to reduce the revenue contribution
of distortionary taxes such as custom and export duties, and enhance the stability of public
revenue by reinforcing the relative contribution of stable and predictable taxes such as VAT. In
the case of mining countries, tax transition views would add an additional condition to reduce
the contribution of mining taxation as compared to non-mining taxation, thereby reducing the
volatile component of government revenue.
2.2 Attempts of measuring the concept.
2.2.1 Initial attempts of measuring the concept.
Measuring tax transition is a daunting task even if by definition transition cover a qualitative
dimension. One feature is to measure tax transition directly by VAT. The underlined idea is
that, VAT is a more stabilizing tax and represents a more predictable source of government rev-
enue. Even though empirical studies of Ebeke and Ehrhart (2010); Ebeke and Ehrhart (2011)
confirm the stabilizing effect of VAT, a quantitative manner of measuring the concept is not
suitable because transition better cover a qualitative meaning. In the West African Economic
and Monetary Union (WAEMU), a tax transition criteria imply that the ratio of domestic tax
revenue to international trade tax revenue need to be higher than 1.2, and that, tax revenue
to GDP should converge to a value of 17 percentage points of GDP. But these thresholds in
WAEMU countries can not be apply to all countries. Second, they also lack robust basis and
4
finally, doesn’t take into account tax potential of each specific country.
Nevertheless, our definition of transition broadly imply a change in the composition of govern-
ment revenue and a norm of tax revenue. For example it not appropriate to consider a country
succeeding tax transition if it better change the composition of its tax revenue without main-
taining an adequate level of overall tax revenue, or conversely if it reaches an adequate level of
revenue without a sufficient change in the composition of its tax revenue. To overcome these
difficulties, Attila et al. (2011) suggest to take these conditions simultaneously into account and
to retain an endegenous norm of public revenue that is determined by a country’s tax potential.
2.2.2 How is tax transition finally computed?
We compute tax transition following Attila et al. (2011). Basically, these authors suggest that
a country is meeting tax transition, if the following conditions are simultaneously satisfied :
Condition 1: norm of tax revenue.
According to this condition, country’s total tax revenue should represent at least 90 percent of
its tax potential 3. This condition is derived from the fact that, we can not suppose a country,
succeeding its transition process, if it doesn’t perform tax effort over the interested period.
Condition 2: change in the composition of government revenue.
Assumption 1: condition on trade tax
The ratio of trade tax revenue to GDP, must decrease over a period of five years. We compute
the growth rate of trade taxes over this period. Diarra (2012) amended this condition to three
years, to release the transition conditions. By doing this, he puts a strong hypothesis on trade
tax revenues which is the decrease of this tax quickly over a period of three years. By the fact
that trade tax revenue may not necessarily decrease over a reduced period of three years, we
enable a mid-term period of five years as pointed out by Attila et al. (2011).
Assumption 2: condition on domestic tax revenue.
Domestic tax revenue must increase over a period of five years. We compute the growth rate of
domestic tax revenue over each five years period. If these three conditions are met, we assume
that, the country is meeting tax transition otherwise, fails to meet tax transition. To obtain a
year by year tax transition, we improve Attila et al. (2011) by a backward process computation.
Thus, a country is meeting tax transition one year, if five years before that year, all these con-
ditions are met.
3The detail of computing tax potential is given in appendix
5
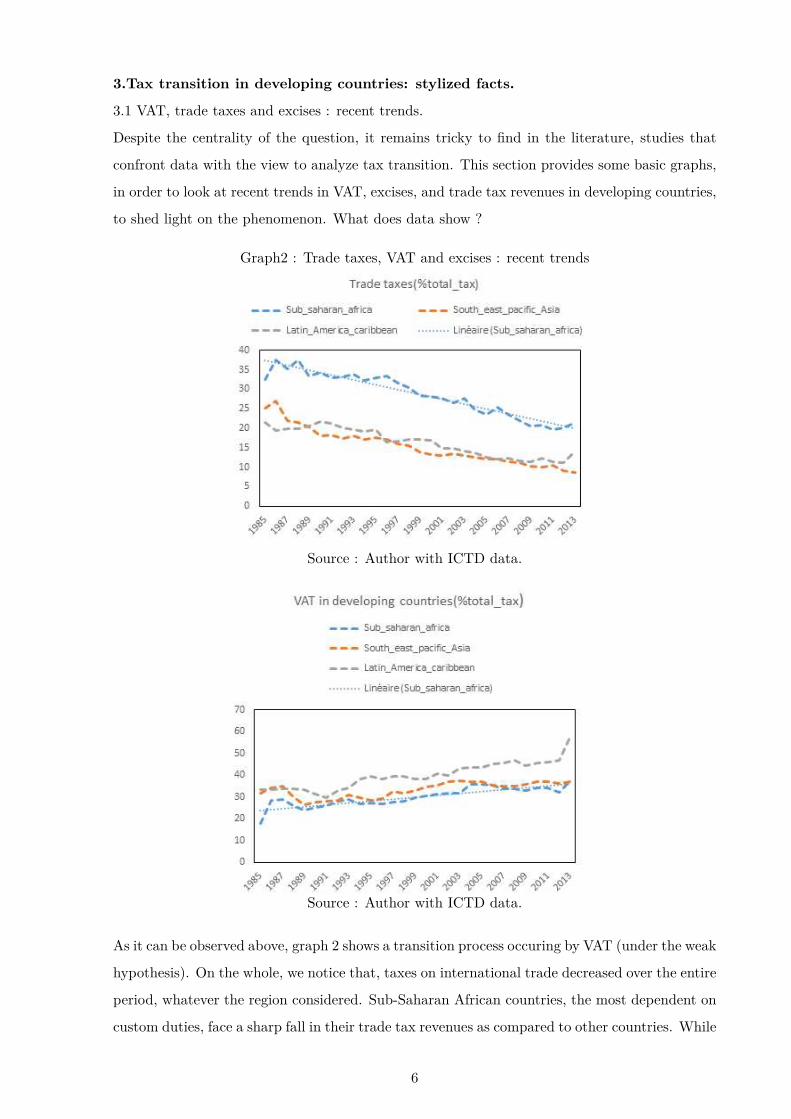
3.Tax transition in developing countries: stylized facts.
3.1 VAT, trade taxes and excises : recent trends.
Despite the centrality of the question, it remains tricky to find in the literature, studies that
confront data with the view to analyze tax transition. This section provides some basic graphs,
in order to look at recent trends in VAT, excises, and trade tax revenues in developing countries,
to shed light on the phenomenon. What does data show ?
Graph2 : Trade taxes, VAT and excises : recent trends
Source : Author with ICTD data.
Source : Author with ICTD data.
As it can be observed above, graph 2 shows a transition process occuring by VAT (under the weak
hypothesis). On the whole, we notice that, taxes on international trade decreased over the entire
period, whatever the region considered. Sub-Saharan African countries, the most dependent on
custom duties, face a sharp fall in their trade tax revenues as compared to other countries. While
6
the effects of trade liberalization on trade tax revenues may depend on the elasticity of imports
to tariffs, graph 2 might tells us that, the negative effect of trade liberalization outweighs the
positive effect of increases in tax base. Turning to the same graph, we observe an increase in
VAT revenue, telling us a transition process occuring by VAT. Latin America and Caribbean
countries have the greatest increase in VAT revenues. This doesn’t necessarily means that, they
are performing well with tax transition (under the stronger one). Indeed, it can tells that, they
could offset significantly their revenues losses with VAT (weak hypothesis) and next, we must
take into account their tax efforts over the interested period. Even if VAT revenue is growing
in developing countries, in comparative terms, African countries are those with the lowest VAT
revenue, but whose trend is outstanding over the period.
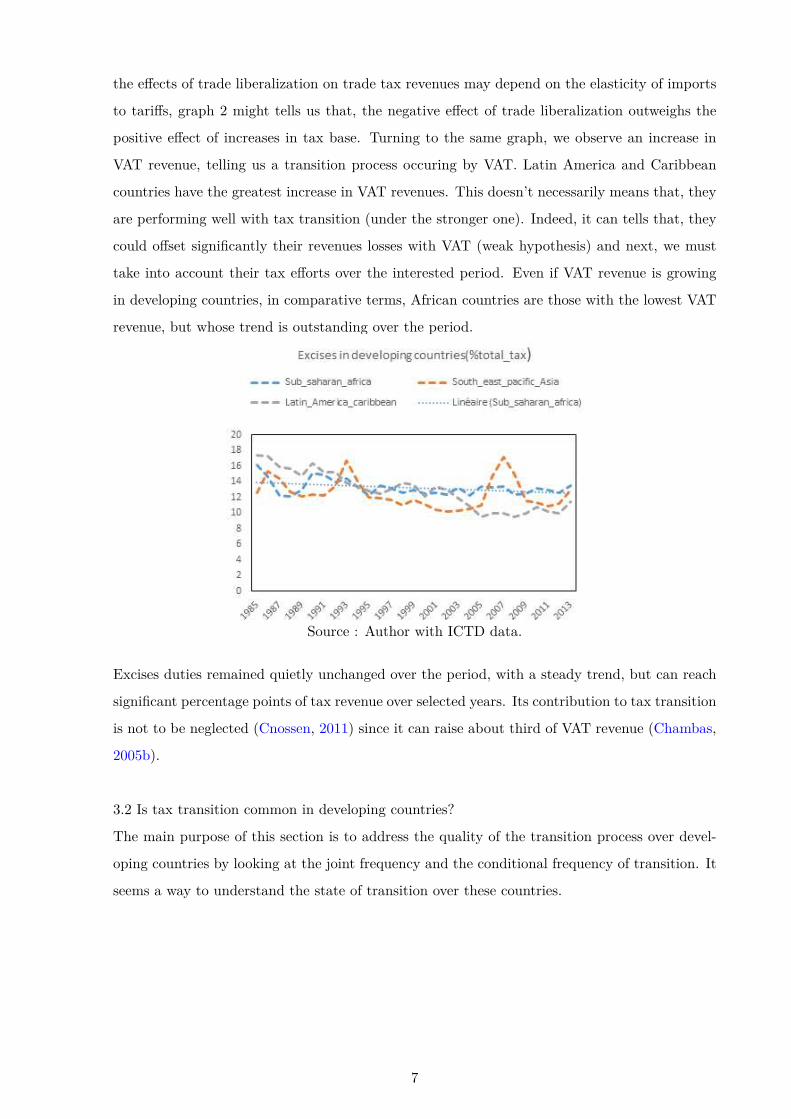
Source : Author with ICTD data.
Excises duties remained quietly unchanged over the period, with a steady trend, but can reach
significant percentage points of tax revenue over selected years. Its contribution to tax transition
is not to be neglected (Cnossen, 2011) since it can raise about third of VAT revenue (Chambas,
2005b).
3.2 Is tax transition common in developing countries?
The main purpose of this section is to address the quality of the transition process over devel-
oping countries by looking at the joint frequency and the conditional frequency of transition. It
seems a way to understand the state of transition over these countries.
7
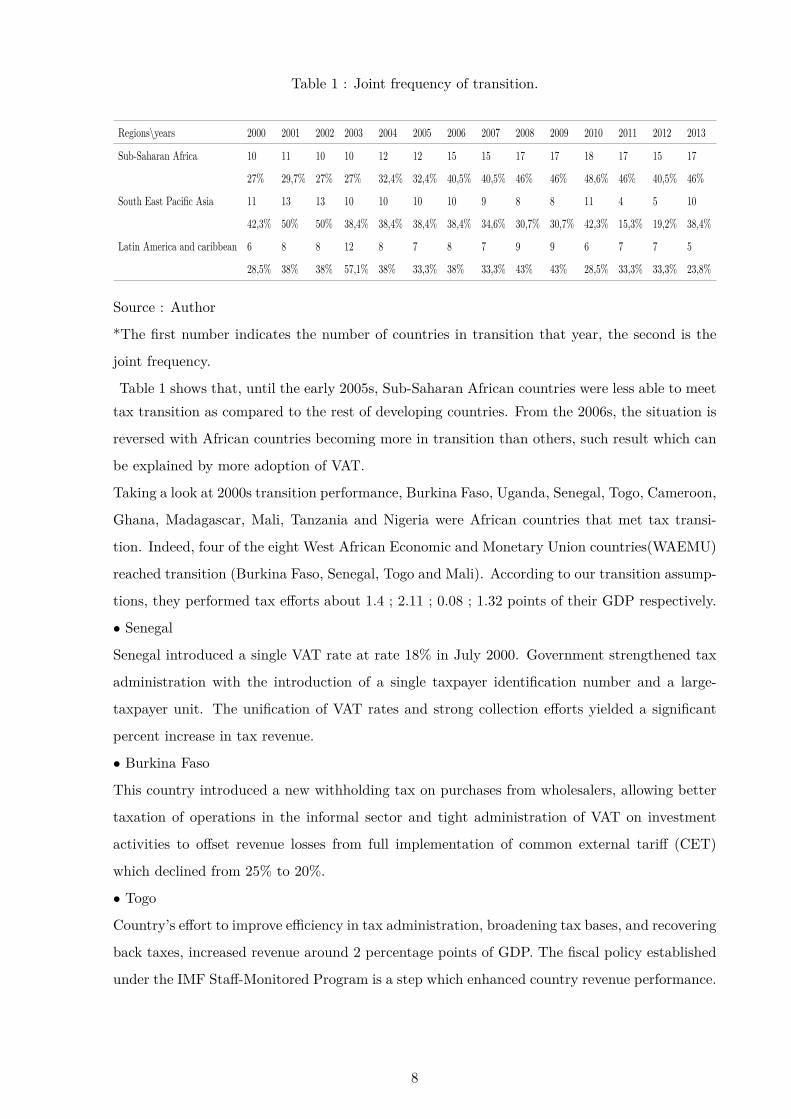
Table 1 : Joint frequency of transition.
Regions\years 2000 2001 2002 2003 2004 2005 2006 2007 2008 2009 2010 2011 2012 2013
Sub-Saharan Africa 10 11 10 10 12 12 15 15 17 17 18 17 15 17
27% 29,7% 27% 27% 32,4% 32,4% 40,5% 40,5% 46% 46% 48,6% 46% 40,5% 46%
South East Pacific Asia 11 13 13 10 10 10 10 9 8 8 11 4 5 10
42,3% 50% 50% 38,4% 38,4% 38,4% 38,4% 34,6% 30,7% 30,7% 42,3% 15,3% 19,2% 38,4%
Latin America and caribbean 6 8 8 12 8 7 8 7 9 9 6 7 7 5
28,5% 38% 38% 57,1% 38% 33,3% 38% 33,3% 43% 43% 28,5% 33,3% 33,3% 23,8%
Source : Author
*The first number indicates the number of countries in transition that year, the second is the
joint frequency.
Table 1 shows that, until the early 2005s, Sub-Saharan African countries were less able to meet
tax transition as compared to the rest of developing countries. From the 2006s, the situation is
reversed with African countries becoming more in transition than others, such result which can
be explained by more adoption of VAT.
Taking a look at 2000s transition performance, Burkina Faso, Uganda, Senegal, Togo, Cameroon,
Ghana, Madagascar, Mali, Tanzania and Nigeria were African countries that met tax transi-
tion. Indeed, four of the eight West African Economic and Monetary Union countries(WAEMU)
reached transition (Burkina Faso, Senegal, Togo and Mali). According to our transition assump-
tions, they performed tax efforts about 1.4 ; 2.11 ; 0.08 ; 1.32 points of their GDP respectively.
• Senegal
Senegal introduced a single VAT rate at rate 18% in July 2000. Government strengthened tax
administration with the introduction of a single taxpayer identification number and a large-
taxpayer unit. The unification of VAT rates and strong collection efforts yielded a significant
percent increase in tax revenue.
• Burkina Faso
This country introduced a new withholding tax on purchases from wholesalers, allowing better
taxation of operations in the informal sector and tight administration of VAT on investment
activities to offset revenue losses from full implementation of common external tariff (CET)
which declined from 25% to 20%.
• Togo
Country’s effort to improve efficiency in tax administration, broadening tax bases, and recovering
back taxes, increased revenue around 2 percentage points of GDP. The fiscal policy established
under the IMF Staff-Monitored Program is a step which enhanced country revenue performance.
8
• Mali
Mali’s efforts to compensate for revenue losses due to the introduction of the common external
tariff have consisted in modernizing indirect tax system in April 1999. Like Senegal country
introduced a single VAT rate at 18% and limitation of VAT exempts goods. Tax administration
was strengthened. A large enterprise division was fully computerized. Taxpayers compliance
had been enhanced by extending the registration system to a sufficient number of taxpayers in
2000.
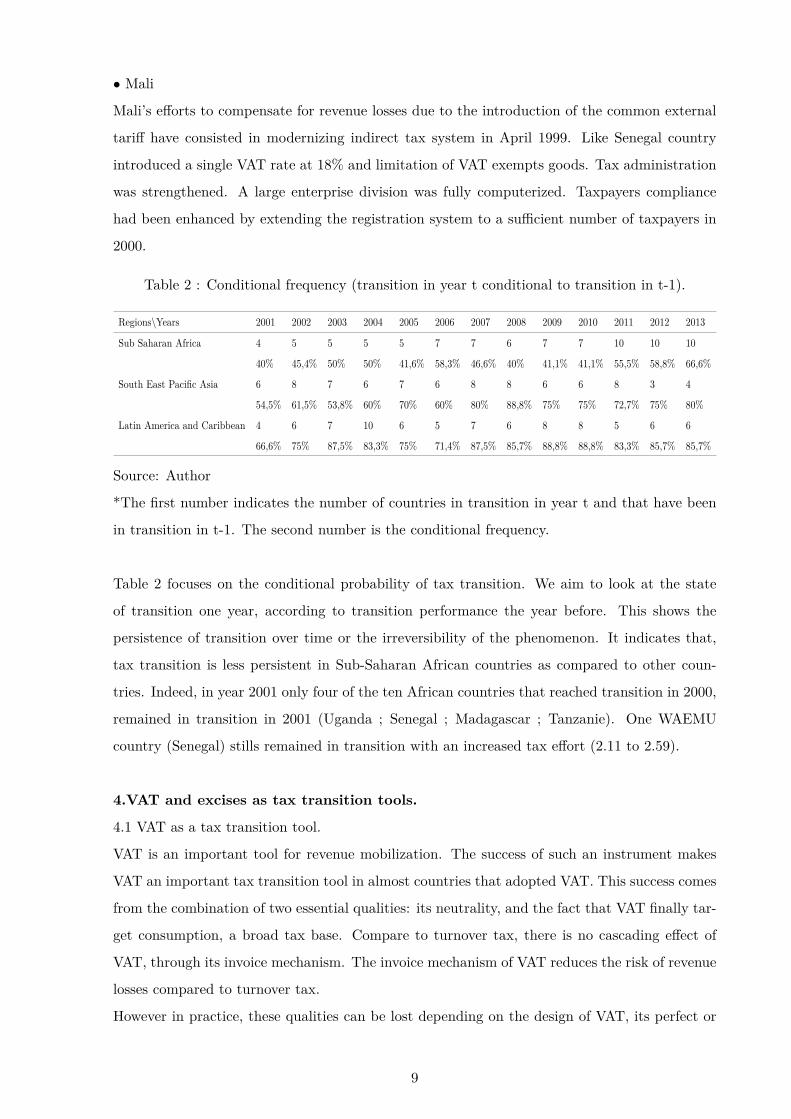
Table 2 : Conditional frequency (transition in year t conditional to transition in t-1).
Regions\Years 2001 2002 2003 2004 2005 2006 2007 2008 2009 2010 2011 2012 2013
Sub Saharan Africa 4 5 5 5 5 7 7 6 7 7 10 10 10
40% 45,4% 50% 50% 41,6% 58,3% 46,6% 40% 41,1% 41,1% 55,5% 58,8% 66,6%
South East Pacific Asia 6 8 7 6 7 6 8 8 6 6 8 3 4
54,5% 61,5% 53,8% 60% 70% 60% 80% 88,8% 75% 75% 72,7% 75% 80%
Latin America and Caribbean 4 6 7 10 6 5 7 6 8 8 5 6 6
66,6% 75% 87,5% 83,3% 75% 71,4% 87,5% 85,7% 88,8% 88,8% 83,3% 85,7% 85,7%
Source: Author
*The first number indicates the number of countries in transition in year t and that have been
in transition in t-1. The second number is the conditional frequency.
Table 2 focuses on the conditional probability of tax transition. We aim to look at the state
of transition one year, according to transition performance the year before. This shows the
persistence of transition over time or the irreversibility of the phenomenon. It indicates that,
tax transition is less persistent in Sub-Saharan African countries as compared to other coun-
tries. Indeed, in year 2001 only four of the ten African countries that reached transition in 2000,
remained in transition in 2001 (Uganda ; Senegal ; Madagascar ; Tanzanie). One WAEMU
country (Senegal) stills remained in transition with an increased tax effort (2.11 to 2.59).
4.VAT and excises as tax transition tools.
4.1 VAT as a tax transition tool.
VAT is an important tool for revenue mobilization. The success of such an instrument makes
VAT an important tax transition tool in almost countries that adopted VAT. This success comes
from the combination of two essential qualities: its neutrality, and the fact that VAT finally tar-
get consumption, a broad tax base. Compare to turnover tax, there is no cascading effect of
VAT, through its invoice mechanism. The invoice mechanism of VAT reduces the risk of revenue
losses compared to turnover tax.
However in practice, these qualities can be lost depending on the design of VAT, its perfect or
9
imperfect implementation 4, and the legislative and administrative framework of the country
that adopted VAT, such as the number of rates, the optimal threshold, and the restrictions to
the VAT refund mechanisms (Ebrill, 2001; Bird & Gendron, 2007).
The literature primarily highlights the role of the optimal threshold on VAT revenue perfor-
mance. Threshold characterizes the trade-off between revenue collection and collection costs. If
the threshold is too weak, tax administration is stretched and unable to monitor registered firms.
It appears difficult to make audit, which affect VAT performance. On the other hand, if the
registration threshold is very high, VAT base becomes narrower (Keen & Mintz, 2004). Thus,
considering firms which are below the threshold, they can not charge VAT on their output, and
can not enjoy the right of VAT refund mechanisms. These firms would make pressure in the
form of lobbying for input exemptions, that go into their businesses. If such lobbying fails, these
firms are more likely to deal with other unregistered firms, which would reinforce structural
dualism and affect VAT revenue performance by making participation in the formal sector less
attractive (Kanbur & Keen, 2014). Because the question of the threshold is an important factor
for VAT revenue performance, Keen and Mintz (2004), investigate the optimal threshold of a
VAT. Their rule stipulate that, the optimal threshold of a VAT is inversely proportional to firms
size and to the social value of public funds, whereas this is proportional to the compliance and
administrative costs. They highlight the fact that, labour intensive activities that with higher
ratio of value added to sales, should be set to a relatively low threshold.
The importance of designing efficient VAT rate and constrain multiple VAT rates, is also a great
concern while addressing VAT revenue performance in tax transition. With multiple VAT rates,
it becomes possible for the taxpayer to apply a wrong rate of VAT to the base, even if it is
not done fraudulently (Tait, 1991)5. Scarce administrative resources have to be channelled into
resolving those classification patterns. Compliance costs rise as the tax form becomes complex,
and accounting records need to be more complete. The result is that, VAT base becomes nar-
rower (Agha & Haughton, 1996). Multiple VAT rates also exacerbate tax credit patterns. If
the input tax rate is multiple and sometimes greater than the output tax rate, there is a danger
that, procedures on VAT refunds are loosened and the degree of scrutiny fails (Ebrill, 2001).
High average rate also leads to low degree of compliance. Taxpayers who face high tax rate,
have greater incentive to evade tax. Tax rate and tax base are not independent instruments.
Thus, it is better to introduce low VAT rates on a broad tax base, rather than having high VAT
rates (Agha & Haughton, 1996) in the prospect of mobilizing more VAT revenue.
VAT exemptions break VAT chain. If the exemption occurs at the final stage, the result is a
4VAT structure is littered with many privileges and exemptions that minimize its revenue impact in developing
countries5Tait identifies more argument against multiple VAT rate. For a detail see (Tait, 1991): Value-Added Tax,
Administrative and Policy Issues (International Monetary Fund). Occasional paper 88
10

loss of revenue, since value added at the final stage escapes tax. On the firm’s side, exemptions
maintain a VAT charge on intermediate goods and lead to a change in the tax burden. The firm
no longer charge VAT to the customer and is no longer entitled to be reimbursed the amount
of VAT paid on his purchases (Chambas, 2005b). Compare to export firms, there is a negative
effective protection of the local firm. While VAT refund mechanism is the "Achilles heel" of VAT
system (Harrison & Krelove, 2005), the impossibility for the local firm selling exempt goods to
deduct VAT, restores the cascading effects specific to turnover taxes (Chambas, 2005b). On the
other side, if exemption occurs at intermediate stage, the cascading effect of tax on inputs is
that, as the price charged by downstream firms using the exempt item rises, in order to cover
their increased costs, tax on output increases. Thus, value added prior to the exempt stage is
effectively taxed more than once (Ebrill, 2001; de La Feria, 2013). With this in mind, VAT loses
neutrality if exemptions are not limited. In such circumstances, the substitution effect of VAT
to trade taxes in tax transition process, could bring the economy far from an optimum (Emran
& Stiglitz, 2005).
Keen (2013), summarizes these findings and addresses the effectiveness of VAT in countries that
adopted VAT. Author brings to the literature theoretical tools that help understand factors that
weaken VAT revenue performance. Drawing his analysis on the «C efficiency concept» an indi-
cator of the IMF departure of public finance, author shows that, the first of the most important
factors that drive VAT revenue performance has by far consisted in changes in «C-efficiency»
even if this concept is not independent from tax rate and tax base. «C-efficiency» has often
moved in the opposite direction from the standard rate of VAT. The higher is the rate, the lower
is «C efficiency». According to the author, understanding the evolution of VAT revenue requires
understanding the evolution of «C-efficiency». VAT gaps between countries comes from two
factors : a "policy gap" (multiple rates and exemptions), and a "compliance gap" or imperfect
implementation of VAT. For developing and emerging economies, compliance gap is the most
important factor, that drive VAT revenue gap, while the opposite seems for developed countries.
In addition, De Mello (2009) in his study concerning OECD and non-OECD countries shows
that, «C-efficiency» ratio increases with low VAT rates. A reasonable support of these studies
is that, developing countries those want to succeed tax transition with VAT, must set up a low
VAT rates on a broad tax base.
Despite the fact that VAT can lose qualities if imperfectly implemented, it is wise for a country to
adopt VAT. In fact, Keen and Lockwood (2006) test the hypothesis of the revenue raising power
of VAT (VAT money machine hypothesis) in OECD countries and find out that, countries with
VAT do recover more revenue than those without, all else equal. Conducting the same analysis
on Sub saharan African countries, Ebeke et al. (2016) investigated whether VAT has lead to
more revenue collection in Sub-Saharan African countries and found out the same result that,
11

VAT has a large positive effect on non-resource taxes, and that, this positive effect remains even
several years after the adoption of VAT. Thus, even with imperfections, VAT has shown in a
number of cases, its revenue raising power in countries that adopted VAT as compared to coun-
tries without. But, Keen and Lockwood (2010) show that, these effects are non-linear, and vary
across countries, according to their income level, reliance on agriculture, and degree of openness.
Further, Ebeke and Ehrhart (2010) show that, VAT reduce the instability of tax revenue for
Sub-Saharan African countries and that, the stabilizing effect of VAT has been reinforced since
the mid 1990s. In their next paper Ebeke and Ehrhart (2011) found that, this effect is robust to
all developing countries that adopted VAT. Nevertheless, Baunsgaard and Keen (2010) provide
controverse finding about the effectiveness of VAT. These authors analyzed the effect of trade
liberalization on domestic tax revenue. From a panel of developing countries, they found that,
high-income countries have compensated for their revenue losses on international trade. For
middle-income countries, compensation ratio has been between 45-60 percent of each dollar lost
on international trade. However, revenue collection has been extremely low in low-income coun-
tries (those most dependent on trade tax revenues). They recovered, at best, not more than 30
percent of every dollar lost on international trade. An important point to make is that, unlike
previous literature, they do not find strong evidence that, the presence of a VAT has made it
possible to do better, in facing the negative effects of trade liberalization on tax revenue.
4.2 Excises as a complement to VAT.
Excise duties received relatively little attention in the tax literature as compared to VAT. How-
ever, taxing specific goods like alcohol, tobacco, oil and beer, is motivated with the ongoing
consideration that, there are few substitutes that consumers would find equally satisfactory for
these goods, so that consumption remains high despite excises lead to high prices. The inelas-
ticity of consumption to excises, is an important argument to maintain excise taxation, and to
raise more revenue. Excises can also help discourage alcohol and tobacco consumption due to
the fact that it increases significantly consumption prices (Cnossen, 2005). As Ramsey (1927),
pointed out, as long as goods are unrelated in consumption, tax rates should be high on the
good with the lowest price elasticity. Thus, excises which can be levied at high rates, can provide
complementary revenue to VAT (Bolnick & Haughton, 1998). These arguments are not however,
independent from the design of excises and require appropriate design. The literature discusses
the question of whether it is wise to design specific6 or ad valorem excises rate. Specific rates
reduce relative price differences between low-priced and high-priced goods, whereas ad valorem
rate increases absolute price differences. For tax transition tools, the choice between these two
6For more detail see Cnossen et al, (2005). A specific rate is design on a fixed amounts per quantity of goods,
whereas the ad valorem rate means fixed percentage of the sale price
12
rates would matter for revenue performance and would depend on whether the primary aim
of the tax policy is to discourage consumption of the excised goods, or to raise more revenue
(Cnossen, 2011).
5. Tax transition in developing countries : Empirical framework
5.1 Model specification.
We present the empirical model that serve to our analysis. Since our main objective is to address
the role of VAT and excises in the first wave tax transition in developing countries, we present
two models that we derive from (Attila et al., 2011) and (Baunsgaard & Keen, 2010).
Equation 1 : Probability model equation
Tax_transitionit = β0+β1∗vat_adoptionit+β2∗LogXit+β3∗vat_adoptionit∗LogXit+µi+ξit
(1)
Equation 2 : Compensatory effect model
Yit = β0 + β1 ∗ trade_taxit + β2 ∗ trade_tax2
it + β3 ∗ Xit + µi + ξit (2)
Where tax_transitionit in equation 1 is the transition variable for a country i in year t,
vat_adoptionit a dummy of the years over which a country have VAT. Our sample cover 96
developing countries that we collect data on VAT adoption date. The period of the study is
constrained to 1985-2013, a period over which most developing countries adopted VAT.
X is the matrix of explanatory variables that we take in logarithm as our preferred identification
strategy, and µi the unobserved heterogeneity time invariant related to countries that explain
their transition process. ξit, the idiosyncratic error term. We add the interactive terms between
VAT and the logarithm of X, to investigate VAT adoption effectiveness depending on structural
factors that drive tax potential in developing countries.
In the compensatory model (equation 2), Y is a matrix of dependent variables (VAT, excises).
We add the square term of trade tax to investigate for non linear relationships in the compen-
satory effect between VAT, excises, and trade taxes. When the coefficient β1 in equation 2 points
negative, it indicates a compensatory effect of VAT and excises on trade tax revenues. More
additionally, if β1 and β2 have the opposite sign, there is a threshold effect of trade tax which
is given by :
∂Y
∂X
= 0 ⇒ β1 + 2β2 ∗ trade_tax = 0 ⇒ trade_tax∗ =−β1
2β2
(3)
5.2 Data and variables.
5.2.1. Dependent variables.
Tax transition variable in equation 1 was computed according to the methodology outlined in
section 2 (Attila et al., 2011). This is a binary variable that take the value 1 if countries met
13

tax transition and 0 otherwise.
In equation 2 dependent variables of VAT and excises come from International Centre for Tax
and Development (ICTD, 2016). All variables are expressed non-resource and in percentage of
GDP.
5.2.2 Independent variables.
Explanatory variables include VAT adoption. This variable comes from the IMF tax policy
division database, and take the value 1 the period over which a country have VAT, and 0 oth-
erwise. In both equation 1 and equation 2, covariates data concern (i) gdp per capita, (ii) trade
openness in percentage of GDP, (iii) natural resources rents in percentage of GDP, and (iv)
agriculture value added to GDP. These variables come from the World Development Indicators
(WDI, 2016).
Per capita income is expected to be positively correlated with tax transition by its effect on
tax revenue, as it express the overall level of economic development and the advanced design
of tax structure. Moreover, according to Wagner’s law, the demand for governments service is
often income–elastic, so that, the share of taxes collected by governments to provide goods and
services is expected to rise with income (Gupta, 2007).
Trade openness may affect tax transition by its composition effects. If trade openness oc-
curs primarily through reduction in tariffs, one would expect losses in tariff revenues. But,
Keen and Simone (2004) argue that, revenue might increase provided trade liberalization occurs
through reduction of quotas, elimination of exemptions, and improvement in custom procedures.
Aizenman and Jinjarak (2009) highlight the fact that, trade openness should shift tax revenue
from “easy to collect taxes” (tariffs and seigniorage taxes) towards “hard to collect taxes” (value
added and income taxes). Overall, the effects of trade liberalization on tax revenue and later on
tax transition would certainly be indefinite.
Recent challenges in natural resources wealth countries, focused on the ‘Dutch disease’ effects.
Natural resources might affect tax transition by its effect on tax efforts. One aspect of the
resource curse may be its impact on a country’s incentive to mobilize non-resource domestic tax
revenues. For example Moore (2007), argued that, governments relying on resource rents are
likely to mobilize less revenue from other sources and this result suggests that, resource rents
would lead to low domestic tax efforts that would reduce the likelihood of tax transition.
Agriculture sector is expected to be negatively correlated with tax revenue and thus with tax
transition as it remains almost hard to tax agriculture in developing countries. As highlighted
by Stotsky and WoldeMariam (1997), this variable almost negatively matter for tax revenue in
these countries.
14
5.3 The probit/logit estimator and the instrumental variable probit regression.
As the paper aims to address the effect of having VAT on tax transition, our model is a qualita-
tive response model with a binary dependent variable. The econometric identification problem
of this model is to estimate the conditional probability that the dependent variable being one, as
a function of the covariates. Ordinary least square estimators are seriously biased because the
conditionnal probability of the dependent variable, is not necessarily bounded between zero and
one (Horowitz & Savin, 2001). This default can be corrected by replacing the linear function by a
cumulative distribution function that constrained the conditional probability to lie between zero
and one. The commonly used cumulative distribution functions are the distribution functions
of a normal distribution or a logistic distribution which use the maximum likelihood estimators,
and have very similar properties in large sample.
Nevertheless, estimating the causal effect of having VAT on tax transition in equation 1, is
subject to endogeneity bias on the fact that, there is a simultaneity between having VAT and
tax transition. In other words, adoption of VAT has an effect on tax transition, but a country
undergoing a tax transition reform may want to adopt VAT. We need instrumental variables to
solve the endogeneity of VAT adoption. Ufier (2014), establish several factors that drive VAT
adoption in developing countries. Ebeke (2011), uses neighborhood effects to instrument VAT
adoption. Keen and Lockwood (2010) show that, countries under IMF lending programs are
more likely to adopt VAT to pay off their debts both by necessity, but also because of the IMF
encouragement to adopt VAT. We instrument VAT adoption with the share of neighbors that
adopted VAT before the given country, and with a dummy variable that represents a country
involvement in IMF‘s assistance programs. For trade taxes, this variable was instrumented with
trade tax effective rate, and its first lag. The basic underlined idea is that, if trade tax revenues
are affected by trade liberalization, effective collected tariff rates may explain the revenue it
generated, but not revenue generated by VAT.
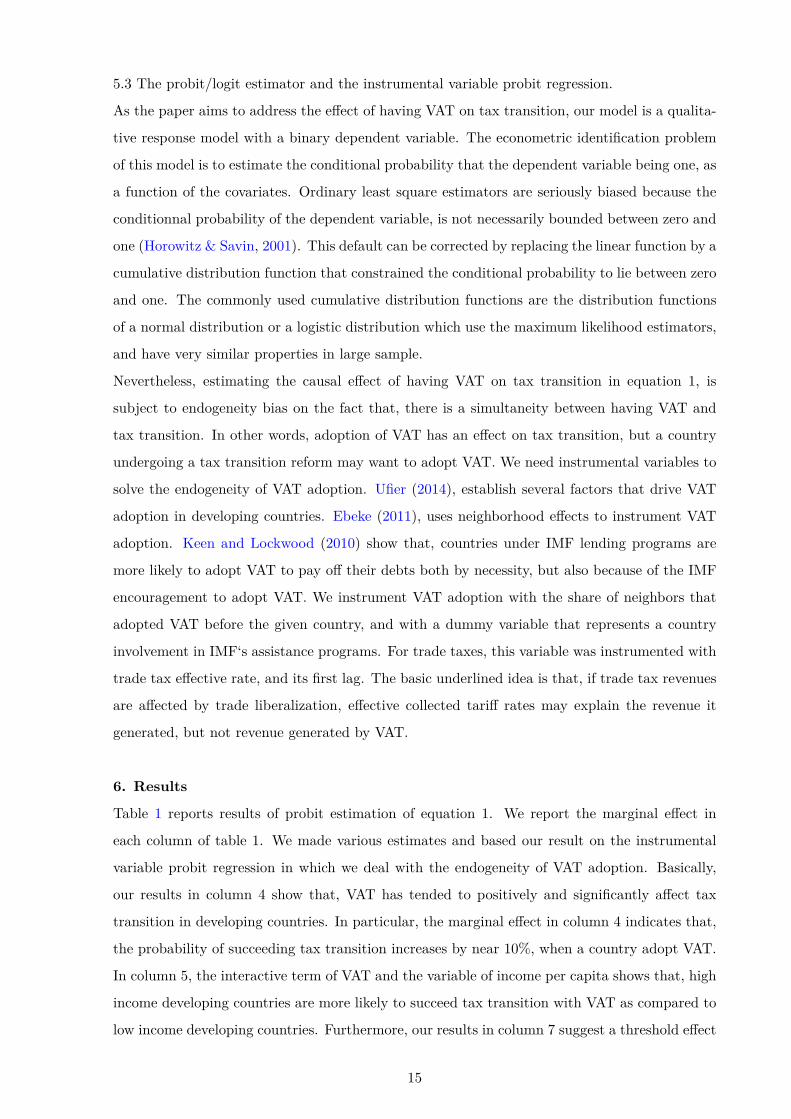
6. Results
Table 1 reports results of probit estimation of equation 1. We report the marginal effect in
each column of table 1. We made various estimates and based our result on the instrumental
variable probit regression in which we deal with the endogeneity of VAT adoption. Basically,
our results in column 4 show that, VAT has tended to positively and significantly affect tax
transition in developing countries. In particular, the marginal effect in column 4 indicates that,
the probability of succeeding tax transition increases by near 10%, when a country adopt VAT.
In column 5, the interactive term of VAT and the variable of income per capita shows that, high
income developing countries are more likely to succeed tax transition with VAT as compared to
low income developing countries. Furthermore, our results in column 7 suggest a threshold effect
15
of VAT considering the negative effect of the interative term with the variable of agriculture, and
the positive effect of the variable of VAT adoption. This means that, VAT still positively affects
tax transition in developing countries with a ratio of agriculture to GDP less than 20 percentage
points. Due to the self-comsumption and exemptions of most agricultural commodities, the
beneficial effect of VAT tends to diminish when a country’s agriculture to GDP ratio becomes
more important (Stotsky & WoldeMariam, 1997; Chambas & Araujo Bonjean, 2001).
Table 1: Baseline estimate, probability model, marginal effect
(1) (2) (3) (4) (5) (6) (7) (8)
Linear probability Logit Probit IV probit IV probit IV probit IV probit IV probit
VARIABLES tax transition tax transition tax transition tax transition tax transition tax transition tax transition tax transition
Vat adoption 0.0894*** 0.0968** 0.0932** 0.0975** 0.114** 0.146 0.107** 0.114**
(0.0201) (0.0378) (0.0365) (0.0344) (0.0529) (0.0897) (0.0504) (0.0501)
Log(gdp capita) 0.0292** 0.0383* 0.0391* 0.0307** 0.0700* 0.0216* 0.0331*** 0.0317***
(0.0118) (0.0224) (0.0221) (0.0127) (0.0416) (0.0114) (0.0113) (0.0121)
Log(trade) -0.0200 0.00968 0.0101 -0.0206 -0.0302 -0.0228 -0.0294 -0.0293
(0.0186) (0.0365) (0.0358) (0.0191) (0.0228) (0.0204) (0.0215) (0.0182)
Log(agriculture) -0.0519*** -0.0683** -0.0678** -0.0540*** -0.0516*** -0.0469** -0.0582*** -0.0523***
(0.0150) (0.0284) (0.0281) (0.0163) (0.0174) (0.0189) (0.0174) (0.0155)
Log(resources rents) -0.0253*** -0.0316*** -0.0311*** -0.0260*** -0.0266*** -0.0251*** -0.0215*** -0.0525***
(0.00501) (0.0102) (0.0101) (0.00518) (0.00533) (0.00562) (0.00703) (0.00867)
Log(gdp capita)*vat adoption 0.135**
(0.0687)
Log(trade)*vat adoption -0.2020
(0.195)
Log(agriculture)*vat adoption -0.0348**
(0.0127)
Log(resources rents)*vat adoption 0.0240
(0.0175)
Constant 0.0172
(0.146)
Observations 2,401 2,401 2,401 2,401 2,401 2,401 2,401 2,401
R-squared 0.027
Number of country code 96 96 96 96 96 96 96 96
Wald test of exogeneity 0.9125 0.6001 0.4770 0.7237 0.4605
Robust standard errors in parentheses
***p<0.01, ** p<0.05, * p<0.1
Table 2 reports results for the compensatory effect between VAT and excises. We also made
various estimates and based our results on the instrumental variable estimate in column 4 and
8. Our results in column 4 suggest that, a decrease of one percentage point of trade tax revenue
to GDP, leads to an increase of 0.67 percentage points of VAT. More specifically, the loss of one
percentage point of trade tax revenues to GDP, is offset by an increase of 0.67 percentage points
of VAT. In other words, developing countries are offsetting 67% of their trade tax revenues with
VAT. In the same column, our results suggest that, this effect is non-linear. Indeed, the positive
sign of the square term and the appropriate threshold effect indicates that, the compensatory
effect holds only if the decrease in trade tax revenue does not exceed 6 percentage points of
GDP (VAT exhibit an U relationship with trade tax).
16
The average compensation ratio less than one, might tells us that, VAT tax efforts need to be
increased if the primary goal of first wave tax transition by VAT is to make VAT a powerful tax
transition tool. In column 8, results suggest that, excises are offsetting for revenue losses, once
the decrease in trade tax revenue reached 4 percentage points of GDP (we find an U inverted
relationship between trade tax and excises with a turning point at 4percentage points of GDP).
Thus, the study points out a complementarity effect between VAT and excises in the interval of
trade tax revenue between [4-6] points of GDP. Outside this interval of complementarity, VAT
still works for revenue losses below 4percentage points of trade tax to GDP with a two-thirds-
to-one ratio.
Table 2: Compensatory and complementarity effect between VAT and excises
(1) (2) (3) (4) (5) (6) (7) (8)
Fixed effect Random effect IV IV Fixed effect Random effect IV IV
VARIABLES vat vat vat vat excises excises excises excises
Trade tax -0.290*** -0.287*** -0.404*** -0.672*** 0.0127 0.0199 0.0204 0.382*
(0.0859) (0.0816) (0.0446) (0.139) (0.0288) (0.0259) (0.0177) (0.195)
Log(gdp capita) 1.610*** 1.206*** 1.512*** 1.397*** 0.214** 0.0888 0.213*** 0.193**
(0.472) (0.361) (0.179) (0.196) (0.0889) (0.0896) (0.0711) (0.0767)
Trade 0.00200 0.00269 0.00270 0.00215 -0.00114 -0.00101 -0.00749 -0.00652
(0.00381) (0.00378) (0.00191) (0.00192) (0.00154) (0.00136) (0.00500) (0.00591)
Agriculture -0.0479* -0.0513** -0.0469*** -0.0476*** -0.00795* -0.00876** -0.00761** -0.00749**
(0.0244) (0.0234) (0.00764) (0.00771) (0.00429) (0.00409) (0.00348) (0.00347)
Resources rents 0.00530 0.00364 0.00210 0.00176 0.00550 0.00237 0.00563 0.00569
(0.0142) (0.0135) (0.00579) (0.00583) (0.00646) (0.00619) (0.00452) (0.00451)
Trade_tax2 0.0535*** -0.0474**
(0.0116) (0.0218)
Constant -6.050 -2.939 3.561*** 2.635***
(4.008) (3.178) (1.090) (0.750)
Observations 2,784 2,784 2,688 2,688 2,784 2,784 2,688 2,688
R-squared 0.195 0.193 0.179 0.004 0.004 0.004
Number of country_code 96 96 96 96 96 96 96 96
Hansen P-value 0.284 0.213 0.4428 0.5503
Robust standard errors in parentheses
***p<0.01, ** p<0.05, * p<0.1
17
7. Sensitivity analysis
7.1 Is our result robust to sub-sample diversities ?
Our assumption is that tax systems vary across countries and regions of developing world. For
example, while African countries have an emerging VAT mostly with single VAT rate but with
numerous exemptions, Asian countries adopted low VAT rate, substantial rate dispersion and
few exempt goods. These trends differ considering Latin American countries that have VAT
almost at high rate, with reduced VAT rate and few VAT exemptions. We make sensitivity
analysis to ensure that VAT is performing well wherever it is adopted and that its adoption is
effectively driving tax transition over different areas of developing countries. Investigating such
heterogeneities is essential to address the effectiveness of VAT in tax transition over developing
countries.
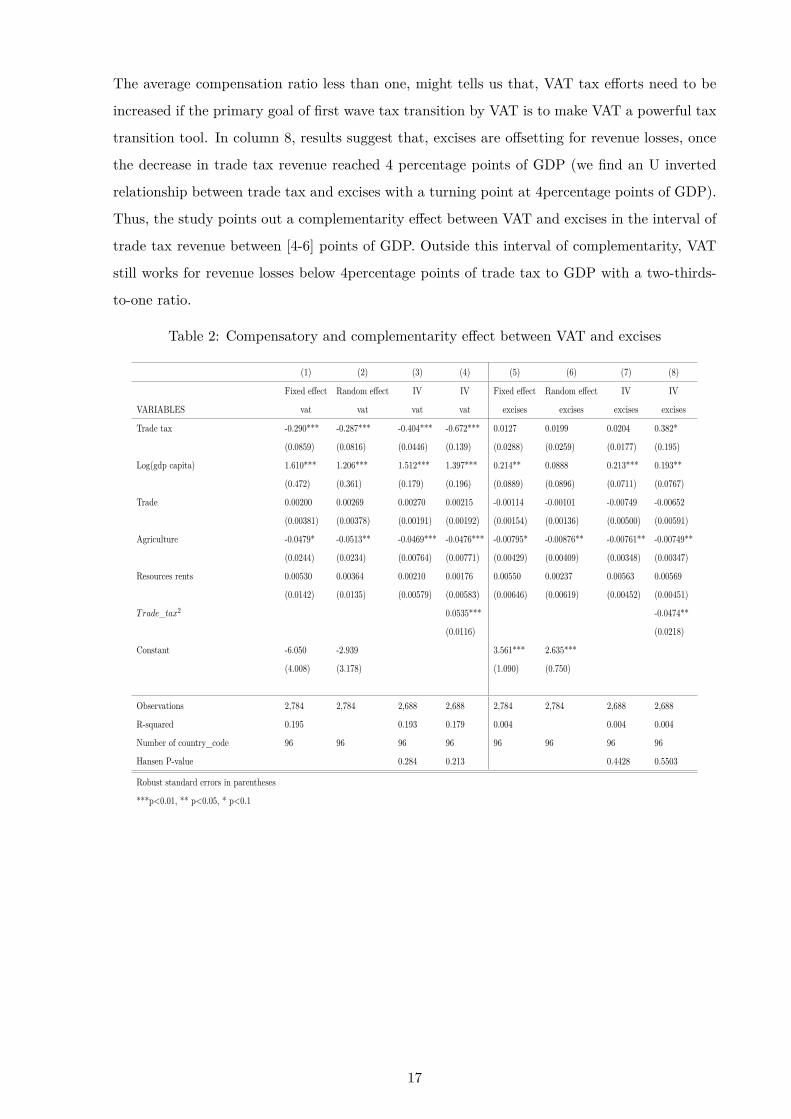
Table 3 reports results on the sub-group of African countries while estimating equation 1. Re-
sults obtained on this table indicate that, VAT adoption effect is robust to Sub-Saharan African
countries. Sub-Saharan African countries are also taking hold of VAT adoption to increase their
probability of succeeding transition. Indeed, for this group of countries, according to results in
column 4, the probability of succeeding transition increases by 12% when they have VAT. We do
not find any differential effect depending on the level of per capita income, but findings in column
8 suggest that, the presence of natural resources made it unlikely to succeed tax transition. The
beneficial effect of VAT tends to diminish as countries become more resource-depending (above
12 percentage points of GDP). To facilitate resource extractive activities, African governements
often grant VAT exemptions to investors in the mining code for several years, to imported cap-
ital goods used in these activities, that may explain this situation.
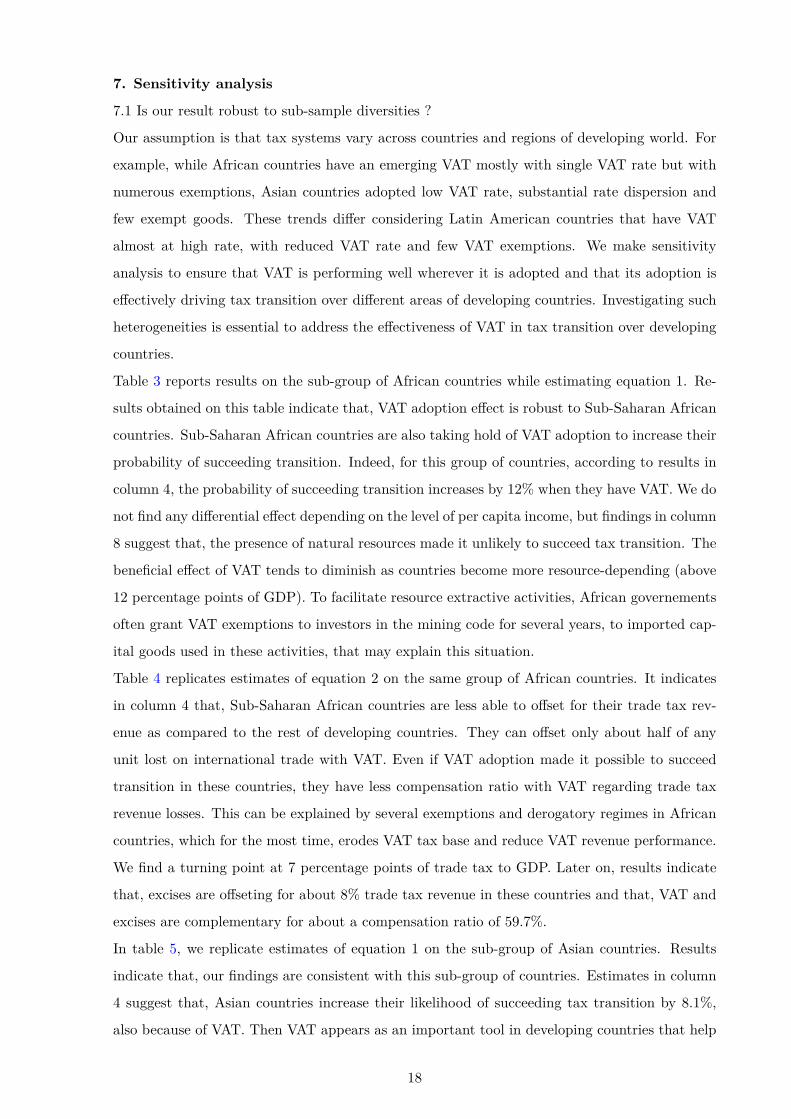
Table 4 replicates estimates of equation 2 on the same group of African countries. It indicates
in column 4 that, Sub-Saharan African countries are less able to offset for their trade tax rev-
enue as compared to the rest of developing countries. They can offset only about half of any
unit lost on international trade with VAT. Even if VAT adoption made it possible to succeed
transition in these countries, they have less compensation ratio with VAT regarding trade tax
revenue losses. This can be explained by several exemptions and derogatory regimes in African
countries, which for the most time, erodes VAT tax base and reduce VAT revenue performance.
We find a turning point at 7 percentage points of trade tax to GDP. Later on, results indicate
that, excises are offseting for about 8% trade tax revenue in these countries and that, VAT and
excises are complementary for about a compensation ratio of 59.7%.
In table 5, we replicate estimates of equation 1 on the sub-group of Asian countries. Results
indicate that, our findings are consistent with this sub-group of countries. Estimates in column
4 suggest that, Asian countries increase their likelihood of succeeding tax transition by 8.1%,
also because of VAT. Then VAT appears as an important tool in developing countries that help
18
succeeding transition. We find that this effect is reinforced with the level of per capita income
(column 5), but as agriculture becomes more important in terms of GDP (above 15 percentage
points of agriculture to GDP), it reduces the likelihood of succeeding tax transition with VAT
(column 7). This is not surprising since agriculture is almost hard to tax in developing countries
and that, most of agricultural goods are often self-consumed.
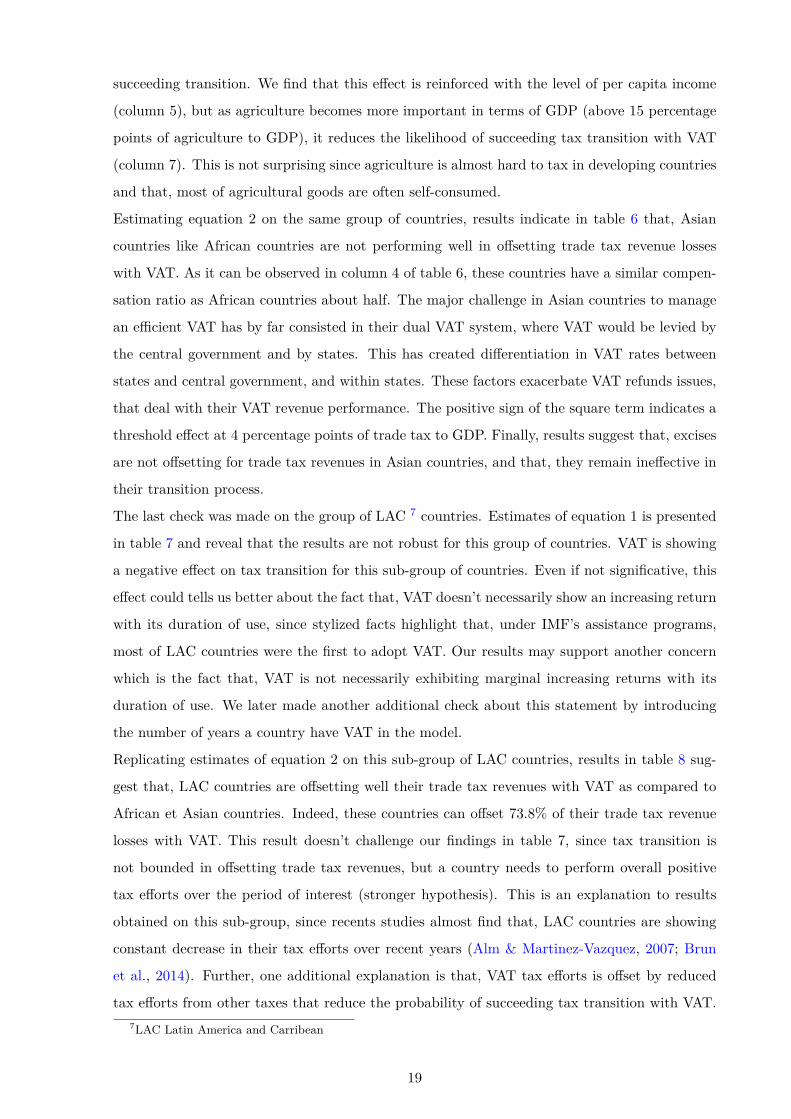
Estimating equation 2 on the same group of countries, results indicate in table 6 that, Asian
countries like African countries are not performing well in offsetting trade tax revenue losses
with VAT. As it can be observed in column 4 of table 6, these countries have a similar compen-
sation ratio as African countries about half. The major challenge in Asian countries to manage
an efficient VAT has by far consisted in their dual VAT system, where VAT would be levied by
the central government and by states. This has created differentiation in VAT rates between
states and central government, and within states. These factors exacerbate VAT refunds issues,
that deal with their VAT revenue performance. The positive sign of the square term indicates a
threshold effect at 4 percentage points of trade tax to GDP. Finally, results suggest that, excises
are not offsetting for trade tax revenues in Asian countries, and that, they remain ineffective in
their transition process.
The last check was made on the group of LAC 7 countries. Estimates of equation 1 is presented
in table 7 and reveal that the results are not robust for this group of countries. VAT is showing
a negative effect on tax transition for this sub-group of countries. Even if not significative, this
effect could tells us better about the fact that, VAT doesn’t necessarily show an increasing return
with its duration of use, since stylized facts highlight that, under IMF’s assistance programs,
most of LAC countries were the first to adopt VAT. Our results may support another concern
which is the fact that, VAT is not necessarily exhibiting marginal increasing returns with its
duration of use. We later made another additional check about this statement by introducing
the number of years a country have VAT in the model.
Replicating estimates of equation 2 on this sub-group of LAC countries, results in table 8 sug-
gest that, LAC countries are offsetting well their trade tax revenues with VAT as compared to
African et Asian countries. Indeed, these countries can offset 73.8% of their trade tax revenue
losses with VAT. This result doesn’t challenge our findings in table 7, since tax transition is
not bounded in offsetting trade tax revenues, but a country needs to perform overall positive
tax efforts over the period of interest (stronger hypothesis). This is an explanation to results
obtained on this sub-group, since recents studies almost find that, LAC countries are showing
constant decrease in their tax efforts over recent years (Alm & Martinez-Vazquez, 2007; Brun
et al., 2014). Further, one additional explanation is that, VAT tax efforts is offset by reduced
tax efforts from other taxes that reduce the probability of succeeding tax transition with VAT.
7LAC Latin America and Carribean
19

The positive sign of the square term indicates a turning point at 6 points of trade tax to GDP.
Finally we find that excises react to trade tax revenue losses in LAC countries, once the decrease
in this tax reached 2 percentage points of GDP. Thus, the complementarity effect between VAT
and excises holds in this region, if the decrease in trade tax lie between [2-6] points of GDP.
7.2 Do the number of years a country have VAT matter ?
This check was made to investigate whether the seniority of VAT increases the return of this tax
in the transition process of developing countries by a cumulative effect, or if it still be an art
to manage VAT. Omission of such variable may lead to « omited variable bias » in the model
since it can affect VAT productivity. Our main assumption is that countries can gain sufficient
experiences with the adopted VAT, its management and it can affect the likelihood of succeeding
tax transition with VAT. This issue is not sufficiently addressed in the literature.
Results obtained in table 9 contrary evidence that, VAT management still be an art in the sense
that, its seniority doesn’t affect the probability of succeeding transition in developing countries.
Further, adding this variable doesn’t challenge as so far our VAT adoption effect on tax transi-
tion.
7.3 Hardening transition assumptions.
We make another check with the main assumption that a country must unavoidably reach its
entire tax potential. We revise and improve Attila et al. (2011), first assumption, since it must
overestimate tax efforts of developing countries. We bring the norm of tax revenue to 100% of
tax potential. We make this check to ensure that, countries are still meeting transition chal-
lenges with VAT even after hardening tax efforts conditions. Results are given in table 10.
We observe in column 4 that, VAT still positively and significantly affects the likelihood of suc-
ceeding tax transition in these countries, which can be interpreted as a qualitative effect of VAT.
But the likelihood of succeeding transition falls to 4.1% (quantitative effect). Thus tax efforts
strongly matter, if one want to address transition performance in developing countries.
20
7.4 Allowing for 3 years interval period (assumption 2 and 3).
We constrained increases and decreases in domestic tax revenues and trade tax revenues over
a period of three years as in Diarra (2012). Compared to the baseline estimate, this check is
performed to assess to what extent, domestic taxes are performing in offsetting trade tax over
a reduced period of three years perhaps because of VAT. Results are given in table 11.
It can be interpreted as follows : First, VAT still remains an important factor that help coun-
tries succeeding tax transition since it still positively and significantly affect tax transition in
these countries. Second, confronting this estimate to our baseline estimate, we observe that the
likelihood of succeeding transition falls to 7%. This result suggests that domestic revenue is like
to cover that of international trade truly in the mid-term.
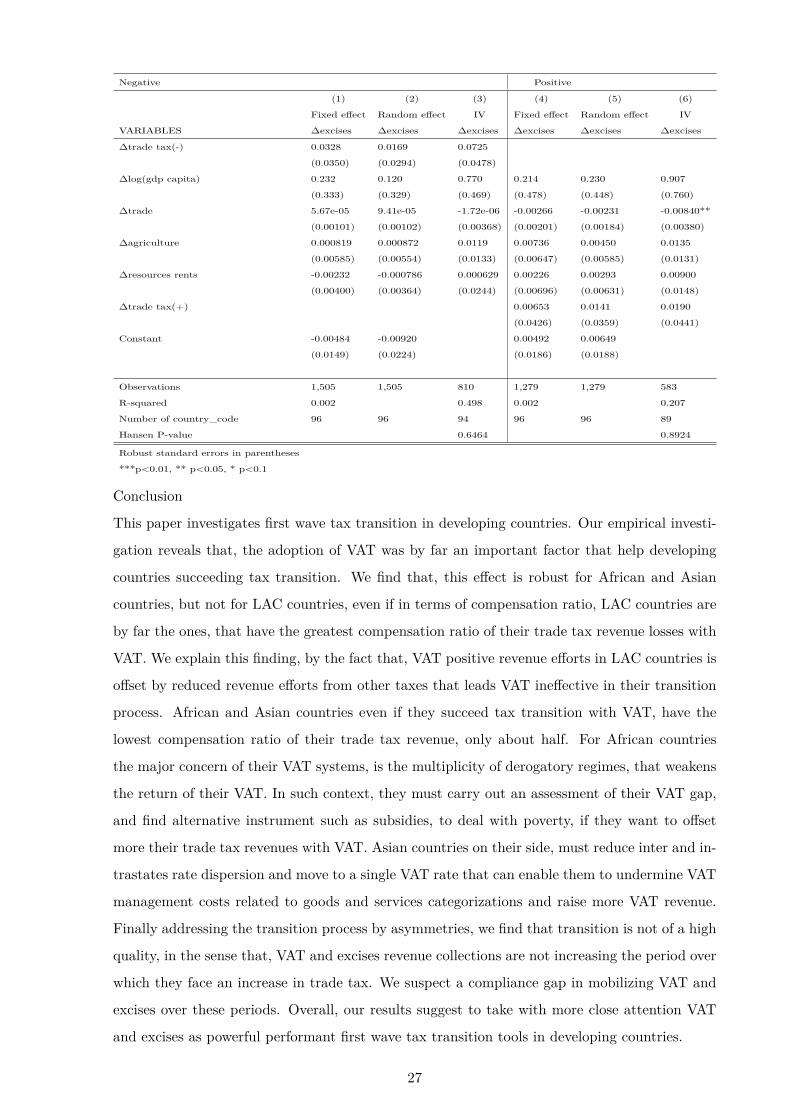
7.5 Investigating for asymmetries.
Another concern of this paper is to investigate for asymmetries. Do VAT and excises revenues
increase in developing countries, the period over which trade tax revenue increases? Investigating
the quality of the transition process need to address empirically this issue to ensure that, VAT
and excises are performing well and that, transition process with these instruments is continuous.
Results in table 12 suggest that, neither VAT nor excises are increasing significantly over the
period where trade tax revenues increase. Thus, this study shows that, first wave tax transition
in developing countries even strengthened by VAT and excises, doesn’t seem irreversible. VAT
and excises systems do not react significantly to the rise in tax base. We suspect a compliance
gap in mobilizing VAT revenue over this period. Thus, VAT and excises policies merit more
close attention, to address empirically the robustness of VAT and excises as powerful effective
first wave tax transition tools in developing countries.
21
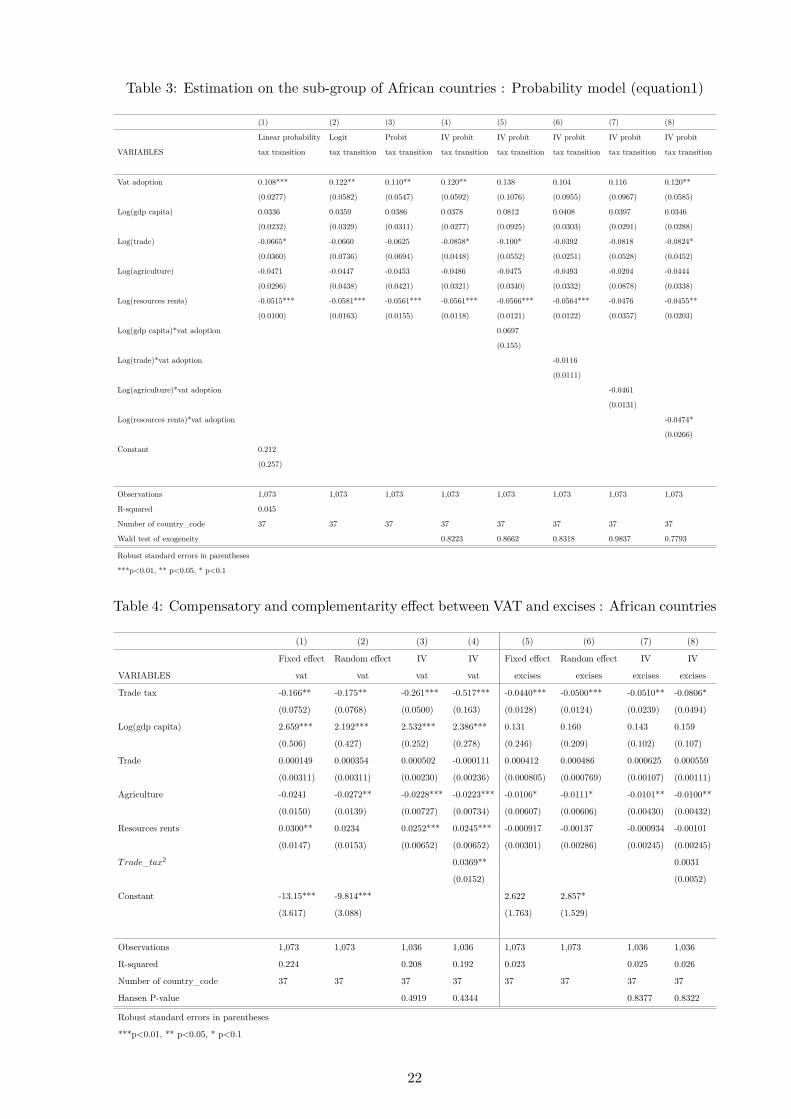
Table 3: Estimation on the sub-group of African countries : Probability model (equation1)
(1) (2) (3) (4) (5) (6) (7) (8)
Linear probability Logit Probit IV probit IV probit IV probit IV probit IV probit
VARIABLES tax transition tax transition tax transition tax transition tax transition tax transition tax transition tax transition
Vat adoption 0.108*** 0.122** 0.110** 0.120** 0.138 0.104 0.116 0.120**
(0.0277) (0.0582) (0.0547) (0.0592) (0.1076) (0.0955) (0.0967) (0.0585)
Log(gdp capita) 0.0336 0.0359 0.0386 0.0378 0.0812 0.0408 0.0397 0.0346
(0.0232) (0.0329) (0.0311) (0.0277) (0.0925) (0.0303) (0.0291) (0.0288)
Log(trade) -0.0665* -0.0660 -0.0625 -0.0858* -0.100* -0.0392 -0.0818 -0.0824*
(0.0360) (0.0736) (0.0694) (0.0448) (0.0552) (0.0251) (0.0528) (0.0452)
Log(agriculture) -0.0471 -0.0447 -0.0453 -0.0486 -0.0475 -0.0493 -0.0204 -0.0444
(0.0296) (0.0438) (0.0421) (0.0321) (0.0340) (0.0332) (0.0878) (0.0338)
Log(resources rents) -0.0515*** -0.0581*** -0.0561*** -0.0561*** -0.0566*** -0.0564*** -0.0476 -0.0455**
(0.0100) (0.0163) (0.0155) (0.0118) (0.0121) (0.0122) (0.0357) (0.0203)
Log(gdp capita)*vat adoption 0.0697
(0.155)
Log(trade)*vat adoption -0.0116
(0.0111)
Log(agriculture)*vat adoption -0.0461
(0.0131)
Log(resources rents)*vat adoption -0.0474*
(0.0266)
Constant 0.212
(0.257)
Observations 1,073 1,073 1,073 1,073 1,073 1,073 1,073 1,073
R-squared 0.045
Number of country_code 37 37 37 37 37 37 37 37
Wald test of exogeneity 0.8223 0.8662 0.8318 0.9837 0.7793
Robust standard errors in parentheses
***p<0.01, ** p<0.05, * p<0.1
Table 4: Compensatory and complementarity effect between VAT and excises : African countries
(1) (2) (3) (4) (5) (6) (7) (8)
Fixed effect Random effect IV IV Fixed effect Random effect IV IV
VARIABLES vat vat vat vat excises excises excises excises
Trade tax -0.166** -0.175** -0.261*** -0.517*** -0.0440*** -0.0500*** -0.0510** -0.0806*
(0.0752) (0.0768) (0.0500) (0.163) (0.0128) (0.0124) (0.0239) (0.0494)
Log(gdp capita) 2.659*** 2.192*** 2.532*** 2.386*** 0.131 0.160 0.143 0.159
(0.506) (0.427) (0.252) (0.278) (0.246) (0.209) (0.102) (0.107)
Trade 0.000149 0.000354 0.000502 -0.000111 0.000412 0.000486 0.000625 0.000559
(0.00311) (0.00311) (0.00230) (0.00236) (0.000805) (0.000769) (0.00107) (0.00111)
Agriculture -0.0241 -0.0272** -0.0228*** -0.0223*** -0.0106* -0.0111* -0.0101** -0.0100**
(0.0150) (0.0139) (0.00727) (0.00734) (0.00607) (0.00606) (0.00430) (0.00432)
Resources rents 0.0300** 0.0234 0.0252*** 0.0245*** -0.000917 -0.00137 -0.000934 -0.00101
(0.0147) (0.0153) (0.00652) (0.00652) (0.00301) (0.00286) (0.00245) (0.00245)
Trade_tax2 0.0369** 0.0031
(0.0152) (0.0052)
Constant -13.15*** -9.814*** 2.622 2.857*
(3.617) (3.088) (1.763) (1.529)
Observations 1,073 1,073 1,036 1,036 1,073 1,073 1,036 1,036
R-squared 0.224 0.208 0.192 0.023 0.025 0.026
Number of country_code 37 37 37 37 37 37 37 37
Hansen P-value 0.4919 0.4344 0.8377 0.8322
Robust standard errors in parentheses
***p<0.01, ** p<0.05, * p<0.1
22
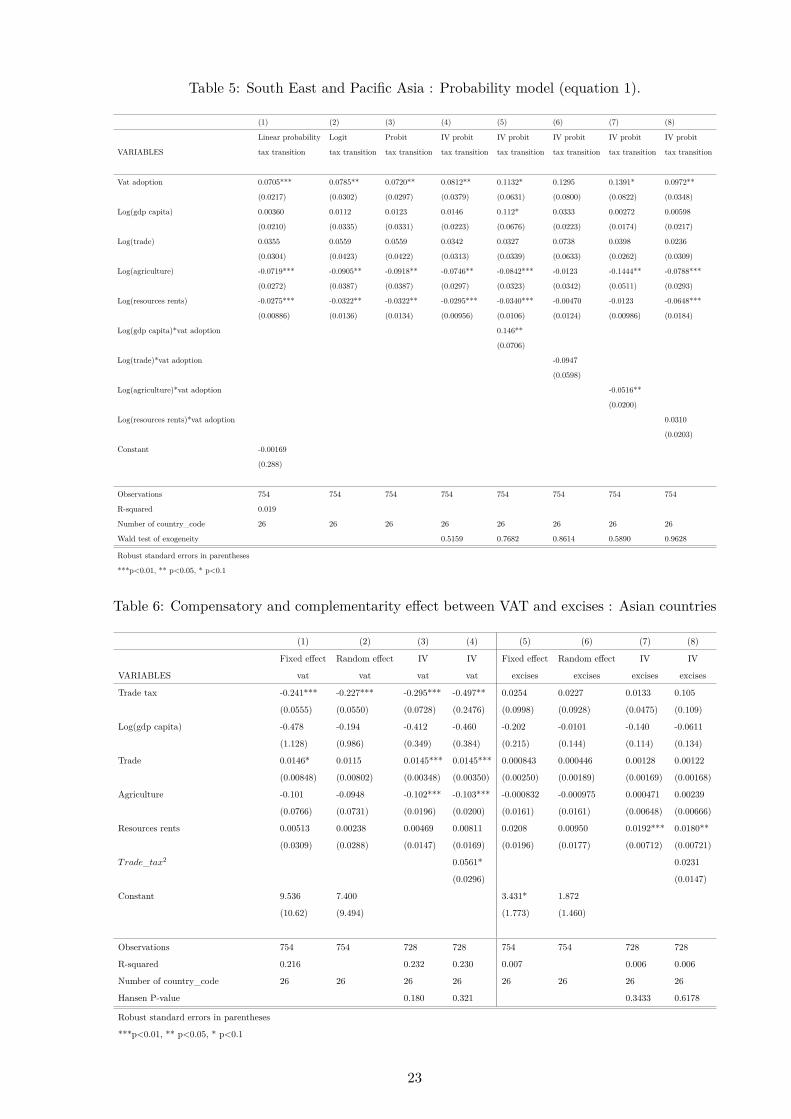
Table 5: South East and Pacific Asia : Probability model (equation 1).
(1) (2) (3) (4) (5) (6) (7) (8)
Linear probability Logit Probit IV probit IV probit IV probit IV probit IV probit
VARIABLES tax transition tax transition tax transition tax transition tax transition tax transition tax transition tax transition
Vat adoption 0.0705*** 0.0785** 0.0720** 0.0812** 0.1132* 0.1295 0.1391* 0.0972**
(0.0217) (0.0302) (0.0297) (0.0379) (0.0631) (0.0800) (0.0822) (0.0348)
Log(gdp capita) 0.00360 0.0112 0.0123 0.0146 0.112* 0.0333 0.00272 0.00598
(0.0210) (0.0335) (0.0331) (0.0223) (0.0676) (0.0223) (0.0174) (0.0217)
Log(trade) 0.0355 0.0559 0.0559 0.0342 0.0327 0.0738 0.0398 0.0236
(0.0304) (0.0423) (0.0422) (0.0313) (0.0339) (0.0633) (0.0262) (0.0309)
Log(agriculture) -0.0719*** -0.0905** -0.0918** -0.0746** -0.0842*** -0.0123 -0.1444** -0.0788***
(0.0272) (0.0387) (0.0387) (0.0297) (0.0323) (0.0342) (0.0511) (0.0293)
Log(resources rents) -0.0275*** -0.0322** -0.0322** -0.0295*** -0.0340*** -0.00470 -0.0123 -0.0648***
(0.00886) (0.0136) (0.0134) (0.00956) (0.0106) (0.0124) (0.00986) (0.0184)
Log(gdp capita)*vat adoption 0.146**
(0.0706)
Log(trade)*vat adoption -0.0947
(0.0598)
Log(agriculture)*vat adoption -0.0516**
(0.0200)
Log(resources rents)*vat adoption 0.0310
(0.0203)
Constant -0.00169
(0.288)
Observations 754 754 754 754 754 754 754 754
R-squared 0.019
Number of country_code 26 26 26 26 26 26 26 26
Wald test of exogeneity 0.5159 0.7682 0.8614 0.5890 0.9628
Robust standard errors in parentheses
***p<0.01, ** p<0.05, * p<0.1
Table 6: Compensatory and complementarity effect between VAT and excises : Asian countries
(1) (2) (3) (4) (5) (6) (7) (8)
Fixed effect Random effect IV IV Fixed effect Random effect IV IV
VARIABLES vat vat vat vat excises excises excises excises
Trade tax -0.241*** -0.227*** -0.295*** -0.497** 0.0254 0.0227 0.0133 0.105
(0.0555) (0.0550) (0.0728) (0.2476) (0.0998) (0.0928) (0.0475) (0.109)
Log(gdp capita) -0.478 -0.194 -0.412 -0.460 -0.202 -0.0101 -0.140 -0.0611
(1.128) (0.986) (0.349) (0.384) (0.215) (0.144) (0.114) (0.134)
Trade 0.0146* 0.0115 0.0145*** 0.0145*** 0.000843 0.000446 0.00128 0.00122
(0.00848) (0.00802) (0.00348) (0.00350) (0.00250) (0.00189) (0.00169) (0.00168)
Agriculture -0.101 -0.0948 -0.102*** -0.103*** -0.000832 -0.000975 0.000471 0.00239
(0.0766) (0.0731) (0.0196) (0.0200) (0.0161) (0.0161) (0.00648) (0.00666)
Resources rents 0.00513 0.00238 0.00469 0.00811 0.0208 0.00950 0.0192*** 0.0180**
(0.0309) (0.0288) (0.0147) (0.0169) (0.0196) (0.0177) (0.00712) (0.00721)
Trade_tax2 0.0561* 0.0231
(0.0296) (0.0147)
Constant 9.536 7.400 3.431* 1.872
(10.62) (9.494) (1.773) (1.460)
Observations 754 754 728 728 754 754 728 728
R-squared 0.216 0.232 0.230 0.007 0.006 0.006
Number of country_code 26 26 26 26 26 26 26 26
Hansen P-value 0.180 0.321 0.3433 0.6178
Robust standard errors in parentheses
***p<0.01, ** p<0.05, * p<0.1
23
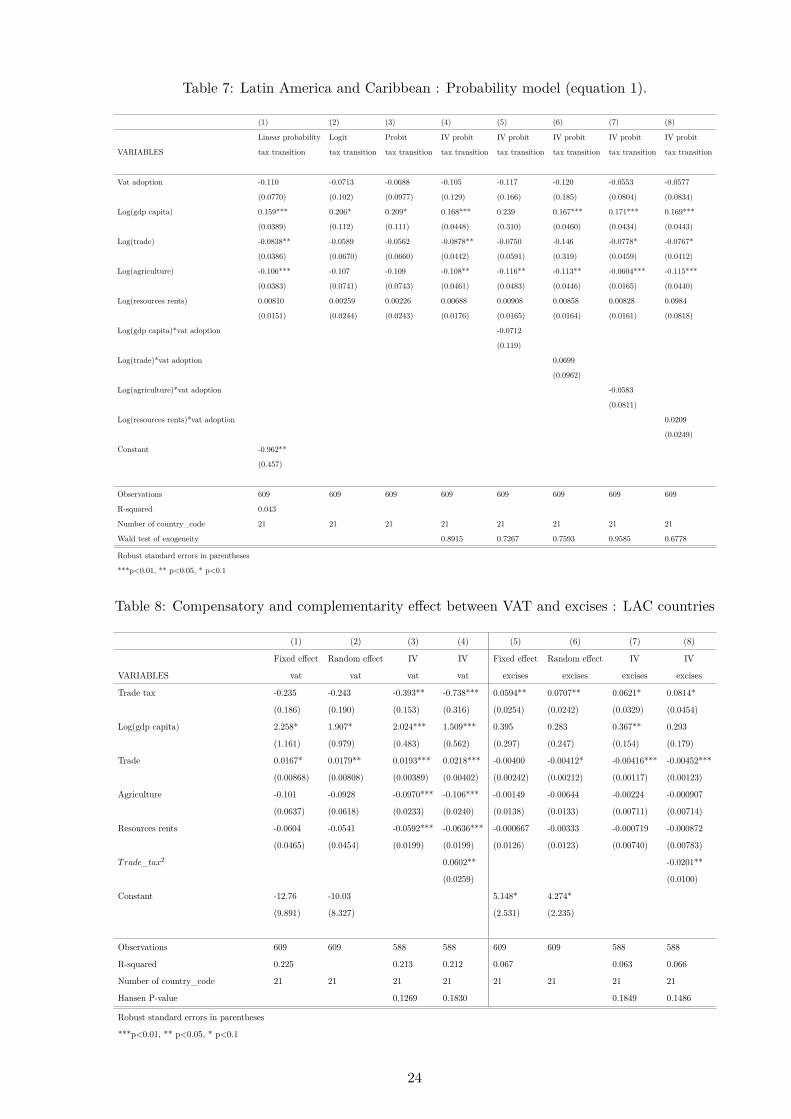
Table 7: Latin America and Caribbean : Probability model (equation 1).
(1) (2) (3) (4) (5) (6) (7) (8)
Linear probability Logit Probit IV probit IV probit IV probit IV probit IV probit
VARIABLES tax transition tax transition tax transition tax transition tax transition tax transition tax transition tax transition
Vat adoption -0.110 -0.0713 -0.0688 -0.105 -0.117 -0.120 -0.0553 -0.0577
(0.0770) (0.102) (0.0977) (0.129) (0.166) (0.185) (0.0804) (0.0834)
Log(gdp capita) 0.159*** 0.206* 0.209* 0.168*** 0.239 0.167*** 0.171*** 0.169***
(0.0389) (0.112) (0.111) (0.0448) (0.310) (0.0460) (0.0434) (0.0443)
Log(trade) -0.0838** -0.0589 -0.0562 -0.0878** -0.0750 -0.146 -0.0778* -0.0767*
(0.0386) (0.0670) (0.0660) (0.0442) (0.0591) (0.319) (0.0459) (0.0412)
Log(agriculture) -0.106*** -0.107 -0.109 -0.108** -0.116** -0.113** -0.0604*** -0.115***
(0.0383) (0.0741) (0.0743) (0.0461) (0.0483) (0.0446) (0.0165) (0.0440)
Log(resources rents) 0.00810 0.00259 0.00226 0.00688 0.00908 0.00858 0.00828 0.0984
(0.0151) (0.0244) (0.0243) (0.0176) (0.0165) (0.0164) (0.0161) (0.0818)
Log(gdp capita)*vat adoption -0.0712
(0.119)
Log(trade)*vat adoption 0.0699
(0.0962)
Log(agriculture)*vat adoption -0.0583
(0.0811)
Log(resources rents)*vat adoption 0.0209
(0.0249)
Constant -0.962**
(0.457)
Observations 609 609 609 609 609 609 609 609
R-squared 0.043
Number of country_code 21 21 21 21 21 21 21 21
Wald test of exogeneity 0.8915 0.7267 0.7593 0.9585 0.6778
Robust standard errors in parentheses
***p<0.01, ** p<0.05, * p<0.1
Table 8: Compensatory and complementarity effect between VAT and excises : LAC countries
(1) (2) (3) (4) (5) (6) (7) (8)
Fixed effect Random effect IV IV Fixed effect Random effect IV IV
VARIABLES vat vat vat vat excises excises excises excises
Trade tax -0.235 -0.243 -0.393** -0.738*** 0.0594** 0.0707** 0.0621* 0.0814*
(0.186) (0.190) (0.153) (0.316) (0.0254) (0.0242) (0.0329) (0.0454)
Log(gdp capita) 2.258* 1.907* 2.024*** 1.509*** 0.395 0.283 0.367** 0.293
(1.161) (0.979) (0.483) (0.562) (0.297) (0.247) (0.154) (0.179)
Trade 0.0167* 0.0179** 0.0193*** 0.0218*** -0.00400 -0.00412* -0.00416*** -0.00452***
(0.00868) (0.00808) (0.00389) (0.00402) (0.00242) (0.00212) (0.00117) (0.00123)
Agriculture -0.101 -0.0928 -0.0970*** -0.106*** -0.00149 -0.00644 -0.00224 -0.000907
(0.0637) (0.0618) (0.0233) (0.0240) (0.0138) (0.0133) (0.00711) (0.00714)
Resources rents -0.0604 -0.0541 -0.0592*** -0.0636*** -0.000667 -0.00333 -0.000719 -0.000872
(0.0465) (0.0454) (0.0199) (0.0199) (0.0126) (0.0123) (0.00740) (0.00783)
Trade_tax2 0.0602** -0.0201**
(0.0259) (0.0100)
Constant -12.76 -10.03 5.148* 4.274*
(9.891) (8.327) (2.531) (2.235)
Observations 609 609 588 588 609 609 588 588
R-squared 0.225 0.213 0.212 0.067 0.063 0.066
Number of country_code 21 21 21 21 21 21 21 21
Hansen P-value 0.1269 0.1830 0.1849 0.1486
Robust standard errors in parentheses
***p<0.01, ** p<0.05, * p<0.1
24
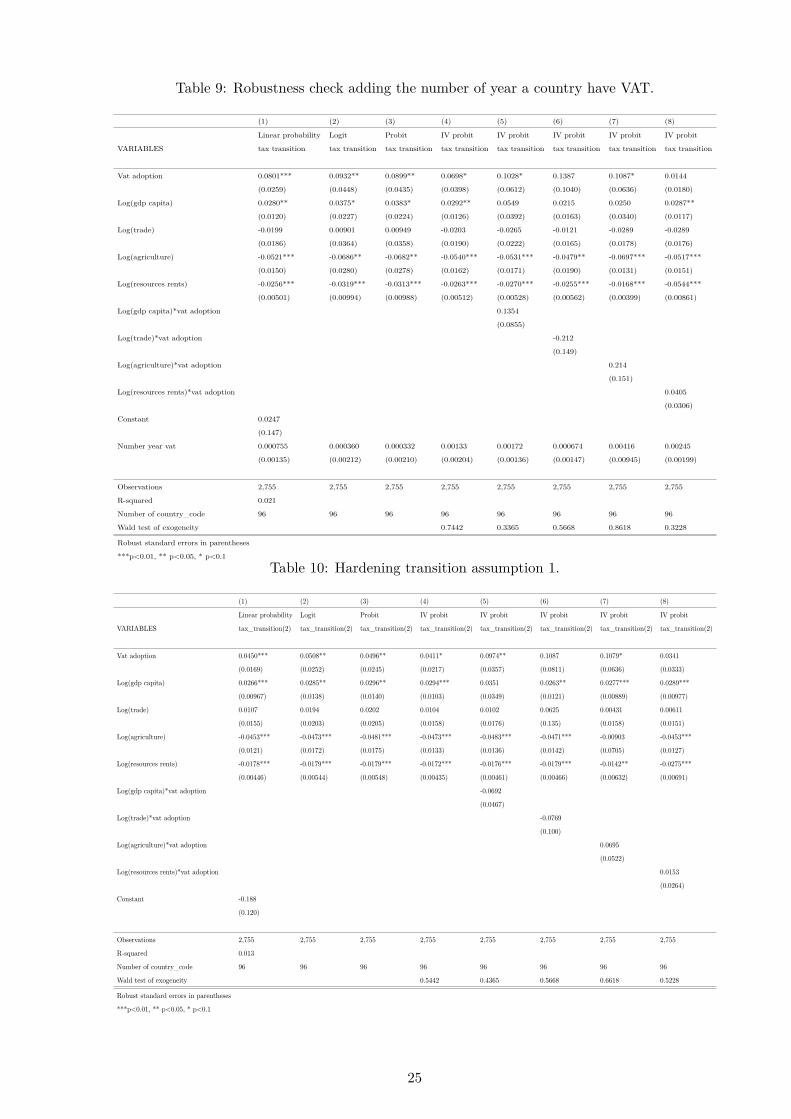
Table 9: Robustness check adding the number of year a country have VAT.
(1) (2) (3) (4) (5) (6) (7) (8)
Linear probability Logit Probit IV probit IV probit IV probit IV probit IV probit
VARIABLES tax transition tax transition tax transition tax transition tax transition tax transition tax transition tax transition
Vat adoption 0.0801*** 0.0932** 0.0899** 0.0698* 0.1028* 0.1387 0.1087* 0.0144
(0.0259) (0.0448) (0.0435) (0.0398) (0.0612) (0.1040) (0.0636) (0.0180)
Log(gdp capita) 0.0280** 0.0375* 0.0383* 0.0292** 0.0549 0.0215 0.0250 0.0287**
(0.0120) (0.0227) (0.0224) (0.0126) (0.0392) (0.0163) (0.0340) (0.0117)
Log(trade) -0.0199 0.00901 0.00949 -0.0203 -0.0265 -0.0121 -0.0289 -0.0289
(0.0186) (0.0364) (0.0358) (0.0190) (0.0222) (0.0165) (0.0178) (0.0176)
Log(agriculture) -0.0521*** -0.0686** -0.0682** -0.0540*** -0.0531*** -0.0479** -0.0697*** -0.0517***
(0.0150) (0.0280) (0.0278) (0.0162) (0.0171) (0.0190) (0.0131) (0.0151)
Log(resources rents) -0.0256*** -0.0319*** -0.0313*** -0.0263*** -0.0270*** -0.0255*** -0.0168*** -0.0544***
(0.00501) (0.00994) (0.00988) (0.00512) (0.00528) (0.00562) (0.00399) (0.00861)
Log(gdp capita)*vat adoption 0.1354
(0.0855)
Log(trade)*vat adoption -0.212
(0.149)
Log(agriculture)*vat adoption 0.214
(0.151)
Log(resources rents)*vat adoption 0.0405
(0.0306)
Constant 0.0247
(0.147)
Number year vat 0.000755 0.000360 0.000332 0.00133 0.00172 0.000674 0.00416 0.00245
(0.00135) (0.00212) (0.00210) (0.00204) (0.00136) (0.00147) (0.00945) (0.00199)
Observations 2,755 2,755 2,755 2,755 2,755 2,755 2,755 2,755
R-squared 0.021
Number of country_code 96 96 96 96 96 96 96 96
Wald test of exogeneity 0.7442 0.3365 0.5668 0.8618 0.3228
Robust standard errors in parentheses
***p<0.01, ** p<0.05, * p<0.1
Table 10: Hardening transition assumption 1.
(1) (2) (3) (4) (5) (6) (7) (8)
Linear probability Logit Probit IV probit IV probit IV probit IV probit IV probit
VARIABLES tax_transition(2) tax_transition(2) tax_transition(2) tax_transition(2) tax_transition(2) tax_transition(2) tax_transition(2) tax_transition(2)
Vat adoption 0.0450*** 0.0508** 0.0496** 0.0411* 0.0974** 0.1087 0.1079* 0.0341
(0.0169) (0.0252) (0.0245) (0.0217) (0.0357) (0.0811) (0.0636) (0.0333)
Log(gdp capita) 0.0266*** 0.0285** 0.0296** 0.0294*** 0.0351 0.0263** 0.0277*** 0.0289***
(0.00967) (0.0138) (0.0140) (0.0103) (0.0349) (0.0121) (0.00889) (0.00977)
Log(trade) 0.0107 0.0194 0.0202 0.0104 0.0102 0.0625 0.00431 0.00611
(0.0155) (0.0203) (0.0205) (0.0158) (0.0176) (0.135) (0.0158) (0.0151)
Log(agriculture) -0.0453*** -0.0473*** -0.0481*** -0.0473*** -0.0483*** -0.0471*** -0.00903 -0.0453***
(0.0121) (0.0172) (0.0175) (0.0133) (0.0136) (0.0142) (0.0705) (0.0127)
Log(resources rents) -0.0178*** -0.0179*** -0.0179*** -0.0172*** -0.0176*** -0.0179*** -0.0142** -0.0275***
(0.00446) (0.00544) (0.00548) (0.00435) (0.00461) (0.00466) (0.00632) (0.00691)
Log(gdp capita)*vat adoption -0.0692
(0.0467)
Log(trade)*vat adoption -0.0769
(0.100)
Log(agriculture)*vat adoption 0.0695
(0.0522)
Log(resources rents)*vat adoption 0.0153
(0.0264)
Constant -0.188
(0.120)
Observations 2,755 2,755 2,755 2,755 2,755 2,755 2,755 2,755
R-squared 0.013
Number of country_code 96 96 96 96 96 96 96 96
Wald test of exogeneity 0.5442 0.4365 0.5668 0.6618 0.5228
Robust standard errors in parentheses
***p<0.01, ** p<0.05, * p<0.1
25
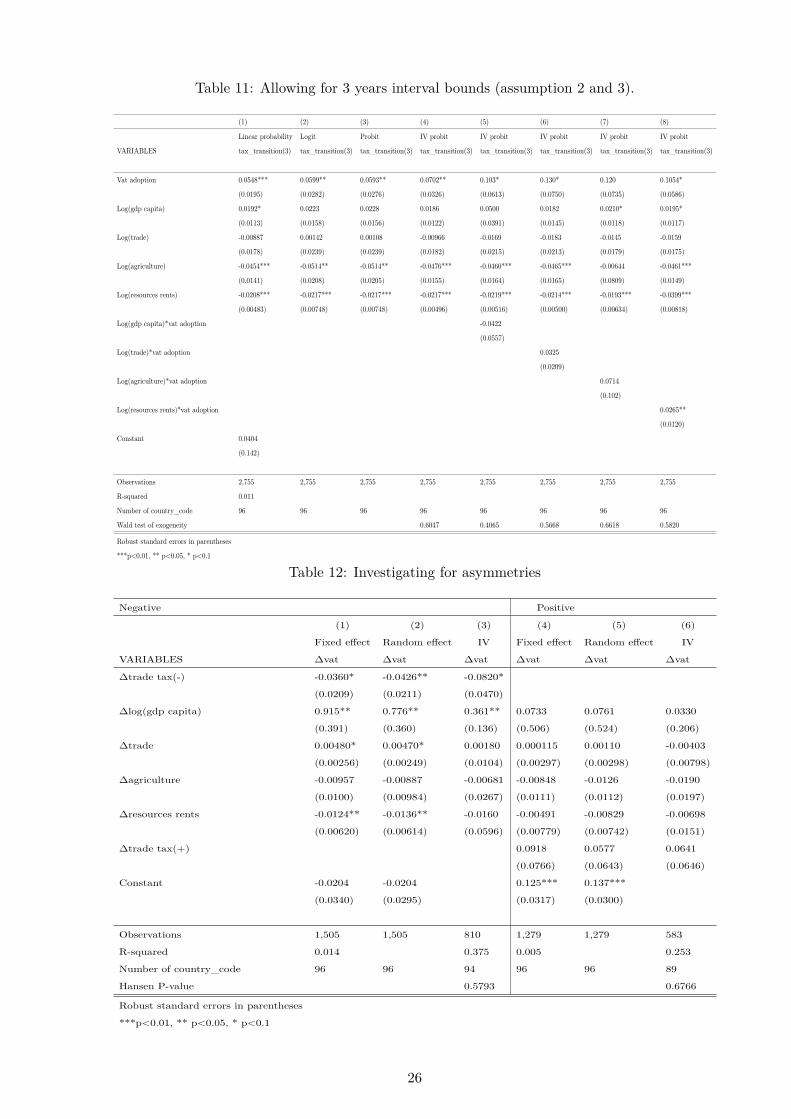
Table 11: Allowing for 3 years interval bounds (assumption 2 and 3).
(1) (2) (3) (4) (5) (6) (7) (8)
Linear probability Logit Probit IV probit IV probit IV probit IV probit IV probit
VARIABLES tax_transition(3) tax_transition(3) tax_transition(3) tax_transition(3) tax_transition(3) tax_transition(3) tax_transition(3) tax_transition(3)
Vat adoption 0.0548*** 0.0599** 0.0593** 0.0702** 0.103* 0.130* 0.120 0.1054*
(0.0195) (0.0282) (0.0276) (0.0326) (0.0613) (0.0750) (0.0735) (0.0586)
Log(gdp capita) 0.0192* 0.0223 0.0228 0.0186 0.0500 0.0182 0.0210* 0.0195*
(0.0113) (0.0158) (0.0156) (0.0122) (0.0391) (0.0145) (0.0118) (0.0117)
Log(trade) -0.00887 0.00142 0.00108 -0.00966 -0.0169 -0.0183 -0.0145 -0.0159
(0.0178) (0.0239) (0.0239) (0.0182) (0.0215) (0.0213) (0.0179) (0.0175)
Log(agriculture) -0.0454*** -0.0514** -0.0514** -0.0476*** -0.0460*** -0.0465*** -0.00644 -0.0461***
(0.0141) (0.0208) (0.0205) (0.0155) (0.0164) (0.0165) (0.0809) (0.0149)
Log(resources rents) -0.0208*** -0.0217*** -0.0217*** -0.0217*** -0.0219*** -0.0214*** -0.0193*** -0.0399***
(0.00483) (0.00748) (0.00748) (0.00496) (0.00516) (0.00500) (0.00634) (0.00818)
Log(gdp capita)*vat adoption -0.0422
(0.0557)
Log(trade)*vat adoption 0.0325
(0.0209)
Log(agriculture)*vat adoption 0.0714
(0.102)
Log(resources rents)*vat adoption 0.0265**
(0.0120)
Constant 0.0404
(0.142)
Observations 2,755 2,755 2,755 2,755 2,755 2,755 2,755 2,755
R-squared 0.011
Number of country_code 96 96 96 96 96 96 96 96
Wald test of exogeneity 0.6047 0.4065 0.5668 0.6618 0.5820
Robust standard errors in parentheses
***p<0.01, ** p<0.05, * p<0.1
Table 12: Investigating for asymmetries
Negative Positive
(1) (2) (3) (4) (5) (6)
Fixed effect Random effect IV Fixed effect Random effect IV
VARIABLES ∆vat ∆vat ∆vat ∆vat ∆vat ∆vat
∆trade tax(-) -0.0360* -0.0426** -0.0820*
(0.0209) (0.0211) (0.0470)
∆log(gdp capita) 0.915** 0.776** 0.361** 0.0733 0.0761 0.0330
(0.391) (0.360) (0.136) (0.506) (0.524) (0.206)
∆trade 0.00480* 0.00470* 0.00180 0.000115 0.00110 -0.00403
(0.00256) (0.00249) (0.0104) (0.00297) (0.00298) (0.00798)
∆agriculture -0.00957 -0.00887 -0.00681 -0.00848 -0.0126 -0.0190
(0.0100) (0.00984) (0.0267) (0.0111) (0.0112) (0.0197)
∆resources rents -0.0124** -0.0136** -0.0160 -0.00491 -0.00829 -0.00698
(0.00620) (0.00614) (0.0596) (0.00779) (0.00742) (0.0151)
∆trade tax(+) 0.0918 0.0577 0.0641
(0.0766) (0.0643) (0.0646)
Constant -0.0204 -0.0204 0.125*** 0.137***
(0.0340) (0.0295) (0.0317) (0.0300)
Observations 1,505 1,505 810 1,279 1,279 583
R-squared 0.014 0.375 0.005 0.253
Number of country_code 96 96 94 96 96 89
Hansen P-value 0.5793 0.6766
Robust standard errors in parentheses
***p<0.01, ** p<0.05, * p<0.1
26
Negative Positive
(1) (2) (3) (4) (5) (6)
Fixed effect Random effect IV Fixed effect Random effect IV
VARIABLES ∆excises ∆excises ∆excises ∆excises ∆excises ∆excises
∆trade tax(-) 0.0328 0.0169 0.0725
(0.0350) (0.0294) (0.0478)
∆log(gdp capita) 0.232 0.120 0.770 0.214 0.230 0.907
(0.333) (0.329) (0.469) (0.478) (0.448) (0.760)
∆trade 5.67e-05 9.41e-05 -1.72e-06 -0.00266 -0.00231 -0.00840**
(0.00101) (0.00102) (0.00368) (0.00201) (0.00184) (0.00380)
∆agriculture 0.000819 0.000872 0.0119 0.00736 0.00450 0.0135
(0.00585) (0.00554) (0.0133) (0.00647) (0.00585) (0.0131)
∆resources rents -0.00232 -0.000786 0.000629 0.00226 0.00293 0.00900
(0.00400) (0.00364) (0.0244) (0.00696) (0.00631) (0.0148)
∆trade tax(+) 0.00653 0.0141 0.0190
(0.0426) (0.0359) (0.0441)
Constant -0.00484 -0.00920 0.00492 0.00649
(0.0149) (0.0224) (0.0186) (0.0188)
Observations 1,505 1,505 810 1,279 1,279 583
R-squared 0.002 0.498 0.002 0.207
Number of country_code 96 96 94 96 96 89
Hansen P-value 0.6464 0.8924
Robust standard errors in parentheses
***p<0.01, ** p<0.05, * p<0.1
Conclusion
This paper investigates first wave tax transition in developing countries. Our empirical investi-
gation reveals that, the adoption of VAT was by far an important factor that help developing
countries succeeding tax transition. We find that, this effect is robust for African and Asian
countries, but not for LAC countries, even if in terms of compensation ratio, LAC countries are
by far the ones, that have the greatest compensation ratio of their trade tax revenue losses with
VAT. We explain this finding, by the fact that, VAT positive revenue efforts in LAC countries is
offset by reduced revenue efforts from other taxes that leads VAT ineffective in their transition
process. African and Asian countries even if they succeed tax transition with VAT, have the
lowest compensation ratio of their trade tax revenue, only about half. For African countries
the major concern of their VAT systems, is the multiplicity of derogatory regimes, that weakens
the return of their VAT. In such context, they must carry out an assessment of their VAT gap,
and find alternative instrument such as subsidies, to deal with poverty, if they want to offset
more their trade tax revenues with VAT. Asian countries on their side, must reduce inter and in-
trastates rate dispersion and move to a single VAT rate that can enable them to undermine VAT
management costs related to goods and services categorizations and raise more VAT revenue.
Finally addressing the transition process by asymmetries, we find that transition is not of a high
quality, in the sense that, VAT and excises revenue collections are not increasing the period over
which they face an increase in trade tax. We suspect a compliance gap in mobilizing VAT and
excises over these periods. Overall, our results suggest to take with more close attention VAT
and excises as powerful performant first wave tax transition tools in developing countries.
27
References
Agha, A., & Haughton, J. (1996). Designing VAT systems: Some efficiency considerations. The
Review of Economics and Statistics, 303–308.
Aizenman, J., & Jinjarak, Y. (2009). Globalisation and developing countries–a shrinking tax
base? The Journal of Development Studies, 45 (5), 653–671.
Alm, J., & Martinez-Vazquez, J. (2007). Tax morale and tax evasion in Latin America. Andrew
Young School of Policy Studies, Georgia University, International Studies Program, WP,
07–32.
Attila, G., Chambas, G., & Combes, J.-L. (2011). Aide publique au développement et transition
fiscale. Retrieved from https://hal.inria.fr/halshs-00554343/
Baunsgaard, T., & Keen, M. (2010). Tax revenue and (or?) trade liberalization. Journal of
Public Economics, 94 (9), 563 - 577.
Besley, T., & Persson, T. (2014). Why Do Developing Countries Tax So Little? The Journal of
Economic Perspectives, 28 (4), 99–120.
Bevan, D. (1995). Fiscal implications of trade liberalization. IMF Working Paper(95/50).
Bird, R. (1989). The administrative dimension of tax reform in developing countries. Tax reform
in developing countries, 315–346.
Bird, R., & Gendron, P.-P. (2007). The VAT in developing and transitional countries. Cambridge
University Press.
Bodin, J.-P. (2012). Modernizing the Tax Administration in Developing Countries: Impact of
the VAT. Revue d’économie du développement, 20 (3), 83–103.
Bolnick, B. R., & Haughton, J. (1998). Tax policy in Sub-Saharan Africa: examining the role of
excise taxation. United States Agency for International Development, Bureau for Africa,
Office of Sustainable Development.
Brautigam, D., Fjeldstad, O.-H., & Moore, M. (2008). Taxation and State-Building in Devel-
oping Countries: Capacity and Consent. Cambridge University Press.
Brun, J. F., Chambas, G., & Mansour, M. (2014). Tax effort of developing countries: An
alternative measure. Financing sustainable development by addressing vulnerabilities Eco-
nomica.
Chambas, G. (2005a). Afrique au sud du sahara:quelle stratégie de transition fiscale? Afrique
contemporaine(1), 133–163.
Chambas, G. (2005b). TVA et transition fiscale en Afrique: les nouveaux enjeux. Afrique
contemporaine(3), 181–194.
Chambas, G., & Araujo Bonjean, C. (2001). Le paradoxe de la fiscalité agricole en afrique
subsaharienne. Revue Tiers Monde, 42 (168), 773–788.
28
Cnossen, S. (2005). Theory and practice of excise taxation: smoking, drinking, gambling,
polluting, and driving. Oxford University Press.
Cnossen, S. (2011). The economics of excise taxation. E. ALBI, AND MARTINEZ-VAZQUEZ,
J.(EDS), 2011 , 278–299.
de La Feria, R. (2013). VAT exemptions: consequences and design alternatives. Kluwer Law
International.
De Mello, L. (2009). Avoiding the Value Added Tax: Theory and cross-country evidence. Public
Finance Review, 37 (1), 27–46.
Diarra, S. (2012). Chocs et mobilisation des recettes publiques dans les pays en développe-
ment (Doctoral dissertation, Université d’Auvergne-Clermont-Ferrand I). Retrieved from
https://hal.archives-ouvertes.fr/tel-00777227/
Ebeke, C. (2011). Remittances, value added tax and tax revenue in developing countries.
Retrieved from https://halshs.archives-ouvertes.fr/halshs-00552222/
Ebeke, C., & Ehrhart, H. (2010). Is VAT Stabilizing. International Monetary Fund, 20 .
Ebeke, C., & Ehrhart, H. (2011). Tax revenue instability in Sub-Saharan Africa: Consequences
and remedies. Journal of African Economies, 21 (1), 1–27.
Ebeke, C., Mansour, M., & Rota-Graziosi, G. (2016). The Power to Tax in Sub-Saharan
Africa: LTUs, VATs, and SARAs. Retrieved from https://halshs.archives-ouvertes
.fr/halshs-01332049/document
Ebrill, L. P. (2001). The modern VAT. International Monetary Fund.
Emran, M. S., & Stiglitz, J. E. (2005). On selective indirect tax reform in developing countries.
Journal of Public Economics, 89 (4), 599 - 623.
Gupta, A. S. (2007). Determinants of tax revenue efforts in developing countries. International
Monetary Fund, 7/184.
Harrison, M. G., & Krelove, R. (2005). VAT Refunds: A Review of Country Experience (EPub)
(No. 5-218). International Monetary Fund.
Horowitz, J. L., & Savin, N. E. (2001). Binary response models: Logits, probits and semipara-
metrics. Journal of Economic Perspectives, 15 (4), 43–56.
Jones, C., Morrissey, O., & Nelson, D. (2011). Did the world bank drive tariff reforms in eastern
africa? World Development, 39 (3), 324 - 335.
Kanbur, R., & Keen, M. (2014). Thresholds, informality, and partitions of compliance. Inter-
national Tax and Public Finance, 21 (4), 536–559.
Keen, M. (2013). The Anatomy of the VAT. International Monetary Fund, 13/111.
Keen, M., & Ligthart, J. (2002). Coordinating tariff reduction and domestic tax reform. Journal
of International Economics, 56 (2), 489–507.
Keen, M., & Lockwood, B. (2006). Is the VAT a money machine? National Tax Journal,
29
905–928.
Keen, M., & Lockwood, B. (2010). The value added tax: Its causes and consequences. Journal
of Development Economics, 92 (2), 138–151.
Keen, M., & Mintz, J. (2004). The optimal threshold for a value-added tax. Journal of Public
Economics, 88 (3-4), 559–576.
Keen, M., & Simone, A. (2004). Tax policy in developing countries: some lessons from the 1990s
and some challenges ahead. Helping countries develop: The role of fiscal policy, 302–52.
Khattry, B., & Rao, J. M. (2002). Fiscal faux pas?: an analysis of the revenue implications of
trade liberalization. World Development, 30 (8), 1431–1444.
Moore, M. (2007). How does taxation affect the quality of governance? Working paper series,
280. Brighton: IDS .
Ramsey, F. P. (1927). A Contribution to the Theory of Taxation. The Economic Journal,
37 (145), 47–61.
Stotsky, M. J. G., & WoldeMariam, M. A. (1997). Tax effort in sub-Saharan Africa. International
Monetary Fund, 97/107.
Tait, A. A. (1991). Value-Added Tax; Administrative and Policy Issues (Tech. Rep.). Interna-
tional Monetary Fund.
Tanzi, V., & Zee, H. H. (2000). Tax policy for emerging markets: developing countries. National
tax journal, 299–322.
Ufier, A. (2014). Quasi-Experimental Analysis on the Effects of Adoption of a Value Added
Tax. Economic Inquiry, 52 (4), 1364–1379.
30
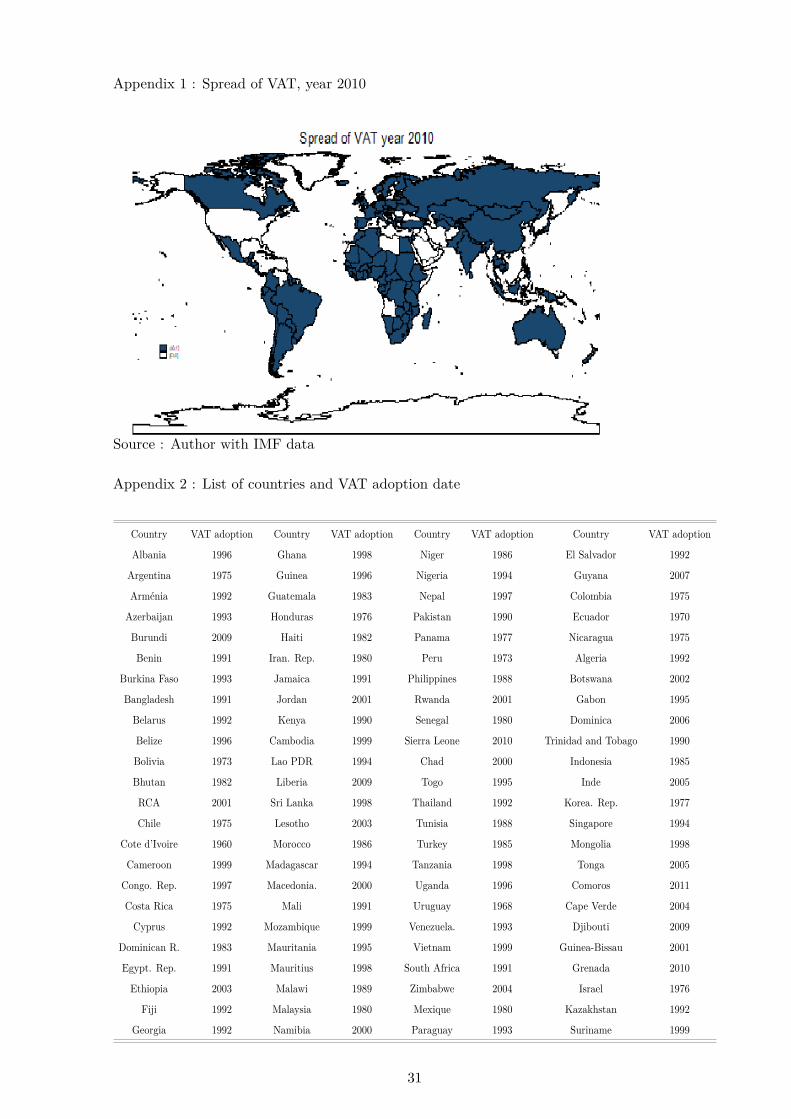
Appendix 1 : Spread of VAT, year 2010
Source : Author with IMF data
Appendix 2 : List of countries and VAT adoption date
Country VAT adoption Country VAT adoption Country VAT adoption Country VAT adoption
Albania 1996 Ghana 1998 Niger 1986 El Salvador 1992
Argentina 1975 Guinea 1996 Nigeria 1994 Guyana 2007
Arménia 1992 Guatemala 1983 Nepal 1997 Colombia 1975
Azerbaijan 1993 Honduras 1976 Pakistan 1990 Ecuador 1970
Burundi 2009 Haiti 1982 Panama 1977 Nicaragua 1975
Benin 1991 Iran. Rep. 1980 Peru 1973 Algeria 1992
Burkina Faso 1993 Jamaica 1991 Philippines 1988 Botswana 2002
Bangladesh 1991 Jordan 2001 Rwanda 2001 Gabon 1995
Belarus 1992 Kenya 1990 Senegal 1980 Dominica 2006
Belize 1996 Cambodia 1999 Sierra Leone 2010 Trinidad and Tobago 1990
Bolivia 1973 Lao PDR 1994 Chad 2000 Indonesia 1985
Bhutan 1982 Liberia 2009 Togo 1995 Inde 2005
RCA 2001 Sri Lanka 1998 Thailand 1992 Korea. Rep. 1977
Chile 1975 Lesotho 2003 Tunisia 1988 Singapore 1994
Cote d’Ivoire 1960 Morocco 1986 Turkey 1985 Mongolia 1998
Cameroon 1999 Madagascar 1994 Tanzania 1998 Tonga 2005
Congo. Rep. 1997 Macedonia. 2000 Uganda 1996 Comoros 2011
Costa Rica 1975 Mali 1991 Uruguay 1968 Cape Verde 2004
Cyprus 1992 Mozambique 1999 Venezuela. 1993 Djibouti 2009
Dominican R. 1983 Mauritania 1995 Vietnam 1999 Guinea-Bissau 2001
Egypt. Rep. 1991 Mauritius 1998 South Africa 1991 Grenada 2010
Ethiopia 2003 Malawi 1989 Zimbabwe 2004 Israel 1976
Fiji 1992 Malaysia 1980 Mexique 1980 Kazakhstan 1992
Georgia 1992 Namibia 2000 Paraguay 1993 Suriname 1999
31
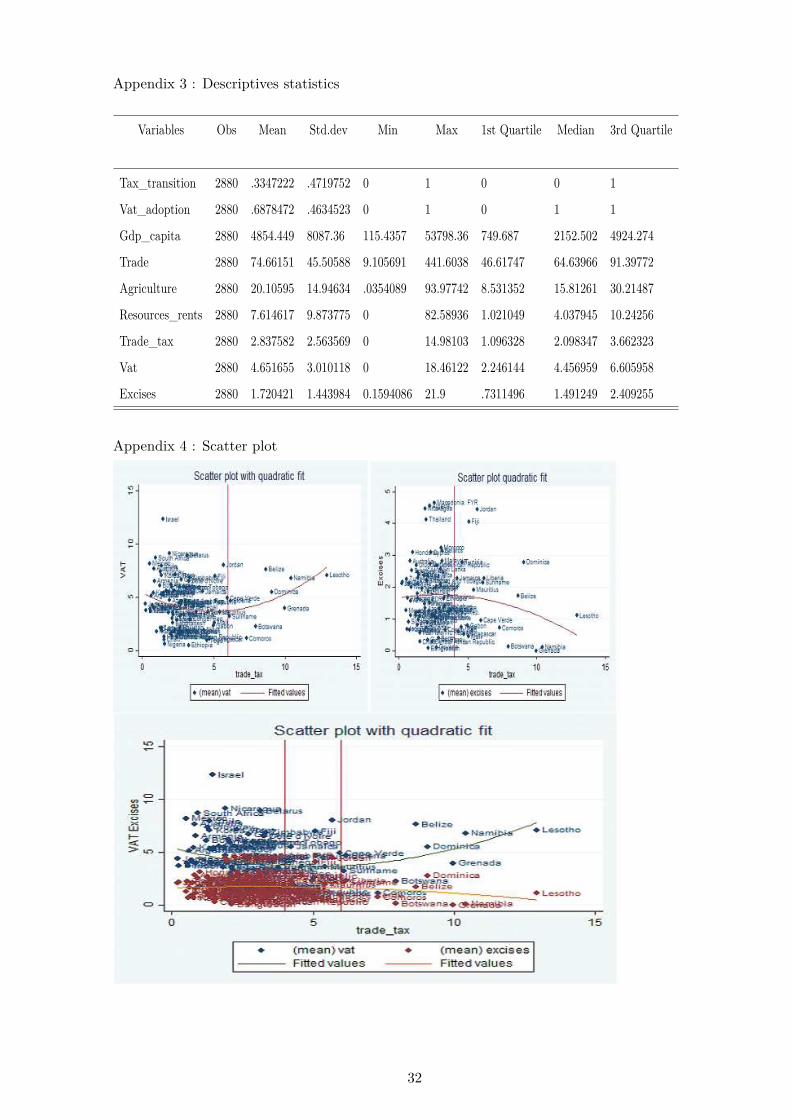
Appendix 3 : Descriptives statistics
Variables Obs Mean Std.dev Min Max 1st Quartile Median 3rd Quartile
Tax_transition 2880 .3347222 .4719752 0 1 0 0 1
Vat_adoption 2880 .6878472 .4634523 0 1 0 1 1
Gdp_capita 2880 4854.449 8087.36 115.4357 53798.36 749.687 2152.502 4924.274
Trade 2880 74.66151 45.50588 9.105691 441.6038 46.61747 64.63966 91.39772
Agriculture 2880 20.10595 14.94634 .0354089 93.97742 8.531352 15.81261 30.21487
Resources_rents 2880 7.614617 9.873775 0 82.58936 1.021049 4.037945 10.24256
Trade_tax 2880 2.837582 2.563569 0 14.98103 1.096328 2.098347 3.662323
Vat 2880 4.651655 3.010118 0 18.46122 2.246144 4.456959 6.605958
Excises 2880 1.720421 1.443984 0.1594086 21.9 .7311496 1.491249 2.409255
Appendix 4 : Scatter plot
32

Appendix 4
To estimate tax potential we run an auxilliary regression of tax revenue on structural factors
that determine tax revenue , namely income per capita, the level of trade openness, the sectoral
composition of the economy by adding the ratio of agriculture value added to GDP, and finally
their dependence on natural resource sector. Specifically we estimate the following regression
Tax_revenueit = β0+β1∗Gdp_capitait−1+β2∗Trade_opennessit+β3∗Agriculture_value_addedit+
β4 ∗ Resource_rentsit + µi + ξit(4)
The predicted tax revenue from this regression out of any tax policy considerations are country’s
tax potential. Tax efforts that take into account the effectiveness of tax policy measures, leads
to a deviation of tax revenue from its potential. Thus, lets call the predicted value of tax revenue
from this model: ̂Tax_revenueit.
Tax effort is the difference between tax revenue and tax potential and it is due to the tax system
and tax policy of countries. If it is positive, countries have revenue over their potential and in
the case it is negative they do not approach yet their potential of revenue du to ineffective tax
policies.Tax_effortit = Tax_revenueit − ̂Tax_revenueit (5)
The advantage is that tax potential is endogeneously determined in our model and can reflect
properly each country’s norm of tax revenue.
33


![Prac excises 3[1].5](https://img.pdfslide.us/doc/110x75/55a601581a28abbf498b46ba/prac-excises-315-55b0fabbed9a7.jpg)