Embed Size (px)
Citation preview

1
Tax Structures in Developing Countries: Many Puzzles and a Possible Explanation
by
Roger Gordon and Wei Li* UCSD and University of Virginia
March, 2005
Abstract: Tax policies seen in developing countries are puzzling on many dimensions. To begin with, revenue/GDP is surprisingly small compared with that in developed economies. Taxes on labor income play a minor role. Taxes on consumption are important, but effective tax rates vary dramatically by firm, with many firms avoiding taxes entirely by operating through cash in the informal economy and others facing very high liabilities. Taxes on capital are an important source of revenue, as are tariffs and seignorage, all contrary to the theoretical literature. In this paper, we argue that all of these aspects of policy may be sensible responses if a government is able in practice to collect taxes only from those firms that make use of the financial sector. Through use of the financial sector, firms generate a paper trail, facilitating tax enforcement. The threat of disintermediation then limits how much can be collected in taxes. Taxes can most easily be collected from the firms most dependent on the financial sector, presumably capital-intensive firms. Given the resulting differential tax rates by sector, other policies would sensibly be used to offset these tax distortions. Tariff protection for capital-intensive firms is one. Inflation, imposing a tax on the cash economy is another.
Keywords: tax policy in developing countries, informal economy, inflation, tariffs, red tape, capital taxes, corruption JEL codes: H21,O23, O17, F23,F13
* We would very much like to thank participants at seminars at Harvard, MIT, the Boston Fed, NBER, the IMF, Berkeley, Michigan Law School, and particularly Sören Bo Nielsen for helpful comments on an earlier draft. We would also like to thank the World Bank for financial support for this project.

2
The past academic literature on tax policy has focused almost entirely on the analysis of
tax structures in the richest countries, particularly the U.S. Overall the optimal tax
models explain reasonably well the observed tax policies in these countries. As
summarized in Gordon (2000), for example, past theoretical work suggests tha t taxes on
consumption or labor income should dominate use of capital income taxes in open
economies under plausible assumptions. Consistent with this, value-added taxes,
personal income taxation of labor income, and payroll taxes are the most important
sources of revenue in many countries. Even under the income tax, a large fraction of
personal savings in practice is tax exempt.1
Of course there are some deviations between the forecasts from models of optimal policy
and observed government policies even in the richest countries. For example, Friedman
(1969) argued that the optimal inflation rate should be negative (to bring nominal interest
rates down to zero), whereas observed inflation rates have been positive even if relatively
low.2 Optimal tariffs should be close to zero, given that countries rarely have much
market power in particular commodities beyond what individual firms have. Tariffs in
the past have been large, but with GATT and now the WTO, tariffs at least among
developed countries are indeed very low.
Tax policies in developing countries are much more puzzling, however. These
differences are laid out in more detail in section 1. To begin with, poorer countries
collect on average only two-thirds or less of the amount of tax revenue that richer
countries do, as a fraction of GDP. Yet, given the severe needs for investments in say
infrastructure and education in these countries, is it plausible that the lack of revenue
simply represents differing tastes for public vs. private goods in poor vs. rich countries?
While the personal income tax is the dominant source of tax revenue among richer
1 The largest investments for most people are their house, consumer durables, and pension. The return on these forms of saving is largely exempt from tax in most countries. Gordon, Kalambokidis, and Slemrod (2004ab) report evidence that the U.S. collects little or no net revenue from taxes on capital income, and imposes much lower distortions on investment and savings decisions than it at first appears given the statutes. 2 Feldstein (1997) calculated a large efficiency gain from lowering the inflation rate towards zero, even from a lo w positive initial level, due to the lack of correction for inflation in the measurement of taxable income.

3
countries, it is only a minor source of revenue among the poorest countries. Instead, the
corporate income tax is a much more important source of tax revenue, as are tariffs and
seignorage. Yet the existing optimal tax theories argue that tariffs and seignorage are
particularly poor sources of tax revenue, while distortions to investment incentives
created by a corporate tax should also be avoided.
A natural starting point in explaining these differences in tax policy is greater tax
enforcement problems in poorer countries. One important issue largely neglected in
existing optimal tax models is the effects of the tax structure on the size of the informal
(underground) economy. According to the estimates reported in Schneider and Enste
(2000), the informal economy on average is only about 15% of GDP among OECD
countries, so small enough that it should not be a driving factor in the choice of tax
structure. However, among developing countries, the median size of the informal
economy they report is 37% of GDP, ranging from 13% in Hong Kong and Singapore to
71% in Thailand and 76% in Nigeria.
The huge variation in the size of the informal sector across countries suggests that any
effects of the tax structure, or of government policies more generally, on the size of the
informal sector can be of first-order importance in the choice of these policies. Yet at
this point, we know relatively little about how policies affect the size of the informal
sector.
The objective of this paper is to explore the implications of a specific hypothesis about
the factors affecting the choice of a firm whether to be part of the formal or the informal
economy. We show that adding this hypothesis to an otherwise standard optimal tax
model can easily explain each of the above differences in policies between poor and rich
countries, along with a variety of other differences in observed policies.
The key assumption in the paper is that firms can avoid tax payments in any country by
shifting entirely to cash transactions and not using the financial sector, thereby avoiding

4
leaving any paper trail.3 When firms make use of the financial sector, in contrast, the
government can gain access to their bank records and use this information in enforcing
the tax law. 4 Firms then have to choose whether the economic benefits from use of the
financial sector are greater or less than the resulting tax liabilities. Poorer countries differ
from richer countries under our hypothesis simply because the value firms receive from
using the financial sector is much more modest.
When the value from using the financial sector is low, the government needs to worry
about possible disintermediation and the resulting loss of its tax base when choosing its
tax structure. This threat of disintermediation not only can keep tax rates low, but can
also have important effects on the design of the tax structure, and on government policies
more generally.
We presume, for example, that capital- intensive firms are more dependent on the
financial sector, allowing the government to impose higher taxes on them without
inducing disintermediation. In poorer countries, taxes do seem to be paid far more
heavily by capital- intensive firms than by the rest of the economy. Relying more heavily
on corporate income taxes is one means of focusing tax collection on the firms that are
most dependent on the financial sector.
With the resulting much higher effective tax rates on capital- intensive firms, one would
expect to see fewer capital- intensive firms. This is not at all apparent given the data,
suggesting that there are policies in place to protect these firms, and thereby protect the
government’s tax base. An example would be tariff protection for industries dominated
by capital- intensive firms. Another policy that implicitly favors these firms is inflation.
Firms that use the financial sector are largely protected from inflation, whereas those
firms that rely on cash transactions so as to evade tax are thereby vulnerable to inflation. 3 Cash transactions are extremely hard to monitor even in the richest countries. Likely for this reason, illegal activity seems to rely heavily on cash transactions. 4 Among the richest countries, governments rely on firms to provide information about individual wage and dividend incomes, and then on accounting reports and tax audits both to double-check these reports by firms on individual earnings and to document each firm’s own earnings. Accounting firms and tax audits, in turn, rely heavily on the records of a firm’s transactions through the financial sector, making these records a key underlying source of information supporting most forms of taxes.

5
Policies may sensibly encourage or hinder investments by multinationals, depending on
the government’s ability to tax multinationals vs. competing domestic firms. There may
even be an efficiency gain from introducing red tape hindering activity in the untaxed
sector. Of course, policies hindering entry of new firms may in the process harm
economic growth, as argued by Schumpeter (1942). Without protecting its tax base,
however, a government may not be able to afford basic government services in the
present.
As the financial sector improves in effectiveness, more firms will be pulled into using it
in spite of the tax implications of doing so. With a broader and less elastic tax base, tax
policy can shift towards the types of policies seem in developed countries, and
recommended by the traditional optimal tax literature. With a broader tax base, there is
less need for policies hindering entry and growth of new firms. Our paper therefore
provides an additional rationale for the empirical evidence surveyed in Levine (2004)
linking improvements in the financial sector and economic growth. It in fact suggests
that improvements in the financial sector may be a prerequisite for fundamental tax
reform.
Section 2 develops the basic model for the choice of tax structure, given the threat of
disintermediation. Section 3 explores a variety of supplementary policies a government
can use to protect its tax base.
Section 4 then provides a brief discussion of a related puzzle why state-owned banks are
so common among poorer countries. What compensates for the presumed resulting
efficiency loss from public ownership? Since the government needs to rely on banks to
gather information about firms, it needs some controls to assure access to this
information. Direct ownership is one approach. In addition, direct ownership may be
valuable in order to discourage lending to untaxed firms, and perhaps to induce lending to
taxed firms even when the bank loses money, given the gains to the government from the
resulting tax revenue on the new investment.

6
Finally, section 5 provides a brief summary and discussion.
1. Data on tax policies in poor vs. rich countries
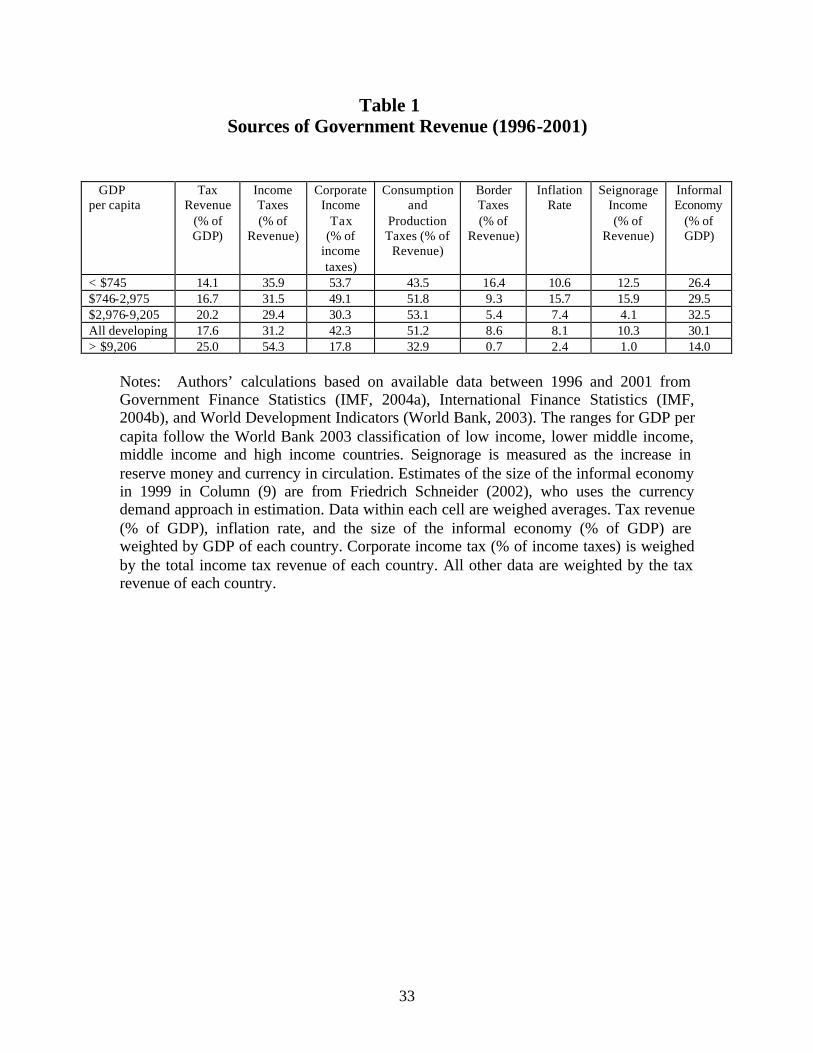
Table 1 compares the sources of tax revenue among countries of different income levels.
To begin with, as seen in the Table, the poorest countries collect two-thirds or less of the
revenue collected in the richer countries, as a fraction of GDP.
Among the richest countries, the main sources of revenue are the personal income tax
(42.7% = 54.3%(1-.178) of revenue) and various types of consumption taxes (32.9% of
revenue). Consumption taxes are even more important among the poorest countries
(51.2% of their lower tax revenue), but the personal income tax is of minor importance,
collecting only 14.3% of tax revenue. Instead, the corporate income tax is much more
important (19.3% of revenue, compared with 9.7% in richer countries), and tariffs are
also important (16.4% of revenue, compared with a trivial fraction in richer countries).
As seen in the Table, seignorage represents a major nontax source of revenue among the
poorest countries (12.5% of tax revenue, compared with 1.0% in richer countries). As a
result, inflation rates among the poorest countries on average tend to be much higher.
These sharp differences in sources of tax revenue do not seem to correspond to sharp
differences in statutory tax rates between poor and rich countries, however. Among a
limited set of countries where we have been able to acquire data, listed in Table 2, the
average maximum statutory tax rates under the VAT are very close among poor vs. rich
countries (14.7% vs. 16.2%). The average maximum corporate tax rates are also very
close (26.7% vs. 29.6%), while the maximum personal tax rates are not that different
(34.7% vs. 42.8%).
The effective tax rates, though, must be very different given the lower fraction of GDP
collected by these taxes among poorer countries, presumably due to their much larger
informal economies. As seen in Table 1, estimates of the size of the informal economy

7
are on average more than twice as large in poorer countries than in richer countries. As a
simple summary description of how tax revenue relates to these tax rates, we regressed
(tax revenue)/GDP against the maximum VAT rate and the minimum of the top personal
and corporate tax rates,5 focusing separately on data from poorer and richer countries. If
countries are otherwise the same, but simply differ in their tax rates, then the coefficient
on each tax rate should equal the size of the tax base, as a fraction of GDP, multiplied by
the ratio of the average to the maximum tax rate.
Using data from the richer countries (18 observations), results seem quite sensible:
Revenue/GDP = .06 + .46 min(t,t) + .58 s, R2=0.42
(.07) (.20) (.19)
Here, t is the maximum personal tax rate, t is the maximum corporate tax rate, while s is
the maximum consumption tax rate. Consider, for example, the coefficient of .58 on s. If
the consumption tax base on average were roughly 2/3’s of GDP, then the implied
effective tax rate is (.58/.67)s = .87 s. Given the common use of lower tax rates on
services and necessities such as food, this estimate seems quite reasonable. The
coefficient of .46 on the minimum income tax rate also seems plausible, given the
frequent use of a progressive rate structure under the personal income tax, leading to an
average tax rate much below the maximum statutory rate.
With data from poor countries (25 observations), in contrast, results are dramatically
different:
Revenue/GDP = .22 - .23 min(t,t) + .22 s, R2=0.38
(.03) (.07) (.09)
5 Our motivation for focusing on the minimum of the personal and corporate income tax rates is the apparent ease of shifting income between the corporate and personal tax bases, as documented for example in Gordon and Slemrod (2000). If this income shifting is sufficiently costless, then only the minimum rate matters. When we add the maximum tax rate, it has a tiny and insignificant coefficient. When we include both corporate and personal tax rates separately, the qualitative results are the same, but the fit is not as good.

8
One possible explanation for the lower coefficient on s is that the average VAT rate is
much below the maximum statutory tax rate, perhaps because the underground economy
is often very large in poorer countries. The negative coefficient on the income tax rate,
however, suggests reverse causation: when revenue is very low due to a large
underground economy, statutory tax rates become higher to collect more from the few
firms that remain part of the taxed sector. These are certainly the interpretations we will
suggest based on the theory described next.
2. Tax policy when information is limited
Optimal Sales Tax Rates
Existing models deriving optimal tax policy typically assume that the government can
observe the income earned by all factors and by all firms, even if underlying ability is not
observable. How do forecasts for the optimal tax policy change if the existence of an
informal economy able to evade tax is taken into account explicitly?
Consider the following highly stylized setting. The economy consists of a collection of
industries. Firms in industry j have a Cobb-Douglas production function jbj
jbjj LKf
−≡
1,
where jf denotes industry output, jK denotes the industry’s capital stock, and jL its
labor inputs.
There is free entry to each industry, so that each firm earns zero net-of-tax profits in
equilibrium. If a firm does not make use of the financial sector,6 using cash for all
transactions, it leaves no paper trail. As a result, we assume that the government does not
observe anything about the firm, including its existence, so cannot impose any taxes on it.
6 We simplify the analysis by assuming that firms in an industry use banks for either all or none of their transactions.

9
Profits for such a firm then equal jjjj wLrKfp −−* , where *jp is the output price in
industry j, set on the world market,7 r is the local interest rate, and w is the local wage
rate.
If a firm in industry j does use a financial intermediary, doing so increases its output by
the fraction ja ,8 so that output becomes jj fa )1( + , and pretax profits become
jjjjj wLrKfpa −−+ *)1( . If firms in the industry do choose to use banks, then the
government can observe all its transactions through auditing the banks’ records. It can
then impose taxes based on this information. Consider first the optimal use of sales taxes
at rate js on each industry j .
If the sales tax is collected whether output is sold abroad or on the domestic market, as
we assume, then *)1( jjj pps =+ , where jp is the price domestic firms now receive, net
of the sales tax payment. The resulting tax revenue equals ∑ ∑=∈ ∈Tj Tj
jjjjjj fpsfps ** ,
where )1/(*jjj sss += and where T describes the set of industries that make use of
banks, so are taxable.
If all firms use banks, then we are back to the standard framework in which the
government can observe and tax all sales. Let jβ =1 if the firms in industry j use banks,
with 0=jβ otherwise.
Given these assumptions, each firm acts to maximize expected net-of-tax profits, so
chooses factor inputs and jβ based on:
7 We assume the country is small, so is a price taker in world markets. While we allow for free trade in goods, we assume no capital flows and for the moment no foreign direct investment. 8 In principle, ja can be negative. This could occur when firms fear that the banks will abscond with their
funds, or at least limit their ability to withdraw cash when needed.

10
( )jjjjjjjjjjKL wLrKfaspfpjjj
−−+−+− )1)(1()1(max ***,, βββ
Firms that use banks choose capital inputs so that )]1)(1/[(/ **jjjjj asrKfp +−=∂∂ ,
while rKfp jj =∂∂ /* otherwise, with comparable equations determining labor inputs.
Firms will choose to use banks if and only if doing so raises their net profits, so if and
only if 1)1)(1( * >−+ jj sa , in which case
(1) j
jj a
as
+<
1* .
Put simply, firms use banks when the economic gain from use of the financial sector
outweighs the resulting loss from being subject to the sales tax, even given that these
economic gains are themselves subject to the sales tax. If the sales tax rate in industry j
violates this inequality, then it would induce disintermediation in this industry, and
collect no revenue.
Equation (1) then represents an implicit constraint that optimal sales tax rates should
satisfy. If the tax rate in any industry is raised high enough to induce disintermediation,
then there is a discrete drop in tax revenue from that industry with no resulting gains to
firms in the industry, so a Pareto loss. These constraints are the key additional feature
characterizing optimal tax rates once the possibility of disintermediation and the resulting
tax evasion is taken into account.
These constraints have immediate implications for the variation of sales tax rates within a
country, and also for variation in average sales tax rates across countries. Regarding the
latter, countries in which the ja ’s are systematically larger, so in which the financial
sector provides greater value-added to firms, can feasibly impose higher sales tax rates
without inducing disintermediation and a loss of its tax base. While the inequality
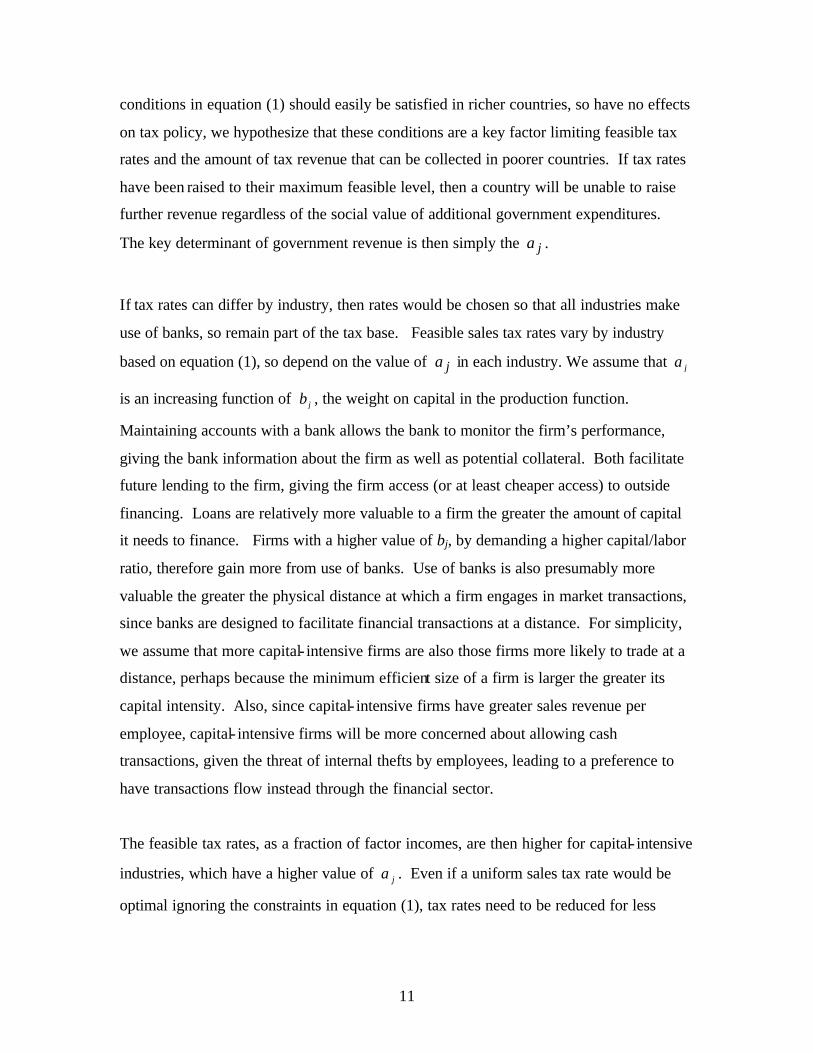
11
conditions in equation (1) should easily be satisfied in richer countries, so have no effects
on tax policy, we hypothesize that these conditions are a key factor limiting feasible tax
rates and the amount of tax revenue that can be collected in poorer countries. If tax rates
have been raised to their maximum feasible level, then a country will be unable to raise
further revenue regardless of the social value of additional government expenditures.
The key determinant of government revenue is then simply the ja .
If tax rates can differ by industry, then rates would be chosen so that all industries make
use of banks, so remain part of the tax base. Feasible sales tax rates vary by industry
based on equation (1), so depend on the value of ja in each industry. We assume that ja
is an increasing function of jb , the weight on capital in the production function.
Maintaining accounts with a bank allows the bank to monitor the firm’s performance,
giving the bank information about the firm as well as potential collateral. Both facilitate
future lending to the firm, giving the firm access (or at least cheaper access) to outside
financing. Loans are relatively more valuable to a firm the greater the amount of capital
it needs to finance. Firms with a higher value of bj, by demanding a higher capital/labor
ratio, therefore gain more from use of banks. Use of banks is also presumably more
valuable the greater the physical distance at which a firm engages in market transactions,
since banks are designed to facilitate financial transactions at a distance. For simplicity,
we assume that more capital- intensive firms are also those firms more likely to trade at a
distance, perhaps because the minimum efficient size of a firm is larger the greater its
capital intensity. Also, since capital- intensive firms have greater sales revenue per
employee, capital- intensive firms will be more concerned about allowing cash
transactions, given the threat of internal thefts by employees, leading to a preference to
have transactions flow instead through the financial sector.
The feasible tax rates, as a fraction of factor incomes, are then higher for capital- intensive
industries, which have a higher value of ja . Even if a uniform sales tax rate would be
optimal ignoring the constraints in equation (1), tax rates need to be reduced for less

12
capital- intensive industries when equation (1) becomes binding, and then perhaps raised
for more capital- intensive industries to compensate for the resulting loss in tax revenue.
Industries, as defined in practice under the tax law, are inevitably heterogeneous,
however. Any increase in a sales tax rate for a broad group of industries will then cause
some disintermediation, adding a new source of excess burden beyond those commonly
considered. The more elastic the extent of disintermediation at the margin, the higher the
marginal excess burden from a rate increase, everything else equal.
The global optimum could in theory involve very high tax rates with a very narrow tax
base, depending on parameters. For example, if one set of firms would always use the
banking system, then a very high *is in principle can collect substantial revenue from
these firms at the cost of collecting little or nothing from other firms. Lowering the tax
rate by enough to pull more firms into the tax base may lower overall tax revenue too
much to be attractive. Optimal tax rates can be very high, in spite of the threat of
disintermediation.
Optimal Use of Capital Taxes
Capital taxes can help collect additional revenue while leaving unchanged or reducing the
degree of disintermediation. To see this, start from the above setting with positive sales
tax rates in all industries. Within a given industry j with heterogeneous firms, for any
given initial sales tax rate *js , there should be some *
jb at which a firm is just indifferent
to using banks. Any firm k in this industry with *jjk bb > will use banks, and
conversely. 9 Consider introducing a marginal tax rate, Kt , on capital, with a
compensating marginal cut in *js just sufficient to leave net profits unchanged for firms
with =b *jb . Given the Cobb-Douglas assumption, this implies that
9 Firms with *
jjk bb < then continue to evade taxes.

13
)1(/ ***jjKj sbts −−=∂∂ . With these combined tax changes, firms with =b *
jb by
construction remain ind ifferent to using banks.
Starting from a setting with 0=Kt , tax revenue from firms with *jbb = is also
unchanged. Tax payments by any firm k with *jjk bb > go up, however, due to these
combined tax changes. Starting from 0=Kt , the marginal change in tax payments
equals
])1)()[(1(])[1( *****
*
K
jkjjkjjjkjj
K
jkj
K
jjkjjjk t
fsfsbbap
tf
sts
faprK∂∂
+−−+=∂∂
+∂∂
++ ,
given that jkjjjjkjk fapsbrK )1()1( ** +−= with a Cobb-Douglas production function.
Since by construction *jjk bb > , the first term is positive. This outweighs the second
term as long as the effective tax rate on firm k is below the rate at the top of the Laffer
curve.10 Intuitively, since these other firms are more capital intensive, the cut in the sales
tax rate is not sufficient to offset the increase in the tax on capital expenditures. This
marginal tax change will not induce any disintermediation, since these firms discretely
gained from use of banks. There is no marginal excess burden from distortions to
capital/labor ratios, since the tax change is imposed at a point where this choice is
efficient. Introducing a small tax on capital income therefore raises more revenue while
leaving unchanged the extent of disintermediation.
Further increases in Kt in principle could eventually induce disintermediation among
some of the more capital- intensive firms within the industry. To judge when this might
occur, let )]1)(1/[()1( **jjK satrr −++≡ and )]1)(1/[(* *
jj saww −+= represent the
effective factor prices. Then with a Cobb-Douglas production function, the unit cost
equals bbbb wrbb −−−− − 1**)1( )()()1( . Using banks continues to be attractive for any firm
with *jbb > if and only if
10 Throughout, we assume that the tax rate remains below the rate at the peak of the Laffer curve.
14
1)1))((1(
)1(*
<−+
+
jj
bK
sbat
for all *jbb > , given that by definition this equation is just satisfied for firms with *
jbb = .
This condition is equivalent to the condition
(2) )*(
*)1(
)(1
)(1 jbbK
jj
j tba
ba −+>
+
+
holding for all *jbb > .11
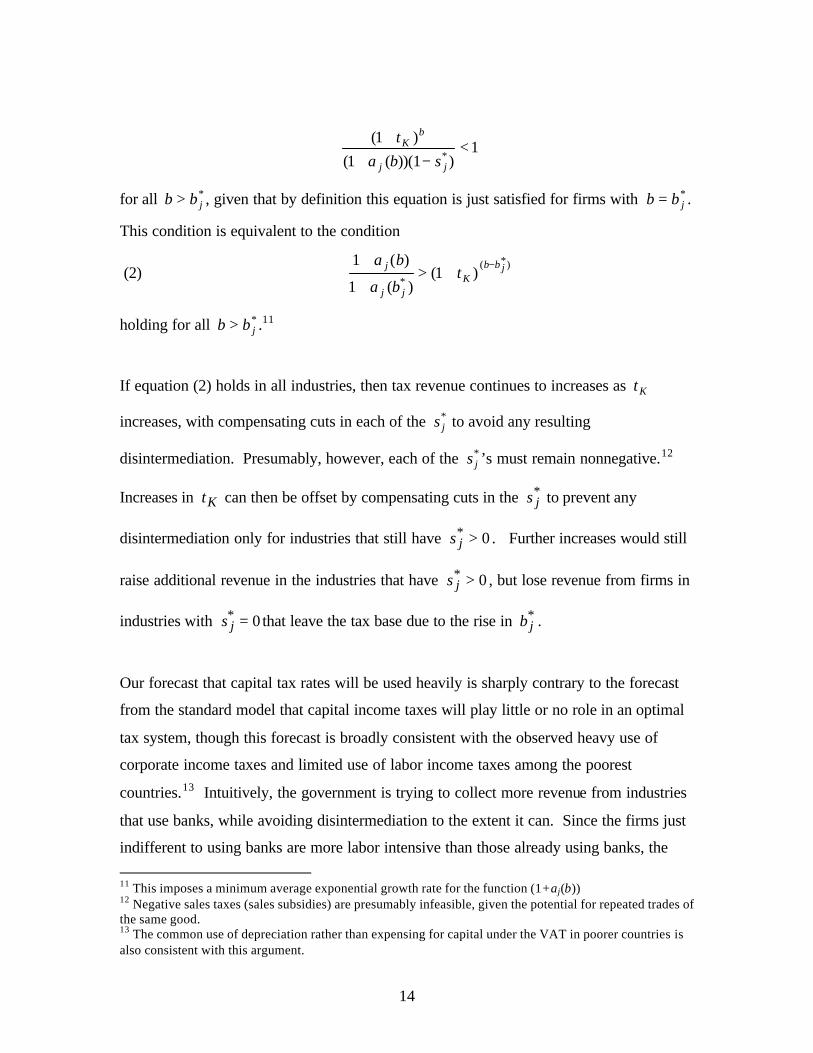
If equation (2) holds in all industries, then tax revenue continues to increases as Kt
increases, with compensating cuts in each of the *js to avoid any resulting
disintermediation. Presumably, however, each of the *js ’s must remain nonnegative.12
Increases in Kt can then be offset by compensating cuts in the *js to prevent any
disintermediation only for industries that still have 0* >js . Further increases would still
raise additional revenue in the industries that have 0* >js , but lose revenue from firms in
industries with 0* =js that leave the tax base due to the rise in *jb .
Our forecast that capital tax rates will be used heavily is sharply contrary to the forecast
from the standard model that capital income taxes will play little or no role in an optimal
tax system, though this forecast is broadly consistent with the observed heavy use of
corporate income taxes and limited use of labor income taxes among the poorest
countries.13 Intuitively, the government is trying to collect more revenue from industries
that use banks, while avoiding disintermediation to the extent it can. Since the firms just
indifferent to using banks are more labor intensive than those already using banks, the 11 This imposes a minimum average exponential growth rate for the function (1+aj(b)) 12 Negative sales taxes (sales subsidies) are presumably infeasible, given the potential for repeated trades of the same good. 13 The common use of depreciation rather than expensing for capital under the VAT in poorer countries is also consistent with this argument.

15
marginal firms are relatively more concerned about sales tax rates, compared with capital
tax rates, than the inframarginal firms. Cutting sales tax rates and raising capital tax rates
therefore can raise revenue without inducing disintermediation.
A similar argument might be made for imposing a labor income tax on just the highest
earners. Like a tax on capital income, this would help focus taxes on firms most tied to
using the financial sector if high-skilled workers are complementary with capital in
production.
Optimal Use of Tariffs
So far, we have ignored the possibility of taxes on imports or exports. When would trade
distortions be used, assuming as before that the country is a price-taker in the world
market for all goods? With no constraints on sales tax rates on consumer goods, then the
results in Diamond-Mirrlees (1971) forecast production efficiency, requiring that the
relative prices faced by domestic producers equal those prevailing on the world market.
When tax rates are constrained by the threat of disintermediation, though, forecasts
change. In particular, when domestic sales tax rates are high in some industries, and low
in others, then there is an efficiency gain from using tariffs to shift domestic production
towards the highly taxed industries. Such tariffs necessarily change relative consumer
prices, however, which may or may not be desired.
To consider these questions more formally, assume for simplicity that, ignoring tariffs,
the country would produce nonzero amounts of two homogeneous goods.14 Capital
expenditures are taxed at some rate Kt , while conditional on Kt each industry faces a
maximum sales tax rate maxis , with max
2max1 ss < .15 Assume that the country exports the
14 This in fact is stronger than is needed. We only need to assume that both goods are produced at the equilibrium tariff rate. 15 With 0>kt , equation (1) becomes ).1/(])/1(1[max
ib
kiiartas ++−+=

16
first good, and imports the second good. Imports of good 2 are subject to a tariff at rate
2τ , while exports of the first good are untaxed.
Denote imports of the second good by 2M , and denote domestic consumption of the two
goods by iC . Domestic consumer prices then equal *1p and )1( 2
*2 τ+p , while the prices
faced by domestic producers equal )1( *1
*1 sp − and )1)(1( *
22*2 sp −+ τ . To simplify
notation, let 1*
1 ff ≡ and 22*
2 )1( ff τ+≡ , where fi continues to denote domestic output in
industry i.
In setting tax and tariff rates, we follow convention and assume that the government is
maximizing a standard representation of social welfare:16
(3)
∑ ++++=i
Kiiis MpKtfpsUrwppVWi
)(),),1(,(max 2*22
***2
*2
*1, 2
* τττ
=
−++ ∑
iiiis
CfpUrwppVi
))((),),1(,(max *2
*2
*1, 2
* ττ
.
Here, (.)V is the indirect utility a representative resident receives from private sector
activity, U(.) represents the utility from public expenditures, and K is the aggregate
capital stock. Given the overall domestic budget constraint, government tax revenue
equals the value of domestic output at world prices net of the value of domestic
consumption: ∑ −i
iii Cfp )(* . The government maximizes this subject to the constraint
that max*ii ss < , for any given Kt .
The resulting first-order condition for 2τ is
(4)
∂∂
−∂∂
−=
∂∂
−∂∂
∑22
2*2
22
*'ττττw
Lr
KCpVCf
pU Iii
ii
)( 2*22
*2 fsMpVI +=
16 A Leviathan government is a special case in which .0≈V
17
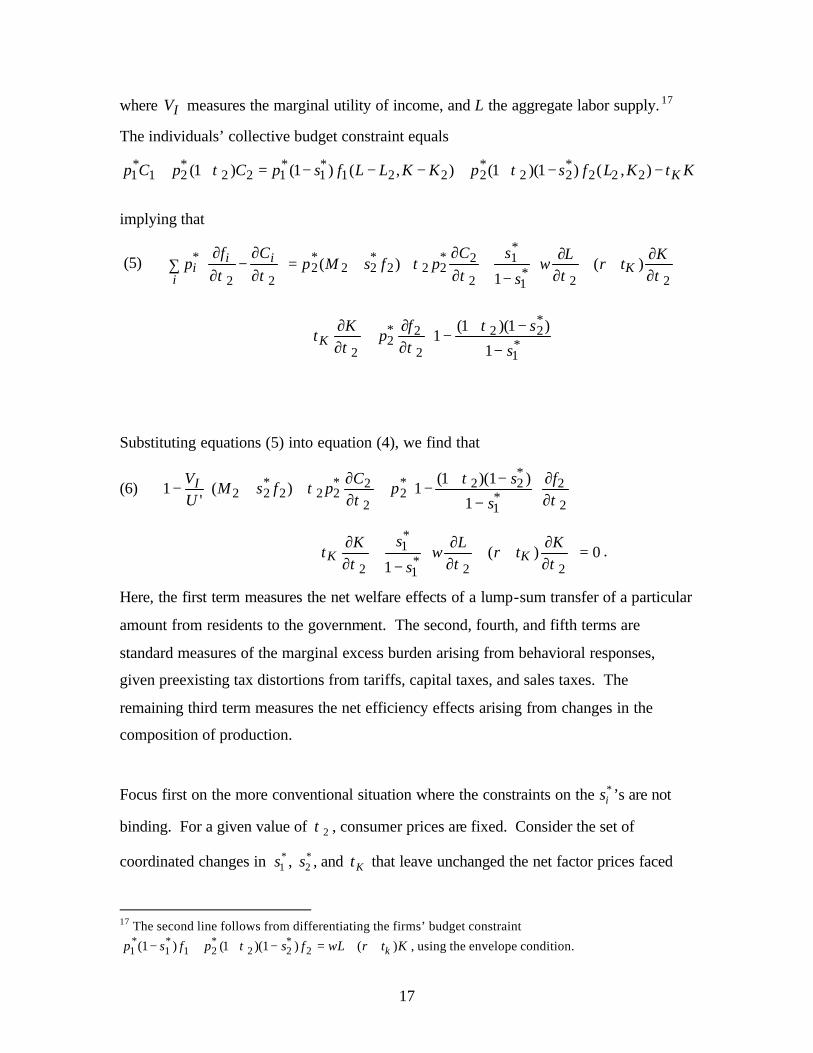
where IV measures the marginal utility of income, and L the aggregate labor supply. 17
The individuals’ collective budget constraint equals
KtKLfspKKLLfspCpCp K−−++−−−=++ ),()1)(1(),()1()1( 222*22
*2221
*1
*122
*21
*1 ττ
implying that
(5) ∑
∂∂
++∂∂
−+
∂∂
++=
∂∂
−∂∂
iK
iii
Ktr
Lw
s
sCpfsMp
Cfp
22*1
*1
2
2*222
*22
*2
22
* )(1
)(τττ
τττ
−
−+−
∂∂
+∂∂
+ *1
*22
2
2*2
2 1
)1)(1(1
s
sfp
KtK
τττ
Substituting equations (5) into equation (4), we find that
(6) 2
2*1
*22*
22
2*222
*22
1
)1)(1(1)(
'1
ττ
ττ
∂∂
−
−+−+
∂∂
++
−
f
s
sp
CpfsM
UVI
0)(1 22*
1
*1
2=
∂∂
++∂∂
−+
∂∂
+τττK
trL
ws
sKt KK .
Here, the first term measures the net welfare effects of a lump-sum transfer of a particular
amount from residents to the government. The second, fourth, and fifth terms are
standard measures of the marginal excess burden arising from behavioral responses,
given preexisting tax distortions from tariffs, capital taxes, and sales taxes. The
remaining third term measures the net efficiency effects arising from changes in the
composition of production.
Focus first on the more conventional situation where the constraints on the *is ’s are not
binding. For a given value of 2τ , consumer prices are fixed. Consider the set of
coordinated changes in *1s , *
2s , and Kt that leave unchanged the net factor prices faced
17 The second line follows from differentiating the firms’ budget constraint
KtrwLfspfsp k )()1)(1()1( 2*22
*21
*1
*1 ++=−++− τ , using the envelope condition.

18
by individuals (r and w), but affect the composition of production. 18 With any such
combined tax change, the factor and goods prices faced by consumers all remain
unchanged, so that the iC ’s remain unchanged. The composition of production changes,
however. With government revenue equal to ∑ −i
iii Cfp )(* , taxes within this set should
then be chosen to maximize ∑i
ii fp* . This occurs if the relative output prices faced by
firms equal the relative international prices for these goods, requiring that
)1)(1()1( *22
*1 ss −+=− τ . Production would then be efficient at the optimal choices for
*1s , *
2s , and Kt , for any given value of 2τ : this is the Diamond-Mirrlees result.
With unrestricted tax rates, therefore, the third term in equation (6) drops out. The
optimal tariff rate is determined by the remaining terms in equation (6). The
presumption in the optimal tax literature19 is that the optimal commodity tax rates should
be approximately equal, implying that *2
*1 ss ≈ , so that .02 ≈τ 20
When sales tax rates are constrained by equation (1), however, then there are two new
factors pushing for use of tariffs. First, with tax rates constrained, the marginal value of
government revenue rises (the ratio '/UVI falls), raising the value of other sources of
revenue. This has been a common rationale for tariffs in the past.21
18 For example, with a given increase in the tax rate on the labor-intensive sector and a suitably larger increase in the tax rate on the capital-intensive sector, the market clearing wage rate can remain unchanged but the equilibrium value of )1( Ktr + falls. The return to savings, r , can then be left unchanged through a
suitable cut in Kt . However, these combined tax changes cause a shift in production towards the labor-intensive sector. 19 Corlett and Hague (1953) show that optimal commodity tax rates are equal if goods are equally substitutable with leisure, while Atkinson and Stiglitz (1976) show that this holds if the utility function is weakly separable between leisure and consumption. Hatta (1986) shows that any deviation from equal rates should be “small” even if the utility function is unrestricted. 20 Intuitively, given such separability in the utility function, the effects of tariffs on factor supplies are equivalent to what can be accomplished using a particular set of factor taxes yielding the same revenue, so that the first and last two terms in equation (6) together sum to zero. With only the second term remaining, the optimal tariff rate equals zero. 21 See, for example, Campillo and Miron (1997).

19
In addition, as seen in the third term of equation (6), use of tariffs to increase production
of good 2 provides a net gain to the extent that )1)(1()1( *22
*1 ss −+>− τ . By taxing
imports of good 2, domestic production shifts towards the more heavily taxed
commodity, offsetting a preexisting distortion. These gains in production efficiency are
then traded off with net losses from distorting relative consumer prices away from what
would have been desired.
Note that even nontariff barriers may be used, if tariffs are unavailable, e.g. due to
international trade agreements. A marginal increase in nontariff barriers generates no
direct transfer of revenue to the government, eliminating the first two terms in equation
(6). The remaining terms, however, may still justify some level of nontariff barriers, in
order again to shift domestic production towards the more heavily taxed sector.
Yet another way to shift production towards industry 2 is to subsidize inputs used
primarily by industry 2, or tax inputs used primarily by industry 1. An example would be
a subsidy to use of energy. If energy is used much more intensively in capital- intensive
firms, then a subsidy to imports of energy makes industry 2 more profitable, generating a
shift in resources towards industry 2. Such a subsidy is attractive if the net social cost of
the subsidy needed to induce a given marginal increase in 2f is less than the net social
cost of increasing tariff (or nontariff) barriers yet further.
If the more heavily-taxed capital- intensive good is exported instead, so that *2
*1 ss > , then
the third term in equation (6) is negative. If this term is large enough, the optimal tariff
on imports of good 2 can also be negative, lowering the market price of good 2 and
shifting domestic resources into added production of the more heavily taxed good 1.
Whether a country would be expected to encourage or discourage trade can then depend
heavily on whether production of the exported good is taxed at a higher or lower tax rate
than the good competing with imports.
Other Assumptions about Factors Affecting Observability

20
Our assumption that the government can fully observe sales and profits for firms that use
banks is clearly heroic, particularly given the major problems even the U.S. government
has in controlling tax avoidance by large corporations. A weaker assumption is that the
government simply knows of the existence of a firm if it uses a bank. Inspectors can then
visit the firm to learn more, in the process perhaps observing only jK and the number of
workers, say jN .22 Since we argued above that the optimal tax structure would likely
involve heavy taxation of jK , even if jf and jL were also observable, the outcome can
be close to those above. If only the number of workers is observed, though, and not jL or
jf , this does undermine effective use of a sales tax.
Qualitative results also remain largely unchanged if we consider other stylized
descriptions of the source of information for the government tax authorities. Consider for
example the alternative assumption that the government observes a business only if it
owns land (e.g. a mine or oil deposit) and/or operates out of a factory or office building,
giving it a visible fixed location. To translate previous notation, let 1=jβ if a firm owns
a building or land, and assume that having such a fixed place of business raises output by
the fraction ja . If a business is “visible,” assume again that the government can observe
its entire capital stock, jK , and its number of workers, jN . Then the formal
considerations affecting the choice of the tax structure remain exactly the same.
3. Implications for other policies
Inflation Taxes
Many other puzzling policies can easily make sense once the government’s problems
obtaining information about economic activity are recognized. Consider the choice of an
inflation rate. The taxed sector, given that it makes use of the banking sector, is 22 The value of output would be more difficult to observe.

21
presumably largely protected from an inflation “tax,” since in equilibrium its bank
deposits should earn a higher nominal interest rate, reflecting expected inflation. The
untaxed sector, however, by construction relies heavily on cash transactions, making it
particularly vulnerable to an inflation tax.
Since an inflation tax has a much larger impact on the unmonitored sector than on the
taxed sector, it can well generate an efficiency ga in offsetting the costs focused on by
Friedman (1969) and Feldstein (1997). To begin with, inflation raises the costs of
business within the untaxed sector, causing these firms to shrink, leading capital and
labor inputs to be reallocated to the taxed sector. Since there were too few such inputs in
the taxed sector to begin with, due to taxes, this reallocation at the margin is an efficiency
gain. In addition, firms that would otherwise use cash transactions may instead shift to
using banks as intermediaries, in order to avoid these costs. This shift is again an
efficiency gain, due to both the value jj fa provided by financial intermediation and the
elimination of inflation distortions in this sector. These efficiency (and revenue) gains
can easily be large enough to offset the standard losses from inflation, at least for low
rates of inflation. The more responsive is the allocation of resources between the taxed
vs. untaxed sectors to the inflation rate, the stronger the case for a higher inflation rate.
The optimal inflation tax is limited, though, by the possibility that dollars or some other
foreign currency replace the local currency, in order to avoid the inflation tax. Since this
currency substitution provides no further shift in resources towards the taxed sector but
leads to a discrete fall in seignorage revenue, the optimal inflation rate is capped due to
this treat of currency substitution.
With inflation, the country needs to allow for a steady depreciation of the va lue of its
currency in international markets. Any attempts to stabilize the currency, e.g. through a
peg to the dollar or the euro, will undermine use of inflation for domestic purposes.23
23 We thank Haizhou Huang for pointing out this connection to exchange rate policies.

22
Similar arguments can be made for inflation even in a developed economy context.
While the informal/cash economy is much smaller in most developed economies, it still
exists. In addition, illegal activity, e.g. the drug trade, relies on cash transactions heavily
to maintain anonymity. Inflation then provides an alternative way to discourage such
illegal activity, and one that may be cheaper at the margin than additional resources
invested in drug interdiction. These gains must be traded off against the efficiency costs
from an inflation tax in the rest of the economy.
State Ownership of Firms
Given the result from the stylized model above that taxes on capital can become large
when the threat of disintermediation is important, too little capital will be invested in the
taxed sector. As discussed in Gordon, Bai, and Li (1999), one extreme response to this
tax-induced misallocation of capital is state ownership at least of the most capital-
intensive firms, in order to induce these firms to take into account the benefits to the
government from higher tax payments.24 Another response, discussed in Gordon (2003),
is government-subsidized credit to the taxed sector for the purchase of new capital.
While the government loses directly from the subsidized loans to the taxed sector, it gains
from the resulting extra taxes on the new investment, and new production. Even if the
subsidy fully offsets the revenue collected in present value on the new capital investment,
for example, the government can continue to collect revenue on existing capital (and
output) while leaving undistorted the decision to purchase additional capital. These
subsidies confined to firms in the taxed sector can also induce more firms to join the
taxed sector.
Restrictions on Multinationals
The model also suggests particular types of restrictions on the activity of foreign
multinationals within a country. Multinationals would certainly be part of the taxed
sector, if only because a multinational’s home country will require accounting firms to
24 Such state ownership in poorer countries of large capital-intensive firms is quite common.

23
document the income and balance sheet of the local subsidiary, records that should be
available to the host government. However, the multinational has many opportunities to
shift real and financial activity across countries, depending on relative tax rates, e.g.
through use of transfer pricing.25 These income-shifting opportunities are not as readily
available to domestic firms within the host country. 26
The impact of multinationals on domestic tax revenue depends on the taxes they pay
compared with the revenue lost from the resulting crowding out of domestic taxable
activity. 27 If multinationals sell goods to domestic residents otherwise produced by
taxable domestic firms, then their effect on domestic tax revenue depends on the relative
taxes paid by the multinationals compared to domestic firms as a fraction of sales. Due
to their greater income-shifting opportunities, multinationals would commonly pay a
lower effective tax rate. Given the loss of tax revenue from entry of multinationals,
restrictions on entry of multinationals into sectors dominated by taxable domestic firms
would be expected.28 Alternatively, the government can compensate for the avoidance
behavior of multinationals by trying to impose higher tax rates on these firms. If the
result is at least comparable revenue from foreign-owned produc tion to that lost from the
crowding out of domestic production, then FDI could be welcome in these industries.
Governments would still gain revenue from the entry of multinationals into sectors
otherwise dominated by untaxed firms. In this case, tax revenue increases by replacing
untaxed domestic firms with multinationals that pay at least some tax. Even when
multinationals produce in sectors dominated by taxed domestic firms, if the product
produced by the multinational does not crowd out the domestic production, e.g. it is
exported whereas domestic production is sold locally, then multinationals could still enter
without a loss in government tax revenue.
25 See Gordon and Hines (2002) for a summary of the theoretical and empirical literature in this area. 26 Even in the U.S., as documented by Grubert, Goodspeed, and Swenson (1993), foreign subsidiaries pay much less in taxes than seemingly equivalent domestic firms. 27 Crowding out can occur due to competition in both the goods and the factor markets. 28 Such restrictions may take the form of limits on the fraction of a firm that can be owned by a foreign multinational in particular industries, as long as minority ownership is not sufficient to induce such tax avoidance.

24
If the taxed industries consist of a few capital- intensive firms and a competitive fringe of
labor- intensive firms, then the government has a financial incentive to adopt policies
giving the capital- intensive firms monopoly power, driving out the competitive fringe.
This makes output of the taxed (capital- intensive) firms less sensitive to tax rates, since
the taxed firms can no longer be undercut by the competitive fringe. Any resulting
monopoly profits can be taxed away, so the key role of such policies is simply to help
shift output from the untaxed competitive fringe into the taxed share of each industry.
Red Tape Focused on the Untaxed Sector
One other mechanism to offset the tax distortion leading to too few firms in the taxed
sector is to create nontax costs on those firms operating or hoping to enter in the untaxed
sector. For example, assume that the government can hire bureaucrats to monitor
(hound) untaxed firms, and attempt to collect tax revenue from those that already exist,
and fees from those hoping to enter.29 If the monitors cannot themselves be monitored,
however, the government cannot collect revenue based on what a bureaucrat learns firm
by firm. However, it can collect an ex ante amount, based on say the size of the sector
over which the bureaucrat has authority, and then allow this ex ante payment to be set by
market forces.
In equilibrium, competition among potential bureaucrats for the job would lead to an ex
ante net payment equal to the expected tax revenue collected minus the opportunity cost
of the bureaucrat’s time. If positive, this could be a form of tax farming. If negative, this
could involve a very low official salary for such positions with no official revenue
generation.
A bureaucrat in such a position would want to maximize the revenue collected. How
much can be collected depends on what powers the bureaucrat has been given, e.g. what
threats are available. With full powers, well-defined property rights to extort the firms,
29 By our admittedly extreme assumptions, the tax base for firms using banks is costlessly observable, through tabulation of bank records. As a result, there is no gain from giving tax inspectors the power to extort money from taxable firms – the payments come out of tax revenue dollar for dollar.

25
and an unlimited time horizon, the bureaucrat would act like a Leviathan government.
Firms in principle should be able to escape from this bureaucratic extortion by becoming
part of the monitored sector (in exchange of course for becoming subject to regular
taxes). This option puts an upper bound on what the bureaucrat in equilibrium can collect
equal to the taxes due in the taxed sector minus the efficiency gain from use of the
banking sector. If the bureaucrat becomes fully informed and has property rights to the
firms evading taxes, then the extortion would be just low enough so that no firms would
shift into the taxed sector.30
To what degree would a government choose to hire bureaucrats in this fashion? By our
assumptions, the bureaucrat simply earns her opportunity cost, so is indifferent to being
employed by the government. Assume in addition that the equilibrium salary of such a
bureaucrat is positive, so that bureaucrats each collect less in revenue than their
opportunity cost. The government then loses revenue directly from employing such
bureaucrats. Given these considerations alone, bureaucrats are a pure social waste,
harming the firms they extort while reducing the government revenue available to
everyone else.
However, bureaucrats raise the cost of doing business in the “untaxed” sector, causing
these firms at a minimum to employ fewer inputs. This in itself leads to an expansion of
the taxed sector, and to that extent an efficiency gain. In addition, if the bureaucrat’s
information is imperfect, some firms will shift into the taxed sector, which again is an
efficiency gain. These efficiency gains may well be large enough to more than offset the
social waste that remains present.
Other forms of organization, e.g. making the bureaucrat’s job temporary or employing
multiple independent bureaucrats to hound the same pool of untaxed firms, may provide
larger gains. With a temporary job, a bureaucrat has an incentive to seize what can be
taken quickly, before the job terminates, to the point of confiscating anything of value.
30 If the information of the bureaucrat is not perfect, then the bureaucrat would charge enough that at least some firms do shift into the taxed sector.

26
Similarly, as shown in Berkowitz and Li (2000), bureaucrats who compete in extracting
rents from a common pool of untaxed firms together would impose a higher effective tax
rate than would a Leviathan government. Anticipating this, otherwise untaxed firms
would likely either not open or else open solely in the taxed sector. Such extreme
rapaciousness then could induce most firms to join the taxed sector, or else not enter.
This would be a more efficient outcome, since tax policy would no longer need to be
adjusted to deal with the threat of disintermediation.
4. Implications for the treatment of the financial sector
In the above model, the financial sector plays a critical role in the functioning of the tax
structure. The working assumption had been that the government has access to bank
records on each firm, and can make use of this information in enforcing the tax law.
Why should banks be willing to provide this information? In particular, any bank that
can reduce the taxes that its customers owe has a competitive advantage. In order to have
access to bank records, the government cannot rely on market forces!
State ownership of the banks is one extreme policy that can in principle assure that banks
make information available to the government. Another approach is use of bank
regulations, whereby any bank that refuses to cooperate with the tax authorities loses its
license to function as a bank. Market forces should still lead to the creation of an
informal banking sector that circumvents these regulations, providing financial
intermediation without exposing customers to tax liabilities. In order to preserve its
revenue base, governments would be expected to oppose the development of such an
informal financial sector. When it develops nonetheless, it will likely facilitate tax
evasion.

27
Similarly, governments may impose capital controls making it difficult for firms to shift
their deposits abroad, into foreign banks. These deposits are presumably outside the
purview of the tax authorities, so use of foreign banks undermines the tax system.
To what degree should the government encourage or discourage branches of foreign
banks from operating in the domestic economy? For one, the best of the foreign banks
could provide much more value to customers (have higher ja ), so pull more firms into
the taxed sector. Such banks can gain a further competitive advantage, however, by
enabling firms to shift their financial records abroad, into branches of the bank based in
other countries, where they can no longer by monitored by the domestic tax authorities.
It is not surprising, given the model here, that governments often express concern about
the entry of branches of foreign banks into the country, since these banks can undermine
the entire domestic tax system. Under this story, preventing foreign banks from taking
deposits is sufficient to prevent tax evasion, and this is a common restriction. In fact,
domestic-owned banks with foreign branches create the same risks unless the bank
regulation is effective enough.
The tax treatment of banks also interacts critically with the tax system more broadly. If
the banking sector is competitive, any taxes on banks in equilibrium must be passed on to
customers, reducing the gain, ja , from using banks, and thereby lowering the feasible
taxes that can be collected directly from firms. If a firm’s use of banks is proportional to
its taxable activity (output or capital stock), then taxes on banks should crowd out other
taxes on firms dollar for dollar.31 This would lead banks facing such a tax to report high
spreads between loan and deposit interest rates, to compensate for the tax. 32 Everything
else equal, therefore, the more that revenue is collected directly from banks the lower the
feasible tax rates on capital expenditures, and on firms more broadly. Bank taxes,
though, do not allow for separate tax rates by industry of depositor, making them less
flexible than sales or capital taxes.
31 For example, if all new investments by taxe d firms are financed by bank loans, then a tax on loans or income from loans is equivalent to a tax on capital, yet may be easier to administer. 32 These large spreads, per se, then need not be an indicator of a poorly functioning financial sector.

28
5. Summary and discussion
The key hypothesis of this paper is that governments need to rely on the information
available from bank records in order to identify taxable entities and to measure the
amount of their taxable activity. Firms then become subject to tax if they choose to make
use of the financial sector. When tax rates are high enough, firms instead may forego the
economic benefits from use of banks in order to avoid these taxes.
This threat of disintermediation may be of little import in the richest countries, where the
value provided by financial intermediation is considerable. In poorer countries, however,
this threat of disintermediation may be a key factor both limiting the government’s ability
to collect tax revenue and shaping government policy more generally.
In particular, based on this hypothesis about the role of banks in tax enforcement, we
have derived the following forecasts for countries where banks provide only modest
value added:
a) Tax revenue as a share of GDP will be low, constrained by the threat of
disintermediation.
b) The tax base will be narrow, confined to capital- intensive firms that
particularly value the use of financial intermediaries.
c) The optimal tax structure will put substantial weight on capital income taxes,
in order to focus the tax burden on those firms least willing to forego use of the
financial sector.
d) Tariffs will be used to protect the taxed sector.

29
e) Inflation will be used as an indirect means of taxing the untaxed (cash)
economy.
f) Entry of foreign firms may be restricted in those sectors subject to tax, but be
encouraged in otherwise untaxed sectors.
g) Entry of foreign banks will be particularly discouraged, given the ease with
which foreign banks can facilitate tax evasion by domestic firms.
h) Red tape restricting activity in the untaxed sector is likely.
According to the model, all of these policies are optimal, given any standard government
objective function, to the extent that the threat of disintermediation (and the resulting tax
evasion) is important, raising questions about recommendations to avoid such policies.
Free-trade agreements, for example, are commonly defended as a means of eliminating
costly distortions that limit the degree to which countries can take advantage of gains
from trade. In our setting, however, the domestic tax system puts capital- intensive
industries at an artificial disadvantage in international markets, so that further trade can
easily reduce efficiency, and reduce the feasible amount of tax revenue that the
government can collect.
Recent free-trade agreements have given particular weight to opening up markets for
international trade in financial services. According to our model, entry of foreign banks
can seriously undermine a country’s domestic tax system, by making it easier for
domestic firms to hide their activity from the government through shifting their financial
accounts abroad.
Similarly, inflation can easily be argued to create substantial costs, e.g. through making
long-term contracting very difficult. In our setting, inflation also creates offsetting

30
benefits through raising the operating costs in the cash economy, a sector otherwise
favored by being able to avoid domestic taxes.
Even reducing red tape can have costly side effects, according to the model, through
making it easier for firms to operate in the “underground” economy.
For a small policy change, these effects on tax revenue also measure the effects of the
policy change on economic efficiency. 33 That government revenue is keep low due to the
threat of disintermediation, however, suggests that the marginal welfare gain from extra
government expenditures can be large, so that social welfare can be particularly sensitive
to the impact of a policy change on government revenue.
There remain the standard gains from trade from cutting tariffs, and standard costs from
inflation. In order to achieve these gains without creating more than offsetting efficiency
and welfare losses through undercutting government tax revenue, the model suggests that
the key policy focus instead should be on reform of the domestic financial sector. Any
policies that raise the value of the services provided by financial intermediaries will
increase the usage of the financial sector, raising efficiency and allowing the government
to collect more revenue. Conversely, anything that undercuts the perceived value of the
services provided by the financial sector, e.g. a bank failure, can undermine the fraction
of GDP collected in tax revenue, in addition to any direct effects on GDP through loss of
financial intermediation.
We have made no attempt here to estimate the quantitative size of the effects described in
the paper. To do so, the key step is to estimate the effects of any given policy change on
government tax revenue arising from behavioral responses. Our future research will aim
at testing the forecasts from this model, and providing such quantitative estimates.
33 By the envelope condition, private individuals and firms are indifferent at the margin to any changes in behavior induced by a policy change. Behavioral changes can have first-order effects on government revenue, however, so that these changes in revenue in fact measure the combined net benefits to all sectors of the economy. See Feldstein (1999) for further discussion.

31
References Atkinson, A.B. and J.E. Stiglitz. 1976. “The Design of Tax Structure: Direct vs. Indirect Taxation,” Journal of Public Economics 6, pp. 55-75. Berkowitz, Dan and Wei Li. 2000. “Tax Rights in Transition Economies: A Tragedy of the Commons?” Journal of Public Economics, 76, pp. 369—97. Campillo, Marta and Jeffrey A. Miron. 1997. “Why Does Inflation Differ Across Countries? In Reducing Inflation: Motivation and Strategy, edited by C. Romer and D. Romer. Chicago: University of Chicago Press. Corlett, W.J. and D.C. Hague. 1953. “Complementarity and the Excess Burden of Taxation,” Review of Economic Studies 21, pp. 21-30. Diamond, Peter and James Mirrlees. 1971. “Optimal Taxation and Public Production,” American Economic Review 61, pp. 8-27. Feldstein, Martin. 1997. “The Costs and Benefits of Going from Low Inflation to Price Stability.” In Reducing Inflation: Motivation and Strategy,” edited by C. Romer and D. Romer. Chicago: Chicago University Press. Feldstein Martin. 1999. “Tax Avoidance and the Deadweight Loss of the Income Tax,” Review of Economics and Statistics 81, pp. 674-80. Friedman, Milton. 1969. “The Optimal Quantity of Money.” In The Optimal Quantity of Money and Other Essays, edited by Milton Friedman. Chicago: Aldine Publishing Company. Gordon, Roger H. 2000. “Taxation of Capital Income vs. Labour Income: An Overview.” In Taxing Capital Income in the European Union: Issues and Options for Reform, edited by Sijbren Cnossen. Oxford: Oxford University Press. -------------------. 2003. “Taxes and Privatization.” In Public Finance and Public Policy in the New Century, edited by Sijbren Cnossen. Cambridge: MIT Press. Gordon, Roger H., Chong-en Bai, and David Li. 1999. “Efficiency Losses from Tax Distortions vs. Government Control,'' European Economic Review 43, pp. 163-83. Gordon, Roger and James R. Hines, Jr. 2002. “International Taxation.” In Handbook of Public Economics, vol. 4, edited by Alan J. Auerbach and Martin S. Feldstein. New York: Elsevier.

32
Gordon, Roger, Laura Kalambokidis, and Joel Slemrod. 2004a. “A New Summary Measure of the Effective Tax Rate on Investment.” In Measuring the Tax Burden on Capital and Labor, edited by Peter Birch Sorensen, pp. 99-128. ------------------. 2004b. “Do We Now Collect any Revenue from Taxing Capital Income,” Journal of Public Economics 88, pp. 981-1009. Gordon, Roger and James Levinsohn. 1990. “The Linkage between Domestic Taxes and Border Taxes.” In Taxation in the Global Economy,” edited by Assaf Razin and Joel Slemrod. Chicago: University of Chicago Press, pp. 357-89. Gordon, Roger and Joel Slemrod. 2000. “Are `Real’ Responses to Taxes Simply Income-Shifting between Corporate and Personal Tax Bases?” In Does Atlas Shrug: The Economic Consequences of Taxing the Rich, edited by Joel Slemrod. Harvard: Harvard University Press. Grubert, Harry, Tim Goodspeed and Deborah Swenson. 1993. “Explaining the Low Taxable Income of Foreign-Controlled Companies in the United States.” In Studies in International Taxation, edited by Alberto Giovannini, R. Glenn Hubbard, and Joel Slemrod. Chicago: University of Chicago Press, pp. 237-270. Hatta, Tatsuo. 1986. “Welfare Effects of Changing Commodity Tax Rates Towards Uniformity,” Journal of Public Economics 29, pp. 99-112. IMF. 2004a. Government Finance Statistics Yearbook. Washington, D.C.: IMF. IMF. 2004b. International Finance Statistics Yearbook. Washington, D.C.: IMF. Levine, Ross. 2004. “Finance and Growth: Theory and Evidence,” N.B.E.R. Working Paper No. 10766. Schneider, Friedrich. 2002. “Size and Measurement of the Informal Economy in 110 Countries Around the World.” Mimeo, Department of Economics, Johannes Kepler University of Linz. Schneider, Friedrich and Dominik H. Enste. 2002. “Shadow Economies: Size, Causes, and Consequences,” Journal of Economic Literature 38, pp. 77-114. Schumpeter, Joseph. Capitalism, Socialism, and Democracy. New York: Harper, 1942. World Bank. 2003. World Development Indicators. Washington, D.C.: World Bank.
33
Table 1 Sources of Government Revenue (1996-2001)
GDP per capita
Tax Revenue
(% of GDP)
Income Taxes (% of
Revenue)
Corporate Income
Tax (% of
income taxes)
Consumption and
Production Taxes (% of
Revenue)
Border Taxes (% of
Revenue)
Inflation Rate
Seignorage Income (% of
Revenue)
Informal Economy
(% of GDP)
< $745 14.1 35.9 53.7 43.5 16.4 10.6 12.5 26.4 $746-2,975 16.7 31.5 49.1 51.8 9.3 15.7 15.9 29.5 $2,976-9,205 20.2 29.4 30.3 53.1 5.4 7.4 4.1 32.5 All developing 17.6 31.2 42.3 51.2 8.6 8.1 10.3 30.1 > $9,206 25.0 54.3 17.8 32.9 0.7 2.4 1.0 14.0
Notes: Authors’ calculations based on available data between 1996 and 2001 from Government Finance Statistics (IMF, 2004a), International Finance Statistics (IMF, 2004b), and World Development Indicators (World Bank, 2003). The ranges for GDP per capita follow the World Bank 2003 classification of low income, lower middle income, middle income and high income countries. Seignorage is measured as the increase in reserve money and currency in circulation. Estimates of the size of the informal economy in 1999 in Column (9) are from Friedrich Schneider (2002), who uses the currency demand approach in estimation. Data within each cell are weighed averages. Tax revenue (% of GDP), inflation rate, and the size of the informal economy (% of GDP) are weighted by GDP of each country. Corporate income tax (% of income taxes) is weighed by the total income tax revenue of each country. All other data are weighted by the tax revenue of each country.

34
Table 2 Maximum Statutory Tax Rates, by Country
Tax Revenue Corporate Personal Country (% of GDP) Tax Rate Tax Rate VAT
Argentina 17.2% 35.0% 35.0% 17.0%Bulgaria 21.4% 19.5% 29.0% 20.0%Brazil 24.3% 34.0% 20.0% 0.0%China 12.6% 33.0% 45.0% 17.0%Czech Republic 21.7% 28.0% 32.0% 19.0%Egypt, Arab Rep. 15.8% 40.0% 20.0% 0.0%Estonia 23.2% 0.0% 26.0% 18.0%Hungary 25.9% 16.0% 40.0% 25.0%Indonesia 15.5% 30.0% 30.0% 10.0%India 12.3% 36.8% 40.0% 0.0%Lithuania 23.5% 15.0% 35.0% 18.0%Latvia 22.3% 15.0% 25.0% 18.0%Morocco 23.5% 35.0% 41.5% 20.0%Mexico 14.5% 33.0% 35.0% 15.0%Malta 21.9% 35.0% 35.0% 18.0%Pakistan 12.9% 35.0% 35.0% 15.0%Philippines 15.2% 32.0% 34.0% 10.0%Poland 23.8% 19.0% 40.0% 22.0%Romania 18.7% 25.0% 60.0% 19.0%Russian Federation 23.9% 24.0% 13.0% 20.0%Slovak Republic 21.2% 19.0% 19.0% 23.0%Thailand 15.7% 30.0% 37.0% 7.0%Turkey 20.3% 33.0% 40.0% 18.0%Vietnam 17.0% 28.0% 60.0% 20.0%South Africa 26.5% 30.0% 45.0% 14.0%Zambia 17.9% 15.0% 30.0% 0.0%All developing 19.6% 26.7% 34.7% 14.7%
Belgium 30.6% 34.0% 55.0% 21.0%Canada 32.5% 36.6% 31.0% 7.0%Cyprus 20.3% 15.0% 30.0% 15.0%Germany 23.6% 25.0% 45.0% 16.0%Denmark 47.6% 30.0% 60.0% 25.0%Spain 21.9% 35.0% 56.0% 16.0%Finland 33.6% 29.0% 35.0% 22.0%France 28.3% 34.3% 54.0% 20.6%United Kingdom 29.7% 30.0% 40.0% 17.5%Greece 25.9% 35.0% 40.0% 18.0%Ireland 21.1% 12.5% 42.0% 21.0%Israel 33.2% 36.0% 49.0% 17.0%Italy 30.1% 33.0% 45.0% 20.0%Luxembourg 30.5% 30.0% 46.0% 15.0%Netherlands 36.9% 34.5% 60.0% 17.5%Norway 32.2% 28.0% 28.0% 23.0%Portugal 24.3% 27.5% 40.0% 17.0%Singapore 15.6% 22.0% 22.0% 0.0%United States 21.5% 35.0% 35.0% 0.0%All Developed 28.4% 29.6% 42.8% 16.2%
Note: Statutory tax rates are from http://www.worldwide-tax.com/index.asp#partthree. The rates do not include local taxes, if they exist.