Embed Size (px)
Citation preview
87
Tax Reform in the Cypriot Road Transport Sector
Adamos Adamou and Sofronis Clerides
Department of Economics, University of Cyprus
Abstract
The road transport sector contributes a significant fraction of government tax revenue in many countries, including Cyprus. Most revenue comes from excise taxes on vehicles and fuel and from road (circulation) tax. There is currently a need to modernize the tax system in order to provide a steady stream of revenue and to abide by environmental taxation principles increasingly being applied in Europe and elsewhere. We discuss the theoretical justification for transport sector taxation and the shortcomings of the current system and propose reforms aimed at achieving the twin goals of revenue stability and pollution reduction with minimal market distortion.
Keywords: vehicle taxation, carbon taxes, road tax, transport sector taxation.
1. Introduction
Taxation of road transportation is an important source of tax revenue in most countries. Cyprus is no exception: around 12% of overall tax revenue in recent years has come from this sector. Table 1 reports government revenue from transport-related taxes and fees for the period 2003-2012. The most important components of the transport tax system are excise taxes on fuel (‗fuel tax‘) and vehicles (‗vehicle tax‘); the road (circulation) tax; and value-added tax (VAT). Until December 2012 a substantial registration fee was also assessed but this has now been reduced to a fixed fee of €150 per registration and is no longer an important source of revenue.
Corresponding author. Address: Department of Economics, University of Cyprus, P.O.Box 20537, 1678 Nicosia, Cyprus. E-mail: [email protected].
Cyprus Economic Policy Review, Vol. 7, No. 1, pp. 87-114 (2013) 1450-4561
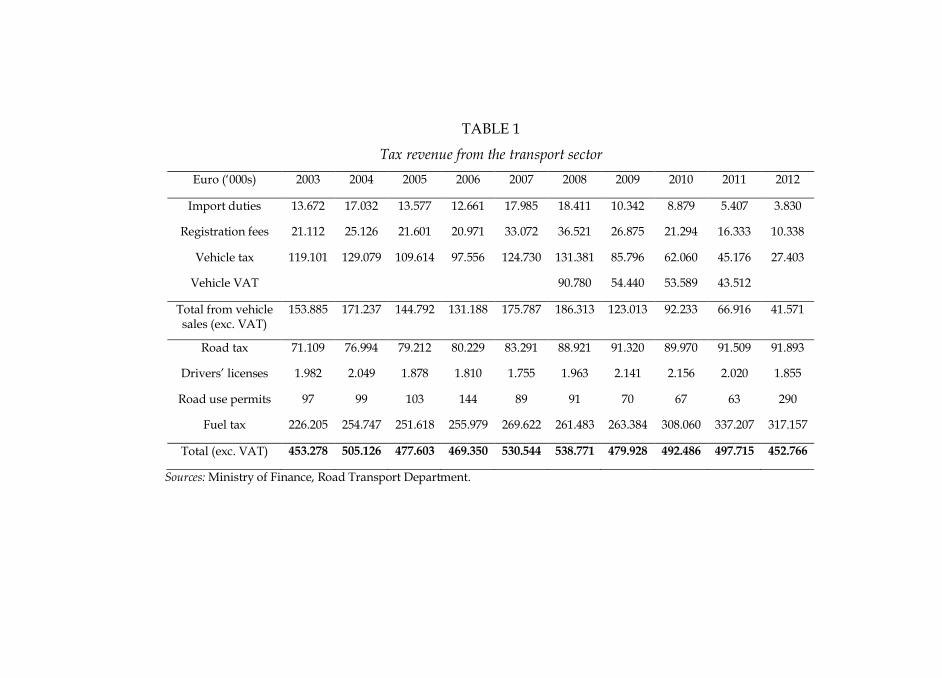
TABLE 1
Tax revenue from the transport sector
Euro (‗000s) 2003 2004 2005 2006 2007 2008 2009 2010 2011 2012
Import duties 13.672 17.032 13.577 12.661 17.985 18.411 10.342 8.879 5.407 3.830
Registration fees 21.112 25.126 21.601 20.971 33.072 36.521 26.875 21.294 16.333 10.338
Vehicle tax 119.101 129.079 109.614 97.556 124.730 131.381 85.796 62.060 45.176 27.403
Vehicle VAT 90.780 54.440 53.589 43.512
Total from vehicle sales (exc. VAT)
153.885 171.237 144.792 131.188 175.787 186.313 123.013 92.233 66.916 41.571
Road tax 71.109 76.994 79.212 80.229 83.291 88.921 91.320 89.970 91.509 91.893
Drivers‘ licenses 1.982 2.049 1.878 1.810 1.755 1.963 2.141 2.156 2.020 1.855
Road use permits 97 99 103 144 89 91 70 67 63 290
Fuel tax 226.205 254.747 251.618 255.979 269.622 261.483 263.384 308.060 337.207 317.157
Total (exc. VAT) 453.278 505.126 477.603 469.350 530.544 538.771 479.928 492.486 497.715 452.766
Sources: Ministry of Finance, Road Transport Department.
Total revenue from the transport sector peaked at €539 million in 2008 but has declined significantly since then owing to the large drop in new vehicle registrations. Total tax revenue (excluding VAT) in 2012 was almost 16% lower than in 2008. Taxes related to the sale of a new vehicle (i.e., the vehicle tax, the registration fee, and import duties) collapsed by 78%, while revenue from the fuel tax in the same period increased by 21%.
Cyprus is currently considering an overhaul of taxation related to road transport. The need for reform has arisen for two main reasons: (a) the decline of government tax revenue due to the crisis and to the substantial reduction of the registration fee; and (b) the need for taxation to abide by environmental principles aimed at reducing the emissions of pollutants from motor vehicles. The purpose of this paper is to evaluate the current system and to propose specific reforms that would improve the system‘s effectiveness in achieving the policy objectives of revenue generation and pollution reduction and at the same time reduce the distortionary effects of taxation.
2. Rationale and key features of road transport taxes
2.1 Aims and side effects
Taxation in the transport sector has two main objectives: (a) to correct the negative social impact (external cost) resulting from transportation; and (b) to provide the government with a steady and reliable stream of revenue. In designing a tax system to achieve these objectives, policy makers must bear in mind that all taxes have negative repercussions and create distortions. Some issues that need to be taken into account include the system‘s administrative costs; tax fairness and tax evasion; creation of market distortions and restriction of consumer choices; and the burden imposed on taxpayers.
2.2 The external cost of transport
Transportation imposes a social cost because it causes environmental pollution, congestion, wear of the road network and damages from accidents. The standard economic prescription to correct such externalities is to tax the activity generating the negative social impact; this is known as a Pigouvian tax. The tax leads to a reduction in the intensity of the said activity, and hence of its negative impact.
In the case of vehicles, the negative impact is caused when vehicles are driven on the road. Therefore, the tax should be targeted at usage and not at the purchase or ownership of vehicles. Several studies have investigated
90
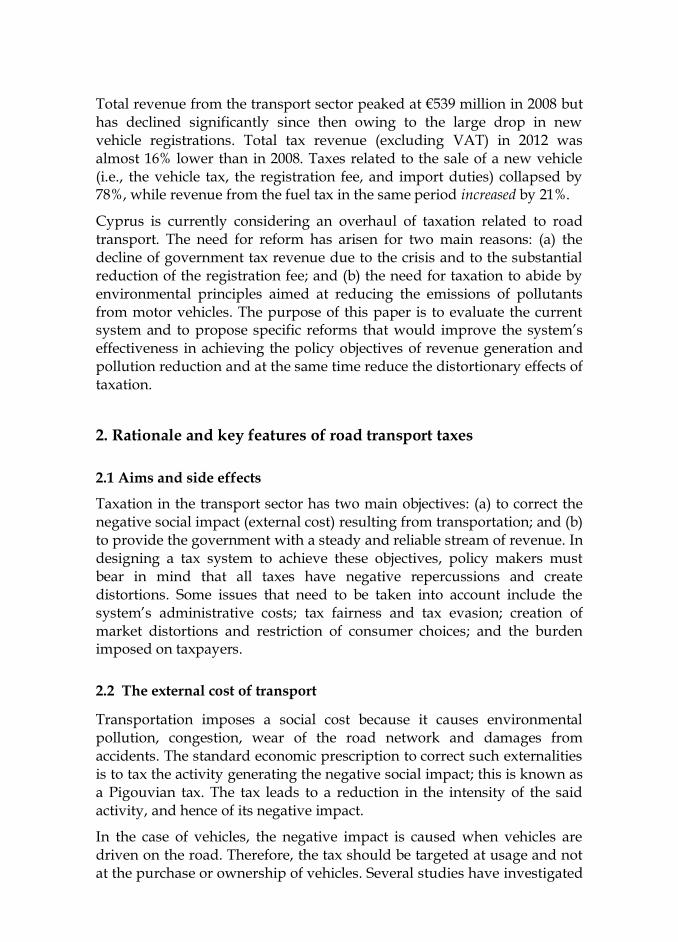
the external costs associated with vehicles in an effort to quantify the different types of costs. In Table 2 we provide a summary of the relevant findings from Parry, Walls and Harrington‘s (2007) review of the literature. Two general and perhaps surprising conclusions are that:
a. The most important external cost is congestion rather than
pollution.
b. Local pollution is more damaging than pollution attributed to
carbon emissions.
TABLE 2
Summary of estimates of external cost from the use of vehicles in the USA
Cent/gal.a Cent/milea
Central values for marginal external costs
Fuel-related costs Greenhouse warning 6 0.3
Oil dependency 12 0.6 Sum 18 0.9
Mileage-related costs
Local pollution 42 2.0 Congestion, cents/mile 105 5.0
Accidents 63 3.0 sum 210 10.0
Note: aCosts converted assuming on-road fuel economy of twenty-one miles per gallon. Source: Parry, Walls and Harrington (2007).
It follows from the above that an effective tax should aim primarily at congestion and secondly at environmental pollution. Congestion cost is mainly the cost of time lost during journeys. This cost varies substantially depending on the time and location of travel. The consumption of a liter of fuel at peak hour in the center of a city imposes a much higher external cost than the consumption of a liter of fuel in a quite rural road. The best way to deal with the external cost of congestion is with congestion fees. Such fees have been adopted in several countries. Despite some concerns regarding loss of privacy, it is expected that their use will increase in the future as the required technology improves and becomes more affordable.
91
TABLE 3
Advantages and Disadvantages of different taxes
Advantages Disadvantages
Vehicle excise tax
− Easy to collect − Can depend on emissions − Some tax evasion related to used
cars
− Variability revenue − Not related to usage − Reduced revenue from
purchases of used vehicles − Large cost at time of purchase
Road (circulation) tax
− Can depend on emissions − Applies to both new and used
vehicles
− Some administrative cost and tax evasion
− Relation with usage is indirect and limited
− Paid in lump sum Fuel excise tax
− Easy to collect − Minimal tax evasion − Taxes usage − Applies to new and used vehicles
− Increases cost of commerce − Burdens commuters
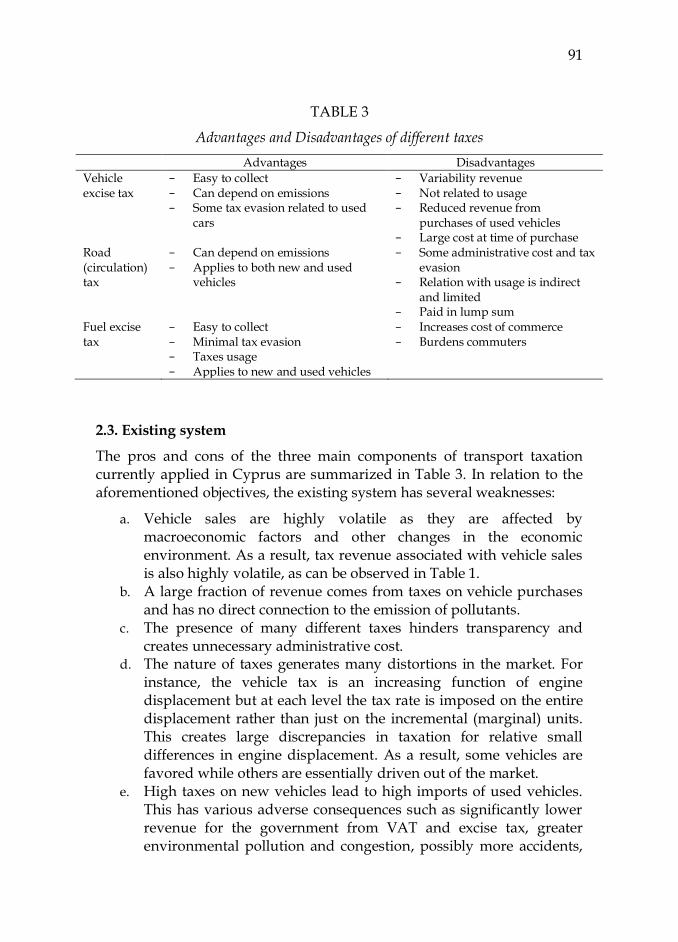
2.3. Existing system
The pros and cons of the three main components of transport taxation currently applied in Cyprus are summarized in Table 3. In relation to the aforementioned objectives, the existing system has several weaknesses:
a. Vehicle sales are highly volatile as they are affected by macroeconomic factors and other changes in the economic environment. As a result, tax revenue associated with vehicle sales is also highly volatile, as can be observed in Table 1.
b. A large fraction of revenue comes from taxes on vehicle purchases and has no direct connection to the emission of pollutants.
c. The presence of many different taxes hinders transparency and creates unnecessary administrative cost.
d. The nature of taxes generates many distortions in the market. For instance, the vehicle tax is an increasing function of engine displacement but at each level the tax rate is imposed on the entire displacement rather than just on the incremental (marginal) units. This creates large discrepancies in taxation for relative small differences in engine displacement. As a result, some vehicles are favored while others are essentially driven out of the market.
e. High taxes on new vehicles lead to high imports of used vehicles. This has various adverse consequences such as significantly lower revenue for the government from VAT and excise tax, greater environmental pollution and congestion, possibly more accidents,
92
greater tax evasion, and a quality/technology gap due to the age of the vehicle fleet.
3. Reform options
It has been argued above that the ideal tax system must penalize activities incurring an external cost. The long-term policy objective should therefore be to: (a) abolish the vehicle excise tax and road tax; and (b) adopt a congestion fee and adjust the fuel consumption tax so that it reflects the true external cost and meets the government‘s revenue needs.
The long-term objective cannot be achieved at this juncture because imposition of a congestion fee is currently not possible in Cyprus. Given this, taxing fuel consumption is a reasonable alternative to the extent that consumption is related to congestion. However, immediate abolition of the vehicle tax and a corresponding increase in the fuel tax has at least two drawbacks. Firstly, the fuel tax has been raised recently (1/1/2013) by 7 cents per liter and is scheduled to increase by another 5 cents in 2014. Further increases would impose a heavy burden on consumers. Secondly, recent vehicle buyers have already paid vehicle tax and will be penalized as they will now have to pay a higher fuel tax as well. These negative consequences can be mitigated with a gradual transition from the vehicle tax to the fuel tax.
A second factor that restricts policy options is the government‘s need for increased revenue from this sector, as stipulated in the Memorandum of Understanding (MoU). Given current market conditions and the prolonged recession, it is highly unlikely that there will be increased revenue from taxes in the vehicle market (vehicle tax and VAT), a prediction that is also borne out in our simulations (see section 3.3). In fact, sales and associated tax revenue will likely continue to follow a downward trend for the next 2-3 years at least. Additional revenue may therefore only be collected from further increases in the fuel and road taxes. Since the fuel tax has already been increased and a new increase is planned, the road tax is perhaps the most appropriate policy instrument at present.
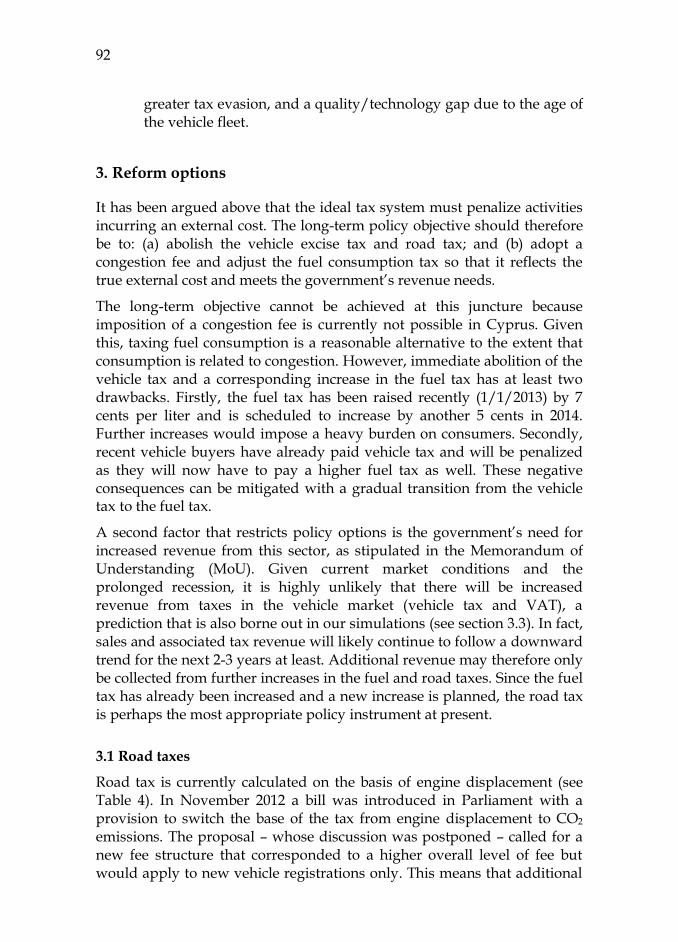
3.1 Road taxes
Road tax is currently calculated on the basis of engine displacement (see Table 4). In November 2012 a bill was introduced in Parliament with a provision to switch the base of the tax from engine displacement to CO2 emissions. The proposal – whose discussion was postponed – called for a new fee structure that corresponded to a higher overall level of fee but would apply to new vehicle registrations only. This means that additional
93
revenue from the road tax would be limited. According to the proposal‘s estimates, based on 2011 sales, additional revenue would be €2 million in the first year and would rise by €2 million every year beyond that (that is, €4 million in the second year, €6 million in the third year, and so on). We updated this estimate using 2012 sales and found that additional revenue would be much lower, around €1,3 million, with a clear downward trend. A figure of €1 million is a reasonable upper bound on additional revenues to be raised from road taxes on new vehicle registrations. A second
important disadvantage of raising road taxes for new vehicles only is that it increases the cost of purchasing a new vehicle as compared to keeping an existing one (which will pay a lower road tax), and therefore creates a disincentive for purchasing new vehicles.
TABLE 4
Existing road tax fees
Displacement (c.c.) Fee (€/c.c.) Indicative fee (€)
1-1450 0,04272 10-62 1451-1650 0,05980 87-99 1651-2050 0,11960 198-246 2051-2250 0,14523 297-326 2251-2650 0,19649 443-521
2651- 0,19649 521-
Note: Existing fees are further differentiated on the basis of emissions. Using M to denote
emissions, there is a 30% discount for Μ≤120, a 20% discount for 120<Μ≤165, a 10% discount for 165<Μ≤200, a surcharge of 10% for 200<Μ≤250, and a surcharge of 20% for Μ>250.
For these reasons, the switch of the base of the road tax from displacement to emissions must be accompanied with an increase in road tax rates for existing vehicles also. Ideally, one would want to have a uniform tax system for all vehicles. This cannot be done on the basis of emissions because the relevant information is not available for older vehicles (those registered before 2007). An alternative would be to tax vehicles registered since 2007 on the basis of emissions and vehicles registered earlier on the basis of engine displacement. This is also not possible for legal reasons; taxation based on pollutants can be applied only to new registrations. The only remaining option is to tax new registrations on the basis of emissions and existing vehicles using the existing system but at different rates. We discuss possible fee structures below.
94
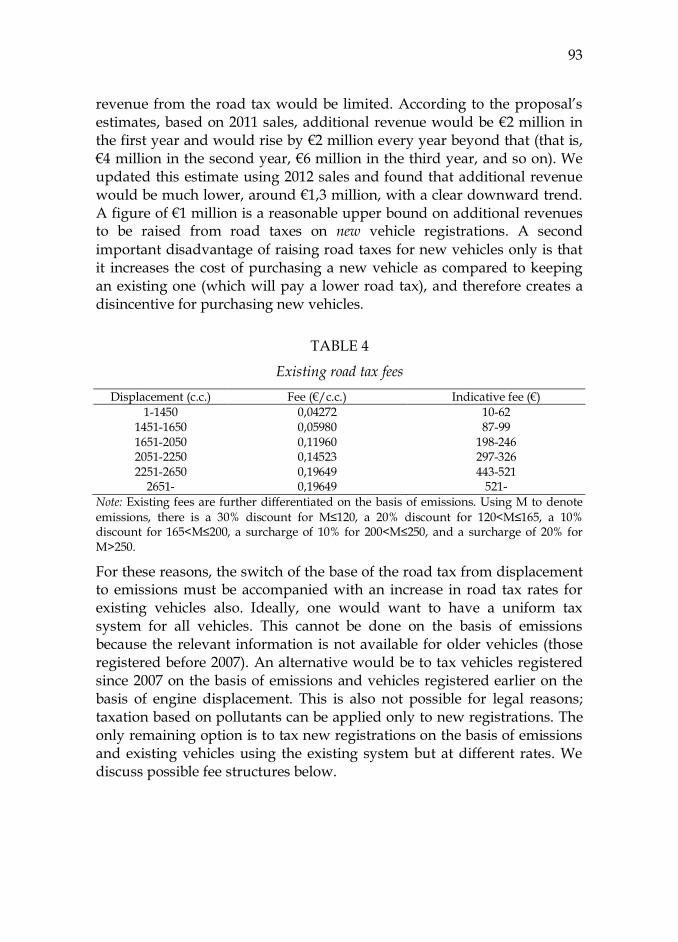
TABLE 5
Proposed road tax fees
CO2 (gr/km) Road tax (€)
November proposal Road tax (€)
Alternative proposal
0-100 0 50
101-110 20 60
111-120 40 70
121-130 70 80
131-140 100 90
141-150 130 100
151-165 150 120
166-175 200 150
176-185 300 250
186-200 400 350
201-225 600 450
226-256 850 600
257+ 1300 800
3.1.1 Road tax for the existing fleet
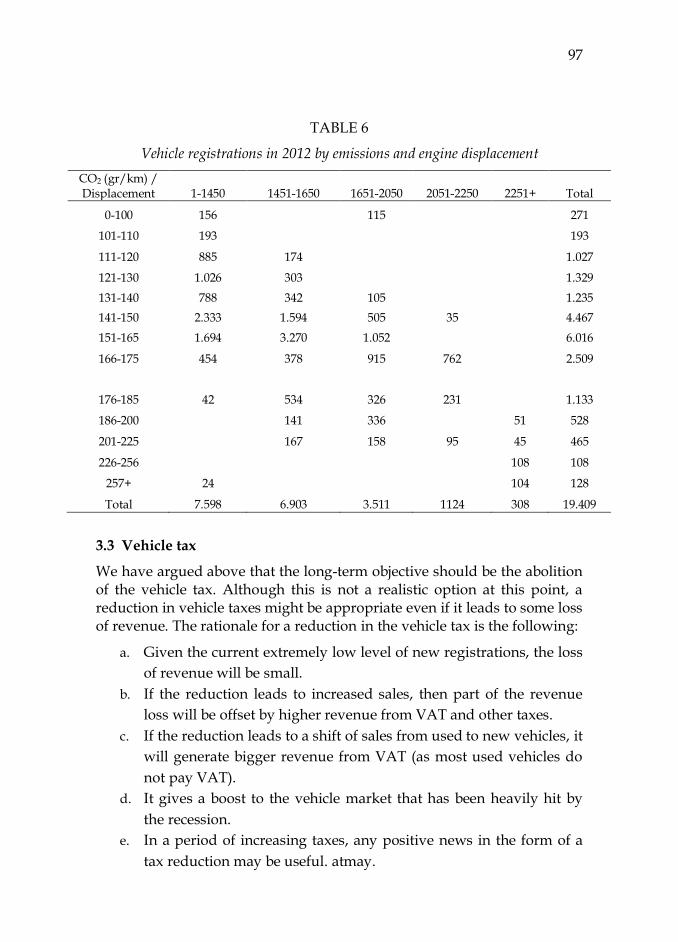
Existing fees are very low for small- and medium-sized vehicles (up to 1650cc) and very high for larger vehicles. Since most registrations are of vehicles up to 1650cc (see Table 6), the objective of higher revenue can only be achieved if rates are increased in this category. We have examined two alternative ways of raising fees for existing vehicles:
1. Flat surcharge on all vehicles
2. Increase (and rounding) of rates
1. Flat surcharge
It is estimated that in 2013 around 600 thousand vehicles will pay road taxes (580,246 had already paid by 23rd April 2013). Based on this, a flat increase of €10 in the road tax of all vehicle categories will yield €6 million of additional revenue. It is wise to adopt a more conservative prediction of €5 million for a €10 increase per vehicle because it is expected that payments will drop in the upcoming years due to the economic crisis. Consequently, a €20 increase in the road tax per vehicle will yield approximately €10 million in additional annual revenue.
95
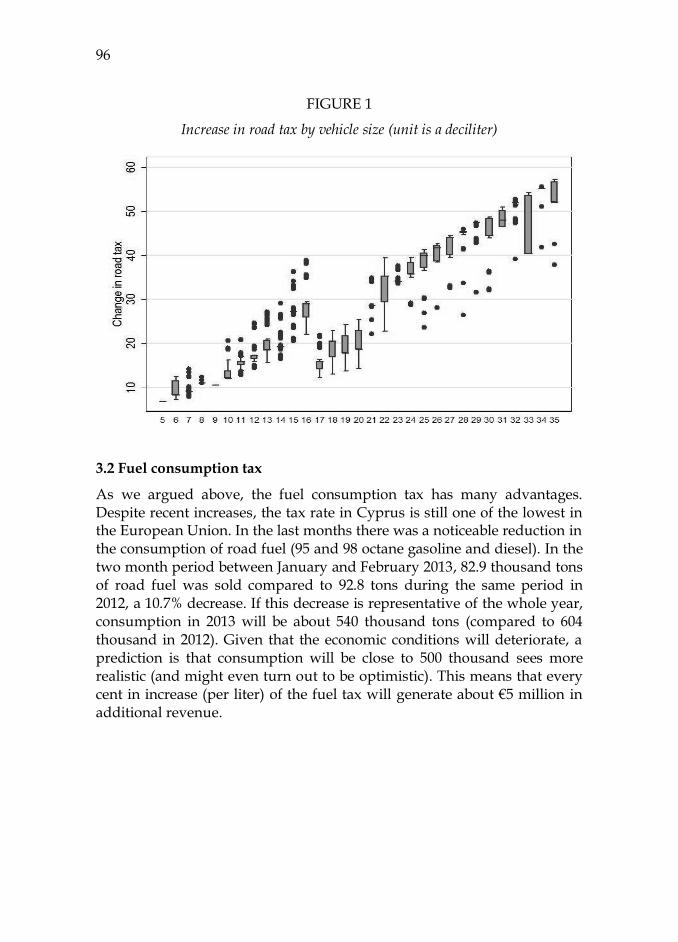
2. Rate increases
Table 4 shows a proposal for increasing road tax rates (and retaining the emissions-based discount/surcharge). The proposed rates were chosen so that the fees will increase by approximately €20 for most vehicles, with the exception of larger vehicles for which the increase will be slightly higher. The increase per category is shown in the last column of the Table. Figure 1 displays the change in the tax at the more disaggregated level of the deciliter (one tenth of a liter, known in Cyprus as an ‗άλογο‘ (horse)). It can be noted that the increase for vehicles in the 1650-2050cc category is slightly lower than the increase for smaller vehicles. This is because taxes on this category are already quite high.
This proposal is expected to generate €4.8 million from vehicles registered in the period 2007-2012. These are about 200 thousand vehicles, i.e., one third of the fleet. A conservative prediction is that about €12 million in additional annual revenue can be generated from the entire fleet by imposing the suggested fee structure.
3.1.2 Fees for new registrations
In Table 6 we present two proposals; the proposal regarding the fees for new registrations included in last November´s bill, and an alternative one that we believe will be more effective in meeting policy objectives in the current market conditions. The main elements that differentiate the new proposal are:
A fee is levied on all vehicles, even those with emissions below 100.
This increases revenue by broadening the tax base.
Categories in the range 150-200 are narrower so as to avoid large
fee discrepancies when moving from one category to the next.
The fees for high-emission vehicles are lower so that they do not
become prohibitive.
As mentioned before, the new fees are not expected to yield significant revenue to the government in the upcoming years due to the large drop in new registrations.
96
FIGURE 1
Increase in road tax by vehicle size (unit is a deciliter)
3.2 Fuel consumption tax
As we argued above, the fuel consumption tax has many advantages. Despite recent increases, the tax rate in Cyprus is still one of the lowest in the European Union. In the last months there was a noticeable reduction in the consumption of road fuel (95 and 98 octane gasoline and diesel). In the two month period between January and February 2013, 82.9 thousand tons of road fuel was sold compared to 92.8 tons during the same period in 2012, a 10.7% decrease. If this decrease is representative of the whole year, consumption in 2013 will be about 540 thousand tons (compared to 604 thousand in 2012). Given that the economic conditions will deteriorate, a prediction is that consumption will be close to 500 thousand sees more realistic (and might even turn out to be optimistic). This means that every cent in increase (per liter) of the fuel tax will generate about €5 million in additional revenue.
97
TABLE 6
Vehicle registrations in 2012 by emissions and engine displacement
CO2 (gr/km) / Displacement 1-1450 1451-1650 1651-2050 2051-2250 2251+ Total
0-100 156
115
271
101-110 193
193
111-120 885 174
1.027
121-130 1.026 303
1.329
131-140 788 342 105
1.235
141-150 2.333 1.594 505 35
4.467
151-165 1.694 3.270 1.052
6.016
166-175 454 378 915 762
2.509
176-185 42 534 326 231
1.133
186-200
141 336
51 528
201-225
167 158 95 45 465
226-256
108 108
257+ 24 104 128
Total 7.598 6.903 3.511 1124 308 19.409
3.3 Vehicle tax
We have argued above that the long-term objective should be the abolition of the vehicle tax. Although this is not a realistic option at this point, a reduction in vehicle taxes might be appropriate even if it leads to some loss of revenue. The rationale for a reduction in the vehicle tax is the following:
a. Given the current extremely low level of new registrations, the loss
of revenue will be small.
b. If the reduction leads to increased sales, then part of the revenue
loss will be offset by higher revenue from VAT and other taxes.
c. If the reduction leads to a shift of sales from used to new vehicles, it
will generate bigger revenue from VAT (as most used vehicles do
not pay VAT).
d. It gives a boost to the vehicle market that has been heavily hit by
the recession.
e. In a period of increasing taxes, any positive news in the form of a
tax reduction may be useful. atmay.
98
If sales were to remain the same, a 10% reduction in vehicle tax rates would decrease revenue by 10%. However, it is highly likely that sales will change for the reasons identified in points (b) and (c) above. Therefore, in order to properly design the tax system, we need to estimate how the market will react to different tax reform scenarios.
For this purpose we have estimated a vehicle demand system based on historical data from the Cyprus market for the period 2006-2012. We then used the estimated demand system to simulate various taxation scenarios. This is a useful exercise because it allows us to examine how different taxes impact different market segments and to calculate resulting revenues. This approach has recently been used for ex-post assessments of CO2-based tax schemes implemented in specific countries, such as Bastard (2010) for France and Rogan, Dennehy, Daly, Howley, and Ó Gallachóir (2011) for Ireland. The ex-ante analysis we use here has been used by Adamou, Clerides and Zachariadis (2012, 2013) for Greece and Germany respectively and by Christodoulou and Clerides (2012) for Cyprus. The exercise does have some limitations that are worth pointing out:
a. The model we use is designed to estimate substitution elasticities between different models and is known to perform well in this regard. It does not perform as well in estimating overall market fluctuations, especially in periods of high uncertainty like the current situation in Cyprus. In other words, the system estimates well the shifts within the market quite, but less so the overall direction of the market.
b. The simulations allow consumer demand to shift over time but elasticities remain constant.
c. It was not possible to estimate with sufficient accuracy the degree to which consumers take into account the annual road tax. For this reason, in the simulations we experimented with different scenarios for this parameter. Our calculations show that the extent to which consumers take the road tax into account does not make much difference qualitatively. The estimates we report assume that the road tax is not taken into account at the time of purchase.
d. In cases of large price changes, the estimates have a large margin of error.
Data for the period 2006-2012 were obtained from three sources. The Cyprus Road Transport Department (RTD) provided data on automobile registrations, including several attributes of registered vehicles (engine capacity, CO2 emissions, fuel type, etc.). Information on vehicle prices was obtained from motor vehicle importers, who provided us with actual transaction prices, something quite rare in this literature. Where importer prices were not available we used list prices from the monthly magazine
99
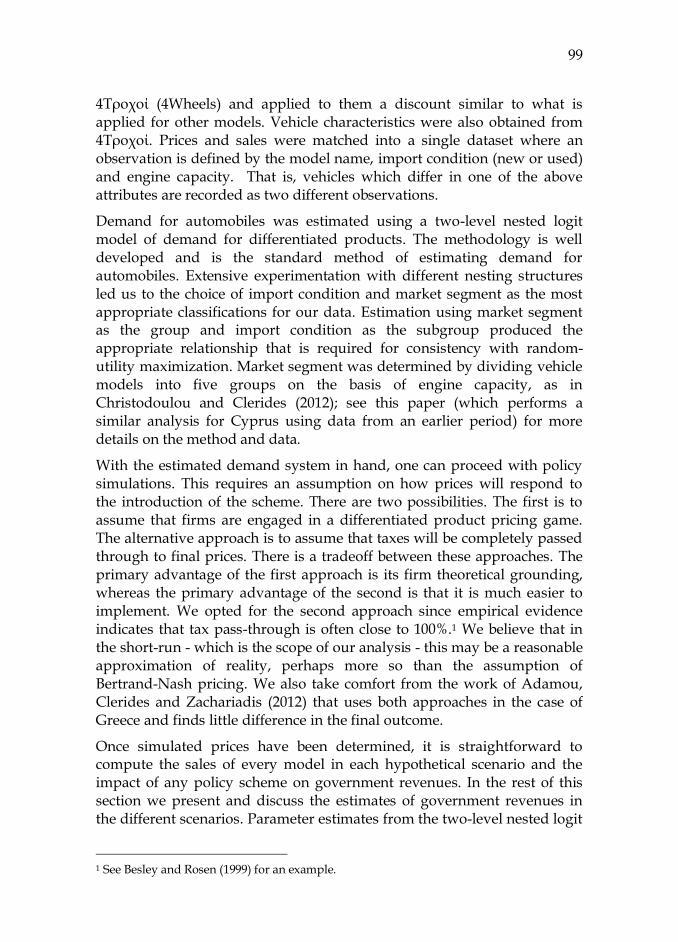
4Τροχοί (4Wheels) and applied to them a discount similar to what is applied for other models. Vehicle characteristics were also obtained from 4Τροχοί. Prices and sales were matched into a single dataset where an observation is defined by the model name, import condition (new or used) and engine capacity. That is, vehicles which differ in one of the above attributes are recorded as two different observations.
Demand for automobiles was estimated using a two-level nested logit model of demand for differentiated products. The methodology is well developed and is the standard method of estimating demand for automobiles. Extensive experimentation with different nesting structures led us to the choice of import condition and market segment as the most appropriate classifications for our data. Estimation using market segment as the group and import condition as the subgroup produced the appropriate relationship that is required for consistency with random-utility maximization. Market segment was determined by dividing vehicle models into five groups on the basis of engine capacity, as in Christodoulou and Clerides (2012); see this paper (which performs a similar analysis for Cyprus using data from an earlier period) for more details on the method and data.
With the estimated demand system in hand, one can proceed with policy simulations. This requires an assumption on how prices will respond to the introduction of the scheme. There are two possibilities. The first is to assume that firms are engaged in a differentiated product pricing game. The alternative approach is to assume that taxes will be completely passed through to final prices. There is a tradeoff between these approaches. The primary advantage of the first approach is its firm theoretical grounding, whereas the primary advantage of the second is that it is much easier to implement. We opted for the second approach since empirical evidence indicates that tax pass-through is often close to 100%.1 We believe that in the short-run - which is the scope of our analysis - this may be a reasonable approximation of reality, perhaps more so than the assumption of Bertrand-Nash pricing. We also take comfort from the work of Adamou, Clerides and Zachariadis (2012) that uses both approaches in the case of Greece and finds little difference in the final outcome.
Once simulated prices have been determined, it is straightforward to compute the sales of every model in each hypothetical scenario and the impact of any policy scheme on government revenues. In the rest of this section we present and discuss the estimates of government revenues in the different scenarios. Parameter estimates from the two-level nested logit
1 See Besley and Rosen (1999) for an example.
100
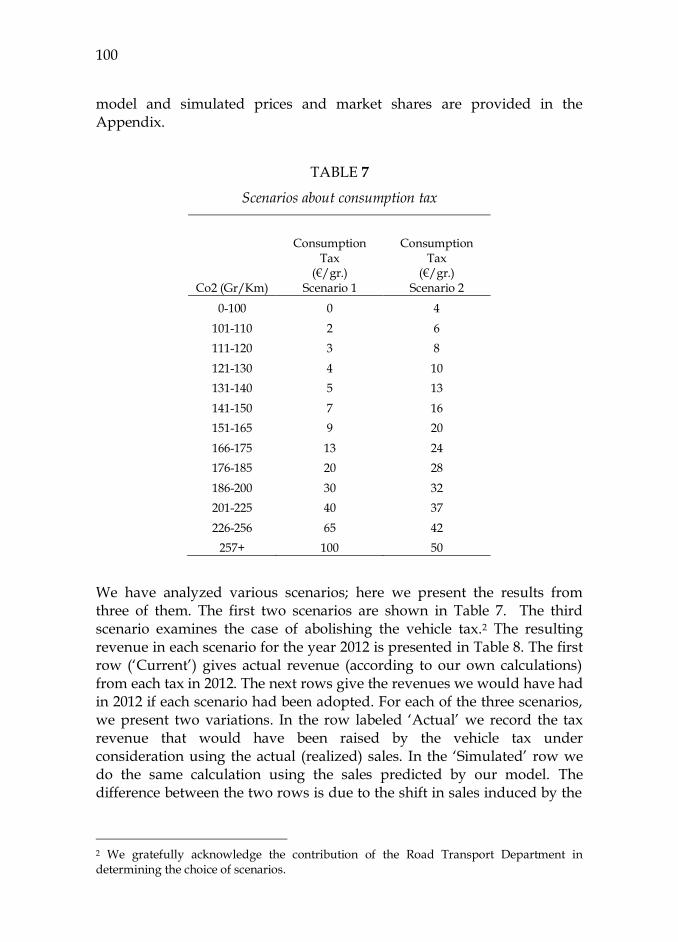
model and simulated prices and market shares are provided in the Appendix.
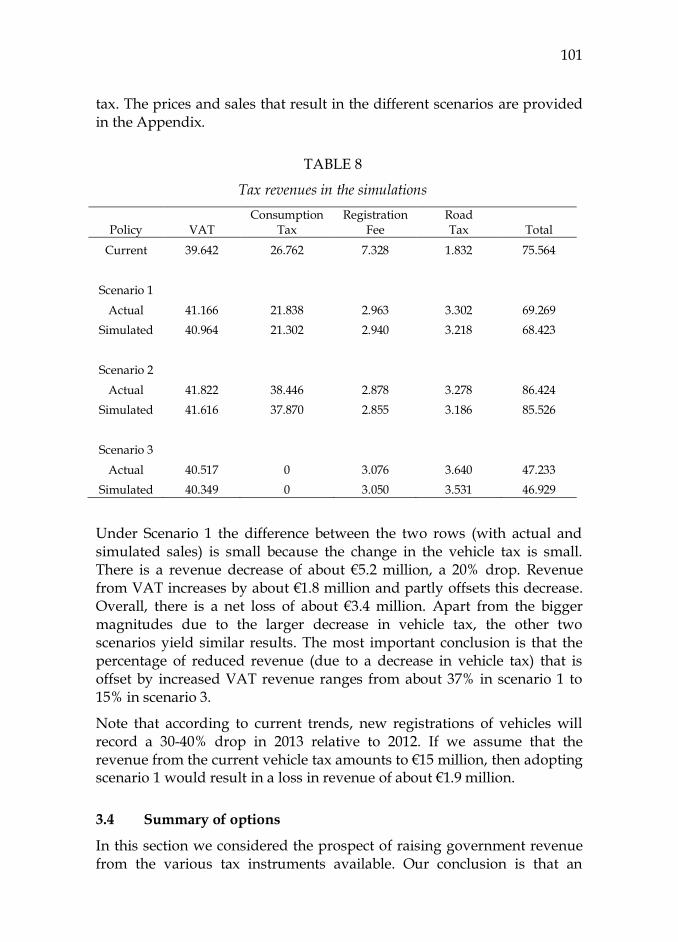
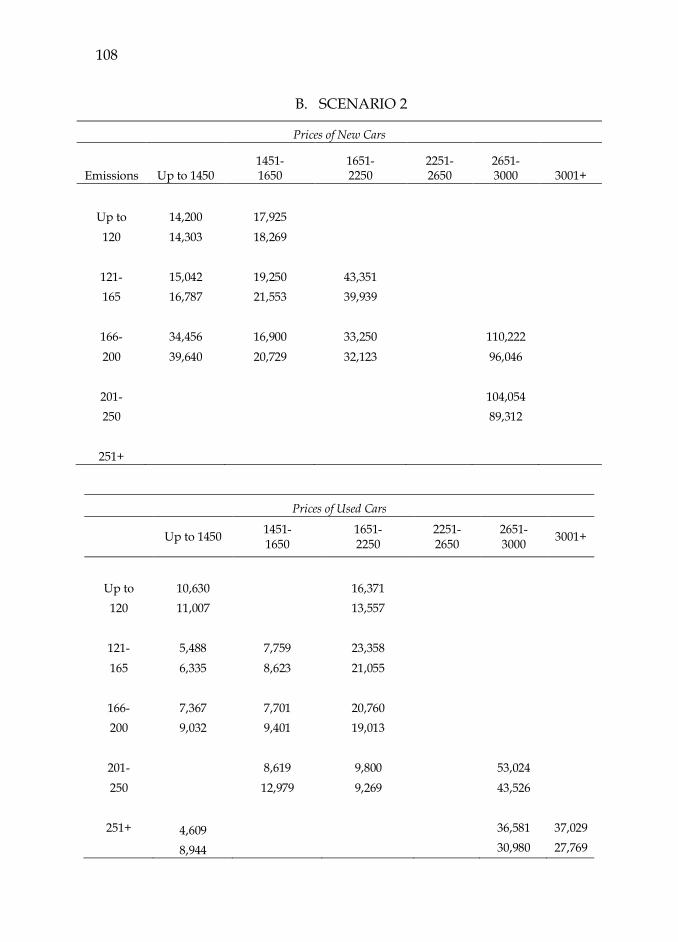
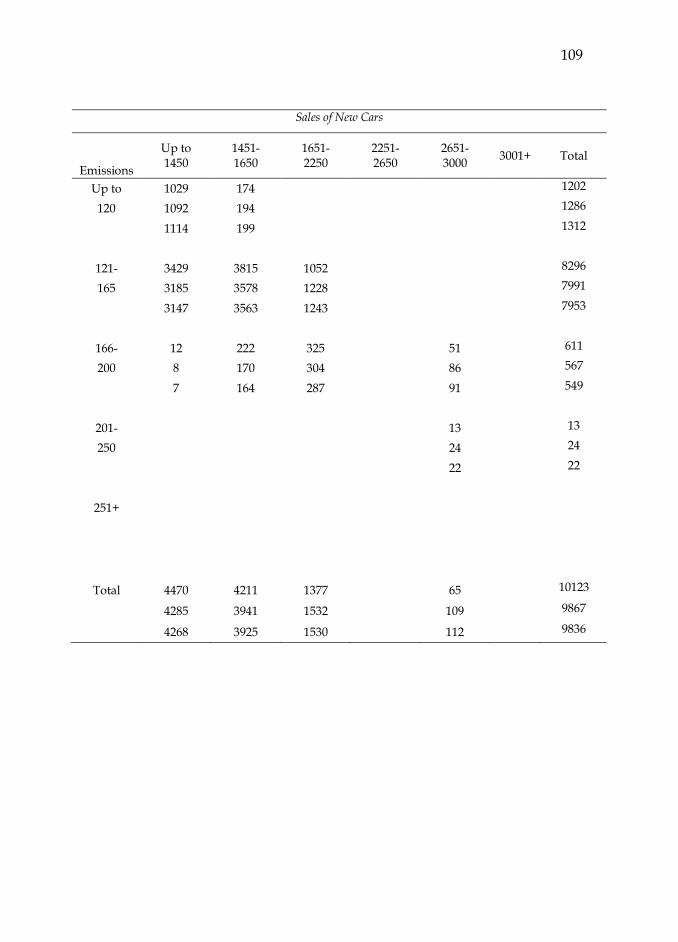
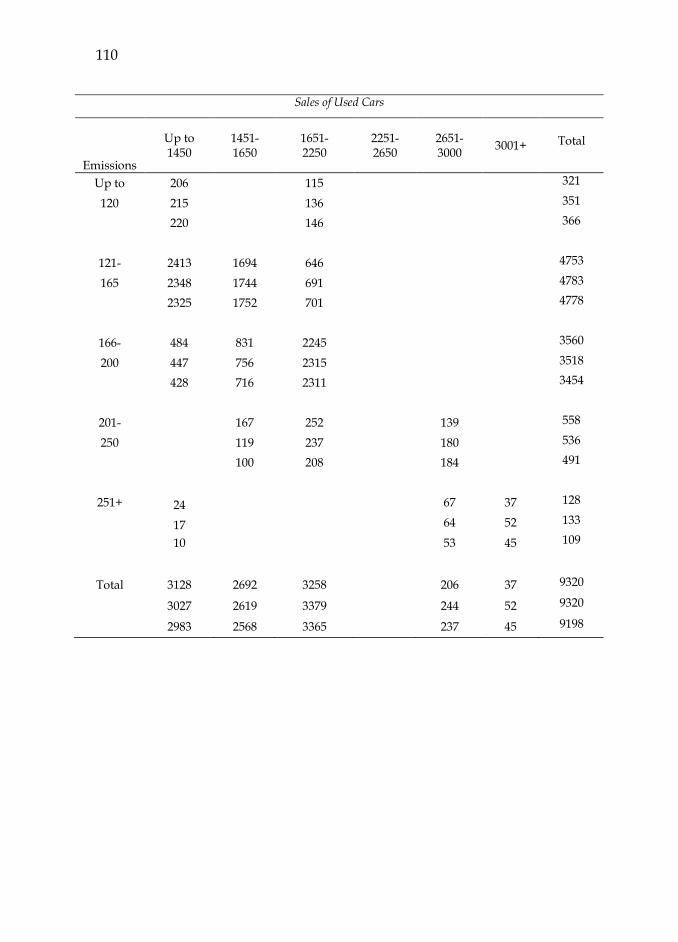
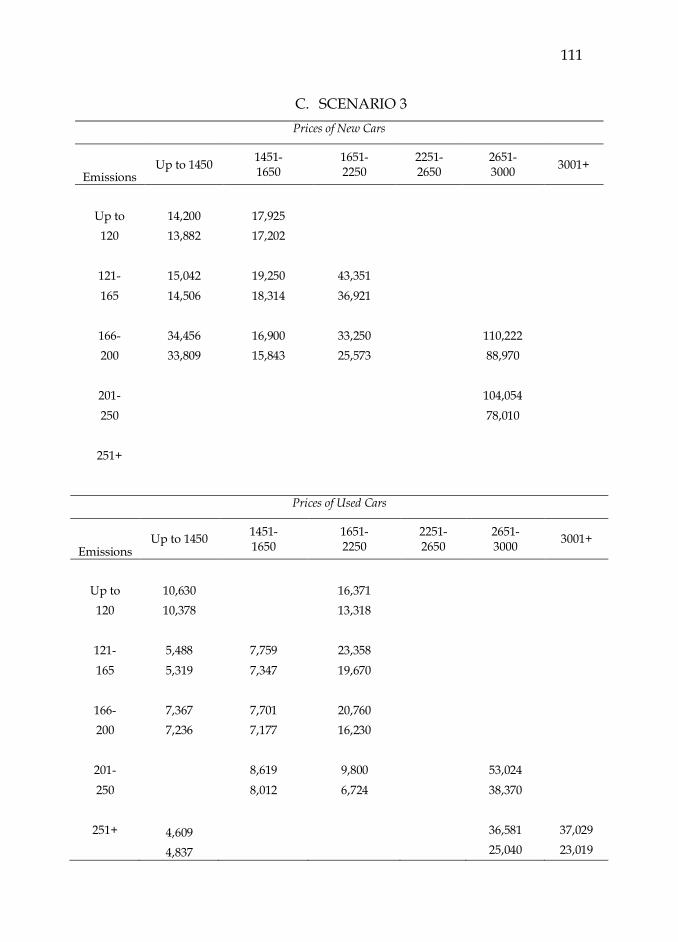
We have analyzed various scenarios; here we present the results from three of them. The first two scenarios are shown in Table 7. The third scenario examines the case of abolishing the vehicle tax.2 The resulting revenue in each scenario for the year 2012 is presented in Table 8. The first row (‗Current‘) gives actual revenue (according to our own calculations) from each tax in 2012. The next rows give the revenues we would have had in 2012 if each scenario had been adopted. For each of the three scenarios, we present two variations. In the row labeled ‗Actual‘ we record the tax revenue that would have been raised by the vehicle tax under consideration using the actual (realized) sales. In the ‗Simulated‘ row we do the same calculation using the sales predicted by our model. The difference between the two rows is due to the shift in sales induced by the
2 We gratefully acknowledge the contribution of the Road Transport Department in determining the choice of scenarios.
TABLE 7
Scenarios about consumption tax
Co2 (Gr/Km)
Consumption Tax (€/gr.)
Scenario 1
Consumption Tax (€/gr.)
Scenario 2
0-100 0 4
101-110 2 6
111-120 3 8
121-130 4 10
131-140 5 13
141-150 7 16
151-165 9 20
166-175 13 24
176-185 20 28
186-200 30 32
201-225 40 37
226-256 65 42
257+ 100 50
101
tax. The prices and sales that result in the different scenarios are provided in the Appendix.
TABLE 8
Tax revenues in the simulations
Policy VAT Consumption
Tax Registration
Fee Road Tax Total
Current 39.642 26.762 7.328 1.832 75.564
Scenario 1
Actual 41.166 21.838 2.963 3.302 69.269
Simulated 40.964 21.302 2.940 3.218 68.423
Scenario 2
Actual 41.822 38.446 2.878 3.278 86.424
Simulated 41.616 37.870 2.855 3.186 85.526
Scenario 3
Actual 40.517 0 3.076 3.640 47.233
Simulated 40.349 0 3.050 3.531 46.929
Under Scenario 1 the difference between the two rows (with actual and simulated sales) is small because the change in the vehicle tax is small. There is a revenue decrease of about €5.2 million, a 20% drop. Revenue from VAT increases by about €1.8 million and partly offsets this decrease. Overall, there is a net loss of about €3.4 million. Apart from the bigger magnitudes due to the larger decrease in vehicle tax, the other two scenarios yield similar results. The most important conclusion is that the percentage of reduced revenue (due to a decrease in vehicle tax) that is offset by increased VAT revenue ranges from about 37% in scenario 1 to 15% in scenario 3.
Note that according to current trends, new registrations of vehicles will record a 30-40% drop in 2013 relative to 2012. If we assume that the revenue from the current vehicle tax amounts to €15 million, then adopting scenario 1 would result in a loss in revenue of about €1.9 million.
3.4 Summary of options
In this section we considered the prospect of raising government revenue from the various tax instruments available. Our conclusion is that an
102
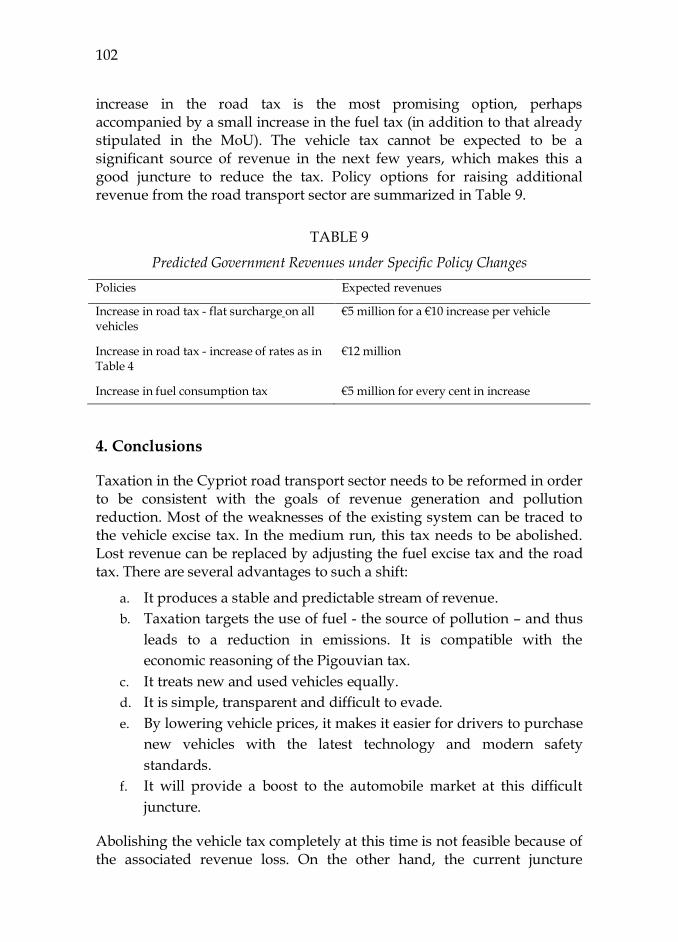
increase in the road tax is the most promising option, perhaps accompanied by a small increase in the fuel tax (in addition to that already stipulated in the MoU). The vehicle tax cannot be expected to be a significant source of revenue in the next few years, which makes this a good juncture to reduce the tax. Policy options for raising additional revenue from the road transport sector are summarized in Table 9.
TABLE 9
Predicted Government Revenues under Specific Policy Changes
Policies Expected revenues
Increase in road tax - flat surcharge on all vehicles
€5 million for a €10 increase per vehicle
Increase in road tax - increase of rates as in Table 4
€12 million
Increase in fuel consumption tax €5 million for every cent in increase
4. Conclusions
Taxation in the Cypriot road transport sector needs to be reformed in order to be consistent with the goals of revenue generation and pollution reduction. Most of the weaknesses of the existing system can be traced to the vehicle excise tax. In the medium run, this tax needs to be abolished. Lost revenue can be replaced by adjusting the fuel excise tax and the road tax. There are several advantages to such a shift:
a. It produces a stable and predictable stream of revenue.
b. Taxation targets the use of fuel - the source of pollution – and thus
leads to a reduction in emissions. It is compatible with the
economic reasoning of the Pigouvian tax.
c. It treats new and used vehicles equally.
d. It is simple, transparent and difficult to evade.
e. By lowering vehicle prices, it makes it easier for drivers to purchase
new vehicles with the latest technology and modern safety
standards.
f. It will provide a boost to the automobile market at this difficult
juncture.
Abolishing the vehicle tax completely at this time is not feasible because of the associated revenue loss. On the other hand, the current juncture
103
presents an opportunity to proceed with a modest decrease in the tax as the revenue loss will be quite small and the market response will be instructive.
In the longer run, the policy objective should be the introduction of congestion fees, perhaps as a replacement of the road tax. Congestion is the single largest external cost of transportation and the tax system should be designed to correct this externality. The use of congestion fees has been increasing in recent years and Cypriot policy makers should start thinking about how they could be implemented in Cyprus in the near future.
104
Appendix
Demand estimates
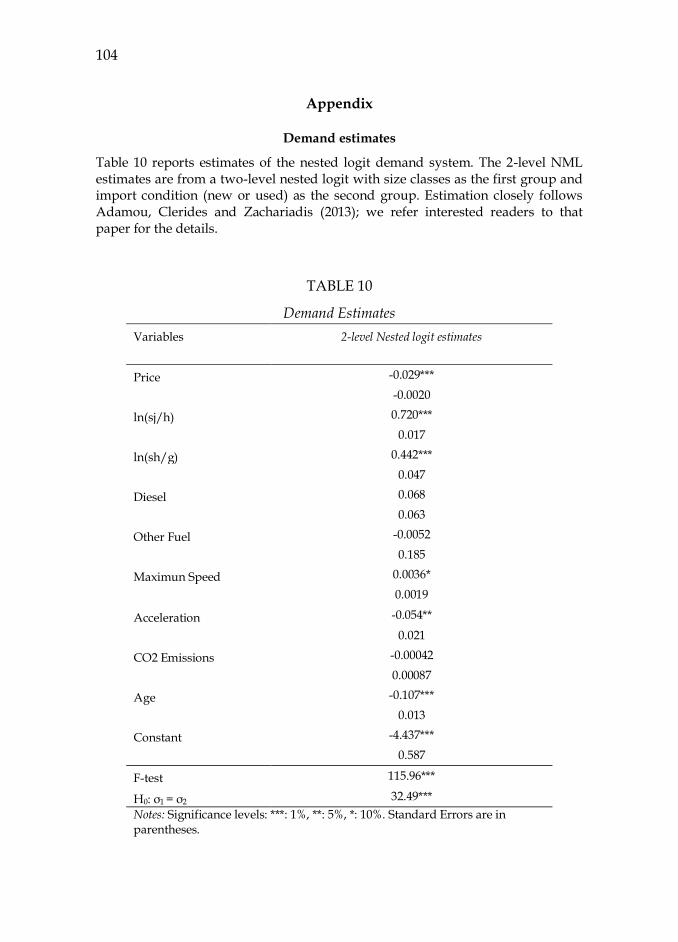
Table 10 reports estimates of the nested logit demand system. The 2-level NML estimates are from a two-level nested logit with size classes as the first group and import condition (new or used) as the second group. Estimation closely follows Adamou, Clerides and Zachariadis (2013); we refer interested readers to that paper for the details.
TABLE 10
Demand Estimates
Variables 2-level Nested logit estimates
Price -0.029***
-0.0020
ln(sj/h) 0.720***
0.017
ln(sh/g) 0.442***
0.047
Diesel 0.068
0.063
Other Fuel -0.0052
0.185
Maximun Speed 0.0036*
0.0019
Acceleration -0.054**
0.021
CO2 Emissions -0.00042
0.00087
Age -0.107***
0.013
Constant -4.437***
0.587
F-test 115.96***
Η0: σ1 = σ2 32.49***
Notes: Significance levels: ***: 1%, **: 5%, *: 10%. Standard Errors are in parentheses.
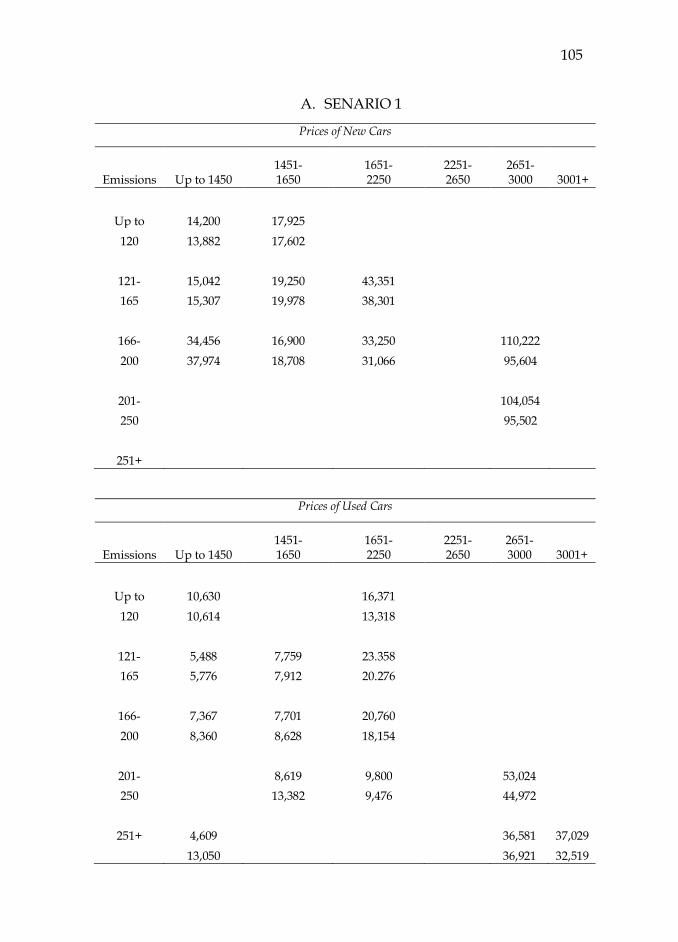
105
A. SENARIO 1
Prices of New Cars
Emissions Up to 1450 1451- 1650
1651- 2250
2251-2650
2651- 3000 3001+
Up to 14,200 17,925 120 13,882 17,602
121- 15,042 19,250 43,351 165 15,307 19,978 38,301
166- 34,456 16,900 33,250
110,222 200 37,974 18,708 31,066
95,604
201-
104,054 250
95,502
251+
Prices of Used Cars
Emissions Up to 1450 1451- 1650
1651- 2250
2251-2650
2651- 3000 3001+
Up to 10,630 16,371 120 10,614 13,318
121- 5,488 7,759 23.358 165 5,776 7,912 20.276
166- 7,367 7,701 20,760
200 8,360 8,628 18,154
201-
8,619 9,800 53,024
250
13,382 9,476 44,972
251+ 4,609
36,581 37,029
13,050
36,921 32,519
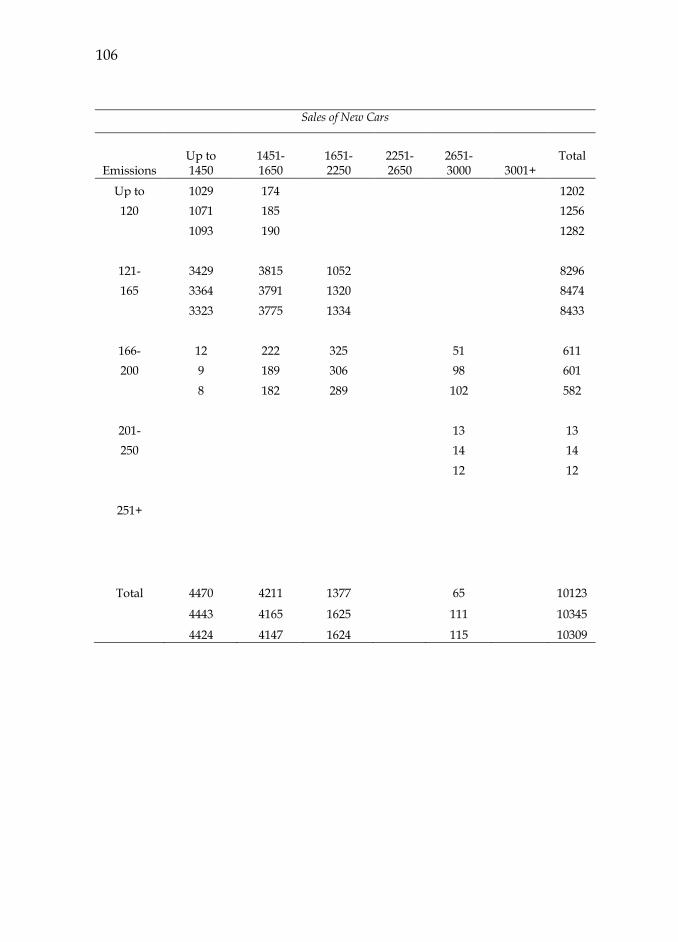
106
Sales of New Cars
Emissions Up to 1450
1451- 1650
1651- 2250
2251- 2650
2651- 3000 3001+
Total
Up to 1029 174
1202
120 1071 185
1256
1093 190
1282
121- 3429 3815 1052
8296
165 3364 3791 1320
8474
3323 3775 1334
8433
166- 12 222 325
51
611
200 9 189 306
98
601
8 182 289
102
582
201-
13
13
250
14
14
12
12
251+
Total 4470 4211 1377 65 10123
4443 4165 1625 111 10345
4424 4147 1624 115 10309

107
Sales of Used Cars
Emissions Up to 1450
1451- 1650
1651- 2250
2251- 2650
2651- 3000 3001+
Total
Up to 206 115
321
120 212 129
342
217 139
356
121- 2413 1694 646
4753
165 2395 1752 704
4850
2370 1760 713
4842
166- 484 831 2245
3560
200 458 766 2392
3617
438 725 2387
3551
201-
167 252 139 558
250
107 215 183 505
90 188 186 464
251+ 24
67 37 128
10
46 39 95
6
38 33 77
Total 3128 2692 3258 206 37 9320
3076 2625 3441 229 39 9409
3032 2575 3428 223 33 9291
108
B. SCENARIO 2
Prices of New Cars
Emissions Up to 1450 1451- 1650
1651- 2250
2251-2650
2651- 3000 3001+
Up to 14,200 17,925 120 14,303 18,269
121- 15,042 19,250 43,351 165 16,787 21,553 39,939
166- 34,456 16,900 33,250
110,222 200 39,640 20,729 32,123
96,046
201-
104,054 250
89,312
251+
Prices of Used Cars
Up to 1450
1451- 1650
1651- 2250
2251-2650
2651- 3000
3001+
Up to 10,630 16,371
120 11,007 13,557
121- 5,488 7,759 23,358
165 6,335 8,623 21,055
166- 7,367 7,701 20,760
200 9,032 9,401 19,013
201-
8,619 9,800 53,024
250
12,979 9,269 43,526
251+ 4,609
36,581 37,029
8,944
30,980 27,769
109
Sales of New Cars
Emissions
Up to 1450
1451- 1650
1651- 2250
2251- 2650
2651- 3000
3001+
Total
Up to 1029 174
1202
120 1092 194
1286
1114 199
1312
121- 3429 3815 1052
8296
165 3185 3578 1228
7991
3147 3563 1243
7953
166- 12 222 325
51
611
200 8 170 304
86
567
7 164 287
91
549
201-
13
13
250
24
24
22
22
251+
Total 4470 4211 1377 65 10123
4285 3941 1532 109 9867
4268 3925 1530 112 9836
110
Sales of Used Cars
Emissions
Up to 1450
1451- 1650
1651- 2250
2251- 2650
2651- 3000
3001+
Total
Up to 206 115
321
120 215 136
351
220 146
366
121- 2413 1694 646
4753
165 2348 1744 691
4783
2325 1752 701
4778
166- 484 831 2245
3560
200 447 756 2315
3518
428 716 2311
3454
201-
167 252 139 558
250
119 237 180 536
100 208 184 491
251+ 24
67 37 128
17
64 52 133
10
53 45 109
Total 3128 2692 3258 206 37 9320
3027 2619 3379 244 52 9320
2983 2568 3365 237 45 9198
111
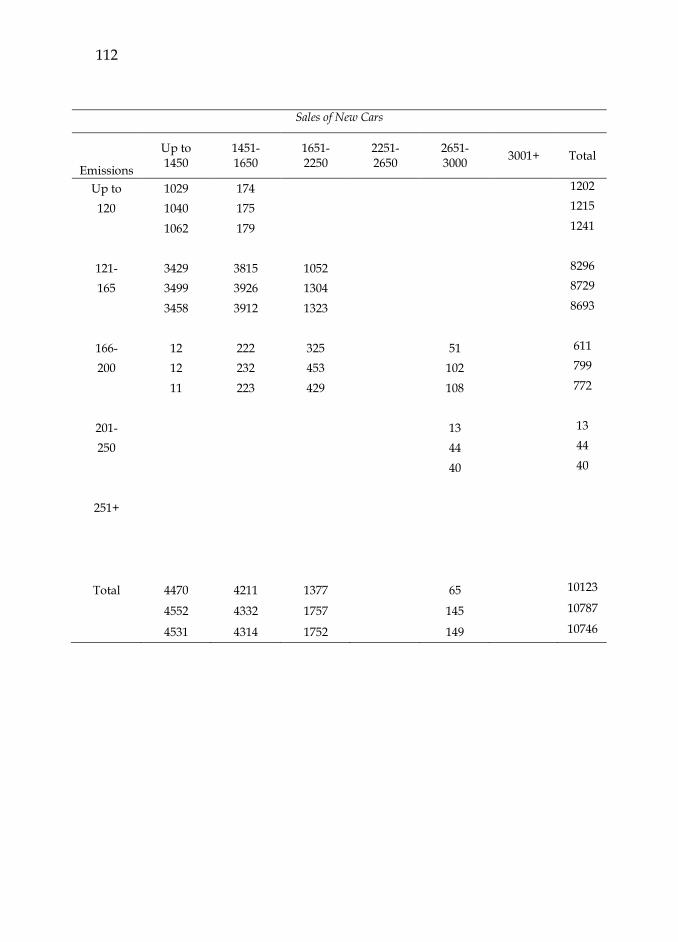
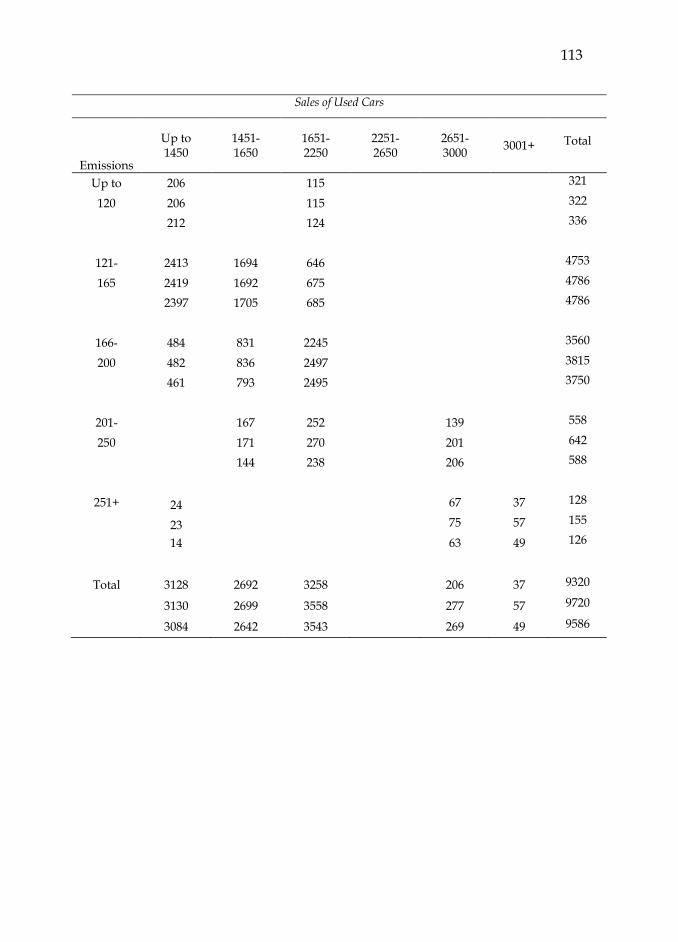
C. SCENARIO 3
Prices of New Cars
Emissions Up to 1450
1451- 1650
1651- 2250
2251-2650
2651- 3000
3001+
Up to 14,200 17,925
120 13,882 17,202
121- 15,042 19,250 43,351
165 14,506 18,314 36,921
166- 34,456 16,900 33,250
110,222
200 33,809 15,843 25,573
88,970
201-
104,054
250
78,010
251+
Prices of Used Cars
Emissions Up to 1450
1451- 1650
1651- 2250
2251-2650
2651- 3000
3001+
Up to 10,630 16,371
120 10,378 13,318
121- 5,488 7,759 23,358
165 5,319 7,347 19,670
166- 7,367 7,701 20,760
200 7,236 7,177 16,230
201-
8,619 9,800 53,024
250
8,012 6,724 38,370
251+ 4,609
36,581 37,029
4,837
25,040 23,019
112
Sales of New Cars
Emissions
Up to 1450
1451- 1650
1651- 2250
2251- 2650
2651- 3000
3001+
Total
Up to 1029 174
1202
120 1040 175
1215
1062 179
1241
121- 3429 3815 1052
8296
165 3499 3926 1304
8729
3458 3912 1323
8693
166- 12 222 325
51
611
200 12 232 453
102
799
11 223 429
108
772
201-
13
13
250
44
44
40
40
251+
Total 4470 4211 1377 65 10123
4552 4332 1757 145 10787
4531 4314 1752 149 10746
113
Sales of Used Cars
Emissions
Up to 1450
1451- 1650
1651- 2250
2251- 2650
2651- 3000
3001+
Total
Up to 206 115
321
120 206 115
322
212 124
336
121- 2413 1694 646
4753
165 2419 1692 675
4786
2397 1705 685
4786
166- 484 831 2245
3560
200 482 836 2497
3815
461 793 2495
3750
201-
167 252 139 558
250
171 270 201 642
144 238 206 588
251+ 24
67 37 128
23
75 57 155
14
63 49 126
Total 3128 2692 3258 206 37 9320
3130 2699 3558 277 57 9720
3084 2642 3543 269 49 9586
114
Acknowledgements
We are grateful to the Road Transport Department and 4Τροχοί magazine for providing registration and price data respectively and to the Association of Motor Vehicle Importers (ΣΕΜΟ) for facilitating the collection of prices.
References
Adamou, A., Clerides, S., and Zachariadis, T., (2012) ‗Tradeoffs in CO2-oriented vehicle tax reforms: A case study of Greece,‘ Transportation Research Part D: Transport and Environment, 17(6): 451-6.
Adamou, A., Clerides, S., and Zachariadis, T., (2013) ‗Welfare implications of automobile feebates: A simulation analysis,‘ unpublished manuscript, http://ssrn.com/abstract=2006757.
Bastard, L., (2010) ‗The impact of economic instruments on the auto industry and the consequences of fragmenting markets - Focus on the EU case‘, Discussion Paper No 2010-08, International Transport Forum. http://www.internationaltransportforum.org/jtrc/DiscussionPapers/DP201008.pdf.
Besley, T., and Rosen H. (1999), ‗Sales Taxes and Prices: An Empirical Analysis,‘ National Tax Journal, 52: 157-178.
Christodoulou, T., and Clerides, S., (2012), ‗Emissions-based vehicle tax reform for Cyprus: A simulation analysis‘, Cyprus Economic Policy Review, 6(1): 3-20.
Parry, I. W. H., Walls, M., and Harrington, W., (2007) ‗Automobile externalities and policies‘, Journal of Economic Literature, 45(2): 373-99.
Rogan, F., Dennehy, E., Daly, H., Howley, M., and Ó Gallachóir, B. P., (2011) ‗Impacts of an emission based private car taxation policy – First year of ex-post analysis,‘ Transportation Research Part A: Policy and Practice, 45(7): 583-97.