Embed Size (px)
Citation preview

Tax Policy Under the Curse of Low Revenues: The Case of Romania
by
Daniel Daianu, Professor of Economics, SNSPA BucharestElla Kallai, Chief Economist, Alpha Bank Romania
Laurian Lungu, Cardiff Business School and Macroanalitica
October 18, 2011, Bucharest

Agenda:
2
• Motivation
• The Current Crisis and the Role of Fiscal Policy Intervention in the EU,
2009-2010
• Taxes and Tax Revenues: the Romanian Experience
• Changes after the Introduction of the Flat Tax
• Taxpayers – Households and Companies
• The Shadow Economy – Implications for Tax Revenues
• Policy Recommendations

Motivation
3
Transition to harder budget constraints in public sector
Low budget revenues•Limit redistribution•Constrain public investmentand supply of public goods
Why budget revenues are
low?
How budget revenues can be
raised?
Markets’ debt tolerance reduced
•Is it due to poverty?•Are legal taxes too small?• Is it due to tax structure?•Is collection inefficiency to blame?•Is it due to taxpayers?•Is it tax evasion and shadow economy?

Current crisis and the role of fiscal policy intervention in the EU
Source: OECD, Commission services & 2010 Taxation trends
4
• Fiscal austerity, or economic policies that compensate intense deleveraging in the private sector growth? Short-term vs. medium/long-term fiscal correction.
• Large scale fiscal adjustment, in numerous developed countries, was needed even before the crisis in order to deal with pensions and health care costs. EU-27: 2007 vs 2010. Government deficit: 1% vs 7% of GDP. Public debt: 59% vs. 80% of GDP
• Scale and composition of adjustment tailored to the specific conditions of individual countries.
-25
-20
-15
-10
-5
0
5
10
0 30 60 90 120 150
stim
ulus
(+)/
cons
olid
ation
(-)
200
9-20
10, %
GD
P
General government gross debt 2009, %GDP
RO
Ee Lt
Lv
Lu
Bg
SkMt
Hu
Ie
Gr
-25
-20
-15
-10
-5
0
5
10
0 0.2 0.4 0.6
stim
ulus
(+)/
cons
olid
ation
(-)
200
9-20
10, %
GD
P
Tax revenue sensitivity to economic activity
RO
EeLt
Lv
Lu
Bg
SkMt
Hu
Ie
Gr

Current crisis and the role of fiscal policy intervention in the EU (Cont’d)
5
• Consolidation was larger than stimulus measures; Scope of fiscal stimulus was reduced in countries confronted with liquidity crises (Romania included)
• The rise in EU aggregate public debt (by 1/3) is caused by: 1. fall in tax receipts; 2. automatic stabilisers; 3. fiscal measures to mitigate decline; 4. bank bail-outs
• Ireland and Spain epitomize the role of excessive private sector indebtedness in undermining financial stability and public debt sustainability
• Public debt sustainability hinges on economic competitiveness and growth prospects (ex: Germany has a larger public debt than Spain)

• The case of NMSs:• Except Hungary, NMSs had low public debts before the crisis hit; • A liquidity crisis threatened several NMSs which had run large (double digit) external deficits and relied on heavy external borrowing• Countries implementing fiscal stimulus have debt between 15-100% of GDP• The size of public debt is not always conclusive for making a judgment on the need for immediate fiscal consolidation
• Not the size of gross debt-to-GDP drove the scale of stimulation/ consolidation, but markets’ debt intolerance and tax revenue sensitivity;
The current crisis and the role of fiscal policy intervention in the EU, 2009-2010 (Cont’d)
6

The Romanian Experience
7
Source: Eurostat, European Commission Spring Forecast 2011
• Objective: examine Romanian tax revenues performance over the last two decades; look at stylised facts of tax revenues, their dynamics, and tax policies • The decline in consolidated budget revenues in the 90s:
• a “disorganisation effect” due to economic regime change• shrinking of the tax base; number of employees fell by 35% over ’89-’98• tax rate cuts, adjustments in income tax brackets, tax exemptions/holiday
• Low tax revenues/GDP compared to NMSs (5% gap in 2009) and EU-27 (9% gap in 2009) all over the last two decades
25272931333537394143
1992
1993
1994
1995
1996
1997
1998
1999
2000
2001
2002
2003
2004
2005
2006
2007
2008
2009
2010
%GDPRevenues and expenditures of consolidated
budget
total revenues tax revenues total expenditure
-16
-14
-12
-10
-8
-6
-4
-2
0% Romanian tax revenue-to-GDP gap
vs. NMS vs. EU-27

The Romanian experience (cont’d)
8Source: Albania-IMF 2010 Article IV Consultation Preliminary Conclusion of the Mission March 19, 2010, IMF Country Report 09/73; Bulgaria-and Romania European Commission, Croatia-IMF Country Report 10/179 and 9/185, Macedonia IMF Country Report 11/42, Montenegro-IMF Country Report 9/88 and 11/100; Serbia-IMF Country Report 9/158, 10/25 and 11/95
Is poverty responsible for low tax revenue?
The thesis that this is normal for an emerging economy does not stand scrutiny: Bulgaria, Montenegro and Serbia collect more than Romania as % of GDP
GDP/capita, US$ 2009
2006 2007 2008 2009
Tax revenue-to-GDP ratio
Albania 3,808 23 23.6 24.3 23.5
Bulgaria 6,423 34.1 34.8 33.3 30.6
Croatia 14,222 35.1 35.2 35.2 34.1
Macedonia 4,515 27.9 27.8 27.4 26.1
Montenegro 6,635 35.1 37.8 37.1 35.5
Romania 7,500 28.5 29 28 27.9
Serbia 5,872 38.2 36.8 35.8 35.5
The Romanian experience (cont’d)
9Source: European Commission, IMF
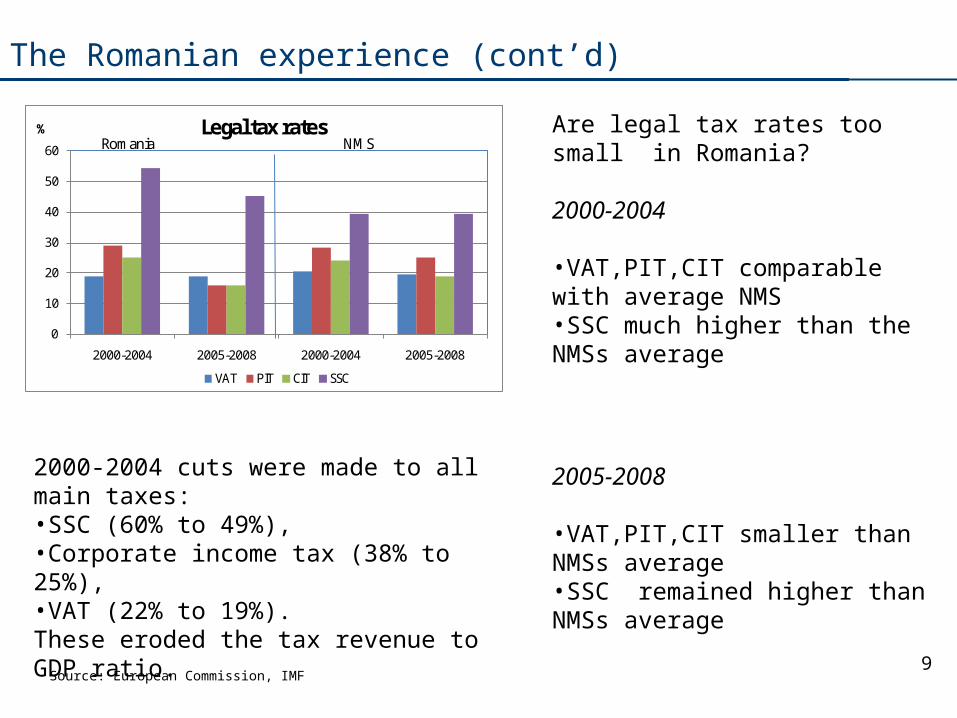
Are legal tax rates too small in Romania?
2000-2004
•VAT,PIT,CIT comparable with average NMS•SSC much higher than the NMSs average
2005-2008
•VAT,PIT,CIT smaller than NMSs average•SSC remained higher than NMSs average
0
10
20
30
40
50
60
2000-2004 2005-2008 2000-2004 2005-2008
% Legal tax rates
VAT PIT CIT SSC
Romania NMS
2000-2004 cuts were made to all main taxes: •SSC (60% to 49%), •Corporate income tax (38% to 25%), •VAT (22% to 19%). These eroded the tax revenue to GDP ratio.

Changes in Tax Revenues After the Flat Tax phased in
10Source: Eurostat
Personal income tax
(PIT)Corporate income tax
(CIT)
other
Direct taxes
VAT
Excise duties & consumption
tax
Other taxes on products (import duties including)
Indirect taxes
Other taxes on production
Employees
Employers
Self employed +non-employed
Social Security Contributions (SSC)
~consumption tax
PIT+SSC (compulsory) ~ labour tax
CIT+PIT+ other taxes on products + other tax on production ~ capital tax

Changes in tax revenues after the flat tax phased in (Cont’d)
11
Source: Eurostat
• Budgetary effects difficult to estimate. • Macroeconomic effects of flat tax introduction also difficult to disentangle from the
post-EU accession economic growth effects (massive capital inflows which bolstered tax receipts)
After 2005• No change in tax revenue as % of GDP; cyclically adjusted tax revenue has
declined• VAT increased and PIT increased marginally as % of GDP:;SSC declined; No change
in CIT• Only VAT approaches and CIT is slightly above NMS level, potential for other taxes
(excise, royalty, environmental taxes)
0
5
10
15
20
25
30
35
40
45
2000-2004 2005-2008 2000-2004 2005-2008 2000-2004 2005-2008
%G
DP
Tax revenue (including SSC)
actual cyclically adjusted
EU-27 Romania NMS
0
2
4
6
8
10
12
14
2000-2004 2005-2008 2000-2004 2005-2008 2000-2004 2005-2008
%G
DP
Tax revenue
VAT PIT CIT SSC other
EU-27 Romania NMS

Changes in Tax Revenues After the Flat Tax phased in (Cont’d)
12Source: Eurostat
0
2
4
6
8
10
12
14
16
2000-2004 2005-2008 2000-2004 2005-2008 2000-2004 2005-2008
%G
DP
By tax categories
indirect taxes direct taxes SSC
EU-27 Romania NMS
0
5
10
15
20
25
2000-2004 2005-2008 2000-2004 2005-2008 2000-2004 2005-2008
%G
DP
By economic functions of taxes
tax on consumption tax on labour tax on capital
EU-27 Romania NMS
•The main pillars of tax revenues •indirect taxes and SSC•consumption tax and labor tax
After 2005•The revenues from indirect taxes increased compensating the decline of SSC•Revenues from consumption tax exceeded the revenue from labour tax
Implicit Tax Rates and Tax Collection Efficiency
13
Source: own computation based on Eurostat
Romania
0
10
20
30
40
50
60
70
80
2000 2001 2002 2003 2004 2005 2006 2007 2008 2009
VAThouseholds' income taxcorporate income taxsocial security contribution
% NMSs
0
10
20
30
40
50
60
70
80
2000 2001 2002 2003 2004 2005 2006 2007 2008 2009
VAThouseholds' income taxcorporate income taxsocial security contribution
%
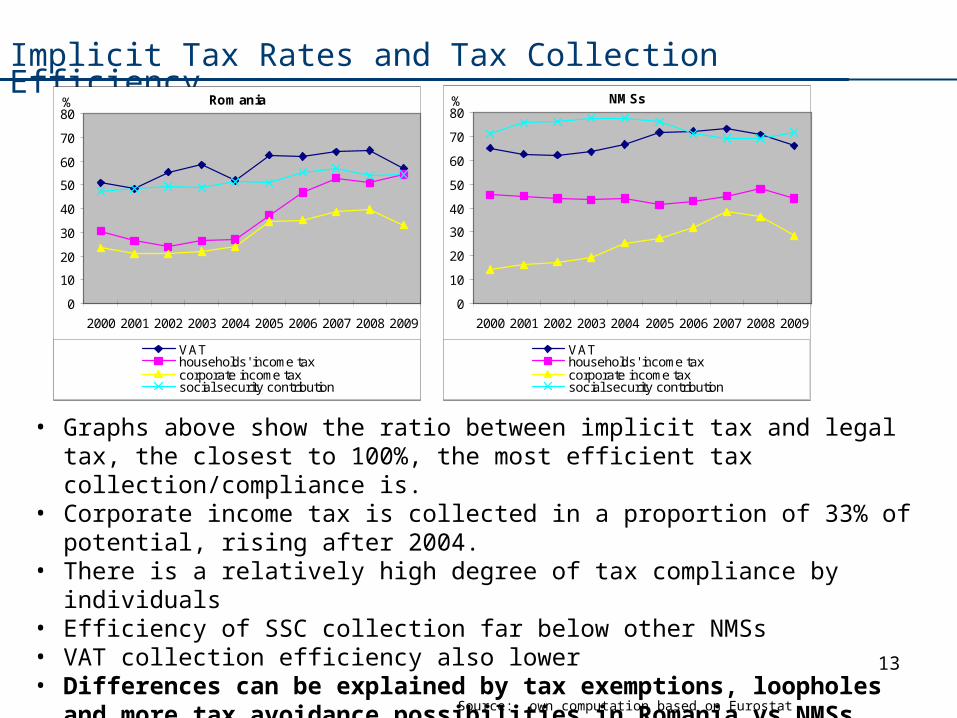
• Graphs above show the ratio between implicit tax and legal tax, the closest to 100%, the most efficient tax collection/compliance is.
• Corporate income tax is collected in a proportion of 33% of potential, rising after 2004.
• There is a relatively high degree of tax compliance by individuals• Efficiency of SSC collection far below other NMSs• VAT collection efficiency also lower • Differences can be explained by tax exemptions, loopholes and more tax
avoidance possibilities in Romania vs NMSs

Implicit Tax Rates and Tax Collection Efficiency (Cont’d)
14Source: Eurostat, European Commission Taxation trends, 206-2011
VAT
0.0
5.0
10.0
15.0
20.0
25.0
2000-2004 2005-2008 2000-2004 2005-2008
%
legal tax rate implic it tax rate
R omania NMS
gap=7.3% gap=7.4% gap=5.8%gap=9%
S S C
0.0
10.0
20.0
30.0
40.0
50.0
60.0
2000-2004 2005-2008 2000-2004 2005-2008
%
legal tax rate implic it tax rate
R omania NMS
gap=20.7%gap=9.3% gap=11.1%
gap=26.9%
• Revenues from VAT,SSC,PIT and CIT 80% of tax revenues
After 2005:
• Tax collection efficiency increased for both VAT and SSC (gap between legal tax rate and implicit tax rate reduced)
• Tax collection efficiency for VAT approaches NMSs performance
• SSC collection efficiency remained far bellow NMSs performance
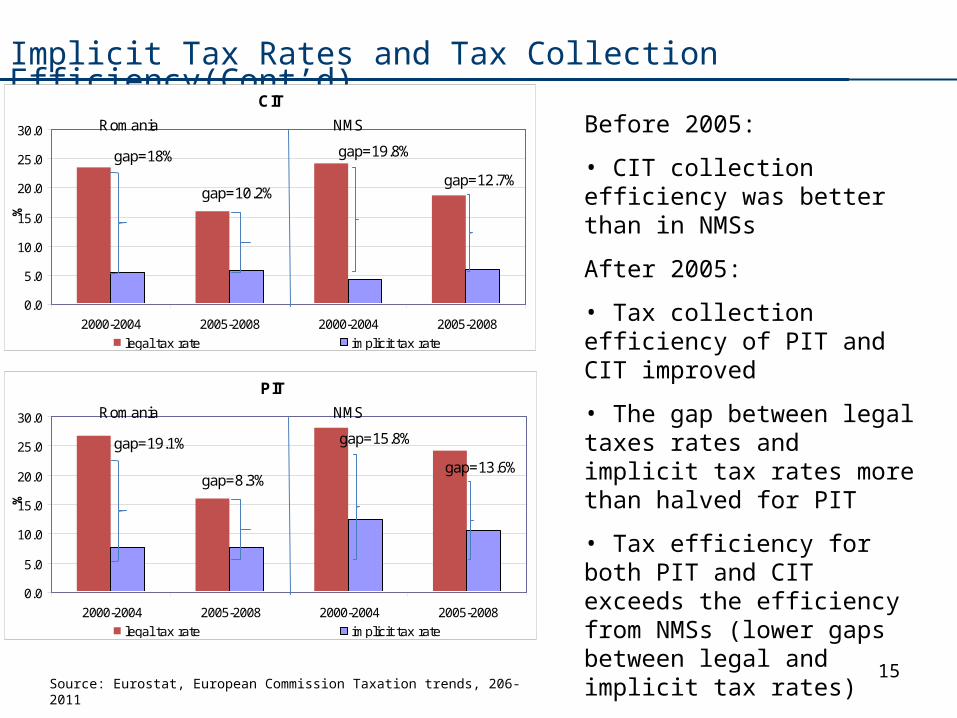
Implicit Tax Rates and Tax Collection Efficiency(Cont’d)
15Source: Eurostat, European Commission Taxation trends, 206-2011
C IT
0.0
5.0
10.0
15.0
20.0
25.0
30.0
2000-2004 2005-2008 2000-2004 2005-2008
%
legal tax rate implic it tax rate
R omania NMS
gap=10.2%
gap=19.8%
gap=12.7%
gap=18%
Before 2005:
• CIT collection efficiency was better than in NMSs
After 2005:
• Tax collection efficiency of PIT and CIT improved
• The gap between legal taxes rates and implicit tax rates more than halved for PIT
• Tax efficiency for both PIT and CIT exceeds the efficiency from NMSs (lower gaps between legal and implicit tax rates)
P IT
0.0
5.0
10.0
15.0
20.0
25.0
30.0
2000-2004 2005-2008 2000-2004 2005-2008
%
legal tax rate implic it tax rate
R omania NMS
gap=8.3%
gap=15.8%
gap=13.6%
gap=19.1%

Taxpayers: Tax Revenues
16Source: European Commission, Taxation trends in 2011
5
7
9
11
13
15
17
%GDP Personal income tax and social contribution paid by individuals
ro EU27 NMS
8.59
9.510
10.511
11.512
12.5
% GDP Corporate income tax and social contribution paid by employers
ro EU27 NMS
• The taxes paid by employers was around 9% of GDP (2002-2008) and 8.5% of GDP in 2009;• Taxes paid by individuals increased from near 5% of GDP in 2005 to 7% of GDP in 2009; • Voluntary payment compliance for all taxpayers was 78.9% in 2010

Taxpayers: Households (HH)
17Note: * taxes on wages, pensions, independent activities, social security contribution, unemployment contribution and health insurance
Source: Households budget survey, INSSE
05
101520253035404550
2000-2004 2005-2008 2000-2004 2005-2008 2000-2004 2005-2008
%
Households' income-to-GDP/capitaemploees HH agricultural HH retiree HH
77
17
1.5 4.5
Taxes* paid by households
employees HH retiree HHagricultural HH other HH
37
44
8
11
Number of households
employees HH retiree HHagricultural HH other HH
In 2009• 37% of HH are employee HH and pay 77% of HHs’ taxes• The tax revenue from agricultural income extremely small• 44% of HH retirees and pay 1.3% of HHs’ taxes
In 2005-2008 • Employees HH average annual income ~ 44% of GDP/capita• Agricultural HH average annual income ~ 25%of GDP/capita• Retiree HH average annual income ~36% of GDP
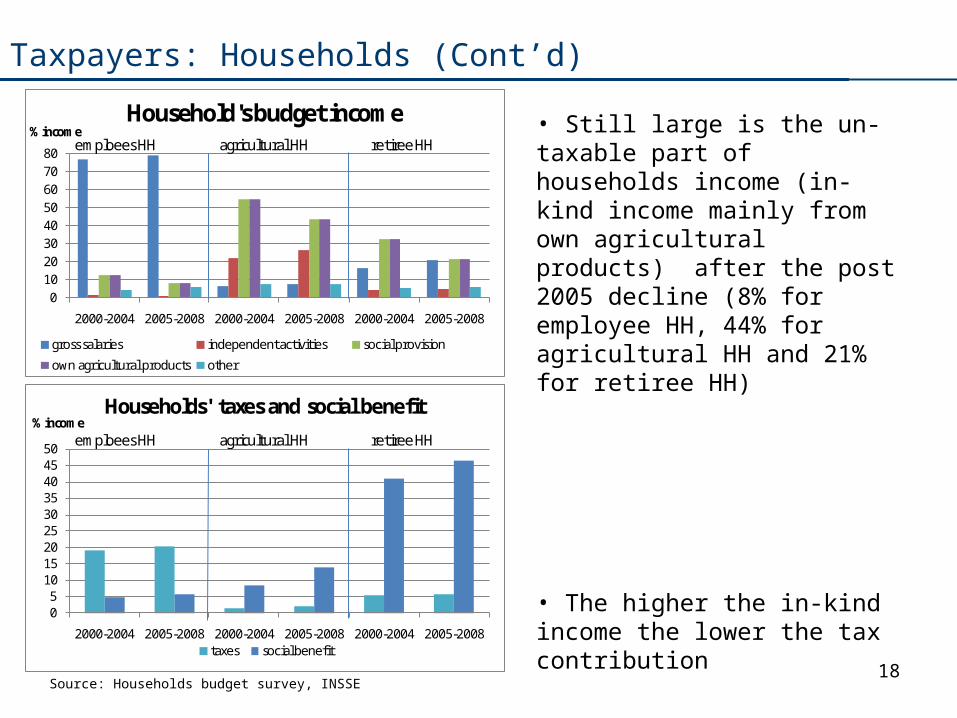
Taxpayers: Households (Cont’d)
18Source: Households budget survey, INSSE
• Still large is the un-taxable part of households income (in-kind income mainly from own agricultural products) after the post 2005 decline (8% for employee HH, 44% for agricultural HH and 21% for retiree HH)
• The higher the in-kind income the lower the tax contribution
01020304050607080
2000-2004 2005-2008 2000-2004 2005-2008 2000-2004 2005-2008
% incomeHousehold's budget income
gross salaries independent activities social provision
own agricultural products other
emploees HH agricultural HH retiree HH
05
101520253035404550
2000-2004 2005-2008 2000-2004 2005-2008 2000-2004 2005-2008
% incomeHouseholds' taxes and social benefit
taxes social benefit
emploees HH agricultural HH retiree HH

Taxpayers: Households (Cont’d)
19Source: Households budget survey, INSSE
• 80% of HH have the average annual income lower than 60% of GDP/capita
• Only the richest 10% of households’ annual average income exceeds the GDP/capita
0
20
40
60
80
100
%
Households' income-to-GDP/capita, by income decilesd1 d2 d3 d4 d5 d6 d7 d8 d9 d10
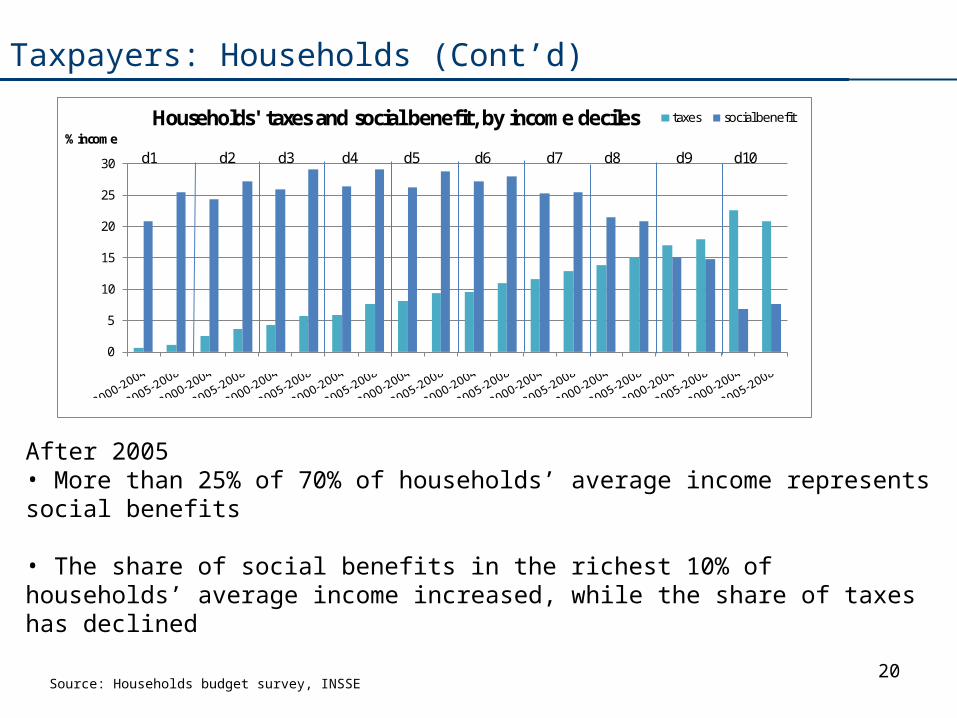
Taxpayers: Households (Cont’d)
20Source: Households budget survey, INSSE
After 2005• More than 25% of 70% of households’ average income represents social benefits
• The share of social benefits in the richest 10% of households’ average income increased, while the share of taxes has declined
0
5
10
15
20
25
30
% incomeHouseholds' taxes and social benefit, by income deciles taxes social benefit
d1 d2 d3 d4 d5 d6 d7 d8 d9 d10

Taxpayers: Households (Cont’d)
21Source: Households budget survey, INSSE
After 2005• The tax burdenslightly shifted towards the middle income 60% of households; they pay 42.6% of total taxes (vs. 41% before 2005) • The poorest 20% of households pay 1.9% of taxes (vs. 2.1% before 2005)• The richest 20% of households pay 55.5% of taxes (vs. 56.9% before 2005)• The tax contribution of all households increased, excepting the richest 10% of households
0
5
10
15
20
25
30
35
40
% totalHouseholds' taxes and social benefit shares taxes social benefit
d1 d2 d3 d4 d5 d6 d7 d8 d9 d10

Taxpayers: Companies
22Source: Eurostat, European Commission Spring Forecast 2011
2.19 1.69 1.34 1.22 1.66 1.76
0.19 0.15
0.15 0.12 0.12 0.13
2.40
1.73
1.30 1.09
1.50 1.60
0.26
0.12
0.10 0.09
0.08 0.09
0.0
1.0
2.0
3.0
4.0
5.0
dec.2005 dec.2006 dec.2007 dec.2008 dec.2009 iun.2010
% GDPFig. A3.1 Arrears to consolidated general
budget, by type
social insurance special funds state budget local budgets
5.03
3.7
2.892.51
3.363.57
1.14 0.99 0.79 0.78 1.13 1.18
0.04 0.04
0.05 0.04
0.05 0.06
1.03 0.83
0.61 0.55
0.78 0.79
0.14
0.04
0.03 0.04
0.04 0.04
0.0
1.0
2.0
3.0
dec.2005 dec.2006 dec.2007 dec.2008 dec.2009 iun.2010
% GDPFig. A3.2 Arrears to consolidated general
budget of state companies, by type
social insurance special funds state budget local budgets
2.3
1.891.48
1.4
1.99 2.07
• CIT revenues 2.5% of GDP; SSC paid by employers 6.1% of GDP in 2009. • Arrears a systemic problem. Arrears to GCB rose to 4.2% of PIB in 2010. • 45% of the arrears to the consolidated budget represent arrears to state
budget• More than half of tax arrears are created by state companies• Mining, manufacturing and services are major arrears generators: they
generate 30.5%, 21% and 21% respectively of all arrears to GCB

The Shadow Economy – Implications for Tax Revenues
23Source: European Commission Spring Forecast 2011
GDP shadow economy (bn RON) 180 139 98 GDP shadow economy as % of 2010 GDP 35 27 19 Total fiscal evasion (as % of GDP), of which: 16.0 12.3 8.7 SSC 5.9 4.5 3.2 VAT 8.4 6.5 4.6 PIT 1.8 1.4 1.0
• Estimations of the shadow economy vary substantially – 3 scenarios considered
• If the size of the shadow economy were 27% of GDP, or RON 139 Ron, fiscal evasion would amount to some 12.3% of GDP. In this case, full compliance of paying taxes would bring to the budget revenues equivalent to 12.3% of GDP (assuming a VAT rate of 24%). VAT revenues alone would rise by 6.5% of GDP

Shadow Economy, Estimated Size (Cont’d)
24Source: European Commission Spring Forecast 2011
Share of informal economy brought to light
The size of the informal economy, % of total output
35 27 19 0.3
SSC 1.0 0.8 0.6 VAT 1.5 1.1 0.8 PIT 0.4 0.3 0.2 Increase in budgetary revenues
2.9 2.2 1.6
0.5
SSC 1.7 1.3 0.9 VAT 2.4 1.9 1.3 PIT 0.7 0.5 0.4 Increase in budgetary revenues
4.8 3.7 2.6
0.7
SSC 2.4 1.8 1.3 VAT 3.4 2.6 1.9 PIT 1.0 0.8 0.5 Increase in budgetary revenues
6.8 5.2 3.7
• Diminishing the size of informal economy would have considerable positive budgetary implications

Conclusions and Policy Recommendations
25
• Fiscal consolidation is not achieved. Tolerance of markets to high budget
deficits is increasingly lower.
• Tax revenues to GDP ratio in Romania is extremely low there is much
leeway for raising the revenue/GDP ratio significantly. How to do it?
• Need a fiscal strategy for the long term. Define a clear tax policy concept: tax
more personal income or consumption? Such an approach involves a forward-
looking attitude to tax policy.
• Any change in fiscal policy should have its main objective in keeping budget
deficit below 3% of GDP in the medium and long term - and as close to zero
as possible.
• Strive towards achieving optimal tax – more analyses need to be done here.
The implicit tax rates suggest the current tax structure is not optimal.

• Is there a potential to raise the tax base? Potential tax adjustments relating to
household’s wealth (including agricultural land) or royalties. However, such
tax adjustments should pay attention to household’s work/saving incentives,
poverty of many farmers, as well as the effects on companies’ investment
plans.
• Fiscal strategy should focus on fiscal consolidation. Fiscal consolidation
should target raising fiscal revenues, since there is an enormous
leeway in this respect. Follow a ratio of 4:1 between reduced government
spending and tax increases? Fiscal consolidation should entail restructuring
government spending to support economic growth.
• EU funds could much mitigate the pains and pro-cyclicality of fiscal
consolidation in an adverse external environment.
Policy recommendations (Cont’d)
26

• Changes in fiscal policy should be pre-announced after comprehensive
analyses estimating the impact of the changes on the economy. Predictability
of fiscal policy is paramount in times of global uncertainty.
• Pay attention to the impact of the EU governance reform
• Reduce shadow economy: compliance procedures, efficiency in detecting
non-compliance, severe penalties for those who practice and perpetrate tax
evasion (including lay-offs of public sector employees)
• Increase administrative effectiveness and efficiency : Consolidating local tax
offices; Improving information systems and information technology
management as well as the operational capacity; Improve human resource
management function and strategy
• Stimulate domestic savings via tax allowances and support activities that can
improve Romania’s competitiveness – the fairness concept
Policy recommendations (Cont’d)
27
Adopt a ‘Transparency and Credibility’ Package
28
• Causes for low tax revenues collection:
• Weaknesses of institutions responsible for collecting tax revenues
• Population’s perception that the value of public services offered in
exchange for the taxes it pays is extremely low
• Fairness. Government spending on various projects is often perceived
( and sometimes it is proved to be so) to be made to firms belonging to a
political clientele
• Individual ethical conduct, an important disciplining device based on the
principle of self regulation, is permanently dissuaded

Adopt A ‘Transparency and Credibility’ Package; Suggestions
29
• Announce full transparency of government spending programs- open bidding process; spending benchmarks.
• Announce clear strategies for investments in infrastructure, health care and education by nominating specific projects together with their costs and completion time.
• Local public utilities: have tariffs and costs be published on the internet so as to foster benchmarking and competition.
• Cost-benefit analysis should be done effectively (no public investment above a certain threshold be done without such a thorough analysis).

Adopt A ‘Transparency and Credibility’ Package; Suggestions (Cont’d)
30
• Budgeting and human resource management in the public sector should shift from inputs to objectives and performance.
• Set up an independent Audit Office to monitor public sector spending.
• Make it easier for companies and individuals to pay their taxes. Simplify tax forms and improve mechanisms for online payment.
• Announce a firm plan for tax reductions (SSCs for instance).The plan should have a 2-3 years horizon and its continuation should be conditional on the increased compliance in paying taxes.
• Raise penalties for tax evasion so that these would act as a deterrent.

Tax Policy Under the Curse of Low Revenues: The Case of Romania
by
Daniel Daianu, Professor of Economics, SNSPA BucharestElla Kallai, Chief Economist, Alpha Bank Romania
Laurian Lungu, Cardiff Business School and Macroanalitica
October 18, 2011, Bucharest