Embed Size (px)
Citation preview
WP/07/274
Tax Policy: Recent Trends and Coming Challenges
John Norregaard and Tehmina S. Khan

© 2007 International Monetary Fund WP/07/274 IMF Working Paper Fiscal Affairs Department
Tax Policy: Recent Trends and Coming Challenges
Prepared by John Norregaard and Tehmina S. Khan
Authorized for distribution by Isaias Coelho
December 2007
Abstract
This Working Paper should not be reported as representing the views of the IMF. The views expressed in this Working Paper are those of the author(s) and do not necessarily represent those of the IMF or IMF policy. Working Papers describe research in progress by the author(s) and are published to elicit comments and to further debate.
This paper provides an overview of the key economic factors that shape tax policy reform in many high-income countries, developing countries, and/or transition economies. The paper describes and evaluates global and regional developments with respect to tax rates and revenue ratios over the last some 20 years, and discusses selected structural reform initiatives that have been high on the policy agenda over this period. In particular, it focuses on developments relating to experiments with the restructuring of corporate tax, the impact of corporate taxes on FDI, key reform initiatives including dual income taxes and flat taxes, as well as the worldwide spread of the VAT and policy developments associated with climate change and natural resource taxation. JEL Classification Numbers: H20, H21, H23, H24, H25, H26 Keywords: Tax reform, personal income tax, corporate income tax, value-added tax, tax
wedge, tax competition, green taxes Author’s E-Mail Address: [email protected]; [email protected]. Acknowledgements: We are grateful to A. M. Abdel-Rahman, Alexander Klemm, Emil Sunley, Jon Strand, Michael Keen, Sanjeev Gupta, and colleagues in the Tax Policy Division of the IMF for many helpful suggestions and comments. We would also like to thank Asegedech WoldeMariam for her assistance with the VAT map, which could not be reproduced as part of this paper but can be found at http://www.imf.org/external/pubs/ft/wp/2007/maps/vatmap.pdf.
2
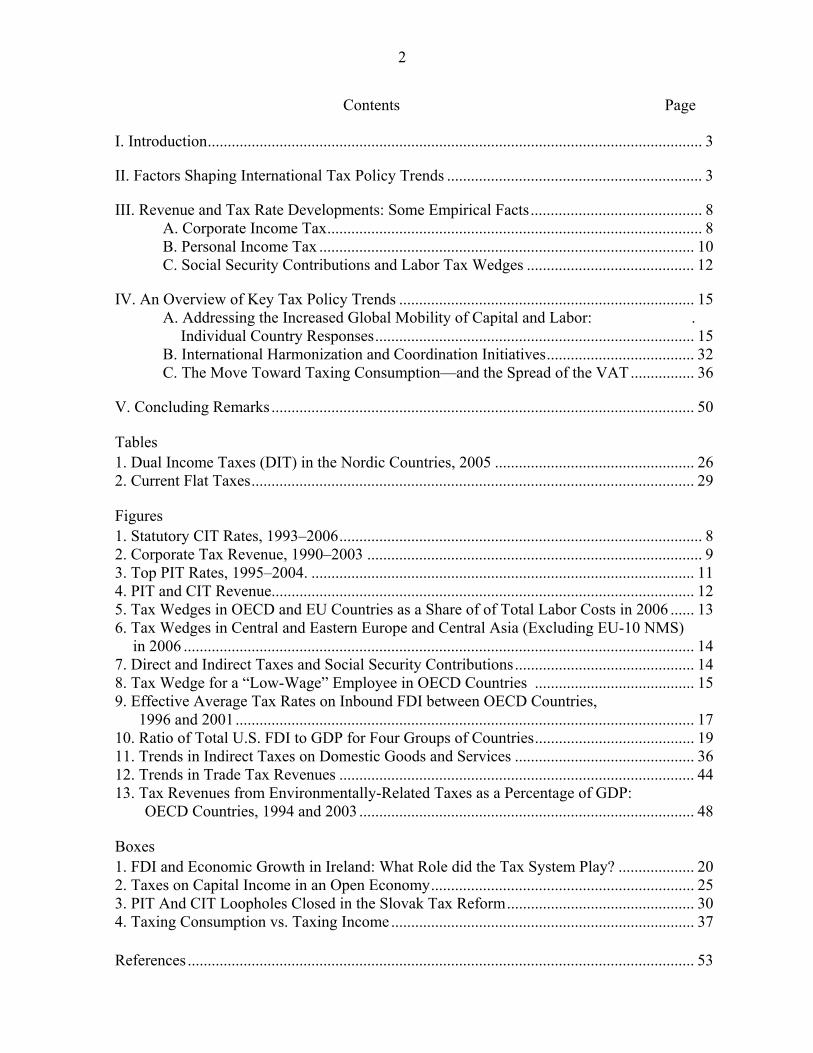
Contents Page
I. Introduction............................................................................................................................ 3
II. Factors Shaping International Tax Policy Trends ................................................................ 3
III. Revenue and Tax Rate Developments: Some Empirical Facts........................................... 8 A. Corporate Income Tax.............................................................................................. 8 B. Personal Income Tax .............................................................................................. 10 C. Social Security Contributions and Labor Tax Wedges .......................................... 12
IV. An Overview of Key Tax Policy Trends .......................................................................... 15 A. Addressing the Increased Global Mobility of Capital and Labor: .
Individual Country Responses................................................................................ 15 B. International Harmonization and Coordination Initiatives..................................... 32 C. The Move Toward Taxing Consumption—and the Spread of the VAT................ 36
V. Concluding Remarks .......................................................................................................... 50 Tables 1. Dual Income Taxes (DIT) in the Nordic Countries, 2005 .................................................. 26 2. Current Flat Taxes............................................................................................................... 29 Figures 1. Statutory CIT Rates, 1993–2006........................................................................................... 8 2. Corporate Tax Revenue, 1990–2003 .................................................................................... 9 3. Top PIT Rates, 1995–2004. ................................................................................................ 11 4. PIT and CIT Revenue.......................................................................................................... 12 5. Tax Wedges in OECD and EU Countries as a Share of of Total Labor Costs in 2006 ...... 13 6. Tax Wedges in Central and Eastern Europe and Central Asia (Excluding EU-10 NMS)
in 2006 ................................................................................................................................ 14 7. Direct and Indirect Taxes and Social Security Contributions............................................. 14 8. Tax Wedge for a “Low-Wage” Employee in OECD Countries ........................................ 15 9. Effective Average Tax Rates on Inbound FDI between OECD Countries,
1996 and 2001................................................................................................................... 17 10. Ratio of Total U.S. FDI to GDP for Four Groups of Countries........................................ 19 11. Trends in Indirect Taxes on Domestic Goods and Services ............................................. 36 12. Trends in Trade Tax Revenues ......................................................................................... 44 13. Tax Revenues from Environmentally-Related Taxes as a Percentage of GDP:
OECD Countries, 1994 and 2003 .................................................................................... 48 Boxes 1. FDI and Economic Growth in Ireland: What Role did the Tax System Play? ................... 20 2. Taxes on Capital Income in an Open Economy.................................................................. 25 3. PIT And CIT Loopholes Closed in the Slovak Tax Reform............................................... 30 4. Taxing Consumption vs. Taxing Income............................................................................ 37 References ............................................................................................................................... 53
3
I. INTRODUCTION
While Benjamin Franklin may have been right that death and taxes are the only certain things in life,1 this certainty definitely does not extend to the way taxes are levied: tax systems are continuously changing as countries align their tax systems with evolving economic, political, and administrative conditions.2 This prompts the question whether there are factors at work that “steer” tax reform efforts of different countries, regionally or globally, broadly in the same direction? And if so, what insights can individual countries gain from that process? A central policy issue in recent years has been the implications for the stability of tax bases of economic integration and the ever increasing mobility of capital (physical as well as financial), labor, and goods and services. It is worth noting, though, that the specific policy challenges differ widely across countries, with developing countries focusing, in particular, on attracting investment and raising revenue to promote development, and developed countries predominantly preoccupied by safeguarding their tax bases to preserve the welfare state and to meet the challenges of ageing. This note provides an overview of the key economic factors shaping tax policy reform in many high-income countries, developing countries, and/or transition economies. It discusses selected reform initiatives that have been high on the policy agenda over the last some 20 years,3 and those that are likely to be important in the coming years. Section II discusses some of the more important determining factors that have shaped tax reform initiatives over the same period, while section III provides a summary of quantitative global and regional developments with respect to tax rates and revenue ratios over this period. Section IV discusses selected specific commonalities in actual tax reforms implemented around the globe over the same time span, and section V concludes. Despite the fairly short span of time, a wide spectrum of tax reforms were implemented. Hence, the approach adopted is eclectic and the presentation of the issues to some degree “impressionistic.”
II. FACTORS SHAPING INTERNATIONAL TAX POLICY TRENDS
Truly global tax reform movements, with a majority of countries adopting broadly similar policy measures, rarely occur—perhaps with the global spread of the VAT over the last 40 years as the most notable exception, with the fall in statutory corporate tax rates coming in as a close second (both phenomena dealt with in what follows)4. However, we frequently 1 “In this world, nothing can be said to be certain, except death and taxes.” Benjamin Franklin, 1789, in a letter to Jean-Baptiste Leroy.
2 In fact, a whole “industry” has emerged that on a daily basis scrutinizes and reports on global tax reform initiatives.
3 Useful recent reviews of tax reform trends are provided in Zee (2004) and Owens (2006).
4 In the late 19th and 20th centuries, the most notable evolution was the emergence and global spread of the income tax.
4
observe common patterns, at least on a regional basis, in tax reforms adopted by different countries over a given period. We believe there are, in fact, underlying factors that induce countries to adopt broadly similar approaches to tax reform over given periods of time with the following ones mentioned in no particular order and frequently overlapping: Globalization of economic activity—i.e., the ever increasing ease with which saving and investment, factors of production, and goods and services can move and do move across borders—is the most frequently noted development.5 This increased mobility has far-reaching consequences for tax policy design, and often gives rise to complicated technical issues (e.g., international allocation of taxation rights; taxation of e-commerce), and sensitive issues of cross-border policy coordination (e.g., attempts by the EU to establish a uniform corporate tax base). In some sense, this development has not in itself presented altogether new tax policy issues, since taxation has always affected behavior and thereby tax bases, and governments have always responded by trying to adopt tax systems to minimize costs and preserve tax bases. But globalization has accentuated the need for continuous adaptation and deepened international cooperation (although some would say that there is no need for increased cooperation, tax competition on the whole being beneficial), and increased the stakes by raising the potential costs of not following suit. Important examples that come to mind include the widening popularity of “flat” taxes, the ever growing use of tax-based incentives that countries apply to attract foreign investors, and the ensuing attempts to establish international “rules of the game” to prevent suboptimal outcomes. Another is the continued deepening of international financial intermediation as reflected, for example, in the emergence of significant off-shore financial centers—in large measure driven by attempts to shield investors from taxation in the jurisdictions where they reside. Employment creation and the need to remove labor tax impediments to labor demand and supply, while perhaps not a global phenomenon, has featured high on the policy agenda in many countries, not least in the EU and OECD areas, as well as in most transition economies. This trend could be seen in the broader context of globalization, which has exposed labor markets in many (particularly developed) countries to increasing competition from low-wage economies and forced structural changes, perhaps, most prominently reflected in attempts to reduce aggregate tax wedges on labor in tandem with reformed benefit systems and other flexibility enhancing labor market reforms.6
5 Although land constitutes the only truly immobile factor of production, cross-border land ownership is far from unusual, and changing ownership patterns can be associated with important financial flows with ramifications for tax bases and tax policy.
6 The so-called “flexicurity model” first adopted in Denmark is one such approach, where it is regarded as a mix (“golden triangle”) of flexibility in the labor market (the ability to easily hire and fire workers) combined with social security for workers and proactive labor market policies http://www.bm.dk/sw3792.asp.
5
A subtle change of views on the equity-efficiency tradeoff, while frequently hard to accurately discern in practice or to distinguish clearly from the forces of globalization, may have importantly affected recent tax policy formulation. In one interpretation, not unequivocally supported by empirical evidence, more attention to efficiency aspects of taxation—supported by optimal tax literature,7 actual experience with extremely high marginal income tax rates in the 1970s/1980s as well as evidence that for all their progressivity, tax systems are largely proportional8—may have been a participatory factor behind a number of fairly recent policy trends, such as the larger role accorded to consumption taxes and the apparent sacrifice of the principle of global income taxation in favor of, for example, the dual income tax (DIT) and (both discussed in more detail in what follows). “Herd behavior,” or put somewhat more positively, adopting tax policy reform that for some reason becomes fashionable among economists and politicians at different points in time, is another factor of some potential importance, although its importance is very hard to assess in practice. This behavior is, in part, driven by political economy factors, with governments eager to demonstrate decisiveness, but using reform models that may have proven successful elsewhere. Examples include the move toward global income taxes in the 1980s–90s; and introduction of green taxes in the 1990s, and flat taxes in the 2000s. In some cases, it is hard to distinguish this behavior from the effects of globalization (e.g., DIT). There are prominent examples of this phenomenon taking the form of attempts to emulate success stories (Ireland on “low” taxes, see Box 1, and Russia on flat taxes).9 Again, it could be held, taking the flat tax as an example, that there is nothing inherently innovative in this approach, which adopts the same underlying rationale that was driving the reforms of the 1980s/90s. However, these reforms have provided important cases for research on effects of specific tax reforms.10 Somewhat related to the concept of herd behavior, but, perhaps, more satisfying to economists, is the idea of “yardstick competition,” which represents an alternative explanation for interdependence in tax setting behavior across jurisdictions to the standard direct competition for tax bases: under yardstick competition (or tax mimicking), governments are judged relative to their neighbors, and voters and potential investors take a country’s tax system and tax rate as a signal of its wider competence and attitudes toward business (Besley and Case, 1995). In practice, however, there is an issue of how to distinguish this
7 Diamond and Mirrlees (1981), Atkinson and Stiglitz (1976), Sandmo (1976). Also see Sørensen (2007).
8 Pechman and Okner (1974) , Musgrave, Case and Herman (1974) are early contributions.
9 There are some indications that, in both cases, the impact of tax policy factors may have been misinterpreted and/or overstated, see Box 1 and the discussion of the flat tax in section IV.
10 An interesting question in this regard is what would have happened with the flat tax “movement’ had the Russian flat tax reform failed to increase revenue?
6
phenomenon from standard tax competition using rate reductions and tax incentives to attract tax bases. Initiatives to strengthen regional economic policy coordination, to induce economic integration and to stimulate growth. Again, these initiatives could be seen in the context of globalization as a means of strengthening economic development and competitiveness of regional groupings. Frequently, they are characterized by a dominant tax policy component, as reflected most clearly in the multitude of customs unions established over the last couple of decades and more that are likely to follow—the most recent initiative being the possible establishment of a Central America Customs Union (CACU)—against the backdrop of sluggish Doha negotiations, typically followed by efforts to harmonize also other tax policies. The EU probably constitutes the best known example, but many other examples of deeper regional harmonization efforts exist (including efforts to establish codes of conduct on tax incentives in Latin American and African groupings, similar to that of the EU). There is a broad range of configurations from the highly formalized EU system to simple customs unions without any revenue pooling mechanisms. Devolution of political and fiscal powers to lower level of government which could be seen as complementary to the partial transfer of national fiscal autonomy to supranational “entities,“ have continuously taken place in numerous countries during recent decades.11 While this has been a development of “stealth”, attracting far less attention than some of the issues enumerated above, it has, nevertheless, importantly shaped the structure of countries’ tax systems. There are very large differences across countries in the policies adopted, with no obvious common policy direction, although one common central concern has been proper tax assignment, i.e., which taxes should be raised centrally, and shared one way or the other with sub-national governments, and which are better raised by local governments, such as property taxes (see Ahmed and Brosio (2006), and Norregaard (1997) in Ter-Minassian (ed.,), (1997)), for a comprehensive discussion of these issues). The strong push for increased—and geographically more spread—natural resource exploration, which has followed the broad-based rise in natural resource prices in recent years (in turn, related to the global economic expansion referred to below), has lead to sharply increased attention to natural resource taxation, and has featured with increasing prominence in the policy debate—not least because of the increase in new oil discoveries (as in East Timor, Ghana, Mauritania, and Uganda). A core question in this area relates to how governments can best share the income stream from resource wealth with private extracting companies for the common good of present and future generations (see IMF (2003)12 for a
11 For a recent discussion of fiscal decentralization over the last two decades in Latin America and East Asia, see Escobar-Lemmon (2001) and Wescott (2005).
12 http://www.imf.org/external/pubs/ft/grrt/eng/060705.htm.
7
discussion of these issues). Another issue pertinent to many of these countries (albeit not discussed in this note) is the appropriate design of domestic or non-oil tax systems. Increasing popular and political concerns about pollution, greenhouse gas (GHG) emissions, and climate change has led to stronger pressures for the application of remedial fiscal instruments, including the use of “green” taxes and, more lately, by “carbon” taxes.13 This is, perhaps, the most important recent development that could be suggestive of the direction of future tax policy trends. It has, however, so far basically manifested itself only in developed countries and with fairly limited actual policy action. With green taxes, countries seek to exploit the twin benefits of correcting for environmental externalities, including to mitigate GHG emissions, and apply revenues to reducing taxes on labor in an attempt to stimulate employment growth.14 The extent of truly global externalities associated with GHG emissions would imply the need for close international policy coordination. However, this is an area where the EU—despite potential adverse implication for the competitiveness of EU- based companies—have decided to take a first decisive step, undoubtedly in the hope that others will follow suit, including through accession to the EU-ETS, as discussed in section IV. Cyclical factors, finally, may play an important role in shaping tax policies. There are, for example, signs that this have been the case recently, with the world economy still in the midst of an extraordinary expansion, based on strong global economic fundamentals, and with 2007 set to become the fifth year with sustained growth at the highest level since the late 1960s, at close to 5 percent.15 The resulting cyclical “dividend” has lead to a general easing of budgetary constraints in many countries, and may have provided an incentive that, in part, explains the tax rate reductions described below (although, again, this policy factor is hard to distinguish from effects of globalization). If this is, indeed, a participatory factor, the underlying structural fiscal balances together with automatic fiscal stabilizers may have been severely weakened, contributing to a procyclical, and thereby potentially destabilizing fiscal policy stance. The dangers of weakened structural fiscal balances over the longer term are also particularly relevant for those economies (usually high income and/or transition economies) that are currently facing the combined challenges of increased longevity and reduced population birthrates, and whose costs of financing social pensions and health care systems are expected to climb over time.
13 Although there are some early signs that the appetite for additional environmental taxes in Europe is fading, see discussion in section IV.
14 However, some observers have argued that these taxes are, in fact, quite similar to labor taxes: to the extent that taxes on household energy use reduce the amount of real income available to households, these are equivalent to an increase in income tax. This suggests that the appropriate level of a pollution tax is one below the level otherwise considered optimal if considered purely from the perspective of mitigating a negative environmental externality (Bovenberg, 1999).
15 Assuming that the widespread financial disturbance during mid/end-year will not significantly slow economic growth.
8
III. REVENUE AND TAX RATE DEVELOPMENTS: SOME EMPIRICAL FACTS This section provides basic data on developments in key tax rates and revenue ratios for different regions since the early 1990s, as a background for the conceptual discussion in section IV.
A. Corporate Income Tax (CIT)
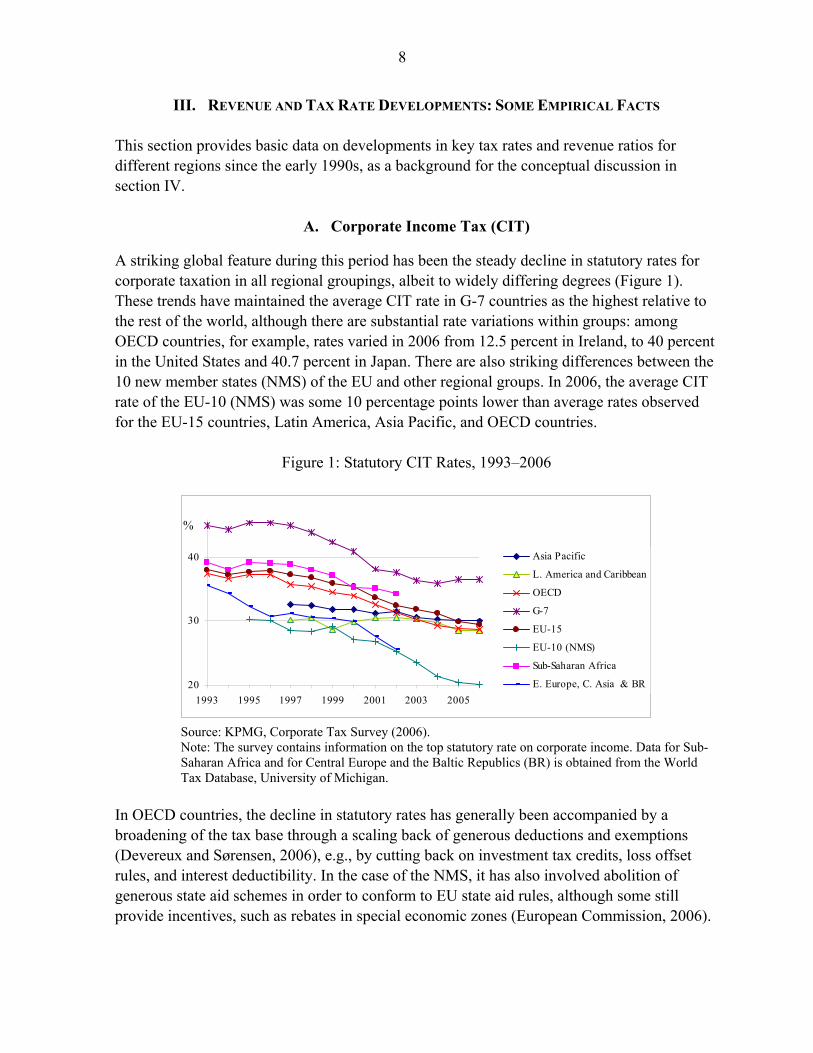
A striking global feature during this period has been the steady decline in statutory rates for corporate taxation in all regional groupings, albeit to widely differing degrees (Figure 1). These trends have maintained the average CIT rate in G-7 countries as the highest relative to the rest of the world, although there are substantial rate variations within groups: among OECD countries, for example, rates varied in 2006 from 12.5 percent in Ireland, to 40 percent in the United States and 40.7 percent in Japan. There are also striking differences between the 10 new member states (NMS) of the EU and other regional groups. In 2006, the average CIT rate of the EU-10 (NMS) was some 10 percentage points lower than average rates observed for the EU-15 countries, Latin America, Asia Pacific, and OECD countries.
Figure 1: Statutory CIT Rates, 1993–2006
20
30
40
1993 1995 1997 1999 2001 2003 2005
%
Asia Pacific
L. America and Caribbean
OECD
G-7
EU-15
EU-10 (NMS)
Sub-Saharan Africa
E. Europe, C. Asia & BR
Source: KPMG, Corporate Tax Survey (2006). Note: The survey contains information on the top statutory rate on corporate income. Data for Sub-Saharan Africa and for Central Europe and the Baltic Republics (BR) is obtained from the World Tax Database, University of Michigan.
In OECD countries, the decline in statutory rates has generally been accompanied by a broadening of the tax base through a scaling back of generous deductions and exemptions (Devereux and Sørensen, 2006), e.g., by cutting back on investment tax credits, loss offset rules, and interest deductibility. In the case of the NMS, it has also involved abolition of generous state aid schemes in order to conform to EU state aid rules, although some still provide incentives, such as rebates in special economic zones (European Commission, 2006).
9
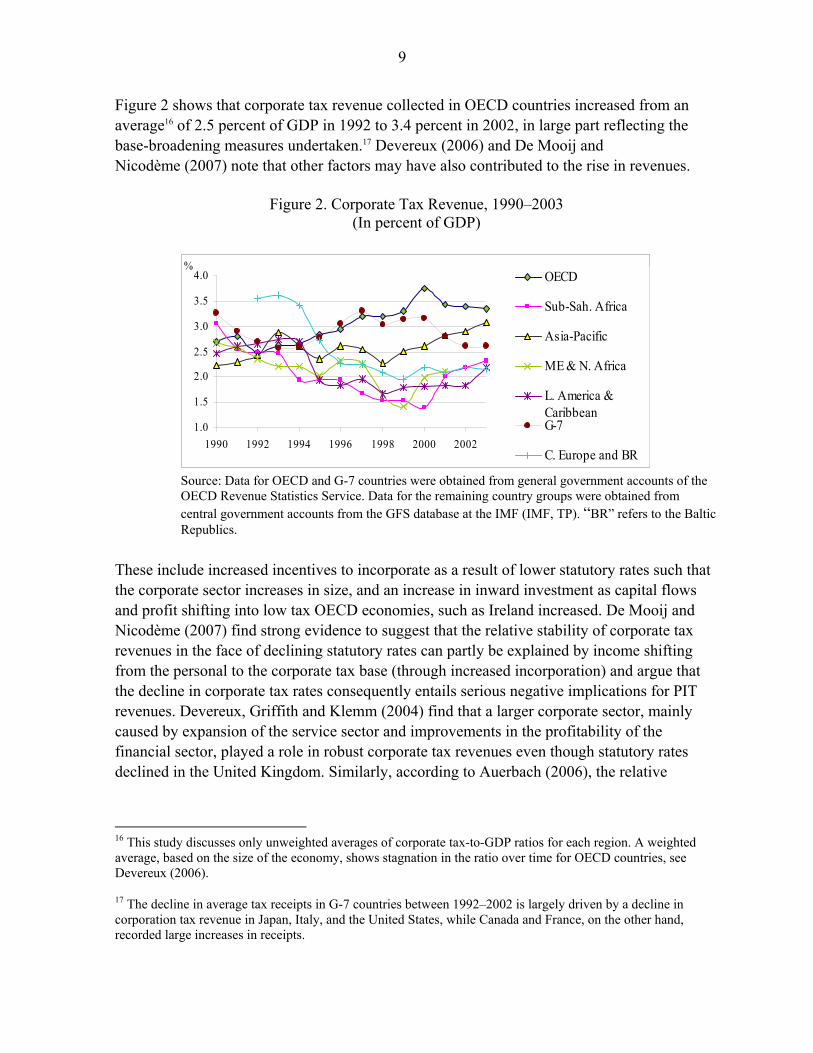
Figure 2 shows that corporate tax revenue collected in OECD countries increased from an average16 of 2.5 percent of GDP in 1992 to 3.4 percent in 2002, in large part reflecting the base-broadening measures undertaken.17 Devereux (2006) and De Mooij and Nicodème (2007) note that other factors may have also contributed to the rise in revenues.
Figure 2. Corporate Tax Revenue, 1990–2003
(In percent of GDP)
1.0
1.5
2.0
2.5
3.0
3.5
4.0
1990 1992 1994 1996 1998 2000 2002
%OECD
Sub-Sah. Africa
Asia-Pacific
ME & N. Africa
L. America &CaribbeanG-7
C. Europe and BR
Source: Data for OECD and G-7 countries were obtained from general government accounts of the OECD Revenue Statistics Service. Data for the remaining country groups were obtained from central government accounts from the GFS database at the IMF (IMF, TP). “BR” refers to the Baltic Republics.
These include increased incentives to incorporate as a result of lower statutory rates such that the corporate sector increases in size, and an increase in inward investment as capital flows and profit shifting into low tax OECD economies, such as Ireland increased. De Mooij and Nicodème (2007) find strong evidence to suggest that the relative stability of corporate tax revenues in the face of declining statutory rates can partly be explained by income shifting from the personal to the corporate tax base (through increased incorporation) and argue that the decline in corporate tax rates consequently entails serious negative implications for PIT revenues. Devereux, Griffith and Klemm (2004) find that a larger corporate sector, mainly caused by expansion of the service sector and improvements in the profitability of the financial sector, played a role in robust corporate tax revenues even though statutory rates declined in the United Kingdom. Similarly, according to Auerbach (2006), the relative
16 This study discusses only unweighted averages of corporate tax-to-GDP ratios for each region. A weighted average, based on the size of the economy, shows stagnation in the ratio over time for OECD countries, see Devereux (2006).
17 The decline in average tax receipts in G-7 countries between 1992–2002 is largely driven by a decline in corporation tax revenue in Japan, Italy, and the United States, while Canada and France, on the other hand, recorded large increases in receipts.
10
stability of financial sector profits in the United States helped to dampen the overall volatility of revenues from the corporate sector. However, in developing or low-income countries, there appears to have been a tendency toward a narrowing of the corporate tax base (or base stagnation) as statutory rates have fallen, leading to a general decline in corporate revenue-to-GDP ratios.18 This is somewhat worrying insofar as corporate tax revenues account on average for approximately one-sixth of total tax revenues in developing countries, i.e., more than in OECD countries. Keen and Simone (2004) document an increase in the use of tax holidays, free trade zones, and tax breaks in some of the poorest developing countries. They note, for instance, that while at the start of the 1990s only one sub-Saharan country offered tax holidays, virtually all did so toward the end of the decade. Corporate tax revenues as a percentage of GDP, however, seem to have improved in some groupings since the late 1990s, although these trends may be largely cyclical indicating buoyant tax revenues in Asia-Pacific region as it emerged from the crisis in 1997–98, as well as sustained economic growth in Africa and Asia in the recent years. These recent gains in corporate tax revenue may also have been importantly affected by buoyant natural resource taxes, particularly pertaining to oil.19
B. Personal Income Tax
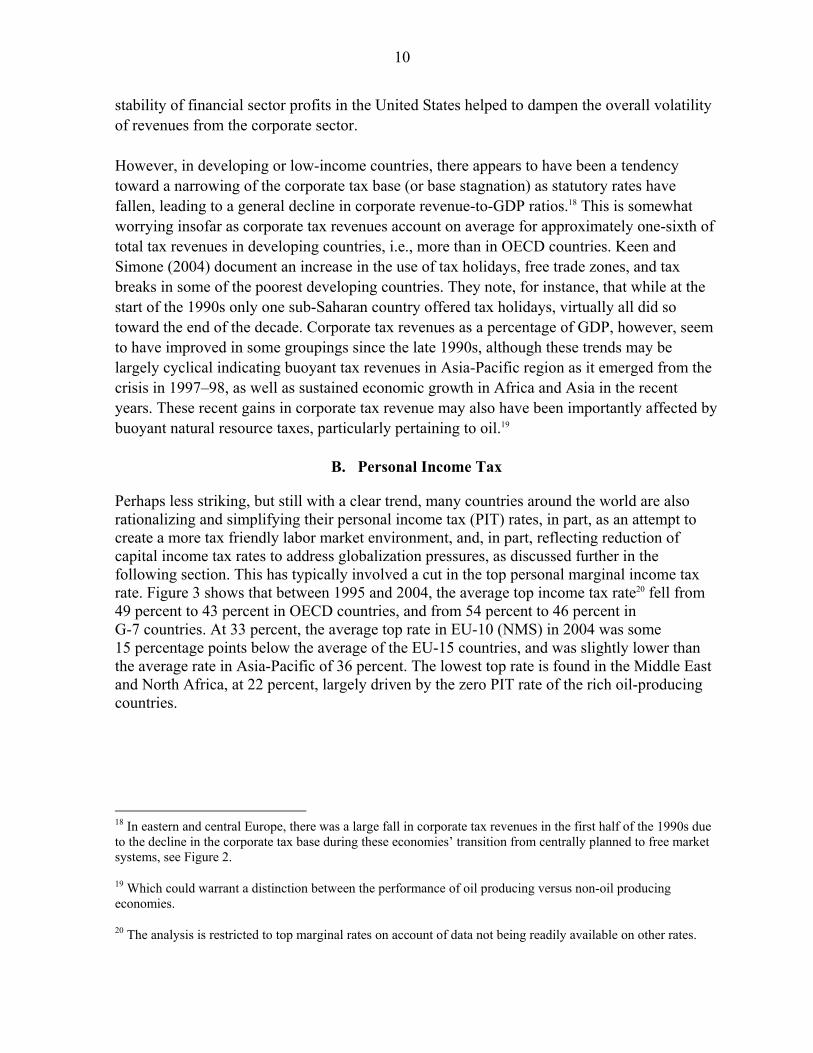
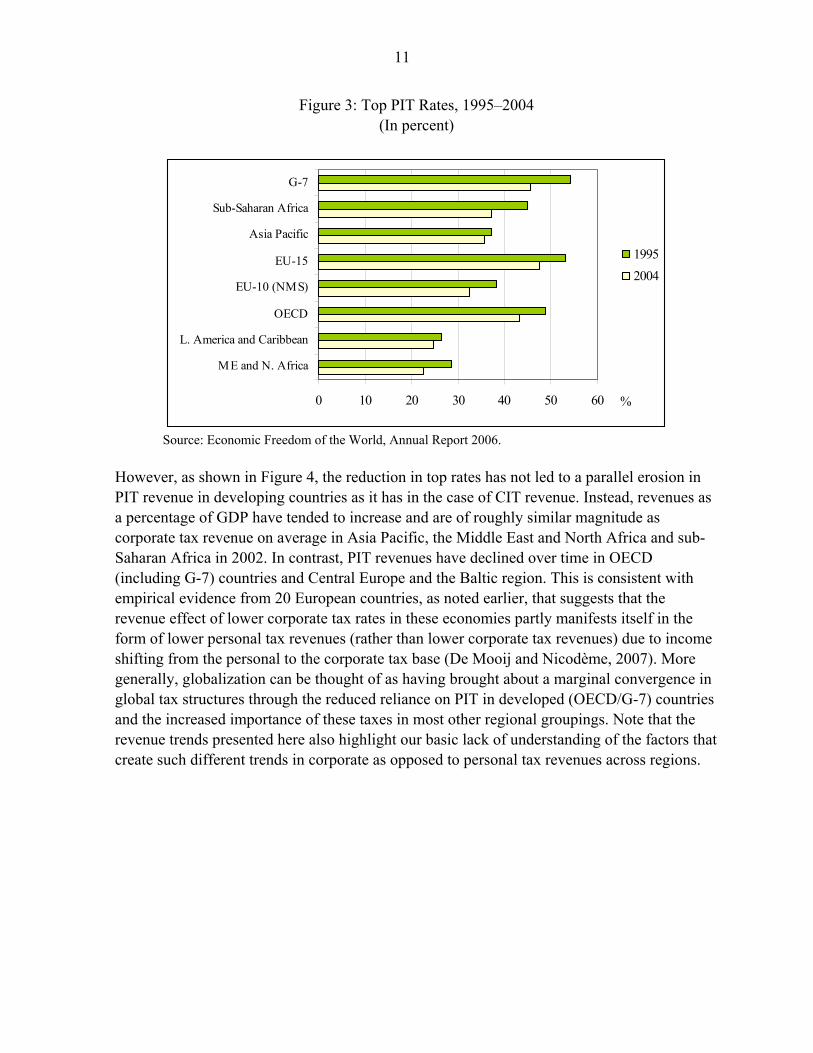
Perhaps less striking, but still with a clear trend, many countries around the world are also rationalizing and simplifying their personal income tax (PIT) rates, in part, as an attempt to create a more tax friendly labor market environment, and, in part, reflecting reduction of capital income tax rates to address globalization pressures, as discussed further in the following section. This has typically involved a cut in the top personal marginal income tax rate. Figure 3 shows that between 1995 and 2004, the average top income tax rate20 fell from 49 percent to 43 percent in OECD countries, and from 54 percent to 46 percent in G-7 countries. At 33 percent, the average top rate in EU-10 (NMS) in 2004 was some 15 percentage points below the average of the EU-15 countries, and was slightly lower than the average rate in Asia-Pacific of 36 percent. The lowest top rate is found in the Middle East and North Africa, at 22 percent, largely driven by the zero PIT rate of the rich oil-producing countries.
18 In eastern and central Europe, there was a large fall in corporate tax revenues in the first half of the 1990s due to the decline in the corporate tax base during these economies’ transition from centrally planned to free market systems, see Figure 2.
19 Which could warrant a distinction between the performance of oil producing versus non-oil producing economies.
20 The analysis is restricted to top marginal rates on account of data not being readily available on other rates.
11
Figure 3: Top PIT Rates, 1995–2004 (In percent)
0 10 20 30 40 50 60
ME and N. Africa
L. America and Caribbean
OECD
EU-10 (NMS)
EU-15
Asia Pacific
Sub-Saharan Africa
G-7
%
19952004
Source: Economic Freedom of the World, Annual Report 2006.
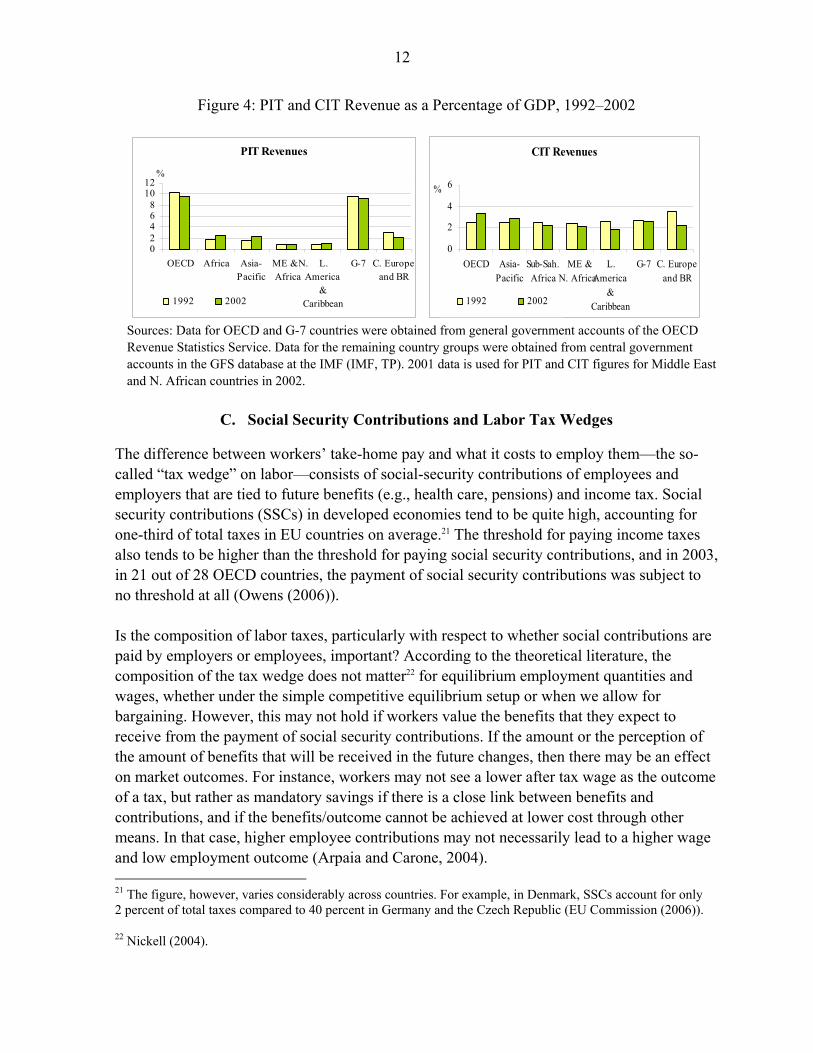
However, as shown in Figure 4, the reduction in top rates has not led to a parallel erosion in PIT revenue in developing countries as it has in the case of CIT revenue. Instead, revenues as a percentage of GDP have tended to increase and are of roughly similar magnitude as corporate tax revenue on average in Asia Pacific, the Middle East and North Africa and sub-Saharan Africa in 2002. In contrast, PIT revenues have declined over time in OECD (including G-7) countries and Central Europe and the Baltic region. This is consistent with empirical evidence from 20 European countries, as noted earlier, that suggests that the revenue effect of lower corporate tax rates in these economies partly manifests itself in the form of lower personal tax revenues (rather than lower corporate tax revenues) due to income shifting from the personal to the corporate tax base (De Mooij and Nicodème, 2007). More generally, globalization can be thought of as having brought about a marginal convergence in global tax structures through the reduced reliance on PIT in developed (OECD/G-7) countries and the increased importance of these taxes in most other regional groupings. Note that the revenue trends presented here also highlight our basic lack of understanding of the factors that create such different trends in corporate as opposed to personal tax revenues across regions.
12
Figure 4: PIT and CIT Revenue as a Percentage of GDP, 1992–2002
PIT Revenues
02468
1012
OECD Africa Asia-Pacific
ME &N.Africa
L.America
&Caribbean
G-7 C. Europeand BR
%
1992 2002
CIT Revenues
0
2
4
6
OECD Asia-Pacific
Sub-Sah.Africa
ME &N. Africa
L.America
&Caribbean
G-7 C. Europeand BR
%
1992 2002
Sources: Data for OECD and G-7 countries were obtained from general government accounts of the OECD Revenue Statistics Service. Data for the remaining country groups were obtained from central government accounts in the GFS database at the IMF (IMF, TP). 2001 data is used for PIT and CIT figures for Middle East and N. African countries in 2002.
C. Social Security Contributions and Labor Tax Wedges
The difference between workers’ take-home pay and what it costs to employ them—the so- called “tax wedge” on labor—consists of social-security contributions of employees and employers that are tied to future benefits (e.g., health care, pensions) and income tax. Social security contributions (SSCs) in developed economies tend to be quite high, accounting for one-third of total taxes in EU countries on average.21 The threshold for paying income taxes also tends to be higher than the threshold for paying social security contributions, and in 2003, in 21 out of 28 OECD countries, the payment of social security contributions was subject to no threshold at all (Owens (2006)). Is the composition of labor taxes, particularly with respect to whether social contributions are paid by employers or employees, important? According to the theoretical literature, the composition of the tax wedge does not matter22 for equilibrium employment quantities and wages, whether under the simple competitive equilibrium setup or when we allow for bargaining. However, this may not hold if workers value the benefits that they expect to receive from the payment of social security contributions. If the amount or the perception of the amount of benefits that will be received in the future changes, then there may be an effect on market outcomes. For instance, workers may not see a lower after tax wage as the outcome of a tax, but rather as mandatory savings if there is a close link between benefits and contributions, and if the benefits/outcome cannot be achieved at lower cost through other means. In that case, higher employee contributions may not necessarily lead to a higher wage and low employment outcome (Arpaia and Carone, 2004). 21 The figure, however, varies considerably across countries. For example, in Denmark, SSCs account for only 2 percent of total taxes compared to 40 percent in Germany and the Czech Republic (EU Commission (2006)).
22 Nickell (2004).
13
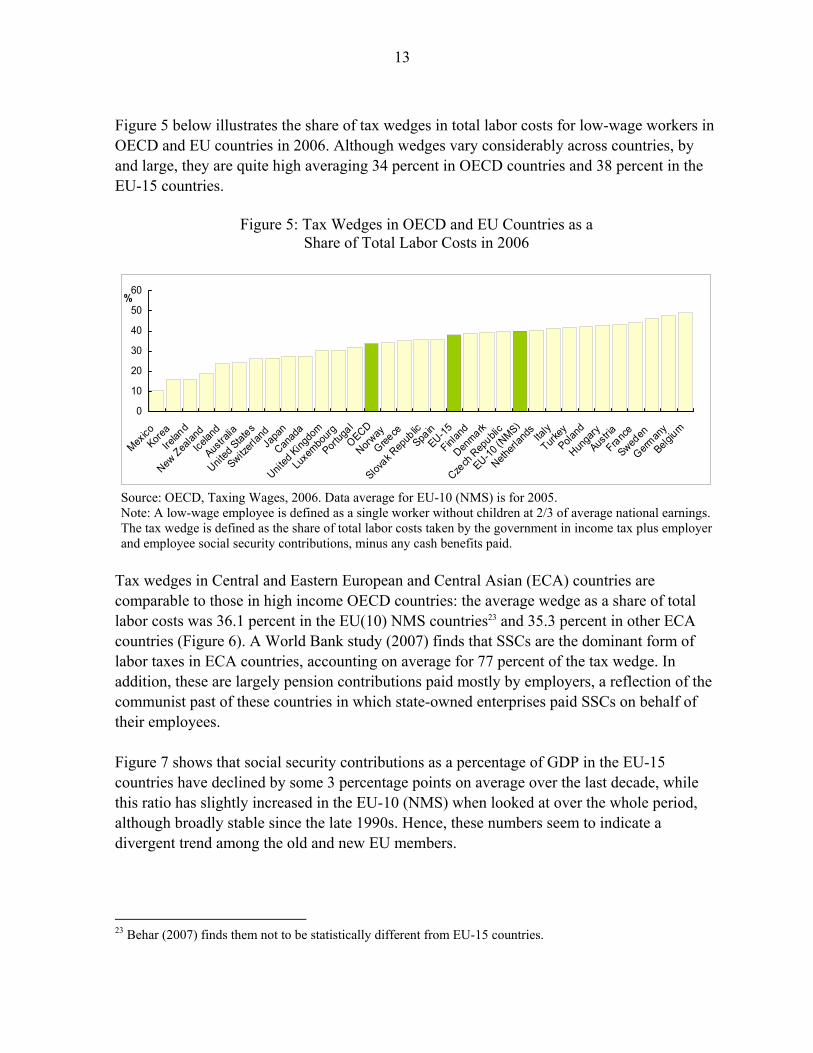
Figure 5 below illustrates the share of tax wedges in total labor costs for low-wage workers in OECD and EU countries in 2006. Although wedges vary considerably across countries, by and large, they are quite high averaging 34 percent in OECD countries and 38 percent in the EU-15 countries.
Figure 5: Tax Wedges in OECD and EU Countries as a Share of Total Labor Costs in 2006
0
10
20
30
40
50
60
Mexico
KoreaIre
land
New Zea
land
Icelan
d
Austra
lia
United
States
Switzerl
and Ja
pan
Canad
a
United
Kingdo
m
Luxe
mbourg
Portug
al
OECD
Norway
Greece
Slovak R
epub
lic
Spain
EU-15
Finlan
d
Denmark
Czech
Rep
ublic
EU-10 (N
MS)
Netherl
ands
Ita
ly
Turkey
Poland
Hunga
ry
Austria
France
Sweden
German
y
Belgium
%
Source: OECD, Taxing Wages, 2006. Data average for EU-10 (NMS) is for 2005. Note: A low-wage employee is defined as a single worker without children at 2/3 of average national earnings. The tax wedge is defined as the share of total labor costs taken by the government in income tax plus employer and employee social security contributions, minus any cash benefits paid.
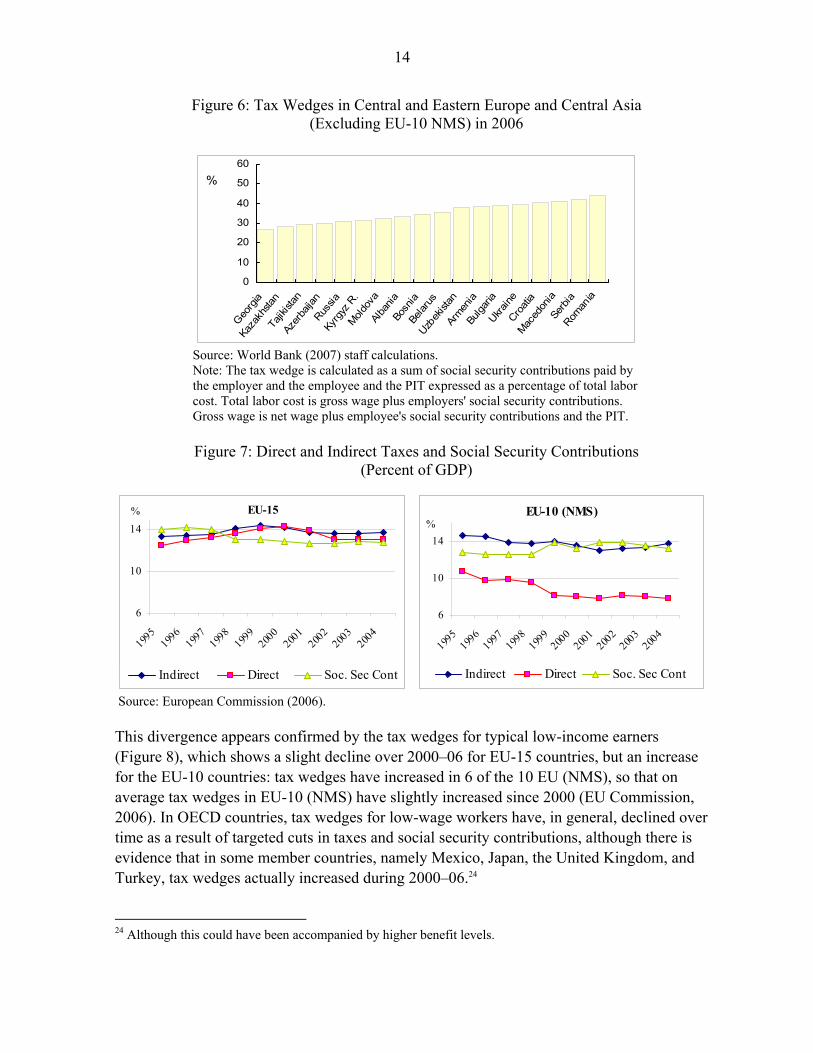
Tax wedges in Central and Eastern European and Central Asian (ECA) countries are comparable to those in high income OECD countries: the average wedge as a share of total labor costs was 36.1 percent in the EU(10) NMS countries23 and 35.3 percent in other ECA countries (Figure 6). A World Bank study (2007) finds that SSCs are the dominant form of labor taxes in ECA countries, accounting on average for 77 percent of the tax wedge. In addition, these are largely pension contributions paid mostly by employers, a reflection of the communist past of these countries in which state-owned enterprises paid SSCs on behalf of their employees. Figure 7 shows that social security contributions as a percentage of GDP in the EU-15 countries have declined by some 3 percentage points on average over the last decade, while this ratio has slightly increased in the EU-10 (NMS) when looked at over the whole period, although broadly stable since the late 1990s. Hence, these numbers seem to indicate a divergent trend among the old and new EU members.
23 Behar (2007) finds them not to be statistically different from EU-15 countries.
14
Figure 6: Tax Wedges in Central and Eastern Europe and Central Asia (Excluding EU-10 NMS) in 2006
0
10
20
30
40
50
60
Georg
iaKa
zakh
stan
Tajik
istan
Azer
baija
nRus
siaKy
rgyz
R.
Moldov
aAl
bania
Bosn
ia Be
larus
Uzbek
istan
Armen
iaBu
lgaria
Ukraine
Croati
aMac
edon
iaSe
rbia
Roman
ia
%
Source: World Bank (2007) staff calculations. Note: The tax wedge is calculated as a sum of social security contributions paid by the employer and the employee and the PIT expressed as a percentage of total labor cost. Total labor cost is gross wage plus employers' social security contributions. Gross wage is net wage plus employee's social security contributions and the PIT.
Figure 7: Direct and Indirect Taxes and Social Security Contributions
(Percent of GDP)
EU-15
6
10
14
1995
1996
1997
1998
1999
2000
2001
2002
2003
2004
%
Indirect Direct Soc. Sec Cont
EU-10 (NMS)
6
10
14
1995
1996
1997
1998
1999
2000
2001
2002
2003
2004
%
Indirect Direct Soc. Sec Cont
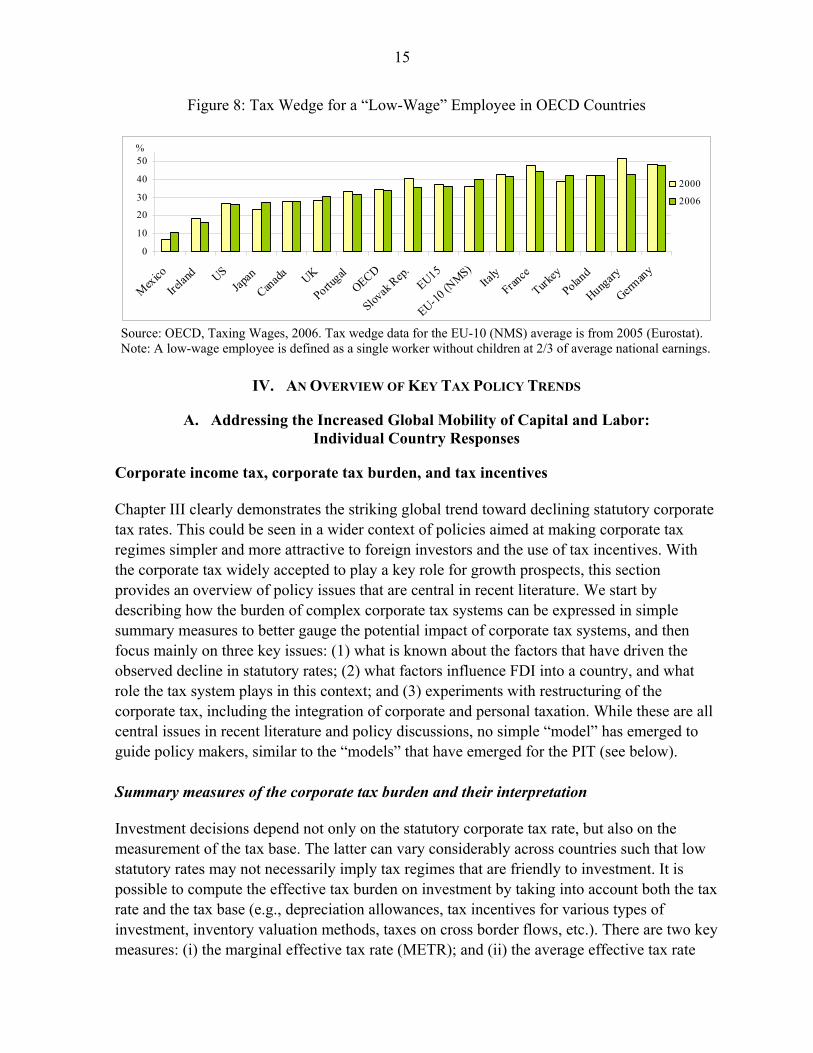
Source: European Commission (2006). This divergence appears confirmed by the tax wedges for typical low-income earners (Figure 8), which shows a slight decline over 2000–06 for EU-15 countries, but an increase for the EU-10 countries: tax wedges have increased in 6 of the 10 EU (NMS), so that on average tax wedges in EU-10 (NMS) have slightly increased since 2000 (EU Commission, 2006). In OECD countries, tax wedges for low-wage workers have, in general, declined over time as a result of targeted cuts in taxes and social security contributions, although there is evidence that in some member countries, namely Mexico, Japan, the United Kingdom, and Turkey, tax wedges actually increased during 2000–06.24 24 Although this could have been accompanied by higher benefit levels.
15
Figure 8: Tax Wedge for a “Low-Wage” Employee in OECD Countries
0
10
20
30
40
50
Mexico
Irelan
d USJap
an
Canada UK
Portugal
OECD
Slovak
Rep.EU15
EU-10 (N
MS)Ita
lyFran
ce
Turkey
Poland
Hungary
Germany
%
2000
2006
Source: OECD, Taxing Wages, 2006. Tax wedge data for the EU-10 (NMS) average is from 2005 (Eurostat). Note: A low-wage employee is defined as a single worker without children at 2/3 of average national earnings.
IV. AN OVERVIEW OF KEY TAX POLICY TRENDS
A. Addressing the Increased Global Mobility of Capital and Labor: Individual Country Responses
Corporate income tax, corporate tax burden, and tax incentives Chapter III clearly demonstrates the striking global trend toward declining statutory corporate tax rates. This could be seen in a wider context of policies aimed at making corporate tax regimes simpler and more attractive to foreign investors and the use of tax incentives. With the corporate tax widely accepted to play a key role for growth prospects, this section provides an overview of policy issues that are central in recent literature. We start by describing how the burden of complex corporate tax systems can be expressed in simple summary measures to better gauge the potential impact of corporate tax systems, and then focus mainly on three key issues: (1) what is known about the factors that have driven the observed decline in statutory rates; (2) what factors influence FDI into a country, and what role the tax system plays in this context; and (3) experiments with restructuring of the corporate tax, including the integration of corporate and personal taxation. While these are all central issues in recent literature and policy discussions, no simple “model” has emerged to guide policy makers, similar to the “models” that have emerged for the PIT (see below). Summary measures of the corporate tax burden and their interpretation Investment decisions depend not only on the statutory corporate tax rate, but also on the measurement of the tax base. The latter can vary considerably across countries such that low statutory rates may not necessarily imply tax regimes that are friendly to investment. It is possible to compute the effective tax burden on investment by taking into account both the tax rate and the tax base (e.g., depreciation allowances, tax incentives for various types of investment, inventory valuation methods, taxes on cross border flows, etc.). There are two key measures: (i) the marginal effective tax rate (METR); and (ii) the average effective tax rate
16
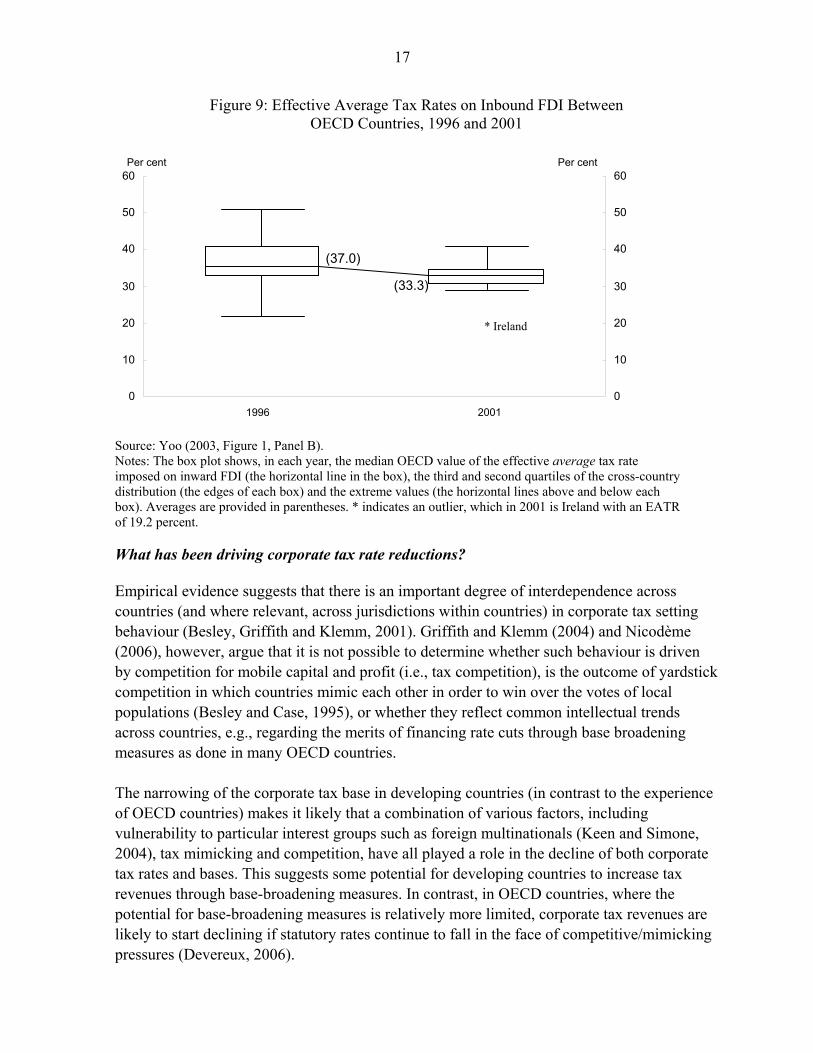
(AETR).25 The METR refers to the intensive margin of capital formation, namely, the scale or level of investment (or, in other words, the effective rate for a project that just breaks even), whereas the AETR refers to the extensive margin, namely the discrete decision of where to locate investment (or the effective rate for a profitable project).26 Consequently, it is the latter concept that is relevant for understanding the capital location decisions of multinational firms and for an insight into the international tax competitiveness of countries (Devereux and Griffith, 1999, 2003). However, it should be noted that statutory rates (possibly in conjunction with withholding taxes) remain relevant for understanding where firms choose to locate their profits (for example, through transfer pricing arrangements), which tend to be even more mobile than capital itself. Evidence suggests that AETRs have fallen significantly in OECD countries, notwithstanding the expansion in the tax base. The figure 9 shows that the average value of AETR on inbound FDI in OECD countries27 fell from 37 percent in 1996 to 33.3 percent in 2001. Although dispersion in AETRs has also declined, there are, nevertheless, considerable differences across countries, with AETRs on inbound FDI estimated at 40 percent in Turkey28 and Japan and 19 percent in Ireland (Yoo, 2003). Deveruex (2007) reports that nine of the ten new member states (NMS) were characterized by the lowest AETRs among EU countries, and that effective rates were likely to be even lower if various tax incentives available in the NMS had been taken into account. While data for developing countries is not easily available, there is some evidence to indicate that AETRs have declined. For instance, Nassar (2007) documents that AETRs in 15 Caribbean countries fell by 10 percentage points to 26 percent between 1985 and 2005.
25 See Devereux and Griffith (2003) for a discussion of hypothetical and accounting-based AETR and METR measures.
26 The AETR measure constructed by Devereux and Griffith (2003) is a weighted average of the METR and the statutory rate adjusted for personal taxes. As they explain, ‘for a marginal investment, it is equal to the METR. As the rate of profit rises, it converges to the adjusted statutory rate. It can, therefore, be interpreted as summarizing the distribution of effective tax rates for an investment project over a range of profitability, with the EMTR representing the special case of a marginal investment.’ 27 Constructed by Yoo (2003), these indicators measure the wedge between pre-tax and posttax return on FDI taking into account home and host country tax policies, interaction of these policies, and taxation of cross-border income. 28 Turkey has since reduced its CIT rate, from 33 percent to 20 percent in 2006, and, therefore, AETRs are likely to be lower.
17
Figure 9: Effective Average Tax Rates on Inbound FDI Between OECD Countries, 1996 and 2001
Source: Yoo (2003, Figure 1, Panel B). Notes: The box plot shows, in each year, the median OECD value of the effective average tax rate imposed on inward FDI (the horizontal line in the box), the third and second quartiles of the cross-country distribution (the edges of each box) and the extreme values (the horizontal lines above and below each box). Averages are provided in parentheses. * indicates an outlier, which in 2001 is Ireland with an EATR of 19.2 percent. What has been driving corporate tax rate reductions? Empirical evidence suggests that there is an important degree of interdependence across countries (and where relevant, across jurisdictions within countries) in corporate tax setting behaviour (Besley, Griffith and Klemm, 2001). Griffith and Klemm (2004) and Nicodème (2006), however, argue that it is not possible to determine whether such behaviour is driven by competition for mobile capital and profit (i.e., tax competition), is the outcome of yardstick competition in which countries mimic each other in order to win over the votes of local populations (Besley and Case, 1995), or whether they reflect common intellectual trends across countries, e.g., regarding the merits of financing rate cuts through base broadening measures as done in many OECD countries. The narrowing of the corporate tax base in developing countries (in contrast to the experience of OECD countries) makes it likely that a combination of various factors, including vulnerability to particular interest groups such as foreign multinationals (Keen and Simone, 2004), tax mimicking and competition, have all played a role in the decline of both corporate tax rates and bases. This suggests some potential for developing countries to increase tax revenues through base-broadening measures. In contrast, in OECD countries, where the potential for base-broadening measures is relatively more limited, corporate tax revenues are likely to start declining if statutory rates continue to fall in the face of competitive/mimicking pressures (Devereux, 2006).
0
10
20
30
40
50
60
1996 20010
10
20
30
40
50
60
(37.0)
(33.3)
* Ireland
Per cent Per cent
18
The impact of taxes on FDI A key question is whether low AETRs or statutory rates are successful in attracting capital flows. Typically, studies focus on FDI out of OECD member countries—in particular, the United States for which data tends to be most reliable (Gordon and Hines, 2002)—and into (mostly) other OECD countries. Empirical evidence for developing countries is generally limited (see Ho and Liu, 2007 for a review of empirical evidence). By and large, evidence suggests that statutory tax rates and AETRs do appear to affect the location of capital (De Mooij and Everdeen, 2006). For example, Hines (1996) finds evidence that the location of foreign investment into the United States is affected by differences in U.S. state CITs. More recently, Buettner and Ruf (2007) find that statutory tax rates play a significant role in the decision by German multinationals on where to locate or hold subsidiaries abroad. However, Devereux and Maffini (2007) and Devereux and Griffith (2003) argue that the empirical literature is fraught with various shortcomings, including (among others) that FDI is an imperfect measure of real investment activity, difficulties inherent in measuring effective tax rates, and a host of issues associated with econometric methodology, such that it is impossible to summarize the results of the empirical literature into a quantitative measure of the impact of the effect of corporation tax on the location of capital. Consequently, estimates of the elasticity of investment to tax rates can vary considerably according to sample type and methodology (Devereux and Maffini, 2007).29 Moreover, a growing body of evidence suggests that other factors also matter for attracting FDI, perhaps more so than tax. A study of FDI in major emerging economies (Brazil, India, China, and Mexico) by McKinsey (2003) found that targeted FDI policies, such as tax holidays, accelerated depreciation, and import duty exemptions (among others) were ineffective in influencing the volume of FDI.30 Furthermore, in many cases, they were counter productive, by contributing directly to fiscal and administrative costs as well as indirectly by lowering productivity or by encouraging inefficient levels of investment. Instead, primary considerations when MNEs invested abroad were macroeconomic stability, the quality of infrastructure and the labor force, the size and growth of the domestic market, and the accessibility of location.
29 De Mooij and Everdeen (2006) compare the outcomes of 31 empirical studies by computing the tax rate elasticity under a uniform definition and report that a 1 percentage point reduction in host country tax typically raises foreign investment by 2.1 percentage points.
30 In contrast, for China, Tseng and Zebreg (2003) note that preferential policies may have been effective in attracting FDI, at least initially, but over time created distortions and a complex tax system that is now being reformed (for example, China has unified the corporate tax for foreign and domestic enterprises effective January 1, 2008).
19
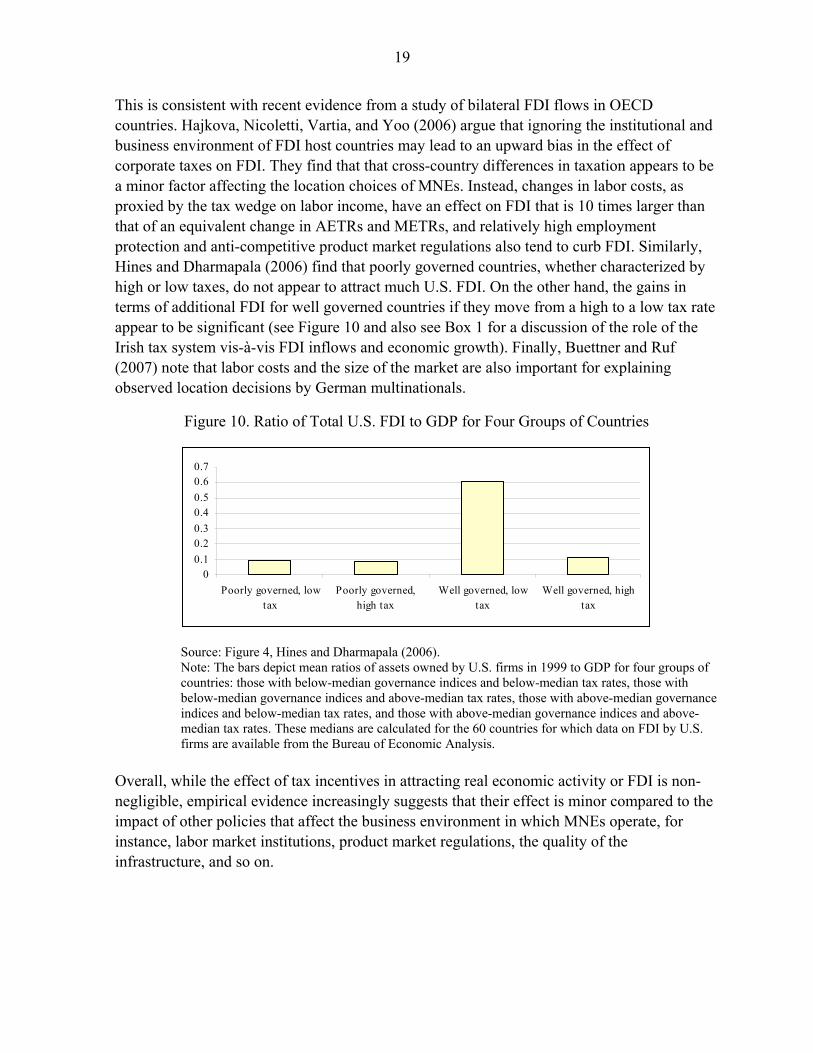
This is consistent with recent evidence from a study of bilateral FDI flows in OECD countries. Hajkova, Nicoletti, Vartia, and Yoo (2006) argue that ignoring the institutional and business environment of FDI host countries may lead to an upward bias in the effect of corporate taxes on FDI. They find that that cross-country differences in taxation appears to be a minor factor affecting the location choices of MNEs. Instead, changes in labor costs, as proxied by the tax wedge on labor income, have an effect on FDI that is 10 times larger than that of an equivalent change in AETRs and METRs, and relatively high employment protection and anti-competitive product market regulations also tend to curb FDI. Similarly, Hines and Dharmapala (2006) find that poorly governed countries, whether characterized by high or low taxes, do not appear to attract much U.S. FDI. On the other hand, the gains in terms of additional FDI for well governed countries if they move from a high to a low tax rate appear to be significant (see Figure 10 and also see Box 1 for a discussion of the role of the Irish tax system vis-à-vis FDI inflows and economic growth). Finally, Buettner and Ruf (2007) note that labor costs and the size of the market are also important for explaining observed location decisions by German multinationals.
Figure 10. Ratio of Total U.S. FDI to GDP for Four Groups of Countries
00.10.20.30.40.50.60.7
Poorly governed, lowtax
Poorly governed,high tax
Well governed, lowtax
Well governed, hightax
Source: Figure 4, Hines and Dharmapala (2006). Note: The bars depict mean ratios of assets owned by U.S. firms in 1999 to GDP for four groups of countries: those with below-median governance indices and below-median tax rates, those with below-median governance indices and above-median tax rates, those with above-median governance indices and below-median tax rates, and those with above-median governance indices and above-median tax rates. These medians are calculated for the 60 countries for which data on FDI by U.S. firms are available from the Bureau of Economic Analysis.
Overall, while the effect of tax incentives in attracting real economic activity or FDI is non-negligible, empirical evidence increasingly suggests that their effect is minor compared to the impact of other policies that affect the business environment in which MNEs operate, for instance, labor market institutions, product market regulations, the quality of the infrastructure, and so on.
20
Box 1. FDI and Economic Growth in Ireland: What Role did the Tax System Play?
Average real GDP growth in Ireland was 2.4 percent between 1980 and 1985, but rose to 10 percent between 1995–2000. Current growth rates of roughly 5 percent are still amongst the highest in industrial countries (IMF Article IV, 2006). Unemployment in 2005 was 4.3 percent compared to 16 percent in 1993, and migration outflows reversed themselves in the 1990s. Currently, Irish GDP per capita estimated at US$58,000 per capita31 is the second highest in the EU (after Luxembourg), and the fourth highest in the world. How did a country, once described by The Economist as “poorest of the rich,”32 transform itself and at so rapidly a pace? And what was the role of Irish tax system in this transformation?
Honohan and Walsh (2002) argue that the Irish “miracle” should be viewed as a “delayed” or “deferred…process of bringing more of the population into a modern sector that was already close to the production frontier a quarter of a century ago.” The relevant question according to them is why it took so long for the country to catch up with the rest of the Europe. Claiming that the supply side and institutional preconditions necessary for convergence were already present in the 1970s, they argue that growth was derailed for more than a decade by a combination of various factors, including the oil crises of 1973 and 1979, a lax fiscal policy environment that eroded the competitiveness of Irish labor, and high global interest rates and weak foreign demand in the early 1980s. In a similar vein, Fortin (2002) distinguishes between ‘a long-term productivity boom dating back to the 1950s and 1960s, and a short-term output and employment boom’ starting in the early 1990s. The long-term productivity boom was driven by a shift of economic activity from the primary to the secondary and tertiary sectors—in 1960, approximately 40 percent of the Irish labor was employed in the primary sector compared to approximately 9 percent in 2000 (Fortin, 2002). Other underlying factors included the emergence of a highly skilled labor force due to the introduction of free secondary and low cost higher education in 1966, and an outward looking commercial and industrial policy Ireland joined the EEC in 1973, the Single European Market in 1993, and eventually the EMU in 1999. It also moved away from a protectionist industrial policy toward a regime that was extremely FDI friendly (for instance, through the relaxation of incentives to locate in peripheral regions the ending of restrictions on MNCs to remit profits abroad). In 1956, 100 percent remission known as export profit tax relief (see Honohan and Walsh, 2002) was applied to profits from (mainly manufacturing) exports. This was essentially a zero tax rate applied to profits from export sales. However, it was deemed incompatible with Ireland’s obligations under the Treaty of Rome, and in 1981 was replaced by a 10 percent preferential corporate tax rate applied to profits from the manufacturing industry and internationally-traded services (later extended to certain financial services and raised to 12.5 percent in 2003). The remainder of the corporate sector was, however, taxed at extremely high rates—in 1991 the “standard” rate was 40 percent. As part of an effort to harmonize it with the tax rate on manufacturing, it was gradually reduced to 12.5 percent in 2003. What were the factors that contributed to its economic turnaround in the early 1990s? And what was the contribution, if any, of the low tax on manufacturing? Various studies decline to pinpoint any single factor that caused the acceleration of growth, employment, and FDI (Walsh, 2000, Walsh and Honohan, 2002, Fortin, 2002). Instead, they point to significant improvements in the external trade environment with strong output and income growth in the United States, United Kingdom, and EU after 1993, leading to strong export growth. Exports were also boosted by decline of unit labor costs in manufacturing relative to its trading partners, driven, in part, by the 10 percent devaluation of the exchange rate in 1993, as well as by a long period of wage moderation and peaceful industrial relations starting in 1986. Macroeconomic stability on the domestic front, particularly successful fiscal consolidation after 1987, eventually facilitated a reduction in domestic labor and corporate tax burdens. On the supply side, the expansion in demand was accommodated by the decline in unemployment levels, a sharp increase in the participation of women in the labor force, and a large flow of immigrants into Ireland.
31 2007 estimate. Source: WEO.
32 “Poorest of the Rich: A Survey” The Economist, Jan 15, 1988, Vol 306, No. 7533.
21
Box 1. FDI and Economic Growth in Ireland: What Role did the Tax System Play? (concluded) There was also a substantial surge in FDI worldwide in the 1990s which Walsh (2001) argues Ireland was uniquely well placed to receive, particularly from the United States. This was by virtue of its close linguistic and cultural ties with the United States, an abundant supply of English speaking low cost and highly skilled labor, a modern physical infrastructure on account of large amounts of EU state aid, a stable fiscal and policy environment, and integration into the EU single market which made it a convenient platform for U.S. MNCs wishing to export to the EU. Consequently, net FDI in Ireland which had earlier averaged US$100 million annually between 1986–1990 was ten times larger—US$1.1 billion a year—between 1991–1997 (Fortin, 2000). Fortin (2002),Walsh (2000) and Honohan and Walsh (2002) all emphasize that there were no changes to the tax regime that could be regarded as a trigger for the explosion of FDI into Ireland or the employment boom. The extremely low tax rate on manufacturing profits had been in place since the 1950s. Furthermore, there had actually been an increase in the tax rate in 1981, as described above, followed by a further rise to 12.5 percent in 2003. Nevertheless, the generosity of the Irish tax system—it has the lowest effective and statutory rate of CIT applicable to MNCs among OECD countries—cannot be overlooked. While Walsh and Fortin argue that low tax rates were only one of the many factors that drew U.S. FDI to Ireland, Romalis (2007) provides evidence on Ireland to suggest that low taxes on capital in combination with the substantial decline in trade costs and the dismantling of barriers to trade in the 1990s were indeed a possible trigger for the economic growth and FDI inflow.
Corporate tax systems: experiments with fundamental restructuring
The integration of corporate and PIT systems was widely discussed in the 1980s and 1990s, particularly in OECD countries, with the “benchmark” being full imputation,33 and with (varying) integration systems being a hallmark of many European tax systems. Among others, Australia, Finland, Germany, New Zealand, and the United Kingdom introduced full imputation systems. The basic rationale was that integration relief provided to domestic shareholders can be expected to lower the cost of capital, thus spurring investment, and, at the same time, removing some distortions to the choice of corporate financing as compared to classical systems. However, while some countries have maintained these systems and even developed them further (Australia and New Zealand), others abandoned them and introduced simpler systems in their place (e.g., Finland, Germany, Italy, Portugal, and the United Kingdom) for a variety of reasons: administrative problems associated with the administration of full imputation systems; because of the small open economy context,34 and for some European countries because of the particular EU legal environment.35 It is interesting 33 With full credit given to individual recipients of dividends for the underlying corporate tax paid on those dividends, as opposed to a “classical” system under which dividends paid out from after tax corporate profits, are fully liable to PIT (“double taxation” of dividends).
34 Operating in small open economies, multinationals rely on capital raised in international capital markets with the cost of capital exogenously determined, and thus independent from the degree of integration of domestic PIT and CIT systems (Owens, 2006).
35 The European Court of Justice has ruled that dividends received from foreign countries must be taxed in the same way as dividends received from domestic companies, i.e., if imputation credits are provided to shareholders, they must be provided for both domestic and foreign-source dividend income.
22
to note that at roughly the same time the United States moved toward integration with its 2003 reform, many European countries moved in the opposite direction toward classical tax treatment (Owens, 2006). In a wider sense, this trend away from integration could also be seen as a further distancing from the pure principle of global income taxation.
Prominent examples of more recent experiments with fundamental corporate tax restructuring includes Estonia’s repeal of the standard corporate tax in favor of taxing only dividend distributions.36 In the Estonian model, retained earnings are subject to a zero corporate tax rate, while dividends are taxed at 25 percent (regarded as corporate tax paid). Dividends paid to nonresidents are furthermore subject to a withholding tax at a rate that depends on whether a double taxation agreement is in place or not. While, in principle, attractive in its simplicity and efficiency by treating debt and equity financing broadly uniformly, the model is not altogether without problems: (1) dependent on the initial system, it could well involve a significant revenue loss; (2) it is not fully EU compatible and Estonia has been asked by the EC to change the system as of 2009; (3) it may create new distortions, including locking-in effects for corporate profits; and (4) it raises the issue whether foreign parent companies can credit the tax under preexisting double taxation agreements. Belgium has adopted an “allowance for corporate equity” (similar to what Croatia did in 1994, but later abandoned), in an attempt both to eliminate arbitrary discrimination between debt and equity finance, and move the CIT closer to a pure profit tax. Finally, cash-flow tax systems of corporate taxation, which would involve METRs of zero on new investment and tax only excess profits of enterprises, has frequently been discussed in the literature, and is currently being considered for implementation in Bahrain and East Timor (in January 2008).
A different policy line, but one which could be interpreted as having a broadly similar ultimate objective, has been adopted by Denmark and Germany,37 and aims basically at curtailing interest deductibility of corporations (so, instead of treating dividends like interest as in Belgium, this strategy would—in the extreme—treat interest like dividends).38 In the case of Denmark, a central objective was to prevent future use of leveraged acquisitions financing structures. Combined with a rate reduction from 28 percent to 25 percent, the reform includes a tightening of interest deductibility, effective July 1, 2007, by two cumulative provisions: (1) net interest expenses exceeding DKK 20 million (Euro 2.66 million) would be deductible up to a cap equal to 6.5 percent of the tax value of Danish operating assets plus 20 percent of the value of foreign subsidiaries; and (2) the maximum interest deduction could not exceed 80 percent of earnings before income tax. The German model which aims at stimulating the use of equity capital would deny deductibility of interest
36 Moldova, while keeping the standard corporate tax system, has reduced the CIT rate to zero starting in 2008.
37 With a more limited reform adopted in Canada, see below.
38 This is essentially the “comprehensive business income tax” (CBIT), proposal made by the U.S. Treasury Department in a 1992 report according to which neither the incurred interest on debt nor any imputed return on equity may be deducted against the profit tax base.
23
in excess of 30 percent of income before consideration of interest earned and interest payable (and with exemptions for smaller enterprises and specific circumstances), but interest expenses denied can be carried forward.
The provisions discussed in Canada would, with a transition period to 2012, restrict deductibility of interest on debt related to investments in foreign affiliates (to prevent so- called “double dip structures”), since dividends payable by a subsidiary are in some cases eligible for a 100 percent dividends received deduction. At the same time, the corporate tax rate will be reduced to 18.5 percent by 2011.
The issue of interest deductibility has also attracted some attention in Central American countries, where a Working Group on Tax Coordination for Central America, under the auspices of CACU, is currently attempting to develop a regional standard for interest deductibility.
Dual income tax (DIT)
The idea of levying a flat uniform (relatively low) tax on capital income, separately from the progressive tax on labor income, originated in a formal sense with the Danish tax reform of the late 1980s39 40—quickly followed by similar reforms in Sweden (1991), Norway (1992), and Finland (1993), with the Norwegian and Finnish models coming closest to the strict conceptual framework of a DIT.41 This tax policy innovation broke decisively with the notion of the global income tax, which had dominated tax policy discussions and guided tax reforms during the previous some 30 years, and which, in turn, originated from the well-known Haig-Simons concept of comprehensive or global income of individuals (measured, for example, as consumption plus change in net wealth over a given period) as the appropriate measure of taxable capacity (Zee (2004)). Switching from a global tax to a DIT is seen by some as one indicator of the changing balance between equity and efficiency considerations, although, as already noted, revenue considerations also played a role.42
39 It is noteworthy that the original intention of the Danish reform was to stimulate private saving, including by providing disincentives to debt, by reducing the “tax value” (i.e., reduction in tax liability) for individuals from interest deductibility which prior to the reform was very high owing to the full interest deductibility for all debt, combined with very high marginal tax rates under the progressive PIT. Later DIT reforms emphasized the international mobility of capital income as their primary rationale.
40 Many countries had separate systems of often final withholding on capital income sources (interest and dividend), but mainly for reasons of administrative feasibility.
41 Overviews are provided in Sørensen (1998) and Cnossen (2000). Since the Nordic reforms, few countries have seriously considered introducing full-fledged DITs, but many countries have adopted reforms that build on the basic DIT concept.
42 Some observers (for example, Zee, 2004) interpret this as a fundamental change in the balance between the importance assigned to equity (in particular, horizontal equity, or the equal treatment of individuals with the same (global) income, whether from capital or labor income sources) and economic efficiency considerations, with the latter gaining traction because of increased tax competition and mobility of capital).
24
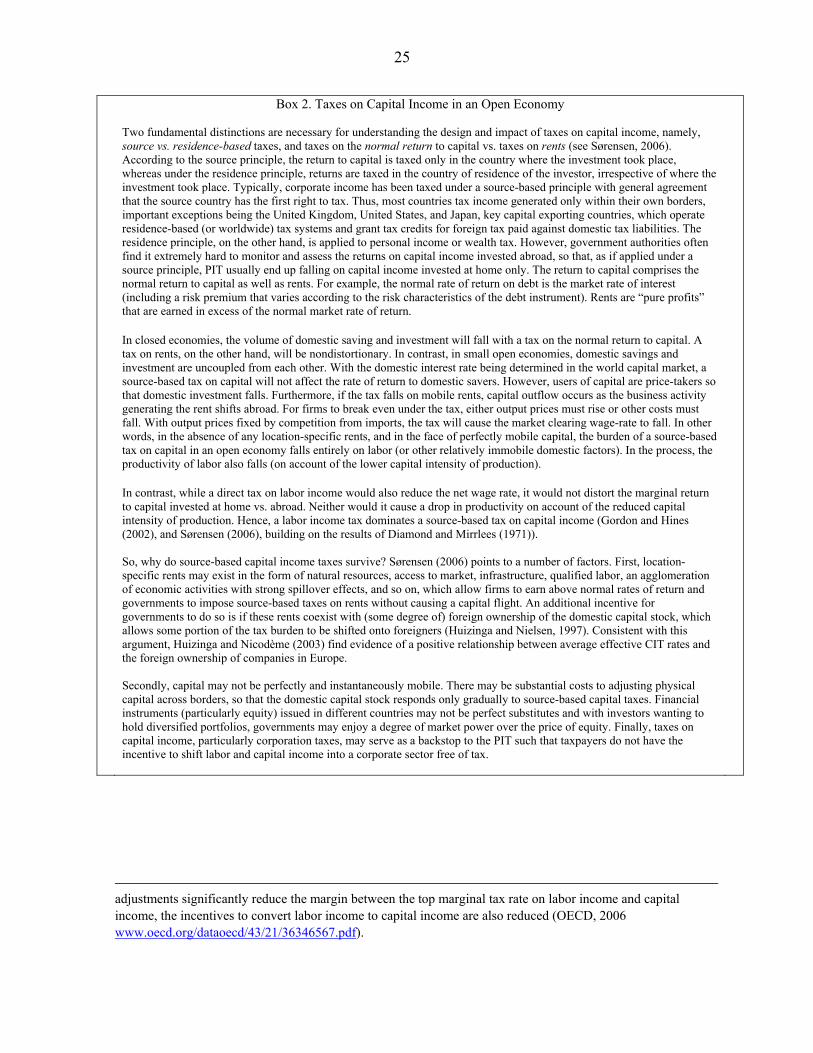
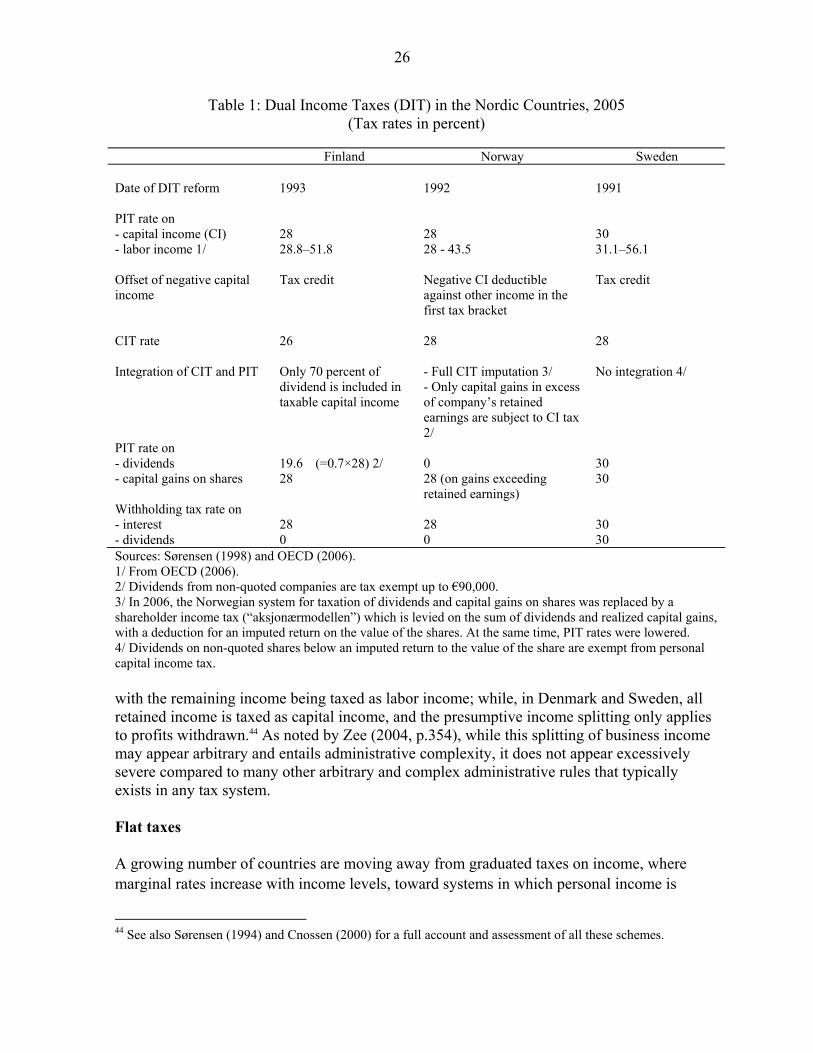
The DIT was (and is) considered to have several attractive features. First, by applying a flat rate to all capital income, tax arbitrage among capital income sources is prevented. Furthermore, because of the “flatness” of the capital income tax, it can, in many cases, conveniently be collected by final withholding. Second, with the global income tax coming under considerable pressure, the DIT was considered a reasonable compromise between several critical considerations: stimulating savings and investment in the face of increased capital mobility; preserving government revenue; and securing a reasonable degree of fairness in taxation. Finally, the tax can also claim some theoretical underpinning in optimal tax theory, as applied to small open economies (see Box 2). While specific practices differ across countries applying the DIT (the DITs in the Nordic countries are summarized in Table 1), its main characteristics are (Zee (2004)):
(1) capital income includes interest, dividends, capital gains, rents, royalties, and business profits;
(2) labor income includes wages and salaries (including imputed labor income of self-employed), pensions and social security benefits, perquisites, and royalties not classified as capital income;
(3) the rate of tax on capital income is uniform (to avoid tax arbitrage and to maintain neutrality) and moderate (to address capital mobility). Under a “pure” DIT, the rate would equal the lowest positive PIT rate; and
(4) the rates on labor income are progressive (for equity and revenue reasons) and
generally higher than the rate on capital income (on account of relatively low labor mobility), but not so high as to provide a strong incentive for the self-employed to disguise labor income as capital income.
The treatment of the self-employed has been considered the Achilles-heel of the DIT, because of the need to separate their income in return to capital and remuneration for labor services under a DIT. This cannot be done in any precise manner. In Finland and Norway, (until 2006),43 a presumptive rate of return on capital determines the share of capital income,
43 The system of mandatory income splitting worked reasonably well in Norway for the self-employed but not for so-called active owners of companies (owner-managers) who managed to avoid mandatory income splitting by inviting “passive” owners into the company. Starting in January 2006, the split model was replaced by additional taxation on distributed profit as ordinary income. Thus, partnerships will still be subject to 28 percent taxation upon all income irrespective of distribution, supplemented by 28 percent additional taxation on distributed profits. In order to compensate for the initial 28 percent taxation, only 72 percent of the distributed profit will be taxable. Furthermore, only the distributed profit exceeding a risk-free interest on the capital invested in the partnership will be taxable. The new regulations, called the “shielding method for partnerships,” will ensure the same level of taxation on both retained and distributed profit as in limited companies. The maximum marginal tax rate of distributed income will be 48.16 percent (0.28+0.72*0.28—see http://www.regjeringen.no/nb/dep/fin/tema/Norsk_okonomi/topics/The-corporate-tax-system-and-taxation-of-capital-income.html?id=418058). At the same time, the top marginal PIT rate has declined. Because these
(continued…)
25
Box 2. Taxes on Capital Income in an Open Economy
Two fundamental distinctions are necessary for understanding the design and impact of taxes on capital income, namely, source vs. residence-based taxes, and taxes on the normal return to capital vs. taxes on rents (see Sørensen, 2006). According to the source principle, the return to capital is taxed only in the country where the investment took place, whereas under the residence principle, returns are taxed in the country of residence of the investor, irrespective of where the investment took place. Typically, corporate income has been taxed under a source-based principle with general agreement that the source country has the first right to tax. Thus, most countries tax income generated only within their own borders, important exceptions being the United Kingdom, United States, and Japan, key capital exporting countries, which operate residence-based (or worldwide) tax systems and grant tax credits for foreign tax paid against domestic tax liabilities. The residence principle, on the other hand, is applied to personal income or wealth tax. However, government authorities often find it extremely hard to monitor and assess the returns on capital income invested abroad, so that, as if applied under a source principle, PIT usually end up falling on capital income invested at home only. The return to capital comprises the normal return to capital as well as rents. For example, the normal rate of return on debt is the market rate of interest (including a risk premium that varies according to the risk characteristics of the debt instrument). Rents are “pure profits” that are earned in excess of the normal market rate of return. In closed economies, the volume of domestic saving and investment will fall with a tax on the normal return to capital. A tax on rents, on the other hand, will be nondistortionary. In contrast, in small open economies, domestic savings and investment are uncoupled from each other. With the domestic interest rate being determined in the world capital market, a source-based tax on capital will not affect the rate of return to domestic savers. However, users of capital are price-takers so that domestic investment falls. Furthermore, if the tax falls on mobile rents, capital outflow occurs as the business activity generating the rent shifts abroad. For firms to break even under the tax, either output prices must rise or other costs must fall. With output prices fixed by competition from imports, the tax will cause the market clearing wage-rate to fall. In other words, in the absence of any location-specific rents, and in the face of perfectly mobile capital, the burden of a source-based tax on capital in an open economy falls entirely on labor (or other relatively immobile domestic factors). In the process, the productivity of labor also falls (on account of the lower capital intensity of production). In contrast, while a direct tax on labor income would also reduce the net wage rate, it would not distort the marginal return to capital invested at home vs. abroad. Neither would it cause a drop in productivity on account of the reduced capital intensity of production. Hence, a labor income tax dominates a source-based tax on capital income (Gordon and Hines (2002), and Sørensen (2006), building on the results of Diamond and Mirrlees (1971)). So, why do source-based capital income taxes survive? Sørensen (2006) points to a number of factors. First, location-specific rents may exist in the form of natural resources, access to market, infrastructure, qualified labor, an agglomeration of economic activities with strong spillover effects, and so on, which allow firms to earn above normal rates of return and governments to impose source-based taxes on rents without causing a capital flight. An additional incentive for governments to do so is if these rents coexist with (some degree of) foreign ownership of the domestic capital stock, which allows some portion of the tax burden to be shifted onto foreigners (Huizinga and Nielsen, 1997). Consistent with this argument, Huizinga and Nicodème (2003) find evidence of a positive relationship between average effective CIT rates and the foreign ownership of companies in Europe. Secondly, capital may not be perfectly and instantaneously mobile. There may be substantial costs to adjusting physical capital across borders, so that the domestic capital stock responds only gradually to source-based capital taxes. Financial instruments (particularly equity) issued in different countries may not be perfect substitutes and with investors wanting to hold diversified portfolios, governments may enjoy a degree of market power over the price of equity. Finally, taxes on capital income, particularly corporation taxes, may serve as a backstop to the PIT such that taxpayers do not have the incentive to shift labor and capital income into a corporate sector free of tax.
adjustments significantly reduce the margin between the top marginal tax rate on labor income and capital income, the incentives to convert labor income to capital income are also reduced (OECD, 2006 www.oecd.org/dataoecd/43/21/36346567.pdf).
26
Table 1: Dual Income Taxes (DIT) in the Nordic Countries, 2005 (Tax rates in percent)
Finland Norway Sweden
Date of DIT reform
1993
1992
1991
PIT rate on - capital income (CI) - labor income 1/
28 28.8–51.8
28 28 - 43.5
30 31.1–56.1
Offset of negative capital income
Tax credit
Negative CI deductible against other income in the first tax bracket
Tax credit
CIT rate
26
28
28
Integration of CIT and PIT
Only 70 percent of dividend is included in taxable capital income
- Full CIT imputation 3/ - Only capital gains in excess of company’s retained earnings are subject to CI tax 2/
No integration 4/
PIT rate on - dividends - capital gains on shares
19.6 (=0.7×28) 2/ 28
0 28 (on gains exceeding retained earnings)
30 30
Withholding tax rate on - interest - dividends
28 0
28 0
30 30
Sources: Sørensen (1998) and OECD (2006). 1/ From OECD (2006). 2/ Dividends from non-quoted companies are tax exempt up to €90,000. 3/ In 2006, the Norwegian system for taxation of dividends and capital gains on shares was replaced by a shareholder income tax (“aksjonærmodellen”) which is levied on the sum of dividends and realized capital gains, with a deduction for an imputed return on the value of the shares. At the same time, PIT rates were lowered. 4/ Dividends on non-quoted shares below an imputed return to the value of the share are exempt from personal capital income tax. with the remaining income being taxed as labor income; while, in Denmark and Sweden, all retained income is taxed as capital income, and the presumptive income splitting only applies to profits withdrawn.44 As noted by Zee (2004, p.354), while this splitting of business income may appear arbitrary and entails administrative complexity, it does not appear excessively severe compared to many other arbitrary and complex administrative rules that typically exists in any tax system. Flat taxes A growing number of countries are moving away from graduated taxes on income, where marginal rates increase with income levels, toward systems in which personal income is
44 See also Sørensen (1994) and Cnossen (2000) for a full account and assessment of all these schemes.
27
subjected to a single (usually low) flat rate (often also applied to corporate income). This spreading of the “flat tax,” initially centered in Eastern Europe, has attracted much attention. The experience in Russia, in particular, sparked great interest and enthusiasm: there the adoption of a flat tax at the start of 2000, with a reduction in top marginal rates from 20 percent and 30 percent to 13 percent, was followed by an increase in real revenues from the PIT of nearly one-quarter. Not surprisingly, adoption of a flat tax has been widely canvassed ever since and is currently on the agenda of several countries, including Mauritius, and has recently been adopted in the Czech Republic.45 In fact, there is no such thing as “the” flat tax. As originally conceived by Hall and Rabushka (‘HR,’1983 and 1985), the “true” flat tax is a combination of a cash flow tax on business income (that is, with full expensing of capital expenditure) and a tax on wage income at the same rate (against which personal and dependent allowances would be available), as currently being implemented in East Timor. It is thus, in effect, a particular form of expenditure tax. None of the “flat taxes” that have been introduced in practice, however—examples of which are shown in Table 246—are of the HR form. In Table 2, in six cases, the CIT is charged at the same rate as that on labor income.47 In Slovakia, VAT is also charged at the same rate (for which there is no clear economic rationale). In Georgia, there is no exempt amount, and the flat tax is being merged with the social security tax—48 a feature distinct from flat taxes in other countries. There is great variation, too, in the tax treatment of capital income, which is typically not subject to the same rate as labor income. The only feature that these tax systems have in common is the application of a single positive marginal rate to labor income, and it is
45 An early precursor to the current flat tax is Hong Kong SAR, which allows tax payers to choose between a progressive schedule and a flat tax (currently 16 percent) with a much narrower range of deductions. Other early (and nonoptional) flat taxes (in the sense defined below) include: Bolivia (13 percent), though in this case the tax is intended to serve largely as a means of enforcing the VAT, with amounts shown on VAT invoices deductible (and, consequently, a large market in fake invoices); Guernsey and Jersey (20 percent); and Jamaica (25 percent). Some sub-national governments also levy a flat tax, including Massachusetts and Alberta. More generally, flat income taxes have a long history. Perhaps surprisingly, the first income tax, adopted by Great Britain in 1798, was not flat, but characterized by increasing marginal tax rates; the version reintroduced in 1842, however, was (Keen, Kim and Varsano, 2006).
46 The following omissions from the list merit comment. First, Serbia, sometimes included among flat tax countries, also applies an additional tax on the sum of income from all sources above a threshold. Thus, the tax does not conform to the definition applied here as there are two strictly positive marginal rates applied to labor income. Second, Paraguay introduced a 10 percent flat PIT in 2007. However, the Paraguayan tax, like the Bolivian, is largely intended as an instrument to improve VAT compliance. Other omissions are São Tomé and Príncipe, where a flat rate on employment income has been in force since 1998, but for which data is not readily available, hence meriting their exclusion from the table (Keen, Kim and Varsano, 2007).
47 These are, perhaps, the cases closest to HR, though with the key difference that investment expenditure is not fully expensed, but instead attracts depreciation allowances.
48 Georgia is considering substituting a single 25 percent tax for the PIT (12 percent) and the social tax (20 percent).
28
this that has become the defining feature of the “flat tax”—with the further connotation, since the Russian reform, that this single rate will be low.49 The key and related merits claimed for the flat tax are that it is simple and encourages beneficial supply-side effects,50 including not least improved compliance. The latter effects, it should be noted, relate less to the “flatness” of the schedule but rather to its low level: much of the current flat tax rate rhetoric, arguably, is about the level of tax rates, not their number and, given the relative immobility of labour, PIT rates that are as low as 10 percent are hard to rationalize except as (possibly expensive) signals of fundamental regime shift toward market-oriented policies (Keen, Kim and Varsano, 2007). In addition, some are concerned by a loss of progressivity in moving to a flat rate structure, although others have argued that progressivity is improved by bringing hitherto untaxed income into the tax net. Despite the attention the recent crop of flat taxes has attracted, there has been little empirical analysis of their impact. On the basis of such evidence as there is, it does not seem to be the case that flat tax reforms have had Laffer curve effects, with reduction in rates in itself leading to such an expansion of the base—whether through increased economic activity or improved compliance—that revenue actually increased (Keen, Kim and Varsano, 2007). Analysis of a large panel of Russian individuals, observed both before and after the reform, shows quite firmly that the strong performance of PIT revenues after the reform was not due to the reform itself:51 it mainly reflected increased tax payments by people essentially unaffected by the reform. There are signs that compliance did improve in Russia following the reform, but it is not clear to what extent this was due to the reform itself rather than to improvements in tax administration occurring around the same time. While some degree of flatness in the taxation of labor income may help simplify a tax system, most of the complexity of a tax system typically comes from exemptions and exceptions in the definition of the tax base, and from the taxation of different types of income at different rates (with the latter, in particular, having in many cases survived the introduction of the flat tax, as noted above). Survey evidence for Russia does not suggest that the 2000 reform led to a system that was widely perceived as much simpler. However, countries that have adopted a flat tax have typically used this as an opportunity to scale back exemptions, offering voters and lobbyists a clear choice between a low rate and a narrow base (see Box 3 for exemption reducing measures undertaken by Slovakian authorities at the time of their flat tax reform).
49 Table 2 suggests that there have been two waves of flat tax reforms, the first comprising countries that set tax rates at typically the highest of the pre-reform marginal tax rates, and a second (starting with the Russian flat tax reform) comprising countries that typically have set it at the lowest of pre-reform rates.
50 These are not obvious in principle since some marginal tax rates rise for “archetypal” flat tax reforms. See Keen , Kim and Varsano (2007) for a comprehensive discussion.
51 These and other observations on the Russian experience are based on Ivanova, Keen and Klemm (2005).
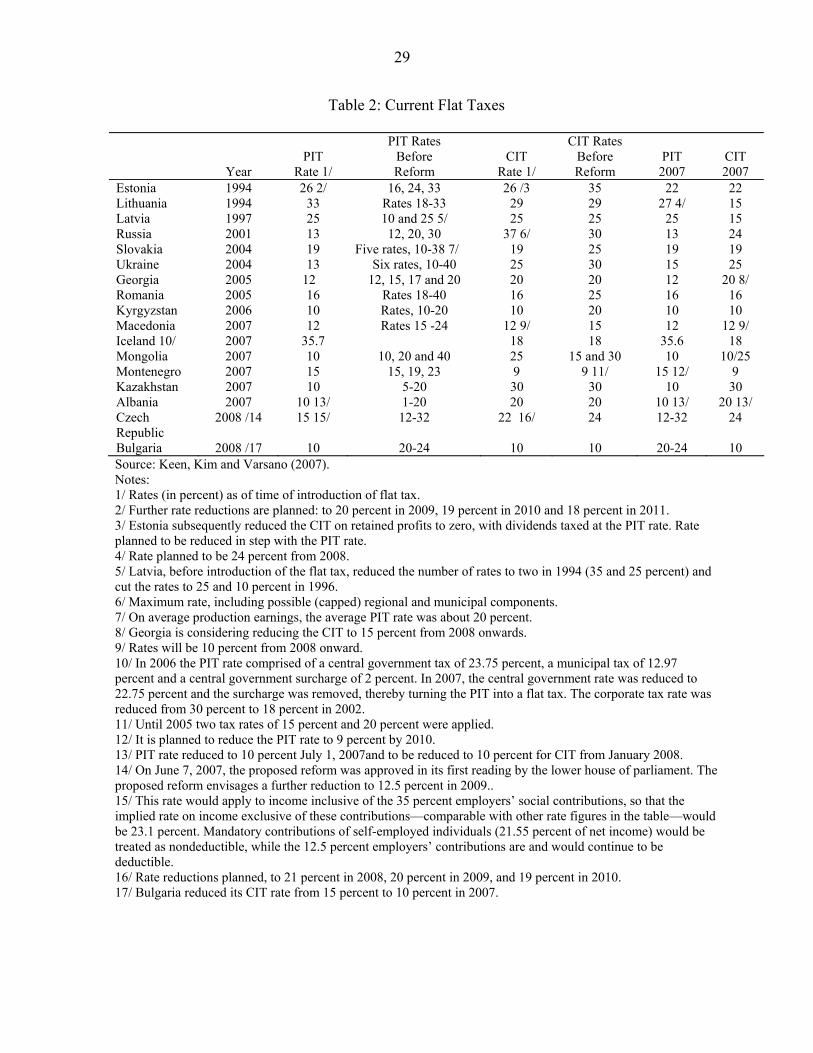
29
Table 2: Current Flat Taxes
Year
PIT
Rate 1/
PIT Rates Before Reform
CIT
Rate 1/
CIT Rates Before Reform
PIT 2007
CIT 2007
Estonia 1994 26 2/ 16, 24, 33 26 /3 35 22 22 Lithuania 1994 33 Rates 18-33 29 29 27 4/ 15 Latvia 1997 25 10 and 25 5/ 25 25 25 15 Russia 2001 13 12, 20, 30 37 6/ 30 13 24 Slovakia 2004 19 Five rates, 10-38 7/ 19 25 19 19 Ukraine 2004 13 Six rates, 10-40 25 30 15 25 Georgia 2005 12 12, 15, 17 and 20 20 20 12 20 8/ Romania 2005 16 Rates 18-40 16 25 16 16 Kyrgyzstan 2006 10 Rates, 10-20 10 20 10 10 Macedonia 2007 12 Rates 15 -24 12 9/ 15 12 12 9/ Iceland 10/ 2007 35.7 18 18 35.6 18 Mongolia 2007 10 10, 20 and 40 25 15 and 30 10 10/25 Montenegro 2007 15 15, 19, 23 9 9 11/ 15 12/ 9 Kazakhstan 2007 10 5-20 30 30 10 30 Albania 2007 10 13/ 1-20 20 20 10 13/ 20 13/ Czech Republic
2008 /14 15 15/ 12-32 22 16/ 24 12-32 24
Bulgaria 2008 /17 10 20-24 10 10 20-24 10 Source: Keen, Kim and Varsano (2007). Notes: 1/ Rates (in percent) as of time of introduction of flat tax. 2/ Further rate reductions are planned: to 20 percent in 2009, 19 percent in 2010 and 18 percent in 2011. 3/ Estonia subsequently reduced the CIT on retained profits to zero, with dividends taxed at the PIT rate. Rate planned to be reduced in step with the PIT rate. 4/ Rate planned to be 24 percent from 2008. 5/ Latvia, before introduction of the flat tax, reduced the number of rates to two in 1994 (35 and 25 percent) and cut the rates to 25 and 10 percent in 1996. 6/ Maximum rate, including possible (capped) regional and municipal components. 7/ On average production earnings, the average PIT rate was about 20 percent. 8/ Georgia is considering reducing the CIT to 15 percent from 2008 onwards. 9/ Rates will be 10 percent from 2008 onward. 10/ In 2006 the PIT rate comprised of a central government tax of 23.75 percent, a municipal tax of 12.97 percent and a central government surcharge of 2 percent. In 2007, the central government rate was reduced to 22.75 percent and the surcharge was removed, thereby turning the PIT into a flat tax. The corporate tax rate was reduced from 30 percent to 18 percent in 2002. 11/ Until 2005 two tax rates of 15 percent and 20 percent were applied. 12/ It is planned to reduce the PIT rate to 9 percent by 2010. 13/ PIT rate reduced to 10 percent July 1, 2007and to be reduced to 10 percent for CIT from January 2008. 14/ On June 7, 2007, the proposed reform was approved in its first reading by the lower house of parliament. The proposed reform envisages a further reduction to 12.5 percent in 2009.. 15/ This rate would apply to income inclusive of the 35 percent employers’ social contributions, so that the implied rate on income exclusive of these contributions—comparable with other rate figures in the table—would be 23.1 percent. Mandatory contributions of self-employed individuals (21.55 percent of net income) would be treated as nondeductible, while the 12.5 percent employers’ contributions are and would continue to be deductible. 16/ Rate reductions planned, to 21 percent in 2008, 20 percent in 2009, and 19 percent in 2010. 17/ Bulgaria reduced its CIT rate from 15 percent to 10 percent in 2007.
30
Finally, while the equity impact of the flat tax in practice has received almost no close analysis, it may be less adverse than it seems: almost all countries adopting a flat tax have at the same time increased personal allowances—thus the poorest actually pay less under the flat tax than under its predecessor, so that the distributional impact is not unambiguously adverse—and improved compliance by those facing the largest rate cut (who will be the better off) will go some way to offsetting the distributional effects of the change in the statutory rate structure.
Box 3. PIT And CIT Loopholes Closed in the Slovak Tax Reform
The following special exemptions, concerning both the PIT and the CIT base, were abolished: • Income of taxpayers in farming, forestry, and water management; • Income from yields on government bonds and securities denominated in foreign currency, and from yields
from mortgage debentures; • International grants; • Operational revenues of small scale power plants and environmentally-friendly equipment. In the CIT, several tax exemptions and concessions were abolished: • Tax exemptions of income from business activities of colleges, high schools, primary schools and
educational establishments; • Tax concessions on selected RD activities; • Tax concessions for creating jobs for partially disabled persons (Sk 10,000 for each) and for severely
disabled persons (Sk 24,000) when the enterprise was not subject to a reduced CIT rate. In the PIT, the following exemptions were abolished: • Supplementary pension insurance paid by the employer • Several allowances, total number reduced from six to three; • 10 percent tax rate on use of the Social Fund; • Revenues from sale of securities (previously exempt if three years between the purchase and the sale, or if
annual revenues did not exceed Sk 50,000); • Income of members of military missions working abroad and paid in foreign currency; • Earned interest on deposits in construction saving societies, and on state aid. Source: Ministry of Finance, Slovak Republic (cited from World Bank (2007)). Reducing the tax wedge on labor
A series of fairly recent empirical studies, mainly focusing on developed countries, unequivocally support the notion that the size of the tax wedge significantly affects labor market outcomes. Nickell (2003), averaging the results of different OECD studies, concludes that “a 10 percentage points rise in the tax wedge reduces labor input by somewhere between 1 and 3 percent of the population of working age”. This implies, for example, that the difference in the tax wedge would explain around one-quarter of the overall difference in the employment rate between the United States and the three big countries of continental Europe (France, Germany, and Italy). Bassanini and Duval (2006), using pooled data for OECD countries for 1982–2003, found that a 10 percentage points reduction in the tax wedge would be associated with a drop in the unemployment rate by 2.8 percentage points.52 Because of the 52 World Bank (2007), forthcoming, provides a good summary of these latest analyses.
31
potentially negative effect on employment associated with tax wedges, some countries are considering moving away from social security contributions toward other more neutral consumption based taxes (e.g., Belgium) in order to finance their social security programs. However, while the empirical analyses seem clear, actual trends regarding developments in the level of labor tax wedges are far from uniform (cf. section III), with for example EU-15 and EU-10 countries on average moving in opposite directions. A number of countries over the last few decades have either introduced or expanded programs that aim to enhance employment opportunities for low-income and low-skilled workers, while, at the same time, maintaining socially acceptable wage rates (also referred to as “make work pay” policies), for instance, through employment-conditional benefits and tax credits, or employment subsidies and payroll tax rebates given to employers. Examples of such programs include the earned income tax credit (EITC) in the United States and the working families’ tax credit (WFTC) in the United Kingdom53 (see Pearson and Scarpetta, 2000).
Growing empirical evidence as well as increased experience with such programs suggests that if designed properly, these programs can have a beneficial effect on the labor supply decisions of recipients. For instance, a survey by Eissa and Hoynes (2005) of the U.S. EITC54 notes that, over the years, expansions in the available tax credit have led to dramatic declines in average tax rates (from 14.5 percent in 1985 to a negative 4.1 percent in 2000 i.e., the United States provided a subsidy equivalent to 4.1 percent of income). Furthermore, according to Eissa and Hoynes, the empirical evidence consistently showed that such EITC expansions raise employment rates particularly for single low-income mothers in the United States, but there is little evidence that the credit leads to reduced hours worked for those already in the labor market, perhaps, due to the inability of workers to choose continuous hours of work. Evidence from the United Kingdom similarly shows that an increase in credits in 1999 had a positive effect on the labor participation rates, hours, and earnings of those who were eligible for the credit (in particular, single mothers), and that it reduced the fraction of people who said that they had a serious health problem, or that a health problem had prevented them from working (Leigh, 2005). However, disincentive effects were also noted for women whose partners were employed (Blundell and Meghir, 2002).
53 For a review of such policies in Netherlands, Finland, Ireland, Germany and Belgium, see Gradus and Julsing (2003).
54 This is currently the largest federal cash transfer program in the United States. In 2003, some 20 million families were projected to have benefited from the tax credit at a total cost to the U.S. federal government of more than 34 billion dollars (Eissa and Hoynes, 2005).
32
B. International Harmonization and Coordination Initiatives
The most prominent among these are the OECD initiative against “harmful” tax competition (or practices) and the EU initiatives to remove tax obstacles to intra-community economic flows. The OECD initiative55 The OECD initiative gained prominence during the 1990s, particularly with the publication of the 1998 report on harmful tax competition (OECD, 1998).56 Harmful tax practices include both practices in member countries and those of “tax havens.” Features of harmful preferential tax regimes according to OECD (1998) included: low (or nil) effective tax rates;57 lack of effective exchange of information; lack of transparency; ring-fencing or—in the case of tax havens—lack of substantial economic activity taking place in the country or territory. The initiative lead to the establishment of a Forum on Harmful Tax Practices, which maintains a list of uncooperative tax havens. The list initially included 35 jurisdictions, but has since dwindled down—due, in part, to increased cooperation—to only five tax havens.58 For OECD member states, harmful tax practices should have been completely eliminated by now. Concerning nonmember states, it remains an open question what kind of enforcement powers are available to make them fully compliant, and the timing of their use in case of noncooperation. For nonmembers, the OECD initiative has more to do with prevention of revenue erosion to tax havens than with standard tax competition. Little accurate information is available about the actual extent of tax base erosion, but some indication may be found in the available (and highly uncertain) estimates of the total amount of capital channeled through off-shore financial centers (which may not necessarily be tax havens) in the order of US$5,000–7,000 billion.59
55 For a comprehensive discussion of the OECD initiative see Abery (2007).
56 Switzerland and Luxembourg abstained on the OECD Council approval of the 1998 Report which also applies to any follow-up work undertaken since 1998. 57 According to OECD (1998), while “no or low tax” is a gateway criterion to determine whether further analysis is necessary it does not itself constitute a harmful tax practice. http://www.oecd.org/document/49/0,3343,en_2649_33745_33995569_1_1_1_1,00.htm.
58 “All Together Now,” The Economist, February 22nd 2007. http://www.economist.com/specialreports/PrinterFriendly.cfm?story_id=8695207.
59 This estimate—based on data from BIS, IMF, and OECD—was given by Jeffrey Owens, Director of the OECD Centre for Tax Policy and Administration, at his testimony before the U.S. Senate Finance Committee on Offshore Tax Evasion on May 3, 2007. An interesting 2006 report from a U.S. Senate committee (Tax Haven Abuses: the Enablers, the Tools and Secrecy, Committee on Homeland Security and Government Affairs, August 1, 2006) notes that Americans now have more than US$1 trillion in assets offshore.
33
EU’s tax package As part of its efforts to counter harmful tax competition, the EU has adopted a series of measures in the last decade or so. Of particular importance in this context was the adoption by EU Ministers of Finance (the Council) in June 2003 of a “package” to tackle harmful tax competition and promote tax coordination, consisting of four elements. First, a political code of conduct to eliminate harmful business tax regimes.60 The underlying report (from November 1999) identified 66 tax measures with harmful features which member states agreed to revise or replace. Low statutory rates were not considered harmful; instead, criteria for the existence of harmful features included: a significantly lower level of effective taxation than that which generally applies in the country concerned; tax advantages reserved to nonresidents only; tax benefits available absent real economic activity; tax incentives for activities isolated from the domestic economy (ring-fenced); nontraditional rules for taxation of multinational companies (departing from principles set by the OECD); and lack of transparency of tax provisions (including covert relaxation of rules at the administrative level). The code remains “soft law” which does not bind member states. Second, a legislative measure to ensure an effective minimum level of taxation of savings income of individuals. The directive on taxation of savings is intended to avoid distortions to the movement of capital and allow effective taxation of cross-border flows of interest payments to individuals, thereby limiting the evasion of capital tax by individuals who place their savings in other member states or third countries where there is no taxation. The provisions applied as of July 1 2005 in all 25 member states, as well as in 10 dependent or associated territories of member states. Equivalent measures applied to five European third countries (including Switzerland). The directive allows two different approaches: • While all members ultimately are expected to introduce automatic exchange of
information on interest payments by paying agents to individuals resident in other member countries, all members, except Belgium, Luxembourg, and Austria (who all have bank secrecy laws), immediately introduced such a system of information reporting by imposing an obligation on financial institutions to report the amount of payments to the payee’s state of residence.
60 The code itself had been accepted by the council already in December 1997.
34
• Belgium, Luxembourg, and Austria during a transitional period operate a system of withholding taxes on interest payment to individual nonresidents at 15 percent for the first three years, 20 percent for the following three years, and 35 percent thereafter. They transfer 75 percent of the revenue of the withholding tax to the investor’s state of residence. The withholding tax is entirely creditable (or refundable) in the investor’s state of tax residence. Individuals have the option to disclose information about savings held abroad as an alternative to the withholding tax. The three countries are entitled to receive information from other member states.
The end of the transitional period is made contingent on EU agreement with a number of third countries on exchange of information in this area, and on agreement in the council that the United States is committed to exchange of information upon request as defined in the 2002 OECD model agreement in relation to interest. While there is fairly little or no experience with the working of comprehensive systems of information exchange (Zee, 2004), the savings directive can be seen as an innovative vehicle to better tax cross-border flows of saving, and it should provide a valuable experiment in this regard. However, the impact of the directive will be limited insofar as savings are so narrowly defined covering only interest income from bonds and not capital gains or dividend income, and hence runs the risk of creating tax related distortions in the treatment of investment income. Countries that have agreed to withhold taxes and remit have so far only remitted a tiny 210 Euros.61 An EU wide tax imposed at a moderate or low rate that is broadly based may be another option to consider. However, individual investors will continue to have the opportunity to evade taxes—they can simply move funds to financial centers outside the EU. Third, a legislative measure to eliminate source taxes on cross-border payments of interest and royalties between associated companies. The “I + R directive” eliminates any taxes, including withholding taxes, on interest and royalty payments within a group of companies arising in a member state, where the beneficiary is a company or permanent establishment (subject to corporate tax in the EU and of a type listed in the annex to the directive) in another member state. Finally, guidelines on the application of state aid rules (first adopted by the Commission in November 1998—98/C384/03) to measures relating to direct business taxation. These are based on the treaty’s competition rules which have the force of law. They seek to restrict member state competition through subsidy of business and have been held by the European Court of Justice to apply to indirect subsidies like tax breaks. In this way, these provisions “circumvent” the unanimity rule that applies ot tax harmonization initiatives.
61 “All Together Now,” The Economist, February 22nd 2007. http://www.economist.com/specialreports/PrinterFriendly.cfm?story_id=8695207.
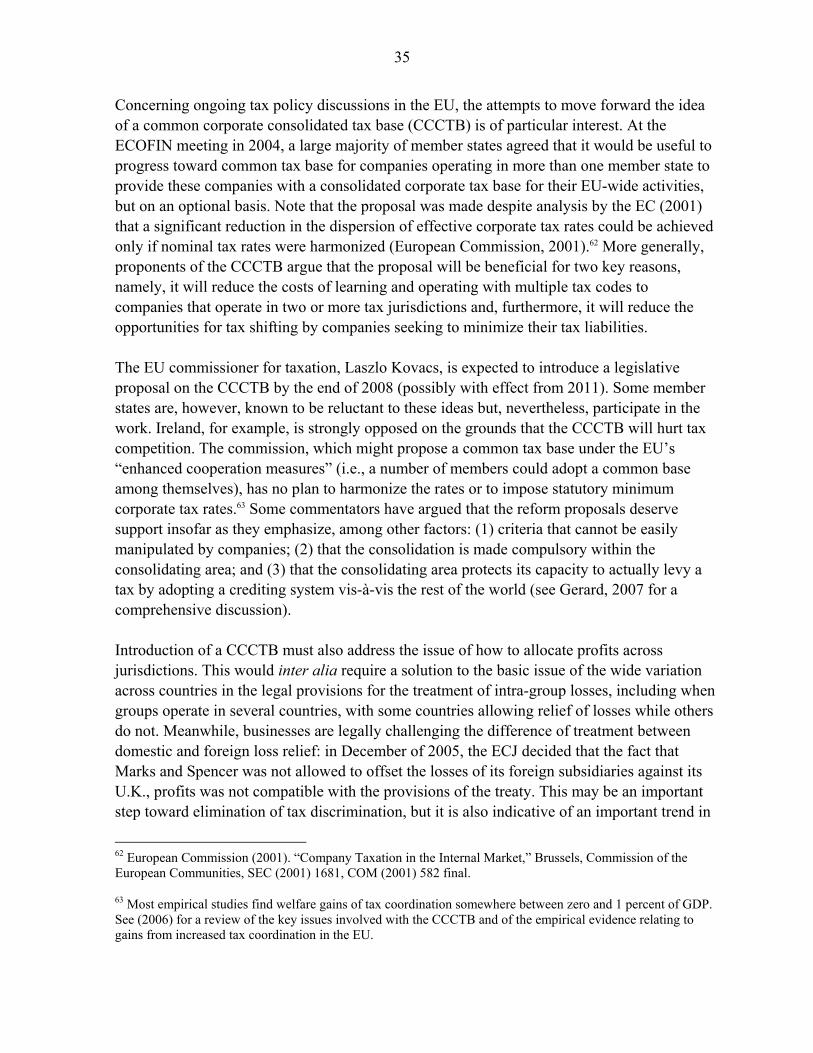
35
Concerning ongoing tax policy discussions in the EU, the attempts to move forward the idea of a common corporate consolidated tax base (CCCTB) is of particular interest. At the ECOFIN meeting in 2004, a large majority of member states agreed that it would be useful to progress toward common tax base for companies operating in more than one member state to provide these companies with a consolidated corporate tax base for their EU-wide activities, but on an optional basis. Note that the proposal was made despite analysis by the EC (2001) that a significant reduction in the dispersion of effective corporate tax rates could be achieved only if nominal tax rates were harmonized (European Commission, 2001).62 More generally, proponents of the CCCTB argue that the proposal will be beneficial for two key reasons, namely, it will reduce the costs of learning and operating with multiple tax codes to companies that operate in two or more tax jurisdictions and, furthermore, it will reduce the opportunities for tax shifting by companies seeking to minimize their tax liabilities. The EU commissioner for taxation, Laszlo Kovacs, is expected to introduce a legislative proposal on the CCCTB by the end of 2008 (possibly with effect from 2011). Some member states are, however, known to be reluctant to these ideas but, nevertheless, participate in the work. Ireland, for example, is strongly opposed on the grounds that the CCCTB will hurt tax competition. The commission, which might propose a common tax base under the EU’s “enhanced cooperation measures” (i.e., a number of members could adopt a common base among themselves), has no plan to harmonize the rates or to impose statutory minimum corporate tax rates.63 Some commentators have argued that the reform proposals deserve support insofar as they emphasize, among other factors: (1) criteria that cannot be easily manipulated by companies; (2) that the consolidation is made compulsory within the consolidating area; and (3) that the consolidating area protects its capacity to actually levy a tax by adopting a crediting system vis-à-vis the rest of the world (see Gerard, 2007 for a comprehensive discussion). Introduction of a CCCTB must also address the issue of how to allocate profits across jurisdictions. This would inter alia require a solution to the basic issue of the wide variation across countries in the legal provisions for the treatment of intra-group losses, including when groups operate in several countries, with some countries allowing relief of losses while others do not. Meanwhile, businesses are legally challenging the difference of treatment between domestic and foreign loss relief: in December of 2005, the ECJ decided that the fact that Marks and Spencer was not allowed to offset the losses of its foreign subsidiaries against its U.K., profits was not compatible with the provisions of the treaty. This may be an important step toward elimination of tax discrimination, but it is also indicative of an important trend in
62 European Commission (2001). “Company Taxation in the Internal Market,” Brussels, Commission of the European Communities, SEC (2001) 1681, COM (2001) 582 final.
63 Most empirical studies find welfare gains of tax coordination somewhere between zero and 1 percent of GDP. See (2006) for a review of the key issues involved with the CCCTB and of the empirical evidence relating to gains from increased tax coordination in the EU.
36
EU tax matters—namely, the increased importance of the rulings of the court as a driver of EU tax consolidation which eventually may lead to fundamental changes of national tax systems.
C. The Move Toward Taxing Consumption—and the Spread of the VAT
Introduction A significant development over the past two decades has been the growing importance of revenue from consumption-based taxes in developing countries and transition economies. Figure 11 below indicates that revenue from indirect taxes rose from an average of 4.6 percent of GDP in 1990 to 5.4 percent by 2002 in Africa and the Asia-Pacific region, while in Latin American and Caribbean countries average revenues rose from 4.1 percent to 8.8 percent of GDP over the corresponding period.
Figure 11: Trends in Indirect Taxes on Domestic Goods and Services (Revenues as a percentage of GDP)
3
6
9
12
1990 1992 1994 1996 1998 2000 2002
%
OECD AfricaAsia-Pacific ME &NAL. America & Caribbean G-7C. Europe and BR
0.0
2.0
4.0
6.0
8.0
10.0
12.0
OECD Africa As ia-Pacific
ME &NA L. America&
Carib bean
G-7 C. Europ eand BR
%
1992 2002
Source: Data for OECD and G-7 countries were obtained from general government accounts of the OECD Revenue Statistics Service. Data for the remaining country groups were obtained from central government accounts in the GFS database at the IMF (IMF, TP). Data from 2001 is used for indirect tax revenue figures for 2002 for MENA countries.
The growing importance of indirect taxes in developing countries reflects, in part, the decline in revenue from traditional sources of revenue, in particular, the decline in revenues due to the dismantling of trade barriers over the last two decades (see later). The shift toward taxing consumption can also be understood in light of the increased cross border competition for mobile tax bases—the argument for taxing consumption being that it is relatively less mobile than, say, capital income (see Box 4 for a distinction between consumption and income taxes).
37
Box 4. Taxing Consumption vs. Taxing Income
The conventional distinction of consumption taxes is that they are imposed on the sale and purchase of goods and services (excluding labor services), e.g., general sales tax, excise, and trade taxes, while income taxes are levied on the compensation to labor as well as the return on savings and investment, e.g., personal income and CITs. However, if viewed from an inter-temporal approach, income saved today is ultimately consumed tomorrow—consequently the present value of lifetime labor income (including inheritance) is equal to the present value of lifetime consumption (including bequests). Hence, taxing labor income is equivalent to taxing consumption over a consumer’s life cycle. The important distinction to note here is that the equivalence exists only between consumption and labor income and not consumption and comprehensive income (the aggregate of labor and capital income). Thus, a shift toward taxing consumption is actually a shift toward taxing only labor income rather than comprehensive income. Stated differently, it effectively means that capital income is not taxed, only labor income (Zee, 2004).
There are two broad proposals to shift the structure of taxation away from comprehensive income toward consumption. The first is similar to the Hall and Rabushka (1995) proposal for a “flat tax” under which conventional PIT is replaced by a wage tax and the CIT replaced by net cashflow tax on real transactions (i.e., sales and purchases of goods and services). Full expensing of capital expenditures is allowed. Under the second, the PIT is replaced with a tax on net cashflows derived from real and financial transactions (lending and borrowing) and the CIT with a VAT (see Zee, 2004).
The spread of the VAT One trend that deserves particular attention with regard to indirect taxes is the widespread adoption of the VAT64 both among developing countries and developed countries. It is estimated that the VAT currently raises some 20 percent of the world’s tax revenues and affects some 4 billion people (Ebrill, Keen, Bodin and Summers (2001)). In 1989, there were only 48 countries, primarily located in Western Europe and Latin America but also including a handful of developing countries (see map), that had adopted a VAT. However, at the start of 2007, there were 143 such countries.65 The spread of the VAT has been attributed to a number of factors. Ebrill and others (2001) suggest that in Western Europe, the VAT was connected to the drive for greater economic integration,66 whereas in transition economies a key consideration was the need to replace traditional sources of revenue, such as levies on state enterprises in CIS countries. Investigating a panel of 143 countries over a period of 25 years, Keen and Lockwood (2007) find evidence to suggest that, among other factors, the adoption of a VAT is more likely the
64 The VAT has been defined as “a broad based tax on commodity sales up to and including, at least, the manufacturing stage, with systematic offsetting of tax charged on commodities purchased as inputs—except perhaps on capital goods—against that due on outputs” (Chapter 1, Ebrill, Keen, Bodin and Summers (2001)).
65 As Keen and Simone (2004) point out, these figures tend to “overdramatize” the switch to VAT systems since many sales tax systems that existed prior to the adoption of the VAT had VAT-like features or some limited degree of crediting.
66 The adoption of a VAT is a prerequisite for membership in the EU.
38
lower is a country’s openness to trade, the higher the proportion of neighbouring countries with a VAT,67 and if there has been participation in an IMF program.68 Proponents of the VAT argue that it is a particularly efficient tax in the sense that revenue is secured by being collected throughout the chain of production, unlike a retail sales tax under which all tax is lost if there is evasion at the final stage. Furthermore, there is no distortion of production choices and nontransparency that, for instance, are associated with cascading turnover taxes. More generally, the VAT is also seen as a catalyst for modernizing the way countries administer taxes, in particular, by introducing methods for self-assessment that can then be extended to other taxes thus easing administration costs associated with these taxes too (Ebrill and others, 2001). On the other hand, it is argued that these efficiency gains can be offset by substantial administrative and compliance costs and possibly adverse distributional consequences. In this regard, it is pertinent to note that the issue of whether the VAT should have multiple rates or a single rate is central. Developing countries have generally chosen to adopt single-rate VAT systems while more developed OECD countries largely favored multi-rate systems. The preference among developing countries for single-rate VAT systems stems in large measure from their relatively weak administrative capabilities.69 On the other hand, it should be noted that arguments for VAT differentiation on equity grounds are stronger in developing countries, since they have fewer alternative instruments available to them relative to developed countries. Furthermore, if the crediting chain of the VAT is broken, production decisions can be distorted and the final incidence of the tax becomes uncertain. To the extent that the structure of taxation interacts with the size of the formal and informal sector, Emran and Stiglitz (2005) argue that the attraction of the VAT (relative to tariffs) can be undermined by a shift of activity from the formal to the informal sector, although, as noted by Keen (2006), a large portion of the VAT collected in developing countries is levied on imports and, therefore, serves as a tariff for producers in the informal sector. Empirical evidence indicates that the effect of the VAT on revenue is in general positive in the large majority of countries that have adopted a VAT, with gains tending to be greater in high income and more open economies (Keen and Lockwood, 2007).
67 Whether these results point toward herd effects or yardstick competition is unclear.
68 The significance of IMF programs suggests a potential role for underlying macro/fiscal difficulties.
69 Of the 21 African countries that adopted a VAT between 1990–99, currently 14 have a single-rate VAT system, while eight of the nine African countries that adopted a VAT from 2000 onward also have single-rate VAT systems.
39
VAT fraud Just as the VAT has become more pervasive over time, so has VAT fraud. Although difficult to measure (given its nature), it is estimated that criminal attacks on the VAT cost the EU up to US$340 billion a year, leading to calls by the EU Tax Commissioner for a “fundamental change” to the EU VAT system.70 Types of VAT fraud range from internal fraud (wrong declarations or undue deductions), which can be addressed by improving tax administration and developing sophisticated risk based auditing systems, and fraud, which has an international dimension and requires some degree of administrative cooperation, of which cross-border fraud is particularly important. Essentially, the latter concerns the tax free nature of cross-border trade. Fraudsters obtain VAT registration to acquire goods VAT free from other member states, then sell on the goods at VAT inclusive prices and disappear without passing on the VAT paid by their customers to the tax authorities. The fraud is usually carried out very quickly, with the fraudsters disappearing by the time the tax authorities follow up the registration with their regular assurance activities (“missing trader” fraud) . One variation of this is “carousel fraud”—goods are repeatedly imported and reexported in a series of contrived transactions, with VAT stolen by the importer and refunds claimed by exporters each time a good is sold to another state.
Solutions advanced for tackling VAT fraud can be grouped into those that have traditionally been concerned with the design of the EU VAT in the absence of border controls and other, more recent, proposals that focus on carousel fraud (Ainsworth, 2007).
There are three key proposals in the former group. The first suggests taxing intra-community transactions at origin, e.g., as under the common VAT71 which taxes sales at the rate of the country from which the goods are supplied. Under this, the importer in one member state deducts the VAT collected in another. The second suggests requiring prepayment for intra-community transactions—under the prepaid VAT (PVAT),72 goods are not released into cross-border trade without payment of tax at either at origin or at destination. The third category of proposals suggest the imposition of a community level “Euro-VAT” to coordinate transactions among member states, such as the compensating VAT (CVAT) or the variable integrated VAT (VIVAT). Under the CVAT,73 a federal VAT is imposed when exporting across an internal border (rather than simply zero-rating them), followed by a full deduction by the importing party but only in conjunction with filing a return.74 This minimizes the risk 70 “Europe needs to reform VAT” published in The Financial Times, April 20, 2007. 71 European Commission, “A common system of VAT: A program for the single market,” COM (1996) 328 final. 72 Developed by Poddar and Hutton (2001).
73 See McLure (2000).
74 A CVAT is currently being considered for implementation in Brazil.
40
that unscrupulous traders will try to masquerade as registered traders in other states in order to make zero-rated purchases. The VIVAT,75 on the other hand, involves the application of a common VAT rate on all sales to registered traders anywhere within the EU, with the rate applicable to final sales, an outcome of each state’s decision on the appropriate tax burden on the final consumer. Recent suggestions that focus on carousel fraud include recommendations for electronic invoices (the Mittler model, see Ainsworth, 2007) and pay-first models under which buyers can claim input tax deductions only if they can prove that the seller has paid VAT to the tax authorities (one controversial method is through the establishment of special bank accounts to ensure that the supplier actually pays the VAT being claimed). Reverse charge proposals are another alternative whereby tax is charged at the end of the supply chain (i.e., to businesses acquiring goods or services). Advocated primarily by Germany and Austria,76 according to these proposals, businesses buying inputs (for which they are allowed to claim an input deduction) do not pay VAT. Instead, they self-assess and, at the same time, claim a credit. The invoice does not include the amount for VAT and, consequently, the seller who no longer has VAT in hand, does not have an incentive to disappear (see Ainsworth, 2007, for a discussion).
The European Commission on the other hand has expressed a preference for a common VAT, specifically taxation in the member state of departure (country of origin) at a uniform rate of 15 percent, and using a bilateral (microeconomic) clearing procedure in order to allocate revenues between countries that are net exporters and net importers.77 Under this, carousel fraud is eliminated since goods are no longer allowed to circulate VAT-free between member states. Generally, however, the difference between “old” OECD VAT systems and “new” VAT systems that have been adopted only recently by, for instance, Chile, Singapore, and New Zealand should be noted. VAT systems in the latter group are characterized by relatively low rates and the tax is broadly based with few exemptions and deductions. These features are important insofar as low rates and a broad base both reduce the scope and incentive for fraud. Financial services and the VAT The treatment of financial services in most countries has been largely determined by the precedent first set by the EU when it implemented its own VAT in 1977 (Zee, 2004). First, it adopted the invoice-credit mechanism for implementing the VAT and, secondly, it exempted 75 Keen and Smith (1996).
76 For example, see the Financial Times, “Germany and Austria to block EU tax reforms in dispute over VAT,” November 28, 2006.
77 www.consilium.europa.eu/ueDocs/cms_Data/docs/pressData/en/ecofin/94492.pdf.
41
the financial services sector on account of difficulties associated with extending the invoice mechanism to value added in the financial sector.78 Consequently, financial services tend to be wholly VAT exempt79 in developing countries, and partially so in developed countries (VAT is usually applied to services rendered for an explicit fee). However, given that one-quarter of GDP in OECD and one-tenth in non-OECD countries is accounted for by the financial sector (Zee, 2004), there is scope for increasing VAT revenues, although the extent of the increase will be offset to some degree by the loss of revenue collected from the taxation of financial sector inputs (with exemption, although tax is not charged on the output of the financial sector, neither can it be reclaimed on inputs).
The main difficulty with the exemption of the financial sector is the cascading that arises from the break in the VAT credit chain and, consequently, the overtaxation of financial services when they are used by businesses80 and undertaxation when consumed by final consumers. Various countries have, therefore, sought to rectify the overtaxation of financial services when used as inputs. For instance, Israel uses the addition method to tax aggregate value added in the financial sector, i.e., levies tax directly on the sum of wages and profits. Under the alternative subtraction method, tax would be levied on the excess of a firm’s output over its inputs. Neither method is, however, fully compatible with the use of the invoice method in the rest of the economy (the tax on the financial sector is not imposed on a transaction by transaction basis) and does not allow the systematic crediting of financial services provided to registered businesses. In the case of Israel, because the addition-method VAT applied to the financial sector is not a creditable tax for the invoice-credit VAT applied to the remainder of the economy, the simultaneous application of the two methods actually results in substantial cascading (Zee, 2004).
Australia and Singapore, on the other hand, allow financial institutions to claim a credit for a fixed proportion of the VAT paid on their inputs, even though the final output is exempt. This, although it serves to reduce the over taxation of businesses, only serves to worsen the undertaxation of consumers. In New Zealand (and in Singapore, as an alternative to the method described above), businesses are allowed to zero-rate their purchases of financial service inputs. This, although it can entail significant tax administration and compliance costs, completely rectifies the overtaxation of businesses and does not affect the undertaxation of
78 The problem was not so much determining aggregate value added in the financial sector but rather determining what proportion of value added from financial intermediation should be allocated to consumers (to be taxed) and producers (not to be taxed, see Keen and Boadway, 2003, for a discussion).
79 A VAT exemption refers to a situation when the rate of tax applied to output sales is zero. However, in contrast with items that are “zero-rated” no credit is given for taxes paid on inputs.
80 The financial sector, whose output is VAT exempt, cannot deduct input VAT on services or goods (e.g., computers) supplied to them. Their charges to customers will, therefore, reflect this VAT cost and, as it cannot be recovered by business customers, cascades through the system, increasing the cost of the goods and services.
42
consumers. Finally, a third suggestion has been to apply VAT on a cash-flow basis, whereby all inflows of funds (including loan and interest receipts) are treated as equivalent to sales (and hence taxable if the recipient is registered), while all outflows, including loan repayments or interest payments, are allowed a credit if the payer is registered. The approach is, however, untested and could also entail large compliance costs on the part of businesses that must perform VAT calculation on a cash-flow basis on transactions with financial institutions if they are to obtain tax credits.81 Taxing e-commerce Although there is no universal definition of e-commerce, one useful description refers to all those “commercial transactions involving the production, distribution, sale, and delivery of goods that are carried out over open networks, such as the internet” (Pinto, 2003). The question that arises is to what degree are these transactions sufficiently different from traditional “bricks and mortar” commerce to warrant conceptually different tax treatment? To the extent that open networks, such as the internet, are used to arrange the delivery of goods across borders, then the issue is one of cross-border trade. If production/delivery itself is over the internet, e.g., in the provision of a service, then the issue becomes one of taxing services that can be provided internationally. The consensus in the EU appears to favor neutral taxation with the intention that there should be a level playing field for all commerce, whether electronic or otherwise. The main principle behind the EU-VAT system is that it is applied on a destination principle.82 Consequently, e-traders who sell physical commodities to private consumers in other EU countries are required to register with the tax authorities of all EU countries if sales lie above a certain threshold and pay tax at the rate applicable in the buyer’s country of residence. Otherwise, registration is not required and the tax is applied on an origin basis.
The extent of registration compliance according to thresholds is, however, uncertain, since there is an incentive for traders located in low-VAT countries to apply the local VAT rates. Therefore, in the absence of border controls, and with local tax authorities also lacking incentives to track total sales by domestic sellers to other countries, it is suspected that a major portion of intra-EU online trade in physical goods is taxed according to the origin principle, such that low-tax countries gain revenue at the expense of high-tax countries. In turn, this may place pressure on high-tax countries to lower (or “harmonize”) taxes to levels set by low-tax countries (Rasmussen, 2004). With regard to the trade-in-services (or 81 An alternative discussed in Zee (2004) is to apply a modified reverse charging system to all VAT free inputs (including interest paid on deposits) purchased by financial institutions and taxing all their outputs (including the interest received on loans). This is economically equivalent to a cash-flow system.
82 Under the destination principle, exports of goods are untaxed while imports are taxed at the same rate as goods produced and sold domestically. Under the origin (or the source) principle, it is the origin of the commodity, i.e. the location of the seller, that determines the tax rate so that all goods produced within a tax jurisdiction are taxed at the same rate irrespective of the final destination of the good.
43
digitalized goods), an “e-commerce VAT” directive (COM (2002) 38) has been in force since July 1, 2003. Recently extended till December 2008, it specifies that non-EU residents selling services to EU residents are required to pay VAT on sales to the latter.83 EU firms on the other hand, are zero-rated for exports to non-EU customers, but pay VAT according to the origin principle on sales to EU customers.84
In the United States, the tone of the debate has been somewhat different, focusing on the extent to which e-commerce should be subject to indirect taxation under the U.S. system of state sales taxes (Zodrow, 2003), with arguments being made for preferential treatment of e-commerce on the grounds that it is a young industry that is likely to respond to such treatment (see Goolsbee, 2000). Consequently, a moratorium has existed on certain types of taxes relating to e-commerce since 1998,85 namely, taxes on internet access and “multiple and discriminatory” taxes over and above existing state sales taxes that are aimed specifically at online commerce.86 The presence of network externalities has also been used to justify preferential tax treatment, although Zodrow (2003) concludes that favorable treatment on these grounds is unwarranted.
83 Prior to 2003, imports of e-services into the EU were untaxed, thus putting EU companies at a competitive disadvantage.
84 While the directive makes provisions for simplified registration and reporting obligations for non-EU traders, generally the extent of compliance is unclear since digital transactions are extremely hard to verify. 85 Under the Internet Tax Freedom Act (ITFA) enacted in 1998, extended till 2003 by the Internet Tax Freedom Act of 2001, and further until November 2007 by the 2004 Internet Tax Nondiscrimination Act, and is likely to be extended beyond that date.
86 It should be noted that the U.S. commodity tax system is highly complex, comprising local and state taxes, with varying tax rates and tax bases. Goods are taxed according to the destination of final consumption, and in-state purchases are subject to sales taxes collected by the seller. Out-of-state purchases, on the other hand, are subject to a use-tax levied on the buyer, with collection by the seller if the seller has a physical presence (or “nexus”) in the buyer’s state. At the current moment, out-of-state companies (without nexus) are not required to collect use taxes for purchases by state residents because this is regarded as placing an “undue burden” on interstate commerce, although Congress (which has the right to regulate interstate commerce) has the right to and can pass such regulations in the future (also see Ward and Sipior, 2004). Without “nexus”, collection of the use tax is left to self-reporting by the buyer, and compliance is almost nonexistent. The relevance of this for e-commerce is that internet companies (e.g., Amazon) have nexus in only a few states, so that e-commerce is largely untaxed with a significant loss in state sales tax revenue. Rasmussen (2004) argues that this qualifies as tax evasion, and is unconnected to the Internet Tax Freedom Act (ITFA) of 1998—buyers of e-commerce are required to pay tax under the ITFA but there is a lack of enforcement resulting in noncompliance. One way to get around the “undue burden” concern would be for states and municipalities to simplify their sales tax systems —in the extreme, to agree on a common state sales tax—but there is no evidence to suggest that states are considering such a move.
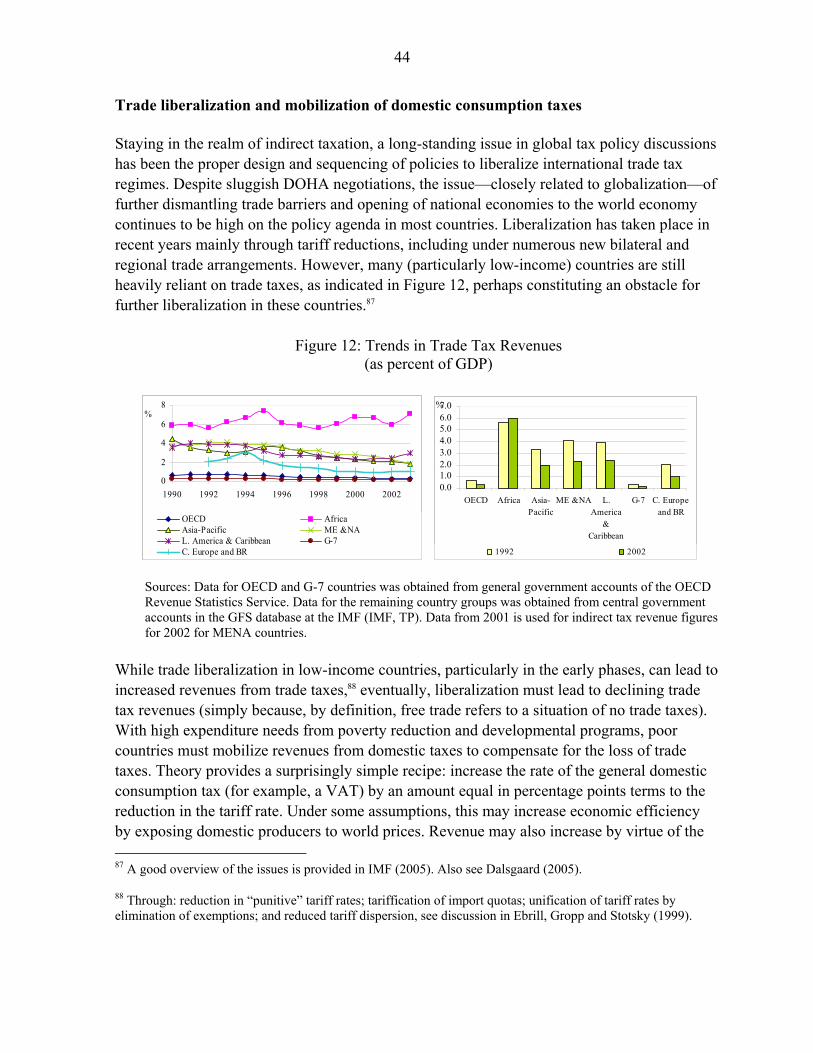
44
Trade liberalization and mobilization of domestic consumption taxes Staying in the realm of indirect taxation, a long-standing issue in global tax policy discussions has been the proper design and sequencing of policies to liberalize international trade tax regimes. Despite sluggish DOHA negotiations, the issue—closely related to globalization—of further dismantling trade barriers and opening of national economies to the world economy continues to be high on the policy agenda in most countries. Liberalization has taken place in recent years mainly through tariff reductions, including under numerous new bilateral and regional trade arrangements. However, many (particularly low-income) countries are still heavily reliant on trade taxes, as indicated in Figure 12, perhaps constituting an obstacle for further liberalization in these countries.87
Figure 12: Trends in Trade Tax Revenues (as percent of GDP)
0
2
4
6
8
1990 1992 1994 1996 1998 2000 2002
%
OECD AfricaAsia-Pacific ME &NAL. America & Caribbean G-7C. Europe and BR
0.01.02.03.04.05.06.07.0
OECD Africa Asia-Pacific
ME &NA L.America
&Caribbean
G-7 C. Europeand BR
%
1992 2002
Sources: Data for OECD and G-7 countries was obtained from general government accounts of the OECD Revenue Statistics Service. Data for the remaining country groups was obtained from central government accounts in the GFS database at the IMF (IMF, TP). Data from 2001 is used for indirect tax revenue figures for 2002 for MENA countries.
While trade liberalization in low-income countries, particularly in the early phases, can lead to increased revenues from trade taxes,88 eventually, liberalization must lead to declining trade tax revenues (simply because, by definition, free trade refers to a situation of no trade taxes). With high expenditure needs from poverty reduction and developmental programs, poor countries must mobilize revenues from domestic taxes to compensate for the loss of trade taxes. Theory provides a surprisingly simple recipe: increase the rate of the general domestic consumption tax (for example, a VAT) by an amount equal in percentage points terms to the reduction in the tariff rate. Under some assumptions, this may increase economic efficiency by exposing domestic producers to world prices. Revenue may also increase by virtue of the 87 A good overview of the issues is provided in IMF (2005). Also see Dalsgaard (2005).
88 Through: reduction in “punitive” tariff rates; tariffication of import quotas; unification of tariff rates by elimination of exemptions; and reduced tariff dispersion, see discussion in Ebrill, Gropp and Stotsky (1999).
45
fact that tax revenues are collected from all consumption of domestically-produced items as well as imports, rather than just imports.89 Three results from the empirical literature are indeed worth noting in this context. First, recent econometric work suggests that while most middle- and high-income countries have been able to recuperate most of the revenue losses from trade taxes, low-income countries have only been able to recover on the order of 30 percent of the losses through higher domestic taxes.90 This striking difference in performance between low- and middle-income countries is most likely caused by the often rudimentary administrations of low-income countries, while middle-income administrations are better equipped to strengthen nonborder tax collections. This implies lower administrative costs in middle-income countries associated with increasing domestic taxes. Furthermore, potential domestic tax bases, income taxes in particular, are more easily tapped in middle-income countries, where economies to a lesser extent are characterized by subsistence, small-holder farming (Dalsgaard, 2005). Second, the presence of a VAT does not in itself appear to enhance the ability to recover revenue (Baunsgaard and Keen, 2005). In contrast, what does seem to matter is the quality of the design and implementation of the VAT, particularly, whether the VAT has a single rate and few exemptions, which increases the likelihood of revenue recovery (Dalsgaard, 2005). And third, many of the countries that have successfully recovered the revenue loss from trade liberalization have relied also on higher direct taxes in doing so, and not only consumption taxes. Overall, experience clearly demonstrates that countries with a successful record in this area have: (1) carefully sequenced trade liberalization with domestic tax reform; (2) typically supported trade reform initiatives with improved customs and tax administration; and (3) been able to mobilize the necessary and continued political commitment to reform. Natural resource taxation, green tax reforms, and climate change91 This is a diverse group of issues encompassing also direct tax issues (on natural resource extraction) and fiscal or quasi-tax instruments (emissions trading), but are discussed here together with indirect tax issues because of their focus on particular “commodities” (e.g., oil, gas, minerals, emissions, and carbon). Taxation of natural resources Fiscal regimes and, in particular, the structure of taxation applicable to natural resource sector activity vary considerably across countries (see Baunsgaard, 2001). In general, the design of
89 See Keen and Ligthart (2005).
90 See Keen and Baunsgaard (2005).
91 This section builds on Baunsgaard (2001), Sarma and Naresh (2001), and HIS Energy (2006).
46
the fiscal regime is of critical importance for attracting and ensuring the optimal exploitation of natural resources by investors facing long time horizons with regard to exploration and production involving considerable uncertainty, expense, and risk. Macroeconomic and environmental considerations are also important—revenue streams from resource rent taxes can fluctuate excessively, and there may be a need to compensate for/mitigate potentially substantial and negative environmental externalities associated with resource extraction. General transparency in extractive industries is also attracting considerable policy attention.92 Typically, multiple fiscal instruments are available to governments. These can be broadly classified as those levies that fall under the government’s general powers of taxation (basic income tax, import and export duties, and VAT), those levied to claim the government’s legitimate share as resource owner (progressive profits tax, supplementary income tax at higher rates) and nontax instruments (royalties, production-sharing, and equity-sharing), and those aimed at achieving environmental objectives (Sarma and Naresh, 2001). Normal income taxes are usually the primary form of taxation, commonly supplemented by an additional profits tax. Several countries levy higher rates progressively on a project by project basis (Sarma and Naresh, 2001),93 while some (e.g., Brazil and Nigeria) levy taxes whose revenue is allocated to specific purposes, such as local development and housing (IHS, 2006). Resource rent taxes, which are similar to cash-flow taxes and imposed only if the accumulated cash-flow is positive, tend to be relatively common in Africa (Baunsgaard, 2001) and also in the petroleum sector (they tend to be avoided in mining industries). Accelerated depreciation for initial capital outlays (which can be substantial) are common as are tax incentives, such as tax holidays (Brazil), foreign reinvestment allowances (China), and reinvestment deductions (Ethiopia, Papua New Guinea, and Peru). Equipment imports tend to be exempt from import duties and sales taxes, although if a VAT applies, refunds are available on tax paid on inputs. Specific levies, such as royalties in the form of specific or ad valorem duties on the amount or value of the product in order to secure revenue streams upfront tend to be quite popular (Baunsgaard, 2001). Product-sharing contracts (PSCs) became common in the 1960s/70s with the break-up of oil cartels and nationalization. In their simplest form, PSCs consist of paying governments a fixed proportion of the extracted commodity, which the government can then sell.94 Recently, there have been some shifts away 92 See http://www.imf.org/external/pubs/ft/grrt/eng/060705.htm.
93 E.g., the United Kingdom, Canada, Australia, Indonesia, Papua New Guinea, South Africa, and Kazakhstan. Referred to as a progressive profits tax (PPT), it usually entails the application of a higher rate of tax on profits that lie above a certain stipulated level. The limit is prescribed in terms of capital such that when the profits-capital ratio rises above a certain threshold, the higher rate is applied to the additional profits. The PPT often taxes two projects with the same net present value differently if the timing of their cash flows differs.
94 Alternatively, governments and investors share production after the latter have recovered exploration, development, and operating costs including depreciation. Baunsgaard (2001) finds that typically 50–60percent of profit oil accrues to the state.
47
from PSCs toward a tax/royalty system,95 although several countries have moved back toward a PSC regime.96 A few countries have also introduced windfall taxes on the minerals sector which target “excess” profits in the industry97 although these tend to reflect underlying inadequacies in fiscal regimes that fail to address the volatile (and cyclical) nature of commodity prices. Green tax reforms, climate change, and carbon pricing Probably more public attention has been generated by the series of reforms during the period under review that introduced “green taxes,” most notably in OECD countries. Figure 13 below shows changes in the total revenues from environmentally-related taxes98 in percent of GDP in OECD countries between 1994–2003, with Turkey characterized by the highest revenue-to-GDP share (5.16 percent) and the United States by the lowest (0.88 percent). The classic policy prescription for uncompensated external (environmental) effects of production and consumption activity is the application of taxes set at “Pigouvian” levels that result in private decision-makers facing exactly the full social damage of their activities. A second purpose of these taxes is to raise revenue. In the late 1980s and early 1990s, a number of European countries embarked on green tax initiatives with a view to correcting negative environmental externalities and using environmental tax revenues for reducing other more distortionary taxes, particularly, labor taxes, such as social security contributions (‘revenue
95 E.g., Romania (1996), Bulgaria (1999), Bolivia (1996), and Kyrgyzstan (1998).
96 E.g., Ukraine(1999), Uzbekistan (2001), and Brunei (2001). The oil laws of Georgia, Cameroon, and Togo offer a PSC framework and, in Iran and Nigeria, there has been some discussion of returning to a PSC framework. See IHS (2006).
97 Legislation has been recently proposed in the U.S. for such a tax which is triggered when the price of oil rises above US$50 a barrel ( http://www.chron.com/disp/story.mpl/business/4754027.html ) while France threatened oil companies with such a tax in 2005. China and Algeria announced plans in 2006 to impose a windfall tax on oil profits. After much debate, the United Kingdom chose not to impose a windfall tax on oil company profits—instead, it raised corporate tax rates by 10 percentage points to 50 percent in 2005. South Africa proposed a windfall tax on synthetic fuels in 2006, but withdrew the proposal under heavy criticism, while Mongolia imposed a windfall tax in 2006 on copper and gold.
98 “Environmentally-related taxes” are defined—relatively broadly—by the OECD as any compulsory, unrequited payment to general government levied on tax bases deemed to be of particular environmental relevance (http://www2.oecd.org/ ecoinst/queries/index.htm). However, this is a very broad definition, but classifying environmental taxes is rather complex due to the different functions that they can perform and the different forms that they can take. Furthermore, figure 13 should be interpreted with care, since an increase in environmental tax revenue could actually be an indication of a shift toward resource intensive production and consumption, while a decrease could be interpreted as environmental taxes being generally effective, and hence causing a reduction in the base on which they are levied.
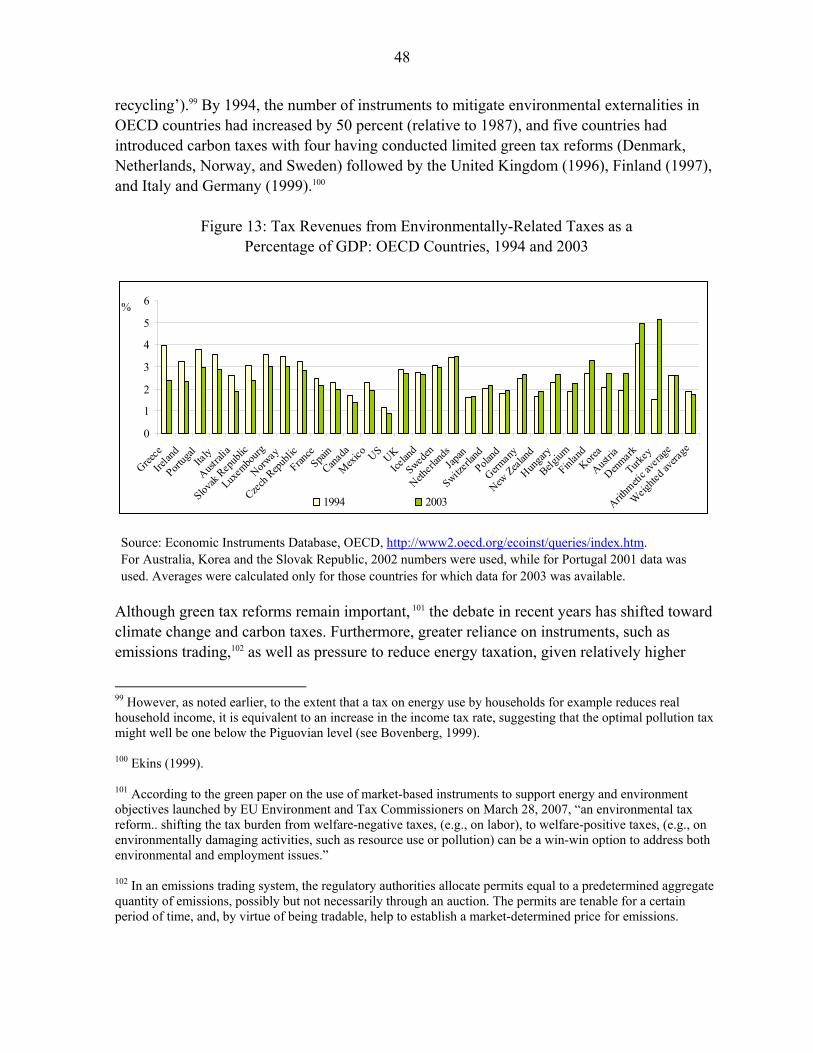
48
recycling’).99 By 1994, the number of instruments to mitigate environmental externalities in OECD countries had increased by 50 percent (relative to 1987), and five countries had introduced carbon taxes with four having conducted limited green tax reforms (Denmark, Netherlands, Norway, and Sweden) followed by the United Kingdom (1996), Finland (1997), and Italy and Germany (1999).100
Figure 13: Tax Revenues from Environmentally-Related Taxes as a Percentage of GDP: OECD Countries, 1994 and 2003
0
1
2
3
4
5
6
Greece
Irelan
d
Portug
al Ita
ly
Austral
ia
Slovak
Repub
lic
Luxem
bourg
Norway
Czech R
epubli
c
France
Spain
Canada
Mexico
US
UKIce
land
Sweden
Netherl
ands
Japan
Switzerl
and
Poland
German
y
New Zeal
and
Hungar
y
Belgium
Finlan
d
Korea
Austria
Denmark
Turkey
Arithmeti
c ave
rage
Weighte
d aver
age
%
1994 2003
Source: Economic Instruments Database, OECD, http://www2.oecd.org/ecoinst/queries/index.htm. For Australia, Korea and the Slovak Republic, 2002 numbers were used, while for Portugal 2001 data was used. Averages were calculated only for those countries for which data for 2003 was available.
Although green tax reforms remain important, 101 the debate in recent years has shifted toward climate change and carbon taxes. Furthermore, greater reliance on instruments, such as emissions trading,102 as well as pressure to reduce energy taxation, given relatively higher
99 However, as noted earlier, to the extent that a tax on energy use by households for example reduces real household income, it is equivalent to an increase in the income tax rate, suggesting that the optimal pollution tax might well be one below the Piguovian level (see Bovenberg, 1999). 100 Ekins (1999). 101 According to the green paper on the use of market-based instruments to support energy and environment objectives launched by EU Environment and Tax Commissioners on March 28, 2007, “an environmental tax reform.. shifting the tax burden from welfare-negative taxes, (e.g., on labor), to welfare-positive taxes, (e.g., on environmentally damaging activities, such as resource use or pollution) can be a win-win option to address both environmental and employment issues.” 102 In an emissions trading system, the regulatory authorities allocate permits equal to a predetermined aggregate quantity of emissions, possibly but not necessarily through an auction. The permits are tenable for a certain period of time, and, by virtue of being tradable, help to establish a market-determined price for emissions.
49
international oil prices seem to have reduced the appetite for additional environmental taxes in Europe. The EU Commission (2006) documents that on average the effective tax rates on energy have been steadily declining since 1999 in the EU.103 Generally, reducing greenhouse gas emissions which are closely tied to climate change requires substantial and internationally coordinated policy interventions. These could include price- (tax-) based or cap-and-trade schemes for major emitters of greenhouse gases (GHGs), and subsidies to promote development of renewable energies.104 Currently, the key policy framework which attempts to counteract climate change is the Kyoto Protocol. The agreement, which came into force in 2005, binds 35 industrial countries to reduce their emissions by, on average, 5 percent below their 1990 baseline over the 2008 to 2012 period. However, its effectiveness has been limited for several reasons. First, countries whose emissions are effectively limited by the Kyoto Protocol comprise only 20 percent of global emissions. Second, even though the EU (relative to the United States or Canada) has decided to move forward alone on the implementation of Kyoto (in the hope that others will follow) its main implementation mechanism, the EU Emissions Trading Scheme (EU-ETS), is a cap-and-trade-system with major weaknesses: it covers only about 45 percent of GHG emissions with important sectors, notably transport, agriculture, and households excluded; the free allocation of emission rights forgoes revenues that could otherwise have been used to implement tax reductions elsewhere; and although grandfathering in this manner can help compensate those that would otherwise lose out, research suggests that this could have been achieved by only grandfathering some 10–20 percent of emission rights. Furthermore, by generating expectations that the future quota allocations will also be free, it reduces incentives to abate now. The excessive number of emissions permits issued has also resulted in a very low current permit price. Furthermore, Kyoto’s other main mechanism, the Clean Development Mechanism (allowing emissions-reducing projects, carried out in low-income countries, to be credited to wealthier countries) cannot guarantee the additionality of emissions reductions as low-income countries face no overall restrictions. Finally, the Kyoto agreement expires in 2012, implying uncertainty about the rewards to emissions reducing efforts beyond this date. While the need to agree on common action among main (current and potential) emitters has been a serious obstacle to effective mitigation, some countries or regions have attempted to lead the way through unilateral action on climate change. In particular, the United Kingdom
103 For example, Sweden has introduced an energy tax relief program for energy-intensive firms if, for a 5-year period, they implement an energy management system (including fixed energy targets) as well as energy-saving measures. 104 A possible rationale for the provision of subsidies for developing renewable energy supplies is that nonrenewables are undertaxed and are likely to remain so for political reasons. However, note that this remains an inferior solution, since it is better to tax “dirty” energy rather than to subsidize clean ones.
50
introduced a draft law (climate change bill) in March 2007 which aims to put in place a framework to achieve a mandatory 60 percent cut in the United Kingdom's carbon emissions by 2050, and intermediate targets for 2020 of cuts ranging between 26 percent and 32 percent.105 If approved, the United Kingdom is likely to become the first country to set such a long-range and significant carbon reduction target into law. While the United States has not ratified the Kyoto Protocol, certain states, notably California and Connecticut, have also taken a lead. The California global warming vehicle law (2002) requires car makers to reduce emissions by 30 percent by 2016 for all new passenger cars and light trucks sold in the state,106 while the global warming solution act (2006) caps California’s greenhouse gas emissions at 1990 levels by 2020 and includes penalties for noncompliance by major industries. State utilities are also required to produce at least 20 percent of their electricity using renewable sources by 2010. A separate initiative in the United States is the Regional Greenhouse Gas Initiative (RGGI) under which 10 northeastern states of the United States have agreed to cut emissions from power plants by 10 percent between 2009 and 2018. The designers of the RGGI, which is a cap-and-trade system with emissions caps expected to be introduced in January 2009, also aim to address some of the flaws of the EU-ETS—almost all emissions permits are to be auctioned rather than handed out free of charge, and RGGI permits will also be valid for the lifetime of the scheme in contrast to EU-ETS emissions permits.107 On a multilateral level, UN-sponsored talks between signatories to Kyoto and the UN climate change convention were held in Bonn in mid-May, 2007. Expected to resume in Bali in December 2007, these are aimed at widening and extending the Kyoto Protocol. In conclusion, while these are all potentially important initiatives, it is important to note that the emission targets set are just that—policy targets—and that the formulation of the substantive policy measures that are required to fulfill the commitments made is still to come.
V. CONCLUDING REMARKS
This paper has demonstrated—on a global scale—the wide spectrum of recent tax reform initiatives, and by so doing has also identified key commonalities, such as the well-known spread of the VAT and a broad based trend toward reductions in direct tax rates, in duty rates, and—in some (but far from all) countries—a marked reduction in the tax wedge on labor. At
105 Enforcement as envisioned by the bill would involve the establishment of an independent “carbon committee” to work with ministers to deliver reductions “over time and across the economy,” creating new powers to ensure the 2050 target is achieved and improvements in the way CO2 reductions are monitored and reported, including to parliament
106 The legislation applies to 2009 and later models of passenger cars and trucks only.
107 “Embracing Reggie,” The Economist, November 17, 2007.
51
the same time, however, it is evident that countries have attempted to preserve their prerogative to at least some degree of fiscal autonomy, by devising individual approaches to domestic tax policies that address the forces of globalization and other concerns, reflecting differences in the political and economic environment across countries. This, in turn, has provided an interesting global “laboratory” of tax policy experimentation which, in some cases, has produced innovative and useful outcomes.
Looking into the crystal ball, there are a number of routes that future tax reform initiatives may follow:
• The experimentation with structural changes to the corporate tax will continue, probably combined with further rate lowering in some countries. Rate reductions will, though, be tempered by revenue needs, and the basic question is where the “equilibrium” level of the rate is. Similar considerations apply both to the PIT per se, and to the broader issue of the tax wedge on labor.
• The number of countries adopting flat tax reforms, in which the single income tax rate chosen is low, is likely to increase over the years. However, if considered in the context that pressures to reduce taxes on capital income are likely to increase, that the value of low flat rates as a signal is likely to diminish as more countries undertake flat tax reforms, and that currently buoyant economic conditions around the world will not last forever, significant fiscal strains may emerge, leading some countries to move away from flat tax systems.
• Greater experience with (and understanding of) the incentive effects of “make work policies,” such as earned income tax credits that aim to reduce the tax wedge for low-income (or skilled) workers makes it likely that such policies (which also have an important income redistribution element) will be an important part of any future strategy in OECD countries to increase employment.
• Tax systems in developing countries will increasingly come to resemble those based on DIT principles, particularly given the already close resemblance and also in light of the attractions of DIT systems in stimulating saving and capital in the face of growing capital mobility.
• The VAT will be further scrutinized to find ways to limit the “frictions” it causes for cross-border movements of goods and services, and—closely related—the very substantial revenue losses from fraudulent trade operations. The EU will probably continue to spearhead the search for operational solutions.
• Financial flows to a multiplicity of offshore financial centers, primarily to avoid home country tax liabilities, will continue to stress-test the international financial architecture, leading to ever-increasing scrutiny of the way that these centers operate.
52
• Policy attention will increasingly turn to ways to mitigate climate change including through the tax system, with deepened analytical efforts to clarify the relative merits of cap-and-trade systems and taxation, as the best way forward in properly pricing carbon emissions.
• Trade liberalization will continue to mushroom, with emerging and strengthened regional trade arrangements, which will put low-income countries in particular under increased budgetary pressures, and require them to further reform their domestic tax systems to strengthen revenue mobilization.
• All of the above have very important international ramifications, and will go hand-in-hand with increasing pressures to coordinate tax polices internationally—on a bilateral, regional, and global scale. This will involve voluntary or formalized limitations to national tax policy autonomy, in favor of supranational “entities” (again, voluntary or formalized), with much varying degrees of enforcement powers.
• However, to the extent that political coordination is likely to prove extremely difficult to achieve, such efforts may also be channeled toward less visible but politically palatable administrative cooperation, for instance, involving information exchange rather than any attempts at coordinating tax policy across jurisdictions.
Hence, as it looks, tax reform will for the foreseeable future remain as certain as death and taxation itself.
53
REFERENCES
Abery, Elaine, 2007, “The OECD and Harmful Tax Practices,” Special Report, Tax Notes International (May).
Ahmed, Ehtisham, and Giorgio Brosio, 2006, (eds.) The Handbook of Fiscal Federalism,
(Edward Elgar Publishing). Ainsworth, Richard T., 2007, “Tackling VAT Fraud, 13 Ways Forward,” Tax Notes
International (March). Arpaia, Alfonso, and Giuseppe Carone, 2004, “Do Labor Taxes (and Their Composition)
Affect Wages in the Short and in the Long Run?,” Public Economics 0411004, EconWPA.
Atkinson, A.B., and Joseph E. Stiglitz, 1976, “The Design of Tax Structure: Direct versus
Indirect Taxation, Journal of Public Economics, Vol. 6, pp. 55–75. Auerbach, Alan J., 2006, “Why Have Corporate Tax Revenues Declined? Another Look,”
CESifo Working Paper No. 1785. Bargain, Olivier, and Kristian Orsini, 2006, “In-work Policies in Europe: Killing Two Birds
with One Stone?” Labour Economics, Elsevier, Vol. 13(6), pp. 667–97. Baunsgaard, Thomas, 2001, “A Primer on Mineral Taxation,” IMF Working Paper 01/139
(Washington: International Monetary Fund). Besley, Tim, and Anne Case, 1995, “Incumbent Behavior: Vote Seeking, Tax Setting, and
Yardstick Competition,” American Economic Review, Vol. 85, pp. 25–45. Besley, Tim, Rachel Griffith, and Alexander Klemm, 2001, “Empirical Evidence on Fiscal
Interdependence in OECD Countries,” mimeo (London: Institute for Fiscal Studies). Blundell, Richard, and Costas Meghir, 2002, “Active Labour Market Policy vs. Employment
Tax Credits: Lessons from Recent U.K. Reforms,” IFAU Institute for Labour Market Policy Evaluation Working Paper 2002:1.
Bovenberg, Lars A., 1999, “Green Tax Reform and the Double Dividend: an Updated Readers
Guide,” International Tax and Public Finance, Vol. 6, pp. 421–43. Buettner, Thiess, and Martin Ruf, 2007, “Tax Incentives and the Location of FDI: Evidence
from a Panel of German Multinationals,” International Tax and Public Finance, Vol. 14(2), pp. 151–64 (Berlin; New York: Springer-Verlag).
54
Cnossen, Sijbren, 2000, “Taxing Capital Iincome in the Nordic Countries: A Model for the European Union?” In Sijbren Cnossen (ed.), Taxing Capital Income in the European Union (New York: OUP). pp. 180–213.
Dalsgaard, Thomas, 2005, “Developing Countries: Lessons from Trade Reform and Revenue
Loss,” Trade Policy Analyses, Vol. 7, No. 2, (Cordell Hull Institute). Devereux, Michael P., 2006, “Developments in the Taxation of Corporate Profit in the OECD
Since 1965: Rates, Bases and Revenues,” Working Paper, https://www.sbs.ox.ac.uk/faculty/Devereux+Michael/
———, 2007, “Taxes in the EU New Member States and the Location of Capital and Profit,”
Working Paper 07/03, Said Business School. ———, and Peter B. Sørensen, 2006, The Corporate Income Tax: International Trends and
Options for Fundamental Reform, European Economy, Economic Papers, No 264. ———, Rachel Griffith, and Alexander Klemm, 2004, “Why Has the UK Corporation Tax
Raised So Much Money?” Fiscal Studies, Vol. 25.4 pp. 366–87. ———, and Rachel Griffith, 2003, “Evaluating Tax Policy for Location Decisions,”
International Tax and Public Finance (Springer), Vol. 10(2), pp. 107–26. ———, and Georgia Maffini, 2007, “The Impact of Taxation on the Location of Capital,
Firms and Profits: A Survey of the Empirical Evidence,” Working Paper 07/02, Said Business School.
De Mooij, Ruuf A., and Sjef Everdeen, 2006, “What Difference Does it Make? Understanding
the Empirical Literature on Taxation and International Capital Flows,” Paper prepared for the workshop of DG ECFIN of the European Commission on Corporate Tax Competition and Coordination in Europe, (September), Brussels.
———, ———, and Gaëtan Nicodème, 2007, “Corporate Tax Policy and Incorporation in
the EU,” Working Papers CEB 07-016.RS, (Brussels: Université Libre de Bruxelles, Solvay Business School, Centre Emile Bernheim (CEB)).
Dharmapala, Dhammika, and James R. Hines, 2006, “Which Countries Become Tax
Havens?” Available via Internet: SSRN: http://ssrn.com/abstract=952721. Diamond, Peter, and Jim Mirrlees, 1971, “Optimal Taxation and Public Production: Tax
Rules,” Parts 1 and 2, American Economic Review 61 (March and June 1971), pp. 8–27 and 261–78.
Ebrill, Liam P., Michael Keen, J-P. Bodin, and Victoria Summers, 2001, The Modern VAT
(Washington: International Monetary Fund).
55
———, Reint Gropp, and Janet Stotsky, 1999, “Revenue Implications of Trade Liberalization,” IMF Occasional Papers 180 (Washington: International Monetary Fund).
Emran, M.S., and J.E. Stiglitz, 2005, “On Selective Indirect Tax Reform in Developing
Countries,” Journal of Public Economics, Vol. 89, pp.599–623. European Commission, 1996, “A Common System of VAT: A Programme for the Single
Market,” COM, 328 final. ———, 2006, “Structures of the Taxation Systems in the European Union,” Eurostat. ———, 2007, “Taxation Trends in the European Union,” Eurostat. Ekins, Paul, 1999, “Survey: European Environmental Taxes and Charges: Recent
Experiences, Issues and Trends,” Ecological Economics, 31, pp. 39–62. Escobar-Lemmon, Maria, 2001, “Fiscal Decentralization and Federalism in Latin America,”
Publius: Journal of Federalism, Vol. 31, No. 4 (Autumn), pp. 23–41. Eissa, Nada O., and Hilary Williamson Hoynes, 2005, “Behavioral Responses to Taxes:
Lessons from the EITC and Labor Supply,” NBER Working Paper No. W11729 (Cambridge, Massachusetts: National Bureau of Economic Research).
Fortin, Pierre, 2002, “The Irish Economic Boom: Facts, Causes and Lessons,” Industry
Canada Economic Analysis and Statistics Discussion Paper Series, No 12. Gerard, Marcel, 2007, “Reforming the Taxation of Multi-Jurisdictional Enterprises in
Europe,” CESifo Economic Studies, Vol. 53, Issue 2, pp. 329–41. Green Paper on “Market-Based Instruments for Environment and Energy Related Purposes,
2007,” EU Commission, available via the Internet: http://www.euractiv.com/en/environment/commission-launches-debate-green-tax-reform/article-162858
Goolsbee, Austan, 2000, “In aWorld Without Borders: The Impact of Taxes on Internet
Commerce,” Quarterly Journal of Economics, Vol. 115, pp. 561–76. Gradus, R.H.J.M., and J.M. Julsing, 2003, “Comparing Different European Income Tax:
Policies Making Work Pay,” Research Centre for Economic Policy (OCFEB) Working paper available via the Internet: https://ep.eur.nl/handle/1765/823.
Griffith, Rachel, and Alexander Klemm, 2004, “What Has Been the Tax Competition
Experience of the Past 20 Years?” Tax Notes International, Vol. 34 (13) pp. 1299–1314.
56
Gordon, Roger H., and James R. Hines, 2002, “International Taxation” in Handbook of Public Economics, ed. by Alan J. Auerbach and Martin Feldstein (Amsterdam: North Holland), Vol 4, pp. 1935–95.
Gwartney, James, Robert Lawson, and William Easterly, 2006, “Economic Freedom of the
World,” 2006 Annual Report (The Frasier Institute). Hajkova, Dana, Giuseppe Nicoletti, and Laura Vartia and Kwang-Yeol Yoo, 2006, “Taxation,
Business Environment and FDI Location in OECD Countries,” OECD Economics Department Working Papers 502 (Paris: Organization for Economic Cooperation and Development).
Hall, Robert E., and Rabushka, Alvin, 1983, “Low Tax, Simple Tax, Just Tax,” (New York:
McGraw Hill). ———, 1985, “The Flat Tax” (Stanford, CA: The Hoover Institution Press). Hines, James R., 1996, “Altered States: Taxes and the Location of Foreign Direct Investment
in America,” American Economic Review, Vol. 86, No. 5, pp. 1076–94. Honohan, Patrick and Brendan Walsh, 2002, “Catching Up with the Leaders: the Irish Hare,”
Brookings Papers on Economic Activity: 1, Brookings Institution, pp. 1–77. Huizinga, H. and G. Nicodème, 2003, “Foreign Ownership and Corporate Taxation: An
Empirical Investigation,” CEPR Discussion Paper No. 3952 (London: CEPR). Huizinga, H., and S.B. Nielsen, 1997, “Capital Income and Profits Taxation with Foreign
Ownership of Firms,” Journal of International Economicsi, Vol. 42, pp. 149–65. Ho, Daniel Hoi Ki, and Peter Tze Liu Lau, 2007, “Perspectives on Foreign Direct Investment
Location Decisions: What Do We Know and Where Do We Go From Here,” International Tax Journal.
HIS Energy, 2006, “Mozambique E and P International Investment Workshop.” Study
prepared for the Institute of National Petroleum. International Monetary Fund, 2005, “Dealing with the Revenue Consequences of Trade
Reform,” Background paper for review of Fund work on trade reform (Washington: International Monetary Fund).
Ivanova, Anna, Michael Keen, and Alexander Klemm, 2005, “The Russian Flat Tax Reform,”
Economic Policy, Vol. 20 (43), pp. 397–444.
57
Keen, Michael, and Alejandro Simone, 2004, “Tax Policy in Developing Countries: Some
Lessons from the 1990s, and Some Challenges Ahead,” in Helping Countries Develop: The Role of the Fiscal.Policy, ed. by Sanjeev Gupta, Ben Clements, and Gabriela Inchauste (Washington: International Monetary Fund).
———, and B. Lockwood, 2007, “The Value-Added Tax—Consequences and Causes,” IMF
Working Paper 07/183 (Washington: International Monetary Fund). ———, Yitae Kim, and Ricardo Varsano, 2007, “The ‘Flat Tax(es)’: Principles and
Evidence,” International Tax and Public Finance (forthcoming). Also published as IMF Working Paper 06/218 (Washington: International Monetary Fund).
———, and Stephen Smith, 1996, “The Future of the Value-Added Tax in the European
Union,” Economic Policy, 375–411 and 409–420. ———, and Jenny E. Ligthart, 2005, “Coordinating Tariff Reduction and Domestic Tax
Reform under Imperfect Competition,” Review of International Economics, Vol. 13(2), pp. 385–90.
———, and Robin Boadway, 2003, Theoretical Perspectives on the Taxation of Capital
Income and Financial Services." In Patrick Honohan, ed., Taxation of Financial Intermediation Theory and Practice for Emerging Economies . Washington, D.C.: World Bank; and New York : Oxford University Press.
———, and Thomas Baunsgaard, 2005, “Tax Revenue and (or?) Trade Liberalization,” IMF
Working Paper No. 05/112 (Washsington: International Monetary Fund). Leigh, Andrew, 2004, “Optimal Design of Earned Income Tax Credits: Evidence from a
British Natural Experiment,” available via the Internet: http://ssrn.com/abstract=547302.
McLure, Charles E., Jr., 2000, “Implementing Subnational VATs on Internal Trade: The
Compensating VAT (CVAT)” International Tax and Public Finance, Vol. 7, No. 6, pp. 723–40.
McKinsey, 2003, “New Horizons: Multinational Company Investment in Developing
Economies,” McKinsey Global Institute Publication. Musgrave, Richard A., Karl E. Case, and Herman Leonard, 1974, “The Distribution of
Fiscal Burdens and Benefits,” Public Finance Quarterly, Vol. 2, pp. 259–311. Nicodème, Gaëtan, 2006, “Corporate Tax Competition and Coordination in the EU: What Do
We Know? Where Do We stand?” Munich Personal RePEc Archive paper No. 107.
Nickell, Steve, 2004, “Employment and Taxes,” CEP Discussion Paper 634.
58
Nassar, Koiffie, 2007, “Corporate Income Tax Competition in the Caribbean,” mimeo. Norregaard, John, 1997, “Tax Assignment,” in Ter-Minassian (ed.), 1997. OECD, 2006, “Taxing Wages 2004/2005: 2006 Edition.” Published by the OECD. Owens, Jeffrey, 2006, “Fundamental Tax Reform: An International Perspective,” The
National Tax Journal, Vol. 59/1, pp.131–55. Pechman, Joseph A., and Benjamin A. Okner, 1974, “Who Bears the Tax Burden?”
(Washington: Brookings Institution). Pinto, Dale, 2003, “E-Commerce and Source Based Income Taxation,” (IBFD: USA) Poddar, Satya, and Eric Hutton, 2001, “Zero-Rating of Inter-State Sales Under a
Sub-National VAT: A New Approach,” mimeo (Toronto: Ernst and Young). Rasmussen, Bo Sandemann, 2004, "On the Possibility and Desirability of Taxing E-
Commerce," University of Aarhus Economics Working Paper No. 2004–8. Romalis, John, 2007, “Capital Taxes, Trade Costs, and the Irish Miracle,” Journal of the
European Economic Association (forthcoming). Sandmo, Angmar, 1976, “Optimal Taxation: An Introduction to the Literature,” Journal of
Public Economics, No. 6, pp. 37–54. Sarma, J.V.M., and G. Naresh, 2001, “Mineral Taxation Around the World,” Asia-Pacific Tax
Bulletin (January). Pearson, Mark and Stefano Scarpetta, 2000, “An Overview: What Do We Know About
Policies to Make Work Pay?” OECD Economic Studies No 31/11. Sørensen Peter, B., 1994, “From the Global Income Tax to the Dual Income Tax—Recent
Tax Reforms in the Nordic Countries,” International Tax and Public Finance, No. 1. ———, 1998, “Recent Innovations in Nordic Tax Policy: From the Global Income Tax to the
Dual Income Tax,” in Tax Policy in the Nordic Countries ed. by Peter B Sørensen (London, Macmillan Press), pp. 1–27.
———, 2006, “Can Capital Income Taxes Survive? And Should They?” CESifo Working
Paper Series No. 1793. ———, 2007, “The Theory of Optimal Taxation: What is the Policy Relevance?”
International Tax and Public Finance, Vol. 14, pp. 383-406. Ter-Minassian, Teresa, ed., 1997, Fiscal Federalism in Theory and Practice (Washington:
International Monetary Fund).
59
Tseng, W., and H. Zebreg, 2003, “FDI in China: Some Lessons for Other Countries,” in China: Competing in the Global Economy, ed. byTseng and Rodlauer.
United States, 2006, “Tax Haven Abuses: the Enablers, the Tools and Secrecy,” Hearing
before the Permanent Subcommittee on Investigations of the Committee on Homeland Security and Governmental Affairs, United States Senate, 109th Congress, second session (August) (Washington: U.S. G.P.O.)
Walsh, Brendan, 2000, “The Role of Tax Policy in Ireland’s Economic Renaissance,”
Canadian Tax Journal, Vol 48. No 3. Ward, Burke T., and Janice C. Sipior, 2004, “To Tax or Not to Tax E-commerce: A United
States Perspective,” Journal of Electronic Commerce Research, Vol. 5(3), pp. 172-80. Wescott, Clay G., 2005, “Fiscal Devolution in East Asia,” available via the Internet at SSRN:
http://ssrn.com/abstract=819765. World Bank, 2007, “Fiscal Policy and Economic Growth: Lessons for Transition Economies,”
draft. Yoo, Kwang-Yeol, 2003, “Corporate Taxation of Foreign Direct Investment Income 1991–
2001,” OECD Economics Department Working Paper 365. Zee, Howell, 2004, “World Trends in Tax Policy: An Economic Perspective,” Keynote
address delivered at the 4th World Tax Conference (Sydney, Australia), (February). Zodrow, George R., 2003, “Network Externalities and Indirect Tax Preferences for Electronic
Commerce,” International Tax and Public Finance, Vol. 10, pp. 79–97.