Embed Size (px)
Citation preview
TAX POLICIES FOR INCLUSIVE GROWTH IN A CHANGING WORLD │ 1
Tax policies for inclusive growth in a changing world
OECD report to G-20 Finance Ministers and Central Bank Governors, July 2018
Executive Summary
Globalisation and technological change, including digitalisation and advances in
automation, have generated substantial increases in quality of life for many households, and
have reduced poverty rates in many emerging economies. Global integration, new technology
and flexible work arrangements create benefits for society and offer significant opportunities to
improve well-being. Consumers face a wider range of consumption goods of higher quality at
cheaper prices. Flexible work arrangements can provide workers with opportunities to better
reconcile work and broader life priorities across the life-cycle. Equally, businesses face increased
opportunities to innovate and sell their goods and services to a global market.
While these changes have resulted in increased incomes and increased opportunities, these
benefits have not been shared equally. Despite recent improvements in economic performance,
many economies continue to experience low productivity growth and often stagnating wages, as
well as increased levels of inequality. Moreover, technological changes may shift labour demand
towards jobs that will require greater use of cognitive skills for which many workers are not
currently adequately trained. This may lead to increased gaps in wages, access to stable and
secure work and life opportunities between those with high, medium and low skills. New
technologies may also facilitate the rise of non-standard employment and the “gig economy”,
challenging traditional work arrangements and social protection systems. These factors may
further exacerbate inequality.
Policymakers face challenges in simultaneously addressing the problems of low productivity
growth and rising inequality. These challenges arise in a context of increasing fiscal pressures
as a result of ageing populations and climate change. The mobility of capital (and increasingly, of
labour) in a globalised and rapidly innovating world raise the efficiency costs of using taxes on
labour and capital to further domestic equity goals. Technological change and its implications for
the future of work challenge traditional social protection systems and require adjustment
mechanisms to help individuals navigate the transition.
It is sometimes argued that tax policy can support equity or efficiency but not both (Okun,
1975[1]). Trade-offs between equity and efficiency objectives often exist, whereby policies that
2 │ TAX POLICIES FOR INCLUSIVE GROWTH IN A CHANGING WORLD
reduce inequality may be harmful to growth, and growth-friendly policies can increase
inequalities. Similarly, reducing taxes may be beneficial to growth and sometimes to equity, but
may conflict with the core objective of the tax system, which is to raise public revenue.
However, this paper argues that in many countries, governments can achieve tax and transfer
policies for inclusive growth while also supporting the revenue-raising capacity of the tax
system and ensuring the sustainability of public spending. Achieving this will not be the
result of any single policy, but a careful balance of policy choices and trade-offs. Individual parts
of the tax and transfer system may be well-designed, but looking in isolation at, for example, one
type of tax can lead to poor tax policy choices and sub-optimal economic and social outcomes
(Slemrod and Gillitzer, 2014[1]). More broadly, tax and transfer policy should be considered as
part of a broader framework of structural reforms for inclusive growth.
That many such reforms are politically challenging does not make them less necessary. New
challenges require new responses. This paper highlights reforms to adapt tax systems to
globalisation and technological change, particularly with respect to the changing world of
work. Raising the quality of public spending is also essential as it gives taxpayers the highest
value for their tax money. While comprehensive reform can be difficult, and the ways in which
the future will impact the tax system and the economy are uncertain, there is still much that can
be done.
A “one-size-fits-all” tax system to facilitate inclusive growth does not exist. Countries differ
in the challenges they are facing and have different preferences in terms of the kinds of societies
they want. Differing countries also have tax systems that are designed differently. Countries
therefore face different reform priorities. Reforms that may be effective in stimulating inclusive
growth in one country may be less effective in another country.
This paper is organised around five key topics.
Section 2 focuses on the impact of the tax system on the market distribution of income, by
supporting employment, skills investments, and labour market formality.
Section 3 considers how shifting tax mixes towards growth-friendly taxes can be combined
with measures to improve progressivity, particularly through base-broadening and through
removing inefficient and regressive tax expenditures.
Section 4 deals with ways in which personal income taxes and social transfers can foster
inclusive growth by raising the efficiency and equity of labour and capital income tax
systems.
Section 5 examines how tax policy can foster business dynamism and productivity,
including through support for investment and innovation, and can raise efficiency by
continuing to combat BEPS.
Section 6 considers how tax capacity can be raised, and how tax administration can be
strengthened, including through international cooperation.
TAX POLICIES FOR INCLUSIVE GROWTH IN A CHANGING WORLD │ 3
1. Taxation, inequality and growth: The current state of play
1.1. The current challenges in fostering inclusive growth
1. The global economy is undergoing a period of significant change that is affecting both
the rate of economic growth as well as the distribution of the growth dividend. Within-country
inequality has increased in many OECD and G20 countries since the mid-1990s (OECD, 2015[2]).
In the aftermath of the financial crisis, some countries have seen continued increases in income
inequality.
2. While inequalities of income and wealth within countries have increased,
inequalities between countries in the OECD and G20 has fallen, as have poverty rates across
the world, though large numbers of people continue to live in poverty. Catch-up growth of many
middle income countries has led to converging living standards (OECD and World Bank Group,
2017[3]).
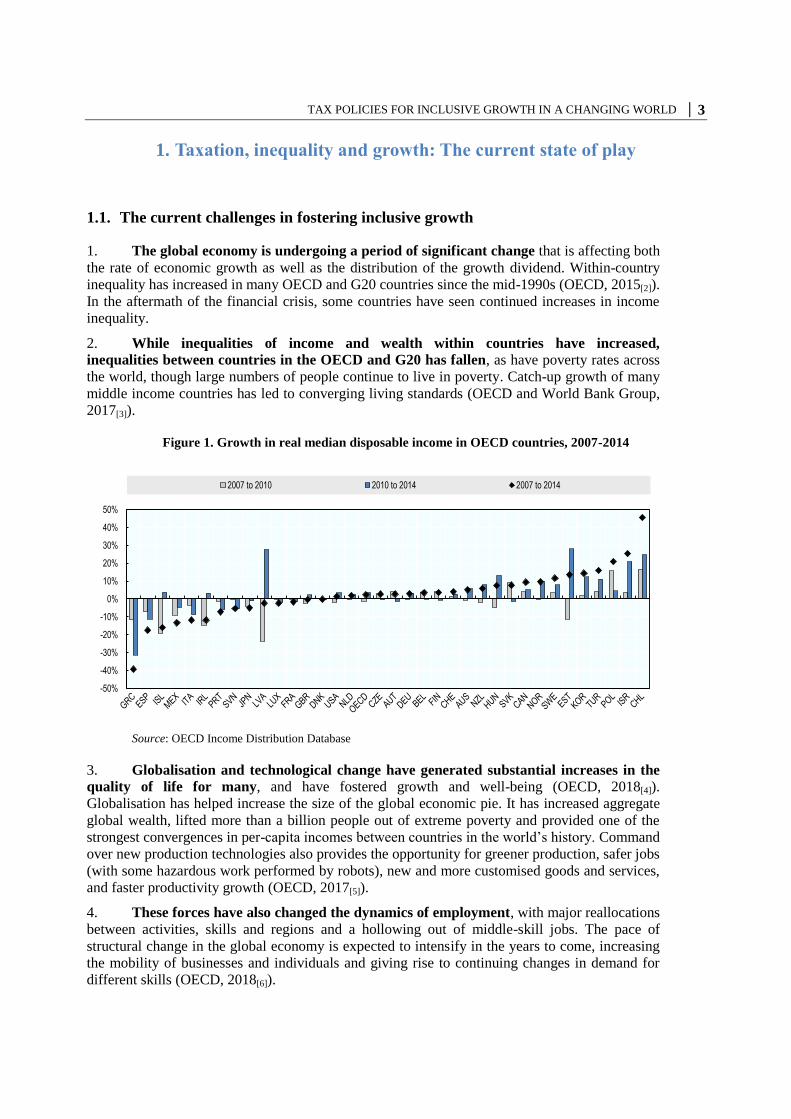
Figure 1. Growth in real median disposable income in OECD countries, 2007-2014
Source: OECD Income Distribution Database
3. Globalisation and technological change have generated substantial increases in the
quality of life for many, and have fostered growth and well-being (OECD, 2018[4]).
Globalisation has helped increase the size of the global economic pie. It has increased aggregate
global wealth, lifted more than a billion people out of extreme poverty and provided one of the
strongest convergences in per-capita incomes between countries in the world’s history. Command
over new production technologies also provides the opportunity for greener production, safer jobs
(with some hazardous work performed by robots), new and more customised goods and services,
and faster productivity growth (OECD, 2017[5]).
4. These forces have also changed the dynamics of employment, with major reallocations
between activities, skills and regions and a hollowing out of middle-skill jobs. The pace of
structural change in the global economy is expected to intensify in the years to come, increasing
the mobility of businesses and individuals and giving rise to continuing changes in demand for
different skills (OECD, 2018[6]).
-50%
-40%
-30%
-20%
-10%
0%
10%
20%
30%
40%
50%
2007 to 2010 2010 to 2014 2007 to 2014
4 │ TAX POLICIES FOR INCLUSIVE GROWTH IN A CHANGING WORLD
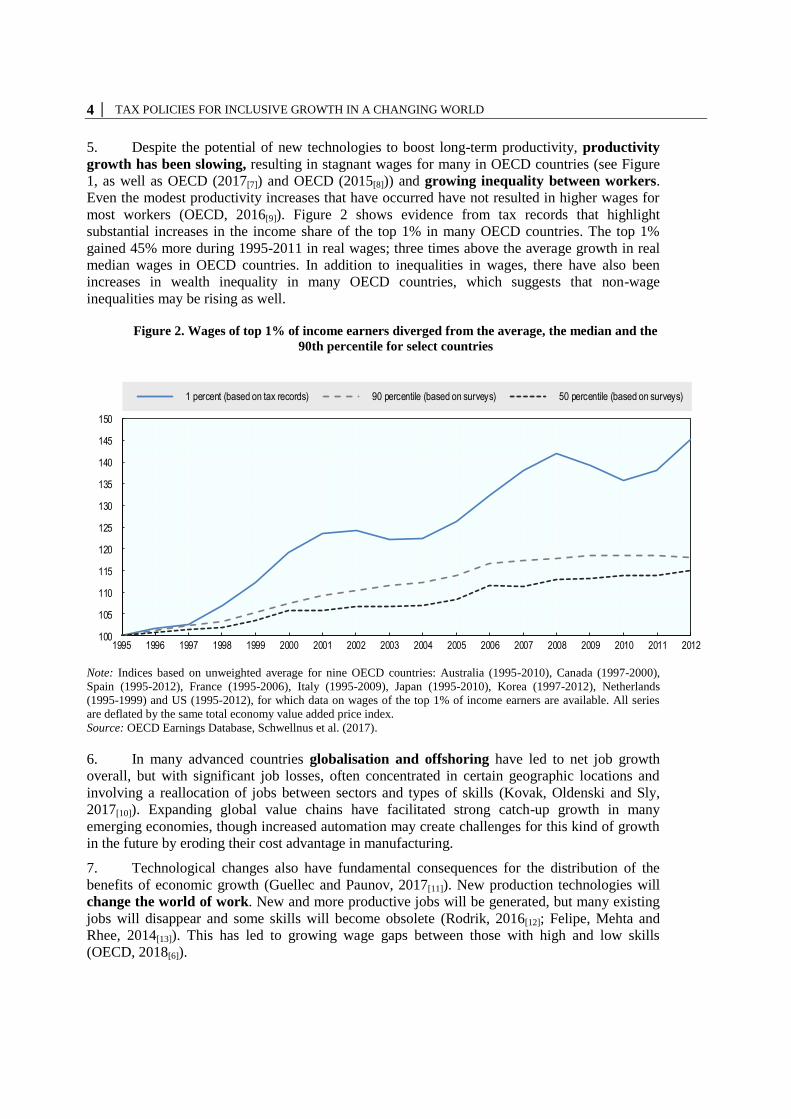
5. Despite the potential of new technologies to boost long-term productivity, productivity
growth has been slowing, resulting in stagnant wages for many in OECD countries (see Figure
1, as well as OECD (2017[7]) and OECD (2015[8])) and growing inequality between workers.
Even the modest productivity increases that have occurred have not resulted in higher wages for
most workers (OECD, 2016[9]). Figure 2 shows evidence from tax records that highlight
substantial increases in the income share of the top 1% in many OECD countries. The top 1%
gained 45% more during 1995-2011 in real wages; three times above the average growth in real
median wages in OECD countries. In addition to inequalities in wages, there have also been
increases in wealth inequality in many OECD countries, which suggests that non-wage
inequalities may be rising as well.
Figure 2. Wages of top 1% of income earners diverged from the average, the median and the
90th percentile for select countries
Note: Indices based on unweighted average for nine OECD countries: Australia (1995-2010), Canada (1997-2000),
Spain (1995-2012), France (1995-2006), Italy (1995-2009), Japan (1995-2010), Korea (1997-2012), Netherlands
(1995-1999) and US (1995-2012), for which data on wages of the top 1% of income earners are available. All series
are deflated by the same total economy value added price index.
Source: OECD Earnings Database, Schwellnus et al. (2017).
6. In many advanced countries globalisation and offshoring have led to net job growth
overall, but with significant job losses, often concentrated in certain geographic locations and
involving a reallocation of jobs between sectors and types of skills (Kovak, Oldenski and Sly,
2017[10]). Expanding global value chains have facilitated strong catch-up growth in many
emerging economies, though increased automation may create challenges for this kind of growth
in the future by eroding their cost advantage in manufacturing.
7. Technological changes also have fundamental consequences for the distribution of the
benefits of economic growth (Guellec and Paunov, 2017[11]). New production technologies will
change the world of work. New and more productive jobs will be generated, but many existing
jobs will disappear and some skills will become obsolete (Rodrik, 2016[12]; Felipe, Mehta and
Rhee, 2014[13]). This has led to growing wage gaps between those with high and low skills
(OECD, 2018[6]).
100
105
110
115
120
125
130
135
140
145
150
1995 1996 1997 1998 1999 2000 2001 2002 2003 2004 2005 2006 2007 2008 2009 2010 2011 2012
1 percent (based on tax records) 90 percentile (based on surveys) 50 percentile (based on surveys)
TAX POLICIES FOR INCLUSIVE GROWTH IN A CHANGING WORLD │ 5
8. These trends are transforming the global economy fundamentally, and in doing so are
altering the recipients of the benefits of economic growth, creating new social pressures and
social risks. Increasing discontent, disenchantment and anxiety about the future are generating
new social and political cleavages, including across genders, generations, and regions, between
those with in-demand-skills and those without, and between those with high levels of labour
market security and those without. There is no objectively “correct” level of inequality, and the
optimal level of inequality is subjective and contested and will differ between countries. In
addition, there are trade-offs between addressing these differing and interacting inequalities as
well as other competing policy objectives, which will inevitably require some degree of
prioritisation of objectives (Persson and Tabellini, 1994[14]). Nonetheless, governments can play
an important role in facilitating change and social inclusion. Managing these trade-offs generates
complex challenges for policymakers and the answers to these complex and interrelated
challenges may vary from one country to the next.
9. Increases in inequality not only undermine perceptions of well-being, but can also have
potentially negative consequences for growth, especially where inequality is already high.
High levels of income inequality can reduce growth through diminished productivity and those
with low levels of income and wealth might face insufficient opportunities for skills investments.
Where levels of inequality become too high, public perception that the returns to growth are not
fairly shared may create increased disquiet among citizens as to the merits of globalisation,
generating political tensions in some countries.
10. Increased levels of job obsolescence and social risk also undermine well-being and may
create increased pressure on public finances. In advanced economies, where economic shocks
hit particular regions or sectors, public finances may be placed under strain by demands for
expanded social protection in response to the new or changing social risks. In emerging
economies, a large part of the poor remain outside social safety nets despite the sizable scale-up
of social protection systems in many countries in recent decades. In these countries, increasing
automation may heighten the need to scale up social safety nets by increasing their scope and the
amount of benefits the poor receive; however, the major challenge is to do so in a fiscally
sustainable manner.
11. These pressures on public finances are exacerbated by demographic change in
advanced economies, in particular population ageing and migration. In some emerging
economies, population ageing is a key concern, but ensuring that citizens, especially young
people, have access to skill development and jobs is a competing public finance pressure.
1.2. Tax policy in a changing environment
12. Structural changes in the economy present challenges for tax policy from efficiency,
equity and revenue perspectives. These global trends raise new challenges for policymakers
and also affect the tools they have to deal with them. Trade-offs between policy options become
more challenging in some instances (see Table 1). Many aspects of tax systems have been
designed for the economy of the past and may not always be fit for purpose to support inclusive
growth today or in the future. Each country faces differing sets of tax policy and other
challenges; reforms that are appropriate for one country may be less relevant in other countries.
Reform packages need to be tailored, and sequenced carefully to ensure success (Brys, 2011[15]).
6 │ TAX POLICIES FOR INCLUSIVE GROWTH IN A CHANGING WORLD
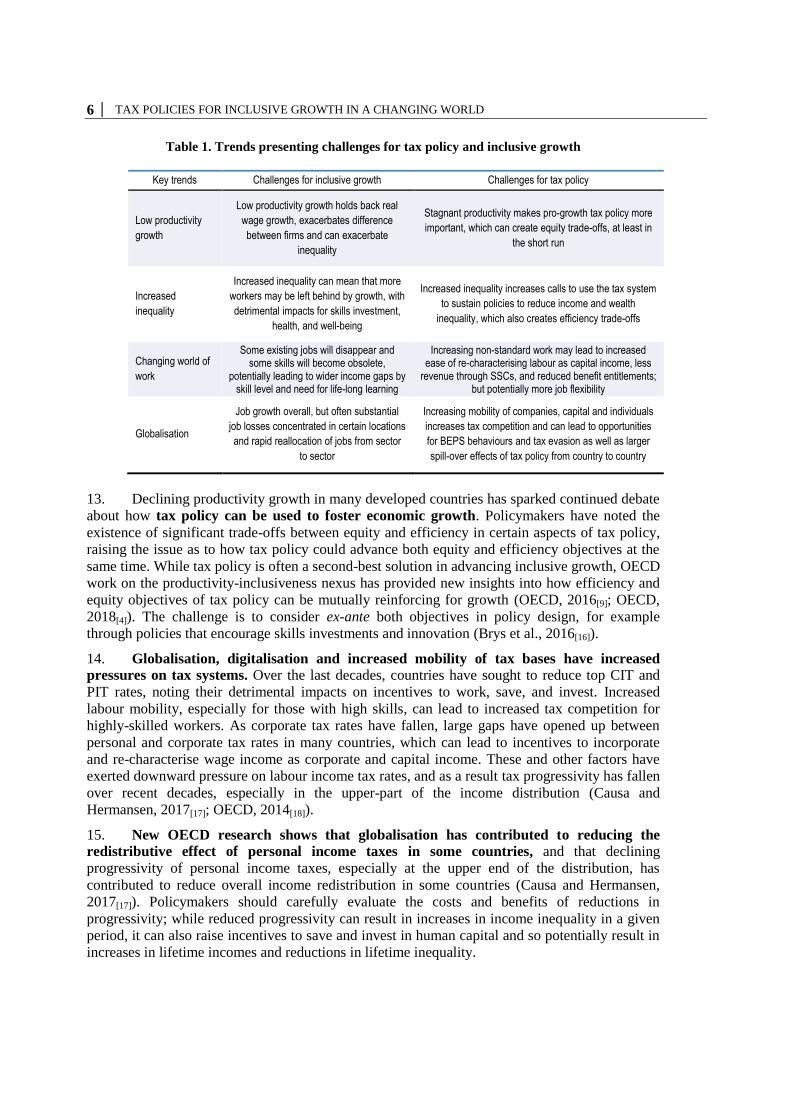
Table 1. Trends presenting challenges for tax policy and inclusive growth
Key trends Challenges for inclusive growth Challenges for tax policy
Low productivity
growth
Low productivity growth holds back real
wage growth, exacerbates difference
between firms and can exacerbate
inequality
Stagnant productivity makes pro-growth tax policy more
important, which can create equity trade-offs, at least in
the short run
Increased
inequality
Increased inequality can mean that more
workers may be left behind by growth, with
detrimental impacts for skills investment,
health, and well-being
Increased inequality increases calls to use the tax system
to sustain policies to reduce income and wealth
inequality, which also creates efficiency trade-offs
Changing world of
work
Some existing jobs will disappear and some skills will become obsolete,
potentially leading to wider income gaps by skill level and need for life-long learning
Increasing non-standard work may lead to increased ease of re-characterising labour as capital income, less
revenue through SSCs, and reduced benefit entitlements; but potentially more job flexibility
Globalisation
Job growth overall, but often substantial
job losses concentrated in certain locations
and rapid reallocation of jobs from sector
to sector
Increasing mobility of companies, capital and individuals
increases tax competition and can lead to opportunities
for BEPS behaviours and tax evasion as well as larger
spill-over effects of tax policy from country to country
13. Declining productivity growth in many developed countries has sparked continued debate
about how tax policy can be used to foster economic growth. Policymakers have noted the
existence of significant trade-offs between equity and efficiency in certain aspects of tax policy,
raising the issue as to how tax policy could advance both equity and efficiency objectives at the
same time. While tax policy is often a second-best solution in advancing inclusive growth, OECD
work on the productivity-inclusiveness nexus has provided new insights into how efficiency and
equity objectives of tax policy can be mutually reinforcing for growth (OECD, 2016[9]; OECD,
2018[4]). The challenge is to consider ex-ante both objectives in policy design, for example
through policies that encourage skills investments and innovation (Brys et al., 2016[16]).
14. Globalisation, digitalisation and increased mobility of tax bases have increased
pressures on tax systems. Over the last decades, countries have sought to reduce top CIT and
PIT rates, noting their detrimental impacts on incentives to work, save, and invest. Increased
labour mobility, especially for those with high skills, can lead to increased tax competition for
highly-skilled workers. As corporate tax rates have fallen, large gaps have opened up between
personal and corporate tax rates in many countries, which can lead to incentives to incorporate
and re-characterise wage income as corporate and capital income. These and other factors have
exerted downward pressure on labour income tax rates, and as a result tax progressivity has fallen
over recent decades, especially in the upper-part of the income distribution (Causa and
Hermansen, 2017[17]; OECD, 2014[18]).
15. New OECD research shows that globalisation has contributed to reducing the
redistributive effect of personal income taxes in some countries, and that declining
progressivity of personal income taxes, especially at the upper end of the distribution, has
contributed to reduce overall income redistribution in some countries (Causa and Hermansen,
2017[17]). Policymakers should carefully evaluate the costs and benefits of reductions in
progressivity; while reduced progressivity can result in increases in income inequality in a given
period, it can also raise incentives to save and invest in human capital and so potentially result in
increases in lifetime incomes and reductions in lifetime inequality.
TAX POLICIES FOR INCLUSIVE GROWTH IN A CHANGING WORLD │ 7
16. Changes to the structure of labour markets, including an increasing number of non-
standard ‘gig’ jobs, raise complexities for tax collection, and the equity and efficiency of the
tax system. The increased prevalence of non-standard work may lead to challenges in some
countries where this non-standard work is subject to different rates under tax and SSC systems.
Increases in non-standard work may lead to increased re-characterisation of labour income as
business income. A greater number of self-employed workers may generate problems for tax
remittance revenue-raising across various tax bases, especially where third-party reporting levels
may decrease. A further challenge for tax policy is to ensure low compliance burdens for new
non-standard workers to minimise the likelihood of them drifting into the informal economy.
Emerging economies will face continued challenges due to informality, increasing the negative
efficiency consequences of implementing progressive tax systems. Finally, changes in labour
markets also present challenges in adjusting social transfers to address increasing numbers of
workers in non-standard work arrangements.
17. However, changes in the global economy present opportunities as well as risks for tax
policymakers. New technologies present new prospects for tax administrations to combat
evasion and BEPS behaviours in more sophisticated ways, including in terms of taxing informal
and ‘gig’ income more effectively. Increased data storage capacity and digitalization of
transactions further increase the potential for efficiency, efficacy, and ease of tax computation
and collection. Expanded cross-border information will also be increasingly available to tax
authorities, whether on bank information, transfer pricing, tax rulings, or through country-by-
country reporting. Improvements in information technology also present opportunities to make
social transfers more effective, especially in emerging economies (World Bank Group, 2016[19]).
These initiatives all present new opportunities for countries to raise revenue in a fair and efficient
manner.
1.3. Taxes and public spending
18. Changes in the structure of the economy also create new pressures on spending. The
expansion of non-standard work raises challenges in designing social protection systems that can
meet the needs of these workers. In addition, social protection spending is often already placed
under pressure from population ageing. If jobs move overseas or workers’ skills are rendered
obsolete, there may be increased pressure for higher spending to reduce inequality, to invest in
education and training, to upgrade obsolete skills, and to address new and emerging forms of
insecurity. In many emerging economies, more spending may be required to invest in the
infrastructure, education and research and development (R&D) in order to move to more capital
intensive or skills based production.
19. Inequality in market incomes can have many costs, including the costs of providing
income support or poverty relief to those with low market incomes, as well as the costs of
alleviating the negative impacts on health and well-being that result from poverty. This means
that there is a strong case for employing public policies to reduce poverty, and reducing market
income inequality may help. . In this context, increasing the quality of public spending is
essential in delivering inclusive growth (see Box 1). This includes focusing on public
investment that can raise productivity and wages, including spending on raising educational
attainment levels and improving infrastructure. Spending in the form of public subsidies for
certain goods can add to economic distortions while at the same time being an inferior way to
reduce income inequality. High quality public spending can also have positive effects on tax
revenue, in part by increasing trust in governance institutions, and as a result, on tax morale
(Akgun, Cournède and Fournier, 2017[20]).
8 │ TAX POLICIES FOR INCLUSIVE GROWTH IN A CHANGING WORLD
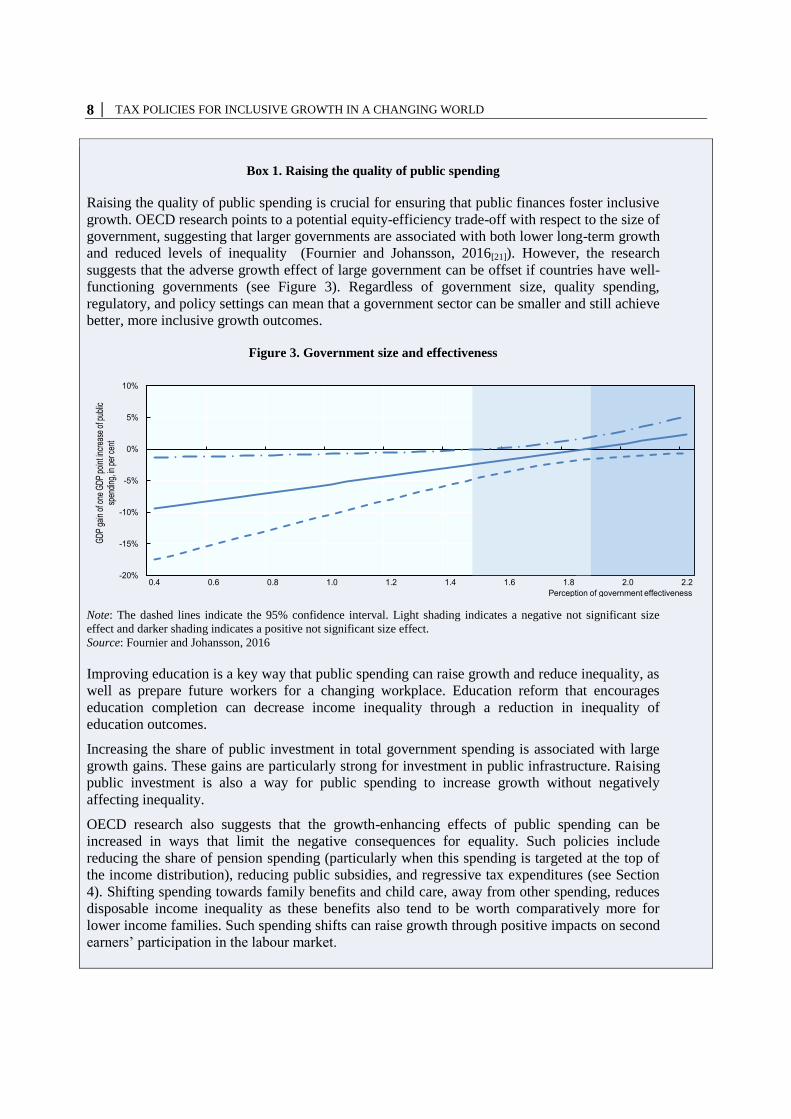
Box 1. Raising the quality of public spending
Raising the quality of public spending is crucial for ensuring that public finances foster inclusive
growth. OECD research points to a potential equity-efficiency trade-off with respect to the size of
government, suggesting that larger governments are associated with both lower long-term growth
and reduced levels of inequality (Fournier and Johansson, 2016[21]). However, the research
suggests that the adverse growth effect of large government can be offset if countries have well-
functioning governments (see Figure 3). Regardless of government size, quality spending,
regulatory, and policy settings can mean that a government sector can be smaller and still achieve
better, more inclusive growth outcomes.
Figure 3. Government size and effectiveness
Note: The dashed lines indicate the 95% confidence interval. Light shading indicates a negative not significant size
effect and darker shading indicates a positive not significant size effect.
Source: Fournier and Johansson, 2016
Improving education is a key way that public spending can raise growth and reduce inequality, as
well as prepare future workers for a changing workplace. Education reform that encourages
education completion can decrease income inequality through a reduction in inequality of
education outcomes.
Increasing the share of public investment in total government spending is associated with large
growth gains. These gains are particularly strong for investment in public infrastructure. Raising
public investment is also a way for public spending to increase growth without negatively
affecting inequality.
OECD research also suggests that the growth-enhancing effects of public spending can be
increased in ways that limit the negative consequences for equality. Such policies include
reducing the share of pension spending (particularly when this spending is targeted at the top of
the income distribution), reducing public subsidies, and regressive tax expenditures (see Section
4). Shifting spending towards family benefits and child care, away from other spending, reduces
disposable income inequality as these benefits also tend to be worth comparatively more for
lower income families. Such spending shifts can raise growth through positive impacts on second
earners’ participation in the labour market.
-20%
-15%
-10%
-5%
0%
5%
10%
0.4 0.6 0.8 1.0 1.2 1.4 1.6 1.8 2.0 2.2
GD
P ga
in o
f one
GD
P po
int i
ncre
ase
of p
ublic
sp
endi
ng, i
n pe
r cen
t
Perception of government effectiveness
TAX POLICIES FOR INCLUSIVE GROWTH IN A CHANGING WORLD │ 9
20. Rapid and continuing changes in the world of work create new pressures on social
protection spending. Shorter job tenure and rising shares of self-employment can put increasing
numbers of workers outside the scope of traditional social insurance programmes that are
available to those in some other forms of employment. These same factors may reduce SSCs, and
in doing so potentially reduce the sustainability of SSC-financed social protection systems, or
require increased financing of SSCs from other revenue sources.
21. These various spending pressures highlight the importance of securing the revenue-
raising capacity of the tax system. Many middle income countries currently raise insufficient
levels of revenue to meet their emerging expenditure needs. These include spending that can
unlock higher levels of growth. Further increasing participation in and completion of education
for children from poorer households would help to improve social mobility, as can investments in
school building. Infrastructure provision – both in quality and quantity – is also very poor in
many emerging economies, pointing to the need for increased public investment (OECD,
2017[7]). Infrastructure spending in emerging economies can also improve inclusiveness and well-
being, including by providing access to public transport, reliable energy, clean water and
sanitation. While the size of government may vary from country to country, raising revenue
efficiently, effectively, and equitably in order to address these challenges remains a key policy
goal.
22. Securing sustainable tax revenue is required to finance inequality-reducing social
transfers. OECD research shows that, within a given time period, inequality at the bottom of the
income distribution is generally reduced more by transfers than by taxes. The decline in income
redistribution since the mid-1990s in advanced countries has been principally driven by a decline
in transfer redistribution while taxes have played a less important and more heterogeneous role in
this decline. In some countries, the decline in redistribution has contributed to increases in
disposable income inequality (Causa and Hermansen, 2017[17]).
1.4. Future-proofing the tax system
23. New challenges require new responses. This paper highlights reforms to adapt tax
systems to globalisation and technological change, particularly with respect to the changing
world of work. Different countries have different tax systems reflecting differing stages of
development, social preferences, and other policy priorities. There is no single ‘best approach’ to
fostering inclusive growth through the tax system, and so different countries will respond to
global trends in different ways. While comprehensive reform is challenging, and the ways in
which the future will impact the tax system and the economy are uncertain, there is still much
that can be done.
24. The remainder of this paper is organised around five key topics.
Section 2 focuses on the impact of the tax system on the market distribution of income, by
raising employment, wages, and formality.
Section 3 considers how shifting tax mixes towards growth-friendly taxes can be
combined with measures to improve progressivity, particularly through base-broadening
and through removing inefficient and regressive tax expenditures. Through an increased
reliance on taxes with less mobile tax bases, including property and environmental taxes,
progressivity and growth can be advanced, through targeted use of the accruing revenues
and other reforms outside of the income tax system.
10 │ TAX POLICIES FOR INCLUSIVE GROWTH IN A CHANGING WORLD
Section 4 deals with ways in which personal income taxes and social transfers can foster
inclusive growth by raising the efficiency and equity of labour and capital income tax
systems.
Section 5 examines how tax policy can foster business dynamism and productivity,
including through support for investment and innovation, and can raise efficiency by
continuing to combat BEPS.
Section 6 considers how tax capacity can be raised, and how tax administration can be
strengthened, including through international cooperation.
25. This report does not proceed on a tax by tax basis. Tax design that can adapt to
continued economic change requires a systematic approach (Brys et al., 2016[16]).1 Individual
parts of the tax system may be well-designed, but looking in isolation at one tax provision or
even one type of tax can lead to poor tax policy choices and sub-optimal economic and social
outcomes.
26. Tax policy should be considered inside a broader framework of structural reforms for
inclusive growth. Taxation is often a second-best policy instrument in achieving inclusive
growth policy design. In many cases, inclusive growth challenges are best tackled at source. For
example, inefficiencies stemming from market power can be addressed through competition
policy as opposed to tax policy. Investing in education and skills can be addressed through public
spending instead of tax incentives. Where tax policies are used, they should be deployed as part
of broader set of structural reforms to deliver inclusive growth.
1 Country examples of a systems approach to tax analysis include Birch Sørensen (2010[78]), and
Mirrlees et al. (2011[79]).
TAX POLICIES FOR INCLUSIVE GROWTH IN A CHANGING WORLD │ 11
2. Raising employment, wages, and formality
27. A key channel though which inclusive growth can be enhanced in the face of
digitalisation and globalisation is by increasing the number of high-quality jobs and boosting
workforce participation in the formal sector. Raising market incomes for all as the nature of jobs
and skill demand evolve also requires workers to constantly upgrade and improve their skills over
their lifetime. Changes in labour markets may see increased numbers of workers engaging in
non-standard work arrangements. These arrangements can provide benefits to workers: many
such arrangements offer increased flexibility, and can provide opportunities to engage in
productivity-enhancing work. However, non-standard work arrangements can also raise risks if
non-standard workers are more likely to engage in informal work, are less likely to invest in their
skills, face greater labour market insecurity or become more vulnerable to exploitation.
Policymakers need to ensure that the tax system is neutral across different kinds of labour
contracts (i.e. between traditional employment relationships and non-standard work types). Tax
policy also has a role to play in helping policymakers manage changes to labour markets. This
can involve removing barriers to participation in the formal labour market and incentivising
investments in human capital.
2.1. Reducing barriers to employment
28. A key priority for many countries should be to facilitate active participation in the labour
market by making work pay including for those with low skills. There is increasing evidence
of the positive benefits of in-work transfers on labour market participation, and on broader
measures of well-being, including health (Hoynes, Miller and Simon, 2012[22]). Financial
disincentives can be the result of low wage-earning potential, a high tax burden on low-wage
earners, or out-of-work benefits whose design does not reward job-search or employment. Many
countries have reduced their average tax rates on low income labour over recent years, but they
remain high in some countries. Policymakers can strengthen (and in many countries already have
strengthened) work incentives through an expansion of in-work benefits such as earned-income
tax credits (EITCs) or related types of in-work benefits. Substantial in-work benefits can,
however, create other policy challenges, including weak incentives, or even disincentives, to
increase work hours.
29. In-work benefits have been found to have a particularly strong impact in countries where
earnings inequality is high, and can have broader positive impacts on health and well-being of
those groups benefiting from them (Markowitz et al., 2017[23]; Immervoll and Pearson, 2009[24];
Immervoll et al., 2007[25]). However, they can be challenging to implement and can entail
deadweight losses where targeting reduces horizontal equity or raises administrative costs. This
can be particularly problematic for emerging economies where administrative capacity may be
lower. These costs can potentially be reduced for both in-work benefits and other conditional
cash transfers through use of big data by tax administrations (World Bank Group, 2016[19]).
30. Workers in a number of OECD countries would benefit from reductions in payroll taxes
and SSCs, which could be financed by shifting the burden of social protection financing away
from SSCs to other tax bases. In addition to raising employment, reductions in effective tax
rates at low incomes can also provide benefits to those firms who employ large numbers of low-
skilled workers, benefiting these workers in turn (Saez, Schoefer and Seim, 2017[26]). SSC
reductions should be considered as part of broader social insurance reform, and work best when
12 │ TAX POLICIES FOR INCLUSIVE GROWTH IN A CHANGING WORLD
combined with broader structural policies to encourage labour market activation, including
policies to incentivise skill investments by the low-skilled (see Section 2.3).
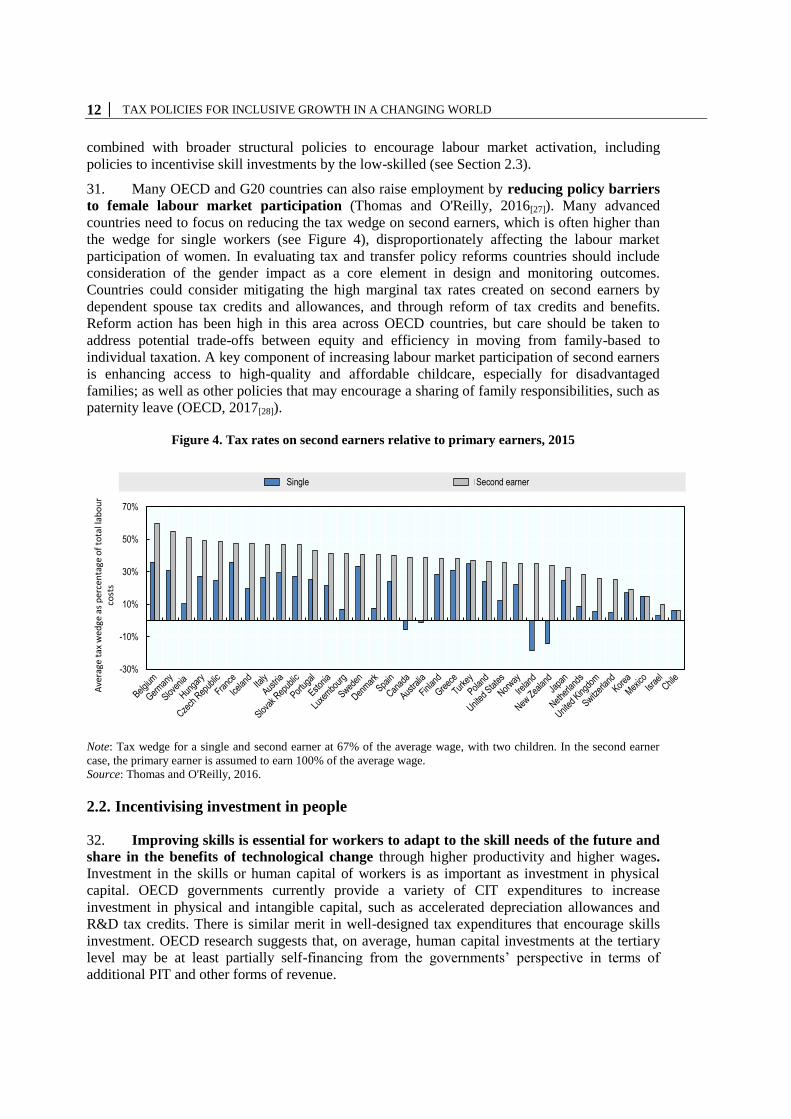
31. Many OECD and G20 countries can also raise employment by reducing policy barriers
to female labour market participation (Thomas and O'Reilly, 2016[27]). Many advanced
countries need to focus on reducing the tax wedge on second earners, which is often higher than
the wedge for single workers (see Figure 4), disproportionately affecting the labour market
participation of women. In evaluating tax and transfer policy reforms countries should include
consideration of the gender impact as a core element in design and monitoring outcomes.
Countries could consider mitigating the high marginal tax rates created on second earners by
dependent spouse tax credits and allowances, and through reform of tax credits and benefits.
Reform action has been high in this area across OECD countries, but care should be taken to
address potential trade-offs between equity and efficiency in moving from family-based to
individual taxation. A key component of increasing labour market participation of second earners
is enhancing access to high-quality and affordable childcare, especially for disadvantaged
families; as well as other policies that may encourage a sharing of family responsibilities, such as
paternity leave (OECD, 2017[28]).
Figure 4. Tax rates on second earners relative to primary earners, 2015
Note: Tax wedge for a single and second earner at 67% of the average wage, with two children. In the second earner
case, the primary earner is assumed to earn 100% of the average wage.
Source: Thomas and O'Reilly, 2016.
2.2. Incentivising investment in people
32. Improving skills is essential for workers to adapt to the skill needs of the future and
share in the benefits of technological change through higher productivity and higher wages.
Investment in the skills or human capital of workers is as important as investment in physical
capital. OECD governments currently provide a variety of CIT expenditures to increase
investment in physical and intangible capital, such as accelerated depreciation allowances and
R&D tax credits. There is similar merit in well-designed tax expenditures that encourage skills
investment. OECD research suggests that, on average, human capital investments at the tertiary
level may be at least partially self-financing from the governments’ perspective in terms of
additional PIT and other forms of revenue.
-30%
-10%
10%
30%
50%
70%
Ave
rage
tax
wed
ge a
s p
erce
nta
ge o
f to
tal l
abo
ur
cost
s
Single Second earner
TAX POLICIES FOR INCLUSIVE GROWTH IN A CHANGING WORLD │ 13
33. Many existing tax and financial incentives to invest in skills benefit those with high
incomes most. Since low-income and low-skilled workers have a lower propensity to engage in
skills development, incentives could be targeted at low-income and low-skilled groups to reduce
inequality and foster labour productivity. Such targeting, however, may pose trade-offs with
respect to both administrative feasibility as well as horizontal equity. Incentives could include
CIT and PIT credits for skills investments, though direct spending could be effective as well.
34. Raising skill levels can also increase employment levels and reduce the overall distortions
due to tax systems. Those with higher skills are more likely to earn higher wages and to
participate in the labour market. This means that investing in skills can lift labour market
participation, and thus reduce the negative impact of taxation on employment. Those with a
stronger attachment to the labour market are less likely to reduce labour supply in response to
taxation, reducing the efficiency losses from income taxes. This can mean that raising skill levels
offers significant benefits for the economy. This highlights the importance of incentivising skills
investments especially for those that have less labour market attachment, including single
parents, and both younger and older workers.
35. The changing world of work creates a necessity for innovative solutions to support
training for the low-skilled, including through the provision of financial incentives. Some
workers face a greater risk than others that their jobs will be shifted offshore or rendered obsolete
by automation, highlighting the need to incentivise lifelong learning, especially for those with
low skills.
36. Reforms to financial incentives to invest in skills should also take account of increases in
non-standard work, shorter periods of employment, and rising shares of self-employment, to
ensure that those with non-standard work arrangements are given opportunities to invest in
skills. At present, workers in many countries receive adult education through their employer.
While this is beneficial, it can exacerbate differences in access to training between those in
standard and non-standard work arrangements. Reforms to alleviate this may include shifting
training credits from jobs to providing support to individuals’ skills investments through
individual learning accounts, as recently proposed in France and the Netherlands (see, for
example, OECD (2017[29])). Other financing options such as income-contingent loans and
expanded scholarships and grant support can also support investment in skills, potentially with
fewer distortions than would be the case with respect to support through the tax system. In all
cases, financial incentives to foster skills investments should be rigorously evaluated to assess the
effectiveness of measures as many tax incentives and other programmes suffer from significant
deadweight losses (OECD, 2017[30]).
2.3. Combatting labour market informality
37. Labour market informality is a key policy challenge, which can disproportionately
affect vulnerable socioeconomic groups and may jeopardise the sustainability of the tax-benefit
system (OECD, 2017[31]). Informal employment can leave entire segments of the population
without access to social protection. Informality can compromise productivity, as informal sectors
are typically characterised by limited access to training and lower levels of human capital
accumulation (Hsieh, 2015[32]), as well as lower managerial skills and a lack of access to finance
that compromise their ability to invest in and adopt new technologies.
38. For emerging countries, addressing labour market informality is a matter of
urgency. The negative impacts of informality in terms of social benefit coverage, poverty, job
quality and productivity are all significant for emerging economies. High levels of informality
can also undermine confidence in government, institutions and the rule of law more generally.
14 │ TAX POLICIES FOR INCLUSIVE GROWTH IN A CHANGING WORLD
39. Labour informality can be addressed through a systematic approach that combines
tax policy and tax administration initiatives. A well-designed tax system can also contribute to
reducing informality (OECD/CIAT/IDB, 2016[33]). In particular, avoiding high labour tax wedges
on low-paid workers, who are at the highest risk of working in the informal economy, can restore
the incentives to formalise. Changes to tax policies can be complemented by tax administration
measures including targeted audits, simplified worker registration, and presumptive taxation.
Some aspects of the digital transformation such as e-payments and mobile payments may
encourage businesses to formalise. Equally, making the receipt of transfer payment conditional
upon formal registration and the better use of data matching across government departments can
have an impact on informality.
40. Non-tax policy approaches are complementary to tax policy approaches in
addressing informality. These can include enhancing employability through continued
investment in skills and the reform of social benefits including through the increased use of
conditional cash transfers, including in-work benefits.
TAX POLICIES FOR INCLUSIVE GROWTH IN A CHANGING WORLD │ 15
3. Shifting the tax mix towards well-designed taxes on less
mobile tax bases
41. Globalisation and the changing world of work continue to have profound impacts on the
distribution of income and the ability of tax systems to promote stronger and more inclusive
growth. In this context, priority should be given to smart tax design that supports inclusive
growth. OECD research has found that taxes on income (PIT and CIT) are associated with lower
economic growth (Akgun, Bartolini and Cournède, 2017[34]).
42. OECD research has highlighted the need to shift the tax mix away from income
taxes towards taxes that have less negative impacts on economic growth, including taxes on
property and on consumption, while also noting the importance of environmental taxes for
internalising external costs related to health, climate, and the environment. A tax mix shift
towards taxes on less mobile tax bases can ensure that the tax system becomes more
resilient and is less vulnerable to the effects of globalisation. Income taxes, especially CIT, are
taxes that are imposed on a relatively mobile tax base. The CIT, which is levied at source, has
been found to be associated with lower levels of growth, especially in open economies (OECD,
2010[35]; Akgun, Bartolini and Cournède, 2017[34]). By contrast, taxes on immovable property,
taxes on natural resource rents, and VAT have less mobile bases. In the case of VAT, it is levied
on a destination basis which means that the base of the tax is less vulnerable in a globalising
economy, and taxes on rents are less distortionary.
43. In globalising and rapidly transforming economies, rebalancing the tax mix should be a
policy priority. While different countries at different levels of development will have different
priorities, tax mix shifts can mitigate the negative impacts of PIT and SSCs when levied on the
top and bottom ends of the income distribution (see Section 2). At the bottom of the income
distribution, PIT and SSCs can have negative impacts on employment, labour market activation,
and skills development. At the top of the income distribution, PIT and SSCs can result in
increased distortions through lower risk-taking and entrepreneurship, increased mobility of high
income earners and increased income shifting across income periods, the form of compensation
and the legal form through which the taxpayer earns their income (as discussed in Section 2).
Capital income taxes can have negative impacts on incentives to save and invest (Yagan,
2015[36]). By contrast, VAT and property taxes rely upon much less mobile tax bases and are less
distortive and more beneficial for growth compared to other taxes in the tax mix. Increases in
these taxes can finance reductions in taxes on employment and human capital investment. This
can have positive efficiency and potentially equity consequences for the economy, if these
reductions are targeted in a progressive way.
44. However, shifting towards taxes that have less negative impacts on economic growth
can also raise trade-offs between equity and efficiency because greater reliance on some of
these taxes may reduce the overall progressivity of the tax system. This may be a particular
challenge in developing and emerging economies that tend to rely heavily on certain indirect
taxes, especially consumption taxes (Lustig, 2017[37]). A key question then becomes how to use
good tax design to shift the tax mix with minimal negative equity consequences.
45. While income taxes, particularly the PIT, have been seen as central to ensuring the
progressivity of the tax system, policymakers may need to look beyond income taxes to raise
the inclusiveness of the tax system. This requires examining the progressivity of the entire tax
and benefit system, rather than focussing on the progressivity of any one tax. OECD research has
shown that taxes other than income taxes can have beneficial distributional consequences while
16 │ TAX POLICIES FOR INCLUSIVE GROWTH IN A CHANGING WORLD
minimising the negative growth and efficiency implications associated with income taxes. For
example, some taxes imposed on relatively immobile tax bases such as property taxes may raise
overall tax progressivity.
46. The distributional consequences of tax mix shifts should also be examined in concert with
the public spending mix. Greater reliance on taxes that may be regressive (such as VAT and
SSCs in some instances) may actually increase the amount of overall redistribution due to the tax
and transfer system if the spending associated with the reform has progressive effects. For
example, the VAT, which is generally recognised to be either proportional or slightly regressive
in its distributional impact, may increase the overall progressivity of the tax and transfer system if
VAT revenues are used to finance spending targeted at those on lower incomes or other
initiatives that seek to redress inequality. Maintenance of progressivity will then require
continued coexistence of the tax and redistribution components of the reform therefore a key
issue in this respect is the need to mobilise sufficient domestic resources in order to meet the
countries existing and emerging expenditure needs. This means that there may be a variety of
ways to reach a given level of progressivity or redistribution.
47. The distributional impact of the tax system should also be considered from a lifetime
perspective. Some taxes such as income taxes may be highly progressive when (Levell, Roantree
and Shaw, 2015[38])considered in a given period, but may be less progressive from a lifetime
perspective, as many of those who may have low incomes at one time may have higher incomes
later in life. Much of the redistribution carried out by the tax system is in fact distribution over
the lifecycle. The lifetime impact of the tax system should also be considered through the impact
of the tax system on incentives to save, work and invest in physical capital and skills.
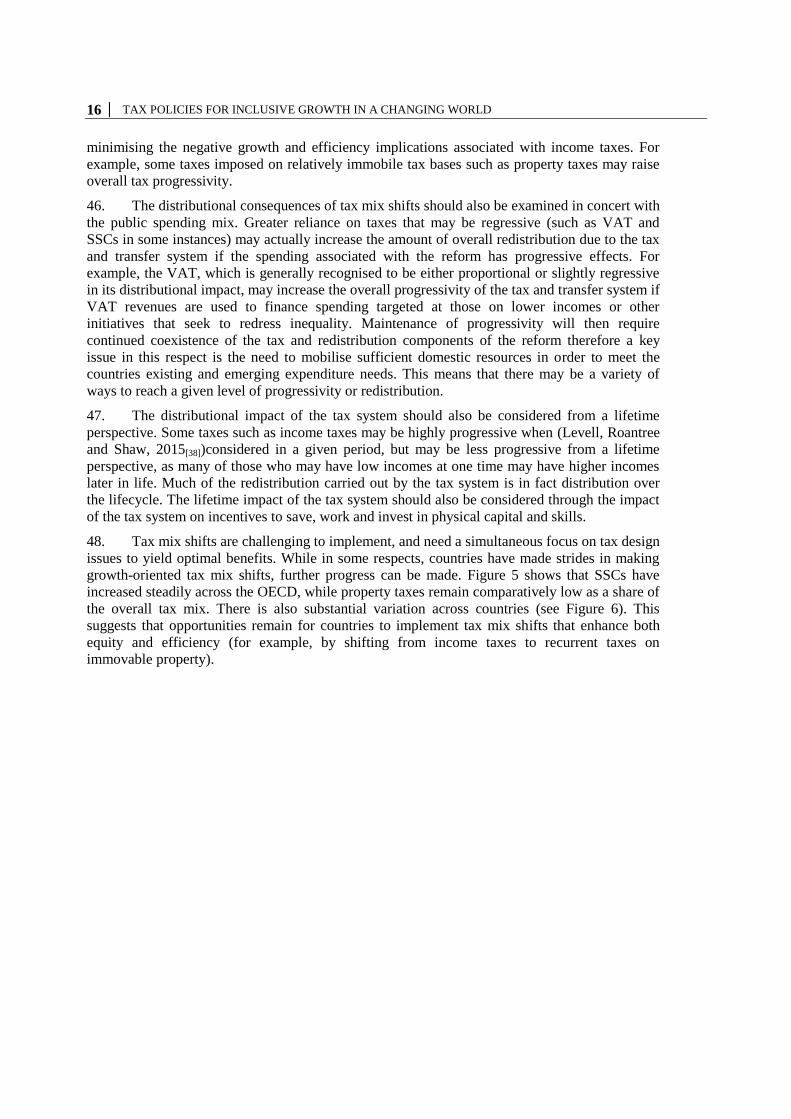
48. Tax mix shifts are challenging to implement, and need a simultaneous focus on tax design
issues to yield optimal benefits. While in some respects, countries have made strides in making
growth-oriented tax mix shifts, further progress can be made. Figure 5 shows that SSCs have
increased steadily across the OECD, while property taxes remain comparatively low as a share of
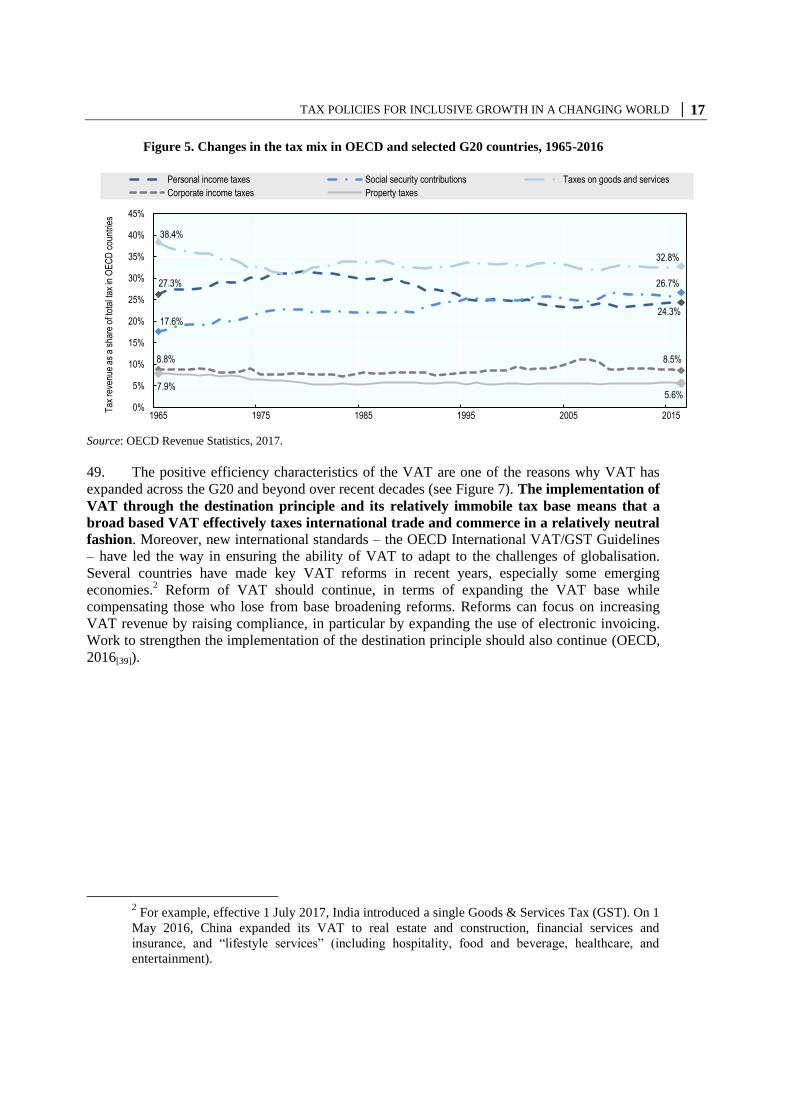
the overall tax mix. There is also substantial variation across countries (see Figure 6). This
suggests that opportunities remain for countries to implement tax mix shifts that enhance both
equity and efficiency (for example, by shifting from income taxes to recurrent taxes on
immovable property).
TAX POLICIES FOR INCLUSIVE GROWTH IN A CHANGING WORLD │ 17
Figure 5. Changes in the tax mix in OECD and selected G20 countries, 1965-2016
Source: OECD Revenue Statistics, 2017.
49. The positive efficiency characteristics of the VAT are one of the reasons why VAT has
expanded across the G20 and beyond over recent decades (see Figure 7). The implementation of
VAT through the destination principle and its relatively immobile tax base means that a
broad based VAT effectively taxes international trade and commerce in a relatively neutral
fashion. Moreover, new international standards – the OECD International VAT/GST Guidelines
– have led the way in ensuring the ability of VAT to adapt to the challenges of globalisation.
Several countries have made key VAT reforms in recent years, especially some emerging
economies.2 Reform of VAT should continue, in terms of expanding the VAT base while
compensating those who lose from base broadening reforms. Reforms can focus on increasing
VAT revenue by raising compliance, in particular by expanding the use of electronic invoicing.
Work to strengthen the implementation of the destination principle should also continue (OECD,
2016[39]).
2 For example, effective 1 July 2017, India introduced a single Goods & Services Tax (GST). On 1
May 2016, China expanded its VAT to real estate and construction, financial services and
insurance, and “lifestyle services” (including hospitality, food and beverage, healthcare, and
entertainment).
27.3%
24.3%17.6%
26.7%
38.4%
32.8%
8.8% 8.5%
7.9%5.6%
0%
5%
10%
15%
20%
25%
30%
35%
40%
45%
1965 1975 1985 1995 2005 2015
Tax
rev
enue
as
a sh
are
of to
tal t
ax in
OE
CD
cou
ntrie
s
Personal income taxes Social security contributions Taxes on goods and services
Corporate income taxes Property taxes
18 │ TAX POLICIES FOR INCLUSIVE GROWTH IN A CHANGING WORLD
Figure 6. The tax mix in OECD and selected G20 countries, 2015
Note: Countries are grouped according to the largest tax type of Personal Income Taxes, Social Security Contributions,
or Value Added Taxes.
Source: OECD Revenue Statistics, 2017.
Figure 7. Expansion of VAT in OECD and worldwide, 1965-2016
Source: Consumption Tax Trends (OECD, 2016[39]). Consumption and VAT revenue data are based on OECD
countries only.
50. Recurrent taxes on immovable property also have positive efficiency and equity
consequences. Recurrent taxes on property have been found to be among the least
detrimental to growth and are difficult to evade due to the immobility of the tax base. Recurrent taxes on property are also more efficient than transaction taxes on property, as they do
not distort labour mobility and are less sensitive to volatility in the housing market, although
transaction taxes can also lessen excessive price increases due to market speculation.
0%
20%
40%
60%
80%
100%
Personal Income Taxes Social Security Contributions Value Added Taxes Corporate Income Taxes Property Taxes Other Taxes
2.2%
20.1%
36.2%
12.6%
3
166
0
20
40
60
80
100
120
140
160
180
0%
5%
10%
15%
20%
25%
30%
35%
40%
1965 1975 1985 1995 2005 2015
Num
ber o
f cou
ntrie
s
Tax
rev
enue
as
a sh
are
of to
tal t
ax r
even
ue
Value added taxes revenue Non-VAT consumption taxes revenue Countries with VAT
TAX POLICIES FOR INCLUSIVE GROWTH IN A CHANGING WORLD │ 19
51. Recurrent taxes on immovable property are also progressive, as those with high
levels of income are more likely to have more housing wealth (O’Connor et al., 2015[40]). The
fairness of the tax can be maintained through regular re-valuation to enable the tax base to
properly reflect the market value of residential property. The efficiency and equity characteristics
of recurrent property taxes are especially beneficial to middle-income countries, where other
progressive taxes can be difficult to implement (Blöchliger, 2015[35], Norregaard, 2015[36]).
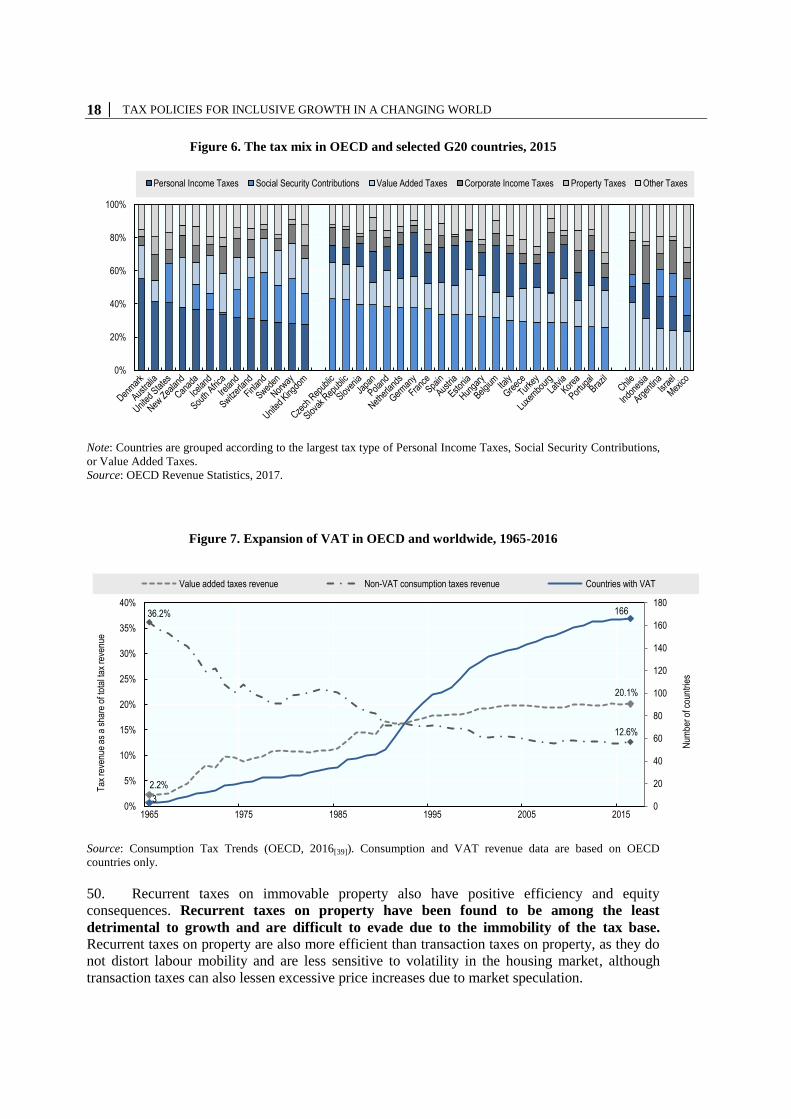
52. Despite these advantages, revenue from recurrent property taxes remains low in most
countries (see Figure 8). Raising increased revenue from property taxes presents political
economy challenges for many policymakers, in part due to the high salience of property taxes.
This salience stems from the fact that property taxes are typically paid as a lump sum once a year
or through a small number of periodic instalments and the taxpayer is responsible for remittance.
Through well-designed recurrent taxes on immovable property, governments could prevent over-
investment in housing by aligning the tax burden on housing with the tax burden on other savings
vehicles. Governments could potentially also raise higher property tax revenue by spreading
payments throughout the year, by addressing liquidity constraints for some taxpayers through
deferral, or through special credits for the elderly or others who are likely to be liquidity
constrained. (Blöchliger, 2015[41]). Regular valuation of properties is also important; in many
countries valuations are out of date, which presents significant administrative and political
challenges in terms of updating them; which may be a factor in keeping revenues low.
53. In some cases fiscal decentralisation can also play a role in keeping property tax revenues
low. Property taxes are largely levied by sub-central governments, which tend to raise a small
portion of total tax revenue, and can have difficulties in raising revenue due to local tax
competition-or as a result of the increased sensitivity to the political implications of these taxes
that comes with being the level of government that is closest to the taxpayer. Certain types of
reform of fiscal arrangements across levels of government may permit central governments to
raise more revenue from property taxes, while continuing to enable sub-central governments
to retain an important source of revenue.
54. There can be other reasons for keeping property taxes low, particularly with
respect to the principal residence. Home ownership has been shown by some studies as having
positive side effects (Dietz and Haurin, 2003[42]). It also may have a favourable effect on saving:
controlling for anterior savings and other relevant covariates, homeowners have been found in
some studies to accumulate significantly higher wealth than renters (Turner and Luea, 2009[43]).
Home ownership may also be a way for retirees to maintain their standard of living. Furthermore
the burden of property taxes may also be borne by tenants which could increase costs of living.
Where labour markets are tight, landlords may shift the burden of the tax to tenants. For these
reasons, some governments may choose to continue to provide tax concessions for home
ownership, however, care should be taken to avoid the negative efficiency and equity
consequences of such policies outlined above.
20 │ TAX POLICIES FOR INCLUSIVE GROWTH IN A CHANGING WORLD
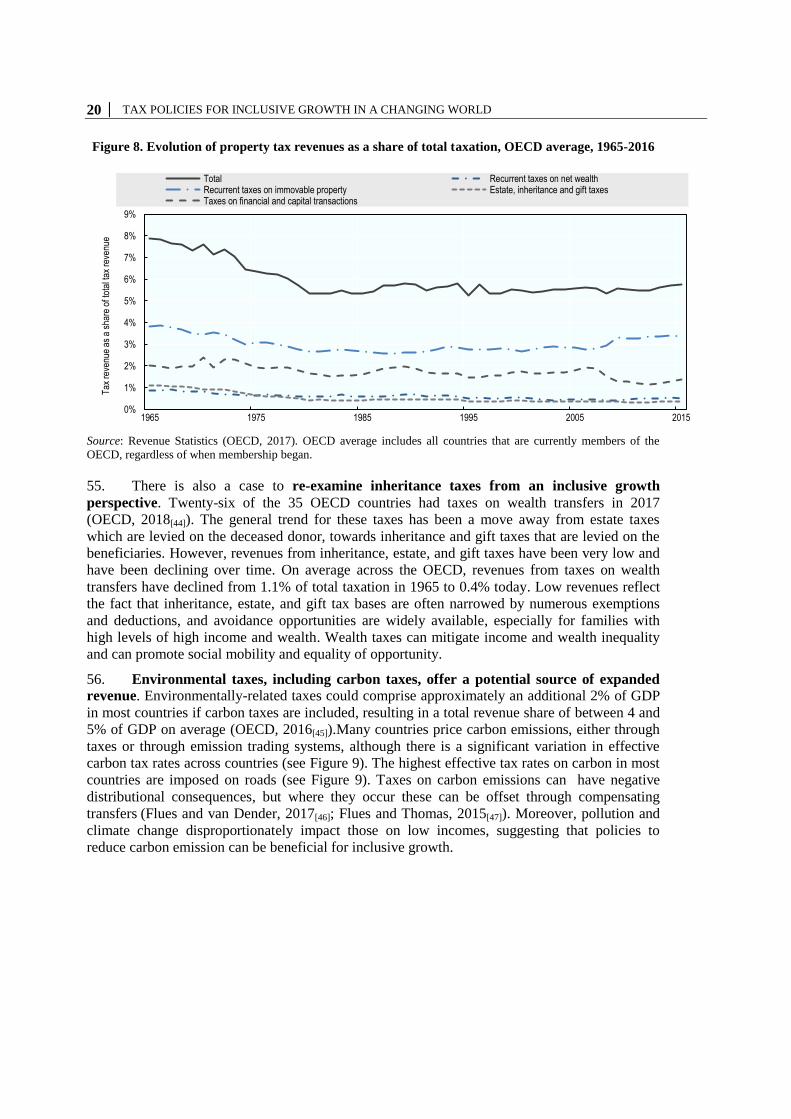
Figure 8. Evolution of property tax revenues as a share of total taxation, OECD average, 1965-2016
Source: Revenue Statistics (OECD, 2017). OECD average includes all countries that are currently members of the
OECD, regardless of when membership began.
55. There is also a case to re-examine inheritance taxes from an inclusive growth
perspective. Twenty-six of the 35 OECD countries had taxes on wealth transfers in 2017
(OECD, 2018[44]). The general trend for these taxes has been a move away from estate taxes
which are levied on the deceased donor, towards inheritance and gift taxes that are levied on the
beneficiaries. However, revenues from inheritance, estate, and gift taxes have been very low and
have been declining over time. On average across the OECD, revenues from taxes on wealth
transfers have declined from 1.1% of total taxation in 1965 to 0.4% today. Low revenues reflect
the fact that inheritance, estate, and gift tax bases are often narrowed by numerous exemptions
and deductions, and avoidance opportunities are widely available, especially for families with
high levels of high income and wealth. Wealth taxes can mitigate income and wealth inequality
and can promote social mobility and equality of opportunity.
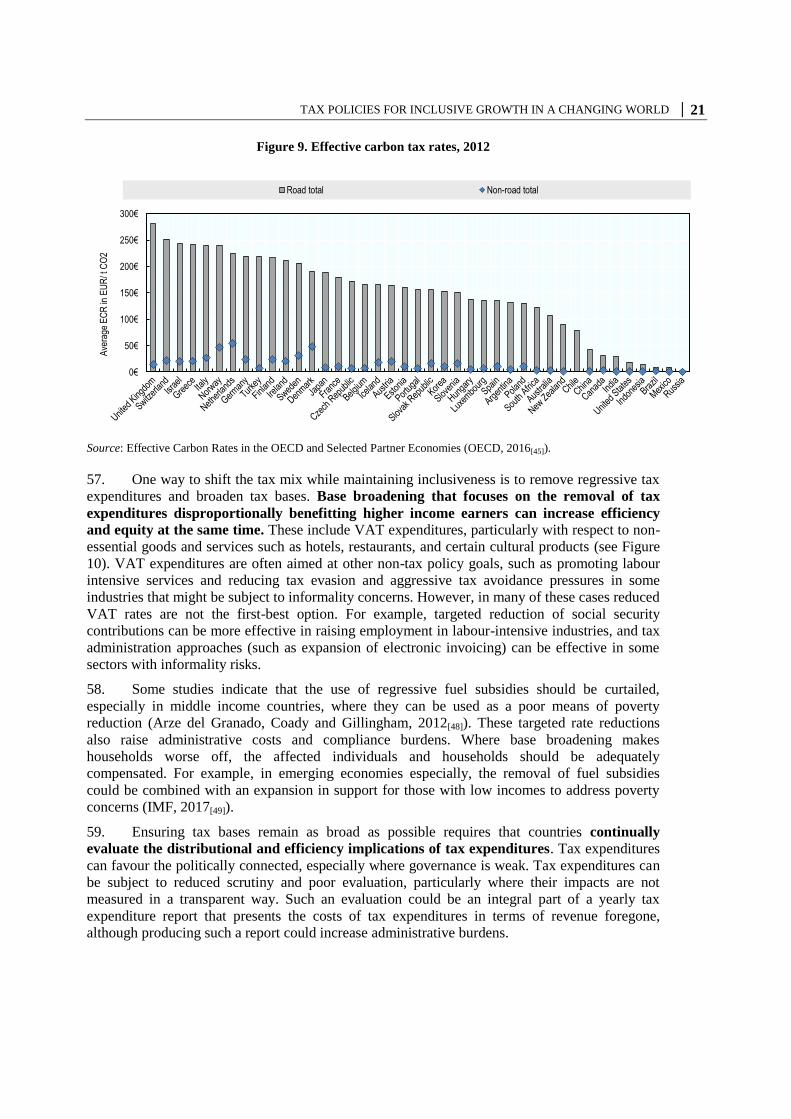
56. Environmental taxes, including carbon taxes, offer a potential source of expanded
revenue. Environmentally-related taxes could comprise approximately an additional 2% of GDP
in most countries if carbon taxes are included, resulting in a total revenue share of between 4 and
5% of GDP on average (OECD, 2016[45]).Many countries price carbon emissions, either through
taxes or through emission trading systems, although there is a significant variation in effective
carbon tax rates across countries (see Figure 9). The highest effective tax rates on carbon in most
countries are imposed on roads (see Figure 9). Taxes on carbon emissions can have negative
distributional consequences, but where they occur these can be offset through compensating
transfers (Flues and van Dender, 2017[46]; Flues and Thomas, 2015[47]). Moreover, pollution and
climate change disproportionately impact those on low incomes, suggesting that policies to
reduce carbon emission can be beneficial for inclusive growth.
0%
1%
2%
3%
4%
5%
6%
7%
8%
9%
1965 1975 1985 1995 2005 2015
Tax
rev
enue
as
a sh
are
of to
tal t
ax r
even
ue
Total Recurrent taxes on net wealthRecurrent taxes on immovable property Estate, inheritance and gift taxesTaxes on financial and capital transactions
TAX POLICIES FOR INCLUSIVE GROWTH IN A CHANGING WORLD │ 21
Figure 9. Effective carbon tax rates, 2012
Source: Effective Carbon Rates in the OECD and Selected Partner Economies (OECD, 2016[45]).
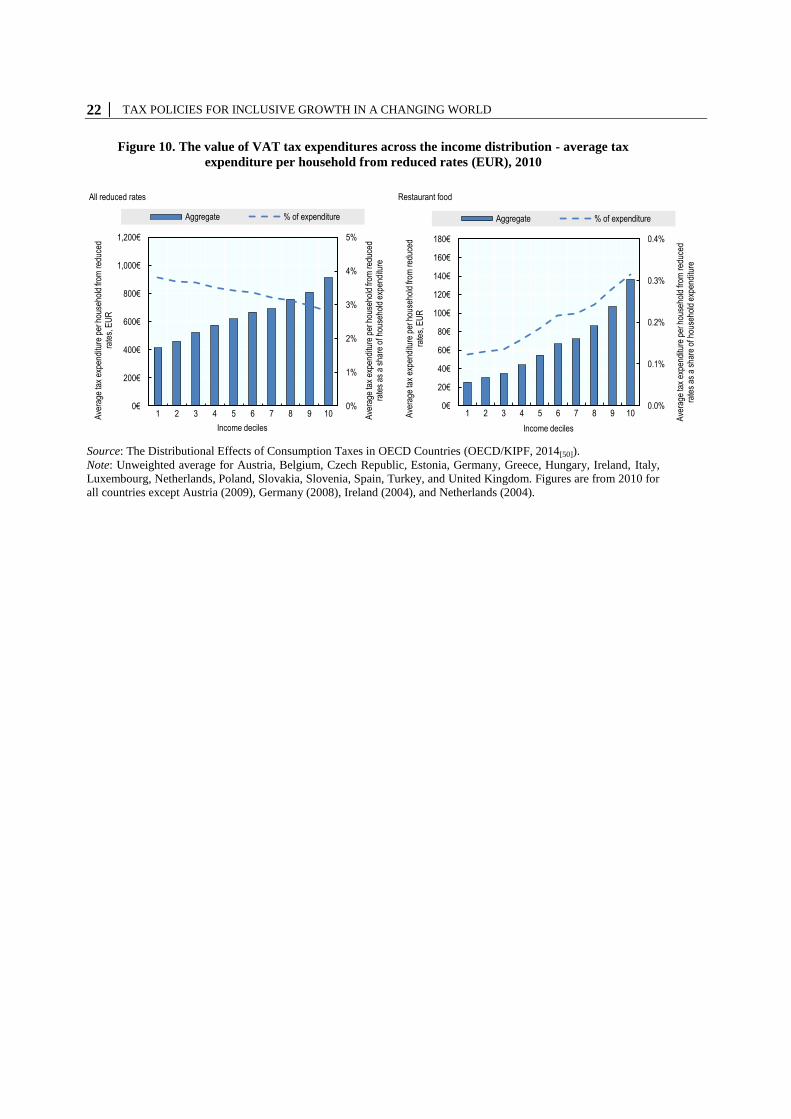
57. One way to shift the tax mix while maintaining inclusiveness is to remove regressive tax
expenditures and broaden tax bases. Base broadening that focuses on the removal of tax
expenditures disproportionally benefitting higher income earners can increase efficiency
and equity at the same time. These include VAT expenditures, particularly with respect to non-
essential goods and services such as hotels, restaurants, and certain cultural products (see Figure
10). VAT expenditures are often aimed at other non-tax policy goals, such as promoting labour
intensive services and reducing tax evasion and aggressive tax avoidance pressures in some
industries that might be subject to informality concerns. However, in many of these cases reduced
VAT rates are not the first-best option. For example, targeted reduction of social security
contributions can be more effective in raising employment in labour-intensive industries, and tax
administration approaches (such as expansion of electronic invoicing) can be effective in some
sectors with informality risks.
58. Some studies indicate that the use of regressive fuel subsidies should be curtailed,
especially in middle income countries, where they can be used as a poor means of poverty
reduction (Arze del Granado, Coady and Gillingham, 2012[48]). These targeted rate reductions
also raise administrative costs and compliance burdens. Where base broadening makes
households worse off, the affected individuals and households should be adequately
compensated. For example, in emerging economies especially, the removal of fuel subsidies
could be combined with an expansion in support for those with low incomes to address poverty
concerns (IMF, 2017[49]).
59. Ensuring tax bases remain as broad as possible requires that countries continually
evaluate the distributional and efficiency implications of tax expenditures. Tax expenditures
can favour the politically connected, especially where governance is weak. Tax expenditures can
be subject to reduced scrutiny and poor evaluation, particularly where their impacts are not
measured in a transparent way. Such an evaluation could be an integral part of a yearly tax
expenditure report that presents the costs of tax expenditures in terms of revenue foregone,
although producing such a report could increase administrative burdens.
0€
50€
100€
150€
200€
250€
300€
Ave
rage
EC
R in
EU
R/ t
CO
2
Road total Non-road total
22 │ TAX POLICIES FOR INCLUSIVE GROWTH IN A CHANGING WORLD
Figure 10. The value of VAT tax expenditures across the income distribution - average tax
expenditure per household from reduced rates (EUR), 2010
Source: The Distributional Effects of Consumption Taxes in OECD Countries (OECD/KIPF, 2014[50]).
Note: Unweighted average for Austria, Belgium, Czech Republic, Estonia, Germany, Greece, Hungary, Ireland, Italy,
Luxembourg, Netherlands, Poland, Slovakia, Slovenia, Spain, Turkey, and United Kingdom. Figures are from 2010 for
all countries except Austria (2009), Germany (2008), Ireland (2004), and Netherlands (2004).
All reduced rates Restaurant food
0%
1%
2%
3%
4%
5%
0€
200€
400€
600€
800€
1,000€
1,200€
1 2 3 4 5 6 7 8 9 10 Ave
rage
tax
expe
nditu
re p
er h
ouse
hold
from
red
uced
ra
tes
as a
sha
re o
f hou
seho
ld e
xpen
ditu
re
Ave
rage
tax
expe
nditu
re p
er h
ouse
hold
from
red
uced
ra
tes,
EU
R
Income deciles
Aggregate % of expenditure
0.0%
0.1%
0.2%
0.3%
0.4%
0€
20€
40€
60€
80€
100€
120€
140€
160€
180€
1 2 3 4 5 6 7 8 9 10
Ave
rage
tax
expe
nditu
re p
er h
ouse
hold
from
red
uced
ra
tes
as a
sha
re o
f hou
seho
ld e
xpen
ditu
re
Ave
rage
tax
expe
nditu
re p
er h
ouse
hold
from
red
uced
ra
tes,
EU
RIncome deciles
Aggregate % of expenditure
TAX POLICIES FOR INCLUSIVE GROWTH IN A CHANGING WORLD │ 23
4. Supporting the efficiency and equity of personal income tax
and transfer systems
60. Income taxes have a crucial role to play in fostering inclusive growth, both in raising
revenue and delivering progressivity in the tax system, but due to the relatively mobile tax base
of income taxes, they may be particularly affected by increased tax competition from
globalisation. In addition, changes in the nature of work may place this tax base under increasing
pressure if the importance of non-standard employment arrangements rises significantly. OECD
research has suggested that income taxes have a negative impact on growth and a positive impact
on income redistribution. OECD research shows that the redistributive impact of income taxes
and transfers has declined under increased globalisation (Causa and Hermansen, 2017[17]). A key
question for policymakers is how to design personal income taxes and transfers to boost growth
and make them more inclusive, while maintaining their capacity to raise revenues. In some
countries reforms are needed to support the progressivity of taxes and transfers, to reduce tax
distortions across different forms of work, and to strengthen the taxation of capital income at the
personal level.
4.1. Improving the effectiveness of taxes and transfers
61. Overall, labour income tax progressivity has fallen across the OECD over the last
thirty years, though it has increased modestly in the post-crisis period. This overall result has
been driven by reductions in taxation at the top of the income distribution, though it has been
partly offset by reductions at the bottom. Taxes have increased in the middle of the income
distribution. There is also substantial variation in the degree of change in labour income tax
progressivity across countries. Overall, the decline in tax progressivity (at the top) has
contributed to a reduction in income redistribution across OECD countries over recent decades
(Causa and Hermansen, 2017[17]).
62. High tax rates at the top of the income distribution can carry well-known efficiency
costs, reducing investment, entrepreneurship and labour supply, and also providing strong
incentives for individuals to reduce their tax liability (OECD, 2010[35]). High-income taxpayers
can respond through avoidance (e.g. the re-characterisation of income), evasion (e.g. concealing
assets and income offshore) and mobility (e.g. shifting tax residency).
63. However, some studies have argued that increased personal taxation of those with high
levels of income and wealth can be beneficial from an efficiency perspective. Higher income
taxes at the top of the distribution can be effective where top incomes are due to economic
rents (Piketty and Saez, 2012[51]), market failure (Bivens and Mishel, 2013[52]), or where
responses to taxation result in shifts in the form of compensation but not reductions in effort
(Rubolino and Waldenström, 2017[53]; Goolsbee, 2000[54]).
64. In middle income countries, many income tax systems contribute a relatively small
share of overall revenues and do not play a very significant role in reducing inequality, due
to high tax-free thresholds and generous tax allowances as well as widespread informality and
evasion. These thresholds should be reduced, but the reduction should be combined with
expansions in tax capacity and initiatives to reduce informality, improved administration and
expanded third-party reporting.
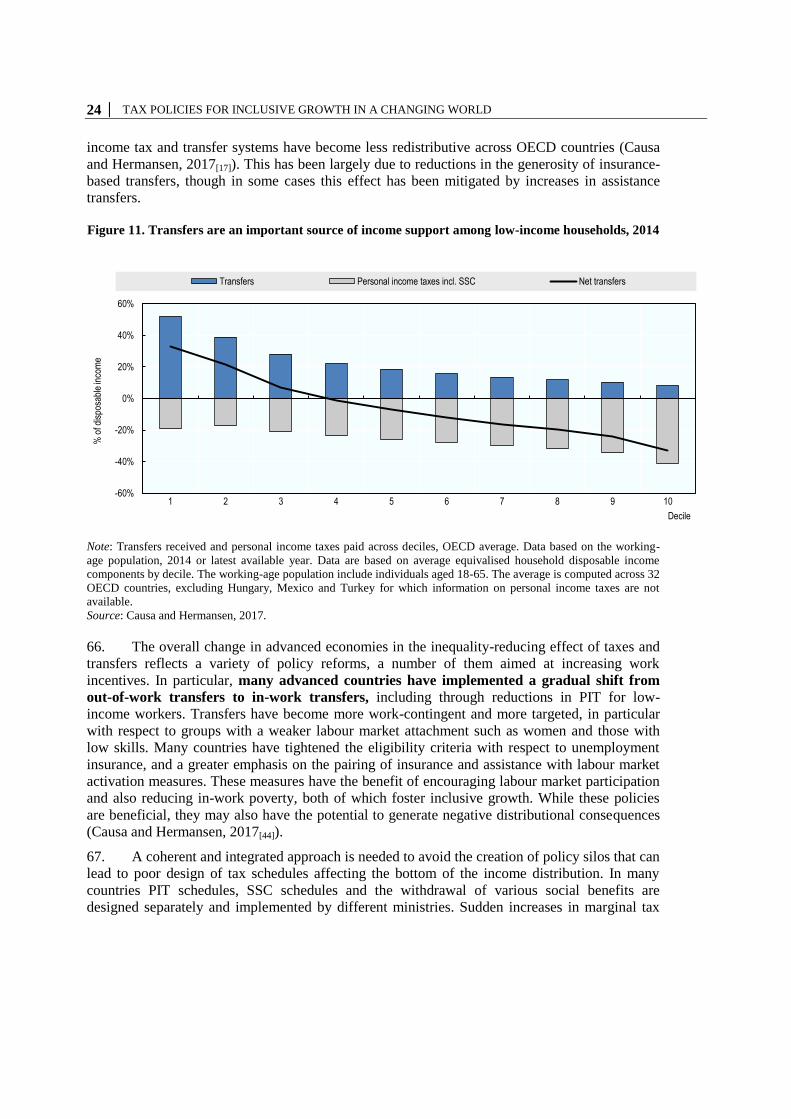
65. Transfers do more to reduce inequality than taxes and are an important source of
income support at the bottom of the distribution (see Figure 11). Over the last decades,
24 │ TAX POLICIES FOR INCLUSIVE GROWTH IN A CHANGING WORLD
income tax and transfer systems have become less redistributive across OECD countries (Causa
and Hermansen, 2017[17]). This has been largely due to reductions in the generosity of insurance-
based transfers, though in some cases this effect has been mitigated by increases in assistance
transfers.
Figure 11. Transfers are an important source of income support among low-income households, 2014
Note: Transfers received and personal income taxes paid across deciles, OECD average. Data based on the working-
age population, 2014 or latest available year. Data are based on average equivalised household disposable income
components by decile. The working-age population include individuals aged 18-65. The average is computed across 32
OECD countries, excluding Hungary, Mexico and Turkey for which information on personal income taxes are not
available.
Source: Causa and Hermansen, 2017.
66. The overall change in advanced economies in the inequality-reducing effect of taxes and
transfers reflects a variety of policy reforms, a number of them aimed at increasing work
incentives. In particular, many advanced countries have implemented a gradual shift from
out-of-work transfers to in-work transfers, including through reductions in PIT for low-
income workers. Transfers have become more work-contingent and more targeted, in particular
with respect to groups with a weaker labour market attachment such as women and those with
low skills. Many countries have tightened the eligibility criteria with respect to unemployment
insurance, and a greater emphasis on the pairing of insurance and assistance with labour market
activation measures. These measures have the benefit of encouraging labour market participation
and also reducing in-work poverty, both of which foster inclusive growth. While these policies
are beneficial, they may also have the potential to generate negative distributional consequences
(Causa and Hermansen, 2017[44]).
67. A coherent and integrated approach is needed to avoid the creation of policy silos that can
lead to poor design of tax schedules affecting the bottom of the income distribution. In many
countries PIT schedules, SSC schedules and the withdrawal of various social benefits are
designed separately and implemented by different ministries. Sudden increases in marginal tax
-60%
-40%
-20%
0%
20%
40%
60%
1 2 3 4 5 6 7 8 9 10
% o
f dis
posa
ble
inco
me
Decile
Transfers Personal income taxes incl. SSC Net transfers
TAX POLICIES FOR INCLUSIVE GROWTH IN A CHANGING WORLD │ 25
wedges at certain income levels can result when various PIT or SSC increases or rates of benefit
withdrawal are not coordinated, which in turn can lead to poverty traps.3
4.2. Labour income taxation and the future of work
68. A challenge for the taxation of labour income in a rapidly changing economy is
the increasing proportion of the workforce earning some or all of their income outside of
traditional employee-employer relationships, though the share of the population engaged in
non-standard work arrangements is currently low (OECD, 2015[2]). While such changes are not
negative developments as such, they need to be managed to ensure that they do not result in other
negative outcomes for workers and firms such as increased economic insecurity and increased
inequality.
69. The incentives of firms to hire workers outside of traditional employer-employee
work arrangements may be substantial in many OECD countries (Jackson, Looney and Ramnath,
2017[55]). Non-standard work arrangements often offer cost advantages for firms, some of which
are directly linked to the tax system, such as reduced SSCs, or none at all. This means that tax
factors may be driving sub-optimal changes in labour contract choice. This is particularly
relevant in sectors that have been more deeply affected by digitalisation, which has ushered in
dramatic growth in the number of firms providing services through online platforms. An
increasing number of jobs traditionally performed by employees are now performed by self-
employed contractors.4
70. These changes may create particular challenges for social protection systems
substantially financed through SSCs. These systems provide both an important insurance role
through collective saving, and also support pension provision in ageing societies. However they
face challenges. First, entitlements to social protection may diminish if individuals’ SSC
contribution histories become irregular, reducing their entitlements and lowering social
protection, for example with respect to unemployment, disability and retirement (OECD, 2015[2]).
This would have the effect of reducing the insurance role that SSC-financed social insurance
plays in many societies.
71. Second, reduced contributions may undermine the fiscal sustainability of
social insurance systems. Potential increases in self-employment as a result of changes in the
labour market could result in a narrowing of the SSC base. In many countries self-employed
workers pay SSCs at lower rates compared to standard employees. Increases in self-employment
have the potential to substantially lower SSC revenues in the absence of policy changes. Where
workers are engaged through online platforms, there may be tax administration challenges in
levying SSCs on cross-border labour income, further reducing revenue collected. Further
international cooperation may be needed to addresses these challenges (see Section 6.1). The
fiscal sustainability challenges of social insurance systems will be exacerbated by population
ageing.
72. Increases in SSC rates can be used to expand access to social insurance or to
strengthen the financial position of SSC systems. However, these high SSC rates reduce labour
3 A “trap” refers to a situation where an increase in gross earnings fails to translate into a net
income increase that is felt by the individual to be a sufficient return for the additional effort.
4 The impact of digitalisation on CIT and VAT are discussed further in the Interim Report of the
Task Force on the Digital Economy and so are not addressed in detail in this note.
26 │ TAX POLICIES FOR INCLUSIVE GROWTH IN A CHANGING WORLD
demand, particularly for workers with low incomes, and may also increase the incentives for
informal arrangements. High SSCs can also widen the difference in tax wedges between those in
standard jobs and those in non-standard jobs. Despite these issues, SSC rates have risen over
recent years, and account for a large part of the increase in the tax-to-GDP ratio across the OECD
over the past 50 years.
73. The future of work also requires new approaches to financing social insurance due to the
fact that the coverage of social protection schemes will need to be expanded to adapt to the
changing world of work. Workers on ‘flexible’ labour contracts or other forms of non-standard
work often have limited or no access to certain forms of social protection, such as workplace
accident and unemployment insurance, and they may not be covered by basic labour market
regulations. This also means extending the reach of social protection to new forms of work as
much as possible, which would likely require additional government revenues.
74. Financing social insurance from general taxation revenue instead of SSCs could raise
labour market participation, reduce labour market dualism and boost growth, while at the same
time extending welfare support to a larger fraction of society. This could allow more of the
burden of social insurance financing to come from less distortive taxes such as taxes on
consumption and property (see Section 4.1). This could also have the benefit of reducing tax
differentials between standard and non-standard work arrangements. In many emerging
economies, high SSC rates at low incomes significantly reduce the progressivity of tax systems.
The case for expanded social insurance financing is strongest for those benefits that are weakly
linked to the amount of SSCs made, including housing allowances and cash transfers to support
families with children.
75. Reform to the way social protection is financed need not result in reductions in
social transfers that are important in reducing inequality. Reducing SSCs in particular can
present challenges for governments where SSC contributions are closely tied to receipt of social
benefits. Rather, reform to social insurance financing can be an opportunity to expand social
protection coverage to those in non-standard work, the self-employed, and other groups who may
not have regular patterns of social security contributions such as migrants. At the same time,
there is a case for encouraging retirement savings by better linking social benefits to social
contribution payments. However, care needs to be taken to ensure that these reforms do not
increase inequality.
76. In general, a better understanding of the links between the transformation of
work and tax and spending policies is required. While SSCs may be lower for some non-
standard work categories, other taxes may apply instead (e.g., CIT or VAT for services rendered).
This makes it challenging to assess the tax burden across different legal forms, highlighting the
need for further analysis. Achieving tax neutrality requires the reduction in gaps in effective tax
rates on different employment forms, though this may be difficult in practice.
4.3. Effectively taxing capital and wealth
77. Strengthening the progressivity and efficiency of the tax system could also
occur through more effective taxation of capital income at the personal level. Wealth
inequality has been shown to be higher than income inequality, and there are widespread calls for
raising capital taxation in response to increasing income and wealth inequality. Recent advances
in the theoretical economic literature highlight the importance of effective capital taxation as part
of the overall tax mix (Stantcheva, 2014[56]; Saez and Stantcheva, 2017[57]). Recent OECD
research suggests that the decline in the taxation of capital income at the personal level has
contributed to the decline in income redistribution across the OECD (Causa and Hermansen,
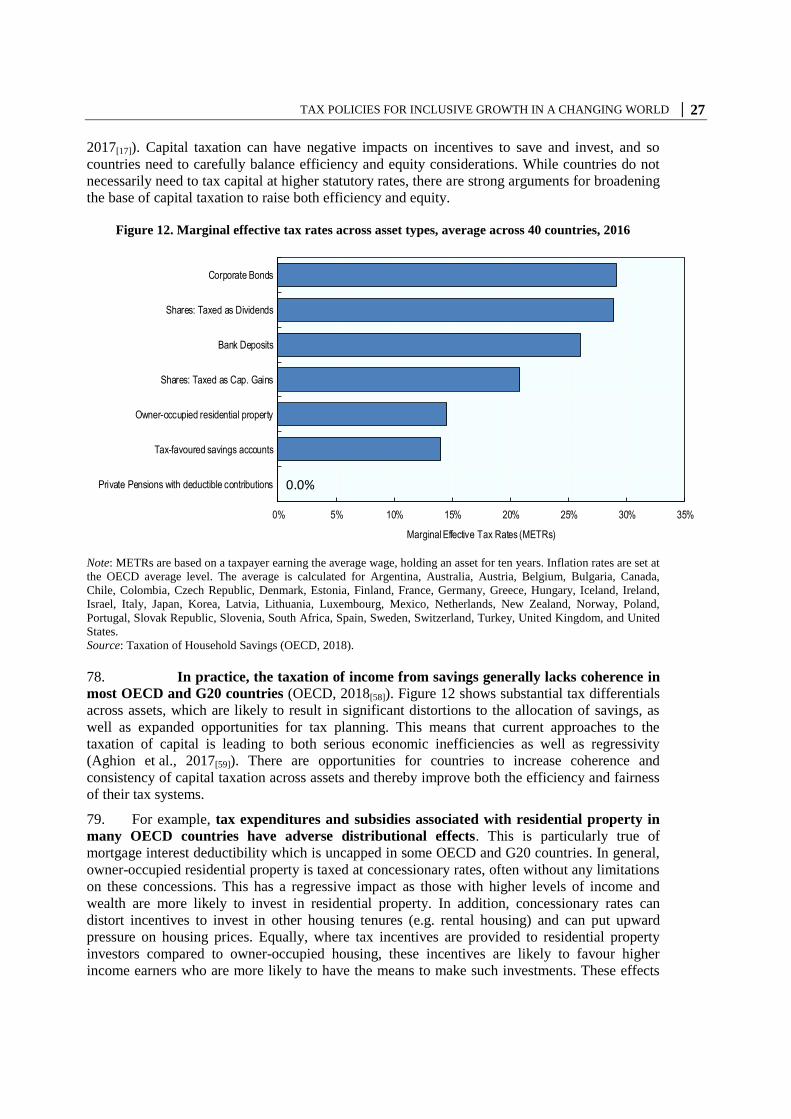
TAX POLICIES FOR INCLUSIVE GROWTH IN A CHANGING WORLD │ 27
2017[17]). Capital taxation can have negative impacts on incentives to save and invest, and so
countries need to carefully balance efficiency and equity considerations. While countries do not
necessarily need to tax capital at higher statutory rates, there are strong arguments for broadening
the base of capital taxation to raise both efficiency and equity.
Figure 12. Marginal effective tax rates across asset types, average across 40 countries, 2016
Note: METRs are based on a taxpayer earning the average wage, holding an asset for ten years. Inflation rates are set at
the OECD average level. The average is calculated for Argentina, Australia, Austria, Belgium, Bulgaria, Canada,
Chile, Colombia, Czech Republic, Denmark, Estonia, Finland, France, Germany, Greece, Hungary, Iceland, Ireland,
Israel, Italy, Japan, Korea, Latvia, Lithuania, Luxembourg, Mexico, Netherlands, New Zealand, Norway, Poland,
Portugal, Slovak Republic, Slovenia, South Africa, Spain, Sweden, Switzerland, Turkey, United Kingdom, and United
States.
Source: Taxation of Household Savings (OECD, 2018).
78. In practice, the taxation of income from savings generally lacks coherence in
most OECD and G20 countries (OECD, 2018[58]). Figure 12 shows substantial tax differentials
across assets, which are likely to result in significant distortions to the allocation of savings, as
well as expanded opportunities for tax planning. This means that current approaches to the
taxation of capital is leading to both serious economic inefficiencies as well as regressivity
(Aghion et al., 2017[59]). There are opportunities for countries to increase coherence and
consistency of capital taxation across assets and thereby improve both the efficiency and fairness
of their tax systems.
79. For example, tax expenditures and subsidies associated with residential property in
many OECD countries have adverse distributional effects. This is particularly true of
mortgage interest deductibility which is uncapped in some OECD and G20 countries. In general,
owner-occupied residential property is taxed at concessionary rates, often without any limitations
on these concessions. This has a regressive impact as those with higher levels of income and
wealth are more likely to invest in residential property. In addition, concessionary rates can
distort incentives to invest in other housing tenures (e.g. rental housing) and can put upward
pressure on housing prices. Equally, where tax incentives are provided to residential property
investors compared to owner-occupied housing, these incentives are likely to favour higher
income earners who are more likely to have the means to make such investments. These effects
Marginal effective tax rates across asset types, average across 40 countries
Note: METRs are based on a taxpayer earning the average wage, holding an asset for ten years. Inflation rates are set at the OECD average level. The average is calculated for Argentina, Australia, Austria, Belgium, Bulgaria, Canada, Chile, Colombia, Czech Republic, Denmark, Estonia, Finland, France, Germany, Greece, Hungary, Iceland, Ireland, Israel, Italy, Japan, Korea, Latvia, Lithuania, Luxembourg, Mexico, Netherlands, New Zealand, Norway, Poland, Portugal, Slovak Republic, Slovenia, South Africa, Spain, Sweden, Switzerland, Turkey, United Kingdom, and United States
Source: (OECD, 2018)
0.0%
0% 5% 10% 15% 20% 25% 30% 35%
Private Pensions with deductible contributions
Tax-favoured savings accounts
Owner-occupied residential property
Shares: Taxed as Cap. Gains
Bank Deposits
Shares: Taxed as Dividends
Corporate Bonds
Marginal Effective Tax Rates (METRs)
28 │ TAX POLICIES FOR INCLUSIVE GROWTH IN A CHANGING WORLD
can have further adverse distributional impacts (OECD, 2018[4]). Exemptions of residences from
capital gains tax could be curtailed, especially for expensive properties or for capital gains above
a certain threshold, although such exemption curtails mobility.
80. Net wealth taxes have been increasingly cited in the public debate as an answer to
addressing the increase in inequality of wealth and income. However, when combined with
personal income tax on capital income they can result in extremely high effective tax rates being
imposed on certain assets and can have an adverse impact on growth. Implementing wealth taxes
can also present challenges, especially where assets are illiquid, and may be costly to administer.
Wealth taxes can be an effective policy substitute in instances where a country, for other
policy reasons, does not have a broad-based capital income tax, including a tax on capital
gains, and a well-designed inheritance tax (OECD, 2018[44]). However, in the presence of these
taxes, the case for net wealth taxes is less strong.
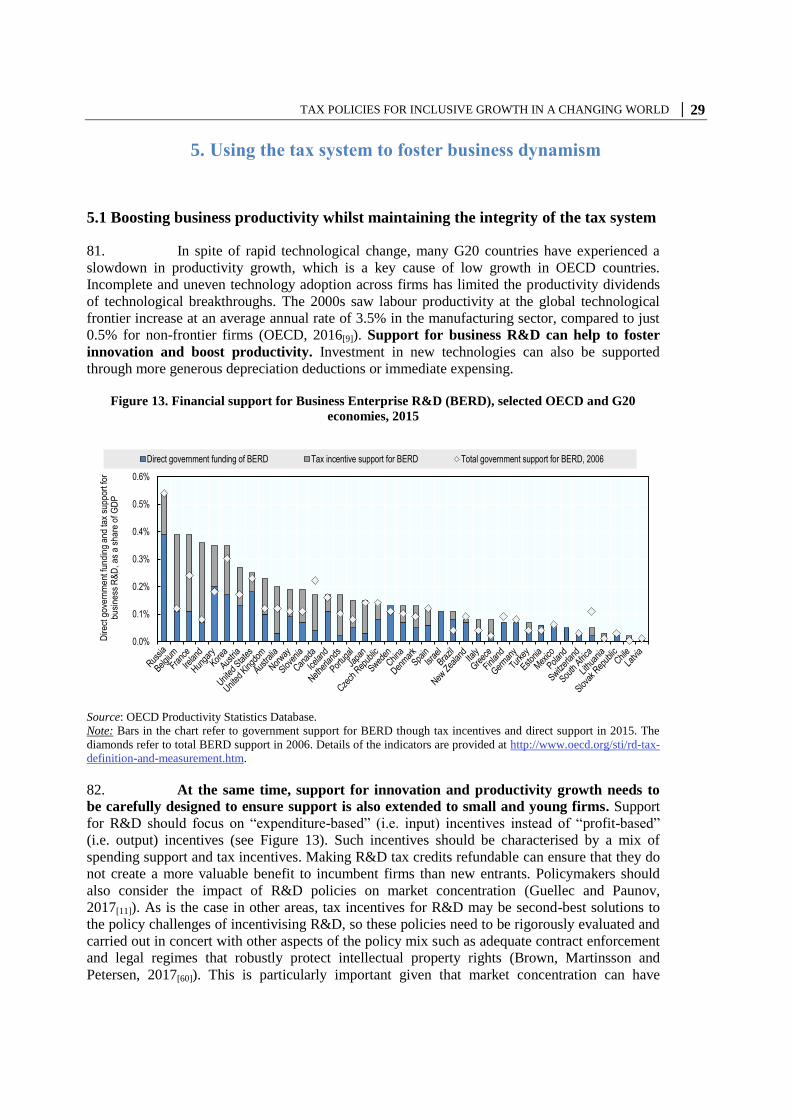
TAX POLICIES FOR INCLUSIVE GROWTH IN A CHANGING WORLD │ 29
5. Using the tax system to foster business dynamism
5.1 Boosting business productivity whilst maintaining the integrity of the tax system
81. In spite of rapid technological change, many G20 countries have experienced a
slowdown in productivity growth, which is a key cause of low growth in OECD countries.
Incomplete and uneven technology adoption across firms has limited the productivity dividends
of technological breakthroughs. The 2000s saw labour productivity at the global technological
frontier increase at an average annual rate of 3.5% in the manufacturing sector, compared to just
0.5% for non-frontier firms (OECD, 2016[9]). Support for business R&D can help to foster
innovation and boost productivity. Investment in new technologies can also be supported
through more generous depreciation deductions or immediate expensing.
Figure 13. Financial support for Business Enterprise R&D (BERD), selected OECD and G20
economies, 2015
Source: OECD Productivity Statistics Database.
Note: Bars in the chart refer to government support for BERD though tax incentives and direct support in 2015. The
diamonds refer to total BERD support in 2006. Details of the indicators are provided at http://www.oecd.org/sti/rd-tax-
definition-and-measurement.htm.
82. At the same time, support for innovation and productivity growth needs to
be carefully designed to ensure support is also extended to small and young firms. Support
for R&D should focus on “expenditure-based” (i.e. input) incentives instead of “profit-based”
(i.e. output) incentives (see Figure 13). Such incentives should be characterised by a mix of
spending support and tax incentives. Making R&D tax credits refundable can ensure that they do
not create a more valuable benefit to incumbent firms than new entrants. Policymakers should
also consider the impact of R&D policies on market concentration (Guellec and Paunov,
2017[11]). As is the case in other areas, tax incentives for R&D may be second-best solutions to
the policy challenges of incentivising R&D, so these policies need to be rigorously evaluated and
carried out in concert with other aspects of the policy mix such as adequate contract enforcement
and legal regimes that robustly protect intellectual property rights (Brown, Martinsson and
Petersen, 2017[60]). This is particularly important given that market concentration can have
0.0%
0.1%
0.2%
0.3%
0.4%
0.5%
0.6%
Dire
ct g
ove
rnm
ent f
un
din
g a
nd
tax
sup
po
rt fo
r b
usi
ne
ss R
&D
, a
s a
sh
are
of G
DP
Direct government funding of BERD Tax incentive support for BERD Total government support for BERD, 2006
30 │ TAX POLICIES FOR INCLUSIVE GROWTH IN A CHANGING WORLD
negative consequences for the distribution of income (De Loecker and Eeckhout, 2017[61]).
Market concentration appears to be increasing in some areas of the “gig” economy.
83. Supporting productivity has equity benefits. Diverging productivity developments
across firms can explain a significant part of the increased earnings inequality in many OECD
economies (Berlingieri, Blanchenay and Criscuolo C., 2017[62]) since divergence in productivity
between firms is linked to wage divergence between employees of those firms. This suggests that
reductions in productivity gaps can support wage growth and inclusion across G20 economies
(OECD, 2016[9]).
84. OECD research has also suggested that biases for debt over equity financing can be
more likely to discriminate against innovative fast-growing firms, because they may invest more
heavily in intangible property and thus have less access to debt financing and are more reliant on
equity financing (Brown, Martinsson and Petersen, 2013[63]; Adalet McGowan, Andrews and
Millot, 2017[64]). Debt bias can also result from tax systems, and removing or reducing tax-related
incentives for debt financing could foster increased productivity diffusion.
85. Adapting the business tax system to continuing trends of globalisation and digitalisation
also means addressing base erosion and profit shifting (BEPS). Tax evasion and BEPS
behaviours place burdens on tax revenues, and diminish trust in tax systems. In addition to the
challenges posed by BEPS for tax revenues and effective tax administration, BEPS behaviours
can also generate benefits that accrue to large incumbent firms over smaller firms and new
entrants and in doing so reduce business dynamism. This means that providing support for
businesses should be combined with effective measures to address BEPS behaviours and ensure
the integrity of the tax system. Tackling aggressive tax avoidance should include implementing
the four minimum standards of the OECD/G20 BEPS project on combatting harmful tax
practices, preventing tax treaty abuse, enhancing the effectiveness of dispute resolution, and
implementing greater transparency through Country-by-Country Reporting. The BEPS Project
has established clear limits for income-based support schemes such as intellectual property
regimes so that they are not harmful and therefore do not create tax-avoidance opportunities.
5.2 Supporting growth of SMEs
86. The tax treatment of SMEs and new businesses is crucial in terms of raising
competition that can drive dynamic and inclusive growth. While not all SMEs are innovative,
new and small firms are often the driving force behind innovations that are important for
economic growth (OECD, 2010[65]).
87. The tax treatment of SMEs varies across legal forms. Business income of
unincorporated SMEs is typically taxed under the PIT; incorporated businesses are taxed under
CIT and then separately or under PIT when wages and/or dividends are distributed or capital
gains are realised. Some countries have special tax rules for closely-held corporations or for pass-
through entities that can affect SMEs. Businesses may face tax-induced incentives to change
their legal form (e.g. to incorporate), reducing the efficiency and horizontal equity of the tax
system and potentially creating hurdles for business growth.
88. Some aspects of the tax system can inadvertently disadvantage SMEs relative to larger
enterprises, such as the fixed costs associated with tax and regulatory compliance. However,
many countries use reduced CIT rates to support SMEs, which may discourage SMEs from
expanding for tax reasons (see Figure 14). Efforts to support SMEs should be provided in
ways that do not impede their growth, such as through simplified or presumptive taxation and
efforts to reduce compliance and administrative burdens as opposed to reduced rates.
Competition policy is often a more targeted means of promoting competition than tax policy. It is
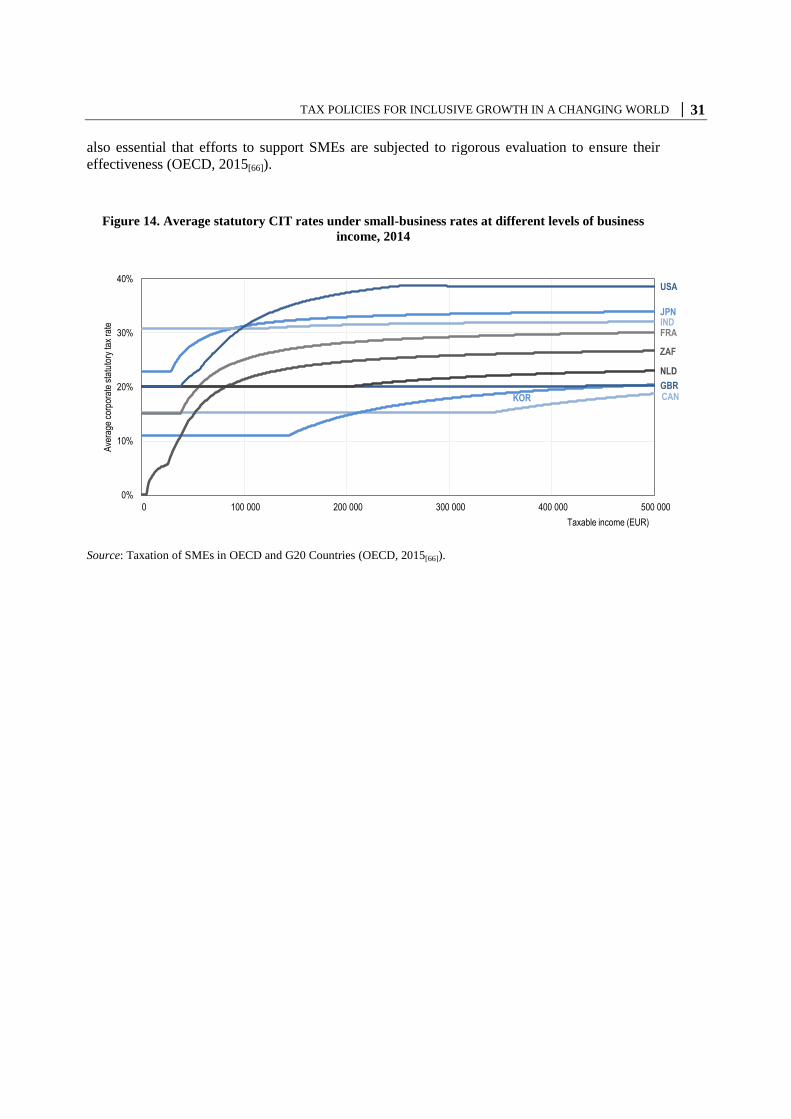
TAX POLICIES FOR INCLUSIVE GROWTH IN A CHANGING WORLD │ 31
also essential that efforts to support SMEs are subjected to rigorous evaluation to ensure their
effectiveness (OECD, 2015[66]).
Figure 14. Average statutory CIT rates under small-business rates at different levels of business
income, 2014
Source: Taxation of SMEs in OECD and G20 Countries (OECD, 2015[66]).
CAN
FRA
JPN
KOR
ZAF
GBR
USA
IND
NLD
0%
10%
20%
30%
40%
0 100 000 200 000 300 000 400 000 500 000
Ave
rage
cor
pora
te s
tatu
tory
tax
rate
Taxable income (EUR)
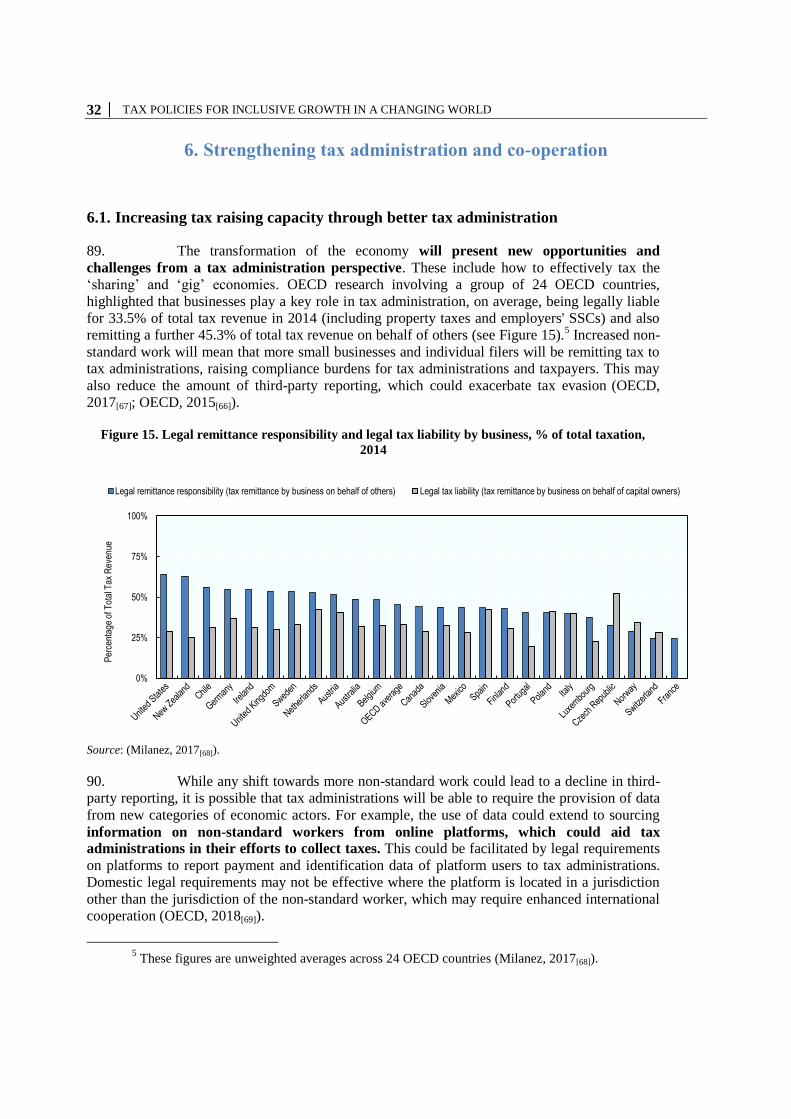
32 │ TAX POLICIES FOR INCLUSIVE GROWTH IN A CHANGING WORLD
6. Strengthening tax administration and co-operation
6.1. Increasing tax raising capacity through better tax administration
89. The transformation of the economy will present new opportunities and
challenges from a tax administration perspective. These include how to effectively tax the
‘sharing’ and ‘gig’ economies. OECD research involving a group of 24 OECD countries,
highlighted that businesses play a key role in tax administration, on average, being legally liable
for 33.5% of total tax revenue in 2014 (including property taxes and employers' SSCs) and also
remitting a further 45.3% of total tax revenue on behalf of others (see Figure 15).5 Increased non-
standard work will mean that more small businesses and individual filers will be remitting tax to
tax administrations, raising compliance burdens for tax administrations and taxpayers. This may
also reduce the amount of third-party reporting, which could exacerbate tax evasion (OECD,
2017[67]; OECD, 2015[66]).
Figure 15. Legal remittance responsibility and legal tax liability by business, % of total taxation,
2014
Source: (Milanez, 2017[68]).
90. While any shift towards more non-standard work could lead to a decline in third-
party reporting, it is possible that tax administrations will be able to require the provision of data
from new categories of economic actors. For example, the use of data could extend to sourcing
information on non-standard workers from online platforms, which could aid tax
administrations in their efforts to collect taxes. This could be facilitated by legal requirements
on platforms to report payment and identification data of platform users to tax administrations.
Domestic legal requirements may not be effective where the platform is located in a jurisdiction
other than the jurisdiction of the non-standard worker, which may require enhanced international
cooperation (OECD, 2018[69]).
5 These figures are unweighted averages across 24 OECD countries (Milanez, 2017[68]).
0%
25%
50%
75%
100%
Legal remittance responsibility (tax remittance by business on behalf of others) Legal tax liability (tax remittance by business on behalf of capital owners)
Per
cent
age
of T
otal
Tax
Rev
enue
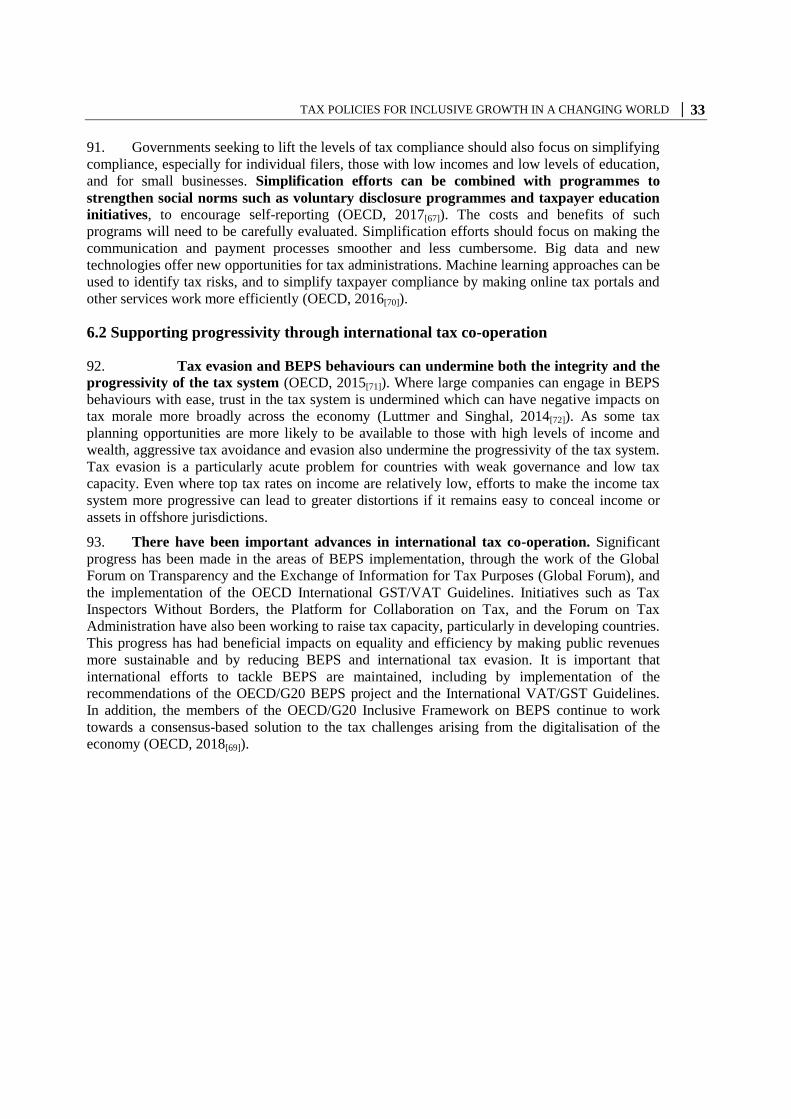
TAX POLICIES FOR INCLUSIVE GROWTH IN A CHANGING WORLD │ 33
91. Governments seeking to lift the levels of tax compliance should also focus on simplifying
compliance, especially for individual filers, those with low incomes and low levels of education,
and for small businesses. Simplification efforts can be combined with programmes to
strengthen social norms such as voluntary disclosure programmes and taxpayer education
initiatives, to encourage self-reporting (OECD, 2017[67]). The costs and benefits of such
programs will need to be carefully evaluated. Simplification efforts should focus on making the
communication and payment processes smoother and less cumbersome. Big data and new
technologies offer new opportunities for tax administrations. Machine learning approaches can be
used to identify tax risks, and to simplify taxpayer compliance by making online tax portals and
other services work more efficiently (OECD, 2016[70]).
6.2 Supporting progressivity through international tax co-operation
92. Tax evasion and BEPS behaviours can undermine both the integrity and the
progressivity of the tax system (OECD, 2015[71]). Where large companies can engage in BEPS
behaviours with ease, trust in the tax system is undermined which can have negative impacts on
tax morale more broadly across the economy (Luttmer and Singhal, 2014[72]). As some tax
planning opportunities are more likely to be available to those with high levels of income and
wealth, aggressive tax avoidance and evasion also undermine the progressivity of the tax system.
Tax evasion is a particularly acute problem for countries with weak governance and low tax
capacity. Even where top tax rates on income are relatively low, efforts to make the income tax
system more progressive can lead to greater distortions if it remains easy to conceal income or
assets in offshore jurisdictions.
93. There have been important advances in international tax co-operation. Significant
progress has been made in the areas of BEPS implementation, through the work of the Global
Forum on Transparency and the Exchange of Information for Tax Purposes (Global Forum), and
the implementation of the OECD International GST/VAT Guidelines. Initiatives such as Tax
Inspectors Without Borders, the Platform for Collaboration on Tax, and the Forum on Tax
Administration have also been working to raise tax capacity, particularly in developing countries.
This progress has had beneficial impacts on equality and efficiency by making public revenues
more sustainable and by reducing BEPS and international tax evasion. It is important that
international efforts to tackle BEPS are maintained, including by implementation of the
recommendations of the OECD/G20 BEPS project and the International VAT/GST Guidelines.
In addition, the members of the OECD/G20 Inclusive Framework on BEPS continue to work
towards a consensus-based solution to the tax challenges arising from the digitalisation of the
economy (OECD, 2018[69]).
34 │ TAX POLICIES FOR INCLUSIVE GROWTH IN A CHANGING WORLD
Figure 16. Expansion in the coverage of exchange of information networks
Source: Global Forum on Transparency and the Exchange of Information for Tax Purposes
94. The ongoing work of the Global Forum and the global agenda on tax transparency remain
important. The enhanced Exchange of Information on Request (EOIR) standard and the work
toward developing terms of reference for the evaluation of Automatic Exchange of Information
(AEOI) demonstrate progress on tax transparency (see Figure 16). There must be a continued
focus on furthering implementation of these standards through the Global Forum peer-
review process.
95. Continued work is required to ensure that information exchange is as
effective as possible and that tax authorities have the capacity to use the information being
exchanged to effectively tackle tax evasion. Policymakers also need to be vigilant in preventing
efforts to frustrate or circumvent new systems for exchanging information on tax matters and in
particular could consider putting in place mechanisms to disclose schemes designed for this
purpose.
96. Taxpayers may also respond to information exchange by appearing to shift
their tax residency. Some jurisdictions may offer means for taxpayers to shift residency with
ease, in ways that may hamper the effective taxation of these taxpayers. Such means can involve
providing incentives for taxpayers to relocate to another country, or they can involve providing
means for the taxpayers to appear to shift residency for tax purposes only, thereby allowing them
to conceal residency in other jurisdictions. Increased international cooperation may be required to
address efforts by some taxpayers to claim residency in low or no-tax jurisdictions for the
purposes of avoiding tax.
0
20
40
60
80
100
120
2000
3000
4000
5000
6000
7000
2009 2010 2011 2012 2013 2014 2015 2016 2017
Num
ber o
f jur
isdi
ctio
ns
Num
ber o
f rel
atio
nshi
ps
Bilateral relationships Relationships by MAC Jurisdictions joined MAC
TAX POLICIES FOR INCLUSIVE GROWTH IN A CHANGING WORLD │ 35
References
Adalet McGowan, M., D. Andrews and V. Millot (2017), “Insolvency Regimes, Technology
Diffusion and Productivity Growth : Evidence from Firms in OECD Countries”, OECD
Economics Department Working Papers, No. 1425, OECD Publishing, Paris,
http://dx.doi.org/10.1787/36600267-en.
[64]
Aghion, P. et al. (2017), “Tax Simplicity and Heterogeneous Learning”, NBER Working Paper,
http://dx.doi.org/10.3386/w24049.
[59]
Akgun, O., D. Bartolini and B. Cournède (2017), “The capacity of governments to raise taxes”,
OECD Economics Department Working Papers, No. 1407, OECD Publishing, Paris,
http://dx.doi.org/10.1787/6bee2df9-en.
[34]
Akgun, O., B. Cournède and J. Fournier (2017), “The effects of the tax mix on inequality and
growth”, OECD Economics Department Working Papers, No. 1447, OECD Publishing,
Paris, http://dx.doi.org/10.1787/c57eaa14-en.
[20]
Andrews, D., Criscuolo C. and P. Gal (2015), “Frontier Firms, Technology Diffusion and
Public Policy: Micro Evidence from OECD Countries”, OECD Productivity Working
Papers 2.
[81]
Arze del Granado, F., D. Coady and R. Gillingham (2012), “The Unequal Benefits of Fuel
Subsidies: A Review of Evidence for Developing Countries”, World Development,
Vol. 40/11, pp. 2234-2248, http://dx.doi.org/10.1016/J.WORLDDEV.2012.05.005.
[48]
Berlingieri, G., P. Blanchenay and Criscuolo C. (2017), “The Great Divergence(s)”, OECD STI
Policy Paper 39.
[62]
Birch Sørensen, P. (2010), 2010:4 Swedish Tax Policy: Recent Trends and Future Challenges |
ESO – Expertgruppen för studier i offentlig ekonomi,
https://eso.expertgrupp.se/rapporter/20104-swedish-tax-policy-recent-trends-and-future-
challanges/ (accessed on 02 May 2018).
[78]
Bivens, J. and L. Mishel (2013), “The Pay of Corporate Executives and Financial Professionals
as Evidence of Rents in Top 1 Percent Incomes”, The Journal of Economic Perspectives,
Vol. 27/3, pp. 57-77.
[52]
Blöchliger, H. (2015), “Reforming the Tax on Immovable Property: Taking Care of the
Unloved”, OECD Economics Department Working Paper.
[41]
Brown, J., G. Martinsson and B. Petersen (2017), “What promotes R and D? Comparative
evidence from around the world”, Research Policy, Vol. 46/2, pp. 447-462,
http://dx.doi.org/10.1016/J.RESPOL.2016.11.010.
[60]
Brown, J., G. Martinsson and B. Petersen (2013), “Law, Stock Markets, and Innovation”, The
Journal of Finance, Vol. 68/4, pp. 1517-1549, http://dx.doi.org/10.1111/jofi.12040.
[63]
Brys, B. (2011), “Making Fundamental Tax Reform Happen”, OECD Taxation Working Papers [15]
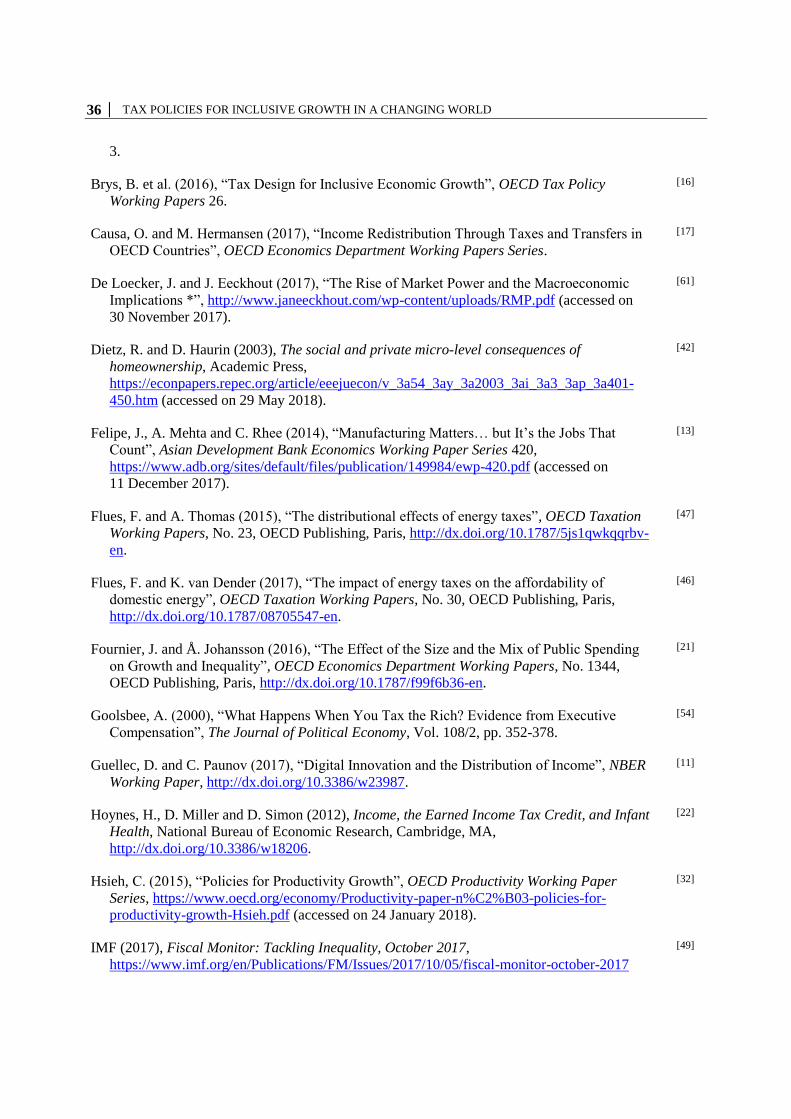
36 │ TAX POLICIES FOR INCLUSIVE GROWTH IN A CHANGING WORLD
3.
Brys, B. et al. (2016), “Tax Design for Inclusive Economic Growth”, OECD Tax Policy
Working Papers 26.
[16]
Causa, O. and M. Hermansen (2017), “Income Redistribution Through Taxes and Transfers in
OECD Countries”, OECD Economics Department Working Papers Series.
[17]
De Loecker, J. and J. Eeckhout (2017), “The Rise of Market Power and the Macroeconomic
Implications *”, http://www.janeeckhout.com/wp-content/uploads/RMP.pdf (accessed on
30 November 2017).
[61]
Dietz, R. and D. Haurin (2003), The social and private micro-level consequences of
homeownership, Academic Press,
https://econpapers.repec.org/article/eeejuecon/v_3a54_3ay_3a2003_3ai_3a3_3ap_3a401-
450.htm (accessed on 29 May 2018).
[42]
Felipe, J., A. Mehta and C. Rhee (2014), “Manufacturing Matters… but It’s the Jobs That
Count”, Asian Development Bank Economics Working Paper Series 420,
https://www.adb.org/sites/default/files/publication/149984/ewp-420.pdf (accessed on
11 December 2017).
[13]
Flues, F. and A. Thomas (2015), “The distributional effects of energy taxes”, OECD Taxation
Working Papers, No. 23, OECD Publishing, Paris, http://dx.doi.org/10.1787/5js1qwkqqrbv-
en.
[47]
Flues, F. and K. van Dender (2017), “The impact of energy taxes on the affordability of
domestic energy”, OECD Taxation Working Papers, No. 30, OECD Publishing, Paris,
http://dx.doi.org/10.1787/08705547-en.
[46]
Fournier, J. and Å. Johansson (2016), “The Effect of the Size and the Mix of Public Spending
on Growth and Inequality”, OECD Economics Department Working Papers, No. 1344,
OECD Publishing, Paris, http://dx.doi.org/10.1787/f99f6b36-en.
[21]
Goolsbee, A. (2000), “What Happens When You Tax the Rich? Evidence from Executive
Compensation”, The Journal of Political Economy, Vol. 108/2, pp. 352-378.
[54]
Guellec, D. and C. Paunov (2017), “Digital Innovation and the Distribution of Income”, NBER
Working Paper, http://dx.doi.org/10.3386/w23987.
[11]
Hoynes, H., D. Miller and D. Simon (2012), Income, the Earned Income Tax Credit, and Infant
Health, National Bureau of Economic Research, Cambridge, MA,
http://dx.doi.org/10.3386/w18206.
[22]
Hsieh, C. (2015), “Policies for Productivity Growth”, OECD Productivity Working Paper
Series, https://www.oecd.org/economy/Productivity-paper-n%C2%B03-policies-for-
productivity-growth-Hsieh.pdf (accessed on 24 January 2018).
[32]
IMF (2017), Fiscal Monitor: Tackling Inequality, October 2017,
https://www.imf.org/en/Publications/FM/Issues/2017/10/05/fiscal-monitor-october-2017
[49]
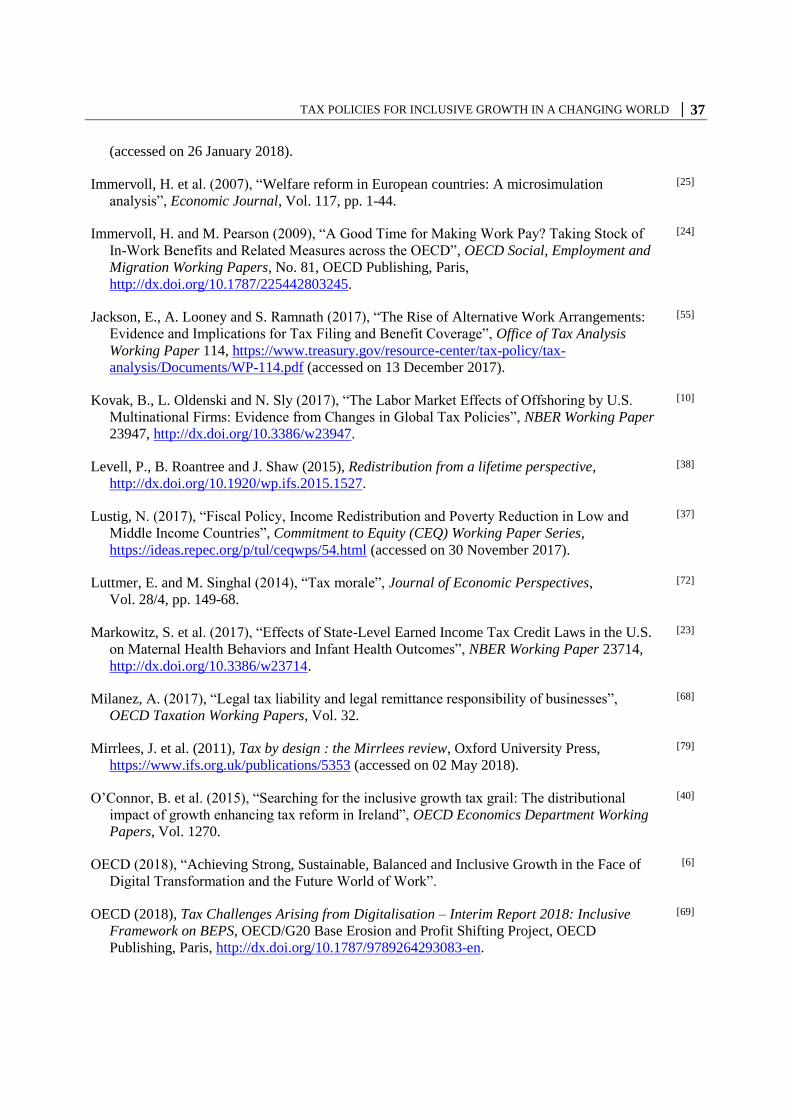
TAX POLICIES FOR INCLUSIVE GROWTH IN A CHANGING WORLD │ 37
(accessed on 26 January 2018).
Immervoll, H. et al. (2007), “Welfare reform in European countries: A microsimulation
analysis”, Economic Journal, Vol. 117, pp. 1-44.
[25]
Immervoll, H. and M. Pearson (2009), “A Good Time for Making Work Pay? Taking Stock of
In-Work Benefits and Related Measures across the OECD”, OECD Social, Employment and
Migration Working Papers, No. 81, OECD Publishing, Paris,
http://dx.doi.org/10.1787/225442803245.
[24]
Jackson, E., A. Looney and S. Ramnath (2017), “The Rise of Alternative Work Arrangements:
Evidence and Implications for Tax Filing and Benefit Coverage”, Office of Tax Analysis
Working Paper 114, https://www.treasury.gov/resource-center/tax-policy/tax-
analysis/Documents/WP-114.pdf (accessed on 13 December 2017).
[55]
Kovak, B., L. Oldenski and N. Sly (2017), “The Labor Market Effects of Offshoring by U.S.
Multinational Firms: Evidence from Changes in Global Tax Policies”, NBER Working Paper
23947, http://dx.doi.org/10.3386/w23947.
[10]
Levell, P., B. Roantree and J. Shaw (2015), Redistribution from a lifetime perspective,
http://dx.doi.org/10.1920/wp.ifs.2015.1527.
[38]
Lustig, N. (2017), “Fiscal Policy, Income Redistribution and Poverty Reduction in Low and
Middle Income Countries”, Commitment to Equity (CEQ) Working Paper Series,
https://ideas.repec.org/p/tul/ceqwps/54.html (accessed on 30 November 2017).
[37]
Luttmer, E. and M. Singhal (2014), “Tax morale”, Journal of Economic Perspectives,
Vol. 28/4, pp. 149-68.
[72]
Markowitz, S. et al. (2017), “Effects of State-Level Earned Income Tax Credit Laws in the U.S.
on Maternal Health Behaviors and Infant Health Outcomes”, NBER Working Paper 23714,
http://dx.doi.org/10.3386/w23714.
[23]
Milanez, A. (2017), “Legal tax liability and legal remittance responsibility of businesses”,
OECD Taxation Working Papers, Vol. 32.
[68]
Mirrlees, J. et al. (2011), Tax by design : the Mirrlees review, Oxford University Press,
https://www.ifs.org.uk/publications/5353 (accessed on 02 May 2018).
[79]
O’Connor, B. et al. (2015), “Searching for the inclusive growth tax grail: The distributional
impact of growth enhancing tax reform in Ireland”, OECD Economics Department Working
Papers, Vol. 1270.
[40]
OECD (2018), “Achieving Strong, Sustainable, Balanced and Inclusive Growth in the Face of
Digital Transformation and the Future World of Work”.
[6]
OECD (2018), Tax Challenges Arising from Digitalisation – Interim Report 2018: Inclusive
Framework on BEPS, OECD/G20 Base Erosion and Profit Shifting Project, OECD
Publishing, Paris, http://dx.doi.org/10.1787/9789264293083-en.
[69]
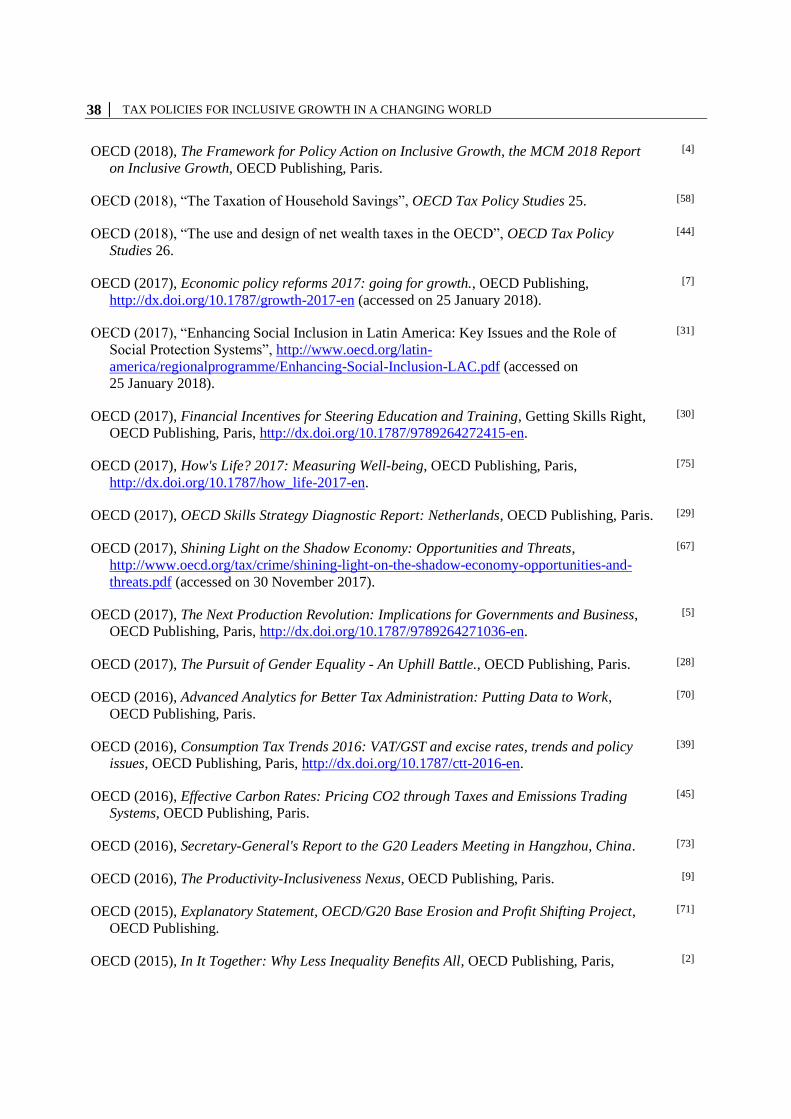
38 │ TAX POLICIES FOR INCLUSIVE GROWTH IN A CHANGING WORLD
OECD (2018), The Framework for Policy Action on Inclusive Growth, the MCM 2018 Report
on Inclusive Growth, OECD Publishing, Paris.
[4]
OECD (2018), “The Taxation of Household Savings”, OECD Tax Policy Studies 25. [58]
OECD (2018), “The use and design of net wealth taxes in the OECD”, OECD Tax Policy
Studies 26.
[44]
OECD (2017), Economic policy reforms 2017: going for growth., OECD Publishing,
http://dx.doi.org/10.1787/growth-2017-en (accessed on 25 January 2018).
[7]
OECD (2017), “Enhancing Social Inclusion in Latin America: Key Issues and the Role of
Social Protection Systems”, http://www.oecd.org/latin-
america/regionalprogramme/Enhancing-Social-Inclusion-LAC.pdf (accessed on
25 January 2018).
[31]
OECD (2017), Financial Incentives for Steering Education and Training, Getting Skills Right,
OECD Publishing, Paris, http://dx.doi.org/10.1787/9789264272415-en.
[30]
OECD (2017), How's Life? 2017: Measuring Well-being, OECD Publishing, Paris,
http://dx.doi.org/10.1787/how_life-2017-en.
[75]
OECD (2017), OECD Skills Strategy Diagnostic Report: Netherlands, OECD Publishing, Paris. [29]
OECD (2017), Shining Light on the Shadow Economy: Opportunities and Threats,
http://www.oecd.org/tax/crime/shining-light-on-the-shadow-economy-opportunities-and-
threats.pdf (accessed on 30 November 2017).
[67]
OECD (2017), The Next Production Revolution: Implications for Governments and Business,
OECD Publishing, Paris, http://dx.doi.org/10.1787/9789264271036-en.
[5]
OECD (2017), The Pursuit of Gender Equality - An Uphill Battle., OECD Publishing, Paris. [28]
OECD (2016), Advanced Analytics for Better Tax Administration: Putting Data to Work,
OECD Publishing, Paris.
[70]
OECD (2016), Consumption Tax Trends 2016: VAT/GST and excise rates, trends and policy
issues, OECD Publishing, Paris, http://dx.doi.org/10.1787/ctt-2016-en.
[39]
OECD (2016), Effective Carbon Rates: Pricing CO2 through Taxes and Emissions Trading
Systems, OECD Publishing, Paris.
[45]
OECD (2016), Secretary-General's Report to the G20 Leaders Meeting in Hangzhou, China. [73]
OECD (2016), The Productivity-Inclusiveness Nexus, OECD Publishing, Paris. [9]
OECD (2015), Explanatory Statement, OECD/G20 Base Erosion and Profit Shifting Project,
OECD Publishing.
[71]
OECD (2015), In It Together: Why Less Inequality Benefits All, OECD Publishing, Paris, [2]
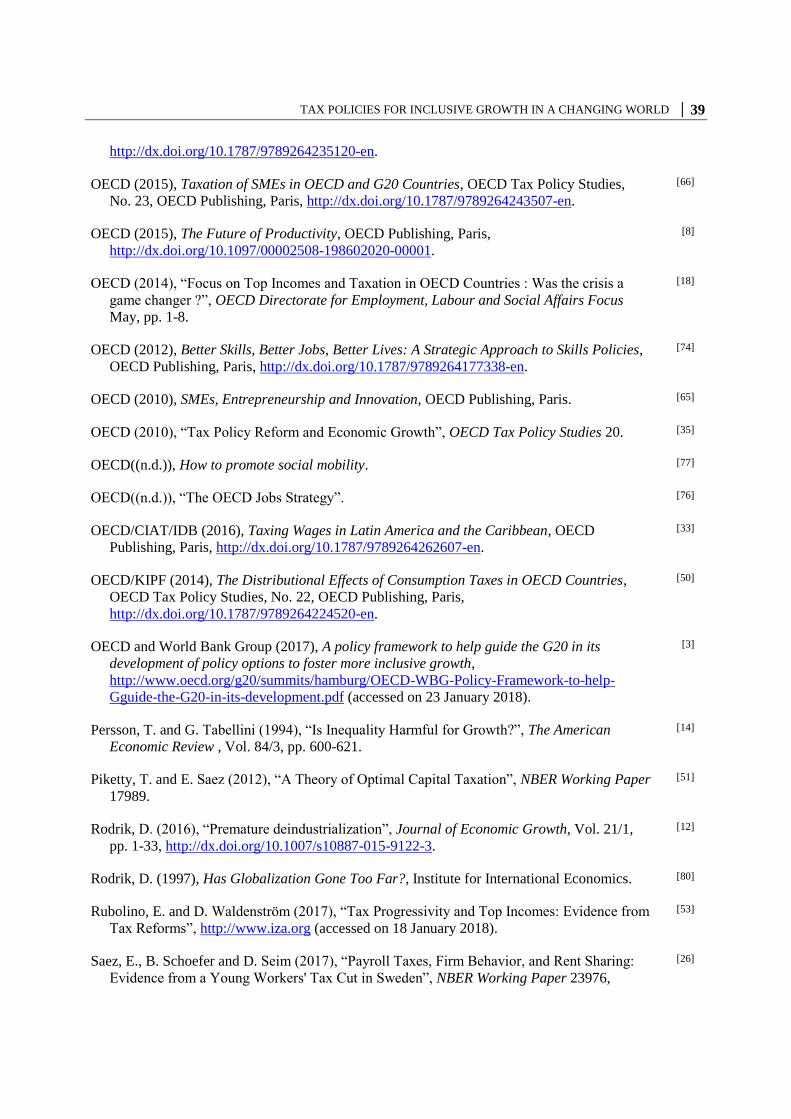
TAX POLICIES FOR INCLUSIVE GROWTH IN A CHANGING WORLD │ 39
http://dx.doi.org/10.1787/9789264235120-en.
OECD (2015), Taxation of SMEs in OECD and G20 Countries, OECD Tax Policy Studies,
No. 23, OECD Publishing, Paris, http://dx.doi.org/10.1787/9789264243507-en.
[66]
OECD (2015), The Future of Productivity, OECD Publishing, Paris,
http://dx.doi.org/10.1097/00002508-198602020-00001.
[8]
OECD (2014), “Focus on Top Incomes and Taxation in OECD Countries : Was the crisis a
game changer ?”, OECD Directorate for Employment, Labour and Social Affairs Focus
May, pp. 1-8.
[18]
OECD (2012), Better Skills, Better Jobs, Better Lives: A Strategic Approach to Skills Policies,
OECD Publishing, Paris, http://dx.doi.org/10.1787/9789264177338-en.
[74]
OECD (2010), SMEs, Entrepreneurship and Innovation, OECD Publishing, Paris. [65]
OECD (2010), “Tax Policy Reform and Economic Growth”, OECD Tax Policy Studies 20. [35]
OECD((n.d.)), How to promote social mobility. [77]
OECD((n.d.)), “The OECD Jobs Strategy”. [76]
OECD/CIAT/IDB (2016), Taxing Wages in Latin America and the Caribbean, OECD
Publishing, Paris, http://dx.doi.org/10.1787/9789264262607-en.
[33]
OECD/KIPF (2014), The Distributional Effects of Consumption Taxes in OECD Countries,
OECD Tax Policy Studies, No. 22, OECD Publishing, Paris,
http://dx.doi.org/10.1787/9789264224520-en.
[50]
OECD and World Bank Group (2017), A policy framework to help guide the G20 in its
development of policy options to foster more inclusive growth,
http://www.oecd.org/g20/summits/hamburg/OECD-WBG-Policy-Framework-to-help-
Gguide-the-G20-in-its-development.pdf (accessed on 23 January 2018).
[3]
Persson, T. and G. Tabellini (1994), “Is Inequality Harmful for Growth?”, The American
Economic Review , Vol. 84/3, pp. 600-621.
[14]
Piketty, T. and E. Saez (2012), “A Theory of Optimal Capital Taxation”, NBER Working Paper
17989.
[51]
Rodrik, D. (2016), “Premature deindustrialization”, Journal of Economic Growth, Vol. 21/1,
pp. 1-33, http://dx.doi.org/10.1007/s10887-015-9122-3.
[12]
Rodrik, D. (1997), Has Globalization Gone Too Far?, Institute for International Economics. [80]
Rubolino, E. and D. Waldenström (2017), “Tax Progressivity and Top Incomes: Evidence from
Tax Reforms”, http://www.iza.org (accessed on 18 January 2018).
[53]
Saez, E., B. Schoefer and D. Seim (2017), “Payroll Taxes, Firm Behavior, and Rent Sharing:
Evidence from a Young Workers' Tax Cut in Sweden”, NBER Working Paper 23976,
[26]
40 │ TAX POLICIES FOR INCLUSIVE GROWTH IN A CHANGING WORLD
http://dx.doi.org/10.3386/w23976.
Saez, E. and S. Stantcheva (2017), “A Simpler Theory of Optimal Capital Taxation”, Journal of
Public Economics, http://dx.doi.org/10.1016/J.JPUBECO.2017.10.004.
[57]
Slemrod, J. and C. Gillitzer (2014), “Insights from a Tax-systems Perspective”, CESifo
Economic Studies, Vol. 60/November 2013, pp. 1-31,
http://dx.doi.org/10.1093/cesifo/ift015.
[1]
Stantcheva, S. (2014), “Optimal Taxation and Human Capital Policies over the Life Cycle”,
Unpublished Working Paper.
[56]
Thomas, A. and P. O'Reilly (2016), “The Impact of Tax and Benefit Systems on the Workforce
Participation Incentives of Women”, OECD Tax Policy Working Papers, Vol. 29.
[27]
Turner, T. and H. Luea (2009), Homeownership, wealth accumulation and income status,
Academic Press,
https://econpapers.repec.org/article/eeejhouse/v_3a18_3ay_3a2009_3ai_3a2_3ap_3a104-
114.htm (accessed on 29 May 2018).
[43]
World Bank Group (2016), Taking on Inequality: Poverty and Shared Prosperity 2016,
https://openknowledge.worldbank.org/bitstream/handle/10986/25078/9781464809583.pdf
(accessed on 24 January 2018).
[19]
Yagan, D. (2015), “Capital tax reform and the real economy: The effects of the 2003 dividend
tax cut”, American Economic Review, Vol. 105/12, pp. 3531-63.
[36]