Embed Size (px)
Citation preview
1
Tax incentives and economic
growth in Romania
Research, Development and Innovation
2
Introduction
1 2The Importance of RDI in the Economy Romania in the European RDI
context
IntroRDI and Economic Growth 2Government support for private investments in RDI
RDI ExpenditureStatus of human resources assigned to RDIRDI performance indicatorsConclusions
4
5
7
8
12
13
15
3
3 4Tax incentives for research and development: form, application, challenges
Conclusions and recommendations
Types of tax incentives and their effectsR&D tax incentives in other countriesR&D tax incentives in Romania – application and challengesExamples of activities which could benefit from the research, development and innovation tax incentives
Encouraging RDI through fiscal-budgetary policiesFacilitating innovation
16
18
23
21
34
34
Annex
Embracing the science behind innovative thinking
35
GlossaryBibliography
40
41
4
As a consequence of the international financial crisis, economic growth has been and still is a prime target of governmental strategies of the European Union member states and also worldwide. In the new context of global competitiveness, technological progress is known to be one of the key elements of sustainable economic development, and the research, development and innovation (RDI) sector plays a leading part.
It is widely known that the support of the RDI sector is achieved through a mix of various policies and instruments, many complementing each other. Considering the difficulties encountered by many countries in providing an optimal level of public funding in this area, one of the frequently used policies is government encouragement of the private sector, from an investment and operational perspective, in order to develop RDI specific activities. Tax incentives are an efficient and useful instrument. These can be developed and applied to successfully contribute to the above-mentioned objective.
Without being an exhaustive analysis, this study aims to provide a brief picture of Romania’s performance in the RDI sector (also underlining its importance in the national economic framework), emphasizing the significant potential which tax incentives have, if applied in various specific areas. With this in mind, we will present for comparison the situation of some countries in the region, we will analyze
various practical models of implementation, and then conclude on the main directions to be followed in order to reach the envisaged target.
At an organizational level, from a Human Resources perspective, companies which focus on research, development and innovation can generate a positive influence on their RDI strategy and the results achieved by encouraging their own employees, at an individual level, to explore and adopt new ways of thinking. Discoveries in neuroscience, in particular in relation to neuroplasticity, and the way in which the former can help people to become innovative in their activity will be examined in this study.
We believe the timing for this analysis is the right one, given the recent amendments to tax law with a direct impact on this sector at national level, but also the significant imbalances found in Romania with regard to its specific evolution, particularly in the context of regional competitiveness at EU level.
We are confident that KPMG’s initiative will represent a landmark for future public debate on this subject, as well as an invitation to reflection, addressed to decision makers and also to those who actively take part in shaping the Romanian RDI sector.
Without being an exhaustive analysis, this study aims to provide a brief picture of Romania’s performance in the RDI sector.
“Introduction
5
Economic growth is based on three main components: a) accumulation of capital - including investments in real estate, equipment and human resources, b) an increase in population and hence in the work force, and c) technological progress1. In this context, two main theories have emerged, marking the importance of technological change in the framework of economic growth, supporting the idea that innovation is its main driver. The first theory, of neo-classical origin, perceives technological progress as an outside element, being supported only by the passing of time and not explained as a self-supporting process, the emphasis being placed on the intensity of capital accumulation. Robert M. Solow, Nobel Prize winner in Economics, is regarded as the author of this theory, called the exogenous growth model.
By comparison, there are models where economic growth is governed by technological change, and ideas/knowledge represent its driver. This is the basis of the endogenous growth model, whose significant representative is the American economist Paul Romer. In his reference works2, Romer claims that technological progress is the driver of economic growth and it takes place in the context of some investments particularly devoted to the RDI sector. Based on this, investments in technology, as well as in RDI expenditure, lead to an increase in productivity.
A model derived from the endogenous growth theory was developed by Aghion and Howitt in 19903, based on the well-known concept of “creative destruction” coined by Schumpeter (1934). The model claims
that research performance can have an impact on the economy in its entirety. Thus, economic growth is the result of innovative activities, a qualified workforce and of productivity of research activities. These models suggest that investments in research and development lead to innovation and technological development due to human capital and accumulation of knowledge.
Another significant idea to emerge from the model of endogenous growth is that in order to benefit from the development of scientific ideas, significant investments and resources are necessary. Thus, at firm level, there will be an incentive to invest in RDI when the prospects of profit maximization are met. Consequently, by increasing the profitability of research and development activities, private investments also increase and innovating processes are boosted, leading to higher total productivity4.
Another important element of the theory discussed is the endogeneity of the GDP growth rate. Thus, the production and the associated performance cannot be explained exclusively by means of physical capital elements, such as real estate or machinery. In this equation, elements belonging to human capital or RDI activities also emerge. The development of the latter plays an important role in the new models of economic growth because it ensures the so-called spillover effect. Thus, the knowledge resulting from RDI activities represents the foundation of innovation which, in turn, contributes to the creation of new products and services, cost reduction or quality improvement.
The Importance of RDI Activities in the Economy
RDI and Economic Growth
1. Todaro, M. P. (1997). Economic Development 6th Edition, New York;2. Romer, P. M. (1990). Endogenous technological change. Journal of political Economy, 98 (5, Part 2), S71-S102;3. Aghion, P., & Howitt, P. (1990). A model of growth through creative destruction (No. w3223). National Bureau of
Economic Research;4. Grossman, G.M., Helpman, E. (1991). Innovation and Growth in the Economy. MIT Press, Cambridge, MA;
6
5. Ulku, H. (2004). P.S. (2000). R&D, Innovation, and Economic Growth: An Empirical Analysis. IMF Working Paper, WP/04/185;
6. Zachariadis, M. (2004). R&D R&D-induced Growth in the OECD? Review of Development Economics, 8(3), 423-439;7. Griliches, Z., 1995. R&D and productivity. In: Stoneman, P. Ed.., Handbook of Industrial Innovation. Blackwell, London;8. Jones, C. I., & Williams, J. C. (1998). Measuring the social return to R&D. The Quarterly Journal of Economics, 113(4),
1119-1135;9. Pessoa, A. (2010). R&D and economic growth: How strong is the link? Economic Letters 107, 152-154;10. Chou, Y.K. (2002). The Australian growth experience (1960-2000), R&D based, human capital-based or just steady state
growth? Research Paper No. 855. Department of Economics, University of Melbourne;11. Kwack, S. Y., & Lee, Y. S. (2006). Analyzing the Korea’s growth experience: The application of R&D and human capital
based growth models with demography. Journal of Asian Economics, 17(5), 818-831 & Jin, J. C., (2009). Economic research and economic growth: Evidence from East Asian economies. Journal of Asian Economics, 20, 150–155.doi: 10.1016/j.asieco.2008.12.002;
12. Kim, L.W. (2011). The Economic Growth Effect of R&D Activity in Korea. Korea and the World Economy, 12(1), 25-44;13. Peng, L. (2010). Study on Relationship between R&D Expenditure and Economic Growth of China. Proceedings of the
7th International Conference on Innovation & Management, 1725-1728;14. Sadraoui, T., Ali, T.B., Deguachi, B. (2014). Economic Growth and International R&D Cooperation: A Panel Granger
Causality Analysis. International Journal of Econometrics and Financial Management, 2(1), 7-21;15. Goel, R.K., Payne, J.E., & Ram. (2008). R&D expenditures and U.S. economic growth: A disaggregated approach.
Journal of Policy Modeling, 30, 237–250. doi: 10.1016/j.jpolmod.2007.04.008;
The positive relationship between RDI investments and economic growth has been proven over time by numerous empirical contributions. We offer some examples:
A study conducted in 20045 analyzed data on RDI activities and patents from 30 countries, during the period 1981–1997. The results confirmed a positive relationship between GDP per capita and innovation, endorsing the conclusions of previous research6, which tested an identical relationship between expenditure and RDI, patenting activity and productivity. Also, Griliches (1995)7 proves the role of RDI as an important source of growth, in the context of externalities generated by this activity, and Jones and Williams (1998)8 mention that RDI activities generate significant social effects and represent an important part of economic development and growth.
The connection between RDI and economic growth is normally based on the structure of a linear model, supported by the idea that the activities conducted by research lead to the creation of new ideas, which later on become new products, in connection to which production processes are being created and for which marketing plans are being developed, finally leading to the creation and support of relevant market demand. This model benefits from the empirical support of the positive correlation between RDI expenditure and the level of economic development measured by GDP per capita. Nonetheless, the connection between the intensity of RDI and economic growth is not perfect, given that a series of other important elements contribute to the development of an economy. Given this background, Pessoa (2010)9 draws attention on the fact that a correlation does not imply causation.
A study applied to the Australian economy was prepared in 200210 with the intention of researching
RDI’s contribution to economic growth. Using data from the period 1960-2000, the model created shows that constant and long-term economic development at national level was supported by the research carried out at the local but also global level, as well as by the development of innovative ideas.
The economy of South Korea was also a subject of research in this area11. Using data from 1971 to 2002, the results were revealing, in the sense that RDI represents, together with other indicators, a significant driver for long-term economic growth, endorsing the endogenous growth theory. Public and private investments were identified as representing major contributors to the development and support of innovation. Another empirical study focused on RDI’s effects in South Korea concluded that the classical production factors, work and capital, contribute 65% to economic growth, whilst RDI has an impact of around 35%12.
More specific results are presented in a study on China’s economy, which concludes that for each growth of 1% in RDI expenditure, GDP increases by 0.92%13. Moreover, the causal relationship was tested positive between cooperation in the RDI sector and economic growth in 32 developed countries, based on data covering the period 1970–201214. The connection with RDI was also checked for the US economy. For instance, a study from 200815 based on data from the last 50 years revealed a strong link between economic growth and RDI activities in the defense sector, as well as those undertaken in the private sector, concluding on the need to increase investments in these areas.
7
According to the OECD, RDI expenditure is a key indicator of countries’ innovative efforts16. Such activities mainly cover three areas: fundamental research, applied research and experimental development. The indicator used for measuring the intensity of specific activities is the total expenditure on research and development activity as a % of GDP. It represents a percentage of the expenses made by all sectors of performance in a country for research and development activities, divided by the gross domestic product (GDP) and it shows the level of financial resources assigned to research and development activities17. This indicator has the advantage of also allowing international comparisons, which is a very important aspect in the context of highlighting the role which has been played by RDI in the economic growth of nations.
The main argument in favor of government support for research conducted by the private sector is related to an issue specific to the results of research and development activities, i.e. the appropriability of the results. Normally, ideas/knowledge are non-rival goods, which means that they can be used by multiple persons at the same time, with no decrease in their value. Nonetheless, the economic capitalization of ideas can be exposed to a degree of rivalry by value (i.e. the value obtained by accessing a certain idea/piece of information decreases proportionally to the number of persons who have access to the same idea). Thus, the willingness to pay for a certain idea/piece of knowledge is directly influenced by the level of public exposure of the idea in question18. This inconvenience is highly relevant in
the case of RDI results, as it represents a high risk for those involved in the process, only partially covered by the intellectual property rights system.
Another element implicitly affecting the private sector’s involvement in the RDI sector is the funding difficulties of the various process phases. Part of these difficulties is associated with the informational asymmetries in transaction relations, a feature which belongs to the intangible nature of ideas/knowledge resulting from RDI activities (the owners of newly-created ideas/knowledge are reluctant to fully publicize the results of their research, taking into consideration the risks of reproducibility, and in such cases the potential funders cannot undertake the decision to invest, without being able to assess the full specifications of the intellectual asset being sold).
Thus, in order to stimulate private investments in RDI, at international level, governments assign more and more public resources as subsidies or tax incentives. The role of this type of support has a double focus: on the one hand, it decreases the cost of external financing necessary for RDI projects and, on the other, it gains the trust of investors and of the market in relation to a certain project, signaling its trustworthiness. We will offer certain details below on the public/private structure of funding for RDI activities, as well as the performance achieved at EU level and in Romania.
Government support for private investments in RDI
16. OECD Factbook 2013, Science and Technology, OECD, 2013;17. RomanianNationalInstituteofStatistics,http://www.insse.ro/cms/files/Web_IDD_BD_ro/O10/O10_1-Cheltuieli%20
totale%20cu%20activitati%20de%20cercetare-dezvoltare%20ca%20%25%20din%20PIB.doc;18. Iancu,Victor,(2014)„ProprietateaIndustrialășiMarketingulProducțieiIntelectuale”,EdituraAcademieiRomâne;
8
The results of the above-mentioned research point to the significant role which this sector, and its performance, play in the context of economic growth, as well as the role of the government sector in supporting private investments in this area. For the rest of this chapter, we intend to make a
short presentation of Romania’s positioning in the European RDI context, from several perspectives: 1. Investments in the RDI sector and their structure, 2. Human resources involved and 3. Relevant performance indicators.
Romania in the European RDI context
The most important premise for the development of the RDI sector, a driver of innovation in any economy, is investments targeted at various relevant activities. Before a brief presentation of these cases, it is worth clarifying from the start that, at international level, there is no unitary tendency over the way in which countries decide to support/invest in RDI.
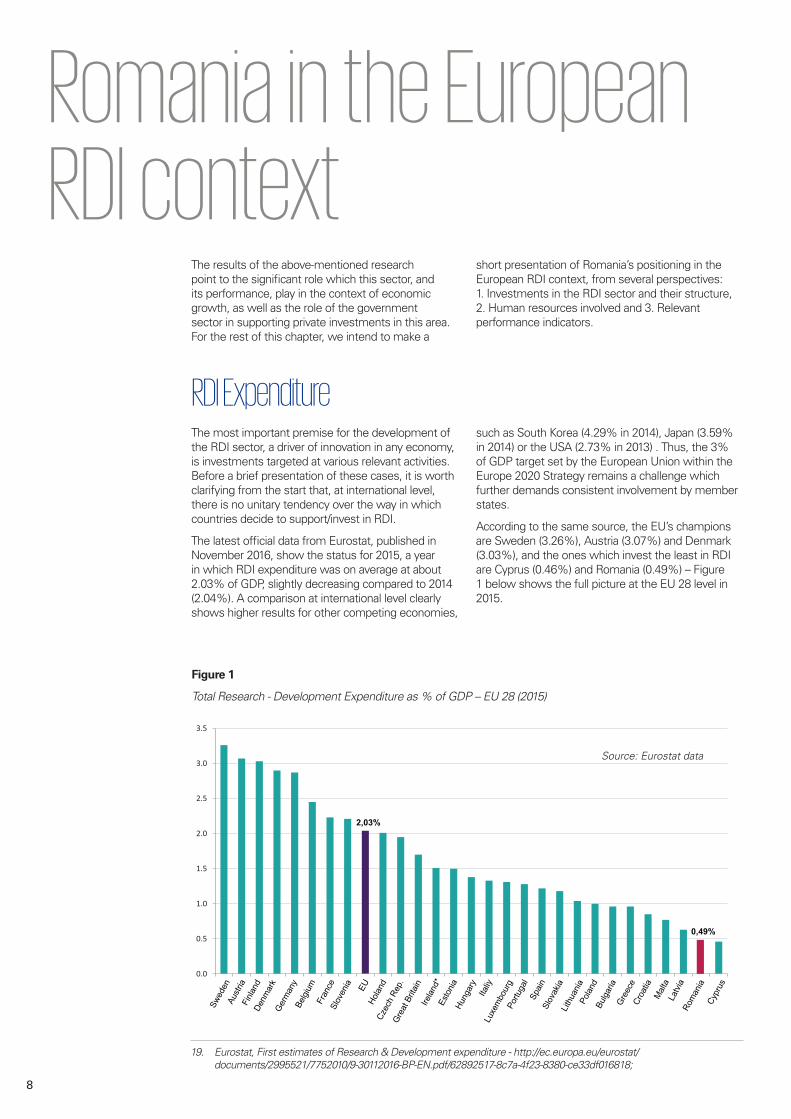
The latest official data from Eurostat, published in November 2016, show the status for 2015, a year in which RDI expenditure was on average at about 2.03% of GDP, slightly decreasing compared to 2014 (2.04%). A comparison at international level clearly shows higher results for other competing economies,
such as South Korea (4.29% in 2014), Japan (3.59% in 2014) or the USA (2.73% in 2013) . Thus, the 3% of GDP target set by the European Union within the Europe 2020 Strategy remains a challenge which further demands consistent involvement by member states.
According to the same source, the EU’s champions are Sweden (3.26%), Austria (3.07%) and Denmark (3.03%), and the ones which invest the least in RDI are Cyprus (0.46%) and Romania (0.49%) – Figure 1 below shows the full picture at the EU 28 level in 2015.
Figure 1
TotalResearch-DevelopmentExpenditureas%ofGDP–EU28(2015)
RDI Expenditure
19. Eurostat, First estimates of Research & Development expenditure - http://ec.europa.eu/eurostat/documents/2995521/7752010/9-30112016-BP-EN.pdf/62892517-8c7a-4f23-8380-ce33df016818;
0.0
0.5
1.0
1.5
2.0
2.5
3.0
3.5
2,03%
0,49%
Swed
enAu
stria
Denm
ark
Finla
nd
Germ
any
Belgi
umFr
ance
Slov
enia EU
Holan
dCz
ech
Rep.
Grea
t Brit
ainIre
land*
Esto
niaHu
ngar
yIta
liyLu
xem
bour
gPo
rtuga
lSp
ainSl
ovak
iaLit
huan
iaPo
land
Bulga
riaGr
eece
Croa
tiaM
alta
Latvi
aRo
man
iaCy
prus
Source: Eurostat data
9
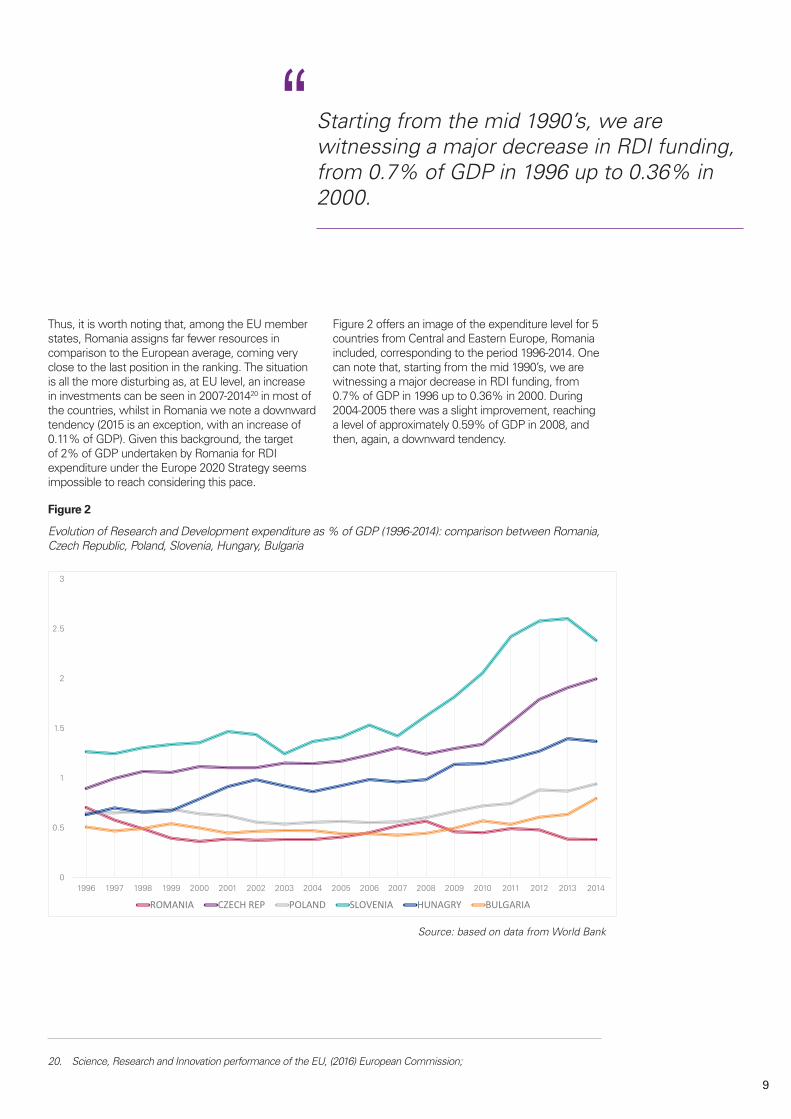
Thus, it is worth noting that, among the EU member states, Romania assigns far fewer resources in comparison to the European average, coming very close to the last position in the ranking. The situation is all the more disturbing as, at EU level, an increase in investments can be seen in 2007-201420 in most of the countries, whilst in Romania we note a downward tendency (2015 is an exception, with an increase of 0.11% of GDP). Given this background, the target of 2% of GDP undertaken by Romania for RDI expenditure under the Europe 2020 Strategy seems impossible to reach considering this pace.
Figure 2 offers an image of the expenditure level for 5 countries from Central and Eastern Europe, Romania included, corresponding to the period 1996-2014. One can note that, starting from the mid 1990’s, we are witnessing a major decrease in RDI funding, from 0.7% of GDP in 1996 up to 0.36% in 2000. During 2004-2005 there was a slight improvement, reaching a level of approximately 0.59% of GDP in 2008, and then, again, a downward tendency.
Figure 2
EvolutionofResearchandDevelopmentexpenditureas%ofGDP(1996-2014):comparisonbetweenRomania,Czech Republic, Poland, Slovenia, Hungary, Bulgaria
20. Science, Research and Innovation performance of the EU, (2016) European Commission;
Starting from the mid 1990’s, we are witnessing a major decrease in RDI funding, from0.7%ofGDPin1996upto0.36%in2000.
“
0
0.5
1
1.5
2
2.5
3
1996 1997 1998 1999 2000 2001 2002 2003 2004 2005 2006 2007 2008 2009 2010 2011 2012 2013 2014
ROMANIA CZECH REP POLAND SLOVENIA HUNAGRY BULGARIA
Source: based on data from World Bank
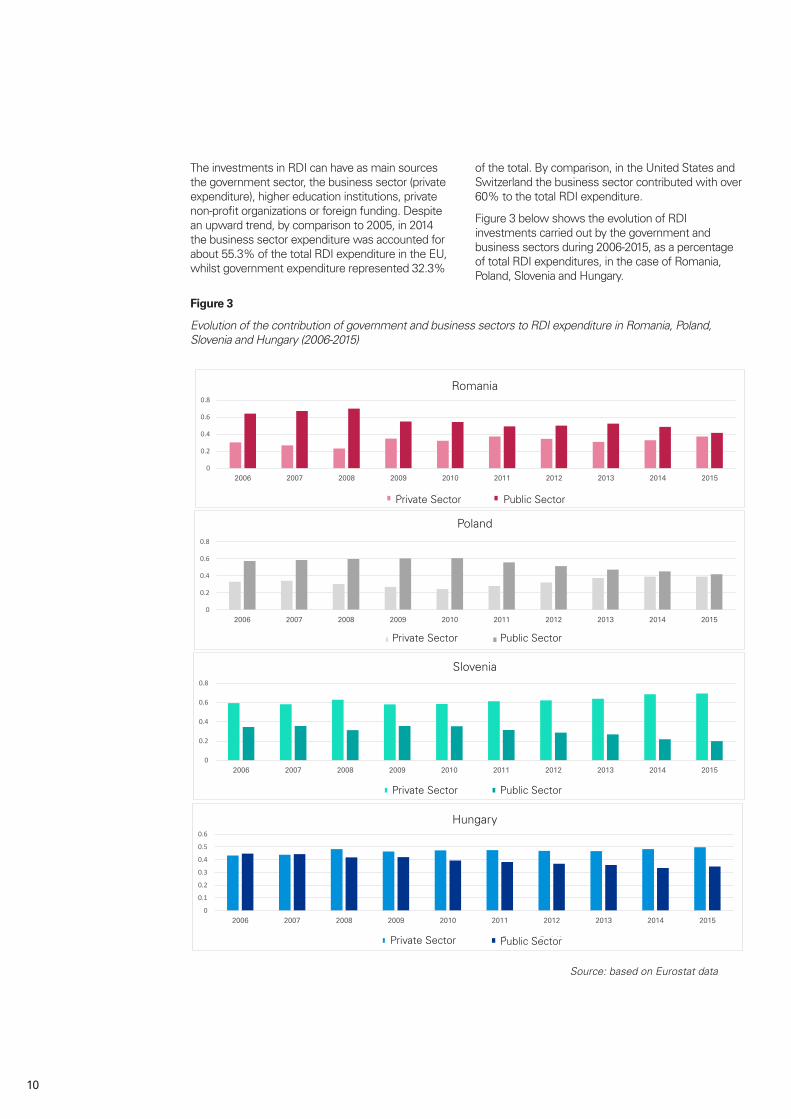
10
The investments in RDI can have as main sources the government sector, the business sector (private expenditure), higher education institutions, private non-profit organizations or foreign funding. Despite an upward trend, by comparison to 2005, in 2014 the business sector expenditure was accounted for about 55.3% of the total RDI expenditure in the EU, whilst government expenditure represented 32.3%
of the total. By comparison, in the United States and Switzerland the business sector contributed with over 60% to the total RDI expenditure.
Figure 3 below shows the evolution of RDI investments carried out by the government and business sectors during 2006-2015, as a percentage of total RDI expenditures, in the case of Romania, Poland, Slovenia and Hungary.
Figure 3
Evolution of the contribution of government and business sectors to RDI expenditure in Romania, Poland, Slovenia and Hungary (2006-2015)
0
0.2
0.4
0.6
0.8
2006 2007 2008 2009 2010 2011 2012 2013 2014 2015
România
Business Sector Governmental SectorSectorul PublicSectorul Privat
0
0.2
0.4
0.6
0.8
2006 2007 2008 2009 2010 2011 2012 2013 2014 2015
Polonia
Business Sector Governmental SectorSectorul PublicSectorul Privat
0
0.2
0.4
0.6
0.8
2006 2007 2008 2009 2010 2011 2012 2013 2014 2015
Slovenia
Business Sector Governmental SectorSectorul PublicSectorul Privat
0
0.1
0.2
0.3
0.4
0.5
0.6
2006 2007 2008 2009 2010 2011 2012 2013 2014 2015
Ungaria
Business Sector Governmental SectorSectorul PublicSectorul Privat
Source: based on Eurostat data
Romania
Poland
Slovenia
Hungary
Private Sector Public Sector
Private Sector Public Sector
Private Sector Public Sector
Private Sector Public Sector
11
One can observe that the structure of RDI expenditure in Romania, considering the funding source, is mainly dependent on the government sector. In 2015, we identify an almost balanced structure, with a share of 41.7% of the total expenditure resulting from public funds and 37.3% belonging to the business sector. A similar structure is also encountered in Poland, but we must take into consideration that this country assigns 1% of GDP to the RDI sector (data for 2015). We note here that the target of 2% of GDP undertaken by Romania, to be met until 2020, is expected to be equally split between the public and business sectors, in terms of funding source, both with 1% of GDP.
An opposite structure, in which private sector funding represents the majority, is encountered in countries such as Slovenia or Hungary, with 69.2% and 50% private funding respectively. In such cases, the high percentage of GDP assigned to RDI must also be emphasized, i.e. 2.21% (Slovenia) and 1.38% (Hungary). Significant progress in private sector funding is also observed in other East European countries such as Bulgaria or Slovakia.
Without any doubt, the decision of countries to invest in RDI depends on a series of factors which are related, among others, to their macro-economic performance, the structure of the industrial sector, commercial performance, etc. However, all these outline how a country perceives the role which innovation, and hence research and development, play within its medium and long-term development strategy.
Taking into consideration Romania’s status as the country with the highest economic growth in the EU over the last few years, and also taking into consideration the core role that technological progress plays in the context of national economies’ competitiveness, at the regional and global level, the failure of government policy to give sufficient priority to this sector is difficult to understand. This observation must also be interpreted in a context where the RDI sector is seen as fuelling sustainable economic growth, in opposition to other development incentives which are less „healthy” in the long run, such as consumption.
12
A highly relevant indicator of innovation and RDI processes is the number of employees assigned to these types of activities, starting from the idea that researchers are the backbone of research and development systems. Researchers are professionals involved in the creation and design of new knowledge, products, processes, methods and systems, who are also directly involved in management processes21. There are significant studies that have tested the positive correlation between the number of researchers in the RDI sector and the growth rate of innovative results, as well as a reverse determination, in the sense that the investments made in innovation have led, aside from the increase in productivity, to significant increases in employment rates22.
According to the European Commission, the share of researchers to the total number of jobs is an indicator of how the economy is structured, showing its level of development, being strongly correlated to producing innovative results at country level. Thus, countries with high shares tend to be also leaders in innovation.23
According to data provided by Eurostat, in the European Union, the above-mentioned share is rising, in 2015 reaching 1.82 million researchers employed full-time, which represents an increase of 32.2% by comparison with the situation 10 years ago. During 2005-2015, in countries such as Portugal or Ireland, the number of researchers has doubled, whilst the Nordic countries have the highest share of employed researchers, the business enterprise sector being the largest employer (as is the case in Denmark, Finland and Sweden). Eurostat figures show that in 2015, in the EU-28, the business enterprise sector employed 49% of researchers, the higher education sector 39%, whilst the government sector employed only 12%. In countries such as Sweden, Austria or France, the business enterprise sector employed over 60% of researchers in 2014. Thus, one can note that the role that the business sector plays in this area is a key one, just as it is for the funding sources of RDI expenditure.
The opposite is true for Romania, Cyprus, Bulgaria, Croatia and Latvia, with low percentages particularly with respect to employees in the private sector (business environment). For instance, in 2015 the government sector was employing the largest share of researchers in Romania (38%), the business enterprise sector 33% and the higher education sector 28%24. Thus, this share of 38% in Romania is the highest in terms of researchers employed by the public sector in the entire European Union25.
In the same context, another relevant indicator is human resources in science and technology. It offers information about the supply and demand of professionals with relevant specializations in the area of science and technology. Over 76 million employees were working in this area in 2015, representing nearly 31.5% of the active work force in the European Union. While in countries such as Sweden or Denmark, the number of employees hired in science and technology represented over 40% of the total workforce, Romania has the lowest percentage, being the only EU member with less than 20%, i.e. 19.1%.
From the above we can derive at least two conclusions: 1. The countries which invest in RDI are in general those that also provide the best conditions for creating and maintaining jobs in the research, science and technology sectors and 2. Romania ranks among the last in the EU, in this respect, with obvious negative effects.
So far we have talked about the importance of public and private expenditure in RDI activities, as well as the role which researchers are playing in this context. It is now time to briefly analyze the way in which the aspects above affect the performance of research, development and of innovation, generally. Thus, the section below brings into discussion the relevant results of a complex statistical instrument intended to measure the degree of innovation at country level.
Status of human resources assigned to RDI
21. Griffith,R.,Redding,S.,&VanReenen,J.(2004).MappingthetwofacesofR&D:ProductivitygrowthinapanelofOECD industries. Review of economics and statistics, 86(4), 883-895;
22. Pianta, M. (1998), New technology and Jobs. In J. Michie, and J.G. Smith, Globalization, Growth and Governance: Creating an Innovative Economy, (p.83). Oxford University Press, United States;.
23. Science, Research and Innovation performance of the EU, (2016) European Commission;24. Romanian National Statistics Institute, http://www.insse.ro/cms/ro/content/activitatea-de-cercetare-dezvoltare-anul-2015;25. Eurostat,http://ec.europa.eu/eurostat/statistics-explained/index.php/R_%26_D_personnel;
13
In the first section of this paper we noticed that the performance of the RDI sector represents an important factor in the complex equation of economic growth, at country level. Aside from the theories formulated in the past, we saw that the results of numerous empirical studies prove more or less strong ties between the intensity and the quality of RDI activities, on the one hand, and economic development, on the other.
But how can we test the connection between the efforts engaged to support RDI activities at a country’s level and the latter’s performance at the economic level, materialized especially through innovative results? This is a question the European Commission is trying to answer through Eurostat which, in an attempt to measure the degree of innovation in the 28 member states, produces an annual analysis based on a complex composite index, based in turn on 25 indicators. This is the European Innovation Scoreboard („EIS”), a remarkable statistical analysis effort which is made public annually in an extensive descriptive report.
What makes EIS the most advanced instrument for measuring the performance of innovation at the EU level and that of the member states, is the broad area of the indicators used, structured under three types: 1. Innovation facilitators (which include, among others, indicators concerning human resources, research systems and funding situation), 2. Firm related indicators (such as RDI private investment or intellectual assets produced) and 3. Result indicators (which outline the performance of innovation, such as high technology exports or the degree by which companies produce organizational or marketing innovations). The reason why we bring this instrument into discussion, in the context of analyzing the Romanian RDI sector, is the inclusion of this last type of indicator (i.e. results indicator) in the EIS index.
As per the EIS, starting from 2008 and up to now, the performance of the European Union in innovation has generally improved, especially for 21 member states, out of which the most spectacular increases were achieved by Latvia and Malta. Nonetheless, 7 countries recorded negative performances, the 2016 edition drawing attention in particular to one country that achieved the most significant negative growth rate, and that is Romania26.
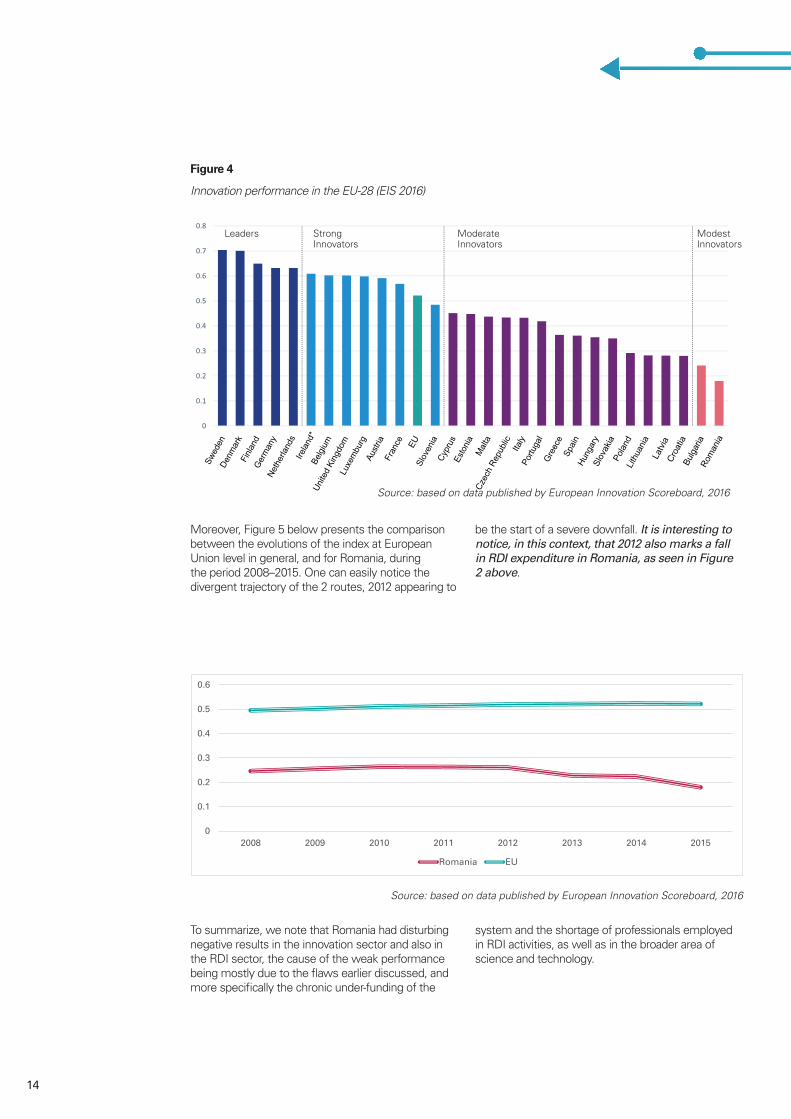
The EIS divides the EU countries into four categories, depending on the results achieved in the index, the countries being thus modest, moderate, strong, or leading innovators. While during the period analyzed, Romania was constantly ranked in the category of modest innovators, there were also times when the progress made was encouraging, whilst other countries had achieved far lower results, such as Bulgaria, Latvia or Lithuania. The 2016 EIS edition reveals yet another negative statistic for Romania, i.e. 2016 was the second consecutive year when the country was mentioned as the most modest EU innovator, ranking last. Figure 4 reflects this situation.
It can be easily noticed that the European innovation leaders are member states with the highest RDI expenditure (Sweden, Denmark, Finland and Germany), the correlation being obvious also in the case of the modest innovators, such as Romania.
Performance indicators of RDI activities
26. European Innovation Scoreboard, (2016), European Commission, http://ec.europa.eu/growth/industry/innovation/facts figures/scoreboards_es;
14
Moreover, Figure 5 below presents the comparison between the evolutions of the index at European Union level in general, and for Romania, during the period 2008–2015. One can easily notice the divergent trajectory of the 2 routes, 2012 appearing to
be the start of a severe downfall. It is interesting to notice, in this context, that 2012 also marks a fall in RDI expenditure in Romania, as seen in Figure 2 above.
To summarize, we note that Romania had disturbing negative results in the innovation sector and also in the RDI sector, the cause of the weak performance being mostly due to the flaws earlier discussed, and more specifically the chronic under-funding of the
system and the shortage of professionals employed in RDI activities, as well as in the broader area of science and technology.
Figure 4
Innovation performance in the EU-28 (EIS 2016)
0
0.1
0.2
0.3
0.4
0.5
0.6
0.7
0.8Leaders Strong
InnovatorsModerateInnovators
ModestInnovators
Swed
en
Austr
ia
Denm
ark
Finla
ndGe
rman
y
Belgi
um
Fran
ce
Slov
eniaEU
Neth
erlan
ds
Czec
h Re
publi
c
Unite
d Ki
ngdo
m
Irelan
d*
Esto
nia
Hung
ary
Italy
Luxe
mbu
rg
Portu
gal
Spain
Slov
akia
Lithu
ania
Polan
d
Bulga
ria
Gree
ce
Croa
tia
Malt
a
Latvi
a
Rom
ania
Cypr
us
Source: based on data published by European Innovation Scoreboard, 2016
0
0.1
0.2
0.3
0.4
0.5
0.6
2008 2009 2010 2011 2012 2013 2014 2015
Romania EU
Source: based on data published by European Innovation Scoreboard, 2016
·TECHNOLOGIC·
BACKGROUND
·TECHNOLOGIC·
BACKGROUND
15
Source: based on data published by European Innovation Scoreboard, 2016
·TECHNOLOGIC·
BACKGROUND
·TECHNOLOGIC·
BACKGROUND
One of the main shortcomings of the national RDI systems is the lack of/insufficiency of funding of the relevant activities. Becoming more and more aware of the importance of supporting RDI activities, particularly as a consequence of the effects of the global economic crisis, the EU states increasingly use instruments to stimulate private investments in this area, either direct (such as grants, loans or by public procurement) or indirect (such as tax incentives). Successful examples include Slovenia, Belgium, Ireland, Hungary, France, Portugal and Austria. Except for Estonia, in all countries mentioned above, tax incentives play a key role, and in France, Belgium, Ireland, Portugal and Holland, the value of tax facilities is even higher than that of direct funding. It is worth mentioning, in this context, that government investments in these countries have also reached high values.
In the following sections we will analyze the tax incentives which can be considered by the public sector to support an increase of investments by the business sector in RDI, as well as for the development of the sector and of activities in science and technology, in general. Mention must be made that this study is not intended to be an exhaustive analysis of the mix of policies/measures necessary for the development of the RDI sector, as there are numerous, extensive papers which highlight the situation of under-funding issues, as well as the need to use various supporting instruments (economic, social, political) to contribute to this strategic objective.
Conclusions
16
As highlighted in the previous chapters, research and development (R&D) investments are an important factor which determines the growth of competitiveness, boosts employment and compensates for market failures, ultimately contributing to economic development and growth. Consequently, the governments of different countries have adopted various measures to support and promote research and development activities within
their jurisdictions, both by providing grants and by offering tax incentives.
In this chapter, we will first take a look at the effect the tax incentives have on R&D investments and on the development of this type of activity. Then, we will focus on the tax incentives available in Romania and their effectiveness.
Tax incentives for research and development: form, application, challenges
Recent studies27 have shown that each type of tax incentive used by governments generates a certain type of effect over time. This has led to an increased interest in the impact they may have on the development of R&D activities and the growth of investments in this area.
Depending on the effects of the different types of tax incentive, as shown by the various research studies28, governments are able to decide which kind of tax incentive is best suited to achieve the objectives set at a given time (e.g. increasing private investments in R&D, stimulating small innovative companies, or boosting skilled labor in a specific area), as they have the possibility to choose from a wide range of tax incentives. Among these we mention:
• Volume-based tax incentives (e.g. supplementary deductions for R&D expenses when determining the taxable profit, or exemption from corporate income tax for companies which carry out R&D activities) tend to favor large companies, with an established market presence, that have significant tax liabilities which can be reduced by applying the incentives. Given the above,
this type of incentive is appropriate when the objective is to increase the volume of private R&D investments, which are usually made by large companies, either local or multinational.
• Tax incentives focused on incremental growth of R&D activities (e.g. in the United States of America, where tax credits are granted after R&D expenses reach a predefined level) are used when the authorities target an increase in research and development activities for already existing players on the market. The main reason for introducing these incentives has been to minimize subsidies for R&D activities that would have been carried out by companies even in the absence of state support. However, in practice, these schemes are difficult to define and use, and have high costs both for governments and for the beneficiaries of these incentives. As a result, this type of tax incentive has been used more infrequently.
• Tax incentives targeting certain categories of organizations (e.g. generally, tax incentives for start-up companies or small and medium-
Types of tax incentives and their effects
27. Appelt,S.etal.(2016),“R&DTaxIncentives:Evidenceondesign,incidenceandimpacts”,OECDScience,TechnologyandIndustryPolicyPapers,No.32,OECDPublishing,Paris.http://dx.doi.org/10.1787/5jlr8fldqk7j-en;
28. Ibidem note 27;
17
sized enterprises fit into this category) are intended to encourage new entrants on the market or smaller companies, which are usually more innovative and more dynamic than large companies. However, in this case, depending on the pursued objective, attention must be paid to how these tax incentives are granted, so that actual savings are available for them to use, since these companies do not have large amounts of tax liabilities that could be reduced. In order to address this situation, some governments offer the possibility to carry forward the tax benefits or use various refund systems.
• In cases where there is a shortage of skilled labor, tax incentives for employees who carry out R&D activities may be the answer to attract and retain in the country workers with appropriate skills and knowledge. Relief on income tax and/or social security contributions related to the salaries of R&D personnel is also a way to encourage investments in this field by new or small firms that have difficulties in generating profit or record low profits. These act as subsidies for the initial costs. For this type of incentive, attention should also be paid to the side effects it may have, such as, in the long run, an artificial rise in wage levels for the envisaged categories of employees, where the workforce supply is inelastic, or a tendency to promote speculative and risky research areas.
In addition to the above, there are also other types of tax incentives, which do not specifically address R&D, but may have a positive effect on stimulation of this type of activity - e.g. tax incentives granted by national or local authorities to encourage investments in economically less-favored regions or in certain industry sectors. Specifically, such incentives may take the form of: tax incentives related to reinvested profit, favorable tax treatment for individual investors (business angels), exemptions or favorable rates for local taxes.
The information made available by impact studies carried out in recent years can help national governments to define policies which ensure a balance between direct subsidies and granting tax incentives, in order to achieve the objectives pursued at a given time. Thus:
• Tax incentives should be designed so they take into account the diversity of companies which carry out R&D activities, for example the existence of innovative young companies that do not have the possibility to generate immediate profit.
• Unlike large companies, small companies are
more likely to react to tax incentives granted for research and development. Moreover, they are less susceptible to moving their profits to another jurisdiction to avoid applicable taxes.
• Stability and predictability of tax incentives in the long run have a greater positive impact on R&D investments. Studies have shown that tax incentives that were granted only temporarily failed to achieve the objective of stimulating investment in research and development29.
• Tax incentives for which no prior approval from public authorities is required are much easier to apply by all types of companies, both large and small, unlike state aid/subsidies, where the application process can involve significant costs30.
According to Commission Regulation no. 651/2014 for declaring certain categories of aid compatible with the internal market within the European Union, state aid granted in any form for research and development activities is not likely to distort competition, but rather it remedies a free market failure, which prevents innovative companies from fully capitalizing on their R&D results, thus discouraging such investments. Consequently, in the European Union, R&D is a privileged sector, as state aid in any form, including tax incentives specifically granted for such activities, is considered acceptable.
In view of the above, as well as considering the fierce competition with neighboring European countries for investment and skilled labor, Romania needs to find clear and effective ways to achieve the objectives set in the National Strategy for Research, Development and Innovation 2014-2020.
29. Ibidem note 27;30. Ibidem note 27;
18
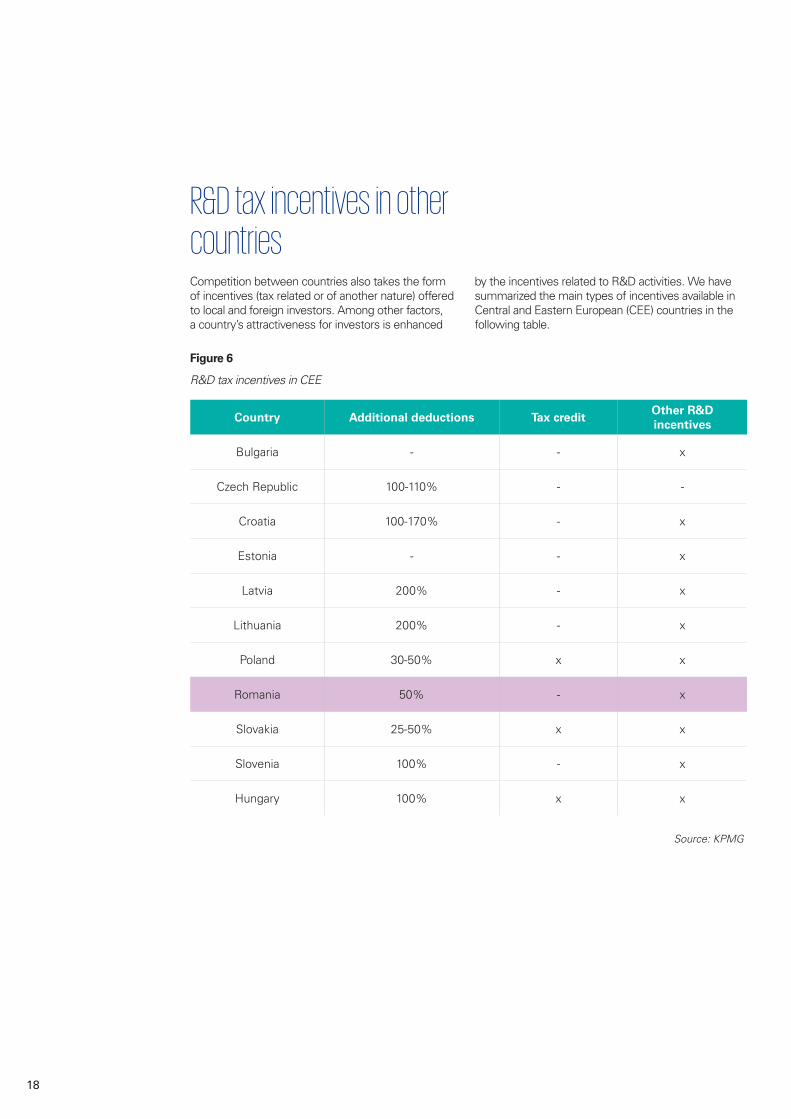
Competition between countries also takes the form of incentives (tax related or of another nature) offered to local and foreign investors. Among other factors, a country’s attractiveness for investors is enhanced
by the incentives related to R&D activities. We have summarized the main types of incentives available in Central and Eastern European (CEE) countries in the following table.
Country Additional deductions Tax creditOther R&D incentives
Bulgaria - - x
Czech Republic 100-110% - -
Croatia 100-170% - x
Estonia - - x
Latvia 200% - x
Lithuania 200% - x
Poland 30-50% x x
Romania 50% - x
Slovakia 25-50% x x
Slovenia 100% - x
Hungary 100% x x
R&D tax incentives in other countries
Source: KPMG
Figure 6
R&D tax incentives in CEE
19
It is still necessary to look beyond the mere level of incentives available and to take into account the clarity of the legal provisions and their practical applicability, as well as the scope of eligible activities. For instance, in some cases, incentives are available only for certain types of R&D, only for a beneficiary’s own R&D activities, only for activities carried out in certain undeveloped regions or only for specific types of entities (e.g. small and medium-sized enterprises - SMEs). Moreover, defining eligible R&D activities is commonly known to be problematic in these countries, including Romania (which we will talk more about in the following sections).
There are also significant differences of approach between countries:
• Tax credit is available in Poland, Slovakia and Hungary, subject to EU state aid legislation (for this reason, additional conditions are imposed). Unlike supplementary deductions for corporate tax purposes, tax credit provides the possibility to request tax refunds in the event tax losses are incurred (a typical situation in the initial phase of an investment). Consequently, it can be used as an instrument to selectively stimulate SMEs or investments in certain undeveloped regions, or in specific strategic sectors.
• SMEs benefit from more favorable conditions (incentives specific to them or higher rates for the generally available incentives) in countries such as Poland and Croatia.
• In Poland, companies can benefit from R&D incentives only for their own activities.
• Differentiated rates for the supplementary deduction are available, e.g. in Poland or Slovenia, for R&D expenditure on equipment and intangible assets as compared to salary expenses.
• Various types of R&D activities (e.g. fundamental research, applied research, experimental development) benefit from different deduction rates in Croatia.
• Certain countries (e.g. the Czech Republic or Slovakia) provide higher deduction rates for R&D expenses recorded in excess of the amounts in the previous year, in order to encourage an increase in investments in these activities.
• R&D centers can benefit from specific incentives e.g. in Poland (and also in Romania, starting January 2017).
We present below a few case studies illustrating the experience of some countries that have succeeded in increasing their R&D investments. To make a more meaningful comparison with the situation in Romania, we have selected the following as representative indicators: population, GDP (at current prices and PPPs) and GDP per capita31, the proportion of R&D expenses in GDP32, as well as the proportion of the government sector/private sector in total R&D expenses33.
31. Based on data provided by the OECD for 2016: https://data.oecd.org/gdp/gross-domestic-product-gdp.htm;32. Based on data provided by the World Bank for 2014;33. Based on data provided by Eurostat for 2015;34. Based on data provided by the Romanian National Institute of Statistics;
Population 19.8 million
GDP: USD 463 billion
GDP per capita: USD 23,406
Proportion of R&D expenses in GDP: 0,383% (0,49% în 201534)
Proportion of government/private R&D expenses:41.69% - government sector
37.29% - private sector
Significant economy sectors:
IT&C, professional services, automotive indus-try, mining and manufacturing industry (chemi-
cal, petrochemical, construction materials, woodworking, light industry)
Romania
20
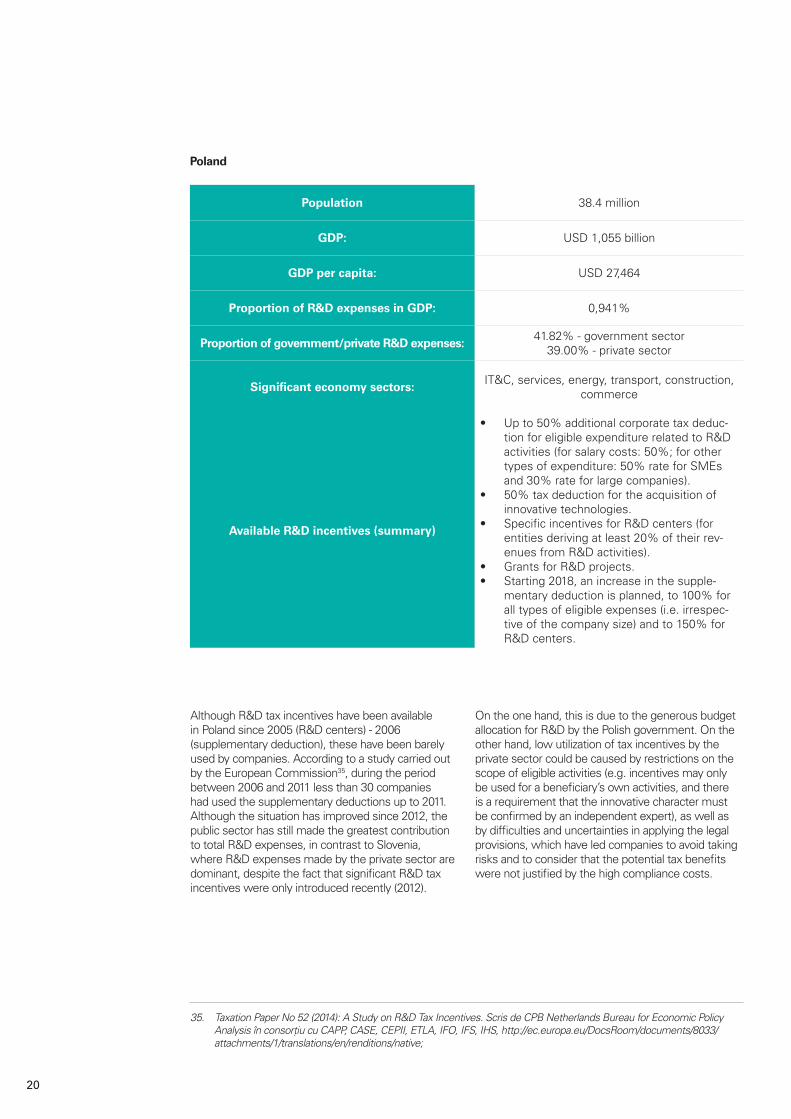
Although R&D tax incentives have been available in Poland since 2005 (R&D centers) - 2006 (supplementary deduction), these have been barely used by companies. According to a study carried out by the European Commission35, during the period between 2006 and 2011 less than 30 companies had used the supplementary deductions up to 2011. Although the situation has improved since 2012, the public sector has still made the greatest contribution to total R&D expenses, in contrast to Slovenia, where R&D expenses made by the private sector are dominant, despite the fact that significant R&D tax incentives were only introduced recently (2012).
On the one hand, this is due to the generous budget allocation for R&D by the Polish government. On the other hand, low utilization of tax incentives by the private sector could be caused by restrictions on the scope of eligible activities (e.g. incentives may only be used for a beneficiary’s own activities, and there is a requirement that the innovative character must be confirmed by an independent expert), as well as by difficulties and uncertainties in applying the legal provisions, which have led companies to avoid taking risks and to consider that the potential tax benefits were not justified by the high compliance costs.
Population 38.4 million
GDP: USD 1,055 billion
GDP per capita: USD 27,464
Proportion of R&D expenses in GDP: 0,941%
Proportion of government/private R&D expenses:41.82% - government sector
39.00% - private sector
Significant economy sectors:IT&C, services, energy, transport, construction,
commerce
Available R&D incentives (summary)
• Up to 50% additional corporate tax deduc-tion for eligible expenditure related to R&D activities (for salary costs: 50%; for other types of expenditure: 50% rate for SMEs and 30% rate for large companies).
• 50% tax deduction for the acquisition of innovative technologies.
• Specific incentives for R&D centers (for entities deriving at least 20% of their rev-enues from R&D activities).
• Grants for R&D projects.• Starting 2018, an increase in the supple-
mentary deduction is planned, to 100% for all types of eligible expenses (i.e. irrespec-tive of the company size) and to 150% for R&D centers.
Poland
35. Taxation Paper No 52 (2014): A Study on R&D Tax Incentives. Scris de CPB Netherlands Bureau for Economic Policy AnalysisînconsorțiucuCAPP,CASE,CEPII,ETLA,IFO,IFS,IHS,http://ec.europa.eu/DocsRoom/documents/8033/attachments/1/translations/en/renditions/native;
21
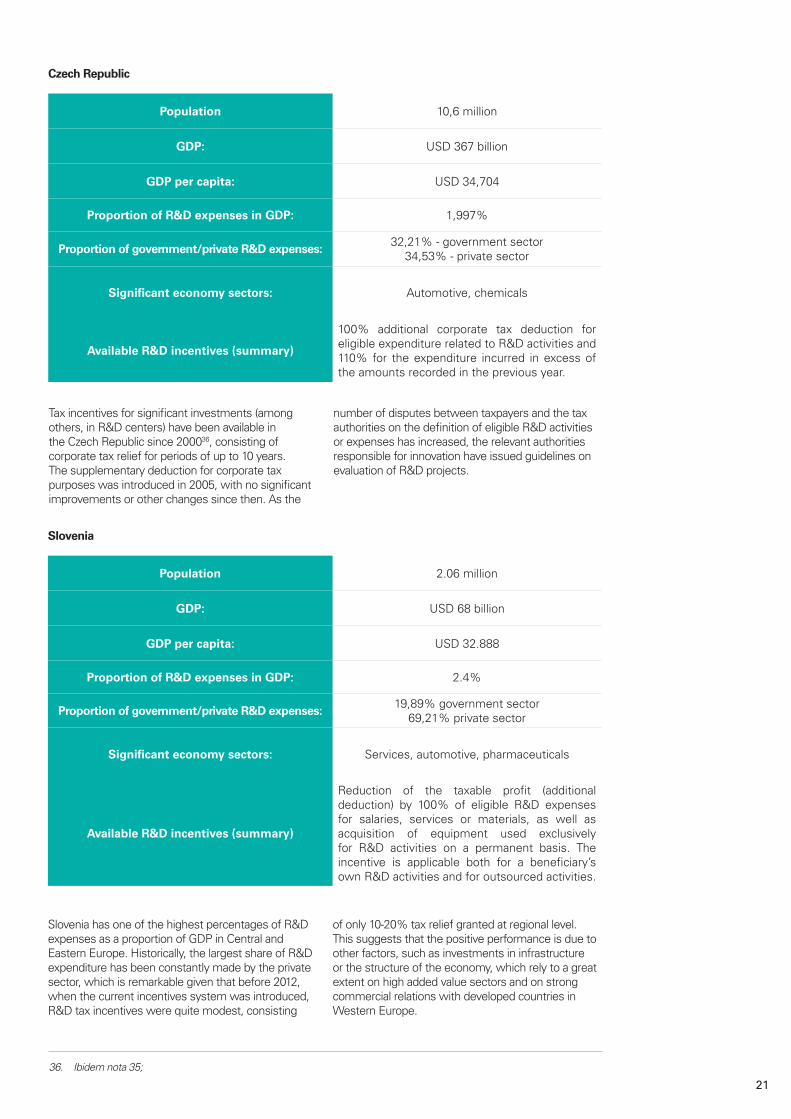
Tax incentives for significant investments (among others, in R&D centers) have been available in the Czech Republic since 200036, consisting of corporate tax relief for periods of up to 10 years. The supplementary deduction for corporate tax purposes was introduced in 2005, with no significant improvements or other changes since then. As the
number of disputes between taxpayers and the tax authorities on the definition of eligible R&D activities or expenses has increased, the relevant authorities responsible for innovation have issued guidelines on evaluation of R&D projects.
Slovenia has one of the highest percentages of R&D expenses as a proportion of GDP in Central and Eastern Europe. Historically, the largest share of R&D expenditure has been constantly made by the private sector, which is remarkable given that before 2012, when the current incentives system was introduced, R&D tax incentives were quite modest, consisting
of only 10-20% tax relief granted at regional level. This suggests that the positive performance is due to other factors, such as investments in infrastructure or the structure of the economy, which rely to a great extent on high added value sectors and on strong commercial relations with developed countries in Western Europe.
Population 10,6 million
GDP: USD 367 billion
GDP per capita: USD 34,704
Proportion of R&D expenses in GDP: 1,997%
Proportion of government/private R&D expenses:32,21% - government sector
34,53% - private sector
Significant economy sectors: Automotive, chemicals
Available R&D incentives (summary)
100% additional corporate tax deduction for eligible expenditure related to R&D activities and 110% for the expenditure incurred in excess of the amounts recorded in the previous year.
Population 2.06 million
GDP: USD 68 billion
GDP per capita: USD 32.888
Proportion of R&D expenses in GDP: 2.4%
Proportion of government/private R&D expenses:19,89% government sector
69,21% private sector
Significant economy sectors: Services, automotive, pharmaceuticals
Available R&D incentives (summary)
Reduction of the taxable profit (additional deduction) by 100% of eligible R&D expenses for salaries, services or materials, as well as acquisition of equipment used exclusively for R&D activities on a permanent basis. The incentive is applicable both for a beneficiary’s own R&D activities and for outsourced activities.
Czech Republic
Slovenia
36. Ibidem nota 35;
22
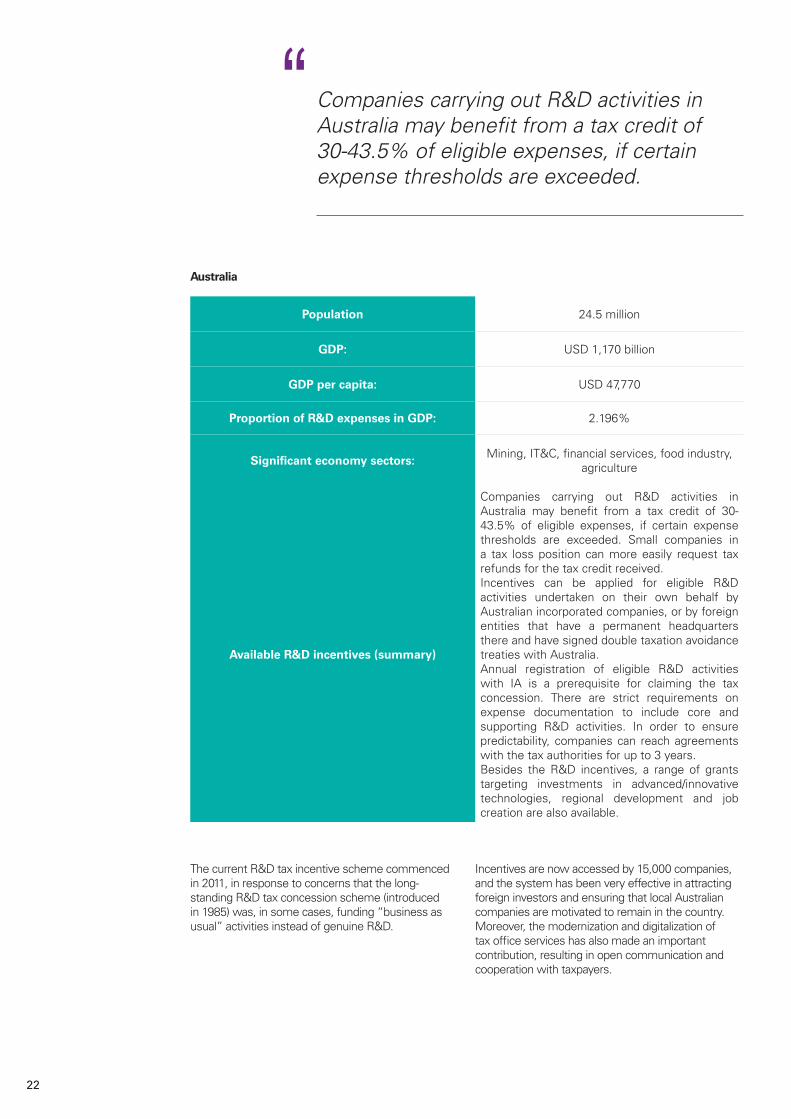
The current R&D tax incentive scheme commenced in 2011, in response to concerns that the long-standing R&D tax concession scheme (introduced in 1985) was, in some cases, funding “business as usual” activities instead of genuine R&D.
Incentives are now accessed by 15,000 companies, and the system has been very effective in attracting foreign investors and ensuring that local Australian companies are motivated to remain in the country. Moreover, the modernization and digitalization of tax office services has also made an important contribution, resulting in open communication and cooperation with taxpayers.
Population 24.5 million
GDP: USD 1,170 billion
GDP per capita: USD 47,770
Proportion of R&D expenses in GDP: 2.196%
Significant economy sectors:Mining, IT&C, financial services, food industry,
agriculture
Available R&D incentives (summary)
Companies carrying out R&D activities in Australia may benefit from a tax credit of 30-43.5% of eligible expenses, if certain expense thresholds are exceeded. Small companies in a tax loss position can more easily request tax refunds for the tax credit received.Incentives can be applied for eligible R&D activities undertaken on their own behalf by Australian incorporated companies, or by foreign entities that have a permanent headquarters there and have signed double taxation avoidance treaties with Australia.Annual registration of eligible R&D activities with IA is a prerequisite for claiming the tax concession. There are strict requirements on expense documentation to include core and supporting R&D activities. In order to ensure predictability, companies can reach agreements with the tax authorities for up to 3 years.Besides the R&D incentives, a range of grants targeting investments in advanced/innovative technologies, regional development and job creation are also available.
Australia
Companies carrying out R&D activities in Australiamaybenefitfromataxcreditof30-43.5%ofeligibleexpenses,ifcertainexpense thresholds are exceeded.
“
23
As we have seen in the previous chapters, many countries, including those from our region, are offering generous tax incentives to companies which carry out R&D activities, driven by the need to stimulate private investments in this field. Given the above, Romania’s position in such a competitive context is brought into question. Is Romania able to compete with its neighboring countries and others in attracting private investment for R&D and innovation related activities through tax incentives?
The good news is that Romania has tried to align to the European tendency of supporting R&D activities. For instance, Government Ordinance no. 57/2002 on scientific research and technological development recognizes how crucial the role of R&D is for the strategy on sustainable economic development and mentions that R&D is a national priority, encouraged and supported by the state.
The first step in stimulating R&D activities through fiscal incentives, however, was made only 7 years later, in 2008, when, with effect from 1 January 2009, specific fiscal incentives relating to corporate tax were introduced into Romanian tax legislation – a supplementary deduction of 20% of R&D expenditure37 (which was later increased to 50%38 starting 1 February 2013) and the application of the accelerated depreciation method for the equipment used for R&D activities.
The next tax measures taken by the Romanian Government to encourage further investments in R&D are quite recent, and they involve the implementation into domestic legislation of the income tax exemption for R&D employees (from August 2016)39 and the exemption from corporate income tax for 10 years, both for start-up companies and existing companies which carry out exclusively R&D and innovation activities (from January 2017)40.
Theoretically, Romania seems to offer generous tax incentives to support R&D and innovation. In practice, however, a number of factors have made it difficult to apply them. For instance, although the additional deduction for corporate tax purposes has been in effect since 2009, the unclear provisions have made its use accessible only to a small number of taxpayers. Although there are no specific statistics to determine the exact number of taxpayers which apply this deduction, this fact is stated even in the National Strategy for Research, Development and Innovation 2014-202041. Moreover, although there is no statistical data to confirm this, the newly introduced incentives (i.e. income tax exemption for R&D employees and corporate tax exemption for firms which carry out exclusively research, development and innovation) seem to be applied by even fewer taxpayers.
We will now analyze in detail the three types of specific tax incentives currently in force in Romania, also covering the issues which seem to inhibit their application by taxpayers.
R&D tax incentives in Romania – application and challenges
37. Government Emergency Ordinance no. 200/2008, amending Law no. 571/2003 on the Fiscal Code;38. Government Ordinance no. 8/ 2013, amending Law no. 571/2003 on the Fiscal Code;39. Government Emergency Ordinance no. 32/2016, on amendments to Law no. 227/2015 on the Fiscal Code and
certainfinancialandfiscalmeasures,andOrderno.899/2016onqualifyingappliedresearchanddevelopmentand/ortechnological development activities;
40 Government Emergency Ordinance no. 3/2017, amending Law no. 227/2015 on the Fiscal Code;41. National Strategy of Research, Development and Innovation – 2014-2020, 21 October 2014;
24
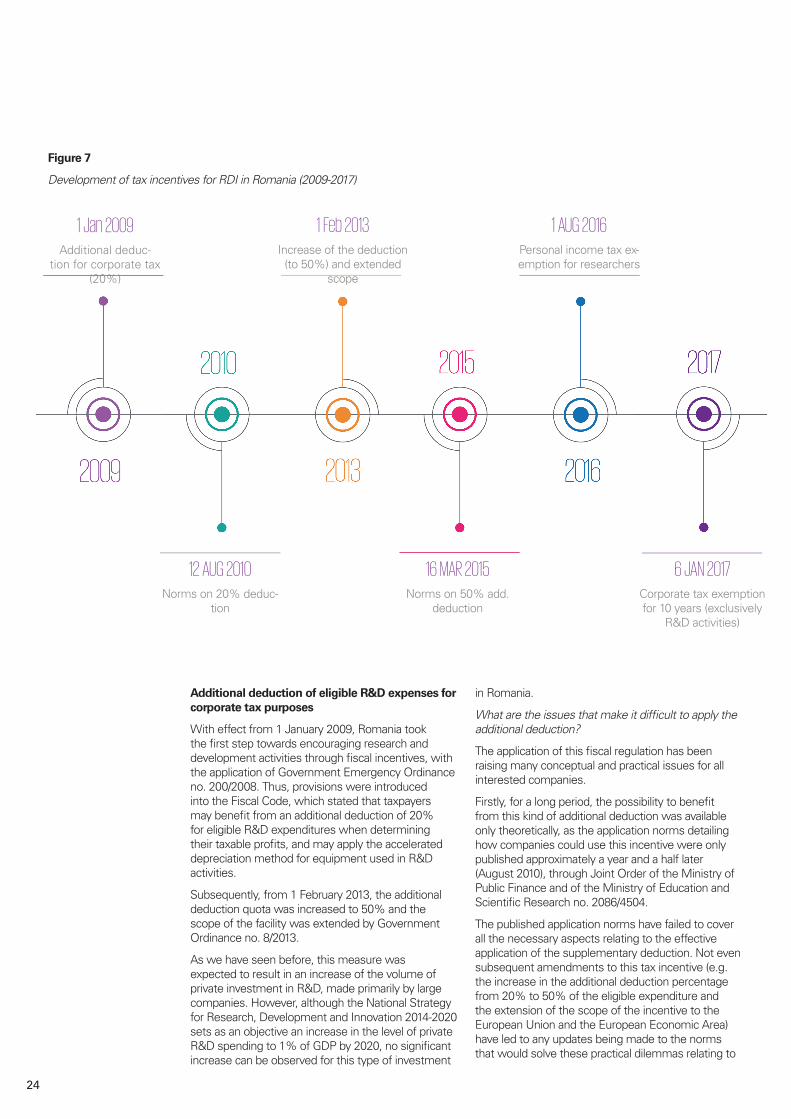
1 Jan 2009Additional deduc-
tion for corporate tax (20%)
1 Feb 2013Increase of the deduction (to 50%) and extended
scope
1 AUG 2016Personal income tax ex-emption for researchers
16 MAR 2015Norms on 50% add.
deduction
6 JAN 2017Corporate tax exemption for 10 years (exclusively
R&D activities)
12 AUG 2010Norms on 20% deduc-
tion
Figure 7
Development of tax incentives for RDI in Romania (2009-2017)
Additional deduction of eligible R&D expenses for corporate tax purposes
With effect from 1 January 2009, Romania took the first step towards encouraging research and development activities through fiscal incentives, with the application of Government Emergency Ordinance no. 200/2008. Thus, provisions were introduced into the Fiscal Code, which stated that taxpayers may benefit from an additional deduction of 20% for eligible R&D expenditures when determining their taxable profits, and may apply the accelerated depreciation method for equipment used in R&D activities.
Subsequently, from 1 February 2013, the additional deduction quota was increased to 50% and the scope of the facility was extended by Government Ordinance no. 8/2013.
As we have seen before, this measure was expected to result in an increase of the volume of private investment in R&D, made primarily by large companies. However, although the National Strategy for Research, Development and Innovation 2014-2020 sets as an objective an increase in the level of private R&D spending to 1% of GDP by 2020, no significant increase can be observed for this type of investment
in Romania.
Whataretheissuesthatmakeitdifficulttoapplytheadditional deduction?
The application of this fiscal regulation has been raising many conceptual and practical issues for all interested companies.
Firstly, for a long period, the possibility to benefit from this kind of additional deduction was available only theoretically, as the application norms detailing how companies could use this incentive were only published approximately a year and a half later (August 2010), through Joint Order of the Ministry of Public Finance and of the Ministry of Education and Scientific Research no. 2086/4504.
The published application norms have failed to cover all the necessary aspects relating to the effective application of the supplementary deduction. Not even subsequent amendments to this tax incentive (e.g. the increase in the additional deduction percentage from 20% to 50% of the eligible expenditure and the extension of the scope of the incentive to the European Union and the European Economic Area) have led to any updates being made to the norms that would solve these practical dilemmas relating to
25
the application of this incentive.
The most important aspects that make taxpayers reluctant to apply this incentive are:
• Although at first glance the conditions to be fulfilled may seem clear, there are no precise templates or guidelines, so companies do not know exactly how the conditions should be met and how they can ensure that these mandatory conditions are truly complied with.
• Definitions of eligible activities for which the additional deduction may apply (i.e. applied research and/or technological development activities) are very broad and generate a series of questions and uncertainties as to the classification of the activities carried out by companies in the categories set out in the relevant legislation. This is one of the main difficulties in applying the supplementary deduction. The National Strategy for Research, Development and Innovation 2014-2020 mentions that large companies with subsidiaries in Romania are reluctant to set up and develop local research centers and to categorise their specific activities as research and development. In order to solve this problem, and taking into account that determining whether the activities carried out by the companies qualify as eligible R&D activities would go beyond the competence of the tax inspectors (who can check the way the incentives are applied only from a fiscal perspective), the Ministry of Education and Research intended to set up a Research and Development Expert Registry, which could be consulted by both companies and the tax authorities, as mentioned in the norms for the application of the supplementary deduction, which were updated in 2015. For the moment however, it remains uncertain if and when this Register will be set up.
• The administrative effort needed to compile the documentation required by law may be considerable, especially for companies that carry out a significant number of projects during a single year (e.g. many companies carry out hundreds of projects in a given year).
Personal income tax exemption for individuals involved in R&D activities
The National Strategy for Research, Development and Innovation 2014-2020 concludes, judging by international standards, but also considering internal needs, that Romania does not have enough researchers. As explained in the above-mentioned
strategy, there is a shortage of the critical mass of human resources necessary for the development of promising areas and, in particular, for interdisciplinary research and innovation, as the number of researchers hired by the private sector has declined. These conclusions come in the context of high competition among CEE countries for skilled labor, as the number of staff able to carry out the activities specific to R&D projects is low. It should be noted that in 2013, over 15,000 Romanian researchers were working outside the country42.
In this context, in August 2016, the income tax exemption for employees who carry out R&D activities was introduced into national legislation, but only for income derived from applied research and technological development activities. The tax exemption is granted on a monthly basis only for the income obtained from carrying out eligible activities in eligible projects, within the limit of the budget allocated to each project.
On 14 June 2017, Law no. 136/2017 was published, approving changes to Government Emergency Ordinance no. 32/2016 on amendments to Law no. 227/2015 on the Fiscal Code and certain financial and fiscal measures. Under this law, the income tax exemption is extended to all types of research, development and innovation activities. However, it will continue to apply partially, only for activities carried out as part of eligible projects. It remains to be seen what amendments will be adopted by the Government with respect to the application norms for this exemption.
Whataretheissuesthatmakeitdifficulttoapplythistax incentive?
According to the observations received from private companies in KPMG’s client portfolio, we understand that the following issues create difficulties and uncertainty in the application of the income tax exemption for R&D employees, although this is currently being used by only a small number of public institutions:
• The way that eligible activities are defined is, as in the case of the corporate income tax supplementary deduction, very general and generates uncertainty as to the classification of the activities carried out by companies in the categories set out in the relevant legislation. Taxpayers are confronted with the same questions and uncertainties as when applying the supplementary deduction.
• The administrative effort necessary for the preparation of the documents required under
42 European Commission, 2013, Innovation Union Scoreboard;
26
the relevant legal provisions is considerable, especially for companies that carry out a significant number of projects during one particular year.
• The effort and investment needed to modify the payroll calculation process, so that all elements required by law can be presented in the event of a tax audit (e.g. payroll calculation on a project-basis) may be significant for companies whose employees work on more the one eligible project in a given month.
• Applying the income tax exemption only for salaries earned by engaging in eligible projects creates concern for companies, since it may lead to employees being less motivated to work on and to give the same level of attention to non-eligible projects, and could generate internal competition between employees to work as much as possible on eligible projects, as well as potential employee retention problems due to the fluctuating value of the monthly salary they will receive as a result of applying the exemption.
Corporate income tax exemption for entities exclusively carrying out R&D activities
This 10-year income tax exemption for companies carrying out exclusively research, development and innovation activities was introduced into the Romanian Fiscal Code in January 2017. This incentive aims to support R&D centers, both newly established or those existing at the time the incentive was introduced.
Whataretheissuesthatmakeitdifficulttoapplythistax incentive?
No application norms have been published yet for this tax incentive, so it remains practically unused.
Findings / comments
As we can see, there are common issues that make it difficult to apply the three main types of tax incentives through which the Romanian Government aims to encourage private investment and the development of R&D activities. Out of these, we would like to draw attention to the uncertainties faced by taxpayers when they have to demonstrate to the tax authorities the eligible nature of the R&D activities they carry out. We consider that the first necessary step towards improving the current situation, in order to encourage taxpayers to apply the existing tax incentives, is to provide more details about the legislation as well as
to create specific guidelines on the types of eligible activities in different areas of research, development and innovation.
Moreover, companies from other countries have raised similar concerns as to how they can identify eligible research and development activities to apply a certain type of tax incentive and how they will be assessed by the tax authorities in the event of an audit. Some countries have taken steps to clarify these issues. For example, there is an R&D regulatory body in Hungary that has the ability to decide on the classification of the research and development activities undertaken by companies and whether these are eligible for applying the available tax incentives. (This is similar to the proposed R&D Registry of experts in Romania mentioned above).
Moreover, besides the specific problems related to applying the R&D tax incentives, companies in Romania are also confronted with the unpredictability of the fiscal environment and uncertainty over the approach the Romanian tax authorities will take during audits. Studies43 show that the approach, rigor and severity of audits carried out by the tax authorities can have significant effects on the level of accessing R&D tax incentives by taxpayers. Therefore companies are not willing to take the risk of applying such incentives.
The approach, rigor and severity of audits carried out by the tax authorities can have significanteffectsonthelevelofaccessingR&D tax incentives by taxpayers.
“
43.Appelt,S.etal.(2016),“R&DTaxIncentives:Evidenceondesign,incidenceandimpacts”,OECDScience,TechnologyandIndustryPolicyPapers,No.32,OECDPublishing,Paris.http://dx.doi.org/10.1787/5jlr8fldqk7j-en;
27
As previously mentioned, one of the most important obstacles to overcome, which causes many Romanian companies to waive the benefit of current tax incentives for R&D and innovation, seems to be the lack of a clear definition of what research, development and innovation activities actually mean under the relevant legal provisions.
In this respect, we present below three examples of processes, from the automotive, banking and IT industries, which, depending on further clarifications from the tax authorities of the definition of the eligible activities, could include a large number of activities that would qualify for the application of the already existing tax incentives. We believe that, in the near future, this type of processes will become increasingly widespread in Romanian companies as well, including, on a large scale, activities that can be eligible for the application of the current tax incentives. Therefore, we recommend that companies should carry out a detailed analysis of their activities, to clearly identify the research-development and innovation components and, on a case by case basis, to apply the relevant tax incentives.
In the near future, we intend, together with the relevant authorities, to identify acceptable means, for both taxpayers and the authorities, to clarify the nature and eligibility of the activities carried out by various types of taxpayer, with the aim of applying the available tax incentives for research, development and innovation.
Product design and development in the automotive industry
The automotive sector is one of the world’s leading industries, investing around USD 100 billion annually in research and development44.
This sector has undergone accelerated development in Romania too, with many companies setting up local research and development centers, starting from the existing production facilities and the level of expertise of local specialists. Based on new demands or feedback from customers, Romanian specialists are constantly improving existing products or creating new solutions to keep up with the evolution of technology and new market demands. Hence, product design and development is one of the common processes within the aforementioned research and development centers.
The product design and development process includes two main components:
• Design – activities that define the style and external layout, the product architecture from a mechanical, electrical, aerodynamic or other perspective, depending on the type of envisaged product and technology used, activities of selection of materials to be used and for defining of the necessary processes for product development, production and maintenance, as well as for designing/developing the various components/ tools/equipment necessary for the product to work.
• Development - the entire process which starts with identifying a market opportunity, continues with the design and actual development of a product that responds to market requirements, legal requirements and security standards, as well as to existing cost and production restrictions, and is finalized by testing, adjusting, and validating the product until it enters production.
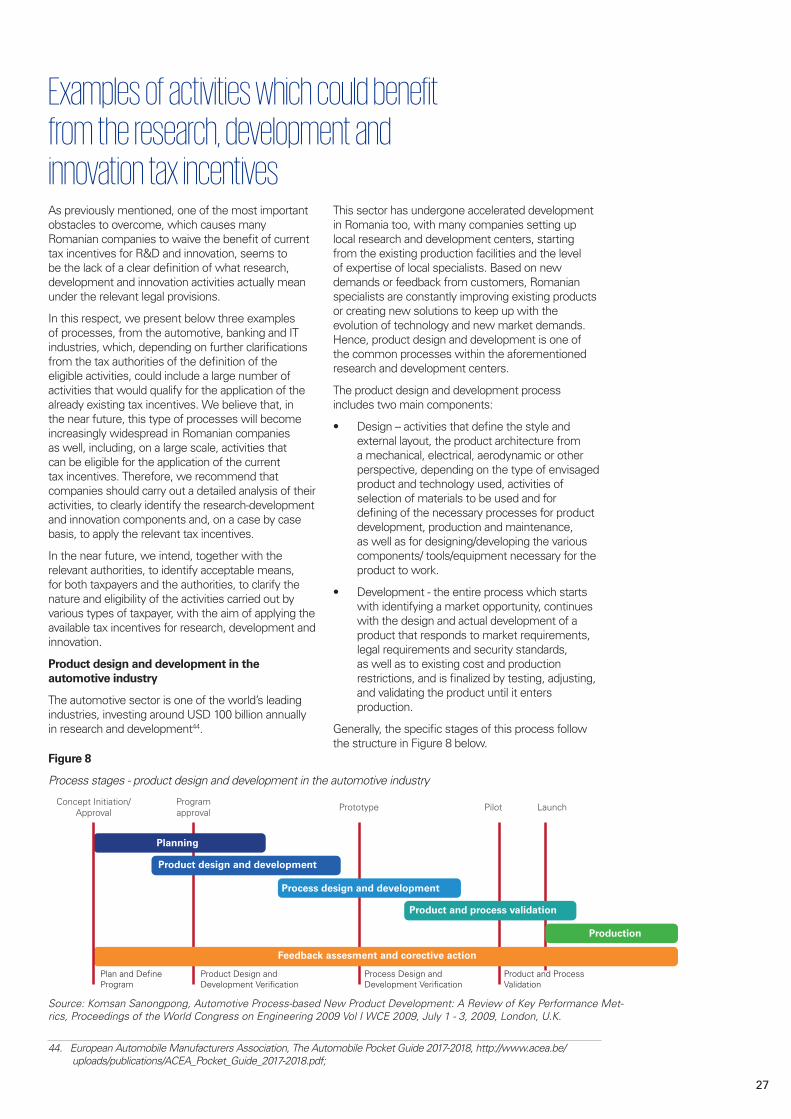
Generally, the specific stages of this process follow the structure in Figure 8 below.
Examples of activities which could benefit from the research, development and innovation tax incentives
Planning
Product design and development
Process design and development
Product and process validation
Production
Feedback assesment and corective action
Concept Initiation/ Approval
Programapproval Prototype Pilot Launch
Product and Process Validation
Process Design and Development Verification
Product Design and Development Verification
Plan and Define Program
Source: Komsan Sanongpong, Automotive Process-based New Product Development: A Review of Key Performance Met-rics, Proceedings of the World Congress on Engineering 2009 Vol I WCE 2009, July 1 - 3, 2009, London, U.K.
Figure 8
Process stages - product design and development in the automotive industry
44. European Automobile Manufacturers Association, The Automobile Pocket Guide 2017-2018, http://www.acea.be/uploads/publications/ACEA_Pocket_Guide_2017-2018.pdf;
28
In order to apply the R&D and innovation-specific tax incentives, it is important however to understand how the activities entailed by the product design
and development process are classified under the categories of eligible activities mentioned in the specific legislation.
The degree to which each of the phases above applies will depend on the specific product, its complexity and the degree of deviation from the previously existing products.
Subsequent to the product’s release into production, depending on the results obtained over time to the tests for compliance with the customer’s specifications and legal requirements, as well as depending on the feedback received based on customer use, the following activities may take place:
• Product modifications and new product functionalities
• Improvements of the product’s quality
• Product adaptation to new regulations, norms or standards imposed by legislation or by the industry.
The activities described above take place in a context where the design and product development teams in the automotive industry are continually confronted with important challenges related to rapid technology evolution, changes in consumer behavior and requirements, cost saving targets and dramatic cuts
to the time necessary to launch new solutions and innovative products on the market.
Thus, the research and development centers in the automotive industry are involved in a continuous process of simplifying and shortening the design and product development process, implementing agile and increasingly efficient methods of development. These include the use of software tools (Computer Aided Engineering and Computer Aided Design) and virtualization (augmented reality), which allow for the design, development and testing of new solutions in a virtual environment (e.g. The Technical Center of Renault Technologie Roumanie in Titu).
Identifying ways to reduce the cost/increase the quality of a product without increasing its costs, as well as identifying functionalities/features that increase the comfort of drivers/passengers and respond to their behavioral changes caused by demographic changes and technological evolution, or the implementation of technologies that have a lower negative environmental impact, and involve research and experimental development activities through which companies in the automotive industry are trying to cope with the disruptive factors and
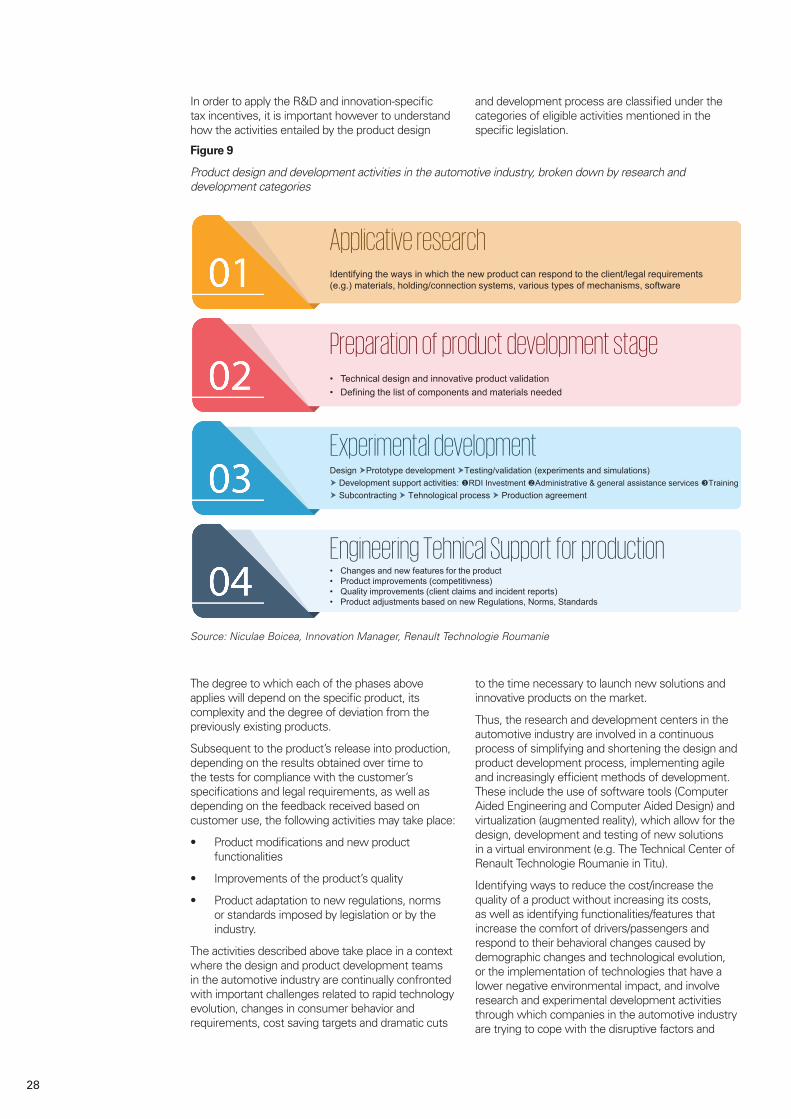
• Technical design and innovative product validation• Defining the list of components and materials needed
• Changes and new features for the product• Product improvements (competitivness)• Quality improvements (client claims and incident reports)• Product adjustments based on new Regulations, Norms, Standards
Development support activities: RDI InvestmentAdministrative & general assistance services Training Subcontracting Tehnological process Production agreement
Applicative researchIdentifying the ways in which the new product can respond to the client/legal requirements (e.g.) materials, holding/connection systems, various types of mechanisms, software
Preparation of product development stage
Experimental developmentDesign Prototype development Testing/validation (experiments and simulations)
Engineering Tehnical Support for production
Figure 9
Product design and development activities in the automotive industry, broken down by research and development categories
Source: Niculae Boicea, Innovation Manager, Renault Technologie Roumanie
29
regulatory changes they face.
On the other hand, the software component is becoming more and more important for newly developed products. Automobiles now incorporate an impressive amount of software, from brake control systems to infotainment systems and connecting various smart devices (e.g. smartphones, tablets).
As technology evolves and we migrate towards solutions for autonomous cars, the number of code lines embedded in a vehicle’s system (currently estimated to be over a million) will explode45, available applications will be addressing increasingly varied and important aspects, seeking to both provide a comfortable driving experience and increase safety conditions (e.g. driving rules violation alerts, systems which observe and assess the driver’s fatigue and stress levels, systems that report the location of a possible accident, its severity and the potential injuries suffered by passengers). All these involve a component of innovation, applied research and significant experimental development, which has already become a permanent requirement in the development of a product specific to the automotive industry.
The types of activities mentioned above generally fall into the categories of applied research and experimental development. The question that requires the authorities’ response is whether they fully qualify for eligible tax incentives, and if not, how one should distinguish between eligible and noneligible activities.
Digital Transformation - omnichannel integration
In recent years, changes in consumer behavior have been increasingly evident, due to the evolution of technology and the different psychological profile of new generations, making the integration of as many channels of distribution as possible and contact with customers an imperative for many industries, including the banking industry. Customers are much better informed, more demanding, and have higher expectations of simplicity, accessibility and comfort. Young people have higher expectations in terms of access to multiple-channel services, real-time processing of requests they make and mobile access to any type of service.
Besides changes in customers’ behavior, banks also currently face pressure generated by:
• Evolution of technologies that allow competitors to have a faster response time to market changes and trends
• Disruptive action of new entrants on the market (e.g. Fintech companies) or technology companies (e.g. Alibaba, Amazon, Apple, telecommunication companies)
• Competition from non-banking financial institutions granting small and short-term loans
• Blockchain technology and the emergence/spread of cryptocurrency
• Standardization and commoditization of traditional banking services.
In view of the above, many banks, already affected by the disruptive behavior of new market entrants or technology companies, engage in a digital transformation process that brings them closer to their customers. At the same time, they engage in a research and innovation process that allows them to identify new sources of income and preserve profit margins by serving new and increasingly complex customer needs.
This transformation represents much more than simply automating certain processes or online access to bank services and products. It is totally different from creating identical applications and websites for the various devices which are now available to customers (e.g. mobile phones, tablets, laptops).
In fact, this transformation begins with the analysis of new consumer behaviors, which are the basis for optimizing the omnichannel strategy, in order to respond to the new requirements and attitudes they demonstrate. According to a study prepared by Efma and Backbase46, the different apps and websites used should be optimized for the different attitudes manifested by customers:
• The quick - actions requiring fast response, for mobile phone interaction
• The casual - actions requiring easy access to information and services or products, for tablet interaction
• The focused - actions requiring attention or that are more complex, for laptop or desktop computer interaction
• The physical - actions requiring physical contact with the banking services provider, for interaction through bank branches and subsidiaries.
45. Kirk Gutmann, SVP of Industry Strategy, Siemens PLM Software, “The importance of agile design in the automotive industry”,GlobalManufacturingNov24,2015,http://www.manufacturingglobal.com/technology/importance-agile-design-automotive-industry;
46 Efma & Backbase, Omni-channel banking: The digital transformation roadmap, 2015 - http://bit.ly/2viBEZO
30
Industrializationto simpify and reduce cost
Virtualized banking services
Social needand empowerment
Flawlessly deliver on basic needs Provide convenience, choice and control Hyper-Conectivity
Self-Fulfillment
Personalization and data intelligence
Standardize Optimize Cooperate
Safely holdcash
Process transactions
Providecredit
Manageaccont
Integrated Channels
When, where, with whom andabout what I want
INNOVATION INNOVATION INNOVATION
Figure 10
Future of banking services
Source:Presentation“Omni-ChannelDigitization&MarketingAutomationPlatform”,ShepHertz,https://www.slide-share.net/shephertz/banking-services-marketing-automation-and-omnichannel-banking
Analyzing new behaviors and preferences requires the development of specific abilities and the implementation of new technologies, which can range from Business Intelligence and Data Analytics tools to Artificial Intelligence. In addition to a better understanding of consumers’ behavior and preferences, the analysis of data through the above-mentioned means allows, among others:
• Closer identification of the target consumer
• Monitoring the consumer’s behavior and activity on all used channels
• Identifying the best ways and channels to get in contact with the consumer
• Identifying and designing new innovative banking services/products
• Defining predictive sales patterns - identifying services/products that a consumer from a specific category is inclined to buy, and preparing marketing campaigns focused on the preferences and needs of each consumer
• Identifying effective ways to integrate the bank’s own offer of services and products with complementary services (e.g. integration of credit card services with travel or relaxation services)
• Defining predictive pricing models for different types of services/products, depending on the behavior and the degree of risk presented by different categories of consumers.
Based on the results of the data analysis, in order to achieve sustainable effects in the digital transformation process, along with the change in IT
systems, banks may have to consider changing the business model and possibly changing their portfolio of services and products, as well as changing internal processes and going through cultural transformations.
Considering these transformations, the integration of multiple channels of distribution and contact with the consumer goes beyond the mere implementation of front-end applications which facilitate the client’s access to the bank’s services/products and employees. New trends show that access to the customer’s credit history and transactions, as well as modeling the interactions with the customer and the offers made based on this, are becoming essential for banks. In addition, interacting with consumers on mobile and social media channels often requires an iterative approach that allows the bank to learn from the interaction with them, better understanding what works on the market or in the interaction with its own employees, and to adjust the approach, the offered services or the technical solutions used. In this context, the agile implementation model becomes imperative, not only at the level of implementing new IT solutions, but at the level of the whole organization, which needs to become more flexible and operate in an integrated manner.
Moreover, the idea that only staff who work directly with customers need to know the customer and be concerned about interaction with him/her, is no longer realistic under the current market conditions. In banks, as well as in organizations in many other industries, there must be perfect integration between front-end and back-end processes, both of which are just as important in providing customer service in the new conditions and requirements of the market.
Thus, the process of digital transformation and
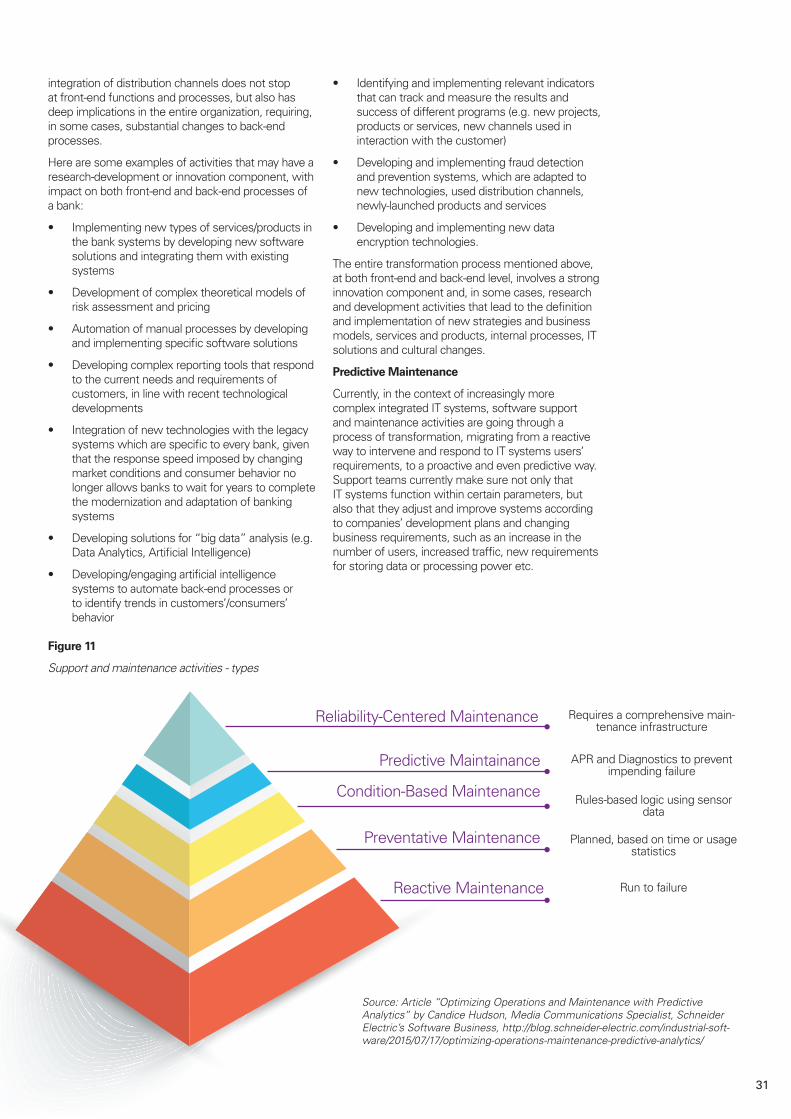
31
Figure 11
Support and maintenance activities - types
Source: Article “Optimizing Operations and Maintenance with Predictive Analytics”byCandiceHudson,MediaCommunicationsSpecialist,SchneiderElectric’s Software Business, http://blog.schneider-electric.com/industrial-soft-ware/2015/07/17/optimizing-operations-maintenance-predictive-analytics/
integration of distribution channels does not stop at front-end functions and processes, but also has deep implications in the entire organization, requiring, in some cases, substantial changes to back-end processes.
Here are some examples of activities that may have a research-development or innovation component, with impact on both front-end and back-end processes of a bank:
• Implementing new types of services/products in the bank systems by developing new software solutions and integrating them with existing systems
• Development of complex theoretical models of risk assessment and pricing
• Automation of manual processes by developing and implementing specific software solutions
• Developing complex reporting tools that respond to the current needs and requirements of customers, in line with recent technological developments
• Integration of new technologies with the legacy systems which are specific to every bank, given that the response speed imposed by changing market conditions and consumer behavior no longer allows banks to wait for years to complete the modernization and adaptation of banking systems
• Developing solutions for “big data” analysis (e.g. Data Analytics, Artificial Intelligence)
• Developing/engaging artificial intelligence systems to automate back-end processes or to identify trends in customers’/consumers’ behavior
• Identifying and implementing relevant indicators that can track and measure the results and success of different programs (e.g. new projects, products or services, new channels used in interaction with the customer)
• Developing and implementing fraud detection and prevention systems, which are adapted to new technologies, used distribution channels, newly-launched products and services
• Developing and implementing new data encryption technologies.
The entire transformation process mentioned above, at both front-end and back-end level, involves a strong innovation component and, in some cases, research and development activities that lead to the definition and implementation of new strategies and business models, services and products, internal processes, IT solutions and cultural changes.
Predictive Maintenance
Currently, in the context of increasingly more complex integrated IT systems, software support and maintenance activities are going through a process of transformation, migrating from a reactive way to intervene and respond to IT systems users’ requirements, to a proactive and even predictive way. Support teams currently make sure not only that IT systems function within certain parameters, but also that they adjust and improve systems according to companies’ development plans and changing business requirements, such as an increase in the number of users, increased traffic, new requirements for storing data or processing power etc.
Reactive Maintenance
Preventative Maintenance
Condition-Based Maintenance
Predictive Maintainance
Reliability-Centered Maintenance Requires a comprehensive main-tenance infrastructure
Planned, based on time or usage statistics
Run to failure
APR and Diagnostics to prevent impending failure
Rules-based logic using sensor data
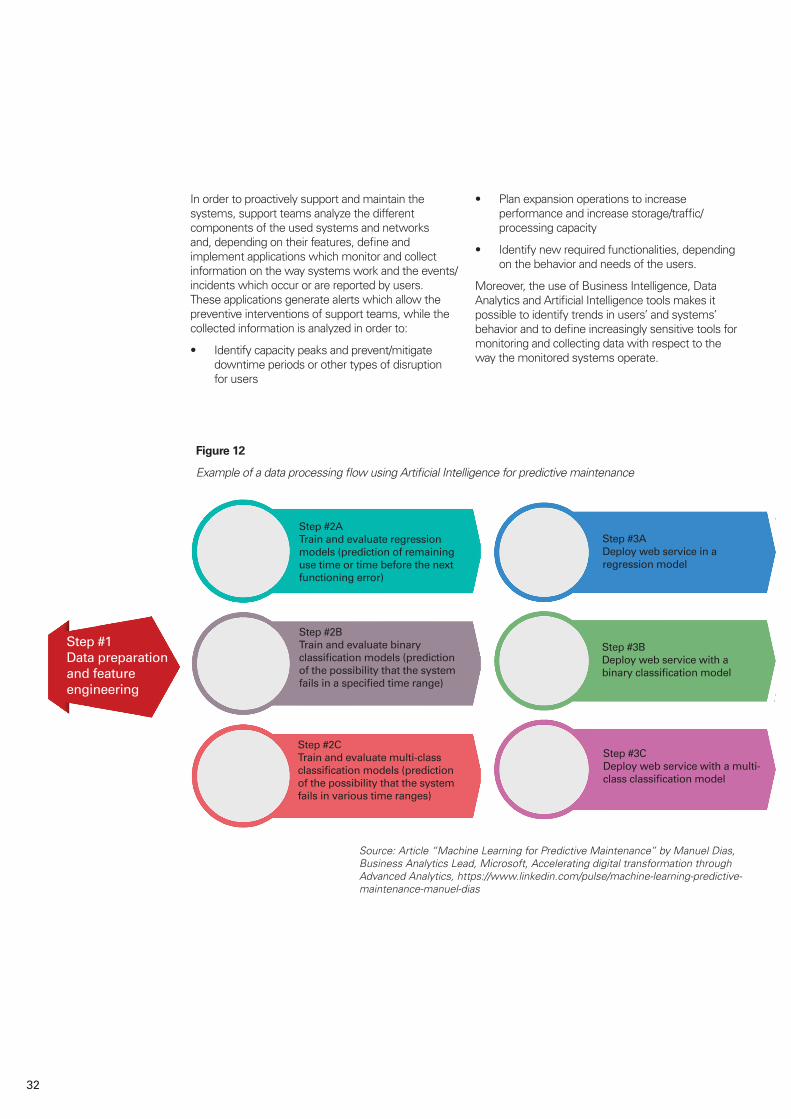
32
In order to proactively support and maintain the systems, support teams analyze the different components of the used systems and networks and, depending on their features, define and implement applications which monitor and collect information on the way systems work and the events/incidents which occur or are reported by users. These applications generate alerts which allow the preventive interventions of support teams, while the collected information is analyzed in order to:
• Identify capacity peaks and prevent/mitigate downtime periods or other types of disruption for users
• Plan expansion operations to increase performance and increase storage/traffic/processing capacity
• Identify new required functionalities, depending on the behavior and needs of the users.
Moreover, the use of Business Intelligence, Data Analytics and Artificial Intelligence tools makes it possible to identify trends in users’ and systems’ behavior and to define increasingly sensitive tools for monitoring and collecting data with respect to the way the monitored systems operate.
Figure 12
ExampleofadataprocessingflowusingArtificialIntelligenceforpredictivemaintenance
Step #1Data preparation and feature engineering
Step #2ATrain and evaluate regression models (prediction of remaining use time or time before the next functioning error)
Step #3ADeploy web service in a regression model
Step #2BTrain and evaluate binary classification models (prediction of the possibility that the system fails in a specified time range)
Step #3BDeploy web service with a binary classification model
Step #2CTrain and evaluate multi-class classification models (prediction of the possibility that the system fails in various time ranges)
Step #3CDeploy web service with a multi-class classification model
Source:Article“MachineLearningforPredictiveMaintenance”byManuelDias,Business Analytics Lead, Microsoft, Accelerating digital transformation through Advanced Analytics, https://www.linkedin.com/pulse/machine-learning-predictive-maintenance-manuel-dias
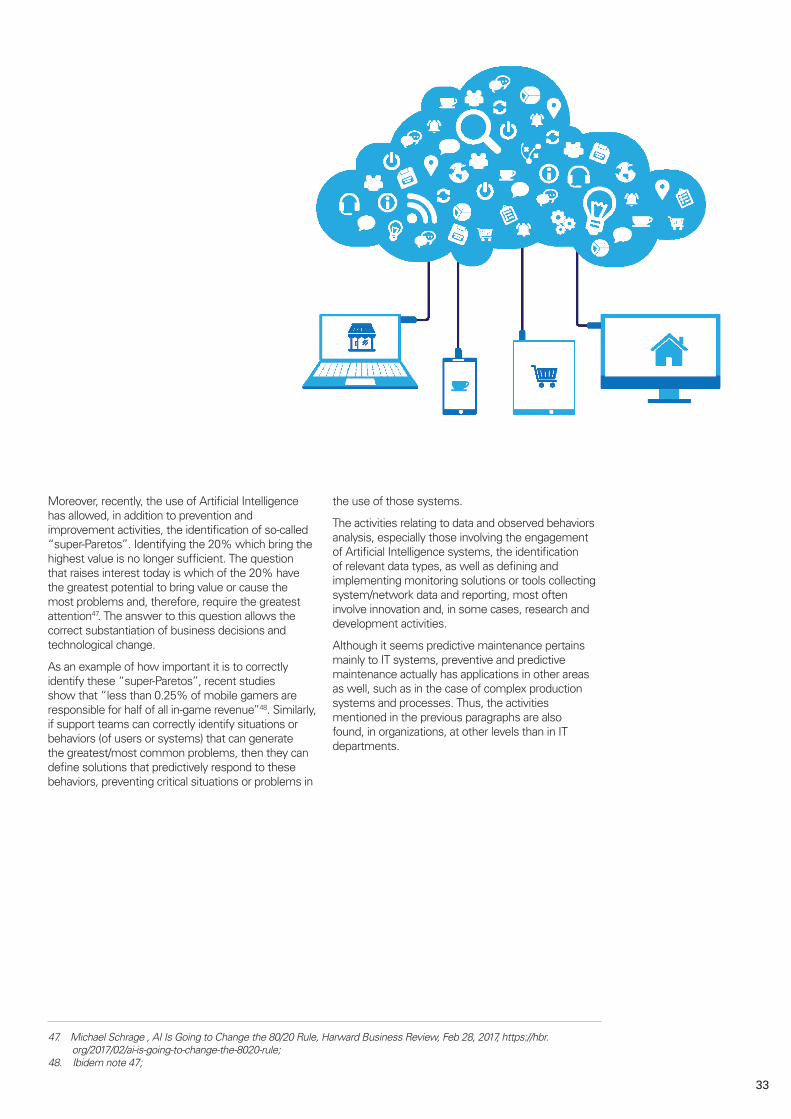
33
Moreover, recently, the use of Artificial Intelligence has allowed, in addition to prevention and improvement activities, the identification of so-called “super-Paretos”. Identifying the 20% which bring the highest value is no longer sufficient. The question that raises interest today is which of the 20% have the greatest potential to bring value or cause the most problems and, therefore, require the greatest attention47. The answer to this question allows the correct substantiation of business decisions and technological change.
As an example of how important it is to correctly identify these “super-Paretos”, recent studies show that “less than 0.25% of mobile gamers are responsible for half of all in-game revenue”48. Similarly, if support teams can correctly identify situations or behaviors (of users or systems) that can generate the greatest/most common problems, then they can define solutions that predictively respond to these behaviors, preventing critical situations or problems in
the use of those systems.
The activities relating to data and observed behaviors analysis, especially those involving the engagement of Artificial Intelligence systems, the identification of relevant data types, as well as defining and implementing monitoring solutions or tools collecting system/network data and reporting, most often involve innovation and, in some cases, research and development activities.
Although it seems predictive maintenance pertains mainly to IT systems, preventive and predictive maintenance actually has applications in other areas as well, such as in the case of complex production systems and processes. Thus, the activities mentioned in the previous paragraphs are also found, in organizations, at other levels than in IT departments.
47. Michael Schrage , AI Is Going to Change the 80/20 Rule, Harward Business Review, Feb 28, 2017, https://hbr.org/2017/02/ai-is-going-to-change-the-8020-rule;
48. Ibidem note 47;
34
Using the successful examples from other countries, there are certain measures that could be implemented in order to encourage private RDI investments, such as:
1. Clarifying the definitions of research, development and innovation activities that are eligible for the application of tax incentives, either by including more detailed definitions into legislation or by preparing guides with examples of eligible activities/processes in various industry sectors.
2. Designing guidelines on the evaluation of eligible RDI activities/projects by tax authorities with respect to applying specific tax incentives;
3. Clarifying and simplifying the administrative conditions for applying the existing tax incentives, especially for SMEs, so that the costs corresponding to the application of these facilities do not exceed the benefits obtained. This could significantly increase the usage of the additional corporate income tax deduction for eligible R&D expenses, the corporate tax exemption for companies that carry out only RDI activities and the income tax exemption for employees which carry out RDI activities, resulting in an increased level of private investments in RDI.
4. Extending the scope for the tax incentives and adapting them to the specifics of certain types of taxpayers, such as SMEs or companies in certain
sectors of activity:
• Extension of the scope for the tax relief on reinvested profit or allowing for higher corporate income tax deduction rates, with respect to the acquisition of innovative technologies, which would indirectly stimulate the creation of new technologies through RDI activities;
• Offering the possibility to benefit from tax credit and therefore to obtain tax refunds (instead of an additional deduction), at least in the case of SMEs, as this type of tax incentive would be more attractive for start-up companies, which incur tax losses and face financing difficulties.
• Introducing differentiated RDI tax incentives with respect to SMEs or for certain sectors of activity, which are considered of strategic importance. For example, besides tax credit, SMEs could also benefit from simplified conditions for documenting their activities.
5. Targeted funding of research projects from the state budget, for both public institutions and private entities (e.g. providing incentives for registering new patents, and grants for research projects in certain areas of strategic interest for the Romanian economy).
At the same time, the broader context in which research, development and innovation activities are carried out is very important. The government, through its policies, should provide the necessary infrastructure for innovation and be innovative as well, e.g. through digitalization of public administration or by using the “partnership for innovation” (the new public procurement procedure introduced in 2016). It is also important to facilitate innovation by creating a stable legal framework and ensuring equal opportunities to access resources through measures
which reduce differences/imbalances between the different regions of the country and between the different categories of taxpayers which carry out innovation activities.
Last but not least, to encourage the development of an innovation-based culture, the authorities could consider extending the existing tax incentives for innovation projects formalized within companies which do not necessarily have research and development as one of their objects of activity.
Conclusions and recommendations
Encouraging RDI through fiscal-budgetary policies
Facilitating innovation
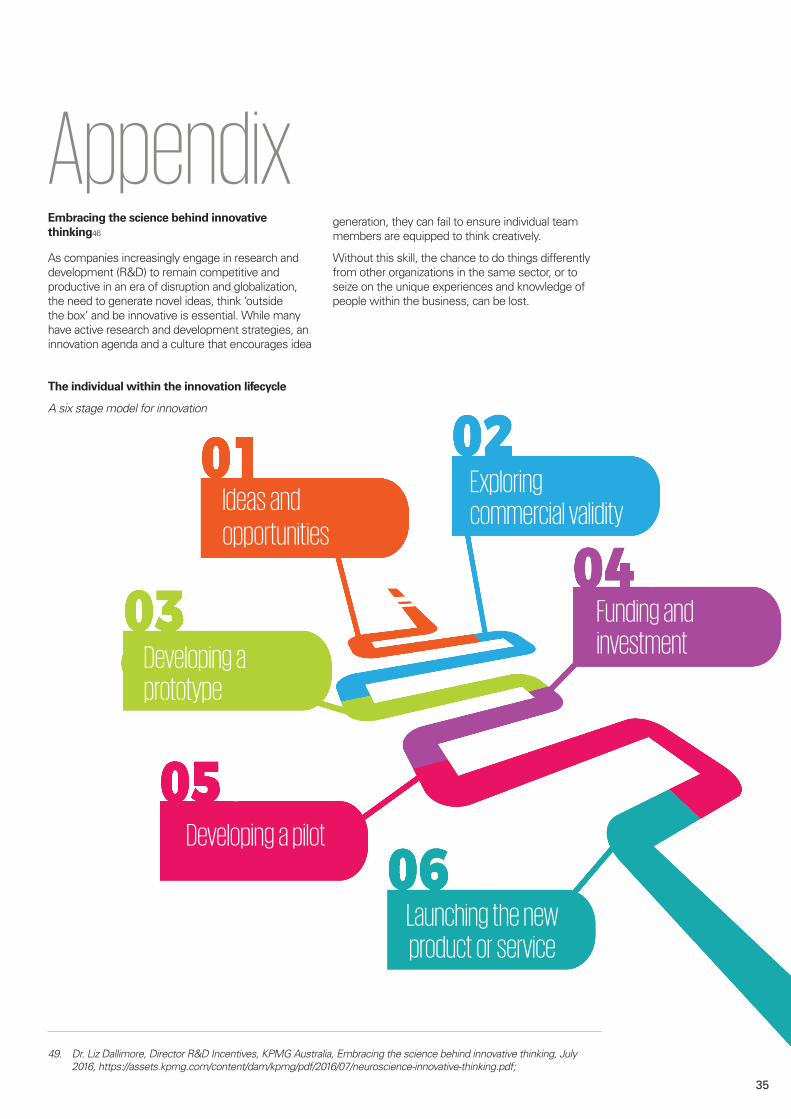
35
Appendix
The individual within the innovation lifecycle
A six stage model for innovation
Ideas and opportunities
Exploring commercial validity
Developing a prototype
Funding and investment
Developing a pilot
Launching the new product or service
Embracing the science behind innovative thinking46
As companies increasingly engage in research and development (R&D) to remain competitive and productive in an era of disruption and globalization, the need to generate novel ideas, think ‘outside the box’ and be innovative is essential. While many have active research and development strategies, an innovation agenda and a culture that encourages idea
generation, they can fail to ensure individual team members are equipped to think creatively.
Without this skill, the chance to do things differently from other organizations in the same sector, or to seize on the unique experiences and knowledge of people within the business, can be lost.
49. Dr. Liz Dallimore, Director R&D Incentives, KPMG Australia, Embracing the science behind innovative thinking, July 2016, https://assets.kpmg.com/content/dam/kpmg/pdf/2016/07/neuroscience-innovative-thinking.pdf;

36
A six stage model for an innovation lifecycle in a R&D-focused organization begins with ideas and opportunities. At this early point, individuals within a business need to feel capable and welcome to think creatively, suggest concepts and discuss them with colleagues or leaders.
Optimal creative thinking can springboard the next two stages in the cycle – exploring the commercial validity of the concept, and developing a rapid ‘safe to fail’ prototype and testing it.
If all is going to plan, the next stages are funding and investment, followed by developing a pilot and finally, launching the new product or service.
Helping team members to think creatively can maximize the potential of this process for the business. This is where foundations from the world of neuroscience can help, as they can shake up how people brainstorm, cooperate, and undertake daily tasks, as well as inspiring employees to be high-performance thinkers.
What does neuroscience tell us?
The emergence of ‘NeuroLeadership’ and ‘Creative Ideation’ has seen the corporate world develop an appetite for neuroscience. But how can R&D-focused businesses use the principles of neuroscience to embed a culture of high performance thinking amongst employees?
Neuroscience is the scientific study of the brain and nervous system. Typically, it differs from related scientific disciplines such as psychology in that neuroscientists are concerned with what is happening at the molecular and cellular level. A neuroscientist will delve into the brain to see how certain environmental cues, changes in behavior and thought processes affect the way neurons function. It is these changes in our neural pathways that neuroscientists are excited about, and it is a phenomenon we term neuroplasticity.
37
Helping team members to think creatively can maximize the potential of this process for the business.
“
Shaping new thoughts
Until relatively recently, many in the neuroscience community believed that our neural pathways were set in childhood development, and later no new neurons were formed. However, since the concept of neuroplasticity was introduced in the late 1960s (Raisman, 1969), neuroscientists have explored how changes in a person’s behavior can alter the neural pathways in the brain, and improve cognitive performance.
So how does this science have the potential to help innovation?
The development of sophisticated imaging techniques such as functional magnetic resonance imaging (FMRI), positron emission tomography (PET), and electroencephalogram (EEG) has allowed neuroscientists to attribute certain brain regions to creative tasks, letting us get a glimpse inside the brain of people who are more creative. It enables them to devise tasks everyone can do to train those areas of the brain.
The science of neuroplasticity
Neurons are the cells in the brain that transmit messages. Each is made up of an axon, cell body and dendrites, and they are linked by a small space called the synapse. A neuron on its own can’t do anything – it needs to ‘talk’ to many other neurons to elicit an action. It does this by sending electrical signals along its axon, which results in the release of chemicals (neurotransmitter/ neurotrophic factors) into the synapse.
For a nearby neuron to be affected, two things must happen. Firstly, it must be in close enough proximity to take up the chemicals. Secondly, it must have the required receptors on its surface to identify the chemicals. An electrical charge will flow down the axon of the neuron, and that neuron will release chemicals into the next synapse. As neurons continue to activate one another, they strengthen. This is the basis for neuroplasticity and indeed new learning – getting new neural pathways to start firing so that they wire together as humans develop a new skill, new thoughts and behaviors.
Activating new neural pathways
We have a neural pathway for all things we have ever encountered during our lives, every object, person, animal, situation, or task. The more we encounter them, the stronger those neural pathways become. For example, when you see someone you know well unexpectedly on the street, you instantly know who they are. The neural pathway for that person is fired so often in many different contexts.
However, if you see a distant relative at a family event every five years, the neural pathway for that person fires only when you see them in that context. So if you run into that person on the street, the neural pathway for that person does not automatically fire, because you don’t immediately associate the context of the street with that person. You’ll recognize them, but you might not instantly place who they are.
Think of neural pathways firing when we are undertaking a routine task. The brain simply uses the existing neural pathways it has already created. It is easier for the brain to do this and it expends less energy to use existing neural pathways. Neurons have a ‘memory’ (this is how we learn) for existing, well-trodden, neural pathways, and will revert to these unless trained to do otherwise. Therefore, to get the most out of our brain, we must train the areas of the brain that we use less in our typical activities.
38
Whilst there are a range of things we can do to train our brains to become more creative, openness to experience is one of the easiest to develop.
“How can individuals change their brains?
As the science of neuroplasticity begins to emerge in the area of creativity, neuroscientists have become fascinated with studying brains of creative people, as well as ordinary people trained to do creative tasks. Researchers tend to agree that creativity is the ability to produce work that is novel (original, unique), useful and generative (Sternberg & Lubart, 1996). Many of these studies look at the creation of novel ideas to open problems, in order to assess which areas of the brain are responsible for creativity. This type of creativity has been termed ‘creative ideation’ (Paulus & Brown, 2007).
When studying a person’s creative ability, or traits, a number of papers point to a trait termed ‘openness to experience’ as one of the single most consistent traits of creativity ability. This rang true in research contrasting scientists and non-scientists, more and less creative scientists, as well as artists and non-artists (Feist, 1998).
Openness to experience – the benefits for innovation
Whilst there are a range of things we can do to train our brains to become more creative, openness to experience is one of the easiest to develop. When we think about openness to experience, we can think in terms of neuroplasticity. If we are willing to try new things, we will start to form new neural pathways on a more regular basis. This will allow our brain to commit more tasks to memory and have a greater range of memories on which to draw from when attempting to generate new and novel ideas. This type of thinking will help fuel the innovative ideas in individuals.
How can individuals harness neural plasticity?
The aim of neuroplasticity is to break away from routine task. One of the most effective things we can do is to learn a musical instrument. This engages a whole range of brain functions, given that we need to visualize the music, move our hands and arms, listen to the feedback, and generate an emotional response.
A simpler way to get neural pathways firing is by walking a different way to work each morning, changing the location of staff meetings, working from a different desk or office, or taking regular lunch time walks to different locations and with new scenery.
Pay attention when creating new neural pathways
Attention is a conscious cognitive process that is essential to allow us to form new neural pathways. The more we pay attention to a task, the greater the signal that is being generated throughout the new neural pathway. If our mind begins to wander whilst we are trying to create a new neural pathway, other non-associated areas of the brain will also fire, making it less likely for us to solidify the neural pathway of interest and commit the new task to memory.
Attention is important, but a lot of us struggle to stay focused. This is largely because the brain is highly situational. Our subconscious mind is phenomenal in the amount of information it is able to process, especially from our physical surroundings. When we are in a room our brain is constantly processing stimuli, including lighting, sounds, space, colors, temperature, and even furniture. All of these stimuli can inhibit or promote brain plasticity.
It has been estimated that the subconscious mind can process 11 million pieces of information per second. However, our conscious mind can only process 40 items per second. Interestingly, it is our sense of hearing, not vision, that seems to have a greater impact on our subconscious. The more prevalent the external stimuli, the more energy the
39
subconscious brain requires to distract the conscious brain from its existence, and therefore the less likely new neural pathways will be committed to memory.
How does this science help organizations with R&D?
Generating novel ideas to solve problems within an organization is the essence of a good R&D and innovation strategy. However, our brains are programmed to do the same thing the same way, and therefore achieving this can be challenge. Organizations that encourage individuals to develop their creative thinking and idea generation through the principles of neuroplasticity, while also ensuring that the company culture and strategy supports that thinking, can be in a stronger position to have a thriving approach to R&D and innovation.
For this approach to be effective, leaders must explain the science behind neuroplasticity and creative thinking to their teams, and develop a program of activity around high-performing thinking. This could take a range of forms, with one example being to encourage individuals to explore new activities that enhance neuroplasticity, through being more open to new experiences and by paying attention when learning new tasks.
This approach could help individuals to think differently, brainstorm effectively, cooperate positively and share innovative concepts that could one day prove a competitive advantage for the broader business.
40
GlossaryCEE Central and Eastern Europe
EIS European Innovation Scoreboard
EU European Union
GDP Gross Domestic Product
OECD Organisation for Economic Co-operation and Development
R&D Research and Development
RDI Research, Development and Innovation
SME Small and Medium Enterprises
USD United States Dollar
41
Bibliography1. Aghion, P., & Howitt, P. (1990). A model of
growth through creative destruction (No. w3223). National Bureau of Economic Research;
2. Chou, Y.K. (2002). The Australian growth experience (1960-2000), R&D based, human capital-based or just steady state growth? Research Paper No. 855. Department of Economics, University of Melbourne;
3. Empirical Analysis, IMF Working Paper, WP/04/185;
4. Eurostat, http://ec.europa.eu/eurostat/statistics-explained/index.php/R_%26_D_personnel;
5. European Commission, 2016, European Innovation Scoreboard http://ec.europa.eu/growth/industry/innovation/facts figures/scoreboards_es;
6. Eurostat, First estimates of Research & Development expenditure - http://ec.europa.eu/eurostat/documents/2995521/7752010/9-30112016-BP-EN.pdf/62892517-8c7a-4f23-8380-ce33df016818;
7. Griliches, Z., 1995. R&D and productivity. In: Stoneman, P. Ed.., Handbook of Industrial Innovation. Blackwell, London;
8. Goel, R.K., Payne, J.E., & Ram. (2008). R&D expenditures and U.S. economic growth: A disaggregated approach. Journal of Policy Modeling, 30, 237–250. 10.1016/j.jpolmod.2007.04.008;
9. Griffith, R., Redding, S., & Van Reenen, J. (2004). Mapping the two faces of R&D: Productivity growth in a panel of OECD industries. Review of economics and statistics, 86(4), 883-895;
10. Grossman, G.M., Helpman, E. (1991). Innovation and Growth in the Economy. MIT Press, Cambridge, MA;
11. Iancu, Victor, (2014) Industrial Property and Intellectual Production Marketing, The Publishing House of the Romanian Academy;
12. Institutul Național de Statistica, http://www.insse.ro/cms/files/Web_IDD_BD_ro/O10/O10_1-Cheltuieli%20totale%20cu%20activitati%20de%20cercetare-dezvoltare%20ca%20%25%20din%20PIB.doc;
13. Institutul National de Statistica, http://www.insse.ro/cms/ro/content/activitatea-de-cercetare-
dezvoltare-anul-2015;
14. Jones, C. I., & Williams, J. C. (1998). Measuring the social return to R&D. The Quarterly Journal of Economics, 113(4), 1119-1135;
15. Kim, L.W. (2011). The Economic Growth Effect of R&D Activity in Korea. Korea and the World Economy, 12(1), 25-44;
16. Kwack, S. Y., & Lee, Y. S. (2006). Analyzing the Korea’s growth experience: The application of R&D and human capital based growth models with demography. Journal of Asian Economics, 17(5), 818-831 & Jin, J. C., (2009). Economic research and economic growth: Evidence from East Asian economies. Journal of Asian Economics, 20, 150–155.doi: 10.1016/j.asieco.2008.12.002;
17. OECD Factbook 2013, Science and Technology, OECD, 2013;
18. Peng, L. (2010). Study on Relationship between R&D Expenditure and Economic Growth of China. Proceedings of the 7th International Conference on Innovation & Management, 1725-1728;
19. Pessoa, A. (2010). R&D and economic growth: How strong is the link? Economic Letters 107, 152-154;
20. Pianta, M. (1998), New technology and Jobs. In J. Michie, and J.G. Smith, Globalization, Growth and Governance: Creating an Innovative Economy, (p.83). Oxford University Press, United States;
21. Romer, P. M. (1990). Endogenous technological change. Journal of political Economy, 98 (5, Part 2), S71-S102;
22. Sadraoui, T., Ali, T.B., Deguachi, B. (2014). Economic Growth and International R&D Cooperation: A Panel Granger Causality Analysis. International Journal of Econometrics and Financial Management, 2(1), 7-21;
23. Science, Research and Innovation performance of the EU, (2016) European Commission;
24. Todaro, M. P. (1997). Economic Development 6th Edition, New York;
25. Ulku, H. (2004). P.S. (2000). R&D, Innovation, and Economic Growth: An Zachariadis, M. (2004). R&D R&D-induced Growth in the OECD?
42
Review of Development Economics, 8(3), 423-439;
26. Appelt, S. et al. (2016), “R&D Tax Incentives: Evidence on design, incidence and impacts”, OECD Science, Technology and Industry Policy Papers, No. 32, OECD Publishing, Paris. http://dx.doi.org/10.1787/5jlr8fldqk7j-en;
27. Taxation Paper No 52 (2014): A Study on R&D Tax Incentives. Scris de CPB Netherlands Bureau for Economic Policy Analysis în consorțiu cu CAPP, CASE, CEPII, ETLA, IFO, IFS, IHS, http://ec.europa.eu/DocsRoom/documents/8033/attachments/1/translations/en/renditions/native;
28. Government Emergency Ordinance no. 200/2008, amending Law no. 571/2003 on the Fiscal Code;
29. Government Ordinance no. 8/ 2013, amending Law no. 571/2003 on the Fiscal Code;
30. Government Emergency Ordinance no. 32/2016, on amendments to Law no. 227/2015 on the Fiscal Code and certain financial and fiscal measures, and Order no. 899/2016 on qualifying applied research and development and/or technological development activities;
31. Government Emergency Ordinance no. 3/2017, amending Law no. 227/2015 on the Fiscal Code;
32. National Research, Development and Innovation Strategy – 2014-2020, 21 October 2014;
33. European Commission, 2013, Innovation Union Scoreboard;
34. Komsan Sanongpong, Automotive Process-based New Product Development: A Review of Key Performance Metrics, Proceedings of the World Congress on Engineering 2009 Vol I WCE 2009, July 1 - 3, 2009, London, U.K.;
35. European Automobile Manufacturers Association, The Automobile Pocket Guide 2017-2018, http://www.acea.be/uploads/publications/ACEA_Pocket_Guide_2017-2018.pdf;
36. Kirk Gutmann, SVP of Industry Strategy, Siemens PLM Software, “The importance of agile design in the automotive industry”, Global Manufacturing Nov 24, 2015, http://www.manufacturingglobal.com/technology/importance-agile-design-automotive-industry;
37. Efma & Backbase, Omni-channel banking: The digital transformation roadmap, 2015, https://urldefense.proofpoint.com/v2/url?u=http-3A__www.backbase.com_wp-2Dcontent_uploads_2017_04_Backbase-5FOmni-2DChannel-2DBanking-2DReport.pdf&d=DwICAw&c=vgc7_vOYmgImobMVdyKsCY1rdGZhhtCa2JetijQZAG0&r=2QJnxBeoOFikHyYUylo-wg&m=acmXP7vVPnwegSiFqqKIBDnHXRqXeVzCY7OoWfPNgCw&s=33F0kJkhFBiXw_u0GlPhhGraRB8Tz7Z_C1CHHsfJw60&e=;
38. ShepHertz, Omni-Channel Digitization & Marketing Automation Platform, https://www.slideshare.net/shephertz/banking-services-marketing-automation-and-omnichannel-banking;
39. Candice Hudson, Media Communications Specialist, Schneider Electric’s Software Business, Optimizing Operations and Maintenance with Predictive Analytics, http://blog.schneider-electric.com/industrial-software/2015/07/17/optimizing-operations-maintenance-predictive-analytics/;
40. Manuel Dias, Business Analytics Lead, Microsoft, Accelerating digital transformation through Advanced Analytics, Machine Learning for Predictive Maintenance, https://www.linkedin.com/pulse/machine-learning-predictive-maintenance-manuel-dias;
41. Michael Schrage , AI Is Going to Change the 80/20 Rule, Harward Business Review, Feb 28, 2017, https://hbr.org/2017/02/ai-is-going-to-change-the-8020-rule;
42. G. Raisman, ‘Neuronal plasticity in the septal nuclei of the adult rat’, Brain Research, vol. 14, no. 1, pp. 25–48, 1969;
43. R.J. Sternberg, T.I. Lubart, Am. Psychol. 7 (1996) 677–688;
44. Paulus P.B., Brown V.R., ‘Toward more creative and innovative group idea generation: a cognitive-social-motivational perspective of brainstorming’, Social and Personality Psychology Compass, 2007; 1:248–265;
45. Feist G.J., ‘A meta-analysis of personality in scientific and artistic creativity,’ Personality and Social Psychology Review. 1998; 2:290–309.

43
44
Ramona Jurubiță Partner, Head Tax and LegalEmail: [email protected]
Victor IancuSenior Manager Advisory, Innovation TeamEmail: [email protected]
Monica Pascu Manager Taxation services, Innovation TeamEmail: [email protected]
Cristian Tătaru Associate Manager Taxation services, Innovation TeamEmail: [email protected]
Cristina SpirescuAssociate ManagerTaxation services, Innovation TeamEmail: [email protected]
Teodora AlecuDirector Taxation servicesEmail: [email protected]
Contact
KPMG RomaniaBucureștiVictoria Business Park, DN1, Șos. Bucuresti - Ploiestinr. 69-71, Sector 1, București 013685, România P.O. Box 18-191 T: +40 (372) 377 800F: +40 (372) 377 700E: [email protected] www.kpmg.ro
Cluj NapocaLiberty Technology ParkStrada Gării nr. 21, Cluj-Napoca, Cluj, RomâniaT: +40 (372) 377 900F: +40 (753) 333 800E: [email protected]
ConstanțaBlv. Mamaia nr. 208, Etaj 4, Constanța, 900540, România T: +40 (756) 070 044 F: +40 (752) 710 044 E: [email protected]
IașiIdeo Business Center, Strada Păcurari nr. 138, Etaj 1, Birou B 105Iasi, 700521, România T: +40 (756) 070 048 F: +40 (752) 710 048 E: [email protected]
TimișoaraBlv. Mihai Viteazul nr. 30B,Timișoara, 300222Timiș, RomâniaT: +40 (256) 221 365F: +40 (256) 499 361E: [email protected]
KPMG MoldovaChișinăuBlv. Ștefan cel Mare nr. 171/1Etaj 8, MD-2004, ChișinăuRepublica MoldovaT: + 373 (22) 580 580F: + 373 (22) 540 499E: [email protected] www.kpmg.md
kpmg.com/socialmedia
The information contained herein is of a general nature and is not intended to address the circumstances of any particular individual or entity. Although we endeavor to provide accurate and timely information,there can be no guarantee that such information is accurate as of the date it is received or that it will continue to be accurate in the future. No one should act on such information without appropriate professionaladvice after a thorough examination of the particular situation.
The KPMG name and logo are registered trademarks or trademarks of KPMG International.
© 2017 KPMG Romania S.R.L., a Romanian limited liability company and a member firm of the KPMG network of independent member firms affiliated with KPMG International Cooperative (“KPMG International”), a Swiss entity. All rights reserved.