Embed Size (px)
Citation preview

ABRIDGED ANNUAL REPORT 2016 - 17
Taurus Mutual Fund
Toll Free No.1800 108 1111www.taurusmutualfund.com
An expert team of professionals to drive your investment
Taurus Mutual Fund
Managing an AAUM of `2,529 Crs. (FY 2016 - 2017)
Product Basket
7 Equity Funds
4 Fixed Income Funds
1 Equity Linked Saving Scheme
Professional Service Providers:
Registrar & Transfer Agent : Karvy Computershare Pvt. Ltd.
Custodian: SBI-SG Global Securities Services Pvt. Ltd.
Fund Accountant : SBI-SG Global Securities Services Pvt. Ltd.
An Experienced and Professional Team across all Functions
Please refer Common Scheme Information Document (CSID) / Common Key Information Memorandum (CKIM) for details on Product Labeling
SPONSOR : HB Portfolio Limited
TRUSTEE : Taurus Investment Trust Company Limited CIN: U65990MH1993PLC072984
ASSET MANAGEMENT COMPANY : Taurus Asset Management Company Limited CIN: U67190MH1993PLC073154
AUDITORS : M/s Deloitte Haskins & Sells LLP
CUSTODIAN : SBI-SG Global Securities Services Pvt. Ltd.
REGISTRAR & TRANSFER AGENT : Karvy Computershare Private Limited
FUND ACCOUNTANT : SBI-SG Global Securities Services Pvt. Ltd.
• Taurus Starshare
• Taurus Bonanza Fund
• Taurus Discovery Fund
• Taurus Tax Shield
• Taurus Ethical Fund
• Taurus Infrastructure Fund
• Taurus Banking & Financial Services Fund
• Taurus Nifty Index Fund
• Taurus Liquid Fund
• Taurus Ultra Short Term Bond Fund
• Taurus Short Term Income Fund
• Taurus Dynamic Income Fund
PRODUCT BASKET
Taurus Investment Trust Company Limited
Mr. G. N. Tandon
Mr. K. N. Goyal
Mr. Harbhajan Singh
Mr. Lalit Malhotra
Mr. Anil Goyal
Mr. Yash Kumar Sehgal
Taurus Asset Management Company Limited
Mr. J. P. Kundra
Mr. M. G. Gupta
Mr. Lalit Bhasin
Maharaj Jai Singh
Mr. R. K. Gupta, M. D.
Mr. Harbans Lal
BOARD OF DIRECTORS
ABRIDGED ANNUAL REPORT 2016 - 2017
Ground Floor, AML Centre-1, 8 Mahal Industrial Estate, Mahakali Caves Road, Andheri (E), Mumbai - 400 093.Email: [email protected] • Website: www.taurusmutualfund.com
Ground Floor, AML Centre-1, 8 Mahal Industrial Estate, Mahakali Caves Road, Andheri (E), Mumbai - 400 093.Email: [email protected] • Website: www.taurusmutualfund.com
1
Dear Unit Holders,
We thank you for the trust reposed in us and our team.
The year gone by saw two major events for the country- Demonetisation and GST, which have the potential to change the landscape of the economy for years to come. On the mutual fund industry front, the return of Indian investor to the equity markets, which started in 2014, further accelerated as inflows reached record highs.
Indian equity markets had a good FY2017 with the broad- based rally continuing. The markets rallied capturing many hurdles such as muted earnings growth, demonetization, US presidential elections, Brexit and spurts of geo-political tensions. The strength in the market was on the back of strong domestic and global fund flows, improving macros and optimistic view of India's future under the Modi government.
Domestic factors remained supportive with low inflation, controlled fiscal deficit, stable currency and normal monsoon. However, the growth turnaround in corporate earnings remained muted. On the monetary front, the stance was "accommodative" in the initial part of the year. However, the Reserve Bank of India changed its stance of monetary policy from "accommodative" to "neutral" at its monetary policy meeting in February 2017.
The key global events for the year were Brexit, the election of Donald Trump and the relatively more hawkish US Fed, after it hiked rates in December 2016. With regard to the global economy, there was a moderation in growth in both developed and emerging markets. Global trade showed indications of revival. Broadly, the focus has shifted from crisis management seen in the years following 2008, to growth now.
India remains one of the best placed domestic growth stories. Favourable demographic profile, improving per capita income and large consumer base domestically are all known advantages. Relatively low level of private corporate debt, improving macros and stable government are added advantage. Also, India has made progress on key reforms including measures to increase infrastructure investment, ease FDI policies, ease of doing business and simplifying bureaucratic processes. India has climbed "Ease of Doing business" by notches and now it is expected to improve further. In-fact, there is an expectation that while GST will help us climb this Index further, we can even see a rating upgrade for the country.
Taurus had its share of ups and downs in the year gone by. We also added Dhereraj Singh, an IIM alumni as Head of Investments to our team.
We strongly believe that the investors who invest regularly and remain invested for medium to long-term will surely reap the rewards.
Thank you
Yours Truly
Waqar Abbas NaqviChief Executive
ABRIDGED ANNUAL REPORT 2016 - 2017
PERFORMANCE OF TAURUS MUTUAL FUND AND ITS FUTURE PLANS
During the financial year, Taurus Mutual Fund witnessed a significant drop in AUM of debt schemes pursuant to default in repayment of maturity proceeds of commercial papers "CP" issued by Ballarpur Industries Limited "BILT". In order to protect the interest of the schemes' investors and to ensure equitable and fair treatment to all class of investors, the board of Taurus AMC and Trustee Co in its meeting dated February 22, 2017 decided that the investment in CP of BILT be treated as non-performing asset with immediate effect and full provision should be made against the same. Further, the sale of fresh units in these affected schemes was also suspended till further notice. We expect that these affected debt schemes will resume operations during FY18.
The average net assets of the schemes of Taurus Mutual Fund for FY 17 stood at Rs 2,529 crores compared to Rs 4,099 crores in the previous year. At present, Taurus Mutual Fund is managing seven open ended equity oriented schemes, one ELSS scheme and four open ended debt oriented schemes.
In the coming years, the focus would be to bring further improvement in the operations, both in terms of increasing the AUM and improving the performance. Efforts would be towards increasing the number of retail folios by exploring alternate channels and also to add new retail clients. We shall continue in our efforts to carry out investor education initiatives.
A GLANCE AT THE SCHEMES OF TAURUS MUTUAL FUND
At present, Taurus Mutual Fund is managing the following open ended schemes:
Equity oriented schemes:
• Taurus Starshare
• Taurus Discovery Fund
• Taurus Bonanza Fund
• Taurus Infrastructure Fund
• Taurus Ethical Fund
• Taurus Nifty Index Fund
• Taurus Tax Shield
• Taurus Banking & Financial Services Fund
Debt schemes:
• Taurus Liquid Fund
• Taurus Ultra Short Term Bond Fund
• Taurus Short Term Income Fund
• Taurus Dynamic Income Fund
Details of each open-ended scheme managed by Taurus Mutual Fund covering its investment objective, past performance as well as future outlook are as under:
Taurus Starshare:
This is an open-ended equity growth scheme. The Scheme's investment objective is to provide long term capital appreciation. Emphasis will be on sharing growth through appreciation as well as distribution of income by way of dividend. A major portion of the funds of the Scheme is being invested in equity shares. The Scheme pursues the policy of diversification of its assets in terms of industry's exposure.
In last one year, performance of the Scheme has been able beat the benchmark due to allocation of assets to mid-cap ideas and also underweight positions in the IT and Pharmaceuticals sector. This has also helped scheme to outperform in longer period of time. The Scheme has significantly improved the rankings in last one year. The efforts are being made to improve the performance of the Scheme in the coming years and sustain the top quartile performance.
Returns (%)
Regular Plan - Direct Plan - S&P Additional Benchmark Duration Growth Option Growth Option BSE 200 Nifty 50 (RP) (DP)
6 Months 6.76 6.85 7.32 6.53
1 Year 22.09 23.11 22.47 18.55
3 Years 14.61 15.76 14.17 11.01
5 Years 13.76 N.A 13.08 11.60
Since inception (RP: 10.51 12.30 9.37 (RP) 8.90 (RP)Jan 29,1994 12.22 (DP) 10.72 (DP)and DP : Jan 01, 2013)
Note: Past performance may or may not be sustained in the future. Returns less than one year are absolute and more than or equal to one year are compounded on an annualised basis. Regular and Direct plan has a different expense structure.
TRUSTEES REPORT FOR THE FINANCIAL YEAR 2016-17
Ground Floor, AML Centre-1, 8 Mahal Industrial Estate, Mahakali Caves Road, Andheri (E), Mumbai - 400 093.Email: [email protected] • Website: www.taurusmutualfund.com
Dear Friends,
We are pleased to present the 23rd Annual Report and Audited Financial Statements of the Schemes of Taurus Mutual Fund for the year ended March 31, 2017.
ECONOMIC SCENARIO
A brief summary of the economic scenario under broad heads is given below:
Growth
• The slowdown in FY17 was largely a result of slump in services segment and poor industrial output.
• Although transitory, withdrawal of 86% of currency exacerbated the slowdown.
• A healthy monsoon in 2017 brought immense cheer to the agriculture sector. It registered the highest growth at 4.4% in FY17 and thus arrested downside to the overall growth.
• GVA is projected to grow at 6.7% in FY17 which is 110bps lower than that seen in FY16.
Inflation
• CPI continued to walk on the glide path, averaging out to 4.5% in FY17 vs 4.9% last year.
• WPI averaged 3.5% compared to 2.5% last year.
• The sharp drop in CPI inflation was mainly food-led, particularly pulses & vegetables.
• While the headline CPI moderated, stickiness in core inflation remained a concern for the Monetary Policy Committee (MPC); causing the MPC to change its policy stance.
Fiscal Deficit
• After trimming the fiscal deficit target by 40bps to 3.5% in FY17 (3.9% in FY16), the government has set a fiscal deficit target of 3.2% for FY18.
• Since the States undertook DISCOM losses under the UDAY scheme, the State finances are facing pressure. As per the Economic Survey 2017, States Deficit in FY16 widened to 3.6% of GDP from 2.5% in FY15. In FY17, it is expected to be in the range of 3% - 3.20%.
• In FY16, the issuance of UDAY bonds stood at INR 0.99tn and increased to INR 1.1tn in FY17.
Current Account Deficit (CAD)
• CAD has narrowed down for straight three years.
• After testing levels of ~5.0% of GDP in FY13, it has reduced to ~0.8% of GDP in FY17; the lowest in 13-years.
• The withdrawal of Specified Bank Notes was a big reform which changed the liquidity dynamics pushing the systemic liquidity into deep surplus.
• Policy positives such as passage of GST and resounding victories of the ruling party in state elections helped buoy the markets.
• Strong FPI inflows in both debt and equity pushed the INR higher as it appreciated from 68+ to 64+. The stability and strength of the INR has helped to keep outflows in check even during the most volatile of times such as the post demonetization period.
OVERVIEW OF THE MUTUAL FUND INDUSTRY PERFORMANCE
The Mutual Fund Industry in India witnessed another successful year recording all time high AAUM of Rs 18.35 lakh crore for the quarter ending March 2017. The MF Industry's AUM has tripled in the last 5 years from Rs 5.87 lakh crore as on 31st March, 2012 to Rs 17.55 lakh crore as on 31st March, 2017.
The closing net assets of the Industry as on March 31, 2017 stood at Rs 17.55 lakh crores vis a vis Rs 12.33 lakh crores as on March 31, 2016, registering a growth of 42.33% in net assets during the year. The net sales of the Industry across all asset classes increased to Rs 1.76 lakh crores from Rs 1.34 lakh crores in the previous year. The proportionate share of equity-oriented schemes is now 32.8% of the industry's assets in March 2017, up from 31.1% in March 2016. The number of investor accounts also increased from 4.77 crores to 5.54 crores showing a growth of 16.23% over FY 16.
The Securities and Exchange Board of India (SEBI) announced certain measures during the year to bring about greater transparency in the interest of the investors and promote the development of the Industry. Some of the key measures are as under:
1. The change in guidelines for imposing restriction on redemption. The redemption amount up to Rs 2 lakhs shall not be subjected to any restriction.
2. Amending the submission time of Scheme Information Document from two days to seven days, prior to the launch of the scheme.
3. A change in information disclosure norms for Consolidated Account Statement (CAS) issued to investors. CAS shall now contain additional data on the amount of actual commission paid by AMCs/Mutual Funds (MFs) to distributors in absolute terms during the half-year period against the concerned investor's total investments in each MF scheme along with expense ratio charged for the applicable scheme / plan.
2
ABRIDGED ANNUAL REPORT 2016 - 2017
Ground Floor, AML Centre-1, 8 Mahal Industrial Estate, Mahakali Caves Road, Andheri (E), Mumbai - 400 093.Email: [email protected] • Website: www.taurusmutualfund.com
Taurus Discovery Fund:
This is an open-ended equity growth scheme with a focus on medium and small size companies. The investment objective of the Scheme is to provide capital appreciation by identification of low priced stocks through a price discovery mechanism. The benchmark index for the scheme is Nifty Free Float Midcap 100. The performance of the Scheme in comparison to its benchmark indices is given below:
The performance of the Scheme reflects improved rankings among peers but below benchmark in short period of time. Large numbers of companies from PSU Banks and Stressed companies have done well which are not part of the scheme impacted the short term performance. However, the performance under 3 years, 5 years and since inception (under Direct Plan) category remained healthy. Our efforts are to make the performance consistent and to bring the Scheme into top quartile.
Returns (%)
Regular Plan - Direct Plan - S&P BSE Additional Benchmark Duration Growth Option Growth Option 500 Shariah Nifty 50 (RP) (DP)
6 Months 0.60 1.00 2.64 6.53
1 Year 13.49 14.56 11.73 18.55
3 Years 13.75 14.61 14.28 11.01
5 Years 13.96 N.A 14.34 11.60Since inception 19.70 15.61 15.90 (RP) 13.84 (RP) (RP: Apr 06, 2009 & 15.24 (DP) 10.72 (DP) DP : Jan 01, 2013)
Note:Past performance may or may not be sustained in the future. Returns less than one year are absolute and more than or equal to one year are compounded on an annualised basis. Regular and Direct plan has a different expense structure.
Returns (%)
Regular Plan - Direct Plan S&P Additional Benchmark Duration Growth Option Growth Option BSE 200 Nifty 50 (RP) (DP)
6 Months 6.91 7.14 7.32 6.53
1 Year 25.68 26.83 22.47 18.55
3 Years 15.64 16.75 14.17 11.01
5 Years 13.77 N.A 13.08 11.60
Since inception 11.29 12.74 12.35 (RP) 11.20 (RP)(RP: Mar 31, 1996 & 12.22 (DP) 10.72 (DP)DP : Jan 01, 2013)
Note: Past performance may or may not be sustained in the future. Returns less than one year are absolute and more than or equal to one year are compounded on an annualised basis. Regular and Direct plan has a different expense structure.
Taurus Bonanza Fund:
This is an open-ended equity growth scheme with substantial exposure to equity shares of large Indian companies. The investment objective of the Scheme is to provide long term capital appreciation by investing in equity and equity related instruments. The portfolio of the Scheme is well diversified with exposure to various sectors. The performance of the Scheme in comparison to its benchmark indices is given below:
In last one year, equity market has shown huge sectoral swings, particularly, in IT, Pharma, FMCG, and Oil & Gas sector. The performance of the Scheme, being a large cap, has therefore, been affected on account of volatility in these sectors. Efforts are being done to bring down the concentration of the scheme across winning sectors and companies and deliver the top quartile performance.
Taurus Tax Shield:
This is an open-ended equity linked tax saving scheme with an endeavour to provide long term capital appreciation by investing in a portfolio of equity and equity-linked securities. The investment objective of the Scheme is to provide long term capital appreciation over the life of the scheme through investment pre-dominantly in equity shares, besides tax savings. Being a tax saving scheme, there is a lock-in period of 3 years from the date of allotment. Further, an investment up to Rs 1.50 lakh in Taurus Tax Shield scheme by an individual or HUF is eligible for deduction under section 80C of the Income Tax Act, 1961. The performance of the Scheme in comparison to its benchmark indices is given below:
The short term performance is marginally below the benchmark but there is significant improvement in the rankings. The investment in the Scheme is normally made for a long term purpose being a lock-in period of 3-years. Therefore, the performance of the Scheme in last 3-years and 5-years is well comparable with the respective benchmark index and has been able to outperform the benchmark
Taurus Infrastructure Fund:
This is an open-ended equity thematic fund with infrastructure as the basic theme, where in investments are made in the equity shares of companies operating in the infrastructure sector, it's related industries inclusive of suppliers of capital goods, raw materials and other supportive services to infrastructure companies. Portfolio construction is oriented towards those Companies which are directly or indirectly involved in the Infrastructure sector with mandate of investing in large infrastructure related companies. The performance of the Scheme in comparison to its benchmark indices is given below:
Thrust on the infrastructure sector has helped scheme to do well. Scheme has improved performance and therefore was able to beat the benchmark S&P BSE 200 in majority of durations. The long term outlook of the sector is looking bright and will help the scheme to outperform the benchmark.
Taurus Banking & Financial Services Fund:
The primary objective of the Scheme is to generate capital appreciation through a portfolio that invests predominantly in equity and equity related instruments of Banking, Financial and Non-Banking Financial Companies that form part of the BFSI Sector. The performance of the Scheme in comparison to its benchmark indices is given below:
Banking sector had been under pressure on account of increase in the NPA level. In financial year ended March 31, 2017, most of the banks, both in private as well as public sector have either incurred losses or reported lower profits. Accordingly, the prices of most of the banking stocks were under pressure. However, in spite of extreme volatility in the bankex, the scheme performance has moved in tandem with its benchmark
Taurus Ethical Fund:
This is an open-ended equity fund which aims to provide capital appreciation and income distribution to the unitholders through investment in a diversified portfolio of equities, which are based on the principles of Shariah. This is the first actively managed Shariah based fund in India. The performance of the Scheme in comparison to its benchmark indices is given below:
3
Returns (%)
Regular Plan - Direct Plan - S&P Additional Benchmark Duration Growth Option Growth Option BSE 200 Nifty 50 (RP) (DP)
6 Months 10.75 11.09 7.32 6.53
1 Year 32.05 33.31 22.47 18.55
3 Years 19.59 20.75 14.17 11.01
5 Years 12.94 N.A 13.08 11.60
Since inception 7.75 13.48 10.40 (RP) 9.79 (RP)(RP: Mar 05, 2007 & 12.22 (DP) 10.72 (DP)DP : Jan 01, 2013)
Note: Past performance may or may not be sustained in the future. Returns less than one year are absolute and more than or equal to one year are compounded on an annualised basis. Regular and Direct plan has a different expense structure.
Returns (%)
Regular Plan - Direct Plan - S&P Additional Benchmark Duration Growth Option Growth Option BSE 100 Nifty 50 (RP) (DP)
6 Months 4.49 4.68 7.11 6.53
1 Year 19.74 20.89 21.17 18.55
3 Years 14.18 15.45 12.27 11.01
5 Years 11.77 N.A 12.29 11.60
Since inception 10.87 11.20 10.19 (RP) 10.47 (RP)(RP: Feb 28, 1995 & 11.10 (DP) 10.54 (DP)DP : Jan 02, 2013)
Note: Past performance may or may not be sustained in the future. Returns less than one year are absolute and more than or equal to one year are compounded on an annualised basis. Regular and Direct plan has a different expense structure.
Returns (%)
Regular Plan - Direct Plan - S&P Additional Benchmark Duration Growth Option Growth Option BSE Bankex Nifty 50 (RP) (DP)
6 Months 9.60 10.07 10.77 6.53
1 Year 30.20 31.64 32.78 18.55
3 Year 14.53 16.03 18.76 11.01
Since inception 14.60 9.44 18.54 (RP) 13.95 (RP)(RP: May 22, 2012 & 12.71 (DP) 10.54 (DP)DP : Jan 02, 2013)
Note: Past performance may or may not be sustained in the future. Returns less than one year are absolute and more than or equal to one year are compounded on an annualised basis. Regular and Direct plan has a different expense structure.
ABRIDGED ANNUAL REPORT 2016 - 2017
Returns (%)
Regular Plan - Direct Plan - Nifty Free Additional Benchmark Duration Growth Option Growth Option Float Midcap Nifty 50 (RP) (DP) 100
6 Months 7.40 7.60 11.57 6.53
1 Year 32.47 33.15 34.85 18.55
3 Years 25.92 26.64 25.90 11.01
5 Years 22.62 N.A 17.38 11.60
Since inception 5.96 19.55 9.52 (RP) 8.84 (RP)(RP: Sept 05, 1994 & 17.72 (DP) 10.72 (DP)DP : Jan 01, 2013)
Note: Past performance may or may not be sustained in the future. Returns less than one year are absolute and more than or equal to one year are compounded on an annualised basis. Regular and Direct plan has a different expense structure.
Ground Floor, AML Centre-1, 8 Mahal Industrial Estate, Mahakali Caves Road, Andheri (E), Mumbai - 400 093.Email: [email protected] • Website: www.taurusmutualfund.com
4
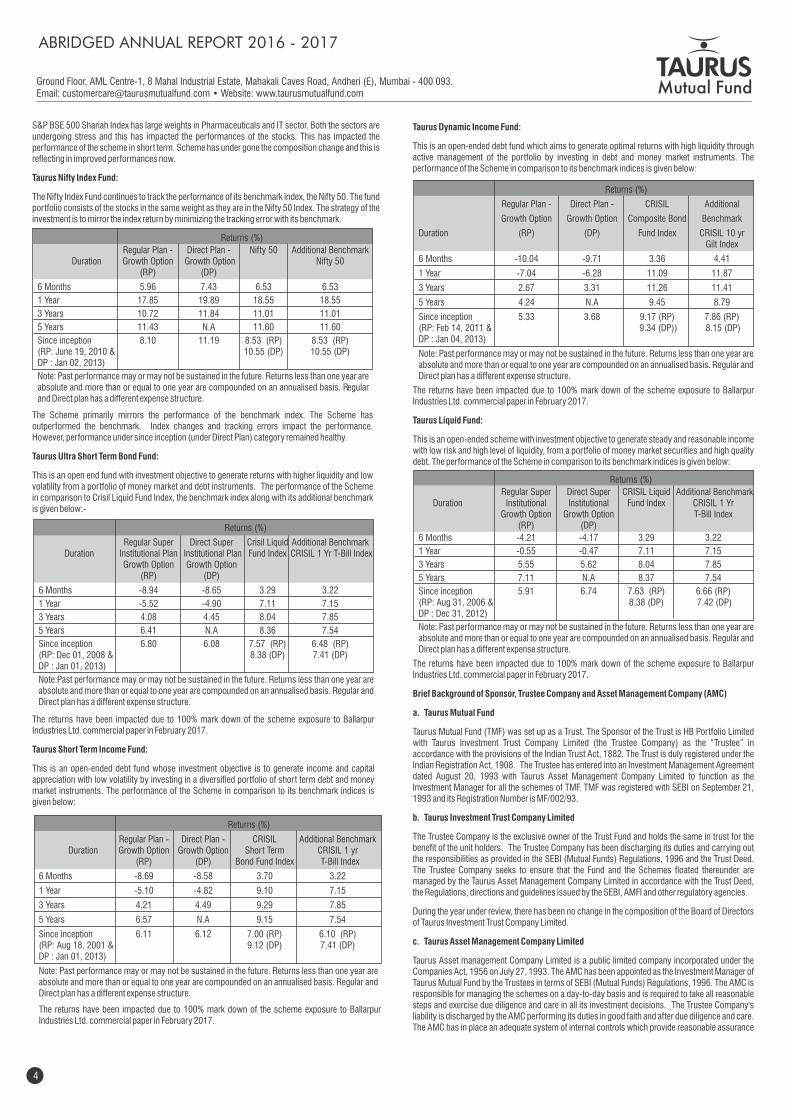
S&P BSE 500 Shariah Index has large weights in Pharmaceuticals and IT sector. Both the sectors are undergoing stress and this has impacted the performances of the stocks. This has impacted the performance of the scheme in short term. Scheme has under gone the composition change and this is reflecting in improved performances now.
Taurus Nifty Index Fund:
The Nifty Index Fund continues to track the performance of its benchmark index, the Nifty 50. The fund portfolio consists of the stocks in the same weight as they are in the Nifty 50 Index. The strategy of the investment is to mirror the index return by minimizing the tracking error with its benchmark.
The Scheme primarily mirrors the performance of the benchmark index. The Scheme has outperformed the benchmark. Index changes and tracking errors impact the performance. However, performance under since inception (under Direct Plan) category remained healthy.
Taurus Ultra Short Term Bond Fund:
This is an open end fund with investment objective to generate returns with higher liquidity and low volatility from a portfolio of money market and debt instruments. The performance of the Scheme in comparison to Crisil Liquid Fund Index, the benchmark index along with its additional benchmark is given below:-
The returns have been impacted due to 100% mark down of the scheme exposure to Ballarpur Industries Ltd. commercial paper in February 2017.
Taurus Short Term Income Fund:
This is an open-ended debt fund whose investment objective is to generate income and capital appreciation with low volatility by investing in a diversified portfolio of short term debt and money market instruments. The performance of the Scheme in comparison to its benchmark indices is given below:
Taurus Dynamic Income Fund:
This is an open-ended debt fund which aims to generate optimal returns with high liquidity through active management of the portfolio by investing in debt and money market instruments. The performance of the Scheme in comparison to its benchmark indices is given below:
ABRIDGED ANNUAL REPORT 2016 - 2017
Returns (%)
Regular Plan - Direct Plan - Nifty 50 Additional Benchmark Duration Growth Option Growth Option Nifty 50 (RP) (DP)
6 Months 5.96 7.43 6.53 6.53
1 Year 17.85 19.89 18.55 18.55
3 Years 10.72 11.84 11.01 11.01
5 Years 11.43 N.A 11.60 11.60
Since inception 8.10 11.19 8.53 (RP) 8.53 (RP) (RP: June 19, 2010 & 10.55 (DP) 10.55 (DP)DP : Jan 02, 2013)
Note: Past performance may or may not be sustained in the future. Returns less than one year are absolute and more than or equal to one year are compounded on an annualised basis. Regular and Direct plan has a different expense structure.
Returns (%)
Regular Super Direct Super Crisil Liquid Additional Benchmark Duration Institutional Plan Institutional Plan Fund Index CRISIL 1 Yr T-Bill Index Growth Option Growth Option (RP) (DP)
6 Months -8.94 -8.65 3.29 3.22
1 Year -5.52 -4.90 7.11 7.15
3 Years 4.08 4.45 8.04 7.85
5 Years 6.41 N.A 8.36 7.54
Since inception 6.80 6.08 7.57 (RP) 6.48 (RP)(RP: Dec 01, 2008 & 8.38 (DP) 7.41 (DP)DP : Jan 01, 2013)
Note:Past performance may or may not be sustained in the future. Returns less than one year are absolute and more than or equal to one year are compounded on an annualised basis. Regular and Direct plan has a different expense structure.
Returns (%)
Regular Plan - Direct Plan - CRISIL Additional Benchmark Duration Growth Option Growth Option Short Term CRISIL 1 yr (RP) (DP) Bond Fund Index T-Bill Index
6 Months -8.69 -8.58 3.70 3.22
1 Year -5.10 -4.82 9.10 7.15
3 Years 4.21 4.49 9.29 7.85
5 Years 6.57 N.A 9.15 7.54
Since inception 6.11 6.12 7.00 (RP) 6.10 (RP)(RP: Aug 18, 2001 & 9.12 (DP) 7.41 (DP) DP : Jan 01, 2013)
Note: Past performance may or may not be sustained in the future. Returns less than one year are absolute and more than or equal to one year are compounded on an annualised basis. Regular and Direct plan has a different expense structure.
The returns have been impacted due to 100% mark down of the scheme exposure to Ballarpur Industries Ltd. commercial paper in February 2017.
The returns have been impacted due to 100% mark down of the scheme exposure to Ballarpur Industries Ltd. commercial paper in February 2017.
Taurus Liquid Fund:
This is an open-ended scheme with investment objective to generate steady and reasonable income with low risk and high level of liquidity, from a portfolio of money market securities and high quality debt. The performance of the Scheme in comparison to its benchmark indices is given below:
Returns (%)
Regular Plan - Direct Plan - CRISIL Additional
Growth Option Growth Option Composite Bond Benchmark
Duration (RP) (DP) Fund Index CRISIL 10 yr Gilt Index
6 Months -10.04 -9.71 3.36 4.41
1 Year -7.04 -6.28 11.09 11.87
3 Years 2.67 3.31 11.26 11.41
5 Years 4.24 N.A 9.45 8.79
Since inception 5.33 3.68 9.17 (RP) 7.86 (RP)(RP: Feb 14, 2011 & 9.34 (DP)) 8.15 (DP) DP : Jan 04, 2013)
Note: Past performance may or may not be sustained in the future. Returns less than one year are absolute and more than or equal to one year are compounded on an annualised basis. Regular and Direct plan has a different expense structure.
Returns (%)
Regular Super Direct Super CRISIL Liquid Additional Benchmark Duration Institutional Institutional Fund Index CRISIL 1 Yr Growth Option Growth Option T-Bill Index (RP) (DP)
6 Months -4.21 -4.17 3.29 3.22
1 Year -0.55 -0.47 7.11 7.15
3 Years 5.55 5.62 8.04 7.85
5 Years 7.11 N.A 8.37 7.54
Since inception 5.91 6.74 7.63 (RP) 6.66 (RP)(RP: Aug 31, 2006 & 8.38 (DP) 7.42 (DP) DP : Dec 31, 2012)
Note: Past performance may or may not be sustained in the future. Returns less than one year are absolute and more than or equal to one year are compounded on an annualised basis. Regular and Direct plan has a different expense structure.
The returns have been impacted due to 100% mark down of the scheme exposure to Ballarpur Industries Ltd. commercial paper in February 2017.
Brief Background of Sponsor, Trustee Company and Asset Management Company (AMC)
a. Taurus Mutual Fund
Taurus Mutual Fund (TMF) was set up as a Trust. The Sponsor of the Trust is HB Portfolio Limited with Taurus Investment Trust Company Limited (the Trustee Company) as the “Trustee” in accordance with the provisions of the Indian Trust Act, 1882. The Trust is duly registered under the Indian Registration Act, 1908. The Trustee has entered into an Investment Management Agreement dated August 20, 1993 with Taurus Asset Management Company Limited to function as the Investment Manager for all the schemes of TMF. TMF was registered with SEBI on September 21, 1993 and its Registration Number is MF/002/93.
b. Taurus Investment Trust Company Limited
The Trustee Company is the exclusive owner of the Trust Fund and holds the same in trust for the benefit of the unit holders. The Trustee Company has been discharging its duties and carrying out the responsibilities as provided in the SEBI (Mutual Funds) Regulations, 1996 and the Trust Deed. The Trustee Company seeks to ensure that the Fund and the Schemes floated thereunder are managed by the Taurus Asset Management Company Limited in accordance with the Trust Deed, the Regulations, directions and guidelines issued by the SEBI, AMFI and other regulatory agencies.
During the year under review, there has been no change in the composition of the Board of Directors of Taurus Investment Trust Company Limited.
c. Taurus Asset Management Company Limited
Taurus Asset management Company Limited is a public limited company incorporated under the Companies Act, 1956 on July 27, 1993. The AMC has been appointed as the Investment Manager of Taurus Mutual Fund by the Trustees in terms of SEBI (Mutual Funds) Regulations, 1996. The AMC is responsible for managing the schemes on a day-to-day basis and is required to take all reasonable steps and exercise due diligence and care in all its investment decisions. The Trustee Company's liability is discharged by the AMC performing its duties in good faith and after due diligence and care. The AMC has in place an adequate system of internal controls which provide reasonable assurance
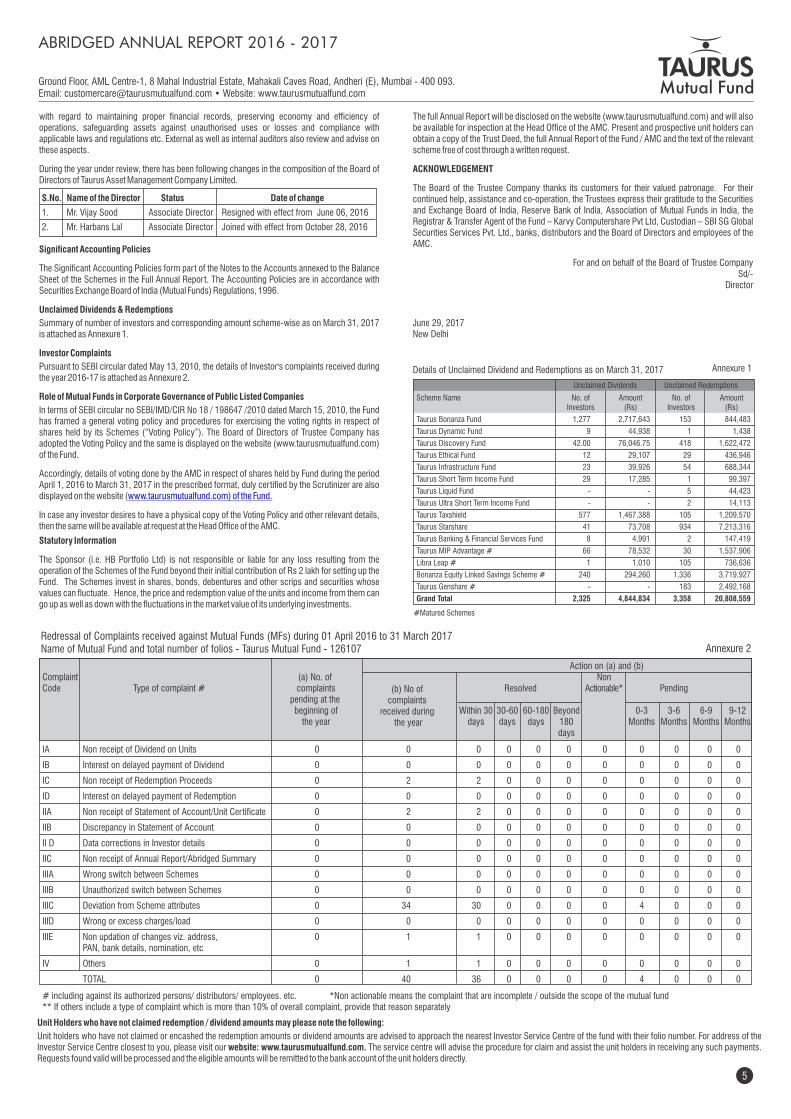
Unclaimed Dividends Unclaimed Redemptions
Scheme Name No. of Amount No. of Amount Investors (Rs) Investors (Rs)
Taurus Bonanza Fund 1,277 2,717,643 153 844,483
Taurus Dynamic Fund 9 44,938 1 1,438
Taurus Discovery Fund 42.00 76,046.75 418 1,622,472
Taurus Ethical Fund 12 29,107 29 436,946
Taurus Infrastructure Fund 23 39,926 54 688,344
Taurus Short Term Income Fund 29 17,285 1 99,397
Taurus Liquid Fund - - 5 44,423
Taurus Ultra Short Term Income Fund - - 2 14,113
Taurus Taxshield 577 1,467,388 105 1,209,570
Taurus Starshare 41 73,708 934 7,213,316
Taurus Banking & Financial Services Fund 8 4,991 2 147,419
Taurus MIP Advantage # 66 78,532 30 1,537,906
Libra Leap # 1 1,010 105 736,636
Bonanza Equity Linked Savings Scheme # 240 294,260 1,336 3,719,927
Taurus Genshare # - - 183 2,492,168
Grand Total 2,325 4,844,834 3,358 20,808,559
Annexure 1
#Matured Schemes
Annexure 2
Ground Floor, AML Centre-1, 8 Mahal Industrial Estate, Mahakali Caves Road, Andheri (E), Mumbai - 400 093.Email: [email protected] • Website: www.taurusmutualfund.com
with regard to maintaining proper financial records, preserving economy and efficiency of operations, safeguarding assets against unauthorised uses or losses and compliance with applicable laws and regulations etc. External as well as internal auditors also review and advise on these aspects.
During the year under review, there has been following changes in the composition of the Board of Directors of Taurus Asset Management Company Limited.
Significant Accounting Policies
The Significant Accounting Policies form part of the Notes to the Accounts annexed to the Balance Sheet of the Schemes in the Full Annual Report. The Accounting Policies are in accordance with Securities Exchange Board of India (Mutual Funds) Regulations, 1996.
Unclaimed Dividends & Redemptions
Summary of number of investors and corresponding amount scheme-wise as on March 31, 2017 is attached as Annexure 1.
Investor Complaints
Pursuant to SEBI circular dated May 13, 2010, the details of Investor's complaints received during the year 2016-17 is attached as Annexure 2.
Role of Mutual Funds in Corporate Governance of Public Listed Companies
In terms of SEBI circular no SEBI/IMD/CIR No 18 / 198647 /2010 dated March 15, 2010, the Fund has framed a general voting policy and procedures for exercising the voting rights in respect of shares held by its Schemes (“Voting Policy”). The Board of Directors of Trustee Company has adopted the Voting Policy and the same is displayed on the website (www.taurusmutualfund.com) of the Fund.
Accordingly, details of voting done by the AMC in respect of shares held by Fund during the period April 1, 2016 to March 31, 2017 in the prescribed format, duly certified by the Scrutinizer are also displayed on the website (www.taurusmutualfund.com) of the Fund.
In case any investor desires to have a physical copy of the Voting Policy and other relevant details, then the same will be available at request at the Head Office of the AMC.
Statutory Information
The Sponsor (i.e. HB Portfolio Ltd) is not responsible or liable for any loss resulting from the operation of the Schemes of the Fund beyond their initial contribution of Rs 2 lakh for setting up the Fund. The Schemes invest in shares, bonds, debentures and other scrips and securities whose values can fluctuate. Hence, the price and redemption value of the units and income from them can go up as well as down with the fluctuations in the market value of its underlying investments.
The full Annual Report will be disclosed on the website (www.taurusmutualfund.com) and will also be available for inspection at the Head Office of the AMC. Present and prospective unit holders can obtain a copy of the Trust Deed, the full Annual Report of the Fund / AMC and the text of the relevant scheme free of cost through a written request.
ACKNOWLEDGEMENT
The Board of the Trustee Company thanks its customers for their valued patronage. For their continued help, assistance and co-operation, the Trustees express their gratitude to the Securities and Exchange Board of India, Reserve Bank of India, Association of Mutual Funds in India, the Registrar & Transfer Agent of the Fund – Karvy Computershare Pvt Ltd, Custodian – SBI SG Global Securities Services Pvt. Ltd., banks, distributors and the Board of Directors and employees of the AMC.
For and on behalf of the Board of Trustee Company Sd/-
Director
June 29, 2017New Delhi
5
Details of Unclaimed Dividend and Redemptions as on March 31, 2017
Redressal of Complaints received against Mutual Funds (MFs) during 01 April 2016 to 31 March 2017 Name of Mutual Fund and total number of folios - Taurus Mutual Fund - 126107
Unit Holders who have not claimed redemption / dividend amounts may please note the following:
Unit holders who have not claimed or encashed the redemption amounts or dividend amounts are advised to approach the nearest Investor Service Centre of the fund with their folio number. For address of the Investor Service Centre closest to you, please visit our website: www.taurusmutualfund.com. The service centre will advise the procedure for claim and assist the unit holders in receiving any such payments. Requests found valid will be processed and the eligible amounts will be remitted to the bank account of the unit holders directly.
ABRIDGED ANNUAL REPORT 2016 - 2017
S.No. Name of the Director Status Date of change
1. Mr. Vijay Sood Associate Director Resigned with effect from June 06, 2016
2. Mr. Harbans Lal Associate Director Joined with effect from October 28, 2016
# including against its authorized persons/ distributors/ employees. etc. *Non actionable means the complaint that are incomplete / outside the scope of the mutual fund** If others include a type of complaint which is more than 10% of overall complaint, provide that reason separately
IA Non receipt of Dividend on Units 0 0 0 0 0 0 0 0 0 0 0
IB Interest on delayed payment of Dividend 0 0 0 0 0 0 0 0 0 0 0
IC Non receipt of Redemption Proceeds 0 2 2 0 0 0 0 0 0 0 0
ID Interest on delayed payment of Redemption 0 0 0 0 0 0 0 0 0 0 0
IIA Non receipt of Statement of Account/Unit Certificate 0 2 2 0 0 0 0 0 0 0 0
IIB Discrepancy in Statement of Account 0 0 0 0 0 0 0 0 0 0 0
II D Data corrections in Investor details 0 0 0 0 0 0 0 0 0 0 0
IIC Non receipt of Annual Report/Abridged Summary 0 0 0 0 0 0 0 0 0 0 0
IIIA Wrong switch between Schemes 0 0 0 0 0 0 0 0 0 0 0
IIIB Unauthorized switch between Schemes 0 0 0 0 0 0 0 0 0 0 0
IIIC Deviation from Scheme attributes 0 34 30 0 0 0 0 4 0 0 0
IIID Wrong or excess charges/load 0 0 0 0 0 0 0 0 0 0 0
IIIE Non updation of changes viz. address, 0 1 1 0 0 0 0 0 0 0 0 PAN, bank details, nomination, etc
IV Others 0 1 1 0 0 0 0 0 0 0 0
TOTAL 0 40 36 0 0 0 0 4 0 0 0
Ground Floor, AML Centre-1, 8 Mahal Industrial Estate, Mahakali Caves Road, Andheri (E), Mumbai - 400 093.Email: [email protected] • Website: www.taurusmutualfund.com
6
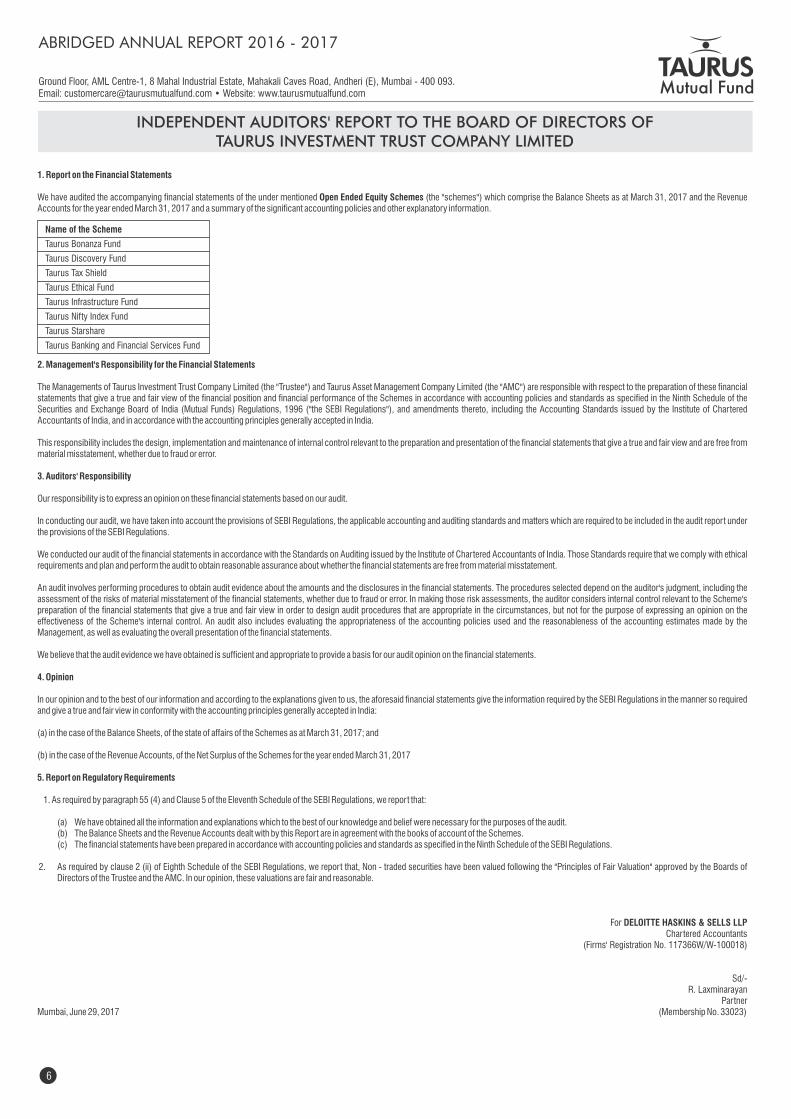
INDEPENDENT AUDITORS' REPORT TO THE BOARD OF DIRECTORS OFTAURUS INVESTMENT TRUST COMPANY LIMITED
1. Report on the Financial Statements
We have audited the accompanying financial statements of the under mentioned Open Ended Equity Schemes (the "schemes") which comprise the Balance Sheets as at March 31, 2017 and the Revenue Accounts for the year ended March 31, 2017 and a summary of the significant accounting policies and other explanatory information.
2. Management's Responsibility for the Financial Statements
The Managements of Taurus Investment Trust Company Limited (the "Trustee") and Taurus Asset Management Company Limited (the "AMC") are responsible with respect to the preparation of these financial statements that give a true and fair view of the financial position and financial performance of the Schemes in accordance with accounting policies and standards as specified in the Ninth Schedule of the Securities and Exchange Board of India (Mutual Funds) Regulations, 1996 ("the SEBI Regulations"), and amendments thereto, including the Accounting Standards issued by the Institute of Chartered Accountants of India, and in accordance with the accounting principles generally accepted in India.
This responsibility includes the design, implementation and maintenance of internal control relevant to the preparation and presentation of the financial statements that give a true and fair view and are free from material misstatement, whether due to fraud or error.
3. Auditors' Responsibility
Our responsibility is to express an opinion on these financial statements based on our audit.
In conducting our audit, we have taken into account the provisions of SEBI Regulations, the applicable accounting and auditing standards and matters which are required to be included in the audit report under the provisions of the SEBI Regulations.
We conducted our audit of the financial statements in accordance with the Standards on Auditing issued by the Institute of Chartered Accountants of India. Those Standards require that we comply with ethical requirements and plan and perform the audit to obtain reasonable assurance about whether the financial statements are free from material misstatement.
An audit involves performing procedures to obtain audit evidence about the amounts and the disclosures in the financial statements. The procedures selected depend on the auditor's judgment, including the assessment of the risks of material misstatement of the financial statements, whether due to fraud or error. In making those risk assessments, the auditor considers internal control relevant to the Scheme's preparation of the financial statements that give a true and fair view in order to design audit procedures that are appropriate in the circumstances, but not for the purpose of expressing an opinion on the effectiveness of the Scheme's internal control. An audit also includes evaluating the appropriateness of the accounting policies used and the reasonableness of the accounting estimates made by the Management, as well as evaluating the overall presentation of the financial statements.
We believe that the audit evidence we have obtained is sufficient and appropriate to provide a basis for our audit opinion on the financial statements.
4. Opinion
In our opinion and to the best of our information and according to the explanations given to us, the aforesaid financial statements give the information required by the SEBI Regulations in the manner so required and give a true and fair view in conformity with the accounting principles generally accepted in India:
(a) in the case of the Balance Sheets, of the state of affairs of the Schemes as at March 31, 2017; and
(b) in the case of the Revenue Accounts, of the Net Surplus of the Schemes for the year ended March 31, 2017
5. Report on Regulatory Requirements
1. As required by paragraph 55 (4) and Clause 5 of the Eleventh Schedule of the SEBI Regulations, we report that:
(a) We have obtained all the information and explanations which to the best of our knowledge and belief were necessary for the purposes of the audit. (b) The Balance Sheets and the Revenue Accounts dealt with by this Report are in agreement with the books of account of the Schemes. (c) The financial statements have been prepared in accordance with accounting policies and standards as specified in the Ninth Schedule of the SEBI Regulations.
2. As required by clause 2 (ii) of Eighth Schedule of the SEBI Regulations, we report that, Non - traded securities have been valued following the "Principles of Fair Valuation" approved by the Boards of Directors of the Trustee and the AMC. In our opinion, these valuations are fair and reasonable.
For DELOITTE HASKINS & SELLS LLPChartered Accountants
(Firms' Registration No. 117366W/W-100018)
Sd/- R. Laxminarayan
PartnerMumbai, June 29, 2017 (Membership No. 33023)
Name of the Scheme
Taurus Bonanza Fund
Taurus Discovery Fund
Taurus Tax Shield
Taurus Ethical Fund
Taurus Infrastructure Fund
Taurus Nifty Index Fund
Taurus Starshare
Taurus Banking and Financial Services Fund
ABRIDGED ANNUAL REPORT 2016 - 2017
Ground Floor, AML Centre-1, 8 Mahal Industrial Estate, Mahakali Caves Road, Andheri (E), Mumbai - 400 093.Email: [email protected] • Website: www.taurusmutualfund.com
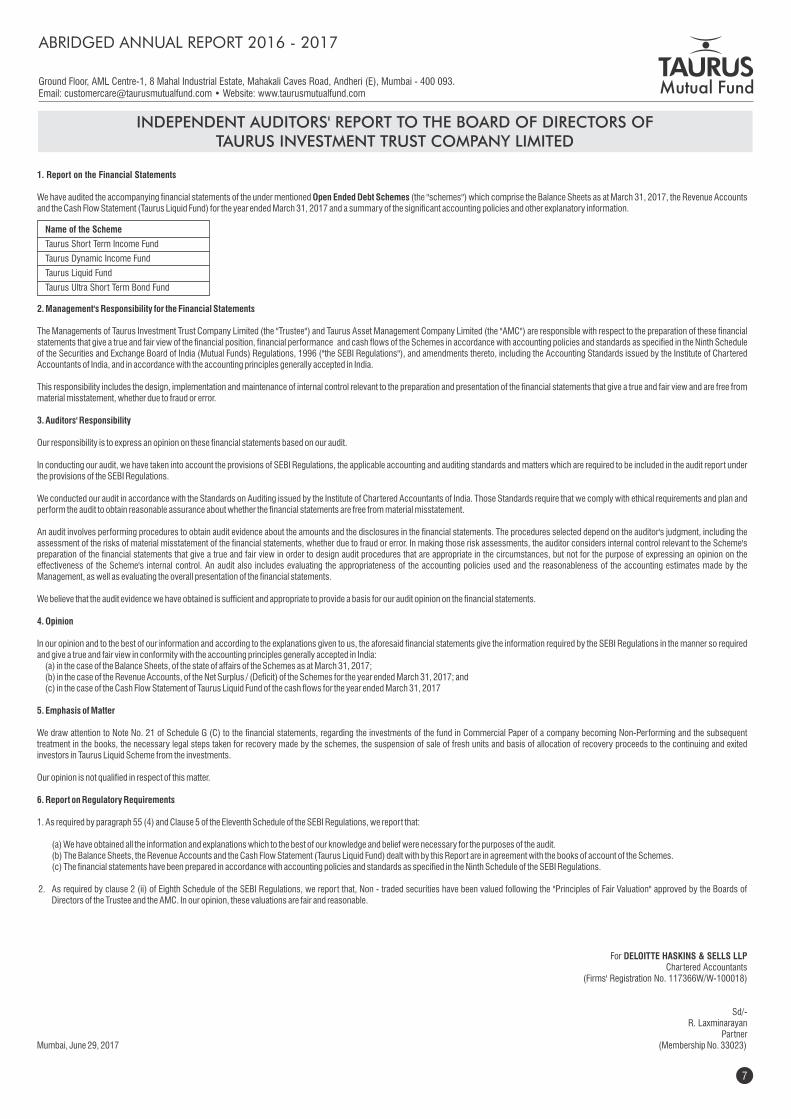
INDEPENDENT AUDITORS' REPORT TO THE BOARD OF DIRECTORS OFTAURUS INVESTMENT TRUST COMPANY LIMITED
1. Report on the Financial Statements
We have audited the accompanying financial statements of the under mentioned Open Ended Debt Schemes (the "schemes") which comprise the Balance Sheets as at March 31, 2017, the Revenue Accounts and the Cash Flow Statement (Taurus Liquid Fund) for the year ended March 31, 2017 and a summary of the significant accounting policies and other explanatory information.
2. Management's Responsibility for the Financial Statements
The Managements of Taurus Investment Trust Company Limited (the "Trustee") and Taurus Asset Management Company Limited (the "AMC") are responsible with respect to the preparation of these financial statements that give a true and fair view of the financial position, financial performance and cash flows of the Schemes in accordance with accounting policies and standards as specified in the Ninth Schedule of the Securities and Exchange Board of India (Mutual Funds) Regulations, 1996 ("the SEBI Regulations"), and amendments thereto, including the Accounting Standards issued by the Institute of Chartered Accountants of India, and in accordance with the accounting principles generally accepted in India.
This responsibility includes the design, implementation and maintenance of internal control relevant to the preparation and presentation of the financial statements that give a true and fair view and are free from material misstatement, whether due to fraud or error.
3. Auditors' Responsibility
Our responsibility is to express an opinion on these financial statements based on our audit.
In conducting our audit, we have taken into account the provisions of SEBI Regulations, the applicable accounting and auditing standards and matters which are required to be included in the audit report under the provisions of the SEBI Regulations.
We conducted our audit in accordance with the Standards on Auditing issued by the Institute of Chartered Accountants of India. Those Standards require that we comply with ethical requirements and plan and perform the audit to obtain reasonable assurance about whether the financial statements are free from material misstatement.
An audit involves performing procedures to obtain audit evidence about the amounts and the disclosures in the financial statements. The procedures selected depend on the auditor's judgment, including the assessment of the risks of material misstatement of the financial statements, whether due to fraud or error. In making those risk assessments, the auditor considers internal control relevant to the Scheme's preparation of the financial statements that give a true and fair view in order to design audit procedures that are appropriate in the circumstances, but not for the purpose of expressing an opinion on the effectiveness of the Scheme's internal control. An audit also includes evaluating the appropriateness of the accounting policies used and the reasonableness of the accounting estimates made by the Management, as well as evaluating the overall presentation of the financial statements.
We believe that the audit evidence we have obtained is sufficient and appropriate to provide a basis for our audit opinion on the financial statements.
4. Opinion
In our opinion and to the best of our information and according to the explanations given to us, the aforesaid financial statements give the information required by the SEBI Regulations in the manner so required and give a true and fair view in conformity with the accounting principles generally accepted in India: (a) in the case of the Balance Sheets, of the state of affairs of the Schemes as at March 31, 2017; (b) in the case of the Revenue Accounts, of the Net Surplus / (Deficit) of the Schemes for the year ended March 31, 2017; and (c) in the case of the Cash Flow Statement of Taurus Liquid Fund of the cash flows for the year ended March 31, 2017
5. Emphasis of Matter
We draw attention to Note No. 21 of Schedule G (C) to the financial statements, regarding the investments of the fund in Commercial Paper of a company becoming Non-Performing and the subsequent treatment in the books, the necessary legal steps taken for recovery made by the schemes, the suspension of sale of fresh units and basis of allocation of recovery proceeds to the continuing and exited investors in Taurus Liquid Scheme from the investments.
Our opinion is not qualified in respect of this matter.
6. Report on Regulatory Requirements
1. As required by paragraph 55 (4) and Clause 5 of the Eleventh Schedule of the SEBI Regulations, we report that:
(a) We have obtained all the information and explanations which to the best of our knowledge and belief were necessary for the purposes of the audit. (b) The Balance Sheets, the Revenue Accounts and the Cash Flow Statement (Taurus Liquid Fund) dealt with by this Report are in agreement with the books of account of the Schemes. (c) The financial statements have been prepared in accordance with accounting policies and standards as specified in the Ninth Schedule of the SEBI Regulations.
2. As required by clause 2 (ii) of Eighth Schedule of the SEBI Regulations, we report that, Non - traded securities have been valued following the "Principles of Fair Valuation" approved by the Boards of Directors of the Trustee and the AMC. In our opinion, these valuations are fair and reasonable.
For DELOITTE HASKINS & SELLS LLPChartered Accountants
(Firms' Registration No. 117366W/W-100018)
Sd/- R. Laxminarayan
PartnerMumbai, June 29, 2017 (Membership No. 33023)
Name of the Scheme
Taurus Short Term Income Fund
Taurus Dynamic Income Fund
Taurus Liquid Fund
Taurus Ultra Short Term Bond Fund
7
ABRIDGED ANNUAL REPORT 2016 - 2017
Ground Floor, AML Centre-1, 8 Mahal Industrial Estate, Mahakali Caves Road, Andheri (E), Mumbai - 400 093.Email: [email protected] • Website: www.taurusmutualfund.com
INDEPENDENT AUDITORS' REPORT TO THE BOARD OF DIRECTORS OFTAURUS INVESTMENT TRUST COMPANY LIMITED
1. Report on the Financial Statements
We have audited the accompanying financial statements of TAURUS MIP ADVANTAGE a Open Ended Scheme (the "Scheme") which comprise the Balance Sheet as at July 8, 2016, the date of winding up of the scheme and the Revenue Account for the period from April 1, 2016 to July 8, 2016 and a summary of the significant accounting policies and other explanatory information.
2. Management's Responsibility for the Financial Statements
The Managements of Taurus Investment Trust Company Limited (the "Trustee") and Taurus Asset Management Company Limited (the "AMC") are responsible with respect to the preparation of these financial statements that give a true and fair view of the financial position and financial per formance of the Scheme in accordance with accounting policies and standards as specified in the Ninth Schedule of the Securities and Exchange Board of India (Mutual Funds) Regulations, 1996 ("the SEBI Regulations"), and amendments thereto, including the Accounting Standards issued by the Institute of Chartered Accountants of India, and in accordance with the accounting principles generally accepted in India.
This responsibility includes the design, implementation and maintenance of internal control relevant to the preparation and presentation of the financial statements that give a true and fair view and are free from material misstatement, whether due to fraud or error.
3. Auditors' Responsibility
Our responsibility is to express an opinion on these financial statements based on our audit.
In conducting our audit, we have taken into account the provisions of SEBI Regulations, the applicable accounting and auditing standards and matters which are required to be included in the audit report under the provisions of the SEBI Regulations.
We conducted our audit of the financial statements in accordance with the Standards on Auditing issued by the Institute of Chartered Accountants of India. Those Standards require that we comply with ethical requirements and plan and perform the audit to obtain reasonable assurance about whether the financial statements are free from material misstatement.
An audit involves performing procedures to obtain audit evidence about the amounts and the disclosures in the financial statements. The procedures selected depend on the auditor's judgment, including the assessment of the risks of material misstatement of the financial statements, whether due to fraud or error. In making those risk assessments, the auditor considers internal control relevant to the Scheme's preparation of the financial statements that give a true and fair view in order to design audit procedures that are appropriate in the circumstances, but not for the purpose of expressing an opinion on the effectiveness of the Scheme's internal control. An audit also includes evaluating the appropriateness of the accounting policies used and the reasonableness of the accounting estimates made by the Management, as well as evaluating the overall presentation of the financial statements.
We believe that the audit evidence we have obtained is sufficient and appropriate to provide a basis for our audit opinion on the financial statements.
4. Opinion
In our opinion and to the best of our information and according to the explanations given to us, the aforesaid financial statements give the information required by the SEBI Regulations in the manner so required and give a true and fair view in conformity with the accounting principles generally accepted in India:
(a) in the case of the Balance Sheet, of the state of affairs of the Scheme as at July 8, 2016; and
(b) in the case of the Revenue Account, of the Net Surplus of the Scheme for the period from April 1,2016 to July 8, 2016;
5. Report on Regulatory Requirements
1. As required by paragraph 55 (4) and Clause 5 of the Eleventh Schedule of the SEBI Regulations, we report that: (a) We have obtained all the information and explanations which to the best of our knowledge and belief were necessary for the purposes of the audit.
(b) The Balance Sheet and the Revenue Account dealt with by this Report are in agreement with the books of account of the Scheme.
(c) The financial statements have been prepared in accordance with accounting policies and standards as specified in the Ninth Schedule of the SEBI Regulations.
For DELOITTE HASKINS & SELLS LLPChartered Accountants
(Firms' Registration No. 117366W/W-100018)
Sd/- R. Laxminarayan
PartnerMumbai, June 29, 2017 (Membership No. 33023)
ABRIDGED ANNUAL REPORT 2016 - 2017
8
Ground Floor, AML Centre-1, 8 Mahal Industrial Estate, Mahakali Caves Road, Andheri (E), Mumbai - 400 093.Email: [email protected] • Website: www.taurusmutualfund.com
9
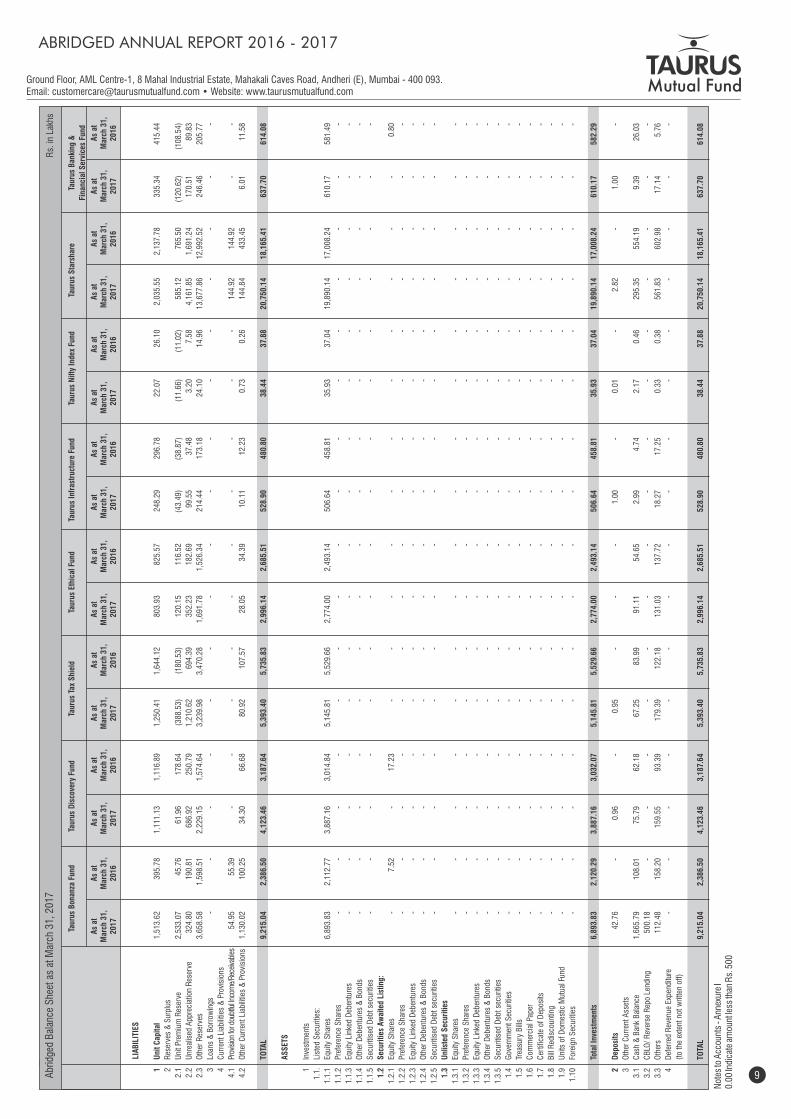
Abr
idge
d B
alan
ce S
heet
as
at M
arch
31,
201
7
Not
es to
Acc
ount
s - A
nnex
ure
I0.
00 In
dica
te a
mou
nt le
ss th
an R
s. 5
00
Ta
urus
Bon
anza
Fun
d Ta
urus
Dis
cove
ry F
und
Taur
us T
ax S
hiel
d Ta
urus
Eth
ical
Fun
d Ta
urus
Inf
rast
ruct
ure
Fund
Ta
urus
Nif
ty I
ndex
Fun
d Ta
urus
Sta
rsha
re
Taur
us B
anki
ng &
Fina
ncia
l Ser
vice
s Fu
nd
LI
AB
ILIT
IES
1
Uni
t C
apit
al
1,5
13.6
2
395
.78
1
,111
.13
1
,116
.89
1
,250
.41
1
,644
.12
8
03.9
3
825
.57
2
48.2
9
296
.78
2
2.07
2
6.10
2
,035
.55
2
,137
.78
3
35.3
4
415
.44
2
Res
erve
s &
Sur
plus
2.
1 U
nit P
rem
ium
Res
erve
2
,533
.07
4
5.76
6
1.96
1
78.6
4
(38
8.53
) (
180.
53)
120
.15
1
16.5
2
(43
.49)
(
38.8
7)
(11
.66)
(
11.0
2)
585
.12
7
65.5
0
(12
0.62
) (
108.
54)
2.
2 U
nrea
lised
App
reci
atio
n R
eser
ve
324
.80
1
90.8
1
686
.92
2
50.7
9
1,2
10.6
2
694
.39
3
52.2
3
182
.69
9
9.55
3
7.48
3
.20
7
.58
4
,161
.85
1
,691
.24
1
70.5
1
89.
83
2.
3 O
ther
Res
erve
s 3
,658
.58
1
,598
.51
2
,229
.15
1
,574
.64
3
,239
.98
3
,470
.28
1
,691
.78
1
,526
.34
2
14.4
4
173
.18
2
4.10
1
4.96
1
3,67
7.86
1
2,99
2.52
2
46.4
6
205
.77
3
Loan
s &
Bor
row
ings
-
-
-
-
-
-
-
-
-
-
-
-
-
-
-
-
4
Cur
rent
Lia
bilit
ies
& P
rovi
sion
s
4.
1 Pr
ovis
ion
for d
oubt
ful I
ncom
e/R
ecei
vabl
es
54.
95
55.
39
-
-
-
-
-
-
-
-
-
-
144
.92
1
44.9
2
-
-
4.
2 O
ther
Cur
rent
Lia
bilit
ies
& P
rovi
sion
s 1
,130
.02
1
00.2
5
34.
30
66.
68
80.
92
107
.57
2
8.05
3
4.39
1
0.11
1
2.23
0
.73
0
.26
1
44.8
4
433
.45
6
.01
1
1.58
TOTA
L 9
,215
.04
2
,386
.50
4
,123
.46
3
,187
.64
5
,393
.40
5
,735
.83
2
,996
.14
2
,685
.51
5
28.9
0
480
.80
3
8.44
3
7.88
2
0,75
0.14
1
8,16
5.41
6
37.7
0
614
.08
AS
SET
S
1
Inve
stm
ents
1.
1.
List
ed S
ecur
ities
:
1.1
.1
Equi
ty S
hare
s 6
,893
.83
2
,112
.77
3
,887
.16
3
,014
.84
5
,145
.81
5
,529
.66
2
,774
.00
2
,493
.14
5
06.6
4
458
.81
3
5.93
3
7.04
1
9,89
0.14
1
7,00
8.24
6
10.1
7
581
.49
1.1
.2
Pre
fere
nce
Sha
res
-
-
-
-
-
-
-
-
-
-
-
-
-
-
-
-
1.1
.3
Equi
ty L
inke
d D
eben
ture
s -
-
-
-
-
-
-
-
-
-
-
-
-
-
-
-
1.1
.4
Oth
er D
eben
ture
s &
Bon
ds
-
-
-
-
-
-
-
-
-
-
-
-
-
-
-
-
1.1
.5
Sec
uriti
sed
Deb
t sec
uriti
es
-
-
-
-
-
-
-
-
-
-
-
-
-
-
-
-
1.
2 S
ecur
itie
s A
wai
ted
List
ing:
1.2
.1
Equi
ty S
hare
s -
7.5
2
-
1
7.23
-
-
-
-
-
-
-
-
-
-
-
0.8
0
1.2
.2
Pre
fere
nce
Sha
res
-
-
-
-
-
-
-
-
-
-
-
-
-
-
-
-
1.2
.3
Equi
ty L
inke
d D
eben
ture
s -
-
-
-
-
-
-
-
-
-
-
-
-
-
-
-
1.2
.4
Oth
er D
eben
ture
s &
Bon
ds
-
-
-
-
-
-
-
-
-
-
-
-
-
-
-
-
1.2
.5
Sec
uriti
sed
Deb
t sec
uriti
es
-
-
-
-
-
-
-
-
-
-
-
-
-
-
-
-
1.
3 U
nlis
ted
Sec
urit
ies
1.3
.1
Equi
ty S
hare
s -
-
-
-
-
-
-
-
-
-
-
-
-
-
-
-
1.3
.2
Pre
fere
nce
Sha
res
-
-
-
-
-
-
-
-
-
-
-
-
-
-
-
-
1.3
.3
Equi
ty L
inke
d D
eben
ture
s -
-
-
-
-
-
-
-
-
-
-
-
-
-
-
-
1.3
.4
Oth
er D
eben
ture
s &
Bon
ds
-
-
-
-
-
-
-
-
-
-
-
-
-
-
-
-
1.3
.5
Sec
uriti
sed
Deb
t sec
uriti
es
-
-
-
-
-
-
-
-
-
-
-
-
-
-
-
-
1.
4 G
over
nmen
t Sec
uriti
es
-
-
-
-
-
-
-
-
-
-
-
-
-
-
-
-
1.
5 Tr
easu
ry B
ills
-
-
-
-
-
-
-
-
-
-
-
-
-
-
-
-
1.
6 C
omm
erci
al P
aper
-
-
-
-
-
-
-
-
-
-
-
-
-
-
-
-
1.
7 C
ertif
icat
e of
Dep
osits
-
-
-
-
-
-
-
-
-
-
-
-
-
-
-
-
1.
8 B
ill R
edis
coun
ting
-
-
-
-
-
-
-
-
-
-
-
-
-
-
-
-
1.
9 U
nits
of
Dom
estic
Mut
ual F
und
-
-
-
-
-
-
-
-
-
-
-
-
-
-
-
-
1.1
0 Fo
reig
n S
ecur
ities
-
-
-
-
-
-
-
-
-
-
-
-
-
-
-
-
Tota
l Inv
estm
ents
6
,893
.83
2
,120
.29
3
,887
.16
3
,032
.07
5
,145
.81
5
,529
.66
2
,774
.00
2
,493
.14
5
06.6
4
458
.81
3
5.93
3
7.04
1
9,89
0.14
1
7,00
8.24
6
10.1
7
582
.29
2
Dep
osit
s 4
2.76
-
0.9
6
-
0
.95
-
-
-
1.0
0
-
0
.01
-
2.8
2
-
1
.00
-
3
Oth
er C
urre
nt A
sset
s
3.
1 C
ash
& B
ank
Bal
ance
1
,665
.79
1
08.0
1
75.
79
62.
18
67.
25
83.
99
91.
11
54.
65
2.9
9
4.7
4
2.1
7
0.4
6
295
.35
5
54.1
9
9.3
9
26.
03
3.
2 C
BLO
/ R
ever
se R
epo
Lend
ing
500
.18
-
-
-
-
-
-
-
-
-
-
-
-
-
-
-
3.
3 O
ther
s 1
12.4
8
158
.20
1
59.5
5
93.
39
179
.39
1
22.1
8
131
.03
1
37.7
2
18.
27
17.
25
0.3
3
0.3
8
561
.83
6
02.9
8
17.
14
5.7
6
4
Def
erre
d R
even
ue E
xpen
ditu
re
-
-
-
-
-
-
-
-
-
-
-
-
-
-
-
-
(to
the
exte
nt n
ot w
ritte
n of
f)
TOTA
L 9
,215
.04
2
,386
.50
4
,123
.46
3
,187
.64
5
,393
.40
5
,735
.83
2
,996
.14
2
,685
.51
5
28.9
0
480
.80
3
8.44
3
7.88
2
0,75
0.14
1
8,16
5.41
6
37.7
0
614
.08
As
at
Mar
ch 3
1,
2017
As
at
Mar
ch 3
1,
2016
Rs.
in L
akhs
ABRIDGED ANNUAL REPORT 2016 - 2017
As
at
Mar
ch 3
1,
2017
As
at
Mar
ch 3
1,
2016
As
at
Mar
ch 3
1,
2017
As
at
Mar
ch 3
1,
2016
As
at
Mar
ch 3
1,
2017
As
at
Mar
ch 3
1,
2016
As
at
Mar
ch 3
1,
2017
As
at
Mar
ch 3
1,
2016
As
at
Mar
ch 3
1,
2017
As
at
Mar
ch 3
1,
2016
As
at
Mar
ch 3
1,
2017
As
at
Mar
ch 3
1,
2016
As
at
Mar
ch 3
1,
2017
As
at
Mar
ch 3
1,
2016
9
Ground Floor, AML Centre-1, 8 Mahal Industrial Estate, Mahakali Caves Road, Andheri (E), Mumbai - 400 093.Email: [email protected] • Website: www.taurusmutualfund.com
9
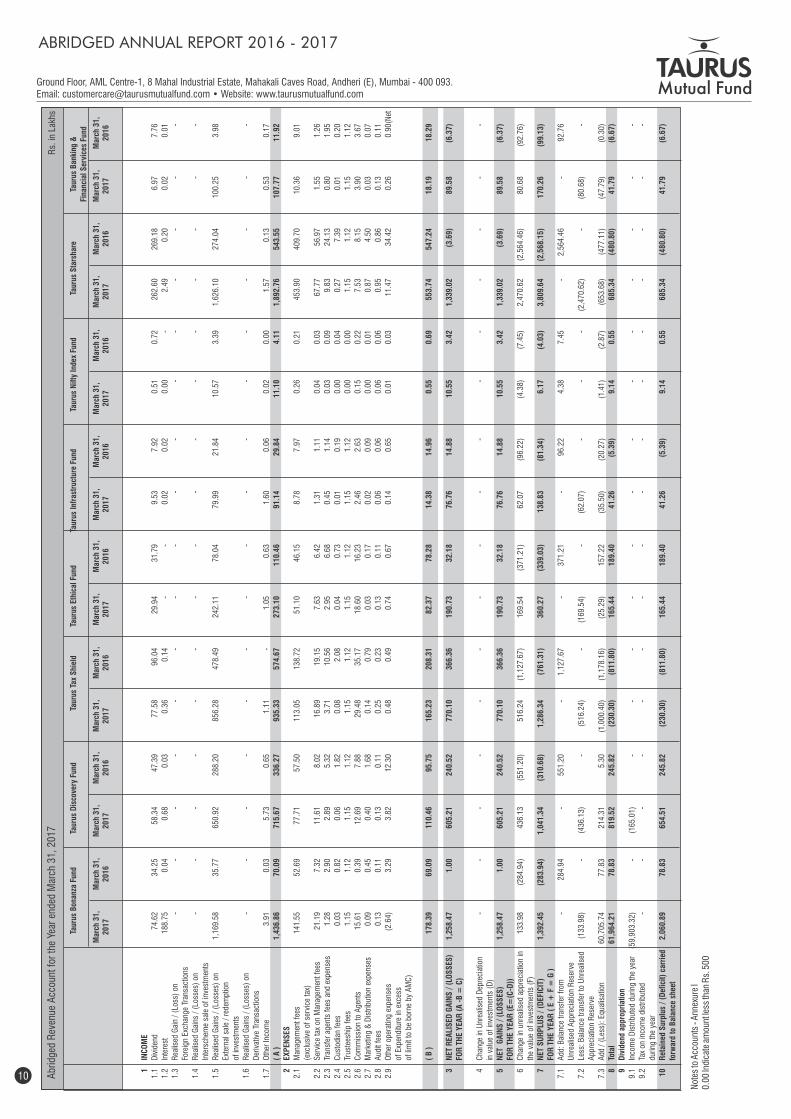
Abr
idge
d R
even
ue A
ccou
nt f
or th
e Ye
ar e
nded
Mar
ch 3
1, 2
017
Not
es to
Acc
ount
s - A
nnex
ure
I0.
00 In
dica
te a
mou
nt le
ss th
an R
s. 5
00
Ta
urus
Bon
anza
Fun
d
Taur
us D
isco
very
Fun
d T a
urus
Tax
Shi
eld
Ta
urus
Eth
ical
Fun
d
Taur
us I
nfra
stru
ctur
e Fu
nd
Ta
urus
Nif
ty I
ndex
Fun
d
Taur
us S
tars
hare
Taur
us B
anki
ng &
Fi
nanc
ial S
ervi
ces
Fund
1
INC
OM
E
1.
1 D
ivid
end
74.
62
34.
25
58.
34
47.
39
77.
58
96.
04
29.
94
31.
79
9.5
3
7.9
2
0.5
1
0.7
2
262
.60
2
69.1
8
6.9
7
7.7
6
1.
2 In
tere
st
188
.75
0
.04
0
.68
0
.03
0
.36
0
.14
-
-
0
.02
0
.02
0.
00
-
2
.49
0
.20
0
.02
0
.01
1.
3 R
ealis
ed G
ain
/ (L
oss)
on
-
-
-
-
-
-
-
-
-
-
-
-
-
-
-
-
Fore
ign
Exch
ange
Tra
nsac
tions
1.
4 R
ealis
ed G
ains
/ (
Loss
es)
on
-
-
-
-
-
-
-
-
-
-
-
-
-
-
-
-
Inte
rsch
eme
sale
of
inve
stm
ents
1.
5 R
ealis
ed G
ains
/ (
Loss
es)
on
1,
169.
58
35.
77
650
.92
2
88.2
0
856
.28
4
78.4
9
242
.11
7
8.04
7
9.99
2
1.84
1
0.57
3
.39
1
,626
.10
2
74.0
4
100
.25
3
.98
Exte
rnal
sal
e /
rede
mpt
ion
of in
vest
men
ts
1.
6 R
ealis
ed G
ains
/ (
Loss
es)
on
-
-
-
-
-
-
-
-
-
-
-
-
-
-
-
-
Der
ivat
ive
Tran
sact
ions
1.
7 O
ther
Inco
me
3.9
1
0.0
3
5.7
3
0.6
5
1.1
1
-
1
.05
0
.63
1
.60
0
.06
0
.02
0
.00
1
.57
0
.13
0
.53
0
.17
( A
)
1,4
36.8
6
70.
09
715
.67
3
36.2
7
935
.33
5
74.6
7
273
.10
1
10.4
6
91.
14
29.
84
11.
10
4.1
1
1,8
92.7
6
543
.55
1
07.7
7
11.
92
2
EXP
ENS
ES
2.
1 M
anag
emen
t fee
s
141
.55
5
2.69
7
7.71
5
7.50
1
13.0
5
138
.72
5
1.10
4
6.15
8
.78
7
.97
0
.26
0
.21
4
53.9
0
409
.70
1
0.36
9
.01
(exc
lusi
ve o
f se
rvic
e ta
x)
2.
2 S
ervi
ce ta
x on
Man
agem
ent f
ees
21.
19
7.3
2
11.
61
8.0
2
16.
89
19.
15
7.6
3
6.4
2
1.3
1
1.1
1
0.0
4
0.0
3
67.
77
56.
97
1.5
5
1.2
6
2.
3 Tr
ansf
er a
gent
s fe
es a
nd e
xpen
ses
1.2
8
2.9
0
2.8
9
5.3
2
3.7
1
10.
56
2.9
5
6.6
8
0.4
5
1.1
4
0.0
3
0.0
9
9.8
3
24.
13
0.8
0
1.9
5
2.
4 C
usto
dian
fee
s 0
.03
0
.82
0
.06
1
.82
0
.08
2
.08
0
.04
0
.73
0
.01
0
.19
0
.00
0
.04
0
.27
7
.39
0
.01
0
.20
2.
5 Tr
uste
eshi
p fe
es
1.1
5
1.1
2
1.1
5
1.1
2
1.1
5
1.1
2
1.1
5
1.1
2
1.1
5
1.1
2
0.0
0
0.0
0
1.1
5
1.1
2
1.1
5
1.1
2
2.
6 C
omm
issi
on to
Age
nts
15.
61
0.3
9
12.
69
7.8
8
29.
48
35.
17
18.
60
16.
23
2.4
6
2.6
3
0.1
5
0.2
2
7.5
3
8.1
5
3.9
0
3.6
7
2.
7 M
arke
ting
& D
istr
ibut
ion
expe
nses
0
.09
0
.45
0
.40
1
.68
0
.14
0
.79
0
.03
0
.17
0
.02
0
.09
0
.00
0
.01
0
.87
4
.50
0
.03
0
.07
2.
8 A
udit
fees
0
.13
0
.11
0
.13
0
.11
0
.25
0
.23
0
.13
0
.11
0
.06
0
.06
0
.06
0
.06
0
.95
0
.86
0
.13
0
.11
2.
9 O
ther
ope
ratin
g ex
pens
es
(2.
64)
3.2
9
3.8
2
12.
30
0.4
8
0.4
9
0.7
4
0.6
7
0.1
4
0.6
5
0.0
1
0.0
3
11.
47
34.
42
0.2
6
0.9
0 (N
et
of E
xpen
ditu
re in
exc
ess
of li
mit
to b
e bo
rne
by A
MC
)
( B
)
178
.39
6
9.09
1
10.4
6
95.
75
165
.23
2
08.3
1
82.
37
78.
28
14.
38
14.
96
0.5
5
0.6
9
553
.74
5
47.2
4
18.
19
18.
29
3
NET
REA
LIS
ED G
AIN
S /
(LO
SS
ES)
1,
258.
47
1.0
0
605
.21
2
40.5
2
770
.10
3
66.3
6
190
.73
3
2.18
7
6.76
1
4.88
1
0.55
3
.42
1
,339
.02
(
3.69
) 8
9.58
(
6.37
)
FOR
TH
E Y
EAR
(A
-B
= C
)
4
Cha
nge
in U
nrea
lised
Dep
reci
atio
n
-
-
-
-
-
-
-
-
-
-
-
-
-
-
-
-
in v
alue
of
inve
stm
ents
(D
)
5
NET
GA
INS
/ (
LOS
SES
)
1,2
58.4
7
1.0
0
605
.21
2
40.5
2
770
.10
3
66.3
6
190
.73
3
2.18
7
6.76
1
4.88
1
0.55
3
.42
1
,339
.02
(
3.69
) 8
9.58
(
6.37
)
FOR
TH
E Y
EAR
(E=
(C-D
))
6
Cha
nge
in u
nrea
lised
app
reci
atio
n in
13
3.98
(
284.
94)
436
.13
(
551.
20)
516
.24
(
1,12
7.67
) 1
69.5
4
(37
1.21
) 6
2.07
(
96.2
2)
(4.
38)
(7.
45)
2,4
70.6
2
(2,
564.
46)
80.
68
(92
.76)
the
valu
e of
inve
stm
ents
(F)
7
NET
SU
RP
LUS
/ (
DEF
ICIT
)
1,3
92.4
5
(28
3.94
) 1
,041
.34
(
310.
68)
1,2
86.3
4
(76
1.31
) 3
60.2
7
(33
9.03
) 1
38.8
3
(81
.34)
6
.17
(
4.03
) 3
,809
.64
(
2,56
8.15
) 1
70.2
6
(99
.13)
FOR
TH
E Y
EAR
( E
+ F
= G
)
7.
1 A
dd: B
alan
ce tr
ansf
er f
rom
-
284
.94
-
551
.20
-
1,1
27.6
7
-
3
71.2
1
-
9
6.22
4
.38
7
.45
-
2,5
64.4
6
-
9
2.76
Unr
ealis
ed A
ppre
ciat
ion
Res
erve
7.
2 Le
ss: B
alan
ce tr
ansf
er to
Unr
ealis
ed
(13
3.98
) -
(43
6.13
) -
(51
6.24
) -
(16
9.54
) -
(62
.07)
-
-
-
(2,
470.
62)
-
(
80.6
8)
-
App
reci
atio
n R
eser
ve
7.
3 A
dd /
(Le
ss):
Equ
alis
atio
n 6
0,70
5.74
7
7.83
2
14.3
1
5.3
0
(1,
000.
40)
(1,
178.
16)
(25
.29)
1
57.2
2
(35
.50)
(
20.2
7)
(1.
41)
(2.
87)
(65
3.68
) (
477.
11)
(47
.79)
(
0.30
)
8
Tota
l 6
1,96
4.21
7
8.83
8
19.5
2
245
.82
(
230.
30)
(81
1.80
) 1
65.4
4
189
.40
4
1.26
(
5.39
) 9
.14
0
.55
6
85.3
4
(48
0.80
) 4
1.79
(
6.67
)
9
Div
iden
d ap
prop
riat
ion
9.
1 In
com
e D
istr
ibut
ed d
urin
g th
e ye
ar
(59
,903
.32)
-
(16
5.01
) -
-
-
-
-
-
-
-
-
-
-
-
-
9.
2 Ta
x on
inco
me
dist
ribut
ed
-
-
-
-
-
-
-
-
-
-
-
-
-
-
-
-
durin
g th
e ye
ar
10
R
etai
ned
Sur
plus
/ (
Def
icit
) ca
rrie
d
2,0
60.8
9
78.
83
654
.51
2
45.8
2
(23
0.30
) (
811.
80)
165
.44
1
89.4
0
41.
26
(5.
39)
9.1
4
0.5
5
685
.34
(
480.
80)
41.
79
(6.
67)
forw
ard
to B
alan
ce s
heet
Rs.
in L
akhs
Mar
ch 3
1,
2017
Mar
ch 3
1,
2016
ABRIDGED ANNUAL REPORT 2016 - 2017
10
Mar
ch 3
1,
2017
Mar
ch 3
1,
2016
Mar
ch 3
1,
2017
Mar
ch 3
1,
2016
Mar
ch 3
1,
2017
Mar
ch 3
1,
2016
Mar
ch 3
1,
2017
Mar
ch 3
1,
2016
Mar
ch 3
1,
2017
Mar
ch 3
1,
2016
Mar
ch 3
1,
2017
Mar
ch 3
1,
2016
Mar
ch 3
1,
2017
Mar
ch 3
1,
2016
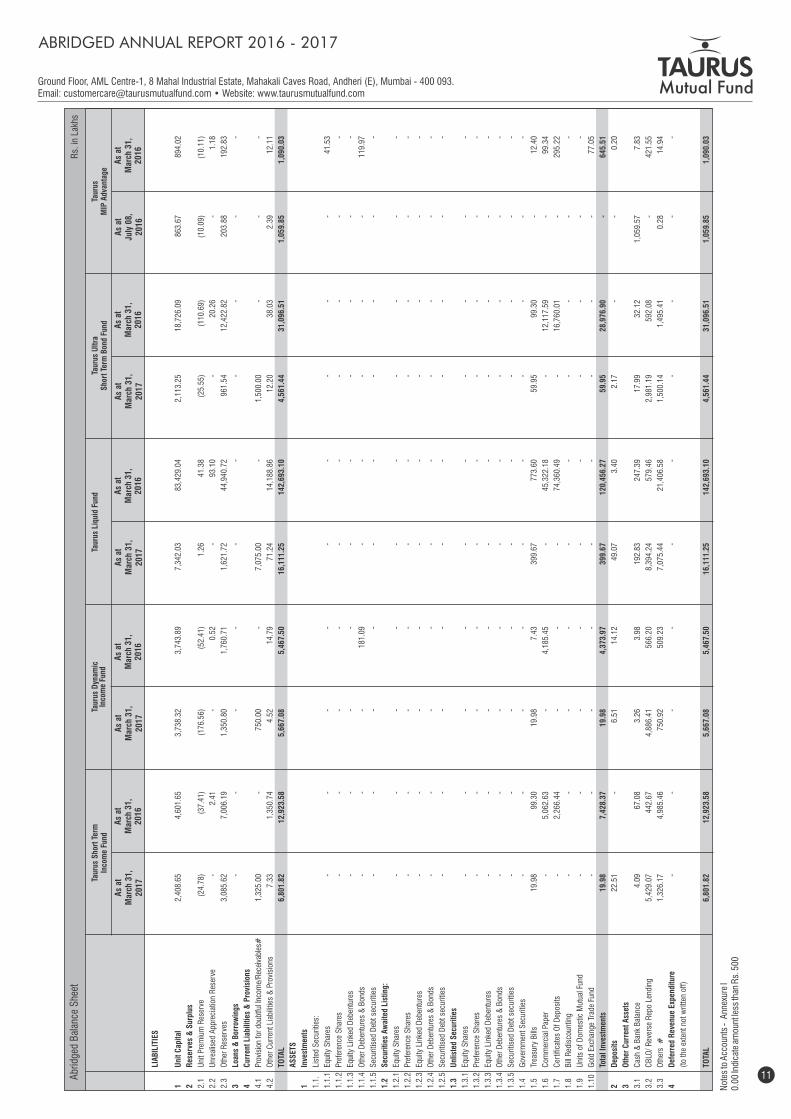
Ground Floor, AML Centre-1, 8 Mahal Industrial Estate, Mahakali Caves Road, Andheri (E), Mumbai - 400 093.Email: [email protected] • Website: www.taurusmutualfund.com
9
LI
AB
ILIT
IES
1 U
nit
Cap
ital
2
,408
.65
4
,601
.65
3
,738
.32
3
,743
.89
7
,342
.03
8
3,42
9.04
2
,113
.25
1
8,72
6.09
8
63.6
7
894
.02
2 R
eser
ves
& S
urpl
us
2.1
Uni
t Pre
miu
m R
eser
ve
(24
.78)
(
37.4
1)
(17
6.56
) (
52.4
1)
1.2
6
41.
38
(25
.55)
(
110.
69)
(10
.09)
(
10.1
1)
2.2
Unr
ealis
ed A
ppre
ciat
ion
Res
erve
-
2.4
1
-
0
.52
-
93.
10
-
2
0.26
-
1.1
8
2.3
Oth
er R
eser
ves
3,0
85.6
2
7,0
06.1
9
1,3
50.8
0
1,7
60.7
1
1,6
21.7
2
44,
940.
72
961
.54
1
2,42
2.82
2
03.8
8
192
.83
3 Lo
ans
& B
orro
win
gs
-
-
-
-
-
-
-
-
-
-
4 C
urre
nt L
iabi
litie
s &
Pro
visi
ons
4.1
Prov
isio
n fo
r do
ubtfu
l Inc
ome/
Rec
eiva
bles
#
1,3
25.0
0
-
7
50.0
0
-
7
,075
.00
-
1,5
00.0
0
-
-
-
4.2
Oth
er C
urre
nt L
iabi
litie
s &
Pro
visi
ons
7.3
3
1,3
50.7
4
4.5
2
14.
79
71.
24
14,
188.
86
12.
20
38.
03
2.3
9
12.
11
TO
TAL
6,8
01.8
2
12,
923.
58
5,6
67.0
8
5,4
67.5
0
16,
111.
25
142
,693
.10
4
,561
.44
3
1,09
6.51
1
,059
.85
1
,090
.03
A
SS
ETS
1 In
vest
men
ts
1.1.
Li
sted
Sec
uriti
es:
1.1.
1 Eq
uity
Sha
res
-
-
-
-
-
-
-
-
-
4
1.53
1.1.
2 P
refe
renc
e S
hare
s -
-
-
-
-
-
-
-
-
-
1.1.
3 Eq
uity
Lin
ked
Deb
entu
res
-
-
-
-
-
-
-
-
-
-
1.1.
4 O
ther
Deb
entu
res
& B
onds
-
-
-
181
.09
-
-
-
-
-
119
.97
1.1.
5 S
ecur
itise
d D
ebt s
ecur
ities
-
-
-
-
-
-
-
-
-
-
1.2
Sec
urit
ies
Aw
aite
d Li
stin
g:
1.2.
1 Eq
uity
Sha
res
-
-
-
-
-
-
-
-
-
-
1.2.
2 P
refe
renc
e S
hare
s -
-
-
-
-
-
-
-
-
-
1.2.
3 Eq
uity
Lin
ked
Deb
entu
res
-
-
-
-
-
-
-
-
-
-
1.2.
4 O
ther
Deb
entu
res
& B
onds
-
-
-
-
-
-
-
-
-
-
1.2.
5 S
ecur
itise
d D
ebt s
ecur
ities
-
-
-
-
-
-
-
-
-
-
1.3
Unl
iste
d S
ecur
itie
s
1.3.
1 Eq
uity
Sha
res
-
-
-
-
-
-
-
-
-
-
1.3.
2 P
refe
renc
e S
hare
s -
-
-
-
-
-
-
-
-
-
1.3.
3 Eq
uity
Lin
ked
Deb
entu
res
-
-
-
-
-
-
-
-
-
-
1.3.
4 O
ther
Deb
entu
res
& B
onds
-
-
-
-
-
-
-
-
-
-
1.3.
5 S
ecur
itise
d D
ebt s
ecur
ities
-
-
-
-
-
-
-
-
-
-
1.4
Gov
ernm
ent S
ecur
ities
-
-
-
-
-
-
-
-
-
-
1.5
Trea
sury
Bill
s 1
9.98
9
9.30
1
9.98
7
.43
3
99.6
7
773
.60
5
9.95
9
9.30
-
12.
40
1.6
Com
mer
cial
Pap
er
-
5
,062
.63
-
4,1
85.4
5
-
4
5,32
2.18
-
12,
117.
59
-
9
9.34
1.7
Cer
tific
ates
Of
Dep
osits
-
2,2
66.4
4
-
-
-
7
4,36
0.49
-
16,
760.
01
-
2
95.2
2
1.8
Bill
Red
isco
untin
g -
-
-
-
-
-
-
-
-
-
1.9
Uni
ts o
f D
omes
tic M
utua
l Fun
d -
-
-
-
-
-
-
-
-
-
1.10
G
old
Exch
ange
Tra
de F
und
-
-
-
-
-
-
-
-
-
7
7.05
To
tal I
nves
tmen
ts
19.
98
7,4
28.3
7
19.
98
4,3
73.9
7
399
.67
1
20,4
56.2
7
59.
95
28,
976.
90
-
6
45.5
1
2 D
epos
its
22.
51
-
6
.51
1
4.12
4
9.07
3
.40
2
.17
-
-
0
.20
3 O
ther
Cur
rent
Ass
ets
3.1
Cas
h &
Ban
k B
alan
ce
4.0
9
67.
08
3.2
6
3.9
8
192
.83
2
47.3
9
17.
99
32.
12
1,0
59.5
7
7.8
3
3.2
CB
LO/
Rev
erse
Rep
o Le
ndin
g 5
,429
.07
4
42.6
7
4,8
86.4
1
566
.20
8
,394
.24
5
79.4
6
2,9
81.1
9
592
.08
-
421
.55
3.3
Oth
ers
#
1,3
26.1
7
4,9
85.4
6
750
.92
5
09.2
3
7,0
75.4
4
21,
406.
58
1,5
00.1
4
1,4
95.4
1
0.2
8
14.
94
4 D
efer
red
Rev
enue
Exp
endi
ture
-
-
-
-
-
-
-
-
-
-
(t
o th
e ex
tent
not
writ
ten
off)
TO
TAL
6,8
01.8
2
12,
923.
58
5,6
67.0
8
5,4
67.5
0
16,
111.
25
142
,693
.10
4
,561
.44
3
1,09
6.51
1
,059
.85
1
,090
.03
Abr
idge
d B
alan
ce S
heet
Taur
us S
hort
Ter
mIn
com
e Fu
nd
As
at
Mar
ch 3
1,
2017
As
at
Mar
ch 3
1,
2016
Taur
us D
ynam
icIn
com
e Fu
ndTa
urus
Liq
uid
Fund
Taur
us U
ltra
Sho
rt T
erm
Bon
d Fu
ndTa
urus
MIP
Adv
anta
ge
Not
es to
Acc
ount
s -
Ann
exur
e I
0.00
Indi
cate
am
ount
less
than
Rs.
500
Rs.
in L
akhs
ABRIDGED ANNUAL REPORT 2016 - 2017
As
at
Mar
ch 3
1,
2017
As
at
Mar
ch 3
1,
2016
As
at
Mar
ch 3
1,
2017
As
at
Mar
ch 3
1,
2016
As
at
Mar
ch 3
1,
2017
As
at
Mar
ch 3
1,
2016
As
at
July
08,
20
16
As
at
Mar
ch 3
1,
2016
11
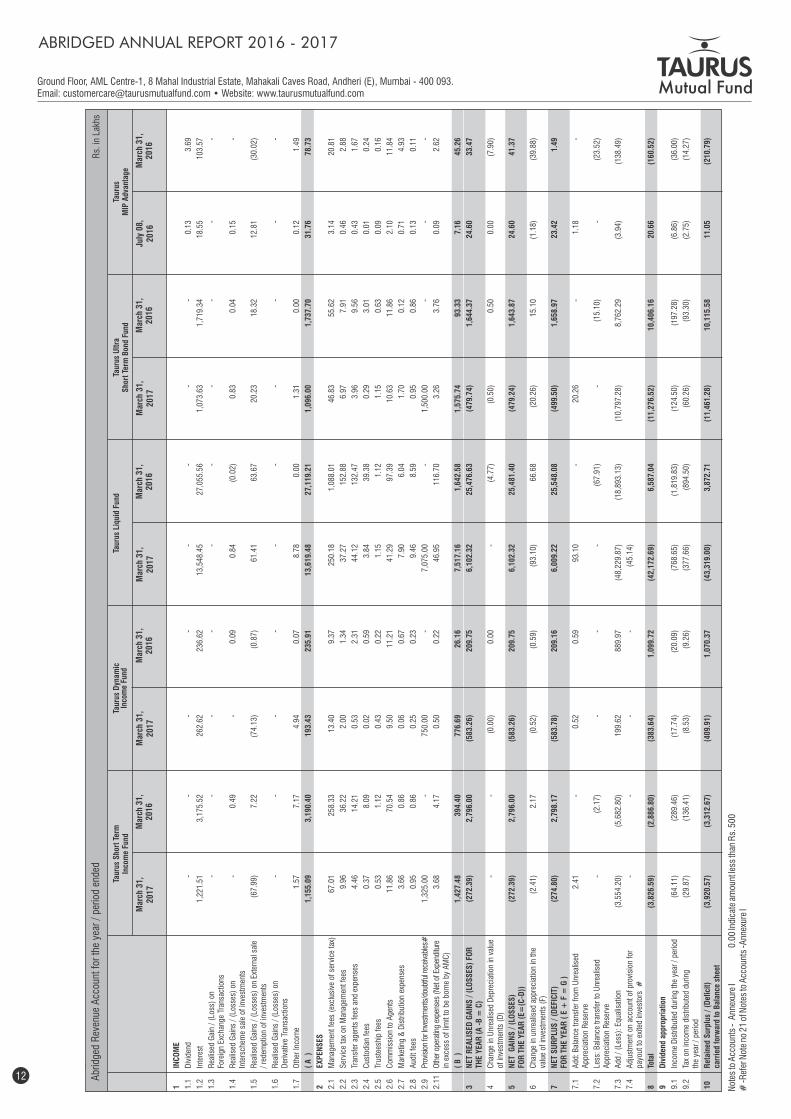
Ground Floor, AML Centre-1, 8 Mahal Industrial Estate, Mahakali Caves Road, Andheri (E), Mumbai - 400 093.Email: [email protected] • Website: www.taurusmutualfund.com
Not
es to
Acc
ount
s -
Ann
exur
e I
0.00
Indi
cate
am
ount
less
than
Rs.
500
# -R
efer
Not
e no
21
of N
otes
to A
ccou
nts
-Ann
exur
e I
9
1 IN
CO
ME
1.1
Div
iden
d -
-
-
-
-
-
-
-
0
.13
3
.69
1.2
Inte
rest
1
,221
.51
3
,175
.52
2
62.6
2
236
.62
1
3,54
8.45
2
7,05
5.56
1
,073
.63
1
,719
.34
1
8.55
1
03.5
7
1.3
Rea
lised
Gai
n /
(Los
s) o
n
-
-
-
-
-
-
-
-
-
-
Fore
ign
Exch
ange
Tra
nsac
tions
1.4
Rea
lised
Gai
ns /
(Lo
sses
) on
-
0.4
9
-
0
.09
0
.84
(
0.02
) 0
.83
0
.04
0
.15
-
Inte
rsch
eme
sale
of
inve
stm
ents
1.5
Rea
lised
Gai
ns /
(Lo
sses
) on
Ext
erna
l sal
e
(67
.99)
7
.22
(
74.1
3)
(0.
87)
61.
41
63.
67
20.
23
18.
32
12.
81
(30
.02)
/
rede
mpt
ion
of in
vest
men
ts
1.6
Rea
lised
Gai
ns /
(Lo
sses
) on
-
-
-
-
-
-
-
-
-
-
D
eriv
ativ
e Tr
ansa
ctio
ns
1.7
Oth
er In
com
e 1
.57
7
.17
4
.94
0
.07
8
.78
0
.00
1
.31
0
.00
0
.12
1
.49
(
A )
1
,155
.09
3
,190
.40
1
93.4
3
235
.91
1
3,61
9.48
2
7,11
9.21
1
,096
.00
1
,737
.70
3
1.76
7
8.73
2 EX
PEN
SES
2.1
Man
agem
ent f
ees
(exc
lusi
ve o
f se
rvic
e ta
x)
67.
01
258
.33
1
3.40
9
.37
2
50.1
8
1,0
88.0
1
46.
83
55.
62
3.1
4
20.
81
2.2
Ser
vice
tax
on M
anag
emen
t fee
s 9
.96
3
6.22
2
.00
1
.34
3
7.27
1
52.8
8
6.9
7
7.9
1
0.4
6
2.8
8
2.3
Tran
sfer
age
nts
fees
and
exp
ense
s 4
.46
1
4.21
0
.53
2
.31
4
4.12
1
32.4
7
3.9
6
9.5
6
0.4
3
1.6
7
2.4
Cus
todi
an f
ees
0.3
7
8.0
9
0.0
2
0.5
9
3.8
4
39.
38
0.2
9
3.0
1
0.0
1
0.2
4
2.5
Trus
tees
hip
fees
0
.53
1
.12
0
.43
0
.22
1
.15
1
.12
1
.15
0
.63
0
.09
0
.16
2.6
Com
mis
sion
to A
gent
s 1
1.86
7
0.54
9
.50
1
1.21
4
1.29
9
7.39
1
0.63
1
1.86
2
.10
1
1.84
2.7
Mar
ketin
g &
Dis
trib
utio
n ex
pens
es
3.6
6
0.8
6
0.0
6
0.6
7
7.9
0
6.0
4
1.7
0
0.1
2
0.7
1
4.9
3
2.8
Aud
it fe
es
0.9
5
0.8
6
0.2
5
0.2
3
9.4
6
8.5
9
0.9
5
0.8
6
0.1
3
0.1
1
2.9
Prov
isio
n fo
r Inv
estm
ents
/dou
btfu
l rec
eiva
bles
#
1,3
25.0
0
-
7
50.0
0
-
7
,075
.00
-
1,5
00.0
0
-
-
-
2.11
O
ther
ope
ratin
g ex
pens
es (
Net
of E
xpen
ditu
re
3.6
8
4.1
7
0.5
0
0.2
2
46.
95
116
.70
3
.26
3
.76
0
.09
2
.62
in
exc
ess
of li
mit
to b
e bo
rne
by A
MC
)
(
B )
1
,427
.48
3
94.4
0
776
.69
2
6.16
7
,517
.16
1
,642
.58
1
,575
.74
9
3.33
7
.16
4
5.26
3 N
ET R
EALI
SED
GA
INS
/ (
LOS
SES
) FO
R
(27
2.39
) 2
,796
.00
(
583.
26)
209
.75
6
,102
.32
2
5,47
6.63
(
479.
74)
1,6
44.3
7
24.
60
33.
47
TH
E Y
EAR
(A
-B
= C
)
4 C
hang
e in
Unr
ealis
ed D
epre
ciat
ion
in v
alue
-
-
(
0.00
)
0.0
0
-
(
4.77
) (
0.50
) 0
.50
0.
00
(7.
90)
of
inve
stm
ents
(D
)
5 N
ET G
AIN
S /
(LO
SS
ES)
(
272.
39)
2,7
96.0
0
(58
3.26
) 2
09.7
5
6,1
02.3
2
25,
481.
40
(47
9.24
) 1
,643
.87
2
4.60
4
1.37
FOR
TH
E Y
EAR
(E=
(C-D
))
6 C
hang
e in
unr
ealis
ed a
ppre
ciat
ion
in th
e
(2.
41)
2.1
7
(0.
52)
(0.
59)
(93
.10)
6
6.68
(
20.2
6)
15.
10
(1.
18)
(39
.88)
va
lue
of in
vest
men
ts (
F)
7 N
ET S
UR
PLU
S /
(D
EFIC
IT)
(
274.
80)
2,7
98.1
7
(58
3.78
) 2
09.1
6
6,0
09.2
2
25,
548.
08
(49
9.50
) 1
,658
.97
2
3.42
1
.49
FO
R T
HE
YEA
R (
E +
F =
G )
7.1
Add
: Bal
ance
tran
sfer
fro
m U
nrea
lised
2
.41
-
0.5
2
0.5
9
93.
10
-
2
0.26
-
1.1
8
-
A
ppre
ciat
ion
Res
erve
7.2
Less
: Bal
ance
tran
sfer
to U
nrea
lised
-
(2.
17)
-
-
-
(
67.9
1)
-
(
15.1
0)
-
(
23.5
2)
App
reci
atio
n R
eser
ve
7.3
Add
/ (
Less
): E
qual
isat
ion
(3,
554.
20)
(5,
682.
80)
199
.62
8
89.9
7
(48
,229
.87)
(
18,8
93.1
3)
(10
,797
.28)
8
,762
.29
(
3.94
) (
138.
49)
7.4
Adj
ustm
ent o
n ac
coun
t of
prov
isio
n fo
r
-
-
-
-
(45
.14)
payo
ut to
exi
ted
inve
stor
s #
8 To
tal
(3,
826.
59)
(2,
886.
80)
(38
3.64
) 1
,099
.72
(
42,1
72.6
9)
6,5
87.0
4
(11
,276
.52)
1
0,40
6.16
2
0.66
(
160.
52)
9 D
ivid
end
appr
opri
atio
n
9.1
Inco
me
Dis
trib
uted
dur
ing
the
year
/ p
erio
d
(64
.11)
(
289.
46)
(17
.74)
(
20.0
9)
(76
8.65
) (
1,81
9.83
) (
124.
50)
(19
7.28
) (
6.86
) (
36.0
0)
9.2
Tax
on in
com
e di
strib
uted
dur
ing
(
29.8
7)
(13
6.41
) (
8.53
) (
9.26
) (
377.
66)
(89
4.50
) (
60.2
6)
(93
.30)
(
2.75
) (
14.2
7)
the
year
/ p
erio
d
10
Ret
aine
d S
urpl
us /
(D
efic
it)
(
3,92
0.57
) (
3,31
2.67
) (
409.
91)
1,0
70.3
7
(43
,319
.00)
3
,872
.71
(
11,4
61.2
8)
10,
115.
58
11.
05
(21
0.79
)
carr
ied
forw
ard
to B
alan
ce s
heet
Abr
idge
d R
even
ue A
ccou
nt f
or th
e ye
ar /
per
iod
ende
d
Taur
us S
hort
Ter
mIn
com
e Fu
nd
Mar
ch 3
1,
2017
Mar
ch 3
1,
2016
Taur
us D
ynam
icIn
com
e Fu
ndTa
urus
Liq
uid
Fund
Taur
us U
ltra
Sho
rt T
erm
Bon
d Fu
ndTa
urus
MIP
Adv
anta
ge
Rs.
in L
akhs
ABRIDGED ANNUAL REPORT 2016 - 2017
12
Mar
ch 3
1,
2017
Mar
ch 3
1,
2016
Mar
ch 3
1,
2017
Mar
ch 3
1,
2016
Mar
ch 3
1,
2017
Mar
ch 3
1,
2016
July
08,
20
16M
arch
31,
20
16
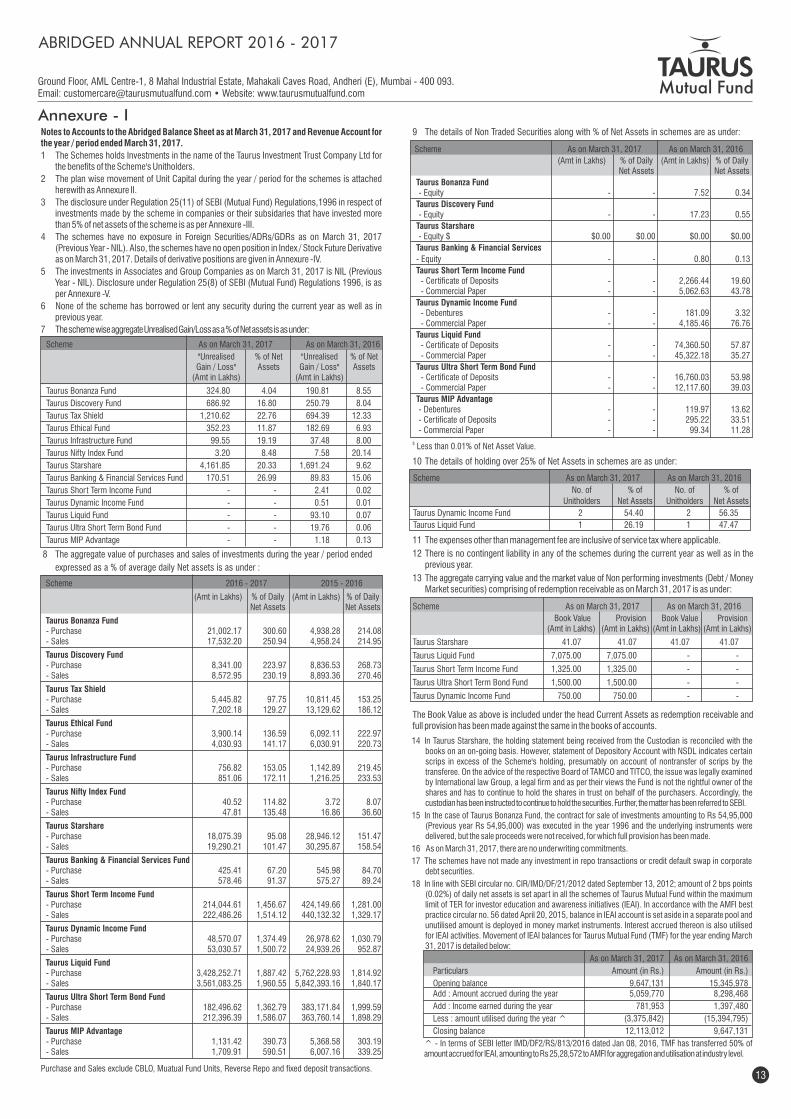
Ground Floor, AML Centre-1, 8 Mahal Industrial Estate, Mahakali Caves Road, Andheri (E), Mumbai - 400 093.Email: [email protected] • Website: www.taurusmutualfund.com
Notes to Accounts to the Abridged Balance Sheet as at March 31, 2017 and Revenue Account for the year / period ended March 31, 2017.
1 The Schemes holds Investments in the name of the Taurus Investment Trust Company Ltd for the benefits of the Scheme's Unitholders.
2 The plan wise movement of Unit Capital during the year / period for the schemes is attached herewith as Annexure II.
3 The disclosure under Regulation 25(11) of SEBI (Mutual Fund) Regulations,1996 in respect of investments made by the scheme in companies or their subsidaries that have invested more than 5% of net assets of the scheme is as per Annexure -III.
4 The schemes have no exposure in Foreign Securities/ADRs/GDRs as on March 31, 2017 (Previous Year - NIL). Also, the schemes have no open position in Index / Stock Future Derivative as on March 31, 2017. Details of derivative positions are given in Annexure -IV.
5 The investments in Associates and Group Companies as on March 31, 2017 is NIL (Previous Year - NIL). Disclosure under Regulation 25(8) of SEBI (Mutual Fund) Regulations 1996, is as per Annexure -V.
6 None of the scheme has borrowed or lent any security during the current year as well as in previous year.
7 The scheme wise aggregate Unrealised Gain/Loss as a % of Net assets is as under:
Annexure - I
Scheme As on March 31, 2017 As on March 31, 2016
"Unrealised % of Net "Unrealised % of Net Gain / Loss" Assets Gain / Loss" Assets (Amt in Lakhs) (Amt in Lakhs)
Taurus Bonanza Fund 324.80 4.04 190.81 8.55
Taurus Discovery Fund 686.92 16.80 250.79 8.04
Taurus Tax Shield 1,210.62 22.76 694.39 12.33
Taurus Ethical Fund 352.23 11.87 182.69 6.93
Taurus Infrastructure Fund 99.55 19.19 37.48 8.00
Taurus Nifty Index Fund 3.20 8.48 7.58 20.14
Taurus Starshare 4,161.85 20.33 1,691.24 9.62
Taurus Banking & Financial Services Fund 170.51 26.99 89.83 15.06
Taurus Short Term Income Fund - - 2.41 0.02
Taurus Dynamic Income Fund - - 0.51 0.01
Taurus Liquid Fund - - 93.10 0.07
Taurus Ultra Short Term Bond Fund - - 19.76 0.06
Taurus MIP Advantage - - 1.18 0.13
Scheme 2016 - 2017 2015 - 2016
(Amt in Lakhs) % of Daily (Amt in Lakhs) % of Daily Net Assets Net Assets
Taurus Bonanza Fund - Purchase 21,002.17 300.60 4,938.28 214.08 - Sales 17,532.20 250.94 4,958.24 214.95
Taurus Discovery Fund - Purchase 8,341.00 223.97 8,836.53 268.73 - Sales 8,572.95 230.19 8,893.36 270.46
Taurus Tax Shield - Purchase 5,445.82 97.75 10,811.45 153.25 - Sales 7,202.18 129.27 13,129.62 186.12
Taurus Ethical Fund - Purchase 3,900.14 136.59 6,092.11 222.97 - Sales 4,030.93 141.17 6,030.91 220.73
Taurus Infrastructure Fund - Purchase 756.82 153.05 1,142.89 219.45 - Sales 851.06 172.11 1,216.25 233.53
Taurus Nifty Index Fund - Purchase 40.52 114.82 3.72 8.07 - Sales 47.81 135.48 16.86 36.60
Taurus Starshare - Purchase 18,075.39 95.08 28,946.12 151.47 - Sales 19,290.21 101.47 30,295.87 158.54
Taurus Banking & Financial Services Fund - Purchase 425.41 67.20 545.98 84.70 - Sales 578.46 91.37 575.27 89.24
Taurus Short Term Income Fund - Purchase 214,044.61 1,456.67 424,149.66 1,281.00 - Sales 222,486.26 1,514.12 440,132.32 1,329.17
Taurus Dynamic Income Fund - Purchase 48,570.07 1,374.49 26,978.62 1,030.79 - Sales 53,030.57 1,500.72 24,939.26 952.87
Taurus Liquid Fund - Purchase 3,428,252.71 1,887.42 5,762,228.93 1,814.92 - Sales 3,561,083.25 1,960.55 5,842,393.16 1,840.17
Taurus Ultra Short Term Bond Fund - Purchase 182,496.62 1,362.79 383,171.84 1,999.59 - Sales 212,396.39 1,586.07 363,760.14 1,898.29
Taurus MIP Advantage - Purchase 1,131.42 390.73 5,368.58 303.19 - Sales 1,709.91 590.51 6,007.16 339.25
8 The aggregate value of purchases and sales of investments during the year / period ended
expressed as a % of average daily Net assets is as under :
Purchase and Sales exclude CBLO, Muatual Fund Units, Reverse Repo and fixed deposit transactions.
Scheme As on March 31, 2017 A s on March 31, 2016
(Amt in Lakhs) % of Daily (Amt in Lakhs) % of Daily Net Assets Net Assets
Taurus Bonanza Fund - Equity - - 7.52 0.34
Taurus Discovery Fund - Equity - - 17.23 0.55
Taurus Starshare - Equity $ $0.00 $0.00 $0.00 $0.00
Taurus Banking & Financial Services
- Equity - - 0.80 0.13
Taurus Short Term Income Fund - Certificate of Deposits - - 2,266.44 19.60 - Commercial Paper - - 5,062.63 43.78
Taurus Dynamic Income Fund - Debentures - - 181.09 3.32 - Commercial Paper - - 4,185.46 76.76
Taurus Liquid Fund - Certificate of Deposits - - 74,360.50 57.87 - Commercial Paper - - 45,322.18 35.27
Taurus Ultra Short Term Bond Fund - Certificate of Deposits - - 16,760.03 53.98 - Commercial Paper - - 12,117.60 39.03
Taurus MIP Advantage - Debentures - - 119.97 13.62 - Certificate of Deposits - - 295.22 33.51 - Commercial Paper - - 99.34 11.28
9 The details of Non Traded Securities along with % of Net Assets in schemes are as under:
$ Less than 0.01% of Net Asset Value.
Scheme As on March 31, 2017 A s on March 31, 2016
No. of % of No. of % of
Unitholders Net Assets Unitholders Net Assets
Taurus Dynamic Income Fund 2 54.40 2 56.35
Taurus Liquid Fund 1 26.19 1 47.47
10 The details of holding over 25% of Net Assets in schemes are as under:
14 In Taurus Starshare, the holding statement being received from the Custodian is reconciled with the books on an on-going basis. However, statement of Depository Account with NSDL indicates certain scrips in excess of the Scheme's holding, presumably on account of nontransfer of scrips by the transferee. On the advice of the respective Board of TAMCO and TITCO, the issue was legally examined by International law Group, a legal firm and as per their views the Fund is not the rightful owner of the shares and has to continue to hold the shares in trust on behalf of the purchasers. Accordingly, the custodian has been instructed to continue to hold the securities. Further, the matter has been referred to SEBI.
15 In the case of Taurus Bonanza Fund, the contract for sale of investments amounting to Rs 54,95,000 (Previous year Rs 54,95,000) was executed in the year 1996 and the underlying instruments were delivered, but the sale proceeds were not received, for which full provision has been made.
16 As on March 31, 2017, there are no underwriting commitments.
17 The schemes have not made any investment in repo transactions or credit default swap in corporate debt securities.
18 In line with SEBI circular no. CIR/IMD/DF/21/2012 dated September 13, 2012; amount of 2 bps points (0.02%) of daily net assets is set apart in all the schemes of Taurus Mutual Fund within the maximum limit of TER for investor education and awareness initiatives (IEAI). In accordance with the AMFI best practice circular no. 56 dated April 20, 2015, balance in IEAI account is set aside in a separate pool and unutilised amount is deployed in money market instruments. Interest accrued thereon is also utilised for IEAI activities. Movement of IEAI balances for Taurus Mutual Fund (TMF) for the year ending March 31, 2017 is detailed below:
As on March 31, 2017 As on March 31, 2016
Particulars Amount (in Rs.) Amount (in Rs.)
Opening balance 9,647,131 15,345,978 Add : Amount accrued during the year 5,059,770 8,298,468
Add : Income earned during the year 781,953 1,397,480
Less : amount utilised during the year ^ (3,375,842) (15,394,795)
Closing balance 12,113,012 9,647,131
^ - In terms of SEBI letter IMD/DF2/RS/813/2016 dated Jan 08, 2016, TMF has transferred 50% of amount accrued for IEAI, amounting to Rs 25,28,572 to AMFI for aggregation and utilisation at industry level.
Scheme As on March 31, 2017 A s on March 31, 2016
Book Value Provision Book Value Provision (Amt in Lakhs) (Amt in Lakhs) (Amt in Lakhs) (Amt in Lakhs)
Taurus Starshare 41.07 41.07 41.07 41.07
Taurus Liquid Fund 7,075.00 7,075.00 - -
Taurus Short Term Income Fund 1,325.00 1,325.00 - -
Taurus Ultra Short Term Bond Fund 1,500.00 1,500.00 - -
Taurus Dynamic Income Fund 750.00 750.00 - -
11 The expenses other than management fee are inclusive of service tax where applicable.
12 There is no contingent liability in any of the schemes during the current year as well as in the previous year.
13 The aggregate carrying value and the market value of Non performing investments (Debt / Money Market securities) comprising of redemption receivable as on March 31, 2017 is as under:
ABRIDGED ANNUAL REPORT 2016 - 2017
The Book Value as above is included under the head Current Assets as redemption receivable and full provision has been made against the same in the books of accounts.
13
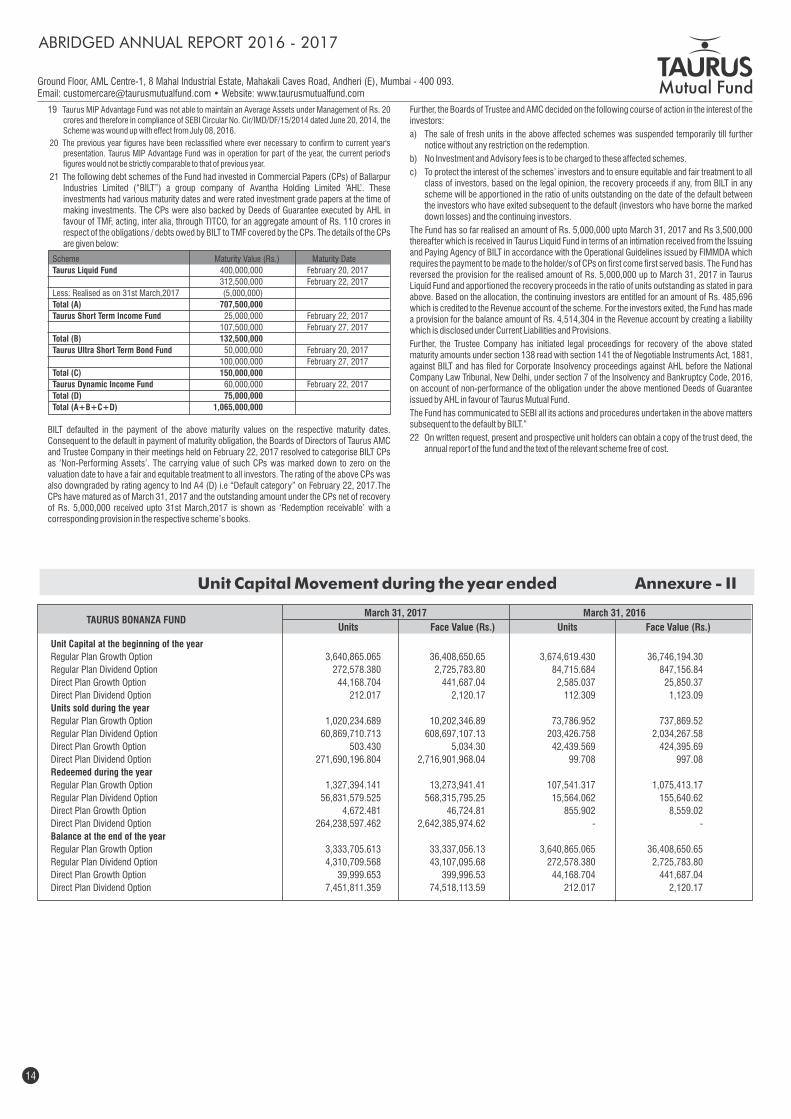
Ground Floor, AML Centre-1, 8 Mahal Industrial Estate, Mahakali Caves Road, Andheri (E), Mumbai - 400 093.Email: [email protected] • Website: www.taurusmutualfund.com
ABRIDGED ANNUAL REPORT 2016 - 2017
19 Taurus MIP Advantage Fund was not able to maintain an Average Assets under Management of Rs. 20 crores and therefore in compliance of SEBI Circular No. Cir/IMD/DF/15/2014 dated June 20, 2014, the Scheme was wound up with effect from July 08, 2016.
20 The previous year figures have been reclassified where ever necessary to confirm to current year's presentation. Taurus MIP Advantage Fund was in operation for part of the year, the current period's figures would not be strictly comparable to that of previous year.
21 The following debt schemes of the Fund had invested in Commercial Papers (CPs) of Ballarpur Industries Limited (“BILT”) a group company of Avantha Holding Limited ‘AHL’. These investments had various maturity dates and were rated investment grade papers at the time of making investments. The CPs were also backed by Deeds of Guarantee executed by AHL in favour of TMF, acting, inter alia, through TITCO, for an aggregate amount of Rs. 110 crores in respect of the obligations / debts owed by BILT to TMF covered by the CPs. The details of the CPs are given below:
Scheme Maturity Value (Rs.) Maturity Date
Taurus Liquid Fund 400,000,000 February 20, 2017
312,500,000 February 22, 2017
Less: Realised as on 31st March,2017 (5,000,000)
Total (A) 707,500,000
Taurus Short Term Income Fund 25,000,000 February 22, 2017
107,500,000 February 27, 2017
Total (B) 132,500,000
Taurus Ultra Short Term Bond Fund 50,000,000 February 20, 2017
100,000,000 February 27, 2017
Total (C) 150,000,000
Taurus Dynamic Income Fund 60,000,000 February 22, 2017
Total (D) 75,000,000
Total (A+B+C+D) 1,065,000,000
Further, the Boards of Trustee and AMC decided on the following course of action in the interest of the investors:
a) The sale of fresh units in the above affected schemes was suspended temporarily till further notice without any restriction on the redemption.
b) No Investment and Advisory fees is to be charged to these affected schemes.
c) To protect the interest of the schemes’ investors and to ensure equitable and fair treatment to all class of investors, based on the legal opinion, the recovery proceeds if any, from BILT in any scheme will be apportioned in the ratio of units outstanding on the date of the default between the investors who have exited subsequent to the default (investors who have borne the marked down losses) and the continuing investors.
The Fund has so far realised an amount of Rs. 5,000,000 upto March 31, 2017 and Rs 3,500,000 thereafter which is received in Taurus Liquid Fund in terms of an intimation received from the Issuing and Paying Agency of BILT in accordance with the Operational Guidelines issued by FIMMDA which requires the payment to be made to the holder/s of CPs on first come first served basis. The Fund has reversed the provision for the realised amount of Rs. 5,000,000 up to March 31, 2017 in Taurus Liquid Fund and apportioned the recovery proceeds in the ratio of units outstanding as stated in para above. Based on the allocation, the continuing investors are entitled for an amount of Rs. 485,696 which is credited to the Revenue account of the scheme. For the investors exited, the Fund has made a provision for the balance amount of Rs. 4,514,304 in the Revenue account by creating a liability which is disclosed under Current Liabilities and Provisions.
Further, the Trustee Company has initiated legal proceedings for recovery of the above stated maturity amounts under section 138 read with section 141 the of Negotiable Instruments Act, 1881, against BILT and has filed for Corporate Insolvency proceedings against AHL before the National Company Law Tribunal, New Delhi, under section 7 of the Insolvency and Bankruptcy Code, 2016, on account of non-performance of the obligation under the above mentioned Deeds of Guarantee issued by AHL in favour of Taurus Mutual Fund.
The Fund has communicated to SEBI all its actions and procedures undertaken in the above matters subsequent to the default by BILT.”
22 On written request, present and prospective unit holders can obtain a copy of the trust deed, the annual report of the fund and the text of the relevant scheme free of cost.
Unit Capital at the beginning of the year
Regular Plan Growth Option 3,640,865.065 36,408,650.65 3,674,619.430 36,746,194.30
Regular Plan Dividend Option 272,578.380 2,725,783.80 84,715.684 847,156.84
Direct Plan Growth Option 44,168.704 441,687.04 2,585.037 25,850.37
Direct Plan Dividend Option 212.017 2,120.17 112.309 1,123.09
Units sold during the year
Regular Plan Growth Option 1,020,234.689 10,202,346.89 73,786.952 737,869.52
Regular Plan Dividend Option 60,869,710.713 608,697,107.13 203,426.758 2,034,267.58
Direct Plan Growth Option 503.430 5,034.30 42,439.569 424,395.69
Direct Plan Dividend Option 271,690,196.804 2,716,901,968.04 99.708 997.08
Redeemed during the year
Regular Plan Growth Option 1,327,394.141 13,273,941.41 107,541.317 1,075,413.17
Regular Plan Dividend Option 56,831,579.525 568,315,795.25 15,564.062 155,640.62
Direct Plan Growth Option 4,672.481 46,724.81 855.902 8,559.02
Direct Plan Dividend Option 264,238,597.462 2,642,385,974.62 - -
Balance at the end of the year
Regular Plan Growth Option 3,333,705.613 33,337,056.13 3,640,865.065 36,408,650.65
Regular Plan Dividend Option 4,310,709.568 43,107,095.68 272,578.380 2,725,783.80
Direct Plan Growth Option 39,999.653 399,996.53 44,168.704 441,687.04
Direct Plan Dividend Option 7,451,811.359 74,518,113.59 212.017 2,120.17
March 31, 2017 March 31, 2016TAURUS BONANZA FUND
Units Face Value (Rs.) Units Face Value (Rs.)
Unit Capital Movement during the year ended Annexure - II
BILT defaulted in the payment of the above maturity values on the respective maturity dates. Consequent to the default in payment of maturity obligation, the Boards of Directors of Taurus AMC and Trustee Company in their meetings held on February 22, 2017 resolved to categorise BILT CPs as ‘Non-Performing Assets’. The carrying value of such CPs was marked down to zero on the valuation date to have a fair and equitable treatment to all investors. The rating of the above CPs was also downgraded by rating agency to Ind A4 (D) i.e “Default category” on February 22, 2017.The CPs have matured as of March 31, 2017 and the outstanding amount under the CPs net of recovery of Rs. 5,000,000 received upto 31st March,2017 is shown as ‘Redemption receivable’ with a corresponding provision in the respective scheme’s books.
14
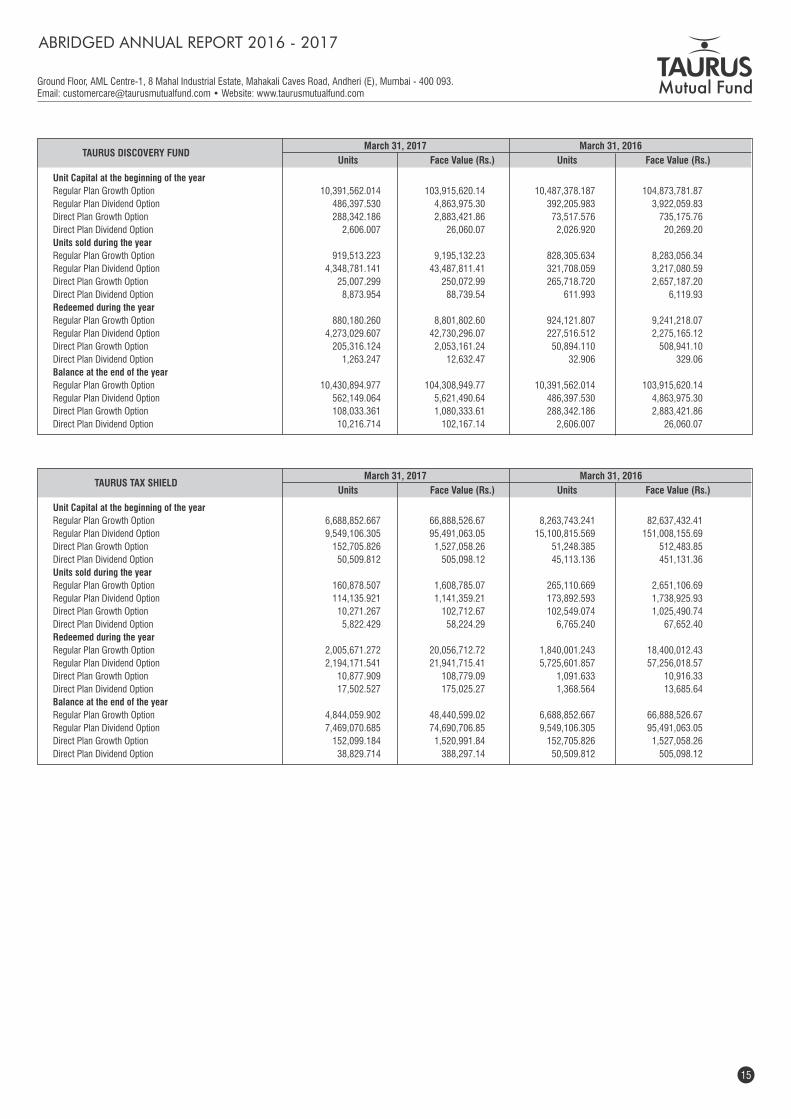
Ground Floor, AML Centre-1, 8 Mahal Industrial Estate, Mahakali Caves Road, Andheri (E), Mumbai - 400 093.Email: [email protected] • Website: www.taurusmutualfund.com
Unit Capital at the beginning of the year
Regular Plan Growth Option 6,688,852.667 66,888,526.67 8,263,743.241 82,637,432.41
Regular Plan Dividend Option 9,549,106.305 95,491,063.05 15,100,815.569 151,008,155.69
Direct Plan Growth Option 152,705.826 1,527,058.26 51,248.385 512,483.85
Direct Plan Dividend Option 50,509.812 505,098.12 45,113.136 451,131.36
Units sold during the year
Regular Plan Growth Option 160,878.507 1,608,785.07 265,110.669 2,651,106.69
Regular Plan Dividend Option 114,135.921 1,141,359.21 173,892.593 1,738,925.93
Direct Plan Growth Option 10,271.267 102,712.67 102,549.074 1,025,490.74
Direct Plan Dividend Option 5,822.429 58,224.29 6,765.240 67,652.40
Redeemed during the year
Regular Plan Growth Option 2,005,671.272 20,056,712.72 1,840,001.243 18,400,012.43
Regular Plan Dividend Option 2,194,171.541 21,941,715.41 5,725,601.857 57,256,018.57
Direct Plan Growth Option 10,877.909 108,779.09 1,091.633 10,916.33
Direct Plan Dividend Option 17,502.527 175,025.27 1,368.564 13,685.64
Balance at the end of the year
Regular Plan Growth Option 4,844,059.902 48,440,599.02 6,688,852.667 66,888,526.67
Regular Plan Dividend Option 7,469,070.685 74,690,706.85 9,549,106.305 95,491,063.05
Direct Plan Growth Option 152,099.184 1,520,991.84 152,705.826 1,527,058.26
Direct Plan Dividend Option 38,829.714 388,297.14 50,509.812 505,098.12
March 31, 2017 March 31, 2016TAURUS TAX SHIELD
Units Face Value (Rs.) Units Face Value (Rs.)
ABRIDGED ANNUAL REPORT 2016 - 2017
Unit Capital at the beginning of the year
Regular Plan Growth Option 10,391,562.014 103,915,620.14 10,487,378.187 104,873,781.87
Regular Plan Dividend Option 486,397.530 4,863,975.30 392,205.983 3,922,059.83
Direct Plan Growth Option 288,342.186 2,883,421.86 73,517.576 735,175.76
Direct Plan Dividend Option 2,606.007 26,060.07 2,026.920 20,269.20
Units sold during the year
Regular Plan Growth Option 919,513.223 9,195,132.23 828,305.634 8,283,056.34
Regular Plan Dividend Option 4,348,781.141 43,487,811.41 321,708.059 3,217,080.59
Direct Plan Growth Option 25,007.299 250,072.99 265,718.720 2,657,187.20
Direct Plan Dividend Option 8,873.954 88,739.54 611.993 6,119.93
Redeemed during the year
Regular Plan Growth Option 880,180.260 8,801,802.60 924,121.807 9,241,218.07
Regular Plan Dividend Option 4,273,029.607 42,730,296.07 227,516.512 2,275,165.12
Direct Plan Growth Option 205,316.124 2,053,161.24 50,894.110 508,941.10
Direct Plan Dividend Option 1,263.247 12,632.47 32.906 329.06
Balance at the end of the year
Regular Plan Growth Option 10,430,894.977 104,308,949.77 10,391,562.014 103,915,620.14
Regular Plan Dividend Option 562,149.064 5,621,490.64 486,397.530 4,863,975.30
Direct Plan Growth Option 108,033.361 1,080,333.61 288,342.186 2,883,421.86
Direct Plan Dividend Option 10,216.714 102,167.14 2,606.007 26,060.07
March 31, 2017 March 31, 2016TAURUS DISCOVERY FUND
Units Face Value (Rs.) Units Face Value (Rs.)
15
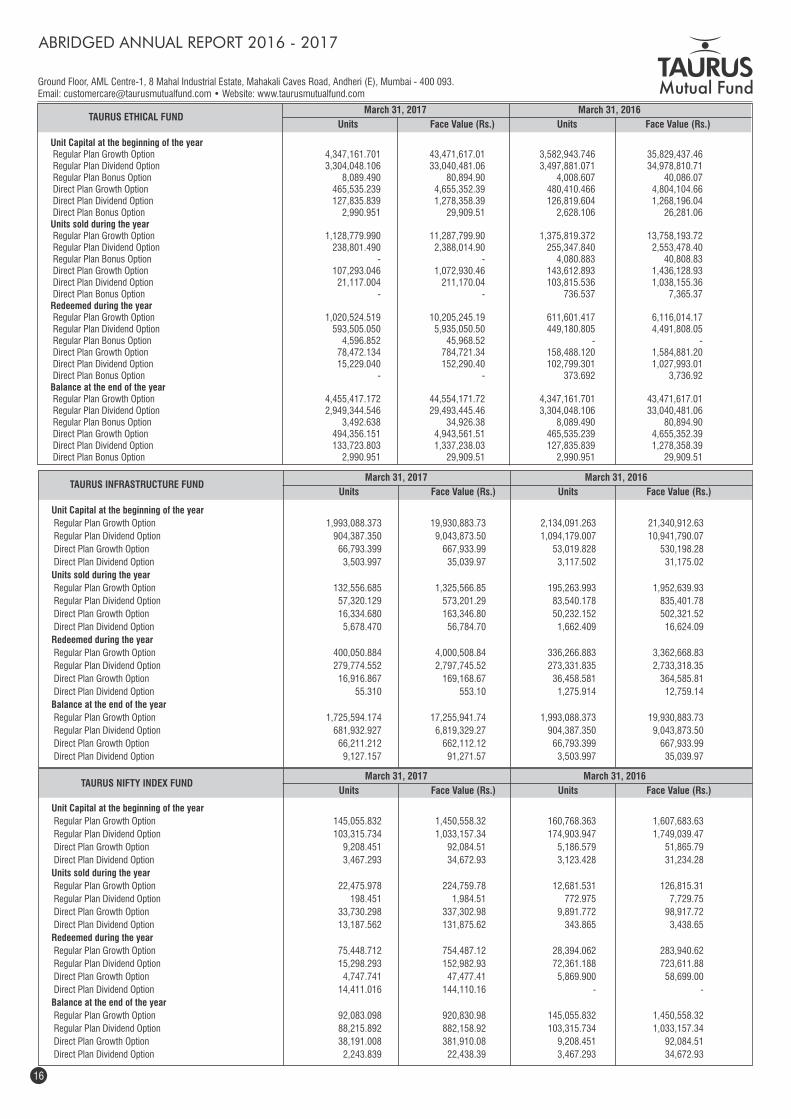
Ground Floor, AML Centre-1, 8 Mahal Industrial Estate, Mahakali Caves Road, Andheri (E), Mumbai - 400 093.Email: [email protected] • Website: www.taurusmutualfund.com
Unit Capital at the beginning of the year
Regular Plan Growth Option 1,993,088.373 19,930,883.73 2,134,091.263 21,340,912.63
Regular Plan Dividend Option 904,387.350 9,043,873.50 1,094,179.007 10,941,790.07
Direct Plan Growth Option 66,793.399 667,933.99 53,019.828 530,198.28
Direct Plan Dividend Option 3,503.997 35,039.97 3,117.502 31,175.02
Units sold during the year
Regular Plan Growth Option 132,556.685 1,325,566.85 195,263.993 1,952,639.93
Regular Plan Dividend Option 57,320.129 573,201.29 83,540.178 835,401.78
Direct Plan Growth Option 16,334.680 163,346.80 50,232.152 502,321.52
Direct Plan Dividend Option 5,678.470 56,784.70 1,662.409 16,624.09
Redeemed during the year
Regular Plan Growth Option 400,050.884 4,000,508.84 336,266.883 3,362,668.83
Regular Plan Dividend Option 279,774.552 2,797,745.52 273,331.835 2,733,318.35
Direct Plan Growth Option 16,916.867 169,168.67 36,458.581 364,585.81
Direct Plan Dividend Option 55.310 553.10 1,275.914 12,759.14
Balance at the end of the year
Regular Plan Growth Option 1,725,594.174 17,255,941.74 1,993,088.373 19,930,883.73
Regular Plan Dividend Option 681,932.927 6,819,329.27 904,387.350 9,043,873.50
Direct Plan Growth Option 66,211.212 662,112.12 66,793.399 667,933.99
Direct Plan Dividend Option 9,127.157 91,271.57 3,503.997 35,039.97
March 31, 2017 March 31, 2016TAURUS INFRASTRUCTURE FUND
Units Face Value (Rs.) Units Face Value (Rs.)
Unit Capital at the beginning of the year
Regular Plan Growth Option 145,055.832 1,450,558.32 160,768.363 1,607,683.63
Regular Plan Dividend Option 103,315.734 1,033,157.34 174,903.947 1,749,039.47
Direct Plan Growth Option 9,208.451 92,084.51 5,186.579 51,865.79
Direct Plan Dividend Option 3,467.293 34,672.93 3,123.428 31,234.28
Units sold during the year
Regular Plan Growth Option 22,475.978 224,759.78 12,681.531 126,815.31
Regular Plan Dividend Option 198.451 1,984.51 772.975 7,729.75
Direct Plan Growth Option 33,730.298 337,302.98 9,891.772 98,917.72
Direct Plan Dividend Option 13,187.562 131,875.62 343.865 3,438.65
Redeemed during the year
Regular Plan Growth Option 75,448.712 754,487.12 28,394.062 283,940.62
Regular Plan Dividend Option 15,298.293 152,982.93 72,361.188 723,611.88
Direct Plan Growth Option 4,747.741 47,477.41 5,869.900 58,699.00
Direct Plan Dividend Option 14,411.016 144,110.16 - -
Balance at the end of the year
Regular Plan Growth Option 92,083.098 920,830.98 145,055.832 1,450,558.32
Regular Plan Dividend Option 88,215.892 882,158.92 103,315.734 1,033,157.34
Direct Plan Growth Option 38,191.008 381,910.08 9,208.451 92,084.51
Direct Plan Dividend Option 2,243.839 22,438.39 3,467.293 34,672.93
March 31, 2017 March 31, 2016TAURUS NIFTY INDEX FUND
Units Face Value (Rs.) Units Face Value (Rs.)
ABRIDGED ANNUAL REPORT 2016 - 2017
Unit Capital at the beginning of the year Regular Plan Growth Option 4,347,161.701 43,471,617.01 3,582,943.746 35,829,437.46 Regular Plan Dividend Option 3,304,048.106 33,040,481.06 3,497,881.071 34,978,810.71 Regular Plan Bonus Option 8,089.490 80,894.90 4,008.607 40,086.07 Direct Plan Growth Option 465,535.239 4,655,352.39 480,410.466 4,804,104.66 Direct Plan Dividend Option 127,835.839 1,278,358.39 126,819.604 1,268,196.04 Direct Plan Bonus Option 2,990.951 29,909.51 2,628.106 26,281.06 Units sold during the year Regular Plan Growth Option 1,128,779.990 11,287,799.90 1,375,819.372 13,758,193.72 Regular Plan Dividend Option 238,801.490 2,388,014.90 255,347.840 2,553,478.40 Regular Plan Bonus Option - - 4,080.883 40,808.83 Direct Plan Growth Option 107,293.046 1,072,930.46 143,612.893 1,436,128.93 Direct Plan Dividend Option 21,117.004 211,170.04 103,815.536 1,038,155.36 Direct Plan Bonus Option - - 736.537 7,365.37 Redeemed during the year Regular Plan Growth Option 1,020,524.519 10,205,245.19 611,601.417 6,116,014.17 Regular Plan Dividend Option 593,505.050 5,935,050.50 449,180.805 4,491,808.05 Regular Plan Bonus Option 4,596.852 45,968.52 - - Direct Plan Growth Option 78,472.134 784,721.34 158,488.120 1,584,881.20 Direct Plan Dividend Option 15,229.040 152,290.40 102,799.301 1,027,993.01 Direct Plan Bonus Option - - 373.692 3,736.92 Balance at the end of the year Regular Plan Growth Option 4,455,417.172 44,554,171.72 4,347,161.701 43,471,617.01 Regular Plan Dividend Option 2,949,344.546 29,493,445.46 3,304,048.106 33,040,481.06 Regular Plan Bonus Option 3,492.638 34,926.38 8,089.490 80,894.90 Direct Plan Growth Option 494,356.151 4,943,561.51 465,535.239 4,655,352.39 Direct Plan Dividend Option 133,723.803 1,337,238.03 127,835.839 1,278,358.39 Direct Plan Bonus Option 2,990.951 29,909.51 2,990.951 29,909.51
March 31, 2017 March 31, 2016TAURUS ETHICAL FUND
Units Face Value (Rs.) Units Face Value (Rs.)
16
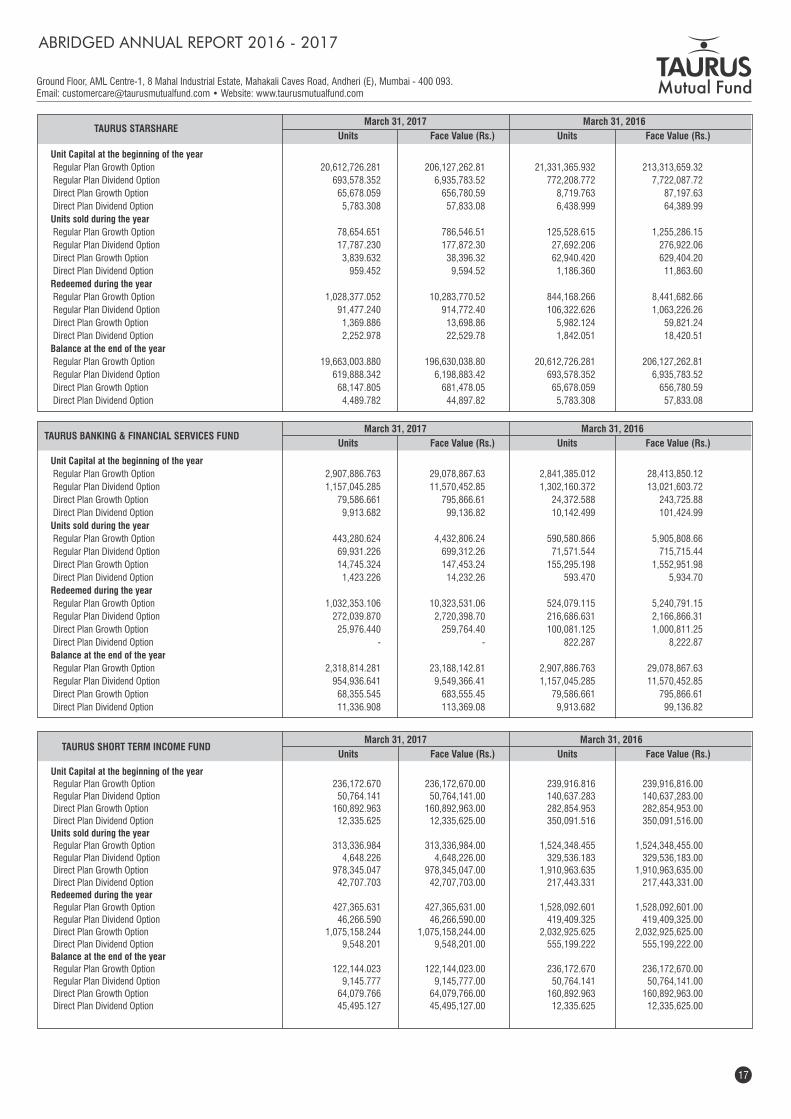
Ground Floor, AML Centre-1, 8 Mahal Industrial Estate, Mahakali Caves Road, Andheri (E), Mumbai - 400 093.Email: [email protected] • Website: www.taurusmutualfund.com
Unit Capital at the beginning of the year
Regular Plan Growth Option 2,907,886.763 29,078,867.63 2,841,385.012 28,413,850.12
Regular Plan Dividend Option 1,157,045.285 11,570,452.85 1,302,160.372 13,021,603.72
Direct Plan Growth Option 79,586.661 795,866.61 24,372.588 243,725.88
Direct Plan Dividend Option 9,913.682 99,136.82 10,142.499 101,424.99
Units sold during the year
Regular Plan Growth Option 443,280.624 4,432,806.24 590,580.866 5,905,808.66
Regular Plan Dividend Option 69,931.226 699,312.26 71,571.544 715,715.44
Direct Plan Growth Option 14,745.324 147,453.24 155,295.198 1,552,951.98
Direct Plan Dividend Option 1,423.226 14,232.26 593.470 5,934.70
Redeemed during the year
Regular Plan Growth Option 1,032,353.106 10,323,531.06 524,079.115 5,240,791.15
Regular Plan Dividend Option 272,039.870 2,720,398.70 216,686.631 2,166,866.31
Direct Plan Growth Option 25,976.440 259,764.40 100,081.125 1,000,811.25
Direct Plan Dividend Option - - 822.287 8,222.87
Balance at the end of the year
Regular Plan Growth Option 2,318,814.281 23,188,142.81 2,907,886.763 29,078,867.63
Regular Plan Dividend Option 954,936.641 9,549,366.41 1,157,045.285 11,570,452.85
Direct Plan Growth Option 68,355.545 683,555.45 79,586.661 795,866.61
Direct Plan Dividend Option 11,336.908 113,369.08 9,913.682 99,136.82
March 31, 2017 March 31, 2016TAURUS BANKING & FINANCIAL SERVICES FUND
Units Face Value (Rs.) Units Face Value (Rs.)
Unit Capital at the beginning of the year
Regular Plan Growth Option 236,172.670 236,172,670.00 239,916.816 239,916,816.00
Regular Plan Dividend Option 50,764.141 50,764,141.00 140,637.283 140,637,283.00
Direct Plan Growth Option 160,892.963 160,892,963.00 282,854.953 282,854,953.00
Direct Plan Dividend Option 12,335.625 12,335,625.00 350,091.516 350,091,516.00
Units sold during the year
Regular Plan Growth Option 313,336.984 313,336,984.00 1,524,348.455 1,524,348,455.00
Regular Plan Dividend Option 4,648.226 4,648,226.00 329,536.183 329,536,183.00
Direct Plan Growth Option 978,345.047 978,345,047.00 1,910,963.635 1,910,963,635.00
Direct Plan Dividend Option 42,707.703 42,707,703.00 217,443.331 217,443,331.00
Redeemed during the year
Regular Plan Growth Option 427,365.631 427,365,631.00 1,528,092.601 1,528,092,601.00
Regular Plan Dividend Option 46,266.590 46,266,590.00 419,409.325 419,409,325.00
Direct Plan Growth Option 1,075,158.244 1,075,158,244.00 2,032,925.625 2,032,925,625.00
Direct Plan Dividend Option 9,548.201 9,548,201.00 555,199.222 555,199,222.00
Balance at the end of the year
Regular Plan Growth Option 122,144.023 122,144,023.00 236,172.670 236,172,670.00
Regular Plan Dividend Option 9,145.777 9,145,777.00 50,764.141 50,764,141.00
Direct Plan Growth Option 64,079.766 64,079,766.00 160,892.963 160,892,963.00
Direct Plan Dividend Option 45,495.127 45,495,127.00 12,335.625 12,335,625.00
March 31, 2017 March 31, 2016TAURUS SHORT TERM INCOME FUND
Units Face Value (Rs.) Units Face Value (Rs.)
ABRIDGED ANNUAL REPORT 2016 - 2017
Unit Capital at the beginning of the year
Regular Plan Growth Option 20,612,726.281 206,127,262.81 21,331,365.932 213,313,659.32
Regular Plan Dividend Option 693,578.352 6,935,783.52 772,208.772 7,722,087.72
Direct Plan Growth Option 65,678.059 656,780.59 8,719.763 87,197.63
Direct Plan Dividend Option 5,783.308 57,833.08 6,438.999 64,389.99
Units sold during the year
Regular Plan Growth Option 78,654.651 786,546.51 125,528.615 1,255,286.15
Regular Plan Dividend Option 17,787.230 177,872.30 27,692.206 276,922.06
Direct Plan Growth Option 3,839.632 38,396.32 62,940.420 629,404.20
Direct Plan Dividend Option 959.452 9,594.52 1,186.360 11,863.60
Redeemed during the year
Regular Plan Growth Option 1,028,377.052 10,283,770.52 844,168.266 8,441,682.66
Regular Plan Dividend Option 91,477.240 914,772.40 106,322.626 1,063,226.26
Direct Plan Growth Option 1,369.886 13,698.86 5,982.124 59,821.24
Direct Plan Dividend Option 2,252.978 22,529.78 1,842.051 18,420.51
Balance at the end of the year
Regular Plan Growth Option 19,663,003.880 196,630,038.80 20,612,726.281 206,127,262.81
Regular Plan Dividend Option 619,888.342 6,198,883.42 693,578.352 6,935,783.52
Direct Plan Growth Option 68,147.805 681,478.05 65,678.059 656,780.59
Direct Plan Dividend Option 4,489.782 44,897.82 5,783.308 57,833.08
March 31, 2017 March 31, 2016TAURUS STARSHARE
Units Face Value (Rs.) Units Face Value (Rs.)
17
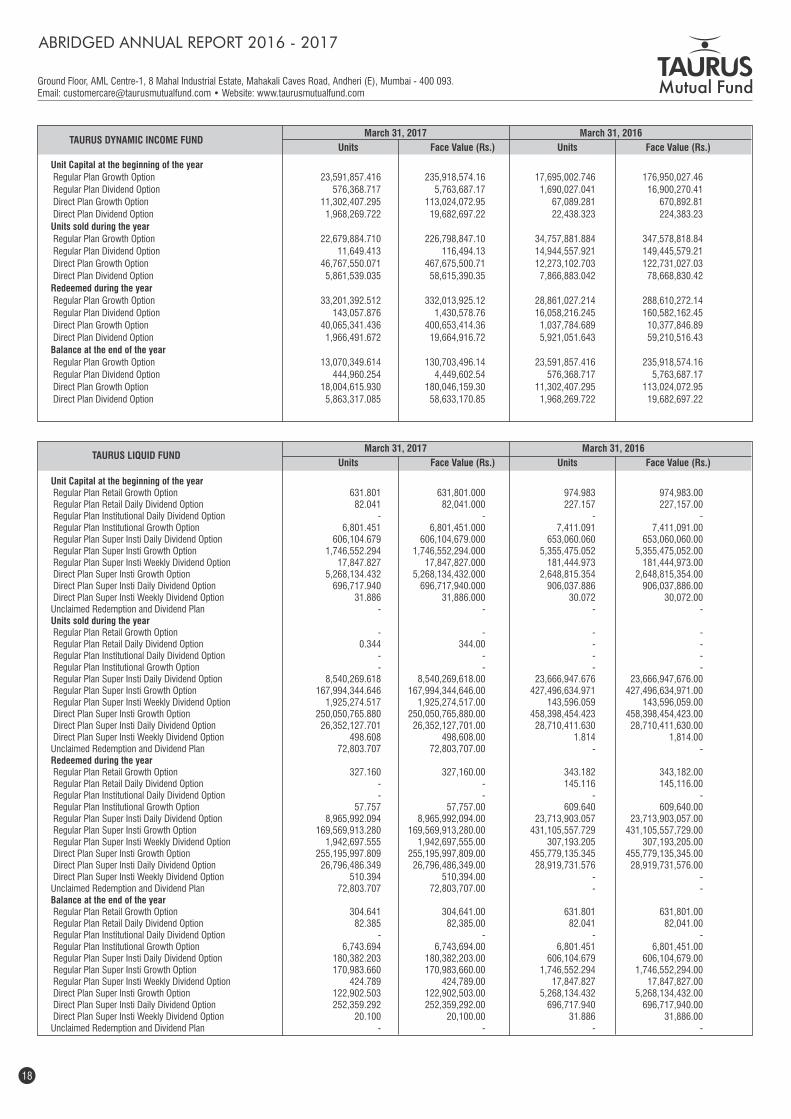
Ground Floor, AML Centre-1, 8 Mahal Industrial Estate, Mahakali Caves Road, Andheri (E), Mumbai - 400 093.Email: [email protected] • Website: www.taurusmutualfund.com
Unit Capital at the beginning of the year Regular Plan Retail Growth Option 631.801 631,801.000 974.983 974,983.00 Regular Plan Retail Daily Dividend Option 82.041 82,041.000 227.157 227,157.00 Regular Plan Institutional Daily Dividend Option - - - - Regular Plan Institutional Growth Option 6,801.451 6,801,451.000 7,411.091 7,411,091.00 Regular Plan Super Insti Daily Dividend Option 606,104.679 606,104,679.000 653,060.060 653,060,060.00 Regular Plan Super Insti Growth Option 1,746,552.294 1,746,552,294.000 5,355,475.052 5,355,475,052.00 Regular Plan Super Insti Weekly Dividend Option 17,847.827 17,847,827.000 181,444.973 181,444,973.00 Direct Plan Super Insti Growth Option 5,268,134.432 5,268,134,432.000 2,648,815.354 2,648,815,354.00 Direct Plan Super Insti Daily Dividend Option 696,717.940 696,717,940.000 906,037.886 906,037,886.00 Direct Plan Super Insti Weekly Dividend Option 31.886 31,886.000 30.072 30,072.00 Unclaimed Redemption and Dividend Plan - - - - Units sold during the year Regular Plan Retail Growth Option - - - - Regular Plan Retail Daily Dividend Option 0.344 344.00 - - Regular Plan Institutional Daily Dividend Option - - - - Regular Plan Institutional Growth Option - - - - Regular Plan Super Insti Daily Dividend Option 8,540,269.618 8,540,269,618.00 23,666,947.676 23,666,947,676.00 Regular Plan Super Insti Growth Option 167,994,344.646 167,994,344,646.00 427,496,634.971 427,496,634,971.00 Regular Plan Super Insti Weekly Dividend Option 1,925,274.517 1,925,274,517.00 143,596.059 143,596,059.00 Direct Plan Super Insti Growth Option 250,050,765.880 250,050,765,880.00 458,398,454.423 458,398,454,423.00 Direct Plan Super Insti Daily Dividend Option 26,352,127.701 26,352,127,701.00 28,710,411.630 28,710,411,630.00 Direct Plan Super Insti Weekly Dividend Option 498.608 498,608.00 1.814 1,814.00 Unclaimed Redemption and Dividend Plan 72,803.707 72,803,707.00 - - Redeemed during the year Regular Plan Retail Growth Option 327.160 327,160.00 343.182 343,182.00 Regular Plan Retail Daily Dividend Option - - 145.116 145,116.00 Regular Plan Institutional Daily Dividend Option - - - - Regular Plan Institutional Growth Option 57.757 57,757.00 609.640 609,640.00 Regular Plan Super Insti Daily Dividend Option 8,965,992.094 8,965,992,094.00 23,713,903.057 23,713,903,057.00 Regular Plan Super Insti Growth Option 169,569,913.280 169,569,913,280.00 431,105,557.729 431,105,557,729.00 Regular Plan Super Insti Weekly Dividend Option 1,942,697.555 1,942,697,555.00 307,193.205 307,193,205.00 Direct Plan Super Insti Growth Option 255,195,997.809 255,195,997,809.00 455,779,135.345 455,779,135,345.00 Direct Plan Super Insti Daily Dividend Option 26,796,486.349 26,796,486,349.00 28,919,731.576 28,919,731,576.00 Direct Plan Super Insti Weekly Dividend Option 510.394 510,394.00 - - Unclaimed Redemption and Dividend Plan 72,803.707 72,803,707.00 - - Balance at the end of the year Regular Plan Retail Growth Option 304.641 304,641.00 631.801 631,801.00 Regular Plan Retail Daily Dividend Option 82.385 82,385.00 82.041 82,041.00 Regular Plan Institutional Daily Dividend Option - - - - Regular Plan Institutional Growth Option 6,743.694 6,743,694.00 6,801.451 6,801,451.00 Regular Plan Super Insti Daily Dividend Option 180,382.203 180,382,203.00 606,104.679 606,104,679.00 Regular Plan Super Insti Growth Option 170,983.660 170,983,660.00 1,746,552.294 1,746,552,294.00 Regular Plan Super Insti Weekly Dividend Option 424.789 424,789.00 17,847.827 17,847,827.00 Direct Plan Super Insti Growth Option 122,902.503 122,902,503.00 5,268,134.432 5,268,134,432.00 Direct Plan Super Insti Daily Dividend Option 252,359.292 252,359,292.00 696,717.940 696,717,940.00 Direct Plan Super Insti Weekly Dividend Option 20.100 20,100.00 31.886 31,886.00 Unclaimed Redemption and Dividend Plan - - - -
March 31, 2017 March 31, 2016TAURUS LIQUID FUND
Units Face Value (Rs.) Units Face Value (Rs.)
ABRIDGED ANNUAL REPORT 2016 - 2017
Unit Capital at the beginning of the year
Regular Plan Growth Option 23,591,857.416 235,918,574.16 17,695,002.746 176,950,027.46
Regular Plan Dividend Option 576,368.717 5,763,687.17 1,690,027.041 16,900,270.41
Direct Plan Growth Option 11,302,407.295 113,024,072.95 67,089.281 670,892.81
Direct Plan Dividend Option 1,968,269.722 19,682,697.22 22,438.323 224,383.23
Units sold during the year
Regular Plan Growth Option 22,679,884.710 226,798,847.10 34,757,881.884 347,578,818.84
Regular Plan Dividend Option 11,649.413 116,494.13 14,944,557.921 149,445,579.21
Direct Plan Growth Option 46,767,550.071 467,675,500.71 12,273,102.703 122,731,027.03
Direct Plan Dividend Option 5,861,539.035 58,615,390.35 7,866,883.042 78,668,830.42
Redeemed during the year
Regular Plan Growth Option 33,201,392.512 332,013,925.12 28,861,027.214 288,610,272.14
Regular Plan Dividend Option 143,057.876 1,430,578.76 16,058,216.245 160,582,162.45
Direct Plan Growth Option 40,065,341.436 400,653,414.36 1,037,784.689 10,377,846.89
Direct Plan Dividend Option 1,966,491.672 19,664,916.72 5,921,051.643 59,210,516.43
Balance at the end of the year
Regular Plan Growth Option 13,070,349.614 130,703,496.14 23,591,857.416 235,918,574.16
Regular Plan Dividend Option 444,960.254 4,449,602.54 576,368.717 5,763,687.17
Direct Plan Growth Option 18,004,615.930 180,046,159.30 11,302,407.295 113,024,072.95
Direct Plan Dividend Option 5,863,317.085 58,633,170.85 1,968,269.722 19,682,697.22
March 31, 2017 March 31, 2016TAURUS DYNAMIC INCOME FUND
Units Face Value (Rs.) Units Face Value (Rs.)
18
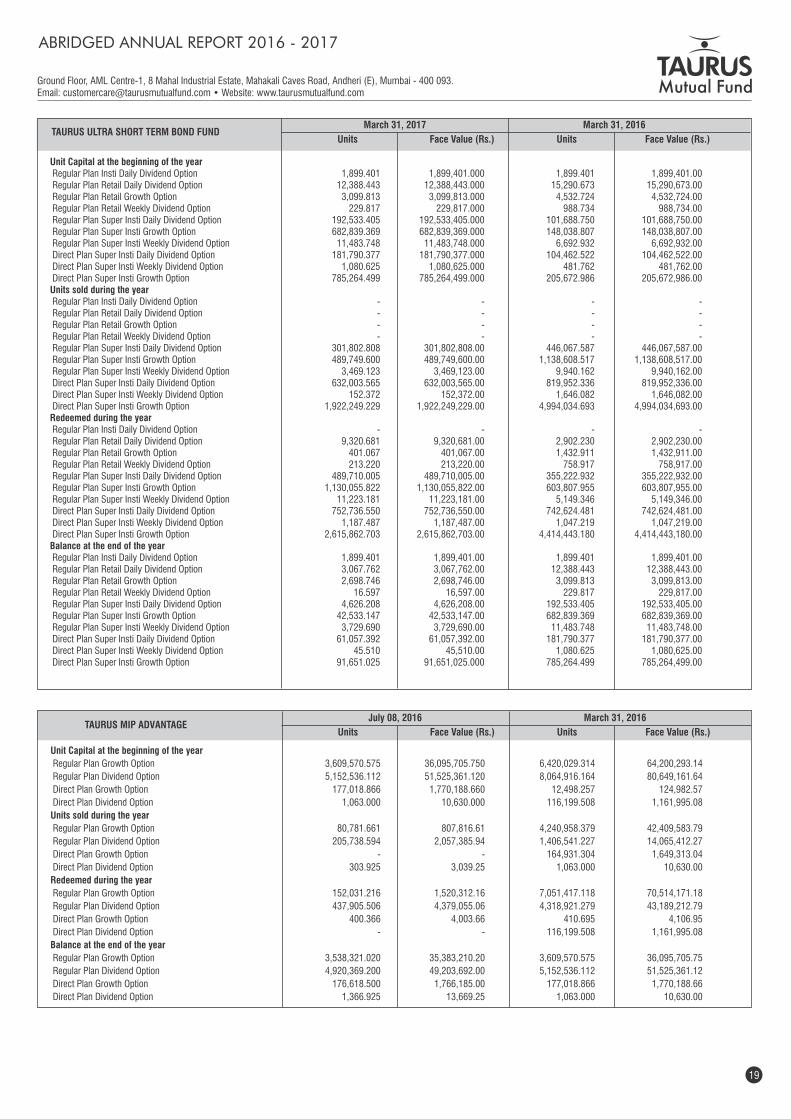
Ground Floor, AML Centre-1, 8 Mahal Industrial Estate, Mahakali Caves Road, Andheri (E), Mumbai - 400 093.Email: [email protected] • Website: www.taurusmutualfund.com
March 31, 2017 March 31, 2016TAURUS ULTRA SHORT TERM BOND FUND
Units Face Value (Rs.) Units Face Value (Rs.)
Unit Capital at the beginning of the year Regular Plan Insti Daily Dividend Option 1,899.401 1,899,401.000 1,899.401 1,899,401.00 Regular Plan Retail Daily Dividend Option 12,388.443 12,388,443.000 15,290.673 15,290,673.00 Regular Plan Retail Growth Option 3,099.813 3,099,813.000 4,532.724 4,532,724.00 Regular Plan Retail Weekly Dividend Option 229.817 229,817.000 988.734 988,734.00 Regular Plan Super Insti Daily Dividend Option 192,533.405 192,533,405.000 101,688.750 101,688,750.00 Regular Plan Super Insti Growth Option 682,839.369 682,839,369.000 148,038.807 148,038,807.00 Regular Plan Super Insti Weekly Dividend Option 11,483.748 11,483,748.000 6,692.932 6,692,932.00 Direct Plan Super Insti Daily Dividend Option 181,790.377 181,790,377.000 104,462.522 104,462,522.00 Direct Plan Super Insti Weekly Dividend Option 1,080.625 1,080,625.000 481.762 481,762.00 Direct Plan Super Insti Growth Option 785,264.499 785,264,499.000 205,672.986 205,672,986.00 Units sold during the year Regular Plan Insti Daily Dividend Option - - - - Regular Plan Retail Daily Dividend Option - - - - Regular Plan Retail Growth Option - - - - Regular Plan Retail Weekly Dividend Option - - - - Regular Plan Super Insti Daily Dividend Option 301,802.808 301,802,808.00 446,067.587 446,067,587.00 Regular Plan Super Insti Growth Option 489,749.600 489,749,600.00 1,138,608.517 1,138,608,517.00 Regular Plan Super Insti Weekly Dividend Option 3,469.123 3,469,123.00 9,940.162 9,940,162.00 Direct Plan Super Insti Daily Dividend Option 632,003.565 632,003,565.00 819,952.336 819,952,336.00 Direct Plan Super Insti Weekly Dividend Option 152.372 152,372.00 1,646.082 1,646,082.00 Direct Plan Super Insti Growth Option 1,922,249.229 1,922,249,229.00 4,994,034.693 4,994,034,693.00 Redeemed during the year Regular Plan Insti Daily Dividend Option - - - - Regular Plan Retail Daily Dividend Option 9,320.681 9,320,681.00 2,902.230 2,902,230.00 Regular Plan Retail Growth Option 401.067 401,067.00 1,432.911 1,432,911.00 Regular Plan Retail Weekly Dividend Option 213.220 213,220.00 758.917 758,917.00 Regular Plan Super Insti Daily Dividend Option 489,710.005 489,710,005.00 355,222.932 355,222,932.00 Regular Plan Super Insti Growth Option 1,130,055.822 1,130,055,822.00 603,807.955 603,807,955.00 Regular Plan Super Insti Weekly Dividend Option 11,223.181 11,223,181.00 5,149.346 5,149,346.00 Direct Plan Super Insti Daily Dividend Option 752,736.550 752,736,550.00 742,624.481 742,624,481.00 Direct Plan Super Insti Weekly Dividend Option 1,187.487 1,187,487.00 1,047.219 1,047,219.00 Direct Plan Super Insti Growth Option 2,615,862.703 2,615,862,703.00 4,414,443.180 4,414,443,180.00 Balance at the end of the year Regular Plan Insti Daily Dividend Option 1,899.401 1,899,401.00 1,899.401 1,899,401.00 Regular Plan Retail Daily Dividend Option 3,067.762 3,067,762.00 12,388.443 12,388,443.00 Regular Plan Retail Growth Option 2,698.746 2,698,746.00 3,099.813 3,099,813.00 Regular Plan Retail Weekly Dividend Option 16.597 16,597.00 229.817 229,817.00 Regular Plan Super Insti Daily Dividend Option 4,626.208 4,626,208.00 192,533.405 192,533,405.00 Regular Plan Super Insti Growth Option 42,533.147 42,533,147.00 682,839.369 682,839,369.00 Regular Plan Super Insti Weekly Dividend Option 3,729.690 3,729,690.00 11,483.748 11,483,748.00 Direct Plan Super Insti Daily Dividend Option 61,057.392 61,057,392.00 181,790.377 181,790,377.00 Direct Plan Super Insti Weekly Dividend Option 45.510 45,510.00 1,080.625 1,080,625.00 Direct Plan Super Insti Growth Option 91,651.025 91,651,025.000 785,264.499 785,264,499.00
Unit Capital at the beginning of the year
Regular Plan Growth Option 3,609,570.575 36,095,705.750 6,420,029.314 64,200,293.14
Regular Plan Dividend Option 5,152,536.112 51,525,361.120 8,064,916.164 80,649,161.64
Direct Plan Growth Option 177,018.866 1,770,188.660 12,498.257 124,982.57
Direct Plan Dividend Option 1,063.000 10,630.000 116,199.508 1,161,995.08
Units sold during the year
Regular Plan Growth Option 80,781.661 807,816.61 4,240,958.379 42,409,583.79
Regular Plan Dividend Option 205,738.594 2,057,385.94 1,406,541.227 14,065,412.27
Direct Plan Growth Option - - 164,931.304 1,649,313.04
Direct Plan Dividend Option 303.925 3,039.25 1,063.000 10,630.00
Redeemed during the year
Regular Plan Growth Option 152,031.216 1,520,312.16 7,051,417.118 70,514,171.18
Regular Plan Dividend Option 437,905.506 4,379,055.06 4,318,921.279 43,189,212.79
Direct Plan Growth Option 400.366 4,003.66 410.695 4,106.95
Direct Plan Dividend Option - - 116,199.508 1,161,995.08
Balance at the end of the year
Regular Plan Growth Option 3,538,321.020 35,383,210.20 3,609,570.575 36,095,705.75
Regular Plan Dividend Option 4,920,369.200 49,203,692.00 5,152,536.112 51,525,361.12
Direct Plan Growth Option 176,618.500 1,766,185.00 177,018.866 1,770,188.66
Direct Plan Dividend Option 1,366.925 13,669.25 1,063.000 10,630.00
July 08, 2016 March 31, 2016TAURUS MIP ADVANTAGE
Units Face Value (Rs.) Units Face Value (Rs.)
ABRIDGED ANNUAL REPORT 2016 - 2017
19
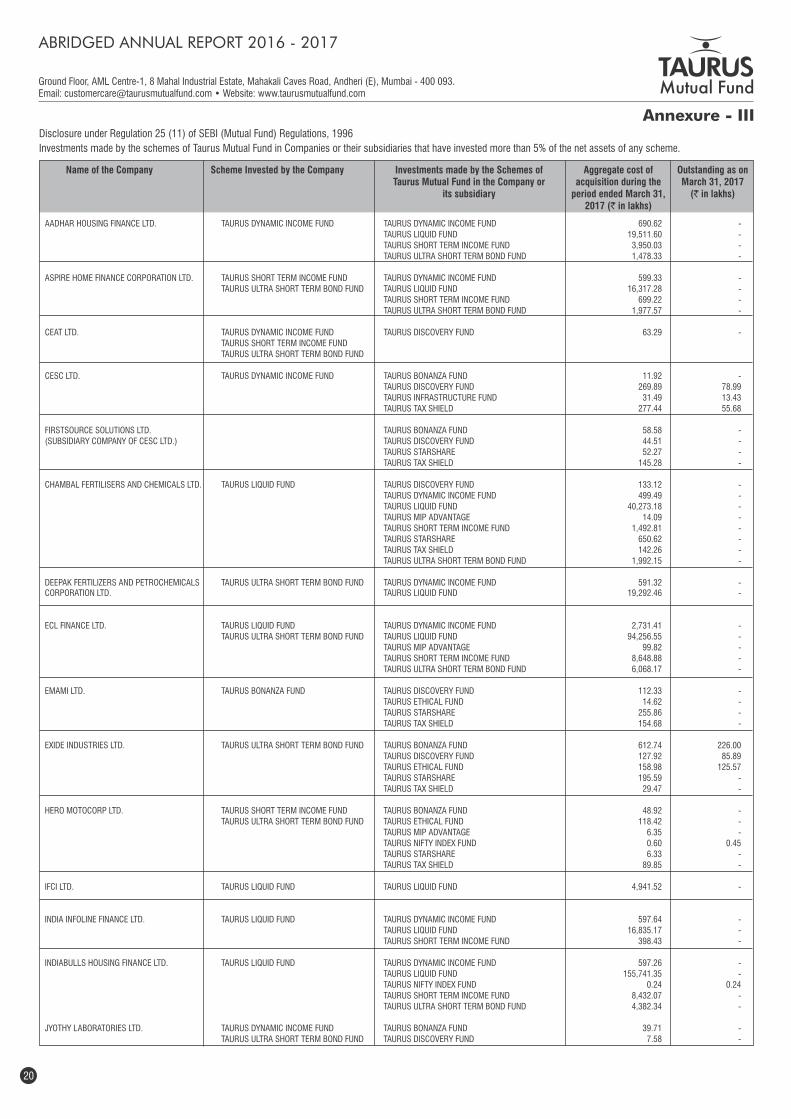
Ground Floor, AML Centre-1, 8 Mahal Industrial Estate, Mahakali Caves Road, Andheri (E), Mumbai - 400 093.Email: [email protected] • Website: www.taurusmutualfund.com
Annexure - III
ABRIDGED ANNUAL REPORT 2016 - 2017
Name of the Company Scheme Invested by the Company Investments made by the Schemes of Taurus Mutual Fund in the Company or
its subsidiary
Outstanding as on March 31, 2017
(` in lakhs)
Aggregate cost of acquisition during the
period ended March 31, 2017 (` in lakhs)
AADHAR HOUSING FINANCE LTD. TAURUS DYNAMIC INCOME FUND TAURUS DYNAMIC INCOME FUND 690.62 -
TAURUS LIQUID FUND 19,511.60 -
TAURUS SHORT TERM INCOME FUND 3,950.03 -
TAURUS ULTRA SHORT TERM BOND FUND 1,478.33 -
ASPIRE HOME FINANCE CORPORATION LTD. TAURUS SHORT TERM INCOME FUND TAURUS DYNAMIC INCOME FUND 599.33 -
TAURUS ULTRA SHORT TERM BOND FUND TAURUS LIQUID FUND 16,317.28 -
TAURUS SHORT TERM INCOME FUND 699.22 -
TAURUS ULTRA SHORT TERM BOND FUND 1,977.57 -
CEAT LTD. TAURUS DYNAMIC INCOME FUND TAURUS DISCOVERY FUND 63.29 -
TAURUS SHORT TERM INCOME FUND
TAURUS ULTRA SHORT TERM BOND FUND
CESC LTD. TAURUS DYNAMIC INCOME FUND TAURUS BONANZA FUND 11.92 -
TAURUS DISCOVERY FUND 269.89 78.99
TAURUS INFRASTRUCTURE FUND 31.49 13.43
TAURUS TAX SHIELD 277.44 55.68
FIRSTSOURCE SOLUTIONS LTD. TAURUS BONANZA FUND 58.58 -
(SUBSIDIARY COMPANY OF CESC LTD.) TAURUS DISCOVERY FUND 44.51 -
TAURUS STARSHARE 52.27 -
TAURUS TAX SHIELD 145.28 -
CHAMBAL FERTILISERS AND CHEMICALS LTD. TAURUS LIQUID FUND TAURUS DISCOVERY FUND 133.12 -
TAURUS DYNAMIC INCOME FUND 499.49 -
TAURUS LIQUID FUND 40,273.18 -
TAURUS MIP ADVANTAGE 14.09 -
TAURUS SHORT TERM INCOME FUND 1,492.81 -
TAURUS STARSHARE 650.62 -
TAURUS TAX SHIELD 142.26 -
TAURUS ULTRA SHORT TERM BOND FUND 1,992.15 -
DEEPAK FERTILIZERS AND PETROCHEMICALS TAURUS ULTRA SHORT TERM BOND FUND TAURUS DYNAMIC INCOME FUND 591.32 - CORPORATION LTD. TAURUS LIQUID FUND 19,292.46 -
ECL FINANCE LTD. TAURUS LIQUID FUND TAURUS DYNAMIC INCOME FUND 2,731.41 -
TAURUS ULTRA SHORT TERM BOND FUND TAURUS LIQUID FUND 94,256.55 -
TAURUS MIP ADVANTAGE 99.82 -
TAURUS SHORT TERM INCOME FUND 8,648.88 -
TAURUS ULTRA SHORT TERM BOND FUND 6,068.17 -
EMAMI LTD. TAURUS BONANZA FUND TAURUS DISCOVERY FUND 112.33 -
TAURUS ETHICAL FUND 14.62 -
TAURUS STARSHARE 255.86 -
TAURUS TAX SHIELD 154.68 -
EXIDE INDUSTRIES LTD. TAURUS ULTRA SHORT TERM BOND FUND TAURUS BONANZA FUND 612.74 226.00
TAURUS DISCOVERY FUND 127.92 85.89
TAURUS ETHICAL FUND 158.98 125.57
TAURUS STARSHARE 195.59 -
TAURUS TAX SHIELD 29.47 -
HERO MOTOCORP LTD. TAURUS SHORT TERM INCOME FUND TAURUS BONANZA FUND 48.92 -
TAURUS ULTRA SHORT TERM BOND FUND TAURUS ETHICAL FUND 118.42 -
TAURUS MIP ADVANTAGE 6.35 -
TAURUS NIFTY INDEX FUND 0.60 0.45
TAURUS STARSHARE 6.33 -
TAURUS TAX SHIELD 89.85 -
IFCI LTD. TAURUS LIQUID FUND TAURUS LIQUID FUND 4,941.52 -
INDIA INFOLINE FINANCE LTD. TAURUS LIQUID FUND TAURUS DYNAMIC INCOME FUND 597.64 -
TAURUS LIQUID FUND 16,835.17 -
TAURUS SHORT TERM INCOME FUND 398.43 -
INDIABULLS HOUSING FINANCE LTD. TAURUS LIQUID FUND TAURUS DYNAMIC INCOME FUND 597.26 -
TAURUS LIQUID FUND 155,741.35 -
TAURUS NIFTY INDEX FUND 0.24 0.24
TAURUS SHORT TERM INCOME FUND 8,432.07 -
TAURUS ULTRA SHORT TERM BOND FUND 4,382.34 -
JYOTHY LABORATORIES LTD. TAURUS DYNAMIC INCOME FUND TAURUS BONANZA FUND 39.71 -
TAURUS ULTRA SHORT TERM BOND FUND TAURUS DISCOVERY FUND 7.58 -
Disclosure under Regulation 25 (11) of SEBI (Mutual Fund) Regulations, 1996
Investments made by the schemes of Taurus Mutual Fund in Companies or their subsidiaries that have invested more than 5% of the net assets of any scheme.
20
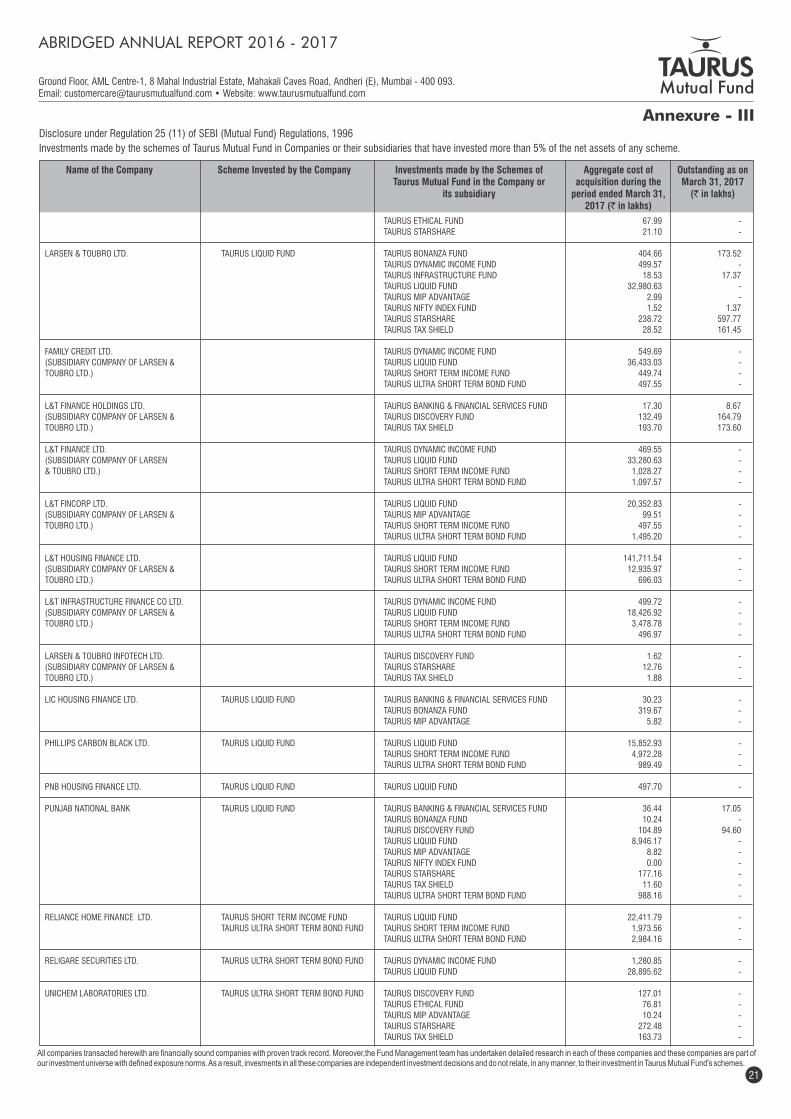
Ground Floor, AML Centre-1, 8 Mahal Industrial Estate, Mahakali Caves Road, Andheri (E), Mumbai - 400 093.Email: [email protected] • Website: www.taurusmutualfund.com
Annexure - III
ABRIDGED ANNUAL REPORT 2016 - 2017
Name of the Company Scheme Invested by the Company Investments made by the Schemes of Taurus Mutual Fund in the Company or
its subsidiary
Outstanding as on March 31, 2017
(` in lakhs)
Aggregate cost of acquisition during the
period ended March 31, 2017 (` in lakhs)
Disclosure under Regulation 25 (11) of SEBI (Mutual Fund) Regulations, 1996
Investments made by the schemes of Taurus Mutual Fund in Companies or their subsidiaries that have invested more than 5% of the net assets of any scheme.
TAURUS ETHICAL FUND 67.99 -
TAURUS STARSHARE 21.10 -
LARSEN & TOUBRO LTD. TAURUS LIQUID FUND TAURUS BONANZA FUND 404.66 173.52
TAURUS DYNAMIC INCOME FUND 499.57 -
TAURUS INFRASTRUCTURE FUND 18.53 17.37
TAURUS LIQUID FUND 32,980.63 -
TAURUS MIP ADVANTAGE 2.99 -
TAURUS NIFTY INDEX FUND 1.52 1.37
TAURUS STARSHARE 238.72 597.77
TAURUS TAX SHIELD 28.52 161.45
FAMILY CREDIT LTD. TAURUS DYNAMIC INCOME FUND 549.69 -
(SUBSIDIARY COMPANY OF LARSEN & TAURUS LIQUID FUND 36,433.03 -
TOUBRO LTD.) TAURUS SHORT TERM INCOME FUND 449.74 -
TAURUS ULTRA SHORT TERM BOND FUND 497.55 -
L&T FINANCE HOLDINGS LTD. TAURUS BANKING & FINANCIAL SERVICES FUND 17.30 8.67
(SUBSIDIARY COMPANY OF LARSEN & TAURUS DISCOVERY FUND 132.49 164.79
TOUBRO LTD.) TAURUS TAX SHIELD 193.70 173.60
L&T FINANCE LTD. TAURUS DYNAMIC INCOME FUND 469.55 -
(SUBSIDIARY COMPANY OF LARSEN TAURUS LIQUID FUND 33,280.63 -
& TOUBRO LTD.) TAURUS SHORT TERM INCOME FUND 1,028.27 -
TAURUS ULTRA SHORT TERM BOND FUND 1,097.57 -
L&T FINCORP LTD. TAURUS LIQUID FUND 20,352.83 -
(SUBSIDIARY COMPANY OF LARSEN & TAURUS MIP ADVANTAGE 99.51 -
TOUBRO LTD.) TAURUS SHORT TERM INCOME FUND 497.55 -
TAURUS ULTRA SHORT TERM BOND FUND 1,495.20 -
L&T HOUSING FINANCE LTD. TAURUS LIQUID FUND 141,711.54 -
(SUBSIDIARY COMPANY OF LARSEN & TAURUS SHORT TERM INCOME FUND 12,935.97 -
TOUBRO LTD.) TAURUS ULTRA SHORT TERM BOND FUND 696.03 -
L&T INFRASTRUCTURE FINANCE CO LTD. TAURUS DYNAMIC INCOME FUND 499.72 -
(SUBSIDIARY COMPANY OF LARSEN & TAURUS LIQUID FUND 18,426.92 -
TOUBRO LTD.) TAURUS SHORT TERM INCOME FUND 3,478.78 -
TAURUS ULTRA SHORT TERM BOND FUND 496.97 -
LARSEN & TOUBRO INFOTECH LTD. TAURUS DISCOVERY FUND 1.62 -
(SUBSIDIARY COMPANY OF LARSEN & TAURUS STARSHARE 12.76 -
TOUBRO LTD.) TAURUS TAX SHIELD 1.88 -
LIC HOUSING FINANCE LTD. TAURUS LIQUID FUND TAURUS BANKING & FINANCIAL SERVICES FUND 30.23 -
TAURUS BONANZA FUND 319.67 -
TAURUS MIP ADVANTAGE 5.82 -
PHILLIPS CARBON BLACK LTD. TAURUS LIQUID FUND TAURUS LIQUID FUND 15,852.93 -
TAURUS SHORT TERM INCOME FUND 4,972.28 -
TAURUS ULTRA SHORT TERM BOND FUND 989.49 -
PNB HOUSING FINANCE LTD. TAURUS LIQUID FUND TAURUS LIQUID FUND 497.70 -
PUNJAB NATIONAL BANK TAURUS LIQUID FUND TAURUS BANKING & FINANCIAL SERVICES FUND 36.44 17.05
TAURUS BONANZA FUND 10.24 -
TAURUS DISCOVERY FUND 104.89 94.60
TAURUS LIQUID FUND 8,946.17 -
TAURUS MIP ADVANTAGE 8.82 -
TAURUS NIFTY INDEX FUND 0.00 -
TAURUS STARSHARE 177.16 -
TAURUS TAX SHIELD 11.60 -
TAURUS ULTRA SHORT TERM BOND FUND 988.16 -
RELIANCE HOME FINANCE LTD. TAURUS SHORT TERM INCOME FUND TAURUS LIQUID FUND 22,411.79 -
TAURUS ULTRA SHORT TERM BOND FUND TAURUS SHORT TERM INCOME FUND 1,973.56 -
TAURUS ULTRA SHORT TERM BOND FUND 2,984.16 -
RELIGARE SECURITIES LTD. TAURUS ULTRA SHORT TERM BOND FUND TAURUS DYNAMIC INCOME FUND 1,280.85 -
TAURUS LIQUID FUND 28,895.62 -
UNICHEM LABORATORIES LTD. TAURUS ULTRA SHORT TERM BOND FUND TAURUS DISCOVERY FUND 127.01 -
TAURUS ETHICAL FUND 76.81 -
TAURUS MIP ADVANTAGE 10.24 -
TAURUS STARSHARE 272.48 -
TAURUS TAX SHIELD 163.73 -
All companies transacted herewith are financially sound companies with proven track record. Moreover,the Fund Management team has undertaken detailed research in each of these companies and these companies are part of our investment universe with defined exposure norms. As a result, invesments in all these companies are independent investment decisions and do not relate, in any manner, to their investment in Taurus Mutual Fund's schemes.
21
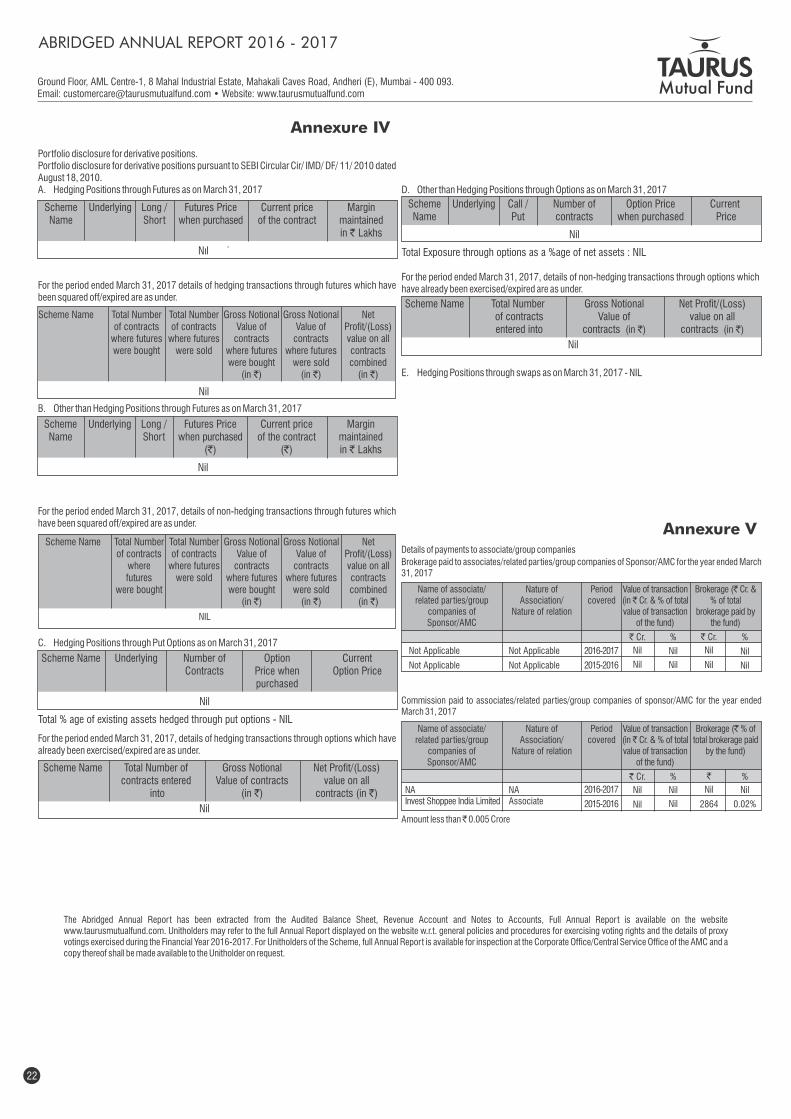
D. Other than Hedging Positions through Options as on March 31, 2017
For the period ended March 31, 2017, details of non-hedging transactions through options which have already been exercised/expired are as under.
E. Hedging Positions through swaps as on March 31, 2017 - NIL
Scheme Underlying Call / Number of Option Price Current Name Put contracts when purchased Price
Nil
Total Exposure through options as a %age of net assets : NIL
Annexure V
Commission paid to associates/related parties/group companies of sponsor/AMC for the year ended March 31, 2017
Amount less than ̀ 0.005 Crore
Details of payments to associate/group companies
Brokerage paid to associates/related parties/group companies of Sponsor/AMC for the year ended March 31, 2017
Brokerage (` Cr. & % of total
brokerage paid by the fund)
Brokerage (` % of total brokerage paid
by the fund)
%
Nil
Nil
%
Nil
0.02%
Annexure IV
Portfolio disclosure for derivative positions.Portfolio disclosure for derivative positions pursuant to SEBI Circular Cir/ IMD/ DF/ 11/ 2010 dated August 18, 2010.A. Hedging Positions through Futures as on March 31, 2017
For the period ended March 31, 2017 details of hedging transactions through futures which have been squared off/expired are as under.
B. Other than Hedging Positions through Futures as on March 31, 2017
For the period ended March 31, 2017, details of non-hedging transactions through futures which have been squared off/expired are as under.
C. Hedging Positions through Put Options as on March 31, 2017
For the period ended March 31, 2017, details of hedging transactions through options which have already been exercised/expired are as under.
Name of associate/related parties/group
companies of Sponsor/AMC
Name of associate/related parties/group
companies of Sponsor/AMC
Value of transaction (in ` Cr. & % of total value of transaction
of the fund)
Value of transaction (in ` Cr. & % of total value of transaction
of the fund)
Nature of Association/
Nature of relation
Nature of Association/
Nature of relation
Periodcovered
Periodcovered
Not Applicable
Not Applicable
NAInvest Shoppee India Limited
Not Applicable
Not Applicable
NAAssociate
2016-2017
2015-2016
2016-2017
2015-2016
` Cr.
Nil
Nil
` Cr.
Nil
Nil
` Cr.
Nil
Nil
`
Nil
2864
%
Nil
Nil
%
Nil
Nil
Ground Floor, AML Centre-1, 8 Mahal Industrial Estate, Mahakali Caves Road, Andheri (E), Mumbai - 400 093.Email: [email protected] • Website: www.taurusmutualfund.com
22
Nil
Total Number of contracts
where futures were bought
Total Number of contracts
where futures were sold
Gross Notional Value of
contracts where futures
were sold(in `)
Net Profit/(Loss) value on all contracts combined
(in `)
Gross Notional Value of
contracts where futures were bought
(in `)
Scheme Name
Total Number of contracts
where futures
were bought
Total Number of contracts
where futures were sold
Gross Notional Value of
contracts where futures
were sold(in `)
Net Profit/(Loss) value on all contracts combined
(in `)
Gross Notional Value of
contracts where futures were bought
(in `)
Scheme Name
NIL
Scheme Name Underlying Number of Option Current Contracts Price when Option Price purchased
Nil
Total % age of existing assets hedged through put options - NIL
Scheme Name Total Number of Gross Notional Net Profit/(Loss) contracts entered Value of contracts value on all into (in `) contracts (in `)
Nil
Scheme Name Total Number Gross Notional Net Profit/(Loss) of contracts Value of value on all entered into contracts (in `) contracts (in `)
Nil
The Abridged Annual Report has been extracted from the Audited Balance Sheet, Revenue Account and Notes to Accounts, Full Annual Report is available on the website www.taurusmutualfund.com. Unitholders may refer to the full Annual Report displayed on the website w.r.t. general policies and procedures for exercising voting rights and the details of proxy votings exercised during the Financial Year 2016-2017. For Unitholders of the Scheme, full Annual Report is available for inspection at the Corporate Office/Central Service Office of the AMC and a copy thereof shall be made available to the Unitholder on request.
ABRIDGED ANNUAL REPORT 2016 - 2017
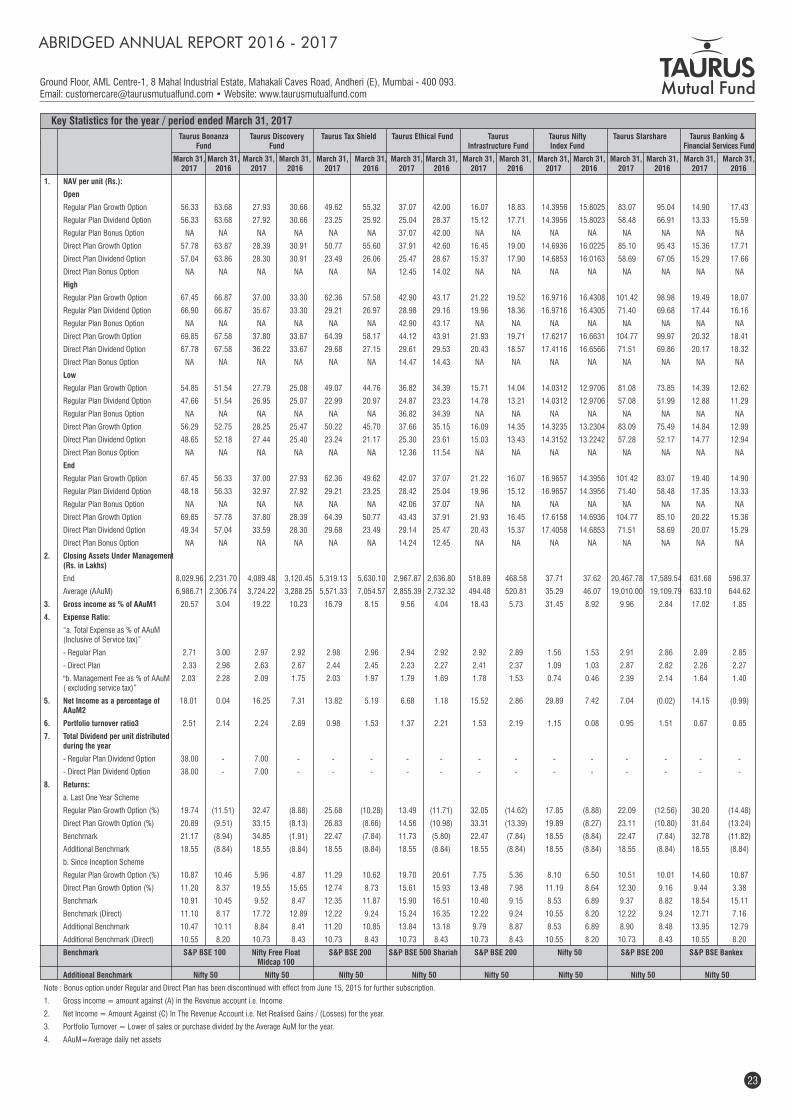
Key Statistics for the year / period ended March 31, 2017
Taurus Bonanza Taurus Discovery Taurus Tax Shield Taurus Ethical Fund Taurus Taurus Nifty Taurus Starshare Taurus Banking & Fund Fund Infrastructure Fund Index Fund Financial Services Fund
March 31, March 31, March 31, March 31, March 31, March 31, March 31, March 31, March 31, March 31, March 31, March 31, March 31, March 31, March 31, March 31, 2017 2016 2017 2016 2017 2016 2017 2016 2017 2016 2017 2016 2017 2016 2017 2016
1. NAV per unit (Rs.):
Open
Regular Plan Growth Option 56.33 63.68 27.93 30.66 49.62 55.32 37.07 42.00 16.07 18.83 14.3956 15.8025 83.07 95.04 14.90 17.43
Regular Plan Dividend Option 56.33 63.68 27.92 30.66 23.25 25.92 25.04 28.37 15.12 17.71 14.3956 15.8023 58.48 66.91 13.33 15.59
Regular Plan Bonus Option NA NA NA NA NA NA 37.07 42.00 NA NA NA NA NA NA NA NA
Direct Plan Growth Option 57.78 63.87 28.39 30.91 50.77 55.60 37.91 42.60 16.45 19.00 14.6936 16.0225 85.10 95.43 15.36 17.71
Direct Plan Dividend Option 57.04 63.86 28.30 30.91 23.49 26.06 25.47 28.67 15.37 17.90 14.6853 16.0163 58.69 67.05 15.29 17.66
Direct Plan Bonus Option NA NA NA NA NA NA 12.45 14.02 NA NA NA NA NA NA NA NA
High
Regular Plan Growth Option 67.45 66.87 37.00 33.30 62.36 57.58 42.90 43.17 21.22 19.52 16.9716 16.4308 101.42 98.98 19.49 18.07
Regular Plan Dividend Option 66.90 66.87 35.67 33.30 29.21 26.97 28.98 29.16 19.96 18.36 16.9716 16.4305 71.40 69.68 17.44 16.16
Regular Plan Bonus Option NA NA NA NA NA NA 42.90 43.17 NA NA NA NA NA NA NA NA
Direct Plan Growth Option 69.85 67.58 37.80 33.67 64.39 58.17 44.12 43.91 21.93 19.71 17.6217 16.6631 104.77 99.97 20.32 18.41
Direct Plan Dividend Option 67.78 67.58 36.22 33.67 29.68 27.15 29.61 29.53 20.43 18.57 17.4116 16.6566 71.51 69.86 20.17 18.32
Direct Plan Bonus Option NA NA NA NA NA NA 14.47 14.43 NA NA NA NA NA NA NA NA
Low
Regular Plan Growth Option 54.85 51.54 27.79 25.08 49.07 44.76 36.82 34.39 15.71 14.04 14.0312 12.9706 81.08 73.85 14.39 12.62
Regular Plan Dividend Option 47.66 51.54 26.95 25.07 22.99 20.97 24.87 23.23 14.78 13.21 14.0312 12.9706 57.08 51.99 12.88 11.29
Regular Plan Bonus Option NA NA NA NA NA NA 36.82 34.39 NA NA NA NA NA NA NA NA
Direct Plan Growth Option 56.29 52.75 28.25 25.47 50.22 45.70 37.66 35.15 16.09 14.35 14.3235 13.2304 83.09 75.49 14.84 12.99
Direct Plan Dividend Option 48.65 52.18 27.44 25.40 23.24 21.17 25.30 23.61 15.03 13.43 14.3152 13.2242 57.28 52.17 14.77 12.94
Direct Plan Bonus Option NA NA NA NA NA NA 12.36 11.54 NA NA NA NA NA NA NA NA
End
Regular Plan Growth Option 67.45 56.33 37.00 27.93 62.36 49.62 42.07 37.07 21.22 16.07 16.9657 14.3956 101.42 83.07 19.40 14.90
Regular Plan Dividend Option 48.18 56.33 32.97 27.92 29.21 23.25 28.42 25.04 19.96 15.12 16.9657 14.3956 71.40 58.48 17.35 13.33
Regular Plan Bonus Option NA NA NA NA NA NA 42.06 37.07 NA NA NA NA NA NA NA NA
Direct Plan Growth Option 69.85 57.78 37.80 28.39 64.39 50.77 43.43 37.91 21.93 16.45 17.6158 14.6936 104.77 85.10 20.22 15.36
Direct Plan Dividend Option 49.34 57.04 33.59 28.30 29.68 23.49 29.14 25.47 20.43 15.37 17.4058 14.6853 71.51 58.69 20.07 15.29
Direct Plan Bonus Option NA NA NA NA NA NA 14.24 12.45 NA NA NA NA NA NA NA NA
2. Closing Assets Under Management (Rs. in Lakhs)
End 8,029.96 2,231.70 4,089.48 3,120.45 5,319.13 5,630.10 2,967.87 2,636.80 518.89 468.58 37.71 37.62 20,467.78 17,589.54 631.68 596.37
Average (AAuM) 6,986.71 2,306.74 3,724.22 3,288.25 5,571.33 7,054.57 2,855.39 2,732.32 494.48 520.81 35.29 46.07 19,010.00 19,109.79 633.10 644.62
3. Gross income as % of AAuM1 20.57 3.04 19.22 10.23 16.79 8.15 9.56 4.04 18.43 5.73 31.45 8.92 9.96 2.84 17.02 1.85
4. Expense Ratio:
“a. Total Expense as % of AAuM (Inclusive of Service tax)”
- Regular Plan 2.71 3.00 2.97 2.92 2.98 2.96 2.94 2.92 2.92 2.89 1.56 1.53 2.91 2.86 2.89 2.85
- Direct Plan 2.33 2.98 2.63 2.67 2.44 2.45 2.23 2.27 2.41 2.37 1.09 1.03 2.87 2.82 2.26 2.27
"b. Management Fee as % of AAuM 2.03 2.28 2.09 1.75 2.03 1.97 1.79 1.69 1.78 1.53 0.74 0.46 2.39 2.14 1.64 1.40 ( excluding service tax)”
5. Net Income as a percentage of 18.01 0.04 16.25 7.31 13.82 5.19 6.68 1.18 15.52 2.86 29.89 7.42 7.04 (0.02) 14.15 (0.99) AAuM2
6. Portfolio turnover ratio3 2.51 2.14 2.24 2.69 0.98 1.53 1.37 2.21 1.53 2.19 1.15 0.08 0.95 1.51 0.67 0.85
7. Total Dividend per unit distributed during the year
- Regular Plan Dividend Option 38.00 - 7.00 - - - - - - - - - - - - -
- Direct Plan Dividend Option 38.00 - 7.00 - - - - - - - - - - - - -
8. Returns:
a. Last One Year Scheme
Regular Plan Growth Option (%) 19.74 (11.51) 32.47 (8.88) 25.68 (10.28) 13.49 (11.71) 32.05 (14.62) 17.85 (8.88) 22.09 (12.56) 30.20 (14.48)
Direct Plan Growth Option (%) 20.89 (9.51) 33.15 (8.13) 26.83 (8.66) 14.56 (10.98) 33.31 (13.39) 19.89 (8.27) 23.11 (10.80) 31.64 (13.24)
Benchmark 21.17 (8.94) 34.85 (1.91) 22.47 (7.84) 11.73 (5.80) 22.47 (7.84) 18.55 (8.84) 22.47 (7.84) 32.78 (11.82)
Additional Benchmark 18.55 (8.84) 18.55 (8.84) 18.55 (8.84) 18.55 (8.84) 18.55 (8.84) 18.55 (8.84) 18.55 (8.84) 18.55 (8.84)
b. Since Inception Scheme
Regular Plan Growth Option (%) 10.87 10.46 5.96 4.87 11.29 10.62 19.70 20.61 7.75 5.36 8.10 6.50 10.51 10.01 14.60 10.87
Direct Plan Growth Option (%) 11.20 8.37 19.55 15.65 12.74 8.73 15.61 15.93 13.48 7.98 11.19 8.64 12.30 9.16 9.44 3.38
Benchmark 10.91 10.45 9.52 8.47 12.35 11.87 15.90 16.51 10.40 9.15 8.53 6.89 9.37 8.82 18.54 15.11
Benchmark (Direct) 11.10 8.17 17.72 12.89 12.22 9.24 15.24 16.35 12.22 9.24 10.55 8.20 12.22 9.24 12.71 7.16
Additional Benchmark 10.47 10.11 8.84 8.41 11.20 10.85 13.84 13.18 9.79 8.87 8.53 6.89 8.90 8.48 13.95 12.79
Additional Benchmark (Direct) 10.55 8.20 10.73 8.43 10.73 8.43 10.73 8.43 10.73 8.43 10.55 8.20 10.73 8.43 10.55 8.20
Benchmark S&P BSE 100 Nifty Free Float S&P BSE 200 S&P BSE 500 Shariah S&P BSE 200 Nifty 50 S&P BSE 200 S&P BSE Bankex Midcap 100
Additional Benchmark Nifty 50 Nifty 50 Nifty 50 Nifty 50 Nifty 50 Nifty 50 Nifty 50 Nifty 50
Note : Bonus option under Regular and Direct Plan has been discontinued with effect from June 15, 2015 for further subscription.
1. Gross income = amount against (A) in the Revenue account i.e. Income.
2. Net Income = Amount Against (C) In The Revenue Account i.e. Net Realised Gains / (Losses) for the year.
3. Portfolio Turnover = Lower of sales or purchase divided by the Average AuM for the year.
4. AAuM=Average daily net assets
Ground Floor, AML Centre-1, 8 Mahal Industrial Estate, Mahakali Caves Road, Andheri (E), Mumbai - 400 093.Email: [email protected] • Website: www.taurusmutualfund.com
23
ABRIDGED ANNUAL REPORT 2016 - 2017
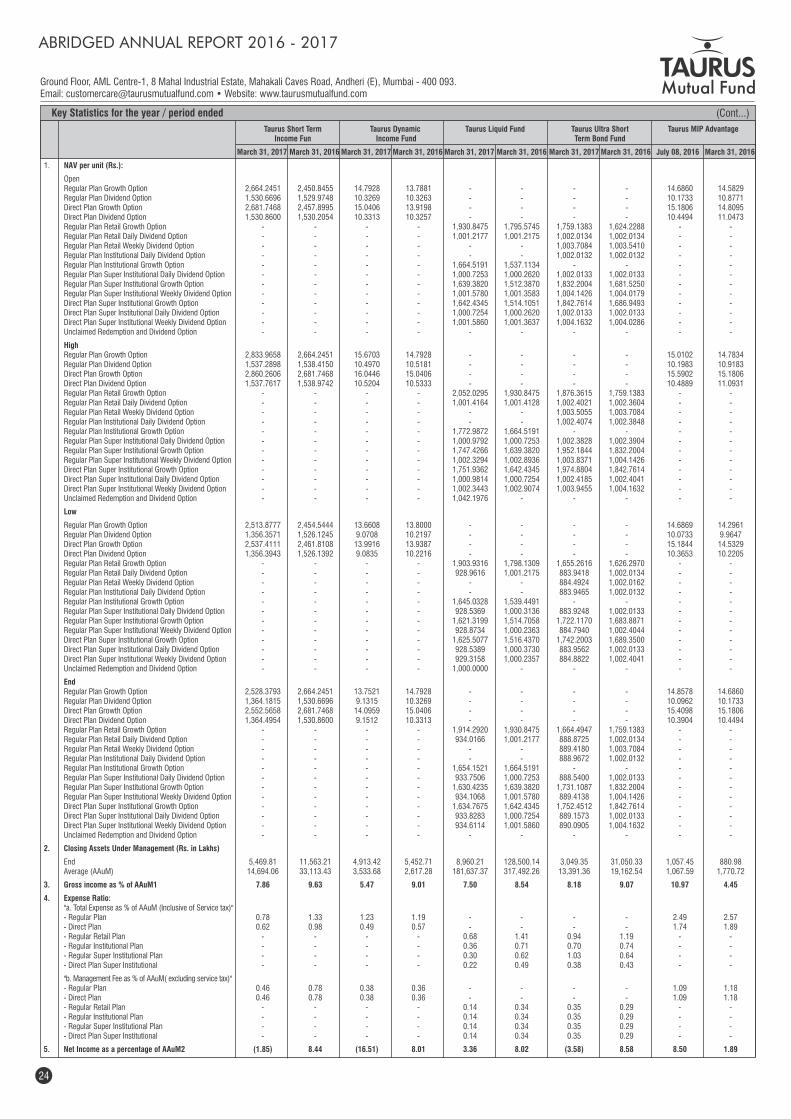
Key Statistics for the year / period ended (Cont...)
Taurus Short Term Taurus Dynamic Taurus Liquid Fund Taurus Ultra Short Taurus MIP Advantage Income Fun Income Fund Term Bond Fund
March 31, 2017 March 31, 2016 March 31, 2017 March 31, 2016 March 31, 2017 March 31, 2016 March 31, 2017 March 31, 2016 July 08, 2016 March 31, 2016
1. NAV per unit (Rs.):
Open Regular Plan Growth Option 2,664.2451 2,450.8455 14.7928 13.7881 - - - - 14.6860 14.5829 Regular Plan Dividend Option 1,530.6696 1,529.9748 10.3269 10.3263 - - - - 10.1733 10.8771 Direct Plan Growth Option 2,681.7468 2,457.8995 15.0406 13.9198 - - - - 15.1806 14.8095 Direct Plan Dividend Option 1,530.8600 1,530.2054 10.3313 10.3257 - - - - 10.4494 11.0473 Regular Plan Retail Growth Option - - - - 1,930.8475 1,795.5745 1,759.1383 1,624.2288 - - Regular Plan Retail Daily Dividend Option - - - - 1,001.2177 1,001.2175 1,002.0134 1,002.0134 - - Regular Plan Retail Weekly Dividend Option - - - - - - 1,003.7084 1,003.5410 - - Regular Plan Institutional Daily Dividend Option - - - - - - 1,002.0132 1,002.0132 - - Regular Plan Institutional Growth Option - - - - 1,664.5191 1,537.1134 - - - - Regular Plan Super Institutional Daily Dividend Option - - - - 1,000.7253 1,000.2620 1,002.0133 1,002.0133 - - Regular Plan Super Institutional Growth Option - - - - 1,639.3820 1,512.3870 1,832.2004 1,681.5250 - - Regular Plan Super Institutional Weekly Dividend Option - - - - 1,001.5780 1,001.3583 1,004.1426 1,004.0179 - - Direct Plan Super Institutional Growth Option - - - - 1,642.4345 1,514.1051 1,842.7614 1,686.9493 - - Direct Plan Super Institutional Daily Dividend Option - - - - 1,000.7254 1,000.2620 1,002.0133 1,002.0133 - - Direct Plan Super Institutional Weekly Dividend Option - - - - 1,001.5860 1,001.3637 1,004.1632 1,004.0286 - - Unclaimed Redemption and Dividend Option - - - - - - - - - -
High Regular Plan Growth Option 2,833.9658 2,664.2451 15.6703 14.7928 - - - - 15.0102 14.7834 Regular Plan Dividend Option 1,537.2898 1,538.4150 10.4970 10.5181 - - - - 10.1983 10.9183 Direct Plan Growth Option 2,860.2606 2,681.7468 16.0446 15.0406 - - - - 15.5902 15.1806 Direct Plan Dividend Option 1,537.7617 1,538.9742 10.5204 10.5333 - - - - 10.4889 11.0931 Regular Plan Retail Growth Option - - - - 2,052.0295 1,930.8475 1,876.3615 1,759.1383 - - Regular Plan Retail Daily Dividend Option - - - - 1,001.4164 1,001.4128 1,002.4021 1,002.3604 - - Regular Plan Retail Weekly Dividend Option - - - - - - 1,003.5055 1,003.7084 - - Regular Plan Institutional Daily Dividend Option - - - - - - 1,002.4074 1,002.3848 - - Regular Plan Institutional Growth Option - - - - 1,772.9872 1,664.5191 - - - - Regular Plan Super Institutional Daily Dividend Option - - - - 1,000.9792 1,000.7253 1,002.3828 1,002.3904 - - Regular Plan Super Institutional Growth Option - - - - 1,747.4266 1,639.3820 1,952.1844 1,832.2004 - - Regular Plan Super Institutional Weekly Dividend Option - - - - 1,002.3294 1,002.8936 1,003.8371 1,004.1426 - - Direct Plan Super Institutional Growth Option - - - - 1,751.9362 1,642.4345 1,974.8804 1,842.7614 - - Direct Plan Super Institutional Daily Dividend Option - - - - 1,000.9814 1,000.7254 1,002.4185 1,002.4041 - - Direct Plan Super Institutional Weekly Dividend Option - - - - 1,002.3443 1,002.9074 1,003.9455 1,004.1632 - - Unclaimed Redemption and Dividend Option - - - - 1,042.1976 - - - - -
Low
Regular Plan Growth Option 2,513.8777 2,454.5444 13.6608 13.8000 - - - - 14.6869 14.2961 Regular Plan Dividend Option 1,356.3571 1,526.1245 9.0708 10.2197 - - - - 10.0733 9.9647 Direct Plan Growth Option 2,537.4111 2,461.8108 13.9916 13.9387 - - - - 15.1844 14.5329 Direct Plan Dividend Option 1,356.3943 1,526.1392 9.0835 10.2216 - - - - 10.3653 10.2205 Regular Plan Retail Growth Option - - - - 1,903.9316 1,798.1309 1,655.2616 1,626.2970 - - Regular Plan Retail Daily Dividend Option - - - - 928.9616 1,001.2175 883.9418 1,002.0134 - - Regular Plan Retail Weekly Dividend Option - - - - - - 884.4924 1,002.0162 - - Regular Plan Institutional Daily Dividend Option - - - - - - 883.9465 1,002.0132 - - Regular Plan Institutional Growth Option - - - - 1,645.0328 1,539.4491 - - - - Regular Plan Super Institutional Daily Dividend Option - - - - 928.5369 1,000.3136 883.9248 1,002.0133 - - Regular Plan Super Institutional Growth Option - - - - 1,621.3199 1,514.7058 1,722.1170 1,683.8871 - - Regular Plan Super Institutional Weekly Dividend Option - - - - 928.8734 1,000.2363 884.7940 1,002.4044 - - Direct Plan Super Institutional Growth Option - - - - 1,625.5077 1,516.4370 1,742.2003 1,689.3500 - - Direct Plan Super Institutional Daily Dividend Option - - - - 928.5389 1,000.3730 883.9562 1,002.0133 - - Direct Plan Super Institutional Weekly Dividend Option - - - - 929.3158 1,000.2357 884.8822 1,002.4041 - - Unclaimed Redemption and Dividend Option - - - - 1,000.0000 - - - - -
End Regular Plan Growth Option 2,528.3793 2,664.2451 13.7521 14.7928 - - - - 14.8578 14.6860 Regular Plan Dividend Option 1,364.1815 1,530.6696 9.1315 10.3269 - - - - 10.0962 10.1733 Direct Plan Growth Option 2,552.5658 2,681.7468 14.0959 15.0406 - - - - 15.4098 15.1806 Direct Plan Dividend Option 1,364.4954 1,530.8600 9.1512 10.3313 - - - - 10.3904 10.4494 Regular Plan Retail Growth Option - - - - 1,914.2920 1,930.8475 1,664.4947 1,759.1383 - - Regular Plan Retail Daily Dividend Option - - - - 934.0166 1,001.2177 888.8725 1,002.0134 - - Regular Plan Retail Weekly Dividend Option - - - - - - 889.4180 1,003.7084 - - Regular Plan Institutional Daily Dividend Option - - - - - - 888.9672 1,002.0132 - - Regular Plan Institutional Growth Option - - - - 1,654.1521 1,664.5191 - - - - Regular Plan Super Institutional Daily Dividend Option - - - - 933.7506 1,000.7253 888.5400 1,002.0133 - - Regular Plan Super Institutional Growth Option - - - - 1,630.4235 1,639.3820 1,731.1087 1,832.2004 - - Regular Plan Super Institutional Weekly Dividend Option - - - - 934.1068 1,001.5780 889.4138 1,004.1426 - - Direct Plan Super Institutional Growth Option - - - - 1,634.7675 1,642.4345 1,752.4512 1,842.7614 - - Direct Plan Super Institutional Daily Dividend Option - - - - 933.8283 1,000.7254 889.1573 1,002.0133 - - Direct Plan Super Institutional Weekly Dividend Option - - - - 934.6114 1,001.5860 890.0905 1,004.1632 - - Unclaimed Redemption and Dividend Option - - - - - - - - - -
2. Closing Assets Under Management (Rs. in Lakhs)
End 5,469.81 11,563.21 4,913.42 5,452.71 8,960.21 128,500.14 3,049.35 31,050.33 1,057.45 880.98 Average (AAuM) 14,694.06 33,113.43 3,533.68 2,617.28 181,637.37 317,492.26 13,391.36 19,162.54 1,067.59 1,770.72
3. Gross income as % of AAuM1 7.86 9.63 5.47 9.01 7.50 8.54 8.18 9.07 10.97 4.45
4. Expense Ratio: "a. Total Expense as % of AAuM (Inclusive of Service tax)" - Regular Plan 0.78 1.33 1.23 1.19 - - - - 2.49 2.57 - Direct Plan 0.62 0.98 0.49 0.57 - - - - 1.74 1.89 - Regular Retail Plan - - - - 0.68 1.41 0.94 1.19 - - - Regular Institutional Plan - - - - 0.36 0.71 0.70 0.74 - - - Regular Super Institutional Plan - - - - 0.30 0.62 1.03 0.64 - - - Direct Plan Super Institutional - - - - 0.22 0.49 0.38 0.43 - -
"b. Management Fee as % of AAuM( excluding service tax)" - Regular Plan 0.46 0.78 0.38 0.36 - - - - 1.09 1.18 - Direct Plan 0.46 0.78 0.38 0.36 - - - - 1.09 1.18 - Regular Retail Plan - - - - 0.14 0.34 0.35 0.29 - - - Regular Institutional Plan - - - - 0.14 0.34 0.35 0.29 - - - Regular Super Institutional Plan - - - - 0.14 0.34 0.35 0.29 - - - Direct Plan Super Institutional - - - - 0.14 0.34 0.35 0.29 - -
5. Net Income as a percentage of AAuM2 (1.85) 8.44 (16.51) 8.01 3.36 8.02 (3.58) 8.58 8.50 1.89
Ground Floor, AML Centre-1, 8 Mahal Industrial Estate, Mahakali Caves Road, Andheri (E), Mumbai - 400 093.Email: [email protected] • Website: www.taurusmutualfund.com
24
ABRIDGED ANNUAL REPORT 2016 - 2017
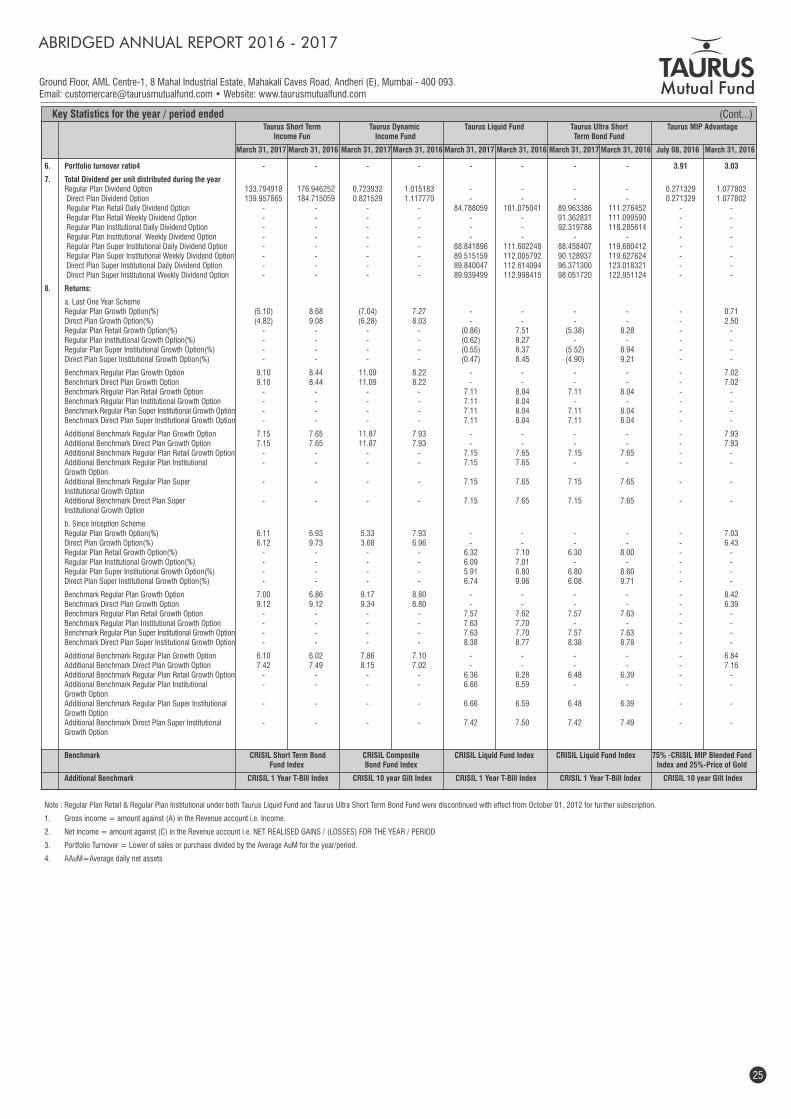
Key Statistics for the year / period ended (Cont...)
Ground Floor, AML Centre-1, 8 Mahal Industrial Estate, Mahakali Caves Road, Andheri (E), Mumbai - 400 093.Email: [email protected] • Website: www.taurusmutualfund.com
25
6. Portfolio turnover ratio4 - - - - - - - - 3.91 3.03
7. Total Dividend per unit distributed during the year Regular Plan Dividend Option 133.794918 176.946252 0.723932 1.015183 - - - - 0.271329 1.077802 Direct Plan Dividend Option 139.957865 184.715059 0.821529 1.117770 - - - - 0.271329 1.077802 Regular Plan Retail Daily Dividend Option - - - - 84.788059 101.075041 89.963386 111.276452 - - Regular Plan Retail Weekly Dividend Option - - - - - - 91.362831 111.099590 - - Regular Plan Institutional Daily Dividend Option - - - - - - 92.319788 118.285614 - - Regular Plan Institutional Weekly Dividend Option - - - - - - - - - - Regular Plan Super Institutional Daily Dividend Option - - - - 88.841896 111.602248 88.458407 119.680412 - - Regular Plan Super Institutional Weekly Dividend Option - - - - 89.515159 112.005792 90.128937 119.627624 - - Direct Plan Super Institutional Daily Dividend Option - - - - 89.840047 112.614094 96.371300 123.018321 - - Direct Plan Super Institutional Weekly Dividend Option - - - - 89.939499 112.998415 98.051720 122.951124 - -
8. Returns:
a. Last One Year Scheme Regular Plan Growth Option(%) (5.10) 8.68 (7.04) 7.27 - - - - - 0.71 Direct Plan Growth Option(%) (4.82) 9.08 (6.28) 8.03 - - - - - 2.50 Regular Plan Retail Growth Option(%) - - - - (0.86) 7.51 (5.38) 8.28 - - Regular Plan Institutional Growth Option(%) - - - - (0.62) 8.27 - - - - Regular Plan Super Institutional Growth Option(%) - - - - (0.55) 8.37 (5.52) 8.94 - - Direct Plan Super Institutional Growth Option(%) - - - - (0.47) 8.45 (4.90) 9.21 - -
Benchmark Regular Plan Growth Option 9.10 8.44 11.09 8.22 - - - - - 7.02 Benchmark Direct Plan Growth Option 9.10 8.44 11.09 8.22 - - - - - 7.02 Benchmark Regular Plan Retail Growth Option - - - - 7.11 8.04 7.11 8.04 - - Benchmark Regular Plan Institutional Growth Option - - - - 7.11 8.04 - - - - Benchmark Regular Plan Super Institutional Growth Option - - - - 7.11 8.04 7.11 8.04 - - Benchmark Direct Plan Super Institutional Growth Option - - - - 7.11 8.04 7.11 8.04 - -
Additional Benchmark Regular Plan Growth Option 7.15 7.65 11.87 7.93 - - - - - 7.93 Additional Benchmark Direct Plan Growth Option 7.15 7.65 11.87 7.93 - - - - - 7.93 Additional Benchmark Regular Plan Retail Growth Option - - - - 7.15 7.65 7.15 7.65 - - Additional Benchmark Regular Plan Institutional - - - - 7.15 7.65 - - - - Growth Option Additional Benchmark Regular Plan Super - - - - 7.15 7.65 7.15 7.65 - - Institutional Growth Option Additional Benchmark Direct Plan Super - - - - 7.15 7.65 7.15 7.65 - - Institutional Growth Option
b. Since Inception Scheme Regular Plan Growth Option(%) 6.11 6.93 5.33 7.93 - - - - - 7.03 Direct Plan Growth Option(%) 6.12 9.73 3.68 6.96 - - - - - 6.43 Regular Plan Retail Growth Option(%) - - - - 6.32 7.10 6.30 8.00 - - Regular Plan Institutional Growth Option(%) - - - - 6.09 7.01 - - - - Regular Plan Super Institutional Growth Option(%) - - - - 5.91 6.80 6.80 8.60 - - Direct Plan Super Institutional Growth Option(%) - - - - 6.74 9.06 6.08 9.71 - -
Benchmark Regular Plan Growth Option 7.00 6.86 9.17 8.80 - - - - - 8.42 Benchmark Direct Plan Growth Option 9.12 9.12 9.34 8.80 - - - - - 6.39 Benchmark Regular Plan Retail Growth Option - - - - 7.57 7.62 7.57 7.63 - - Benchmark Regular Plan Institutional Growth Option - - - - 7.63 7.70 - - - - Benchmark Regular Plan Super Institutional Growth Option - - - - 7.63 7.70 7.57 7.63 - - Benchmark Direct Plan Super Institutional Growth Option - - - - 8.38 8.77 8.38 8.78 - -
Additional Benchmark Regular Plan Growth Option 6.10 6.02 7.86 7.10 - - - - - 6.84 Additional Benchmark Direct Plan Growth Option 7.42 7.49 8.15 7.02 - - - - - 7.16 Additional Benchmark Regular Plan Retail Growth Option - - - - 6.36 6.28 6.48 6.39 - - Additional Benchmark Regular Plan Institutional - - - - 6.66 6.59 - - - - Growth Option Additional Benchmark Regular Plan Super Institutional - - - - 6.66 6.59 6.48 6.39 - - Growth Option Additional Benchmark Direct Plan Super Institutional - - - - 7.42 7.50 7.42 7.49 - - Growth Option
Benchmark CRISIL Short Term Bond CRISIL Composite CRISIL Liquid Fund Index CRISIL Liquid Fund Index 75% -CRISIL MIP Blended Fund Fund Index Bond Fund Index Index and 25%-Price of Gold
Additional Benchmark CRISIL 1 Year T-Bill Index CRISIL 10 year Gilt Index CRISIL 1 Year T-Bill Index CRISIL 1 Year T-Bill Index CRISIL 10 year Gilt Index
Note : Regular Plan Retail & Regular Plan Institutional under both Taurus Liquid Fund and Taurus Ultra Short Term Bond Fund were discontinued with effect from October 01, 2012 for further subscription.
1. Gross income = amount against (A) in the Revenue account i.e. Income.
2. Net income = amount against (C) in the Revenue account i.e. NET REALISED GAINS / (LOSSES) FOR THE YEAR / PERIOD
3. Portfolio Turnover = Lower of sales or purchase divided by the Average AuM for the year/period.
4. AAuM=Average daily net assets
ABRIDGED ANNUAL REPORT 2016 - 2017
Taurus Short Term Taurus Dynamic Taurus Liquid Fund Taurus Ultra Short Taurus MIP Advantage Income Fun Income Fund Term Bond Fund
March 31, 2017 March 31, 2016 March 31, 2017 March 31, 2016 March 31, 2017 March 31, 2016 March 31, 2017 March 31, 2016 July 08, 2016 March 31, 2016
TAURUS ASSET MANAGEMENT COMPANY LIMITED CIN: U67190MH1993PLC073154
Regd. Office: 305, Regent Chambers, 208, Jamnalal Bajaj Marg, Nariman Point, Mumbai - 400 021.
Head Office: Ground Floor, Centre-1, Mahal Industrial Estate, Mahakali Caves Road, Andheri East, Mumbai - 400 093. Tel.: +91 22 66242700 (Board) Fax: +91 22 6624 2777
Email: [email protected] Website: www.taurusmutualfund.com
If undelivered, please return to:
Mutual Fund investments are subject to market risks, read allscheme information documents carefully.
Book Post
The Abridged Annual Report has been extracted from the Audited Balance Sheet, Revenue Account and Notes to Accounts, Full Annual Report is available on the website www.taurusmutualfund.com. Unitholders may refer to the full Annual Report displayed on the website w.r.t. general policies and procedures for exercising voting rights and the details of proxy votings exercised during the Financial Year 2016-2017. For Unitholders of the Scheme, full Annual Report is available for inspection at the Corporate Office/Central Service Office of the AMC and a copy thereof shall be made available to the Unitholder on request.