Embed Size (px)
Citation preview

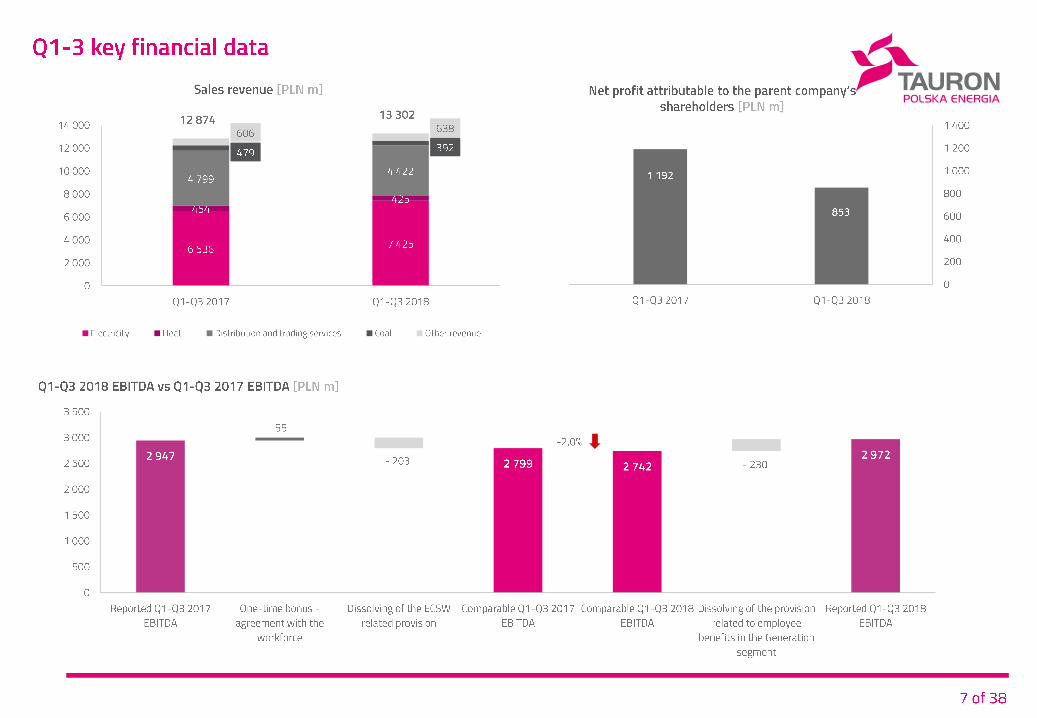
TAURON Group’s Q1-3 2018
Financial Results
November 7, 2018

0
20
40
60
80
100
120
140
Q1-Q3 2017 Q1-Q3 2018
50
52
54
56
58
PMI
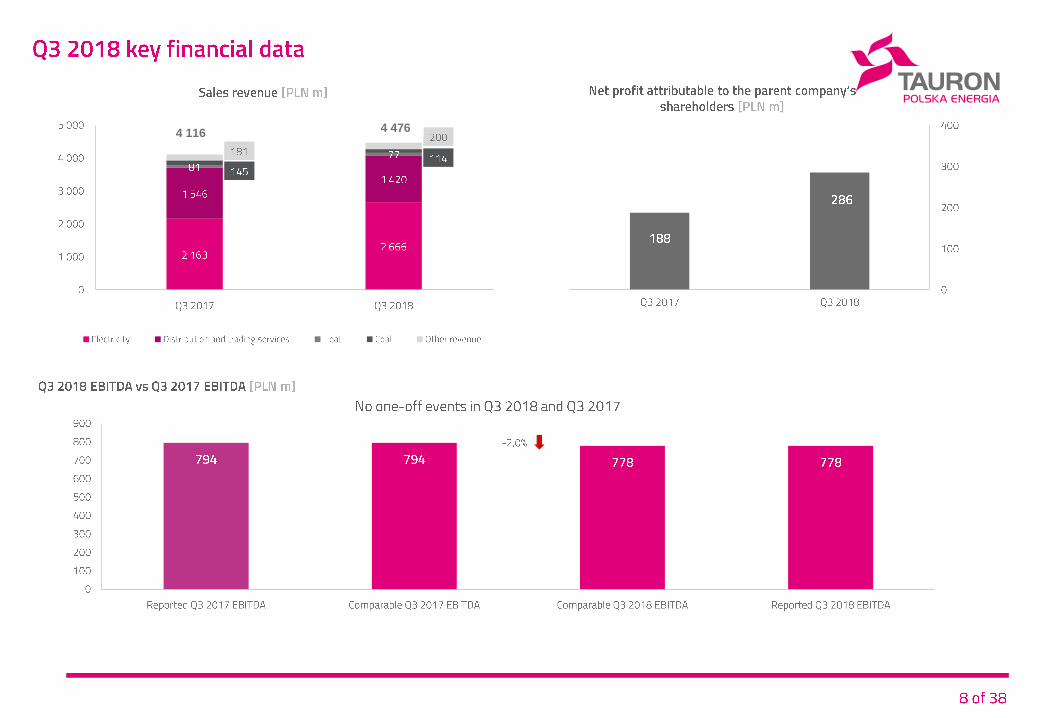
4 116 4 476
*
PLN m
*
*

6a
1
√
-
-
1
√
-
-

6a
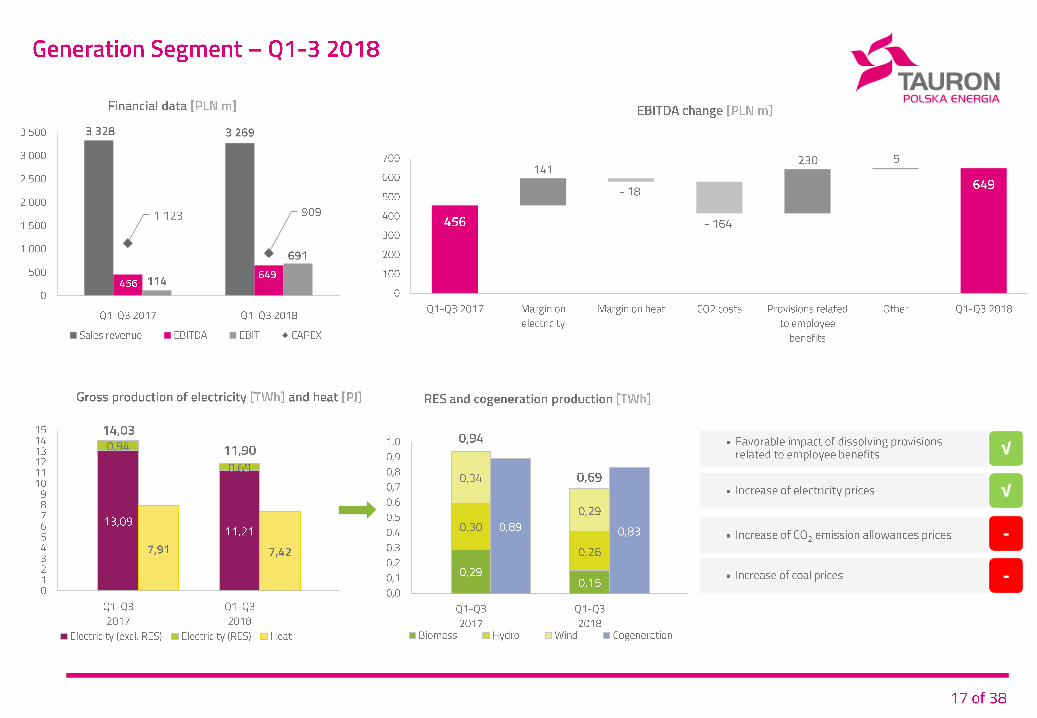
√
√
-
-
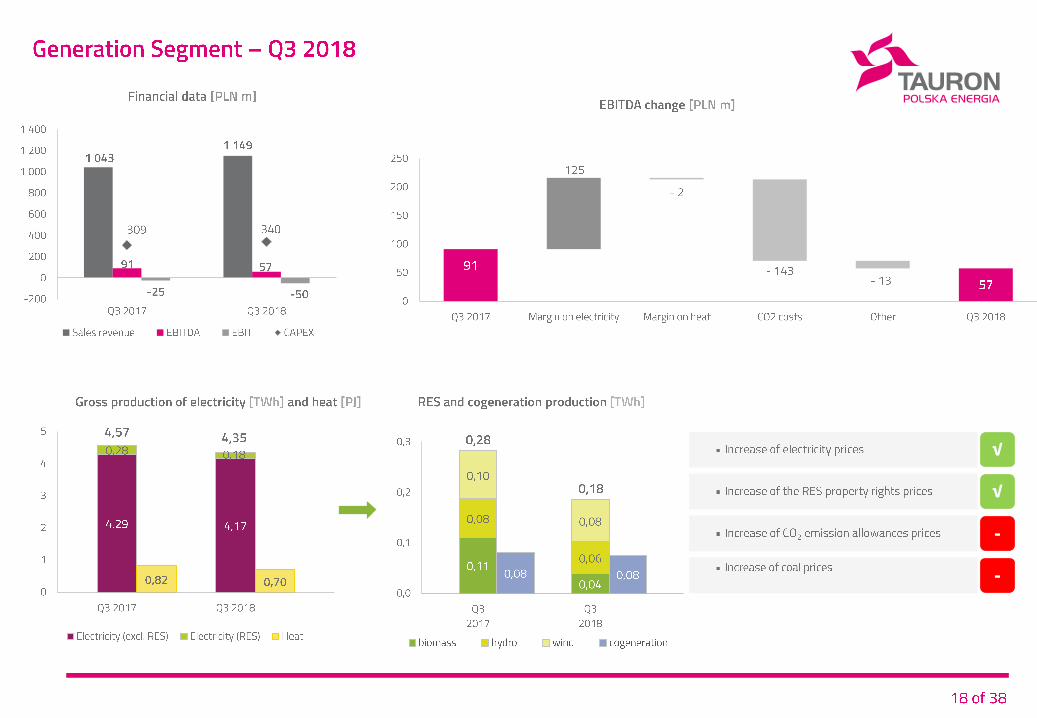
√
√
-
-

6a
0 5 10 15 20 25 30 35 40 45
*neighboring DSO and exports
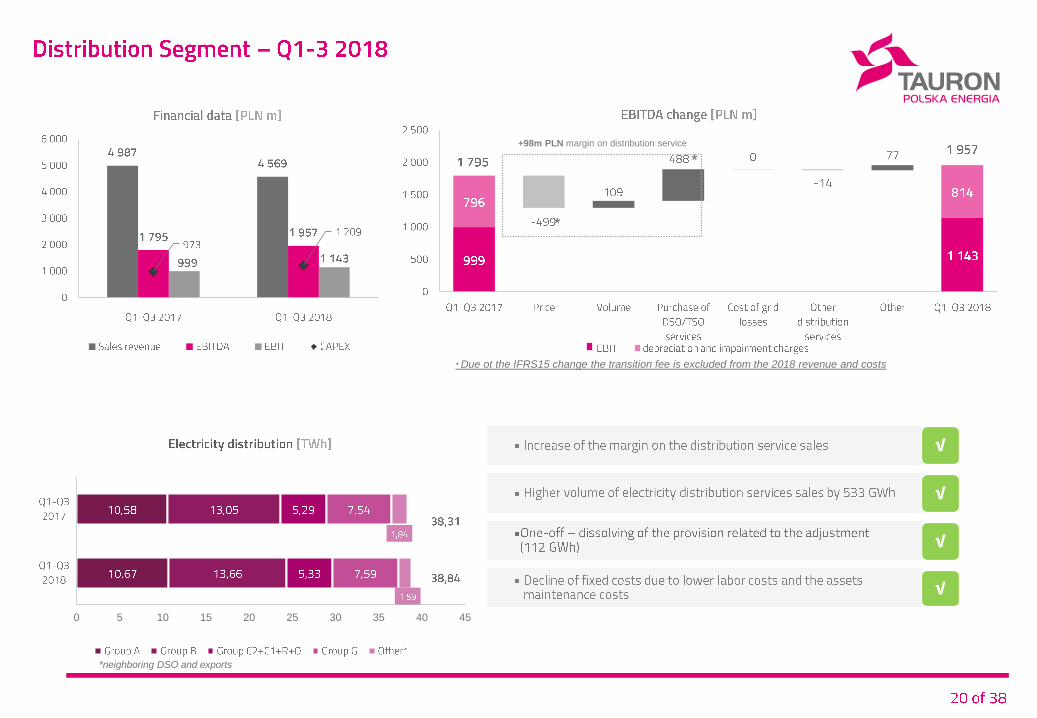
√
√
√
√
*
*
* Due ot the IFRS15 change the transition fee is excluded from the 2018 revenue and costs
+98m PLN margin on distribution service
0 2 4 6 8 10 12 14
EBIT depreciation and impairment charges
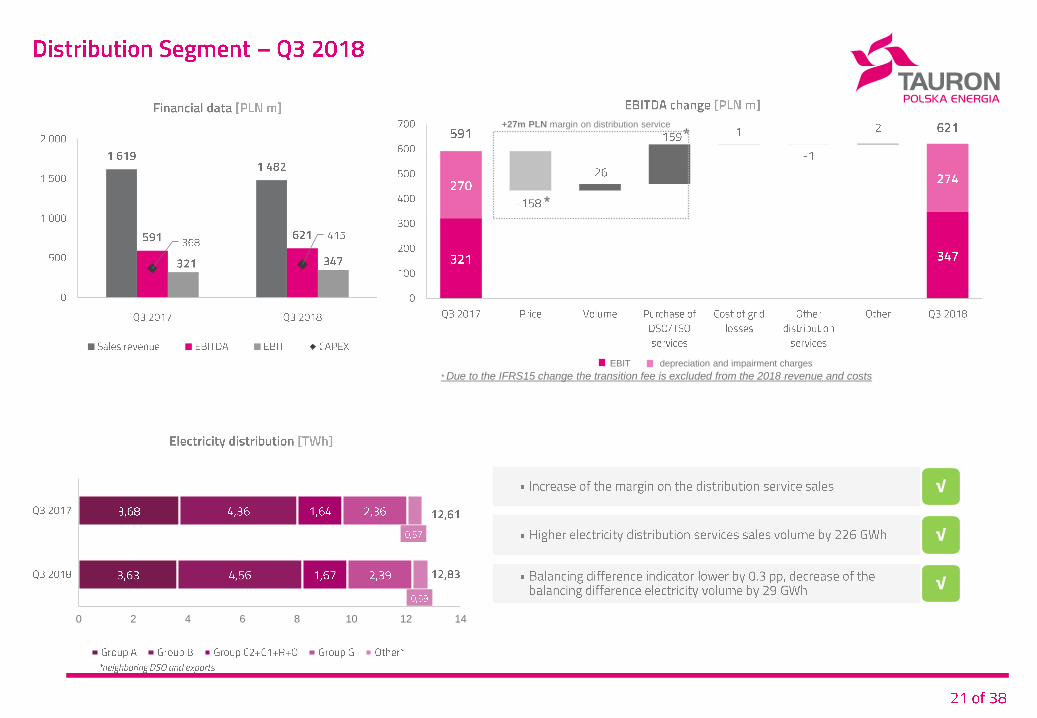
√
√
√
*
*
* Due to the IFRS15 change the transition fee is excluded from the 2018 revenue and costs
+27m PLN margin on distribution service
0
2
4
6
8
10
12
14
16
18
0
20
40
60
80
100
120
140
160
180
200
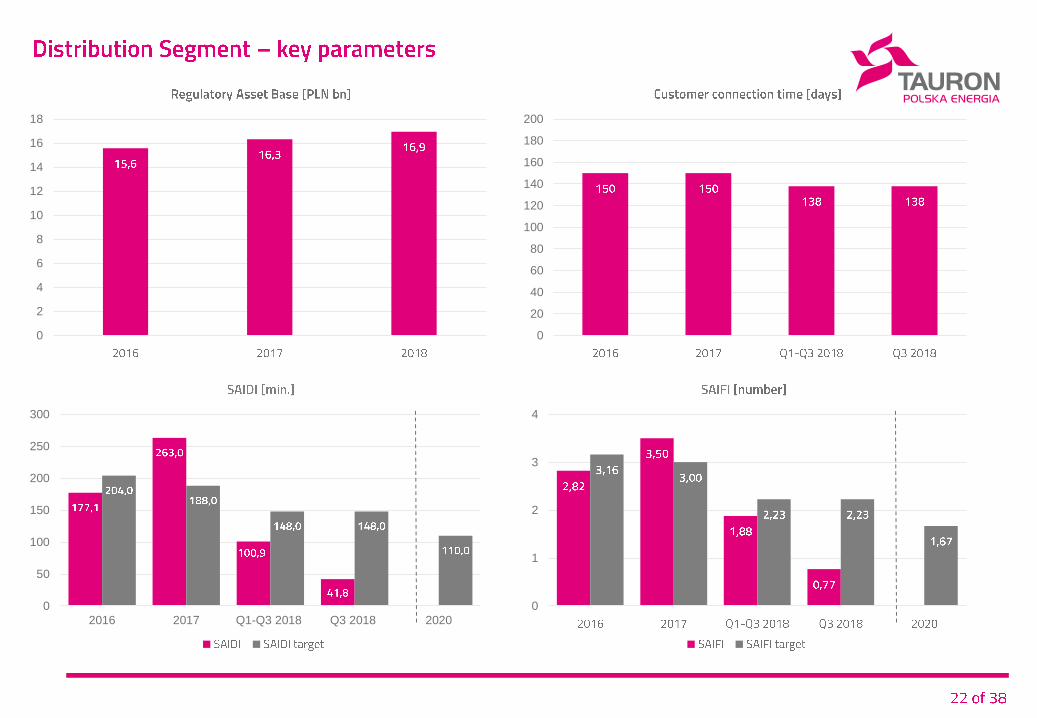
0
50
100
150
200
250
300
2016 2017 Q1-Q3 2018 Q3 2018 2020
0
1
2
3
4

6a
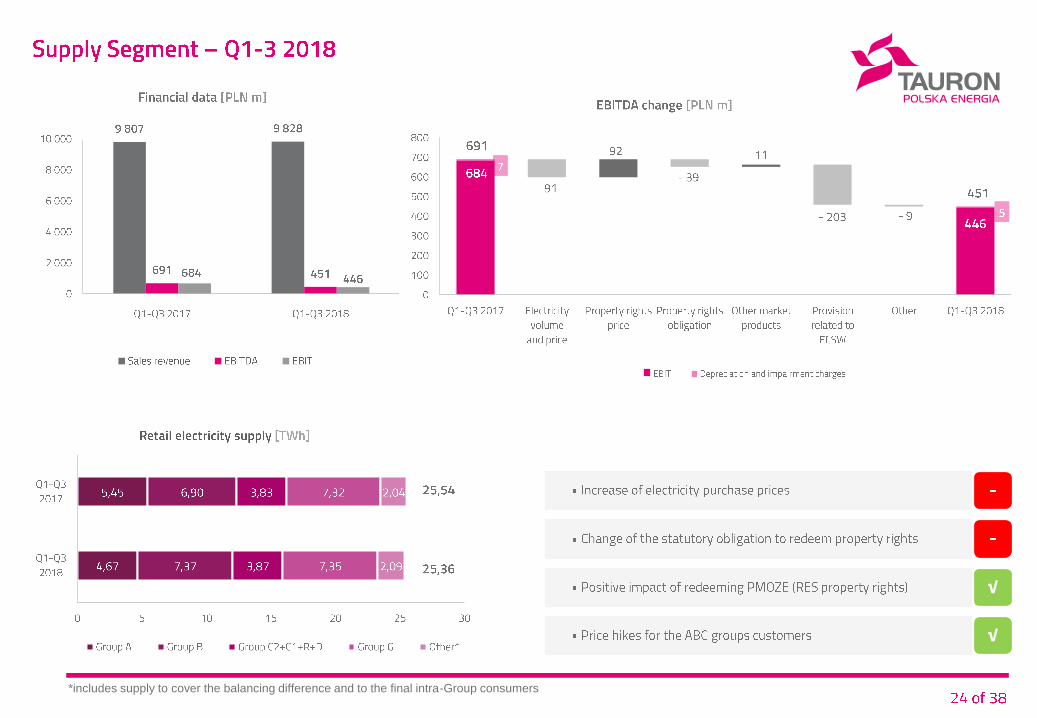
*includes supply to cover the balancing difference and to the final intra-Group consumers
√
√
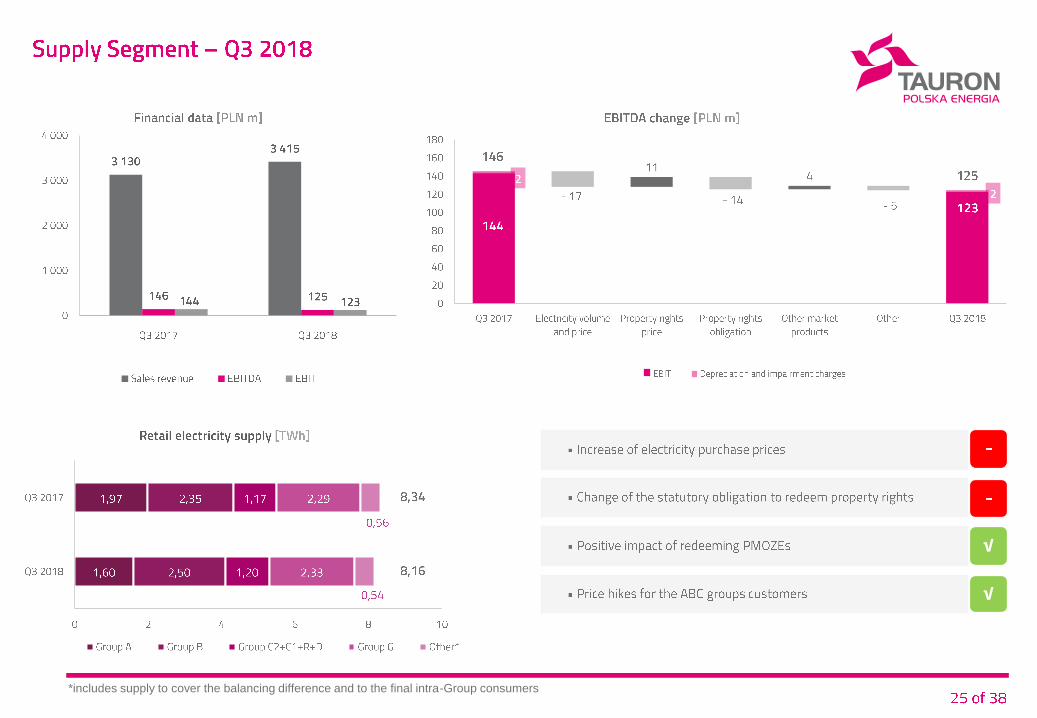
*includes supply to cover the balancing difference and to the final intra-Group consumers
√
√
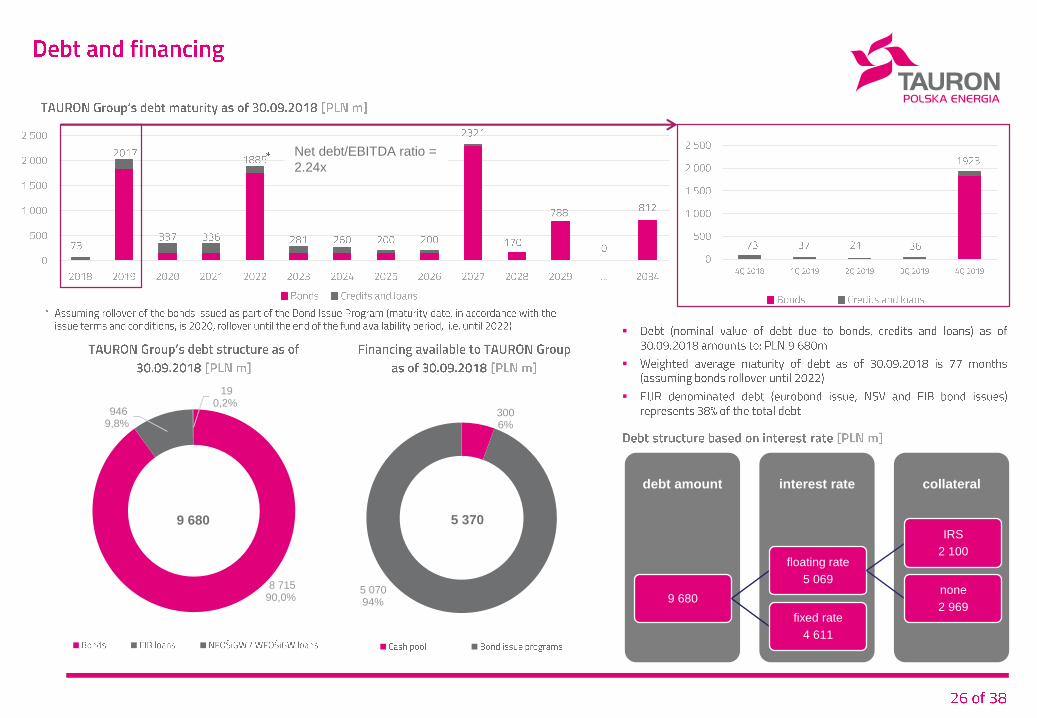
8 715 90,0%
946 9,8%
19 0,2%
3006%
5 07094%
9 680 5 370
collateralinterest rate debt amount
9 680
floating rate
5 069
IRS
2 100
none
2 969fixed rate
4 611
Net debt/EBITDA ratio =
2.24x
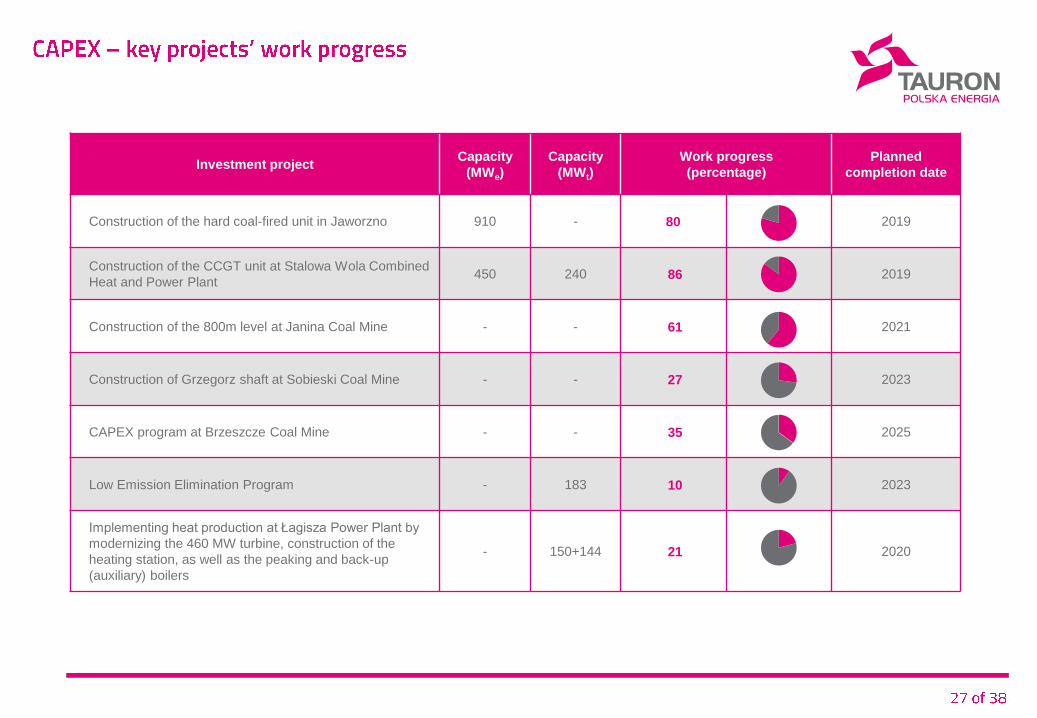
Investment projectCapacity
(MWe)
Capacity
(MWt)
Work progress
(percentage)
Planned
completion date
Construction of the hard coal-fired unit in Jaworzno 910 - 80 2019
Construction of the CCGT unit at Stalowa Wola Combined
Heat and Power Plant450 240 86 2019
Construction of the 800m level at Janina Coal Mine - - 61 2021
Construction of Grzegorz shaft at Sobieski Coal Mine - - 27 2023
CAPEX program at Brzeszcze Coal Mine - - 35 2025
Low Emission Elimination Program - 183 10 2023
Implementing heat production at Łagisza Power Plant by
modernizing the 460 MW turbine, construction of the
heating station, as well as the peaking and back-up
(auxiliary) boilers
- 150+144 21 2020
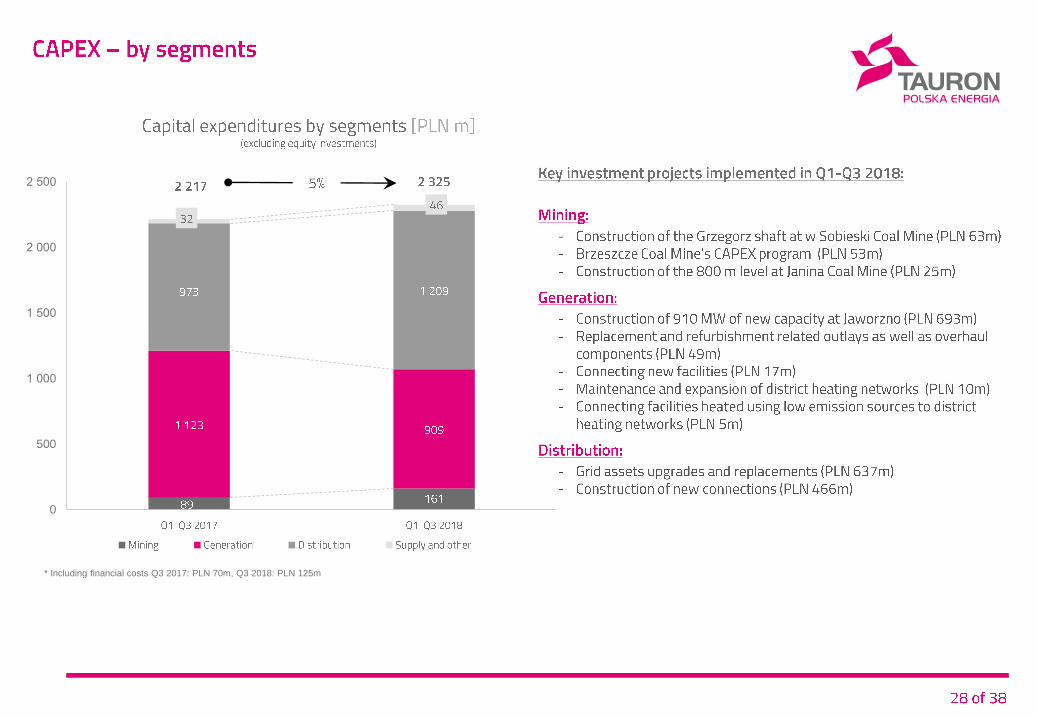
0
500
1 000
1 500
2 000
2 500
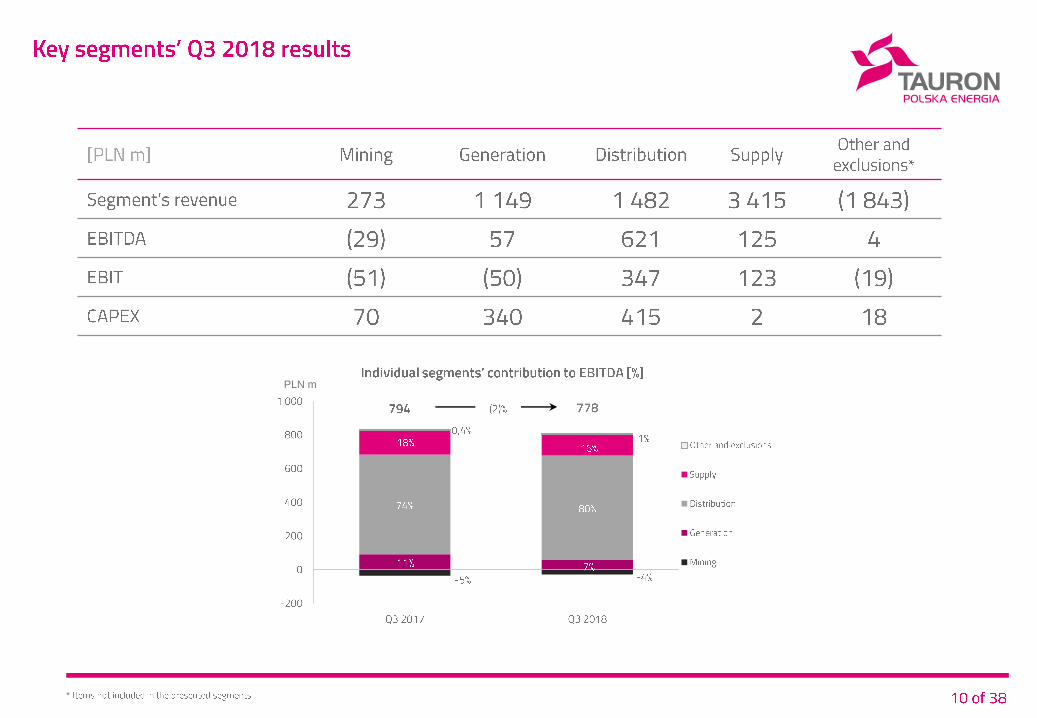
* Including financial costs Q3 2017: PLN 70m, Q3 2018: PLN 125m
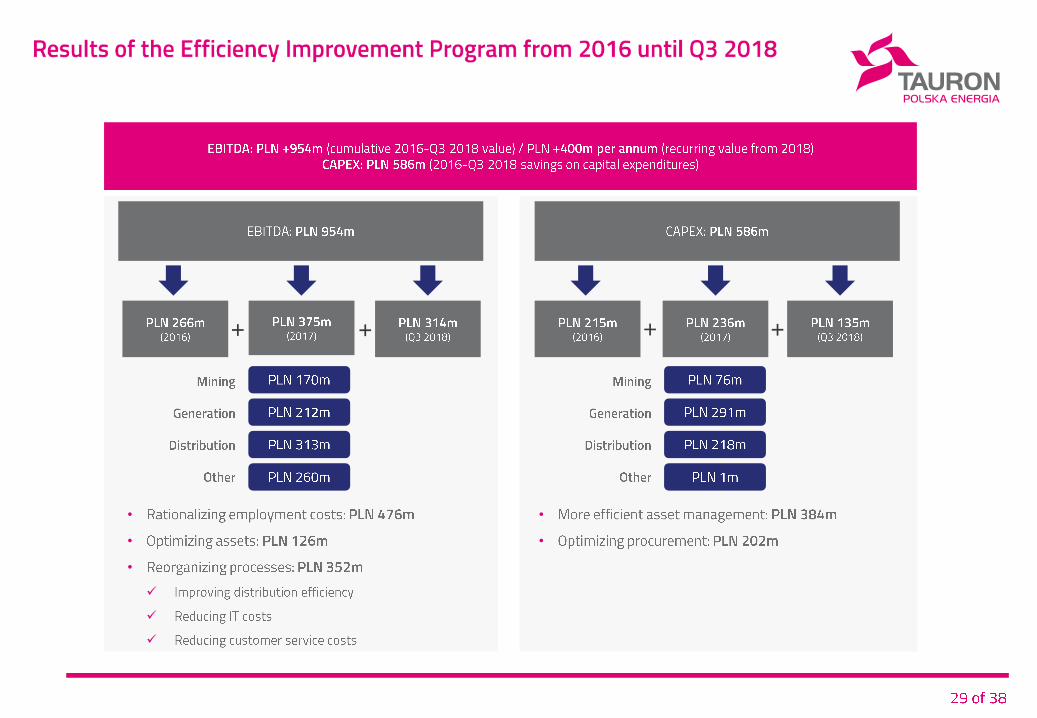
+ + + +
•
•
•
•
•

This presentation serves for information purposes only and should not be treated as investment-related advice.
This presentation has been prepared by TAURON Polska Energia S.A. (the “Company”).
Neither the Company nor any of its subsidiaries shall be held accountable for any damage resulting from the use of this presentation or a part thereof,
or its contents or in any other manner in connection with this presentation.
The recipients of this presentation shall bear exclusive responsibility for their own analyses and market assessment as well as evaluation of the
Company’s market position and its potential results in the future based on information contained in herein.
To the extent this presentation contains forward-looking statements related to the future, in particular such terms as ”designed”, ”planned”,
”anticipated”, or other similar expressions (including their negation), they shall be connected with the known and unknown risks, uncertainty and other
factors which might result in actual results, financial situation, actions and achievements being materially different from any future results, actions or
achievements expressed in such forward-looking statements.
Neither the Company, nor any of its subsidiaries shall be obligated to provide the recipients of this presentation with any additional information or
update this presentation.
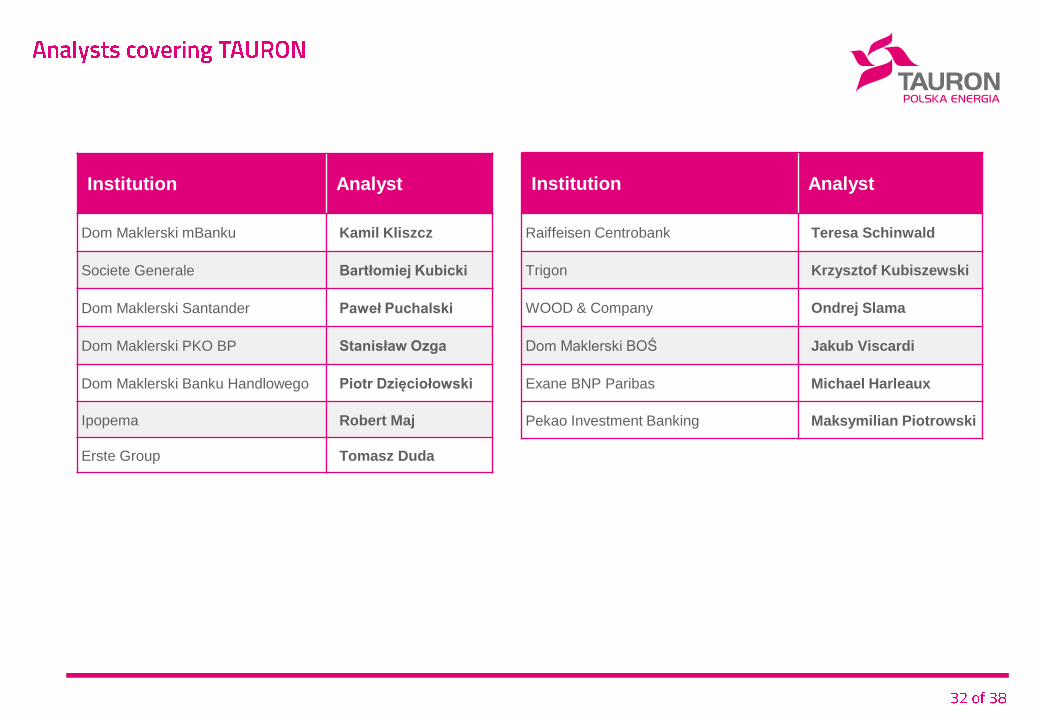
Institution Analyst
Dom Maklerski mBanku Kamil Kliszcz
Societe Generale Bartłomiej Kubicki
Dom Maklerski Santander Paweł Puchalski
Dom Maklerski PKO BP Stanisław Ozga
Dom Maklerski Banku Handlowego Piotr Dzięciołowski
Ipopema Robert Maj
Erste Group Tomasz Duda
Institution Analyst
Raiffeisen Centrobank Teresa Schinwald
Trigon Krzysztof Kubiszewski
WOOD & Company Ondrej Slama
Dom Maklerski BOŚ Jakub Viscardi
Exane BNP Paribas Michael Harleaux
Pekao Investment Banking Maksymilian Piotrowski
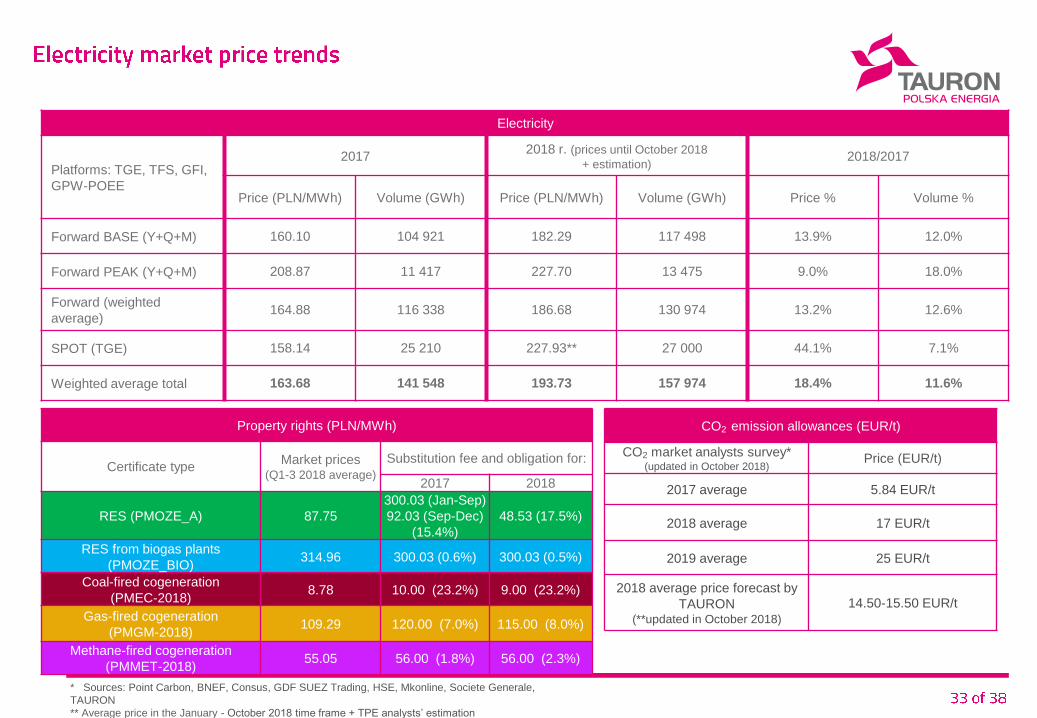
Electricity
Platforms: TGE, TFS, GFI,
GPW-POEE
20172018 r. (prices until October 2018
+ estimation)2018/2017
Price (PLN/MWh) Volume (GWh) Price (PLN/MWh) Volume (GWh) Price % Volume %
Forward BASE (Y+Q+M) 160.10 104 921 182.29 117 498 13.9% 12.0%
Forward PEAK (Y+Q+M) 208.87 11 417 227.70 13 475 9.0% 18.0%
Forward (weighted
average)164.88 116 338 186.68 130 974 13.2% 12.6%
SPOT (TGE) 158.14 25 210 227.93** 27 000 44.1% 7.1%
Weighted average total 163.68 141 548 193.73 157 974 18.4% 11.6%
Property rights (PLN/MWh)
Certificate typeMarket prices
(Q1-3 2018 average)
Substitution fee and obligation for:
2017 2018
RES (PMOZE_A) 87.75
300.03 (Jan-Sep)
92.03 (Sep-Dec)
(15.4%)
48.53 (17.5%)
RES from biogas plants
(PMOZE_BIO)314.96 300.03 (0.6%) 300.03 (0.5%)
Coal-fired cogeneration
(PMEC-2018) 8.78 10.00 (23.2%) 9.00 (23.2%)
Gas-fired cogeneration
(PMGM-2018)109.29 120.00 (7.0%) 115.00 (8.0%)
Methane-fired cogeneration
(PMMET-2018)55.05 56.00 (1.8%) 56.00 (2.3%)
CO2 emission allowances (EUR/t)
CO2 market analysts survey*(updated in October 2018)
Price (EUR/t)
2017 average 5.84 EUR/t
2018 average 17 EUR/t
2019 average 25 EUR/t
2018 average price forecast by
TAURON (**updated in October 2018)
14.50-15.50 EUR/t
* Sources: Point Carbon, BNEF, Consus, GDF SUEZ Trading, HSE, Mkonline, Societe Generale,
TAURON
** Average price in the January - October 2018 time frame + TPE analysts’ estimation
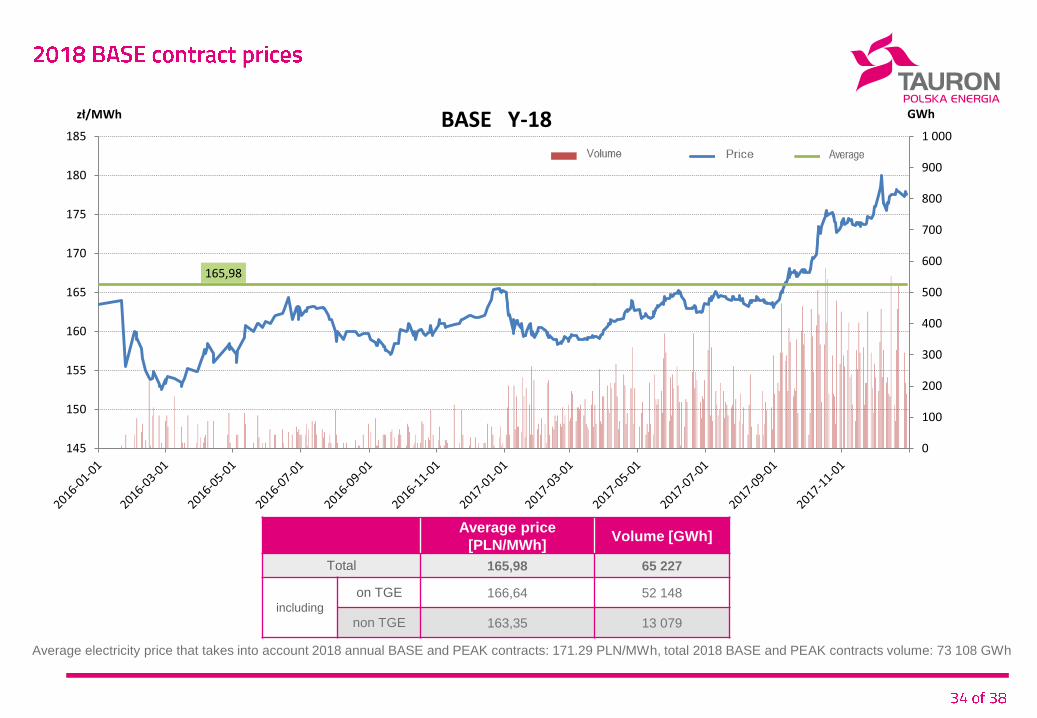
Average price
[PLN/MWh]Volume [GWh]
Total 165,98 65 227
including
on TGE 166,64 52 148
non TGE 163,35 13 079
Average electricity price that takes into account 2018 annual BASE and PEAK contracts: 171.29 PLN/MWh, total 2018 BASE and PEAK contracts volume: 73 108 GWh
165,98
0
100
200
300
400
500
600
700
800
900
1 000
145
150
155
160
165
170
175
180
185
GWhzł/MWh BASE Y-18
Wolumen obrotu Notowania Średnia
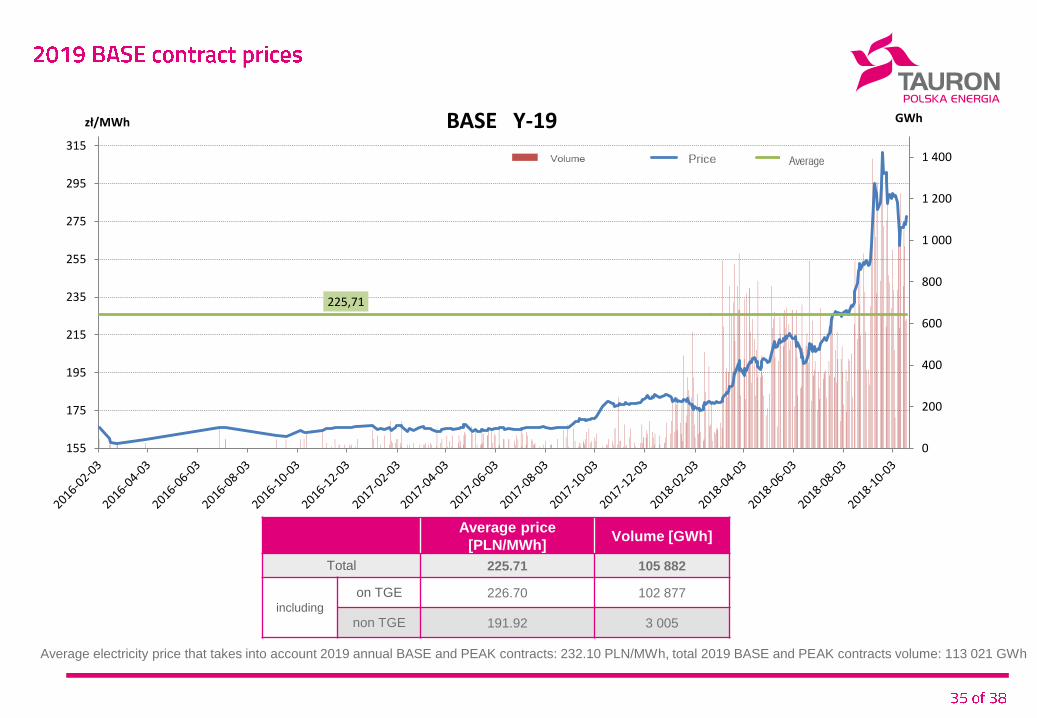
Average price
[PLN/MWh]Volume [GWh]
Total 225.71 105 882
including
on TGE 226.70 102 877
non TGE 191.92 3 005
Average electricity price that takes into account 2019 annual BASE and PEAK contracts: 232.10 PLN/MWh, total 2019 BASE and PEAK contracts volume: 113 021 GWh
225,71
0
200
400
600
800
1 000
1 200
1 400
155
175
195
215
235
255
275
295
315
GWhzł/MWh BASE Y-19
Wolumen obrotu Notowania Średnia
Average price
[PLN/MWh]Volume [GWh]
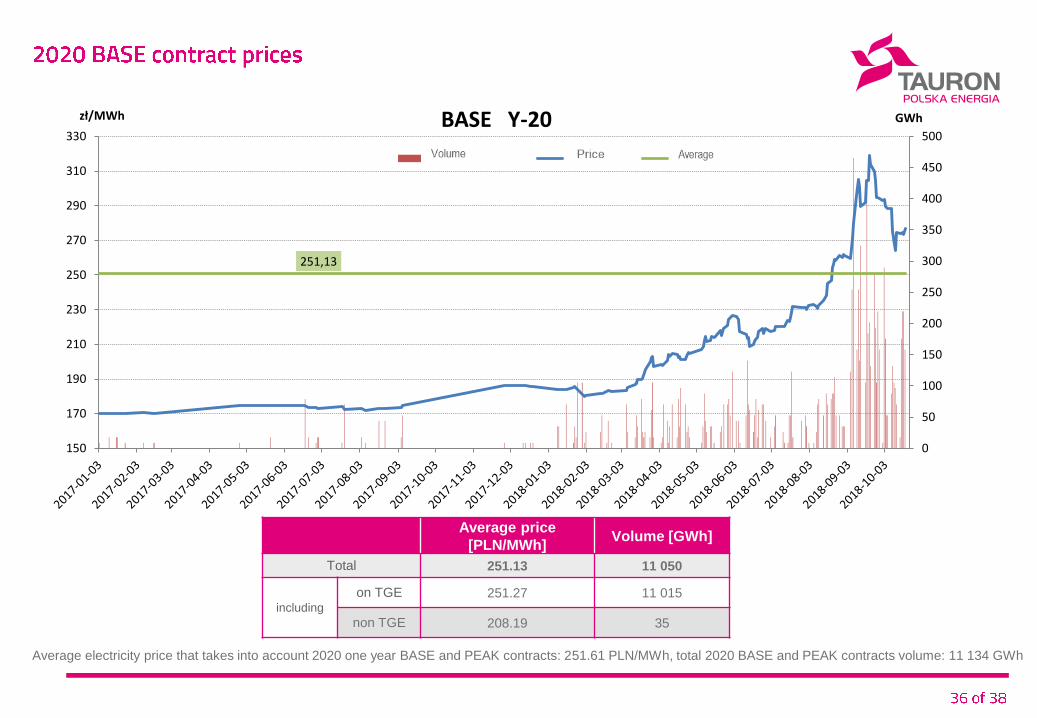
Total 251.13 11 050
including
on TGE 251.27 11 015
non TGE 208.19 35
Average electricity price that takes into account 2020 one year BASE and PEAK contracts: 251.61 PLN/MWh, total 2020 BASE and PEAK contracts volume: 11 134 GWh
251,13
0
50
100
150
200
250
300
350
400
450
500
150
170
190
210
230
250
270
290
310
330
GWhzł/MWh BASE Y-20
Wolumen obrotu Notowania Średnia
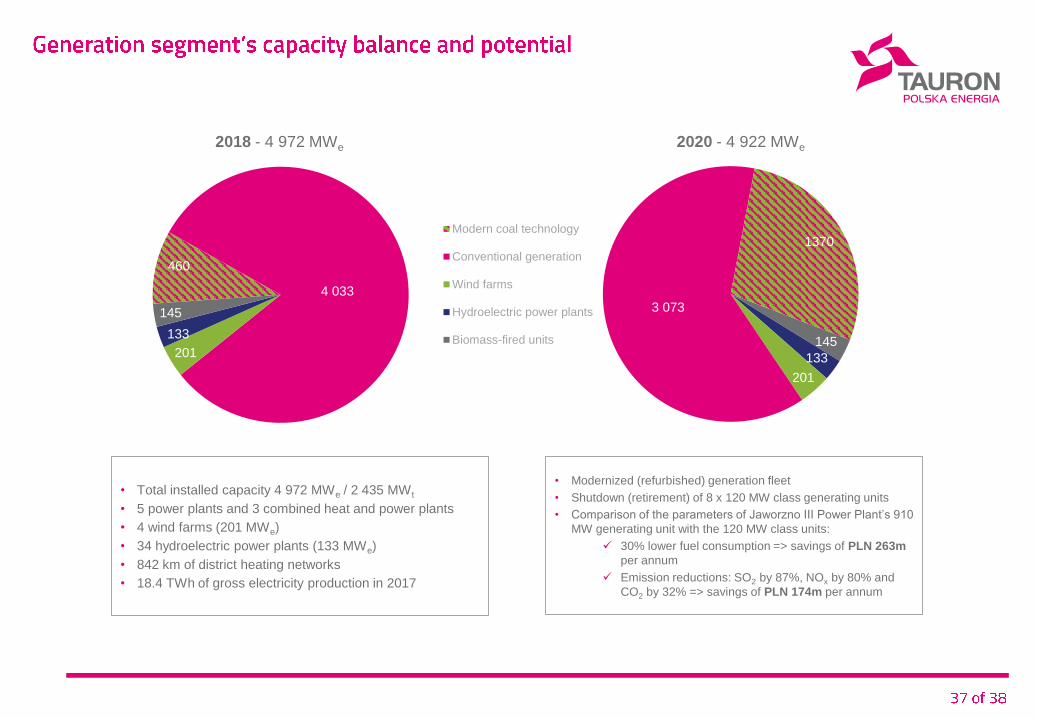
460
4 033
201
133
145
Modern coal technology
Conventional generation
Wind farms
Hydroelectric power plants
Biomass-fired units 145
133
201
3 073
1370
2018 - 4 972 MWe 2020 - 4 922 MWe
• Total installed capacity 4 972 MWe / 2 435 MWt
• 5 power plants and 3 combined heat and power plants
• 4 wind farms (201 MWe)
• 34 hydroelectric power plants (133 MWe)
• 842 km of district heating networks
• 18.4 TWh of gross electricity production in 2017
• Modernized (refurbished) generation fleet
• Shutdown (retirement) of 8 x 120 MW class generating units
• Comparison of the parameters of Jaworzno III Power Plant’s 910
MW generating unit with the 120 MW class units:
30% lower fuel consumption => savings of PLN 263m
per annum
Emission reductions: SO2 by 87%, NOx by 80% and
CO2 by 32% => savings of PLN 174m per annum