Embed Size (px)
Citation preview

Adam Lapacz, Andrew Olson, Daniel Greuel, Indira Manandhar, Kyle Snyder, Mark Kelly, Molly McClung, Stefanie Perez, Tony Palmer
Tate Laboratory of PhysicsBuilding Analysis

Built: 1927Located: East Bank of University of Minnesota, MinneapolisBuilding Use : Classroom/Lecture/OfficeOperation hours: 9 Hrs/DayFloor Area: 199,655 square feet
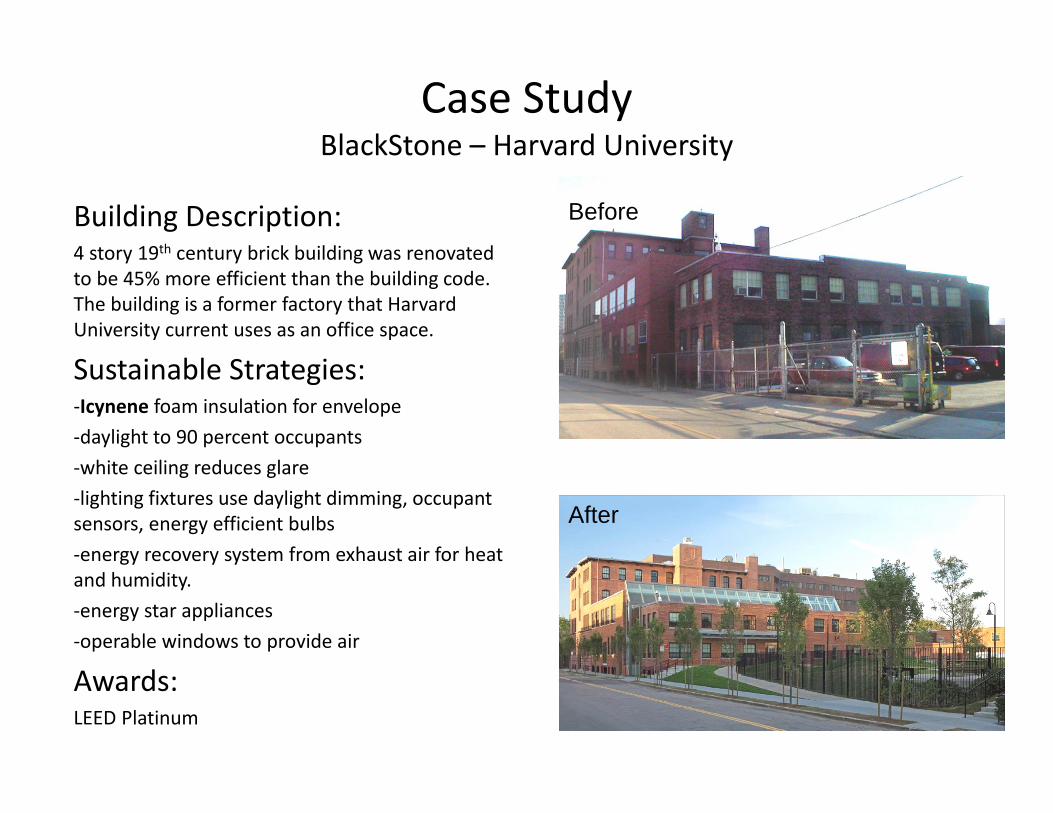
Case StudyBlackStone – Harvard University
Building Description:4 story 19th century brick building was renovated to be 45% more efficient than the building code. The building is a former factory that Harvard University current uses as an office space.
Sustainable Strategies:‐Icynene foam insulation for envelope‐daylight to 90 percent occupants‐white ceiling reduces glare‐lighting fixtures use daylight dimming, occupant sensors, energy efficient bulbs‐energy recovery system from exhaust air for heat and humidity.‐energy star appliances‐operable windows to provide air
Awards: LEED Platinum
Before
After

Case StudyCollege of Nursing – ASU
Building Description:Site underwent a $8,000,000 renovation and became The Global Institute of Sustainability.
Sustainable Strategies:-Dependency on potable water was reduced by 59% through water conservation, ie low-flow and dual-flush fixtures and native landscaping measures.-Copper (durable and recyclable) covers approximately 34,000 square feet of the building skin.-Energy efficient building design, including shading devices, building orientation and glazing lead to a 20% cost saving in regulated energy
Awards: LEED Gold

Design Challenges:
Historic preservation of mall side
Limited funding from university
Possibility of classes still in progress during construction
Creation of central atrium
Analysis Areas:
Water
Thermal
Daylight
Renewable Energy

DESIGN PROPOSAL
Existing Tate Lab
Proposed central atrium
Event space
Community space
Entry on Church St.
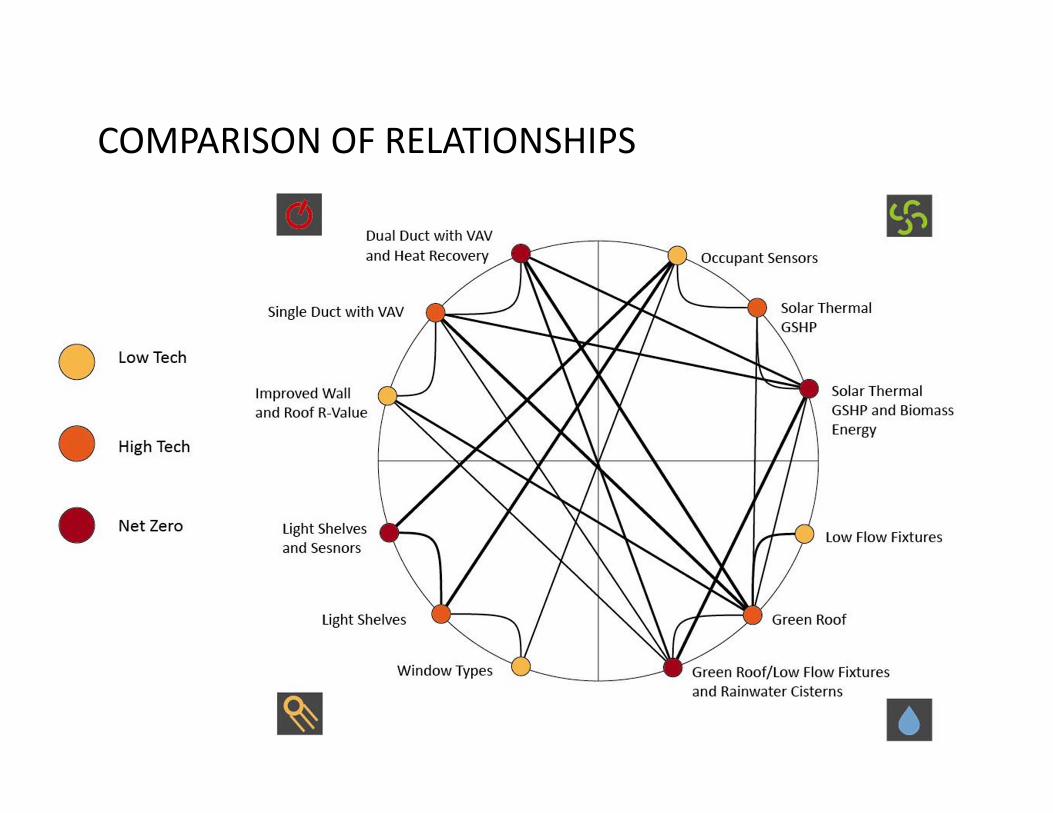
COMPARISON OF RELATIONSHIPS

Analysis Bundles
LOW TECH BUNDLE
Summary of Methods: This bundle uses low tech measures to implement sustainable technology within Tate Lab. These analyses show that the total energy can be lessened using off‐the‐shelf, proven, inexpensive technology. The estimated life cycle cost payback is 1 ‐ 3 years.
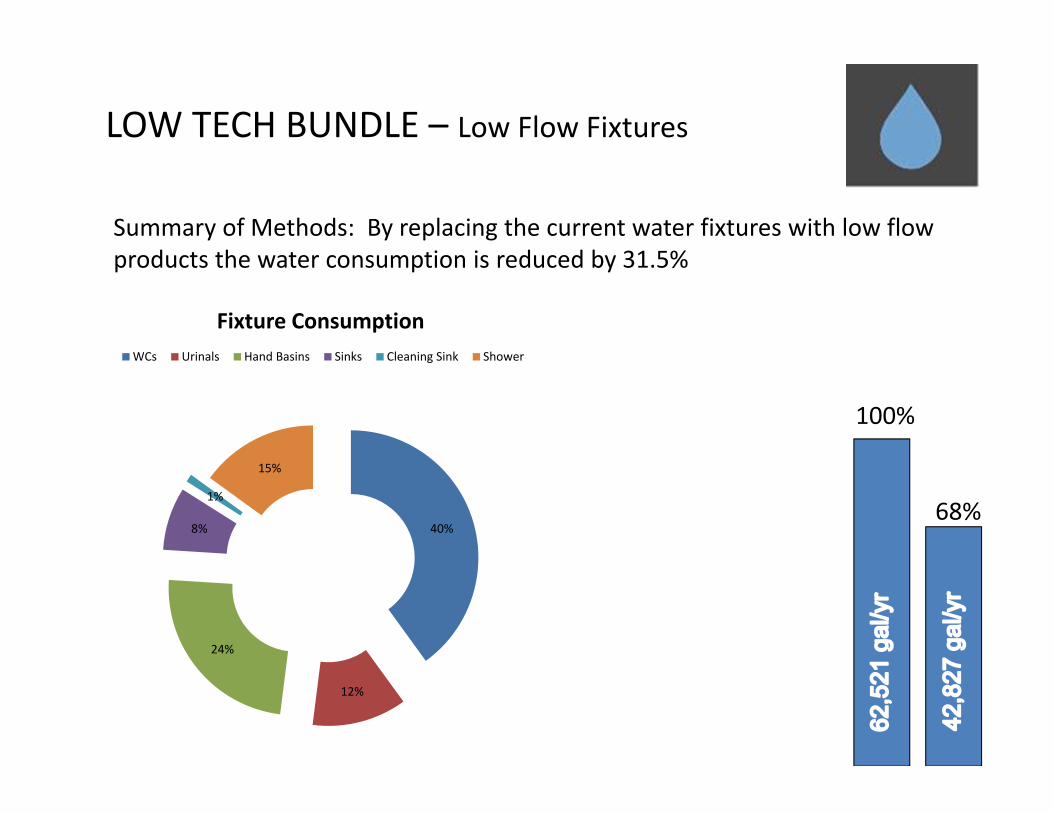
LOW TECH BUNDLE – Low Flow Fixtures
100%
Summary of Methods: By replacing the current water fixtures with low flow products the water consumption is reduced by 31.5%
68%40%
12%
24%
8%
1%
15%
Fixture ConsumptionWCs Urinals Hand Basins Sinks Cleaning Sink Shower
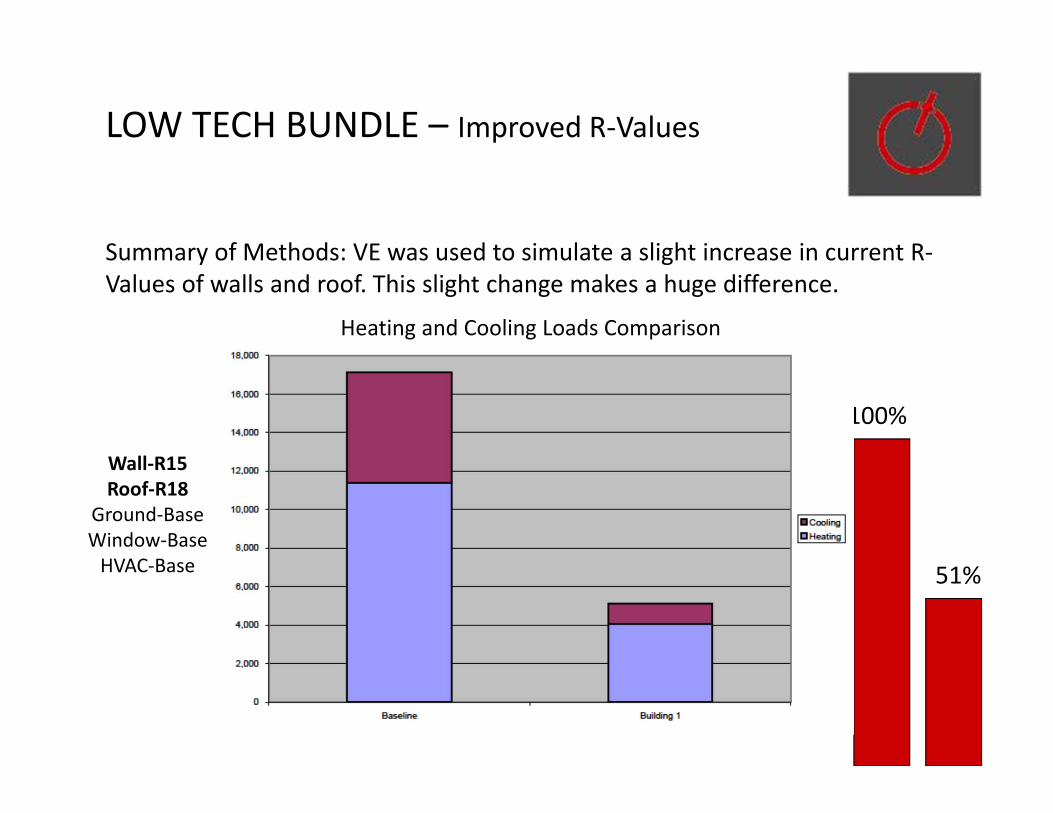
LOW TECH BUNDLE – Improved R‐Values
Summary of Methods: VE was used to simulate a slight increase in current R‐Values of walls and roof. This slight change makes a huge difference.
100%
51%
Heating and Cooling Loads Comparison
Wall‐R15Roof‐R18
Ground‐BaseWindow‐BaseHVAC‐Base

LOW TECH BUNDLE – Light Shelves
Summary of Methods: VE was used to simulate the implementation of light shelves and light dimming sensors in the building. The impact of this method would provide a small change to the existing
energy loads by 8%.
100%92%
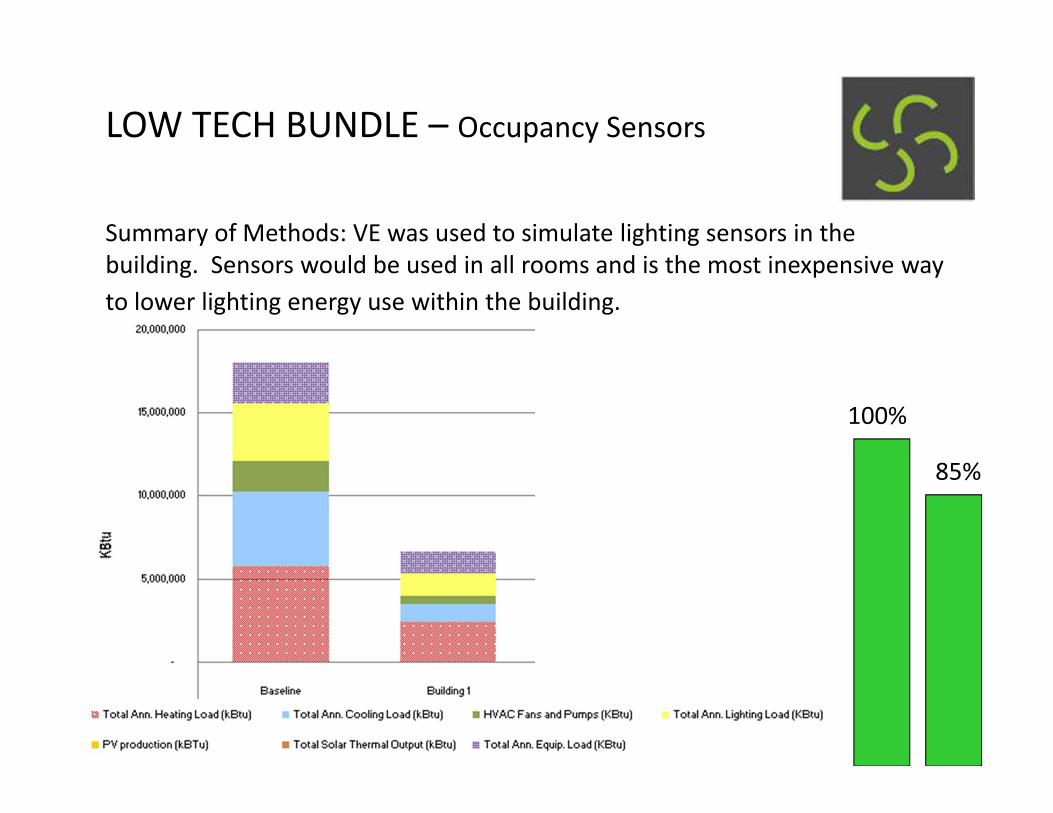
LOW TECH BUNDLE – Occupancy Sensors
Summary of Methods: VE was used to simulate lighting sensors in the building. Sensors would be used in all rooms and is the most inexpensive way to lower lighting energy use within the building.
100%
85%
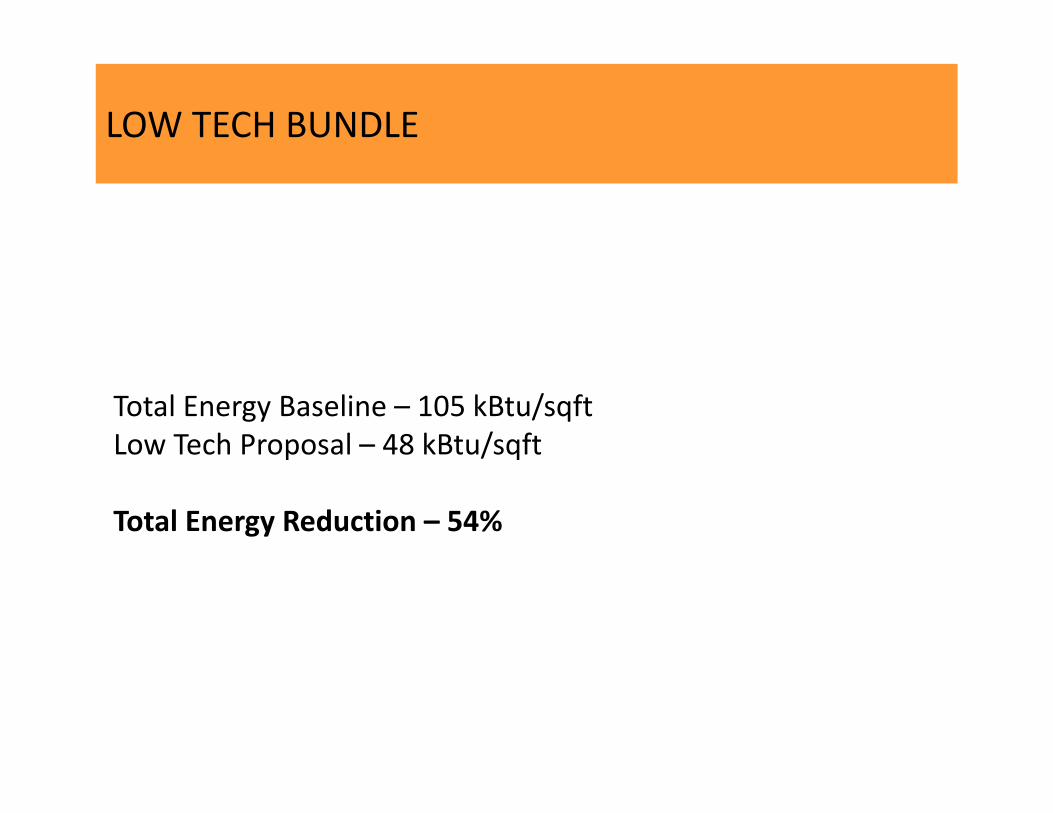
LOW TECH BUNDLE
Total Energy Baseline – 105 kBtu/sqftLow Tech Proposal – 48 kBtu/sqft
Total Energy Reduction – 54%

HIGH TECH BUNDLE
Summary of Methods: This bundle uses high tech innovations to offset a significant amount of the total energy use. These analyses show that the total energy can be lessened or balanced by the use of more expensive, more efficient technology. The estimated life cycle cost payback is 10 – 15 years.

HIGH TECH BUNDLE – Green Roof
100%
71%
Summary of Methods: The implementation of an extensive green roof has the ability to reduce storm water runoff, create new amenity spaces, and help make the building more energy efficient.• A 26,000 sqft roof can have 470,206 gallons of runoff annually
• This proposal is a 13,000 sqft green roof, and meets the MN Ordinance Runoff Volume Reduction Goal
• Produces $2,347 in energy savings annually (≈37 year payback)
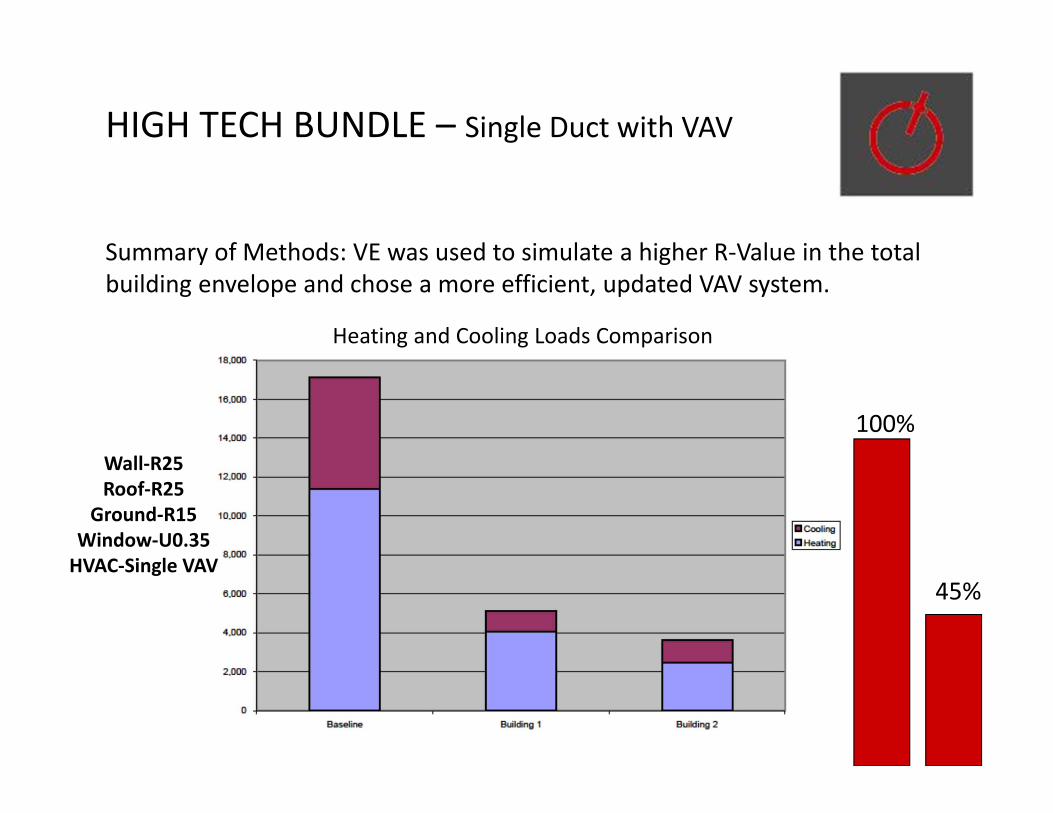
HIGH TECH BUNDLE – Single Duct with VAV
Summary of Methods: VE was used to simulate a higher R‐Value in the total building envelope and chose a more efficient, updated VAV system.
100%
45%
Heating and Cooling Loads Comparison
Wall‐R25Roof‐R25
Ground‐R15Window‐U0.35HVAC‐Single VAV

HIGH TECH BUNDLE – LED and Sensors
Summary of Methods: VE was used to simulate lighting sensors in the building. Sensors are the most inexpensive way to lower lighting energy use within the building.
100%82%Baseline Thermal
onlyBest (30 l/wReplaced with 92 l/w)
Average(70 l/wReplaced with 76l/w)
Worst(110 l/wReplaced with 60l/w)
Light Sensors (30%) and best case scenario
Boilers 2,838,179 3,107,523 3,107,523 3,107,523 3,107,523 3,107,523
Chillers 4,345,754 3,282,194 3,282,194 3,282,194 3,282,194 3,282,194
Lights 3,501,214 3,501,214 2,359,468 3,224,968 6,418,776 1,651,628
Total 17,149,514 15,916,590 14,774,844 1,560,344 18,834,152 14,067,004
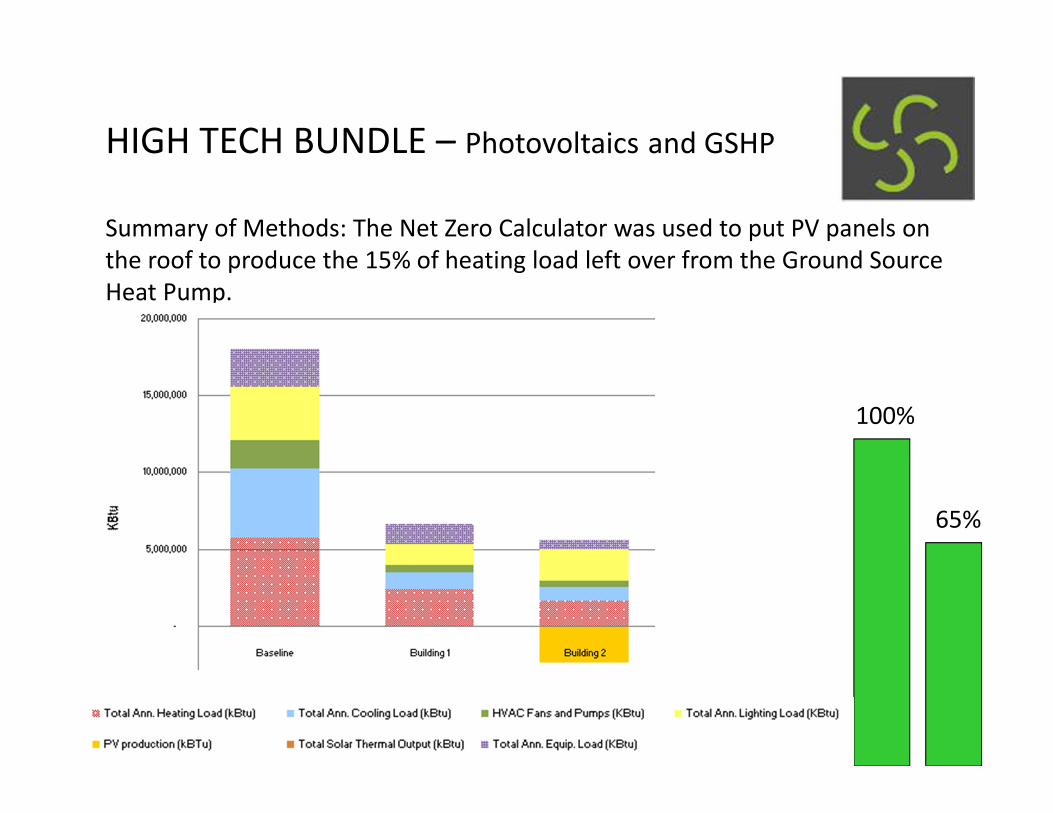
HIGH TECH BUNDLE – Photovoltaics and GSHP
Summary of Methods: The Net Zero Calculator was used to put PV panels on the roof to produce the 15% of heating load left over from the Ground Source Heat Pump.
100%
65%
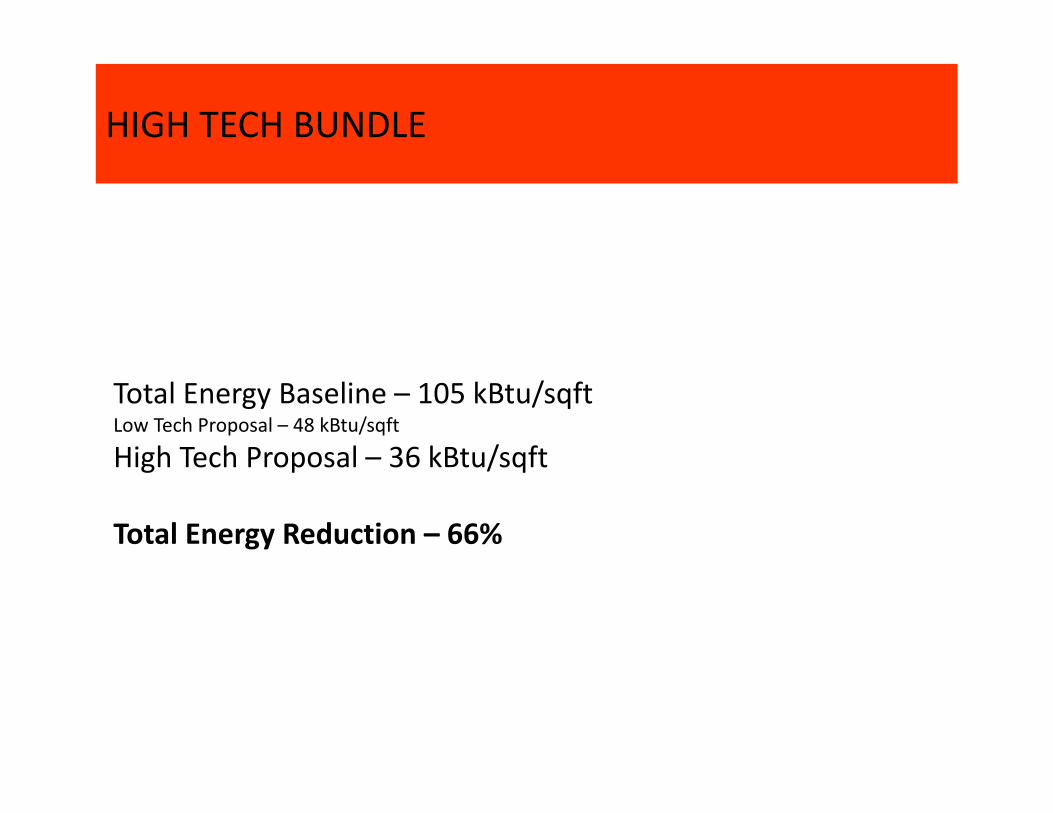
HIGH TECH BUNDLE
Total Energy Baseline – 105 kBtu/sqftLow Tech Proposal – 48 kBtu/sqft
High Tech Proposal – 36 kBtu/sqft
Total Energy Reduction – 66%
NET ZERO BUNDLE
Summary of Methods: This bundle uses a combination of measures from low tech and high tech bundles to create a balance of energy produced and energy used. These methods will be more expensive and invasive, but should balance all energy and water bills. The estimated payback period is 15 – 20 years.
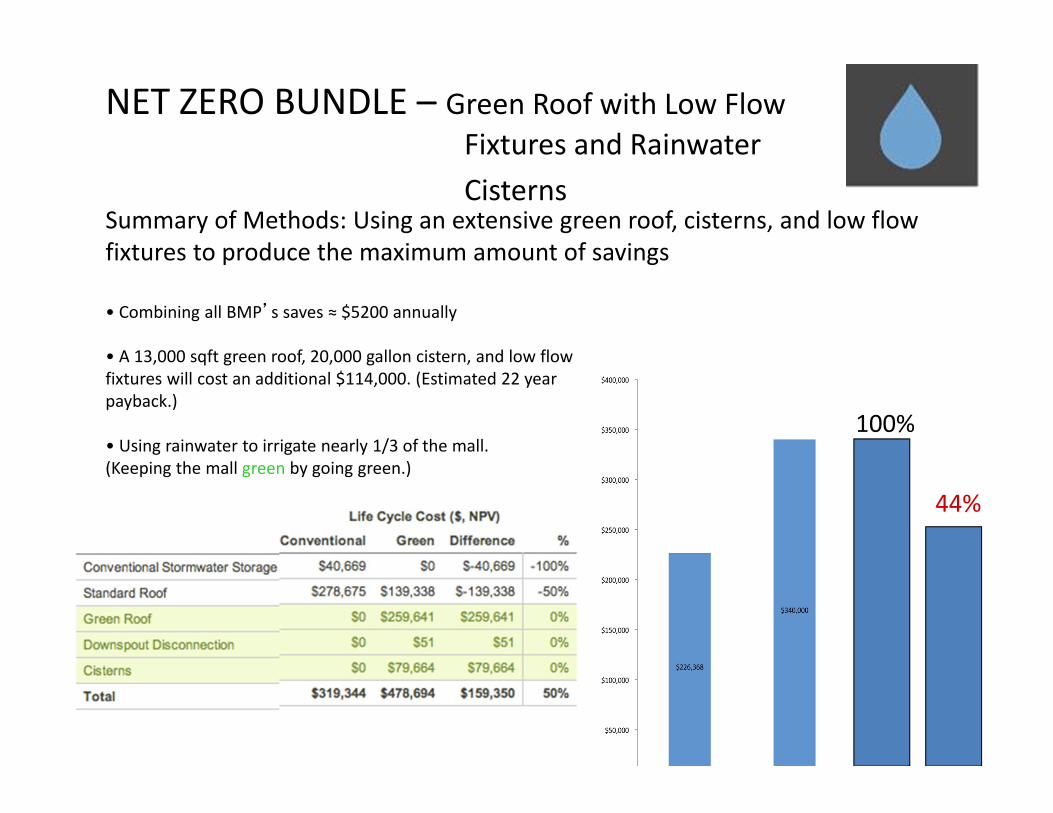
NET ZERO BUNDLE – Green Roof with Low Flow Fixtures and Rainwater Cisterns
100%
44%
Summary of Methods: Using an extensive green roof, cisterns, and low flow fixtures to produce the maximum amount of savings
• Combining all BMP’s saves ≈ $5200 annually
• A 13,000 sqft green roof, 20,000 gallon cistern, and low flow fixtures will cost an additional $114,000. (Estimated 22 year payback.)
• Using rainwater to irrigate nearly 1/3 of the mall. (Keeping the mall green by going green.)
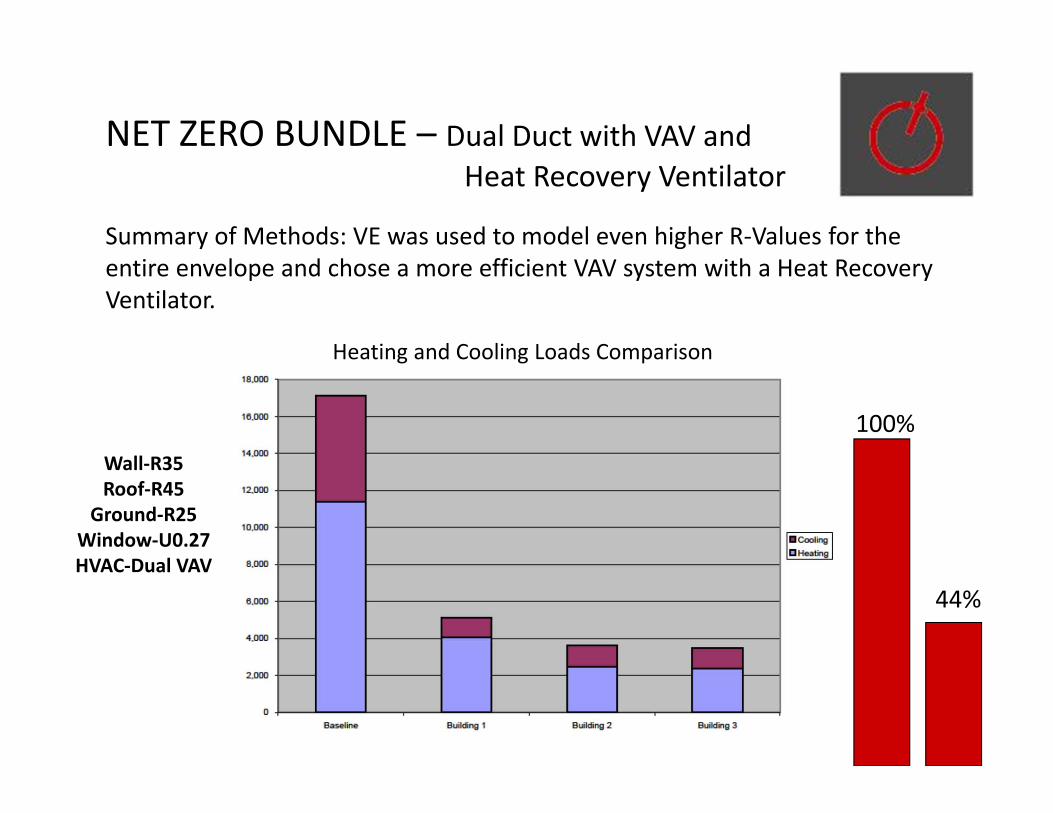
NET ZERO BUNDLE – Dual Duct with VAV and Heat Recovery Ventilator
Summary of Methods: VE was used to model even higher R‐Values for the entire envelope and chose a more efficient VAV system with a Heat Recovery Ventilator.
100%
44%
Wall‐R35Roof‐R45
Ground‐R25Window‐U0.27HVAC‐Dual VAV
Heating and Cooling Loads Comparison
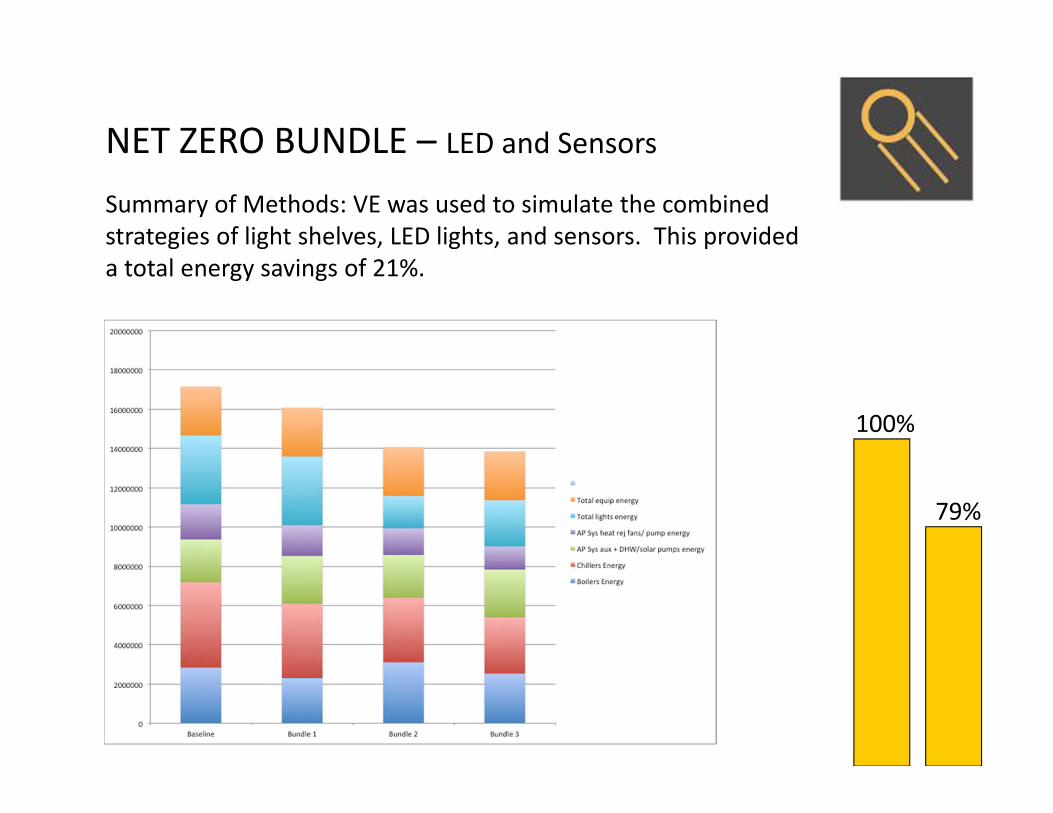
NET ZERO BUNDLE – LED and Sensors
Summary of Methods: VE was used to simulate the combined strategies of light shelves, LED lights, and sensors. This provided a total energy savings of 21%.
100%
79%
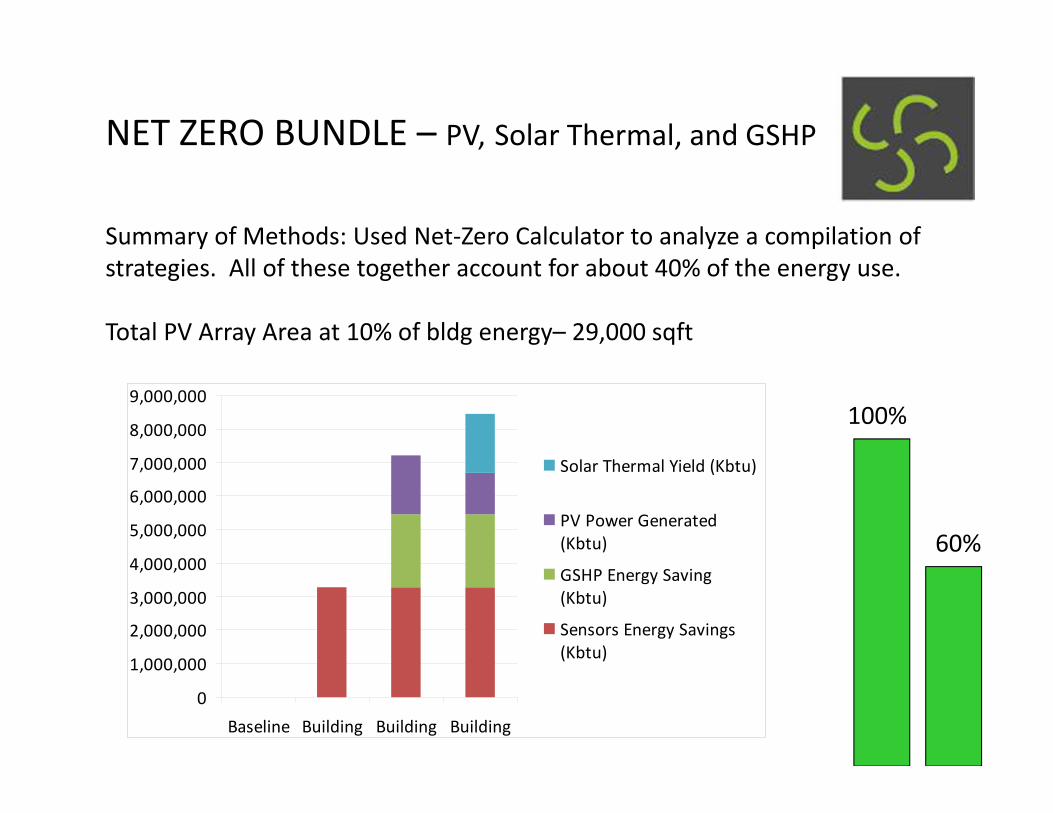
NET ZERO BUNDLE – PV, Solar Thermal, and GSHP
Summary of Methods: Used Net‐Zero Calculator to analyze a compilation of strategies. All of these together account for about 40% of the energy use.
Total PV Array Area at 10% of bldg energy– 29,000 sqft
100%
60%
0
1,000,000
2,000,000
3,000,000
4,000,000
5,000,000
6,000,000
7,000,000
8,000,000
9,000,000
Baseline Building Building Building
Solar Thermal Yield (Kbtu)
PV Power Generated(Kbtu)
GSHP Energy Saving(Kbtu)
Sensors Energy Savings(Kbtu)
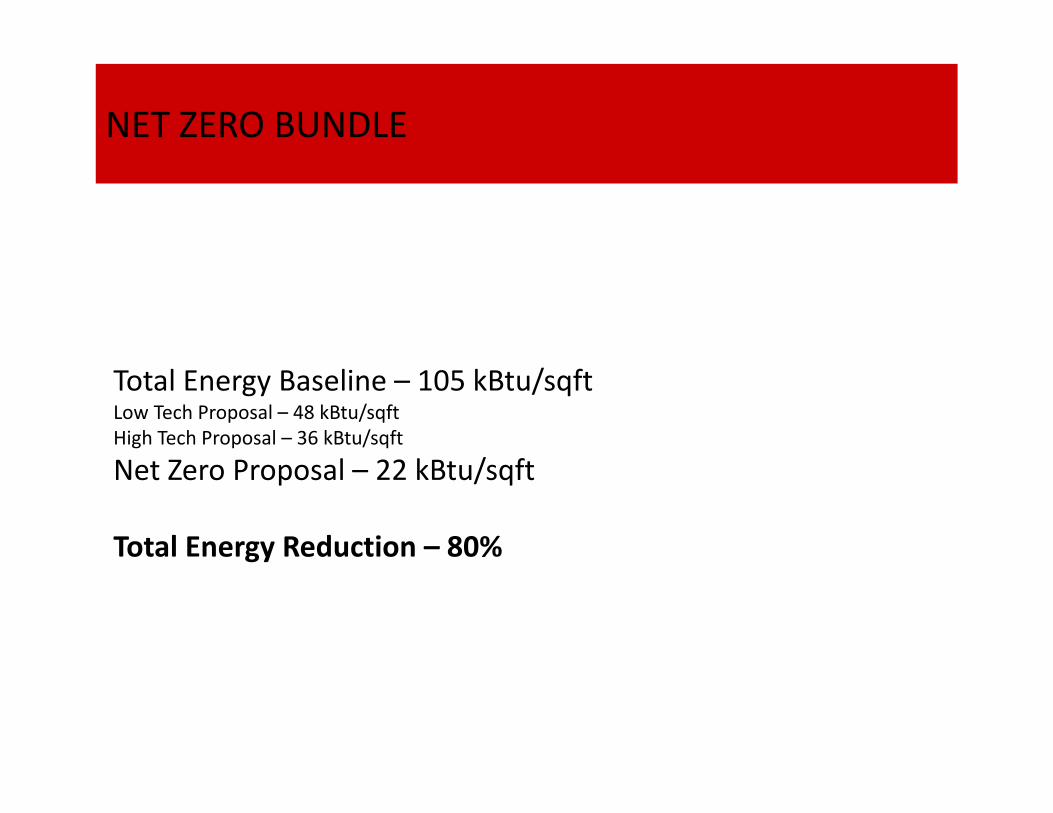
NET ZERO BUNDLE
Total Energy Baseline – 105 kBtu/sqftLow Tech Proposal – 48 kBtu/sqftHigh Tech Proposal – 36 kBtu/sqft
Net Zero Proposal – 22 kBtu/sqft
Total Energy Reduction – 80%

COMPARISON GRAPH

CONCLUSIONS• Low Flow fixtures are very effective in reducing water use (30%) with out any lifestyle changes.
• The greatest single reduction in energy was increasing the R value in the walls and roof. Roughly 50% decrease.
• LED lighting, combined with sensors, can yield an 18% decrease in total energy.
•Greatest impact from a renewable energy source was the Ground Source Heat Pump; there is a decrease in 85% of heating load.
RECOMMENDATIONS – Ideal Methods from All CategoriesSuggested options for greatest reduction on energy use.
• Install low flow fixtures
•Improve wall and roof insulation
• Install LED lights and occupancy sensors
•Ground Source Heat Pumps are the most effective renewable system
NEXT STEPS
• Look into using waterless fixtures to further reduce water use, investigate structural load capacity of structure to determine green roof strategy.
• Explore innovative HVAC strategies: chilled beams, radiant floor system, under‐floor plenum.
• Research LED lights and desired color of light.
•Look into broadening the scope, the cost of sustainable energy methods goes down at a community scale.

APPENDIX
• Low Flow Fixtures
• Green Roof
• Renewable Energy
• Biomass Information
• Bibliography
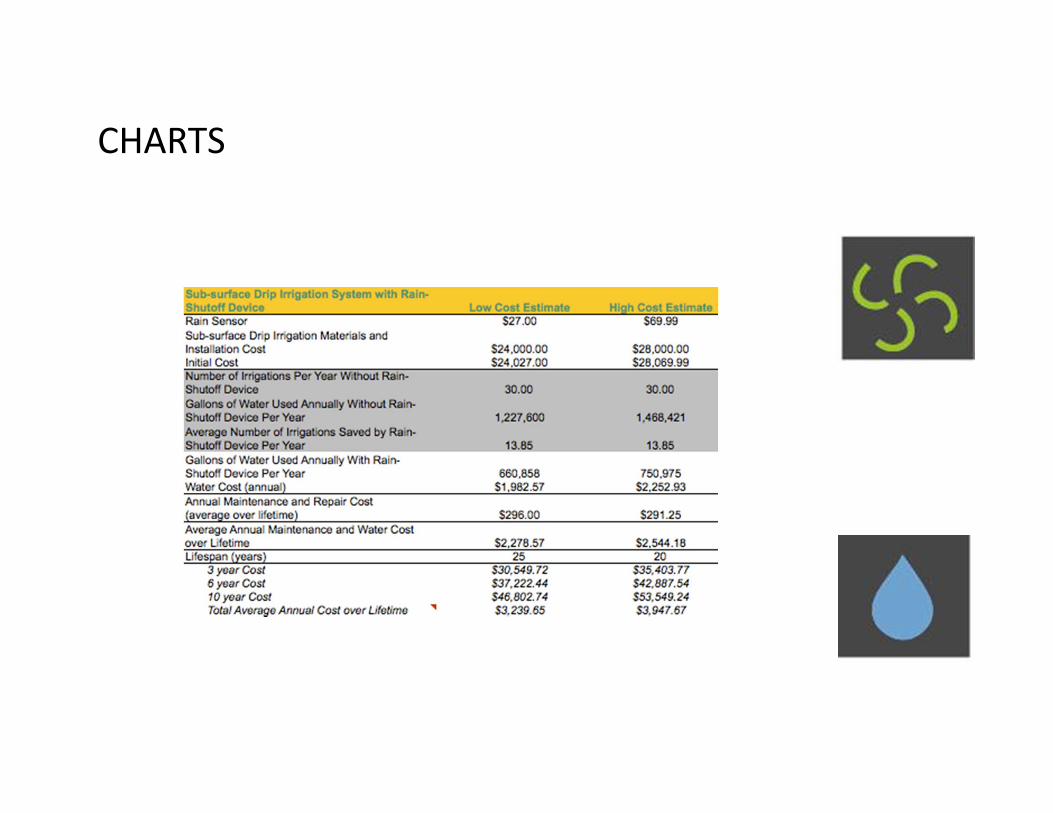
CHARTS
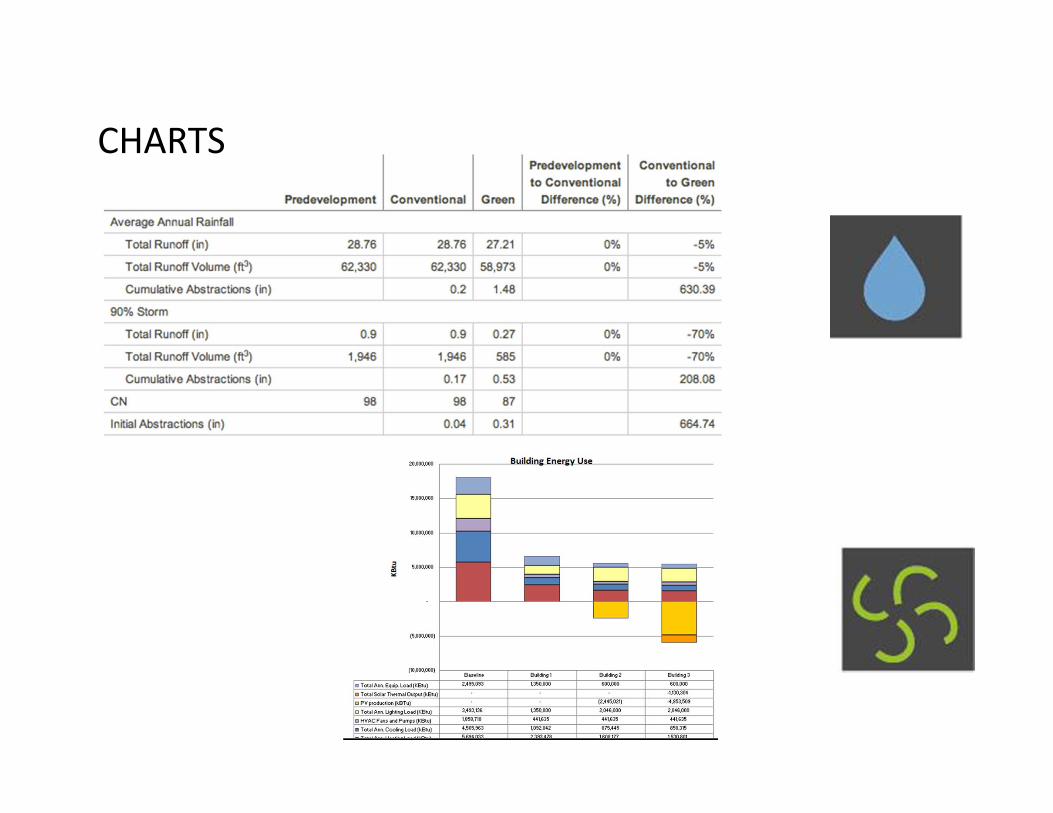
CHARTS
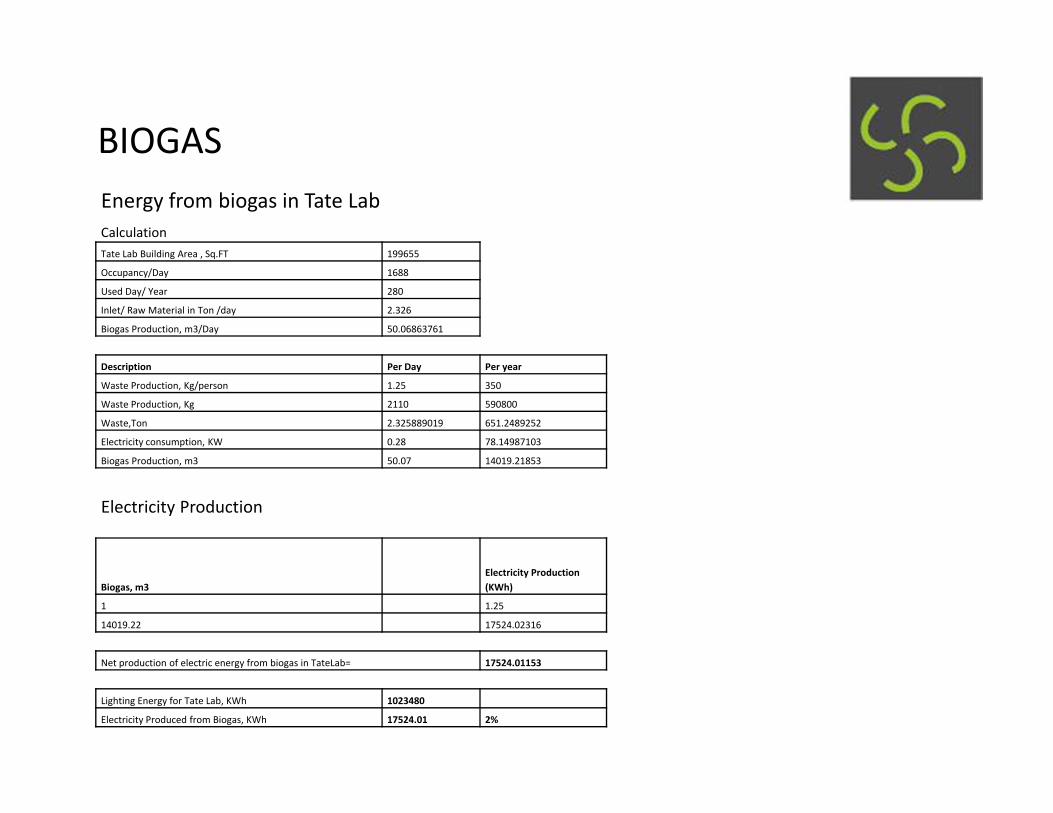
BIOGASEnergy from biogas in Tate LabCalculationTate Lab Building Area , Sq.FT 199655
Occupancy/Day 1688
Used Day/ Year 280
Inlet/ Raw Material in Ton /day 2.326
Biogas Production, m3/Day 50.06863761
Description Per Day Per year
Waste Production, Kg/person 1.25 350
Waste Production, Kg 2110 590800
Waste,Ton 2.325889019 651.2489252
Electricity consumption, KW 0.28 78.14987103
Biogas Production, m3 50.07 14019.21853
Electricity Production
Biogas, m3Electricity Production (KWh)
1 1.25
14019.22 17524.02316
Net production of electric energy from biogas in TateLab= 17524.01153
Lighting Energy for Tate Lab, KWh 1023480
Electricity Produced from Biogas, KWh 17524.01 2%

BIBLIOGRAPHY
http://www.nationmaster.com/graph/env_mun_was_gen‐environment‐municipal‐waste‐generationhttp://www.nss.org/settlement/moon/library/LB2‐611‐WasteProcessing.pdfwww.zorg‐biogas.comwww.paceproject.nethttp://large.stanford.edu/courses/2010/ph240/cook2/