Embed Size (px)
Citation preview
…Message Box ( Arial, Font size 18 Bold) 1
Tata Power Financial Results
Q1 FY22
6th August 2021
…Message Box ( Arial, Font size 18 Bold) 2
Disclaimer
This document does not constitute or form part of and should not be construed as a prospectus, offering circular or offering memorandum or an offer to sell or issue or the solicitation of an offer to buy or
acquire securities of the Company or any of its subsidiaries or affiliates in any jurisdiction or as an inducement to enter into investment activity. No part of this document, nor the fact of its distribution,
should form the basis of, or be relied on in connection with, any contract or commitment or investment decision whatsoever. This document is not financial, legal, tax or other product advice.
This presentation should not be considered as a recommendation to any investor to subscribe for, or purchase, any securities of the Company and should not be used as a basis for any investment
decision. This document has been prepared by the Company based on information available to them for selected recipients for information purposes only and does not constitute a recommendation
regarding any securities of the Company. The information contained herein has not been independently verified. No representation, warranty or undertaking, express or implied, is made as to, and no
reliance should be placed on, the fairness, accuracy, completeness or correctness of the information or the opinions contained herein. None of the Company or any of its affiliates, advisors or
representatives shall have any liability whatsoever (in negligence or otherwise) for any loss howsoever arising from any use of this document or its contents or otherwise arising in connection with the
document. Furthermore, no person is authorized to give any information or make any representation, which is not contained in, or is inconsistent with, this presentation. Any such extraneous or
inconsistent information or representation, if given or made, should not be relied upon as having been authorized by or on behalf of the Company.
The Company may alter, modify or otherwise change in any manner the contents of this presentation, without obligation to notify any person of such revision or changes. This document is given solely for
your information and for your use and may not be retained by you nor may this document, or any portion thereof, be shared, copied, reproduced or redistributed to any other person in any manner. The
distribution of this presentation in certain jurisdictions may be restricted by law. Accordingly, any person in possession of this presentation should inform themselves about and observe any such
restrictions. By accessing this presentation you acknowledge that you will be solely responsible for your own assessment of the market and the market position of the Company and that you will conduct
your own analysis and be solely responsible for forming your own view of the potential future performance of the business of the Company.
The statements contained in this document speak only as at the date as of which they are made, and the Company expressly disclaims any obligation or undertaking to supplement, amend or disseminate
any updates or revisions to any statements contained herein to reflect any change in events, conditions or circumstances on which any such statements are based. By preparing this presentation, none of
the Company, its management, and their respective advisers undertakes any obligation to provide the recipient with access to any additional information or to update this presentation or any additional
information or to correct any inaccuracies in any such information which may become apparent.
This document has not been and will not be reviewed or approved by a regulatory authority in India or by any stock exchange in India. This document and its contents should not be forwarded, delivered or
transmitted in any manner to any person other than its intended recipient and should not be reproduced in any manner whatsoever.
This presentation is not an offer of securities for sale in the United States. Securities may not be offered or sold in the United States absent registration, or an exemption from registration, under the U.S.
Securities Act of 1933, as amended. Any public offering in the United States may be made only by means of an offering circular that may be obtained from the Company and that will contain detailed
information about the Company and management, as well as financial statements.
This presentation contains forward-looking statements based on the currently held beliefs and assumptions of the management of the Company, which are expressed in good faith and, in their opinion,
reasonable. Forward-looking statements involve known and unknown risks, uncertainties and other factors, which may cause the actual results, financial condition, performance, or achievements of the
Company or industry results, to differ materially from the results, financial condition, performance or achievements expressed or implied by such forward-looking statements. Actual results may differ
materially from these forward-looking statements due to a number of factors, including future changes or developments in the Company’s business, its competitive environment, information, technology
and political, economic, legal and social conditions in India. Given these risks, uncertainties and other factors, recipients of this document are cautioned not to place undue reliance on these forward-
looking statements. In addition to statements which are forward looking by reason of context, the words ‘anticipates’, ‘believes’, ‘estimates’, ‘may’, ‘expects’, ‘plans’, ‘intends’, ‘predicts’, or ‘continue’ and
similar expressions identify forward looking statements.
…Message Box ( Arial, Font size 18 Bold)
Q1 FY22 Business Highlights
…Message Box ( Arial, Font size 18 Bold) 4
Q1 FY 22 Highlights
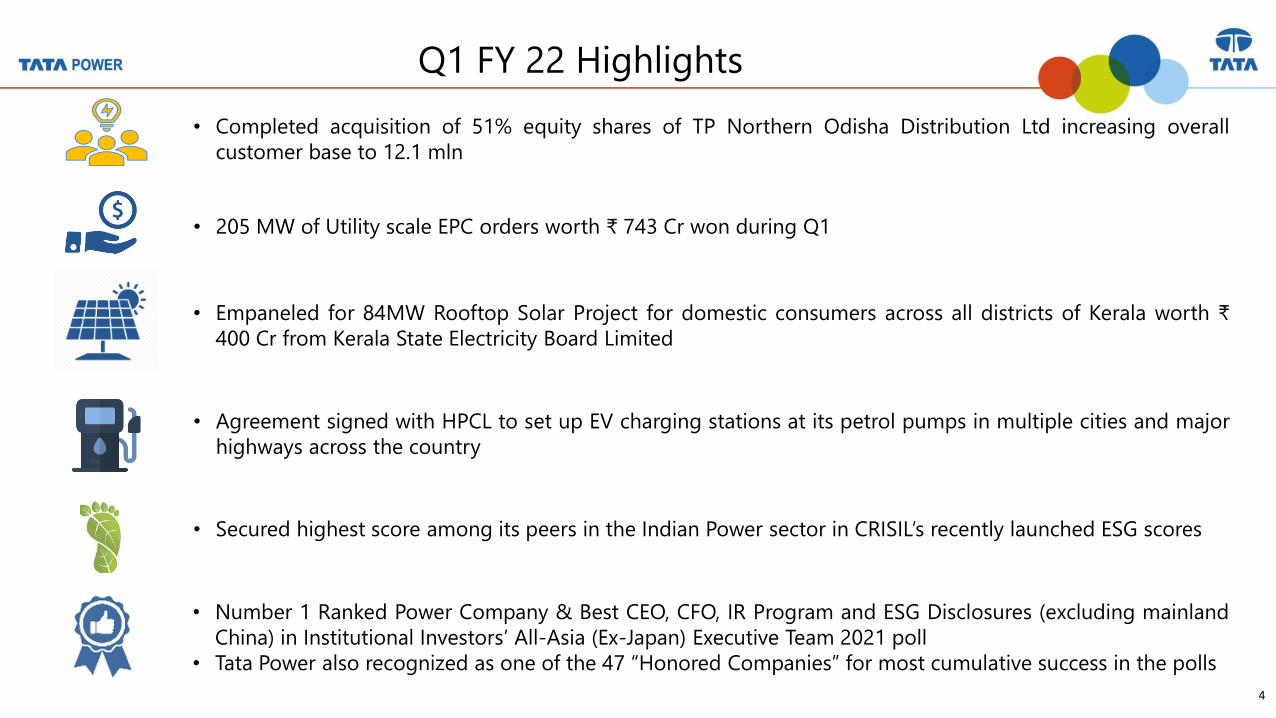
• Number 1 Ranked Power Company & Best CEO, CFO, IR Program and ESG Disclosures (excluding mainland
China) in Institutional Investors’ All-Asia (Ex-Japan) Executive Team 2021 poll
• Tata Power also recognized as one of the 47 “Honored Companies” for most cumulative success in the polls
• 205 MW of Utility scale EPC orders worth ₹ 743 Cr won during Q1
• Empaneled for 84MW Rooftop Solar Project for domestic consumers across all districts of Kerala worth ₹
400 Cr from Kerala State Electricity Board Limited
• Agreement signed with HPCL to set up EV charging stations at its petrol pumps in multiple cities and major
highways across the country
• Secured highest score among its peers in the Indian Power sector in CRISIL’s recently launched ESG scores
• Completed acquisition of 51% equity shares of TP Northern Odisha Distribution Ltd increasing overall
customer base to 12.1 mln
…Message Box ( Arial, Font size 18 Bold) 5
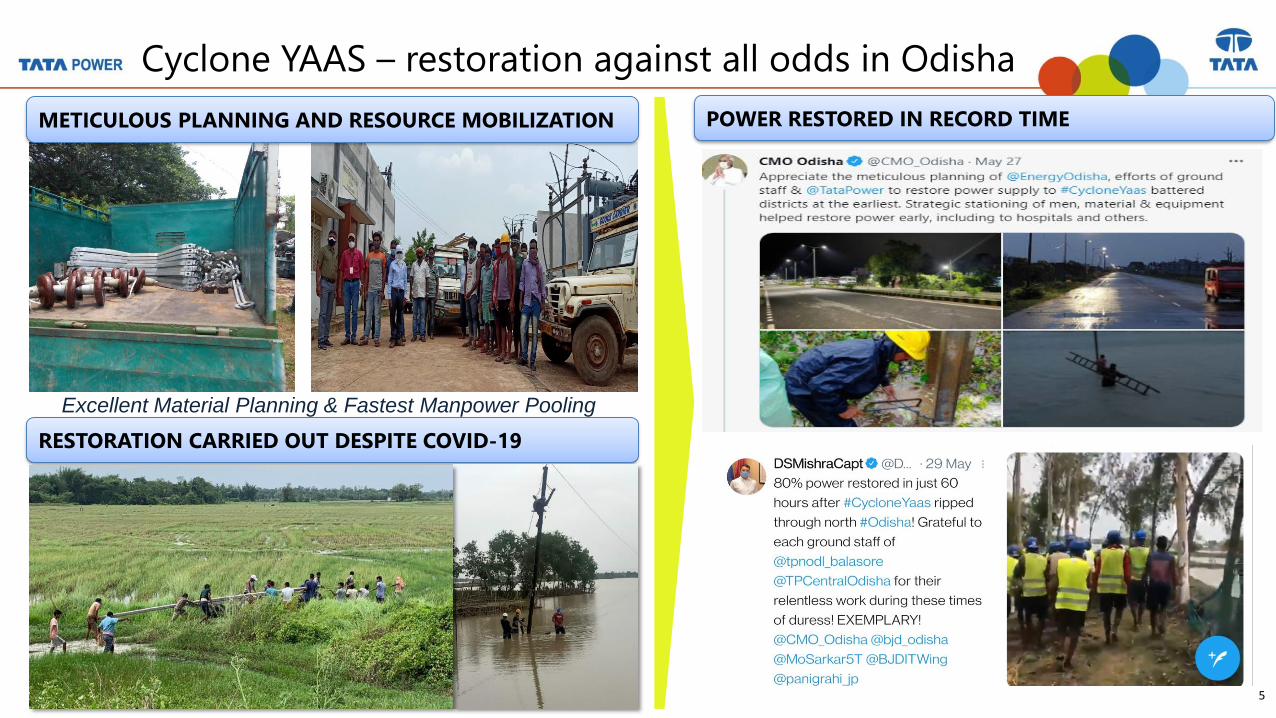
Cyclone YAAS – restoration against all odds in Odisha
RESTORATION CARRIED OUT DESPITE COVID-19
METICULOUS PLANNING AND RESOURCE MOBILIZATION
Excellent Material Planning & Fastest Manpower Pooling
POWER RESTORED IN RECORD TIME
…Message Box ( Arial, Font size 18 Bold) 6
MSME financing with Bank of Baroda & no EMI for HDFC Bank cardholders
₹ 400 Cr KSEB contract won in July
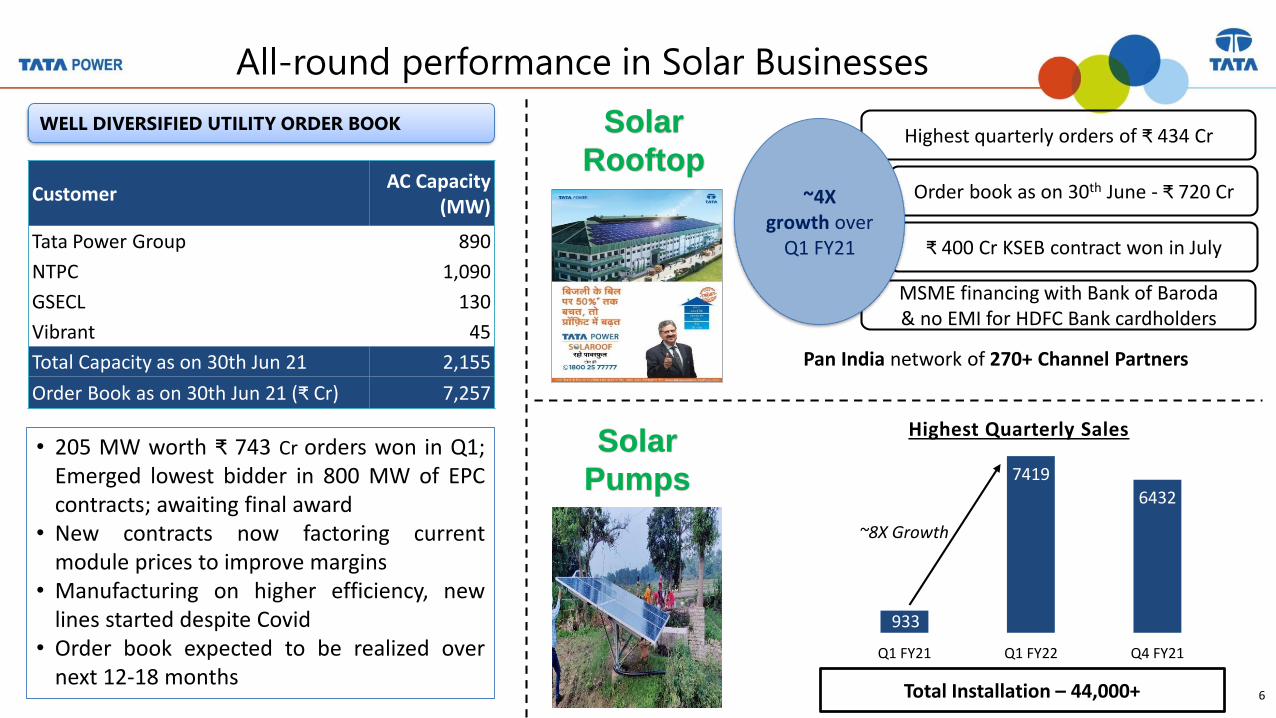
All-round performance in Solar Businesses
WELL DIVERSIFIED UTILITY ORDER BOOK
• 205 MW worth ₹ 743 Cr orders won in Q1;Emerged lowest bidder in 800 MW of EPCcontracts; awaiting final award
• New contracts now factoring currentmodule prices to improve margins
• Manufacturing on higher efficiency, newlines started despite Covid
• Order book expected to be realized overnext 12-18 months
CustomerAC Capacity
(MW)
Tata Power Group 890
NTPC 1,090
GSECL 130
Vibrant 45
Total Capacity as on 30th Jun 21 2,155
Order Book as on 30th Jun 21 (₹ Cr) 7,257
Solar
Rooftop
Solar
Pumps
Pan India network of 270+ Channel Partners
Highest quarterly orders of ₹ 434 Cr
Order book as on 30th June - ₹ 720 Cr~4Xgrowth over
Q1 FY21
Total Installation – 44,000+
933
7419
6432
Q1 FY21 Q1 FY22 Q4 FY21
Highest Quarterly Sales
~8X Growth
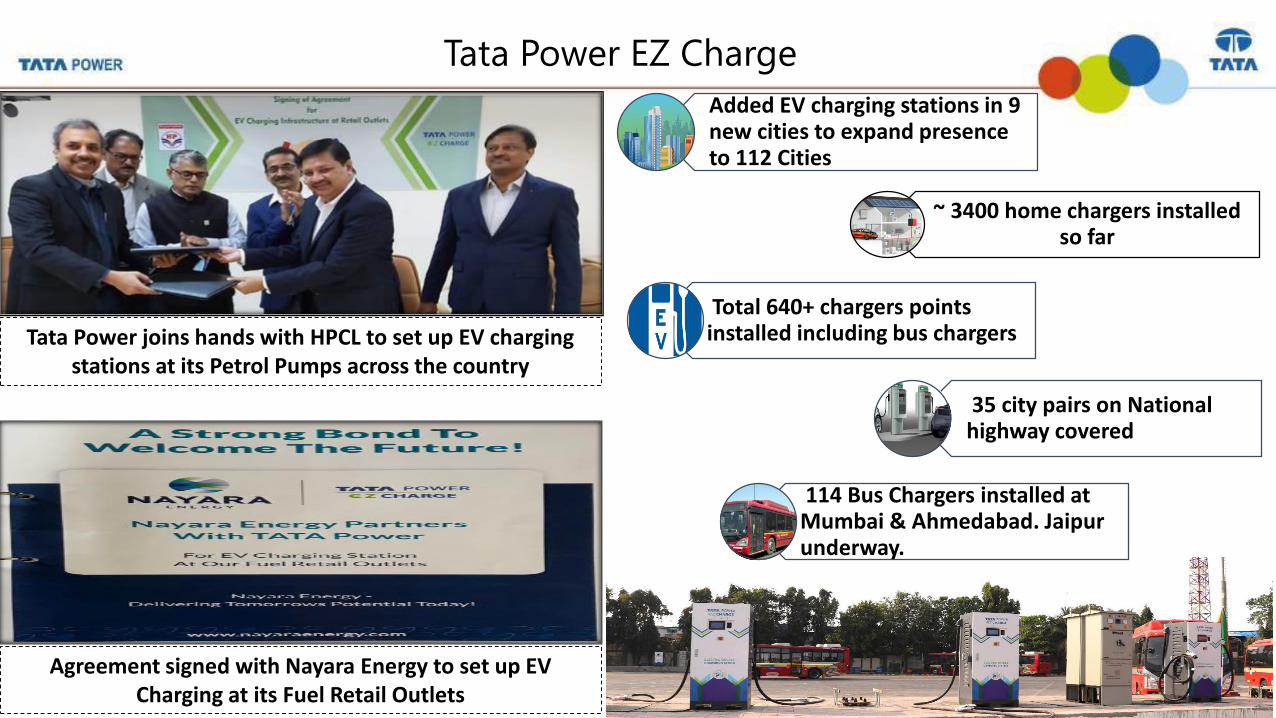
Tata Power EZ Charge
Agreement signed with Nayara Energy to set up EV Charging at its Fuel Retail Outlets
Tata Power joins hands with HPCL to set up EV charging stations at its Petrol Pumps across the country
Added EV charging stations in 9 new cities to expand presence to 112 Cities
~ 3400 home chargers installed so far
Total 640+ chargers points installed including bus chargers
35 city pairs on National highway covered
114 Bus Chargers installed at Mumbai & Ahmedabad. Jaipur underway.
…Message Box ( Arial, Font size 18 Bold)
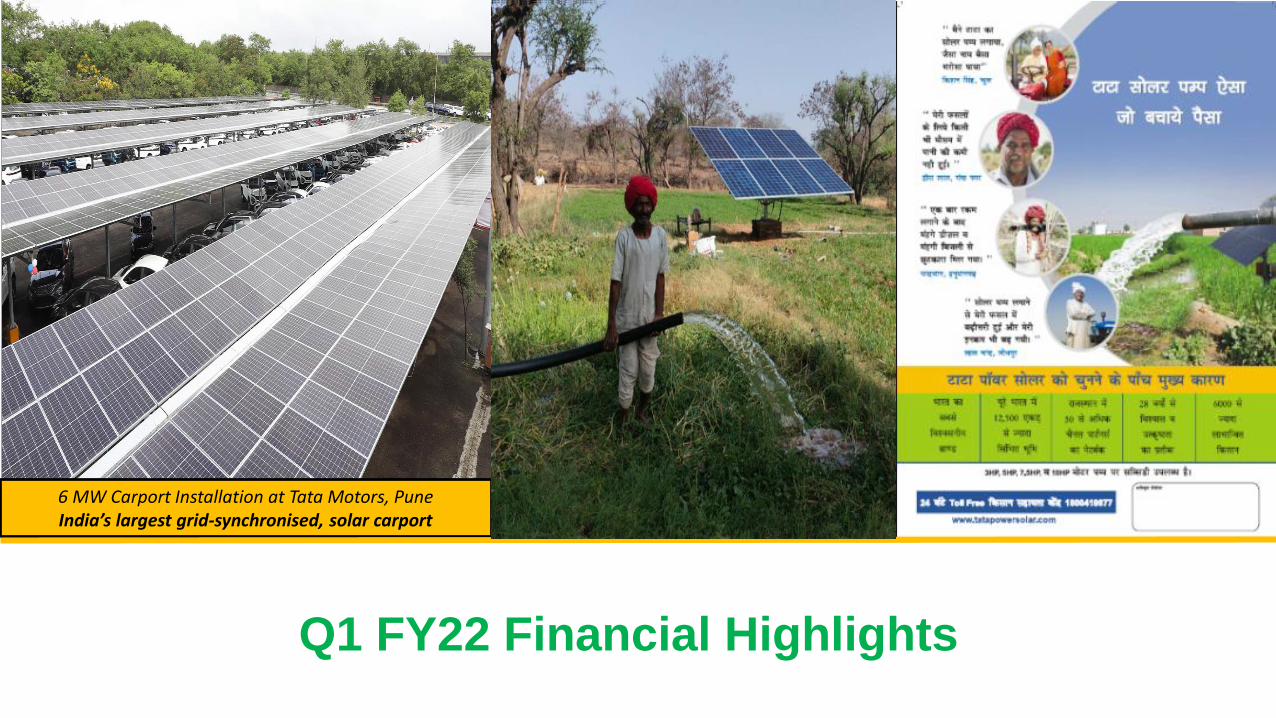
Q1 FY22 Financial Highlights
6 MW Carport Installation at Tata Motors, PuneIndia’s largest grid-synchronised, solar carport
…Message Box ( Arial, Font size 18 Bold) 9
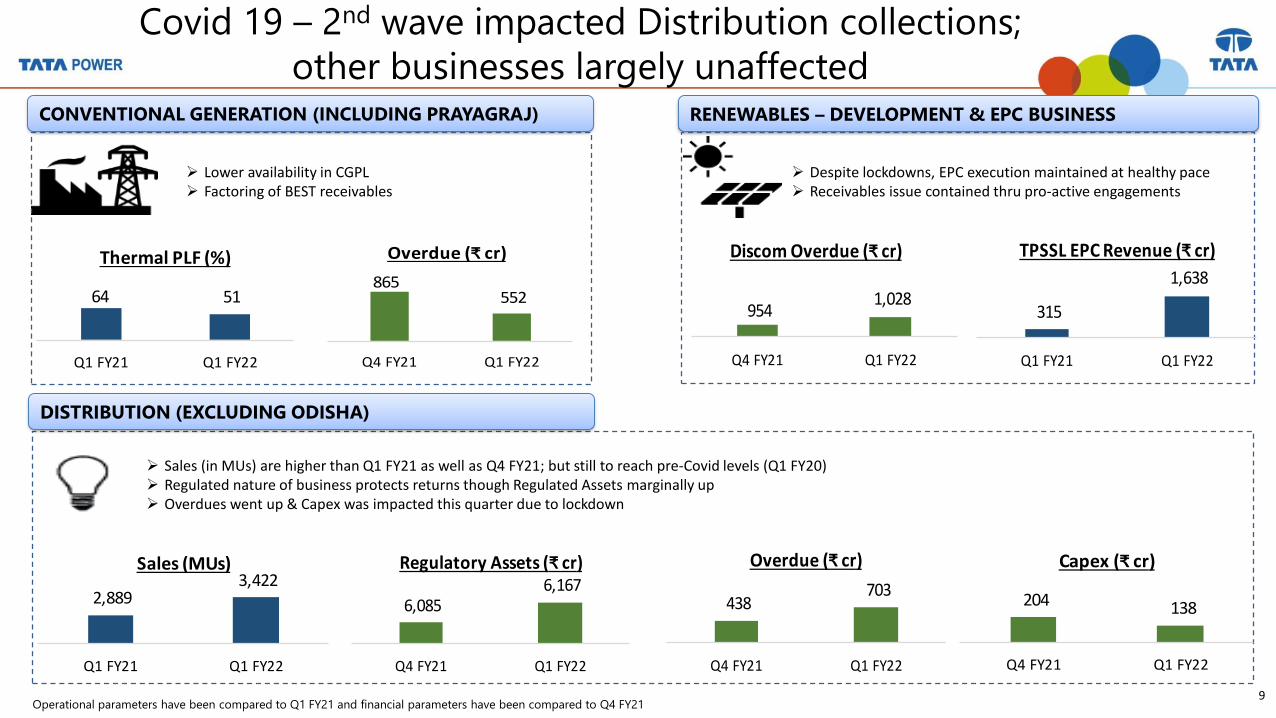
Covid 19 – 2nd wave impacted Distribution collections;
other businesses largely unaffectedRENEWABLES – DEVELOPMENT & EPC BUSINESS
➢ Lower availability in CGPL➢ Factoring of BEST receivables
➢ Despite lockdowns, EPC execution maintained at healthy pace➢ Receivables issue contained thru pro-active engagements
CONVENTIONAL GENERATION (INCLUDING PRAYAGRAJ)
DISTRIBUTION (EXCLUDING ODISHA)
Operational parameters have been compared to Q1 FY21 and financial parameters have been compared to Q4 FY21
➢ Sales (in MUs) are higher than Q1 FY21 as well as Q4 FY21; but still to reach pre-Covid levels (Q1 FY20)➢ Regulated nature of business protects returns though Regulated Assets marginally up➢ Overdues went up & Capex was impacted this quarter due to lockdown
64 51
Q1 FY21 Q1 FY22
Thermal PLF (%)865
552
Q4 FY21 Q1 FY22
Overdue (₹ cr)
315
1,638
Q1 FY21 Q1 FY22
TPSSL EPC Revenue (₹ cr)
954 1,028
Q4 FY21 Q1 FY22
Discom Overdue (₹ cr)
2,889 3,422
Q1 FY21 Q1 FY22
Sales (MUs)
438 703
Q4 FY21 Q1 FY22
Overdue (₹ cr)
6,085 6,167
Q4 FY21 Q1 FY22
Regulatory Assets (₹ cr)
204 138
Q4 FY21 Q1 FY22
Capex (₹ cr)
…Message Box ( Arial, Font size 18 Bold) 10
Q1 FY22 Financial Highlights
REPORTED EBITDA Underlying EBITDA (Including Share of JVs & Associated)
Reported PAT (before Discontinued and exceptional items)
Receivables Net External Debt
CGPL & Coal Cluster – Net Profit Renewables EBITDA
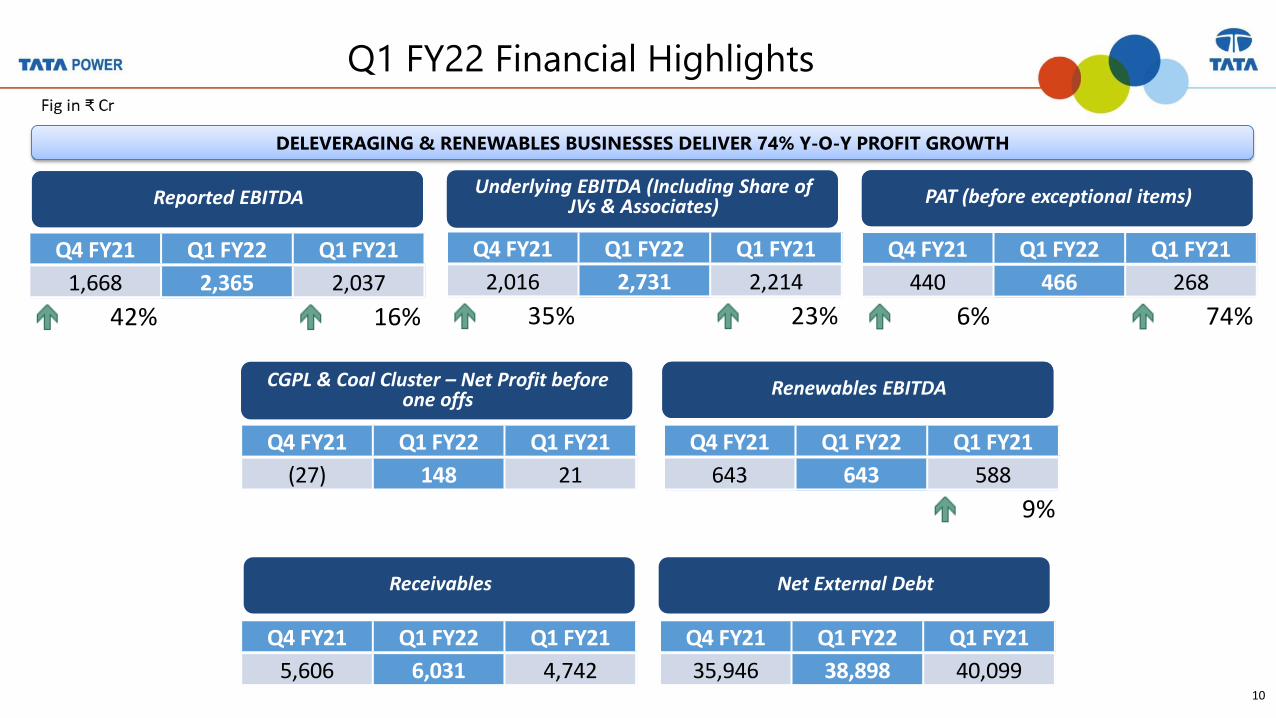
DELEVERAGING & RENEWABLES BUSINESSES DELIVER 74% Y-O-Y PROFIT GROWTH
Reported EBITDAUnderlying EBITDA (Including Share of
JVs & Associates) PAT (before exceptional items)
CGPL & Coal Cluster – Net Profit before one offs
Renewables EBITDA
Q4 FY21 Q1 FY22 Q1 FY21
1,668 2,365 2,037
42% 16%
Q4 FY21 Q1 FY22 Q1 FY21
2,016 2,731 2,214
35% 23%
Q4 FY21 Q1 FY22 Q1 FY21
440 466 268
6% 74%
Q4 FY21 Q1 FY22 Q1 FY21
(27) 148 21
Q4 FY21 Q1 FY22 Q1 FY21
643 643 588
9%
Q4 FY21 Q1 FY22 Q1 FY21
35,946 38,898 40,099
Q4 FY21 Q1 FY22 Q1 FY21
5,606 6,031 4,742
…Message Box ( Arial, Font size 18 Bold) 11
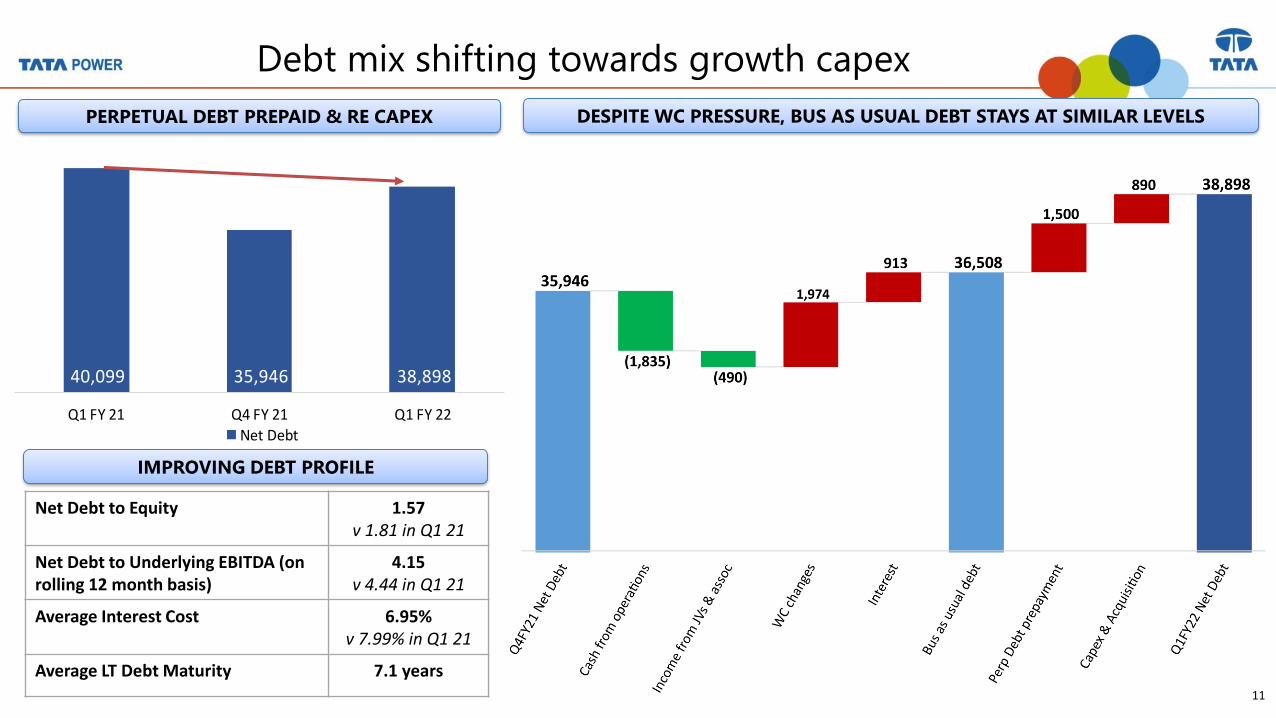
40,099 35,946 38,898
Q1 FY 21 Q4 FY 21 Q1 FY 22
Net Debt
Debt mix shifting towards growth capex
IMPROVING DEBT PROFILE
Net Debt to Equity 1.57v 1.81 in Q1 21
Net Debt to Underlying EBITDA (on rolling 12 month basis)
4.15v 4.44 in Q1 21
Average Interest Cost 6.95%v 7.99% in Q1 21
Average LT Debt Maturity 7.1 years
PERPETUAL DEBT PREPAID & RE CAPEX DESPITE WC PRESSURE, BUS AS USUAL DEBT STAYS AT SIMILAR LEVELS
…Message Box ( Arial, Font size 18 Bold) 12
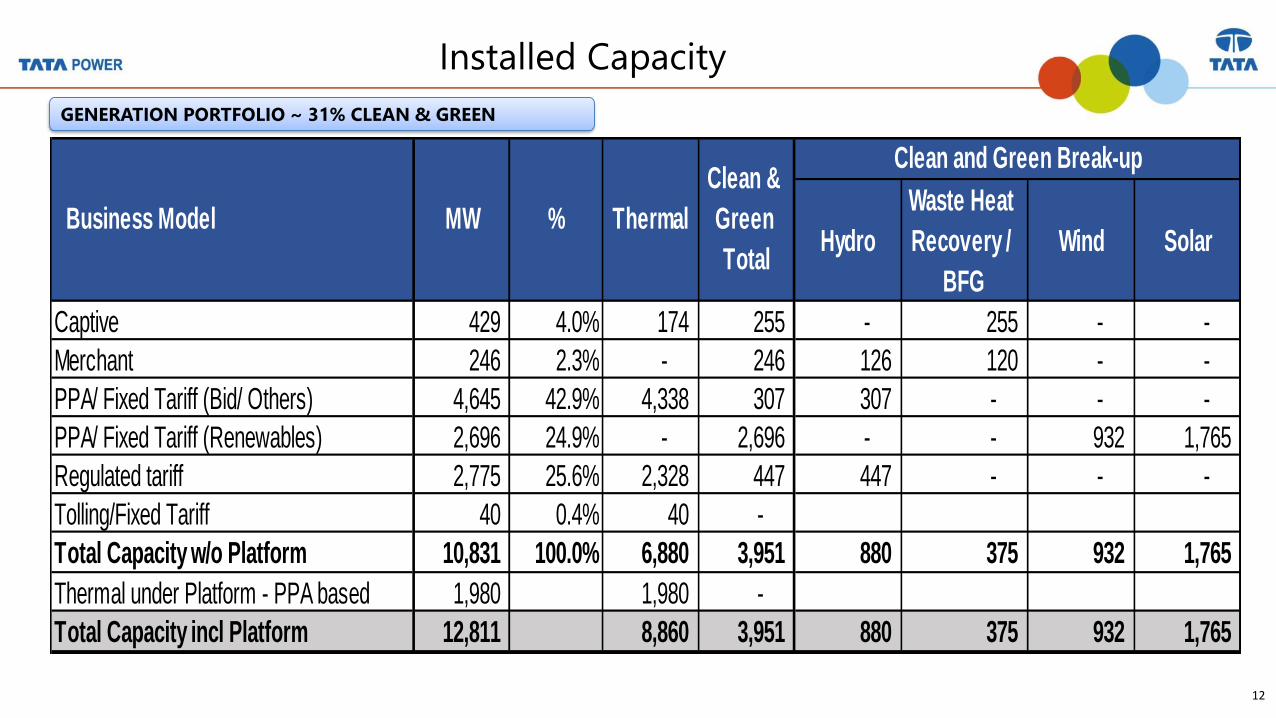
Installed Capacity
GENERATION PORTFOLIO ~ 31% CLEAN & GREEN
Hydro
Waste Heat
Recovery /
BFG
Wind Solar
Captive 429 4.0% 174 255 - 255 - -
Merchant 246 2.3% - 246 126 120 - -
PPA/ Fixed Tariff (Bid/ Others) 4,645 42.9% 4,338 307 307 - - -
PPA/ Fixed Tariff (Renewables) 2,696 24.9% - 2,696 - - 932 1,765
Regulated tariff 2,775 25.6% 2,328 447 447 - - -
Tolling/Fixed Tariff 40 0.4% 40 -
Total Capacity w/o Platform 10,831 100.0% 6,880 3,951 880 375 932 1,765
Thermal under Platform - PPA based 1,980 1,980 -
Total Capacity incl Platform 12,811 8,860 3,951 880 375 932 1,765
Business Model Thermal
Clean &
Green
Total
Clean and Green Break-up
MW %
…Message Box ( Arial, Font size 18 Bold) 13
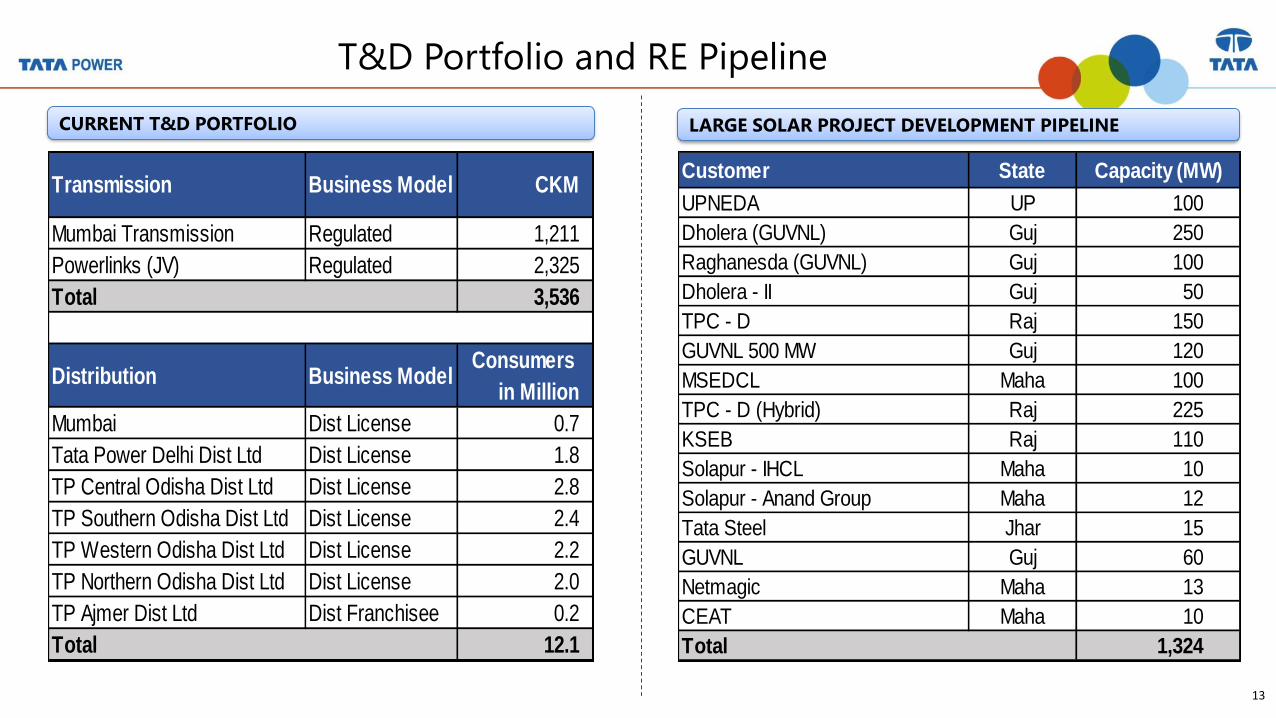
T&D Portfolio and RE Pipeline
CURRENT T&D PORTFOLIO LARGE SOLAR PROJECT DEVELOPMENT PIPELINE
Customer State Capacity (MW)
UPNEDA UP 100
Dholera (GUVNL) Guj 250
Raghanesda (GUVNL) Guj 100
Dholera - II Guj 50
TPC - D Raj 150
GUVNL 500 MW Guj 120
MSEDCL Maha 100
TPC - D (Hybrid) Raj 225
KSEB Raj 110
Solapur - IHCL Maha 10
Solapur - Anand Group Maha 12
Tata Steel Jhar 15
GUVNL Guj 60
Netmagic Maha 13
CEAT Maha 10
1,324 Total
Transmission Business Model CKM
Mumbai Transmission Regulated 1,211
Powerlinks (JV) Regulated 2,325
3,536
Distribution Business ModelConsumers
in Million
Mumbai Dist License 0.7
Tata Power Delhi Dist Ltd Dist License 1.8
TP Central Odisha Dist Ltd Dist License 2.8
TP Southern Odisha Dist Ltd Dist License 2.4
TP Western Odisha Dist Ltd Dist License 2.2
TP Northern Odisha Dist Ltd Dist License 2.0
TP Ajmer Dist Ltd Dist Franchisee 0.2
12.1Total
Total
…Message Box ( Arial, Font size 18 Bold) 14
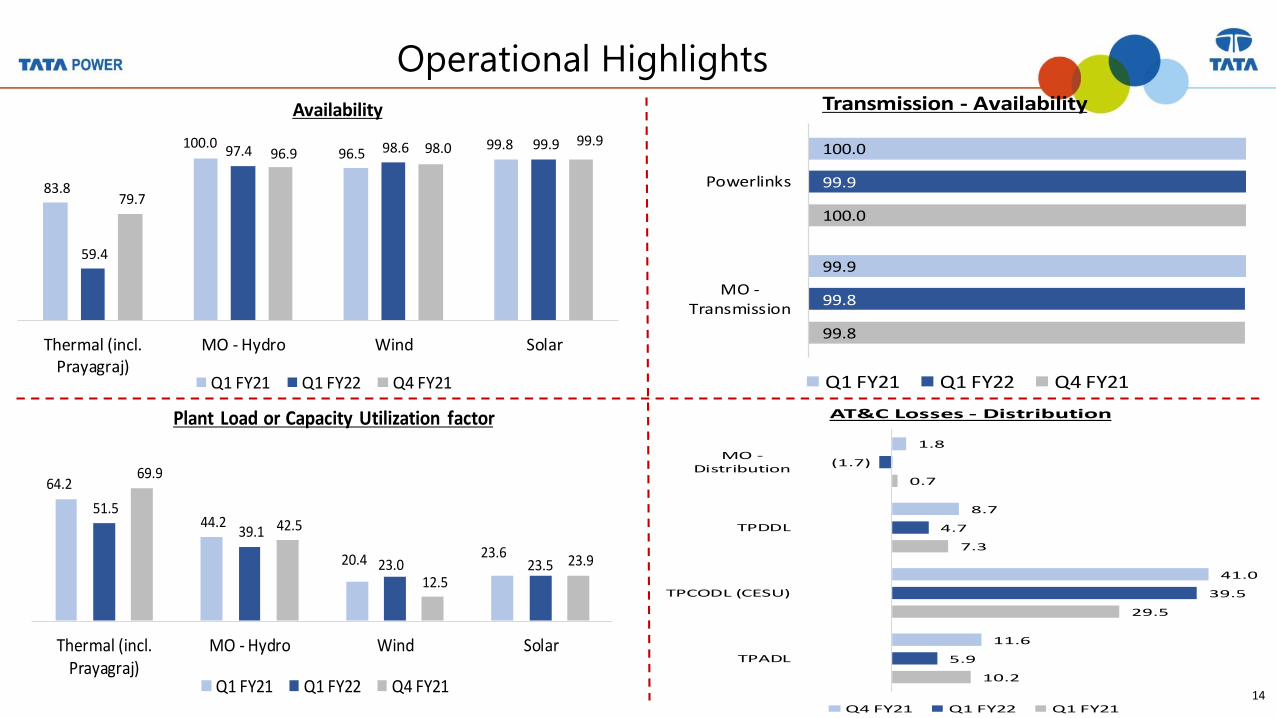
Operational Highlights
83.8
100.0 96.5
99.8
59.4
97.4 98.6 99.9
79.7
96.9 98.0 99.9
Thermal (incl.Prayagraj)
MO - Hydro Wind Solar
Availability
Q1 FY21 Q1 FY22 Q4 FY21
64.2
44.2
20.4 23.6
51.5
39.1
23.0 23.5
69.9
42.5
12.5
23.9
Thermal (incl.Prayagraj)
MO - Hydro Wind Solar
Plant Load or Capacity Utilization factor
Q1 FY21 Q1 FY22 Q4 FY21
99.8
100.0
99.8
99.9
99.9
100.0
MO -Transmission
Powerlinks
Transmission - Availability
Q1 FY21 Q1 FY22 Q4 FY21
10.2
29.5
7.3
0.7
5.9
39.5
4.7
(1.7)
11.6
41.0
8.7
1.8
TPADL
TPCODL (CESU)
TPDDL
MO -Distribution
AT&C Losses - Distribution
Q4 FY21 Q1 FY22 Q1 FY21
…Message Box ( Arial, Font size 18 Bold) 15
Financial Results – Q1 FY22
…Message Box ( Arial, Font size 18 Bold) 16
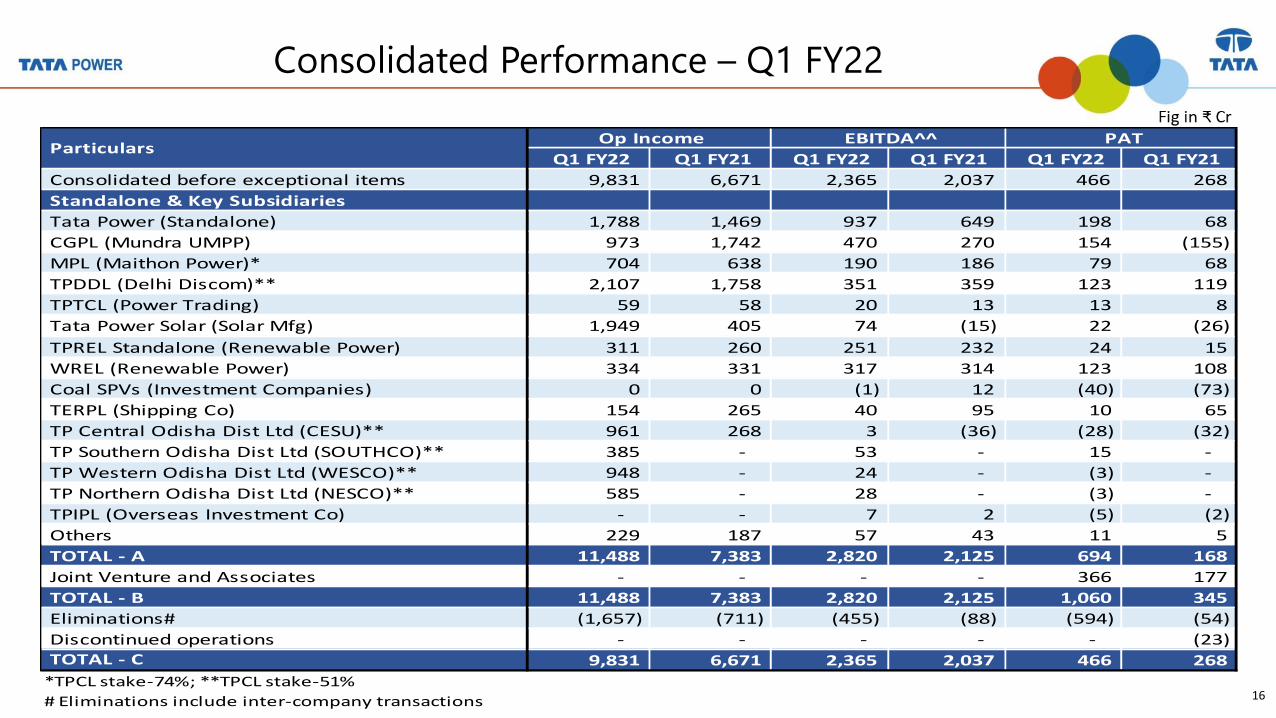
Consolidated Performance – Q1 FY22
Q1 FY22 Q1 FY21 Q1 FY22 Q1 FY21 Q1 FY22 Q1 FY21
Consolidated before exceptional items 9,831 6,671 2,365 2,037 466 268
Standalone & Key Subsidiaries
Tata Power (Standalone) 1,788 1,469 937 649 198 68
CGPL (Mundra UMPP) 973 1,742 470 270 154 (155)
MPL (Maithon Power)* 704 638 190 186 79 68
TPDDL (Delhi Discom)** 2,107 1,758 351 359 123 119
TPTCL (Power Trading) 59 58 20 13 13 8
Tata Power Solar (Solar Mfg) 1,949 405 74 (15) 22 (26)
TPREL Standalone (Renewable Power) 311 260 251 232 24 15
WREL (Renewable Power) 334 331 317 314 123 108
Coal SPVs (Investment Companies) 0 0 (1) 12 (40) (73)
TERPL (Shipping Co) 154 265 40 95 10 65
TP Central Odisha Dist Ltd (CESU)** 961 268 3 (36) (28) (32)
TP Southern Odisha Dist Ltd (SOUTHCO)** 385 - 53 - 15 -
TP Western Odisha Dist Ltd (WESCO)** 948 - 24 - (3) -
TP Northern Odisha Dist Ltd (NESCO)** 585 - 28 - (3) -
TPIPL (Overseas Investment Co) - - 7 2 (5) (2)
Others 229 187 57 43 11 5
TOTAL - A 11,488 7,383 2,820 2,125 694 168
Joint Venture and Associates - - - - 366 177
TOTAL - B 11,488 7,383 2,820 2,125 1,060 345
Eliminations# (1,657) (711) (455) (88) (594) (54)
Discontinued operations - - - - - (23) TOTAL - C 9,831 6,671 2,365 2,037 466 268
*TPCL stake-74%; **TPCL stake-51%
# Eliminations include inter-company transactions
Particulars Op Income EBITDA^^ PAT
…Message Box ( Arial, Font size 18 Bold) 17
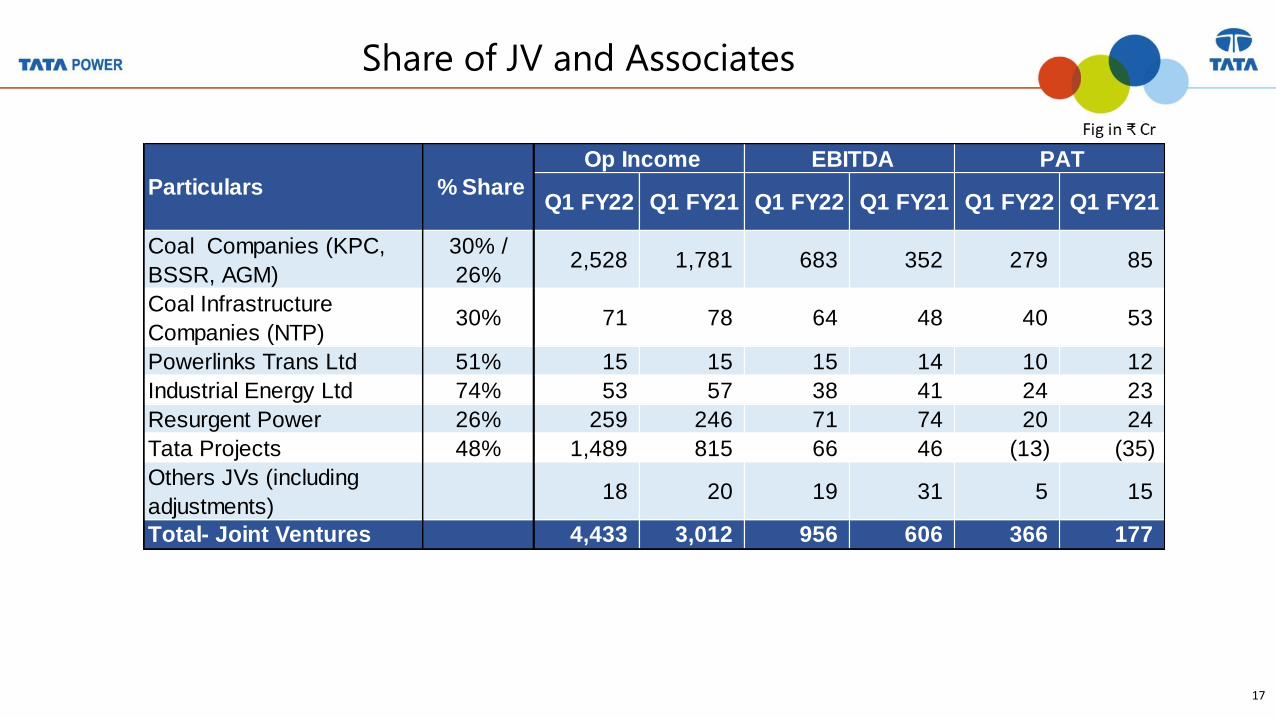
Share of JV and Associates
Q1 FY22 Q1 FY21 Q1 FY22 Q1 FY21 Q1 FY22 Q1 FY21
Coal Companies (KPC,
BSSR, AGM)
30% /
26% 2,528 1,781 683 352 279 85
Coal Infrastructure
Companies (NTP)30% 71 78 64 48 40 53
Powerlinks Trans Ltd 51% 15 15 15 14 10 12
Industrial Energy Ltd 74% 53 57 38 41 24 23
Resurgent Power 26% 259 246 71 74 20 24
Tata Projects 48% 1,489 815 66 46 (13) (35)
Others JVs (including
adjustments) 18 20 19 31 5 15
Total- Joint Ventures 4,433 3,012 956 606 366 177
Particulars % Share
Op Income EBITDA PAT
…Message Box ( Arial, Font size 18 Bold) 18
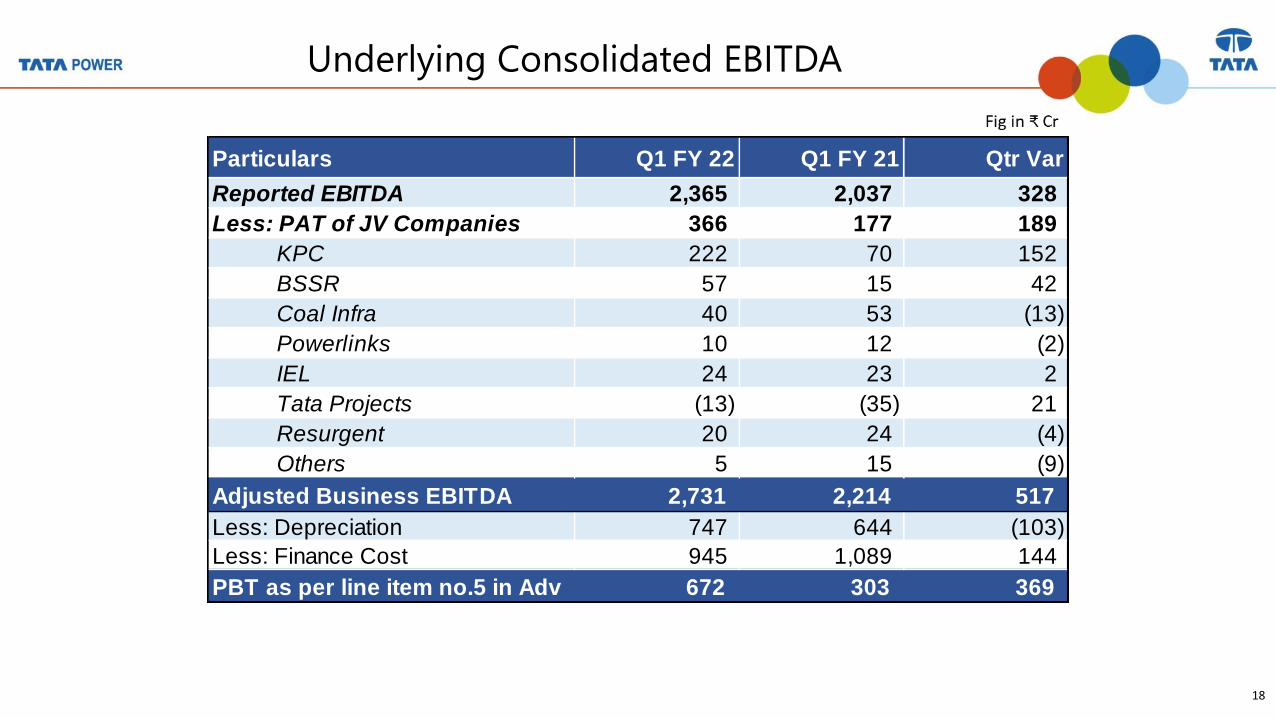
Underlying Consolidated EBITDA
Particulars Q1 FY 22 Q1 FY 21 Qtr Var
Reported EBITDA 2,365 2,037 328
Less: PAT of JV Companies 366 177 189
KPC 222 70 152
BSSR 57 15 42
Coal Infra 40 53 (13)
Powerlinks 10 12 (2)
IEL 24 23 2
Tata Projects (13) (35) 21
Resurgent 20 24 (4)
Others 5 15 (9)
Adjusted Business EBITDA 2,731 2,214 517
Less: Depreciation 747 644 (103)
Less: Finance Cost 945 1,089 144
PBT as per line item no.5 in Adv 672 303 369

…Message Box ( Arial, Font size 18 Bold) 19
Tata Power (Consolidated) Financial Performance
Particulars Q1 FY22 Q1 FY21 Variance Quarter Variance Remarks
Operating Income 9,831 6,671 3,159 Higher income due to Odisha DISCOMS acquisiton & higher execution of projects
in TPSSL partially offset by lower generation in CGPL
Operating Expenses 7,644 4,722 (2,922) Power purchase costs in Odisha and material costs in TPSSL
Operating Profit 2,187 1,950 237
Other Income 178 87 90 APTEL Tariff order impact in CGPL
EBITDA 2,365 2,037 328
Interest cost 945 1,089 144 Interest cost benefit offset by increased debt for Perpetual Debt prepayment, WC
and capex requirements
Depreciation 747 644 (103) Inclusion of Odisha Discoms & manufacturing capacity expansion in TPSSL
PBT before share of Assoc & JVs 672 303 369
Share of Associates & JV's results 366 177 189 Higher profit in coal companies
PBT after share of JV 1,038 480 558
Tax Expenses 573 189 (383) Reversal of MAT Credit due to transition to New Tax Regime (₹ 342 Cr) and tax
provision on dividend from foreign companies (₹ 71 Cr)
Net profit before discontinued ops 466 291 175
Discontinued ops (Defence) Results - (23) 23
Net Profit for the Period before
exceptional 466 268 198
* As per line item 13 in the SEBI Advt
…Message Box ( Arial, Font size 18 Bold) 20
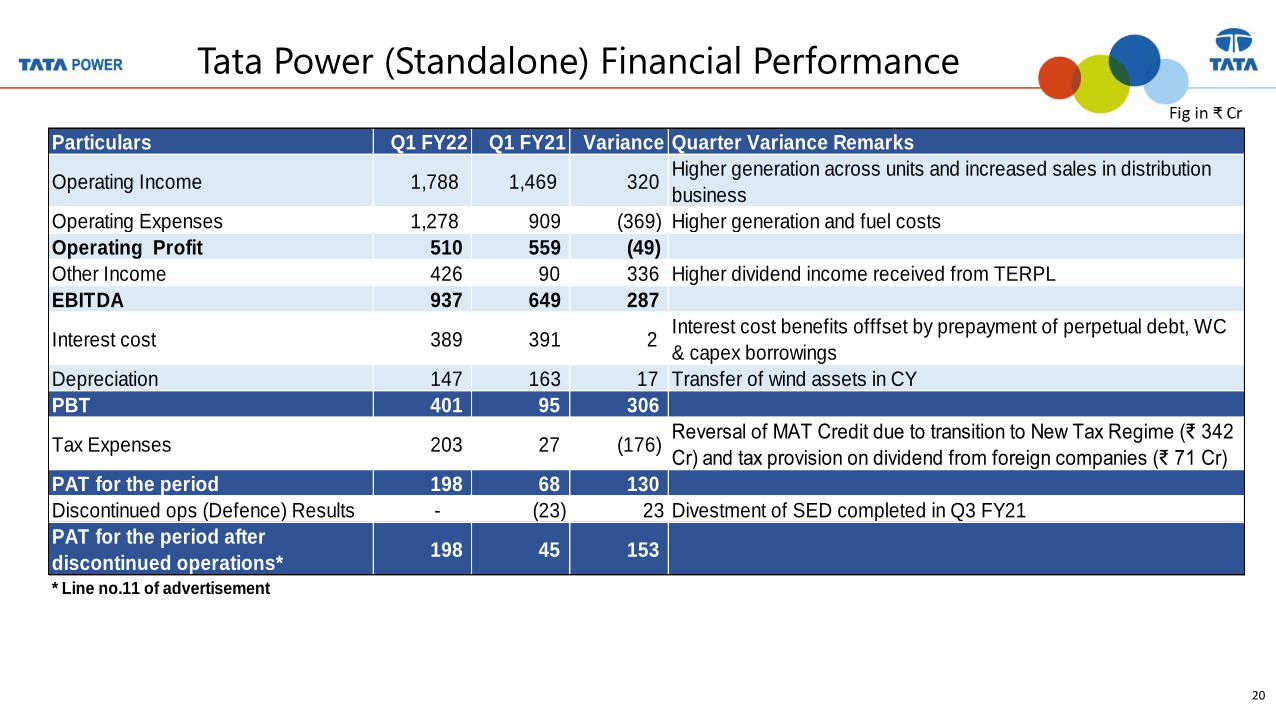
Tata Power (Standalone) Financial Performance
Particulars Q1 FY22 Q1 FY21 Variance Quarter Variance Remarks
Operating Income 1,788 1,469 320 Higher generation across units and increased sales in distribution
business
Operating Expenses 1,278 909 (369) Higher generation and fuel costs
Operating Profit 510 559 (49)
Other Income 426 90 336 Higher dividend income received from TERPL
EBITDA 937 649 287
Interest cost 389 391 2 Interest cost benefits offfset by prepayment of perpetual debt, WC
& capex borrowings
Depreciation 147 163 17 Transfer of wind assets in CY
PBT 401 95 306
Tax Expenses 203 27 (176)Reversal of MAT Credit due to transition to New Tax Regime (₹ 342
Cr) and tax provision on dividend from foreign companies (₹ 71 Cr)
PAT for the period 198 68 130
Discontinued ops (Defence) Results - (23) 23 Divestment of SED completed in Q3 FY21
PAT for the period after
discontinued operations* 198 45 153
* Line no.11 of advertisement
…Message Box ( Arial, Font size 18 Bold) 21
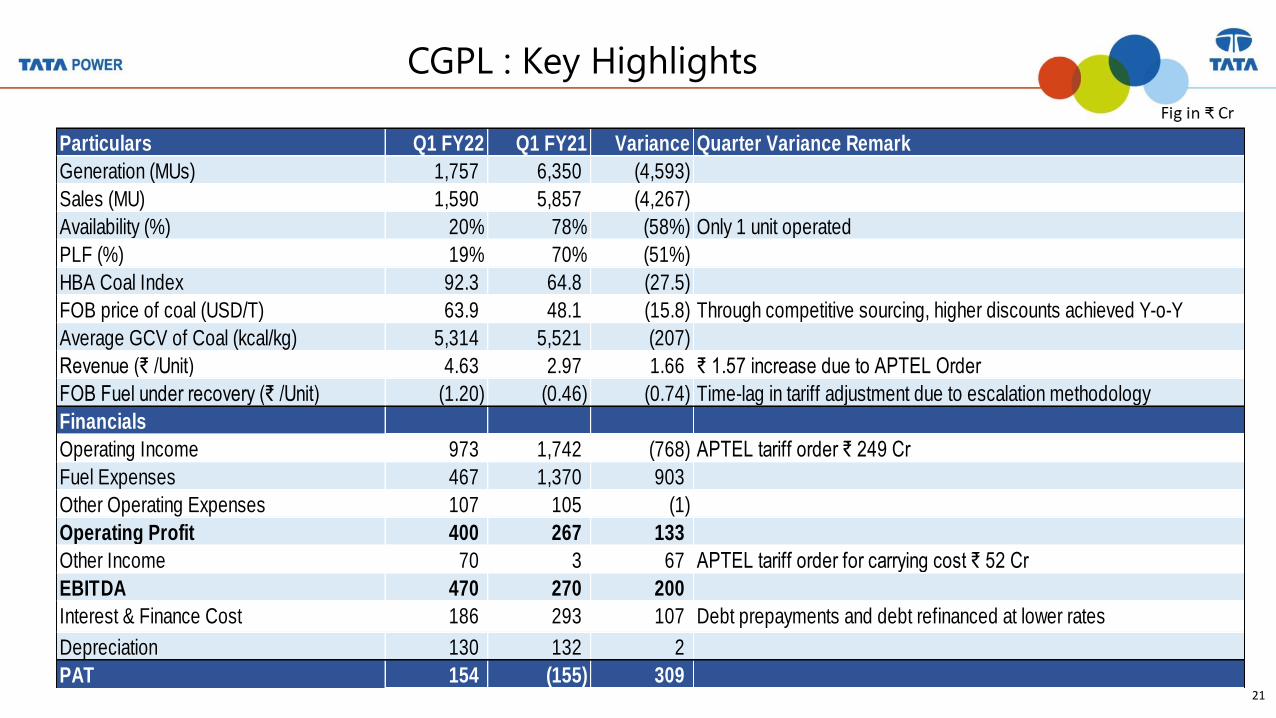
CGPL : Key Highlights
Particulars Q1 FY22 Q1 FY21 Variance Quarter Variance Remark
Generation (MUs) 1,757 6,350 (4,593)
Sales (MU) 1,590 5,857 (4,267)
Availability (%) 20% 78% (58%) Only 1 unit operated
PLF (%) 19% 70% (51%)
HBA Coal Index 92.3 64.8 (27.5)
FOB price of coal (USD/T) 63.9 48.1 (15.8) Through competitive sourcing, higher discounts achieved Y-o-Y
Average GCV of Coal (kcal/kg) 5,314 5,521 (207)
Revenue (₹ /Unit) 4.63 2.97 1.66 ₹ 1.57 increase due to APTEL Order
FOB Fuel under recovery (₹ /Unit) (1.20) (0.46) (0.74) Time-lag in tariff adjustment due to escalation methodology
Financials
Operating Income 973 1,742 (768) APTEL tariff order ₹ 249 Cr
Fuel Expenses 467 1,370 903
Other Operating Expenses 107 105 (1)
Operating Profit 400 267 133
Other Income 70 3 67 APTEL tariff order for carrying cost ₹ 52 Cr
EBITDA 470 270 200
Interest & Finance Cost 186 293 107 Debt prepayments and debt refinanced at lower rates
Depreciation 130 132 2
PAT 154 (155) 309
…Message Box ( Arial, Font size 18 Bold) 22
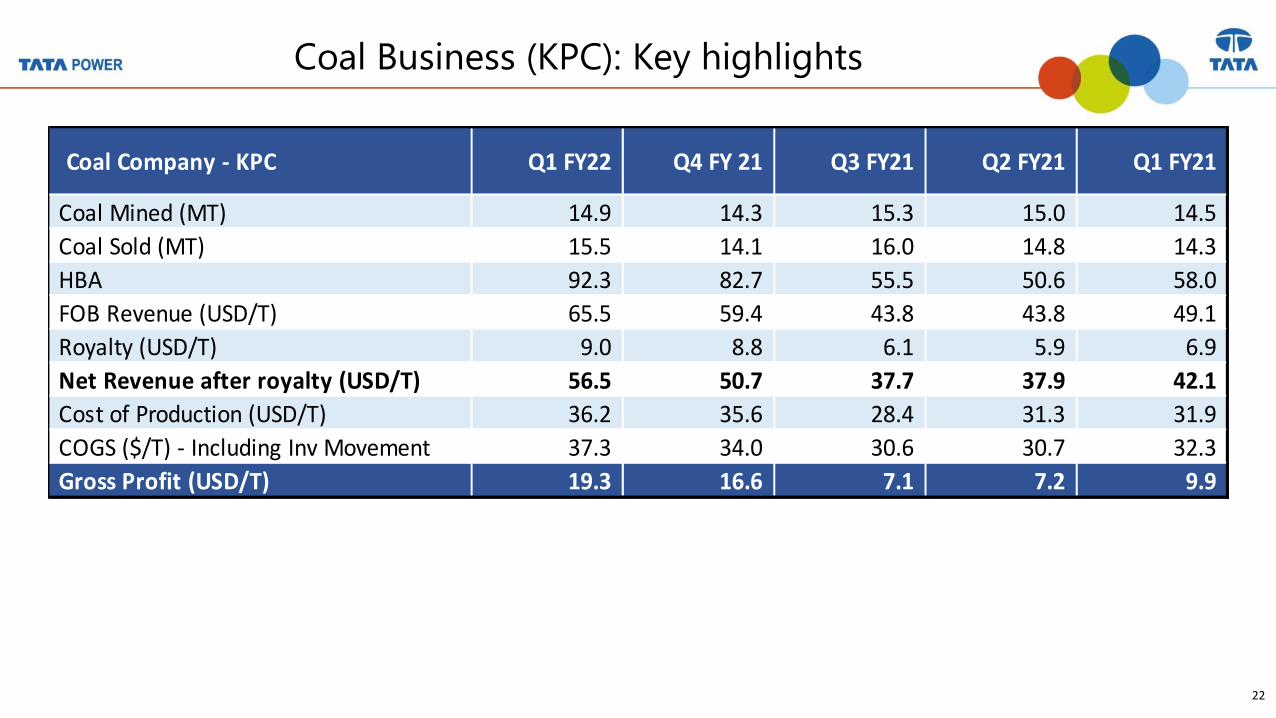
Coal Business (KPC): Key highlights
Coal Company - KPC Q1 FY22 Q4 FY 21 Q3 FY21 Q2 FY21 Q1 FY21
Coal Mined (MT) 14.9 14.3 15.3 15.0 14.5
Coal Sold (MT) 15.5 14.1 16.0 14.8 14.3
HBA 92.3 82.7 55.5 50.6 58.0
FOB Revenue (USD/T) 65.5 59.4 43.8 43.8 49.1
Royalty (USD/T) 9.0 8.8 6.1 5.9 6.9
Net Revenue after royalty (USD/T) 56.5 50.7 37.7 37.9 42.1
Cost of Production (USD/T) 36.2 35.6 28.4 31.3 31.9
COGS ($/T) - Including Inv Movement 37.3 34.0 30.6 30.7 32.3
Gross Profit (USD/T) 19.3 16.6 7.1 7.2 9.9
…Message Box ( Arial, Font size 18 Bold) 23
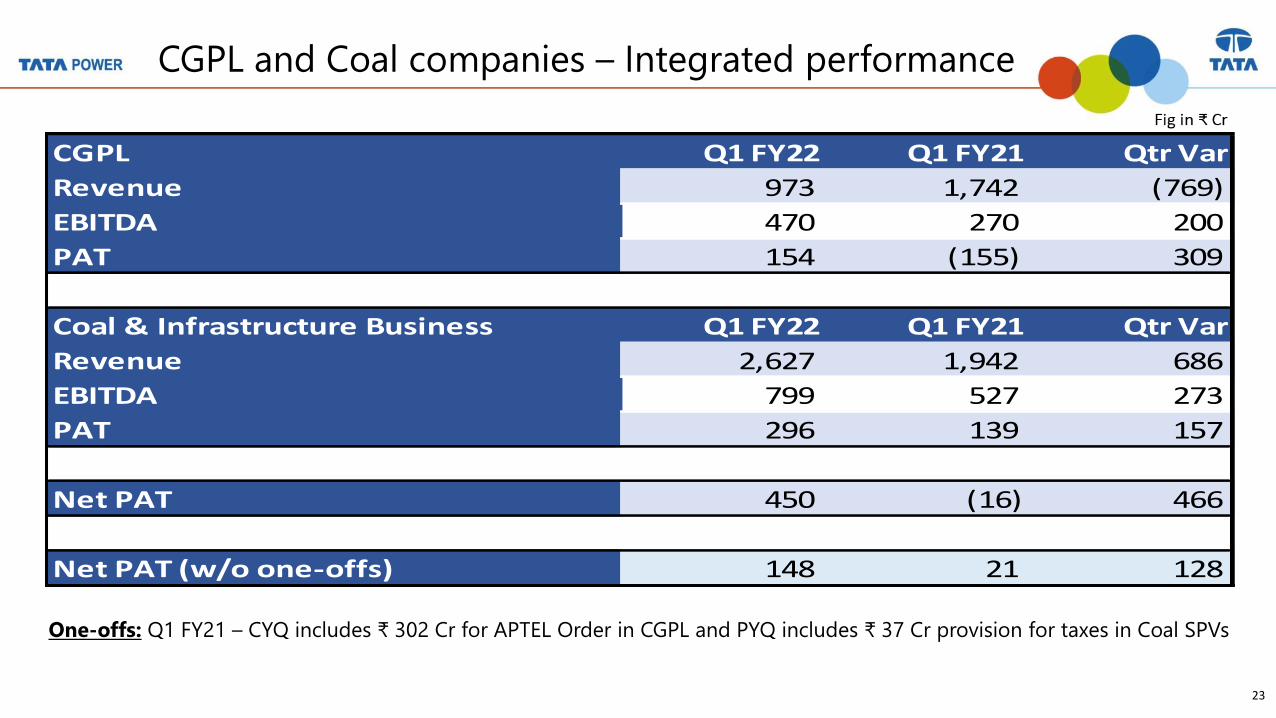
CGPL and Coal companies – Integrated performance
One-offs: Q1 FY21 – CYQ includes ₹ 302 Cr for APTEL Order in CGPL and PYQ includes ₹ 37 Cr provision for taxes in Coal SPVs
CGPL Q1 FY22 Q1 FY21 Qtr Var
Revenue 973 1,742 (769)
EBITDA 470 270 200
PAT 154 (155) 309
Coal & Infrastructure Business Q1 FY22 Q1 FY21 Qtr Var
Revenue 2,627 1,942 686
EBITDA 799 527 273
PAT 296 139 157
Net PAT 450 (16) 466
Net PAT (w/o one-offs) 148 21 128
…Message Box ( Arial, Font size 18 Bold) 24
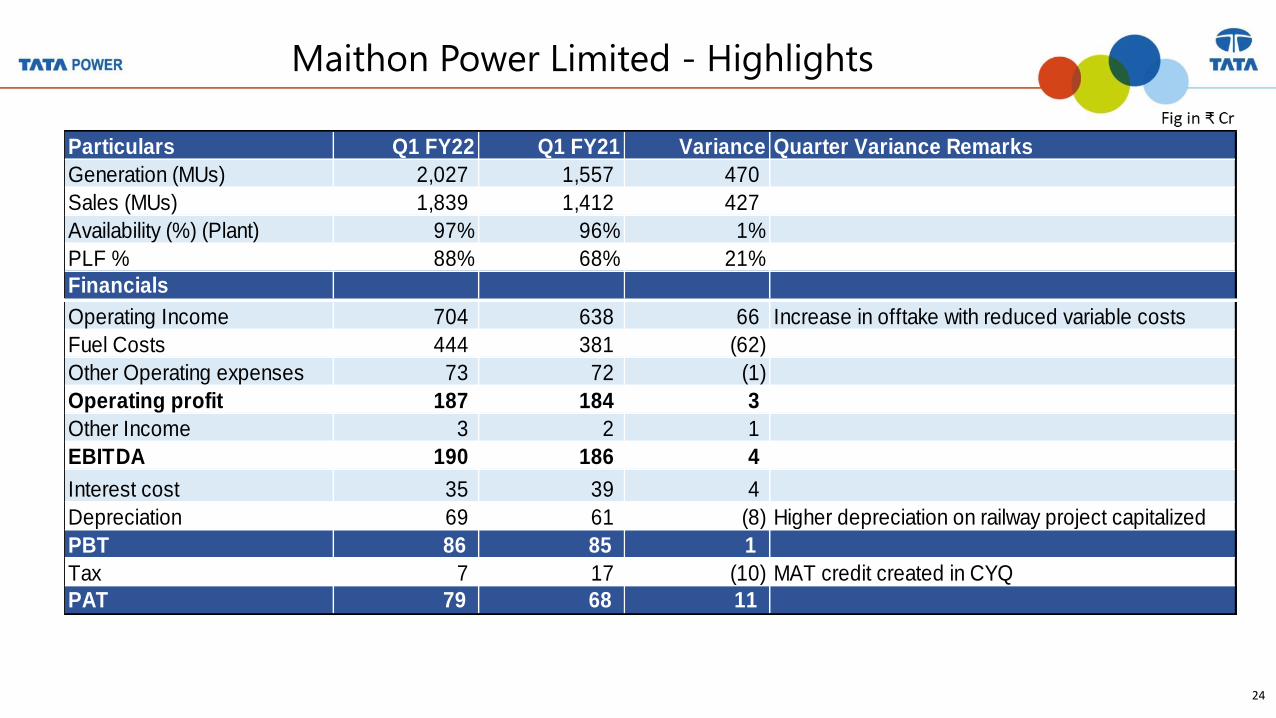
Maithon Power Limited - Highlights
Particulars Q1 FY22 Q1 FY21 Variance Quarter Variance Remarks
Generation (MUs) 2,027 1,557 470
Sales (MUs) 1,839 1,412 427
Availability (%) (Plant) 97% 96% 1%
PLF % 88% 68% 21%
Financials
Operating Income 704 638 66 Increase in offtake with reduced variable costs
Fuel Costs 444 381 (62)
Other Operating expenses 73 72 (1)
Operating profit 187 184 3
Other Income 3 2 1
EBITDA 190 186 4
Interest cost 35 39 4
Depreciation 69 61 (8) Higher depreciation on railway project capitalized
PBT 86 85 1
Tax 7 17 (10) MAT credit created in CYQ
PAT 79 68 11
…Message Box ( Arial, Font size 18 Bold) 25
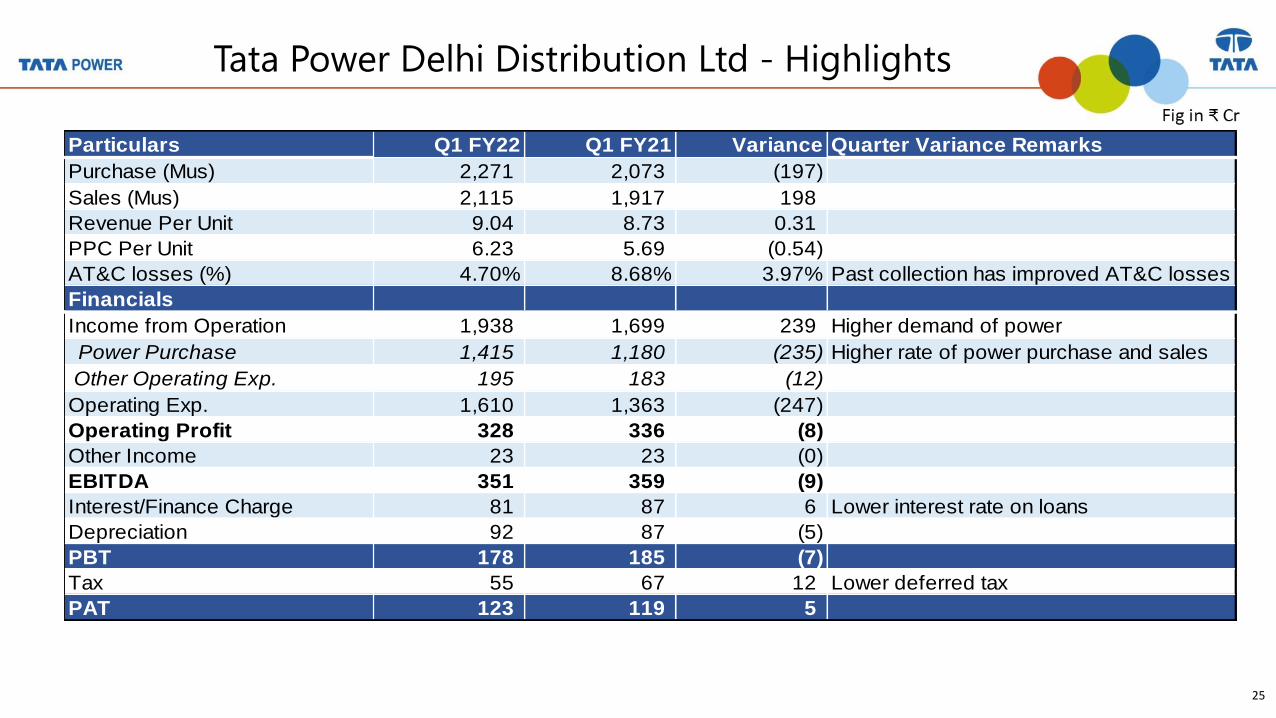
Tata Power Delhi Distribution Ltd - Highlights
Particulars Q1 FY22 Q1 FY21 Variance Quarter Variance Remarks
Purchase (Mus) 2,271 2,073 (197)
Sales (Mus) 2,115 1,917 198
Revenue Per Unit 9.04 8.73 0.31
PPC Per Unit 6.23 5.69 (0.54)
AT&C losses (%) 4.70% 8.68% 3.97% Past collection has improved AT&C losses
Financials
Income from Operation 1,938 1,699 239 Higher demand of power
Power Purchase 1,415 1,180 (235) Higher rate of power purchase and sales
Other Operating Exp. 195 183 (12)
Operating Exp. 1,610 1,363 (247)
Operating Profit 328 336 (8)
Other Income 23 23 (0)
EBITDA 351 359 (9)
Interest/Finance Charge 81 87 6 Lower interest rate on loans
Depreciation 92 87 (5)
PBT 178 185 (7)
Tax 55 67 12 Lower deferred tax
PAT 123 119 5
…Message Box ( Arial, Font size 18 Bold) 26
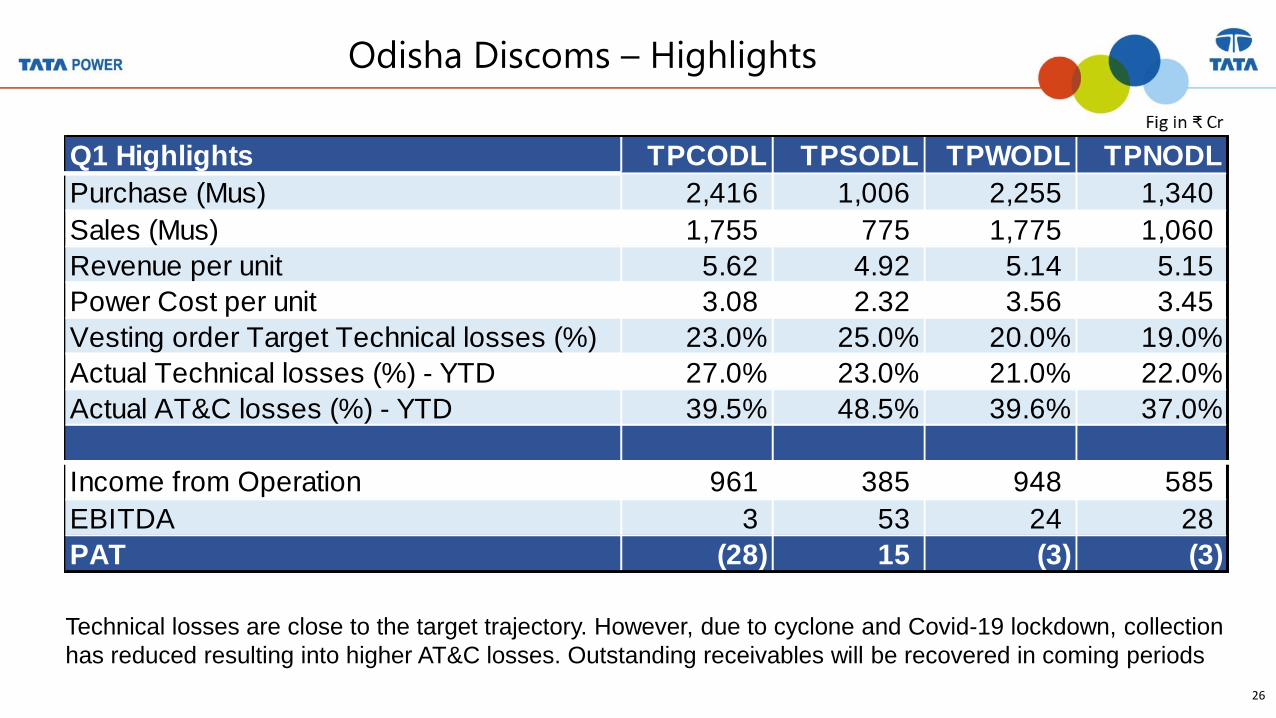
Odisha Discoms – Highlights
Technical losses are close to the target trajectory. However, due to cyclone and Covid-19 lockdown, collection
has reduced resulting into higher AT&C losses. Outstanding receivables will be recovered in coming periods
Q1 Highlights TPCODL TPSODL TPWODL TPNODL
Purchase (Mus) 2,416 1,006 2,255 1,340
Sales (Mus) 1,755 775 1,775 1,060
Revenue per unit 5.62 4.92 5.14 5.15
Power Cost per unit 3.08 2.32 3.56 3.45
Vesting order Target Technical losses (%) 23.0% 25.0% 20.0% 19.0%
Actual Technical losses (%) - YTD 27.0% 23.0% 21.0% 22.0%
Actual AT&C losses (%) - YTD 39.5% 48.5% 39.6% 37.0%
Income from Operation 961 385 948 585
EBITDA 3 53 24 28
PAT (28) 15 (3) (3)
…Message Box ( Arial, Font size 18 Bold) 27
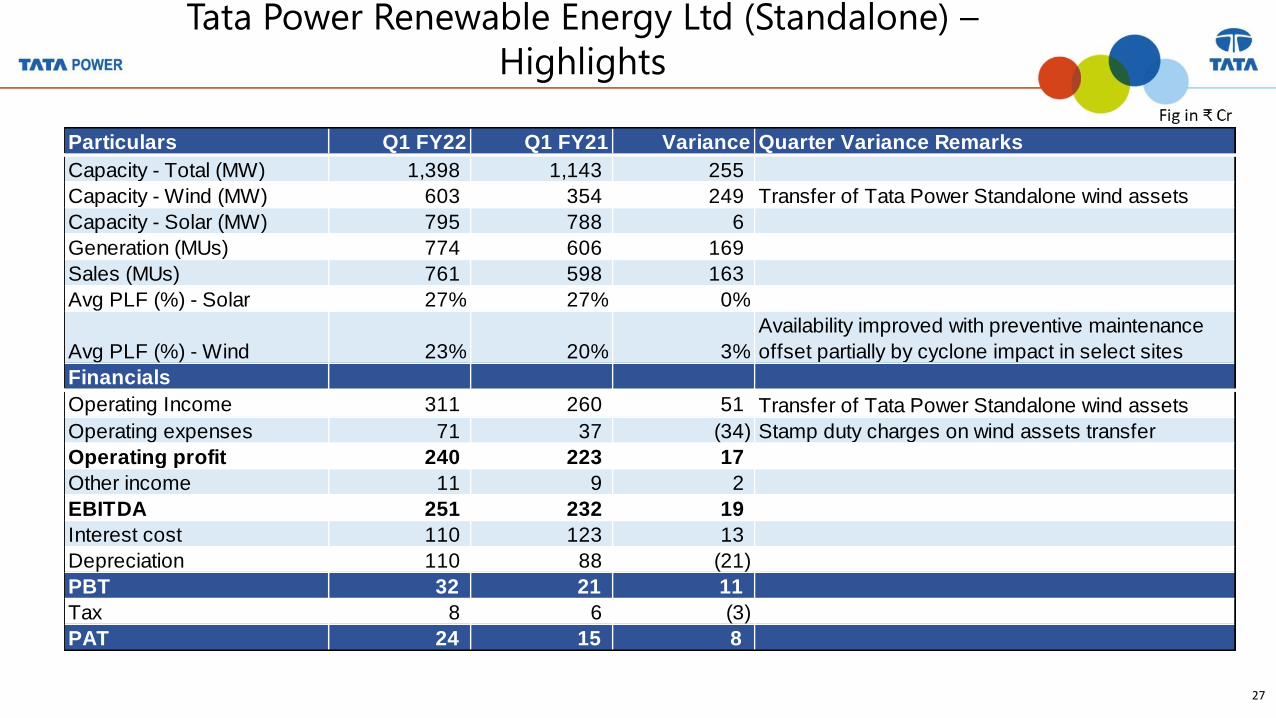
Tata Power Renewable Energy Ltd (Standalone) –
Highlights
Particulars Q1 FY22 Q1 FY21 Variance Quarter Variance Remarks
Capacity - Total (MW) 1,398 1,143 255
Capacity - Wind (MW) 603 354 249 Transfer of Tata Power Standalone wind assets
Capacity - Solar (MW) 795 788 6
Generation (MUs) 774 606 169
Sales (MUs) 761 598 163
Avg PLF (%) - Solar 27% 27% 0%
Avg PLF (%) - Wind 23% 20% 3%
Availability improved with preventive maintenance
offset partially by cyclone impact in select sites
Financials
Operating Income 311 260 51 Transfer of Tata Power Standalone wind assets
Operating expenses 71 37 (34) Stamp duty charges on wind assets transfer
Operating profit 240 223 17
Other income 11 9 2
EBITDA 251 232 19
Interest cost 110 123 13
Depreciation 110 88 (21)
PBT 32 21 11
Tax 8 6 (3)
PAT 24 15 8
…Message Box ( Arial, Font size 18 Bold) 28
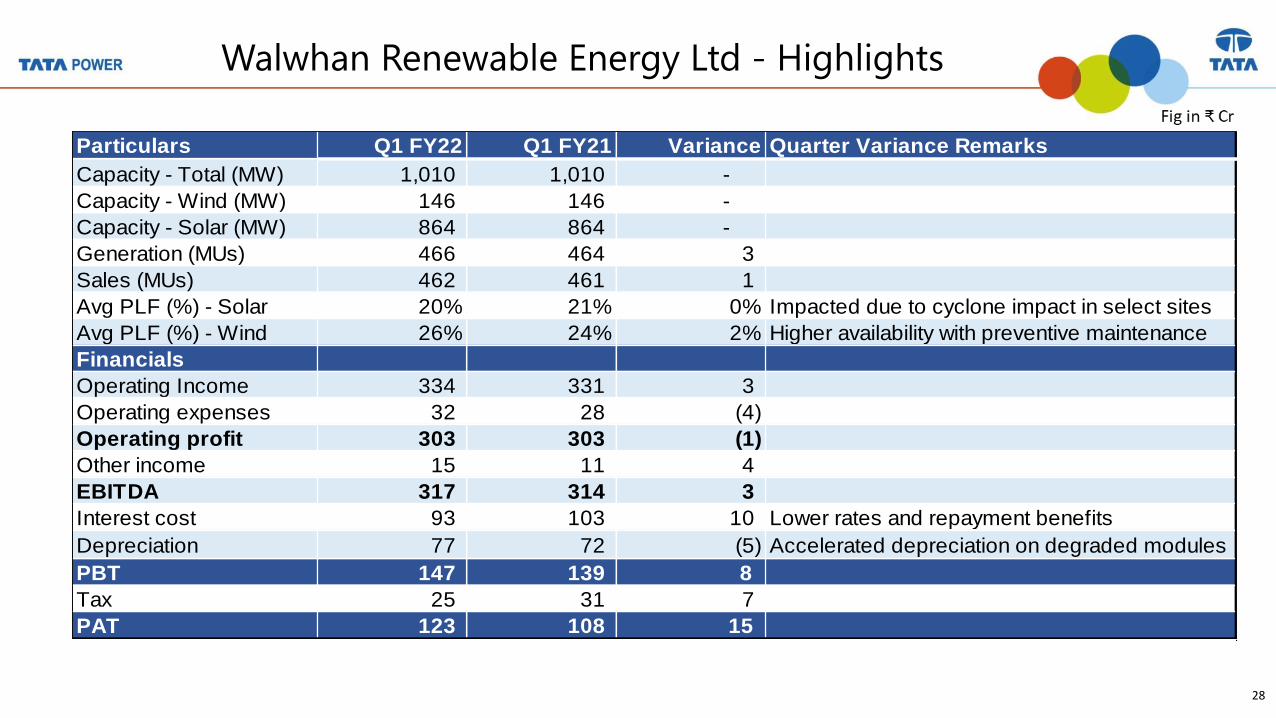
Walwhan Renewable Energy Ltd - Highlights
Particulars Q1 FY22 Q1 FY21 Variance Quarter Variance Remarks
Capacity - Total (MW) 1,010 1,010 -
Capacity - Wind (MW) 146 146 -
Capacity - Solar (MW) 864 864 -
Generation (MUs) 466 464 3
Sales (MUs) 462 461 1
Avg PLF (%) - Solar 20% 21% 0% Impacted due to cyclone impact in select sites
Avg PLF (%) - Wind 26% 24% 2% Higher availability with preventive maintenance
Financials
Operating Income 334 331 3
Operating expenses 32 28 (4)
Operating profit 303 303 (1)
Other income 15 11 4
EBITDA 317 314 3
Interest cost 93 103 10 Lower rates and repayment benefits
Depreciation 77 72 (5) Accelerated depreciation on degraded modules
PBT 147 139 8
Tax 25 31 7
PAT 123 108 15
…Message Box ( Arial, Font size 18 Bold) 29
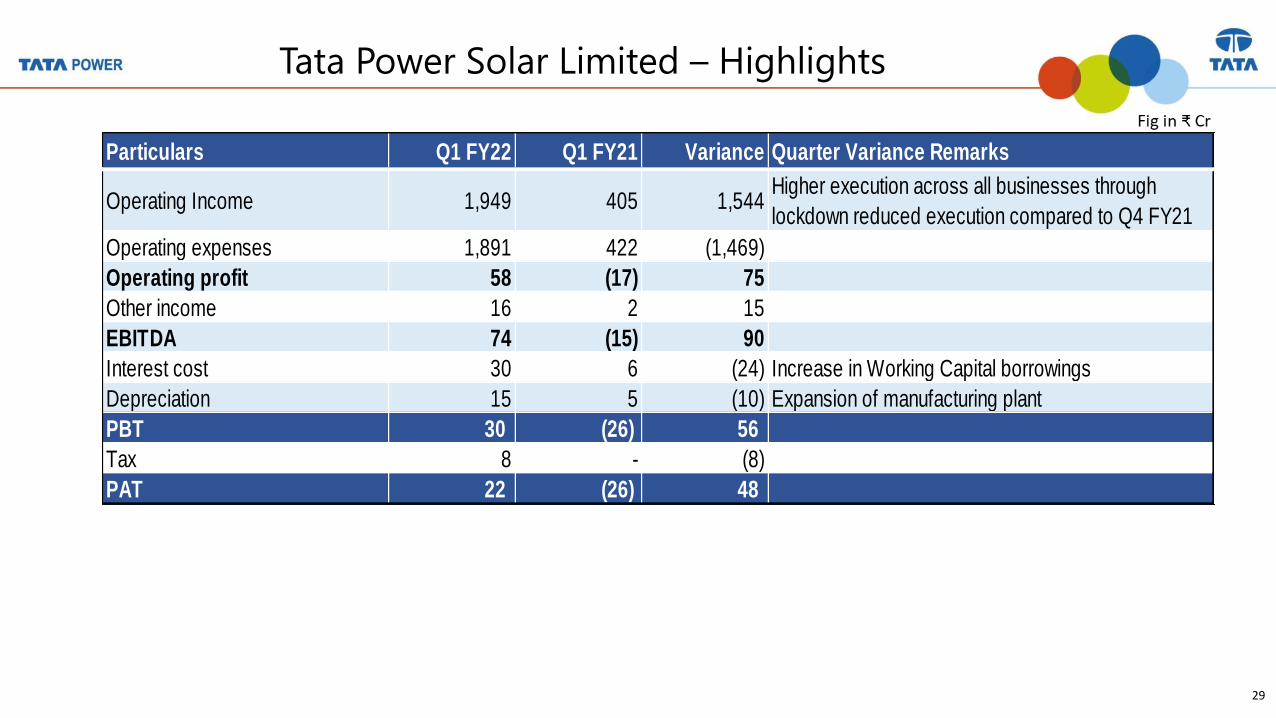
Tata Power Solar Limited – Highlights
Particulars Q1 FY22 Q1 FY21 Variance Quarter Variance Remarks
Operating Income 1,949 405 1,544 Higher execution across all businesses through
lockdown reduced execution compared to Q4 FY21
Operating expenses 1,891 422 (1,469)
Operating profit 58 (17) 75
Other income 16 2 15
EBITDA 74 (15) 90
Interest cost 30 6 (24) Increase in Working Capital borrowings
Depreciation 15 5 (10) Expansion of manufacturing plant
PBT 30 (26) 56
Tax 8 - (8)
PAT 22 (26) 48
…Message Box ( Arial, Font size 18 Bold) 30
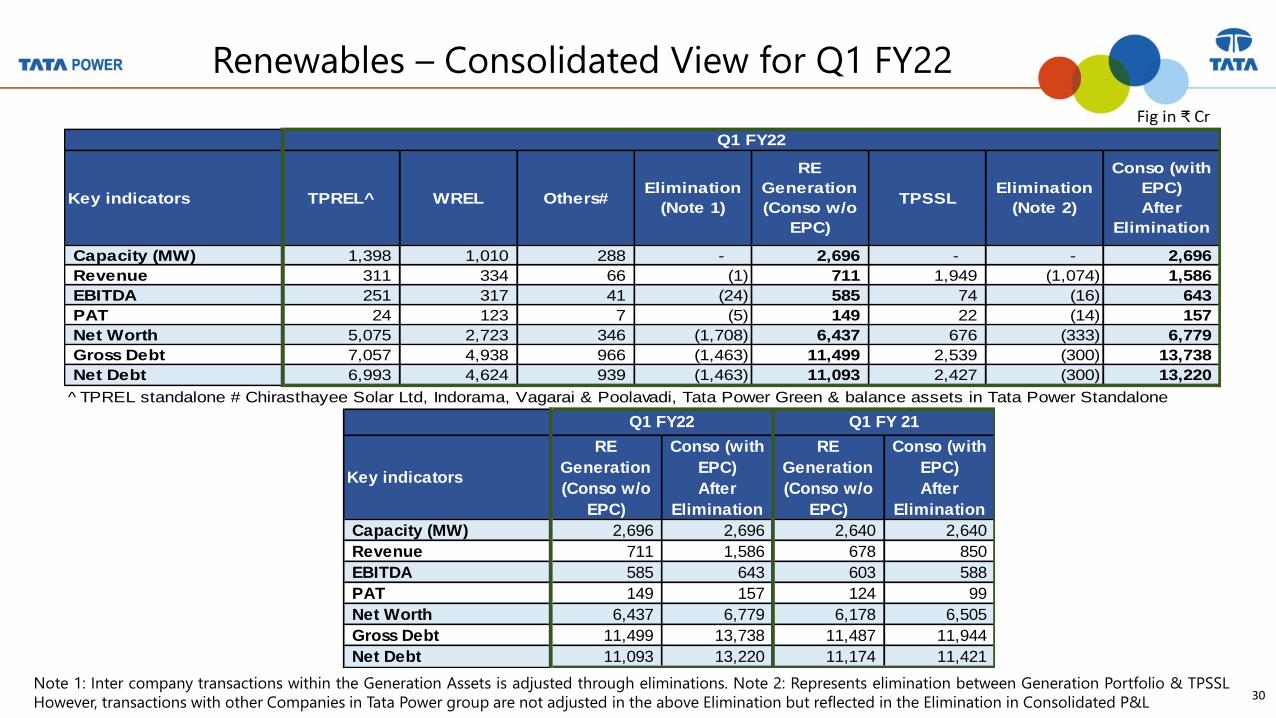
Renewables – Consolidated View for Q1 FY22
Note 1: Inter company transactions within the Generation Assets is adjusted through eliminations. Note 2: Represents elimination between Generation Portfolio & TPSSL
However, transactions with other Companies in Tata Power group are not adjusted in the above Elimination but reflected in the Elimination in Consolidated P&L
Key indicators TPREL^ WREL Others#Elimination
(Note 1)
RE
Generation
(Conso w/o
EPC)
TPSSLElimination
(Note 2)
Conso (with
EPC)
After
Elimination
Capacity (MW) 1,398 1,010 288 - 2,696 - - 2,696
Revenue 311 334 66 (1) 711 1,949 (1,074) 1,586
EBITDA 251 317 41 (24) 585 74 (16) 643
PAT 24 123 7 (5) 149 22 (14) 157
Net Worth 5,075 2,723 346 (1,708) 6,437 676 (333) 6,779
Gross Debt 7,057 4,938 966 (1,463) 11,499 2,539 (300) 13,738
Net Debt 6,993 4,624 939 (1,463) 11,093 2,427 (300) 13,220
TPREL standalone # Chirasthayee Solar Ltd, Indorama, Vagarai & Poolavadi, Tata Power Green & balance assets in Tata Power Standalone
Q1 FY22
Key indicators
RE
Generation
(Conso w/o
EPC)
Conso (with
EPC)
After
Elimination
RE
Generation
(Conso w/o
EPC)
Conso (with
EPC)
After
Elimination
Capacity (MW) 2,696 2,696 2,640 2,640
Revenue 711 1,586 678 850
EBITDA 585 643 603 588
PAT 149 157 124 99
Net Worth 6,437 6,779 6,178 6,505
Gross Debt 11,499 13,738 11,487 11,944
Net Debt 11,093 13,220 11,174 11,421
Q1 FY 21Q1 FY22
…Message Box ( Arial, Font size 18 Bold) 31
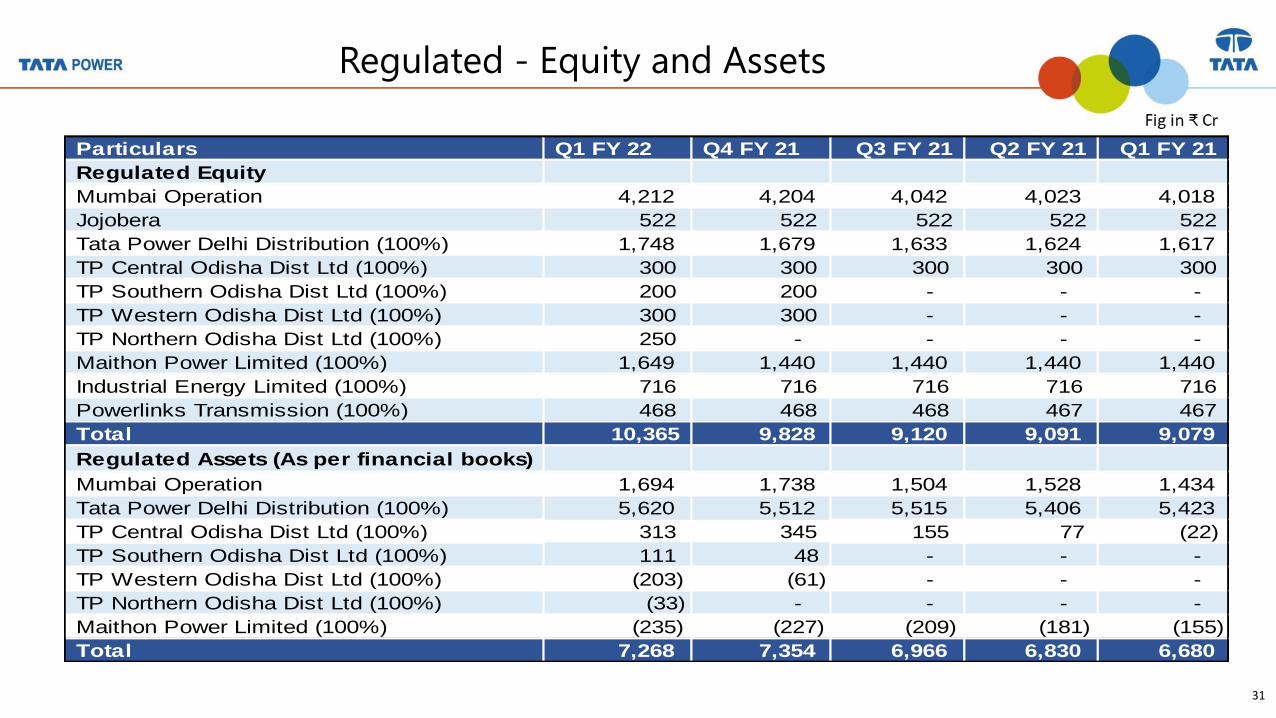
Regulated - Equity and Assets
Particulars Q1 FY 22 Q4 FY 21 Q3 FY 21 Q2 FY 21 Q1 FY 21
Regulated Equity
Mumbai Operation 4,212 4,204 4,042 4,023 4,018
Jojobera 522 522 522 522 522
Tata Power Delhi Distribution (100%) 1,748 1,679 1,633 1,624 1,617
TP Central Odisha Dist Ltd (100%) 300 300 300 300 300
TP Southern Odisha Dist Ltd (100%) 200 200 - - -
TP Western Odisha Dist Ltd (100%) 300 300 - - -
TP Northern Odisha Dist Ltd (100%) 250 - - - -
Maithon Power Limited (100%) 1,649 1,440 1,440 1,440 1,440
Industrial Energy Limited (100%) 716 716 716 716 716
Powerlinks Transmission (100%) 468 468 468 467 467
Total 10,365 9,828 9,120 9,091 9,079
Regulated Assets (As per financial books)
Mumbai Operation 1,694 1,738 1,504 1,528 1,434
Tata Power Delhi Distribution (100%) 5,620 5,512 5,515 5,406 5,423
TP Central Odisha Dist Ltd (100%) 313 345 155 77 (22)
TP Southern Odisha Dist Ltd (100%) 111 48 - - -
TP Western Odisha Dist Ltd (100%) (203) (61) - - -
TP Northern Odisha Dist Ltd (100%) (33) - - - -
Maithon Power Limited (100%) (235) (227) (209) (181) (155)
Total 7,268 7,354 6,966 6,830 6,680
…Message Box ( Arial, Font size 18 Bold) 32
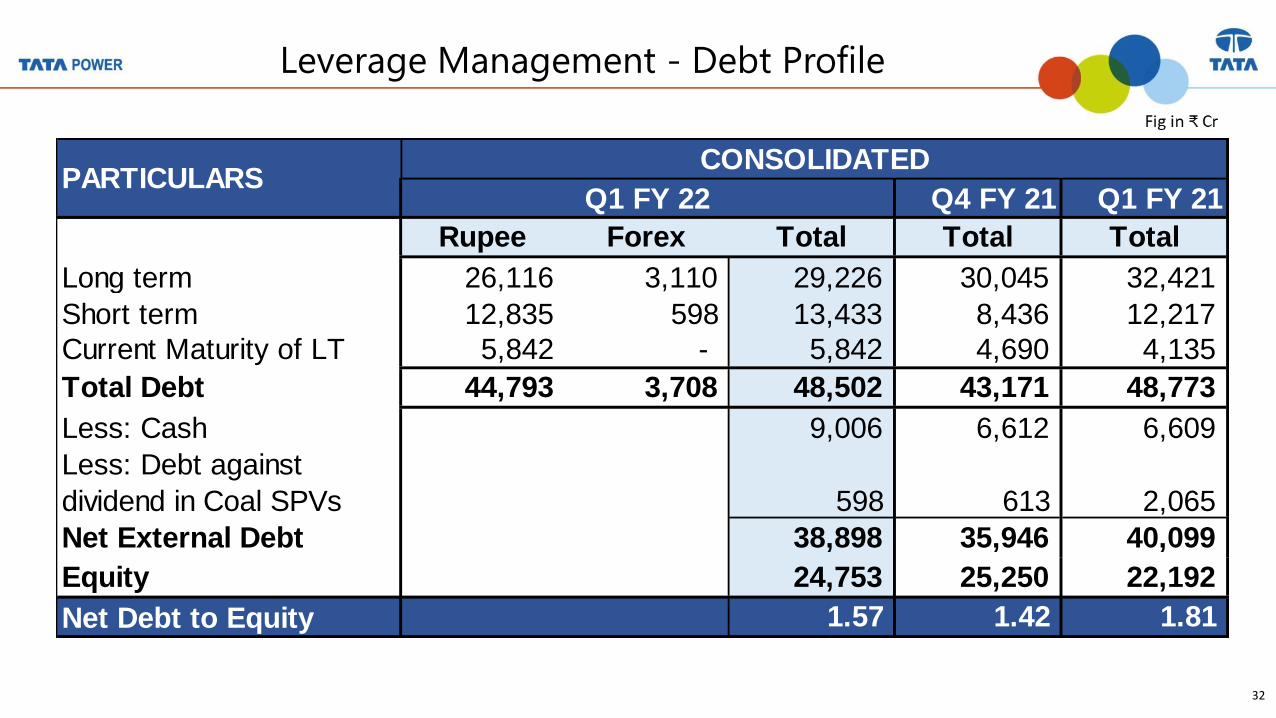
Leverage Management - Debt Profile
Q4 FY 21 Q1 FY 21
Rupee Forex Total Total Total
Long term 26,116 3,110 29,226 30,045 32,421
Short term 12,835 598 13,433 8,436 12,217
Current Maturity of LT 5,842 - 5,842 4,690 4,135
Total Debt 44,793 3,708 48,502 43,171 48,773
Less: Cash 9,006 6,612 6,609
Less: Debt against
dividend in Coal SPVs 598 613 2,065
Net External Debt 38,898 35,946 40,099
Equity 24,753 25,250 22,192
Net Debt to Equity 1.57 1.42 1.81
Q1 FY 22
CONSOLIDATEDPARTICULARS
…Message Box ( Arial, Font size 18 Bold) 33
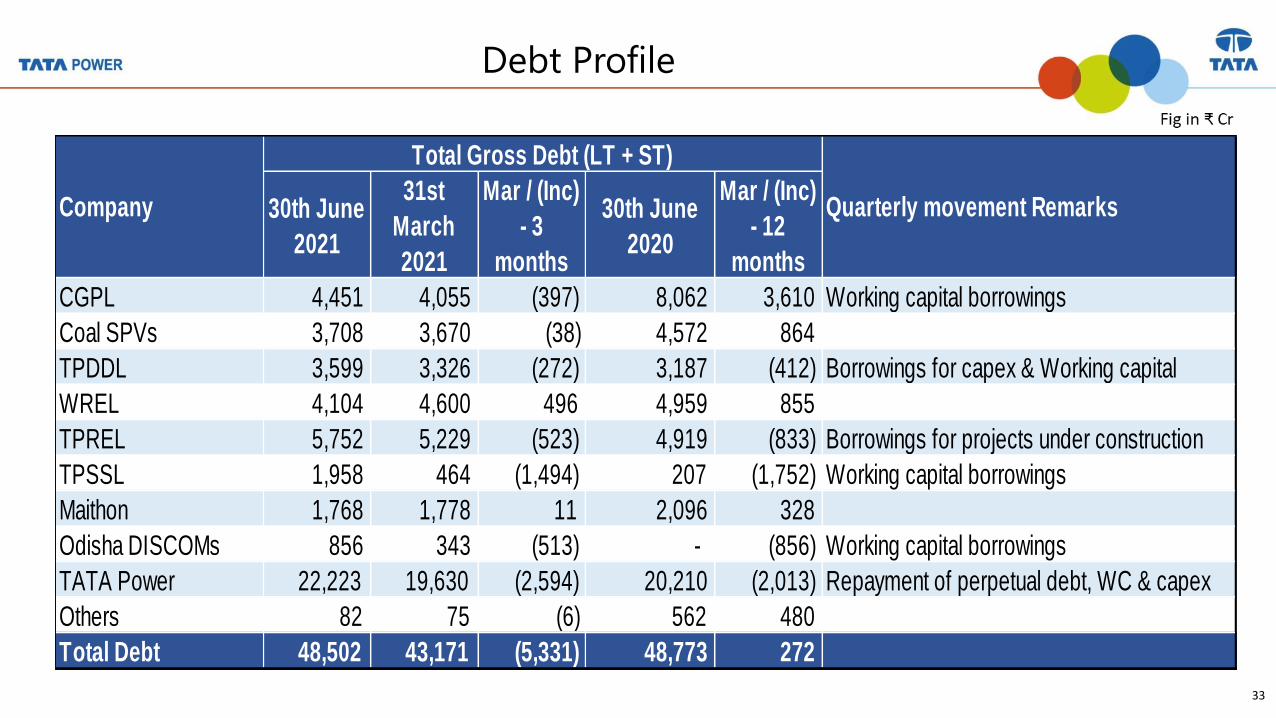
Debt Profile
30th June
2021
31st
March
2021
Mar / (Inc)
- 3
months
30th June
2020
Mar / (Inc)
- 12
months
CGPL 4,451 4,055 (397) 8,062 3,610 Working capital borrowings
Coal SPVs 3,708 3,670 (38) 4,572 864
TPDDL 3,599 3,326 (272) 3,187 (412) Borrowings for capex & Working capital
WREL 4,104 4,600 496 4,959 855
TPREL 5,752 5,229 (523) 4,919 (833) Borrowings for projects under construction
TPSSL 1,958 464 (1,494) 207 (1,752) Working capital borrowings
Maithon 1,768 1,778 11 2,096 328
Odisha DISCOMs 856 343 (513) - (856) Working capital borrowings
TATA Power 22,223 19,630 (2,594) 20,210 (2,013) Repayment of perpetual debt, WC & capex
Others 82 75 (6) 562 480
Total Debt 48,502 43,171 (5,331) 48,773 272
Total Gross Debt (LT + ST)
Company Quarterly movement Remarks
…Message Box ( Arial, Font size 18 Bold) 34
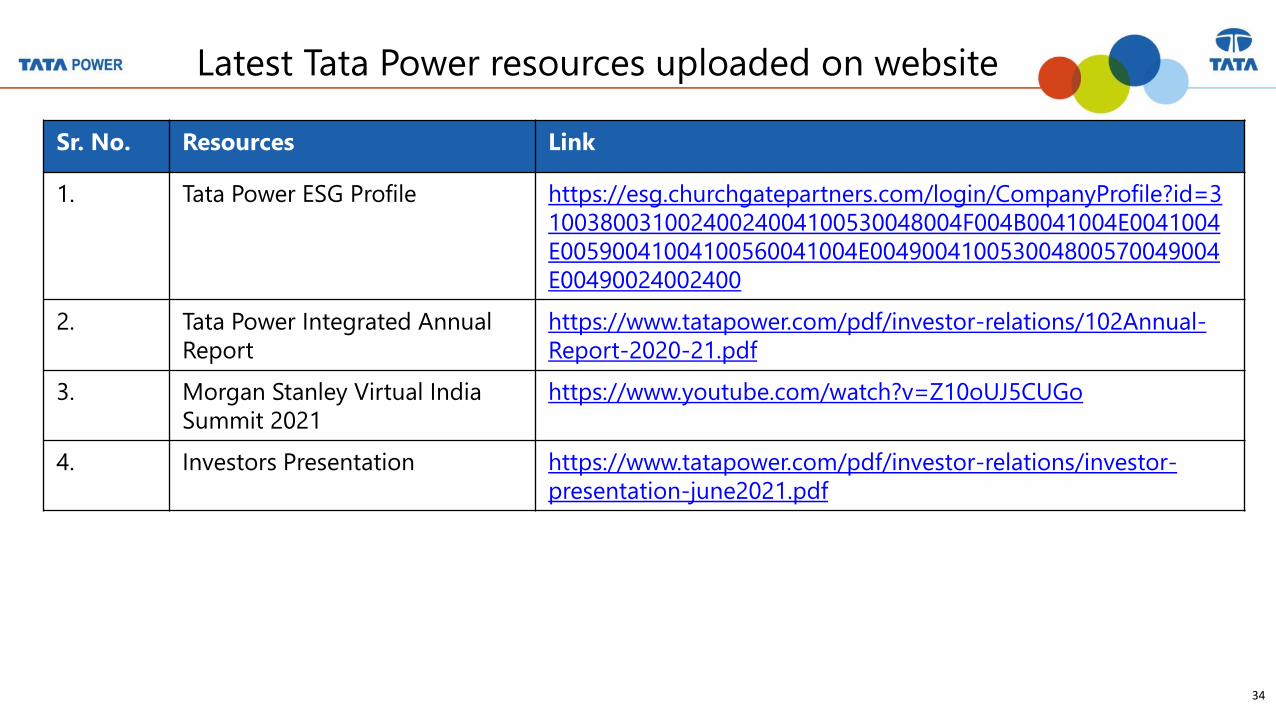
Latest Tata Power resources uploaded on website
Sr. No. Resources Link
1. Tata Power ESG Profile https://esg.churchgatepartners.com/login/CompanyProfile?id=3
10038003100240024004100530048004F004B0041004E0041004
E00590041004100560041004E004900410053004800570049004
E00490024002400
2. Tata Power Integrated Annual
Report
https://www.tatapower.com/pdf/investor-relations/102Annual-
Report-2020-21.pdf
3. Morgan Stanley Virtual India
Summit 2021
https://www.youtube.com/watch?v=Z10oUJ5CUGo
4. Investors Presentation https://www.tatapower.com/pdf/investor-relations/investor-
presentation-june2021.pdf
…Message Box ( Arial, Font size 18 Bold) 35
Thank You!Website: www.tatapower.com
Investor Relations Team:
Mr. Soundararajan Kasturi
Chief – Treasury & Investor Relations
Email: [email protected]
M: +91 82912 04022
Mr. Rahul Shah
Head – Investor Relations
Email: [email protected]
M: +91 91370 34304


![Tata Steels Q1 FY16 Key Production and Sales Figure [Company Update]](https://img.pdfslide.us/doc/110x75/577cb4421a28aba7118c638a/tata-steels-q1-fy16-key-production-and-sales-figure-company-update.jpg)