Embed Size (px)
Citation preview


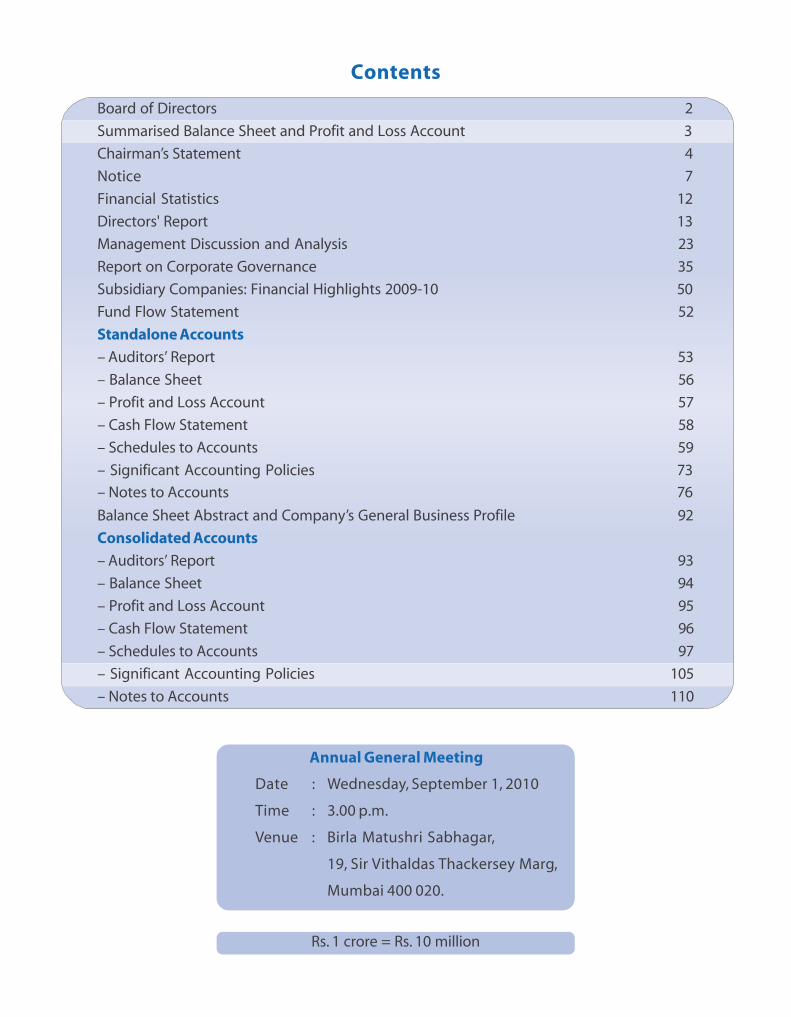
Contents
Board of Directors 2
Summarised Balance Sheet and Profit and Loss Account 3
Chairman’s Statement 4
Notice 7
Financial Statistics 12
Directors' Report 13
Management Discussion and Analysis 23
Report on Corporate Governance 35
Subsidiary Companies: Financial Highlights 2009-10 50
Fund Flow Statement 52
Standalone Accounts
– Auditors’ Report 53
– Balance Sheet 56
– Profit and Loss Account 57
– Cash Flow Statement 58
– Schedules to Accounts 59
– Significant Accounting Policies 73
– Notes to Accounts 76
Balance Sheet Abstract and Company’s General Business Profile 92
Consolidated Accounts
– Auditors’ Report 93
– Balance Sheet 94
– Profit and Loss Account 95
– Cash Flow Statement 96
– Significant Accounting Policies 105
Annual General Meeting
Date : Wednesday, September 1, 2010
Time : 3.00 p.m.
Venue : Birla Matushri Sabhagar,
19, Sir Vithaldas Thackersey Marg,
Mumbai 400 020.
Rs. 1 crore = Rs. 10 million
– Notes to Accounts 110
– Schedules to Accounts 97
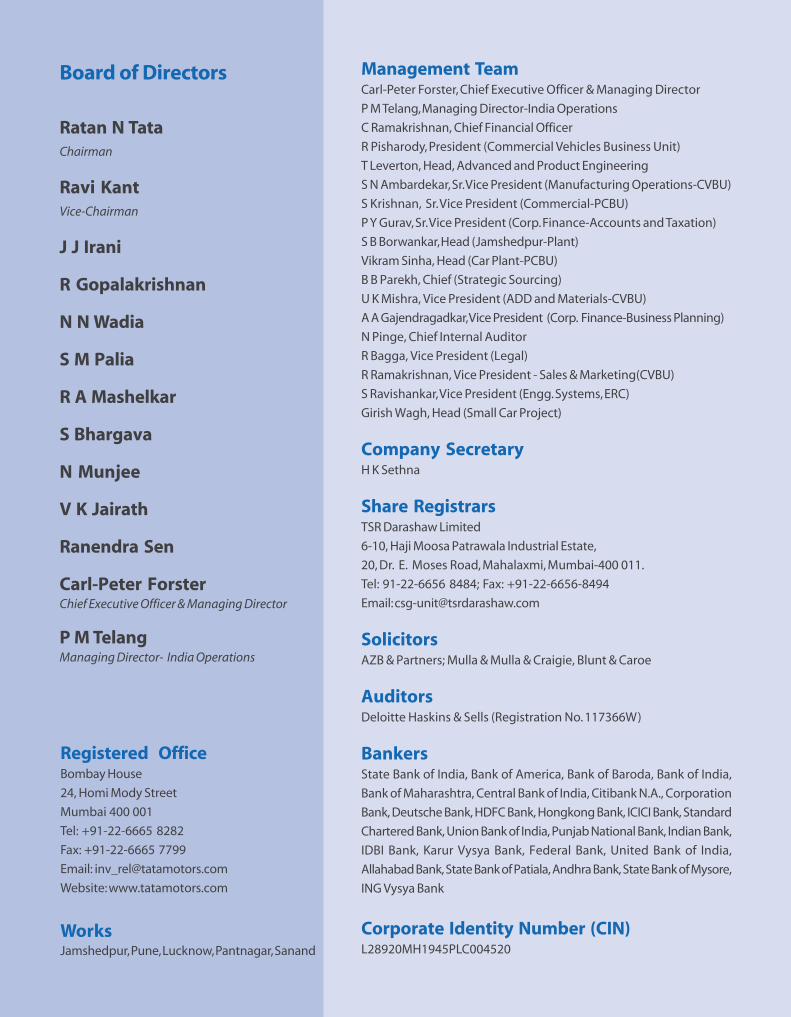
ContentsRatan N TataChairman
Ravi KantVice-Chairman
J J Irani
R Gopalakrishnan
N N Wadia
S M Palia
R A Mashelkar
S Bhargava
N Munjee
V K Jairath
Ranendra Sen
Carl-Peter ForsterChief Executive Officer & Managing Director
P M TelangManaging Director- India Operations
Board of Directors
Registered OfficeBombay House
24, Homi Mody Street
Mumbai 400 001
Tel: +91-22-6665 8282
Fax: +91-22-6665 7799
Email: [email protected]
Website: www.tatamotors.com
WorksJamshedpur, Pune, Lucknow, Pantnagar, Sanand
Management TeamCarl-Peter Forster, Chief Executive Officer & Managing Director
P M Telang, Managing Director-India Operations
C Ramakrishnan, Chief Financial Officer
R Pisharody, President (Commercial Vehicles Business Unit)
T Leverton, Head, Advanced and Product Engineering
S N Ambardekar, Sr. Vice President (Manufacturing Operations-CVBU)
S Krishnan, Sr. Vice President (Commercial-PCBU)
P Y Gurav, Sr. Vice President (Corp. Finance-Accounts and Taxation)
S B Borwankar, Head (Jamshedpur-Plant)
Vikram Sinha, Head (Car Plant-PCBU)
B B Parekh, Chief (Strategic Sourcing)
U K Mishra, Vice President (ADD and Materials-CVBU)
A A Gajendragadkar, Vice President (Corp. Finance-Business Planning)
N Pinge, Chief Internal Auditor
R Bagga, Vice President (Legal)
R Ramakrishnan, Vice President - Sales & Marketing(CVBU)
S Ravishankar, Vice President (Engg. Systems, ERC)
Girish Wagh, Head (Small Car Project)
Company SecretaryH K Sethna
Share RegistrarsTSR Darashaw Limited
6-10, Haji Moosa Patrawala Industrial Estate,
20, Dr. E. Moses Road, Mahalaxmi, Mumbai-400 011.
Tel: 91-22-6656 8484; Fax: +91-22-6656-8494
Email: [email protected]
SolicitorsAZB & Partners; Mulla & Mulla & Craigie, Blunt & Caroe
AuditorsDeloitte Haskins & Sells (Registration No. 117366W)
BankersState Bank of India, Bank of America, Bank of Baroda, Bank of India,
Bank of Maharashtra, Central Bank of India, Citibank N.A., Corporation
Bank, Deutsche Bank, HDFC Bank, Hongkong Bank, ICICI Bank, Standard
Chartered Bank, Union Bank of India, Punjab National Bank, Indian Bank,
IDBI Bank, Karur Vysya Bank, Federal Bank, United Bank of India,
Allahabad Bank, State Bank of Patiala, Andhra Bank, State Bank of Mysore,
ING Vysya Bank
Corporate Identity Number (CIN)L28920MH1945PLC004520

3
Summarised Balance Sheet(Rs. in crores)
Company Tata Motors’ GroupWHAT THE COMPANY OWNED As at As at As at As at
March 31, March 31, March 31, March 31,
2010 2009 2010 2009
1. NET FIXED ASSETS 16436.04 14592.16 38506.33 35733.33
2. GOODWILL - - 3422.87 3718.65
3. INVESTMENTS 22336.90 12968.13 2219.12 1257.40
4. DEFERRED TAX ASSETS (NET) - - 425.97 269.44
5. FOREIGN CURRENCY MONETARY ITEM TRANSLATION
DIFFERENCE ACCOUNT (NET) 161.69 - - 636.48
6. NET CURRENT ASSETS (5834.61) (1136.67) 808.81 565.79
7. MISCELLANEOUS EXPENDITURE - 2.02 - 86.08
8. TOTAL ASSETS (NET) 33100.02 26425.64 45383.10 42267.17
WHAT THE COMPANY OWED
1. LOANS 16625.91 13165.56 35192.36 34973.85
2. NET WORTH 14965.47 12230.15 8206.48 5940.64
3. MINORITY INTEREST - - 213.51 403.03
4. FOREIGN CURRENCY MONETARY ITEM TRANSLATION
DIFFERENCE ACCOUNT (NET) - 164.12 191.15 -
5. DEFERRED TAX LIABILITY (NET) 1508.64 865.81 1579.60 949.65
6. TOTAL FUNDS EMPLOYED 33100.02 26425.64 45383.10 42267.17
Summarised Profit and Loss Account
Company Tata Motors’ Group
2009-2010 2008-2009 2009-2010 2008-2009
1. INCOMESALE OF PRODUCTS AND OTHER INCOME FROM OPERATIONS 38364.10 28568.21 95567.42 74093.31
LESS : EXCISE DUTY 2771.05 2938.48 3048.17 3212.36
35593.05 25629.73 92519.25 70880.95
DIVIDEND AND OTHER INCOME 1853.45 925.97 1793.12 798.96
37446.50 26555.70 94312.37 71679.91
2. EXPENDITURERAW MATERIALS / COMPONENTS, MANUFACTURING
AND OTHER EXPENSES 29578.64 22325.90 75153.32 61387.03
EMPLOYEE COST 1836.13 1551.39 8751.77 7297.42
PRODUCT DEVELOPMENT EXPENDITURE 144.03 51.17 498.20 347.75
DEPRECIATION / AMORTISATION 1033.87 874.54 3887.13 2506.77
INTEREST AND DISCOUNTING CHARGES 1103.84 673.68 2239.71 1930.90
EXCEPTIONAL ITEMS 920.45 65.26 259.60 339.29
TOTAL EXPENDITURE 34616.96 25541.94 90789.73 73809.16
3. PROFIT / (LOSS) BEFORE TAX 2829.54 1013.76 3522.64 (2129.25)
4. TAX EXPENSE (589.46) (12.50) (1005.75) (335.75)
5. PROFIT /(LOSS) AFTER TAX 2240.08 1001.26 2516.89 (2465.00)
6. SHARE OF MINORITY INTEREST - - (30.33) 11.48
7. SHARE OF PROFIT / (LOSS) IN RESPECT OF INVESTMENTS
IN ASSOCIATE COMPANIES - - 84.50 (51.73)
8. PROFIT /(LOSS) FOR THE YEAR 2240.08 1001.26 2571.06 (2505.25)
(Rs. in crores)
Sixty-fifth annual report 2009-10
Tata Motors Limited
4
Chairman’s Statement
Dear Shareholder,
The world has been recovering from the global financial crisis which devastated the economies of somany countries and so many business sectors.
The automobile industry has always been a barometer for the economic strength of a nation. It istherefore not surprising that this sector was amongst the worst-hit industrial sectors during the periodof this global meltdown. Automotive sales in North America, Continental Europe and the UnitedKingdom were particularly hard-hit in 2008-09, due mainly to the rise in fuel prices and the collapse ofthe banking institutions. Sales of cars in the United States declined by 21.5% over the previous yearwhile sales in Europe and the United Kingdom declined by 11.9% and 6.4% respectively. This resultedin dramatic changes in the structure of global auto makers. Two of the ‘Big Three’ U.S. car companiesfiled for bankruptcy in mid-2009 and re-emerged with substantial federal funds, a lower cost base,and lower debt. The new structure and the related government-led financial packages, along withmarket incentives helped the industry to survive this crisis. Today, auto makers the world over areconcentrating on new technologies to meet the stringent forthcoming emission goals which arebeing set. Hybrids and plug-in electric cars are also being introduced in the market in increasingnumbers as alternative propulsion options.
By contrast, the automotive sector in Asia experienced growth. China and India were the main driversof this growth. The domestic car markets of China and India have remained exceptionally buoyant.China, now the world’s largest car producer, saw its passenger car sales increase 47.5% from 5.7 millionunits in 2008 to 8.4 million units in 2009. India too witnessed growth in passenger vehicle sales of24.5% from 1.5 million units in FY09 to about 1.9 million units in FY10 in the domestic market.Commercial vehicle sales in India also registered a recovery of 40% on the increased execution ofmajor infrastructure projects in the country.
Consequently, Tata Motors posted record consolidated net revenues and profits of Rs. 92,519 crores($19,376 million) and Rs. 2,571 crores ($538 million) respectively during the current year. The Company’sdomestic sales in India for cars and commercial vehicles was 633,862 units – a growth of 34.1%.Passenger vehicle sales alone increased by 25.3% to 260,020 units.
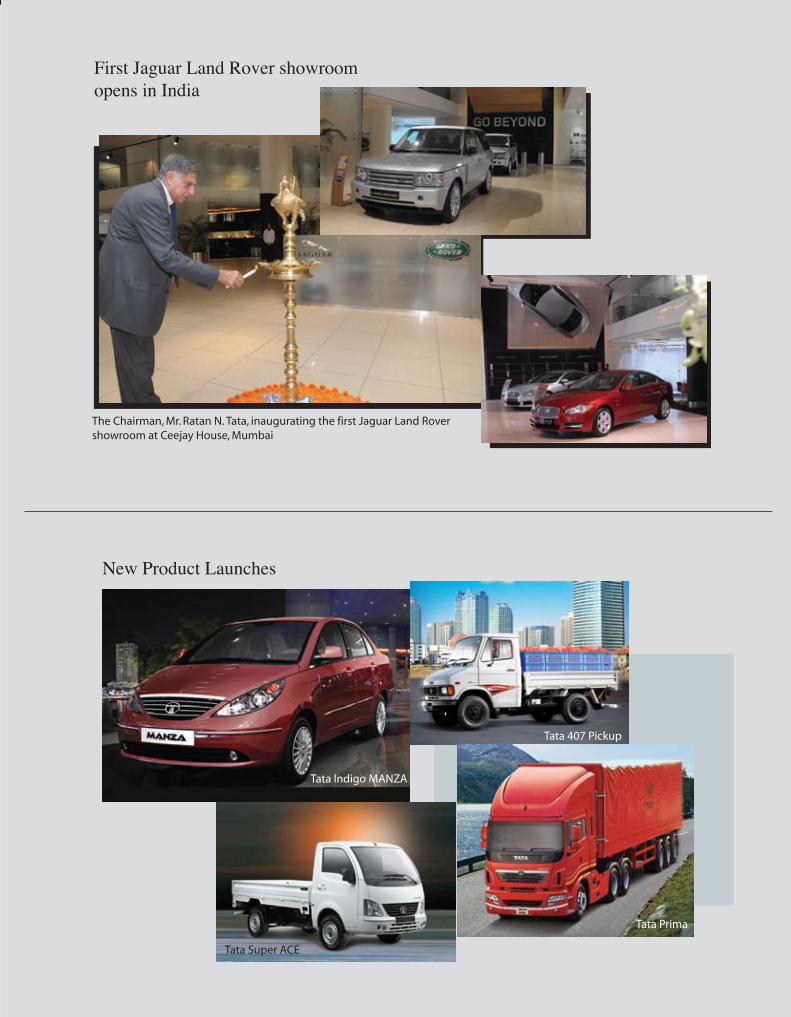
Jaguar/Land Rover wholesale sales for FY 2009-10 grew to almost 194,000 units. Both brands improvedtheir performance impressively mainly due to the very positive customer response to its newly-launched luxury sedans and the fact that the Company has succeeded in achieving a significantreduction in cost with improved operational efficiencies.

5
Also, during the year, despite the adverse market and financial conditions, Tata Motors was also ableto restructure and pay down its debt by $977 million, thus making the Company a stronger and moreviable enterprise.
Today and Beyond
The global automobile industry seems to be recovering – in line with the world’s improving economicclimate. Market sentiment has improved. The outlook for Tata Motors appears to be robust. Theautomotive demand in Asia remains strong and the market in Europe, United Kingdom and theUnited States has improved.
JLR’s operations have been profitable over the last two quarters and the new Jaguar and LandRover products recently launched have all been well-received in the market. The Company hasenormous talent, capabilities and skills, in addition to an impressive development of productand process technologies. These will enable the Company to achieve a more prominent positionin the international automobile marketplace in the coming years.
Highlights for each brand and their future plans are summarized below:-
o Jaguar – The newly launched XF and XJ luxury sedans have been welcomed by customersin the market. Jaguar cars are regaining the confidence of customers as being reliable, inaddition to being high-performance, with great road-handling and occupant safety.
The Company is considering widening the product range of Jaguar cars by introducing astation wagon, a new entry-level Jaguar, and a new roadster.
o Land Rover / Range Rover – The Range Rover continues to be the gold standard for off-road vehicles. Work is underway to revamp and refresh the entire model range. The newRange Rover ‘EVOQUE’ will be a bold design evolution in SUVs. Fuel-efficient ‘start/stop’and hybrid vehicles will also be introduced progressively. The current range of vehicleshas seen resurgence in demand, and the challenge before the Company today is to deliverenough vehicles to meet market demand. China has emerged as the third-largest globalmarket for Land Rover/Range Rover and studies are underway to consider options toincrease market penetration in China, India and other developing markets.
Tata Motors – India
During the year Tata Motors launched its all-new second-generation Indigo Manza sedan tojoin the new Indica Vista hatchback launched last year. Both have been well-received in themarket. In January, the Company also displayed its new Crossover vehicle, two new passengercarriers and an entire new range of heavy commercial vehicles. These are being releasedprogressively during the current year.
The shift of the Nano manufacturing facilities from Singur in West Bengal to Sanand in Gujarathas been completed. The new plant in Sanand, Gujarat, has become operational in a record 14months’ time and while this new facility will initially produce 250,000 Nanos per annum, it will

Sixty-fifth annual report 2009-10
Tata Motors Limited
6
have the capability to expand to 500,000 units per annum. In the interim, Nano deliveries hadbeen executed from the Company’s facilities in Uttaranchal. The new Sanand plant will nowmake it possible to derive scale and optimization of manufacturing processes. The Nano hasbeen selling extremely well and continues to evoke unprecedented customer interest acrossthe country.
Recognizing that scale and market growth are essential, Tata Motors has, in addition to itsdomestic growth, viewed international expansion as an important strategic factor. With theacquisition of Jaguar/Land Rover, Daewoo Commercial Vehicle Company Limited, HispanoCarrocera S.p.A. Spain, and a major bus joint venture with Marco Polo of Brazil, Tata Motorsexpects to be in a position to offer a much wider product range in passenger cars andcommercial vehicles in an increasing number of international markets. The operationalstrategy would be to leverage the Company’s strengths in the design and development ofproducts for the base of the pyramid, namely, addressing the often-unserved large potentialmarket at the low end, while also growing in the higher priced segment. The Company alsoplans to undertake several joint initiatives which will leverage the respective strengths andeconomies of its various domestic and overseas establishments.
While sales of JLR, as also the Indian commercial vehicle segment suffered badly in 2008-09during the global meltdown, resulting in a consolidated loss, all these segments have beenable to register an impressive recovery in 2009-10, vindicating the sound fundamentals of theCompany’s longer-term strategies.
There is great confidence that with the major initiatives undertaken in terms of globalacquisitions, product development, new product introductions and operational synergies,Tata Motors will achieve growth and take its place as a respected and viable automobileenterprise in the global industry with meaningful size and scale in the various segments inwhich it operates.
The progress which the Company has made would never have been possible without thetremendous support of our management, our workforce and our unions. We also appreciatethe confidence and loyalty displayed by our customers, whom we will always strive to servebetter. Last, but not least, we wish to thank our shareholders for their continued faith andsupport to the Company through good times and bad. All of this has gone towards makingTata Motors the company it is today. We would need this continued support to achieve thegoals we have set for Tata Motors in the years ahead.
Mumbai, July 16, 2010
Chairman
7
Notice
NOTICE IS HEREBY GIVEN THAT THE SIXTY-FIFTH ANNUAL GENERAL MEETING OF TATA MOTORS LIMITED will be held on Wednesday,
September 1, 2010 at 3.00 p.m., at Birla Matushri Sabhagar, 19, Sir Vithaldas Thackersey Marg, Mumbai 400 020 to transact the
following business:
Ordinary Business
1. To receive, consider and adopt the Audited Profit and Loss Account for the year ended March 31, 2010 and the Balance Sheet as
at that date together with the Reports of the Directors and the Auditors thereon.
2. To declare a dividend on Ordinary Shares and ‘A’ Ordinary Shares.
3. To appoint a Director in place of Mr Ratan N Tata, who retires by rotation and is eligible for re-appointment.
4. To appoint a Director in place of Dr R A Mashelkar, who retires by rotation and is eligible for re-appointment.
5. To consider and, if thought fit, to pass with or without modification, if any, the following resolution as an Ordinary Resolution:
“RESOLVED that Mr R Gopalakrishnan, a Director liable to retire by rotation, who does not seek re-election, be not re-appointed
a Director of the Company."
“RESOLVED FURTHER that the vacancy, so created on the Board of Directors of the Company, be not filled.”
6. To appoint Auditors and fix their remuneration.
Special Business
7. Appointment of Mr Ranendra Sen as a Director
To consider and, if thought fit, to pass with or without modification, if any, the following resolution as an Ordinary Resolution:
“RESOLVED that Mr Ranendra Sen who was appointed by the Board of Directors as an Additional Director of the Company with
effect from June 1, 2010 and who holds office upto the date of this Annual General Meeting of the Company, in terms of Section
260 of the Companies Act, 1956 (“the Act”), but who is eligible for appointment and in respect of whom the Company has
received a notice in writing from a Member under Section 257 of the Act proposing his candidature for the office of Director of
the Company, be and is hereby appointed a Director of the Company whose office shall be liable to retirement by rotation.”
8. Appointment of Mr Carl-Peter Forster as a Director
To consider and, if thought fit, to pass with or without modification, if any, the following resolution as an Ordinary Resolution:
“RESOLVED that Mr Carl-Peter Forster who was appointed by the Board of Directors as an Additional Director of the Company
with effect from April 1, 2010 and who holds office upto the date of this Annual General Meeting of the Company, in terms of
Section 260 of the Companies Act, 1956 (“the Act”), but who is eligible for appointment and in respect of whom the Company has
received a notice in writing from a Member under Section 257 of the Act proposing his candidature for the office of Director of
the Company, be and is hereby appointed a Director of the Company.”
9. Appointment of Mr Carl-Peter Forster as Chief Executive Officer and Managing Director
To consider and, if thought fit, to pass with or without modification, if any, the following resolution as an Ordinary Resolution:
“RESOLVED that pursuant to the provisions of Sections 198, 269, 309, and other applicable provisions, if any, of the Companies Act,
1956 (“the Act”), as amended or re-enacted from time to time, read with Schedule XIII of the Act and subject to the approval of the
Central Government, the Company hereby approves the appointment and terms of remuneration of Mr Carl-Peter Forster as the
Chief Executive Officer and Managing Director of the Company for the period from April 1, 2010 to March 31, 2013, upon the
terms and conditions, including the remuneration to be paid in the event of inadequacy of profits in any financial year as set out
in the Explanatory Statement annexed to the Notice convening this meeting, with liberty to the Directors to alter and vary the
terms and conditions of the said appointment in such manner as may be agreed to between the Directors and Mr Forster.”
Sixty-fifth annual report 2009-10
Tata Motors Limited
8
“RESOLVED FURTHER that the Board of Directors of the Company or a Committee thereof, be and is hereby authorised to take
all such steps as may be necessary, proper and expedient to give effect to this Resolution.”
By Order of the Board of Directors
H K SETHNAMumbai, July 1, 2010 Company Secretary
Registered Office:Bombay House, 24, Homi Mody Street, Mumbai 400 001
Notes:
a. The relative Explanatory Statement pursuant to Section 173 of the Companies Act, 1956 in respect of the business under Item Nos.5, 7 to 9 set
out above and details under Clause 49 of the Listing Agreement with the Stock Exchanges in respect of Directors seeking appointment/re-
appointment at this Annual General Meeting are annexed hereto.
b. A MEMBER ENTITLED TO ATTEND AND VOTE IS ENTITLED TO APPOINT A PROXY TO ATTEND AND VOTE ON A POLL INSTEAD OF HIMSELF AND THE
PROXY NEED NOT BE A MEMBER. The instrument appointing Proxy as per the format included in the Annual Report should be returned to the
Registered Office of the Company not less than FORTY-EIGHT HOURS before the time for holding the Meeting. Proxies submitted on behalf of
limited companies, societies, partnership firms, etc. must be supported by appropriate resolution /authority, as applicable, issued by the member
organization.
c. Only registered Members (including the holders of ‘A’ Ordinary Shares) of the Company may attend and vote at the Annual General Meeting.
The holders of the American Depositary Receipts (the ‘ADRs’) and Global Depositary Receipts (the ‘GDRs’) of the Company shall not be entitled to
attend the said Annual General Meeting. However, the ADR holders are entitled to give instructions for exercise of voting rights at the said
meeting through the Depositary, to give or withhold such consents, to receive such notice or to otherwise take action to exercise their rights
with respect to such underlying shares represented by each such American Depositary Share. A brief statement as to the manner in which such
voting instructions may be given is being sent to the ADR holders by the Depositary. The Depositary for the holders of the GDRs shall exercise
voting rights in respect of the deposited shares by issue of an appropriate proxy or power of attorney in terms of the Deposit Agreement
pertaining to the GDRs.
In respect of ‘A’ Ordinary Shares, if any resolution at the meeting is put to vote by a show of hands, each ‘A’ Ordinary Shareholder shall be entitled
to one vote, i.e., the same number of votes as available to holders of Ordinary Shares. If any resolution at the meeting is put to vote on a poll, or
if any resolution is put to vote by postal ballot, each ‘A’ Ordinary Shareholder shall be entitled to one vote for every ten ‘A’ Ordinary Shares held.
d. In case of joint holder attending the Meeting, only such joint holder who is higher in the order of names will be entitled to vote.
e. The Register of Members and Transfer Books of the Company will be closed from Thursday, August 12, 2010 to Wednesday, September 1, 2010, both
days inclusive. If the dividend as recommended by the Board of Directors is approved at the Annual General Meeting, payment of such dividend
will be made on or after September 2, 2010 as under:
(i) To all Beneficial Owners in respect of shares held in electronic form, as per the data made available by the National Securities Depository
Limited and the Central Depository Services (India) Limited, as of the close of business hours on August 11, 2010;
(ii) To all Members in respect of shares held in physical form, after giving effect to valid transfers in respect of transfer requests lodged with the
Company on or before the close of business hours on August 11, 2010.
The ‘A’ Ordinary Shareholders will receive dividend for any financial year at five percentage points more than the aggregate rate of dividend
declared on Ordinary Shares for that financial year.
f. To avoid loss of dividend warrants in transit and undue delay in respect of receipt of dividend warrants, the Company has provided a facility to the
Members for remittance of dividend through the National Electronic Clearing System (NECS). NECS essentially operates on the new and unique
bank account number allotted by banks post implementation of Core Banking Solutions (CBS) for centralized processing of inward instructions
and efficiency in handling bulk transactions. The NECS facility is available at locations identified by Reserve Bank of India from time to time and
covers most of the cities and towns. Members holding shares in physical form and desirous of availing this facility are requested to contact the
Company’s Registrars and Transfer Agents.
g. Members holding shares in dematerialised mode are requested to intimate all changes pertaining to their bank details, NECS, mandates, nominations,
power of attorney, change of address/name, PAN details, etc. to their Depository Participant only and not to the Company’s Registrars and Transfer
Agents. Changes intimated to the Depository Participant will then be automatically reflected in the Company’s records which will help the
Company and its Registrars and Transfer Agents to provide efficient and better service to the Members.
h. As per Securities and Exchange Board of India (SEBI) notification, submission of Permanent Account Number (PAN) is compulsorily required for
participating in the securities market, deletion of name of deceased shareholder or transmission/transposition of shares. Members holding
shares in dematerialised mode are requested to submit the PAN details to their Depository Participant, whereas Members holding shares in
physical form are requested to submit the PAN details to the Company’s Registrars and Transfer Agents.
i. Members’ attention is particularly drawn to the “Corporate Governance” section in respect of unclaimed and unpaid dividends.
j. Members desiring any information as regards the Accounts are requested to write to the Company at an early date so as to enable the Management
to keep the information ready at the Meeting.
k. As an austerity measure, copies of the Annual Report will not be distributed at the Annual General Meeting. Members are requested to bring
their copies to the Meeting.
9
Explanatory StatementThe following Explanatory Statement, pursuant to Section 173 of the Companies Act, 1956 ("the Act"), sets out all material facts
relating to the business mentioned at Item Nos. 5, 7 to 9 of the accompanying Notice dated July 1, 2010.
Item No. 5: In accordance with the provisions of Section 256 of the Act and the Articles of Association of the Company,
Mr R Gopalakrishnan retires by rotation. Mr R Gopalakrishnan has not sought re-election and it has been decided by the Board that
the vacancy so created on the Board of Directors of the Company should not be filled.
Mr Gopalakrishnan is a Director of the Company since December 22, 1998 and is also a Member of the Executive Committee of the
Board, Investors’ Grievance Committee and Ethics and Compliance Committee. The Board has placed on record its appreciation of
the contributions made by Mr Gopalakrishnan to the Company. Members’ attention is invited to the Directors’ Report.
Item No. 7: The Board of Directors (‘the Board’), at its Meeting held on May 27, 2010 appointed Mr Ranendra Sen as an Additional
Director with effect from June 1, 2010, pursuant to Section 260 of the Act and Article 132 of the Articles of Association of the Company.
Under Section 260 of the Act, Mr Sen ceases to hold office at this Annual General Meeting but is eligible for appointment as a
Director. Notice under Section 257 of the Act has been received from a Member signifying his intention to propose Mr Sen’s
appointment as a Director.
Mr Sen graduated from St. Xavier’s College and joined the Indian Foreign Service in 1966. From 1986 to 1991, he was Joint Secretary
to successive Prime Ministers, responsible for foreign and defence policies, atomic energy, space and other tasks. During his 43 years
as a public servant, he participated in about 180 multilateral and bilateral summits. Mr Sen served as a political appointee as
Ambassador to the United States during the most rapid and far-reaching transformation of India-US relations from 2004 to 2009.
Brief information of Mr Sen is given in the Annexure attached to the Notice.
The Board considers it desirable that the Company should continue to avail of the services of Mr Sen and accordingly commends
the Resolution at Item No.7 for approval by the Members.
Mr Sen is concerned or interested in Item No.7 of the Notice.
Item Nos. 8 and 9: Mr Carl-Peter Forster was appointed as the Group Chief Executive Officer of the Company w.e.f. February 15, 2010
and was entrusted with the overall responsibility of Tata Motors’ operations globally, including Jaguar Land Rover.
With over 4 million Tata vehicles plying in India, the Company is the country’s market leader in commercial vehicles and among the
top three passenger vehicle manufacturers in India. Tata cars, buses and trucks are being marketed in several countries in Europe,
Africa, the Middle East, South Asia and South America. It also has franchisee/joint venture assembly operations in Kenya, Bangladesh,
Ukraine, Russia and Senegal. Through subsidiaries and associate companies, Tata Motors has operations in the UK, South Korea,
Thailand and Spain. Among them is Jaguar Land Rover, the business comprising the two iconic British brands which were acquired
in 2008 which has global operations. The Company also has an industrial joint venture with Fiat S.p.A., Italy in India.
The Company is emerging as a major player in the global field with a presence in almost all Automobile segments. It is a reputed
brand worldwide especially in the recent years having a global footprint in almost all continents. The Company has further plans
to consolidate its position in various product segments in India and globally and is working on various initiatives, significant being,
improving quality, reducing cost, expanding product range and market reach.
Mr Forster has 24 years of international experience in the automobile industry and was the CEO of General Motors, Europe where
he looked after Opel/Vauxhall, Saab and European activities of Chevrolet. Prior to this, Mr Forster held various positions in BMW,
including that of Managing Director of BMW South Africa and was also on the Managing Board of BMW responsible for manufacturing.
Mr Forster holds a Diploma in Aeronautical Engineering from the Technical University in Munich and a Diploma in Economics from
the Rheinische Friedrichs-Wilhelm-Universitat in Bonn, Germany. Mr Forster, a German resident and national, holds a valid employment
Visa and registration certificate issued by Foreigners Regional Registration Office, Mumbai. Brief information of Mr Forster is given
in the Annexure attached to the Notice.
Taking into consideration the size and complexity of the Company’s global operations, the enormous responsibility for oversight
of the Tata Motors’ Group and the qualifications and accomplishments of Mr Forster, the Board at its meeting held on March 30, 2010
appointed Mr Forster as an Additional Director and subject to the approval of the Members and the Central Government, also as the
Chief Executive Officer and the Managing Director (‘the Managing Director’) of the Company w.e.f. April 1, 2010.
Under Section 260 of the Act, Mr Forster ceases to hold office at this Annual General Meeting but is eligible for appointment as
Director. Notice under Section 257 of the Act has been received from a Member signifying his intention to propose Mr Forster’s
appointment as a Director and the Members’ approval is sought for the said proposal vide Resolution at Item No.8.

Sixty-fifth annual report 2009-10
Tata Motors Limited
10
Pursuant to Section 302 of the Act, an Abstract of the main terms and conditions of Mr Forster’s appointment was sent to the
Members for their information. An application has also been made to the Central Government in respect of the said appointment
and remuneration to be paid to Mr Forster and the appointment is subject to receipt of the said approval.
The terms of appointment and remuneration as approved by the Board pursuant to the recommendation of the Remuneration
Committee include:-
a. Tenure of Agreement: April 1, 2010 to March 31, 2013.
b. Nature of duties: The Managing Director shall be responsible for the substantial management and administration of the
Company comprising primarily of contributing in high level business development, networking, business guidance, business
visibility, administration, finance, policy and decision making, in accordance with the directions of the Board. Mr Forster shall also
accept and discharge those duties which may be assigned to him by the Board from time to time including serving on the
Boards of associated/subsidiary companies or any other executive body or committee of such company and any other duties
which can be reasonably expected of him in consideration of his position as the Managing Director.
The discharge of the duties by Mr Forster shall be subject to superintendence, control and direction of the Board and shall also
be subject to any limits and restrictions imposed under the Agreement with the Company or imposed by Applicable Law, Articles
of Association of the Company, corporate governance documents, the approval of the Central Government and restrictions
imposed by the Board of the Company.
c. Remuneration:
Salary: Rs.34,90,000/- p.m.;
Bonus and variable incentives remuneration based on certain performance criteria laid down by the Board;
Benefits, perquisites and allowances as may be determined by the Board or a Committee thereof from time to time.
Minimum Remuneration: Notwithstanding anything to the contrary, where in any financial year, the Company has no profits or its
profits are inadequate during the currency of the tenure of the Managing Director, the Company will, subject to the approval of
Central Government as required under applicable laws continue to pay to Mr Forster, remuneration by way of Basic Salary, Incentive
Remuneration, benefits, bonus, perquisites and allowances as may be approved by the Board/Committee thereof from time to time.
d. Other terms of Appointment:
(i) During the Term, the Managing Director:
- is required to devote sufficient time and attention to the affairs and business of the Company and will have no other
engagement or employment in any capacity for remuneration or otherwise, without the prior written consent of the
Board or except to the extent with any subsidiary/affiliate of the Company;
- shall not become interested or otherwise concerned, directly or though his affiliates, in any selling agency of the Company.
(ii) The terms of appointment also include appropriate clauses for:
- non compete/conflict of interest and non-solicitation during the term and for a period of 12 months thereafter. For the
period of the post-contractual prohibition of competition and the post-contractual non-solicitation covenant set out
above, the Company would pay the Managing Director, compensation of 50% of his last drawn basic salary;
- adherence with the Tata Code of Conduct and maintenance of confidentiality.
(iii) During the Term, the Company or Mr Forster may terminate the appointment with effect to the end of a month upon
written notice to the other party, on the following terms:
- If the Managing Director elects to terminate his employment during this period, he shall be entitled to do so provided
he gives the Company 6 month’s basic salary.
- If the Company elects to terminate the Managing Director’s employment, it shall give the Managing Director all salary
and benefits payable under his employment agreement for the period of 3 years from the effective date of employment.
Within the said 3 year period, the Managing Director shall use reasonable efforts to find an appropriate new position,
in which event, 50% of the Managing Director’s salary and bonus entitlements shall be due to him.
- Notwithstanding anything mentioned above, the Company will have the right, after due inquiry and opportunity to
the Managing Director of being heard, to terminate the employment with immediate effect in the event it is proved
that the Managing Director is guilty of (a) misappropriation of funds; (b) serious violation of applicable laws, the
Company’s Articles of Association, the Tata Code of Conduct which result in significant loss or damage to the Company;
(c) serious violation of any of his duties which result in significant loss or damage to the Company; (d) repeated or
continuing breach or non observance by the Managing Director of the Board’s directives which result in significant
11
loss or damage to the Company; (e) abuse of confidential information for his own purposes; and (f ) an undisclosed
serious violation of the non-compete covenant.
In such event, the Company would not be required to pay the Managing Director any remuneration from the date of termination.
- Upon termination, the Managing Director would resign from the office as a director in the Company or other offices
held by him in the Company and/or any of its subsidiaries/affiliates without claim for compensation for loss of office.
(iv) Mr Forster is appointed as a Director by virtue of his employment in the Company and his appointment shall be subject
to the provisions of Section 283(1)(l) and other applicable provisions of the Act.
In compliance with the provisions of Sections 269, 309, and other applicable provisions of the Act read with Schedule XIII of the Act,
the terms of remuneration specified above are now being placed before the Members for their approval vide Resolution at Item No. 9.
The Board commends the Resolutions at Item Nos. 8 and 9 for approval by the Members.
Mr Forster is concerned or interested in Item Nos. 8 and 9 of the Notice.
By Order of the Board of Directors
H K SETHNAMumbai, July 1, 2010 Company Secretary
Registered Office:Bombay House, 24, Homi Mody Street, Mumbai 400 001
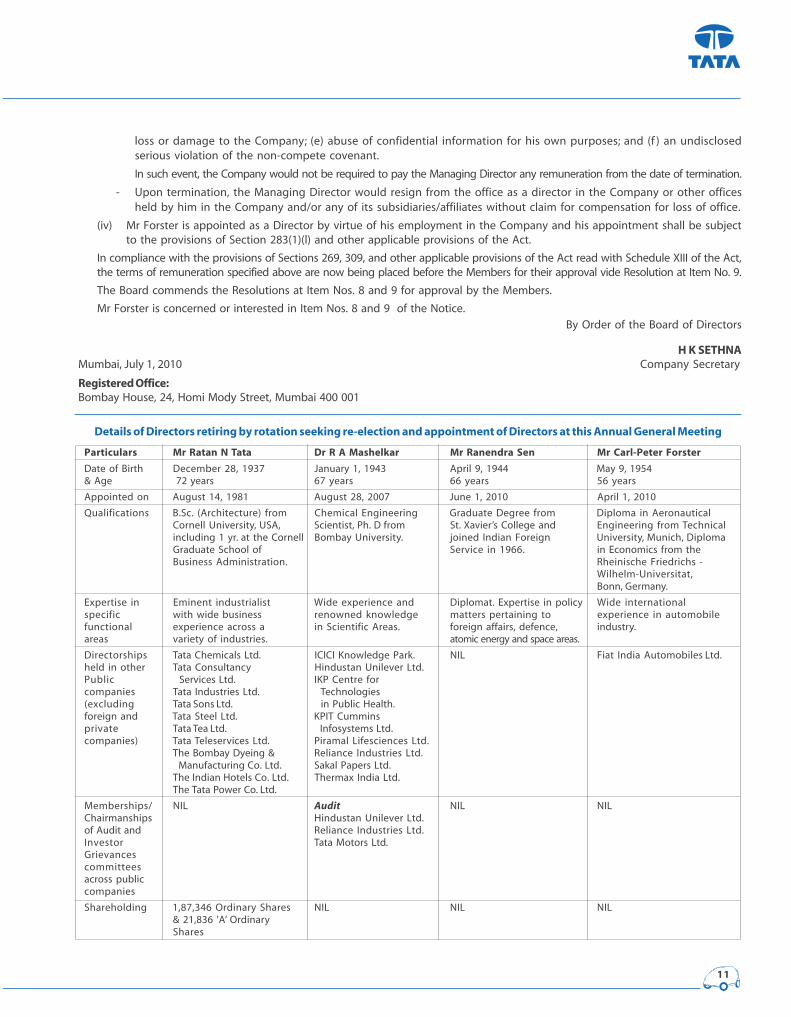
Particulars Mr Ratan N Tata Dr R A Mashelkar Mr Ranendra Sen Mr Carl-Peter Forster
Date of Birth December 28, 1937 January 1, 1943 April 9, 1944 May 9, 1954
& Age 72 years 67 years 66 years 56 years
Appointed on August 14, 1981 August 28, 2007 June 1, 2010 April 1, 2010
Qualifications B.Sc. (Architecture) from Chemical Engineering Graduate Degree from Diploma in Aeronautical
Cornell University, USA, Scientist, Ph. D from St. Xavier’s College and Engineering from Technical
including 1 yr. at the Cornell Bombay University. joined Indian Foreign University, Munich, Diploma
Graduate School of Service in 1966. in Economics from the
Business Administration. Rheinische Friedrichs -
Wilhelm-Universitat,
Bonn, Germany.
Expertise in Eminent industrialist Wide experience and Diplomat. Expertise in policy Wide international
specific with wide business renowned knowledge matters pertaining to experience in automobile
functional experience across a in Scientific Areas. foreign affairs, defence, industry.
areas variety of industries. atomic energy and space areas.
Directorships Tata Chemicals Ltd. ICICI Knowledge Park. NIL Fiat India Automobiles Ltd.
held in other Tata Consultancy Hindustan Unilever Ltd.
Public Services Ltd. IKP Centre for
companies Tata Industries Ltd. Technologies
(excluding Tata Sons Ltd. in Public Health.
foreign and Tata Steel Ltd. KPIT Cummins
private Tata Tea Ltd. Infosystems Ltd.
companies) Tata Teleservices Ltd. Piramal Lifesciences Ltd.
The Bombay Dyeing & Reliance Industries Ltd.
Manufacturing Co. Ltd. Sakal Papers Ltd.
The Indian Hotels Co. Ltd. Thermax India Ltd.
The Tata Power Co. Ltd.
Memberships/ NIL Audit NIL NIL
Chairmanships Hindustan Unilever Ltd.
of Audit and Reliance Industries Ltd.
Investor Tata Motors Ltd.
Grievances
committees
across public
companies
Shareholding 1,87,346 Ordinary Shares NIL NIL NIL
& 21,836 'A’ Ordinary
Shares
Details of Directors retiring by rotation seeking re-election and appointment of Directors at this Annual General Meeting
Sixty-fifth annual report 2009-10
Tata Motors Limited
12
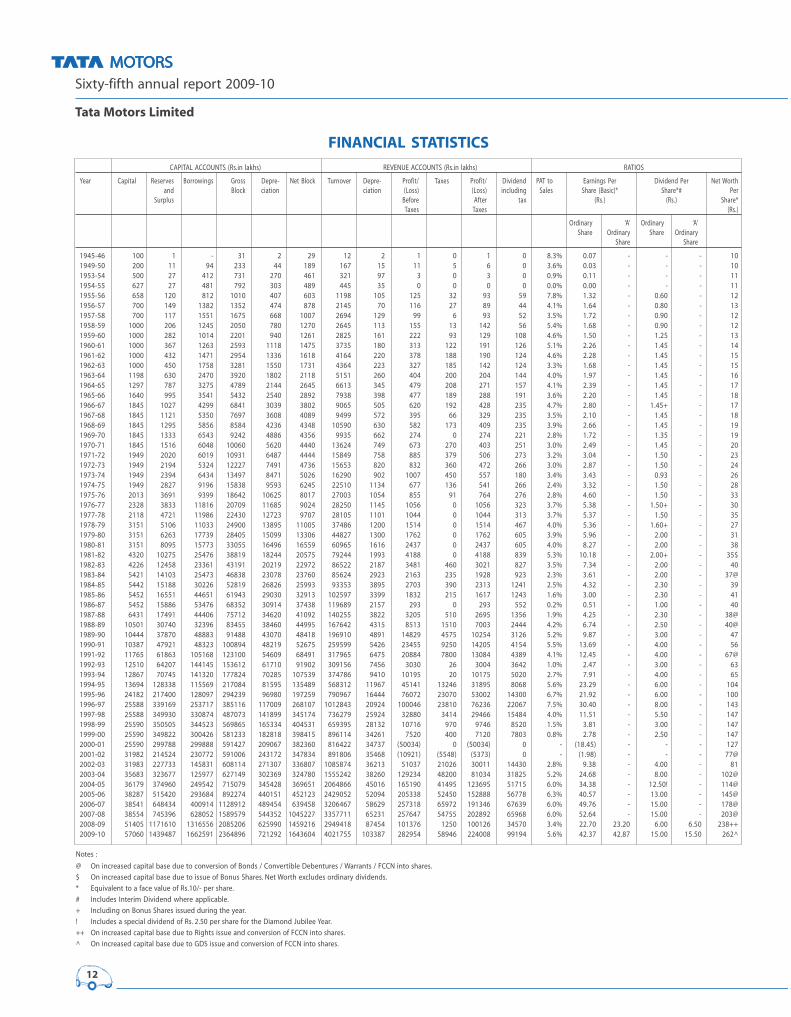
FINANCIAL STATISTICS
CAPITAL ACCOUNTS (Rs.in lakhs) REVENUE ACCOUNTS (Rs.in lakhs) RATIOS
Year Capital Reserves Borrowings Gross Depre- Net Block Turnover Depre- Profit/ Taxes Profit/ Dividend PAT to Earnings Per Dividend Per Net Worth
and Block ciation ciation (Loss) (Loss) including Sales Share (Basic)* Share*# Per
Surplus Before After tax (Rs.) (Rs.) Share*
Taxes Taxes (Rs.)
Ordinary ‘A’ Ordinary ‘A’
Share Ordinary Share Ordinary
Share Share
1945-46 100 1 - 31 2 29 12 2 1 0 1 0 8.3% 0.07 - - - 10
1949-50 200 11 94 233 44 189 167 15 11 5 6 0 3.6% 0.03 - - - 10
1953-54 500 27 412 731 270 461 321 97 3 0 3 0 0.9% 0.11 - - - 11
1954-55 627 27 481 792 303 489 445 35 0 0 0 0 0.0% 0.00 - - - 11
1955-56 658 120 812 1010 407 603 1198 105 125 32 93 59 7.8% 1.32 - 0.60 - 12
1956-57 700 149 1382 1352 474 878 2145 70 116 27 89 44 4.1% 1.64 - 0.80 - 13
1957-58 700 117 1551 1675 668 1007 2694 129 99 6 93 52 3.5% 1.72 - 0.90 - 12
1958-59 1000 206 1245 2050 780 1270 2645 113 155 13 142 56 5.4% 1.68 - 0.90 - 12
1959-60 1000 282 1014 2201 940 1261 2825 161 222 93 129 108 4.6% 1.50 - 1.25 - 13
1960-61 1000 367 1263 2593 1118 1475 3735 180 313 122 191 126 5.1% 2.26 - 1.45 - 14
1961-62 1000 432 1471 2954 1336 1618 4164 220 378 188 190 124 4.6% 2.28 - 1.45 - 15
1962-63 1000 450 1758 3281 1550 1731 4364 223 327 185 142 124 3.3% 1.68 - 1.45 - 15
1963-64 1198 630 2470 3920 1802 2118 5151 260 404 200 204 144 4.0% 1.97 - 1.45 - 16
1964-65 1297 787 3275 4789 2144 2645 6613 345 479 208 271 157 4.1% 2.39 - 1.45 - 17
1965-66 1640 995 3541 5432 2540 2892 7938 398 477 189 288 191 3.6% 2.20 - 1.45 - 18
1966-67 1845 1027 4299 6841 3039 3802 9065 505 620 192 428 235 4.7% 2.80 - 1.45+ - 17
1967-68 1845 1121 5350 7697 3608 4089 9499 572 395 66 329 235 3.5% 2.10 - 1.45 - 18
1968-69 1845 1295 5856 8584 4236 4348 10590 630 582 173 409 235 3.9% 2.66 - 1.45 - 19
1969-70 1845 1333 6543 9242 4886 4356 9935 662 274 0 274 221 2.8% 1.72 - 1.35 - 19
1970-71 1845 1516 6048 10060 5620 4440 13624 749 673 270 403 251 3.0% 2.49 - 1.45 - 20
1971-72 1949 2020 6019 10931 6487 4444 15849 758 885 379 506 273 3.2% 3.04 - 1.50 - 23
1972-73 1949 2194 5324 12227 7491 4736 15653 820 832 360 472 266 3.0% 2.87 - 1.50 - 24
1973-74 1949 2394 6434 13497 8471 5026 16290 902 1007 450 557 180 3.4% 3.43 - 0.93 - 26
1974-75 1949 2827 9196 15838 9593 6245 22510 1134 677 136 541 266 2.4% 3.32 - 1.50 - 28
1975-76 2013 3691 9399 18642 10625 8017 27003 1054 855 91 764 276 2.8% 4.60 - 1.50 - 33
1976-77 2328 3833 11816 20709 11685 9024 28250 1145 1056 0 1056 323 3.7% 5.38 - 1.50+ - 30
1977-78 2118 4721 11986 22430 12723 9707 28105 1101 1044 0 1044 313 3.7% 5.37 - 1.50 - 35
1978-79 3151 5106 11033 24900 13895 11005 37486 1200 1514 0 1514 467 4.0% 5.36 - 1.60+ - 27
1979-80 3151 6263 17739 28405 15099 13306 44827 1300 1762 0 1762 605 3.9% 5.96 - 2.00 - 31
1980-81 3151 8095 15773 33055 16496 16559 60965 1616 2437 0 2437 605 4.0% 8.27 - 2.00 - 38
1981-82 4320 10275 25476 38819 18244 20575 79244 1993 4188 0 4188 839 5.3% 10.18 - 2.00+ - 35$
1982-83 4226 12458 23361 43191 20219 22972 86522 2187 3481 460 3021 827 3.5% 7.34 - 2.00 - 40
1983-84 5421 14103 25473 46838 23078 23760 85624 2923 2163 235 1928 923 2.3% 3.61 - 2.00 - 37@
1984-85 5442 15188 30226 52819 26826 25993 93353 3895 2703 390 2313 1241 2.5% 4.32 - 2.30 - 39
1985-86 5452 16551 44651 61943 29030 32913 102597 3399 1832 215 1617 1243 1.6% 3.00 - 2.30 - 41
1986-87 5452 15886 53476 68352 30914 37438 119689 2157 293 0 293 552 0.2% 0.51 - 1.00 - 40
1987-88 6431 17491 44406 75712 34620 41092 140255 3822 3205 510 2695 1356 1.9% 4.25 - 2.30 - 38@
1988-89 10501 30740 32396 83455 38460 44995 167642 4315 8513 1510 7003 2444 4.2% 6.74 - 2.50 - 40@
1989-90 10444 37870 48883 91488 43070 48418 196910 4891 14829 4575 10254 3126 5.2% 9.87 - 3.00 - 47
1990-91 10387 47921 48323 100894 48219 52675 259599 5426 23455 9250 14205 4154 5.5% 13.69 - 4.00 - 56
1991-92 11765 61863 105168 123100 54609 68491 317965 6475 20884 7800 13084 4389 4.1% 12.45 - 4.00 - 67@
1992-93 12510 64207 144145 153612 61710 91902 309156 7456 3030 26 3004 3642 1.0% 2.47 - 3.00 - 63
1993-94 12867 70745 141320 177824 70285 107539 374786 9410 10195 20 10175 5020 2.7% 7.91 - 4.00 - 65
1994-95 13694 128338 115569 217084 81595 135489 568312 11967 45141 13246 31895 8068 5.6% 23.29 - 6.00 - 104
1995-96 24182 217400 128097 294239 96980 197259 790967 16444 76072 23070 53002 14300 6.7% 21.92 - 6.00 - 100
1996-97 25588 339169 253717 385116 117009 268107 1012843 20924 100046 23810 76236 22067 7.5% 30.40 - 8.00 - 143
1997-98 25588 349930 330874 487073 141899 345174 736279 25924 32880 3414 29466 15484 4.0% 11.51 - 5.50 - 147
1998-99 25590 350505 344523 569865 165334 404531 659395 28132 10716 970 9746 8520 1.5% 3.81 - 3.00 - 147
1999-00 25590 349822 300426 581233 182818 398415 896114 34261 7520 400 7120 7803 0.8% 2.78 - 2.50 - 147
2000-01 25590 299788 299888 591427 209067 382360 816422 34737 (50034) 0 (50034) 0 - (18.45) - - - 127
2001-02 31982 214524 230772 591006 243172 347834 891806 35468 (10921) (5548) (5373) 0 - (1.98) - - - 77@
2002-03 31983 227733 145831 608114 271307 336807 1085874 36213 51037 21026 30011 14430 2.8% 9.38 - 4.00 - 81
2003-04 35683 323677 125977 627149 302369 324780 1555242 38260 129234 48200 81034 31825 5.2% 24.68 - 8.00 - 102@
2004-05 36179 374960 249542 715079 345428 369651 2064866 45016 165190 41495 123695 51715 6.0% 34.38 - 12.50! - 114@
2005-06 38287 515420 293684 892274 440151 452123 2429052 52094 205338 52450 152888 56778 6.3% 40.57 - 13.00 - 145@
2006-07 38541 648434 400914 1128912 489454 639458 3206467 58629 257318 65972 191346 67639 6.0% 49.76 - 15.00 - 178@
2007-08 38554 745396 628052 1589579 544352 1045227 3357711 65231 257647 54755 202892 65968 6.0% 52.64 - 15.00 - 203@
2008-09 51405 1171610 1316556 2085206 625990 1459216 2949418 87454 101376 1250 100126 34570 3.4% 22.70 23.20 6.00 6.50 238++
2009-10 57060 1439487 1662591 2364896 721292 1643604 4021755 103387 282954 58946 224008 99194 5.6% 42.37 42.87 15.00 15.50 262^
Notes :
@ On increased capital base due to conversion of Bonds / Convertible Debentures / Warrants / FCCN into shares.
$ On increased capital base due to issue of Bonus Shares. Net Worth excludes ordinary dividends.
* Equivalent to a face value of Rs.10/- per share.
# Includes Interim Dividend where applicable.
+ Including on Bonus Shares issued during the year.
! Includes a special dividend of Rs. 2.50 per share for the Diamond Jubilee Year.
++ On increased capital base due to Rights issue and conversion of FCCN into shares.
^ On increased capital base due to GDS issue and conversion of FCCN into shares.
13
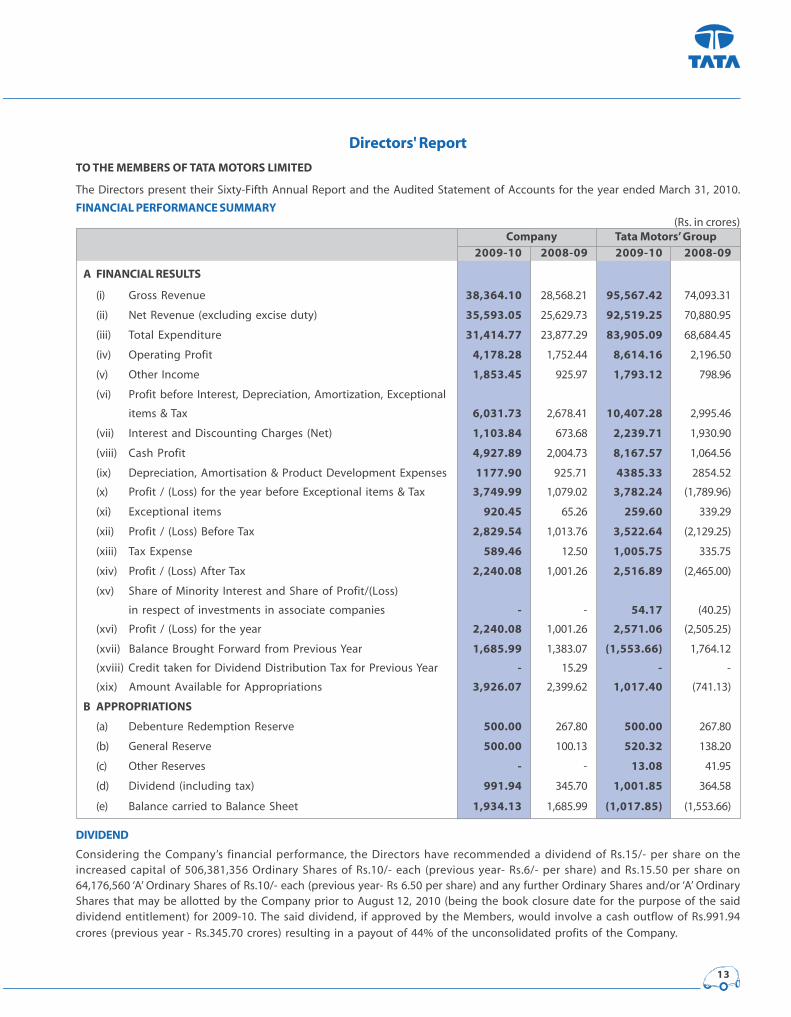
Directors' Report
TO THE MEMBERS OF TATA MOTORS LIMITED
The Directors present their Sixty-Fifth Annual Report and the Audited Statement of Accounts for the year ended March 31, 2010.
FINANCIAL PERFORMANCE SUMMARY(Rs. in crores)
Company Tata Motors’ Group2009-10 2008-09 2009-10 2008-09
A FINANCIAL RESULTS
(i) Gross Revenue 38,364.10 28,568.21 95,567.42 74,093.31
(ii) Net Revenue (excluding excise duty) 35,593.05 25,629.73 92,519.25 70,880.95
(iii) Total Expenditure 31,414.77 23,877.29 83,905.09 68,684.45
(iv) Operating Profit 4,178.28 1,752.44 8,614.16 2,196.50
(v) Other Income 1,853.45 925.97 1,793.12 798.96
(vi) Profit before Interest, Depreciation, Amortization, Exceptional
items & Tax 6,031.73 2,678.41 10,407.28 2,995.46
(vii) Interest and Discounting Charges (Net) 1,103.84 673.68 2,239.71 1,930.90
(viii) Cash Profit 4,927.89 2,004.73 8,167.57 1,064.56
(ix) Depreciation, Amortisation & Product Development Expenses 1177.90 925.71 4385.33 2854.52
(x) Profit / (Loss) for the year before Exceptional items & Tax 3,749.99 1,079.02 3,782.24 (1,789.96)
(xi) Exceptional items 920.45 65.26 259.60 339.29
(xii) Profit / (Loss) Before Tax 2,829.54 1,013.76 3,522.64 (2,129.25)
(xiii) Tax Expense 589.46 12.50 1,005.75 335.75
(xiv) Profit / (Loss) After Tax 2,240.08 1,001.26 2,516.89 (2,465.00)
(xv) Share of Minority Interest and Share of Profit/(Loss)
in respect of investments in associate companies - - 54.17 (40.25)
(xvi) Profit / (Loss) for the year 2,240.08 1,001.26 2,571.06 (2,505.25)
(xvii) Balance Brought Forward from Previous Year 1,685.99 1,383.07 (1,553.66) 1,764.12
(xviii) Credit taken for Dividend Distribution Tax for Previous Year - 15.29 - -
(xix) Amount Available for Appropriations 3,926.07 2,399.62 1,017.40 (741.13)
B APPROPRIATIONS
(a) Debenture Redemption Reserve 500.00 267.80 500.00 267.80
(b) General Reserve 500.00 100.13 520.32 138.20
(c) Other Reserves - - 13.08 41.95
(d) Dividend (including tax) 991.94 345.70 1,001.85 364.58
(e) Balance carried to Balance Sheet 1,934.13 1,685.99 (1,017.85) (1,553.66)
DIVIDEND
Considering the Company’s financial performance, the Directors have recommended a dividend of Rs.15/- per share on the
increased capital of 506,381,356 Ordinary Shares of Rs.10/- each (previous year- Rs.6/- per share) and Rs.15.50 per share on
64,176,560 ‘A’ Ordinary Shares of Rs.10/- each (previous year- Rs 6.50 per share) and any further Ordinary Shares and/or ‘A’ Ordinary
Shares that may be allotted by the Company prior to August 12, 2010 (being the book closure date for the purpose of the said
dividend entitlement) for 2009-10. The said dividend, if approved by the Members, would involve a cash outflow of Rs.991.94
crores (previous year - Rs.345.70 crores) resulting in a payout of 44% of the unconsolidated profits of the Company.
Sixty-fifth annual report 2009-10
Tata Motors Limited
14
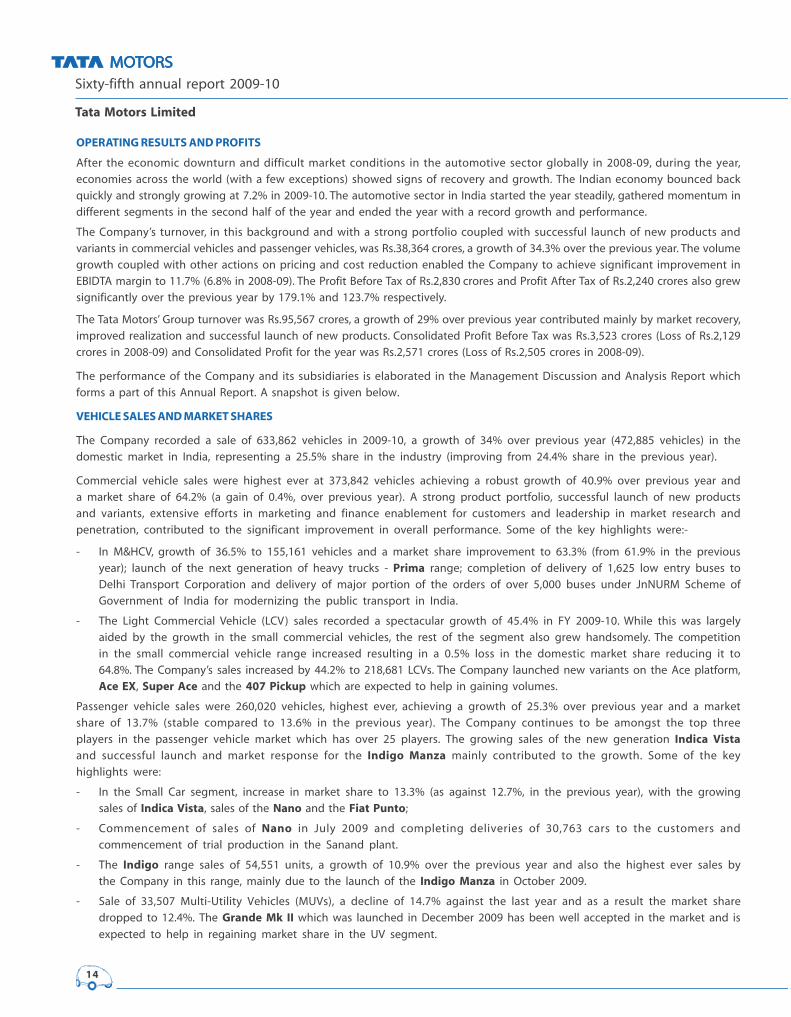
OPERATING RESULTS AND PROFITS
After the economic downturn and difficult market conditions in the automotive sector globally in 2008-09, during the year,
economies across the world (with a few exceptions) showed signs of recovery and growth. The Indian economy bounced back
quickly and strongly growing at 7.2% in 2009-10. The automotive sector in India started the year steadily, gathered momentum in
different segments in the second half of the year and ended the year with a record growth and performance.
The Company’s turnover, in this background and with a strong portfolio coupled with successful launch of new products and
variants in commercial vehicles and passenger vehicles, was Rs.38,364 crores, a growth of 34.3% over the previous year. The volume
growth coupled with other actions on pricing and cost reduction enabled the Company to achieve significant improvement in
EBIDTA margin to 11.7% (6.8% in 2008-09). The Profit Before Tax of Rs.2,830 crores and Profit After Tax of Rs.2,240 crores also grew
significantly over the previous year by 179.1% and 123.7% respectively.
The Tata Motors’ Group turnover was Rs.95,567 crores, a growth of 29% over previous year contributed mainly by market recovery,
improved realization and successful launch of new products. Consolidated Profit Before Tax was Rs.3,523 crores (Loss of Rs.2,129
crores in 2008-09) and Consolidated Profit for the year was Rs.2,571 crores (Loss of Rs.2,505 crores in 2008-09).
The performance of the Company and its subsidiaries is elaborated in the Management Discussion and Analysis Report which
forms a part of this Annual Report. A snapshot is given below.
VEHICLE SALES AND MARKET SHARES
The Company recorded a sale of 633,862 vehicles in 2009-10, a growth of 34% over previous year (472,885 vehicles) in the
domestic market in India, representing a 25.5% share in the industry (improving from 24.4% share in the previous year).
Commercial vehicle sales were highest ever at 373,842 vehicles achieving a robust growth of 40.9% over previous year and
a market share of 64.2% (a gain of 0.4%, over previous year). A strong product portfolio, successful launch of new products
and variants, extensive efforts in marketing and finance enablement for customers and leadership in market research and
penetration, contributed to the significant improvement in overall performance. Some of the key highlights were:-
- In M&HCV, growth of 36.5% to 155,161 vehicles and a market share improvement to 63.3% (from 61.9% in the previous
year); launch of the next generation of heavy trucks - Prima range; completion of delivery of 1,625 low entry buses to
Delhi Transport Corporation and delivery of major portion of the orders of over 5,000 buses under JnNURM Scheme of
Government of India for modernizing the public transport in India.
- The Light Commercial Vehicle (LCV) sales recorded a spectacular growth of 45.4% in FY 2009-10. While this was largely
aided by the growth in the small commercial vehicles, the rest of the segment also grew handsomely. The competition
in the small commercial vehicle range increased resulting in a 0.5% loss in the domestic market share reducing it to
64.8%. The Company’s sales increased by 44.2% to 218,681 LCVs. The Company launched new variants on the Ace platform,
Ace EX, Super Ace and the 407 Pickup which are expected to help in gaining volumes.
Passenger vehicle sales were 260,020 vehicles, highest ever, achieving a growth of 25.3% over previous year and a market
share of 13.7% (stable compared to 13.6% in the previous year). The Company continues to be amongst the top three
players in the passenger vehicle market which has over 25 players. The growing sales of the new generation Indica Vistaand successful launch and market response for the Indigo Manza mainly contributed to the growth. Some of the key
highlights were:
- In the Small Car segment, increase in market share to 13.3% (as against 12.7%, in the previous year), with the growing
sales of Indica Vista, sales of the Nano and the Fiat Punto;
- Commencement of sales of Nano in July 2009 and completing deliveries of 30,763 cars to the customers and
commencement of trial production in the Sanand plant.
- The Indigo range sales of 54,551 units, a growth of 10.9% over the previous year and also the highest ever sales by
the Company in this range, mainly due to the launch of the Indigo Manza in October 2009.
- Sale of 33,507 Multi-Utility Vehicles (MUVs), a decline of 14.7% against the last year and as a result the market share
dropped to 12.4%. The Grande Mk II which was launched in December 2009 has been well accepted in the market and is
expected to help in regaining market share in the UV segment.
15
- Sale of 24,884 Fiat cars which has given Fiat a 1.3% market share as against 0.5% in the previous year with Linea sales
at 11,102 nos. (a segment share of 10.1%) and the Grande Punto sales at 13,281 (a segment share of 3.5%).
- The Company sold 225 Jaguar and Land Rover vehicles through its exclusive dealerships in India in the first year of
the sales of the Jaguar Land Rover brands.
The Company’s international business remained affected by the economic downturn in many of the key markets. The
Company’s commercial vehicle exports grew moderately by 4.7% to 27,878 vehicles and passenger vehicles exports declined
by 9.9% to 6,231 vehicles. With improved economic outlook and market recovery and with the new product range, the
Company expects significant improvement in its international business in the future.
Tata Motors’ Group sales were 880,396 vehicles across its entire range of products and markets. The key highlights were:
- The Company has sold 667,971 vehicles.
- Jaguar Land Rover achieved sale of 193,982 vehicles as compared to 167,348 vehicles in 2008-09 (in 10 months since Tata
Motors acquisition of the business in June 2008). Jaguar Land Rover continued to enhance its product offerings through an
all new XFR, powertrain offerings and 2010 model year vehicles. The new Jaguar XJ was unveiled in London in July 2009 and
had its public debut at the Frankfurt Motor Show in September 2009.
- In South Korea, Tata Daewoo Commercial Vehicle Company Limited ( TDCV) successfully launched the new premium
truck platform – Prima; TDCV sales were stagnant at 9,011 vehicles in Korea and international markets as compared
to 9,137 vehicles in the previous year.
- In Thailand, Tata Motors (Thailand) Limited saw a very good response to the CNG version of the Tata Pick-up vehicle – Xenon.
TATA MOTORS FINANCE LIMITED- CUSTOMER FINANCING INITIATIVES
The vehicle financing activity under the brand “Tata MotorFinance” (TMF) of Tata Motors Finance Limited, a wholly-owned
subsidiary company, financed a total of 1,44,806 vehicles during the year as compared to 1,00,611 vehicles in the previous year.
Total disbursements were Rs.6,697 crores as against Rs.4,900 crores in the previous year. The disbursals for new commercial
vehicles were Rs.5,123 crores (96,593 units) as compared to Rs.3,319 crores (59,467 units) during the previous year. For passenger
cars, total disbursements were Rs.1,454 crores (48,213 units) as compared to Rs.1,288 crores (41,144 units) in the previous year. The
market share in terms of products financed by the Company increased from 22.4% in commercial vehicles to 26% and remained
constant at 21% in passenger cars. TMF has shown improvements in disbursements as well as Net Interest Margins, mainly driven
by the overall economic recovery coupled with a strong focus on controlling costs, improving quality of fresh acquisitions, micro-
management of collections. TMF’s strategy on controlling, managing and reversing non-performing assets (NPAs) and ‘Risk Scored
Pricing Model’ thrust on customer relations and a branch based re-organised field structure has set a robust platform to enable
future growth.
HUMAN RESOURCES & INDUSTRIAL RELATIONS
Industrial Relations were cordial at all locations. In a challenging environment and business conditions, the support from the
workforce and unions was positive throughout. The key highlights in the human resources and industrial relations were:-
- The Company’s plant at Uttarakhand was conferred with the prestigious Golden Peacock Award for Safety & Environment
and the National Award for energy conservation by the Ministry of Power. The Pune plant received the Frost and Sullivan
Green leader award for 2009 in the automotive sector. The Jamshedpur plant obtained a revised and updated certification
under SA 8000 - a global social accountability standard for working conditions, certifying labour practices at the
facilities including those of suppliers. Towards organizational health and safety, the plants at Jamshedpur, Pune, Uttarakhand
and Lucknow are certified under OHSAS 18001. The communication on progress during 2009-10 was submitted to the United
Nations Global Compact. The Company has also submitted GRI report for 2008-09 based on G3 Guidelines of sustainability
reporting framework. The Company also undertook several initiatives, including on-line tools for performance improvement,
employee development and training.
- At Jaguar Land Rover, the year under review was dominated by the economic downturn and the need to cut costs quickly,
which resulted in large numbers of non-production shifts in the 3 UK plants (Castle Bromwich, Halewood and Solihull).
Jaguar Land Rover worked closely with its Trade Unions and negotiated a Framework Agreement which secured £68 million
Sixty-fifth annual report 2009-10
Tata Motors Limited
16
of cost savings. It closed its Defined Benefit pension scheme to new workers with effect from April 24, 2010, by introducing
a Defined Contribution scheme. All Jaguar Land Rover sites have been prepared to commence certification process for OHSAS
18001 external accreditation for Health and Safety standards, commencing July 2010.
The Company had 482 employees who were in receipt of remuneration of not less than Rs.24 lacs during the year or Rs. 2 lacs per month during
any part of the said year. The Information required under Section 217(2A) of the Companies Act, 1956 and the Rules made thereunder is provided
in the Annexure forming part of the Report. In terms of Section 219(1)(b)(iv) of the Act, the Report and Accounts are being sent to the shareholders
excluding the aforesaid Annexure. Any Shareholder interested in obtaining a copy of the same may write to the Company Secretary.
FINANCE
The borrowings of the Company as on March 31, 2010 stood at Rs.16,625.91 crores (previous year Rs.13,165.56 crores). The key
highlights were:-
- In 2009-10, the Company raised Rs.4,200 crores from the issue of Secured, Rated, Credit Enhanced, Listed, 2% Coupon
Non-Convertible Debentures (NCDs) with premium on redemption and Rs.200 crores from the issue of 9.95% Secured NCDs.
- In a challenging financial market environment, the Company successfully rolled over in May 2009, the bridge finance it
had obtained for acquisition of the Jaguar Land Rover business for a period of 18 months, till December 2010. Subsequently,
the Company was able to prepay this loan facility in October 2009 from certain divestments, improved cash generation
from operations and also through fund raised, US$ 375 million from the issue of Global Depository Receipts and US$ 375
million from issue of Foreign Currency Convertible Notes.
- Further, the Company made a limited period enhanced conversion offer to the non-U.S. holders of the 0% JPY 11,760
million and 1% US$ 300 million Convertible Notes. The offer met with great success with bondholders representing 93%
of the JPY bonds and 76% of US$ series bonds, opting to convert their bonds into Ordinary Shares, which resulted in debt
of US$ 345 million being extinguished against the issue of 26.64 million Ordinary Shares.
- The Company also sold 20% stake in Telco Construction Equipment Company Limited ( Telcon), in favour of Hitachi
Construction Machinery Co. Ltd. (Hitachi) for a consideration of Rs.1,152.51 crores (net of expenses) resulting in the
Company’s shareholding being reduced to 40% (on consolidated basis).
Jaguar Land Rover completed guarantee arrangements to facilitate the drawdown of a £338 million loan from European Investment
Bank for its projects aimed at emission reduction, besides other financing activities like an inventory financing facility; renewal of
a US$200 million loan; and repaid short term borrowing totaling £220 million.
Tata Motors’ Group debt:equity ratio in the operations continues to remain high at 4.3:1, though significantly bought down from
5.9:1 as at March 31, 2009. The Board is conscious of this, and the need to strengthen the long-term funding for the business.
The Company will further consider suitable steps to de-leverage and hence de-risk the balance sheet from volatility and has also
taken and will continue to implement suitable steps for raising long term resources to match the Company’s fund requirement
and to optimize its loan maturity profile. The Company’s rating for foreign currency borrowings was revised by Standard & Poor
to B (Positive Outlook) and by Moodys’ to B3 (Stable Outlook). For borrowing in local currency the rating was revised to A+ (Stable
Outlook) by Crisil and to LA+ (Stable Outlook) by ICRA.
INFORMATION TECHNOLOGY INITIATIVES
Tata Motors' Group continued to reinforce its IT capabilities in all areas of business in design/ engineering, manufacturing, vendor
interface and dealer/customer interface functions. The major initiatives undertaken were:-
- in Product Development/Engineering, 3D design visualization capability, enriching digital content by adding behaviour
to digital models, Knowledge Based Engineering tools and enhanced digital collaboration with vendors;
17
- Digital manufacturing solutions and validation was extensively deployed for the Nano facilities planning; manufacturing
Execution systems implemented in the high-volume plants at Uttarakhand and Sanand;
- Supplier portal, which facilitates close collaboration from design/development stage to production planning and scheduling;
- CRM-DMS program enhancements, which further enrich the on-line common platform system for the Company’s sales,
spare parts service activities and for all channel partners, giving the Company an on-line real-time market and customer
interaction and information capability;
- Extension of customer touch points through web, call centre and SMS.
- Jaguar Land Rover completed the process of separating its operations in markets where it previously operated as a part
of the Ford legal entity and the process to separate the IT infrastructure and support systems is expected to be
completed shortly. Jaguar Land Rover also rolled out its new SAP solution to many of its existing National Sales
Companies around the world including South Africa, Brazil, North America, France and China. Jaguar Land Rover has
initiated a major programme to re-engineer Product Creation capability, covering every aspect of Product Lifecycle
Management (PLM) from concept to recycling, delivering a system that will provide everyone with immediate access to
all Product Creation information, with simple-to-use, graphically-orientated user interfaces.
Tata Technologies Limited continues to be a key strategic partner in several of these technology initiatives.
NEW PRODUCT, TECHNOLOGY AND ENVIRONMENT - FRIENDLY INITIATIVES
Product Development
Tata Motors' Group continuously assesses customer needs to develop new and innovative products which deliver better value to
its customers. In pursuance of this strategy, the Company has developed significant in-house capabilities and works with a range
of partners to keep its product profile rich and meet market expectations. Some of the key initiatives and projects include :-
- The new heavy truck range Prima unveiled in May 2009, will be enriched through several product and application variants
such as tractor trailers, tippers, rigid trucks over the next few years. TDCV received the Grand Prize of 2009 Good Design
Selection of Korea for the Prima, and development on a range of light trucks is underway.
- The new range of buses (based on the Prima platform with bodies being made by Tata Marcopolo displayed at the Delhi Auto
Expo in January 2010) have been launched. Tata Hispano has developed a new Intercity Coach the Xerus and a new Suburban
Bus, the Intea and is working on developing a range of other buses.
- In small commercial vehicles, the Ace platform is being exploited to introduce variants to address various market segments.
The Ace EX and Super Ace have been launched and the Company will introduce the multi-purpose vehicle, Venture, the
passenger vehicle variant, Magic Iris and the micro-truck Ace Zip.
- The Aria, India's first indigenously developed crossover vehicle, showcased at the last Auto Expo is expected to be launched
in the first half of 2010-11.
- Variants of the Nano, to suit specific needs of the domestic and international markets are being developed. Increased thrust
is being made to explore opportunities for launch of the Indica Vista and the Indigo Manza in various international markets.
- In July 2009, Jaguar Land Rover launched to the world, the beginnings of its response to Environmental and C02 challenges
with more compact and efficient vehicles. The New XJ launched in early 2010-11, features the next generation Jaguar's
aerospace-inspired aluminum body architecture enhanced power train with ultra efficient petrol and diesel engine variants,
highest standards of personal luxury and specifications, amongst which is its instrument cluster with a 12" thin film transistor
(TFT) screen. The Range Rover Evoque, a new more compact product, with class leading C02 performance and technology is
under development. The product will showcase technology features including 'Park-for-you' and 'Magna-ride' to deliver
outstanding Chassis dynamics, whilst also showcasing increased use of Aluminium and composites for exterior body panels
to reduce weight.
Development of Environment-friendly Technologies
As a responsible automobile manufacturer, Tata Motors' Group aims to develop vehicles and technologies to reduce the carbon
footprint by developing vehicles running on alternative fuels and hybrids such as:

Sixty-fifth annual report 2009-10
Tata Motors Limited
18
- Development of a complete range of CNG vehicles including Ace, Magic, Xenon, Winger, Indigo and also trucks and buses.
Over 2200 CNG fuelled buses were supplied to Delhi Transport Corporation. Tata Motors (Thailand) Limited was the first OEM
to offer a factory fitted CNG variant of the Xenon pickup in the Thai market. Tata Daewoo Commercial Vehicle Co. Ltd. (TDCV)
pioneered the development and introduction of the first Liquefied Natural Gas (LNG) tractor trailer and the LPG MCV truck
in the South Korean market.
- Hybrid technologies offer perfect solutions for certain commercial vehicle applications. The Company is working on developing
Diesel and CNG hybrid solutions for city bus applications in India and also in Spain through its subsidiary Tata Hispano. Tata
Hispano received a grant from the Spanish Government for the development of a Hybrid Low Floor City Bus. The Company
is working on both, series and parallel hybrid solutions and plans to display the vehicles during the Delhi Commonwealth
Games in October 2010. A mild-hybrid on the Ace platform - Ace Ex with a start-stop arrangement which delivers a saving in
fuel consumption in heavy traffic conditions was launched in the previous year.
- On the electric vehicle range, the Company has secured its position in research and development of electric vehicle technology.
Ace EV, displayed at Zaragosa exhibition in 2008 and Vista EV displayed at Geneva Motor show in 2009, are in advanced stages
of development. These vehicles will be launched in the European markets, especially the northern European market where
there are strong fiscal incentives for such vehicles in the urban city centers.
- The Company is simultaneously working to introduce a range of technologies, which will help in reducing fuel consumption
on its petrol and diesel powered vehicles such as improved fuel injection systems, electric power steering, radial tyres for
commercial vehicles, low resistance tyres, automatic transmissions and weight reduction of components.
- Despite the severe financial conditions of the last 12 months, Jaguar Land Rover has continued to invest heavily in process
and product research. During the past 12 months, 120 technology projects have been progressed toward implementation on
future programmes. The 10 model year programmes delivered a range of advanced technologies including Dual View Screen
(world first), Continuously Variable Damping, Auto Headlamp Dipping and Advanced All-Round Camera features. All of these
were well received by the press and customers alike and served to raise the technology image of Jaguar Land Rover products.
- Further, an extensive range of new technologies are under development for future programmes including 'Series' and
'Parallel' hybrid vehicles, with the first generation of full parallel hybrids moving towards application readiness later this
year. Other projects include Limo-green (series Hybrid), Power train downsizing, EV transmissions, etc; some of which have
been successful in securing government funding.
SUBSIDIARY/ASSOCIATE COMPANIES AND CONSOLIDATED FINANCIAL STATEMENTS
a. During the year, the following changes have taken place in subsidiary companies:
Subsidiary companies formed/acquired:
� Tata Hispano Motors Carrocera S.A., (Hispano) became a subsidiary consequent upon the Company exercising its put
option and increasing its stake from 21% to 100%. Consequently its wholly owned subsidiary Carrosseries Hispano
Maghreb, Morocco also became the Company's subsidiary.
� JaguarLandRover Limited, the Company’s subsidiary formed the following subsidiaries, viz. Jaguar Land Rover Brazil
LLC, Limited Liability Company "Jaguar Land Rover" (Russia), Land Rover Parts Limited and Land Rover Parts US LLC.
Companies ceasing to be subsidiary companies:
� The Company partially divested 20% stake in Telco Construction Equipment Company Limited (Telcon) in favour of
Hitachi Construction Machinery Co. Ltd (Hitachi). Consequently, its stake in Telcon was reduced to 40% (on consolidated
basis), resulting in Telcon and its 5 subsidiaries, viz. Serviplem S. A., Baryval Assistencia Tecnica S.L., Comoplesa Lebrero
S.A., Inner Mongolia North Baryval Engineering Special Vehicle Corporation Ltd and Eurl Lebrero France, ceasing to
be subsidiaries of the Company in March 2010 and have become associate companies.
� INCAT Holdings BV, INCAT KK and Lemmerpoort BV, subsidairies of Tata Technologies Limited and Jaguar & Land Rover
Asia Pacific Company Limited, a subsidairy of JaguarLandRover Limited were liquidated.
� Miljo Innovasjon AS was merged with Miljobil Grenland AS.

19
Name changes:
� Tata Technologies Inc. from INCAT Systems Inc.
� Tata Technologies (Canada) Inc. from INCAT Solutions of Canada Inc.
� Tata Technologies de Mexico, S.A. de C.V from Integrated Systems de Mexico, S.A. de C.V.
� Jaguar Land Rover Nederland BV from Land Rover Nederland BV.
� Tata Hispano Motors Carrocera S.A. from Hispano Carrocera S.A.
b. As required under the Listing agreement with the Stock Exchanges, Consolidated Financial Statements of the Company
is attached. In accordance with the Statement of Accounting Standard on Consolidated Financial Statements (AS 21) and the
Accounting Standard on Accounting for Investments in Associates (AS 23) and Accounting Standard on Accounting for Joint
Ventures (AS 27), issued by the Institute of Chartered Accountants of India, the subsidiaries, associates and joint venture have
been considered in the Consolidated Financial Statements of the Company. On an application made by the Company under
Section 212(8) of the Companies Act, 1956, the Central Government exempted the Company from attaching a copy of the
Balance Sheet and the Profit and Loss Account of the subsidiary companies and other documents to the Annual Report of the
Company. Accordingly, the said documents are not being attached with the Balance Sheet of the Company. The gist of
financial performance of the subsidiary companies for FY 2009-10 are provided under ‘Subsidiary Companies: Financial
Highlights - 2009-10’ in the Annual Report. The Company will make available these documents/ details upon request by any
member of the Company or its subsidiary companies who may be interested in obtaining the same and will also be kept open
for inspection by them at the Registered Office of the Company and at the Head Offices of the subsidiary company concerned.
The same would also be posted on the website of the Company.
c. Associate companies
As on March 31, 2010, the Company had the following associate companies:
Tata Cummins Limited (TCL), in which the Company has a 50% shareholding, with Cummins Engine Co. Inc., USA holding the
balance. TCL is engaged in the manufacture and sale of high horse power engines used in the Company’s range of M&HCVs.
Tata AutoComp Systems Limited (TACO) is a holding company for promoting domestic and foreign Joint Ventures in
auto components and systems and is also engaged in engineering services, supply chain management and after market
operations for the auto industry. The Company’s shareholding in TACO is 26%.
Tata Precision Industries Pte. Ltd., Singapore, in which the Company has a 49.99% shareholding, is engaged in the
manufacture and sale of high precision tooling and equipment for the computer and electronics industry.
Nita Co. Ltd., Bangladesh, in which the Company holds 40% equity, is engaged in the assembly of TATA vehicles for the
Bangladesh market.
Telco Construction Equipment Co. Ltd. (TELCON), in which the Company divested a further 20% stake during the year in
favour of Hitachi, is engaged in the business of development, manufacture and sale of construction equipment and
allied services. Consequently Telcon is owned 60% by Hitachi and 40% (on consolidated basis) by Tata Motors.
Fiat India Automobiles Limited, a 50:50 joint venture company between Tata Motors Limited and Fiat Company located
in Ranjangaon, Maharashtra is engaged in the manufacture of Tata and Fiat branded products as well as engines and
transmissions for use by both the partners.
Automobile Corporation of Goa Ltd. (ACGL), a Company in which Tata Motors Limited has a 42.37% shareholding,
was incorporated in 1980, jointly with EDC Limited (a Goa government enterprise). ACGL is a listed company engaged in
manufacturing sheet metal components, assemblies and bus coaches and is the largest supplier of buses (mainly for
exports) to the Company.
FIXED DEPOSITS
In December 2008, the Company launched a public fixed deposit scheme to meet a part of the funding requirements of the
Company. The scheme has received an overwhelming response and the management of the Company is thankful to all the
investors for participating in the scheme and the faith reposed in the Company. The aggregate amount collected under fixed
deposit scheme as on March 31, 2010 was Rs. 3,173.45 crores from 2,87,343 depositors. The Company has no overdue deposits other
than unclaimed deposits. The Company has discontinued the acceptance and renewal of deposits w.e.f. May 28, 2010.
Sixty-fifth annual report 2009-10
Tata Motors Limited
20
ENERGY, TECHNOLOGY & FOREIGN EXCHANGE
Details of energy conservation and research and development activities undertaken by the Company along with the information
in accordance with the provisions of Section 217(1)(e) of the Companies Act, 1956, read with the Companies (Disclosure of
Particulars in the Report of Board of Directors) Rules, 1988, are given as an Annexure to the Directors’ Report.
DIRECTORS
Mr N A Soonawala who had been on the Board of the Company since May 1989, stepped down from the Board of Directors w.e.f.
March 31, 2010 in accordance with the ‘Policy for Retirement Age of Non-Executive Directors’ adopted by the Company. His
contributions particularly in areas of capital raising, recent acquisitions and its financing/refinancing, financial management and
accounting and capital market matters, have helped the Company in meeting its aspirations to become a truly global Company;
particularly in times of difficulties such as the global meltdown, market swings, Nano relocation. Mr Soonawala was on the Board
for more than 20 years and was a Member of the Executive Committee of the Board, Remuneration Committee and the Nomination
Committee. Mr Soonawala had by his counsel and guidance tremendously contributed to the Company over the years in its
strategic direction and in its financial structure. The Directors place on record the debt the Company owes to Mr Soonawala in
contributing to the Company’s growth and premier position in the automobile industry.
Mr R Gopalakrishnan, a Director of the Company since December 1998, who retires by rotation at the ensuing Annual General
Meeting has conveyed his decision not to offer himself for re-appointment. Mr Gopalakrishnan was also a Member of the
Executive Committee of the Board, Investors’ Grievance Committee and Ethics and Compliance Committee and has added value
to deliberations at Board/Committee Meetings. The Directors place on record their appreciation of the contribution made by
Mr Gopalakrishnan during his tenure as Director of the Company.
The Board at its meeting held on May 27, 2010, appointed Mr Ranendra Sen as an Additional Director, w.e.f. June 1, 2010 in
accordance with Section 260 of the Companies Act, 1956 and Article 132 of the Articles of Association of the Company.
Mr Carl-Peter Forster was appointed as Chief Executive Officer and Managing Director of the Company w.e.f. April 1, 2010. An
abstract and memorandum of interest under Section 302 of the Companies Act, 1956 has been sent to the members of the Company.
In accordance with the provisions of the Companies Act, 1956 and the Articles of Association of the Company, M/s Ratan N Tata
and R A Mashelkar are liable to retire by rotation and are eligible for re-appointment.
Attention of the Members is invited to the relevant items in the Notice of the Annual General Meeting and the Explanatory
Statement thereto.
CORPORATE GOVERNANCE
A separate section on Corporate Governance forming part of the Directors’ Report and the certificate from the Practicing Company
Secretary confirming compliance of Corporate Governance norms as stipulated in Clause 49 of the Listing Agreement with the
Indian Stock Exchanges is included in the Annual Report.
AUDIT
M/s Deloitte Haskins & Sells (DHS), Registration No. 117366W, who are the Statutory Auditors of the Company hold office until the
conclusion of the ensuing Annual General Meeting. It is proposed to re-appoint them to examine and audit the accounts of the
Company for the Financial Year 2010-11. DHS have, under Section 224(1) of the Companies Act, 1956, furnished a certificate of their
eligibility for re-appointment.
Cost Audit
As per the requirement of the Central Government and pursuant to Section 233B of the Companies Act, 1956, the Company carries out an audit
of cost accounts relating to motor vehicles every year. Subject to the approval of the Central Government, the Company has appointed M/s Mani
& Co. to audit the cost accounts relating to motor vehicles for the Financial Year 2010-11.
DIRECTORS’ RESPONSIBILITY STATEMENT:
Pursuant to Section 217 (2AA) of the Companies Act, 1956, the Directors, based on the representation received from the Operating
Management, confirm that:
- in the preparation of the annual accounts, the applicable accounting standards have been followed and that there are
no material departures;
21
Annexure to the Directors’ Report(Additional information given in terms of Notification 1029 of 31-12-1988 issued by the Department of Company Affairs)
A. Conservation of Energy
The Company has always been conscious of the need for conservation of energy and has been steadily making progress
towards this end. Energy conservation measures have been implemented at all the plants and offices of the Company and
special efforts are being put on undertaking specific energy conservation projects like installation of Variable Frequency
Drives & Circulation pumps in paint shop , replacement of forced draft exhaust arrangement by natural draft exhaust
arrangement for the extraction of fumes in paint shop, installation of energy efficient motors, LED & CFL lamps, Wind
Ventilators, Super Magnetic Dust Separators, Solar Photovoltaic Hybrid System for corridor lighting, use of natural light in
plant by using Polycarbonate translucent sheets, switching off unwanted high bay lights & shop substation transformers,
downsizing of the motors, provision of heat resistive cover for furnaces, introduction of Propane in place of LDO in ovens and
heat treatment furnace, transferring cylinder block core production from Shell Core method to Cold Box method, etc. These
changes have resulted in cost savings for the Company of around Rs.8.5crores & annual CO2 reduction of 15179 tCO2. The
company’s CVBU Pune plant was awarded a Trophy and Certificate for “Green India Awards-2009 & was declared as “Green
Leader” by FROST & SULLIVAN, Banglore. ACE Plant at Pantnagar plant won first prize in “Automobile Manufacturing” sector, an
award for “National Energy Conservation Awards-2009” by Bureau of Energy Efficiency (BEE), Ministry of Power, Government of
India. Car Plant at Pune bagged the First Prize in Safety, Health & Environment (SHE) competition organised by the Confederation
of Indian Industry (CII), Western Region, for the year 2009-10. Jamshedpur plant won the Best Entry Award for the Energy
Conservation (ENCON) Contest 2009-10 organised by the Confederation of Indian Industry (CII) in the Eastern region (ER).
Lucknow has been awarded the Excellent Energy Efficient Unit Award at the 10th National Awards for Excellence in Energy
Management - 2009 conducted by CII - Godrej Green Business Centre at Chennai. The Company’s endeavour for tapping wind
energy has also made significant contributions. Total energy produced by wind power for this year was 529.5 lakh units and
this resulted in savings in electricity charges of Rs.18.2 crores.
B. Technology Absorption
The Company has continued its endeavor to absorb the best of technologies for its product range to meet the requirements
of a globally competitive market. All of the Company’s vehicles and engines are compliant with the prevalent regulatory
norms in India and also in the countries to which they are exported. The Company has also undertaken programs for
development of vehicles which would run on alternate fuels like LPG, CNG, Bio-diesel, Electric traction etc.
- they have, in the selection of the accounting policies, consulted the Statutory Auditors and have applied them consistently
and made judgments and estimates that are reasonable and prudent so as to give a true and fair view of the state of affairs
of the Company at the end of the financial year and of the profit of the Company for that period;
- they have taken proper and sufficient care, to the best of their knowledge and ability, for the maintenance of adequate
accounting records in accordance with the provisions of the Companies Act, 1956, for safeguarding the assets of the Company
and for preventing and detecting fraud and other irregularities;
- they have prepared the annual accounts on a going concern basis.
ACKNOWLEDGEMENTS
The Directors wish to convey their appreciation to all of the Company’s employees for their enormous personal efforts as well as
their collective contribution to the Company’s record performance. The Directors would also like to thank the employee unions,
shareholders, fixed deposit holders, customers, dealers, suppliers, bankers, Government and all the other business associates for
the continuous support given by them to the Company and their confidence in its management.
On behalf of the Board of Directors
RATAN N TATAChairman
Mumbai, May 27, 2010

Sixty-fifth annual report 2009-10
Tata Motors Limited
22
Technology for Imported from Year of StatusImport
Development & application of a two cylinder common FEV, Germany 2007-08 Under
rail diesel engine for small passenger car and small 2008-09 Implementation
commercial vehicles. 2009-10
Gas Injection technology for LCV, MCV & HCV engines AEC, Australia 2009-10 In Progress
Stop-Start feature for various vehicle platforms Lucas, UK 2009-10 In progress
Continental, USA
Concept -Automated Manual transmission for Prodrive, UK 2009-10 One Unit imported
commercial vehicles Porsche, Germany as Technology
Demonstrator
Completed
Multiplexed wiring systems for bus platforms Continental, USA 2009-10 Completed
Gas Injection technology for Ace, Xenon, Winger engines AFS, Canada 2009-10 Completed
Engine Management for Series Hybrid Technology for Buses AEC, Australia, 2009-10 In Progress
Design & Development of New Generation engine Ricardo UK Ltd, UK 2006-07 Under
platforms for LCVs and UVs implementation
Design & Development of New Generation engine AVL List GMBH, Austria 2007-08 Completed
platforms for ICV / MCV Delphi Diesel Systems,
France
Design & Development of Infinitely variable transmission M/s Torotrak 2007-08 Under
based on full toriodal traction-Drive variators for (Holdings) Ltd, UK implementation
various vehicle platforms.
Design & Development of flush sliding and plug Wagon SAS, France 2007-08 Completed
Design & Development of Electric Hatchback in windows Tata Motors European 2008-09 Under
Vehicle – Indica Vista EV Technical Centre plc, implementation
UK (TMETC)
During the year the Company spent Rs.1,170.97 crores on Research and Development activities including expenditure on capital
assets purchased for Research and Development which was 3.29% of the net turnover.
C. Foreign Exchange Earnings and OutgoingRs. in crores
Earnings in foreign currency 3,047.56
Expenditure in foreign currency (including dividend remittance) 2,398.70
Major Technology imports include:
Major Technology absorption projects undertaken during the last year include:
Technology for Technology Provider Status
Model based development for Engine Stop Start functionality KPIT Cummins, India Completed
TALC (Touch, Appearance, Light, Colour) Interior Harmony development methodology Delphi, Germany Completed
Acoustic tuning for Infotainment system Delphi, USA Completed
EMC reliability through design specifications & verification on vehicle IDIADA-NSI, Spain Completed
Parallel Hybrid Technology for Buses Eaton In Progress
Hardware in Loop (HIL) System and Test Framework development for Body Control KPIT, India Completed
Module and Instrument Cluster
In keeping with the requirement of technological up gradation of its engines development facility, the company has added facilities
such as 440KW High Dynamic Transient Dynamometer with state-of-the-art Raw gas emission measurement facility and intake air-
conditioning system for developing heavy duty commercial vehicle engines up to 8 L. The Company has also added a variety of
testing facilities and equipment such as Sound Quality Studio, Acoustic transmission loss test rigs for specific body panels, cost
effective telemetry based measurement system for pass by noise, wheel force transducers to gather road load data in a single set
up and has also indigenously developed in-house capability to conduct side pole impact crash tests. The Company has developed
following new technologies/methods and processes for its range of passenger cars and commercial vehicles such as: a) Plastic
balance gears; b) Spoked flywheel; c) Mass dampers on rear suspension arms; d) Dual mass flywheel system; etc. During the year, the
Company has filed 150 Patent applications, 44 Design applications and 78 Copyright applications. Six Patents were granted, 30
Designs and 34 Copyrights were registered to the Company for applications filed in the earlier years.
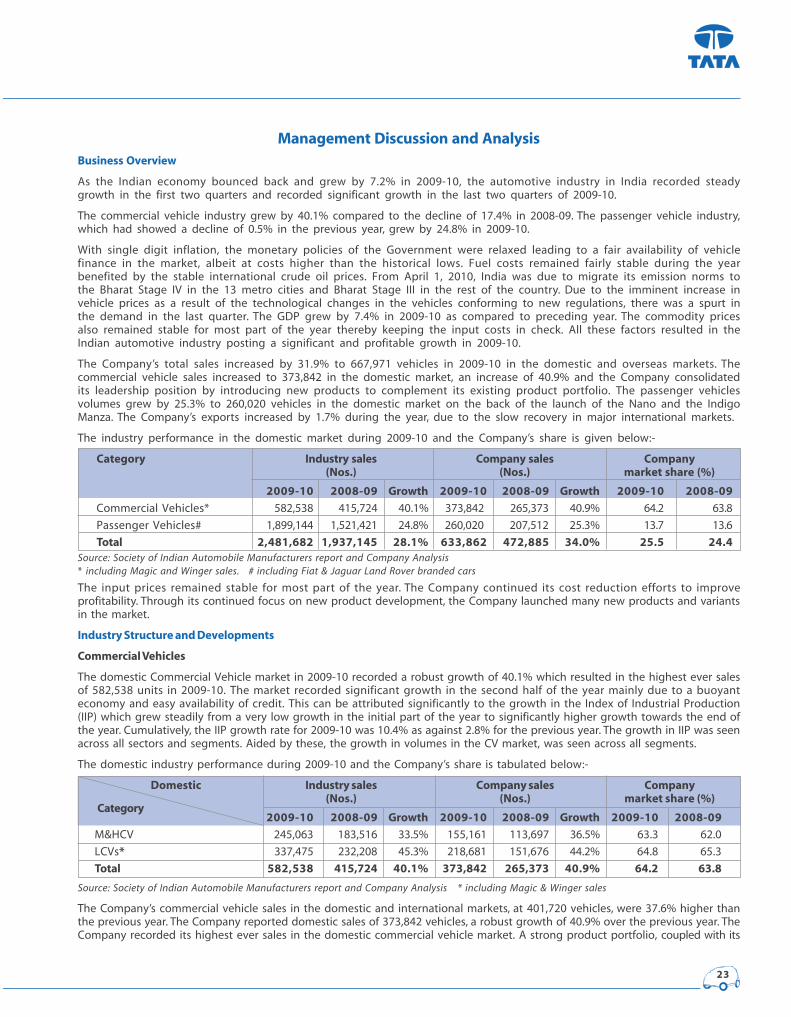
23
Management Discussion and AnalysisBusiness Overview
As the Indian economy bounced back and grew by 7.2% in 2009-10, the automotive industry in India recorded steady
growth in the first two quarters and recorded significant growth in the last two quarters of 2009-10.
The commercial vehicle industry grew by 40.1% compared to the decline of 17.4% in 2008-09. The passenger vehicle industry,
which had showed a decline of 0.5% in the previous year, grew by 24.8% in 2009-10.
With single digit inflation, the monetary policies of the Government were relaxed leading to a fair availability of vehicle
finance in the market, albeit at costs higher than the historical lows. Fuel costs remained fairly stable during the year
benefited by the stable international crude oil prices. From April 1, 2010, India was due to migrate its emission norms to
the Bharat Stage IV in the 13 metro cities and Bharat Stage III in the rest of the country. Due to the imminent increase in
vehicle prices as a result of the technological changes in the vehicles conforming to new regulations, there was a spurt in
the demand in the last quarter. The GDP grew by 7.4% in 2009-10 as compared to preceding year. The commodity prices
also remained stable for most part of the year thereby keeping the input costs in check. All these factors resulted in the
Indian automotive industry posting a significant and profitable growth in 2009-10.
The Company’s total sales increased by 31.9% to 667,971 vehicles in 2009-10 in the domestic and overseas markets. The
commercial vehicle sales increased to 373,842 in the domestic market, an increase of 40.9% and the Company consolidated
its leadership position by introducing new products to complement its existing product portfolio. The passenger vehicles
volumes grew by 25.3% to 260,020 vehicles in the domestic market on the back of the launch of the Nano and the Indigo
Manza. The Company’s exports increased by 1.7% during the year, due to the slow recovery in major international markets.
The industry performance in the domestic market during 2009-10 and the Company’s share is given below:-
Category Industry sales Company sales Company(Nos.) (Nos.) market share (%)
2009-10 2008-09 Growth 2009-10 2008-09 Growth 2009-10 2008-09
Commercial Vehicles* 582,538 415,724 40.1% 373,842 265,373 40.9% 64.2 63.8
Passenger Vehicles# 1,899,144 1,521,421 24.8% 260,020 207,512 25.3% 13.7 13.6
Total 2,481,682 1,937,145 28.1% 633,862 472,885 34.0% 25.5 24.4Source: Society of Indian Automobile Manufacturers report and Company Analysis* including Magic and Winger sales. # including Fiat & Jaguar Land Rover branded cars
The input prices remained stable for most part of the year. The Company continued its cost reduction efforts to improve
profitability. Through its continued focus on new product development, the Company launched many new products and variants
in the market.
Industry Structure and Developments
Commercial Vehicles
The domestic Commercial Vehicle market in 2009-10 recorded a robust growth of 40.1% which resulted in the highest ever sales
of 582,538 units in 2009-10. The market recorded significant growth in the second half of the year mainly due to a buoyant
economy and easy availability of credit. This can be attributed significantly to the growth in the Index of Industrial Production
(IIP) which grew steadily from a very low growth in the initial part of the year to significantly higher growth towards the end of
the year. Cumulatively, the IIP growth rate for 2009-10 was 10.4% as against 2.8% for the previous year. The growth in IIP was seen
across all sectors and segments. Aided by these, the growth in volumes in the CV market, was seen across all segments.
The domestic industry performance during 2009-10 and the Company’s share is tabulated below:-
Domestic Industry sales Company sales Company(Nos.) (Nos.) market share (%)
2009-10 2008-09 Growth 2009-10 2008-09 Growth 2009-10 2008-09
M&HCV 245,063 183,516 33.5% 155,161 113,697 36.5% 63.3 62.0
LCVs* 337,475 232,208 45.3% 218,681 151,676 44.2% 64.8 65.3
Total 582,538 415,724 40.1% 373,842 265,373 40.9% 64.2 63.8
Source: Society of Indian Automobile Manufacturers report and Company Analysis * including Magic & Winger sales
The Company’s commercial vehicle sales in the domestic and international markets, at 401,720 vehicles, were 37.6% higher than
the previous year. The Company reported domestic sales of 373,842 vehicles, a robust growth of 40.9% over the previous year. The
Company recorded its highest ever sales in the domestic commercial vehicle market. A strong product portfolio, coupled with its
Category
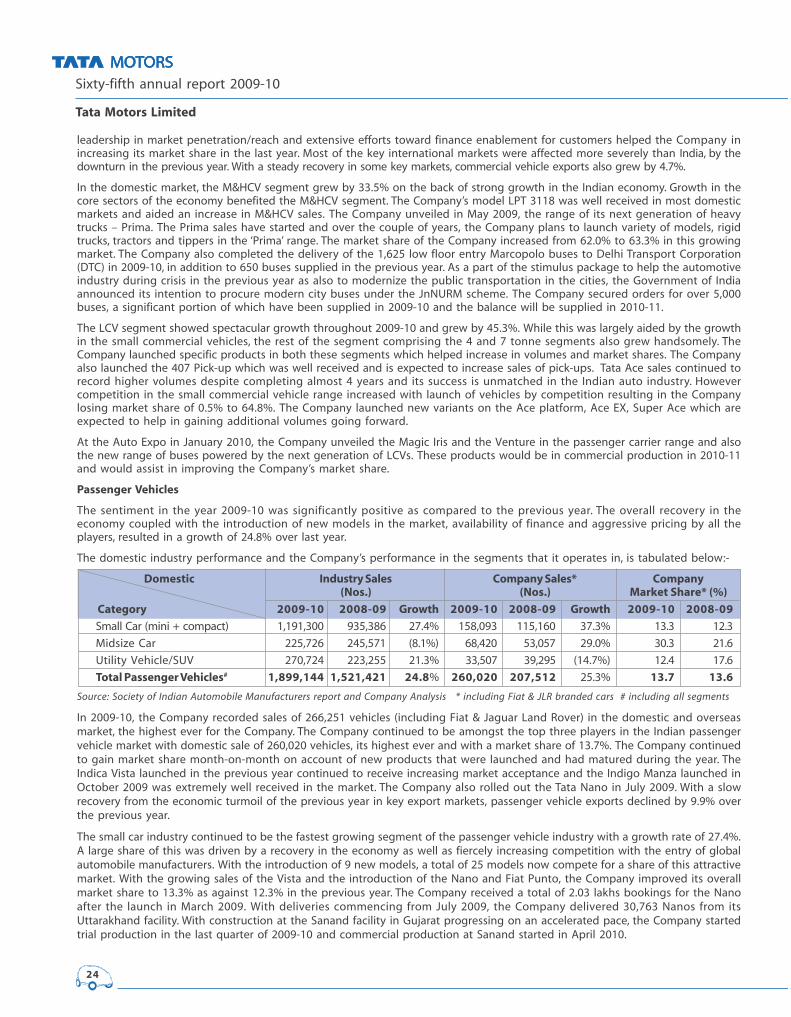
Sixty-fifth annual report 2009-10
Tata Motors Limited
24
leadership in market penetration/reach and extensive efforts toward finance enablement for customers helped the Company in
increasing its market share in the last year. Most of the key international markets were affected more severely than India, by the
downturn in the previous year. With a steady recovery in some key markets, commercial vehicle exports also grew by 4.7%.
In the domestic market, the M&HCV segment grew by 33.5% on the back of strong growth in the Indian economy. Growth in the
core sectors of the economy benefited the M&HCV segment. The Company’s model LPT 3118 was well received in most domestic
markets and aided an increase in M&HCV sales. The Company unveiled in May 2009, the range of its next generation of heavy
trucks – Prima. The Prima sales have started and over the couple of years, the Company plans to launch variety of models, rigid
trucks, tractors and tippers in the ‘Prima’ range. The market share of the Company increased from 62.0% to 63.3% in this growing
market. The Company also completed the delivery of the 1,625 low floor entry Marcopolo buses to Delhi Transport Corporation
(DTC) in 2009-10, in addition to 650 buses supplied in the previous year. As a part of the stimulus package to help the automotive
industry during crisis in the previous year as also to modernize the public transportation in the cities, the Government of India
announced its intention to procure modern city buses under the JnNURM scheme. The Company secured orders for over 5,000
buses, a significant portion of which have been supplied in 2009-10 and the balance will be supplied in 2010-11.
The LCV segment showed spectacular growth throughout 2009-10 and grew by 45.3%. While this was largely aided by the growth
in the small commercial vehicles, the rest of the segment comprising the 4 and 7 tonne segments also grew handsomely. The
Company launched specific products in both these segments which helped increase in volumes and market shares. The Company
also launched the 407 Pick-up which was well received and is expected to increase sales of pick-ups. Tata Ace sales continued to
record higher volumes despite completing almost 4 years and its success is unmatched in the Indian auto industry. However
competition in the small commercial vehicle range increased with launch of vehicles by competition resulting in the Company
losing market share of 0.5% to 64.8%. The Company launched new variants on the Ace platform, Ace EX, Super Ace which are
expected to help in gaining additional volumes going forward.
At the Auto Expo in January 2010, the Company unveiled the Magic Iris and the Venture in the passenger carrier range and also
the new range of buses powered by the next generation of LCVs. These products would be in commercial production in 2010-11
and would assist in improving the Company’s market share.
Passenger Vehicles
The sentiment in the year 2009-10 was significantly positive as compared to the previous year. The overall recovery in the
economy coupled with the introduction of new models in the market, availability of finance and aggressive pricing by all the
players, resulted in a growth of 24.8% over last year.
The domestic industry performance and the Company’s performance in the segments that it operates in, is tabulated below:-
Domestic Industry Sales Company Sales* Company(Nos.) (Nos.) Market Share* (%)
Category 2009-10 2008-09 Growth 2009-10 2008-09 Growth 2009-10 2008-09
Small Car (mini + compact) 1,191,300 935,386 27.4% 158,093 115,160 37.3% 13.3 12.3
Midsize Car 225,726 245,571 (8.1%) 68,420 53,057 29.0% 30.3 21.6
Utility Vehicle/SUV 270,724 223,255 21.3% 33,507 39,295 (14.7%) 12.4 17.6
Total Passenger Vehicles# 1,899,144 1,521,421 24.8% 260,020 207,512 25.3% 13.7 13.6
Source: Society of Indian Automobile Manufacturers report and Company Analysis * including Fiat & JLR branded cars # including all segments
In 2009-10, the Company recorded sales of 266,251 vehicles (including Fiat & Jaguar Land Rover) in the domestic and overseas
market, the highest ever for the Company. The Company continued to be amongst the top three players in the Indian passenger
vehicle market with domestic sale of 260,020 vehicles, its highest ever and with a market share of 13.7%. The Company continued
to gain market share month-on-month on account of new products that were launched and had matured during the year. The
Indica Vista launched in the previous year continued to receive increasing market acceptance and the Indigo Manza launched in
October 2009 was extremely well received in the market. The Company also rolled out the Tata Nano in July 2009. With a slow
recovery from the economic turmoil of the previous year in key export markets, passenger vehicle exports declined by 9.9% over
the previous year.
The small car industry continued to be the fastest growing segment of the passenger vehicle industry with a growth rate of 27.4%.
A large share of this was driven by a recovery in the economy as well as fiercely increasing competition with the entry of global
automobile manufacturers. With the introduction of 9 new models, a total of 25 models now compete for a share of this attractive
market. With the growing sales of the Vista and the introduction of the Nano and Fiat Punto, the Company improved its overall
market share to 13.3% as against 12.3% in the previous year. The Company received a total of 2.03 lakhs bookings for the Nano
after the launch in March 2009. With deliveries commencing from July 2009, the Company delivered 30,763 Nanos from its
Uttarakhand facility. With construction at the Sanand facility in Gujarat progressing on an accelerated pace, the Company started
trial production in the last quarter of 2009-10 and commercial production at Sanand started in April 2010.

25
(Rs. in crores)
The entry midsize car industry grew at 17.7% with sales of 176,604 units during 2009-10. The Indigo range registered an increase
of 10.9% consequent upon launch of the Indigo Manza in October 2009, leading to market share gain, ending the year with the
highest ever sales in the Indigo range in March 2010. The Indigo CS continued to be well received in the market.
The Utility Vehicle market, which had declined by 6.5% last year, reversed the trend in 2009-10 and bounced back, growing by
21.3%. The Company sold 33,507 units, a decline of 14.7% against the last year and as a result its market share dropped to 12.4%
from 17.6% in the previous year. The Grande Mk II launched in December 2009 has been well accepted in the market and the
Venture and Aria (unveiled in the Delhi Auto Expo) to be launched in mid 2010-11 will assist in regaining market share in this segment.
The Company sold 24,884 Fiat cars in 2009-10, representing 1.3% market share of Fiat brand against 0.5% in the previous year.
Linea sales at 11,102 units (market share 10.1% in the upper mid-size car market) and Grande Punto sales at 13,281 units (market
share 3.5% in the B compact car market) have assisted the Company in achieving a higher market share.
The Company sold 225 Jaguar and Land Rover vehicles in its first year of launch of the Jaguar Land Rover brands in India. These
brands are getting an extremely good response in the market and the Company is increasing its dealership footprint across the country.
Financial Performance as a measure of Operational Performance (on a standalone basis)
Overall economic recovery and a benign liquidity environment along with government stimulus have driven domestic
demand revival during the current year. With the upturn in economy, the Company revenue has grown by 38.9% in 2009-10.
Operating margin was higher due to increase in volumes and cost reduction initiatives taken by the Company. The Company
recorded Profit before tax of Rs.2,829.54 crores, growth of 179.1%. The Profit before tax includes Rs.1,112.51 crores profit on
sale of controlling stake in a subsidiary company and loss of Rs.850.86 crores on redemption of investments in preference
shares held in a subsidiary company. The Profit after tax which increased to Rs.2,240.08 crores from Rs.1,001.26 crores in
2008-09 had recorded a growth of 123.7%. The following table set forth the breakup of the Company’s expenses as part of
the net turnover.
Percentage of Turnover
2009-10 2008-09
Turnover net of excise duty 100.0 100.0
Expenditure:
Material (including change in stock and processing charges) 71.7 75.7
Employee Cost 5.2 6.0
Manufacturing and other expenses (net) 11.4 11.4
Total Expenditure 88.3 93.1
Other Income 5.2 3.6
Profit before Exceptional Item, Depreciation, Interest and Tax 16.9 10.5
Depreciation (including product development expenditure) 3.3 3.6
Interest and Discounting Charges (Net) 3.1 2.6
Exchange Loss (Net) on revaluation of foreign currency borrowings, deposits and loans given 0.2 0.3
Loss on redemption of investments in Preference Shares held in a subsidiary company 2.4 -
Profit before Tax 7.9 4.0
Turnover net of excise duty
Turnover net of excise duty increased by 38.9% to Rs.35,593.05 crores in 2009-10 from Rs. 25,629.73 crores in 2008-09. The total
number of vehicles sold during the year increased by 31.9% to 667,971 units from 506,421 units. The domestic volumes increased
by 34.0% to 633,862 units from 472,885 units in 2008-09, while export volumes, marginally increased by 1.7% to 34,109 units from
33,536 units in 2008-09. Gross turnover from sale of vehicles including export and other incentives increased by 37.1% to
Rs.34,677.40 crores from Rs.25,302.71 crores in 2008-09. Sale of Spare parts for vehicles increased by 19.5% to Rs.2,263.54 crores from
Rs.1,894.92 crores in 2008-09.
Material (including change in stock and processing charges)
2009-10 2008-09 Change %Consumption of raw materials and components 20,392.60 16,187.68 4,204.92 26.0
Purchase of product for sale 4,513.23 2,180.32 2,332.91 107.0
Processing Charges 1,212.90 810.60 402.30 49.6
Change in Stock-in-trade and Work-in-progress (606.63) 238.04 (844.67) (354.7)
Material (including change in stock and processing charges) 25,512.10 19,416.64 6,095.46 31.4
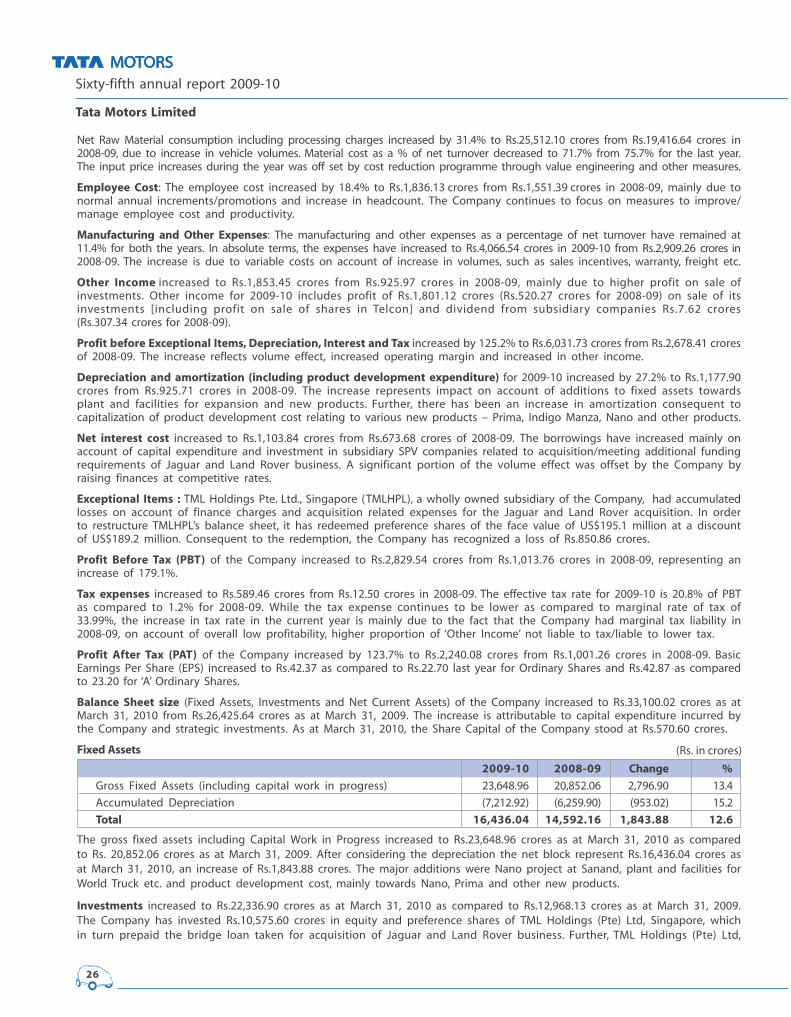
Sixty-fifth annual report 2009-10
Tata Motors Limited
26
Net Raw Material consumption including processing charges increased by 31.4% to Rs.25,512.10 crores from Rs.19,416.64 crores in
2008-09, due to increase in vehicle volumes. Material cost as a % of net turnover decreased to 71.7% from 75.7% for the last year.
The input price increases during the year was off set by cost reduction programme through value engineering and other measures.
Employee Cost: The employee cost increased by 18.4% to Rs.1,836.13 crores from Rs.1,551.39 crores in 2008-09, mainly due to
normal annual increments/promotions and increase in headcount. The Company continues to focus on measures to improve/
manage employee cost and productivity.
Manufacturing and Other Expenses: The manufacturing and other expenses as a percentage of net turnover have remained at
11.4% for both the years. In absolute terms, the expenses have increased to Rs.4,066.54 crores in 2009-10 from Rs.2,909.26 crores in
2008-09. The increase is due to variable costs on account of increase in volumes, such as sales incentives, warranty, freight etc.
Other Income increased to Rs.1,853.45 crores from Rs.925.97 crores in 2008-09, mainly due to higher profit on sale of
investments. Other income for 2009-10 includes profit of Rs.1,801.12 crores (Rs.520.27 crores for 2008-09) on sale of its
investments [including profit on sale of shares in Telcon] and dividend from subsidiary companies Rs.7.62 crores
(Rs.307.34 crores for 2008-09).
Profit before Exceptional Items, Depreciation, Interest and Tax increased by 125.2% to Rs.6,031.73 crores from Rs.2,678.41 crores
of 2008-09. The increase reflects volume effect, increased operating margin and increased in other income.
Depreciation and amortization (including product development expenditure) for 2009-10 increased by 27.2% to Rs.1,177.90
crores from Rs.925.71 crores in 2008-09. The increase represents impact on account of additions to fixed assets towards
plant and facilities for expansion and new products. Further, there has been an increase in amortization consequent to
capitalization of product development cost relating to various new products – Prima, Indigo Manza, Nano and other products.
Net interest cost increased to Rs.1,103.84 crores from Rs.673.68 crores of 2008-09. The borrowings have increased mainly on
account of capital expenditure and investment in subsidiary SPV companies related to acquisition/meeting additional funding
requirements of Jaguar and Land Rover business. A significant portion of the volume effect was offset by the Company by
raising finances at competitive rates.
Exceptional Items : TML Holdings Pte. Ltd., Singapore (TMLHPL), a wholly owned subsidiary of the Company, had accumulated
losses on account of finance charges and acquisition related expenses for the Jaguar and Land Rover acquisition. In order
to restructure TMLHPL’s balance sheet, it has redeemed preference shares of the face value of US$195.1 million at a discount
of US$189.2 million. Consequent to the redemption, the Company has recognized a loss of Rs.850.86 crores.
Profit Before Tax (PBT) of the Company increased to Rs.2,829.54 crores from Rs.1,013.76 crores in 2008-09, representing an
increase of 179.1%.
Tax expenses increased to Rs.589.46 crores from Rs.12.50 crores in 2008-09. The effective tax rate for 2009-10 is 20.8% of PBT
as compared to 1.2% for 2008-09. While the tax expense continues to be lower as compared to marginal rate of tax of
33.99%, the increase in tax rate in the current year is mainly due to the fact that the Company had marginal tax liability in
2008-09, on account of overall low profitability, higher proportion of ‘Other Income’ not liable to tax/liable to lower tax.
Profit After Tax (PAT) of the Company increased by 123.7% to Rs.2,240.08 crores from Rs.1,001.26 crores in 2008-09. Basic
Earnings Per Share (EPS) increased to Rs.42.37 as compared to Rs.22.70 last year for Ordinary Shares and Rs.42.87 as compared
to 23.20 for ‘A’ Ordinary Shares.
Balance Sheet size (Fixed Assets, Investments and Net Current Assets) of the Company increased to Rs.33,100.02 crores as at
March 31, 2010 from Rs.26,425.64 crores as at March 31, 2009. The increase is attributable to capital expenditure incurred by
the Company and strategic investments. As at March 31, 2010, the Share Capital of the Company stood at Rs.570.60 crores.
Fixed Assets
2009-10 2008-09 Change %
Gross Fixed Assets (including capital work in progress) 23,648.96 20,852.06 2,796.90 13.4
Accumulated Depreciation (7,212.92) (6,259.90) (953.02) 15.2
Total 16,436.04 14,592.16 1,843.88 12.6
The gross fixed assets including Capital Work in Progress increased to Rs.23,648.96 crores as at March 31, 2010 as compared
to Rs. 20,852.06 crores as at March 31, 2009. After considering the depreciation the net block represent Rs.16,436.04 crores as
at March 31, 2010, an increase of Rs.1,843.88 crores. The major additions were Nano project at Sanand, plant and facilities for
World Truck etc. and product development cost, mainly towards Nano, Prima and other new products.
Investments increased to Rs.22,336.90 crores as at March 31, 2010 as compared to Rs.12,968.13 crores as at March 31, 2009.
The Company has invested Rs.10,575.60 crores in equity and preference shares of TML Holdings (Pte) Ltd, Singapore, which
in turn prepaid the bridge loan taken for acquisition of Jaguar and Land Rover business. Further, TML Holdings (Pte) Ltd,
(Rs. in crores)
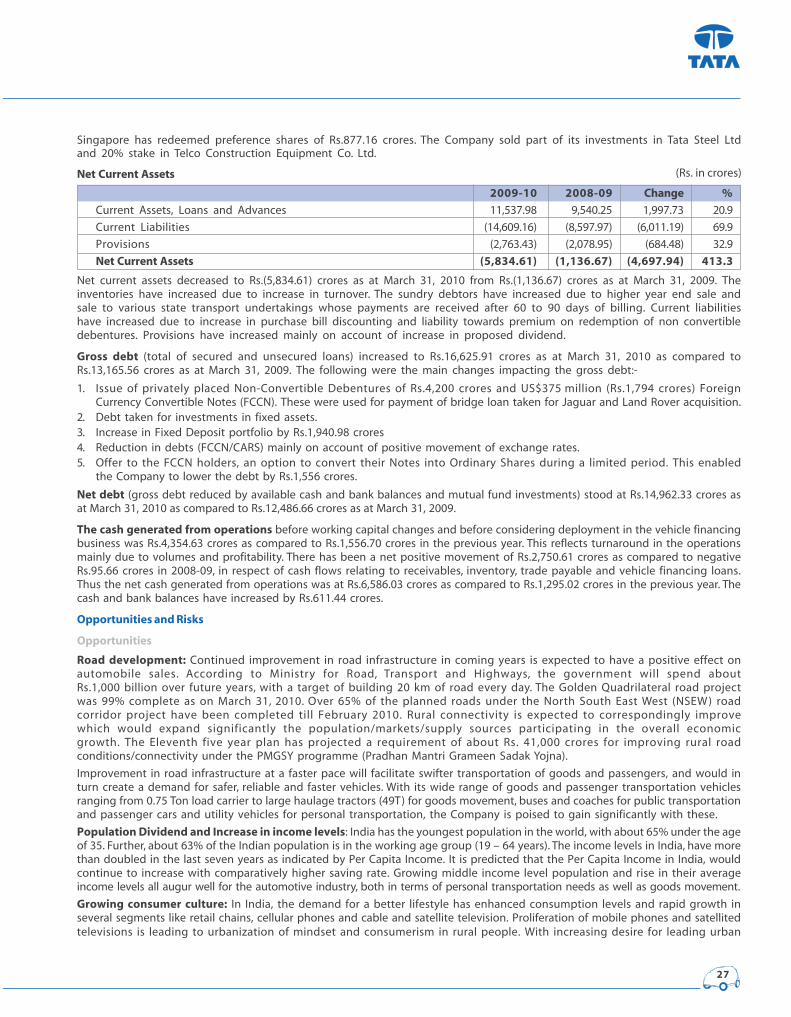
27
Singapore has redeemed preference shares of Rs.877.16 crores. The Company sold part of its investments in Tata Steel Ltd
and 20% stake in Telco Construction Equipment Co. Ltd.
Net Current Assets
2009-10 2008-09 Change %
Current Assets, Loans and Advances 11,537.98 9,540.25 1,997.73 20.9
Current Liabilities (14,609.16) (8,597.97) (6,011.19) 69.9
Provisions (2,763.43) (2,078.95) (684.48) 32.9
Net Current Assets (5,834.61) (1,136.67) (4,697.94) 413.3
Net current assets decreased to Rs.(5,834.61) crores as at March 31, 2010 from Rs.(1,136.67) crores as at March 31, 2009. The
inventories have increased due to increase in turnover. The sundry debtors have increased due to higher year end sale and
sale to various state transport undertakings whose payments are received after 60 to 90 days of billing. Current liabilities
have increased due to increase in purchase bill discounting and liability towards premium on redemption of non convertible
debentures. Provisions have increased mainly on account of increase in proposed dividend.
Gross debt (total of secured and unsecured loans) increased to Rs.16,625.91 crores as at March 31, 2010 as compared to
Rs.13,165.56 crores as at March 31, 2009. The following were the main changes impacting the gross debt:-
1. Issue of privately placed Non-Convertible Debentures of Rs.4,200 crores and US$375 million (Rs.1,794 crores) Foreign
Currency Convertible Notes (FCCN). These were used for payment of bridge loan taken for Jaguar and Land Rover acquisition.
2. Debt taken for investments in fixed assets.
3. Increase in Fixed Deposit portfolio by Rs.1,940.98 crores
4. Reduction in debts (FCCN/CARS) mainly on account of positive movement of exchange rates.
5. Offer to the FCCN holders, an option to convert their Notes into Ordinary Shares during a limited period. This enabled
the Company to lower the debt by Rs.1,556 crores.
Net debt (gross debt reduced by available cash and bank balances and mutual fund investments) stood at Rs.14,962.33 crores as
at March 31, 2010 as compared to Rs.12,486.66 crores as at March 31, 2009.
The cash generated from operations before working capital changes and before considering deployment in the vehicle financing
business was Rs.4,354.63 crores as compared to Rs.1,556.70 crores in the previous year. This reflects turnaround in the operations
mainly due to volumes and profitability. There has been a net positive movement of Rs.2,750.61 crores as compared to negative
Rs.95.66 crores in 2008-09, in respect of cash flows relating to receivables, inventory, trade payable and vehicle financing loans.
Thus the net cash generated from operations was at Rs.6,586.03 crores as compared to Rs.1,295.02 crores in the previous year. The
cash and bank balances have increased by Rs.611.44 crores.
Opportunities and Risks
Opportunities
Road development: Continued improvement in road infrastructure in coming years is expected to have a positive effect on
automobile sales. According to Ministry for Road, Transport and Highways, the government will spend about
Rs.1,000 billion over future years, with a target of building 20 km of road every day. The Golden Quadrilateral road project
was 99% complete as on March 31, 2010. Over 65% of the planned roads under the North South East West (NSEW) road
corridor project have been completed till February 2010. Rural connectivity is expected to correspondingly improve
which would expand significantly the population/markets/supply sources participating in the overall economic
growth. The Eleventh five year plan has projected a requirement of about Rs. 41,000 crores for improving rural road
conditions/connectivity under the PMGSY programme (Pradhan Mantri Grameen Sadak Yojna).
Improvement in road infrastructure at a faster pace will facilitate swifter transportation of goods and passengers, and would in
turn create a demand for safer, reliable and faster vehicles. With its wide range of goods and passenger transportation vehicles
ranging from 0.75 Ton load carrier to large haulage tractors (49T) for goods movement, buses and coaches for public transportation
and passenger cars and utility vehicles for personal transportation, the Company is poised to gain significantly with these.
Population Dividend and Increase in income levels: India has the youngest population in the world, with about 65% under the age
of 35. Further, about 63% of the Indian population is in the working age group (19 – 64 years). The income levels in India, have more
than doubled in the last seven years as indicated by Per Capita Income. It is predicted that the Per Capita Income in India, would
continue to increase with comparatively higher saving rate. Growing middle income level population and rise in their average
income levels all augur well for the automotive industry, both in terms of personal transportation needs as well as goods movement.
Growing consumer culture: In India, the demand for a better lifestyle has enhanced consumption levels and rapid growth in
several segments like retail chains, cellular phones and cable and satellite television. Proliferation of mobile phones and satellited
televisions is leading to urbanization of mindset and consumerism in rural people. With increasing desire for leading urban
(Rs. in crores)
Sixty-fifth annual report 2009-10
Tata Motors Limited
28
lifestyle, per capita movement between villages and urban centres is expected to witness an explosive growth in the coming year,
which will lead to huge demand for passenger carriers and buses. Consumerism is also expected to lead to an increase in car
penetration from the current levels of 8 per thousand towards the 500+ levels witnessed in the developed countries. The
Company, with its wide portfolio is expected to benefit from improvement in lifestyle and higher aspiration levels in passenger
cars and potential growth in freight movement.
Rural Market Growth: As per the recent report by Accenture Consulting, rural spending is now less dependent on farm income,
with less than 50% of the rural income being contributed by farm income. Income remittances from migrant rural populations
and increases in non-farm activities such as trading and agro-processing are boosting non-farm income. The increase in
procurement prices and improved access to finance and institutional credit has brought greater wealth to rural households.
Policy measures such as the waiver of agricultural loans and the National Rural Employment Guarantee Scheme (NREGS), which
guarantees 100 days of employment to one member of every rural household, and increased government spending in rural areas,
have helped to reduce rural under-employment and raised rural income levels. It is estimated that compared with 48% of
motorcycles sales in the rural areas, only 11% of cars/UVs sales are today contributed by the rural market, which indicates a
potential growth opportunity in this market. The Company has planned affordable transport solutions and distribution channels
to leverage the opportunities presented by this market.
International Business: India continues to be a cost competitive source for the automotive industry globally, both for vehicles
and components. India’s manufacturing base continues to benefit from these scale economies coupled with technology/quality
improvements. The Company has opportunities to increase its exports significantly, particularly with the new and contemporary
product offerings in commercial vehicles and passenger cars. The Company is also setting up/ exploring manufacturing footprint
overseas, which would combine these advantages with local operations and sourcing in these markets.
Risks
Hardening of interest rates and other inflationary trends: Further hardening of consumer interest rates could have an adverse
impact on the automotive industry. Increase in inflation could also have a negative impact on automobile sales in the domestic market.
Fuel Prices: As compared to the volatility in international oil prices in 2008-09 (from a high of US$145 per barrel in June 2008 to a
low of US$30 per barrel), the fuel price has remained high at about US$85 in 2009-10. In India the fuel prices are subsidized by the
Government and going forward may be decontrolled. Higher fuel prices will force the consumers to think of alternative
transportation solutions or defer purchases. The Company’s product programmes encompasses initiatives to improve fuel efficiency
of its products and investing in programmes for development of alternative solutions. The Kirit Parikh committee recommendations
that the retail prices of petrol and diesel to be market determined and that an additional excise duty of Rs.80,000 per car to be levied on
diesel cars, if implemented, could adversely impact demand.
Input Costs: With many economies coming out of recession, prices of commodity items like steel, non-ferrous, precious metals, rubber
and petroleum products are expected to rise significantly. Whilst the Company continues to pursue cost reduction initiatives,
increase in price of input materials could severely impact the Company’s profitability to the extent that the same are not absorbed by
the market through price increases and/or could have a negative impact on the demand in the domesticmarket.
Government Regulations: Stringent emission norms and safety regulations could bring new complexities and cost increases for
automotive industry, impacting the Company’s business. WTO, Free Trade Agreements and other similar policies could make the
market, more competitive for local manufacturers.
In the international markets, many of which have stricter norms of regulations related to emission, safety, noise, technology etc,
the Company competes with international players which have global brand image, larger financial capability and multiple
product platforms. These factors may impact demand of the Company’s products in international markets.
Global Competition: India continues to be an attractive destination for the global automotive players. The global automotive
manufacturers present in India have been expanding their product portfolio and enhancing their production capacities. To
counter the threat of growing global competition, the Company has planned to bridge the quality gap between its products and
foreign offerings while maintaining its low cost product development/sourcing advantage.
Exchange Rates: Our operations are subject to risk arising from fluctuations in exchange rates with reference to countries in which
we operate. These risks primarily relate to fluctuations of Pound to US Dollar, Japanese Yen and Euro, and fluctuations of Indian
Rupee against Pound, US Dollar and Euro.
We import capital equipment, raw materials and components and also sell our vehicles in various countries. These transactions are
denominated in foreign currencies, primarily the U.S. dollar and Euro. Moreover, we have outstanding foreign currency denominated
debt and hence we are sensitive to fluctuations in foreign currency exchange rates. We have experienced and expect to continue
to experience foreign exchange losses and gains on obligations denominated in foreign currencies in respect of our borrowings
and foreign currency assets and liabilities due to currency fluctuations. Although we engage in currency hedging as per our policy
in order to decrease our foreign exchange exposure, the weakening of rupee against the dollar or other major foreign currencies
may have an adverse effect on our cost of borrowing and consequently may increase our financing costs, which could have a
significant adverse impact on our results of operations.

29
New Project Execution: Intensifying competition, reducing product life cycles and breadth of the Company’s product portfolio,
necessitates the Company to continuously invest in new products, upgrades and capacity enhancement programme. Though the
Company employs sophisticated techniques and processes to forecast the demand of new products yet the same is subject to
margin of error. Timely introduction of new products, their acceptance in the market place and managing the complexity of
operations across various manufacturing locations, would be the key to sustain competitiveness.
Outlook
In 2009-10, the first half was slightly weak; however economies across the world (with a few exceptions) have signs of revival. In
2010-11, global growth is expected to be more than 4% as compared in 2009-10. The Indian economy is expected to grow by 8.8%
according to the IMF World Economic Outlook. Other structural factors being favourable, this augurs well for the Indian automotive
sector. Key markets for Jaguar Land Rover such as China, Russia, and Middle East are expected to grow, while the UK, USA is
expected to recover moderately. Commercial vehicle industry continues to be highly dependent on the developments in
infrastructure and manufacturing activity in the country. With increase in the Government spending on infrastructure and increase
in the industrial production, the commercial vehicle industry is expected to do well in the next year.
With recovery in the global markets, there is expected to be an increase in the commodity prices, in turn increasing the input costs.
Interest rates and liquidity may be affected as a result of inflationary pressures. The competition in both commercial and
passenger vehicle segments is expected to intensify in the next year.
On the above background, the Company will continue to focus on retaining its advantage of rich product portfolio, market reach
and penetration and the ‘Tata’ brand, in order to be close to its customers. The Company will continue to introduce to the market,
new products and variants, some of which have already been unveiled at the Delhi Auto Expo this year. These will offer superior
value to the customers and improve the Company’s market position. Aggressive cost reduction will be accentuated to offset the
increase in input costs.
The Company will also aggressively pursue opportunities in the International markets as they recover from the downturn.
Jaguar Land Rover will continue to focus on cost reductions to improve its cost base and competitive positioning in the market.
It will also focus on increasing its presence in the emerging markets such as China and Middle East along with launching new
products and variants and new technology initiatives for emission level reductions.
Internal Control Systems and their adequacy
The Company has in place adequate system of internal control. It has documented procedures covering all financial and operating
functions. These controls have been designed to provide a reasonable assurance with regard to maintaining of proper accounting
controls, monitoring of operations, protecting assets from unauthorized use or losses, compliances with regulations and for
ensuring reliability of financial reporting. The Company has continued its efforts to align all its processes and controls with global
best practices in these areas as well.
Some significant features of the internal control systems are:
� Corporate policies on accounting and major processes;
� Well-defined processes for formulating and reviewing annual and long term business plans;
� Preparation and monitoring of annual budgets for all operating and service functions;
� State-of-the-art ERP, Supplier Relations Management and Customer Relations Management, connect its different locations,
dealers and vendors for efficient and seamless information exchange;
� An on-going program for reinforcement of the Tata Code of Conduct. The Code covers integrity of financial reporting,
ethical conduct, regulatory compliance, conflict of interests review and reporting of concerns. All employees of the
Company are regularly exposed to communications under this program;
� Bi-monthly meeting of the management committee at apex level to review operations and plans in key business areas;
� A well established multidisciplinary Internal Audit team, which reviews and reports to management and the Audit
Committee about the compliance with internal controls and the efficiency and effectiveness of operations and the key
process risks;
� Audit Committee of the Board of Directors, comprising independent directors, which is functional since August 1988,
regularly reviews the audit plans, significant audit findings, adequacy of internal controls, compliance with Accounting
Standards as well as reasons for changes in accounting policies and practices, if any;
� A comprehensive information security policy and continuous upgrades to IT system;
� Documenting major business processes and testing thereof including financial closing, computer controls and entity
level controls as part of compliance with Sarbanes-Oxley Act;
� Anti-fraud programme.
The Board takes responsibility for the total process of risk management in the organisation. The Audit Committee reviews reports
covering operational, financial and other business risk areas. Through an Enterprise Risk Management programme, each Business
Unit addresses opportunities and the attendant risks through an institutionalized approach that is aligned to the Company’s
Sixty-fifth annual report 2009-10
Tata Motors Limited
30
objectives. This is also facilitated by internal audit. The business risks is managed through cross functional involvement and
intense communication across businesses. Results of the risk assessment and residual risks are presented to the senior management.
Material Developments in Human Resources/Industrial Relations
A cordial industrial relations environment prevailed at all the manufacturing units of the Company during the year. The permanent
employee’s strength of the Company as on March, 31 2010 was 24,310. In April 2010, the Company entered into a landmark three
year wage settlement with its Union at Pune through amicable process of negotiations.
Comments on the performance of major subsidiaries
The consolidated financial results for 2009-10 include the results of Tata Motors and its subsidiaries. The consolidated operations
are significantly dominated by Jaguar Land Rover (JLR) and the Company (TML). The consolidated financial information for 2008-
09 includes JLR for 10 months as compared to 12 months in 2009-10.
Following is the brief overview of the performance of the major subsidiaries:
Jaguar and Land Rover Business: During the year, external environment for JLR remained unstable with depressed demand in
most of the key markets, low confidence level in financial markets, volatility in exchange rates and rising input material prices.
Market for premium cars remained weak especially in the first half of the financial year, but in the later half of the year improved
with growth witnessed in each successive quarter. Wholesale volumes for 2009-10 were 193,982 units. The prior reporting period
only covered ten months and therefore not directly comparable; however the overall trend showed an improvement.
The financial results of JLR continued to show improvement throughout the year and resulted in JLR reporting a profit before tax
of £32 million for the year. In addition to this, the last quarter results represented second successive quarter of positive profit after
tax, contribution margin improvement and positive cash flow.
The key markets, in which JLR operates, experienced negative economic growth in the early part of the financial year. However,
most of these major markets started witnessing growth from third quarter of the year.
Wholesale volumes for the full year ending March 2010 were 47,418 units for Jaguar and 146,564 units for Land Rover. The prior
reporting period only covered ten months and therefore not directly comparable, however the overall trend showed an
improvement. Limited availability of the X-Type (production ceased in December 2009) and the outgoing XJ (production ceased in May
2009) have suppressed sales, counteracted by the demand driven by the introduction of the new 10MY product launches.
Retail volumes in the UK for the period totalled 57,056 while retail volumes in North America totalled 41,720. Retail growth in China
continued to be strong across all products with total retail volumes of 17,004. Retails in Russia totalled 8,831 units, significantly
lower than previous periods reflecting the difficult local market conditions. During the year, automotive sector in the UK, Europe
and the USA, benefitted from a variety of vehicle scrappage schemes. However, these schemes had minimal benefit for premium
vehicle segment in which it operates.
The new Jaguar XJ was unveiled in London in July 2009 and had its public début at the Frankfurt International Motor show in
September 2009. The vehicle received significant media acclaim ahead of customer deliveries commencing in 2010-11. This is an
important new model which replaces the previous generation XJ model. The new model features the next generation of Jaguar’s
aerospace-inspired aluminium body architecture, a choice of standard or long wheelbase models, enhanced power trains with
all of Jaguar’s new ultra-efficient Gen III 5.0 litre petrol and 3.0 litre diesel engines available, together with the highest
standards of personal luxury and specification. Among the product innovations is its instrument cluster with a 12" thin film
transistor (TFT) screen.
During 2009 Jaguar launched 10MY products including the introduction of a new naturally aspirated and supercharged 5.0 litre
petrol engine for the models XF, XK and XKR and the all new XFR, along with an acclaimed new 3.0 litre diesel engine in the XF
model giving significantly improved performance and fuel economy. Jaguar’s 10MY product actions continued to deliver positive
sales performance. Sales of the Jaguar XF were up 30% in quarter 4 versus the same period last year.
The new LR-V8 5.0 supercharged petrol and LR-TDV6 3.0 diesel engines introduced in the 2010 model year (MY) were designed to
deliver significant improvements in performance, fuel economy and emissions. 2010 MY Range Rover was available for sale from
July 2009 with 2010 MY Range Rover Sport and Discovery 4/LR4 being available from September 2009. Fuel consumption in the
Range Rover LR-V8 5.0 supercharged has been reduced by 7.3 per cent and CO2
emissions reduced by 7.4 per cent. The LR-TDV6 3.0
diesel reduces fuel consumption by 8.9 per cent and CO2
emissions by 8.3 per cent in the Range Rover Sport and 9.7 per cent and
9.6 per cent respectively in Discovery 4/LR4 (on EU combined cycle).
Land Rover during the year confirmed the production plan of its exciting LRX concept car. The new vehicle will début in 2010-11
and join the Range Rover line-up in 2011-12 and will be the smallest, lightest, most efficient Range Rover ever.

31
On June 1, 2009, JLR’s official entry to the fast growing Indian car market was marked by the opening of a flagship
showroom facility in Mumbai. JLR will continue to grow its presence in the Indian market by opening additional dealerships
across India.
During the year, JLR also completed guarantee arrangements to allow the drawdown of a £338m EIB loan which will further advance
Jaguar Land Rover’s research and development programmes focused on technologies that will reduce CO2
emissions from its
vehicles; agreed a syndication of an inventory financing facility to increase the available funding from £85m to £116m; negotiated
renewal of a US$200m loan for another year and repaid short term borrowing totaling £220m.
In November 2009, JLR completed the process of separating operations in markets where it previously operated as part of Ford
legal entity. JLR continued to work with Ford to separate its IT infrastructure and support systems that is expected to be
completed by the end of first quarter of FY2011.
Tata Daewoo Commercial Vehicles (TDCV): Financial year 2009-10 was a very challenging year for TDCV. TDCV faced severe
slowdown in its main export markets, coupled with an appreciating currency. These factors had an adverse impact on its profitability.
However, TDCV paved the way to strengthen its presence in the domestic market with the successful launch of its new range of
premium trucks “PRIMA”. The financial instability of the company’s sole distributor in domestic market has brought new challenges
and opportunity for the company to set-up alternate marketing and distribution channels. In heavy commercial vehicle, TDCV
sold 3,080 vehicles in 2009-10 with a market share of 28.1% as compared to 2,678 vehicles and market share of 28.4% for 2008-09.
In the medium duty truck market TDCV sold 2,273 units in 2009-10 with a market share of 23.7% compared to 2,138 units in
2008-09 and a market share of 25.6%; a fall of 1.9% in total market share. The Gulf Cooperation Council block, which is the major
export market for TDCV had been one of the worst affected during the global financial crisis. These countries are largely
dependent on oil revenues and with oil prices at relatively lower level, they cancelled and/or indefinitely postponed their order
for our commercial vehicles. The Company exported 3,562 units in 2009-10 compared to 4,184 units in 2008-09, a decline of 14.9%.
Majority of exports were made to countries like Iraq and Algeria. TDCV bagged an export order of 2,570 units from the IRAQ
Ministry of Defense, out of which 1,500 units have been shipped during 2009-10.
Tata Motors Finance Ltd (TMFL): The year under review has been a year of consolidation for TMFL resulting in an improved
operating performance. Many facets of TMFL’s operations, including disbursements, management of non-performing assets as
well as collection efficiencies have shown significant improvements. As the economy recovered during the first half of the year, a
strong focus on controlling overall costs, coupled with a focus on improving quality of fresh acquisitions and micro-management
of collections, has set the organization on a robust platform. TMFL has shown improvements in disbursements as well as net
interest margins, despite very aggressive prices offered by some private and state owned banks.
With a spurt in the volumes of Tata Motors, the disbursals of TMFL also increased substantially. During the year TMFL achieved a
market share of 24.8% for Commercial Vehicles and Passenger car segment combined. The number of contracts booked in the FY
09-10 was 148,016 as compared to 108,835; an increase of 36% in 2009-10. TMFL initiated several measures to improve the
management of the NPA’s and also improve margins and operating efficiencies. This resulted in increase in its Profit after Tax by
Rs.164.88 crores, which represents 136.6% increase as compared to 2008-09.
Tata Technologies Ltd (TTL): In 2009-10 the Profit before Tax increased by 35.8% as compared to 2008-09. This was on account of:
- Cost saving plan containing impact of recession on earnings and margin.
- Improving operational efficiency with project profitability and shared service.
- Improvement in off-shore customers.
- Accelerating diversification in Global services and PLM Solutions.
Comments on Financial Performance on a Consolidated basis
The sales net of excise duty on a consolidated basis, have recorded a growth of 30.5% in 2009-10 to Rs.92,519.25 crores. The
increase is attributable to growth in revenue both at Tata Motors and Jaguar Land Rover business on the background of robust
growth in automotoive volumes. Automotive operations is our most significant segment, accounting for 96.9% and 95.8% for
fiscal 2010 and 2009 respectively, of our total revenues. For Fiscal 2010, revenue from automotive operations before inter segment
eliminations was Rs.89,615.07 crores as compared to Rs.67,877.07 crores for fiscal 2009. (A reference may be made to review of
performance of TML and Jaguar Land Rover business discussed above).
The following table set forth selected consolidated financial information for the Company, including as a percentage of turnover
net of excise duty, for the year ended March 31, 2010 and 2009.
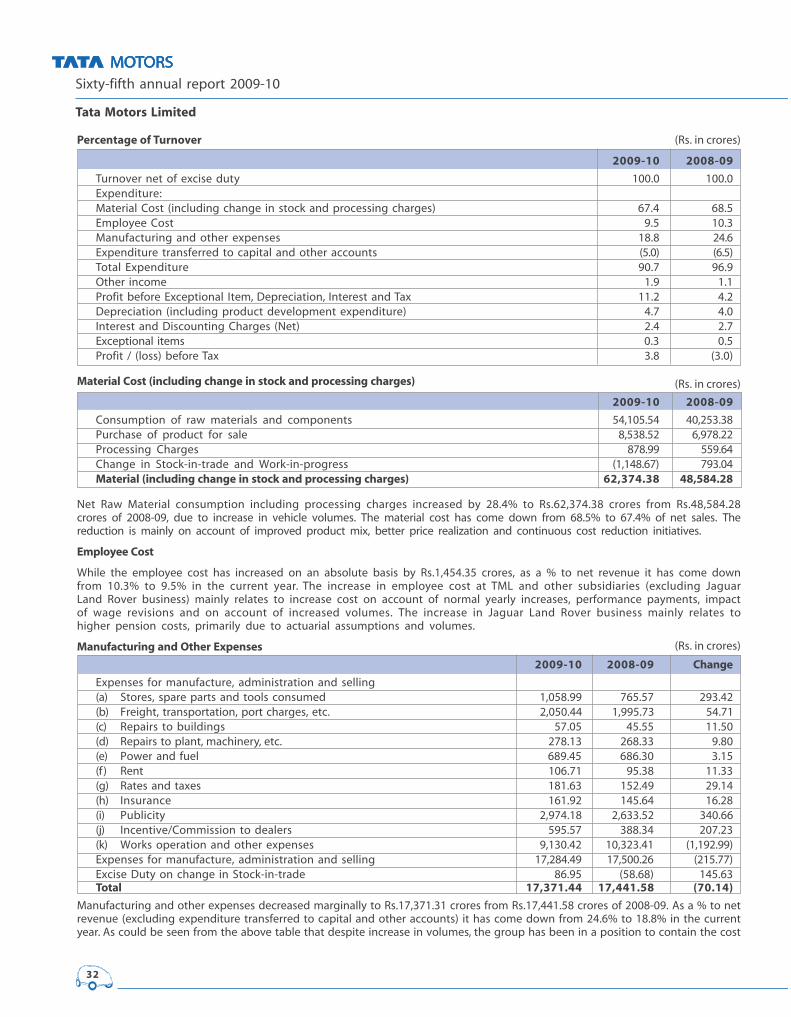
Sixty-fifth annual report 2009-10
Tata Motors Limited
32
(Rs. in crores)
(Rs. in crores)Percentage of Turnover
2009-10 2008-09
Turnover net of excise duty 100.0 100.0
Expenditure:
Material Cost (including change in stock and processing charges) 67.4 68.5
Employee Cost 9.5 10.3
Manufacturing and other expenses 18.8 24.6
Expenditure transferred to capital and other accounts (5.0) (6.5)
Total Expenditure 90.7 96.9
Other income 1.9 1.1
Profit before Exceptional Item, Depreciation, Interest and Tax 11.2 4.2
Depreciation (including product development expenditure) 4.7 4.0
Interest and Discounting Charges (Net) 2.4 2.7
Exceptional items 0.3 0.5
Profit / (loss) before Tax 3.8 (3.0)
Material Cost (including change in stock and processing charges)
2009-10 2008-09
Consumption of raw materials and components 54,105.54 40,253.38
Purchase of product for sale 8,538.52 6,978.22
Processing Charges 878.99 559.64
Change in Stock-in-trade and Work-in-progress (1,148.67) 793.04
Material (including change in stock and processing charges) 62,374.38 48,584.28
Net Raw Material consumption including processing charges increased by 28.4% to Rs.62,374.38 crores from Rs.48,584.28
crores of 2008-09, due to increase in vehicle volumes. The material cost has come down from 68.5% to 67.4% of net sales. The
reduction is mainly on account of improved product mix, better price realization and continuous cost reduction initiatives.
Employee Cost
While the employee cost has increased on an absolute basis by Rs.1,454.35 crores, as a % to net revenue it has come down
from 10.3% to 9.5% in the current year. The increase in employee cost at TML and other subsidiaries (excluding Jaguar
Land Rover business) mainly relates to increase cost on account of normal yearly increases, performance payments, impact
of wage revisions and on account of increased volumes. The increase in Jaguar Land Rover business mainly relates to
higher pension costs, primarily due to actuarial assumptions and volumes.
Manufacturing and Other Expenses
2009-10 2008-09 Change
Expenses for manufacture, administration and selling
(a) Stores, spare parts and tools consumed 1,058.99 765.57 293.42
(b) Freight, transportation, port charges, etc. 2,050.44 1,995.73 54.71
(c) Repairs to buildings 57.05 45.55 11.50
(d) Repairs to plant, machinery, etc. 278.13 268.33 9.80
(e) Power and fuel 689.45 686.30 3.15
(f) Rent 106.71 95.38 11.33
(g) Rates and taxes 181.63 152.49 29.14
(h) Insurance 161.92 145.64 16.28
(i) Publicity 2,974.18 2,633.52 340.66
(j) Incentive/Commission to dealers 595.57 388.34 207.23
(k) Works operation and other expenses 9,130.42 10,323.41 (1,192.99)
Expenses for manufacture, administration and selling 17,284.49 17,500.26 (215.77)
Excise Duty on change in Stock-in-trade 86.95 (58.68) 145.63
Total 17,371.44 17,441.58 (70.14)
Manufacturing and other expenses decreased marginally to Rs.17,371.31 crores from Rs.17,441.58 crores of 2008-09. As a % to net
revenue (excluding expenditure transferred to capital and other accounts) it has come down from 24.6% to 18.8% in the current
year. As could be seen from the above table that despite increase in volumes, the group has been in a position to contain the cost
(Rs. in crores)

33
(Rs. in crores)
at all levels. The increase in stores, spare parts and tools consumed is due to higher level of production. The publicity expenses
have increased by Rs.340.66 crores, mainly towards new product introductions (Nano, Prima, New Jaguar XJ). The incentives/
commission relates to Tata Motor’s business, where the increase is mainly volume driven.
The works operation and other expenses during the current year have come down to 9.9% from 14.6% of net revenue. The major
factor of decrease has been significant reduction in provision towards residual risk on vehicles sold by Jaguar Land Rover
business. There has been a significant drop in the resale value of the cars in those markets in 2008-09, which necessitated
provisions in the last year. During the year on account of improvement in the resale prices, these provisions have been written
back and there have been significantly lower provisions in the current year.
Expenditure transferred to capital and other accounts represents amounts allocated out of employee cost and other expenses for
the amounts capitalized mainly for product development costs. Expenditure transferred to capital and other accounts decreased
marginally to Rs. 4,592.50 crores from Rs. 4,638.83 crores in 2008-09.
Other Income increased to Rs. 1,793.12 crores from Rs.798.96 crores in 2008-09, mainly due to higher profit on sale of investments.
The other income in the current year includes profit on sale of controlling stake in Telcon Rs.1,057.92 crores. The profit (net) on
account of sale of other investments was Rs.693.62 crores in 2009-10 as compared to Rs.718.16 crores for 2008-09.
Profit before Interest, Depreciation, Exceptional items and Tax has increased from Rs. 2,995.46 crores in 2008-09 to Rs. 10,407.28 crores in
2009-10. The increase reflects significant turnaround during the year in the operations of the Company and Jaguar Land Rover business.
Depreciation and Amortization (including product development expenditure) for 2009-10 increased by 53.6% to Rs.4,385.33 crores
from Rs.2,854.52 crores in 2008-09. The increase in depreciation and amortization expenses of Rs.1,380.36 crores represent impact
on account of increased capitalization at TML including the effect of assets installed in the earlier years for which full effect has
come in the current year. Further, there has been an increase in amortization of product development cost consequent to
commencement of commercial production of new products mainly Prima, Nano and other products. The increase is also attributable
to product development written off during the year of Rs.498.20 crores as compared to Rs.347.75 crores in 2008-09 and increased
depreciation of tooling’s at Jaguar Land Rover business.
Net interest cost
2009-10 2008-09 Change
Interest and discounting charges
Interest expenses 2,126.34 1,982.82 143.52
Discounting Charges 671.30 480.09 191.21
Interest capitalized (332.32) (292.31) (40.01)
Interest received (225.61) (239.70) 14.09
Interest expenses 2,239.71 1,930.90 308.81
Net interest cost increased by 16% to Rs.2,239.71 crores from Rs.1,930.90 crores in 2008-09. Out of the total increase of
Rs. 308.81 crores, Rs. 191.21 crores represents increase in level of acceptances consequent to higher volumes in the current year. The
TML group has been successful in containing the costs through borrowings at lower rates and by substituting part of the
borrowings through issue of equity. (Please refer to details of Gross debt)
Exceptional Items
2009-10 2008-09 Change
Exchange (Gain) / Loss (Net) on revaluation of foreign currency borrowings,
Deposits and loans given (84.47) 339.29 (423.76)
Others 344.07 - 344.07
Others consist of (a) employee separation cost of Rs.191.12 crores of Jaguar and Land Rover; (b) unamortised debt issue
cost of Rs.105.04 crores written off on prepayment of bridge loan for acquisition of Jaguar Land Rover business; and (c)
provision for a product liability case.
Consolidated Profit before Tax (PBT) has increased to Rs.3,522.64 crores in 2009-10 from a Loss before Tax of Rs.2,129.25
crores in 2008-09, representing a positive swing of Rs. 5,651.89 crores. This represents a remarkable recovery in the automotive
volumes and improvement in the performance of Jaguar Land Rover business.
Tax expense has increased to Rs.1,005.75 crores in 2009-10 from Rs.335.75 crores in 2008-09. The tax expense as a % to PBT
was 28.6% in 2009-10. The tax expense is higher during the year due to significant increase in proportion of taxable profits
in TML as also on account of provision for tax made at subsidiary companies of Jaguar Land Rover which have been
consolidated on a line by line basis.
Consolidated Profit for the year of the Group increased to Rs.2,571.06 crores from a Loss for the year of Rs.2,505.25 crores in 2008-09.
(Rs. in crores)
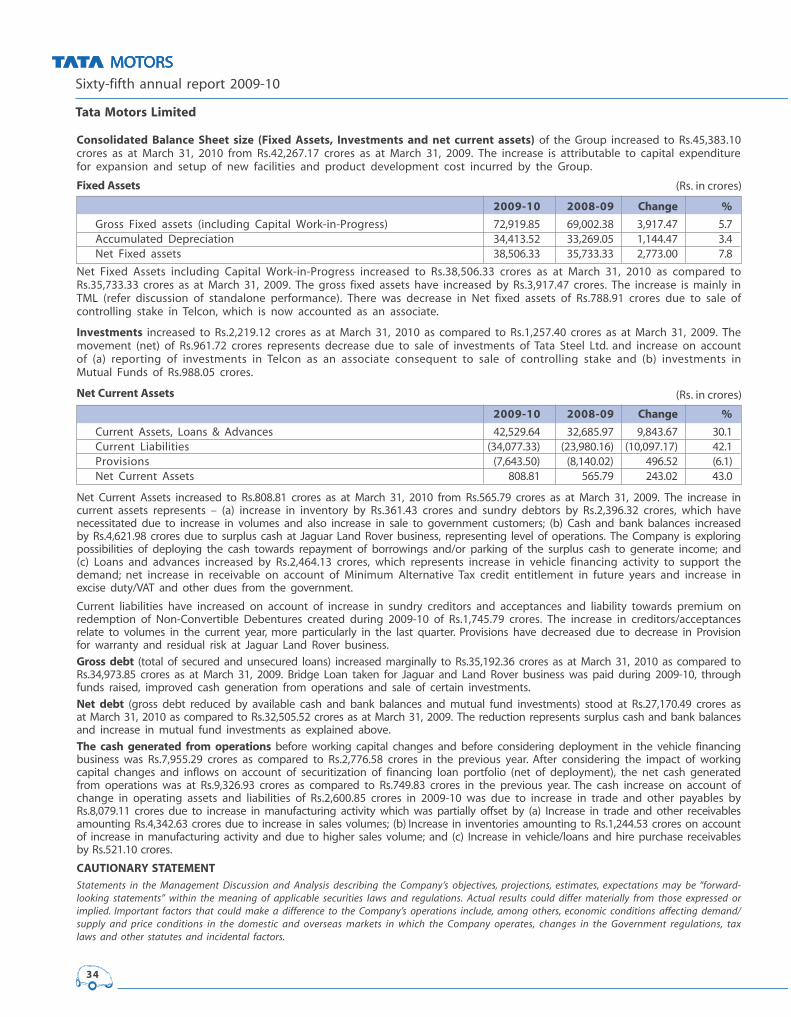
Sixty-fifth annual report 2009-10
Tata Motors Limited
34
Consolidated Balance Sheet size (Fixed Assets, Investments and net current assets) of the Group increased to Rs.45,383.10
crores as at March 31, 2010 from Rs.42,267.17 crores as at March 31, 2009. The increase is attributable to capital expenditure
for expansion and setup of new facilities and product development cost incurred by the Group.
Fixed Assets
2009-10 2008-09 Change %
Gross Fixed assets (including Capital Work-in-Progress) 72,919.85 69,002.38 3,917.47 5.7
Accumulated Depreciation 34,413.52 33,269.05 1,144.47 3.4
Net Fixed assets 38,506.33 35,733.33 2,773.00 7.8
Net Fixed Assets including Capital Work-in-Progress increased to Rs.38,506.33 crores as at March 31, 2010 as compared to
Rs.35,733.33 crores as at March 31, 2009. The gross fixed assets have increased by Rs.3,917.47 crores. The increase is mainly in
TML (refer discussion of standalone performance). There was decrease in Net fixed assets of Rs.788.91 crores due to sale of
controlling stake in Telcon, which is now accounted as an associate.
Investments increased to Rs.2,219.12 crores as at March 31, 2010 as compared to Rs.1,257.40 crores as at March 31, 2009. The
movement (net) of Rs.961.72 crores represents decrease due to sale of investments of Tata Steel Ltd. and increase on account
of (a) reporting of investments in Telcon as an associate consequent to sale of controlling stake and (b) investments in
Mutual Funds of Rs.988.05 crores.
Net Current Assets
2009-10 2008-09 Change %
Current Assets, Loans & Advances 42,529.64 32,685.97 9,843.67 30.1
Current Liabilities (34,077.33) (23,980.16) (10,097.17) 42.1
Provisions (7,643.50) (8,140.02) 496.52 (6.1)
Net Current Assets 808.81 565.79 243.02 43.0
Net Current Assets increased to Rs.808.81 crores as at March 31, 2010 from Rs.565.79 crores as at March 31, 2009. The increase in
current assets represents – (a) increase in inventory by Rs.361.43 crores and sundry debtors by Rs.2,396.32 crores, which have
necessitated due to increase in volumes and also increase in sale to government customers; (b) Cash and bank balances increased
by Rs.4,621.98 crores due to surplus cash at Jaguar Land Rover business, representing level of operations. The Company is exploring
possibilities of deploying the cash towards repayment of borrowings and/or parking of the surplus cash to generate income; and
(c) Loans and advances increased by Rs.2,464.13 crores, which represents increase in vehicle financing activity to support the
demand; net increase in receivable on account of Minimum Alternative Tax credit entitlement in future years and increase in
excise duty/VAT and other dues from the government.
Current liabilities have increased on account of increase in sundry creditors and acceptances and liability towards premium on
redemption of Non-Convertible Debentures created during 2009-10 of Rs.1,745.79 crores. The increase in creditors/acceptances
relate to volumes in the current year, more particularly in the last quarter. Provisions have decreased due to decrease in Provision
for warranty and residual risk at Jaguar Land Rover business.
Gross debt (total of secured and unsecured loans) increased marginally to Rs.35,192.36 crores as at March 31, 2010 as compared to
Rs.34,973.85 crores as at March 31, 2009. Bridge Loan taken for Jaguar and Land Rover business was paid during 2009-10, through
funds raised, improved cash generation from operations and sale of certain investments.
Net debt (gross debt reduced by available cash and bank balances and mutual fund investments) stood at Rs.27,170.49 crores as
at March 31, 2010 as compared to Rs.32,505.52 crores as at March 31, 2009. The reduction represents surplus cash and bank balances
and increase in mutual fund investments as explained above.
The cash generated from operations before working capital changes and before considering deployment in the vehicle financing
business was Rs.7,955.29 crores as compared to Rs.2,776.58 crores in the previous year. After considering the impact of working
capital changes and inflows on account of securitization of financing loan portfolio (net of deployment), the net cash generated
from operations was at Rs.9,326.93 crores as compared to Rs.749.83 crores in the previous year. The cash increase on account of
change in operating assets and liabilities of Rs.2,600.85 crores in 2009-10 was due to increase in trade and other payables by
Rs.8,079.11 crores due to increase in manufacturing activity which was partially offset by (a) Increase in trade and other receivables
amounting Rs.4,342.63 crores due to increase in sales volumes; (b) Increase in inventories amounting to Rs.1,244.53 crores on account
of increase in manufacturing activity and due to higher sales volume; and (c) Increase in vehicle/loans and hire purchase receivables
by Rs.521.10 crores.
CAUTIONARY STATEMENT
Statements in the Management Discussion and Analysis describing the Company’s objectives, projections, estimates, expectations may be “forward-looking statements” within the meaning of applicable securities laws and regulations. Actual results could differ materially from those expressed orimplied. Important factors that could make a difference to the Company’s operations include, among others, economic conditions affecting demand/supply and price conditions in the domestic and overseas markets in which the Company operates, changes in the Government regulations, taxlaws and other statutes and incidental factors.
(Rs. in crores)
(Rs. in crores)
35
Report on Corporate Governance
COMPANY'S PHILOSOPHY ON CORPORATE GOVERNANCE
As part of the Tata group, the Company’s philosophy on Corporate Governance is founded upon a rich legacy of fair, ethical and
transparent governance practices, many of which were in place even before they were mandated by adopting highest standards
of professionalism, honesty, integrity and ethical behaviour. As a global organisation the Corporate Governance practices
followed by the Company and its subsidiaries are compatible with international standards and best practices. Through the
Governance mechanism in the Company, the Board alongwith its Committees undertake its fiduciary responsibilities to all its
stakeholders by ensuring transparency fairplay and independence in its decision making.
The Corporate Governance philosophy has been further strengthened with the implementation, a few years ago, by the Company
of the Tata Business Excellence Model as a means to drive excellence, the Balanced Scorecard methodology for tracking progress
on long term strategic objectives and the Tata Code of Conduct which articulates the values, ethics and business principles and
serves as a guide to the Company, its directors and employees and an appropriate mechanism to report any concern pertaining
to non-adherence to the said Code and addressing the same is also in place. The Company is in full compliance with the
requirements of Corporate Governance under Clause 49 of the Listing Agreement with the Indian Stock Exchanges (“the Listing
Agreement”). The Company’s Depository Programme is listed on the New York Stock Exchange and the Company also complies
with US regulations as applicable to Foreign Private Issuers (non-US listed companies) which cast upon the Board of Directors
and the Audit Committee, onerous responsibilities to improve the Company’s operating efficiencies. Risk management and
internal control functions have been geared up to meet the progressive governance standards.
THE BOARD OF DIRECTORS
The Board of Directors alongwith its Committees provide leadership and guidance to the Company's management and directs,
supervises and controls the performance of the Company. Mr Carl-Peter Forster was appointed as Tata Motors Group CEO &
Managing Director of the Company w.e.f. April 1, 2010. The Board currently comprises of twelve Directors out of which ten
Directors (83.33%) are Non-Executive Directors. The Company has a Non-Executive Chairman and the six Independent Directors
comprise of half of the total strength of the Board. All the Independent Directors have confirmed that they meet the 'independence'
criteria as mentioned under Clause 49 of the Listing Agreement.
None of the Directors on the Company's Board is a Member of more than ten Committees and Chairman of more than five
Committees (Committees being, Audit Committee and Investors' Grievance Committee) across all the companies in which he is a
Director. All the Directors have made necessary disclosures regarding Committee positions held by them in other companies and
do not hold the office of Director in more than fifteen public companies. None of the Directors of the Company is related to each
other. All Non Executive Directors excluding the 'Steel' Director (Tata Steel representative), are liable to retire by rotation. The
appointment of the Managing Directors, including the tenure and terms of remuneration are also approved by the members.
The required information as enumerated in Annexure IA to Clause 49 of the Listing Agreement is made available to the Board of
Directors for discussions and consideration at Board Meetings. The Board reviews the declaration made by the Managing
Directors regarding compliance with all applicable laws on a quarterly basis as also steps taken to remediate instances of non
compliance. CEO & Managing Director and the Chief Financial Officer (CFO) have certified to the Board in accordance with Clause
49 V of the Listing Agreement pertaining to CEO and CFO certification for the Financial Year ended March 31, 2010.
During the year under review, eleven Board Meetings were held on April 27, 2009, May 29, 2009, June 26, 2009, July 27, 2009, August
31, 2009, October 1, 2009, October 26, 2009, November 27, 2009, January 29, 2010, February 26, 2010 and March 30, 2010. The
maximum time-gap between any two consecutive meetings did not exceed four months. The composition of the Board, attendance
at Board Meetings held during the Financial Year under review and at the last Annual General Meeting, number of directorships
(including Tata Motors), memberships/chairmanships of the Board and Committees of public companies and their shareholding
as on March 31, 2010 in the Company are as follows:
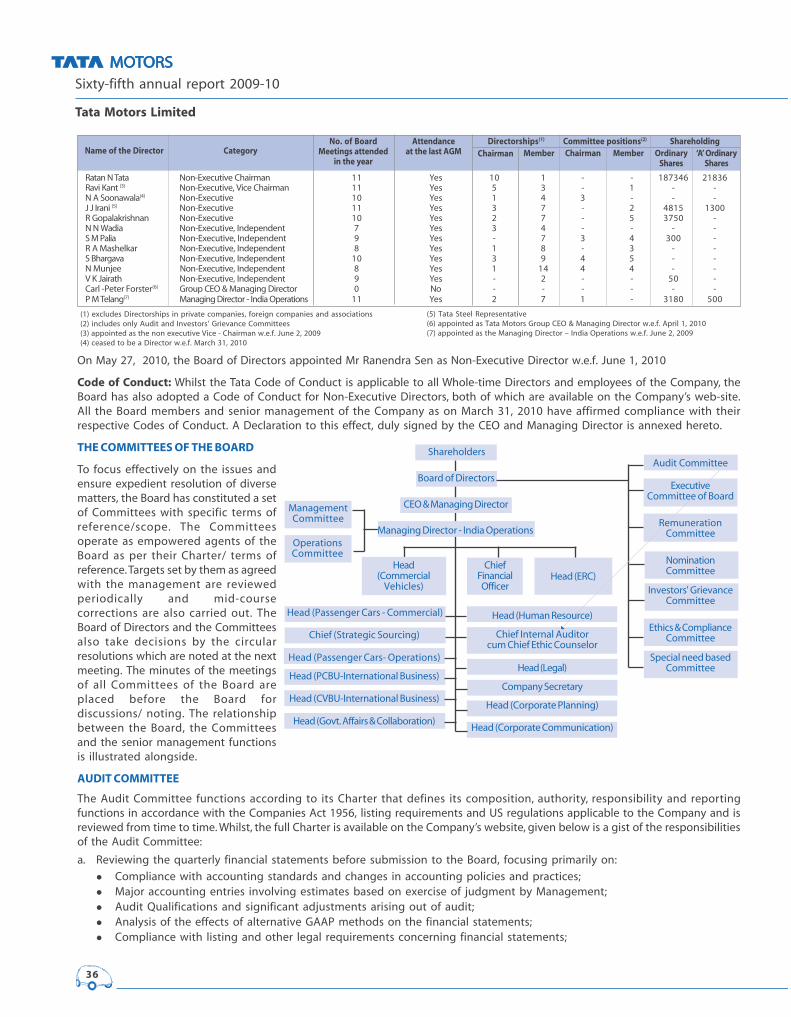
Sixty-fifth annual report 2009-10
Tata Motors Limited
36
On May 27, 2010, the Board of Directors appointed Mr Ranendra Sen as Non-Executive Director w.e.f. June 1, 2010
Code of Conduct: Whilst the Tata Code of Conduct is applicable to all Whole-time Directors and employees of the Company, the
Board has also adopted a Code of Conduct for Non-Executive Directors, both of which are available on the Company’s web-site.
All the Board members and senior management of the Company as on March 31, 2010 have affirmed compliance with their
respective Codes of Conduct. A Declaration to this effect, duly signed by the CEO and Managing Director is annexed hereto.
THE COMMITTEES OF THE BOARD
To focus effectively on the issues and
ensure expedient resolution of diverse
matters, the Board has constituted a set
of Committees with specific terms of
reference/scope. The Committees
operate as empowered agents of the
Board as per their Charter/ terms of
reference. Targets set by them as agreed
with the management are reviewed
periodically and mid-course
corrections are also carried out. The
Board of Directors and the Committees
also take decisions by the circular
resolutions which are noted at the next
meeting. The minutes of the meetings
of all Committees of the Board are
placed before the Board for
discussions/ noting. The relationship
between the Board, the Committees
and the senior management functions
is illustrated alongside.
AUDIT COMMITTEE
The Audit Committee functions according to its Charter that defines its composition, authority, responsibility and reporting
functions in accordance with the Companies Act 1956, listing requirements and US regulations applicable to the Company and is
reviewed from time to time. Whilst, the full Charter is available on the Company’s website, given below is a gist of the responsibilities
of the Audit Committee:
a. Reviewing the quarterly financial statements before submission to the Board, focusing primarily on:
� Compliance with accounting standards and changes in accounting policies and practices;
� Major accounting entries involving estimates based on exercise of judgment by Management;
� Audit Qualifications and significant adjustments arising out of audit;
� Analysis of the effects of alternative GAAP methods on the financial statements;
� Compliance with listing and other legal requirements concerning financial statements;
(1) excludes Directorships in private companies, foreign companies and associations
(2) includes only Audit and Investors’ Grievance Committees
(3) appointed as the non executive Vice - Chairman w.e.f. June 2, 2009
(4) ceased to be a Director w.e.f. March 31, 2010
(5) Tata Steel Representative
(6) appointed as Tata Motors Group CEO & Managing Director w.e.f. April 1, 2010
(7) appointed as the Managing Director – India Operations w.e.f. June 2, 2009
Ratan N Tata Non-Executive Chairman 11 Yes 10 1 - - 187346 21836
Ravi Kant (3)
Non-Executive, Vice Chairman 11 Yes 5 3 - 1 - -
N A Soonawala(4)
Non-Executive 10 Yes 1 4 3 - - -
J J Irani (5)
Non-Executive 11 Yes 3 7 - 2 4815 1300
R Gopalakrishnan Non-Executive 10 Yes 2 7 - 5 3750 -
N N Wadia Non-Executive, Independent 7 Yes 3 4 - - - -
S M Palia Non-Executive, Independent 9 Yes - 7 3 4 300 -
R A Mashelkar Non-Executive, Independent 8 Yes 1 8 - 3 - -
S Bhargava Non-Executive, Independent 10 Yes 3 9 4 5 - -
N Munjee Non-Executive, Independent 8 Yes 1 14 4 4 - -
V K Jairath Non-Executive, Independent 9 Yes - 2 - - 50 -
Carl -Peter Forster(6)
Group CEO & Managing Director 0 No - - - - - -
P M Telang(7)
Managing Director - India Operations 11 Yes 2 7 1 - 3180 500
Name of the Director CategoryNo. of Board
Meetings attendedin the year
Attendanceat the last AGM
Directorships(1)
Chairman MemberCommittee positions(2)
ChairmanShareholding
OrdinaryShares
‘A’ OrdinaryShares
Member
37
� Review Reports on the Management Discussion and Analysis of financial condition, results of Operations and
the Directors’ Responsibility Statement;
� Overseeing the Company’s financial reporting process and the disclosure of its financial information, including
earnings press release, to ensure that the financial statements are correct, sufficient and credible;
� Disclosures made under the CEO and CFO certification and related party transactions to the Board and Shareholders.
b. Reviewing with the management, external auditor and internal auditor, adequacy of internal control systems and
recommending improvements to the management.
c. Reviewing, with the management, the statement of uses/application of funds raised through an issue (public
issue, rights issue, preferential issue, etc.), the statement of funds utilized for purposes other than those stated in
the offer document/prospectus/notice and the report submitted by the monitoring agency monitoring the utilisation of
proceeds of a public or rights issue, and making appropriate recommendations to the Board to take up steps in this matter.
d. Recommending the appointment/removal of the statutory auditor, fixing audit fees and approving non-audit/ consulting
services provided by the statutory auditors’ firms to the Company and its subsidiaries; evaluating auditors’ performance,
qualifications and independence.
e. Reviewing the adequacy of internal audit function, coverage and frequency of internal audit, appointment, removal,
performance and terms of remuneration of the chief internal auditor.
f. Discussing with the internal auditor and senior management significant internal audit findings and follow-up thereon.
g. Reviewing the findings of any internal investigation by the internal auditor into matters involving suspected fraud
or irregularity or a failure of internal control systems of a material nature and report the matter to the Board.
h. Discussing with the external auditor before the audit commences, the nature and scope of audit, as well as conduct
post-audit discussions to ascertain any area of concern.
i. Reviewing the Company’s financial and risk management policies.
j. Reviewing the functioning of the Whistle-Blower and the legal compliance mechanism.
k. Reviewing the financial statements and investments made by subsidiary companies.
l. Look into the reasons for any substantial defaults in payment to the depositors, debenture holders, shareholders
(in case of non-payment of declared dividend) and creditors, if any;
m. Reviewing the effectiveness of the system for monitoring compliance with laws and regulations.
n. Approving the appointment of CFO after assessing the qualification, experience and background etc of the candidate.
During the year, the Committee reviewed key audit findings covering operational, financial and compliance areas. Management
personnel presented their risk mitigation plan to the Committee. It also reviewed the internal control system in subsidiary
companies, status on compliance of its obligations under the Charter and confirmed that it fulfilled its duties and responsibilities.
The Committee through self-assessment annually evaluates its performance.
The Chairman of the Audit Committee briefs the Board members about the significant discussions at Audit Committee meetings.
The Committee comprises of three Independent Directors, all of whom are financially literate and have relevant finance and/or audit
exposure. Mr S M Palia is the financial expert. The quorum of the Committee is two members or one-third of its members, whichever is higher.
The Chairman of the Audit Committee also attended the last Annual General Meeting of the Company. During the period under
review, fourteen Audit Committee meetings were held on May 4, 2009, May 27, 2009, June 23, 2009, July 24, 2009, August 12, 2009,
August 24, 2009, August 28, 2009, September 9, 2009, September 22, 2009, October 23, 2009, November 26, 2009, December 2, 2009,
January 28, 2010 and February 24, 2010. The composition of the Audit Committee and attendance at its meetings is as follows:
Composition N Munjee (Chairman) S M Palia R A Mashelkar
Meetings attended 13 * 14 11
* Does not include Audit Committee Meeting held on August 28, 2009 which was chaired by Mr N Munjee via teleconference.
The Committee meetings are held at the Company’s Corporate Headquarters or at its plant locations and are usually attended
by the Vice Chairman, CEO and Managing Director, Managing Director-India Operations, the Chief Financial Officer, the Chief
Internal Auditor, the Statutory Auditor and the Cost Auditor. The Business and Operation Heads are invited to the meetings,
as required. The Company Secretary acts as the Secretary of the Audit Committee. The Internal Audit function headed by
the Chief Internal Auditor reports to the Audit Committee to ensure its independence.
The Committee relies on the expertise and knowledge of management, the internal auditors and the independent Statutory
Auditor in carrying out its oversight responsibilities. It also uses external expertise, if required. The management is responsible
for the preparation, presentation and integrity of the Company’s financial statements including consolidated statements,
accounting and financial reporting principles. The management is also responsible for internal control over financial reporting
and all procedures are designed to ensure compliance with accounting standards, applicable laws and regulations as well
as for objectively reviewing and evaluating the adequacy, effectiveness and quality of the Company’s system of internal control.
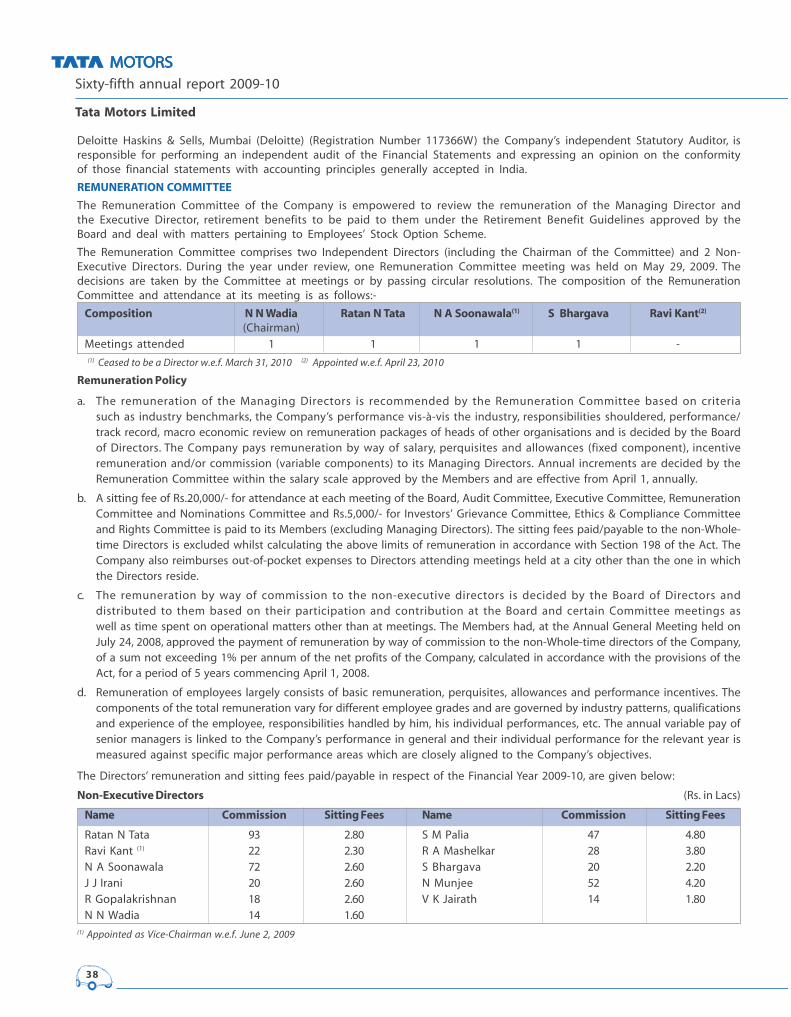
Sixty-fifth annual report 2009-10
Tata Motors Limited
38
Deloitte Haskins & Sells, Mumbai (Deloitte) (Registration Number 117366W) the Company’s independent Statutory Auditor, is
responsible for performing an independent audit of the Financial Statements and expressing an opinion on the conformity
of those financial statements with accounting principles generally accepted in India.
REMUNERATION COMMITTEE
The Remuneration Committee of the Company is empowered to review the remuneration of the Managing Director and
the Executive Director, retirement benefits to be paid to them under the Retirement Benefit Guidelines approved by the
Board and deal with matters pertaining to Employees’ Stock Option Scheme.
The Remuneration Committee comprises two Independent Directors (including the Chairman of the Committee) and 2 Non-
Executive Directors. During the year under review, one Remuneration Committee meeting was held on May 29, 2009. The
decisions are taken by the Committee at meetings or by passing circular resolutions. The composition of the Remuneration
Committee and attendance at its meeting is as follows:-
Composition N N Wadia Ratan N Tata N A Soonawala(1) S Bhargava Ravi Kant(2)
(Chairman)
Meetings attended 1 1 1 1 -
(1) Ceased to be a Director w.e.f. March 31, 2010 (2) Appointed w.e.f. April 23, 2010
Remuneration Policy
a. The remuneration of the Managing Directors is recommended by the Remuneration Committee based on criteria
such as industry benchmarks, the Company’s performance vis-à-vis the industry, responsibilities shouldered, performance/
track record, macro economic review on remuneration packages of heads of other organisations and is decided by the Board
of Directors. The Company pays remuneration by way of salary, perquisites and allowances (fixed component), incentive
remuneration and/or commission (variable components) to its Managing Directors. Annual increments are decided by the
Remuneration Committee within the salary scale approved by the Members and are effective from April 1, annually.
b. A sitting fee of Rs.20,000/- for attendance at each meeting of the Board, Audit Committee, Executive Committee, Remuneration
Committee and Nominations Committee and Rs.5,000/- for Investors’ Grievance Committee, Ethics & Compliance Committee
and Rights Committee is paid to its Members (excluding Managing Directors). The sitting fees paid/payable to the non-Whole-
time Directors is excluded whilst calculating the above limits of remuneration in accordance with Section 198 of the Act. The
Company also reimburses out-of-pocket expenses to Directors attending meetings held at a city other than the one in which
the Directors reside.
c. The remuneration by way of commission to the non-executive directors is decided by the Board of Directors and
distributed to them based on their participation and contribution at the Board and certain Committee meetings as
well as time spent on operational matters other than at meetings. The Members had, at the Annual General Meeting held on
July 24, 2008, approved the payment of remuneration by way of commission to the non-Whole-time directors of the Company,
of a sum not exceeding 1% per annum of the net profits of the Company, calculated in accordance with the provisions of the
Act, for a period of 5 years commencing April 1, 2008.
d. Remuneration of employees largely consists of basic remuneration, perquisites, allowances and performance incentives. The
components of the total remuneration vary for different employee grades and are governed by industry patterns, qualifications
and experience of the employee, responsibilities handled by him, his individual performances, etc. The annual variable pay of
senior managers is linked to the Company’s performance in general and their individual performance for the relevant year is
measured against specific major performance areas which are closely aligned to the Company’s objectives.
The Directors’ remuneration and sitting fees paid/payable in respect of the Financial Year 2009-10, are given below:
Non-Executive Directors (Rs. in Lacs)
Name Commission Sitting Fees Name Commission Sitting Fees
Ratan N Tata 93 2.80 S M Palia 47 4.80
Ravi Kant (1)
22 2.30 R A Mashelkar 28 3.80
N A Soonawala 72 2.60 S Bhargava 20 2.20
J J Irani 20 2.60 N Munjee 52 4.20
R Gopalakrishnan 18 2.60 V K Jairath 14 1.80
N N Wadia 14 1.60
(1) Appointed as Vice-Chairman w.e.f. June 2, 2009
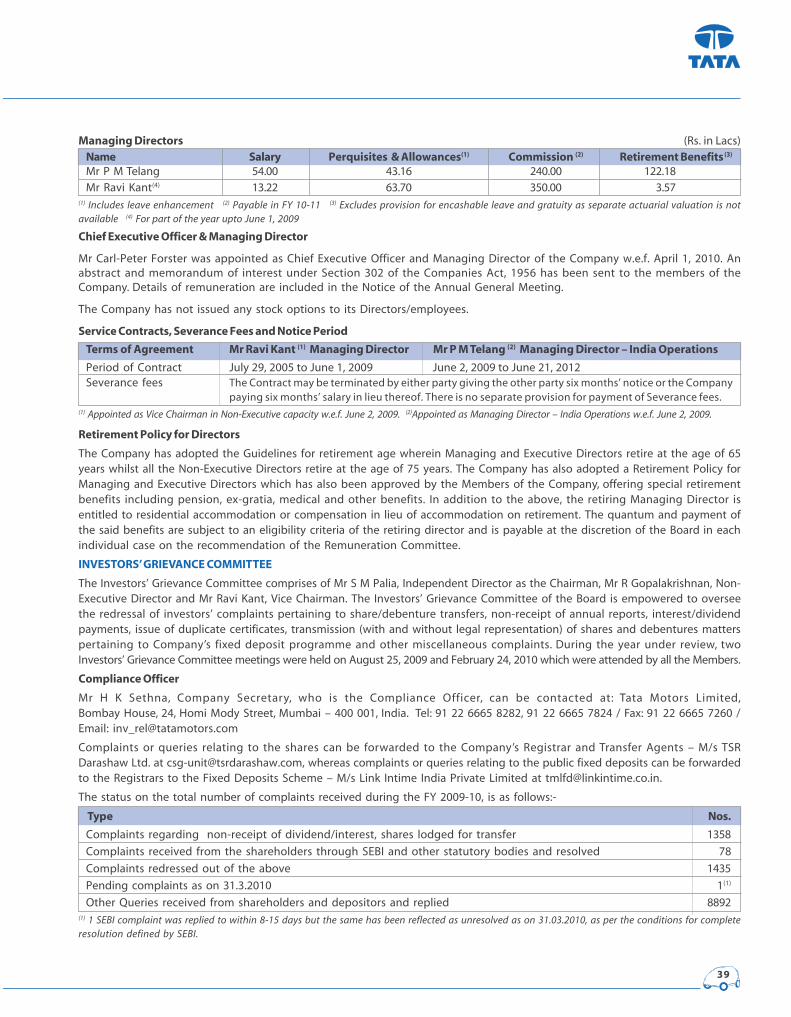
39
Managing Directors (Rs. in Lacs)
Name Salary Perquisites & Allowances(1) Commission (2) Retirement Benefits (3)
Mr P M Telang 54.00 43.16 240.00 122.18
Mr Ravi Kant(4)
13.22 63.70 350.00 3.57
(1) Includes leave enhancement (2) Payable in FY 10-11 (3) Excludes provision for encashable leave and gratuity as separate actuarial valuation is notavailable (4)
For part of the year upto June 1, 2009
Chief Executive Officer & Managing Director
Mr Carl-Peter Forster was appointed as Chief Executive Officer and Managing Director of the Company w.e.f. April 1, 2010. An
abstract and memorandum of interest under Section 302 of the Companies Act, 1956 has been sent to the members of the
Company. Details of remuneration are included in the Notice of the Annual General Meeting.
The Company has not issued any stock options to its Directors/employees.
Service Contracts, Severance Fees and Notice Period
Terms of Agreement Mr Ravi Kant (1) Managing Director Mr P M Telang (2) Managing Director – India Operations
Period of Contract July 29, 2005 to June 1, 2009 June 2, 2009 to June 21, 2012
Severance fees The Contract may be terminated by either party giving the other party six months’ notice or the Company
paying six months’ salary in lieu thereof. There is no separate provision for payment of Severance fees.
(1) Appointed as Vice Chairman in Non-Executive capacity w.e.f. June 2, 2009. (2)Appointed as Managing Director – India Operations w.e.f. June 2, 2009.
Retirement Policy for Directors
The Company has adopted the Guidelines for retirement age wherein Managing and Executive Directors retire at the age of 65
years whilst all the Non-Executive Directors retire at the age of 75 years. The Company has also adopted a Retirement Policy for
Managing and Executive Directors which has also been approved by the Members of the Company, offering special retirement
benefits including pension, ex-gratia, medical and other benefits. In addition to the above, the retiring Managing Director is
entitled to residential accommodation or compensation in lieu of accommodation on retirement. The quantum and payment of
the said benefits are subject to an eligibility criteria of the retiring director and is payable at the discretion of the Board in each
individual case on the recommendation of the Remuneration Committee.
INVESTORS’ GRIEVANCE COMMITTEE
The Investors’ Grievance Committee comprises of Mr S M Palia, Independent Director as the Chairman, Mr R Gopalakrishnan, Non-
Executive Director and Mr Ravi Kant, Vice Chairman. The Investors’ Grievance Committee of the Board is empowered to oversee
the redressal of investors’ complaints pertaining to share/debenture transfers, non-receipt of annual reports, interest/dividend
payments, issue of duplicate certificates, transmission (with and without legal representation) of shares and debentures matters
pertaining to Company’s fixed deposit programme and other miscellaneous complaints. During the year under review, two
Investors’ Grievance Committee meetings were held on August 25, 2009 and February 24, 2010 which were attended by all the Members.
Compliance Officer
Mr H K Sethna, Company Secretary, who is the Compliance Officer, can be contacted at: Tata Motors Limited,
Bombay House, 24, Homi Mody Street, Mumbai – 400 001, India. Tel: 91 22 6665 8282, 91 22 6665 7824 / Fax: 91 22 6665 7260 /
Email: [email protected]
Complaints or queries relating to the shares can be forwarded to the Company’s Registrar and Transfer Agents – M/s TSR
Darashaw Ltd. at [email protected], whereas complaints or queries relating to the public fixed deposits can be forwarded
to the Registrars to the Fixed Deposits Scheme – M/s Link Intime India Private Limited at [email protected].
The status on the total number of complaints received during the FY 2009-10, is as follows:-
Type Nos.
Complaints regarding non-receipt of dividend/interest, shares lodged for transfer 1358
Complaints received from the shareholders through SEBI and other statutory bodies and resolved 78
Complaints redressed out of the above 1435
Pending complaints as on 31.3.2010 1(1)
Other Queries received from shareholders and depositors and replied 8892
(1) 1 SEBI complaint was replied to within 8-15 days but the same has been reflected as unresolved as on 31.03.2010, as per the conditions for completeresolution defined by SEBI.
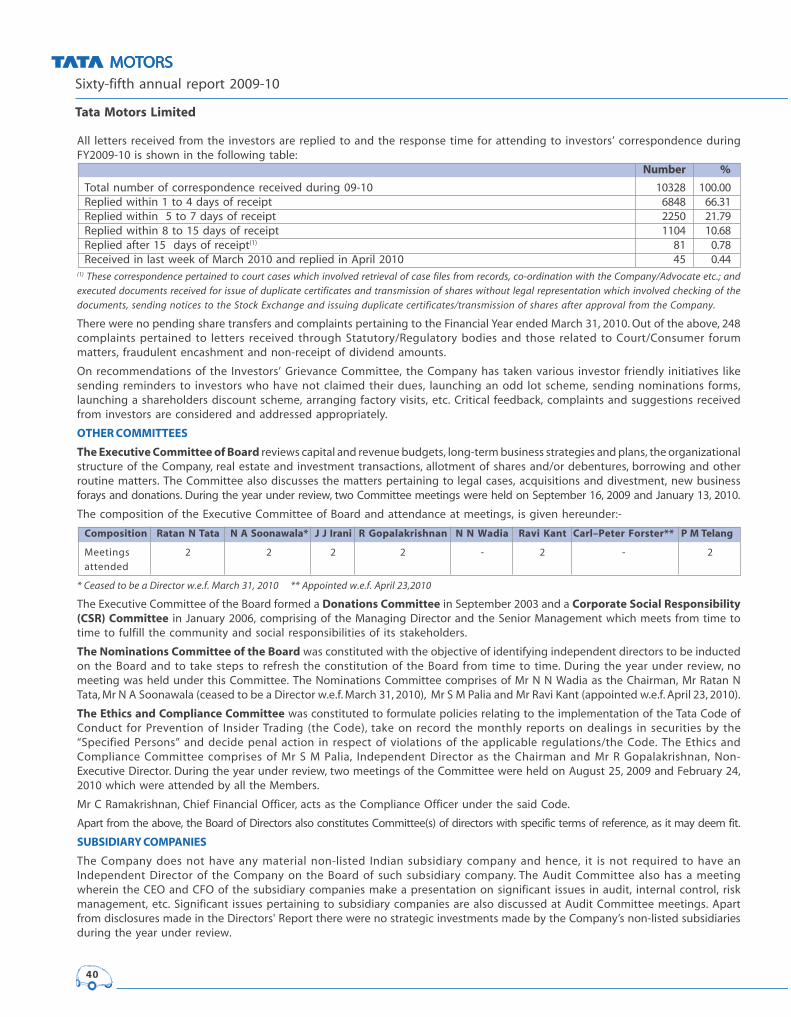
Sixty-fifth annual report 2009-10
Tata Motors Limited
40
All letters received from the investors are replied to and the response time for attending to investors’ correspondence during
FY2009-10 is shown in the following table:
Number %
Total number of correspondence received during 09-10 10328 100.00
Replied within 1 to 4 days of receipt 6848 66.31
Replied within 5 to 7 days of receipt 2250 21.79
Replied within 8 to 15 days of receipt 1104 10.68
Replied after 15 days of receipt(1)
81 0.78
Received in last week of March 2010 and replied in April 2010 45 0.44
(1) These correspondence pertained to court cases which involved retrieval of case files from records, co-ordination with the Company/Advocate etc.; andexecuted documents received for issue of duplicate certificates and transmission of shares without legal representation which involved checking of thedocuments, sending notices to the Stock Exchange and issuing duplicate certificates/transmission of shares after approval from the Company.
There were no pending share transfers and complaints pertaining to the Financial Year ended March 31, 2010. Out of the above, 248
complaints pertained to letters received through Statutory/Regulatory bodies and those related to Court/Consumer forum
matters, fraudulent encashment and non-receipt of dividend amounts.
On recommendations of the Investors’ Grievance Committee, the Company has taken various investor friendly initiatives like
sending reminders to investors who have not claimed their dues, launching an odd lot scheme, sending nominations forms,
launching a shareholders discount scheme, arranging factory visits, etc. Critical feedback, complaints and suggestions received
from investors are considered and addressed appropriately.
OTHER COMMITTEES
The Executive Committee of Board reviews capital and revenue budgets, long-term business strategies and plans, the organizational
structure of the Company, real estate and investment transactions, allotment of shares and/or debentures, borrowing and other
routine matters. The Committee also discusses the matters pertaining to legal cases, acquisitions and divestment, new business
forays and donations. During the year under review, two Committee meetings were held on September 16, 2009 and January 13, 2010.
The composition of the Executive Committee of Board and attendance at meetings, is given hereunder:-
Composition Ratan N Tata N A Soonawala* J J Irani R Gopalakrishnan N N Wadia Ravi Kant Carl–Peter Forster** P M Telang
Meetings 2 2 2 2 - 2 - 2
attended
* Ceased to be a Director w.e.f. March 31, 2010 ** Appointed w.e.f. April 23,2010
The Executive Committee of the Board formed a Donations Committee in September 2003 and a Corporate Social Responsibility(CSR) Committee in January 2006, comprising of the Managing Director and the Senior Management which meets from time to
time to fulfill the community and social responsibilities of its stakeholders.
The Nominations Committee of the Board was constituted with the objective of identifying independent directors to be inducted
on the Board and to take steps to refresh the constitution of the Board from time to time. During the year under review, no
meeting was held under this Committee. The Nominations Committee comprises of Mr N N Wadia as the Chairman, Mr Ratan N
Tata, Mr N A Soonawala (ceased to be a Director w.e.f. March 31, 2010), Mr S M Palia and Mr Ravi Kant (appointed w.e.f. April 23, 2010).
The Ethics and Compliance Committee was constituted to formulate policies relating to the implementation of the Tata Code of
Conduct for Prevention of Insider Trading (the Code), take on record the monthly reports on dealings in securities by the
“Specified Persons” and decide penal action in respect of violations of the applicable regulations/the Code. The Ethics and
Compliance Committee comprises of Mr S M Palia, Independent Director as the Chairman and Mr R Gopalakrishnan, Non-
Executive Director. During the year under review, two meetings of the Committee were held on August 25, 2009 and February 24,
2010 which were attended by all the Members.
Mr C Ramakrishnan, Chief Financial Officer, acts as the Compliance Officer under the said Code.
Apart from the above, the Board of Directors also constitutes Committee(s) of directors with specific terms of reference, as it may deem fit.
SUBSIDIARY COMPANIES
The Company does not have any material non-listed Indian subsidiary company and hence, it is not required to have an
Independent Director of the Company on the Board of such subsidiary company. The Audit Committee also has a meeting
wherein the CEO and CFO of the subsidiary companies make a presentation on significant issues in audit, internal control, risk
management, etc. Significant issues pertaining to subsidiary companies are also discussed at Audit Committee meetings. Apart
from disclosures made in the Directors' Report there were no strategic investments made by the Company’s non-listed subsidiaries
during the year under review.

41
The minutes of all the subsidiary companies are placed before the Board of Directors of the Company and the attention of the
Directors is drawn to significant transactions and arrangements entered into by the subsidiary companies. The performance of
all its subsidiaries is also reviewed by the Board periodically.
GENERAL BODY MEETINGS
Location and time of General Meetings in the past 3 years:
Date Year Type Venue Time
August 25, 2009 2008-2009 Annual General Birla Matushri Sabhagar,
July 24, 2008 2007-2008 Meeting 19, Sir Vithaldas Thackersey Marg, 3:00 p.m.
July 9, 2007 2006-2007 Mumbai – 400 020.
The following are the Special Resolutions passed at General Meetings held in the past 3 years:
Date of Meeting SummaryAugust 25, 2009 No Special Resolution passed
July 24, 2008 Commission to non Whole time Directors
July 9, 2007 Change in place of keeping registers/records
All resolutions moved at the last Annual General Meeting were passed by a show of hands by the requisite majority of members
attending the meeting. None of the items to be transacted at the ensuing meeting is required to be passed by postal ballot.
DISCLOSURES
� Besides the transactions mentioned elsewhere in the Annual Report, there were no other materially significant related party
transactions that may have a potential conflict with the interests of the Company at large.
� The Company has complied with various rules and regulations prescribed by stock exchanges, Securities and Exchange Board
of India or any other statutory authority relating to the capital markets during the last 3 years. No penalties or strictures have
been imposed by them on the Company.
� The Audit Committee and the Board have adopted a Whistle-Blower Policy which provides a formal mechanism for all
employees of the Company to approach the Management of the Company (Audit Committee in case where the concern
involves the Senior Management) and make protective disclosures to the Management about unethical behaviour, actual or
suspected fraud or violation of the Company’s Code of Conduct or ethics policy. The disclosures reported are addressed in the
manner and within the time frames prescribed in the Policy. The Company affirms that no employee of the Company has been
denied access to the Audit Committee.
The status of compliance in respect of non-mandatory requirements of Clause 49 of Listing Agreement is as follows:-
Chairman of the Board: Being the Group Chairman, the Company does not reimburse expenses incurred by the Non-Executive
Chairman for maintenance of a separate Chairman’s office.
At its meeting held on July 25, 2006, the Board of Directors has adopted the Revised Guidelines (2006) regarding the retirement
age of Directors. In line with best practice to continuously refresh the Board’s membership, the Board is encouraged to seek a
balance between change and continuity. A tenure of 9 years may be considered a threshold for granting further tenure for
independent directors based, inter alia, on the merit and contribution of each Director.The Nomination Committee takes into
consideration criteria such as qualifications and expertise whilst recommending induction of non-executive directors on the Board.
Remuneration Committee: Details are given under the heading ‘Remuneration Committee’.
Shareholder Rights: Details are given under the heading “Means of Communications”.
Audit Qualifications: During the year under review, there was no audit qualification in the Company’s financial statements. The
Company continues to adopt best practices to ensure a regime of unqualified financial statements.
Training of Board Members: The Directors interact with the management in a very free and open manner on information that may
be required by them. Orientation and factory visits are arranged for new Directors. The Independent Directors are encouraged to
attend training programmes that may be of relevance and interest to the Directors in discharging their responsibilities to the
Company’s stakeholders.
Mechanism for evaluating non-executive Board members: The performance evaluation of non-executive members is done by the
Board annually based on criteria of attendance and contributions at Board/Committee Meetings as also for the role played other
than at Meetings.
Whistle Blower Mechanism: The Company has adopted a Whistle-Blower Policy. Please refer to ‘DISCLOSURES’ given above.
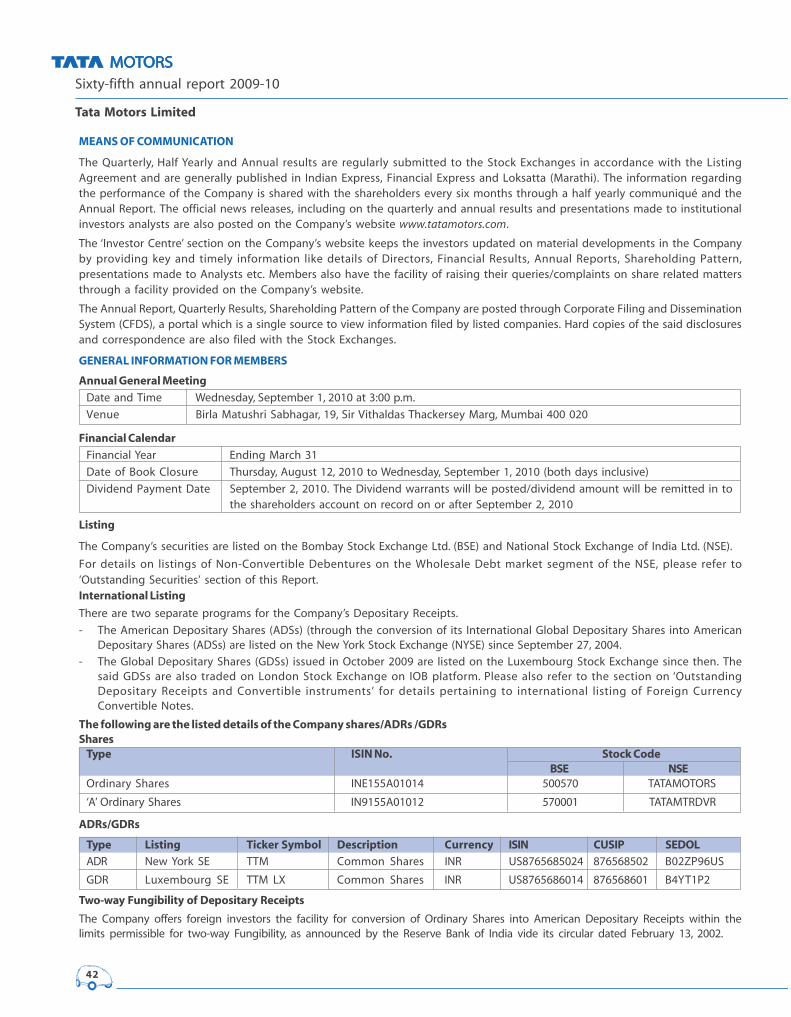
Sixty-fifth annual report 2009-10
Tata Motors Limited
42
MEANS OF COMMUNICATION
The Quarterly, Half Yearly and Annual results are regularly submitted to the Stock Exchanges in accordance with the Listing
Agreement and are generally published in Indian Express, Financial Express and Loksatta (Marathi). The information regarding
the performance of the Company is shared with the shareholders every six months through a half yearly communiqué and the
Annual Report. The official news releases, including on the quarterly and annual results and presentations made to institutional
investors analysts are also posted on the Company’s website www.tatamotors.com.
The ‘Investor Centre’ section on the Company’s website keeps the investors updated on material developments in the Company
by providing key and timely information like details of Directors, Financial Results, Annual Reports, Shareholding Pattern,
presentations made to Analysts etc. Members also have the facility of raising their queries/complaints on share related matters
through a facility provided on the Company’s website.
The Annual Report, Quarterly Results, Shareholding Pattern of the Company are posted through Corporate Filing and Dissemination
System (CFDS), a portal which is a single source to view information filed by listed companies. Hard copies of the said disclosures
and correspondence are also filed with the Stock Exchanges.
GENERAL INFORMATION FOR MEMBERS
Annual General Meeting
Date and Time Wednesday, September 1, 2010 at 3:00 p.m.
Venue Birla Matushri Sabhagar, 19, Sir Vithaldas Thackersey Marg, Mumbai 400 020
Financial Calendar
Financial Year Ending March 31
Date of Book Closure Thursday, August 12, 2010 to Wednesday, September 1, 2010 (both days inclusive)
Dividend Payment Date September 2, 2010. The Dividend warrants will be posted/dividend amount will be remitted in to
the shareholders account on record on or after September 2, 2010
Listing
The Company’s securities are listed on the Bombay Stock Exchange Ltd. (BSE) and National Stock Exchange of India Ltd. (NSE).
For details on listings of Non-Convertible Debentures on the Wholesale Debt market segment of the NSE, please refer to
‘Outstanding Securities’ section of this Report.
International Listing
There are two separate programs for the Company’s Depositary Receipts.
- The American Depositary Shares (ADSs) (through the conversion of its International Global Depositary Shares into American
Depositary Shares (ADSs) are listed on the New York Stock Exchange (NYSE) since September 27, 2004.
- The Global Depositary Shares (GDSs) issued in October 2009 are listed on the Luxembourg Stock Exchange since then. The
said GDSs are also traded on London Stock Exchange on IOB platform. Please also refer to the section on ‘Outstanding
Depositary Receipts and Convertible instruments’ for details pertaining to international listing of Foreign Currency
Convertible Notes.
The following are the listed details of the Company shares/ADRs /GDRsShares
Type ISIN No. Stock CodeBSE NSE
Ordinary Shares INE155A01014 500570 TATAMOTORS
‘A’ Ordinary Shares IN9155A01012 570001 TATAMTRDVR
ADRs/GDRs
Type Listing Ticker Symbol Description Currency ISIN CUSIP SEDOL
ADR New York SE TTM Common Shares INR US8765685024 876568502 B02ZP96US
GDR Luxembourg SE TTM LX Common Shares INR US8765686014 876568601 B4YT1P2
Two-way Fungibility of Depositary Receipts
The Company offers foreign investors the facility for conversion of Ordinary Shares into American Depositary Receipts within the
limits permissible for two-way Fungibility, as announced by the Reserve Bank of India vide its circular dated February 13, 2002.

43
Market Information
Market price data - monthly high/low of the closing price and trading volumes on BSE/NSE depicting liquidity of the
Company’s Ordinary Shares and ‘A’ Ordinary Shares on the said exchanges is given hereunder:-
Ordinary Shares
Bombay Stock Exchange Limited National Stock Exchange of India Limited
Month High (Rs.) Low (Rs.) No. of Shares High (Rs.) Low (Rs.) No. of Shares
Apr-09 281.20 179.85 34420570 281.50 180.00 132851917
May-09 363.90 256.90 21493784 363.25 257.30 95619349
Jun-09 389.05 291.15 27410306 389.20 290.75 104660486
Jul-09 421.55 262.05 31716743 421.55 262.65 124196425
Aug-09 498.65 400.95 41261458 499.70 403.85 157214322
Sep-09 614.50 508.20 29474014 614.85 508.30 114392736
Oct-09 587.40 529.40 23635466 589.25 529.30 104393790
Nov-09 660.90 551.85 19536007 663.15 552.35 84839649
Dec-09 792.60 687.85 18126114 791.55 688.70 75784684
Jan-10 827.40 694.35 12800386 826.45 694.35 61047700
Feb-10 721.70 668.70 12161992 721.55 667.40 59038143
Mar-10 811.65 725.25 66820072 813.00 725.20 107797746
‘A’ Ordinary Shares
Bombay Stock Exchange Limited National Stock Exchange of India Limited
Month High (Rs.) Low (Rs.) No. of Shares High (Rs.) Low (Rs.) No. of Shares
Apr-09 282.00 270.35 91 215.00 175.35 604
May-09 309.75 281.00 177 296.10 210.20 200
June-09 318.00 275.00 5024 320.00 267.00 3589
July-09 334.00 258.00 12378 350.85 235.25 17092
Aug-09 369.35 305.00 1612691 365.10 300.05 147441
Sept-09 437.95 387.25 2278027 437.95 383.05 2303801
Oct-09 450.60 417.35 1714932 449.85 413.75 2352053
Nov-09 499.85 429.95 5902577 495.10 431.50 12598044
Dec-09 515.00 473.15 1640279 513.55 472.40 2650777
Jan-10 509.95 417.65 831539 511.35 415.05 2422470
Feb-10 420.50 379.00 289058 420.35 379.35 1547447
Mar-10 482.30 421.50 1311024 484.55 422.25 1934619
The Performance of the Company’s Stock Price vis-à-vis Sensex, Auto Index, ADR and GDR:
BS
E S
en
se
x &
A
uto
In
de
x
Ta
ta
M
oto
rs O
rd
in
ary
S
ha
re
s (in
R
s.)
Ta
ta
M
oto
rs O
rd
in
ary
S
ha
re
s a
nd
'A
' O
rd
in
ary
S
ha
re
s
AD
R a
nd
GD
R

Sixty-fifth annual report 2009-10
Tata Motors Limited
44
The monthly high and low of the Company’s ADRs and GDRs is given below: (in US$)
ADRs GDRs
Month High Low Month High Low Month High Low
April-09 7.81 5.36 October-09 12.89 11.38 October-09 12.51 11.36
May-09 10.11 7.17 November-09 14.32 11.72 November-09 14.24 11.65
June-09 10.58 8.52 December-09 17.19 15.15 December-09 17.05 14.72
July-09 10.55 7.64 January-10 18.03 14.63 January-10 17.89 15.04
August-09 12.10 10.65 February-10 16.18 14.28 February-10 15.69 14.39
September-09 13.33 11.58 March-10 18.77 16.70 March-10 17.70 15.42
Registrar and Transfer Agents
For Share related matters, Members are requested to correspond with the Company’s Registrar and Transfer Agents –
M/s TSR Darashaw Limited quoting their folio no./DP ID & Client ID at the following addresses:
i. For transfer lodgement, delivery and correspondence:
TSR Darashaw Limited, Unit: Tata Motors Limited, 6-10, Haji Moosa Patrawala Industrial Estate, 20, Dr. E Moses Road,
Mahalaxmi, Mumbai – 400 011.Tel: 022-6656 8484; Fax: 022- 6656 8494; e-mail : [email protected];
website:www.tsrdarashaw.com
ii. For the convenience of investors based in the following cities, transfer documents and letters will also be accepted
at the following branches/agencies of TSR Darashaw Limited:
1 503, Barton Centre, 5th Floor, 84, Mahatma Gandhi Road, Bangalore - 560 001. Tel : 080– 25320321, Fax : 080-25580019,
e-mail : [email protected]
2 Bungalow No.1, “E” Road, Northern Town, Bistupur, Jamshedpur – 831 001. Tel: 0657 – 2426616, Fax: 0657 – 2426937,
email : [email protected]
3 Tata Centre, 1st Floor, 43, Jawaharlal Nehru Road, Kolkata – 700 071. Tel : 033 – 22883087, Fax : 033 – 22883062,
e-mail : [email protected]
4 Plot No.2/42, Sant Vihar, Ansari Road, Daryaganj, New Delhi – 110 002. Tel : 011 – 23271805, Fax : 011 – 23271802,
e-mail : [email protected]
Agent: Shah Consultancy Services Limited: 3-Sumathinath Complex, Pritamnagar Akhada Road, Opp. Kothawala Flats, Ellisbridge,
Ahmedabad - 380 006. Tel: 079–2657 6038, Email: [email protected]
For Fixed Deposits, the investors are requested to correspond with the Registrars to the Fixed Deposits Scheme –
M/s Link Intime India Private Limited at the following addresses:
I. Bhandup Unit : C 13, Pannalal Silk Mills Compound, LBS Marg, Bhandup (West), Mumbai 400 078. Tel: 022- 2594 6960-4
Fax: 022-2594 6969
II. Fort Unit : 203, Davar House, Next to Central Camera Building, 197/199, D N Road, Fort, Mumbai 400 001.
Tel 022-22694127, email : [email protected]
Share Transfer System
Securities lodged for transfer at the Registrar’s address are normally processed within 15 days from the date of lodgement, if the
documents are clear in all respects. All requests for dematerialization of securities are processed and the confirmation is given to
the depositories within 15 days. Senior Executives of the Company are empowered to approve transfer of shares and debentures
and other investor related matters. Grievances received from investors and other miscellaneous correspondence on change of
address, mandates, etc. are processed by the Registrars within 15 days.
Secretarial Audit
� Pursuant to Clause 47(c) of the Listing Agreement with the Stock Exchanges, certificates, on half-yearly basis, have
been issued by a Company Secretary-in-Practice for due compliance of share transfer formalities by the Company.
� A Company Secretary-in-Practice carried out a Secretarial Audit to reconcile the total admitted capital with NSDL and CDSL
and the total issued and listed capital. The audit confirms that the total issued/paid up capital is in agreement with the
aggregate of the total number of shares in physical form and the total number of shares in dematerialised form (held with
NSDL and CDSL).
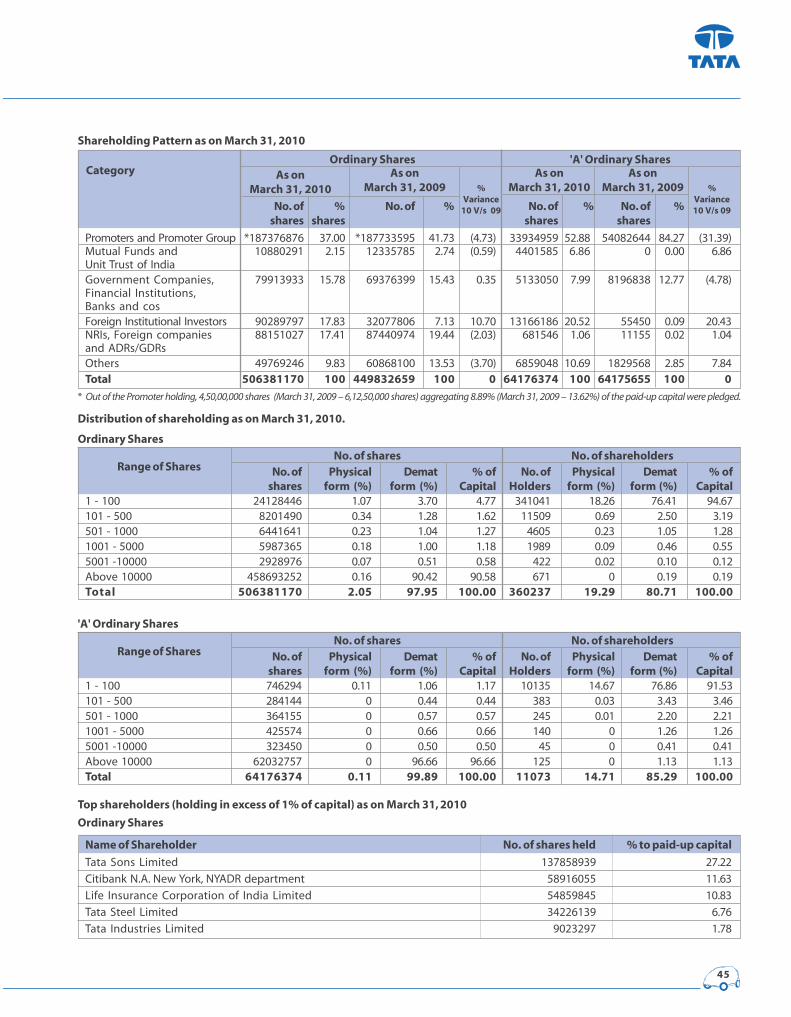
45
No. of % No. of % No. of % No. of %shares shares shares shares
Promoters and Promoter Group *187376876 37.00 *187733595 41.73 (4.73) 33934959 52.88 54082644 84.27 (31.39)
Mutual Funds and 10880291 2.15 12335785 2.74 (0.59) 4401585 6.86 0 0.00 6.86
Unit Trust of India
Government Companies, 79913933 15.78 69376399 15.43 0.35 5133050 7.99 8196838 12.77 (4.78)
Financial Institutions,
Banks and cos
Foreign Institutional Investors 90289797 17.83 32077806 7.13 10.70 13166186 20.52 55450 0.09 20.43
NRIs, Foreign companies 88151027 17.41 87440974 19.44 (2.03) 681546 1.06 11155 0.02 1.04
and ADRs/GDRs
Others 49769246 9.83 60868100 13.53 (3.70) 6859048 10.69 1829568 2.85 7.84
Total 506381170 100 449832659 100 0 64176374 100 64175655 100 0
* Out of the Promoter holding, 4,50,00,000 shares (March 31, 2009 – 6,12,50,000 shares) aggregating 8.89% (March 31, 2009 – 13.62%) of the paid-up capital were pledged.
Shareholding Pattern as on March 31, 2010
Category As onMarch 31, 2010
As onMarch 31, 2009
As onMarch 31, 2010
As onMarch 31, 2009%
Variance10 V/s 09
Ordinary Shares 'A' Ordinary Shares
%Variance10 V/s 09
Distribution of shareholding as on March 31, 2010.
Top shareholders (holding in excess of 1% of capital) as on March 31, 2010
Ordinary Shares
Name of Shareholder No. of shares held % to paid-up capital
Tata Sons Limited 137858939 27.22
Citibank N.A. New York, NYADR department 58916055 11.63
Life Insurance Corporation of India Limited 54859845 10.83
Tata Steel Limited 34226139 6.76
Tata Industries Limited 9023297 1.78
No. of Physical Demat % of No. of Physical Demat % ofshares form (%) form (%) Capital Holders form (%) form (%) Capital
1 - 100 24128446 1.07 3.70 4.77 341041 18.26 76.41 94.67
101 - 500 8201490 0.34 1.28 1.62 11509 0.69 2.50 3.19
501 - 1000 6441641 0.23 1.04 1.27 4605 0.23 1.05 1.28
1001 - 5000 5987365 0.18 1.00 1.18 1989 0.09 0.46 0.55
5001 -10000 2928976 0.07 0.51 0.58 422 0.02 0.10 0.12
Above 10000 458693252 0.16 90.42 90.58 671 0 0.19 0.19
Total 506381170 2.05 97.95 100.00 360237 19.29 80.71 100.00
No. of shares No. of shareholdersRange of Shares
Ordinary Shares
No. of Physical Demat % of No. of Physical Demat % ofshares form (%) form (%) Capital Holders form (%) form (%) Capital
1 - 100 746294 0.11 1.06 1.17 10135 14.67 76.86 91.53
101 - 500 284144 0 0.44 0.44 383 0.03 3.43 3.46
501 - 1000 364155 0 0.57 0.57 245 0.01 2.20 2.21
1001 - 5000 425574 0 0.66 0.66 140 0 1.26 1.26
5001 -10000 323450 0 0.50 0.50 45 0 0.41 0.41
Above 10000 62032757 0 96.66 96.66 125 0 1.13 1.13
Total 64176374 0.11 99.89 100.00 11073 14.71 85.29 100.00
No. of shares No. of shareholdersRange of Shares
'A' Ordinary Shares
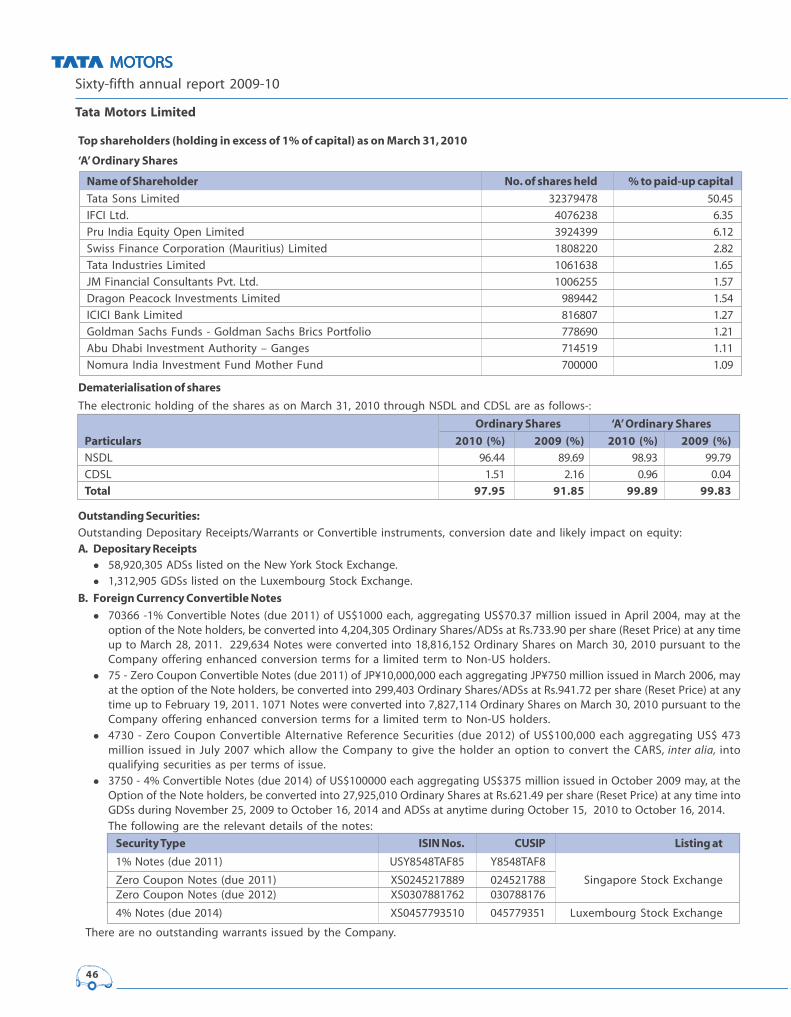
Sixty-fifth annual report 2009-10
Tata Motors Limited
46
Top shareholders (holding in excess of 1% of capital) as on March 31, 2010
‘A’ Ordinary Shares
Name of Shareholder No. of shares held % to paid-up capital
Tata Sons Limited 32379478 50.45
IFCI Ltd. 4076238 6.35
Pru India Equity Open Limited 3924399 6.12
Swiss Finance Corporation (Mauritius) Limited 1808220 2.82
Tata Industries Limited 1061638 1.65
JM Financial Consultants Pvt. Ltd. 1006255 1.57
Dragon Peacock Investments Limited 989442 1.54
ICICI Bank Limited 816807 1.27
Goldman Sachs Funds - Goldman Sachs Brics Portfolio 778690 1.21
Abu Dhabi Investment Authority – Ganges 714519 1.11
Nomura India Investment Fund Mother Fund 700000 1.09
Dematerialisation of shares
The electronic holding of the shares as on March 31, 2010 through NSDL and CDSL are as follows-:
Ordinary Shares ‘A’ Ordinary Shares
Particulars 2010 (%) 2009 (%) 2010 (%) 2009 (%)
NSDL 96.44 89.69 98.93 99.79
CDSL 1.51 2.16 0.96 0.04
Total 97.95 91.85 99.89 99.83
Outstanding Securities:
Outstanding Depositary Receipts/Warrants or Convertible instruments, conversion date and likely impact on equity:
A. Depositary Receipts� 58,920,305 ADSs listed on the New York Stock Exchange.
� 1,312,905 GDSs listed on the Luxembourg Stock Exchange.
B. Foreign Currency Convertible Notes
� 70366 -1% Convertible Notes (due 2011) of US$1000 each, aggregating US$70.37 million issued in April 2004, may at the
option of the Note holders, be converted into 4,204,305 Ordinary Shares/ADSs at Rs.733.90 per share (Reset Price) at any time
up to March 28, 2011. 229,634 Notes were converted into 18,816,152 Ordinary Shares on March 30, 2010 pursuant to the
Company offering enhanced conversion terms for a limited term to Non-US holders.
� 75 - Zero Coupon Convertible Notes (due 2011) of JP¥10,000,000 each aggregating JP¥750 million issued in March 2006, may
at the option of the Note holders, be converted into 299,403 Ordinary Shares/ADSs at Rs.941.72 per share (Reset Price) at any
time up to February 19, 2011. 1071 Notes were converted into 7,827,114 Ordinary Shares on March 30, 2010 pursuant to the
Company offering enhanced conversion terms for a limited term to Non-US holders.
� 4730 - Zero Coupon Convertible Alternative Reference Securities (due 2012) of US$100,000 each aggregating US$ 473
million issued in July 2007 which allow the Company to give the holder an option to convert the CARS, inter alia, into
qualifying securities as per terms of issue.
� 3750 - 4% Convertible Notes (due 2014) of US$100000 each aggregating US$375 million issued in October 2009 may, at the
Option of the Note holders, be converted into 27,925,010 Ordinary Shares at Rs.621.49 per share (Reset Price) at any time into
GDSs during November 25, 2009 to October 16, 2014 and ADSs at anytime during October 15, 2010 to October 16, 2014.
The following are the relevant details of the notes:
Security Type ISIN Nos. CUSIP Listing at
1% Notes (due 2011) USY8548TAF85 Y8548TAF8
Zero Coupon Notes (due 2011) XS0245217889 024521788 Singapore Stock Exchange
Zero Coupon Notes (due 2012) XS0307881762 030788176
4% Notes (due 2014) XS0457793510 045779351 Luxembourg Stock Exchange
There are no outstanding warrants issued by the Company.
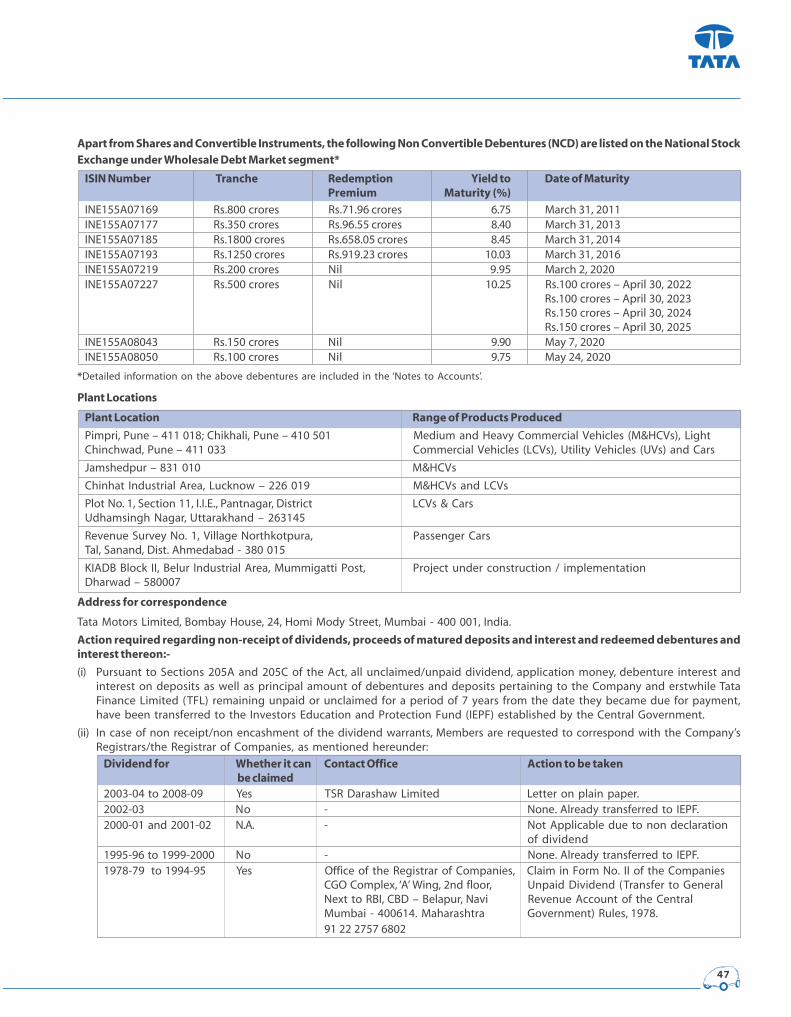
47
Apart from Shares and Convertible Instruments, the following Non Convertible Debentures (NCD) are listed on the National StockExchange under Wholesale Debt Market segment*
ISIN Number Tranche Redemption Yield to Date of MaturityPremium Maturity (%)
INE155A07169 Rs.800 crores Rs.71.96 crores 6.75 March 31, 2011
INE155A07177 Rs.350 crores Rs.96.55 crores 8.40 March 31, 2013
INE155A07185 Rs.1800 crores Rs.658.05 crores 8.45 March 31, 2014
INE155A07193 Rs.1250 crores Rs.919.23 crores 10.03 March 31, 2016
INE155A07219 Rs.200 crores Nil 9.95 March 2, 2020
INE155A07227 Rs.500 crores Nil 10.25 Rs.100 crores – April 30, 2022
Rs.100 crores – April 30, 2023
Rs.150 crores – April 30, 2024
Rs.150 crores – April 30, 2025
INE155A08043 Rs.150 crores Nil 9.90 May 7, 2020
INE155A08050 Rs.100 crores Nil 9.75 May 24, 2020
*Detailed information on the above debentures are included in the ‘Notes to Accounts’.
Plant Locations
Plant Location Range of Products Produced
Pimpri, Pune – 411 018; Chikhali, Pune – 410 501 Medium and Heavy Commercial Vehicles (M&HCVs), Light
Chinchwad, Pune – 411 033 Commercial Vehicles (LCVs), Utility Vehicles (UVs) and Cars
Jamshedpur – 831 010 M&HCVs
Chinhat Industrial Area, Lucknow – 226 019 M&HCVs and LCVs
Plot No. 1, Section 11, I.I.E., Pantnagar, District LCVs & Cars
Udhamsingh Nagar, Uttarakhand – 263145
Revenue Survey No. 1, Village Northkotpura, Passenger Cars
Tal, Sanand, Dist. Ahmedabad - 380 015
KIADB Block II, Belur Industrial Area, Mummigatti Post, Project under construction / implementation
Dharwad – 580007
Address for correspondence
Tata Motors Limited, Bombay House, 24, Homi Mody Street, Mumbai - 400 001, India.
Action required regarding non-receipt of dividends, proceeds of matured deposits and interest and redeemed debentures andinterest thereon:-
(i) Pursuant to Sections 205A and 205C of the Act, all unclaimed/unpaid dividend, application money, debenture interest and
interest on deposits as well as principal amount of debentures and deposits pertaining to the Company and erstwhile Tata
Finance Limited (TFL) remaining unpaid or unclaimed for a period of 7 years from the date they became due for payment,
have been transferred to the Investors Education and Protection Fund (IEPF) established by the Central Government.
(ii) In case of non receipt/non encashment of the dividend warrants, Members are requested to correspond with the Company’s
Registrars/the Registrar of Companies, as mentioned hereunder:
Dividend for Whether it can Contact Office Action to be taken be claimed
2003-04 to 2008-09 Yes TSR Darashaw Limited Letter on plain paper.
2002-03 No - None. Already transferred to IEPF.
2000-01 and 2001-02 N.A. - Not Applicable due to non declaration
of dividend
1995-96 to 1999-2000 No - None. Already transferred to IEPF.
1978-79 to 1994-95 Yes Office of the Registrar of Companies, Claim in Form No. II of the Companies
CGO Complex, ‘A’ Wing, 2nd floor, Unpaid Dividend (Transfer to General
Next to RBI, CBD – Belapur, Navi Revenue Account of the Central
Mumbai - 400614. Maharashtra Government) Rules, 1978.
91 22 2757 6802
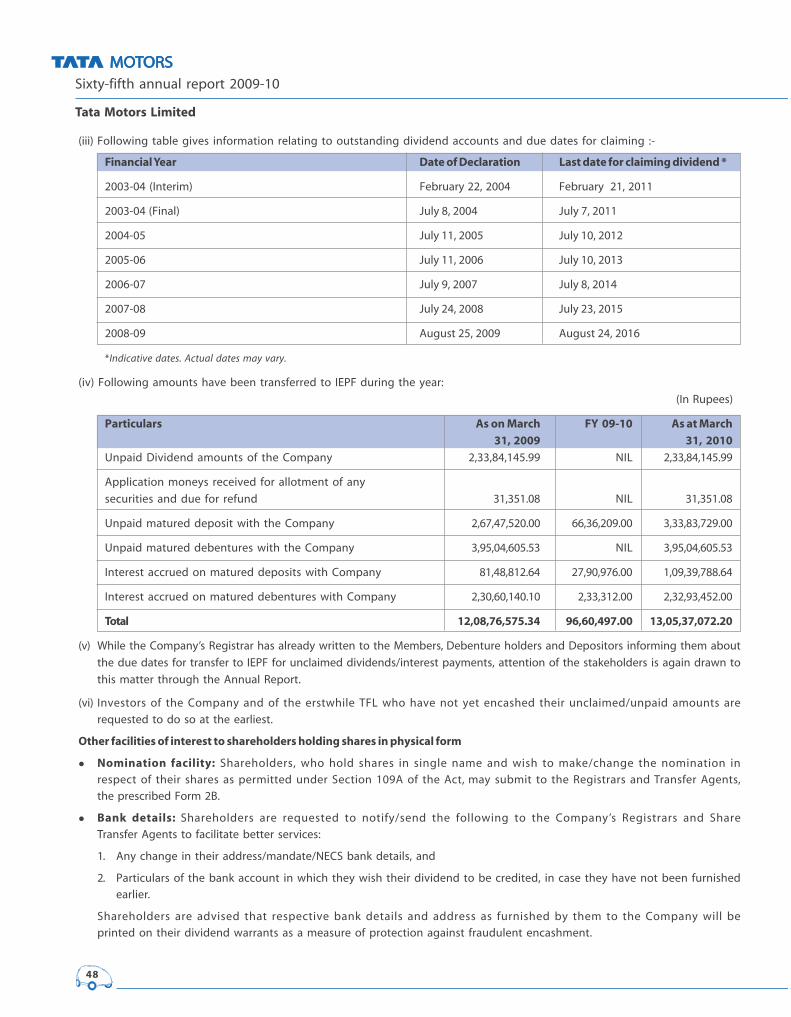
Sixty-fifth annual report 2009-10
Tata Motors Limited
48
(iii) Following table gives information relating to outstanding dividend accounts and due dates for claiming :-
Financial Year Date of Declaration Last date for claiming dividend *
2003-04 (Interim) February 22, 2004 February 21, 2011
2003-04 (Final) July 8, 2004 July 7, 2011
2004-05 July 11, 2005 July 10, 2012
2005-06 July 11, 2006 July 10, 2013
2006-07 July 9, 2007 July 8, 2014
2007-08 July 24, 2008 July 23, 2015
2008-09 August 25, 2009 August 24, 2016
*Indicative dates. Actual dates may vary.
(iv) Following amounts have been transferred to IEPF during the year:
(In Rupees)
Particulars As on March FY 09-10 As at March
31, 2009 31, 2010
Unpaid Dividend amounts of the Company 2,33,84,145.99 NIL 2,33,84,145.99
Application moneys received for allotment of any
securities and due for refund 31,351.08 NIL 31,351.08
Unpaid matured deposit with the Company 2,67,47,520.00 66,36,209.00 3,33,83,729.00
Unpaid matured debentures with the Company 3,95,04,605.53 NIL 3,95,04,605.53
Interest accrued on matured deposits with Company 81,48,812.64 27,90,976.00 1,09,39,788.64
Interest accrued on matured debentures with Company 2,30,60,140.10 2,33,312.00 2,32,93,452.00
Total 12,08,76,575.34 96,60,497.00 13,05,37,072.20
(v) While the Company’s Registrar has already written to the Members, Debenture holders and Depositors informing them about
the due dates for transfer to IEPF for unclaimed dividends/interest payments, attention of the stakeholders is again drawn to
this matter through the Annual Report.
(vi) Investors of the Company and of the erstwhile TFL who have not yet encashed their unclaimed/unpaid amounts are
requested to do so at the earliest.
Other facilities of interest to shareholders holding shares in physical form
� Nomination facility: Shareholders, who hold shares in single name and wish to make/change the nomination in
respect of their shares as permitted under Section 109A of the Act, may submit to the Registrars and Transfer Agents,
the prescribed Form 2B.
� Bank details: Shareholders are requested to notify/send the following to the Company’s Registrars and Share
Transfer Agents to facilitate better services:
1. Any change in their address/mandate/NECS bank details, and
2. Particulars of the bank account in which they wish their dividend to be credited, in case they have not been furnished
earlier.
Shareholders are advised that respective bank details and address as furnished by them to the Company will be
printed on their dividend warrants as a measure of protection against fraudulent encashment.
49
DECLARATION BY THE CEO UNDER CLAUSE 49 OF THE LISTING AGREEMENT REGARDING ADHERENCE TO THE CODE OF CONDUCT
In accordance with Clause 49 sub-clause I(D) of the Listing Agreement with the Stock Exchanges, I hereby confirm that, all the
Directors and the Senior Management personnel of the Company have affirmed compliance to their respective Codes of Conduct,
as applicable to them for the Financial Year ended March 31, 2010.
For Tata Motors Limited
CARL-PETER FORSTER
Chief Executive Officer and Managing Director
Mumbai, May 27, 2010
PRACTISING COMPANY SECRETARIES’ CERTIFICATE ON CORPORATE GOVERNANCE
TO THE MEMBERS OF TATA MOTORS LIMITED
We have examined the compliance of the conditions of Corporate Governance by Tata Motors Limited for the year ended on
March 31, 2010, as stipulated in clause 49 of the Listing Agreement of the said Company with the Stock Exchanges.
The compliance of the conditions of Corporate Governance is the responsibility of the management. Our examination was
limited to procedures and implementation thereof, adopted by the Company for ensuring the compliance of the conditions of
Corporate Governance. It is neither an audit nor an expression of opinion on the financial statements of the Company.
In our opinion and to the best of our information and according to the explanations given to us, and the representations made
by the Directors and the Management, we certify that the Company has complied with the conditions of Corporate Governance
as stipulated in the above mentioned Listing Agreement.
We state that such compliance is neither an assurance as to the future viability of the Company nor of the efficiency or
effectiveness with which the management has conducted the affairs of the Company.
For Parikh & Associates
Practising Company Secretaries
P. N. Parikh
FCS: 327 CP: 1228
Mumbai, May 27, 2010

Sixty-fifth annual report 2009-10
Tata Motors Limited
50
SUB
SID
IAR
Y C
OM
PAN
IES:
FIN
AN
CIA
L H
IGH
LIG
HTS
- 20
09-1
0(R
s. In
cro
re
s)
Sr.
Su
bsid
iary
Co
un
try
Re
po
rtin
gS
ha
re
Re
se
rv
es
Min
orit
yF
ore
ign
To
ta
lT
ota
lT
urn
ov
er
Pro
fit
/T
ax
Pro
fit
/P
ro
fit
/P
ro
po
se
d I
nv
estm
en
ts
No
of
cu
rre
nc
y #
ca
pit
al
an
dIn
te
re
st
Cu
rre
nc
yA
sse
ts
Lia
bil
itie
s(L
oss)
Ex
pe
nse
/(L
oss)
(L
oss)
div
ide
nd
(e
xc
ep
t
Inc
orp
o-
(in
cl.
Su
rp
lus
Mo
ne
ta
ry
Be
fo
re
(C
re
dit
)a
fte
rfo
r
th
ea
nd
in c
ase
ra
tio
na
dv
an
ce
sT
ra
nsla
tio
n T
ax
ta
xy
ea
r *
ta
xo
f
to
wa
rd
sD
iffe
re
nc
eth
ere
on
inv
estm
en
t
ca
pit
al
Ac
co
un
t i
n t
he
wh
ere
Asse
t/
su
bsid
iarie
s)
ap
pli
ca
ble
) (
Lia
bil
ity
)
ID
etai
ls o
f Sub
sidi
arie
s1
TA
L M
an
ufa
ctu
rin
g S
olu
tio
ns L
td
.In
dia
INR
65
.00
25
.92
--
26
3.5
21
72
.60
18
6.3
31
8.9
43
.60
15
.34
15
.34
--
2H
V A
xle
s L
td
.In
dia
INR
45
.00
22
3.8
4-
-3
95
.87
12
7.0
32
39
.42
95
.29
31
.44
63
.85
63
.85
26
.24
52
.76
3H
V T
ra
nsm
issio
ns L
td
.In
dia
INR
40
.00
14
0.0
1-
-3
34
.70
15
4.6
92
09
.25
77
.47
24
.83
52
.64
52
.64
23
.32
11
.00
4C
on
co
rd
e M
oto
rs (
Ind
ia) L
td
.In
dia
INR
26
.80
24
.93
--
20
7.4
61
55
.73
79
1.6
46
.21
2.0
54
.16
4.1
62
.70
-
5S
he
ba
Pro
pe
rtie
s L
td
.In
dia
INR
75
.00
71
.46
--
14
9.7
43
.28
5.7
35
.51
1.0
24
.49
4.4
9-
13
5.6
1
6T
ata
Da
ew
oo
Co
mm
erc
ial
Ve
hic
le C
o. L
td
.S
ou
th
Ko
re
aK
RW
57
.35
92
0.0
0-
-2
,52
2.3
11
,54
4.9
62
,73
3.7
81
05
.97
24
.35
81
.62
81
.62
-2
.38
7T
ata
Te
ch
no
log
ies L
td
.In
dia
INR
37
.24
38
7.1
7-
-5
46
.20
80
.85
39
1.8
01
07
.50
30
.94
76
.56
76
.56
30
.35
44
.10
8T
ata
Mo
to
rs I
nsu
ra
nc
e B
ro
kin
g &
Ad
vis
ory
Se
rv
ice
s L
td
Ind
iaIN
R2
.50
0.4
7-
-8
.85
5.8
91
4.7
60
.35
-0
.35
0.3
5-
2.5
2
9T
ata
Mo
to
rs E
uro
pe
an
Te
ch
nic
al
Ce
ntre
Plc
.U
KG
BP
24
.83
32
.72
--
21
5.6
91
58
.13
17
8.5
51
5.3
7(1
.24
)1
6.6
11
6.6
10
.84
-
10
TM
L D
istrib
utio
n C
om
pa
ny
Ltd
.In
dia
INR
22
5.0
02
1.3
9-
-1
,57
9.9
21
,33
3.5
31
3,9
04
.00
41
.01
11
.26
29
.75
29
.75
--
11
Ta
ta
Mo
to
rs (
SA
) (
Pro
prie
ta
ry
) L
td
.S
ou
th
Afric
aZ
AR
0.0
2(0
.02
)-
--
--
--
--
--
12
Ta
ta
Mo
to
rs F
ina
nc
e L
td
.In
dia
INR
85
0.0
04
81
.02
--
9,4
01
.06
8,0
70
.04
1,2
10
.92
68
.53
24
.37
44
.16
44
.16
-3
90
.93
13
Ta
ta
Ma
rc
op
olo
Mo
to
rs L
td
.In
dia
INR
17
0.0
0(4
8.5
9)
--
43
0.6
33
09
.22
36
4.3
1(7
.47
)0
.02
(7
.49
)(7
.49
)-
0.0
0
14
Ta
ta
Mo
to
rs (
Th
ail
an
d) L
td
.T
ha
ila
nd
TH
B1
54
.56
(1
88
.64
)-
-2
65
.10
29
9.1
81
52
.33
(8
8.2
5)
-(8
8.2
5)
(8
8.2
5)
--
15
TM
L H
old
ing
s P
te
Ltd
, S
ing
ap
ore
Sin
ga
po
re
US
D1
7,3
37
.92
40
1.8
0-
23
5.9
71
7,9
77
.57
1.8
8-
(2
86
.41
)-
(2
86
.41
)(2
86
.41
)-
-
16
Ta
ta
His
pa
no
Mo
to
rs C
arro
ce
ra
S.A
.
(F
orm
erly
kn
ow
n a
s H
isp
an
o C
arro
ce
ra
S.A
.)S
pa
inE
UR
O3
.70
(1
79
.96
)-
-1
87
.83
36
4.5
31
18
.15
(6
6.9
2)
(9
.49
)(5
7.4
3)
(5
7.4
3)
--
17
INC
AT
In
te
rn
atio
na
l P
lc L
td
U.K
.G
BP
1.6
53
2.4
7-
-4
0.6
06
.48
-(1
.07
)-
(1
.07
)(1
.07
)-
-
18
Ta
ta
Te
ch
no
log
ies I
nc
(fo
rm
erly
kn
ow
n a
s I
NC
AT
Sy
ste
ms I
nc
.)U
SA
US
D2
01
.24
39
1.5
8-
-1
41
.74
33
1.2
63
58
.32
8.1
9(2
.49
)1
0.6
81
0.6
8-
-
19
Ta
ta
Te
ch
no
log
ies C
an
ad
a I
nc
.
(fo
rm
erly
kn
ow
n a
s I
NC
AT
So
lutio
ns o
f C
an
ad
a I
nc
.)C
an
ad
aU
SD
(0
.00
)4
.33
--
3.4
37
.77
1.8
40
.65
(0
.02
)0
.67
0.6
7-
-
20
Ta
ta
Te
ch
no
log
ies d
e M
ex
ico
, S
.A. d
e C
.V. (
fo
rm
erly
kn
ow
n a
s
Inte
gra
te
d S
yste
ms T
ec
hn
olo
gie
s d
e M
ex
ico
, S
.A. d
e C
.V.)
Me
xic
oU
SD
(0
.70
)(1
.56
)-
-3
.00
2.3
71
1.8
1(0
.19
)0
.14
(0
.33
)(0
.33
)-
-
21
Ta
ta
Te
ch
no
log
ies E
uro
pe
Lim
ite
d (
fo
rm
erly
kn
ow
n a
s
INC
AT
Lim
ite
d)
UK
GB
P0
.70
12
.95
--
14
6.4
41
33
.42
32
4.3
12
.67
1.0
81
.59
1.5
9-
-
22
INC
AT
Gm
bH
Ge
rm
an
yE
UR
O0
.99
11
.24
--
12
.31
0.0
7-
(0
.20
)-
(0
.20
)(0
.20
)-
-
23
INC
AT
SA
SF
ra
nc
eE
UR
O0
.42
(0
.69
)-
-3
.19
3.4
50
.32
(0
.18
)-
(0
.18
)(0
.18
)-
-
24
Ta
ta
Te
ch
no
log
ies (
Th
ail
an
d) L
imit
ed
(fo
rm
erly
kn
ow
n a
s I
NC
AT
(T
ha
ila
nd
) L
imit
ed
)T
ha
ila
nd
TH
B4
.93
(3
.91
)-
-1
.84
0.8
23
.47
(0
.73
)-
(0
.73
)(0
.73
)-
-
25
TA
TA
Te
ch
no
log
ies P
te
Ltd
.S
ing
ap
ore
SG
D2
82
.83
25
0.5
2-
-5
43
.60
10
.25
25
.61
4.7
90
.01
4.7
84
.78
--
26
Mil
job
il G
re
en
lan
d A
SN
orw
ay
NO
K6
.83
(1
1.7
8)
--
71
.86
76
.80
11
.57
(1
9.3
8)
-(1
9.3
8)
(1
9.3
8)
--
27
Ja
gu
arL
an
dR
ov
er L
imit
ed
UK
US
D1
7,7
54
.19
(1
,95
2.0
4)
--
15
,80
2.3
40
.19
-5
02
.52
-5
02
.52
50
2.5
2-
-
28
Ja
gu
ar C
ars L
imit
ed
UK
GB
P1
9,3
90
.16
(1
4,0
31
.27
)-
-1
4,1
94
.63
13
,46
0.8
71
3,0
17
.68
(1
,51
3.0
0)
70
.46
(1
,58
3.4
6)
(1
,58
3.4
6)
--
29
La
nd
Ro
ve
rU
KG
BP
5,7
21
.69
(4
,47
6.7
5)
--
35
,60
1.6
13
0,4
63
.25
23
,49
8.0
5(1
,01
4.4
7)
26
6.6
9(1
,28
1.1
6)
(1
,28
1.1
6)
--
30
Ja
gu
ar C
ars E
xp
orts L
imit
ed
UK
GB
P6
80
.67
10
3.4
6-
-4
,27
7.3
14
,17
3.8
54
,65
7.1
81
3.6
4(2
7.2
7)
40
.91
40
.91
--
31
Ja
gu
ar L
an
d R
ov
er N
orth
Am
eric
a, L
LC
.U
SA
US
D7
06
.19
57
.43
--
3,4
99
.60
3,1
48
.90
10
,89
5.3
85
3.3
52
4.3
12
9.0
42
9.0
4-
-
32
Ja
gu
ar H
isp
an
ia S
LS
pa
inE
UR
O5
.45
12
.38
--
88
.06
88
.06
21
0.2
82
.69
0.9
11
.78
1.7
8-
-
33
Ja
gu
ar D
eu
tsc
hla
nd
Gm
bH
Ge
rm
an
yE
UR
O1
5.4
81
24
.04
--
26
7.7
11
43
.67
47
4.9
46
.55
2.2
34
.32
4.3
2-
-
34
Ja
gu
ar B
elu
x N
.V.
Be
lgiu
mE
UR
O7
.57
16
.26
--
24
.58
90
.32
27
0.2
53
.19
0.9
62
.23
2.2
3-
-
35
Ja
gu
ar L
an
d R
ov
er A
ustria
Gm
bH
Au
stria
EU
RO
0.8
82
1.5
4-
-9
8.8
37
7.2
83
74
.80
4.3
31
.24
3.0
93
.09
-2
.21
36
Ja
gu
ar C
ars O
ve
rse
as H
old
ing
s L
imit
ed
UK
GB
P0
.00
(0
.01
)-
--
--
--
--
--
37
Ja
gu
ar I
ta
lia
Sp
AIta
lyE
UR
O5
.31
46
.63
--
14
7.8
41
01
.21
37
4.5
71
1.4
2(3
.13
)8
.29
8.2
9-
-
38
La
nd
Ro
ve
r G
ro
up
Lim
ite
dJe
rse
yG
BP
26
0.7
03
11
.75
--
56
4.9
52
53
.21
-3
.03
(3
.79
)6
.82
6.8
2-
-
39
La
nd
Ro
ve
r I
re
lan
d L
imit
ed
Ire
lan
dE
UR
O0
.00
18
.47
--
12
7.1
31
14
.30
31
8.9
63
.55
0.6
72
.88
2.8
8-
-
40
Ja
gu
ar L
an
d R
ov
er A
ustra
lia
Pty
Lim
ite
dA
ustra
lia
AU
D2
.88
58
.15
--
66
3.4
36
05
.27
1,5
36
.79
13
.41
4.8
38
.58
8.5
8-
-
41
La
nd
Ro
ve
r E
xp
orts L
imit
ed
UK
GB
P6
80
.67
32
4.6
8-
-1
2,0
81
.84
11
,75
7.1
61
8,3
75
.68
(1
.52
)(3
8.6
4)
37
.12
37
.12
--
42
La
nd
Ro
ve
r E
sp
an
a S
LS
pa
inE
UR
O2
52
.15
30
0.3
7-
-5
97
.05
29
6.6
98
01
.16
6.9
81
.88
5.1
05
.10
--
43
La
nd
Ro
ve
r D
eu
tsc
hla
nd
Gm
bH
Ge
rm
an
yE
UR
O0
.15
19
4.4
8-
-6
17
.48
42
3.0
01
,43
4.2
49
.09
3.0
46
.05
6.0
5-
-
44
La
nd
Ro
ve
r N
ed
erla
nd
BV
Ne
th
erla
nd
sE
UR
O0
.27
32
.36
--
12
8.7
39
6.3
73
60
.98
5.6
71
.31
4.3
64
.36
--
45
La
nd
Ro
ve
r B
elu
x S
A/N
VB
elg
ium
EU
RO
1.2
38
.42
--
18
2.1
01
72
.50
57
6.8
70
.27
0.2
10
.06
0.0
6-
-
46
La
nd
Ro
ve
r I
ta
lia
Sp
AIta
lyE
UR
O1
15
.05
19
7.5
2-
-7
22
.47
55
3.7
52
,34
9.7
11
1.1
81
0.9
40
.24
0.2
4-
-
47
Ja
gu
ar L
an
d R
ov
er P
ortu
ga
l-V
eic
ulo
s e
Pe
ca
s, L
da
.P
ortu
ga
lE
UR
8.0
54
9.2
7-
-1
21
.17
71
.90
13
9.9
02
.72
2.5
70
.15
0.1
5-
-
48
Ja
gu
ar L
an
d R
ov
er M
ex
ico
, S
A d
e C
VM
ex
ico
MX
P0
.02
(1
31
.76
)-
-6
7.6
38
0.8
01
36
.05
19
.56
-1
9.5
61
9.5
6-
-
49
Ja
gu
ar L
an
d R
ov
er A
uto
Tra
de
(S
ha
ng
ha
i) C
o. L
td
Ch
ina
CN
Y1
2.5
95
8.3
6-
-1
61
.65
10
3.2
91
95
.25
21
.84
7.5
91
4.2
51
4.2
5-
-
50
Ja
gu
ar L
an
d R
ov
er J
ap
an
Lim
ite
dJa
pa
nY
EN
16
8.8
13
60
.77
--
56
1.0
02
00
.23
53
2.6
31
5.5
8(2
1.9
6)
37
.54
37
.54
--
51
Ja
gu
ar L
an
d R
ov
er K
ore
a C
om
pa
ny
Lim
ite
dS
ou
th
Ko
re
aK
RW
23
.74
20
.73
--
11
1.8
09
1.0
73
40
.23
4.3
70
.98
3.3
93
.39
--
52
Ja
gu
ar L
an
d R
ov
er C
an
ad
a U
LC
Ca
na
da
CA
D-
--
--
--
--
--
--
53
Ja
gu
ar L
an
d R
ov
er F
ra
nc
e S
AS
Fra
nc
eE
UR
O1
8.8
73
7.7
2-
-4
26
.65
38
8.9
41
,61
2.8
32
8.7
6-
28
.76
28
.76
--
54
Ja
gu
ar L
an
d R
ov
er (
So
uth
Afric
a) (
Pty
) L
td
So
uth
Afric
aZ
AR
--
--
--
--
--
--
-
55
Ja
gu
ar C
ars S
ou
th
Afric
a (
Pty
) L
td
So
uth
Afric
aZ
AR
--
--
--
--
--
--
-
56
Ja
gu
ar L
an
d R
ov
er B
ra
zil
LL
CB
ra
zil
BR
L2
24
.33
26
9.0
9-
-4
17
.11
14
8.0
21
,10
7.5
94
4.8
2(5
.01
)4
9.8
24
9.8
2-
-
57
Da
imle
r T
ra
nsp
ort V
eh
icle
s L
imit
ed
UK
GB
P0
.00
0.0
0-
-0
.00
--
--
--
--
58
S S
Ca
rs L
imit
ed
UK
GB
P0
.00
0.0
0-
-0
.00
--
--
--
--
59
Th
e L
an
ch
este
r M
oto
r C
om
pa
ny
Lim
ite
dU
KG
BP
0.0
00
.00
--
0.0
0-
--
--
--
-
60
Th
e D
aim
ler M
oto
r C
om
pa
ny
Lim
ite
dU
KG
BP
10
.21
10
.21
--
10
.21
--
--
--
--
61
Th
e J
ag
ua
r C
oll
ec
tio
n L
imit
ed
UK
GB
P0
.00
0.0
0-
-0
.00
--
--
--
--
62
La
nd
Ro
ve
r P
arts L
imit
ed
UK
GB
P-
61
.94
--
77
3.2
47
11
.30
2,7
65
.37
68
.94
-6
8.9
46
8.9
4-
-
63
La
nd
Ro
ve
r P
arts N
A L
LC
US
AU
SD
0.2
10
.21
--
0.5
60
.35
0.6
60
.00
-0
.00
0.0
0-
-
64
Ja
gu
ar L
an
d R
ov
er R
ussia
LL
CR
ussia
RU
R5
73
.09
78
3.7
6-
-1
,01
2.2
92
28
.54
2,1
97
.61
19
6.9
26
6.0
61
30
.86
13
0.8
6-
-
65
Ca
rro
ce
ra
His
pa
no
Ma
gh
re
b, M
orro
co
(w
.e.f
Oc
to
be
r 1
6, 2
00
9)
Sp
ain
EU
RO
10
.53
(1
5.9
2)
63
.11
67
.99
38
.12
(8
.98
)-
(8
.98
)(8
.98
)-
-
De
ta
ils o
f D
ire
ct s
ub
sid
iarie
s ,
on
co
nso
lid
ate
d b
asis
in
clu
din
g t
he
ir
re
sp
ec
tiv
e s
ub
sid
iarie
s i
nc
lud
ed
ab
ov
e
1T
ata
Te
ch
no
log
ies L
imit
ed
( N
ote
A, P
ag
e 5
1)
37
.24
30
9.9
6-
-9
04
.69
55
7.4
81
,08
5.1
21
25
.97
34
.97
91
.00
91
.00
30
.35
44
.10
2T
ata
Mo
to
rs E
uro
pe
an
Te
ch
nic
al
Ce
ntre
Plc
.( N
ote
B, P
ag
e 5
1)
24
.83
13
.12
--
73
.92
17
2.5
61
77
.29
(4
.01
)(1
.24
)(2
.77
)(2
.77
)-
3T
ata
His
pa
no
Mo
to
rs C
arro
ce
ra
S.A
. ( N
ote
C, P
ag
e 5
1)
3.7
0(1
92
.00
)-
-2
07
.67
39
5.9
66
7.3
8(3
8.5
5)
(9
.23
)(2
9.3
2)
(2
9.3
2)
--
4T
ML
Ho
ldin
gs P
te
Ltd
, S
ing
ap
ore
( N
ote
D, P
ag
e 5
1)
17
,33
7.9
2(6
,91
3.9
3)
-3
52
.84
39
,84
4.7
42
9,0
67
.91
49
,34
4.2
1(3
94
.54
)2
13
.96
(6
08
.50
)(6
08
.50
)-
2.2
1
0.0
0 re
pre
se
nts ro
un
de
d o
ff
51
Notes: Country ofIncorporation
(A) List of Subsidiaries of Tata Technologies Limited that have been consolidated1 INCAT International Plc Ltd U.K.
2 Tata Technologies Inc (formerly known as INCAT Systems Inc.) USA
3 Tata Technologies Canada Inc. (formerly known as INCAT Solutions of Canada Inc.) Canada
4 Tata Technologies de Mexico, S.A. de C.V. (formerly known as Integrated Systems Technologies de Mexico, S.A. de C.V.) Mexico
5 Tata Technologies Europe Limited (formerly known as INCAT Limited) UK
6 INCAT GmbH Germany
7 INCAT SAS France
8 Tata Technologies (Thailand) Limited (formerly known as INCAT (Thailand) Limited) Thailand
9 TATA Technologies Pte Ltd. Singapore
(B) List of Subsidiaries of Tata Motors European Technical Centre Plc that have been consolidated1 Miljobil Greenland AS Norway
(C) List of Subsidiaries of Tata Hispano Motors Carrocera S.A. that have been consolidated1 Carrocera Hispano Maghreb, Morroco Spain
(D) List of Subsidiaries of TML Holdings Pte Ltd, Singapore that have been consolidated1 JaguarLandRover Limited UK
2 Jaguar Cars Limited UK
3 Land Rover UK
4 Jaguar Cars Exports Limited UK
5 Jaguar Land Rover North America, LLC. USA
6 Jaguar Hispania SL Spain
7 Jaguar Deutschland GmbH Germany
8 Jaguar Belux N.V. Belgium
9 Jaguar Land Rover Austria GmbH Austria
10 Jaguar Cars Overseas Holdings Limited UK
11 Jaguar Italia SpA Italy
12 Land Rover Group Limited Jersey
13 Land Rover Ireland Limited Ireland
14 Jaguar Land Rover Australia Pty Limited Australia
15 Land Rover Exports Limited UK
16 Land Rover Espana SL Spain
17 Land Rover Deutschland GmbH Germany
18 Land Rover Nederland BV Netherlands
19 Land Rover Belux SA/NV Belgium
20 Land Rover Italia SpA Italy
21 Jaguar Land Rover Portugal-Veiculos e Pecas, Lda. Portugal
22 Jaguar Land Rover Mexico, SA de CV Mexico
23 Jaguar Land Rover Auto Trade (Shanghai) Co. Ltd China
24 Jaguar Land Rover Japan Limited Japan
25 Jaguar Land Rover Korea Company Limited South Korea
26 Jaguar Land Rover Canada ULC Canada
27 Jaguar Land Rover France SAS France
28 Jaguar Land Rover (South Africa) (Pty) Ltd South Africa
29 Jaguar Cars South Africa (Pty) Ltd South Africa
30 Jaguar Land Rover Brazil LLC Brazil
31 Daimler Transport Vehicles Limited UK
32 S S Cars Limited UK
33 The Lanchester Motor Company Limited UK
34 The Daimler Motor Company Limited UK
35 The Jaguar Collection Limited UK
36 Land Rover Parts Limited UK
37 Land Rover Parts NA LLC USA
38 Jaguar Land Rover Russia LLC Russia
# The financial statements of subsidiaries whose reporting currency are other than INR are converted into Indian Rupees on the basis of appropriate
exchange rates.
* Profit for the year is after share of minority interest and share of profit/(loss) in respect of investment in associate companies.
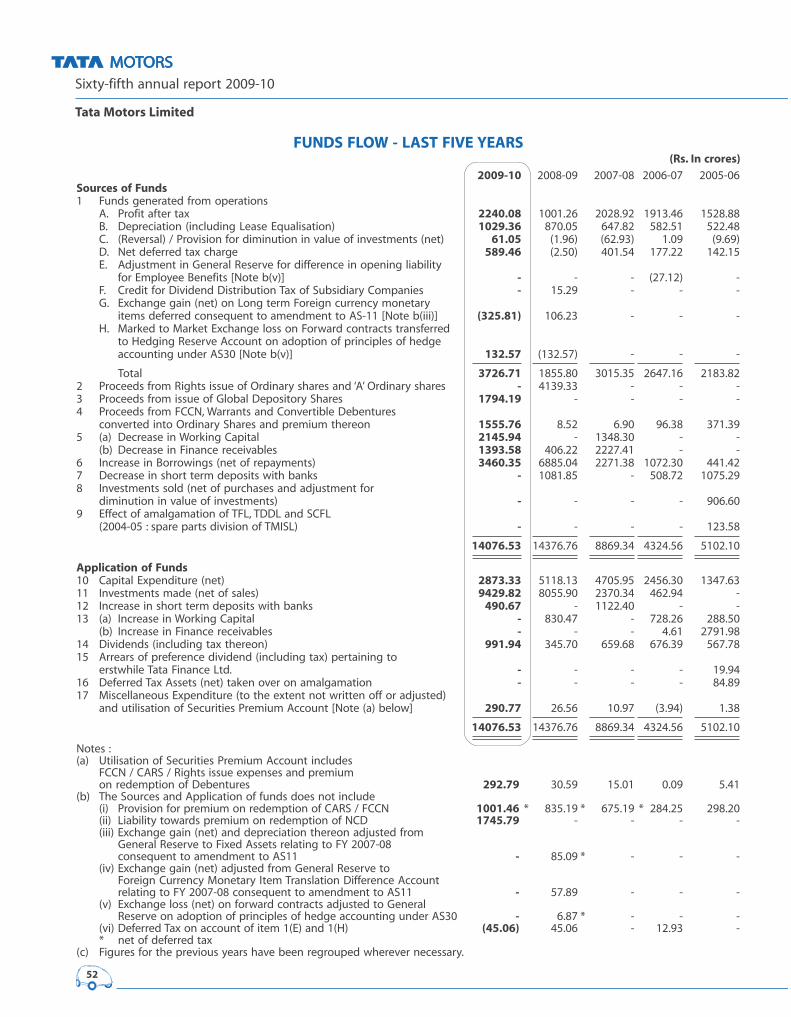
Sixty-fifth annual report 2009-10
Tata Motors Limited
52
FUNDS FLOW - LAST FIVE YEARS(Rs. In crores)
2009-10 2008-09 2007-08 2006-07 2005-06
Sources of Funds1 Funds generated from operations
A. Profit after tax 2240.08 1001.26 2028.92 1913.46 1528.88
B. Depreciation (including Lease Equalisation) 1029.36 870.05 647.82 582.51 522.48
C. (Reversal) / Provision for diminution in value of investments (net) 61.05 (1.96) (62.93) 1.09 (9.69)
D. Net deferred tax charge 589.46 (2.50) 401.54 177.22 142.15
E. Adjustment in General Reserve for difference in opening liability
for Employee Benefits [Note b(v)] - - - (27.12) -
F. Credit for Dividend Distribution Tax of Subsidiary Companies - 15.29 - - -
G. Exchange gain (net) on Long term Foreign currency monetary
items deferred consequent to amendment to AS-11 [Note b(iii)] (325.81) 106.23 - - -
H. Marked to Market Exchange loss on Forward contracts transferred
to Hedging Reserve Account on adoption of principles of hedge
accounting under AS30 [Note b(v)] 132.57 (132.57) - - -
Total 3726.71 1855.80 3015.35 2647.16 2183.82
2 Proceeds from Rights issue of Ordinary shares and ‘A’ Ordinary shares - 4139.33 - - -
3 Proceeds from issue of Global Depository Shares 1794.19 - - - -
4 Proceeds from FCCN, Warrants and Convertible Debentures
converted into Ordinary Shares and premium thereon 1555.76 8.52 6.90 96.38 371.39
5 (a) Decrease in Working Capital 2145.94 - 1348.30 - -
(b) Decrease in Finance receivables 1393.58 406.22 2227.41 - -
6 Increase in Borrowings (net of repayments) 3460.35 6885.04 2271.38 1072.30 441.42
7 Decrease in short term deposits with banks - 1081.85 - 508.72 1075.29
8 Investments sold (net of purchases and adjustment for
diminution in value of investments) - - - - 906.60
9 Effect of amalgamation of TFL, TDDL and SCFL
(2004-05 : spare parts division of TMISL) - - - - 123.58
14076.53 14376.76 8869.34 4324.56 5102.10
Application of Funds10 Capital Expenditure (net) 2873.33 5118.13 4705.95 2456.30 1347.63
11 Investments made (net of sales) 9429.82 8055.90 2370.34 462.94 -
12 Increase in short term deposits with banks 490.67 - 1122.40 - -
13 (a) Increase in Working Capital - 830.47 - 728.26 288.50
(b) Increase in Finance receivables - - - 4.61 2791.98
14 Dividends (including tax thereon) 991.94 345.70 659.68 676.39 567.78
15 Arrears of preference dividend (including tax) pertaining to
erstwhile Tata Finance Ltd. - - - - 19.94
16 Deferred Tax Assets (net) taken over on amalgamation - - - - 84.89
17 Miscellaneous Expenditure (to the extent not written off or adjusted)
and utilisation of Securities Premium Account [Note (a) below] 290.77 26.56 10.97 (3.94) 1.38
14076.53 14376.76 8869.34 4324.56 5102.10
Notes :
(a) Utilisation of Securities Premium Account includes
FCCN / CARS / Rights issue expenses and premium
on redemption of Debentures 292.79 30.59 15.01 0.09 5.41
(b) The Sources and Application of funds does not include
(i) Provision for premium on redemption of CARS / FCCN 1001.46 * 835.19 * 675.19 * 284.25 298.20
(ii) Liability towards premium on redemption of NCD 1745.79 - - - -
(iii) Exchange gain (net) and depreciation thereon adjusted from
General Reserve to Fixed Assets relating to FY 2007-08
consequent to amendment to AS11 - 85.09 * - - -
(iv) Exchange gain (net) adjusted from General Reserve to
Foreign Currency Monetary Item Translation Difference Account
relating to FY 2007-08 consequent to amendment to AS11 - 57.89 - - -
(v) Exchange loss (net) on forward contracts adjusted to General
Reserve on adoption of principles of hedge accounting under AS30 - 6.87 * - - -
(vi) Deferred Tax on account of item 1(E) and 1(H) (45.06) 45.06 - 12.93 -
* net of deferred tax
(c) Figures for the previous years have been regrouped wherever necessary.
53
AUDITORS’ REPORT
TO THE MEMBERS OFTATA MOTORS LIMITED
1. We have audited the attached Balance Sheet of TATA MOTORS LIMITED (“the Company”) as at March 31, 2010, the Profit
and Loss Account and the Cash Flow Statement of the Company for the year ended on that date, both annexed thereto.
These financial statements are the responsibility of the Company’s Management. Our responsibility is to express an opinion
on these financial statements based on our audit.
2. We conducted our audit in accordance with the auditing standards generally accepted in India. Those Standards require
that we plan and perform the audit to obtain reasonable assurance about whether the financial statements are free of
material misstatements. An audit includes examining, on a test basis, evidence supporting the amounts and the disclosures
in the financial statements. An audit also includes assessing the accounting principles used and the significant estimates
made by the Management, as well as evaluating the overall financial statement presentation. We believe that our audit
provides a reasonable basis for our opinion.
3. As required by the Companies (Auditor’s Report) Order, 2003 (CARO) issued by the Central Government in terms of Section
227(4A) of the Companies Act, 1956, we enclose in the Annexure a statement on the matters specified in paragraphs 4 and
5 of the said Order.
4. Further to our comments in the Annexure referred to in paragraph 3 above, we report as follows:
(a) we have obtained all the information and explanations which to the best of our knowledge and belief were necessary
for the purposes of our audit;
(b) in our opinion, proper books of account as required by law have been kept by the Company so far as it appears from
our examination of those books;
(c) the Balance Sheet, the Profit and Loss Account and the Cash Flow Statement dealt with by this report are in agreement
with the books of account;
(d) in our opinion, the Balance Sheet, the Profit and Loss Account and the Cash Flow Statement dealt with by this report
are in compliance with the Accounting Standards referred to in Section 211(3C) of the Companies Act, 1956;
(e) in our opinion and to the best of our information and according to the explanations given to us, the said accounts give
the information required by the Companies Act, 1956 in the manner so required and give a true and fair view in
conformity with the accounting principles generally accepted in India:
(i) in the case of the Balance Sheet, of the state of affairs of the Company as at March 31, 2010;
(ii) in the case of the Profit and Loss Account, of the profit of the Company for the year ended on that date; and
(iii) in the case of the Cash Flow Statement, of the cash flows of the Company for the year ended on that date.
5. On the basis of the written representations received from the Directors as on March 31, 2010 taken on record by the Board
of Directors, none of the Directors is disqualified as on March 31, 2010 from being appointed as a director in terms of
Section 274(1) (g) of the Companies Act, 1956.
For DELOITTE HASKINS & SELLSChartered Accountants
(Registration No. 117366W)
N. VENKATRAMPartner
(Membership No.71387)
Mumbai, May 27, 2010.
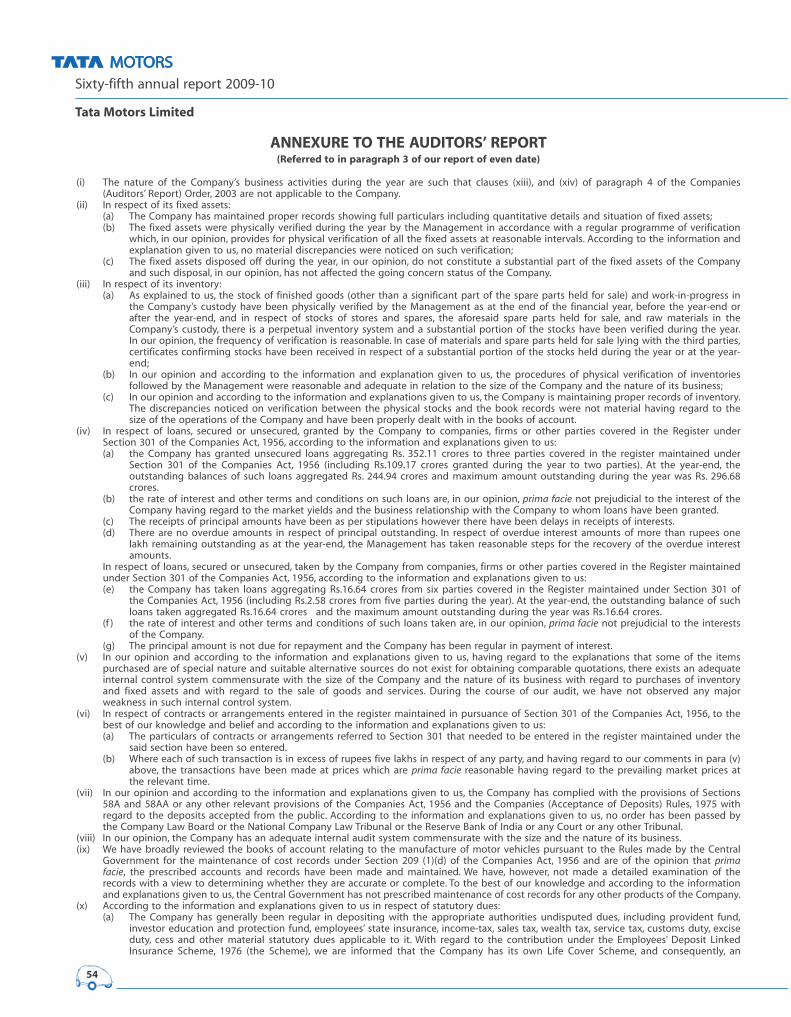
Sixty-fifth annual report 2009-10
Tata Motors Limited
54
ANNEXURE TO THE AUDITORS’ REPORT(Referred to in paragraph 3 of our report of even date)
(i) The nature of the Company’s business activities during the year are such that clauses (xiii), and (xiv) of paragraph 4 of the Companies
(Auditors’ Report) Order, 2003 are not applicable to the Company.
(ii) In respect of its fixed assets:
(a) The Company has maintained proper records showing full particulars including quantitative details and situation of fixed assets;
(b) The fixed assets were physically verified during the year by the Management in accordance with a regular programme of verification
which, in our opinion, provides for physical verification of all the fixed assets at reasonable intervals. According to the information and
explanation given to us, no material discrepancies were noticed on such verification;
(c) The fixed assets disposed off during the year, in our opinion, do not constitute a substantial part of the fixed assets of the Company
and such disposal, in our opinion, has not affected the going concern status of the Company.
(iii) In respect of its inventory:
(a) As explained to us, the stock of finished goods (other than a significant part of the spare parts held for sale) and work-in-progress in
the Company’s custody have been physically verified by the Management as at the end of the financial year, before the year-end or
after the year-end, and in respect of stocks of stores and spares, the aforesaid spare parts held for sale, and raw materials in the
Company’s custody, there is a perpetual inventory system and a substantial portion of the stocks have been verified during the year.
In our opinion, the frequency of verification is reasonable. In case of materials and spare parts held for sale lying with the third parties,
certificates confirming stocks have been received in respect of a substantial portion of the stocks held during the year or at the year-
end;
(b) In our opinion and according to the information and explanation given to us, the procedures of physical verification of inventories
followed by the Management were reasonable and adequate in relation to the size of the Company and the nature of its business;
(c) In our opinion and according to the information and explanations given to us, the Company is maintaining proper records of inventory.
The discrepancies noticed on verification between the physical stocks and the book records were not material having regard to the
size of the operations of the Company and have been properly dealt with in the books of account.
(iv) In respect of loans, secured or unsecured, granted by the Company to companies, firms or other parties covered in the Register under
Section 301 of the Companies Act, 1956, according to the information and explanations given to us:
(a) the Company has granted unsecured loans aggregating Rs. 352.11 crores to three parties covered in the register maintained under
Section 301 of the Companies Act, 1956 (including Rs.109.17 crores granted during the year to two parties). At the year-end, the
outstanding balances of such loans aggregated Rs. 244.94 crores and maximum amount outstanding during the year was Rs. 296.68
crores.
(b) the rate of interest and other terms and conditions on such loans are, in our opinion, prima facie not prejudicial to the interest of the
Company having regard to the market yields and the business relationship with the Company to whom loans have been granted.
(c) The receipts of principal amounts have been as per stipulations however there have been delays in receipts of interests.
(d) There are no overdue amounts in respect of principal outstanding. In respect of overdue interest amounts of more than rupees one
lakh remaining outstanding as at the year-end, the Management has taken reasonable steps for the recovery of the overdue interest
amounts.
In respect of loans, secured or unsecured, taken by the Company from companies, firms or other parties covered in the Register maintained
under Section 301 of the Companies Act, 1956, according to the information and explanations given to us:
(e) the Company has taken loans aggregating Rs.16.64 crores from six parties covered in the Register maintained under Section 301 of
the Companies Act, 1956 (including Rs.2.58 crores from five parties during the year). At the year-end, the outstanding balance of such
loans taken aggregated Rs.16.64 crores and the maximum amount outstanding during the year was Rs.16.64 crores.
(f ) the rate of interest and other terms and conditions of such loans taken are, in our opinion, prima facie not prejudicial to the interests
of the Company.
(g) The principal amount is not due for repayment and the Company has been regular in payment of interest.
(v) In our opinion and according to the information and explanations given to us, having regard to the explanations that some of the items
purchased are of special nature and suitable alternative sources do not exist for obtaining comparable quotations, there exists an adequate
internal control system commensurate with the size of the Company and the nature of its business with regard to purchases of inventory
and fixed assets and with regard to the sale of goods and services. During the course of our audit, we have not observed any major
weakness in such internal control system.
(vi) In respect of contracts or arrangements entered in the register maintained in pursuance of Section 301 of the Companies Act, 1956, to the
best of our knowledge and belief and according to the information and explanations given to us:
(a) The particulars of contracts or arrangements referred to Section 301 that needed to be entered in the register maintained under the
said section have been so entered.
(b) Where each of such transaction is in excess of rupees five lakhs in respect of any party, and having regard to our comments in para (v)
above, the transactions have been made at prices which are prima facie reasonable having regard to the prevailing market prices at
the relevant time.
(vii) In our opinion and according to the information and explanations given to us, the Company has complied with the provisions of Sections
58A and 58AA or any other relevant provisions of the Companies Act, 1956 and the Companies (Acceptance of Deposits) Rules, 1975 with
regard to the deposits accepted from the public. According to the information and explanations given to us, no order has been passed by
the Company Law Board or the National Company Law Tribunal or the Reserve Bank of India or any Court or any other Tribunal.
(viii) In our opinion, the Company has an adequate internal audit system commensurate with the size and the nature of its business.
(ix) We have broadly reviewed the books of account relating to the manufacture of motor vehicles pursuant to the Rules made by the Central
Government for the maintenance of cost records under Section 209 (1)(d) of the Companies Act, 1956 and are of the opinion that primafacie, the prescribed accounts and records have been made and maintained. We have, however, not made a detailed examination of the
records with a view to determining whether they are accurate or complete. To the best of our knowledge and according to the information
and explanations given to us, the Central Government has not prescribed maintenance of cost records for any other products of the Company.
(x) According to the information and explanations given to us in respect of statutory dues:
(a) The Company has generally been regular in depositing with the appropriate authorities undisputed dues, including provident fund,
investor education and protection fund, employees’ state insurance, income-tax, sales tax, wealth tax, service tax, customs duty, excise
duty, cess and other material statutory dues applicable to it. With regard to the contribution under the Employees’ Deposit Linked
Insurance Scheme, 1976 (the Scheme), we are informed that the Company has its own Life Cover Scheme, and consequently, an
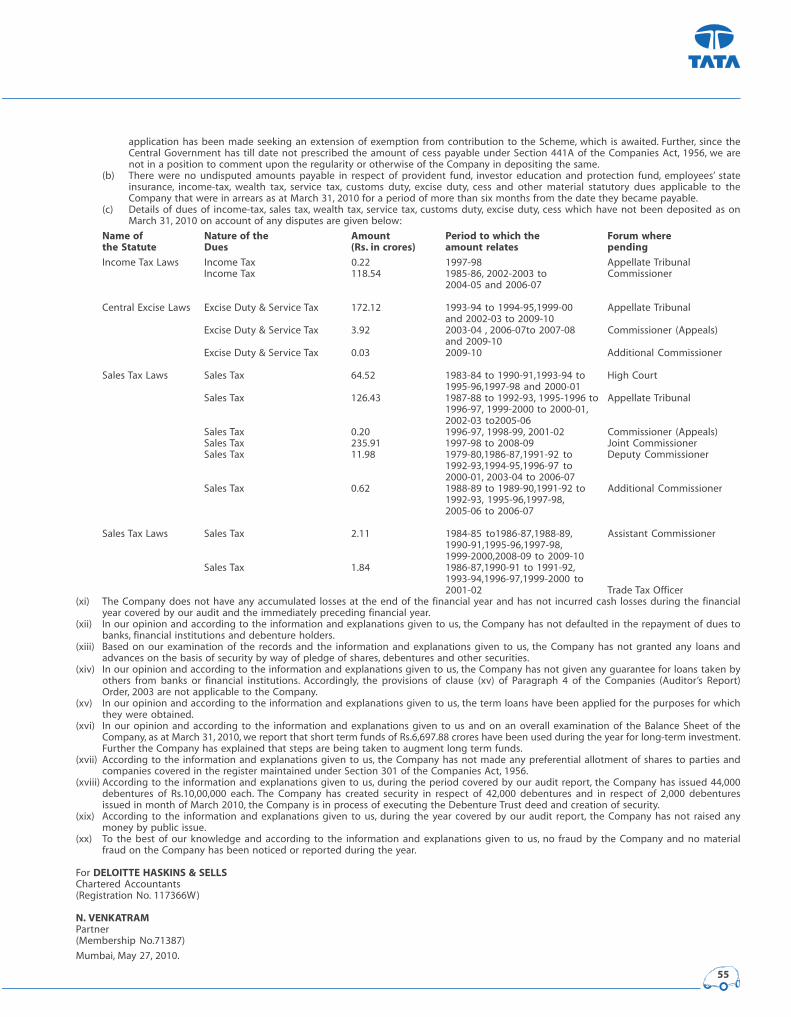
55
application has been made seeking an extension of exemption from contribution to the Scheme, which is awaited. Further, since the
Central Government has till date not prescribed the amount of cess payable under Section 441A of the Companies Act, 1956, we are
not in a position to comment upon the regularity or otherwise of the Company in depositing the same.
(b) There were no undisputed amounts payable in respect of provident fund, investor education and protection fund, employees’ state
insurance, income-tax, wealth tax, service tax, customs duty, excise duty, cess and other material statutory dues applicable to the
Company that were in arrears as at March 31, 2010 for a period of more than six months from the date they became payable.
(c) Details of dues of income-tax, sales tax, wealth tax, service tax, customs duty, excise duty, cess which have not been deposited as on
March 31, 2010 on account of any disputes are given below:
Name of Nature of the Amount Period to which the Forum wherethe Statute Dues (Rs. in crores) amount relates pending
Income Tax Laws Income Tax 0.22 1997-98 Appellate Tribunal
Income Tax 118.54 1985-86, 2002-2003 to Commissioner
2004-05 and 2006-07
Central Excise Laws Excise Duty & Service Tax 172.12 1993-94 to 1994-95,1999-00 Appellate Tribunal
and 2002-03 to 2009-10
Excise Duty & Service Tax 3.92 2003-04 , 2006-07to 2007-08 Commissioner (Appeals)
and 2009-10
Excise Duty & Service Tax 0.03 2009-10 Additional Commissioner
Sales Tax Laws Sales Tax 64.52 1983-84 to 1990-91,1993-94 to High Court
1995-96,1997-98 and 2000-01
Sales Tax 126.43 1987-88 to 1992-93, 1995-1996 to Appellate Tribunal
1996-97, 1999-2000 to 2000-01,
2002-03 to2005-06
Sales Tax 0.20 1996-97, 1998-99, 2001-02 Commissioner (Appeals)
Sales Tax 235.91 1997-98 to 2008-09 Joint Commissioner
Sales Tax 11.98 1979-80,1986-87,1991-92 to Deputy Commissioner
1992-93,1994-95,1996-97 to
2000-01, 2003-04 to 2006-07
Sales Tax 0.62 1988-89 to 1989-90,1991-92 to Additional Commissioner
1992-93, 1995-96,1997-98,
2005-06 to 2006-07
Sales Tax Laws Sales Tax 2.11 1984-85 to1986-87,1988-89, Assistant Commissioner
1990-91,1995-96,1997-98,
1999-2000,2008-09 to 2009-10
Sales Tax 1.84 1986-87,1990-91 to 1991-92,
1993-94,1996-97,1999-2000 to
2001-02 Trade Tax Officer
(xi) The Company does not have any accumulated losses at the end of the financial year and has not incurred cash losses during the financial
year covered by our audit and the immediately preceding financial year.
(xii) In our opinion and according to the information and explanations given to us, the Company has not defaulted in the repayment of dues to
banks, financial institutions and debenture holders.
(xiii) Based on our examination of the records and the information and explanations given to us, the Company has not granted any loans and
advances on the basis of security by way of pledge of shares, debentures and other securities.
(xiv) In our opinion and according to the information and explanations given to us, the Company has not given any guarantee for loans taken by
others from banks or financial institutions. Accordingly, the provisions of clause (xv) of Paragraph 4 of the Companies (Auditor’s Report)
Order, 2003 are not applicable to the Company.
(xv) In our opinion and according to the information and explanations given to us, the term loans have been applied for the purposes for which
they were obtained.
(xvi) In our opinion and according to the information and explanations given to us and on an overall examination of the Balance Sheet of the
Company, as at March 31, 2010, we report that short term funds of Rs.6,697.88 crores have been used during the year for long-term investment.
Further the Company has explained that steps are being taken to augment long term funds.
(xvii) According to the information and explanations given to us, the Company has not made any preferential allotment of shares to parties and
companies covered in the register maintained under Section 301 of the Companies Act, 1956.
(xviii) According to the information and explanations given to us, during the period covered by our audit report, the Company has issued 44,000
debentures of Rs.10,00,000 each. The Company has created security in respect of 42,000 debentures and in respect of 2,000 debentures
issued in month of March 2010, the Company is in process of executing the Debenture Trust deed and creation of security.
(xix) According to the information and explanations given to us, during the year covered by our audit report, the Company has not raised any
money by public issue.
(xx) To the best of our knowledge and according to the information and explanations given to us, no fraud by the Company and no material
fraud on the Company has been noticed or reported during the year.
For DELOITTE HASKINS & SELLSChartered Accountants
(Registration No. 117366W)
N. VENKATRAMPartner
(Membership No.71387)
Mumbai, May 27, 2010.
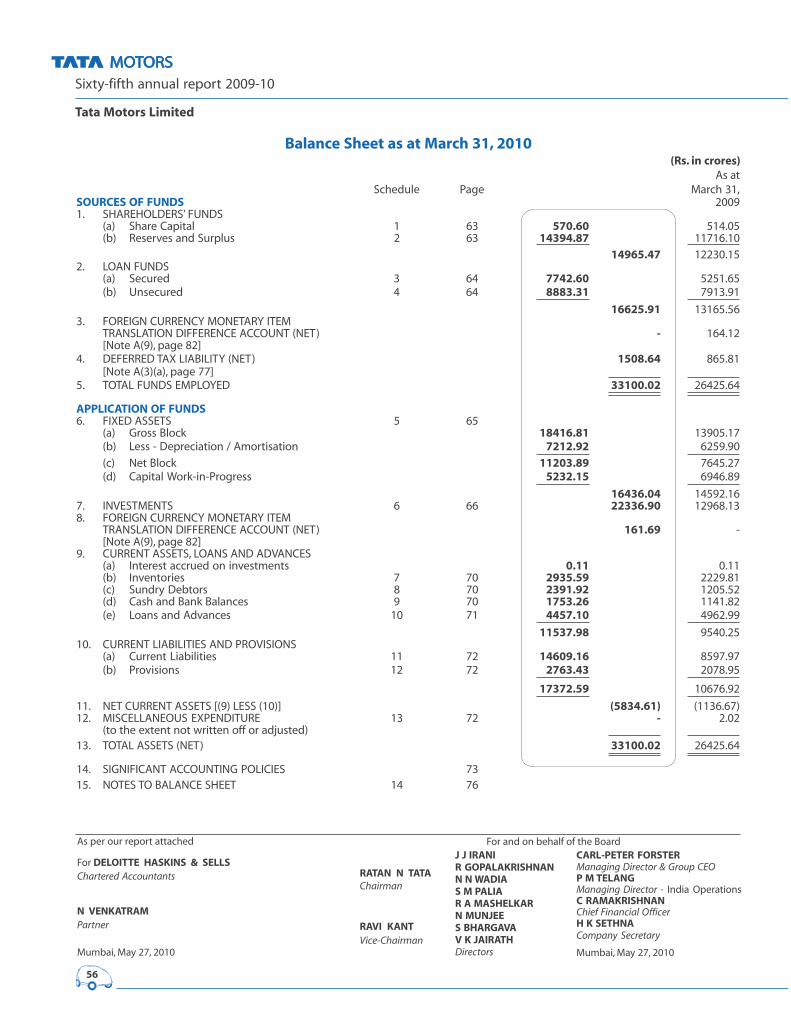
Sixty-fifth annual report 2009-10
Tata Motors Limited
56
Balance Sheet as at March 31, 2010(Rs. in crores)
As at
Schedule Page March 31,
SOURCES OF FUNDS 2009
1. SHAREHOLDERS’ FUNDS
(a) Share Capital 1 63 570.60 514.05
(b) Reserves and Surplus 2 63 14394.87 11716.10
14965.47 12230.15
2. LOAN FUNDS
(a) Secured 3 64 7742.60 5251.65
(b) Unsecured 4 64 8883.31 7913.91
16625.91 13165.56
3. FOREIGN CURRENCY MONETARY ITEM
TRANSLATION DIFFERENCE ACCOUNT (NET) - 164.12
[Note A(9), page 82]
4. DEFERRED TAX LIABILITY (NET) 1508.64 865.81
[Note A(3)(a), page 77]
5. TOTAL FUNDS EMPLOYED 33100.02 26425.64
APPLICATION OF FUNDS6. FIXED ASSETS 5 65
(a) Gross Block 18416.81 13905.17
(b) Less - Depreciation / Amortisation 7212.92 6259.90
(c) Net Block 11203.89 7645.27
(d) Capital Work-in-Progress 5232.15 6946.89
16436.04 14592.16
7. INVESTMENTS 6 66 22336.90 12968.13
8. FOREIGN CURRENCY MONETARY ITEM
TRANSLATION DIFFERENCE ACCOUNT (NET) 161.69 -
[Note A(9), page 82]
9. CURRENT ASSETS, LOANS AND ADVANCES
(a) Interest accrued on investments 0.11 0.11
(b) Inventories 7 70 2935.59 2229.81
(c) Sundry Debtors 8 70 2391.92 1205.52
(d) Cash and Bank Balances 9 70 1753.26 1141.82
(e) Loans and Advances 10 71 4457.10 4962.99
11537.98 9540.25
10. CURRENT LIABILITIES AND PROVISIONS
(a) Current Liabilities 11 72 14609.16 8597.97
(b) Provisions 12 72 2763.43 2078.95
17372.59 10676.92
11. NET CURRENT ASSETS [(9) LESS (10)] (5834.61) (1136.67)
12. MISCELLANEOUS EXPENDITURE 13 72 - 2.02
(to the extent not written off or adjusted)
13. TOTAL ASSETS (NET) 33100.02 26425.64
14. SIGNIFICANT ACCOUNTING POLICIES 73
15. NOTES TO BALANCE SHEET 14 76
As per our report attached
For DELOITTE HASKINS & SELLSChartered Accountants
N VENKATRAMPartner
Mumbai, May 27, 2010
RATAN N TATAChairman
RAVI KANTVice-Chairman
For and on behalf of the Board
CARL-PETER FORSTERManaging Director & Group CEOP M TELANGManaging Director - India Operations
C RAMAKRISHNANChief Financial OfficerH K SETHNACompany Secretary
Mumbai, May 27, 2010
J J IRANIR GOPALAKRISHNANN N WADIAS M PALIAR A MASHELKARN MUNJEES BHARGAVAV K JAIRATHDirectors

57
Profit and Loss Account for the year ended March 31, 2010(Rs. in crores)
Schedule Page 2008-2009
INCOME1. SALE OF PRODUCTS AND OTHER INCOME
FROM OPERATIONS A (1) 59 38364.10 28568.21
LESS : EXCISE DUTY 2771.05 2938.48
35593.05 25629.73
2. DIVIDEND AND OTHER INCOME A (2) 59 1853.45 925.97
37446.50 26555.70
EXPENDITURE3. MANUFACTURING AND OTHER EXPENSES B 60 32155.31 24762.37
4. EXPENDITURE TRANSFERRED TO CAPITAL
AND OTHER ACCOUNTS (740.54) (885.08)
31414.77 23877.29
PROFIT BEFORE DEPRECIATION, INTEREST,EXCEPTIONAL ITEMS AND TAX 6031.73 2678.41
5. PRODUCT DEVELOPMENT EXPENDITURE 144.03 51.17
6. DEPRECIATION / AMORTISATION 5 65 1033.87 874.54
7. INTEREST AND DISCOUNTING CHARGES 1103.84 673.68
[Note B(4), page 83]
PROFIT BEFORE EXCEPTIONAL ITEMS AND TAX 3749.99 1079.02
8. EXCHANGE LOSS (NET) ON
REVALUATION OF FOREIGN CURRENCY
BORROWINGS, DEPOSITS AND LOANS GIVEN (69.59) (65.26)
9. LOSS ON REDEMPTION OF INVESTMENT IN PREFERENCE
SHARES HELD IN A SUBSIDIARY COMPANY [Note 12, page 68] (850.86) -
PROFIT BEFORE TAX 2829.54 1013.76
10. TAX EXPENSE [Note A(3)(c), page 77] (589.46) (12.50)
PROFIT AFTER TAX 2240.08 1001.26
11. BALANCE BROUGHT FORWARD FROM PREVIOUS YEAR 1685.99 1383.07
Add : Credit taken for Dividend Distribution Tax for previous year - 15.29
AMOUNT AVAILABLE FOR APPROPRIATION 3926.07 2399.62
12. APPROPRIATIONS
(a) Proposed Dividend 859.05 311.61
(b) Tax on Proposed Dividend 132.89 34.09
(c) Debenture Redemption Reserve 500.00 267.80
(d) General Reserve 500.00 100.13
(e) Balance carried to Balance Sheet 1934.13 1685.99
3926.07 2399.62
13. EARNINGS PER SHARE [Note B (7), page 85]
I. Ordinary Shares
a) Basic Rupees 42.37 22.70
b) Diluted Rupees 38.99 20.83
II. ‘A’ Ordinary Shares
a) Basic Rupees 42.87 23.20
b) Diluted Rupees 39.49 21.33
14. SIGNIFICANT ACCOUNTING POLICIES 73
15. NOTES TO PROFIT AND LOSS ACCOUNT 14 to 18 83
As per our report attached to the Balance Sheet
For DELOITTE HASKINS & SELLSChartered Accountants
N VENKATRAMPartner
Mumbai, May 27, 2010
RATAN N TATAChairman
RAVI KANTVice-Chairman
For and on behalf of the Board
CARL-PETER FORSTERManaging Director & Group CEOP M TELANGManaging Director - India Operations
C RAMAKRISHNANChief Financial OfficerH K SETHNACompany Secretary
Mumbai, May 27, 2010
J J IRANIR GOPALAKRISHNANN N WADIAS M PALIAR A MASHELKARN MUNJEES BHARGAVAV K JAIRATHDirectors
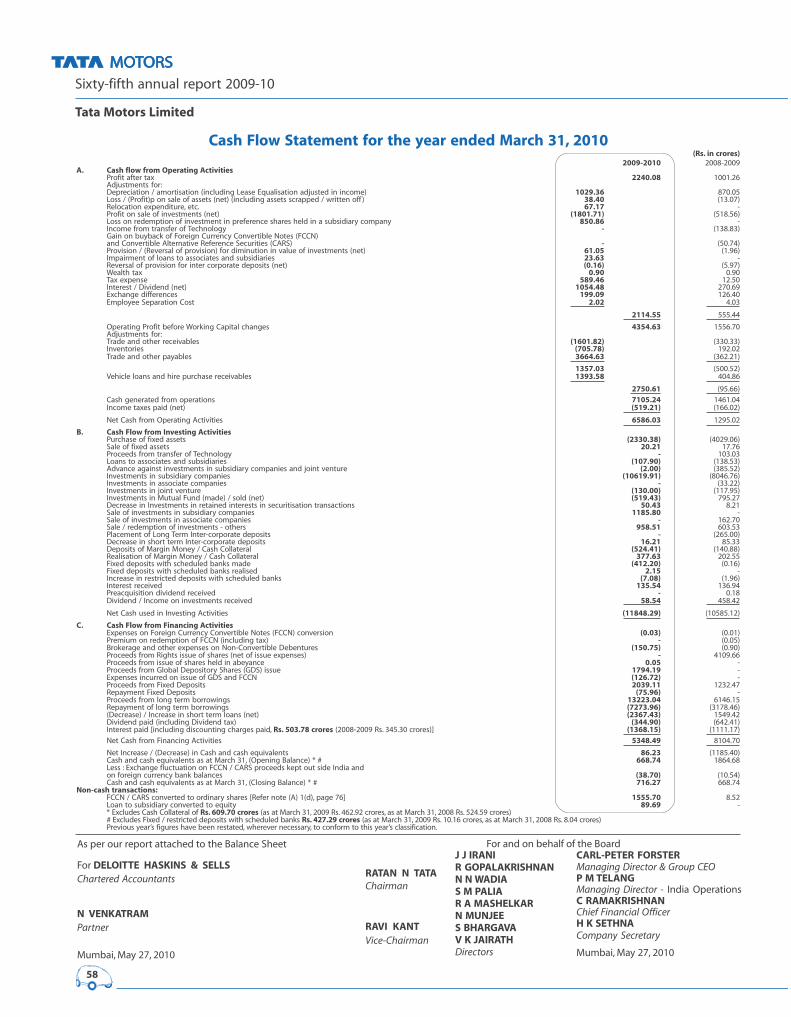
Sixty-fifth annual report 2009-10
Tata Motors Limited
58
Cash Flow Statement for the year ended March 31, 2010(Rs. in crores)
2009-2010 2008-2009
A. Cash flow from Operating ActivitiesProfit after tax 2240.08 1001.26
Adjustments for:
Depreciation / amortisation (including Lease Equalisation adjusted in income) 1029.36 870.05
Loss / (Profit)p on sale of assets (net) (including assets scrapped / written off ) 38.40 (13.07)
Relocation expenditure, etc. 67.17 -
Profit on sale of investments (net) (1801.71) (518.56)
Loss on redemption of investment in preference shares held in a subsidiary company 850.86 -
Income from transfer of Technology - (138.83)
Gain on buyback of Foreign Currency Convertible Notes (FCCN)
and Convertible Alternative Reference Securities (CARS) - (50.74)
Provision / (Reversal of provision) for diminution in value of investments (net) 61.05 (1.96)
Impairment of loans to associates and subsidiaries 23.63 -
Reversal of provision for inter corporate deposits (net) (0.16) (5.97)
Wealth tax 0.90 0.90
Tax expense 589.46 12.50
Interest / Dividend (net) 1054.48 270.69
Exchange differences 199.09 126.40
Employee Separation Cost 2.02 4.03
2114.55 555.44
Operating Profit before Working Capital changes 4354.63 1556.70
Adjustments for:
Trade and other receivables (1601.82) (330.33)
Inventories (705.78) 192.02
Trade and other payables 3664.63 (362.21)
1357.03 (500.52)
Vehicle loans and hire purchase receivables 1393.58 404.86
2750.61 (95.66)
Cash generated from operations 7105.24 1461.04
Income taxes paid (net) (519.21) (166.02)
Net Cash from Operating Activities 6586.03 1295.02
B. Cash Flow from Investing ActivitiesPurchase of fixed assets (2330.38) (4029.06)
Sale of fixed assets 20.21 17.76
Proceeds from transfer of Technology - 103.03
Loans to associates and subsidiaries (107.90) (138.53)
Advance against investments in subsidiary companies and joint venture (2.00) (385.52)
Investments in subsidiary companies (10619.91) (8046.76)
Investments in associate companies - (33.22)
Investments in joint venture (130.00) (117.95)
Investments in Mutual Fund (made) / sold (net) (519.43) 795.27
Decrease in Investments in retained interests in securitisation transactions 50.43 8.21
Sale of investments in subsidiary companies 1185.80 -
Sale of investments in associate companies - 162.70
Sale / redemption of investments - others 958.51 603.53
Placement of Long Term Inter-corporate deposits - (265.00)
Decrease in short term Inter-corporate deposits 16.21 85.33
Deposits of Margin Money / Cash Collateral (524.41) (140.88)
Realisation of Margin Money / Cash Collateral 377.63 202.55
Fixed deposits with scheduled banks made (412.20) (0.16)
Fixed deposits with scheduled banks realised 2.15 -
Increase in restricted deposits with scheduled banks (7.08) (1.96)
Interest received 135.54 136.94
Preacquisition dividend received - 0.18
Dividend / Income on investments received 58.54 458.42
Net Cash used in Investing Activities (11848.29) (10585.12)
C. Cash Flow from Financing ActivitiesExpenses on Foreign Currency Convertible Notes (FCCN) conversion (0.03) (0.01)
Premium on redemption of FCCN (including tax) - (0.05)
Brokerage and other expenses on Non-Convertible Debentures (150.75) (0.90)
Proceeds from Rights issue of shares (net of issue expenses) - 4109.66
Proceeds from issue of shares held in abeyance 0.05 -
Proceeds from Global Depository Shares (GDS) issue 1794.19 -
Expenses incurred on issue of GDS and FCCN (126.72) -
Proceeds from Fixed Deposits 2039.11 1232.47
Repayment Fixed Deposits (75.96) -
Proceeds from long term borrowings 13223.04 6146.15
Repayment of long term borrowings (7273.96) (3178.46)
(Decrease) / Increase in short term loans (net) (2367.43) 1549.42
Dividend paid (including Dividend tax) (344.90) (642.41)
Interest paid [including discounting charges paid, Rs. 503.78 crores (2008-2009 Rs. 345.30 crores)] (1368.15) (1111.17)
Net Cash from Financing Activities 5348.49 8104.70
Net Increase / (Decrease) in Cash and cash equivalents 86.23 (1185.40)
Cash and cash equivalents as at March 31, (Opening Balance) * # 668.74 1864.68
Less : Exchange fluctuation on FCCN / CARS proceeds kept out side India and
on foreign currency bank balances (38.70) (10.54)
Cash and cash equivalents as at March 31, (Closing Balance) * # 716.27 668.74
Non-cash transactions:FCCN / CARS converted to ordinary shares [Refer note (A) 1(d), page 76] 1555.70 8.52
Loan to subsidiary converted to equity 89.69 -
* Excludes Cash Collateral of Rs. 609.70 crores (as at March 31, 2009 Rs. 462.92 crores, as at March 31, 2008 Rs. 524.59 crores)
# Excludes Fixed / restricted deposits with scheduled banks Rs. 427.29 crores (as at March 31, 2009 Rs. 10.16 crores, as at March 31, 2008 Rs. 8.04 crores)
Previous year’s figures have been restated, wherever necessary, to conform to this year’s classification.
As per our report attached to the Balance Sheet
For DELOITTE HASKINS & SELLSChartered Accountants
N VENKATRAMPartner
Mumbai, May 27, 2010
RATAN N TATAChairman
RAVI KANTVice-Chairman
For and on behalf of the Board
CARL-PETER FORSTERManaging Director & Group CEOP M TELANGManaging Director - India Operations
C RAMAKRISHNANChief Financial OfficerH K SETHNACompany Secretary
Mumbai, May 27, 2010
J J IRANIR GOPALAKRISHNANN N WADIAS M PALIAR A MASHELKARN MUNJEES BHARGAVAV K JAIRATHDirectors
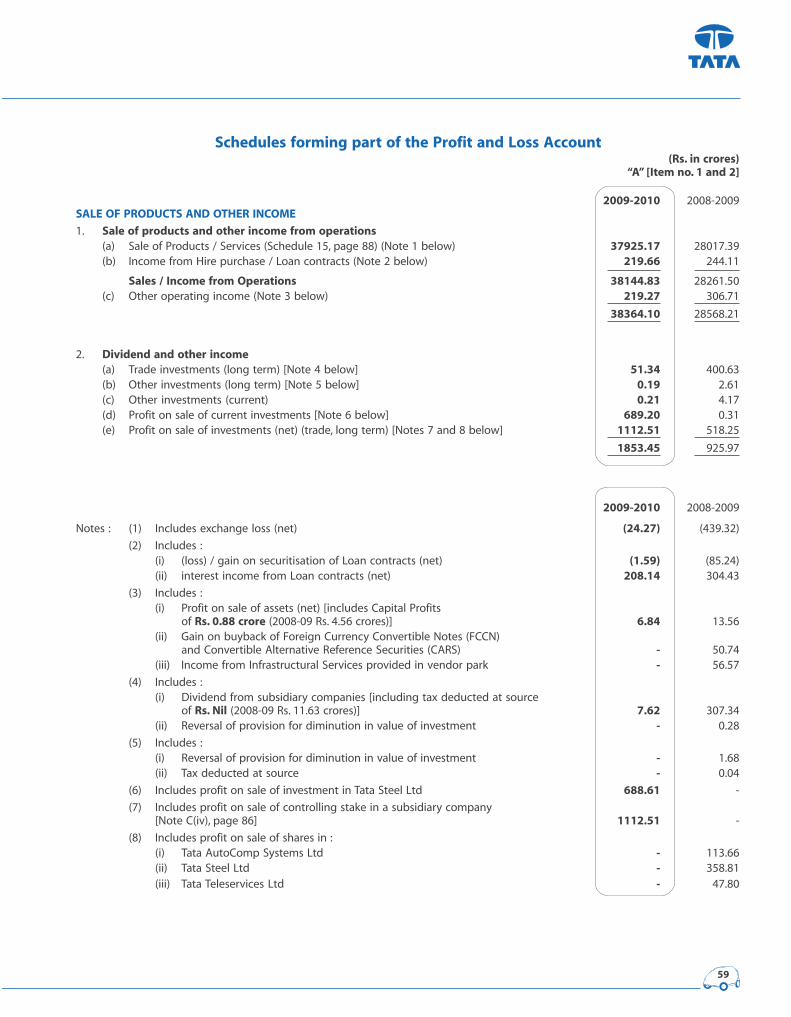
59
Schedules forming part of the Profit and Loss Account(Rs. in crores)
“A” [Item no. 1 and 2]
2009-2010 2008-2009
SALE OF PRODUCTS AND OTHER INCOME
1. Sale of products and other income from operations(a) Sale of Products / Services (Schedule 15, page 88) (Note 1 below) 37925.17 28017.39
(b) Income from Hire purchase / Loan contracts (Note 2 below) 219.66 244.11
Sales / Income from Operations 38144.83 28261.50
(c) Other operating income (Note 3 below) 219.27 306.71
38364.10 28568.21
2. Dividend and other income(a) Trade investments (long term) [Note 4 below] 51.34 400.63
(b) Other investments (long term) [Note 5 below] 0.19 2.61
(c) Other investments (current) 0.21 4.17
(d) Profit on sale of current investments [Note 6 below] 689.20 0.31
(e) Profit on sale of investments (net) (trade, long term) [Notes 7 and 8 below] 1112.51 518.25
1853.45 925.97
2009-2010 2008-2009
Notes : (1) Includes exchange loss (net) (24.27) (439.32)
(2) Includes :
(i) (loss) / gain on securitisation of Loan contracts (net) (1.59) (85.24)
(ii) interest income from Loan contracts (net) 208.14 304.43
(3) Includes :
(i) Profit on sale of assets (net) [includes Capital Profits
of Rs. 0.88 crore (2008-09 Rs. 4.56 crores)] 6.84 13.56
(ii) Gain on buyback of Foreign Currency Convertible Notes (FCCN)
and Convertible Alternative Reference Securities (CARS) - 50.74
(iii) Income from Infrastructural Services provided in vendor park - 56.57
(4) Includes :
(i) Dividend from subsidiary companies [including tax deducted at source
of Rs. Nil (2008-09 Rs. 11.63 crores)] 7.62 307.34
(ii) Reversal of provision for diminution in value of investment - 0.28
(5) Includes :
(i) Reversal of provision for diminution in value of investment - 1.68
(ii) Tax deducted at source - 0.04
(6) Includes profit on sale of investment in Tata Steel Ltd 688.61 -
(7) Includes profit on sale of controlling stake in a subsidiary company
[Note C(iv), page 86] 1112.51 -
(8) Includes profit on sale of shares in :
(i) Tata AutoComp Systems Ltd - 113.66
(ii) Tata Steel Ltd - 358.81
(iii) Tata Teleservices Ltd - 47.80
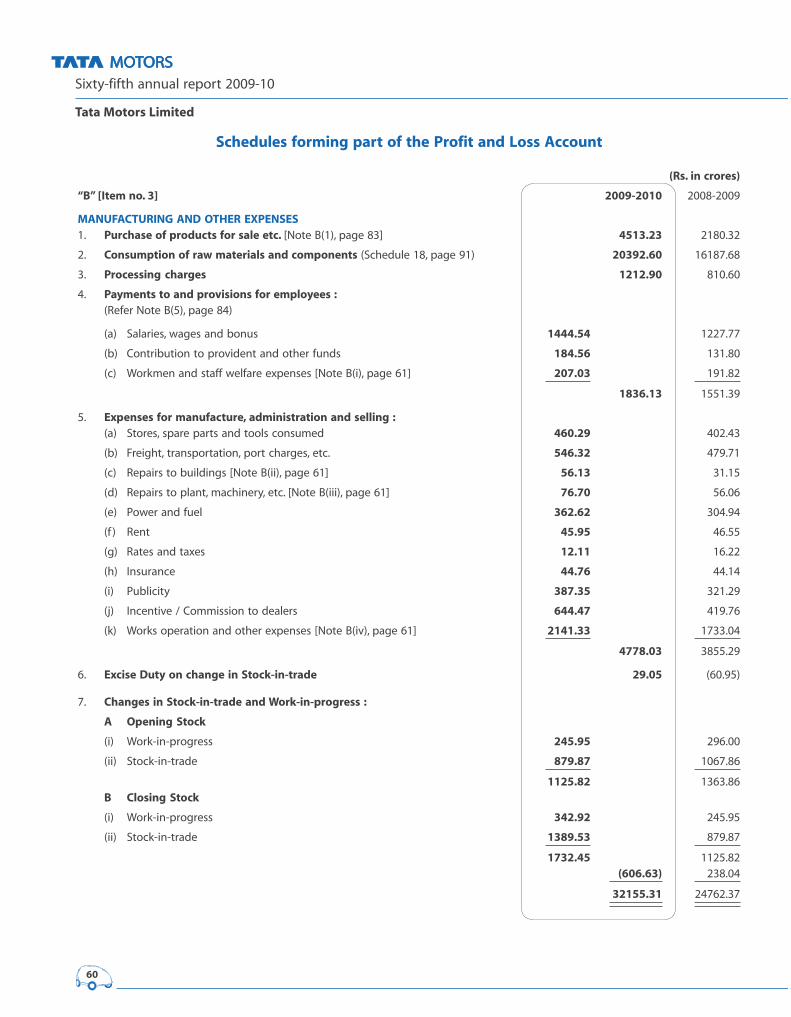
Sixty-fifth annual report 2009-10
Tata Motors Limited
60
Schedules forming part of the Profit and Loss Account
(Rs. in crores)
“B” [Item no. 3] 2009-2010 2008-2009
MANUFACTURING AND OTHER EXPENSES1. Purchase of products for sale etc. [Note B(1), page 83] 4513.23 2180.32
2. Consumption of raw materials and components (Schedule 18, page 91) 20392.60 16187.68
3. Processing charges 1212.90 810.60
4. Payments to and provisions for employees :(Refer Note B(5), page 84)
(a) Salaries, wages and bonus 1444.54 1227.77
(b) Contribution to provident and other funds 184.56 131.80
(c) Workmen and staff welfare expenses [Note B(i), page 61] 207.03 191.82
1836.13 1551.39
5. Expenses for manufacture, administration and selling :(a) Stores, spare parts and tools consumed 460.29 402.43
(b) Freight, transportation, port charges, etc. 546.32 479.71
(c) Repairs to buildings [Note B(ii), page 61] 56.13 31.15
(d) Repairs to plant, machinery, etc. [Note B(iii), page 61] 76.70 56.06
(e) Power and fuel 362.62 304.94
(f ) Rent 45.95 46.55
(g) Rates and taxes 12.11 16.22
(h) Insurance 44.76 44.14
(i) Publicity 387.35 321.29
(j) Incentive / Commission to dealers 644.47 419.76
(k) Works operation and other expenses [Note B(iv), page 61] 2141.33 1733.04
4778.03 3855.29
6. Excise Duty on change in Stock-in-trade 29.05 (60.95)
7. Changes in Stock-in-trade and Work-in-progress :
A Opening Stock
(i) Work-in-progress 245.95 296.00
(ii) Stock-in-trade 879.87 1067.86
1125.82 1363.86
B Closing Stock
(i) Work-in-progress 342.92 245.95
(ii) Stock-in-trade 1389.53 879.87
1732.45 1125.82
(606.63) 238.04
32155.31 24762.37
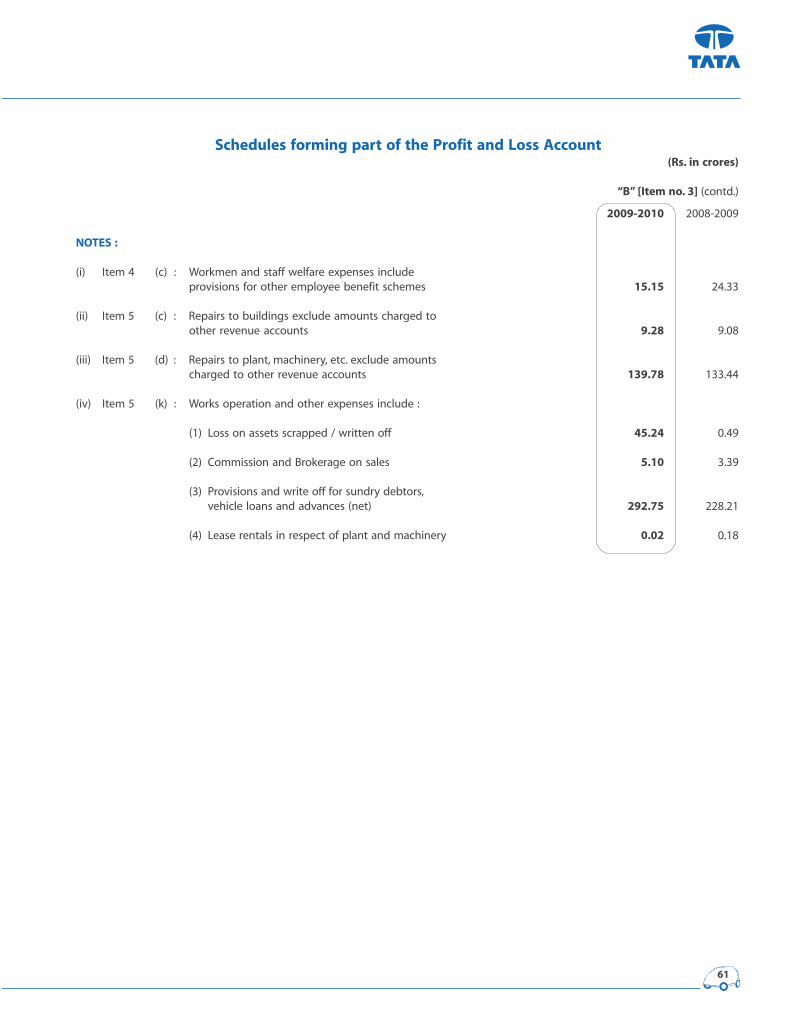
61
Schedules forming part of the Profit and Loss Account(Rs. in crores)
“B” [Item no. 3] (contd.)
2009-2010 2008-2009
NOTES :
(i) Item 4 (c) : Workmen and staff welfare expenses include
provisions for other employee benefit schemes 15.15 24.33
(ii) Item 5 (c) : Repairs to buildings exclude amounts charged to
other revenue accounts 9.28 9.08
(iii) Item 5 (d) : Repairs to plant, machinery, etc. exclude amounts
charged to other revenue accounts 139.78 133.44
(iv) Item 5 (k) : Works operation and other expenses include :
(1) Loss on assets scrapped / written off 45.24 0.49
(2) Commission and Brokerage on sales 5.10 3.39
(3) Provisions and write off for sundry debtors,
vehicle loans and advances (net) 292.75 228.21
(4) Lease rentals in respect of plant and machinery 0.02 0.18
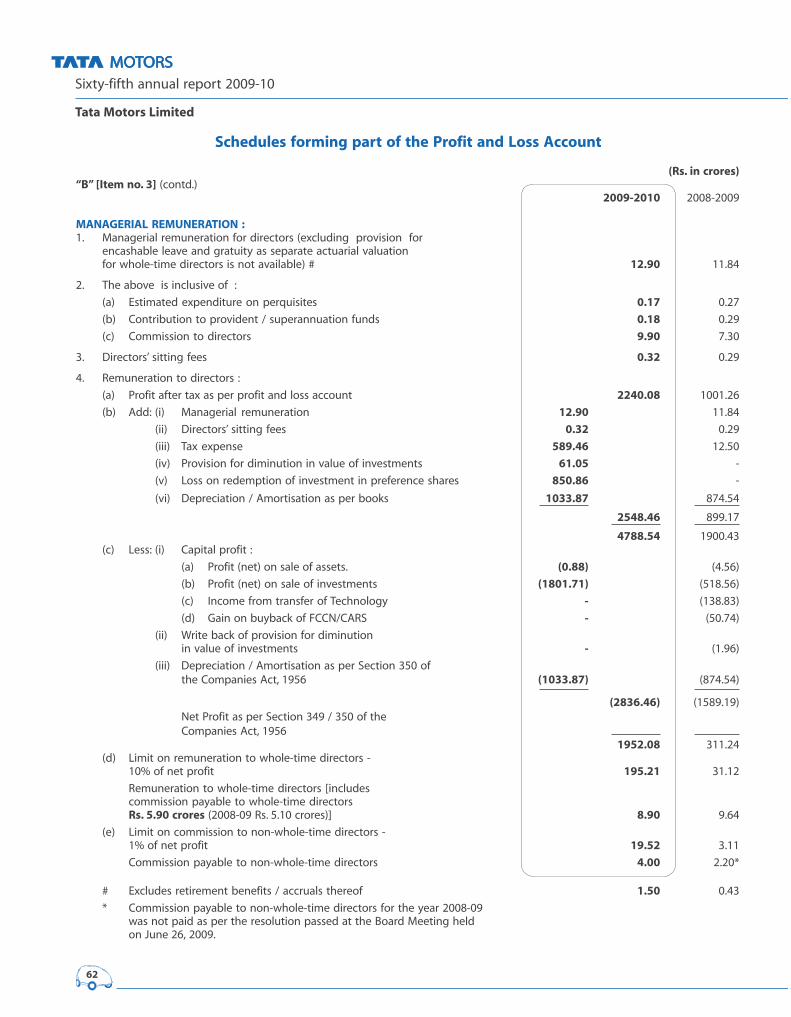
Sixty-fifth annual report 2009-10
Tata Motors Limited
62
Schedules forming part of the Profit and Loss Account
(Rs. in crores)“B” [Item no. 3] (contd.)
2009-2010 2008-2009
MANAGERIAL REMUNERATION :1. Managerial remuneration for directors (excluding provision for
encashable leave and gratuity as separate actuarial valuation
for whole-time directors is not available) # 12.90 11.84
2. The above is inclusive of :
(a) Estimated expenditure on perquisites 0.17 0.27
(b) Contribution to provident / superannuation funds 0.18 0.29
(c) Commission to directors 9.90 7.30
3. Directors’ sitting fees 0.32 0.29
4. Remuneration to directors :
(a) Profit after tax as per profit and loss account 2240.08 1001.26
(b) Add: (i) Managerial remuneration 12.90 11.84
(ii) Directors’ sitting fees 0.32 0.29
(iii) Tax expense 589.46 12.50
(iv) Provision for diminution in value of investments 61.05 -
(v) Loss on redemption of investment in preference shares 850.86 -
(vi) Depreciation / Amortisation as per books 1033.87 874.54
2548.46 899.17
4788.54 1900.43
(c) Less: (i) Capital profit :
(a) Profit (net) on sale of assets. (0.88) (4.56)
(b) Profit (net) on sale of investments (1801.71) (518.56)
(c) Income from transfer of Technology - (138.83)
(d) Gain on buyback of FCCN/CARS - (50.74)
(ii) Write back of provision for diminution
in value of investments - (1.96)
(iii) Depreciation / Amortisation as per Section 350 of
the Companies Act, 1956 (1033.87) (874.54)
(2836.46) (1589.19)
Net Profit as per Section 349 / 350 of the
Companies Act, 1956
1952.08 311.24
(d) Limit on remuneration to whole-time directors -
10% of net profit 195.21 31.12
Remuneration to whole-time directors [includes
commission payable to whole-time directors
Rs. 5.90 crores (2008-09 Rs. 5.10 crores)] 8.90 9.64
(e) Limit on commission to non-whole-time directors -
1% of net profit 19.52 3.11
Commission payable to non-whole-time directors 4.00 2.20*
# Excludes retirement benefits / accruals thereof 1.50 0.43
* Commission payable to non-whole-time directors for the year 2008-09
was not paid as per the resolution passed at the Board Meeting held
on June 26, 2009.

63
Schedules forming part of the Balance Sheet(Rs. in crores)
“1” [Item No. 1(a)]
As at As at
March 31, March 31,
2010 2009
SHARE CAPITAL [Note (A) 1, page 76]Authorised:
70,00,00,000 Ordinary shares of Rs. 10 each (as at March 31, 2009: 70,00,00,000 shares) 700.00 700.00
20,00,00,000 ‘A’ Ordinary shares of Rs. 10 each (as at March 31, 2009: 20,00,00,000 shares) 200.00 200.00
30,00,00,000 Convertible Cumulative Preference shares of Rs. 100 each (as at March 31, 2009: 30,00,00,000 shares) 3000.00 3000.00
3900.00 3900.00
Issued and subscribed:50,63,81,170 Ordinary shares of Rs. 10 each (as at March 31, 2009: 44,98,32,659 shares) 506.38 449.83
6,41,76,374 ‘A’ Ordinary shares of Rs. 10 each (as at March 31, 2009: 6,41,75,655 shares) . 64.18 64.18
570.56 514.01
Less: Calls in arrears - Ordinary shares 0.01 0.01
570.55 514.00
Share Forfeiture - Ordinary shares 0.05 0.05
570.60 514.05
“2” [Item No. 1(b)]
As at Additions Deductions As atMarch 31, March 31,
2009 2010RESERVES AND SURPLUS(a) Securities Premium Account [Note (i) and (ii) below] 5366.31 3617.80 2269.52 6714.59
1537.22 4037.76 208.67 5366.31
(b) Capital Redemption Reserve 2.28 - - 2.282.28 - - 2.28
(c) Debenture Redemption Reserve 602.15 500.00 - 1102.15334.35 267.80 - 602.15
(d) Amalgamation Reserve 0.05 - - 0.050.05 - - 0.05
(e) Special Reserve 55.05 - 55.05 -55.05 - - 55.05
(f ) Revaluation Reserve [Note (iii), page 64] 25.07 - 0.44 24.6325.51 - 0.44 25.07
(g) Hedging Reserve Account (87.51) 87.51 - -- (87.51) - (87.51)
(h) General Reserve [Note (iv), page 64] 4066.71 555.05 4.72 4617.044116.43 100.13 149.85 4066.71
10030.11 4760.36 2329.73 12460.746070.89 4318.18 358.96 10030.11
(i) Profit and Loss Account 1934.131685.99
14394.8711716.10
Notes:- 2009-2010 2008-2009
Additions Deductions Additions Deductions
(i) The opening and closing balances of Securities Premium Account are net
of calls in arrears of Rs. 0.03 crore
(ii) Changes in Securities Premium Account(a) Premium on shares issued on conversion of Foreign Currency Convertible Notes
(FCCN) and on shares issued which were held in abeyance out of Rights issue of shares 1529.11 - 8.37 -
(b) FCCN conversion expenses - 25.57 - 0.01
(c) Premium on issue of Global Depository Shares (GDS) 1764.28 - - -
(d) Premium on Rights issue of shares [Note A(1)(I)(e), page 76] - - 4010.98 -
(e) GDS and FCCN issue Expenses - 126.82 - -
(f ) Rights issue expenses - - - 29.67
(g) Brokerage, stamp duty and other fees on Non-Convertible Debentures
[net of tax Rs. Nil (2008-09 Rs. 0.31 crore)] - 140.40 - 0.59
(h) Exchange difference on provision for premium on redemption of FCCN /
Convertible Alternative Reference Securities (CARS) [net of tax
Rs. 34.82 crores (2008-09 Rs. 56.24 crores)] 93.52 - - 178.40
(i) Reversal of provision for premium on conversion / redemption of
FCCN / CARS [net of tax of Rs. Nil (2008-09 Rs. 9.47 crores)] 230.54 - 18.40 -
(j) Provision for premium on redemption of Non-Convertible
Debentures / CARS / FCCN and withholding tax thereon
[net of tax Rs. 26.51 crores (2008-09 Rs. Nil)] - 1976.73 - -
(k) Others 0.35 - 0.01 -
3617.80 2269.52 4037.76 208.67
contd.
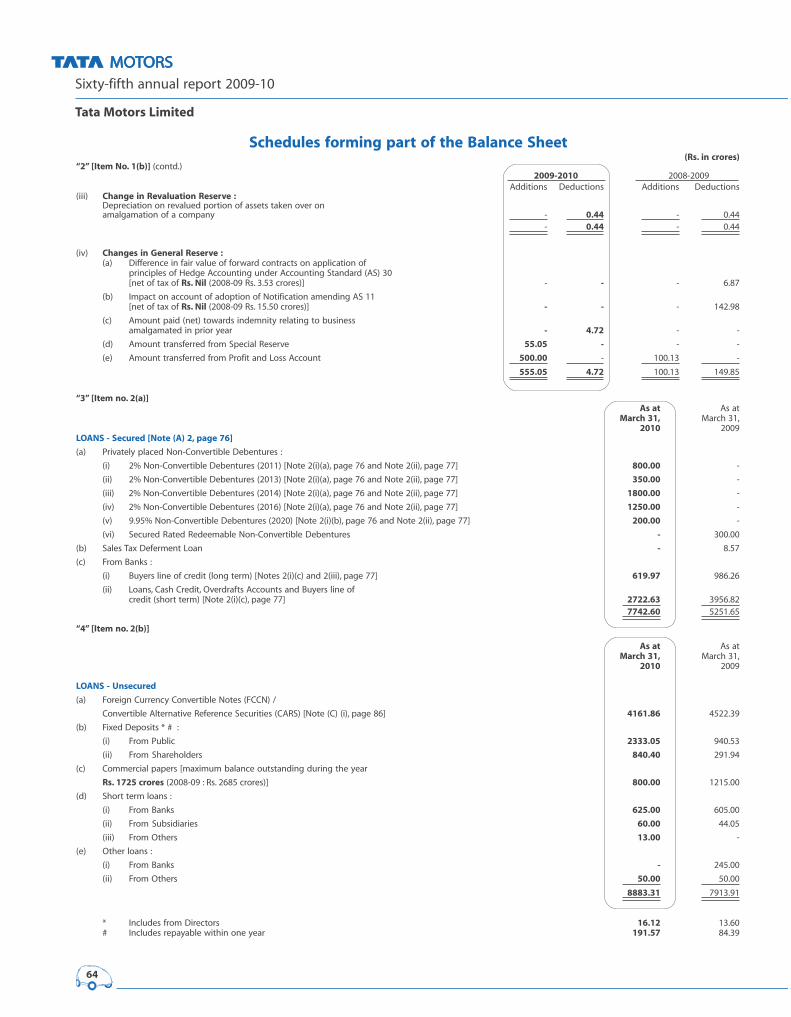
Sixty-fifth annual report 2009-10
Tata Motors Limited
64
Schedules forming part of the Balance Sheet(Rs. in crores)
“2” [Item No. 1(b)] (contd.)
2009-2010 2008-2009
Additions Deductions Additions Deductions
(iii) Change in Revaluation Reserve :Depreciation on revalued portion of assets taken over on
amalgamation of a company - 0.44 - 0.44
- 0.44 - 0.44
(iv) Changes in General Reserve :(a) Difference in fair value of forward contracts on application of
principles of Hedge Accounting under Accounting Standard (AS) 30
[net of tax of Rs. Nil (2008-09 Rs. 3.53 crores)] - - - 6.87
(b) Impact on account of adoption of Notification amending AS 11
[net of tax of Rs. Nil (2008-09 Rs. 15.50 crores)] - - - 142.98
(c) Amount paid (net) towards indemnity relating to business
amalgamated in prior year - 4.72 - -
(d) Amount transferred from Special Reserve 55.05 - - -
(e) Amount transferred from Profit and Loss Account 500.00 - 100.13 -
555.05 4.72 100.13 149.85
“3” [Item no. 2(a)]As at As at
March 31, March 31,
2010 2009
LOANS - Secured [Note (A) 2, page 76]
(a) Privately placed Non-Convertible Debentures :
(i) 2% Non-Convertible Debentures (2011) [Note 2(i)(a), page 76 and Note 2(ii), page 77] 800.00 -
(ii) 2% Non-Convertible Debentures (2013) [Note 2(i)(a), page 76 and Note 2(ii), page 77] 350.00 -
(iii) 2% Non-Convertible Debentures (2014) [Note 2(i)(a), page 76 and Note 2(ii), page 77] 1800.00 -
(iv) 2% Non-Convertible Debentures (2016) [Note 2(i)(a), page 76 and Note 2(ii), page 77] 1250.00 -
(v) 9.95% Non-Convertible Debentures (2020) [Note 2(i)(b), page 76 and Note 2(ii), page 77] 200.00 -
(vi) Secured Rated Redeemable Non-Convertible Debentures - 300.00
(b) Sales Tax Deferment Loan - 8.57
(c) From Banks :
(i) Buyers line of credit (long term) [Notes 2(i)(c) and 2(iii), page 77] 619.97 986.26
(ii) Loans, Cash Credit, Overdrafts Accounts and Buyers line of
credit (short term) [Note 2(i)(c), page 77] 2722.63 3956.82
7742.60 5251.65
“4” [Item no. 2(b)]
As at As at
March 31, March 31,
2010 2009
LOANS - Unsecured
(a) Foreign Currency Convertible Notes (FCCN) /
Convertible Alternative Reference Securities (CARS) [Note (C) (i), page 86] 4161.86 4522.39
(b) Fixed Deposits * # :
(i) From Public 2333.05 940.53
(ii) From Shareholders 840.40 291.94
(c) Commercial papers [maximum balance outstanding during the year
Rs. 1725 crores (2008-09 : Rs. 2685 crores)] 800.00 1215.00
(d) Short term loans :
(i) From Banks 625.00 605.00
(ii) From Subsidiaries 60.00 44.05
(iii) From Others 13.00 -
(e) Other loans :
(i) From Banks - 245.00
(ii) From Others 50.00 50.00
8883.31 7913.91
* Includes from Directors 16.12 13.60
# Includes repayable within one year 191.57 84.39

65
Schedules forming part of the Balance Sheet
(Rs in crores)
"5" [Item no. 6]
FIXED ASSETS Cost as at Additions / Deductions / Cost as at Depreciation / Accumulated Net BookApril 1, Adjustments Adjustments March 31, Amortisation depreciation / Value as at
2009 [Note (iv)] 2010 for the year amortisation upto March 31,2009-2010 March 31, 2010 2010
[Note (vi) [Note (v)and (ix)] and (ix)]
(a) Land 119.11 400.65 - 519.76 - - 519.76119.11 - - 119.11 - - 119.11
(b) Buildings, etc. [Note (i) and (ii)(a)] 1209.22 335.55 1.97 1542.80 42.41 353.82 1188.981029.67 179.65 0.10 1209.22 31.78 311.88 897.34
(c) Leasehold Land [Note (ii)(b)] 77.10 25.37 - 102.47 2.58 8.51 93.9672.27 4.83 - 77.10 0.77 5.93 71.17
(d) Plant & Machinery and
Equipment [Note (ii)(a) and (iii)] 10643.83 1645.15 58.54 12230.44 747.22 5672.18 6558.268317.80 2367.92 41.89 10643.83 667.60 4974.92 5668.91
(e) Water System and
Sanitation [Note (ii)(a)] 87.15 21.94 0.01 109.08 4.67 33.82 75.2667.19 19.96 - 87.15 3.31 29.15 58.00
(f ) Furniture, Fixtures and
Office Appliances [Note (iii)] 100.38 5.75 0.06 106.07 4.87 50.21 55.8692.36 8.16 0.14 100.38 4.83 45.39 54.99
(g) Technical Know-how 34.51 - - 34.51 - 34.51 -34.51 - - 34.51 - 34.51 -
(h) Vehicles and Transport [Note (iii)] 110.54 18.47 11.33 117.68 13.94 68.06 49.62106.09 14.62 10.17 110.54 12.96 63.19 47.35
(i) Plant taken on Lease [Note (viii)] 42.10 - 5.67 36.43 2.93 25.30 11.1342.10 - - 42.10 3.19 27.45 14.65
(j) IT Assets taken on lease 52.25 0.97 - 53.22 11.62 29.93 23.2929.59 22.66 - 52.25 11.86 18.31 33.94
(k) Leased Premises 31.28 - - 31.28 0.08 2.70 28.5831.28 - - 31.28 0.08 2.19 29.09
(l) Assets given on lease 407.97 - 12.16 395.81 4.86 378.75 17.06407.97 - - 407.97 4.86 390.48 17.49
(m) Software 252.96 6.92 0.06 259.82 44.58 194.67 65.15211.66 41.30 - 252.96 58.32 150.15 102.81
(n) Product Development Cost 736.77 2140.67 - 2877.44 154.11 360.46 2516.98269.23 467.54 - 736.77 74.98 206.35 530.42
GRAND TOTAL 13905.17 4601.44 89.80 18416.81 1033.87 7212.92 11203.89
10830.83 3126.64 52.30 13905.17 874.54 6259.90 7645.27
(o) Capital Work-in-Progress [Notes (vii) and (x)] 5232.156946.89
16436.0414592.16
Notes :
(i) Buildings include Rs. 8,631 (as at March 31, 2009 Rs. 8,631) being value of investments in shares of Co-operative Housing Societies.
(ii) (a) Buildings, Water System and Sanitation and Plant and Machinery include Gross block Rs. 4.76 crores, Rs.1.93 crores and Rs. 3.76 crores (as at March 31, 2009 Rs. 4.76 crores, Rs. 1.93 crores
and Rs. 3.76 crores) and Net Block Rs. 0.08 crore, Rs. 0.34 crore and Rs. 0.32 crore respectively (as at March 31, 2009 Rs. 0.08 crore, Rs. 0.42 crore and Rs. 0.34 crore) in respect of
expenditure incurred on capital assets, ownership of which does not vest in the Company.
(b) The registration of Leasehold Land of Rs. 44.33 crores (as at March 31, 2009 Rs. 33.53 crores) is in process.
(iii) Includes Plant & Machinery and Equipment, Furniture, Fixtures and Office Appliances and Vehicles and Transport having Gross block of Rs. 164.85 crores, Rs. 0.73 crore and Rs. 0.57 crore (as
at March 31, 2009 Rs. 150.15 crores, Rs. 1.13 crores and Rs. 0.34 crore), and Net block of Rs. 4.94 crores, Rs. 0.02 crore and Rs. 0.13 crore (as at March 31, 2009 Rs. 6.05 crores, Rs. Nil and
Rs. 0.11 crore) respectively, held for disposal.
(iv) Additions / Adjustments include decapitalisation of exchange gain (net of loss on derivative contracts) of Rs. 308.48 crores (2008-09 capitalisation of exchange loss of Rs. 457.06 crores).
(v) Accumulated Depreciation includes :
(a) an adjustment of Rs. 76.78 crores (as at March 31, 2009 Rs. 47.24 crores) on assets transferred / sold / discarded during the year.
(b) lease equalisation of Rs. 4.51 crores (2008-09 Rs. 4.49 crores) adjusted in lease rental income.
(c) depreciation of Rs. 0.44 crore (2008-09 Rs 0.44 crore) on revalued portion of gross block transferred to Revaluation Reserve.
(d) reversal of depreciation of Rs. Nil (as at March 31, 2009 Rs. 6.87 crores) on exchange gain adjusted in the carrying cost of assets in 2008-09 pertaining to 2007-08 has been transferred to
general reserve in line with the notification issued by the Ministry of Corporate Affairs.
(vi) Depreciation for the year includes loss of Rs. 23.96 crores (2008-09 Rs. 3.97 crores) on assets held for disposal.
(vii) Capital Work-in-Progress includes :
(a) Product Development Cost Rs. 1399.26 crores (as at March 31, 2009 Rs. 2460.76 crores).
(b) advances for capital expenditure of Rs. 264.91 crores (as at March 31, 2009 Rs. 318.67 crores).
(c) exchange differences and net premiums on derivative contracts, Net loss of Rs. 58.55 crores (as at March 31, 2009 Net loss of Rs. 106.54 crores).
(viii) The assets are under renewable secondary lease.
(ix) Depreciation for the year and Accumulated Depreciation includes amortisation, diminution in value of assets and write down of assets net of reversals.
(x) Capital Work-in-progress as of March 31, 2010 includes building under construction of Rs. 315.71 crores for the purposes of manufacturing automobiles. Consequent to the decision to relocate
and construct a similar manufacturing facility at another location, the management is in the process of evaluating several options, under all of which, no adjustment to the carrying amount of
the building is considered necessary based on the information available at the balance sheet date.

Sixty-fifth annual report 2009-10
Tata Motors Limited
66
Schedules forming part of the Balance Sheet(Rs. in crores)
“6”[Item no. 7]
INVESTMENTSAs at As at
Number Face Value Description March 31, 2010 March 31, 2009
Per Unit
I. Long Term Investments (at Cost)(A) Trade Investments(1) Fully paid Ordinary / Equity shares (Quoted)
27,20,629 10 Automobile Corporation of Goa Ltd 99.67 99.67
39,91,615 10 Tata Steel Ltd 239.50 269.86
(39,91,615 shares converted from Cumulative Compulsorily
Convertible Preference Shares during the year)
(2,14,40,882 shares classified as current
investment during the year)
70,249 10 Tata Chemicals Ltd 0.24 0.24
339.41 369.77
(2) Investments in Subsidiary CompaniesFully Paid Ordinary / Equity Shares(Unquoted)
75,00,000 100 Sheba Properties Ltd 75.00 75.00
3,03,00,600 10 Tata Technologies Ltd 224.10 224.10
- - Telco Construction Equipment Company Ltd [Note (C)(iv), page 86] - 119.50
(2,00,00,000 shares sold during the year)
(Associate from current year)24,48,120 10 Concorde Motors (India) Ltd 29.63 29.63
6,50,00,000 10 TAL Manufacturing Solutions Ltd 150.00 150.00
3,40,00,000 10 HV Transmissions Ltd 68.00 68.00
3,82,50,000 10 HV Axles Ltd 76.50 76.50
5,00,000 10 Tata Motors Insurance Broking and Advisory Services Ltd 17.31 17.31
30,16,060 (KRW) 5000 Tata Daewoo Commercial Vehicle Co. Ltd (Korea) 245.41 245.41
18,63,624 (GBP) 1 Tata Motors European Technical Centre Plc, UK [Note 6, page 68] 15.56 15.56
7,900 - Tata Technologies Inc. (formerly known as INCAT Systems Inc.) 0.63 0.63
85,00,00,000 10 Tata Motors Finance Ltd 1350.00 1250.00
(5,00,00,000 shares acquired during the year)
86,700,000 10 Tata Marcopolo Motors Ltd [Note 7, page 68] 86.70 30.60
(5,61,00,000 shares acquired during the year)
22,50,00,000 10 TML Distribution Company Ltd 225.00 115.00
(11,00,00,000 shares acquired during the year)
98,69,900 (THB) 100 Tata Motors (Thailand) Ltd [Note 8, page 68] 135.15 45.47
(63,62,900 shares received during the year on conversion of loans)
600 (ZAR) 1 Tata Motors (SA) (Proprietary) Ltd [Rs. 3,166.20] - -
100 (SGD) 1 TML Holdings Pte Ltd, (Singapore) [Rs. 2,778.73] - -
2,63,83,26,018 (USD) 1 (2,16,70,41,696 shares acquired during the year) 12814.00 2238.40
[Notes 9, 10 and 11, page 68]
1,34,523 (EUR) 31.28 Tata Hispano Motors Carrocera S.A. [Note 13, page 68 16.05 -
and Note (C)(v), page 86] (formerly known as Hispano Carrocera, S A)(1,06,260 shares acquired during the year)
(Subsidiary company from current year)15529.04 4701.11
(3) Fully Paid Ordinary / Equity Shares(Unquoted) in Others
50,59,203 1(S$) Tata Precision Industries Pte. Ltd (Singapore) [Note 14, page 68] 3.11 3.11
25,000 1000 Tata International Ltd 3.85 3.85
1,383 1000 Tata Services Ltd 0.14 0.14
350 900 The Associated Building Company Ltd 0.01 0.01
66,65,780 100 Tata Industries Ltd 82.97 82.97
1,35,000 100 Tata Projects Ltd 4.68 4.68
16,000 (TK) 1000 NITA Co. Ltd (Bangladesh) 1.27 1.27
33,600 100 Kulkarni Engineering Associates Ltd 0.67 0.67
9,00,00,000 10 Tata Cummins Ltd 90.00 90.00
12,375 1000 Tata Sons Ltd 68.75 68.75
5,23,33,170 10 Tata AutoComp Systems Ltd 77.47 77.47
2,25,00,001 10 Haldia Petrochemicals Ltd 22.50 22.50
- - Tata Hispano Motors Carrocera S.A. [Note (C)(v), page 86] - 2.34
(formerly known as Hispano Carrocera, S A)(Subsidiary company from current year)
2,40,000 10 Oriental Floratech (India) Pvt. Ltd 0.24 0.24
7,17,46,395 100 Fiat India Automobiles Ltd [Note 15, page 68] 999.54 719.54
(2,80,00,000 shares acquired during the year)
3,97,50,000 10 Telco Construction Equipment Company Ltd 79.50 -
[Note 5, page 68 and Note (C)(iv), page 86] (Associate from current year)1434.70 1077.54
(4) Fully paid Cumulative Redeemable Preference Shares (Unquoted)(a) in Subsidiaries
13,54,195 100 7% Concorde Motors (India) Ltd 13.54 13.54
1,00,63,999 (USD) 100 6.25% TML Holdings Pte Ltd, (Singapore) [Note 12, page 68] 4520.75 6091.60
(19,51,000 shares redeemed during the year)
13,63,624 (GBP) 1 6% Tata Motors European Technical Centre Plc, UK 9.28 9.89
4543.57 6115.03
(b) in Others1,00,000 1000 7% Tata Sons Ltd 10.00 10.00
2,10,00,000 10 8% Tata AutoComp Systems Ltd 21.00 21.00
- - 7.5% Rallis India Ltd - 5.00
(50,00,000 shares redeemed during the year)
31.00 36.00
4574.57 6151.03
(5) Fully paid Cumulative Compulsorily ConvertiblePreference Shares (Quoted) in others
- - 2% Tata Steel Ltd - 239.50
(2,39,49,693 shares converted to equity shares during the year)
(6) Non Convertible Debentures (Unquoted)- - Rushi Automobiles Ltd - 0.58
(6,80,000 debentures redeemed during the year)
7,500 3000 8% Tata Projects Ltd 2.25 2.25
Carried Forward 21879.97 12541.78
} {
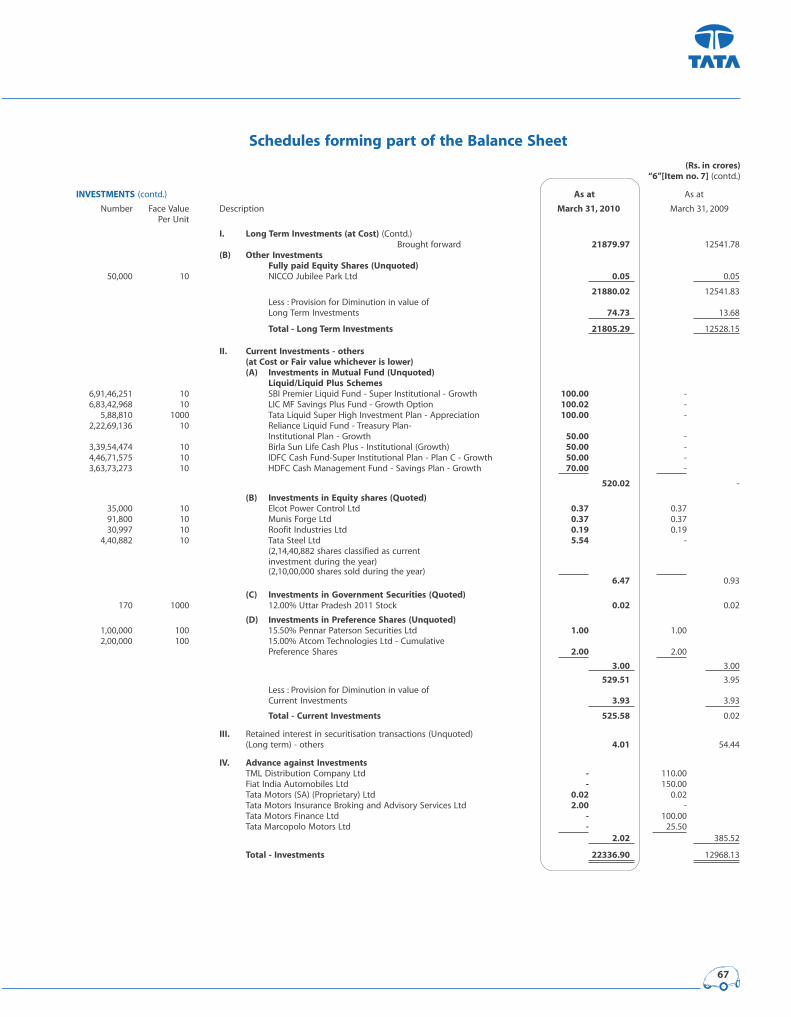
67
Schedules forming part of the Balance Sheet
(Rs. in crores)“6”[Item no. 7] (contd.)
INVESTMENTS (contd.) As at As at
Number Face Value Description March 31, 2010 March 31, 2009
Per Unit
I. Long Term Investments (at Cost) (Contd.)
Brought forward 21879.97 12541.78
(B) Other InvestmentsFully paid Equity Shares (Unquoted)
50,000 10 NICCO Jubilee Park Ltd 0.05 0.05
21880.02 12541.83
Less : Provision for Diminution in value of
Long Term Investments 74.73 13.68
Total - Long Term Investments 21805.29 12528.15
II. Current Investments - others(at Cost or Fair value whichever is lower)(A) Investments in Mutual Fund (Unquoted)
Liquid/Liquid Plus Schemes6,91,46,251 10 SBI Premier Liquid Fund - Super Institutional - Growth 100.00 -
6,83,42,968 10 LIC MF Savings Plus Fund - Growth Option 100.02 -
5,88,810 1000 Tata Liquid Super High Investment Plan - Appreciation 100.00 -
2,22,69,136 10 Reliance Liquid Fund - Treasury Plan-
Institutional Plan - Growth 50.00 -
3,39,54,474 10 Birla Sun Life Cash Plus - Institutional (Growth) 50.00 -
4,46,71,575 10 IDFC Cash Fund-Super Institutional Plan - Plan C - Growth 50.00 -
3,63,73,273 10 HDFC Cash Management Fund - Savings Plan - Growth 70.00 -
520.02 -
(B) Investments in Equity shares (Quoted)35,000 10 Elcot Power Control Ltd 0.37 0.37
91,800 10 Munis Forge Ltd 0.37 0.37
30,997 10 Roofit Industries Ltd 0.19 0.19
4,40,882 10 Tata Steel Ltd 5.54 -
(2,14,40,882 shares classified as current
investment during the year)
(2,10,00,000 shares sold during the year)
6.47 0.93
(C) Investments in Government Securities (Quoted)170 1000 12.00% Uttar Pradesh 2011 Stock 0.02 0.02
(D) Investments in Preference Shares (Unquoted)1,00,000 100 15.50% Pennar Paterson Securities Ltd 1.00 1.00
2,00,000 100 15.00% Atcom Technologies Ltd - Cumulative
Preference Shares 2.00 2.00
3.00 3.00
529.51 3.95
Less : Provision for Diminution in value of
Current Investments 3.93 3.93
Total - Current Investments 525.58 0.02
III. Retained interest in securitisation transactions (Unquoted)
(Long term) - others 4.01 54.44
IV. Advance against InvestmentsTML Distribution Company Ltd - 110.00
Fiat India Automobiles Ltd - 150.00
Tata Motors (SA) (Proprietary) Ltd 0.02 0.02
Tata Motors Insurance Broking and Advisory Services Ltd 2.00 -
Tata Motors Finance Ltd - 100.00
Tata Marcopolo Motors Ltd - 25.50
2.02 385.52
Total - Investments 22336.90 12968.13

Sixty-fifth annual report 2009-10
Tata Motors Limited
68
Schedules forming part of the Balance Sheet
(Rs. in crores)“6”[Item no. 7] (contd.)
INVESTMENTS (contd.)
NOTES : (1) Face Value per unit is in Rupees unless stated otherwise
As at As at
March 31, 2010 March 31, 2009
(2) Book Value of quoted investments 344.97 609.29
(3) Book Value of unquoted investments 21991.93 12358.84
(4) Market Value of quoted investments 345.53 558.32
(5) As per the shareholders agreement dated March 30, 2010, between Hitachi Construction Machinery Co. Ltd and the Company,
these shares are under restriction for sale, assignment or transfer for a period of 3 years from the date of the agreement except
under certain circumstances as provided in the said agreement.
(6) The Company has given a letter of comfort to Standard Chartered Bank, London for GBP 15 million (Rs. 102.15 crores as on Mar
31, 2010) against loan extended by the bank to Tata Motors European Technical Centre Plc, UK (TMETC). Also the Company has
given an undertaking to Standard Chartered Bank, London to retain 100% ownership of TMETC at all times during the tenor of
the loan.
(7) The Company has given a letter of comfort of Rs. 120 crores to HDFC Bank against the short term and long term loans aggregating
Rs. 235 crores given by HDFC Bank to Tata Marcopolo Motors Ltd (TMML). Also the Company has given an undertaking to HDFC
Bank that it will not dilute its stake below 51% during the currency of the loan.
(8) The Company has given a letter of comfort to Citibank NA towards the short term and long term loans aggregating THB 850
million (Rs. 117.88 crores as on March 31, 2010) given by Citibank NA to Tata Motors (Thailand) Ltd (TMTL). The letter of comfort is
restricted to 86.78% of the said amount i.e. THB 737.63 million (Rs. 102.29 crores as on March 31, 2010). As per the proposed
arrangement to be entered between the Company, Thonburi and Citibank NA, on occurrence of certain event, the Company may
have to purchase Thonburi’s stake of 8.81% in TMTL. Consequently, this letter of comfort will be prorata increased to reflect the
increased stake in TMTL. Further the Company has given an undertaking to Citibank NA for non-disposal of its shareholding in
TMTL below 51% during the tenor of the loan.
(9) The Company has given a letter of comfort along with a letter of irrevocable undertaking to State Bank of India, Bank of Baroda
and Bank of India totaling GBP 370 Million (Rs. 2519.65 crores as on Mar 31, 2010) against their guarantees to European Investment
Bank for credit facilities availed by Land Rover.
(10) The Company has also given a Letter of Comfort to State Bank of India, Standard Chartered Bank and Bank of Baroda for GBP 175
Million (Rs. 1191.73 crores as on Mar 31, 2010), USD 240 million (Rs. 1078.20 crores as on Mar 31, 2010), GBP 70 million (Rs. 476.69
crores as on Mar 31, 2010) respectively, for credit facilities given by them to Land Rover.
(11) The Company has given a letter of comfort to GE Commercial Distribution Finance Europe Ltd upto GBP 170 million (Rs. 1157.68
crores as on Mar 31, 2010) for revolving syndicated loan facility to Jaguar Cars Ltd and Land Rover. Also the Company has given
an undertaking to GE Commercial Distribution Finance Europe Ltd to retain ultimate 100% ownership of Jaguar Cars Ltd and
Land Rover at all times during the tenor of the loan.
(12) During the year, TML Holdings Pte Ltd, Singapore, a wholly owned subsidiary of the Company, has redeemed preference shares of
the face value of USD 195.1 million at a discount of USD 189.2 million. Consequent to the redemption, the Company has recognized
a loss of Rs. 850.86 crores.
(13) The Company has given a letter of comfort to Citibank NA against working capital loans extended by the bank to Tata Hispano
Motors Carrocera, S.A. aggregating Euro 15 million (Rs. 90.87 crores as on March 31, 2010). The Company has also given a letter of
comfort to Banco de Valencia against bill discounting facility extended by the bank to Tata Hispano Motors Carrocera, S.A.
aggregating Euro 2 million (Rs. 12.12 crores as on March 31, 2010). The Company has also given an undertaking to Citibank NA for
non-disposal of its shareholding in Hispano Carrocera, S.A. during the tenor of the loan.
(14) The Company has given a letter of comfort to Citibank NA against credit facilities provided by the bank to Tata Precision Industries
Pte. Ltd (TPI), Singapore and Tata Engineering Services Pte. Ltd (TES), Singapore, a wholly owned subsidiary of TPI aggregating
SGD 13.85 million (Rs. 44.48 crores as on March 31, 2010). The Company has also given an undertaking to Citibank NA for non-
disposal of its shareholding in TPI, Singapore, during the tenor of the loan.
(15) The Company has given letter of comfort to certain banks and other lenders against credit facilities extended to Fiat India
Automobiles Ltd for Rs. 1600 crores and Euro 130 million (Rs. 787.57 crores as on March 31, 2010). The Letter of Comfort is
restricted to 50% of the value of credit facilities extended i.e. Rs. 1193.79 crores.
(16) Trade Investments also include :
Number Face Description
Value
Per Unit
Rupees Rupees Rupees
5,000 10 Metal Scrap Trade Corporation Ltd 25000 25000
50 5 Jamshedpur Co-operative Stores Ltd 250 250
16,56,517 1(M$) Tatab Industries Sdn. Bhd. Malaysia 1 1
100 10 American Express Services Ltd 1 1
4 25,000 ICICI Money Multiplier Bond 1 1
100 10 Optel Telecommunications 1995 1995
200 10 Punjab Chemicals 1 1
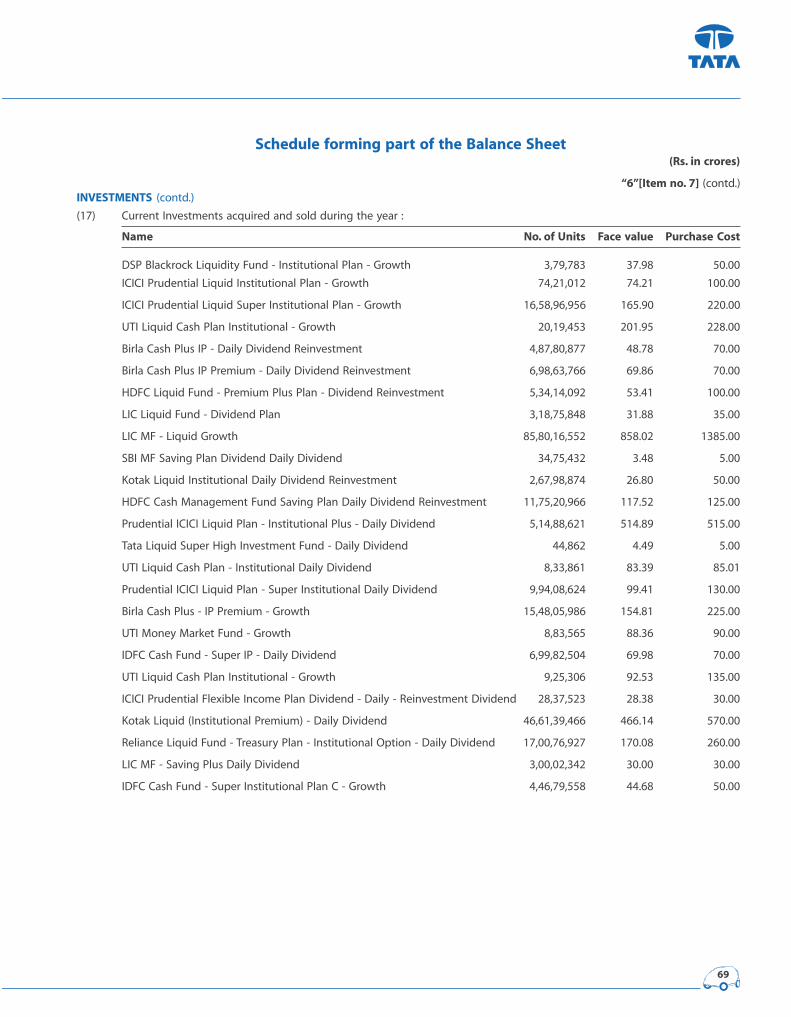
69
Schedule forming part of the Balance Sheet(Rs. in crores)
“6”[Item no. 7] (contd.)
INVESTMENTS (contd.)
(17) Current Investments acquired and sold during the year :
Name No. of Units Face value Purchase Cost
DSP Blackrock Liquidity Fund - Institutional Plan - Growth 3,79,783 37.98 50.00
ICICI Prudential Liquid Institutional Plan - Growth 74,21,012 74.21 100.00
ICICI Prudential Liquid Super Institutional Plan - Growth 16,58,96,956 165.90 220.00
UTI Liquid Cash Plan Institutional - Growth 20,19,453 201.95 228.00
Birla Cash Plus IP - Daily Dividend Reinvestment 4,87,80,877 48.78 70.00
Birla Cash Plus IP Premium - Daily Dividend Reinvestment 6,98,63,766 69.86 70.00
HDFC Liquid Fund - Premium Plus Plan - Dividend Reinvestment 5,34,14,092 53.41 100.00
LIC Liquid Fund - Dividend Plan 3,18,75,848 31.88 35.00
LIC MF - Liquid Growth 85,80,16,552 858.02 1385.00
SBI MF Saving Plan Dividend Daily Dividend 34,75,432 3.48 5.00
Kotak Liquid Institutional Daily Dividend Reinvestment 2,67,98,874 26.80 50.00
HDFC Cash Management Fund Saving Plan Daily Dividend Reinvestment 11,75,20,966 117.52 125.00
Prudential ICICI Liquid Plan - Institutional Plus - Daily Dividend 5,14,88,621 514.89 515.00
Tata Liquid Super High Investment Fund - Daily Dividend 44,862 4.49 5.00
UTI Liquid Cash Plan - Institutional Daily Dividend 8,33,861 83.39 85.01
Prudential ICICI Liquid Plan - Super Institutional Daily Dividend 9,94,08,624 99.41 130.00
Birla Cash Plus - IP Premium - Growth 15,48,05,986 154.81 225.00
UTI Money Market Fund - Growth 8,83,565 88.36 90.00
IDFC Cash Fund - Super IP - Daily Dividend 6,99,82,504 69.98 70.00
UTI Liquid Cash Plan Institutional - Growth 9,25,306 92.53 135.00
ICICI Prudential Flexible Income Plan Dividend - Daily - Reinvestment Dividend 28,37,523 28.38 30.00
Kotak Liquid (Institutional Premium) - Daily Dividend 46,61,39,466 466.14 570.00
Reliance Liquid Fund - Treasury Plan - Institutional Option - Daily Dividend 17,00,76,927 170.08 260.00
LIC MF - Saving Plus Daily Dividend 3,00,02,342 30.00 30.00
IDFC Cash Fund - Super Institutional Plan C - Growth 4,46,79,558 44.68 50.00
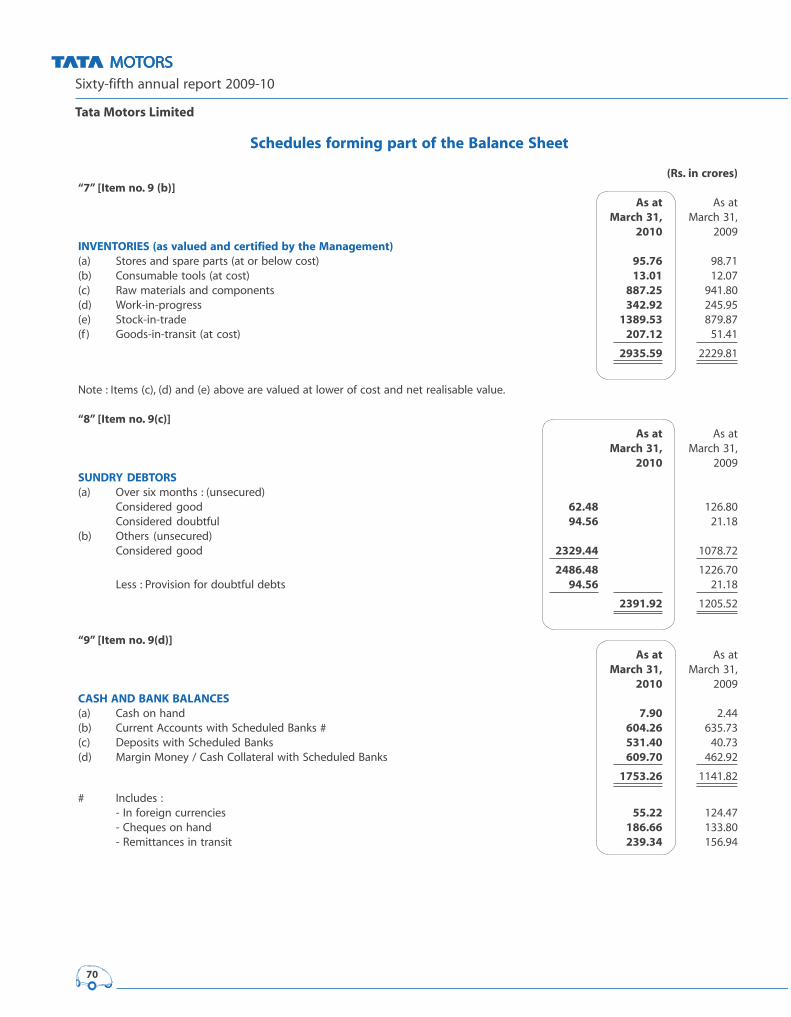
Sixty-fifth annual report 2009-10
Tata Motors Limited
70
Schedules forming part of the Balance Sheet
(Rs. in crores)“7” [Item no. 9 (b)]
As at As at
March 31, March 31,
2010 2009
INVENTORIES (as valued and certified by the Management)(a) Stores and spare parts (at or below cost) 95.76 98.71
(b) Consumable tools (at cost) 13.01 12.07
(c) Raw materials and components 887.25 941.80
(d) Work-in-progress 342.92 245.95
(e) Stock-in-trade 1389.53 879.87
(f ) Goods-in-transit (at cost) 207.12 51.41
2935.59 2229.81
Note : Items (c), (d) and (e) above are valued at lower of cost and net realisable value.
“8” [Item no. 9(c)]As at As at
March 31, March 31,
2010 2009
SUNDRY DEBTORS(a) Over six months : (unsecured)
Considered good 62.48 126.80
Considered doubtful 94.56 21.18
(b) Others (unsecured)
Considered good 2329.44 1078.72
2486.48 1226.70
Less : Provision for doubtful debts 94.56 21.18
2391.92 1205.52
“9” [Item no. 9(d)]As at As at
March 31, March 31,
2010 2009
CASH AND BANK BALANCES(a) Cash on hand 7.90 2.44
(b) Current Accounts with Scheduled Banks # 604.26 635.73
(c) Deposits with Scheduled Banks 531.40 40.73
(d) Margin Money / Cash Collateral with Scheduled Banks 609.70 462.92
1753.26 1141.82
# Includes :
- In foreign currencies 55.22 124.47
- Cheques on hand 186.66 133.80
- Remittances in transit 239.34 156.94

71
Schedules forming part of the Balance Sheet(Rs. in crores)
“10” [Item no. 9(e)]
As at As at
March 31, March 31,
2010 2009
LOANS AND ADVANCESA) Secured
Vehicle loans [Note 1 below and [Note A (4), page 78]]*
Considered good 613.32 2006.90
Considered doubtful 304.35 304.47
917.67 2311.37
Less: Provision for doubtful loans # 304.35 304.47
613.32 2006.90
* Includes Rs. 350.98 crores (as at March 31, 2009 Rs. 368.59 crores)
on account of overdue Securitised Receivables
# Includes Rs. 185.88 crores (as at March 31, 2009 Rs. 181.88 crores)
towards Securitised Receivables
B) Unsecured - considered good(a) Claims / incentives recoverable, advances / loans to suppliers,
contractors, employees and others, rent deposits and
other amount due (Notes 2 and 3 below) 1349.28 881.08
(b) Dues from subsidiary companies (Note 4 below) 106.56 69.96
(c) Interim dividend declared by subsidiary companies - 6.80
(d) Loans and inter-corporate deposits [net of provision of Rs. 33.19 crores(as at March 31, 2009 Rs. 9.72 crores )] (Note 5 below) 581.01 622.95
(e) Deposits with government, public bodies and others :
(i) Balances with Customs, Port Trust, Excise, etc. 152.49 148.82
(ii) Others [net of provision of Rs. 0.10 crore(as at March 31, 2009 Rs. 0.10 crore)] (Note 6 below) 174.00 296.00
326.49 444.82
(f ) Prepaid expenses 167.31 134.69
(g) Income tax refundable (net of provision) (Note 7 below) 1313.13 795.79
3843.78 2956.09
4457.10 4962.99
Notes: (1) Loans are secured against hypothecation of vehicles.
(2) Include :
Loans and advances due from Directors and Officers. 0.10 0.11
Maximum during the year 0.11 0.27
(3) Net of advances considered doubtful which have been
provided for. 63.44 76.44
(4) Dues from subsidiary companies :
(i) HV Axles Ltd 9.51 5.42
(ii) HV Transmissions Ltd 9.88 16.48
(iii) Telco Construction Equipment Company Ltd - 0.91
(Associate from current year)(iv) Tata Daewoo Commercial Vehicle Company Ltd . - 1.17
(v) Tata Marcopolo Motors Ltd 57.62 36.77
(vi) Tata Motors (Thailand) Ltd 8.86 5.32
(vii) Tata Technologies Ltd - 0.15
(viii) TML Distribution Company Ltd 4.10 0.46
(ix) TML Holdings Pte. Ltd, Singapore 2.15 2.13
(x) TAL Manufacturing Solutions Ltd 1.20 1.15
(xi) Tata Hispano Motors Carrocera S.A. 13.24 -
(Subsidiary company from current year)106.56 69.96
(5) Includes given to subsidiaries :
(i) Tata Hispano Motors Carrocera S.A. 147.73 -
(Subsidiary company from current year)(ii) Tata Motors (Thailand) Ltd 60.68 106.95
(iii) Tata Motors European Technical Centre Plc, UK 32.59 34.73
(iv) HV Transmissions Ltd - 6.50
(v) Concorde Motors (India) Ltd 31.00 30.00
(vi) Tata Marcopolo Motors Ltd 10.00 10.00
(vii) TAL Manufacturing Solutions Ltd 5.50 6.50
287.50 194.68
(6) Includes deposits given as collateral security to subsidiary :
(i) Tata Motors Finance Ltd 20.00 20.00
(7) Includes MAT credit entitlement 731.80 220.06
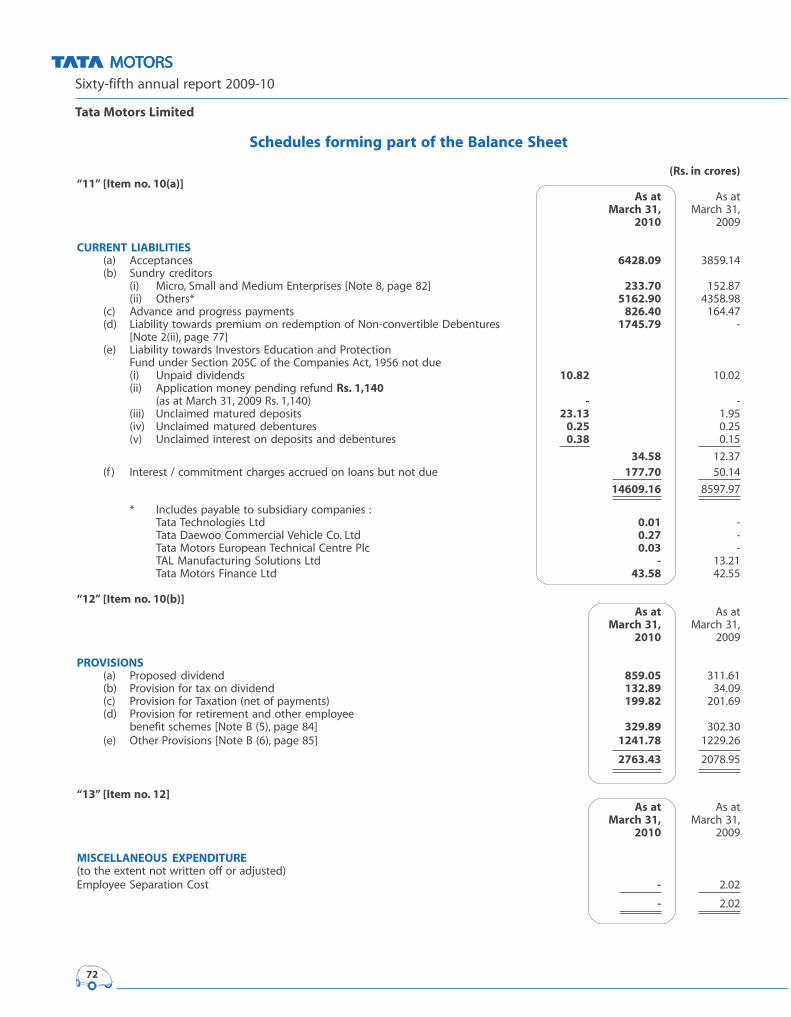
Sixty-fifth annual report 2009-10
Tata Motors Limited
72
Schedules forming part of the Balance Sheet
(Rs. in crores)“11” [Item no. 10(a)]
As at As at
March 31, March 31,
2010 2009
CURRENT LIABILITIES(a) Acceptances 6428.09 3859.14
(b) Sundry creditors
(i) Micro, Small and Medium Enterprises [Note 8, page 82] 233.70 152.87
(ii) Others* 5162.90 4358.98
(c) Advance and progress payments 826.40 164.47
(d) Liability towards premium on redemption of Non-convertible Debentures 1745.79 -
[Note 2(ii), page 77]
(e) Liability towards Investors Education and Protection
Fund under Section 205C of the Companies Act, 1956 not due
(i) Unpaid dividends 10.82 10.02
(ii) Application money pending refund Rs. 1,140(as at March 31, 2009 Rs. 1,140) - -
(iii) Unclaimed matured deposits 23.13 1.95
(iv) Unclaimed matured debentures 0.25 0.25
(v) Unclaimed interest on deposits and debentures 0.38 0.15
34.58 12.37
(f ) Interest / commitment charges accrued on loans but not due 177.70 50.14
14609.16 8597.97
* Includes payable to subsidiary companies :
Tata Technologies Ltd 0.01 -
Tata Daewoo Commercial Vehicle Co. Ltd 0.27 -
Tata Motors European Technical Centre Plc 0.03 -
TAL Manufacturing Solutions Ltd - 13.21
Tata Motors Finance Ltd 43.58 42.55
“12” [Item no. 10(b)]As at As at
March 31, March 31,
2010 2009
PROVISIONS(a) Proposed dividend 859.05 311.61
(b) Provision for tax on dividend 132.89 34.09
(c) Provision for Taxation (net of payments) 199.82 201.69
(d) Provision for retirement and other employee
benefit schemes [Note B (5), page 84] 329.89 302.30
(e) Other Provisions [Note B (6), page 85] 1241.78 1229.26
2763.43 2078.95
“13” [Item no. 12]As at As at
March 31, March 31,
2010 2009
MISCELLANEOUS EXPENDITURE(to the extent not written off or adjusted)
Employee Separation Cost - 2.02
- 2.02
73
Schedules forming part of the Balance Sheet and Profit and Loss AccountSignificant Accounting Policies
(a) Basis of preparation
The financial statements are prepared under the historical cost convention on an accrual basis of accounting in accordance with the generally
accepted accounting principles, Accounting Standards notified under Section 211 (3C) of the Companies Act, 1956 and the relevant provisions
thereof.
(b) Use of estimates
The preparation of financial statements requires management to make judgments, estimates and assumptions, that affect the application of
accounting policies and the reported amounts of assets and liabilities and disclosures of contingent liabilities at the date of these financial
statements and the reported amounts of revenues and expenses for the years presented. Actual results may differ from these estimates.
Estimates and underlying assumptions are reviewed on an ongoing basis. Revisions to accounting estimates are recognised in the year in which
the estimate is revised and future years affected.
(c) Revenue Recognition
The Company recognises revenue on the sale of products, net of discounts, when the products are delivered to the dealer / customer or when
delivered to the carrier for export sales, which is when risks and rewards of ownership pass to the dealer / customer.
Sales include income from services, transfer of technology relating to automotive products and exchange fluctuations relating to export
receivables. Sales include export and other recurring and non-recurring incentives from the Government at the national and state levels. Sale of
products is presented gross of excise duty where applicable, and net of other indirect taxes.
Revenues are recognised when collectibility of the resulting receivables is reasonably assured.
Dividend from investments is recognized when the right to receive the payment is established and when no significant uncertainty as to
measurability or collectability exists.
Interest income is recognized on the time basis determined by the amount outstanding and the rate applicable and where no significant
uncertainty as to measurability or collectability exists.
(d) Depreciation and Amortisation
(i) Depreciation is provided on straight line method (SLM), at the rates and in the manner prescribed in Schedule XIV to the Companies Act,
1956 except in the case of :
� Leasehold Land – amortised over the period of the lease
� Technical Know-how – at 16.67% (SLM)
� Laptops – at 23.75% (SLM)
� Cars – at 23.75% (SLM)
� Assets acquired prior to April 1, 1975 – on Written Down Value basis at rates specified in Schedule XIV to the Companies Act, 1956.
� Software in excess of Rs. 25,000 is amortised over a period of sixty months or on the basis of estimated useful life whichever is
lower.
� Assets taken on lease are amortised over the period of lease.
(ii) Product development cost are amortised over a period of 36 months to 120 months or on the basis of actual production to planned
production volume over such period.
(iii) In respect of assets whose useful life has been revised, the unamortised depreciable amount has been charged over the revised remaining
useful life.
(iv) Depreciation is not recorded on capital work-in-progress until construction and installation are complete and asset is ready for its intended
use. Capital work-in-progress includes capital advances.
(e) Fixed Assets
(i) Fixed assets are stated at cost of acquisition or construction less accumulated depreciation / amortization.
(ii) The product development cost incurred on new vehicle platform, engines, transmission and new products are recognised as fixed assets,
when feasibility has been established, the Company has committed technical, financial and other resources to complete the development
and it is probable that asset will generate probable future benefits.
(iii) Cost includes purchase price, taxes and duties, labour cost and directly attributable costs for self constructed assets and other direct costs
incurred upto the date the asset is ready for its intended use. Borrowing cost incurred for qualifying assets is capitalised up to the date
the asset is ready for intended use, based on borrowings incurred specifically for financing the asset or the weighted average rate of all
other borrowings, if no specific borrowings have been incurred for the asset. The cost of acquisition is further adjusted for exchange
differences relating to long term foreign currency borrowings attributable to the acquisition of depreciable asset w.e.f. April 1, 2007.
(iv) Software not exceeding Rs. 25,000 and product development costs relating to minor product enhancements, facelifts and upgrades are
charged off to the Profit and Loss Account as and when incurred.
(f ) Impairment
At each balance sheet date, the Company assesses whether there is any indication that the fixed assets have suffered an impairment loss. If any
such indication exists, the recoverable amount of the asset is estimated in order to determine the extent of the impairment, if any. Where it is
not possible to estimate the recoverable amount of individual asset, the Company estimates the recoverable amount of the cash-generating
unit to which the asset belongs.
As per the assessment conducted by the Company at March 31, 2010, there were no indications that the fixed assets have suffered an impairment
loss.

Sixty-fifth annual report 2009-10
Tata Motors Limited
74
Significant Accounting Policies - (contd.)
(g) Leases
(i) Finance Lease
Assets acquired under finance leases are recognised at the lower of the fair value of the leased assets at inception and the present
value of minimum lease payments. Lease payments are apportioned between the finance charge and the outstanding liability. The
finance charge is allocated to periods during the lease term at a constant periodic rate of interest on the remaining balance of the
liability. Assets given under finance leases are recognised as receivables at an amount equal to the net investment in the lease and
the finance income is based on a constant rate of return on the outstanding net investment.
(ii) Operating Lease
Leases other than finance lease, are operating leases, and the leased assets are not recognised on the Company’s balance sheet.
Payments under operating leases are recognised in the Profit and Loss Account on a straight-line basis over the term of the lease.
(h) Transactions in Foreign Currencies and Accounting of Derivatives
(i) Exchange differences
Transactions in foreign currencies are recorded at the exchange rates prevailing on the date of the transaction. Foreign currency
monetary assets and liabilities are translated at year end exchange rates.
(1) Exchange differences arising on settlement of transactions and translation of monetary items other than those covered by (2)
below are recognized as income or expense in the year in which they arise. Exchange differences considered as borrowing cost
are capitalized to the extent these relate to the acquisition / construction of qualifying assets and the balance amount is
recognized in the Profit & Loss Account.
(2) Exchange differences relating to long term foreign currency monetary assets / liabilities are accounted for with effect from April
1, 2007 in the following manner:
- Differences relating to borrowings attributable to the acquisition of the depreciable capital asset are added to / deducted
from the cost of such capital assets.
- Other differences are accumulated in Foreign Currency Monetary Item Translation Difference Account, to be amortized over
the period, beginning April 1, 2007 or date of inception of such item, as applicable, and ending on March 31, 2011 or the
date of its maturity, whichever is earlier.
(ii) Hedge Accounting
The Company uses foreign currency forward contracts to hedge its risks associated with foreign currency fluctuations relating to
highly probable forecast transactions. With effect from April 1, 2008, the Company designates such forward contracts in a cash flow
hedging relationship by applying the hedge accounting principles set out in Accounting Standard 30- Financial Instruments: Recognition
and Measurement.
These forward contracts are stated at fair value at each reporting date. Changes in the fair value of these forward contracts that are
designated and effective as hedges of future cash flows are recognized directly in Hedging Reserve Account under Reserves and
Surplus, net of applicable deferred income taxes and the ineffective portion is recognised immediately in the Profit and Loss Account.
Amounts accumulated in Hedging Reserve Account are reclassified to profit and loss in the same periods during which the forecasted
transaction affects profit and loss.
Hedge accounting is discontinued when the hedging instrument expires or is sold, terminated, or exercised, or no longer qualifies for
hedge accounting. For forecasted transactions, any cumulative gain or loss on the hedging instrument recognised in Hedging Reserve
Account is retained there until the forecasted transaction occurs.
If the forecasted transaction is no longer expected to occur, the net cumulative gain or loss recognised in Hedging Reserve Account is
immediately transferred to the Profit and Loss Account.
(iii) Premium or discount on forward contracts other than those covered in (ii) above is amortised over the life of such contracts and is
recognised as income or expense. Foreign currency options and other derivatives are stated at fair value as at the year end with
changes in fair value recognized in the Profit and Loss Account.
(i) Product Warranty Expenses
The estimated liability for product warranties is recorded when products are sold. These estimates are established using historical information
on the nature, frequency and average cost of warranty claims and management estimates regarding possible future incidence based on
corrective actions on product failures. The timing of outflows will vary as and when warranty claim will arise - being typically upto three
years.
(j) Income on Vehicle Loan / Hire-Purchase Income / Finance Income from Lease
Interest income from hire purchase and loan contracts and finance income in respect of vehicles are accounted for by using the Internal
Rate of Return method. Consequently, a constant rate of return on the net outstanding amount is accrued over the period of contract. The
Company provides an allowance for hire purchase and loan receivables that are in arrears for more than 11 months, to the extent of an
amount equivalent to the outstanding principal and amounts due but unpaid, considering probable inherent loss including estimated
realisation based on past performance trends. In respect of loan contracts that are in arrears for more than 6 months but not more than 11
months, allowance is provided to the extent of 10% of the outstanding and amount due but unpaid.
(k) Inventories
Inventories are valued at the lower of cost and net realisable value. Cost of raw materials and consumables are ascertained on a moving
weighted average / monthly moving weighted average basis. Cost, including variable and fixed overheads, are allocated to work-in-progress
and stock-in-trade determined on full absorption cost basis. Net realisable value is estimated selling price in the ordinary course of business
less estimated cost of completion and selling expenses.
75
Significant Accounting Policies - (contd.)(l) Employee Benefits
(i) GratuityThe Company has an obligation towards gratuity, a defined benefit retirement plan covering eligible employees. The plan provides for
a lump sum payment to vested employees at retirement, death while in employment or on termination of employment of an amount
equivalent to 15 to 30 days salary payable for each completed year of service. Vesting occurs upon completion of five years of service.
The Company makes annual contributions to gratuity fund established as trust. The Company accounts for the liability for gratuity
benefits payable in future based on an independent actuarial valuation.
(ii) SuperannuationThe Company has two superannuation plans, a defined benefit plan and a defined contribution plan. An eligible employee on April 1,
1996 could elect to be a member of either plan.
Employees who are members of the defined benefit superannuation plan are entitled to benefits depending on the years of service
and salary drawn. The monthly pension benefits after retirement range from 0.75% to 2% of the annual basic salary for each year of
service. The Company accounts for the liability for superannuation benefits payable in future under the plan based on an independent
actuarial valuation.
With effect from April 1, 2003, this plan was amended and benefits earned by covered employees have been protected as at March 31,
2003. Employees covered by this plan are prospectively entitled to benefits computed on a basis that ensures that the annual cost of
providing the pension benefits would not exceed 15% of salary.
The Company maintains a separate irrevocable trust for employees covered and entitled to benefits. The Company contributes up to
15% of the eligible employees’ salary to the trust every year. The Company recognizes such contributions as an expense when incurred.
The Company has no further obligation beyond this contribution.
(iii) Bhavishya Kalyan Yojana (BKY)Bhavishya Kalyan Yojana is an unfunded defined benefit plan. The benefits of the plan include pension in certain case, payable upto
the date of normal superannuation had the employee been in service, to an eligible employee at the time of death or permanent
disablement, while in service, either as a result of an injury or as certified by the Company’s Medical Board. The monthly payment to
dependents of the deceased / disabled employee under the plan equals 50% of the salary drawn at the time of death or accident or a
specified amount, whichever is higher. The Company accounts for the liability for BKY benefits payable in future based on an independent
actuarial valuation.
(iv) Post-retirement Medicare SchemeUnder this scheme, employees get medical benefits subject to certain limits of amount, periods after retirement and types of benefits,
depending on their grade and location at the time of retirement. Employees separated from the Company as part of Early Separation
Scheme, on medical grounds or due to permanent disablement are also covered under the scheme. The liability for post-retirement
medical scheme is based on an independent actuarial valuation.
(v) Provident fundThe eligible employees of the Company are entitled to receive benefits under the provident fund, a defined contribution plan, in
which both employees and the Company make monthly contributions at a specified percentage of the covered employees’ salary
(currently 12% of employees’ salary). The contributions as specified under the law are paid to the provident fund and pension fund set
up as irrevocable trust by the Company or to respective Regional Provident Fund Commissioner and the Central Provident Fund under
the State Pension scheme. The Company is generally liable for annual contributions and any shortfall in the fund assets based on the
government specified minimum rates of return or pension and recognises such contributions and shortfall, if any, as an expense in the
year incurred.
(vi) Compensated absencesThe Company provides for the encashment of leave or leave with pay subject to certain rules. The employees are entitled to accumulate
leave subject to certain limits, for future encashment. The liability is provided based on the number of days of unutilised leave at each
balance sheet date on the basis of an independent actuarial valuation.
(m) InvestmentsLong term investments are stated at cost less other than temporary diminution in value, if any. Current investments are stated at lower of
cost and fair value. Fair value of investments in mutual funds are determined on a portfolio basis.
(n) Income Tax ExpensesIncome tax expenses comprises current and deferred taxes.
Current tax is the amount of tax payable on the taxable income for the year as determined in accordance with the provisions of the Income
Tax Act, 1961. Current tax is net of credit for entitlement for Minimum Alternative tax. Current tax includes Fringe benefit tax, applicable
upto year ending March 31, 2009.
Deferred tax is recognised, on timing differences, being the difference between taxable income and accounting income that originate in one
period and are capable of reversal in one or more subsequent periods.
Deferred tax assets in respect of unabsorbed depreciation and carry forward of losses are recognised if there is virtual certainty that there
will be sufficient future taxable income available to realise such losses.
Deferred tax assets and liabilities are measured based on the tax rates that are expected to apply in the period when asset is realised or the
liability is settled, based on tax rates and tax laws that have been enacted or substantially enacted by the balance sheet date.
(o) Redemption premium / discount on Foreign Currency Convertible Notes (FCCN) / Convertible AlternativeReference Securities (CARS) / Non Convertible Debentures (NCD)Premium payable on redemption of FCCN / CARS / NCD as per the terms of issue, is provided fully in the year of issue by adjusting against
the Securities Premium Account (SPA). Any change in the premium payable, consequent to conversion or exchange fluctuations is adjusted
to the SPA. Discount on redemption of FCCN, if any, will be recognised on redemption.
(p) Business SegmentsThe Company is engaged mainly in the business of automobile products consisting of all types of commercial and passenger vehicles
including financing of the vehicles sold by the Company. These, in the context of Accounting Standard 17 on Segment Reporting, as specified
in the Companies (Accounting Standards) Rules, 2006, are considered to constitute one single primary segment. Further, there is no reportable
secondary segment i.e. Geographical Segment.
Sixty-fifth annual report 2009-10
Tata Motors Limited
76
Schedules forming part of the Balance Sheet and Profit and Loss Account
“14” [Item no. 15]
(A) Notes to Balance Sheet
1 I. The Issued and subscribed capital includes :
(a) Ordinary Shares allotted as fully paid up shares for consideration other than cash:
- 7,53,470 Ordinary Shares allotted to Daimler – Benz AG in consideration of materials supplied to the Company in the financial
year 1956-57,
- 3,00,000 Ordinary Shares allotted to the Shareholders of erstwhile Investa Machine Tools and Engineering Company Limited
in terms of the Scheme of Amalgamation sanctioned by the Bombay High Court in the financial year 1966-67,
- 7,59,510 Ordinary Shares allotted to the Shareholders of the erstwhile Central Bank of India in terms of the Scheme of
Amalgamation in the financial year 1970-71,
- 1,83,823 Ordinary Shares issued to the Shareholders of the erstwhile Noduron Founders Maharashtra Limited in terms of the
merger in the financial year 1992-93,
- 15,24,30,083 Ordinary Shares issued to Financial Institutions and holders of convertible debentures / bonds on conversion of
term loans / debentures / bonds,
- 1,45,04,949 Ordinary Shares issued to the Shareholders of the erstwhile Tata Finance Limited in terms of the merger in the
financial year 2005-06.
(b) 11,12,92,760 Ordinary Shares issued as fully paid up Bonus Shares by utilising Securities Premium Account, Capital Reserve, Capital
Redemption Reserve, Amalgamation Reserve, contribution for Capital Expenditure Account and General Reserve.
(c) 2,55,02,622 (as at March 31, 2009 2,55,02,402) Ordinary Shares allotted against the exercise of equivalent number of warrants
pertaining to the rights issue of 2001 at Rs.120/- per share.
(d) 5,25,08,228 (as at March 31, 2009 2,58,64,962) Ordinary Shares issued upon conversions of Foreign Currency Convertible Notes
(FCCNs). Details are as follows:
(i) 1% FCCN due 2008
1,83,98,095 (as at March 31, 2009 : 1,83,98,095) Ordinary Shares issued against 99,940 (as at March 31, 2009 : 99,940) Notes.
The balance 60 notes have been redeemed during the year 2008-09.
(ii) 0% FCCN due 2009
74,66,867 (as at March 31, 2009 : 74,66,867) Ordinary Shares issued against 97,590 (as at March 31, 2009 : 97,590) Notes. The
balance 2,410 notes have been redeemed during the year 2009-10.
(iii) 1% FCCN due 2011
1,88,16,152 (as at March 31, 2009 : Nil) Ordinary Shares issued against 2,29,634 (as at March 31, 2009 : Nil) Notes.
(iv) 0% FCCN due 2011
78,27,114 (as at March 31, 2009 : Nil) Ordinary Shares issued against 1,071 (as at March 31, 2009 : Nil) Notes.
(e) 6,42,76,883 (as at March 31, 2009 : 6,42,76,164) Ordinary Shares at Rs. 340 per share and 6,42,76,883 (as at March 31, 2009 : 6,42,76,164)
‘A’ Ordinary Shares at Rs. 305 per share were allotted on exercising of options pertaining to Rights issue of 2008.
(f ) The Company has issued 2,99,04,306 Global Depository Shares (GDS) each representing one share at a price of US$ 12.54 per GDS,
aggregating US$ 375 million (Rs. 1794.19 crores).
II. The entitlements to 1,49,534 (as at March 31, 2009 : 1,50,473) Ordinary Shares and 99,790 (as at March 31, 2009: 1,00,509) ‘A’ Ordinary
Shares are subject matter of various suits filed in the courts / forums by third parties for which final order is awaited and hence kept in
abeyance.
2 Secured Loans :
(i) Nature of Security (on loans including interest accrued thereon) :
(a) Rated, Listed, Secured, Credit Enhanced, 2% Coupon, Premium Redemption Non-Convertible Debentures are secured by a second
charge in favour of Vijaya Bank , Debenture Trustee and first ranking parri passu charge in favour of State Bank of India as Security
trustee on behalf of the Guarantors, by way of English mortgage of the Company’s lands, freehold and leasehold, together with all
buildings, constructions and immovable and movable properties situated at Chinchwad, Pimpri, Chikhali and Maval in Pune District
and plant and machinery and other movable assets situated at Pantnagar in the State of Uttarakhand.
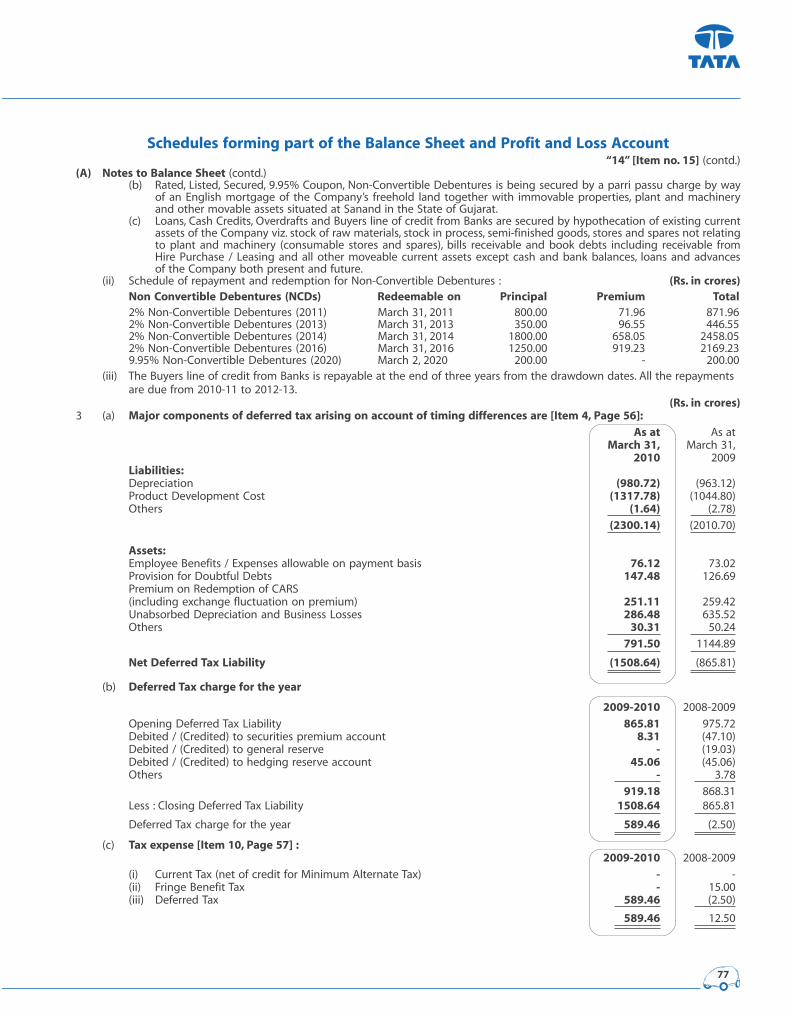
77
Schedules forming part of the Balance Sheet and Profit and Loss Account“14” [Item no. 15] (contd.)
(A) Notes to Balance Sheet (contd.)
(b) Rated, Listed, Secured, 9.95% Coupon, Non-Convertible Debentures is being secured by a parri passu charge by way
of an English mortgage of the Company’s freehold land together with immovable properties, plant and machinery
and other movable assets situated at Sanand in the State of Gujarat.
(c) Loans, Cash Credits, Overdrafts and Buyers line of credit from Banks are secured by hypothecation of existing current
assets of the Company viz. stock of raw materials, stock in process, semi-finished goods, stores and spares not relating
to plant and machinery (consumable stores and spares), bills receivable and book debts including receivable from
Hire Purchase / Leasing and all other moveable current assets except cash and bank balances, loans and advances
of the Company both present and future.
(ii) Schedule of repayment and redemption for Non-Convertible Debentures : (Rs. in crores)Non Convertible Debentures (NCDs) Redeemable on Principal Premium Total2% Non-Convertible Debentures (2011) March 31, 2011 800.00 71.96 871.96
2% Non-Convertible Debentures (2013) March 31, 2013 350.00 96.55 446.55
2% Non-Convertible Debentures (2014) March 31, 2014 1800.00 658.05 2458.05
2% Non-Convertible Debentures (2016) March 31, 2016 1250.00 919.23 2169.23
9.95% Non-Convertible Debentures (2020) March 2, 2020 200.00 - 200.00
(iii) The Buyers line of credit from Banks is repayable at the end of three years from the drawdown dates. All the repayments
are due from 2010-11 to 2012-13.
(Rs. in crores)3 (a) Major components of deferred tax arising on account of timing differences are [Item 4, Page 56]:
As at As at
March 31, March 31,
2010 2009
Liabilities:Depreciation (980.72) (963.12)
Product Development Cost (1317.78) (1044.80)
Others (1.64) (2.78)
(2300.14) (2010.70)
Assets:Employee Benefits / Expenses allowable on payment basis 76.12 73.02
Provision for Doubtful Debts 147.48 126.69
Premium on Redemption of CARS
(including exchange fluctuation on premium) 251.11 259.42
Unabsorbed Depreciation and Business Losses 286.48 635.52
Others 30.31 50.24
791.50 1144.89
Net Deferred Tax Liability (1508.64) (865.81)
(b) Deferred Tax charge for the year
2009-2010 2008-2009
Opening Deferred Tax Liability 865.81 975.72
Debited / (Credited) to securities premium account 8.31 (47.10)
Debited / (Credited) to general reserve - (19.03)
Debited / (Credited) to hedging reserve account 45.06 (45.06)
Others - 3.78
919.18 868.31
Less : Closing Deferred Tax Liability 1508.64 865.81
Deferred Tax charge for the year 589.46 (2.50)
(c) Tax expense [Item 10, Page 57] :2009-2010 2008-2009
(i) Current Tax (net of credit for Minimum Alternate Tax) - -
(ii) Fringe Benefit Tax - 15.00
(iii) Deferred Tax 589.46 (2.50)
589.46 12.50
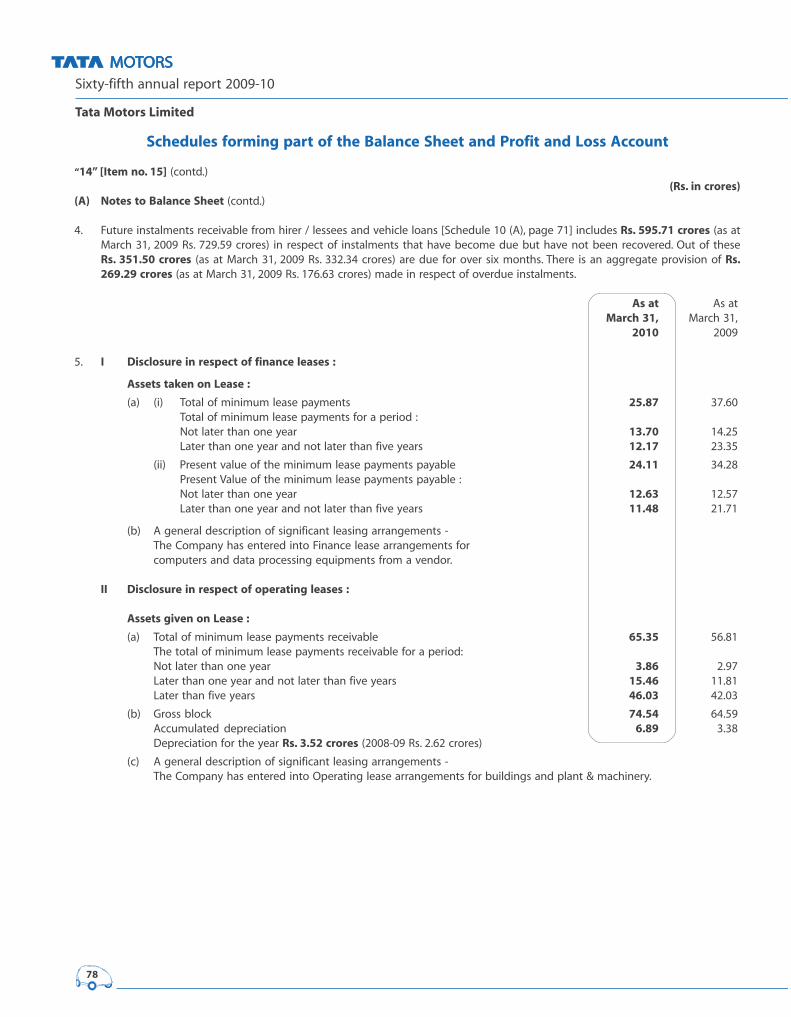
Sixty-fifth annual report 2009-10
Tata Motors Limited
78
Schedules forming part of the Balance Sheet and Profit and Loss Account
“14” [Item no. 15] (contd.)
(Rs. in crores)(A) Notes to Balance Sheet (contd.)
4. Future instalments receivable from hirer / lessees and vehicle loans [Schedule 10 (A), page 71] includes Rs. 595.71 crores (as at
March 31, 2009 Rs. 729.59 crores) in respect of instalments that have become due but have not been recovered. Out of these
Rs. 351.50 crores (as at March 31, 2009 Rs. 332.34 crores) are due for over six months. There is an aggregate provision of Rs.269.29 crores (as at March 31, 2009 Rs. 176.63 crores) made in respect of overdue instalments.
As at As at
March 31, March 31,
2010 2009
5. I Disclosure in respect of finance leases :
Assets taken on Lease :
(a) (i) Total of minimum lease payments 25.87 37.60
Total of minimum lease payments for a period :
Not later than one year 13.70 14.25
Later than one year and not later than five years 12.17 23.35
(ii) Present value of the minimum lease payments payable 24.11 34.28
Present Value of the minimum lease payments payable :
Not later than one year 12.63 12.57
Later than one year and not later than five years 11.48 21.71
(b) A general description of significant leasing arrangements -
The Company has entered into Finance lease arrangements for
computers and data processing equipments from a vendor.
II Disclosure in respect of operating leases :
Assets given on Lease :
(a) Total of minimum lease payments receivable 65.35 56.81
The total of minimum lease payments receivable for a period:
Not later than one year 3.86 2.97
Later than one year and not later than five years 15.46 11.81
Later than five years 46.03 42.03
(b) Gross block 74.54 64.59
Accumulated depreciation 6.89 3.38
Depreciation for the year Rs. 3.52 crores (2008-09 Rs. 2.62 crores)
(c) A general description of significant leasing arrangements -
The Company has entered into Operating lease arrangements for buildings and plant & machinery.
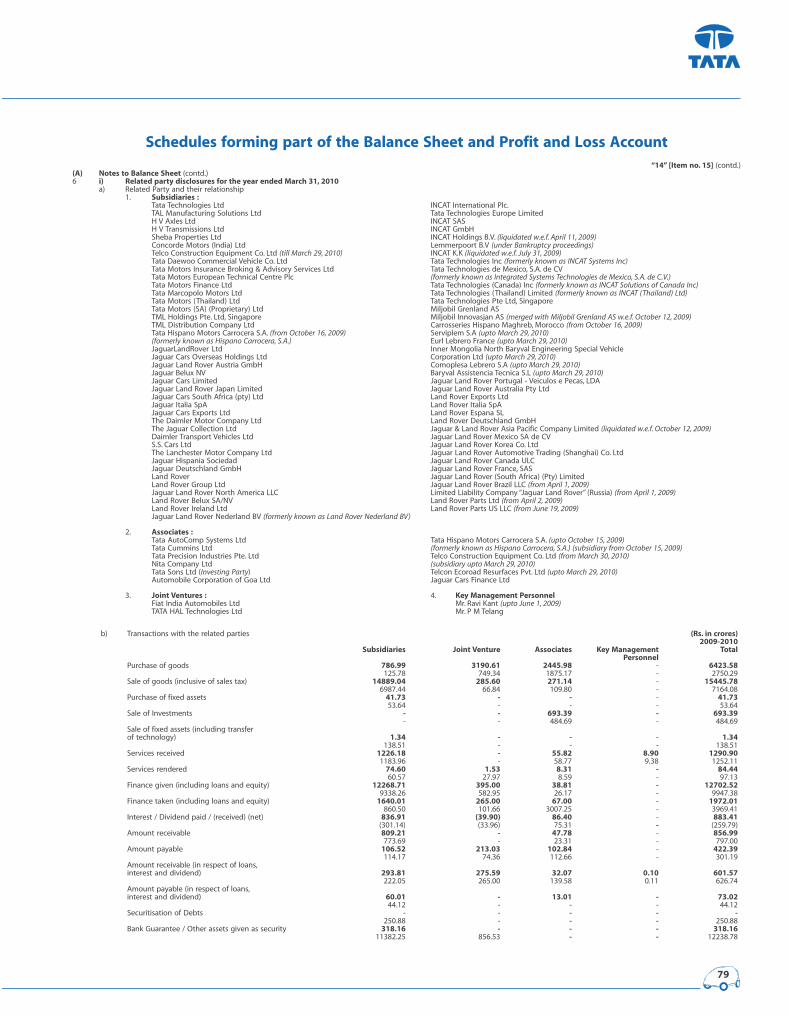
79
Schedules forming part of the Balance Sheet and Profit and Loss Account“14” [Item no. 15] (contd.)
(A) Notes to Balance Sheet (contd.)
6 i) Related party disclosures for the year ended March 31, 2010a) Related Party and their relationship
1. Subsidiaries :Tata Technologies Ltd INCAT International Plc.
TAL Manufacturing Solutions Ltd Tata Technologies Europe Limited
H V Axles Ltd INCAT SAS
H V Transmissions Ltd INCAT GmbH
Sheba Properties Ltd INCAT Holdings B.V. (liquidated w.e.f. April 11, 2009)Concorde Motors (India) Ltd Lemmerpoort B.V (under Bankruptcy proceedings)Telco Construction Equipment Co. Ltd (till March 29, 2010) INCAT K.K (liquidated w.e.f. July 31, 2009)Tata Daewoo Commercial Vehicle Co. Ltd Tata Technologies Inc (formerly known as INCAT Systems Inc)Tata Motors Insurance Broking & Advisory Services Ltd Tata Technologies de Mexico, S.A. de CV
Tata Motors European Technical Centre Plc (formerly known as Integrated Systems Technologies de Mexico, S.A. de C.V.)Tata Motors Finance Ltd Tata Technologies (Canada) Inc (formerly known as INCAT Solutions of Canada Inc)Tata Marcopolo Motors Ltd Tata Technologies (Thailand) Limited (formerly known as INCAT (Thailand) Ltd)Tata Motors (Thailand) Ltd Tata Technologies Pte Ltd, Singapore
Tata Motors (SA) (Proprietary) Ltd Miljobil Grenland AS
TML Holdings Pte. Ltd, Singapore Miljobil Innovasjan AS (merged with Miljobil Grenland AS w.e.f. October 12, 2009)TML Distribution Company Ltd Carrosseries Hispano Maghreb, Morocco (from October 16, 2009)Tata Hispano Motors Carrocera S.A. (from October 16, 2009) Serviplem S.A (upto March 29, 2010)(formerly known as Hispano Carrocera, S.A.) Eurl Lebrero France (upto March 29, 2010)JaguarLandRover Ltd Inner Mongolia North Baryval Engineering Special Vehicle
Jaguar Cars Overseas Holdings Ltd Corporation Ltd (upto March 29, 2010)Jaguar Land Rover Austria GmbH Comoplesa Lebrero S.A (upto March 29, 2010)Jaguar Belux NV Baryval Assistencia Tecnica S.L (upto March 29, 2010)Jaguar Cars Limited Jaguar Land Rover Portugal - Veiculos e Pecas, LDA
Jaguar Land Rover Japan Limited Jaguar Land Rover Australia Pty Ltd
Jaguar Cars South Africa (pty) Ltd Land Rover Exports Ltd
Jaguar Italia SpA Land Rover Italia SpA
Jaguar Cars Exports Ltd Land Rover Espana SL
The Daimler Motor Company Ltd Land Rover Deutschland GmbH
The Jaguar Collection Ltd Jaguar & Land Rover Asia Pacific Company Limited (liquidated w.e.f. October 12, 2009)Daimler Transport Vehicles Ltd Jaguar Land Rover Mexico SA de CV
S.S. Cars Ltd Jaguar Land Rover Korea Co. Ltd
The Lanchester Motor Company Ltd Jaguar Land Rover Automotive Trading (Shanghai) Co. Ltd
Jaguar Hispania Sociedad Jaguar Land Rover Canada ULC
Jaguar Deutschland GmbH Jaguar Land Rover France, SAS
Land Rover Jaguar Land Rover (South Africa) (Pty) Limited
Land Rover Group Ltd Jaguar Land Rover Brazil LLC (from April 1, 2009)Jaguar Land Rover North America LLC Limited Liability Company “Jaguar Land Rover” (Russia) (from April 1, 2009)Land Rover Belux SA/NV Land Rover Parts Ltd (from April 2, 2009)Land Rover Ireland Ltd Land Rover Parts US LLC (from June 19, 2009)Jaguar Land Rover Nederland BV (formerly known as Land Rover Nederland BV)
2. Associates :Tata AutoComp Systems Ltd Tata Hispano Motors Carrocera S.A. (upto October 15, 2009)Tata Cummins Ltd (formerly known as Hispano Carrocera, S.A.) (subsidiary from October 15, 2009)Tata Precision Industries Pte. Ltd Telco Construction Equipment Co. Ltd (from March 30, 2010)Nita Company Ltd (subsidiary upto March 29, 2010)Tata Sons Ltd (Investing Party) Telcon Ecoroad Resurfaces Pvt. Ltd (upto March 29, 2010)Automobile Corporation of Goa Ltd Jaguar Cars Finance Ltd
3. Joint Ventures : 4. Key Management PersonnelFiat India Automobiles Ltd Mr. Ravi Kant (upto June 1, 2009)TATA HAL Technologies Ltd Mr. P M Telang
b) Transactions with the related parties (Rs. in crores)2009-2010
Subsidiaries Joint Venture Associates Key Management TotalPersonnel
Purchase of goods 786.99 3190.61 2445.98 - 6423.58125.78 749.34 1875.17 - 2750.29
Sale of goods (inclusive of sales tax) 14889.04 285.60 271.14 - 15445.786987.44 66.84 109.80 - 7164.08
Purchase of fixed assets 41.73 - - - 41.7353.64 - - - 53.64
Sale of Investments - - 693.39 - 693.39- - 484.69 - 484.69
Sale of fixed assets (including transfer
of technology) 1.34 - - - 1.34138.51 - - - 138.51
Services received 1226.18 - 55.82 8.90 1290.901183.96 - 58.77 9.38 1252.11
Services rendered 74.60 1.53 8.31 - 84.4460.57 27.97 8.59 - 97.13
Finance given (including loans and equity) 12268.71 395.00 38.81 - 12702.529338.26 582.95 26.17 - 9947.38
Finance taken (including loans and equity) 1640.01 265.00 67.00 - 1972.01860.50 101.66 3007.25 - 3969.41
Interest / Dividend paid / (received) (net) 836.91 (39.90) 86.40 - 883.41(301.14) (33.96) 75.31 - (259.79)
Amount receivable 809.21 - 47.78 - 856.99773.69 - 23.31 - 797.00
Amount payable 106.52 213.03 102.84 - 422.39114.17 74.36 112.66 - 301.19
Amount receivable (in respect of loans,
interest and dividend) 293.81 275.59 32.07 0.10 601.57222.05 265.00 139.58 0.11 626.74
Amount payable (in respect of loans,
interest and dividend) 60.01 - 13.01 - 73.0244.12 - - - 44.12
Securitisation of Debts - - - - -250.88 - - - 250.88
Bank Guarantee / Other assets given as security 318.16 - - - 318.1611382.25 856.53 - - 12238.78
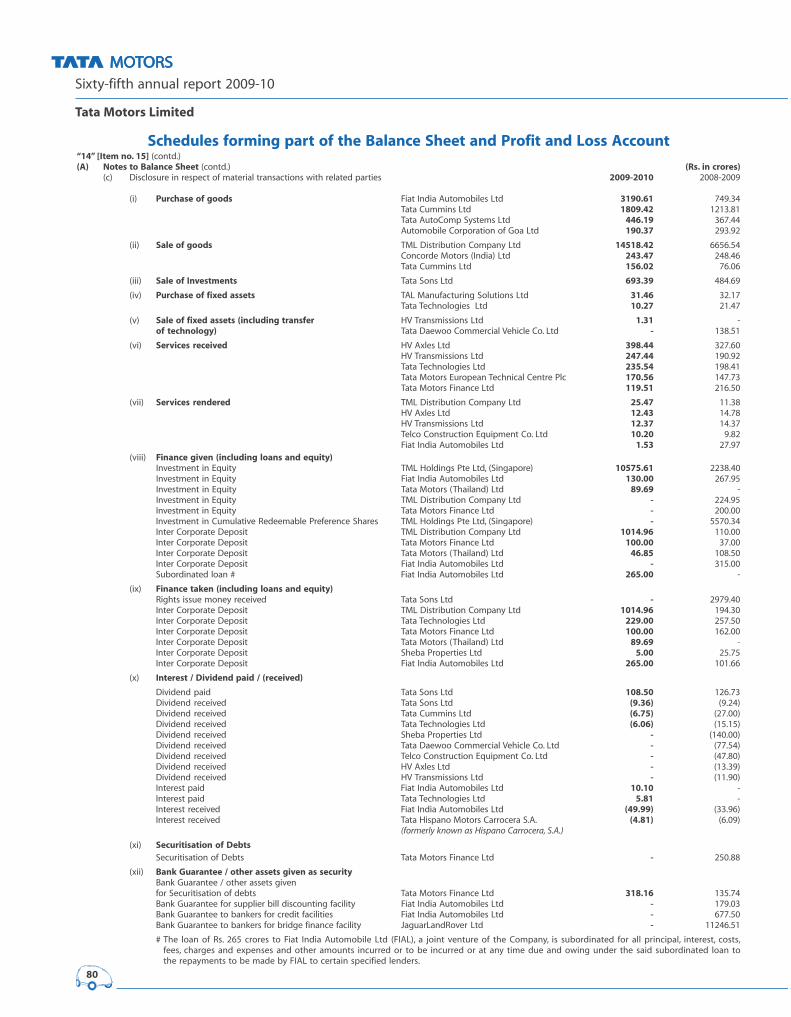
Sixty-fifth annual report 2009-10
Tata Motors Limited
80
Schedules forming part of the Balance Sheet and Profit and Loss Account“14” [Item no. 15] (contd.)
(A) Notes to Balance Sheet (contd.) (Rs. in crores)(c) Disclosure in respect of material transactions with related parties 2009-2010 2008-2009
(i) Purchase of goods Fiat India Automobiles Ltd 3190.61 749.34
Tata Cummins Ltd 1809.42 1213.81
Tata AutoComp Systems Ltd 446.19 367.44
Automobile Corporation of Goa Ltd 190.37 293.92
(ii) Sale of goods TML Distribution Company Ltd 14518.42 6656.54
Concorde Motors (India) Ltd 243.47 248.46
Tata Cummins Ltd 156.02 76.06
(iii) Sale of Investments Tata Sons Ltd 693.39 484.69
(iv) Purchase of fixed assets TAL Manufacturing Solutions Ltd 31.46 32.17
Tata Technologies Ltd 10.27 21.47
(v) Sale of fixed assets (including transfer HV Transmissions Ltd 1.31 -
of technology) Tata Daewoo Commercial Vehicle Co. Ltd - 138.51
(vi) Services received HV Axles Ltd 398.44 327.60
HV Transmissions Ltd 247.44 190.92
Tata Technologies Ltd 235.54 198.41
Tata Motors European Technical Centre Plc 170.56 147.73
Tata Motors Finance Ltd 119.51 216.50
(vii) Services rendered TML Distribution Company Ltd 25.47 11.38
HV Axles Ltd 12.43 14.78
HV Transmissions Ltd 12.37 14.37
Telco Construction Equipment Co. Ltd 10.20 9.82
Fiat India Automobiles Ltd 1.53 27.97
(viii) Finance given (including loans and equity)Investment in Equity TML Holdings Pte Ltd, (Singapore) 10575.61 2238.40
Investment in Equity Fiat India Automobiles Ltd 130.00 267.95
Investment in Equity Tata Motors (Thailand) Ltd 89.69 -
Investment in Equity TML Distribution Company Ltd - 224.95
Investment in Equity Tata Motors Finance Ltd - 200.00
Investment in Cumulative Redeemable Preference Shares TML Holdings Pte Ltd, (Singapore) - 5570.34
Inter Corporate Deposit TML Distribution Company Ltd 1014.96 110.00
Inter Corporate Deposit Tata Motors Finance Ltd 100.00 37.00
Inter Corporate Deposit Tata Motors (Thailand) Ltd 46.85 108.50
Inter Corporate Deposit Fiat India Automobiles Ltd - 315.00
Subordinated loan # Fiat India Automobiles Ltd 265.00 -
(ix) Finance taken (including loans and equity)Rights issue money received Tata Sons Ltd - 2979.40
Inter Corporate Deposit TML Distribution Company Ltd 1014.96 194.30
Inter Corporate Deposit Tata Technologies Ltd 229.00 257.50
Inter Corporate Deposit Tata Motors Finance Ltd 100.00 162.00
Inter Corporate Deposit Tata Motors (Thailand) Ltd 89.69 -
Inter Corporate Deposit Sheba Properties Ltd 5.00 25.75
Inter Corporate Deposit Fiat India Automobiles Ltd 265.00 101.66
(x) Interest / Dividend paid / (received)
Dividend paid Tata Sons Ltd 108.50 126.73
Dividend received Tata Sons Ltd (9.36) (9.24)
Dividend received Tata Cummins Ltd (6.75) (27.00)
Dividend received Tata Technologies Ltd (6.06) (15.15)
Dividend received Sheba Properties Ltd - (140.00)
Dividend received Tata Daewoo Commercial Vehicle Co. Ltd - (77.54)
Dividend received Telco Construction Equipment Co. Ltd - (47.80)
Dividend received HV Axles Ltd - (13.39)
Dividend received HV Transmissions Ltd - (11.90)
Interest paid Fiat India Automobiles Ltd 10.10 -
Interest paid Tata Technologies Ltd 5.81 -
Interest received Fiat India Automobiles Ltd (49.99) (33.96)
Interest received Tata Hispano Motors Carrocera S.A. (4.81) (6.09)
(formerly known as Hispano Carrocera, S.A.)
(xi) Securitisation of DebtsSecuritisation of Debts Tata Motors Finance Ltd - 250.88
(xii) Bank Guarantee / other assets given as securityBank Guarantee / other assets given
for Securitisation of debts Tata Motors Finance Ltd 318.16 135.74
Bank Guarantee for supplier bill discounting facility Fiat India Automobiles Ltd - 179.03
Bank Guarantee to bankers for credit facilities Fiat India Automobiles Ltd - 677.50
Bank Guarantee to bankers for bridge finance facility JaguarLandRover Ltd - 11246.51
# The loan of Rs. 265 crores to Fiat India Automobile Ltd (FIAL), a joint venture of the Company, is subordinated for all principal, interest, costs,
fees, charges and expenses and other amounts incurred or to be incurred or at any time due and owing under the said subordinated loan to
the repayments to be made by FIAL to certain specified lenders.

81
Schedules forming part of the Balance Sheet and Profit and Loss Account“14” [Item no. 15] (contd.)
(A) Notes to Balance Sheet (contd.)
ii) Disclosures required by Clause 32 of the Listing Agreement
Amount of loans / advances in nature of loans outstanding from Subsidiaries and Associates during 2009-2010
Outstanding as at Maximum amount Investment Direct Investment inName of the Company March 31, 2010 outstanding in shares of shares of
during the year the Company subsidiariesof the Company
Rs. crores Rs. crores No. of Shares No. of Sharesa) Subsidiaries
HV Transmissions Ltd - 13.50 - -
6.50 34.50 - -
Sheba Properties Ltd - 5.00 - -- - - 2,50,000
TAL Manufacturing Solutions Ltd 5.50 9.50 - -
6.50 23.00 - -
Concorde Motors (India) Ltd 31.00 35.00 - -
30.00 30.00 - -
HV Axles Ltd - 9.00 - -
- 4.80 - -
Tata Motors European Technical Centre Plc., UK 32.59 38.06 - 9,498[Note (i) below] 34.73 36.87 - 9,498
Tata Marcopolo Motors Ltd 10.00 21.00 - -
10.00 25.00 - -
Tata Motors (Thailand) Ltd 60.68 106.95 - -
106.95 108.50 - -
Tata Motors Finance Ltd - 100.00 - -- 17.00 - -
TML Distribution Company Ltd - 200.00 - -
- 80.00 - -
Telco Construction Equipment Co. Ltd - - - -[Note (ii) below] (Associate from current year) - 40.00 - 93,990
Tata Hispano Motors Carrocera S.A. 147.73 147.73 - 19,996(formerly known as Hispano Carrocera, S.A.) - - - -
(Subsidiary company from current year)
b) AssociatesTata Precision Industries Pte. Ltd. (Singapore) 8.02 8.48 - -
8.34 8.44 - -
Tata Hispano Motors Carrocera S.A. - - - -
(formerly known as Hispano Carrocera, S.A.) 101.26 102.70 - -
(Subsidiary company from current year)Tata AutoComp Systems Ltd 23.83 23.83 - -
23.83 50.00 - -
c) Joint Ventures :Fiat India Automobiles Ltd 265.00 265.00 - -
265.00 290.00 - -
Note :
(i) Shares in Miljobil Grenland AS
(ii) 63,990 shares in Serviplem S.A and 30,000 shares in Comoplesa Lebrero S.A
7. The Company has a joint venture with Fiat Group Automobiles S.p.A., Italy, Fiat India Automobiles Limited (FIAL), for manufacturing passenger cars, engines and
transmissions at Ranjangaon in India. The Company has an investment of Rs. 999.54 crores as at March 31, 2010, representing 50% shareholding in FIAL .
The proportionate share of assets and liabilities as at March 31, 2010 and income and expenditure for the year 2009-10 of FIAL are given below :
(Rs. in crores)As on As on
March 31, March 31,
2010 2009 2009-2010 2008-2009
(Unaudited) (Audited) (Unaudited) (Audited)
RESERVES AND SURPLUS INCOMEReserves and Surplus (484.31) (349.18) Sale of products and services 1614.85 401.43
Less : Excise duty (192.92) (53.57)
Other operating income 146.31 42.74
ASSETSNet Block (including CWIP) 1769.34 1644.35 1568.25 390.60
Investments (Rs. 50.00) - -
Current Assets 983.88 756.31 EXPENDITUREManufacturing and other expenses 1437.93 597.86
2753.22 2400.66 Expenditure transferred to capital
and other accounts - (28.97)
LIABILITIES Product Development Cost 0.48 0.33
Loan Funds 1337.90 755.18 Depreciation 140.79 59.49
Current Liabilities 1028.20 1278.09 Interest 124.18 65.56
Provisions 9.71 2.51 Tax expenses - 1.54
2375.81 2035.78 1703.38 695.81
Claims not acknowledged as debts 3.14 -Capital Commitments 50.01 156.93
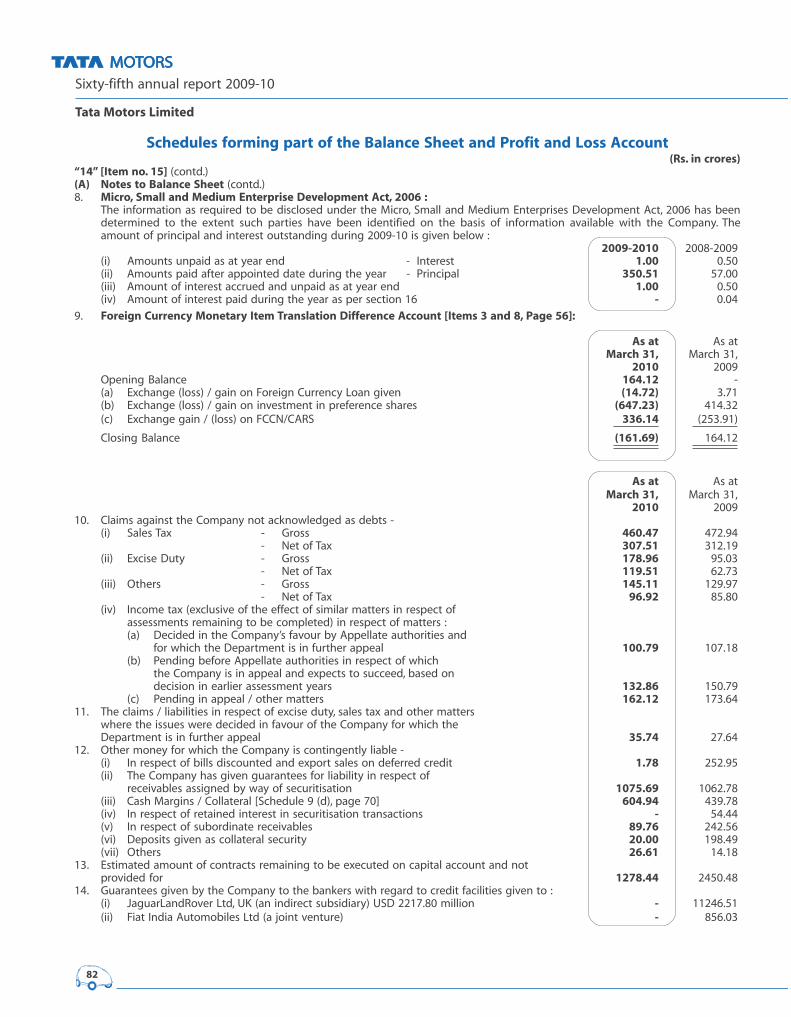
Sixty-fifth annual report 2009-10
Tata Motors Limited
82
Schedules forming part of the Balance Sheet and Profit and Loss Account(Rs. in crores)
“14” [Item no. 15] (contd.)
(A) Notes to Balance Sheet (contd.)
8. Micro, Small and Medium Enterprise Development Act, 2006 :The information as required to be disclosed under the Micro, Small and Medium Enterprises Development Act, 2006 has been
determined to the extent such parties have been identified on the basis of information available with the Company. The
amount of principal and interest outstanding during 2009-10 is given below :
2009-2010 2008-2009
(i) Amounts unpaid as at year end - Interest 1.00 0.50
(ii) Amounts paid after appointed date during the year - Principal 350.51 57.00
(iii) Amount of interest accrued and unpaid as at year end 1.00 0.50
(iv) Amount of interest paid during the year as per section 16 - 0.04
9. Foreign Currency Monetary Item Translation Difference Account [Items 3 and 8, Page 56]:
As at As at
March 31, March 31,
2010 2009
Opening Balance 164.12 -
(a) Exchange (loss) / gain on Foreign Currency Loan given (14.72) 3.71
(b) Exchange (loss) / gain on investment in preference shares (647.23) 414.32
(c) Exchange gain / (loss) on FCCN/CARS 336.14 (253.91)
Closing Balance (161.69) 164.12
As at As at
March 31, March 31,
2010 2009
10. Claims against the Company not acknowledged as debts -
(i) Sales Tax - Gross 460.47 472.94
- Net of Tax 307.51 312.19
(ii) Excise Duty - Gross 178.96 95.03
- Net of Tax 119.51 62.73
(iii) Others - Gross 145.11 129.97
- Net of Tax 96.92 85.80
(iv) Income tax (exclusive of the effect of similar matters in respect of
assessments remaining to be completed) in respect of matters :
(a) Decided in the Company’s favour by Appellate authorities and
for which the Department is in further appeal 100.79 107.18
(b) Pending before Appellate authorities in respect of which
the Company is in appeal and expects to succeed, based on
decision in earlier assessment years 132.86 150.79
(c) Pending in appeal / other matters 162.12 173.64
11. The claims / liabilities in respect of excise duty, sales tax and other matters
where the issues were decided in favour of the Company for which the
Department is in further appeal 35.74 27.64
12. Other money for which the Company is contingently liable -
(i) In respect of bills discounted and export sales on deferred credit 1.78 252.95
(ii) The Company has given guarantees for liability in respect of
receivables assigned by way of securitisation 1075.69 1062.78
(iii) Cash Margins / Collateral [Schedule 9 (d), page 70] 604.94 439.78
(iv) In respect of retained interest in securitisation transactions - 54.44
(v) In respect of subordinate receivables 89.76 242.56
(vi) Deposits given as collateral security 20.00 198.49
(vii) Others 26.61 14.18
13. Estimated amount of contracts remaining to be executed on capital account and not
provided for 1278.44 2450.48
14. Guarantees given by the Company to the bankers with regard to credit facilities given to :
(i) JaguarLandRover Ltd, UK (an indirect subsidiary) USD 2217.80 million - 11246.51
(ii) Fiat India Automobiles Ltd (a joint venture) - 856.03

83
Schedules forming part of the Balance Sheet and Profit and Loss Account“14” [Item no. 15] (contd.)
(Rs. in crores)
(B) Notes to Profit and Loss Account 2009-2010 2008-2009
(1) Purchase of products for sale etc. include [Also refer Schedule 14(E) and 15, page 88]:
(a) Spare parts and accessories for sale 1054.40 821.63
(b) Bodies and trailers for mounting on chassis 719.66 834.72
(c) Vehicles 52891 nos. (2008-09 : 12341 nos.) 2739.17 523.97
4513.23 2180.32
(2) The total expenditure incurred on Research and Development : 2009-2010 2008-2009
(a) Expenditure charged to profit and loss account 81.75 54.32
(b) Expenditure capitalised during the year 1089.22 1422.29
1170.97 1476.61
(3) (a) Auditors’ Remuneration (excluding service tax) : 2009-2010 2008-2009
Rupees Rupees
(i) Audit Fees 3,75,00,000 3,00,00,000
(ii) Audit Fees for financial statements as per IFRS / US GAAP
(including SOX certification) # 5,00,00,000 4,00,00,000
(iii) In other Capacities :
Company Law Matters 35,000 35,000
Tax Audit 37,50,000 37,50,000
Corporate Governance certification - 2,50,000
Taxation Matters * 11,26,500 5,96,062
(iv) Other Services @ 5,27,000 22,000
(v) Reimbursement of travelling and out-of-pocket expenses 4,60,889 -
(b) Cost Auditors’ Remuneration (excluding service tax) :
(i) Cost Audit Fees 10,00,000 10,00,000
(ii) Reimbursement of travelling and out-of-pocket expenses 36,700 35,800
Notes :
@ Excludes audit fees debited to Securities Premium Account related to :
(i) GDS and FCCN Issue 40,00,000 -
(ii) Rights issue - 65,00,000
# Includes amount paid for earlier years 5,00,00,000 4,00,00,000
* Includes remuneration for professional services rendered by firms of auditors in which
some of the partners of the statutory auditors firm are partners. - 50,062
(Rs. in crores)
(4) Interest and Discounting Charges [Item 7, page 57] : 2009-2010 2008-2009
(A) Interest :
(a) On Debentures and fixed loans 880.53 573.13
(b) Others . 113.01 183.51
993.54 756.64
Less : (i) Transferred to Capital account 237.28 262.20
(ii) Interest received on bank and other accounts [tax deducted
at source Rs. 5.00 crores (2008-09 Rs. 19.74 crores)] 142.39 137.22
613.87 357.22
(B) Discounting charges (net) 489.97 316.46
1103.84 673.68
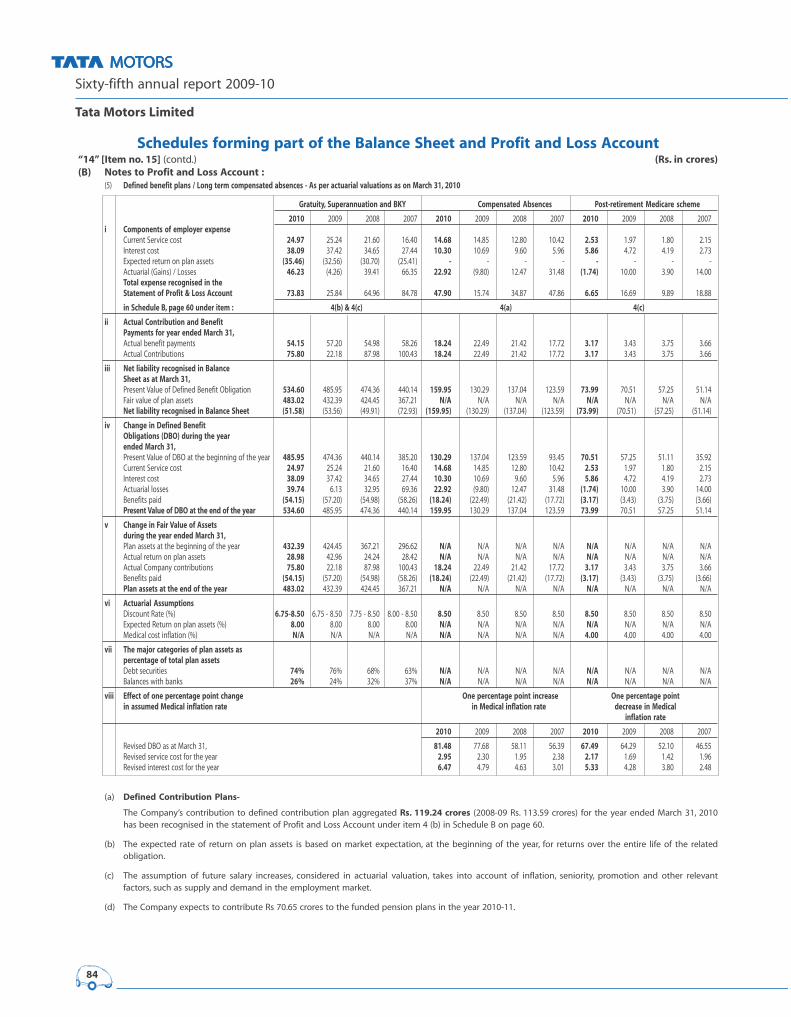
Sixty-fifth annual report 2009-10
Tata Motors Limited
84
Schedules forming part of the Balance Sheet and Profit and Loss Account“14” [Item no. 15] (contd.) (Rs. in crores)(B) Notes to Profit and Loss Account :
(5) Defined benefit plans / Long term compensated absences - As per actuarial valuations as on March 31, 2010
Gratuity, Superannuation and BKY Compensated Absences Post-retirement Medicare scheme
2010 2009 2008 2007 2010 2009 2008 2007 2010 2009 2008 2007
i Components of employer expenseCurrent Service cost 24.97 25.24 21.60 16.40 14.68 14.85 12.80 10.42 2.53 1.97 1.80 2.15
Interest cost 38.09 37.42 34.65 27.44 10.30 10.69 9.60 5.96 5.86 4.72 4.19 2.73
Expected return on plan assets (35.46) (32.56) (30.70) (25.41) - - - - - - - -
Actuarial (Gains) / Losses 46.23 (4.26) 39.41 66.35 22.92 (9.80) 12.47 31.48 (1.74) 10.00 3.90 14.00
Total expense recognised in theStatement of Profit & Loss Account 73.83 25.84 64.96 84.78 47.90 15.74 34.87 47.86 6.65 16.69 9.89 18.88
in Schedule B, page 60 under item : 4(b) & 4(c) 4(a) 4(c)
ii Actual Contribution and BenefitPayments for year ended March 31,Actual benefit payments 54.15 57.20 54.98 58.26 18.24 22.49 21.42 17.72 3.17 3.43 3.75 3.66
Actual Contributions 75.80 22.18 87.98 100.43 18.24 22.49 21.42 17.72 3.17 3.43 3.75 3.66
iii Net liability recognised in BalanceSheet as at March 31,Present Value of Defined Benefit Obligation 534.60 485.95 474.36 440.14 159.95 130.29 137.04 123.59 73.99 70.51 57.25 51.14
Fair value of plan assets 483.02 432.39 424.45 367.21 N/A N/A N/A N/A N/A N/A N/A N/A
Net liability recognised in Balance Sheet (51.58) (53.56) (49.91) (72.93) (159.95) (130.29) (137.04) (123.59) (73.99) (70.51) (57.25) (51.14)
iv Change in Defined BenefitObligations (DBO) during the yearended March 31,Present Value of DBO at the beginning of the year 485.95 474.36 440.14 385.20 130.29 137.04 123.59 93.45 70.51 57.25 51.11 35.92
Current Service cost 24.97 25.24 21.60 16.40 14.68 14.85 12.80 10.42 2.53 1.97 1.80 2.15
Interest cost 38.09 37.42 34.65 27.44 10.30 10.69 9.60 5.96 5.86 4.72 4.19 2.73
Actuarial losses 39.74 6.13 32.95 69.36 22.92 (9.80) 12.47 31.48 (1.74) 10.00 3.90 14.00
Benefits paid (54.15) (57.20) (54.98) (58.26) (18.24) (22.49) (21.42) (17.72) (3.17) (3.43) (3.75) (3.66)
Present Value of DBO at the end of the year 534.60 485.95 474.36 440.14 159.95 130.29 137.04 123.59 73.99 70.51 57.25 51.14
v Change in Fair Value of Assetsduring the year ended March 31,Plan assets at the beginning of the year 432.39 424.45 367.21 296.62 N/A N/A N/A N/A N/A N/A N/A N/A
Actual return on plan assets 28.98 42.96 24.24 28.42 N/A N/A N/A N/A N/A N/A N/A N/A
Actual Company contributions 75.80 22.18 87.98 100.43 18.24 22.49 21.42 17.72 3.17 3.43 3.75 3.66
Benefits paid (54.15) (57.20) (54.98) (58.26) (18.24) (22.49) (21.42) (17.72) (3.17) (3.43) (3.75) (3.66)
Plan assets at the end of the year 483.02 432.39 424.45 367.21 N/A N/A N/A N/A N/A N/A N/A N/A
vi Actuarial AssumptionsDiscount Rate (%) 6.75-8.50 6.75 - 8.50 7.75 - 8.50 8.00 - 8.50 8.50 8.50 8.50 8.50 8.50 8.50 8.50 8.50
Expected Return on plan assets (%) 8.00 8.00 8.00 8.00 N/A N/A N/A N/A N/A N/A N/A N/A
Medical cost inflation (%) N/A N/A N/A N/A N/A N/A N/A N/A 4.00 4.00 4.00 4.00
vii The major categories of plan assets aspercentage of total plan assetsDebt securities 74% 76% 68% 63% N/A N/A N/A N/A N/A N/A N/A N/A
Balances with banks 26% 24% 32% 37% N/A N/A N/A N/A N/A N/A N/A N/A
viii Effect of one percentage point change One percentage point increase One percentage pointin assumed Medical inflation rate in Medical inflation rate decrease in Medical
inflation rate
2010 2009 2008 2007 2010 2009 2008 2007
Revised DBO as at March 31, 81.48 77.68 58.11 56.39 67.49 64.29 52.10 46.55
Revised service cost for the year 2.95 2.30 1.95 2.38 2.17 1.69 1.42 1.96
Revised interest cost for the year 6.47 4.79 4.63 3.01 5.33 4.28 3.80 2.48
(a) Defined Contribution Plans-
The Company’s contribution to defined contribution plan aggregated Rs. 119.24 crores (2008-09 Rs. 113.59 crores) for the year ended March 31, 2010
has been recognised in the statement of Profit and Loss Account under item 4 (b) in Schedule B on page 60.
(b) The expected rate of return on plan assets is based on market expectation, at the beginning of the year, for returns over the entire life of the related
obligation.
(c) The assumption of future salary increases, considered in actuarial valuation, takes into account of inflation, seniority, promotion and other relevant
factors, such as supply and demand in the employment market.
(d) The Company expects to contribute Rs 70.65 crores to the funded pension plans in the year 2010-11.
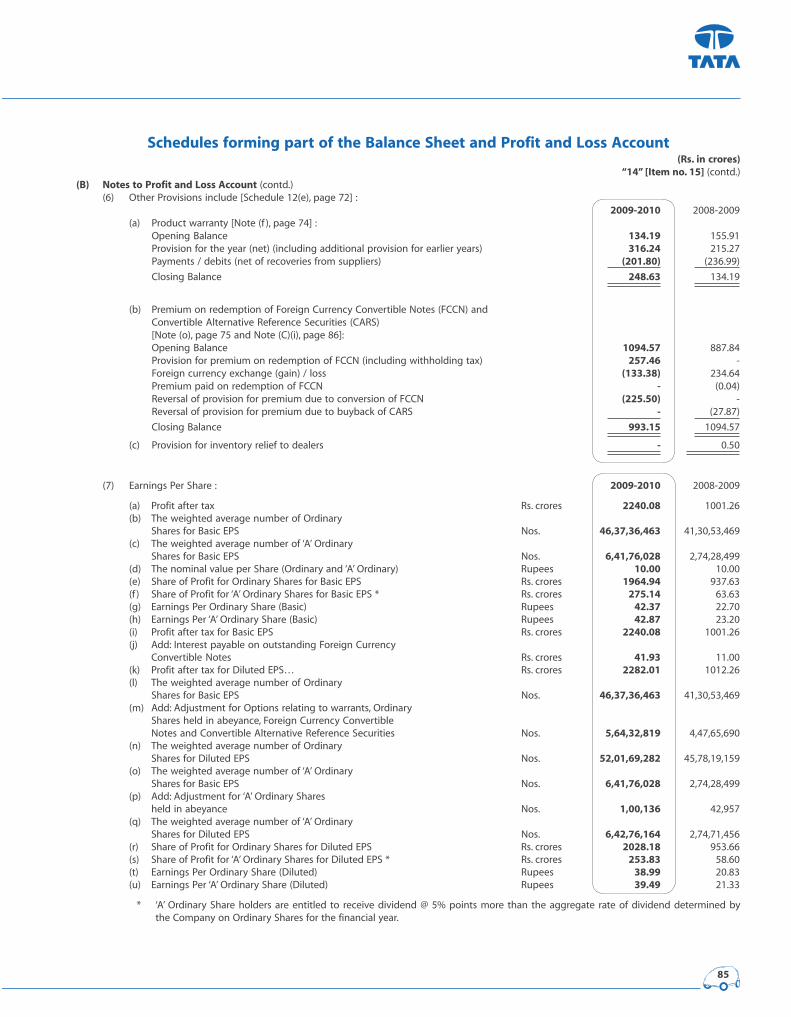
85
Schedules forming part of the Balance Sheet and Profit and Loss Account(Rs. in crores)
“14” [Item no. 15] (contd.)
(B) Notes to Profit and Loss Account (contd.)
(6) Other Provisions include [Schedule 12(e), page 72] :
2009-2010 2008-2009
(a) Product warranty [Note (f ), page 74] :
Opening Balance 134.19 155.91
Provision for the year (net) (including additional provision for earlier years) 316.24 215.27
Payments / debits (net of recoveries from suppliers) (201.80) (236.99)
Closing Balance 248.63 134.19
(b) Premium on redemption of Foreign Currency Convertible Notes (FCCN) and
Convertible Alternative Reference Securities (CARS)
[Note (o), page 75 and Note (C)(i), page 86]:
Opening Balance 1094.57 887.84
Provision for premium on redemption of FCCN (including withholding tax) 257.46 -
Foreign currency exchange (gain) / loss (133.38) 234.64
Premium paid on redemption of FCCN - (0.04)
Reversal of provision for premium due to conversion of FCCN (225.50) -
Reversal of provision for premium due to buyback of CARS - (27.87)
Closing Balance 993.15 1094.57
(c) Provision for inventory relief to dealers - 0.50
(7) Earnings Per Share : 2009-2010 2008-2009
(a) Profit after tax Rs. crores 2240.08 1001.26
(b) The weighted average number of Ordinary
Shares for Basic EPS Nos. 46,37,36,463 41,30,53,469
(c) The weighted average number of ‘A’ Ordinary
Shares for Basic EPS Nos. 6,41,76,028 2,74,28,499
(d) The nominal value per Share (Ordinary and ‘A’ Ordinary) Rupees 10.00 10.00
(e) Share of Profit for Ordinary Shares for Basic EPS Rs. crores 1964.94 937.63
(f ) Share of Profit for ‘A’ Ordinary Shares for Basic EPS * Rs. crores 275.14 63.63
(g) Earnings Per Ordinary Share (Basic) Rupees 42.37 22.70
(h) Earnings Per ‘A’ Ordinary Share (Basic) Rupees 42.87 23.20
(i) Profit after tax for Basic EPS Rs. crores 2240.08 1001.26
(j) Add: Interest payable on outstanding Foreign Currency
Convertible Notes Rs. crores 41.93 11.00
(k) Profit after tax for Diluted EPS… Rs. crores 2282.01 1012.26
(l) The weighted average number of Ordinary
Shares for Basic EPS Nos. 46,37,36,463 41,30,53,469
(m) Add: Adjustment for Options relating to warrants, Ordinary
Shares held in abeyance, Foreign Currency Convertible
Notes and Convertible Alternative Reference Securities Nos. 5,64,32,819 4,47,65,690
(n) The weighted average number of Ordinary
Shares for Diluted EPS Nos. 52,01,69,282 45,78,19,159
(o) The weighted average number of ‘A’ Ordinary
Shares for Basic EPS Nos. 6,41,76,028 2,74,28,499
(p) Add: Adjustment for ‘A’ Ordinary Shares
held in abeyance Nos. 1,00,136 42,957
(q) The weighted average number of ‘A’ Ordinary
Shares for Diluted EPS Nos. 6,42,76,164 2,74,71,456
(r) Share of Profit for Ordinary Shares for Diluted EPS Rs. crores 2028.18 953.66
(s) Share of Profit for ‘A’ Ordinary Shares for Diluted EPS * Rs. crores 253.83 58.60
(t) Earnings Per Ordinary Share (Diluted) Rupees 38.99 20.83
(u) Earnings Per ‘A’ Ordinary Share (Diluted) Rupees 39.49 21.33
* ‘A’ Ordinary Share holders are entitled to receive dividend @ 5% points more than the aggregate rate of dividend determined by
the Company on Ordinary Shares for the financial year.

Sixty-fifth annual report 2009-10
Tata Motors Limited
86
Schedules forming part of the Balance Sheet and Profit and Loss Account
“14” [Item no. 15] (contd.)
(C) (i) Issue of Foreign Currency Convertible Notes (FCCN) and Convertible Alternative Reference Securities (CARS) :
The Company issued the FCCN and CARS which are convertible into Ordinary Shares or ADRs. Additionally, CARS can be converted into
Qualifying Securities* in case there has been a Qualifying Issue as per the terms of Issue. The particulars, terms of issue and the status of
conversion as at March 31, 2010 are given below :
Issue 0% FCCN (due 2009) 1% FCCN (due 2011) 0% FCCN (due 2011) 0% CARS (due 2012) 4% FCCN (due 2014)
Issued on April 27, 2004 April 27, 2004 March 20, 2006 July 11, 2007 October 15, 2009
Issue Amount (in INR US $ 100 million US $ 300 million JP ¥ 11,760 million US $ 490 million US $ 375 million
at the time of the issue) (Rs. 438.50 crores) (Rs.1315.50 crores) (Rs.450.03 crores) (Rs. 1992.71 crores) (Rs. 1794.19 crores)
Face Value US $ 1000 US $ 1000 JP ¥ 10,000,000 US $ 100,000 US $ 100,000
Conversion Price per share Rs. 573.106 Rs. 780.400 Rs. 1001.39 Rs. 960.96 Rs. 623.88
at fixed exchange rate US $ 1 = Rs. 43.85 US $ 1 = Rs. 43.85 Re. 1 = JP ¥ 2.66 US $ 1 = Rs. 40.59 US $ 1 = Rs. 46.28
Reset Conversion Price Rs. 736.72 Rs. 945.34 Rs. 907.17
(Due to Rights Issue
and GDS Issue) NA US $ 1 = Rs. 43.85 Re. 1 = JP ¥ 2.66 US $ 1 = Rs. 40.59 NA
Exercise Period June 7, 2004 to June 7, 2004 to May 2, 2006 to October 11, 2011 November 25, 2009
March 28, 2009 March 28, 2011 February 19, 2011 to June 12, 2012 (for conversion into
shares or GDSs) and
October 15, 2010 (for
conversion into ADSs) to
October 9, 2014
Early redemption at the on or after April 27, 2005 any time (in whole but i) after March 20, 2009 i) after October 11, 2011 i) any time on or after
option of the Company (in whole but not in part) not in part) in the event but prior to February at our option (in October 15, 2012 (in
subject to certain of certain changes 8, 2011 (in whole or whole but not in whole but not in part) at
conditions affecting taxation in India in part) subject to part) our option
certain conditions
or or or
ii) any time (in whole ii) any time (in whole but ii) any time (in whole
but not in part) in the not in part) in the but not in part) in the
event of certain event of certain event of certain
changes affecting changes affecting changes affecting
taxation in India taxation in India taxation in India
Redeemable on April 27, 2009 April 27, 2011 March 21, 2011 July 12, 2012 October 16, 2014
Redemption percentage 95.111% 121.781% 99.253% 131.820% 108.505%
of the Principal Amount
Amount converted US $ 97.59 million US $ 229.64 million JP ¥ 10710 million Nil Nil
Aggregate conversion
into Shares / ADRs 74,66,867 1,88,16,152 78,27,114
Aggregate Notes Redeemed 2410 Nil Nil Nil Nil
Aggregate Notes Nil Nil 30 170 Nil
Bought Back
Notes Outstanding as at Nil 70,366 75 4,730 3,750
March 31, 2010
Aggregate amount of Nil 41,88,225 @ 2,98,258 @ 2,11,63,696 @ 2,78,17,850
shares that could be
issued on conversion of
outstanding notes
* Qualifying Securities holders will have no or differential voting rights in comparison to the existing shareholders and will have no rights to withdraw
the underlying Shares except upon certain conditions as per the terms of issue.
@ Increased due to Rights Issue and GDS Issue.
(ii) On March 23, 2010, the Company had offered to Non-U.S. Noteholders of outstanding 0% JPY 11,760 million (due 2011) and 1% USD 300 million (due 2011)
Convertible Notes, an option to convert their Notes into Ordinary Shares during a limited offer period. During this period, as per the terms of Invitation
Memorandum, Noteholders could opt to receive shares at enhanced conversion terms. Noteholders, who did not participate, would continue with all the
terms of their notes as applicable prior to this limited period offer. Noteholders representing 93.62% of the JPY Notes (i.e. JPY10,710 million) and 76.54% of
USD Notes (i.e. USD 229.63 million), outstanding prior to the offering, opted to convert their Notes into Ordinary Shares. As a result, the company has allotted
2,66,43,266 equity shares to the Noteholders, who exercised the option.
(iii) On June 2, 2008, the Company acquired from Ford Motor Company, Jaguar Land Rover businesses, for a consideration of US $ 2.5 billion (approx Rs. 10765.19
crores), in an all-cash transaction, through JaguarLandRover Ltd, a wholly owned subsidiary of TML Holdings Pte Ltd, Singapore, which is a 100% subsidiary of
the Company.
(iv) On March 30, 2010, the Company sold 20% stake in Telco Construction Equipment Company Limited (Telcon) to Hitachi Construction Machinery Co. Ltd for a
consideration of Rs. 1159.50 crores. Consequently the Company holds 39.75% stake in Telcon.
(v) On October 16, 2009, the Company has acquired 79% shares in Tata Hispano Motors Carrocera S.A. (formerly known as Hispano Carrocera, S.A.) by way of
exercise of the existing call option, through mutual agreement with the other share-holder, Investalia S. A., Spain, for a consideration of Euro 2 million
(Rs. 13.71 crores). Consequently, Tata Hispano Motors Carrocera S.A. has become a 100% subsidiary of the Company.
(vi) Previous year’s figures have been regrouped where necessary.
(vii) Current year figures are shown in bold print.
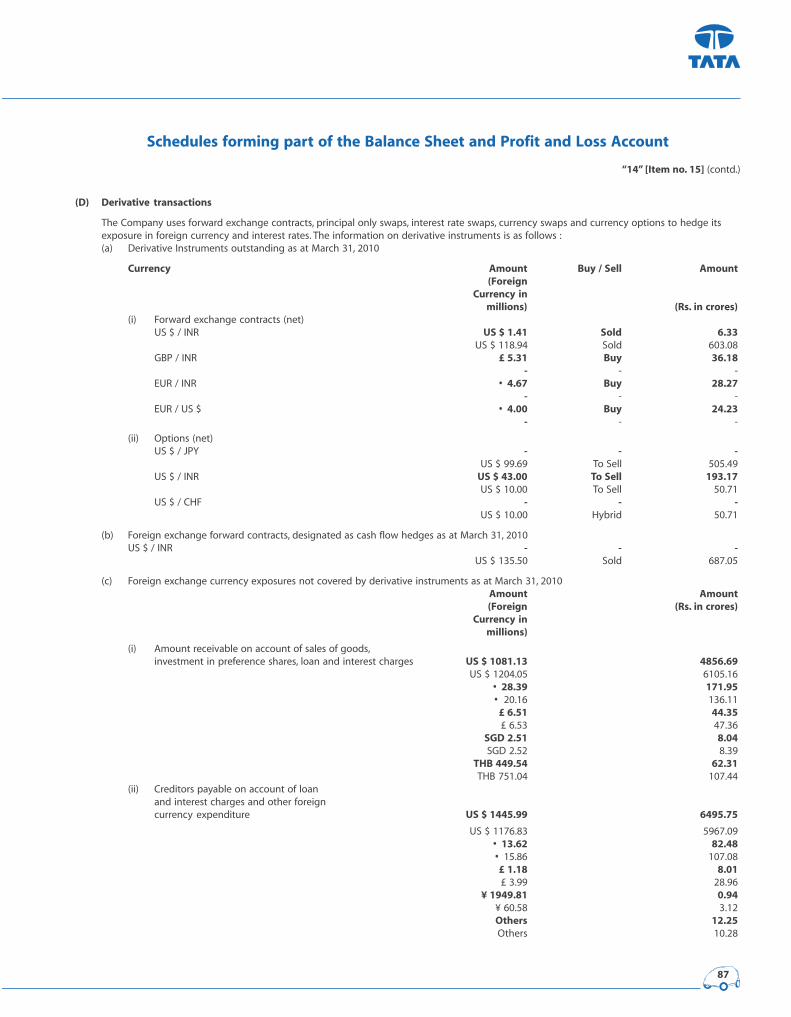
87
Schedules forming part of the Balance Sheet and Profit and Loss Account
“14” [Item no. 15] (contd.)
(D) Derivative transactions
The Company uses forward exchange contracts, principal only swaps, interest rate swaps, currency swaps and currency options to hedge its
exposure in foreign currency and interest rates. The information on derivative instruments is as follows :
(a) Derivative Instruments outstanding as at March 31, 2010
Currency Amount Buy / Sell Amount(Foreign
Currency inmillions) (Rs. in crores)
(i) Forward exchange contracts (net)
US $ / INR US $ 1.41 Sold 6.33US $ 118.94 Sold 603.08
GBP / INR £ 5.31 Buy 36.18- - -
EUR / INR • 4.67 Buy 28.27- - -
EUR / US $ • 4.00 Buy 24.23- - -
(ii) Options (net)
US $ / JPY - - -US $ 99.69 To Sell 505.49
US $ / INR US $ 43.00 To Sell 193.17US $ 10.00 To Sell 50.71
US $ / CHF - - -US $ 10.00 Hybrid 50.71
(b) Foreign exchange forward contracts, designated as cash flow hedges as at March 31, 2010
US $ / INR - - -US $ 135.50 Sold 687.05
(c) Foreign exchange currency exposures not covered by derivative instruments as at March 31, 2010
Amount Amount(Foreign (Rs. in crores)
Currency inmillions)
(i) Amount receivable on account of sales of goods,
investment in preference shares, loan and interest charges US $ 1081.13 4856.69US $ 1204.05 6105.16
• 28.39 171.95• 20.16 136.11
£ 6.51 44.35£ 6.53 47.36
SGD 2.51 8.04SGD 2.52 8.39
THB 449.54 62.31THB 751.04 107.44
(ii) Creditors payable on account of loan
and interest charges and other foreign
currency expenditure US $ 1445.99 6495.75
US $ 1176.83 5967.09
• 13.62 82.48• 15.86 107.08
£ 1.18 8.01£ 3.99 28.96
¥ 1949.81 0.94¥ 60.58 3.12
Others 12.25Others 10.28
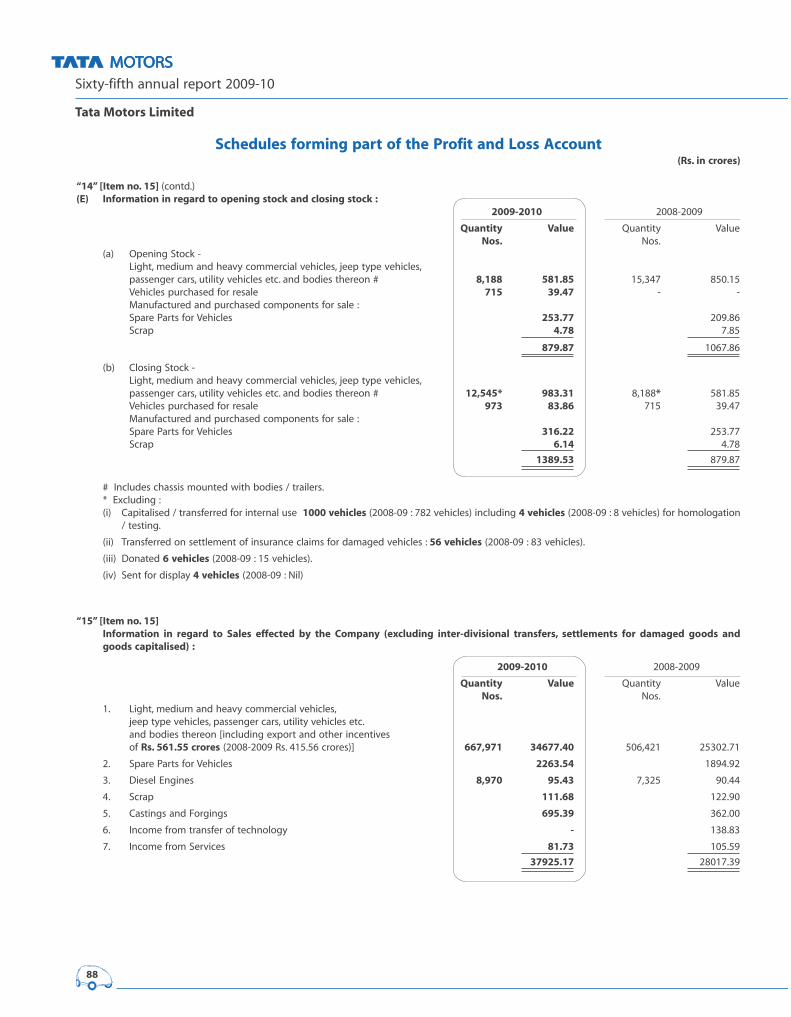
Sixty-fifth annual report 2009-10
Tata Motors Limited
88
Schedules forming part of the Profit and Loss Account(Rs. in crores)
“14” [Item no. 15] (contd.)
(E) Information in regard to opening stock and closing stock : 2009-2010 2008-2009
Quantity Value Quantity Value
Nos. Nos.
(a) Opening Stock -
Light, medium and heavy commercial vehicles, jeep type vehicles,
passenger cars, utility vehicles etc. and bodies thereon # 8,188 581.85 15,347 850.15
Vehicles purchased for resale 715 39.47 - -
Manufactured and purchased components for sale :
Spare Parts for Vehicles 253.77 209.86
Scrap 4.78 7.85
879.87 1067.86
(b) Closing Stock -
Light, medium and heavy commercial vehicles, jeep type vehicles,
passenger cars, utility vehicles etc. and bodies thereon # 12,545* 983.31 8,188* 581.85
Vehicles purchased for resale 973 83.86 715 39.47
Manufactured and purchased components for sale :
Spare Parts for Vehicles 316.22 253.77
Scrap 6.14 4.78
1389.53 879.87
# Includes chassis mounted with bodies / trailers.
* Excluding :
(i) Capitalised / transferred for internal use 1000 vehicles (2008-09 : 782 vehicles) including 4 vehicles (2008-09 : 8 vehicles) for homologation
/ testing.
(ii) Transferred on settlement of insurance claims for damaged vehicles : 56 vehicles (2008-09 : 83 vehicles).
(iii) Donated 6 vehicles (2008-09 : 15 vehicles).
(iv) Sent for display 4 vehicles (2008-09 : Nil)
“15” [Item no. 15]Information in regard to Sales effected by the Company (excluding inter-divisional transfers, settlements for damaged goods andgoods capitalised) :
2009-2010 2008-2009
Quantity Value Quantity Value
Nos. Nos.
1. Light, medium and heavy commercial vehicles,
jeep type vehicles, passenger cars, utility vehicles etc.
and bodies thereon [including export and other incentives
of Rs. 561.55 crores (2008-2009 Rs. 415.56 crores)] 667,971 34677.40 506,421 25302.71
2. Spare Parts for Vehicles 2263.54 1894.92
3. Diesel Engines 8,970 95.43 7,325 90.44
4. Scrap 111.68 122.90
5. Castings and Forgings 695.39 362.00
6. Income from transfer of technology - 138.83
7. Income from Services 81.73 105.59
37925.17 28017.39
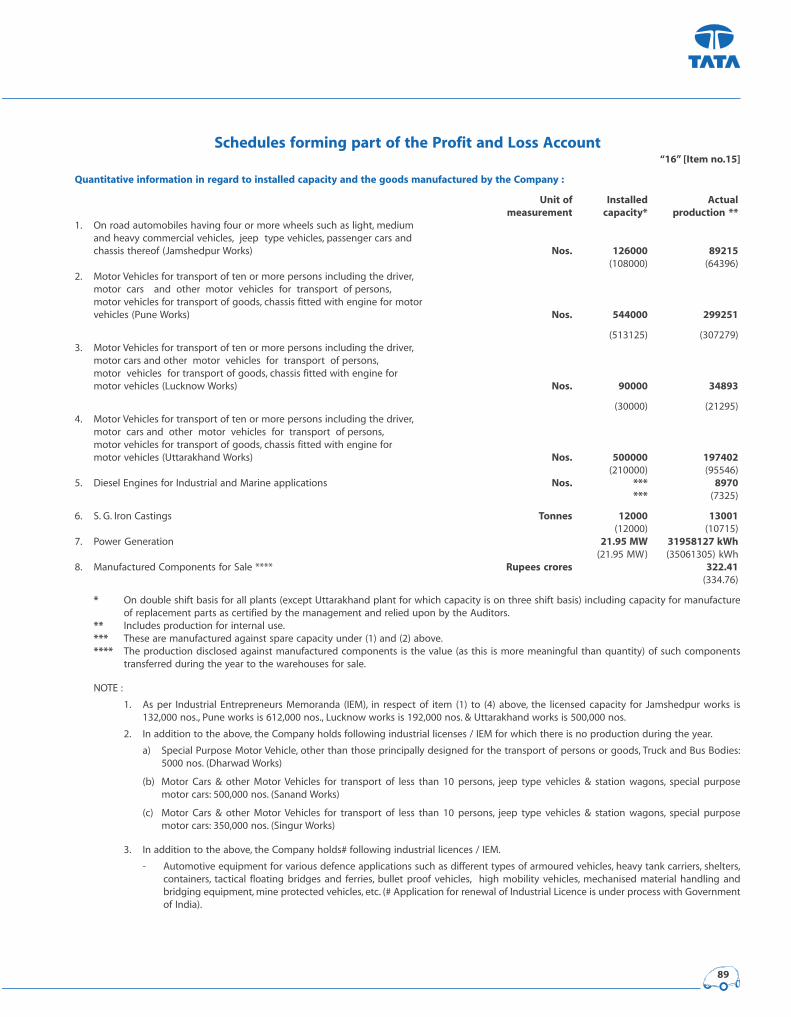
89
Schedules forming part of the Profit and Loss Account“16” [Item no.15]
Quantitative information in regard to installed capacity and the goods manufactured by the Company :
Unit of Installed Actualmeasurement capacity* production **
1. On road automobiles having four or more wheels such as light, medium
and heavy commercial vehicles, jeep type vehicles, passenger cars and
chassis thereof (Jamshedpur Works) Nos. 126000 89215(108000) (64396)
2. Motor Vehicles for transport of ten or more persons including the driver,
motor cars and other motor vehicles for transport of persons,
motor vehicles for transport of goods, chassis fitted with engine for motor
vehicles (Pune Works) Nos. 544000 299251
(513125) (307279)
3. Motor Vehicles for transport of ten or more persons including the driver,
motor cars and other motor vehicles for transport of persons,
motor vehicles for transport of goods, chassis fitted with engine for
motor vehicles (Lucknow Works) Nos. 90000 34893
(30000) (21295)
4. Motor Vehicles for transport of ten or more persons including the driver,
motor cars and other motor vehicles for transport of persons,
motor vehicles for transport of goods, chassis fitted with engine for
motor vehicles (Uttarakhand Works) Nos. 500000 197402(210000) (95546)
5. Diesel Engines for Industrial and Marine applications Nos. *** 8970*** (7325)
6. S. G. Iron Castings Tonnes 12000 13001(12000) (10715)
7. Power Generation 21.95 MW 31958127 kWh(21.95 MW) (35061305) kWh
8. Manufactured Components for Sale **** Rupees crores 322.41(334.76)
* On double shift basis for all plants (except Uttarakhand plant for which capacity is on three shift basis) including capacity for manufacture
of replacement parts as certified by the management and relied upon by the Auditors.
** Includes production for internal use.
*** These are manufactured against spare capacity under (1) and (2) above.
**** The production disclosed against manufactured components is the value (as this is more meaningful than quantity) of such components
transferred during the year to the warehouses for sale.
NOTE :
1. As per Industrial Entrepreneurs Memoranda (IEM), in respect of item (1) to (4) above, the licensed capacity for Jamshedpur works is
132,000 nos., Pune works is 612,000 nos., Lucknow works is 192,000 nos. & Uttarakhand works is 500,000 nos.
2. In addition to the above, the Company holds following industrial licenses / IEM for which there is no production during the year.
a) Special Purpose Motor Vehicle, other than those principally designed for the transport of persons or goods, Truck and Bus Bodies:
5000 nos. (Dharwad Works)
(b) Motor Cars & other Motor Vehicles for transport of less than 10 persons, jeep type vehicles & station wagons, special purpose
motor cars: 500,000 nos. (Sanand Works)
(c) Motor Cars & other Motor Vehicles for transport of less than 10 persons, jeep type vehicles & station wagons, special purpose
motor cars: 350,000 nos. (Singur Works)
3. In addition to the above, the Company holds# following industrial licences / IEM.
- Automotive equipment for various defence applications such as different types of armoured vehicles, heavy tank carriers, shelters,
containers, tactical floating bridges and ferries, bullet proof vehicles, high mobility vehicles, mechanised material handling and
bridging equipment, mine protected vehicles, etc. (# Application for renewal of Industrial Licence is under process with Government
of India).
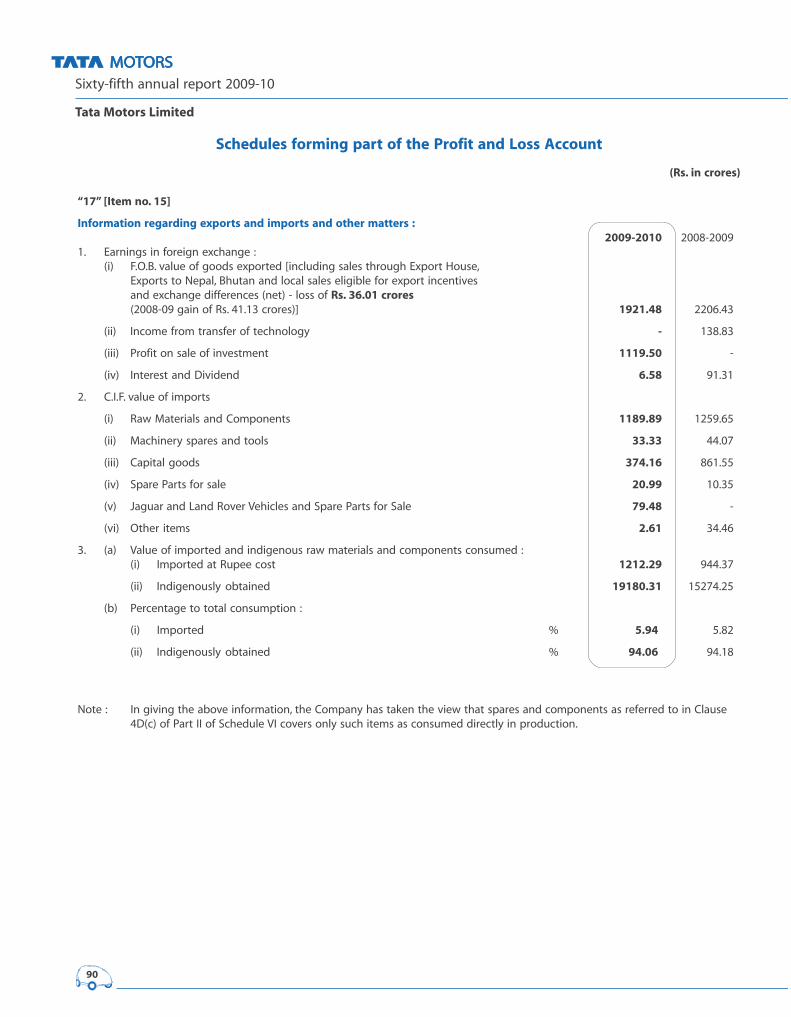
Sixty-fifth annual report 2009-10
Tata Motors Limited
90
Schedules forming part of the Profit and Loss Account
(Rs. in crores)
“17” [Item no. 15]
Information regarding exports and imports and other matters :2009-2010 2008-2009
1. Earnings in foreign exchange :
(i) F.O.B. value of goods exported [including sales through Export House,
Exports to Nepal, Bhutan and local sales eligible for export incentives
and exchange differences (net) - loss of Rs. 36.01 crores(2008-09 gain of Rs. 41.13 crores)] 1921.48 2206.43
(ii) Income from transfer of technology - 138.83
(iii) Profit on sale of investment 1119.50 -
(iv) Interest and Dividend 6.58 91.31
2. C.I.F. value of imports
(i) Raw Materials and Components 1189.89 1259.65
(ii) Machinery spares and tools 33.33 44.07
(iii) Capital goods 374.16 861.55
(iv) Spare Parts for sale 20.99 10.35
(v) Jaguar and Land Rover Vehicles and Spare Parts for Sale 79.48 -
(vi) Other items 2.61 34.46
3. (a) Value of imported and indigenous raw materials and components consumed :
(i) Imported at Rupee cost 1212.29 944.37
(ii) Indigenously obtained 19180.31 15274.25
(b) Percentage to total consumption :
(i) Imported % 5.94 5.82
(ii) Indigenously obtained % 94.06 94.18
Note : In giving the above information, the Company has taken the view that spares and components as referred to in Clause
4D(c) of Part II of Schedule VI covers only such items as consumed directly in production.
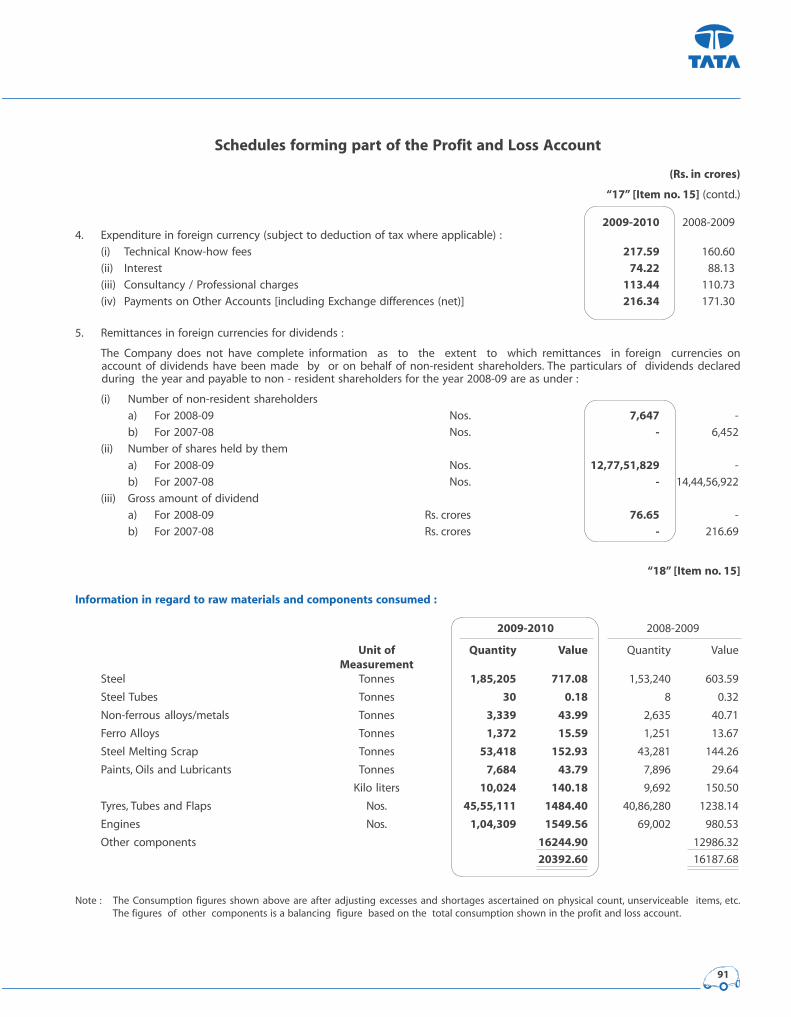
91
Schedules forming part of the Profit and Loss Account
(Rs. in crores)
“17” [Item no. 15] (contd.)
2009-2010 2008-2009
4. Expenditure in foreign currency (subject to deduction of tax where applicable) :
(i) Technical Know-how fees 217.59 160.60
(ii) Interest 74.22 88.13
(iii) Consultancy / Professional charges 113.44 110.73
(iv) Payments on Other Accounts [including Exchange differences (net)] 216.34 171.30
5. Remittances in foreign currencies for dividends :
The Company does not have complete information as to the extent to which remittances in foreign currencies on
account of dividends have been made by or on behalf of non-resident shareholders. The particulars of dividends declared
during the year and payable to non - resident shareholders for the year 2008-09 are as under :
(i) Number of non-resident shareholders
a) For 2008-09 Nos. 7,647 -
b) For 2007-08 Nos. - 6,452
(ii) Number of shares held by them
a) For 2008-09 Nos. 12,77,51,829 -
b) For 2007-08 Nos. - 14,44,56,922
(iii) Gross amount of dividend
a) For 2008-09 Rs. crores 76.65 -
b) For 2007-08 Rs. crores - 216.69
“18” [Item no. 15]
Information in regard to raw materials and components consumed :
2009-2010 2008-2009
Unit of Quantity Value Quantity Value
MeasurementSteel Tonnes 1,85,205 717.08 1,53,240 603.59
Steel Tubes Tonnes 30 0.18 8 0.32
Non-ferrous alloys/metals Tonnes 3,339 43.99 2,635 40.71
Ferro Alloys Tonnes 1,372 15.59 1,251 13.67
Steel Melting Scrap Tonnes 53,418 152.93 43,281 144.26
Paints, Oils and Lubricants Tonnes 7,684 43.79 7,896 29.64
Kilo liters 10,024 140.18 9,692 150.50
Tyres, Tubes and Flaps Nos. 45,55,111 1484.40 40,86,280 1238.14
Engines Nos. 1,04,309 1549.56 69,002 980.53
Other components 16244.90 12986.32
20392.60 16187.68
Note : The Consumption figures shown above are after adjusting excesses and shortages ascertained on physical count, unserviceable items, etc.
The figures of other components is a balancing figure based on the total consumption shown in the profit and loss account.
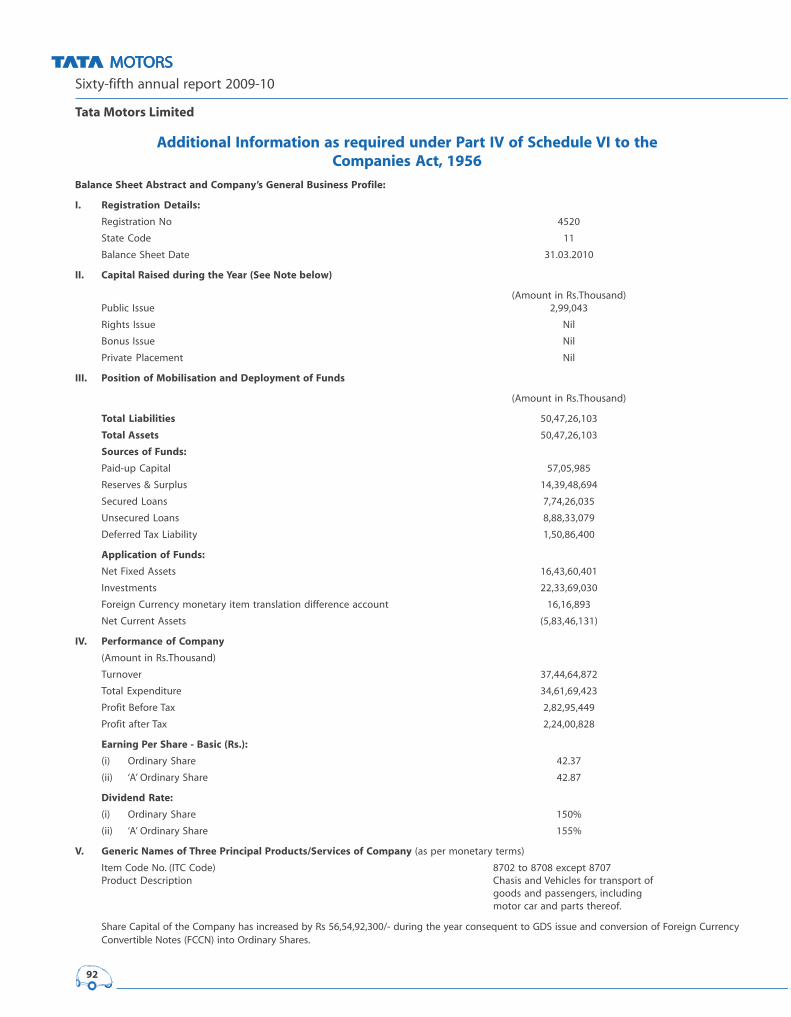
Sixty-fifth annual report 2009-10
Tata Motors Limited
92
Additional Information as required under Part IV of Schedule VI to theCompanies Act, 1956
Balance Sheet Abstract and Company’s General Business Profile:
I. Registration Details:
Registration No 4520
State Code 11
Balance Sheet Date 31.03.2010
II. Capital Raised during the Year (See Note below)
(Amount in Rs.Thousand)
Public Issue 2,99,043
Rights Issue Nil
Bonus Issue Nil
Private Placement Nil
III. Position of Mobilisation and Deployment of Funds
(Amount in Rs.Thousand)
Total Liabilities 50,47,26,103
Total Assets 50,47,26,103
Sources of Funds:
Paid-up Capital 57,05,985
Reserves & Surplus 14,39,48,694
Secured Loans 7,74,26,035
Unsecured Loans 8,88,33,079
Deferred Tax Liability 1,50,86,400
Application of Funds:
Net Fixed Assets 16,43,60,401
Investments 22,33,69,030
Foreign Currency monetary item translation difference account 16,16,893
Net Current Assets (5,83,46,131)
IV. Performance of Company
(Amount in Rs.Thousand)
Turnover 37,44,64,872
Total Expenditure 34,61,69,423
Profit Before Tax 2,82,95,449
Profit after Tax 2,24,00,828
Earning Per Share - Basic (Rs.):
(i) Ordinary Share 42.37
(ii) ‘A’ Ordinary Share 42.87
Dividend Rate:
(i) Ordinary Share 150%
(ii) ‘A’ Ordinary Share 155%
V. Generic Names of Three Principal Products/Services of Company (as per monetary terms)
Item Code No. (ITC Code) 8702 to 8708 except 8707
Product Description Chasis and Vehicles for transport of
goods and passengers, including
motor car and parts thereof.
Share Capital of the Company has increased by Rs 56,54,92,300/- during the year consequent to GDS issue and conversion of Foreign Currency
Convertible Notes (FCCN) into Ordinary Shares.

93
Auditors’ Report on Consolidated Financial Statements
TO THE BOARD OF DIRECTORS OFTATA MOTORS LIMITED1. We have audited the attached Consolidated Balance Sheet of TATA MOTORS LIMITED (“the Company”), its subsidiaries and
jointly controlled entities (the Company, its subsidiaries and jointly controlled entities constitute “the Group”) as at March 31,
2010, the Consolidated Profit and Loss Account and the Consolidated Cash Flow Statement of the Group for the year ended
on that date, both annexed thereto. The Consolidated Financial Statements include investments in associates accounted on
the equity method in accordance with Accounting Standard 23 (Accounting for Investments in Associates in Consolidated
Financial Statements) and the jointly controlled entities accounted in accordance with Accounting Standard 27 (Financial
Reporting of Interests in Joint Ventures) as notified under the Companies (Accounting Standards) Rules, 2006. These financial
statements are the responsibility of the Company’s Management and have been prepared on the basis of the separate
financial statements and other information regarding components. Our responsibility is to express an opinion on these
Consolidated Financial Statements based on our audit.
2. We conducted our audit in accordance with the auditing standards generally accepted in India. Those Standards require that
we plan and perform the audit to obtain reasonable assurance about whether the financial statements are free of material
misstatements. An audit includes examining, on a test basis, evidence supporting the amounts and the disclosures in the
financial statements. An audit also includes assessing the accounting principles used and the significant estimates made by
the Management, as well as evaluating the overall financial statement presentation. We believe that our audit provides a
reasonable basis for our opinion.
3. (a) Attention is invited to Note k (i) under Significant Accounting Policies. As stated in the note, the actuarial losses (net)
amounting to Rs. 1,722.61 crores have been accounted in “Reserves and Surplus” in respect of a group of subsidiary
companies.
(b) We did not audit the financial statements of certain subsidiaries, whose financial statements reflect total assets (net) of
Rs. 11,201.83 crores as at March 31, 2010, total revenues of Rs. 52,732.82 crores and net cash inflows amounting to
Rs. 4,376.56 crores; and of certain associates whose financial statements reflect the Group’s share of profit of Rs. 40.35
crores for the year then ended and Group’s share of loss (net) of Rs. 47.71 crores up to March 31, 2010. These financial
statements and other financial information have been audited by other auditors whose reports have been furnished to
us by the Company’s Management, and our opinion in so far as it relates to the amounts included in respect of these
subsidiaries and associates is based solely on the reports of the other auditors.
(c) As stated in note C(5), C(1) and B(6) of Schedule 14, the financial statements of certain subsidiaries, whose financial
statements reflect total assets (net) of Rs. 692.78 crores (negative) as at March 31, 2010, total revenues of Rs. 163.14
crores and net cash outflows amounting to Rs. 83.43 crores; the financial statements of a joint venture, whose financial
statements reflect the Group’s share of total assets (net) of Rs. 378.30 crores as at March 31, 2010, total revenues of
Rs. 1,761.44 crores and net cash inflows amounting to Rs. 37.42 crores and financial statements of certain associates,
whose financial statements reflect the Group’s share of profit for the year ended March 31, 2010 of Rs. 46.15 crores and
Group’s share of profit (net) of Rs. 116.09 crores upto March 31, 2010, are incorporated in the consolidated financial
statements based on management’s estimates and are not audited by their auditors.
4. Subject to the matters referred to in paragraph 3(c) and read with our comments in paragraph 3(a) above:
(a) we report that the Consolidated Financial Statements have been prepared by the Company’s management in accordance
with the requirements of Accounting Standard 21 (Consolidated Financial Statements), Accounting Standard 23
(Accounting for Investment in Associates in Consolidated Financial Statements) and Accounting Standard 27 (Financial
Reporting of Interests in Joint Ventures) as notified under the Companies (Accounting Standards) Rules, 2006;
(b) based on our audit and on consideration of the separate audit reports on individual financial statements of the Company,
its aforesaid subsidiaries, joint ventures and associates and to the best of our information and according to the
explanations given to us, in our opinion, the Consolidated Financial Statements give a true and fair view in conformity
with the accounting principles generally accepted in India:
(i) in the case of the Consolidated Balance Sheet, of the state of affairs of the Group as at March 31, 2010;
(ii) in the case of the Consolidated Profit and Loss Account, of the profit of the Group for the year ended on that date;
and
(iii) in the case of the Consolidated Cash Flow Statement, of the cash flows of the Group for the year ended on that
date.
For DELOITTE HASKINS & SELLSChartered Accountants
(Registration No. 117366W)
N. VENKATRAMPartner
(Membership No.71387)
Mumbai: May 27, 2010

Sixty-fifth annual report 2009-10
Tata Motors Limited
94
Consolidated Balance Sheet as at March 31, 2010(Rs. in crores)
As at
March 31,
Schedule Page 2009
SOURCES OF FUNDS1. SHAREHOLDERS’ FUNDS
(a) Share Capital 1 99 570.60 514.05
(b) Reserves and Surplus 2 99 7635.88 5426.59
8206.48 5940.64
2. MINORITY INTEREST 213.51 403.03
3. LOAN FUNDS
(a) Secured 3 100 21290.03 13705.50
(b) Unsecured 4 100 13902.33 21268.35
35192.36 34973.85
4. FOREIGN CURRENCY MONETARY ITEM
TRANSLATION DIFFERENCE ACCOUNT (NET) 191.15 -
[Note A (1), Page 110]
5. DEFERRED TAX LIABILITY 1579.60 949.65
[Note A (7) (a) & (b), Page 110]
6. TOTAL FUNDS EMPLOYED 45383.10 42267.17
APPLICATION OF FUNDS7. FIXED ASSETS 5 101
(a) Gross Block 64851.83 58469.38
(b) Less - Depreciation 34413.52 33269.05
(c) Net Block 30438.31 25200.33
(d) Capital Work-in-Progress 8068.02 10533.00
38506.33 35733.33
8. GOODWILL (On Consolidation) 3422.87 3718.65
[Note A (8), Page 111]
9. INVESTMENTS 6 102 2219.12 1257.40
10. DEFERRED TAX ASSETS 425.97 269.44
[Note A (7) (a) & (b), Page 110]
11. FOREIGN CURRENCY MONETARY ITEM
TRANSLATION DIFFERENCE ACCOUNT (NET) - 636.48
[Note A (1), Page 110]
12. CURRENT ASSETS, LOANS AND ADVANCES
(a) Interest accrued on investments 2.43 2.62
(b) Inventories 7 103 11312.03 10950.60
(c) Sundry Debtors 8 103 7191.18 4794.86
(d) Cash and Bank Balances 9 103 8743.32 4121.34
(e) Loans and Advances 10 104 15280.68 12816.55
42529.64 32685.97
13. CURRENT LIABILITIES AND PROVISIONS
(a) Current Liabilities 11 104 34077.33 23980.16
(b) Provisions 12 104 7643.50 8140.02
41720.83 32120.18
14. NET CURRENT ASSETS [(12) LESS (13)] 808.81 565.79
15. MISCELLANEOUS EXPENDITURE 13 104 - 86.08
(to the extent not written off or adjusted)
16. TOTAL ASSETS (NET) 45383.10 42267.17
17. BASIS OF CONSOLIDATION AND SIGNIFICANT
ACCOUNTING POLICIES 105
18. NOTES TO BALANCE SHEET 14 110
As per our report attached
For DELOITTE HASKINS & SELLSChartered Accountants
N VENKATRAMPartner
Mumbai, May 27, 2010
RATAN N TATAChairman
RAVI KANTVice-Chairman
For and on behalf of the Board
CARL-PETER FORSTERManaging Director & Group CEO
P M TELANGManaging Director - India Operations
C RAMAKRISHNANChief Financial Officer
H K SETHNACompany Secretary
Mumbai, May 27, 2010
J J IRANI
R GOPALAKRISHNAN
N N WADIA
S M PALIA
R A MASHELKAR
N MUNJEE
S BHARGAVA
V K JAIRATHDirectors
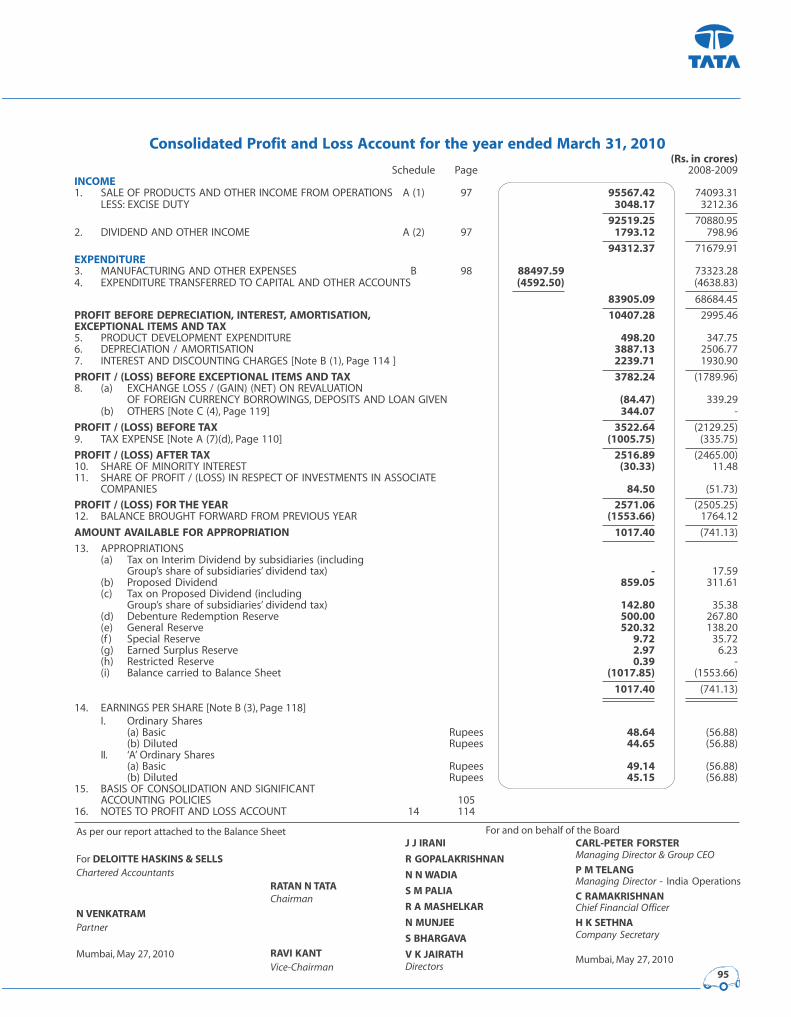
95
Consolidated Profit and Loss Account for the year ended March 31, 2010(Rs. in crores)
Schedule Page 2008-2009
INCOME1. SALE OF PRODUCTS AND OTHER INCOME FROM OPERATIONS A (1) 97 95567.42 74093.31
LESS: EXCISE DUTY 3048.17 3212.36
92519.25 70880.95
2. DIVIDEND AND OTHER INCOME A (2) 97 1793.12 798.96
94312.37 71679.91
EXPENDITURE3. MANUFACTURING AND OTHER EXPENSES B 98 88497.59 73323.28
4. EXPENDITURE TRANSFERRED TO CAPITAL AND OTHER ACCOUNTS (4592.50) (4638.83)
83905.09 68684.45
PROFIT BEFORE DEPRECIATION, INTEREST, AMORTISATION, 10407.28 2995.46
EXCEPTIONAL ITEMS AND TAX5. PRODUCT DEVELOPMENT EXPENDITURE 498.20 347.75
6. DEPRECIATION / AMORTISATION 3887.13 2506.77
7. INTEREST AND DISCOUNTING CHARGES [Note B (1), Page 114 ] 2239.71 1930.90
PROFIT / (LOSS) BEFORE EXCEPTIONAL ITEMS AND TAX 3782.24 (1789.96)
8. (a) EXCHANGE LOSS / (GAIN) (NET) ON REVALUATION
OF FOREIGN CURRENCY BORROWINGS, DEPOSITS AND LOAN GIVEN (84.47) 339.29
(b) OTHERS [Note C (4), Page 119] 344.07 -
PROFIT / (LOSS) BEFORE TAX 3522.64 (2129.25)
9. TAX EXPENSE [Note A (7)(d), Page 110] (1005.75) (335.75)
PROFIT / (LOSS) AFTER TAX 2516.89 (2465.00)
10. SHARE OF MINORITY INTEREST (30.33) 11.48
11. SHARE OF PROFIT / (LOSS) IN RESPECT OF INVESTMENTS IN ASSOCIATE
COMPANIES 84.50 (51.73)
PROFIT / (LOSS) FOR THE YEAR 2571.06 (2505.25)
12. BALANCE BROUGHT FORWARD FROM PREVIOUS YEAR (1553.66) 1764.12
AMOUNT AVAILABLE FOR APPROPRIATION 1017.40 (741.13)
13. APPROPRIATIONS
(a) Tax on Interim Dividend by subsidiaries (including
Group’s share of subsidiaries’ dividend tax) - 17.59
(b) Proposed Dividend 859.05 311.61
(c) Tax on Proposed Dividend (including
Group’s share of subsidiaries’ dividend tax) 142.80 35.38
(d) Debenture Redemption Reserve 500.00 267.80
(e) General Reserve 520.32 138.20
(f ) Special Reserve 9.72 35.72
(g) Earned Surplus Reserve 2.97 6.23
(h) Restricted Reserve 0.39 -
(i) Balance carried to Balance Sheet (1017.85) (1553.66)
1017.40 (741.13)
14. EARNINGS PER SHARE [Note B (3), Page 118]
I. Ordinary Shares
(a) Basic Rupees 48.64 (56.88)
(b) Diluted Rupees 44.65 (56.88)
II. ‘A’ Ordinary Shares
(a) Basic Rupees 49.14 (56.88)
(b) Diluted Rupees 45.15 (56.88)
15. BASIS OF CONSOLIDATION AND SIGNIFICANT
ACCOUNTING POLICIES 105
16. NOTES TO PROFIT AND LOSS ACCOUNT 14 114
As per our report attached to the Balance Sheet
For DELOITTE HASKINS & SELLSChartered Accountants
N VENKATRAMPartner
Mumbai, May 27, 2010
RATAN N TATAChairman
RAVI KANTVice-Chairman
For and on behalf of the Board
CARL-PETER FORSTERManaging Director & Group CEO
P M TELANGManaging Director - India Operations
C RAMAKRISHNANChief Financial Officer
H K SETHNACompany Secretary
Mumbai, May 27, 2010
J J IRANI
R GOPALAKRISHNAN
N N WADIA
S M PALIA
R A MASHELKAR
N MUNJEE
S BHARGAVA
V K JAIRATHDirectors

Sixty-fifth annual report 2009-10
Tata Motors Limited
96
As per our report attached to the Balance Sheet
For DELOITTE HASKINS & SELLSChartered Accountants
N VENKATRAMPartner
Mumbai, May 27, 2010
RATAN N TATAChairman
RAVI KANTVice-Chairman
For and on behalf of the Board
CARL-PETER FORSTERManaging Director & Group CEO
P M TELANGManaging Director - India Operations
C RAMAKRISHNANChief Financial Officer
H K SETHNACompany Secretary
Mumbai, May 27, 2010
J J IRANI
R GOPALAKRISHNAN
N N WADIA
S M PALIA
R A MASHELKAR
N MUNJEE
S BHARGAVA
V K JAIRATHDirectors
Consolidated Cash Flow Statement for the year ended March 31, 2010(Rs. in crores)
2009-2010 2008-2009
A. Cash flow from Operating ActivitiesProfit / (Loss) for the year 2571.06 (2505.25)
Adjustments for:
Depreciation (including Lease Equalisation adjusted in income) 3882.62 2502.27
Loss on sale of assets (net) (includes assets scrapped / written off ) 74.48 13.91
Relocation expenditure etc. 67.17 -
Profit on sale of controlling stake in a subsidiary (1057.92) -
Profit on sale of investments (net) (693.62) (718.16)
Reversal of provision for diminution in value of investments (net) - (1.96)
Impairment of Goodwill 40.00 -
Provision for inter corporate deposits (net) (0.16) (5.97)
Gain on buy back of Foreign Currency Convertible Notes (FCCN) and Convertible Alternative Reference Securities (CARS) - (50.74)
Share of (Profit) / Loss in respect of investments in associate companies (84.50) 51.73
Share of minority interest 30.33 (11.48)
Tax expenses 1005.75 335.75
Interest / Dividend (net) 2305.54 1852.06
Exchange difference (263.05) 1309.49
Amortisation of Miscellaneous Expenditure / Employee Separation Cost 77.59 4.93
5384.23 5281.83
Operating Profit before Working Capital Changes 7955.29 2776.58
Employee Separation Cost of subsidiary companies - (84.08)
Adjustments for:
Trade and other receivables (4342.63) 655.96
Inventories (1244.53) 693.27
Trade and other payables 8709.11 (2987.73)
3121.95 (1638.50)
Vehicle / loans and hire purchase receivables (521.10) 294.45
2600.85 (1344.05)
Cash generated from Operations 10556.14 1348.45
Direct Taxes Paid (net) (1229.21) (598.62)
Net Cash from Operating Activities 9326.93 749.83
B. Cash Flow from Investing ActivitiesPurchase of fixed assets (8475.43) (9970.78)
Sale of fixed assets 22.19 74.91
Investments in associate companies (1.44) (33.22)
Investments in Mutual Fund (made) / sold (net) (979.55) 843.56
Investment in JLR Business (consideration for IPR, Halewood plant and JLR Business) - (10765.19)
Investment in Subsidiary Companies (56.30) (138.54)
Investments - others (10.14) (2.23)
Proceeds from Sale of stake in Telcon 1159.50 -
Decrease in Investments in retained interests in securitisation transactions 51.38 8.94
Sale of Investments in associate company - 162.70
Sale / redemption of investments - others 958.56 852.76
Deposits of Margin Money / Cash Collateral (613.95) (1368.64)
Realisation of Margin Money / Cash Collateral 557.49 1233.13
Fixed deposits with scheduled banks made (412.20) (0.16)
Fixed deposits with scheduled banks realised 2.15 -
Increase in restricted deposits with scheduled banks (7.08) (1.96)
Interest received 237.59 239.71
Dividend received from associates 9.47 29.81
Dividend / Income on investments received 31.51 73.96
Increase in short term Inter-corporate deposit (6.80) (55.20)
Net Cash used in Investing Activities (7533.05) (18816.44)
C. Cash Flow from Financing ActivitiesPremium on redemption of FCCN (including tax) - (0.05)
Expenses on Foreign Currency Convertible Notes (FCCN) conversion / Non-Convertible Debentures (150.79) (0.91)
Proceeds from issue of shares held in abeyance 0.05 -
Proceeds from issue of shares by Joint venture 17.68 -
Proceeds from GDS issue (net of issue expenses) 1667.47 -
Proceeds from long term borrowings 26680.86 19598.62
Repayment of long term borrowings (21072.65) (8241.42)
(Decrease) /Increase in short term borrowings (net) (3443.42) 4210.56
Proceeds from Rights issue of shares - 4109.66
Proceeds from Fixed Deposits 2039.11 1232.47
Repayment of Fixed Deposits (75.96) -
Proceeds from issue of shares to minority shareholders 54.50 0.34
Dividend paid (including Dividend Tax) (346.24) (697.37)
Dividend paid to minority shareholders (3.33) (62.11)
Interest paid [including discounting charges paid, Rs. 668.27 crores, (2008-09 Rs. 508.93 crores)] (2855.34) (2386.65)
Net Cash from Financing Activities 2511.94 17763.14
Net Increase / (Decrease) in Cash and cash equivalents 4305.82 (303.47)
Cash and cash equivalents as at March 31 (Opening Balance) * # 2381.60 2231.06
Add/(Less) : Cash and Bank balance taken over on acquisition of stake in subsidiaries / joint venture 3.41 1280.52
Add/(Less) : Cash and Bank balances on sale of controlling stake of a subsidiary (45.01) -
Add/(Less) : Translation adjustment on opening cash and bank balance of foreign subsidiaries (60.67) (162.31)
Add/(Less) : Translation adjustment on reserves of foreign subsidiaries (91.13) (653.66)
Add/(Less) : Exchange fluctuation on FCCN / CARS proceeds kept outside India and on foreign currency bank balances 35.94 (10.54)
Cash and cash equivalents as at March 31 (Closing Balance) * # 6529.96 2381.60
* Excludes Cash Collateral Rs. 1786.07 crores (as at March 31, 2009 Rs. 1729.58 crores, as at March 31, 2008 Rs. 1594.07 crores)
# Excludes Fixed / restricted deposits with scheduled banks Rs. 427.29 crores (as at March 31, 2009, Rs. 10.16 crores, as at March 31, 2008 Rs. 8.04 crores)
Previous year’s figures have been restated, wherever necessary, to conform to this year’s classification.

97
Schedules forming part of the Consolidated Profit and Loss Account(Rs. in crores)
“A”[Item no. 1 & 2]
2009-2010 2008-2009
SALE OF PRODUCTS AND OTHER INCOME
1. Sale of products and other income from operations
(a) Sale of products / Services (Note 1 below) 93611.20 72502.12
(b) Income from Hire purchase / Loan contracts (Note 2 below) 1330.42 1022.74
Sales / Income from Operations 94941.62 73524.86
(c) Miscellaneous income (Note 3 below) 625.80 568.45
95567.42 74093.31
2. Dividend and other income (Note 4 below) 1793.12 798.96
97360.54 74892.27
2009-2010 2008-2009
Notes: (1) Sale of products / Services includes :
(i) exchange gain /(loss) (net) 106.24 (610.63)
(ii) net of variable marketing expenses of some of subsidiaries (5308.88) (4883.31)
(2) Income from Hire purchase / Loan contracts includes :
(i) Income on securitisation / sale of receivables of Loan contracts (net) 151.33 3.09
(ii) Interest income on Loan contracts (net) 1098.32 955.62
(3) Miscellaneous income include :
(i) Gain on buyback of Foreign Currency Convertible Notes (FCCN)
and Convertible Alternative Reference Securities (CARS) - 50.74
(ii) Income from Infrastructural Services provided in vendor park - 56.57
(4) Dividend and other income includes :
(i) Profit on sale of current investments 693.62 3.26
(ii) Profit on sale of controlling stake in a subsidiary (Note (C)(3)(b), Page 119) 1057.92 -
(iii) Profit on sale of other long term investments (net) - 714.90

Sixty-fifth annual report 2009-10
Tata Motors Limited
98
Schedules forming part of the Consolidated Profit and Loss Account(Rs. in crores)
“B” [Item no. 3] 2009-2010 2008-2009
MANUFACTURING AND OTHER EXPENSES1. Purchase of products for sale, etc. 8538.52 6978.22
2. Consumption of raw materials and components 54105.54 40253.38
3. Processing charges 878.99 559.64
4. Payments to and provision for employees(a) Salaries, wages and bonus 6865.82 6426.19
(b) Contribution to provident and other funds 1011.66 277.33
(c) Workmen and staff welfare expenses 874.29 593.90
8751.77 7297.42
5. Expenses for manufacture, administration and selling:(a) Stores, spare parts and tools consumed 1058.99 765.57
(b) Freight, transportation, port charges, etc. 2050.44 1995.73
(c) Repairs to buildings 57.05 45.55
(d) Repairs to plant, machinery, etc. 278.13 268.33
(e) Power and fuel 689.45 686.30
(f ) Rent 106.71 95.38
(g) Rates and taxes 181.63 152.49
(h) Insurance 161.92 145.64
(i) Publicity 2974.18 2633.52
(j) Incentive / Commission to dealers 595.57 388.34
(k) Other expenses ( Note 1 below ) 9130.42 10323.41
17284.49 17500.26
6. Excise duty on change in Stock-in-trade 86.95 (58.68)
7. Change in Stock-in-trade and Work-in-progress:A. Opening Stock
(i) Work-in-progress 1044.02 370.08
(ii) Stock-in-trade 7572.56 1332.15
8616.58 1702.23
Stock acquired on acquisitions
(i) Work-in-progress 5.89 799.33
(ii) Stock-in-trade 30.56 7925.96
36.45 8725.29
Translation difference (331.57) (1017.90)
Sale of controlling stake in a subsidiary
(i) Work-in-progress 32.97 -
(ii) Stock-in-trade 214.80 -
247.77 -
B. Closing Stock(i) Work-in-progress 998.46 1044.02
(ii) Stock-in-trade 8223.90 7572.56
9222.36 8616.58
(1148.67) 793.04
88497.59 73323.28
2009-2010 2008-2009
Notes : (1) Other expenses include:
(i) Warranty Expenses 2524.70 2233.27
(ii) Computer Expenses 592.91 704.09
(iii) Lease rentals in respect of plant and machinery 118.56 102.67
(iv) Provision and write off of sundry debtors, vehicle loans and advances (net) 786.88 586.40
(v) (Reversal) / Provision towards residual risk on vehicles sold (439.20) 587.71
(vi) Exchange (Gain) / Loss (665.89) 974.88
(vii) Loss on sale of assets 29.29 13.08
(viii) Loss on assets scrapped / written off 45.19 0.87
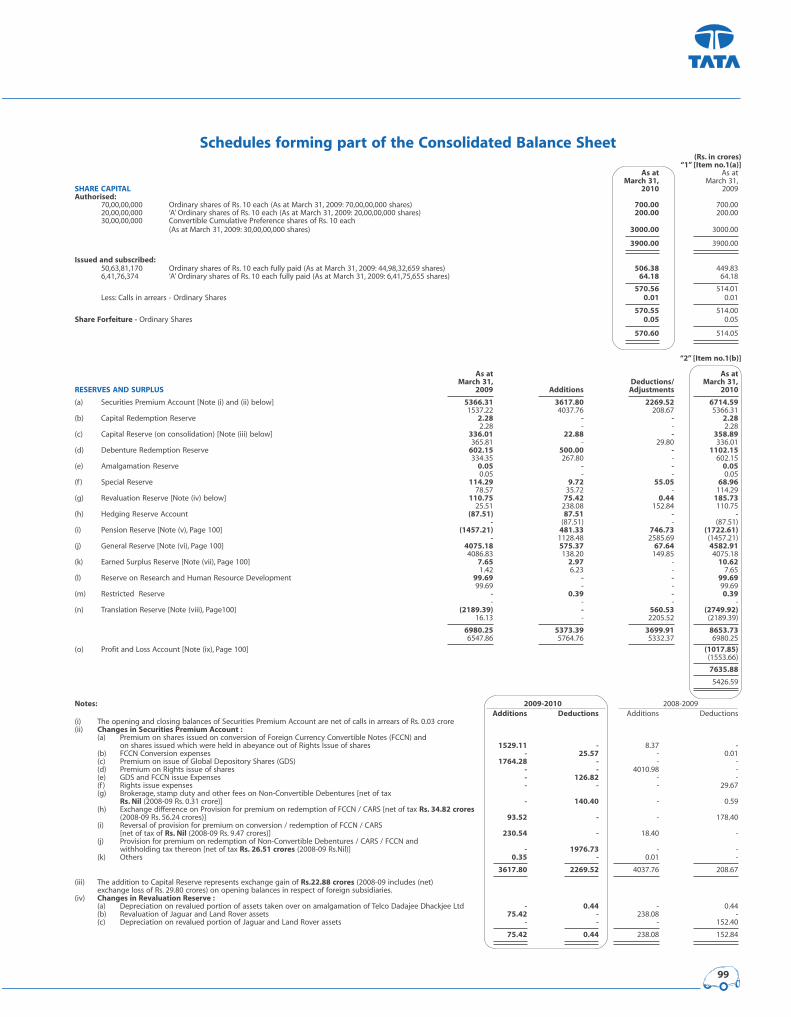
99
Schedules forming part of the Consolidated Balance Sheet(Rs. in crores)
“1” [Item no.1(a)]As at As at
March 31, March 31,
SHARE CAPITAL 2010 2009
Authorised:70,00,00,000 Ordinary shares of Rs. 10 each (As at March 31, 2009: 70,00,00,000 shares) 700.00 700.00
20,00,00,000 ‘A’ Ordinary shares of Rs. 10 each (As at March 31, 2009: 20,00,00,000 shares) 200.00 200.00
30,00,00,000 Convertible Cumulative Preference shares of Rs. 10 each
(As at March 31, 2009: 30,00,00,000 shares) 3000.00 3000.00
3900.00 3900.00
Issued and subscribed:50,63,81,170 Ordinary shares of Rs. 10 each fully paid (As at March 31, 2009: 44,98,32,659 shares) 506.38 449.83
6,41,76,374 ‘A’ Ordinary shares of Rs. 10 each fully paid (As at March 31, 2009: 6,41,75,655 shares) 64.18 64.18
570.56 514.01
Less: Calls in arrears - Ordinary Shares 0.01 0.01
570.55 514.00
Share Forfeiture - Ordinary Shares 0.05 0.05
570.60 514.05
“2” [Item no.1(b)]
As at As atMarch 31, Deductions/ March 31,
RESERVES AND SURPLUS 2009 Additions Adjustments 2010
(a) Securities Premium Account [Note (i) and (ii) below] 5366.31 3617.80 2269.52 6714.591537.22 4037.76 208.67 5366.31
(b) Capital Redemption Reserve 2.28 - - 2.282.28 - - 2.28
(c) Capital Reserve (on consolidation) [Note (iii) below] 336.01 22.88 - 358.89365.81 - 29.80 336.01
(d) Debenture Redemption Reserve 602.15 500.00 - 1102.15334.35 267.80 - 602.15
(e) Amalgamation Reserve 0.05 - - 0.050.05 - - 0.05
(f ) Special Reserve 114.29 9.72 55.05 68.9678.57 35.72 - 114.29
(g) Revaluation Reserve [Note (iv) below] 110.75 75.42 0.44 185.7325.51 238.08 152.84 110.75
(h) Hedging Reserve Account (87.51) 87.51 - -- (87.51) - (87.51)
(i) Pension Reserve [Note (v), Page 100] (1457.21) 481.33 746.73 (1722.61)- 1128.48 2585.69 (1457.21)
(j) General Reserve [Note (vi), Page 100] 4075.18 575.37 67.64 4582.914086.83 138.20 149.85 4075.18
(k) Earned Surplus Reserve [Note (vii), Page 100] 7.65 2.97 - 10.621.42 6.23 - 7.65
(l) Reserve on Research and Human Resource Development 99.69 - - 99.6999.69 - - 99.69
(m) Restricted Reserve - 0.39 - 0.39- - - -
(n) Translation Reserve [Note (viii), Page100] (2189.39) - 560.53 (2749.92)16.13 - 2205.52 (2189.39)
6980.25 5373.39 3699.91 8653.736547.86 5764.76 5332.37 6980.25
(o) Profit and Loss Account [Note (ix), Page 100] (1017.85)(1553.66)
7635.88
5426.59
Notes: 2009-2010 2008-2009
Additions Deductions Additions Deductions
(i) The opening and closing balances of Securities Premium Account are net of calls in arrears of Rs. 0.03 crore
(ii) Changes in Securities Premium Account :(a) Premium on shares issued on conversion of Foreign Currency Convertible Notes (FCCN) and
on shares issued which were held in abeyance out of Rights Issue of shares 1529.11 - 8.37 -
(b) FCCN Conversion expenses - 25.57 - 0.01
(c) Premium on issue of Global Depository Shares (GDS) 1764.28 - - -
(d) Premium on Rights issue of shares - - 4010.98 -
(e) GDS and FCCN issue Expenses - 126.82 - -
(f ) Rights issue expenses - - - 29.67
(g) Brokerage, stamp duty and other fees on Non-Convertible Debentures [net of tax
Rs. Nil (2008-09 Rs. 0.31 crore)] - 140.40 - 0.59
(h) Exchange difference on Provision for premium on redemption of FCCN / CARS [net of tax Rs. 34.82 crores(2008-09 Rs. 56.24 crores)] 93.52 - - 178.40
(i) Reversal of provision for premium on conversion / redemption of FCCN / CARS
[net of tax of Rs. Nil (2008-09 Rs. 9.47 crores)] 230.54 - 18.40 -
(j) Provision for premium on redemption of Non-Convertible Debentures / CARS / FCCN and
withholding tax thereon [net of tax Rs. 26.51 crores (2008-09 Rs.Nil)] - 1976.73 - -
(k) Others 0.35 - 0.01 -
3617.80 2269.52 4037.76 208.67
(iii) The addition to Capital Reserve represents exchange gain of Rs.22.88 crores (2008-09 includes (net)
exchange loss of Rs. 29.80 crores) on opening balances in respect of foreign subsidiaries.
(iv) Changes in Revaluation Reserve :(a) Depreciation on revalued portion of assets taken over on amalgamation of Telco Dadajee Dhackjee Ltd - 0.44 - 0.44
(b) Revaluation of Jaguar and Land Rover assets 75.42 - 238.08 -
(c) Depreciation on revalued portion of Jaguar and Land Rover assets - - - 152.40
75.42 0.44 238.08 152.84
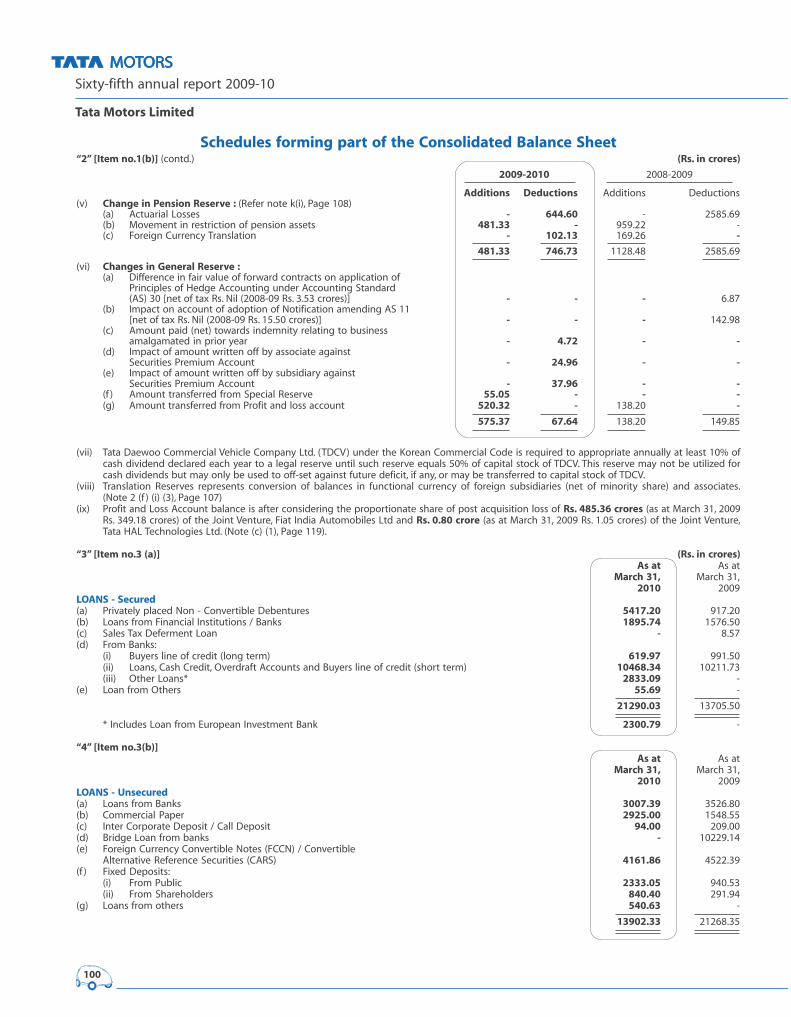
Sixty-fifth annual report 2009-10
Tata Motors Limited
100
Schedules forming part of the Consolidated Balance Sheet“2” [Item no.1(b)] (contd.) (Rs. in crores)
2009-2010 2008-2009
Additions Deductions Additions Deductions
(v) Change in Pension Reserve : (Refer note k(i), Page 108)
(a) Actuarial Losses - 644.60 - 2585.69
(b) Movement in restriction of pension assets 481.33 - 959.22 -
(c) Foreign Currency Translation - 102.13 169.26 -
481.33 746.73 1128.48 2585.69
(vi) Changes in General Reserve :(a) Difference in fair value of forward contracts on application of
Principles of Hedge Accounting under Accounting Standard
(AS) 30 [net of tax Rs. Nil (2008-09 Rs. 3.53 crores)] - - - 6.87
(b) Impact on account of adoption of Notification amending AS 11
[net of tax Rs. Nil (2008-09 Rs. 15.50 crores)] - - - 142.98
(c) Amount paid (net) towards indemnity relating to business
amalgamated in prior year - 4.72 - -(d) Impact of amount written off by associate against
Securities Premium Account - 24.96 - -(e) Impact of amount written off by subsidiary against
Securities Premium Account - 37.96 - -(f ) Amount transferred from Special Reserve 55.05 - - -(g) Amount transferred from Profit and loss account 520.32 - 138.20 -
575.37 67.64 138.20 149.85
(vii) Tata Daewoo Commercial Vehicle Company Ltd. (TDCV) under the Korean Commercial Code is required to appropriate annually at least 10% of
cash dividend declared each year to a legal reserve until such reserve equals 50% of capital stock of TDCV. This reserve may not be utilized for
cash dividends but may only be used to off-set against future deficit, if any, or may be transferred to capital stock of TDCV.
(viii) Translation Reserves represents conversion of balances in functional currency of foreign subsidiaries (net of minority share) and associates.
(Note 2 (f ) (i) (3), Page 107)
(ix) Profit and Loss Account balance is after considering the proportionate share of post acquisition loss of Rs. 485.36 crores (as at March 31, 2009
Rs. 349.18 crores) of the Joint Venture, Fiat India Automobiles Ltd and Rs. 0.80 crore (as at March 31, 2009 Rs. 1.05 crores) of the Joint Venture,
Tata HAL Technologies Ltd. (Note (c) (1), Page 119).
“3” [Item no.3 (a)] (Rs. in crores)As at As at
March 31, March 31,
2010 2009
LOANS - Secured(a) Privately placed Non - Convertible Debentures 5417.20 917.20
(b) Loans from Financial Institutions / Banks 1895.74 1576.50
(c) Sales Tax Deferment Loan - 8.57
(d) From Banks:
(i) Buyers line of credit (long term) 619.97 991.50
(ii) Loans, Cash Credit, Overdraft Accounts and Buyers line of credit (short term) 10468.34 10211.73
(iii) Other Loans* 2833.09 -
(e) Loan from Others 55.69 -
21290.03 13705.50
* Includes Loan from European Investment Bank 2300.79 -
“4” [Item no.3(b)]As at As at
March 31, March 31,
2010 2009
LOANS - Unsecured(a) Loans from Banks 3007.39 3526.80
(b) Commercial Paper 2925.00 1548.55
(c) Inter Corporate Deposit / Call Deposit 94.00 209.00
(d) Bridge Loan from banks - 10229.14
(e) Foreign Currency Convertible Notes (FCCN) / Convertible
Alternative Reference Securities (CARS) 4161.86 4522.39
(f ) Fixed Deposits:
(i) From Public 2333.05 940.53
(ii) From Shareholders 840.40 291.94
(g) Loans from others 540.63 -
13902.33 21268.35

101
Schedules forming part of the Consolidated Balance Sheet(Rs in crores)
“5” [Item No. 7]
FIXED ASSETS Cost as at Acquisitions Additions / Translation Deductions/ Cost as at Depreciation Accumulated Translation Accumulated Net BookMarch 31, Adjustments Adjustment Adjustments March 31, for the year Depreciation Adjustment- Depreciation Value as
2009 [Note (ii) (a)] [Note (ii) (b)] 2010 2009- 2010 on acquisitions Accumulated up to at MarchNote (vi)] during Depreciation March 31 31, 2010
2009-2010 2010[Note (iii)] [Note (iii)
and (vi) ]
(a) Land and Lease Hold Land 1577.81 - 465.26 (48.82) 107.93 1886.32 14.48 - (9.19) 137.38 1748.94438.34 1223.74 68.08 (152.20) 0.15 1577.81 22.37 115.44 (11.83) 132.44 1445.37
(b) Buildings 6625.64 - 612.88 (285.37) 458.50 6494.65 168.27 - (154.05) 2750.76 3743.891531.77 4830.42 849.08 (582.91) 2.72 6625.64 115.10 2689.69 (326.65) 2802.31 3823.33
(c) Plant, Machinery andEquipment 42157.09 77.67 4254.50 (1882.96) 1349.26 43257.04 2794.93 63.19 (1581.46) 28645.74 14611.30[Note (i)] 9510.17 30082.66 6848.84 (3866.34) 418.24 42157.09 1988.15 24769.05 (3275.13) 28159.43 13997.66
(d) Furniture, Fixtures and 964.35 5.28 69.98 (47.66) 80.66 911.29 57.23 4.88 (38.53) 624.23 287.06Office Appliances 139.61 883.58 81.19 (65.35) 74.68 964.35 38.92 653.57 (70.31) 648.52 315.83
[Note (i)](e) Technical Know how 45.34 - 1.77 0.07 3.53 43.65 11.98 - - 43.65 -
45.31 - 0.02 0.01 - 45.34 0.58 - 0.01 29.30 16.04
(f ) Vehicles and Transport 154.14 - 26.58 0.30 36.78 144.24 21.91 - (0.02) 78.72 65.52[Note (i)] 137.85 1.05 32.03 0.11 16.90 154.14 21.11 0.01 0.04 81.02 73.12
(g) Assets taken on Lease 174.15 - 4.68 1.49 25.20 155.12 26.34 - 0.54 77.77 77.35[Note (v)] 130.92 25.37 24.19 - 6.33 174.15 24.70 3.76 - 64.73 109.42
(h) Assets given on Lease 411.50 - - 1.91 14.45 398.96 4.86 - - 381.90 17.06411.50 - - - - 411.50 4.86 - - 393.72 17.78
(i) Product Development Cost 1552.75 58.93 5374.82 (346.07) 7.25 6633.18 592.41 49.72 (46.69) 857.06 5776.12378.13 0.67 1176.11 (2.16) - 1552.75 121.67 0.02 (2.08) 262.66 1290.09
(j) Trade Marks and Brand 2889.47 - - (182.94) - 2706.53 - - - - 2706.53- - 2889.47 - - 2889.47 - - - - 2889.47
(k) Developed Technologies 940.13 0.09 - (38.71) 48.57 852.94 73.23 - (11.82) 132.64 720.30- - 940.13 - - 940.13 71.63 - (3.98) 77.70 862.43
(l) Software 977.01 6.48 516.07 (109.59) 22.06 1367.91 121.49 5.73 (32.97) 683.67 684.24252.05 695.24 172.04 (77.20) 65.12 977.01 97.68 514.28 (66.09) 617.22 359.79
Total 58469.38 148.45 11326.54 (2938.35) 2154.19 64851.83 3887.13 123.52 (1874.19) 34413.52 30438.31
12975.65 37742.73 13081.18 (4746.04) 584.14 58469.38 2506.77 28745.82 (3756.02) 33269.05 25200.33
(m) Capital Work In progress 8068.02[Note (iv)] 10533.00
38506.3335733.33
Notes:(i) Includes Plant, Machinery and Equipment, Furniture, Fixtures and Office Appliances and Vehicles and Transport having Gross block of Rs 165.40 crores, Rs 73.00
crores and Rs. 0.57 crore (as at March 31, 2009 Rs. 159.20 crores, Rs 1.13 crore and Rs.0.34 crore) and net block of Rs. 5.21 crores, Rs. 0.02 crore and Rs. 0.13 crore(as at March 31, 2009 Rs 6.97 crores, Rs Nil and Rs. 0.11 crore) respectively, held for disposal.
(ii) Additions / Adjustments include :
(a) Decapitalisation of exchange gain (net of loss on derivative contract) of Rs 308.48 crores (2008-09 capitalised exchange loss of Rs 459.68 crores).
(b) Consequent to sale of controlling stake in Telco Construction Equipment Company Ltd. The assets of the said subsidiary have been deleted from the gross
block of Rs. 838.74 crores. (Note (C)(3)(c), Page 119)
(iii) Accumulated Depreciation includes :
(a) an adjustment of Rs. 726.00 crores (as at March 31, 2009 Rs.446.44 crores) on Assets transferred/sold/discarded during the year.
(b) lease equalisation of Rs. 4.51 crores (as at March 31, 2009 Rs. 4.49 crores) adjusted in lease rental income.
(c) depreciation of Rs. 51.63 crores (2008-09 Rs. 167.00 crores) on revalued portion of gross block transferred / credited to Revaluation Reserve.
(d) Rs. 1874.20 crores (as at March 31, 2009 Rs. 3756.02 crores) being translation adjustment for foreign subsidiaries.
(e) an adjustment of Rs. 261.16 crores due to sale of controlling stake in Telco Construction Equipment Company Ltd. (Note (C)(3)(c), page 119)
(iv) Capital Work in Progress includes :
(a) Product Development Cost Rs. 4062.16 crores (as at March 31, 2009 Rs. 2920.26 crores).
(b) advances for capital expenditure of Rs. 294.31 crores (as at March 31, 2009 Rs 403.16 crores).
(c) exchange loss of Rs. 58.55 crores (as at March 31,2009 Exchange loss Rs.106.54 crores).
(v) The Plant and Equipments taken on lease are under renewable secondary lease.
(vi) Depreciation for the year and accumulated depreciation includes amortization, diminution in value of assets and write down of assets net of reversals.
(vii) Certain Fixed Assets of Jaguar and Land Rover have been revalued by a external valuer, resulting in Revaluation Reserve of Rs. 131.44 crores (as at March 31, 2009
Rs.238.08 crores).

Sixty-fifth annual report 2009-10
Tata Motors Limited
102
Schedules forming part of the Consolidated Balance Sheet“6” [Item no. 9] (Rs. in crores)
As at As at
INVESTMENTS (at cost) March 31, March 31,
(A) In Associates 2010 2009
(a) Carrying amount of investments in Associates (Note 7 below) 584.25 299.30
[Including Rs. 52.98 crores (as at March 31, 2009 Rs. 56.20 crores) of Goodwill and net of Rs.0.43 crore(as at March 31, 2009 Rs.0.43 crore) of Capital Reserve arising on acquisition of associates]
(b) Fully paid Cumulative Redeemable Preference shares (Unquoted) 21.00 21.00
(B) Others(I) Long Term Investments
Quoted(a) Fully paid Ordinary/Equity shares 275.61 295.78
(b) Fully paid Cumulative Compulsorily Convertible Preference Shares - 239.50
(c) Bonds 2.38 2.23
Unquoted(a) Fully paid Ordinary/Equity shares 231.26 230.11
(b) Fully paid Cumulative Redeemable Preference Shares 12.00 15.00
(c) Fully Paid Non Cumulative Redeemable Preference Shares - 2.00
(d) Non Convertible Debentures 5.75 6.33
(e) Optionally Convertible Debentures 9.61 10.96
(f ) Bonds 6.15 6.15
(g) Retained interest in securitisation transactions 5.33 56.71
(II) Current InvestmentsQuoted(a) Fully paid Ordinary/Equity shares 6.47 0.93
(b) Investment in Securities 0.02 0.02
Unquoted(a) Fully paid Cumulative Redeemable Preference Shares 3.00 3.00
(b) Mutual Fund 1064.62 76.57
2227.45 1265.59
Less: Provision for diminution in value of Investments (Net) 8.33 8.19
2219.12 1257.40
Notes:(1) Book value of quoted investments (other than in associates) 283.55 537.53
(2) Book value of unquoted investments (other than in associates) 1330.32 399.57
(3) Market value of quoted investments (other than in associates) 360.85 552.43
(4) Investment in Mutual funds reinvested 8.08 -
(5) Tata Motors Ltd has given a letter of comfort to Citibank NA against credit facilities provided by the bank to Tata Precision Industries Pte. Ltd (TPI), Singapore and Tata
Engineering Services Pte. Ltd (TES), Singapore, a wholly owned subsidiary of TPI aggregating SGD 13.85 million (Rs. 44.48 crores as on March 31, 2010). The Company
has also given an undertaking to Citibank NA for non-disposal of its shareholding in TPI, Singapore, during the tenor of the loan.
(6) As per the shareholders agreement dated March 30, 2010, between Hitachi Construction Machinery Co. Ltd and the Company, Shares of Telcon Construction Equipment
Company Limited owned by the Company are under restriction for sale, assign or transfer for a period of 3 years from the date of the agreement.
(7) The particulars of investments in associate companies as of March 31, 2010 are as follows:
Sr. Name of the Associates Country of Ownership Original Cost Amount of Share of post Carrying amountNo. Incorporation Interest (%) of Investment Goodwill/ acquisition Reserves of Investments
(Capital Reserve) and Surplusin Original Cost
1) Tata Cummins Ltd. India 50.00 90.00 - 119.20 209.2050.00 90.00 - 79.80 169.80
2) Tata AutoComp Systems Ltd. India 26.00 77.47 - (50.72) 26.7526.00 77.47 - (63.35) 14.12
3) NITA Company Ltd. Bangladesh 40.00 1.27 (0.43) 3.01 4.2840.00 1.27 (0.43) 0.81 2.08
4) Tata Precision Industries Pte. Ltd. Singapore 49.99 3.11 - (3.11) * -
49.99 3.11 - (3.11) * -
5) Tata Hispano Carrocera S. A. (formerly
known as Hispano Carrocera S.A.) # Spain - - - - -21.00 2.34 2.34 (2.34) * -
6) Telcon Ecoroad Resurfaces Pvt. Ltd. @ India - - - - -24.55 7.20 1.08 (5.87) 1.33
7) Automobile Corporation of Goa Ltd. India 42.37 99.67 52.78 7.71 107.3842.37 99.67 52.78 11.79 111.46
8) Jaguar Cars Finance Ltd UK 49.90 0.51 - - 0.5149.90 0.51 - - 0.51
9) Telco Construction Equipment
Company Ltd. ** India 40.00 80.20 0.20 155.93 ^ 236.13- - - - -
Total 352.23 52.55 232.02 584.25
281.57 55.77 17.73 299.30
* Share of loss restricted to the original cost of Investment as per the equity method of accounting for associates under AS -23 ‘Accounting for Investments in Associates
in Consolidated Financial Statements’.
** Subsidiary upto March 30, 2010 thereafter Associate.
@ Associate upto March 30, 2010 (Refer Note C(3) (b), Page 119)
# Associate upto October 15, 2009, thereafter subsidiary.
^ The original cost of Investments of Rs. 80.20 crores represents cost of balance 40% held and share of post acquisition reserve of Rs. 155.93 crores represents Reserves
and Surplus from date of initial investment in Telco Construction Equipment Company Ltd.

103
Schedules forming part of the Consolidated Balance Sheet(Rs. in crores)
“7” [Item no. 12 (b)]
As at As at
March 31, March 31,
2010 2009
INVENTORIES(a) Stores and spare parts (at or below cost) 221.52 194.29
(b) Consumable tools (at cost) 66.56 71.73
(c) Raw materials and components 1381.67 1834.66
(d) Work-in-progress 998.46 1044.02
(e) Stock-in-trade 8223.90 7572.56
(f ) Goods-in-transit (at cost) 419.92 233.34
11312.03 10950.60
Note: Items (c), (d) and (e) above are valued at lower of cost and net realisable value.
“8” [Item no. 12 (c)]
As at As at
March 31, March 31,
2010 2009
SUNDRY DEBTORS(a) Over six months : (unsecured) 242.35 286.52
(b) Others : (unsecured) 7209.46 4694.08
7451.81 4980.60
Less: Provision for doubtful debts 260.63 185.74
7191.18 4794.86
“9” [Item no. 12 (d)]
As at As at
March 31, March 31,
2010 2009
CASH AND BANK BALANCES(a) Cash on hand 32.54 35.12
(b) Current accounts with Banks # 6027.41 2108.00
(c) Short term deposits with Banks * 897.30 248.64
(d) Margin Money / Cash Collateral with Scheduled Banks 1786.07 1729.58
8743.32 4121.34
# Includes :
Cheques on hand 264.90 259.29
Remittances in transit 398.06 434.23
* Includes :
Restricted deposits 22.20 5.61
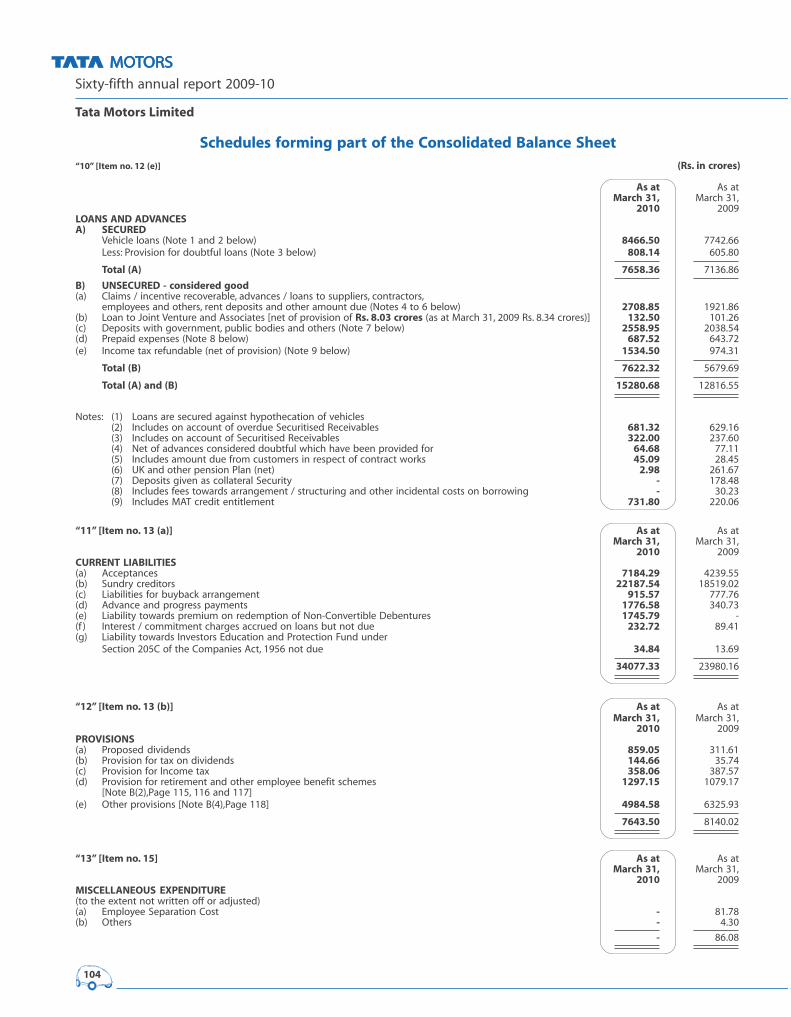
Sixty-fifth annual report 2009-10
Tata Motors Limited
104
Schedules forming part of the Consolidated Balance Sheet“10” [Item no. 12 (e)] (Rs. in crores)
As at As at
March 31, March 31,
2010 2009
LOANS AND ADVANCESA) SECURED
Vehicle loans (Note 1 and 2 below) 8466.50 7742.66
Less: Provision for doubtful loans (Note 3 below) 808.14 605.80
Total (A) 7658.36 7136.86
B) UNSECURED - considered good(a) Claims / incentive recoverable, advances / loans to suppliers, contractors,
employees and others, rent deposits and other amount due (Notes 4 to 6 below) 2708.85 1921.86
(b) Loan to Joint Venture and Associates [net of provision of Rs. 8.03 crores (as at March 31, 2009 Rs. 8.34 crores)] 132.50 101.26
(c) Deposits with government, public bodies and others (Note 7 below) 2558.95 2038.54
(d) Prepaid expenses (Note 8 below) 687.52 643.72
(e) Income tax refundable (net of provision) (Note 9 below) 1534.50 974.31
Total (B) 7622.32 5679.69
Total (A) and (B) 15280.68 12816.55
Notes: (1) Loans are secured against hypothecation of vehicles
(2) Includes on account of overdue Securitised Receivables 681.32 629.16
(3) Includes on account of Securitised Receivables 322.00 237.60
(4) Net of advances considered doubtful which have been provided for 64.68 77.11
(5) Includes amount due from customers in respect of contract works 45.09 28.45
(6) UK and other pension Plan (net) 2.98 261.67
(7) Deposits given as collateral Security - 178.48
(8) Includes fees towards arrangement / structuring and other incidental costs on borrowing - 30.23
(9) Includes MAT credit entitlement 731.80 220.06
“11” [Item no. 13 (a)] As at As at
March 31, March 31,
2010 2009
CURRENT LIABILITIES(a) Acceptances 7184.29 4239.55
(b) Sundry creditors 22187.54 18519.02
(c) Liabilities for buyback arrangement 915.57 777.76
(d) Advance and progress payments 1776.58 340.73
(e) Liability towards premium on redemption of Non-Convertible Debentures 1745.79 -
(f ) Interest / commitment charges accrued on loans but not due 232.72 89.41
(g) Liability towards Investors Education and Protection Fund under
Section 205C of the Companies Act, 1956 not due 34.84 13.69
34077.33 23980.16
“12” [Item no. 13 (b)] As at As at
March 31, March 31,
2010 2009
PROVISIONS(a) Proposed dividends 859.05 311.61
(b) Provision for tax on dividends 144.66 35.74
(c) Provision for Income tax 358.06 387.57
(d) Provision for retirement and other employee benefit schemes 1297.15 1079.17
[Note B(2),Page 115, 116 and 117]
(e) Other provisions [Note B(4),Page 118] 4984.58 6325.93
7643.50 8140.02
“13” [Item no. 15] As at As at
March 31, March 31,
2010 2009
MISCELLANEOUS EXPENDITURE(to the extent not written off or adjusted)
(a) Employee Separation Cost - 81.78
(b) Others - 4.30
- 86.08

105
Schedules forming part of the Consolidated Balance Sheet and Profit and Loss AccountBasis of Consolidation and Significant Accounting Policies
(1) Basis of Consolidation:The consolidated financial statements relate to Tata Motors Limited (the Company), its subsidiary companies, joint ventures and associates. The
Company and its subsidiaries constitute the Group.
(a) Basis of accounting:
I. The financial statements of the subsidiary companies / joint ventures used in the consolidation are drawn upto the same reporting date
as of the Company i.e. year ended March 31, 2010.
II. The financial statements of the Group have been prepared in accordance with the Accounting Standards issued by the Institute of
Chartered Accountants of India / notified under the Companies (Accounting Standards) Rules, 2006 and other generally accepted
accounting principles in India.
(b) Basis of preparation:
The financial statements are prepared under the historical cost convention on an accrual basis of accounting in accordance with the generally
accepted accounting principles, Accounting Standards notified under Section 211 (3C) of the Companies Act, 1956 and the relevant provisions
thereof.
(c) Use of estimates:
The preparation of financial statements requires management to make judgments, estimates and assumptions, that affect the application of
accounting policies and the reported amounts of assets and liabilities and disclosures of contingent liabilities at the date of these financial
statements and the reported amounts of revenues and expenses for the years presented. Actual results may differ from these estimates.
Estimates and underlying assumptions are reviewed on an ongoing basis. Revisions to accounting estimates are recognised in the year in
which the estimate is revised and future years affected.
(d) Principles of consolidation:
The consolidated financial statements have been prepared on the following basis:
I. The financial statements of the Company and its subsidiary companies have been combined on a line-by-line basis by adding together
like items of assets, liabilities, income and expenses. The intra-group balances and intra-group transactions and unrealised profits or
losses have been fully eliminated.
II. The consolidated financial statements include the share of profit / loss of the associate companies which has been accounted as per the
‘Equity method’, and accordingly, the share of profit / loss of each of the associate companies (the loss being restricted to the cost of
investment) has been added to / deducted from the cost of investments.
An associate is an enterprise in which the investor has significant influence and which is neither a Subsidiary nor a joint venture of the
investor.
III. The financial statements of the joint venture companies have been combined by using proportionate consolidation method and
accordingly, venturer’s share of each of the assets, liabilities, income and expenses of jointly controlled entity is reported as separate line
items in the Consolidated Financial Statements. (Note C (1), Page 119)
IV. The excess of cost to the Company of its investments in the subsidiary companies / joint ventures over its share of equity of the subsidiary
companies / joint ventures, at the dates on which the investments in the subsidiary companies / joint ventures are made, is recognised
as ‘Goodwill’ being an asset in the consolidated financial statements. Alternatively, where the share of equity in the subsidiary companies
/ joint ventures as on the date of investment is in excess of cost of investment of the Company, it is recognised as ‘Capital Reserve’ and
shown under the head ‘Reserves and Surplus’, in the consolidated financial statements.
V. Minority interest in the net assets of consolidated subsidiaries consists of the amount of equity attributable to the minority shareholders
at the dates on which investments are made by the Company in the subsidiary companies and further movements in their share in the
equity, subsequent to the dates of investments as stated above.
(e) The following subsidiary companies are considered in the consolidated financial statements:
% of holding either directlyor through subsidiaries as
Sr Country of at March 31,No. Name of the Subsidiary Company incorporation 2010 2009
Direct Subsidiaries1 Tata Daewoo Commercial Vehicle Co. Ltd. South Korea 100 100
2 Telco Construction Equipment Company Ltd.
(Subsidiary upto March 30, 2010 thereafter associate) India - 60
3 HV Axles Ltd. India 85 85
4 HV Transmissions Ltd. India 85 85
5 TAL Manufacturing Solutions Ltd. India 100 100
6 Sheba Properties Ltd. India 100 100
7 Concorde Motors (India) Ltd. India 100 100
8 Tata Motors Insurance Broking & Advisory Services Ltd India 100 100
9 Tata Motors European Technical Centre Plc. UK 100 100
10 Tata Technologies Ltd. India 81.36 81.55
11 Tata Motors Finance Ltd. India 100 100
12 Tata Marcopolo Motors Ltd. India 51 51
13 Tata Motors (Thailand) Ltd. Thailand 86.78 70
14 TML Holdings Pte Ltd, Singapore Singapore 100 100
15 TML Distribution Company Ltd. India 100 100
16 Tata Motors (SA) (Proprietary) Ltd. South Africa 60 60
17 Tata Hispano Motors Carrocera S.A.
(Formerly known as Hispano Carrocera S.A.) (w.e.f October 16, 2009)* Spain 100 21
Indirect Subsidiaries **18 Tata Technologies (Thailand) Ltd (Formerly known as INCAT (Thailand) Ltd) Thailand 81.36 81.55
19 Tata Technologies Pte. Ltd. Singapore 81.36 81.55
20 INCAT International Plc. UK 81.36 81.55
21 Tata Technologies Europe Ltd UK 81.36 81.55
22 INCAT SAS. France 81.36 81.55
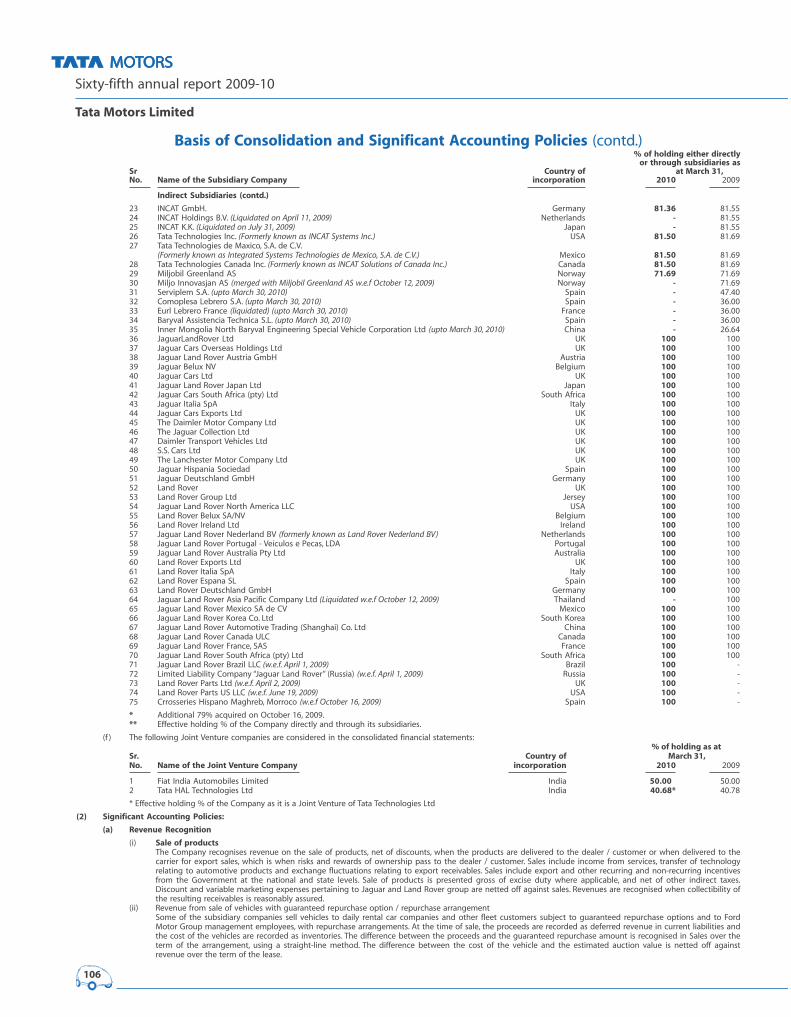
Sixty-fifth annual report 2009-10
Tata Motors Limited
106
Basis of Consolidation and Significant Accounting Policies (contd.)% of holding either directly
or through subsidiaries asSr Country of at March 31,No. Name of the Subsidiary Company incorporation 2010 2009
Indirect Subsidiaries (contd.)
23 INCAT GmbH. Germany 81.36 81.55
24 INCAT Holdings B.V. (Liquidated on April 11, 2009) Netherlands - 81.55
25 INCAT K.K. (Liquidated on July 31, 2009) Japan - 81.55
26 Tata Technologies Inc. (Formerly known as INCAT Systems Inc.) USA 81.50 81.69
27 Tata Technologies de Maxico, S.A. de C.V.
(Formerly known as Integrated Systems Technologies de Mexico, S.A. de C.V.) Mexico 81.50 81.69
28 Tata Technologies Canada Inc. (Formerly known as INCAT Solutions of Canada Inc.) Canada 81.50 81.69
29 Miljobil Greenland AS Norway 71.69 71.69
30 Miljo Innovasjan AS (merged with Miljobil Greenland AS w.e.f October 12, 2009) Norway - 71.69
31 Serviplem S.A. (upto March 30, 2010) Spain - 47.40
32 Comoplesa Lebrero S.A. (upto March 30, 2010) Spain - 36.00
33 Eurl Lebrero France (liquidated) (upto March 30, 2010) France - 36.00
34 Baryval Assistencia Technica S.L. (upto March 30, 2010) Spain - 36.00
35 Inner Mongolia North Baryval Engineering Special Vehicle Corporation Ltd (upto March 30, 2010) China - 26.64
36 JaguarLandRover Ltd UK 100 100
37 Jaguar Cars Overseas Holdings Ltd UK 100 100
38 Jaguar Land Rover Austria GmbH Austria 100 100
39 Jaguar Belux NV Belgium 100 100
40 Jaguar Cars Ltd UK 100 100
41 Jaguar Land Rover Japan Ltd Japan 100 100
42 Jaguar Cars South Africa (pty) Ltd South Africa 100 100
43 Jaguar Italia SpA Italy 100 100
44 Jaguar Cars Exports Ltd UK 100 100
45 The Daimler Motor Company Ltd UK 100 100
46 The Jaguar Collection Ltd UK 100 100
47 Daimler Transport Vehicles Ltd UK 100 100
48 S.S. Cars Ltd UK 100 100
49 The Lanchester Motor Company Ltd UK 100 100
50 Jaguar Hispania Sociedad Spain 100 100
51 Jaguar Deutschland GmbH Germany 100 100
52 Land Rover UK 100 100
53 Land Rover Group Ltd Jersey 100 100
54 Jaguar Land Rover North America LLC USA 100 100
55 Land Rover Belux SA/NV Belgium 100 100
56 Land Rover Ireland Ltd Ireland 100 100
57 Jaguar Land Rover Nederland BV (formerly known as Land Rover Nederland BV) Netherlands 100 100
58 Jaguar Land Rover Portugal - Veiculos e Pecas, LDA Portugal 100 100
59 Jaguar Land Rover Australia Pty Ltd Australia 100 100
60 Land Rover Exports Ltd UK 100 100
61 Land Rover Italia SpA Italy 100 100
62 Land Rover Espana SL Spain 100 100
63 Land Rover Deutschland GmbH Germany 100 100
64 Jaguar Land Rover Asia Pacific Company Ltd (Liquidated w.e.f October 12, 2009) Thailand - 100
65 Jaguar Land Rover Mexico SA de CV Mexico 100 100
66 Jaguar Land Rover Korea Co. Ltd South Korea 100 100
67 Jaguar Land Rover Automotive Trading (Shanghai) Co. Ltd China 100 100
68 Jaguar Land Rover Canada ULC Canada 100 100
69 Jaguar Land Rover France, SAS France 100 100
70 Jaguar Land Rover South Africa (pty) Ltd South Africa 100 100
71 Jaguar Land Rover Brazil LLC (w.e.f. April 1, 2009) Brazil 100 -
72 Limited Liability Company “Jaguar Land Rover” (Russia) (w.e.f. April 1, 2009) Russia 100 -
73 Land Rover Parts Ltd (w.e.f. April 2, 2009) UK 100 -
74 Land Rover Parts US LLC (w.e.f. June 19, 2009) USA 100 -
75 Crrosseries Hispano Maghreb, Morroco (w.e.f October 16, 2009) Spain 100 -
* Additional 79% acquired on October 16, 2009.
** Effective holding % of the Company directly and through its subsidiaries.
(f ) The following Joint Venture companies are considered in the consolidated financial statements:
% of holding as atSr. Country of March 31,No. Name of the Joint Venture Company incorporation 2010 2009
1 Fiat India Automobiles Limited India 50.00 50.00
2 Tata HAL Technologies Ltd India 40.68* 40.78
* Effective holding % of the Company as it is a Joint Venture of Tata Technologies Ltd
(2) Significant Accounting Policies:
(a) Revenue Recognition
(i) Sale of productsThe Company recognises revenue on the sale of products, net of discounts, when the products are delivered to the dealer / customer or when delivered to the
carrier for export sales, which is when risks and rewards of ownership pass to the dealer / customer. Sales include income from services, transfer of technology
relating to automotive products and exchange fluctuations relating to export receivables. Sales include export and other recurring and non-recurring incentives
from the Government at the national and state levels. Sale of products is presented gross of excise duty where applicable, and net of other indirect taxes.
Discount and variable marketing expenses pertaining to Jaguar and Land Rover group are netted off against sales. Revenues are recognised when collectibility of
the resulting receivables is reasonably assured.
(ii) Revenue from sale of vehicles with guaranteed repurchase option / repurchase arrangement
Some of the subsidiary companies sell vehicles to daily rental car companies and other fleet customers subject to guaranteed repurchase options and to Ford
Motor Group management employees, with repurchase arrangements. At the time of sale, the proceeds are recorded as deferred revenue in current liabilities and
the cost of the vehicles are recorded as inventories. The difference between the proceeds and the guaranteed repurchase amount is recognised in Sales over the
term of the arrangement, using a straight-line method. The difference between the cost of the vehicle and the estimated auction value is netted off against
revenue over the term of the lease.
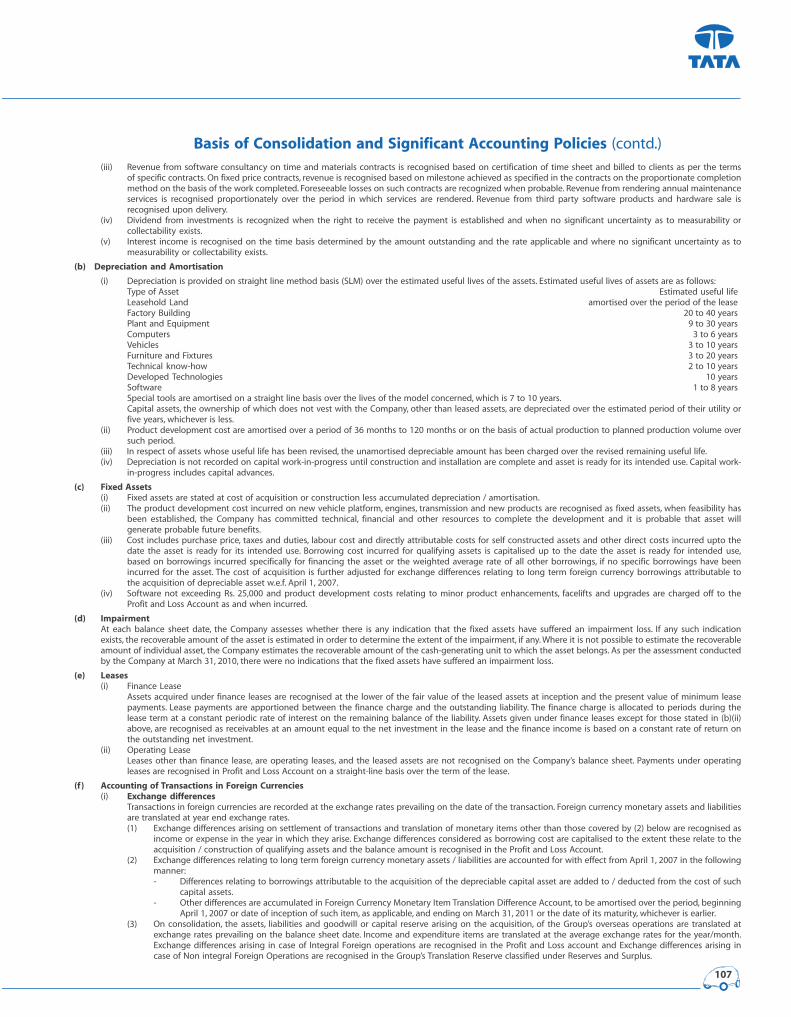
107
Basis of Consolidation and Significant Accounting Policies (contd.)(iii) Revenue from software consultancy on time and materials contracts is recognised based on certification of time sheet and billed to clients as per the terms
of specific contracts. On fixed price contracts, revenue is recognised based on milestone achieved as specified in the contracts on the proportionate completion
method on the basis of the work completed. Foreseeable losses on such contracts are recognized when probable. Revenue from rendering annual maintenance
services is recognised proportionately over the period in which services are rendered. Revenue from third party software products and hardware sale is
recognised upon delivery.
(iv) Dividend from investments is recognized when the right to receive the payment is established and when no significant uncertainty as to measurability or
collectability exists.
(v) Interest income is recognised on the time basis determined by the amount outstanding and the rate applicable and where no significant uncertainty as to
measurability or collectability exists.
(b) Depreciation and Amortisation
(i) Depreciation is provided on straight line method basis (SLM) over the estimated useful lives of the assets. Estimated useful lives of assets are as follows:
Type of Asset Estimated useful life
Leasehold Land amortised over the period of the lease
Factory Building 20 to 40 years
Plant and Equipment 9 to 30 years
Computers 3 to 6 years
Vehicles 3 to 10 years
Furniture and Fixtures 3 to 20 years
Technical know-how 2 to 10 years
Developed Technologies 10 years
Software 1 to 8 years
Special tools are amortised on a straight line basis over the lives of the model concerned, which is 7 to 10 years.
Capital assets, the ownership of which does not vest with the Company, other than leased assets, are depreciated over the estimated period of their utility or
five years, whichever is less.
(ii) Product development cost are amortised over a period of 36 months to 120 months or on the basis of actual production to planned production volume over
such period.
(iii) In respect of assets whose useful life has been revised, the unamortised depreciable amount has been charged over the revised remaining useful life.
(iv) Depreciation is not recorded on capital work-in-progress until construction and installation are complete and asset is ready for its intended use. Capital work-
in-progress includes capital advances.
(c) Fixed Assets(i) Fixed assets are stated at cost of acquisition or construction less accumulated depreciation / amortisation.
(ii) The product development cost incurred on new vehicle platform, engines, transmission and new products are recognised as fixed assets, when feasibility has
been established, the Company has committed technical, financial and other resources to complete the development and it is probable that asset will
generate probable future benefits.
(iii) Cost includes purchase price, taxes and duties, labour cost and directly attributable costs for self constructed assets and other direct costs incurred upto the
date the asset is ready for its intended use. Borrowing cost incurred for qualifying assets is capitalised up to the date the asset is ready for intended use,
based on borrowings incurred specifically for financing the asset or the weighted average rate of all other borrowings, if no specific borrowings have been
incurred for the asset. The cost of acquisition is further adjusted for exchange differences relating to long term foreign currency borrowings attributable to
the acquisition of depreciable asset w.e.f. April 1, 2007.
(iv) Software not exceeding Rs. 25,000 and product development costs relating to minor product enhancements, facelifts and upgrades are charged off to the
Profit and Loss Account as and when incurred.
(d) ImpairmentAt each balance sheet date, the Company assesses whether there is any indication that the fixed assets have suffered an impairment loss. If any such indication
exists, the recoverable amount of the asset is estimated in order to determine the extent of the impairment, if any. Where it is not possible to estimate the recoverable
amount of individual asset, the Company estimates the recoverable amount of the cash-generating unit to which the asset belongs. As per the assessment conducted
by the Company at March 31, 2010, there were no indications that the fixed assets have suffered an impairment loss.
(e) Leases(i) Finance Lease
Assets acquired under finance leases are recognised at the lower of the fair value of the leased assets at inception and the present value of minimum lease
payments. Lease payments are apportioned between the finance charge and the outstanding liability. The finance charge is allocated to periods during the
lease term at a constant periodic rate of interest on the remaining balance of the liability. Assets given under finance leases except for those stated in (b)(ii)
above, are recognised as receivables at an amount equal to the net investment in the lease and the finance income is based on a constant rate of return on
the outstanding net investment.
(ii) Operating Lease
Leases other than finance lease, are operating leases, and the leased assets are not recognised on the Company’s balance sheet. Payments under operating
leases are recognised in Profit and Loss Account on a straight-line basis over the term of the lease.
(f) Accounting of Transactions in Foreign Currencies(i) Exchange differences
Transactions in foreign currencies are recorded at the exchange rates prevailing on the date of the transaction. Foreign currency monetary assets and liabilities
are translated at year end exchange rates.
(1) Exchange differences arising on settlement of transactions and translation of monetary items other than those covered by (2) below are recognised as
income or expense in the year in which they arise. Exchange differences considered as borrowing cost are capitalised to the extent these relate to the
acquisition / construction of qualifying assets and the balance amount is recognised in the Profit and Loss Account.
(2) Exchange differences relating to long term foreign currency monetary assets / liabilities are accounted for with effect from April 1, 2007 in the following
manner:
- Differences relating to borrowings attributable to the acquisition of the depreciable capital asset are added to / deducted from the cost of such
capital assets.
- Other differences are accumulated in Foreign Currency Monetary Item Translation Difference Account, to be amortised over the period, beginning
April 1, 2007 or date of inception of such item, as applicable, and ending on March 31, 2011 or the date of its maturity, whichever is earlier.
(3) On consolidation, the assets, liabilities and goodwill or capital reserve arising on the acquisition, of the Group’s overseas operations are translated at
exchange rates prevailing on the balance sheet date. Income and expenditure items are translated at the average exchange rates for the year/month.
Exchange differences arising in case of Integral Foreign operations are recognised in the Profit and Loss account and Exchange differences arising in
case of Non integral Foreign Operations are recognised in the Group’s Translation Reserve classified under Reserves and Surplus.
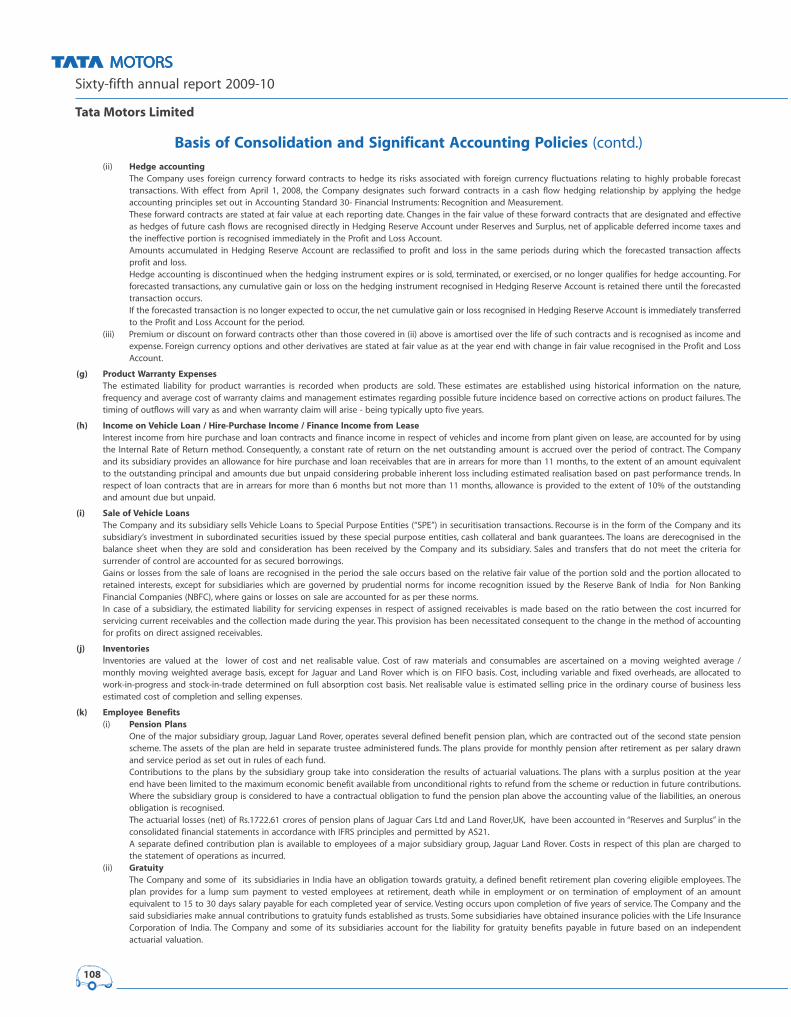
Sixty-fifth annual report 2009-10
Tata Motors Limited
108
Basis of Consolidation and Significant Accounting Policies (contd.)(ii) Hedge accounting
The Company uses foreign currency forward contracts to hedge its risks associated with foreign currency fluctuations relating to highly probable forecast
transactions. With effect from April 1, 2008, the Company designates such forward contracts in a cash flow hedging relationship by applying the hedge
accounting principles set out in Accounting Standard 30- Financial Instruments: Recognition and Measurement.
These forward contracts are stated at fair value at each reporting date. Changes in the fair value of these forward contracts that are designated and effective
as hedges of future cash flows are recognised directly in Hedging Reserve Account under Reserves and Surplus, net of applicable deferred income taxes and
the ineffective portion is recognised immediately in the Profit and Loss Account.
Amounts accumulated in Hedging Reserve Account are reclassified to profit and loss in the same periods during which the forecasted transaction affects
profit and loss.
Hedge accounting is discontinued when the hedging instrument expires or is sold, terminated, or exercised, or no longer qualifies for hedge accounting. For
forecasted transactions, any cumulative gain or loss on the hedging instrument recognised in Hedging Reserve Account is retained there until the forecasted
transaction occurs.
If the forecasted transaction is no longer expected to occur, the net cumulative gain or loss recognised in Hedging Reserve Account is immediately transferred
to the Profit and Loss Account for the period.
(iii) Premium or discount on forward contracts other than those covered in (ii) above is amortised over the life of such contracts and is recognised as income and
expense. Foreign currency options and other derivatives are stated at fair value as at the year end with change in fair value recognised in the Profit and Loss
Account.
(g) Product Warranty ExpensesThe estimated liability for product warranties is recorded when products are sold. These estimates are established using historical information on the nature,
frequency and average cost of warranty claims and management estimates regarding possible future incidence based on corrective actions on product failures. The
timing of outflows will vary as and when warranty claim will arise - being typically upto five years.
(h) Income on Vehicle Loan / Hire-Purchase Income / Finance Income from LeaseInterest income from hire purchase and loan contracts and finance income in respect of vehicles and income from plant given on lease, are accounted for by using
the Internal Rate of Return method. Consequently, a constant rate of return on the net outstanding amount is accrued over the period of contract. The Company
and its subsidiary provides an allowance for hire purchase and loan receivables that are in arrears for more than 11 months, to the extent of an amount equivalent
to the outstanding principal and amounts due but unpaid considering probable inherent loss including estimated realisation based on past performance trends. In
respect of loan contracts that are in arrears for more than 6 months but not more than 11 months, allowance is provided to the extent of 10% of the outstanding
and amount due but unpaid.
(i) Sale of Vehicle LoansThe Company and its subsidiary sells Vehicle Loans to Special Purpose Entities (“SPE”) in securitisation transactions. Recourse is in the form of the Company and its
subsidiary’s investment in subordinated securities issued by these special purpose entities, cash collateral and bank guarantees. The loans are derecognised in the
balance sheet when they are sold and consideration has been received by the Company and its subsidiary. Sales and transfers that do not meet the criteria for
surrender of control are accounted for as secured borrowings.
Gains or losses from the sale of loans are recognised in the period the sale occurs based on the relative fair value of the portion sold and the portion allocated to
retained interests, except for subsidiaries which are governed by prudential norms for income recognition issued by the Reserve Bank of India for Non Banking
Financial Companies (NBFC), where gains or losses on sale are accounted for as per these norms.
In case of a subsidiary, the estimated liability for servicing expenses in respect of assigned receivables is made based on the ratio between the cost incurred for
servicing current receivables and the collection made during the year. This provision has been necessitated consequent to the change in the method of accounting
for profits on direct assigned receivables.
(j) InventoriesInventories are valued at the lower of cost and net realisable value. Cost of raw materials and consumables are ascertained on a moving weighted average /
monthly moving weighted average basis, except for Jaguar and Land Rover which is on FIFO basis. Cost, including variable and fixed overheads, are allocated to
work-in-progress and stock-in-trade determined on full absorption cost basis. Net realisable value is estimated selling price in the ordinary course of business less
estimated cost of completion and selling expenses.
(k) Employee Benefits(i) Pension Plans
One of the major subsidiary group, Jaguar Land Rover, operates several defined benefit pension plan, which are contracted out of the second state pension
scheme. The assets of the plan are held in separate trustee administered funds. The plans provide for monthly pension after retirement as per salary drawn
and service period as set out in rules of each fund.
Contributions to the plans by the subsidiary group take into consideration the results of actuarial valuations. The plans with a surplus position at the year
end have been limited to the maximum economic benefit available from unconditional rights to refund from the scheme or reduction in future contributions.
Where the subsidiary group is considered to have a contractual obligation to fund the pension plan above the accounting value of the liabilities, an onerous
obligation is recognised.
The actuarial losses (net) of Rs.1722.61 crores of pension plans of Jaguar Cars Ltd and Land Rover,UK, have been accounted in “Reserves and Surplus” in the
consolidated financial statements in accordance with IFRS principles and permitted by AS21.
A separate defined contribution plan is available to employees of a major subsidiary group, Jaguar Land Rover. Costs in respect of this plan are charged to
the statement of operations as incurred.
(ii) GratuityThe Company and some of its subsidiaries in India have an obligation towards gratuity, a defined benefit retirement plan covering eligible employees. The
plan provides for a lump sum payment to vested employees at retirement, death while in employment or on termination of employment of an amount
equivalent to 15 to 30 days salary payable for each completed year of service. Vesting occurs upon completion of five years of service. The Company and the
said subsidiaries make annual contributions to gratuity funds established as trusts. Some subsidiaries have obtained insurance policies with the Life Insurance
Corporation of India. The Company and some of its subsidiaries account for the liability for gratuity benefits payable in future based on an independent
actuarial valuation.

109
Basis of Consolidation and Significant Accounting Policies (contd.)(iii) Superannuation
The Company and some of its subsidiaries have two superannuation plans, a defined benefit plan and a defined contribution plan. An eligible employee on
April 1, 1996 could elect to be a member of either plan.
Employees who are members of the defined benefit superannuation plan are entitled to benefits depending on the years of service and salary drawn. The
monthly pension benefits after retirement range from 0.75% to 2% of the annual basic salary for each year of service. The Company and the said subsidiaries
account for superannuation benefits payable in future under the plan based on an independent actuarial valuation.
With effect from April 1, 2003, this plan was amended and benefits earned by covered employees have been protected as at March 31, 2003. Employees
covered by this plan are prospectively entitled to benefits computed on a basis that ensures that the annual cost of providing the pension benefits would
not exceed 15% of salary.
The Company and some of its subsidiaries maintain separate irrevocable trusts for employees covered and entitled to benefits. The Company and its subsidiaries
contributes up to 15% of the eligible employees’ salary to the trust every year. Such contributions are recognized as an expense when incurred. The Company
and the said subsidiaries have no further obligation beyond this contribution.
(iv) Bhavishya Kalyan Yojana (BKY)Bhavishya Kalyan Yojana is an unfunded defined benefit plan. The benefits of the plan include pension in certain case, payable upto the date of normal
superannuation had the employee been in service, to an eligible employee at the time of death or permanent disablement, while in service, either as a result
of an injury or as certified by the Company’s Medical Board. The monthly payment to dependents of the deceased / disabled employee under the plan
equals 50% of the salary drawn at the time of death or accident or a specified amount, whichever is higher. The Company accounts for the liability for BKY
benefits payable in future based on an independent actuarial valuation.
(v) Severance indemintyTata Daewoo Commercial Vehicle Company Limited, TDCV a subsidiary company incorporated in Korea has an obligation towards severance indemnity, a
defined benefit retirement plan, covering eligible employees. The plan provides for a lump sum payment to all employees with more than one year of
employment equivalent to 30 days’ salary payable for each completed year of service.
(vi) Post-retirement Medicare SchemeUnder this scheme, employees of the Company and some of its subsidiaries get medical benefits subject to certain limits of amount, periods after retirement
and types of benefits, depending on their grade and location at the time of retirement. Employees separated from the Company as part of Early Separation
Scheme, on medical grounds or due to permanent disablement are also covered under the scheme. The Company and the said subsidiaries account for the
liability for post-retirement medical scheme based on an independent actuarial valuation.
(vii) Provident fund and family pensionThe eligible employees of the Company and some of its subsidiaries are entitled to receive benefits in respect of provident fund, a defined contribution plan,
in which both employees and the company/subsidiaries make monthly/annual contributions at a specified percentage of the covered employees’ salary
(currently 12% of employees’ salary). The contributions, as specified under the law, are made to the provident fund and pension fund set up as irrevocable
trust by the Company and its subsidiaries or to respective Regional Provident Fund Commissioner and the Central Provident Fund under the State Pension
scheme. The Company and some of its subsidiaries are generally liable for monthly/annual contributions and any shortfall in the fund assets based on the
government specified minimum rates of return or pension and recognises such contributions and shortfall, if any, as an expense in the year incurred.
(viii) Compensated absencesThe Company and some of its subsidiaries provides for the encashment of leave or leave with pay subject to certain rules. The employees are entitled to
accumulate leave subject to certain limits, for future encashment. The liability is provided based on the number of days of unutilized leave at each balance
sheet date on basis of an independent actuarial valuation.
(l) Investments(i) Long term investments are stated at cost less other than temporary diminution in value, if any.
(ii) Investment in associate companies are accounted as per the ‘Equity method’, and accordingly, the share of post acquisition reserves of each of the associate
companies has been added to / deducted from the cost of investments.
(iii) Current investments are stated at lower of cost and fair value. Fair value of investments in mutual funds are determined on a portfolio basis.
(m) Income Tax Expenses
Income tax expenses comprises current and deferred taxes. Current taxes are determined based on respective taxable income of each taxable entity and tax rules
applicable for respective tax jurisdictions. Current tax is net of credit for entitlement for Minimum Alternative tax. Current tax includes Fringe benefit tax, applicable
upto year ended March 31, 2009.
Deferred tax is recognised, on timing differences, being the difference between taxable income and accounting income that originate in one period and are capable
of reversal in one or more subsequent periods. Deferred tax assets in respect of unabsorbed depreciation and carry forward of losses are recognised if there is
virtual certainty that there will be sufficient future taxable income available to realise such losses. Such deferred tax assets and liabilities are computed separately
for each taxable entity and for each taxable jurisdiction.
Deferred tax assets and liabilities are measured based on the tax rates that are expected to apply in the period when asset is realised or the liability is settled, based
on tax rates and tax laws that have been enacted or substantially enacted by the balance sheet date.
(n) Issue expenses / Redemption premium / discount on Foreign Currency Convertible Notes (FCCN) / Convertible Alternative Reference Securities (CARS) /Non Convertible Debentures (NCD)Issue expenses and premium payable on redemption of FCCN / CARS / NCD as per the terms of issue, is provided fully in the year of issue by adjusting against the
Securities Premium Account (SPA). Any change in the premium payable, consequent to conversion or exchange fluctuations is adjusted to the SPA. Discount on
redemption of FCCN, if any, will be recognised on redemption.
(o) Borrowing costsFees towards structuring / arrangements and underwriting and other incidental costs incurred in connection with borrowings are amortised over the period of the
loan.

Sixty-fifth annual report 2009-10
Tata Motors Limited
110
Schedules forming part of the Consolidated Balance Sheet and Profit and Loss Account(Rs. in crores)
“14”[Item no. 18](A) Notes to Balance Sheet
1. Foreign Currency Monetary Item Translation Difference Account (Item 4 and Item 11, Page 94)As at As at
March 31, March 31,
2010 2009
Opening Balance (net loss) 636.48 -(a) Exchange (gain) / loss on Foreign Currency Loan given 14.72 (3.71)
(b) Exchange (gain) / loss on FCCN / CARS / Bridge Loan (840.00) 640.19
(c) Adjustments for sale of Controlling stake in a subsidiary (2.35) -
Closing Balance (net gain) (191.15) 636.48
As at As at
March 31, March 31,
2010 2009
2. (a) Claims not acknowledged as debts 1036.35 842.54
(b) Provision not made for income tax matters in dispute 425.10 443.13
3. The claims / liabilities in respect of excise duty, sales tax and other matters where the
issues were decided in favour of the Company for which department is in further appeal 39.54 28.30
4. Estimated amount of contracts remaining to be executed on capital account and not provided for 2720.87 4545.46
5. Other money for which the Company is contingently liable:
(a) In respect of bills discounted and export sales on deferred credit 462.10 293.84
(b) The Company has given guarantees for liability in respect of receivables assigned by way of securitisation 2970.56 2398.78
(c) Cash Margin / Collateral 1779.91 1702.01
(d) In respect of retained interest in securitisation transactions 1.32 56.71
(e) In respect of subordinated receivables 139.30 242.56
(f ) Inter corporate deposits placed as collateral security 20.00 198.49
(g) Others 55.19 14.18
6. Concorde Motors (India) Limited (CMIL), a subsidiary company acquired certain immovable properties pursuant to a scheme of Arrangement in the year 2004. Stamp duty is payable
on conveyance of properties in favour of CMIL.The stamp duty adjudication order has been passed by District Registrar (DUS) for Bangalore property fixing the market value of the
immovable property situated at Bangalore as on the date of acquisition at Rs.11.65 crores on which Stamp duty @ 7% amounting to Rs.0.82 crore has been paid by CMIL during the
year 2007-08 and has been capitalised under Land & Building. CMIL is in the process of completing similar formalities in respect of the Hyderabad Property that was acquired by CMIL
pursuant to the scheme referred above . It is not possible to quantify the amount of duty payable, and adjustments, as and when effected, will be carried out to the cost of land and
building relating the property at Hyderabad.
7. (a) Major components of deferred tax arising on account of timing differences are:
As at As at
March 31, March 31,
2010 2009
Liabilities:Depreciation (1108.13) (1211.35)
Product development cost and Reserves for Research and Development Expenses (1332.47) (1051.73)
Others (20.69) (22.23)
(2461.29) (2285.31)
Assets:Unabsorbed depreciation/ business loss 315.56 752.50
Employees separation schemes - 0.01
Employee benefits / Expenses allowable on payment basis 315.65 259.39
Provision for doubtful debts 327.58 236.13
Premium on redemption of CARS (net of exchange fluctuation on premium) 251.11 259.42
Others 97.76 97.65
1307.66 1605.10
Net Deferred Tax Liability (1153.63) (680.21)
As at As at
March 31, March 31,
2010 2009
(b) Classified on a company wise basis :
(a) Deferred Tax Asset 425.97 269.44
(b) Deferred Tax Liability (1579.60) (949.65)
Net Deferred Tax Liability (1153.63) (680.21)
2009-2010 2008-2009
(c) Deferred Tax (charge) / credit for the yearOpening net Deferred Tax Liability 680.21 974.45
Debited / (Credited) to Securities Premium Account 8.31 (47.10)
Debited / (Credited) to General Reserve - (19.03)
Debited / (Credited) to Hedging Reserve Account 45.06 (45.06)
Deferred tax on acquisition - (79.40)
Translation differences on opening balances in respect of foreign subsidiaries 4.98 14.67
Sale of controlling stake in a subsidiary (18.88) -
Others - 3.79
719.68 802.32
Less:- Closing net Deferred Tax Liability (1153.63) (680.21)
Deferred Tax (charge) / credit for the year (433.95) 122.11
As at March 31, 2010, a potential deferred tax asset of GBP 763.30 million (Rs. 5195.53 crores) exists in a subsidiary group, in relation to the capital allowance pool GBP134.50 million (Rs. 915.50 crores) and carried forward tax losses GBP 628.80 million (Rs. 4280.03 crores). This has not been recognised due to the economic uncertainty of
trading profits in the UK companies.
2009-2010 2008-2009
(d) Tax expensei) Current Tax (net of credit for Minimum Alternate Tax) 571.80 436.13
ii) Fringe Benefit Tax - 21.73
iii) Deferred Tax 433.95 (122.11)
1005.75 335.75
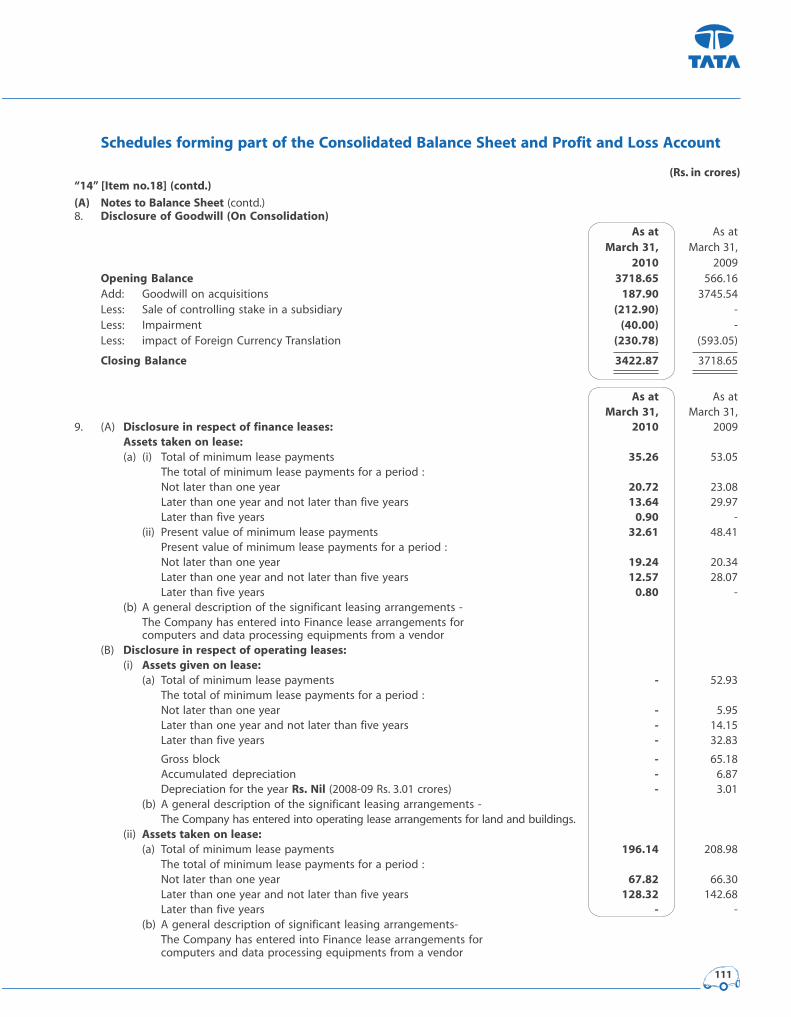
111
Schedules forming part of the Consolidated Balance Sheet and Profit and Loss Account
(Rs. in crores)“14” [Item no.18] (contd.)
(A) Notes to Balance Sheet (contd.)
8. Disclosure of Goodwill (On Consolidation)As at As at
March 31, March 31,
2010 2009
Opening Balance 3718.65 566.16
Add: Goodwill on acquisitions 187.90 3745.54
Less: Sale of controlling stake in a subsidiary (212.90) -
Less: Impairment (40.00) -
Less: impact of Foreign Currency Translation (230.78) (593.05)
Closing Balance 3422.87 3718.65
As at As at
March 31, March 31,
9. (A) Disclosure in respect of finance leases: 2010 2009
Assets taken on lease:(a) (i) Total of minimum lease payments 35.26 53.05
The total of minimum lease payments for a period :
Not later than one year 20.72 23.08
Later than one year and not later than five years 13.64 29.97
Later than five years 0.90 -
(ii) Present value of minimum lease payments 32.61 48.41
Present value of minimum lease payments for a period :
Not later than one year 19.24 20.34
Later than one year and not later than five years 12.57 28.07
Later than five years 0.80 -
(b) A general description of the significant leasing arrangements -
The Company has entered into Finance lease arrangements for
computers and data processing equipments from a vendor
(B) Disclosure in respect of operating leases:(i) Assets given on lease:
(a) Total of minimum lease payments - 52.93
The total of minimum lease payments for a period :
Not later than one year - 5.95
Later than one year and not later than five years - 14.15
Later than five years - 32.83
Gross block - 65.18
Accumulated depreciation - 6.87
Depreciation for the year Rs. Nil (2008-09 Rs. 3.01 crores) - 3.01
(b) A general description of the significant leasing arrangements -
The Company has entered into operating lease arrangements for land and buildings.
(ii) Assets taken on lease:(a) Total of minimum lease payments 196.14 208.98
The total of minimum lease payments for a period :
Not later than one year 67.82 66.30
Later than one year and not later than five years 128.32 142.68
Later than five years - -
(b) A general description of significant leasing arrangements-
The Company has entered into Finance lease arrangements for
computers and data processing equipments from a vendor

Sixty-fifth annual report 2009-10
Tata Motors Limited
112
Schedules forming part of the Consolidated Balance Sheet and Profit and Loss Account“14” [Item no.18] (contd.)
(A) Notes to Balance Sheet (contd.)
10. Related party disclosures for the year ended March 31, 2010(A) Related Party and their relationship
Associates Key Management PersonnelTata AutoComp Systems Ltd Mr. Ravi Kant (upto June 01, 2009)Tata Cummins Ltd Mr. P M Telang
Tata Precision Industries Pte. Ltd
Tata Sons Ltd (Investing Party)
Nita Company Ltd
Tata Hispano Motors Carrocera S.A. (Formerly known as Hispano Carrocera S.A.)(up to October 15, 2009 thereafter subsidiary)Telco Construction Equipment Company Ltd
(Subsidiary upto March 30, 2010 thereafter associate)Telcon Ecoroad Resurfaces Pvt. Ltd
(up to March 30, 2010)Automobile Corporation of Goa Ltd
Jaguar Cars Finance Ltd
Joint VenturesFiat India Automobiles Ltd
Tata HAL Technologies Ltd
(Rs. in crores)
(B) Transactions with the related parties Joint Venture Associates Key 2009-2010 Management Total
Personnel
Purchase of goods 1595.31 2463.58 - 4058.89374.67 1884.66 - 2259.33
Sale of goods (inclusive of sales tax) 142.98 271.64 - 414.6233.68 112.52 - 146.20
Purchase of fixed assets - - - -- 1.06 - 1.06
Sale of Investments - 693.39 - 693.39- 484.69 - 484.69
Services received 0.08 62.66 8.90 71.640.10 68.07 9.38 77.55
Services rendered 2.59 9.59 - 12.1813.99 11.10 - 25.09
Finance given (including loans and equity) 197.50 42.08 - 239.58292.92 28.93 - 321.85
Finance taken (including loans and equity) 132.50 67.00 - 199.5050.83 3007.25 - 3058.08
Interest / Dividend paid/(received) (net) (19.95) 86.05 - 66.10(16.98) 75.31 - 58.33
Amount Receivable 0.22 49.20 - 49.4241.59 24.22 - 65.81
Amount Payable 106.56 113.19 - 219.7577.98 126.54 - 204.52
Amount Receivable (in respect of loans, interest & Dividend) 140.53 33.79 0.10 174.42133.95 144.48 0.11 278.54
Amount Payable (in respect of loans) - 13.01 - 13.01- - - -
(C) Disclosure in respect of material transactions with related parties 2009-2010 2008-2009
i) Purchase of Goods Tata Cummins Ltd 1809.42 1213.81
Fiat India Automobiles Ltd. 1595.31 374.67
Automobile Corporation of Goa Ltd 190.37 293.92
Tata AutoComp Systems Ltd. 446.19 367.44
ii) Sale of Goods Tata Cummins Ltd 156.02 76.06
Fiat India Automobiles Ltd. 142.80 33.42
Nita Company Ltd 110.46 32.33
iii) Purchase of Fixed Assets Tata AutoComp Systems Ltd. - 1.06
iv) Sale of Investments Tata Sons Ltd 693.39 484.69
v) Services received Tata Sons Ltd 62.66 62.02
vi) Services rendered Tata Cummins Ltd 4.65 3.63
Tata Hispano Motors Carrocera S.A. 3.61 4.78
Tata AutoComp Systems Ltd. 1.27 2.35
vii) Finance given including Loan and Equity Fiat India Automobiles Ltd. 197.50 291.47
Telcon Ecoroad Resurfaces Private Ltd - 2.76
Tata Hispano Motors Carrocera S.A. 38.81 -
viii) Finance taken including Loan and Equity Fiat India Automobiles Ltd. 132.50 50.83
Tata Sons Limited - 2979.40
Automobile Corporation of Goa Ltd 67.00 -
ix) Interest/Dividend paid/(received)
Dividend paid Tata Sons Limited 108.50 126.73
Dividend received Tata Cummins Ltd (6.75) (27.00)
Dividend received Tata Sons Limited (9.36) (9.24)
Interest received Tata Hispano Motors Carrocera S.A. (2.80) (6.09)
Interest received Tata AutoComp Systems Ltd. (2.72) (4.52)

113
Schedules forming part of the Consolidated Balance Sheet and Profit and Loss Account“14'’ [Item no.18] (contd.)
(A) Notes to Balance Sheet (contd.)
11. Consolidated Segment Information for the year ended March 31, 2010 (Rs. in crores)(A) Primary segment
Inter-Segment
Automotive Others Eliminations Total
Tata Vehicles / Jaguar and Intraspares and Land Rover Segment Total
financing Business Eliminationsthereof *
a) RevenueExternal sales and income from other operations 40320.59 49344.21 (88.43) 89576.37 2942.88 - 92519.25
28567.88 39270.70 - 67838.58 3042.37 - 70880.95
Inter segment sales and other income 38.70 - - 38.70 495.08 (533.78) -38.49 - - 38.49 423.22 (461.71) -
Total Revenue 40359.29 49344.21 (88.43) 89615.07 3437.96 (533.78) 92519.2528606.37 39270.70 - 67877.07 3465.59 (461.71) 70880.95
b) Segment results before other income, interest,tax and exceptional items 3758.12 53.84 (9.77) 3802.19 288.99 (101.38) 3989.80
958.40 (1777.35) - (818.95) 217.54 (56.61) (658.02)
c) (i) Dividend and other income 1793.12798.96
(ii) Interest and discounting charges (2239.71)(1930.90)
(iii) Exceptional items
(a) Exchange (loss) / gain (net) on revaluation of foreign currency
borrowings, deposits and loans given 84.47(339.29)
(b) Others - debt prepayment cost (105.04)-
d) Profit /(Loss) before tax 3522.64(2129.25)
Tax expense (1005.75)(335.75)
e) Profit / (Loss) after tax 2516.89(2465.00)
f ) Segment assets 39725.90 39649.23 (11.90) 79363.23 1146.43 (356.31) 80153.3533614.34 32626.96 - 66241.30 3087.15 (243.81) 69084.64
g) Segment liabilities 16795.99 20245.43 (2.13) 37039.29 381.87 (68.60) 37352.5611594.86 17511.62 - 29106.48 1164.10 (82.99) 30187.59
h) Other information(i) Depreciation 1324.94 2515.86 - 3840.80 46.33 - 3887.13
1044.01 1419.15 - 2463.16 43.61 - 2506.77
(ii) Capital expenditure 3477.94 5440.37 - 8918.31 70.25 (127.01) 8861.556254.94 10603.68 - 16858.62 449.44 (11.80) 17296.26
i) Segment assets exclude:(i) Deferred Tax Assets 425.97
269.44
(ii) Investments 2219.121257.40
(iii) Foreign Currency Monetary Item Translation
Difference Account -636.48
(iv) Short Term deposits with Banks 897.30248.64
(v) Margin Money / Cash Collateral with Scheduled Banks 1786.071729.58
(vi) Loans to Employees 85.1998.16
(vii) Income tax refundable 1534.50974.31
(viii) Miscellaneous expenditure (to the extent not written off or adjusted) -86.08
(ix) Interest accrued on Investments 2.432.62
6950.585302.71
* Tata vehicles include Tata Daewoo and fiat traded vehicles.
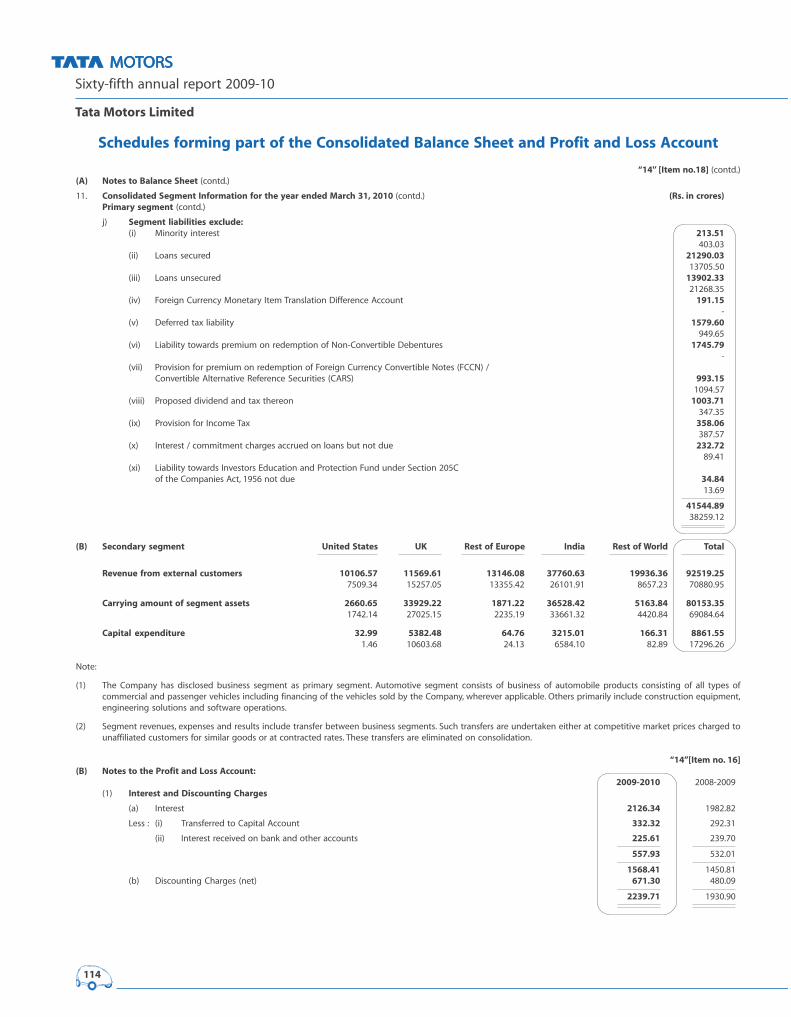
Sixty-fifth annual report 2009-10
Tata Motors Limited
114
Schedules forming part of the Consolidated Balance Sheet and Profit and Loss Account
“14'’ [Item no.18] (contd.)
(A) Notes to Balance Sheet (contd.)
11. Consolidated Segment Information for the year ended March 31, 2010 (contd.) (Rs. in crores)Primary segment (contd.)
j) Segment liabilities exclude:(i) Minority interest 213.51
403.03
(ii) Loans secured 21290.0313705.50
(iii) Loans unsecured 13902.3321268.35
(iv) Foreign Currency Monetary Item Translation Difference Account 191.15-
(v) Deferred tax liability 1579.60949.65
(vi) Liability towards premium on redemption of Non-Convertible Debentures 1745.79-
(vii) Provision for premium on redemption of Foreign Currency Convertible Notes (FCCN) /
Convertible Alternative Reference Securities (CARS) 993.151094.57
(viii) Proposed dividend and tax thereon 1003.71347.35
(ix) Provision for Income Tax 358.06387.57
(x) Interest / commitment charges accrued on loans but not due 232.7289.41
(xi) Liability towards Investors Education and Protection Fund under Section 205C
of the Companies Act, 1956 not due 34.8413.69
41544.8938259.12
(B) Secondary segment United States UK Rest of Europe India Rest of World Total
Revenue from external customers 10106.57 11569.61 13146.08 37760.63 19936.36 92519.257509.34 15257.05 13355.42 26101.91 8657.23 70880.95
Carrying amount of segment assets 2660.65 33929.22 1871.22 36528.42 5163.84 80153.351742.14 27025.15 2235.19 33661.32 4420.84 69084.64
Capital expenditure 32.99 5382.48 64.76 3215.01 166.31 8861.551.46 10603.68 24.13 6584.10 82.89 17296.26
Note:
(1) The Company has disclosed business segment as primary segment. Automotive segment consists of business of automobile products consisting of all types of
commercial and passenger vehicles including financing of the vehicles sold by the Company, wherever applicable. Others primarily include construction equipment,
engineering solutions and software operations.
(2) Segment revenues, expenses and results include transfer between business segments. Such transfers are undertaken either at competitive market prices charged to
unaffiliated customers for similar goods or at contracted rates. These transfers are eliminated on consolidation.
“14”[Item no. 16](B) Notes to the Profit and Loss Account:
2009-2010 2008-2009
(1) Interest and Discounting Charges
(a) Interest 2126.34 1982.82
Less : (i) Transferred to Capital Account 332.32 292.31
(ii) Interest received on bank and other accounts 225.61 239.70
557.93 532.01
1568.41 1450.81
(b) Discounting Charges (net) 671.30 480.09
2239.71 1930.90
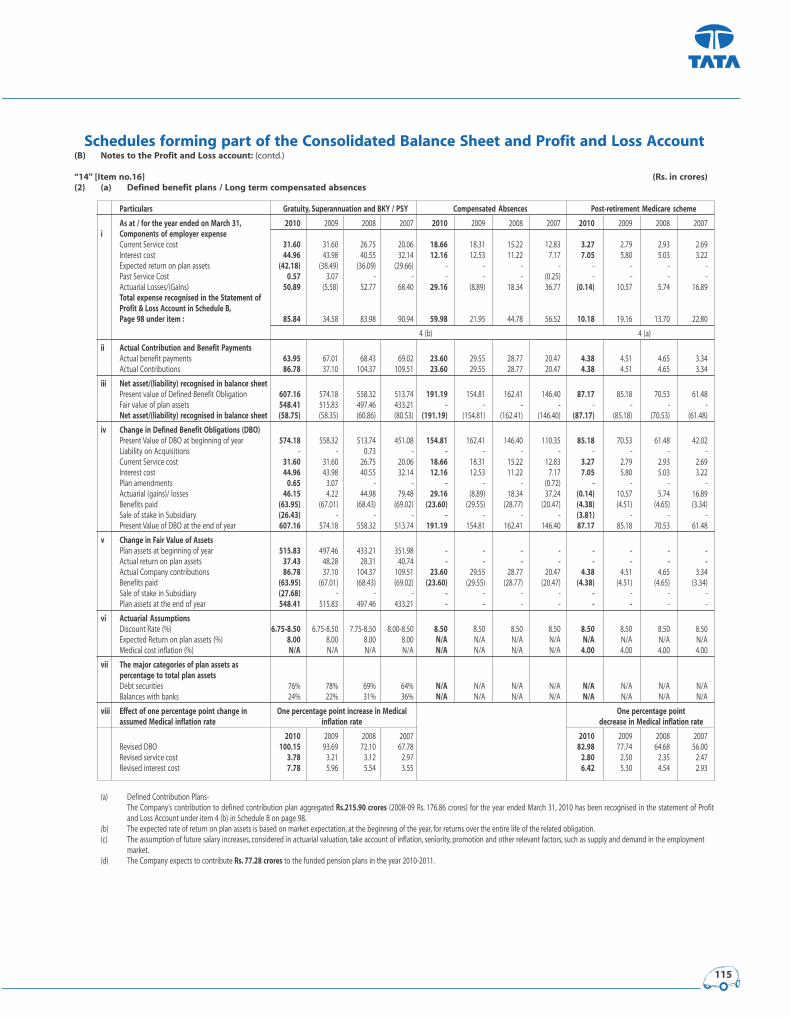
115
Schedules forming part of the Consolidated Balance Sheet and Profit and Loss Account(B) Notes to the Profit and Loss account: (contd.)
“14'’ [Item no.16] (Rs. in crores)(2) (a) Defined benefit plans / Long term compensated absences
Particulars Gratuity, Superannuation and BKY / PSY Compensated Absences Post-retirement Medicare scheme
As at / for the year ended on March 31, 2010 2009 2008 2007 2010 2009 2008 2007 2010 2009 2008 2007
i Components of employer expenseCurrent Service cost 31.60 31.60 26.75 20.06 18.66 18.31 15.22 12.83 3.27 2.79 2.93 2.69
Interest cost 44.96 43.98 40.55 32.14 12.16 12.53 11.22 7.17 7.05 5.80 5.03 3.22
Expected return on plan assets (42.18) (38.49) (36.09) (29.66) - - - - - - - -
Past Service Cost 0.57 3.07 - - - - - (0.25) - - - -
Actuarial Losses/(Gains) 50.89 (5.58) 52.77 68.40 29.16 (8.89) 18.34 36.77 (0.14) 10.57 5.74 16.89
Total expense recognised in the Statement ofProfit & Loss Account in Schedule B,Page 98 under item : 85.84 34.58 83.98 90.94 59.98 21.95 44.78 56.52 10.18 19.16 13.70 22.80
4 (b) 4 (a)
ii Actual Contribution and Benefit PaymentsActual benefit payments 63.95 67.01 68.43 69.02 23.60 29.55 28.77 20.47 4.38 4.51 4.65 3.34
Actual Contributions 86.78 37.10 104.37 109.51 23.60 29.55 28.77 20.47 4.38 4.51 4.65 3.34
iii Net asset/(liability) recognised in balance sheetPresent value of Defined Benefit Obligation 607.16 574.18 558.32 513.74 191.19 154.81 162.41 146.40 87.17 85.18 70.53 61.48
Fair value of plan assets 548.41 515.83 497.46 433.21 - - - - - - - -
Net asset/(liability) recognised in balance sheet (58.75) (58.35) (60.86) (80.53) (191.19) (154.81) (162.41) (146.40) (87.17) (85.18) (70.53) (61.48)
iv Change in Defined Benefit Obligations (DBO)Present Value of DBO at beginning of year 574.18 558.32 513.74 451.08 154.81 162.41 146.40 110.35 85.18 70.53 61.48 42.02
Liability on Acquisitions - - 0.73 - - - - - - - - -
Current Service cost 31.60 31.60 26.75 20.06 18.66 18.31 15.22 12.83 3.27 2.79 2.93 2.69
Interest cost 44.96 43.98 40.55 32.14 12.16 12.53 11.22 7.17 7.05 5.80 5.03 3.22
Plan amendments 0.65 3.07 - - - - - (0.72) - - - -
Actuarial (gains)/ losses 46.15 4.22 44.98 79.48 29.16 (8.89) 18.34 37.24 (0.14) 10.57 5.74 16.89
Benefits paid (63.95) (67.01) (68.43) (69.02) (23.60) (29.55) (28.77) (20.47) (4.38) (4.51) (4.65) (3.34)
Sale of stake in Subsidiary (26.43) - - - - - - - (3.81) - - -
Present Value of DBO at the end of year 607.16 574.18 558.32 513.74 191.19 154.81 162.41 146.40 87.17 85.18 70.53 61.48
v Change in Fair Value of AssetsPlan assets at beginning of year 515.83 497.46 433.21 351.98 - - - - - - - -Actual return on plan assets 37.43 48.28 28.31 40.74 - - - - - - - -Actual Company contributions 86.78 37.10 104.37 109.51 23.60 29.55 28.77 20.47 4.38 4.51 4.65 3.34
Benefits paid (63.95) (67.01) (68.43) (69.02) (23.60) (29.55) (28.77) (20.47) (4.38) (4.51) (4.65) (3.34)
Sale of stake in Subsidiary (27.68) - - - - - - - - - - -
Plan assets at the end of year 548.41 515.83 497.46 433.21 - - - - - - - -
vi Actuarial AssumptionsDiscount Rate (%) 6.75-8.50 6.75-8.50 7.75-8.50 8.00-8.50 8.50 8.50 8.50 8.50 8.50 8.50 8.50 8.50
Expected Return on plan assets (%) 8.00 8.00 8.00 8.00 N/A N/A N/A N/A N/A N/A N/A N/A
Medical cost inflation (%) N/A N/A N/A N/A N/A N/A N/A N/A 4.00 4.00 4.00 4.00
vii The major categories of plan assets aspercentage to total plan assetsDebt securities 76% 78% 69% 64% N/A N/A N/A N/A N/A N/A N/A N/A
Balances with banks 24% 22% 31% 36% N/A N/A N/A N/A N/A N/A N/A N/A
viii Effect of one percentage point change in One percentage point increase in Medical One percentage pointassumed Medical inflation rate inflation rate decrease in Medical inflation rate
2010 2009 2008 2007 2010 2009 2008 2007
Revised DBO 100.15 93.69 72.10 67.78 82.98 77.74 64.68 56.00
Revised service cost 3.78 3.21 3.12 2.97 2.80 2.50 2.35 2.47
Revised interest cost 7.78 5.96 5.54 3.55 6.42 5.30 4.54 2.93
(a) Defined Contribution Plans-
The Company’s contribution to defined contribution plan aggregated Rs.215.90 crores (2008-09 Rs. 176.86 crores) for the year ended March 31, 2010 has been recognised in the statement of Profit
and Loss Account under item 4 (b) in Schedule B on page 98.
(b) The expected rate of return on plan assets is based on market expectation, at the beginning of the year, for returns over the entire life of the related obligation.
(c) The assumption of future salary increases, considered in actuarial valuation, take account of inflation, seniority, promotion and other relevant factors, such as supply and demand in the employment
market.
(d) The Company expects to contribute Rs. 77.28 crores to the funded pension plans in the year 2010-2011.
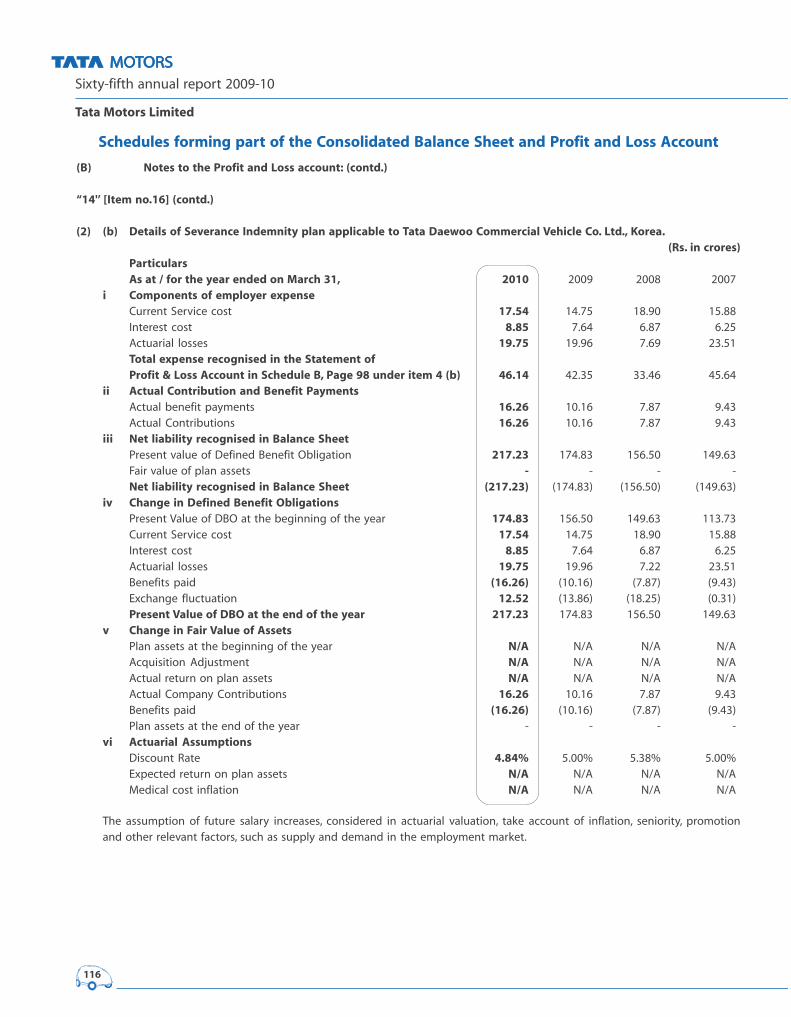
Sixty-fifth annual report 2009-10
Tata Motors Limited
116
Schedules forming part of the Consolidated Balance Sheet and Profit and Loss Account
(B) Notes to the Profit and Loss account: (contd.)
“14'’ [Item no.16] (contd.)
(2) (b) Details of Severance Indemnity plan applicable to Tata Daewoo Commercial Vehicle Co. Ltd., Korea.(Rs. in crores)
ParticularsAs at / for the year ended on March 31, 2010 2009 2008 2007
i Components of employer expenseCurrent Service cost 17.54 14.75 18.90 15.88
Interest cost 8.85 7.64 6.87 6.25
Actuarial losses 19.75 19.96 7.69 23.51
Total expense recognised in the Statement ofProfit & Loss Account in Schedule B, Page 98 under item 4 (b) 46.14 42.35 33.46 45.64
ii Actual Contribution and Benefit PaymentsActual benefit payments 16.26 10.16 7.87 9.43
Actual Contributions 16.26 10.16 7.87 9.43
iii Net liability recognised in Balance SheetPresent value of Defined Benefit Obligation 217.23 174.83 156.50 149.63
Fair value of plan assets - - - -
Net liability recognised in Balance Sheet (217.23) (174.83) (156.50) (149.63)
iv Change in Defined Benefit ObligationsPresent Value of DBO at the beginning of the year 174.83 156.50 149.63 113.73
Current Service cost 17.54 14.75 18.90 15.88
Interest cost 8.85 7.64 6.87 6.25
Actuarial losses 19.75 19.96 7.22 23.51
Benefits paid (16.26) (10.16) (7.87) (9.43)
Exchange fluctuation 12.52 (13.86) (18.25) (0.31)
Present Value of DBO at the end of the year 217.23 174.83 156.50 149.63
v Change in Fair Value of AssetsPlan assets at the beginning of the year N/A N/A N/A N/A
Acquisition Adjustment N/A N/A N/A N/A
Actual return on plan assets N/A N/A N/A N/A
Actual Company Contributions 16.26 10.16 7.87 9.43
Benefits paid (16.26) (10.16) (7.87) (9.43)
Plan assets at the end of the year - - - -
vi Actuarial AssumptionsDiscount Rate 4.84% 5.00% 5.38% 5.00%
Expected return on plan assets N/A N/A N/A N/A
Medical cost inflation N/A N/A N/A N/A
The assumption of future salary increases, considered in actuarial valuation, take account of inflation, seniority, promotion
and other relevant factors, such as supply and demand in the employment market.
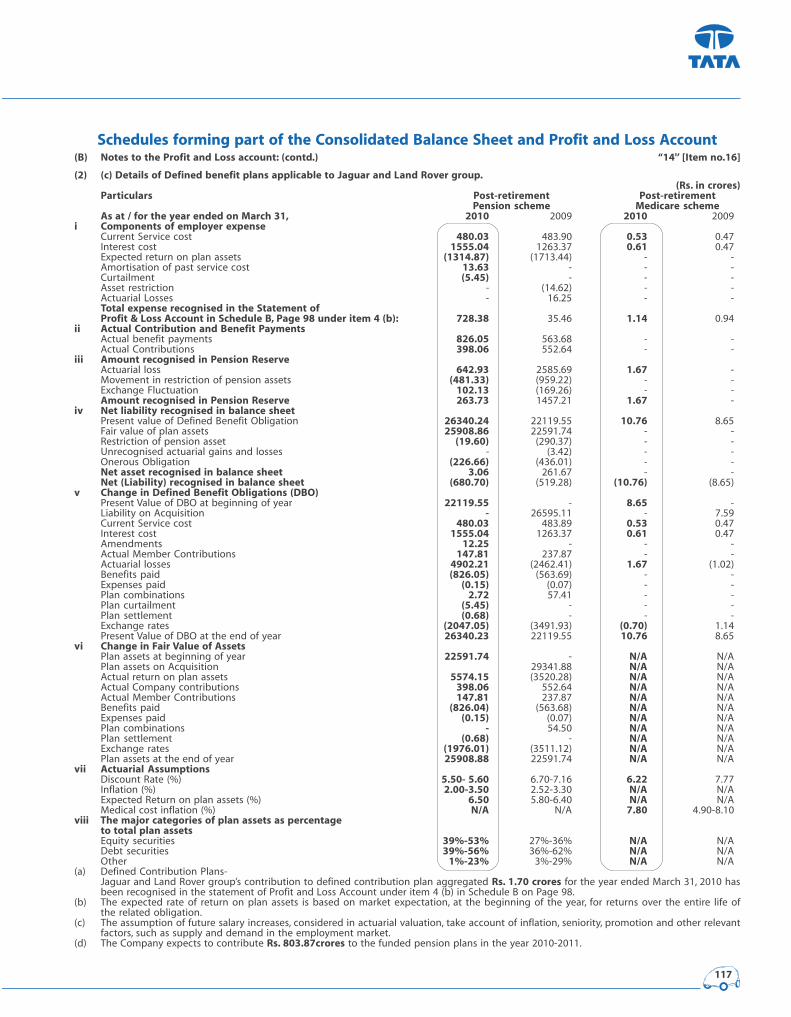
117
Schedules forming part of the Consolidated Balance Sheet and Profit and Loss Account(B) Notes to the Profit and Loss account: (contd.) “14'’ [Item no.16]
(2) (c) Details of Defined benefit plans applicable to Jaguar and Land Rover group.(Rs. in crores)
Particulars Post-retirement Post-retirementPension scheme Medicare scheme
As at / for the year ended on March 31, 2010 2009 2010 2009
i Components of employer expenseCurrent Service cost 480.03 483.90 0.53 0.47
Interest cost 1555.04 1263.37 0.61 0.47
Expected return on plan assets (1314.87) (1713.44) - -
Amortisation of past service cost 13.63 - - -
Curtailment (5.45) - - -
Asset restriction - (14.62) - -
Actuarial Losses - 16.25 - -
Total expense recognised in the Statement ofProfit & Loss Account in Schedule B, Page 98 under item 4 (b): 728.38 35.46 1.14 0.94
ii Actual Contribution and Benefit PaymentsActual benefit payments 826.05 563.68 - -
Actual Contributions 398.06 552.64 - -
iii Amount recognised in Pension ReserveActuarial loss 642.93 2585.69 1.67 -
Movement in restriction of pension assets (481.33) (959.22) - -
Exchange Fluctuation 102.13 (169.26) - -
Amount recognised in Pension Reserve 263.73 1457.21 1.67 -
iv Net liability recognised in balance sheetPresent value of Defined Benefit Obligation 26340.24 22119.55 10.76 8.65
Fair value of plan assets 25908.86 22591.74 - -
Restriction of pension asset (19.60) (290.37) - -
Unrecognised actuarial gains and losses - (3.42) - -
Onerous Obligation (226.66) (436.01) - -
Net asset recognised in balance sheet 3.06 261.67 - -
Net (Liability) recognised in balance sheet (680.70) (519.28) (10.76) (8.65)
v Change in Defined Benefit Obligations (DBO)Present Value of DBO at beginning of year 22119.55 - 8.65 -
Liability on Acquisition - 26595.11 - 7.59
Current Service cost 480.03 483.89 0.53 0.47
Interest cost 1555.04 1263.37 0.61 0.47
Amendments 12.25 - - -
Actual Member Contributions 147.81 237.87 - -
Actuarial losses 4902.21 (2462.41) 1.67 (1.02)
Benefits paid (826.05) (563.69) - -
Expenses paid (0.15) (0.07) - -
Plan combinations 2.72 57.41 - -
Plan curtailment (5.45) - - -
Plan settlement (0.68) - - -
Exchange rates (2047.05) (3491.93) (0.70) 1.14
Present Value of DBO at the end of year 26340.23 22119.55 10.76 8.65
vi Change in Fair Value of AssetsPlan assets at beginning of year 22591.74 - N/A N/A
Plan assets on Acquisition 29341.88 N/A N/A
Actual return on plan assets 5574.15 (3520.28) N/A N/A
Actual Company contributions 398.06 552.64 N/A N/A
Actual Member Contributions 147.81 237.87 N/A N/A
Benefits paid (826.04) (563.68) N/A N/A
Expenses paid (0.15) (0.07) N/A N/A
Plan combinations - 54.50 N/A N/A
Plan settlement (0.68) - N/A N/A
Exchange rates (1976.01) (3511.12) N/A N/A
Plan assets at the end of year 25908.88 22591.74 N/A N/A
vii Actuarial AssumptionsDiscount Rate (%) 5.50- 5.60 6.70-7.16 6.22 7.77
Inflation (%) 2.00-3.50 2.52-3.30 N/A N/A
Expected Return on plan assets (%) 6.50 5.80-6.40 N/A N/A
Medical cost inflation (%) N/A N/A 7.80 4.90-8.10
viii The major categories of plan assets as percentageto total plan assetsEquity securities 39%-53% 27%-36% N/A N/A
Debt securities 39%-56% 36%-62% N/A N/A
Other 1%-23% 3%-29% N/A N/A
(a) Defined Contribution Plans-
Jaguar and Land Rover group’s contribution to defined contribution plan aggregated Rs. 1.70 crores for the year ended March 31, 2010 has
been recognised in the statement of Profit and Loss Account under item 4 (b) in Schedule B on Page 98.
(b) The expected rate of return on plan assets is based on market expectation, at the beginning of the year, for returns over the entire life of
the related obligation.
(c) The assumption of future salary increases, considered in actuarial valuation, take account of inflation, seniority, promotion and other relevant
factors, such as supply and demand in the employment market.
(d) The Company expects to contribute Rs. 803.87crores to the funded pension plans in the year 2010-2011.
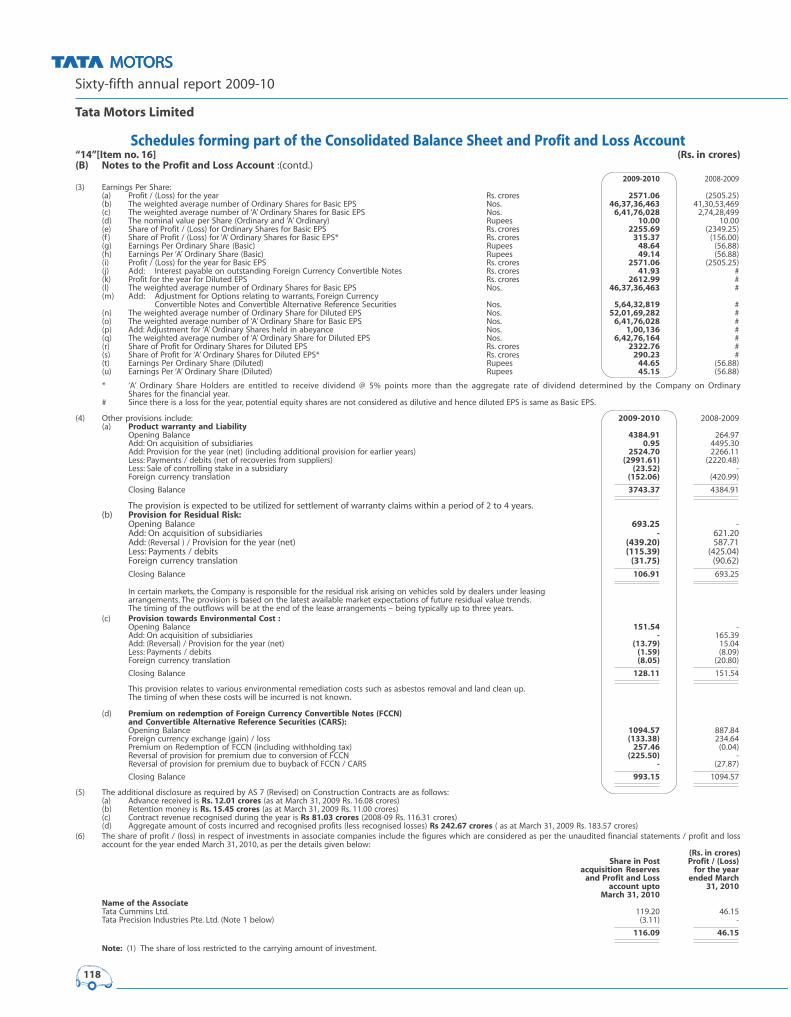
Sixty-fifth annual report 2009-10
Tata Motors Limited
118
Schedules forming part of the Consolidated Balance Sheet and Profit and Loss Account“14”[Item no. 16] (Rs. in crores)(B) Notes to the Profit and Loss Account :(contd.)
2009-2010 2008-2009
(3) Earnings Per Share:
(a) Profit / (Loss) for the year Rs. crores 2571.06 (2505.25)
(b) The weighted average number of Ordinary Shares for Basic EPS Nos. 46,37,36,463 41,30,53,469
(c) The weighted average number of ‘A’ Ordinary Shares for Basic EPS Nos. 6,41,76,028 2,74,28,499
(d) The nominal value per Share (Ordinary and ‘A’ Ordinary) Rupees 10.00 10.00
(e) Share of Profit / (Loss) for Ordinary Shares for Basic EPS Rs. crores 2255.69 (2349.25)
(f ) Share of Profit / (Loss) for ‘A’ Ordinary Shares for Basic EPS* Rs. crores 315.37 (156.00)
(g) Earnings Per Ordinary Share (Basic) Rupees 48.64 (56.88)
(h) Earnings Per ‘A’ Ordinary Share (Basic) Rupees 49.14 (56.88)
(i) Profit / (Loss) for the year for Basic EPS Rs. crores 2571.06 (2505.25)
(j) Add: Interest payable on outstanding Foreign Currency Convertible Notes Rs. crores 41.93 #
(k) Profit for the year for Diluted EPS Rs. crores 2612.99 #
(l) The weighted average number of Ordinary Shares for Basic EPS Nos. 46,37,36,463 #
(m) Add: Adjustment for Options relating to warrants, Foreign Currency
Convertible Notes and Convertible Alternative Reference Securities Nos. 5,64,32,819 #
(n) The weighted average number of Ordinary Share for Diluted EPS Nos. 52,01,69,282 #
(o) The weighted average number of ‘A’ Ordinary Share for Basic EPS Nos. 6,41,76,028 #
(p) Add: Adjustment for ‘A’ Ordinary Shares held in abeyance Nos. 1,00,136 #
(q) The weighted average number of ‘A’ Ordinary Share for Diluted EPS Nos. 6,42,76,164 #
(r) Share of Profit for Ordinary Shares for Diluted EPS Rs. crores 2322.76 #
(s) Share of Profit for ‘A’ Ordinary Shares for Diluted EPS* Rs. crores 290.23 #
(t) Earnings Per Ordinary Share (Diluted) Rupees 44.65 (56.88)
(u) Earnings Per ‘A’ Ordinary Share (Diluted) Rupees 45.15 (56.88)
* ‘A’ Ordinary Share Holders are entitled to receive dividend @ 5% points more than the aggregate rate of dividend determined by the Company on Ordinary
Shares for the financial year.
# Since there is a loss for the year, potential equity shares are not considered as dilutive and hence diluted EPS is same as Basic EPS.
(4) Other provisions include: 2009-2010 2008-2009
(a) Product warranty and LiabilityOpening Balance 4384.91 264.97
Add: On acquisition of subsidiaries 0.95 4495.30
Add: Provision for the year (net) (including additional provision for earlier years) 2524.70 2266.11
Less: Payments / debits (net of recoveries from suppliers) (2991.61) (2220.48)
Less: Sale of controlling stake in a subsidiary (23.52) -
Foreign currency translation (152.06) (420.99)
Closing Balance 3743.37 4384.91
The provision is expected to be utilized for settlement of warranty claims within a period of 2 to 4 years.
(b) Provision for Residual Risk:Opening Balance 693.25 -
Add: On acquisition of subsidiaries - 621.20
Add: (Reversal ) / Provision for the year (net) (439.20) 587.71
Less: Payments / debits (115.39) (425.04)
Foreign currency translation (31.75) (90.62)
Closing Balance 106.91 693.25
In certain markets, the Company is responsible for the residual risk arising on vehicles sold by dealers under leasing
arrangements. The provision is based on the latest available market expectations of future residual value trends.
The timing of the outflows will be at the end of the lease arrangements – being typically up to three years.
(c) Provision towards Environmental Cost :Opening Balance 151.54 -
Add: On acquisition of subsidiaries - 165.39
Add: (Reversal) / Provision for the year (net) (13.79) 15.04
Less: Payments / debits (1.59) (8.09)
Foreign currency translation (8.05) (20.80)
Closing Balance 128.11 151.54
This provision relates to various environmental remediation costs such as asbestos removal and land clean up.
The timing of when these costs will be incurred is not known.
(d) Premium on redemption of Foreign Currency Convertible Notes (FCCN)and Convertible Alternative Reference Securities (CARS):Opening Balance 1094.57 887.84
Foreign currency exchange (gain) / loss (133.38) 234.64
Premium on Redemption of FCCN (including withholding tax) 257.46 (0.04)
Reversal of provision for premium due to conversion of FCCN (225.50) -
Reversal of provision for premium due to buyback of FCCN / CARS - (27.87)
Closing Balance 993.15 1094.57
(5) The additional disclosure as required by AS 7 (Revised) on Construction Contracts are as follows:
(a) Advance received is Rs. 12.01 crores (as at March 31, 2009 Rs. 16.08 crores)
(b) Retention money is Rs. 15.45 crores (as at March 31, 2009 Rs. 11.00 crores)
(c) Contract revenue recognised during the year is Rs 81.03 crores (2008-09 Rs. 116.31 crores)
(d) Aggregate amount of costs incurred and recognised profits (less recognised losses) Rs 242.67 crores ( as at March 31, 2009 Rs. 183.57 crores)
(6) The share of profit / (loss) in respect of investments in associate companies include the figures which are considered as per the unaudited financial statements / profit and loss
account for the year ended March 31, 2010, as per the details given below:
(Rs. in crores)Share in Post Profit / (Loss)
acquisition Reserves for the yearand Profit and Loss ended March
account upto 31, 2010March 31, 2010
Name of the AssociateTata Cummins Ltd. 119.20 46.15
Tata Precision Industries Pte. Ltd. (Note 1 below) (3.11) -
116.09 46.15
Note: (1) The share of loss restricted to the carrying amount of investment.
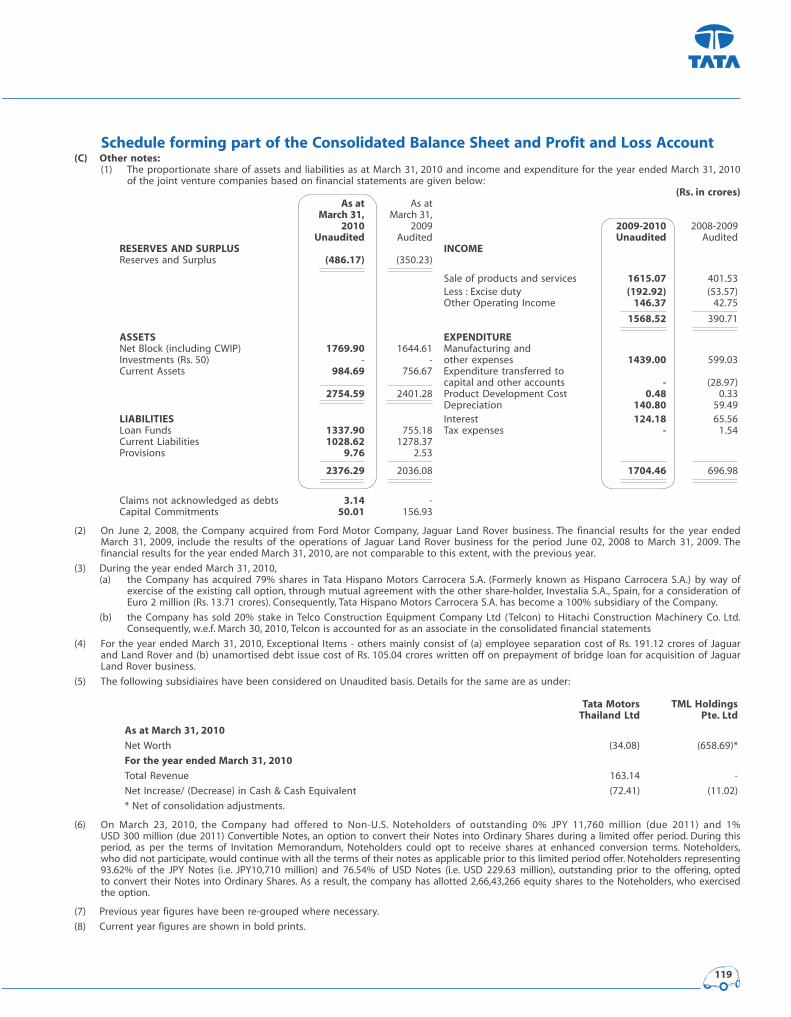
119
Schedule forming part of the Consolidated Balance Sheet and Profit and Loss Account(C) Other notes:
(1) The proportionate share of assets and liabilities as at March 31, 2010 and income and expenditure for the year ended March 31, 2010
of the joint venture companies based on financial statements are given below:
(Rs. in crores)As at As at
March 31, March 31,
2010 2009 2009-2010 2008-2009
Unaudited Audited Unaudited Audited
RESERVES AND SURPLUS INCOMEReserves and Surplus (486.17) (350.23)
Sale of products and services 1615.07 401.53
Less : Excise duty (192.92) (53.57)
Other Operating Income 146.37 42.75
1568.52 390.71
ASSETS EXPENDITURENet Block (including CWIP) 1769.90 1644.61 Manufacturing and
Investments (Rs. 50) - - other expenses 1439.00 599.03
Current Assets 984.69 756.67 Expenditure transferred to
capital and other accounts - (28.97)
2754.59 2401.28 Product Development Cost 0.48 0.33
Depreciation 140.80 59.49
LIABILITIES Interest 124.18 65.56
Loan Funds 1337.90 755.18 Tax expenses - 1.54
Current Liabilities 1028.62 1278.37
Provisions 9.76 2.53
2376.29 2036.08 1704.46 696.98
Claims not acknowledged as debts 3.14 -
Capital Commitments 50.01 156.93
(2) On June 2, 2008, the Company acquired from Ford Motor Company, Jaguar Land Rover business. The financial results for the year ended
March 31, 2009, include the results of the operations of Jaguar Land Rover business for the period June 02, 2008 to March 31, 2009. The
financial results for the year ended March 31, 2010, are not comparable to this extent, with the previous year.
(3) During the year ended March 31, 2010,
(a) the Company has acquired 79% shares in Tata Hispano Motors Carrocera S.A. (Formerly known as Hispano Carrocera S.A.) by way of
exercise of the existing call option, through mutual agreement with the other share-holder, Investalia S.A., Spain, for a consideration of
Euro 2 million (Rs. 13.71 crores). Consequently, Tata Hispano Motors Carrocera S.A. has become a 100% subsidiary of the Company.
(b) the Company has sold 20% stake in Telco Construction Equipment Company Ltd (Telcon) to Hitachi Construction Machinery Co. Ltd.
Consequently, w.e.f. March 30, 2010, Telcon is accounted for as an associate in the consolidated financial statements
(4) For the year ended March 31, 2010, Exceptional Items - others mainly consist of (a) employee separation cost of Rs. 191.12 crores of Jaguar
and Land Rover and (b) unamortised debt issue cost of Rs. 105.04 crores written off on prepayment of bridge loan for acquisition of Jaguar
Land Rover business.
(5) The following subsidiaires have been considered on Unaudited basis. Details for the same are as under:
Tata Motors TML HoldingsThailand Ltd Pte. Ltd
As at March 31, 2010
Net Worth (34.08) (658.69)*
For the year ended March 31, 2010
Total Revenue 163.14 -
Net Increase/ (Decrease) in Cash & Cash Equivalent (72.41) (11.02)
* Net of consolidation adjustments.
(6) On March 23, 2010, the Company had offered to Non-U.S. Noteholders of outstanding 0% JPY 11,760 million (due 2011) and 1%
USD 300 million (due 2011) Convertible Notes, an option to convert their Notes into Ordinary Shares during a limited offer period. During this
period, as per the terms of Invitation Memorandum, Noteholders could opt to receive shares at enhanced conversion terms. Noteholders,
who did not participate, would continue with all the terms of their notes as applicable prior to this limited period offer. Noteholders representing
93.62% of the JPY Notes (i.e. JPY10,710 million) and 76.54% of USD Notes (i.e. USD 229.63 million), outstanding prior to the offering, opted
to convert their Notes into Ordinary Shares. As a result, the company has allotted 2,66,43,266 equity shares to the Noteholders, who exercised
the option.
(7) Previous year figures have been re-grouped where necessary.
(8) Current year figures are shown in bold prints.