Embed Size (px)
Citation preview
Tata Consultancy Services
METHODOLOGY NOTE
ComRes interviewed 5,024 adults aged 18-29 across Europe online between 20th May and 3rd June 2015. Countries surveyed were: Italy
(n=502); Germany (n=502); France (n=500); Spain (n=500); UK (n=504); Eastern Europe – Poland, Romania (n=501); Baltics – Estonia, Latvia
(n=507); Nordics – Norway, Finland, Denmark (n=605); Sweden (n=402); Benelux – the Netherlands, Belgium (n=501). ComRes is a member of
the British Polling Council and abides by its rules.
Data were weighted by gender, age and region to be representative of all adults aged 18-29 in each country.
All press releases or other publications must be checked with ComRes before use. ComRes requires 48 hours to check a press release unless
otherwise agreed.
To commission a voting intention poll or a public opinion survey please contact Katharine Peacock: [email protected]
To register for Pollwatch, a monthly newsletter update on the polls, please email: [email protected]
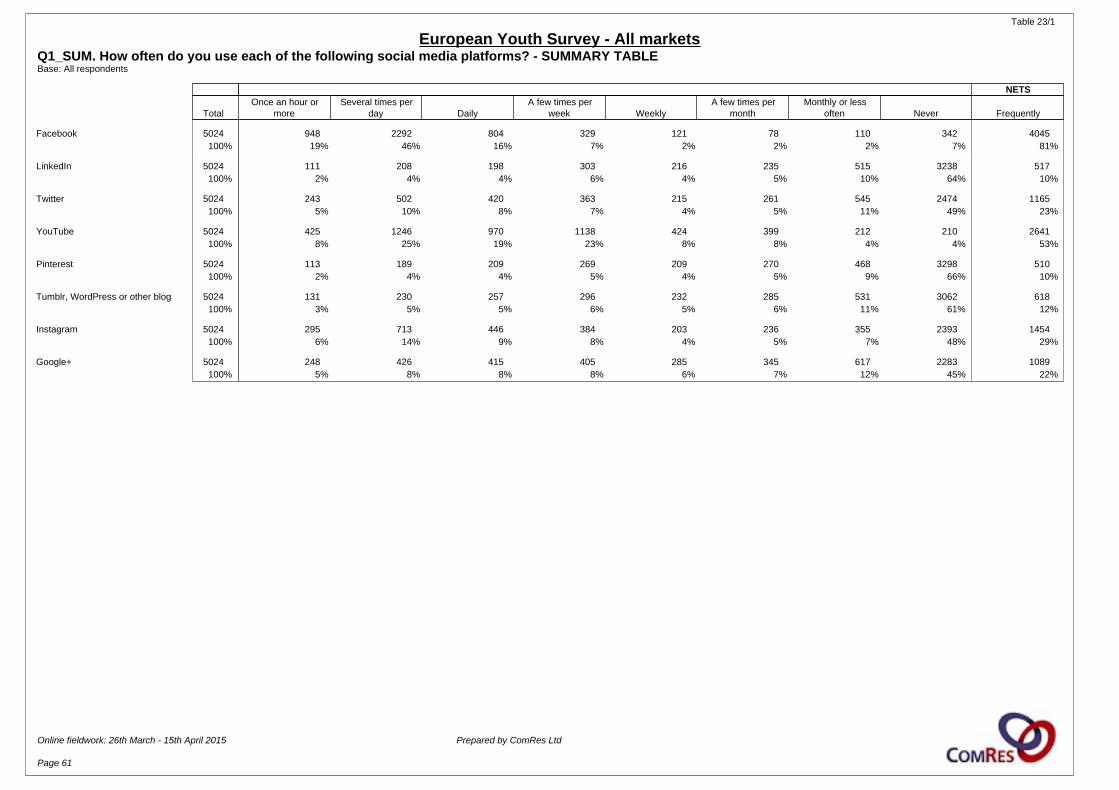
Table 23/1
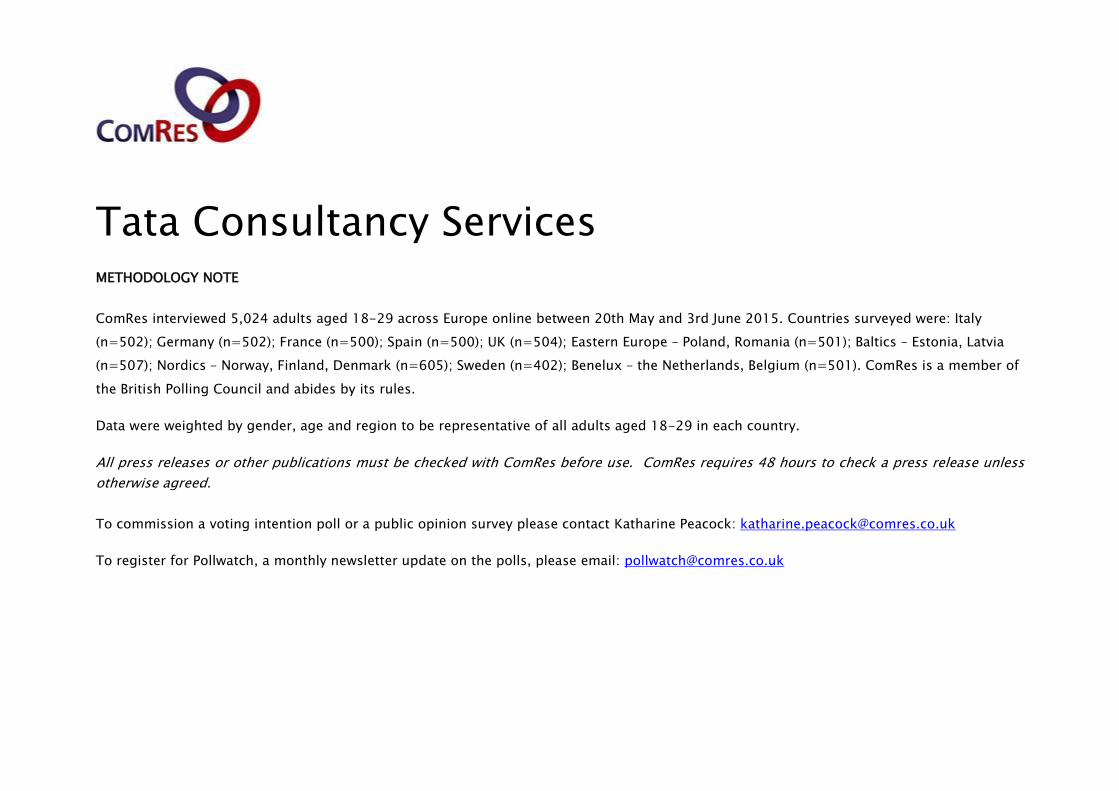
European Youth Survey - All marketsQ1_SUM. How often do you use each of the following social media platforms? - SUMMARY TABLEBase: All respondents
NETS
TotalOnce an hour or
moreSeveral times per
day DailyA few times per
week WeeklyA few times per
monthMonthly or less
often Never Frequently
Facebook 5024 948 2292 804 329 121 78 110 342 4045100% 19% 46% 16% 7% 2% 2% 2% 7% 81%
LinkedIn 5024 111 208 198 303 216 235 515 3238 517100% 2% 4% 4% 6% 4% 5% 10% 64% 10%
Twitter 5024 243 502 420 363 215 261 545 2474 1165100% 5% 10% 8% 7% 4% 5% 11% 49% 23%
YouTube 5024 425 1246 970 1138 424 399 212 210 2641100% 8% 25% 19% 23% 8% 8% 4% 4% 53%
Pinterest 5024 113 189 209 269 209 270 468 3298 510100% 2% 4% 4% 5% 4% 5% 9% 66% 10%
Tumblr, WordPress or other blog 5024 131 230 257 296 232 285 531 3062 618100% 3% 5% 5% 6% 5% 6% 11% 61% 12%
Instagram 5024 295 713 446 384 203 236 355 2393 1454100% 6% 14% 9% 8% 4% 5% 7% 48% 29%
Google+ 5024 248 426 415 405 285 345 617 2283 1089100% 5% 8% 8% 8% 6% 7% 12% 45% 22%
Online fieldwork: 26th March - 15th April 2015 Prepared by ComRes Ltd
Page 61
Table 24/1
European Youth Survey - All marketsQ2_SUM. At what time of day do you use each of the following social media platforms? - SUMMARY TABLEBase: All who have used relevant media platform
Total At breakfast Morning At lunch Afternoon At dinner Evening Night Never
Facebook 4682 1436 2471 1896 2939 1239 3149 1190 49100% 31% 53% 40% 63% 26% 67% 25% 1%
LinkedIn 1786 101 352 272 619 138 414 73 268100% 6% 20% 15% 35% 8% 23% 4% 15%
Twitter 2550 327 648 577 1102 402 1029 319 224100% 13% 25% 23% 43% 16% 40% 13% 9%
YouTube 4814 533 1240 1028 2630 943 2984 1014 63100% 11% 26% 21% 55% 20% 62% 21% 1%
Pinterest 1726 119 242 237 592 177 575 138 280100% 7% 14% 14% 34% 10% 33% 8% 16%
Tumblr, WordPress or other blog 1962 135 298 296 672 223 742 244 312100% 7% 15% 15% 34% 11% 38% 12% 16%
Instagram 2631 475 916 727 1267 518 1358 450 192100% 18% 35% 28% 48% 20% 52% 17% 7%
Google+ 2741 227 573 471 1155 369 1017 260 310100% 8% 21% 17% 42% 13% 37% 9% 11%
Online fieldwork: 26th March - 15th April 2015 Prepared by ComRes Ltd
Page 62
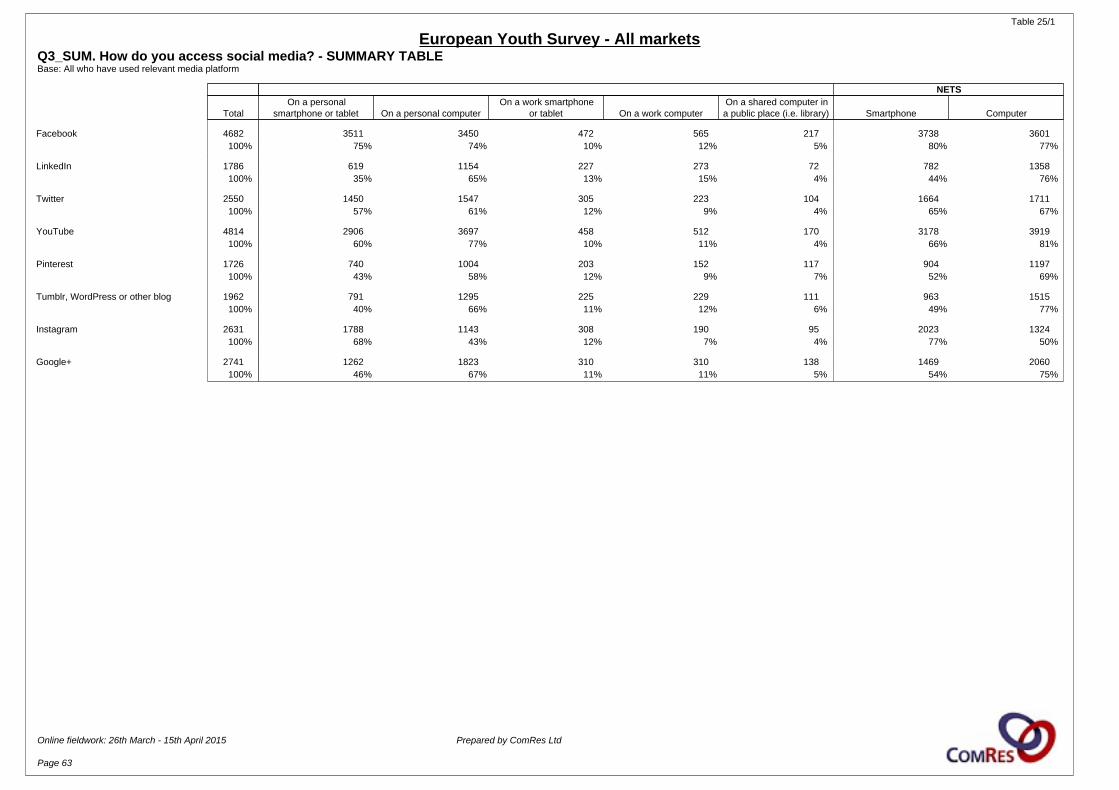
Table 25/1
European Youth Survey - All marketsQ3_SUM. How do you access social media? - SUMMARY TABLEBase: All who have used relevant media platform
NETS
TotalOn a personal
smartphone or tablet On a personal computerOn a work smartphone
or tablet On a work computerOn a shared computer ina public place (i.e. library) Smartphone Computer
Facebook 4682 3511 3450 472 565 217 3738 3601100% 75% 74% 10% 12% 5% 80% 77%
LinkedIn 1786 619 1154 227 273 72 782 1358100% 35% 65% 13% 15% 4% 44% 76%
Twitter 2550 1450 1547 305 223 104 1664 1711100% 57% 61% 12% 9% 4% 65% 67%
YouTube 4814 2906 3697 458 512 170 3178 3919100% 60% 77% 10% 11% 4% 66% 81%
Pinterest 1726 740 1004 203 152 117 904 1197100% 43% 58% 12% 9% 7% 52% 69%
Tumblr, WordPress or other blog 1962 791 1295 225 229 111 963 1515100% 40% 66% 11% 12% 6% 49% 77%
Instagram 2631 1788 1143 308 190 95 2023 1324100% 68% 43% 12% 7% 4% 77% 50%
Google+ 2741 1262 1823 310 310 138 1469 2060100% 46% 67% 11% 11% 5% 54% 75%
Online fieldwork: 26th March - 15th April 2015 Prepared by ComRes Ltd
Page 63

Table 26/1
European Youth Survey - All marketsQ4. Which of the following social media tools and services, if any, are restricted in your workplace/ university?Base: All students and employees
COUNTRY GENDER AGE
Total Italy Germany France Spain UKEasternEurope Baltic Nordics Sweden Benelux Male Female 18-22 22-29
Unweighted Total 4133 366 448 397 400 410 389 427 532 348 416 2092 2041 1296 2837
Weighted Total 4130 365 447 396 400 408 389 427 531 351 415 2074 2056 1684 2446100% 100% 100% 100% 100% 100% 100% 100% 100% 100% 100% 100% 100% 100% 100%
Facebook 956 113 73 203 130 146 85 41 48 39 78 544 412 358 59823% 31% 16% 51% 32% 36% 22% 10% 9% 11% 19% 26% 20% 21% 24%
Twitter 564 42 50 117 94 87 58 30 22 17 47 324 239 221 34214% 11% 11% 30% 24% 21% 15% 7% 4% 5% 11% 16% 12% 13% 14%
YouTube 541 41 52 119 76 71 55 24 26 24 54 314 227 190 35113% 11% 12% 30% 19% 17% 14% 6% 5% 7% 13% 15% 11% 11% 14%
Instagram 456 26 36 88 87 69 46 23 22 19 40 250 207 169 28711% 7% 8% 22% 22% 17% 12% 5% 4% 5% 10% 12% 10% 10% 12%
LinkedIn 380 27 40 62 60 55 50 17 21 10 38 224 155 129 2519% 7% 9% 16% 15% 13% 13% 4% 4% 3% 9% 11% 8% 8% 10%
Tumblr, WordPress or other blog 379 26 33 59 67 54 52 19 21 14 35 213 167 136 2439% 7% 7% 15% 17% 13% 13% 4% 4% 4% 8% 10% 8% 8% 10%
Pinterest 368 24 35 65 63 48 48 17 23 13 32 205 163 131 2379% 7% 8% 17% 16% 12% 12% 4% 4% 4% 8% 10% 8% 8% 10%
Google+ 336 22 31 78 49 45 39 13 16 14 29 188 148 109 2278% 6% 7% 20% 12% 11% 10% 3% 3% 4% 7% 9% 7% 7% 9%
Other 78 1 5 7 8 2 8 16 13 6 11 35 44 29 502% * 1% 2% 2% 1% 2% 4% 3% 2% 3% 2% 2% 2% 2%
None 2873 234 346 149 236 233 292 361 452 289 281 1347 1526 1203 167070% 64% 77% 38% 59% 57% 75% 84% 85% 82% 68% 65% 74% 71% 68%
Online fieldwork: 26th March - 15th April 2015 Prepared by ComRes Ltd
Page 64
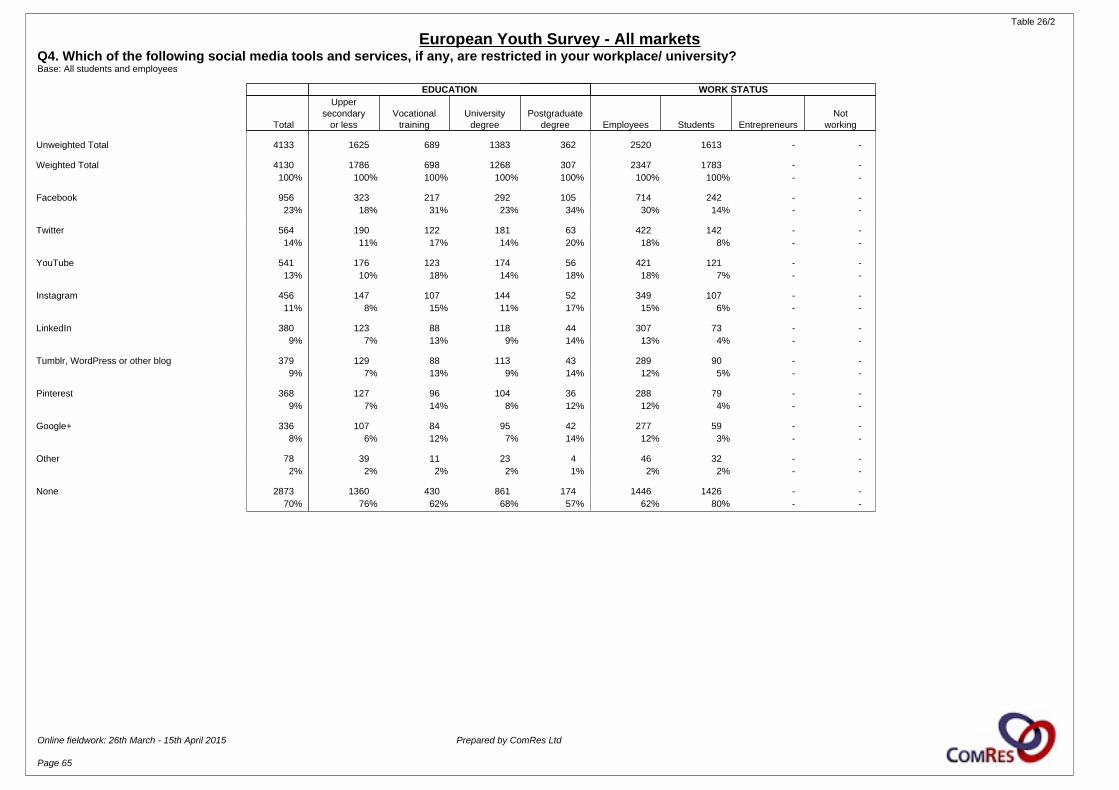
Table 26/2
European Youth Survey - All marketsQ4. Which of the following social media tools and services, if any, are restricted in your workplace/ university?Base: All students and employees
EDUCATION WORK STATUS
Total
Uppersecondary
or lessVocational
trainingUniversity
degreePostgraduate
degree Employees Students EntrepreneursNot
working
Unweighted Total 4133 1625 689 1383 362 2520 1613 - -
Weighted Total 4130 1786 698 1268 307 2347 1783 - -100% 100% 100% 100% 100% 100% 100% - -
Facebook 956 323 217 292 105 714 242 - -23% 18% 31% 23% 34% 30% 14% - -
Twitter 564 190 122 181 63 422 142 - -14% 11% 17% 14% 20% 18% 8% - -
YouTube 541 176 123 174 56 421 121 - -13% 10% 18% 14% 18% 18% 7% - -
Instagram 456 147 107 144 52 349 107 - -11% 8% 15% 11% 17% 15% 6% - -
LinkedIn 380 123 88 118 44 307 73 - -9% 7% 13% 9% 14% 13% 4% - -
Tumblr, WordPress or other blog 379 129 88 113 43 289 90 - -9% 7% 13% 9% 14% 12% 5% - -
Pinterest 368 127 96 104 36 288 79 - -9% 7% 14% 8% 12% 12% 4% - -
Google+ 336 107 84 95 42 277 59 - -8% 6% 12% 7% 14% 12% 3% - -
Other 78 39 11 23 4 46 32 - -2% 2% 2% 2% 1% 2% 2% - -
None 2873 1360 430 861 174 1446 1426 - -70% 76% 62% 68% 57% 62% 80% - -
Online fieldwork: 26th March - 15th April 2015 Prepared by ComRes Ltd
Page 65
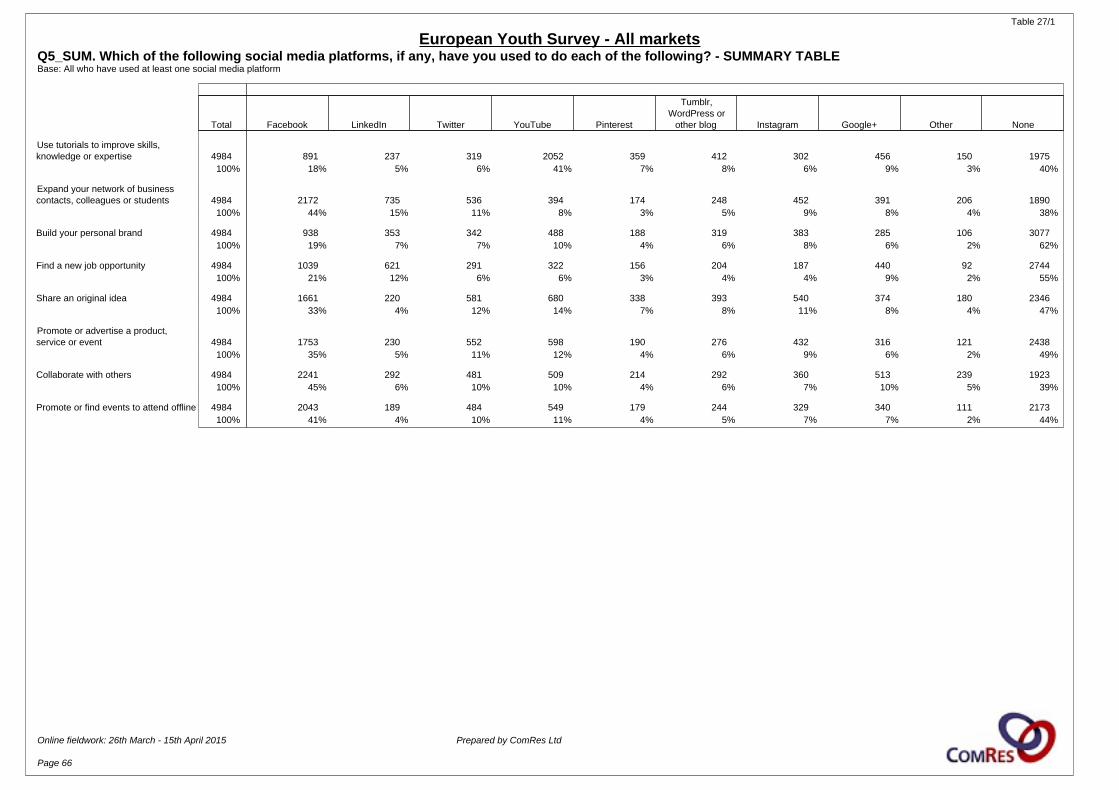
Table 27/1
European Youth Survey - All marketsQ5_SUM. Which of the following social media platforms, if any, have you used to do each of the following? - SUMMARY TABLEBase: All who have used at least one social media platform
Total Facebook LinkedIn Twitter YouTube Pinterest
Tumblr,WordPress or
other blog Instagram Google+ Other None
Use tutorials to improve skills,knowledge or expertise 4984 891 237 319 2052 359 412 302 456 150 1975
100% 18% 5% 6% 41% 7% 8% 6% 9% 3% 40%
Expand your network of businesscontacts, colleagues or students 4984 2172 735 536 394 174 248 452 391 206 1890
100% 44% 15% 11% 8% 3% 5% 9% 8% 4% 38%
Build your personal brand 4984 938 353 342 488 188 319 383 285 106 3077100% 19% 7% 7% 10% 4% 6% 8% 6% 2% 62%
Find a new job opportunity 4984 1039 621 291 322 156 204 187 440 92 2744100% 21% 12% 6% 6% 3% 4% 4% 9% 2% 55%
Share an original idea 4984 1661 220 581 680 338 393 540 374 180 2346100% 33% 4% 12% 14% 7% 8% 11% 8% 4% 47%
Promote or advertise a product,service or event 4984 1753 230 552 598 190 276 432 316 121 2438
100% 35% 5% 11% 12% 4% 6% 9% 6% 2% 49%
Collaborate with others 4984 2241 292 481 509 214 292 360 513 239 1923100% 45% 6% 10% 10% 4% 6% 7% 10% 5% 39%
Promote or find events to attend offline 4984 2043 189 484 549 179 244 329 340 111 2173100% 41% 4% 10% 11% 4% 5% 7% 7% 2% 44%
Online fieldwork: 26th March - 15th April 2015 Prepared by ComRes Ltd
Page 66
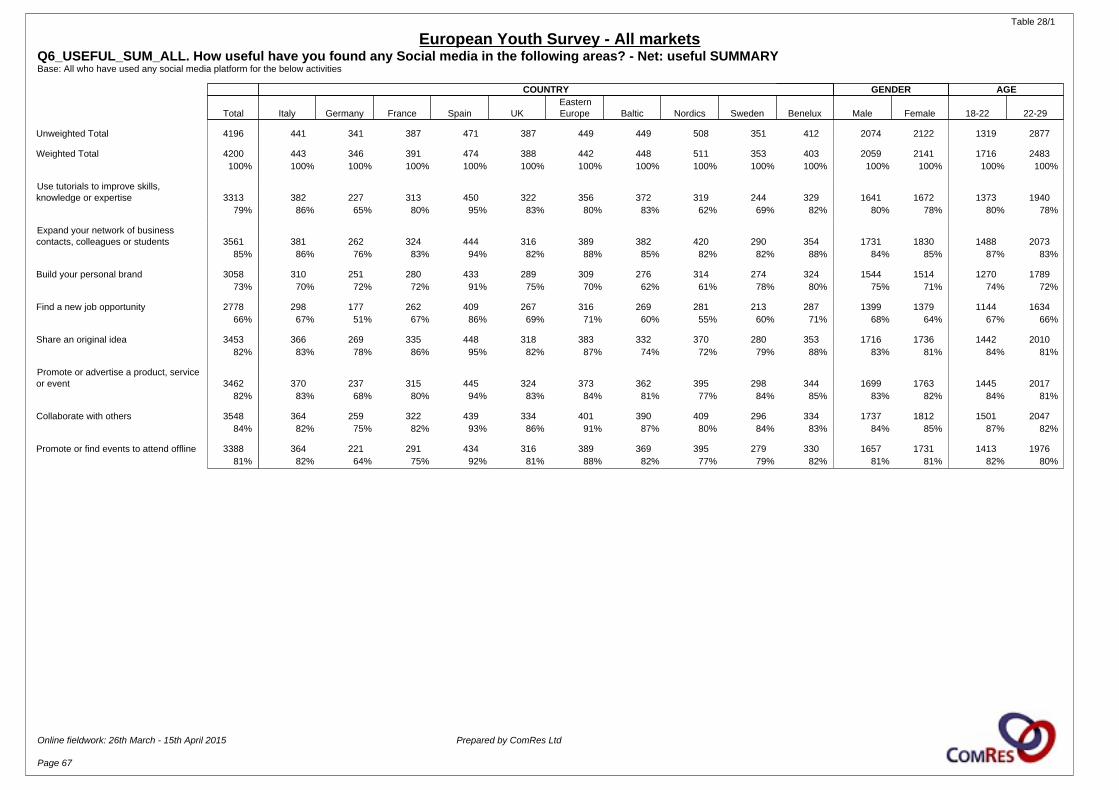
Table 28/1
European Youth Survey - All marketsQ6_USEFUL_SUM_ALL. How useful have you found any Social media in the following areas? - Net: useful SUMMARYBase: All who have used any social media platform for the below activities
COUNTRY GENDER AGE
Total Italy Germany France Spain UKEasternEurope Baltic Nordics Sweden Benelux Male Female 18-22 22-29
Unweighted Total 4196 441 341 387 471 387 449 449 508 351 412 2074 2122 1319 2877
Weighted Total 4200 443 346 391 474 388 442 448 511 353 403 2059 2141 1716 2483100% 100% 100% 100% 100% 100% 100% 100% 100% 100% 100% 100% 100% 100% 100%
Use tutorials to improve skills,knowledge or expertise 3313 382 227 313 450 322 356 372 319 244 329 1641 1672 1373 1940
79% 86% 65% 80% 95% 83% 80% 83% 62% 69% 82% 80% 78% 80% 78%
Expand your network of businesscontacts, colleagues or students 3561 381 262 324 444 316 389 382 420 290 354 1731 1830 1488 2073
85% 86% 76% 83% 94% 82% 88% 85% 82% 82% 88% 84% 85% 87% 83%
Build your personal brand 3058 310 251 280 433 289 309 276 314 274 324 1544 1514 1270 178973% 70% 72% 72% 91% 75% 70% 62% 61% 78% 80% 75% 71% 74% 72%
Find a new job opportunity 2778 298 177 262 409 267 316 269 281 213 287 1399 1379 1144 163466% 67% 51% 67% 86% 69% 71% 60% 55% 60% 71% 68% 64% 67% 66%
Share an original idea 3453 366 269 335 448 318 383 332 370 280 353 1716 1736 1442 201082% 83% 78% 86% 95% 82% 87% 74% 72% 79% 88% 83% 81% 84% 81%
Promote or advertise a product, serviceor event 3462 370 237 315 445 324 373 362 395 298 344 1699 1763 1445 2017
82% 83% 68% 80% 94% 83% 84% 81% 77% 84% 85% 83% 82% 84% 81%
Collaborate with others 3548 364 259 322 439 334 401 390 409 296 334 1737 1812 1501 204784% 82% 75% 82% 93% 86% 91% 87% 80% 84% 83% 84% 85% 87% 82%
Promote or find events to attend offline 3388 364 221 291 434 316 389 369 395 279 330 1657 1731 1413 197681% 82% 64% 75% 92% 81% 88% 82% 77% 79% 82% 81% 81% 82% 80%
Online fieldwork: 26th March - 15th April 2015 Prepared by ComRes Ltd
Page 67
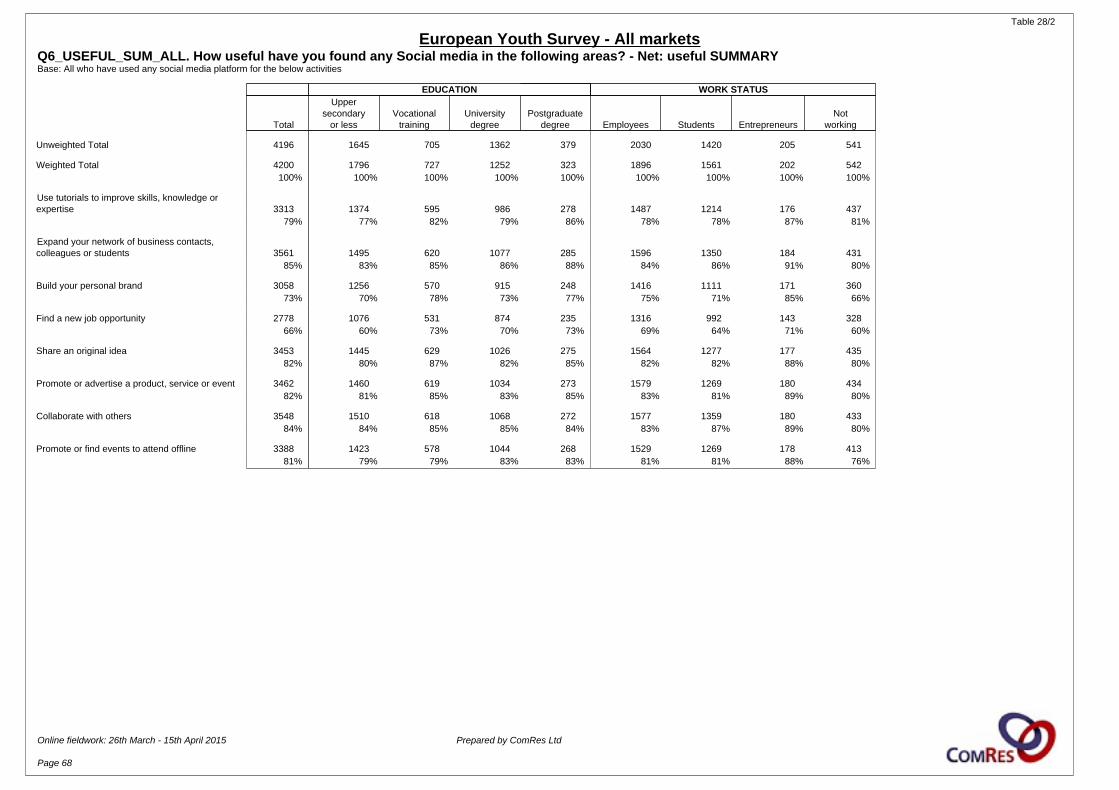
Table 28/2
European Youth Survey - All marketsQ6_USEFUL_SUM_ALL. How useful have you found any Social media in the following areas? - Net: useful SUMMARYBase: All who have used any social media platform for the below activities
EDUCATION WORK STATUS
Total
Uppersecondary
or lessVocational
trainingUniversity
degreePostgraduate
degree Employees Students EntrepreneursNot
working
Unweighted Total 4196 1645 705 1362 379 2030 1420 205 541
Weighted Total 4200 1796 727 1252 323 1896 1561 202 542100% 100% 100% 100% 100% 100% 100% 100% 100%
Use tutorials to improve skills, knowledge orexpertise 3313 1374 595 986 278 1487 1214 176 437
79% 77% 82% 79% 86% 78% 78% 87% 81%
Expand your network of business contacts,colleagues or students 3561 1495 620 1077 285 1596 1350 184 431
85% 83% 85% 86% 88% 84% 86% 91% 80%
Build your personal brand 3058 1256 570 915 248 1416 1111 171 36073% 70% 78% 73% 77% 75% 71% 85% 66%
Find a new job opportunity 2778 1076 531 874 235 1316 992 143 32866% 60% 73% 70% 73% 69% 64% 71% 60%
Share an original idea 3453 1445 629 1026 275 1564 1277 177 43582% 80% 87% 82% 85% 82% 82% 88% 80%
Promote or advertise a product, service or event 3462 1460 619 1034 273 1579 1269 180 43482% 81% 85% 83% 85% 83% 81% 89% 80%
Collaborate with others 3548 1510 618 1068 272 1577 1359 180 43384% 84% 85% 85% 84% 83% 87% 89% 80%
Promote or find events to attend offline 3388 1423 578 1044 268 1529 1269 178 41381% 79% 79% 83% 83% 81% 81% 88% 76%
Online fieldwork: 26th March - 15th April 2015 Prepared by ComRes Ltd
Page 68
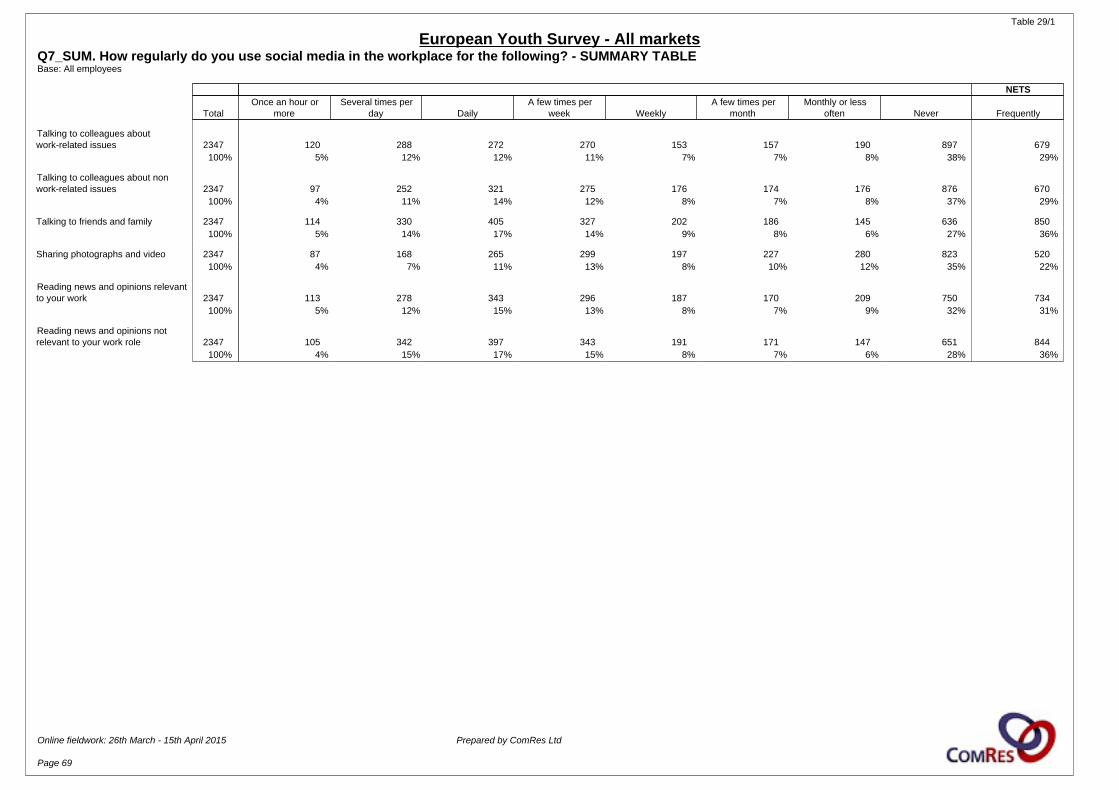
Table 29/1
European Youth Survey - All marketsQ7_SUM. How regularly do you use social media in the workplace for the following? - SUMMARY TABLEBase: All employees
NETS
TotalOnce an hour or
moreSeveral times per
day DailyA few times per
week WeeklyA few times per
monthMonthly or less
often Never Frequently
Talking to colleagues aboutwork-related issues 2347 120 288 272 270 153 157 190 897 679
100% 5% 12% 12% 11% 7% 7% 8% 38% 29%
Talking to colleagues about nonwork-related issues 2347 97 252 321 275 176 174 176 876 670
100% 4% 11% 14% 12% 8% 7% 8% 37% 29%
Talking to friends and family 2347 114 330 405 327 202 186 145 636 850100% 5% 14% 17% 14% 9% 8% 6% 27% 36%
Sharing photographs and video 2347 87 168 265 299 197 227 280 823 520100% 4% 7% 11% 13% 8% 10% 12% 35% 22%
Reading news and opinions relevantto your work 2347 113 278 343 296 187 170 209 750 734
100% 5% 12% 15% 13% 8% 7% 9% 32% 31%
Reading news and opinions notrelevant to your work role 2347 105 342 397 343 191 171 147 651 844
100% 4% 15% 17% 15% 8% 7% 6% 28% 36%
Online fieldwork: 26th March - 15th April 2015 Prepared by ComRes Ltd
Page 69
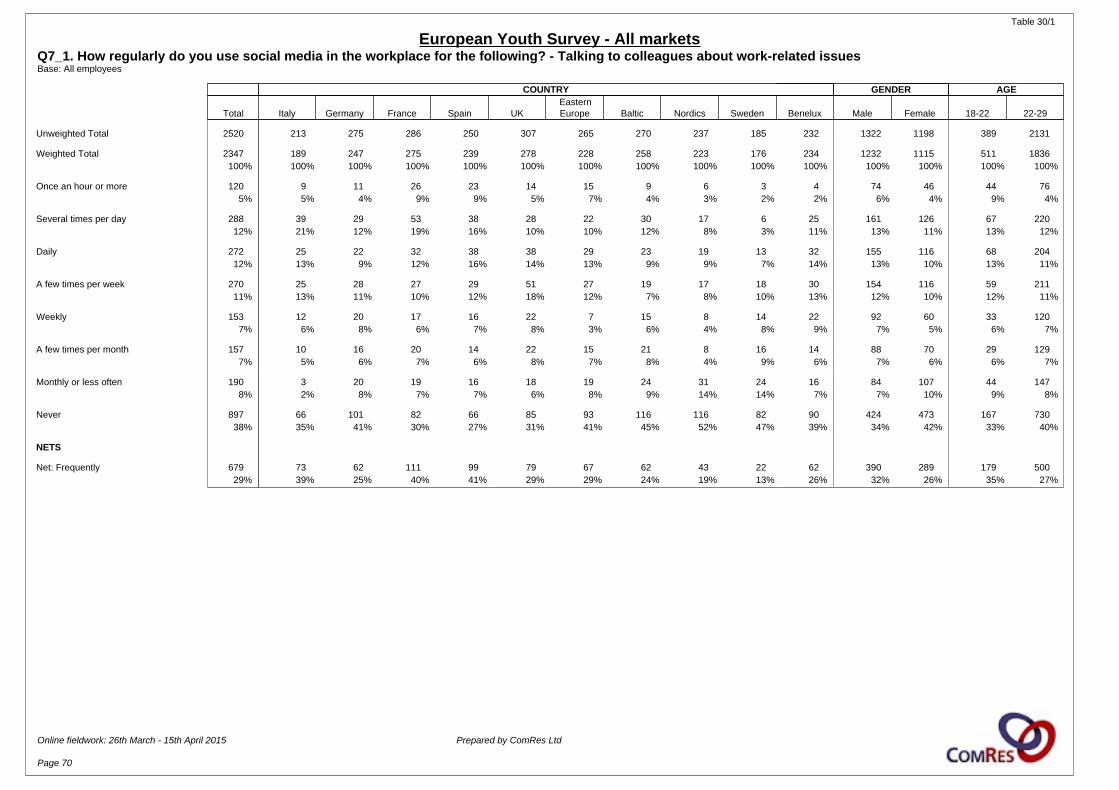
Table 30/1
European Youth Survey - All marketsQ7_1. How regularly do you use social media in the workplace for the following? - Talking to colleagues about work-related issuesBase: All employees
COUNTRY GENDER AGE
Total Italy Germany France Spain UKEasternEurope Baltic Nordics Sweden Benelux Male Female 18-22 22-29
Unweighted Total 2520 213 275 286 250 307 265 270 237 185 232 1322 1198 389 2131
Weighted Total 2347 189 247 275 239 278 228 258 223 176 234 1232 1115 511 1836100% 100% 100% 100% 100% 100% 100% 100% 100% 100% 100% 100% 100% 100% 100%
Once an hour or more 120 9 11 26 23 14 15 9 6 3 4 74 46 44 765% 5% 4% 9% 9% 5% 7% 4% 3% 2% 2% 6% 4% 9% 4%
Several times per day 288 39 29 53 38 28 22 30 17 6 25 161 126 67 22012% 21% 12% 19% 16% 10% 10% 12% 8% 3% 11% 13% 11% 13% 12%
Daily 272 25 22 32 38 38 29 23 19 13 32 155 116 68 20412% 13% 9% 12% 16% 14% 13% 9% 9% 7% 14% 13% 10% 13% 11%
A few times per week 270 25 28 27 29 51 27 19 17 18 30 154 116 59 21111% 13% 11% 10% 12% 18% 12% 7% 8% 10% 13% 12% 10% 12% 11%
Weekly 153 12 20 17 16 22 7 15 8 14 22 92 60 33 1207% 6% 8% 6% 7% 8% 3% 6% 4% 8% 9% 7% 5% 6% 7%
A few times per month 157 10 16 20 14 22 15 21 8 16 14 88 70 29 1297% 5% 6% 7% 6% 8% 7% 8% 4% 9% 6% 7% 6% 6% 7%
Monthly or less often 190 3 20 19 16 18 19 24 31 24 16 84 107 44 1478% 2% 8% 7% 7% 6% 8% 9% 14% 14% 7% 7% 10% 9% 8%
Never 897 66 101 82 66 85 93 116 116 82 90 424 473 167 73038% 35% 41% 30% 27% 31% 41% 45% 52% 47% 39% 34% 42% 33% 40%
NETS
Net: Frequently 679 73 62 111 99 79 67 62 43 22 62 390 289 179 50029% 39% 25% 40% 41% 29% 29% 24% 19% 13% 26% 32% 26% 35% 27%
Online fieldwork: 26th March - 15th April 2015 Prepared by ComRes Ltd
Page 70

Table 30/2
European Youth Survey - All marketsQ7_1. How regularly do you use social media in the workplace for the following? - Talking to colleagues about work-related issuesBase: All employees
EDUCATION WORK STATUS
Total
Uppersecondary
or lessVocational
trainingUniversity
degreePostgraduate
degree Employees Students EntrepreneursNot
working
Unweighted Total 2520 731 507 932 303 2520 - - -
Weighted Total 2347 723 495 830 255 2347 - - -100% 100% 100% 100% 100% 100% - - -
Once an hour or more 120 27 25 52 14 120 - - -5% 4% 5% 6% 6% 5% - - -
Several times per day 288 71 78 89 46 288 - - -12% 10% 16% 11% 18% 12% - - -
Daily 272 73 72 90 32 272 - - -12% 10% 14% 11% 13% 12% - - -
A few times per week 270 97 55 85 25 270 - - -11% 13% 11% 10% 10% 11% - - -
Weekly 153 55 25 54 16 153 - - -7% 8% 5% 7% 6% 7% - - -
A few times per month 157 45 34 55 21 157 - - -7% 6% 7% 7% 8% 7% - - -
Monthly or less often 190 52 42 80 13 190 - - -8% 7% 9% 10% 5% 8% - - -
Never 897 304 165 325 87 897 - - -38% 42% 33% 39% 34% 38% - - -
NETS
Net: Frequently 679 171 175 231 92 679 - - -29% 24% 35% 28% 36% 29% - - -
Online fieldwork: 26th March - 15th April 2015 Prepared by ComRes Ltd
Page 71
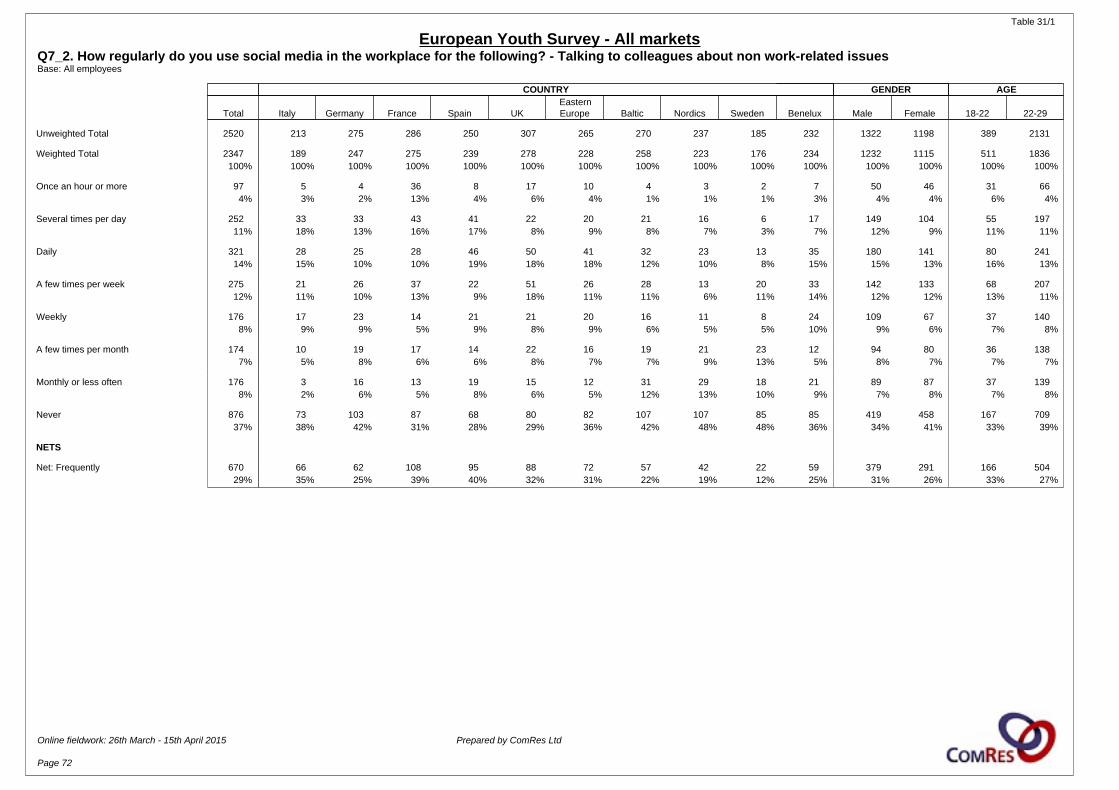
Table 31/1
European Youth Survey - All marketsQ7_2. How regularly do you use social media in the workplace for the following? - Talking to colleagues about non work-related issuesBase: All employees
COUNTRY GENDER AGE
Total Italy Germany France Spain UKEasternEurope Baltic Nordics Sweden Benelux Male Female 18-22 22-29
Unweighted Total 2520 213 275 286 250 307 265 270 237 185 232 1322 1198 389 2131
Weighted Total 2347 189 247 275 239 278 228 258 223 176 234 1232 1115 511 1836100% 100% 100% 100% 100% 100% 100% 100% 100% 100% 100% 100% 100% 100% 100%
Once an hour or more 97 5 4 36 8 17 10 4 3 2 7 50 46 31 664% 3% 2% 13% 4% 6% 4% 1% 1% 1% 3% 4% 4% 6% 4%
Several times per day 252 33 33 43 41 22 20 21 16 6 17 149 104 55 19711% 18% 13% 16% 17% 8% 9% 8% 7% 3% 7% 12% 9% 11% 11%
Daily 321 28 25 28 46 50 41 32 23 13 35 180 141 80 24114% 15% 10% 10% 19% 18% 18% 12% 10% 8% 15% 15% 13% 16% 13%
A few times per week 275 21 26 37 22 51 26 28 13 20 33 142 133 68 20712% 11% 10% 13% 9% 18% 11% 11% 6% 11% 14% 12% 12% 13% 11%
Weekly 176 17 23 14 21 21 20 16 11 8 24 109 67 37 1408% 9% 9% 5% 9% 8% 9% 6% 5% 5% 10% 9% 6% 7% 8%
A few times per month 174 10 19 17 14 22 16 19 21 23 12 94 80 36 1387% 5% 8% 6% 6% 8% 7% 7% 9% 13% 5% 8% 7% 7% 7%
Monthly or less often 176 3 16 13 19 15 12 31 29 18 21 89 87 37 1398% 2% 6% 5% 8% 6% 5% 12% 13% 10% 9% 7% 8% 7% 8%
Never 876 73 103 87 68 80 82 107 107 85 85 419 458 167 70937% 38% 42% 31% 28% 29% 36% 42% 48% 48% 36% 34% 41% 33% 39%
NETS
Net: Frequently 670 66 62 108 95 88 72 57 42 22 59 379 291 166 50429% 35% 25% 39% 40% 32% 31% 22% 19% 12% 25% 31% 26% 33% 27%
Online fieldwork: 26th March - 15th April 2015 Prepared by ComRes Ltd
Page 72
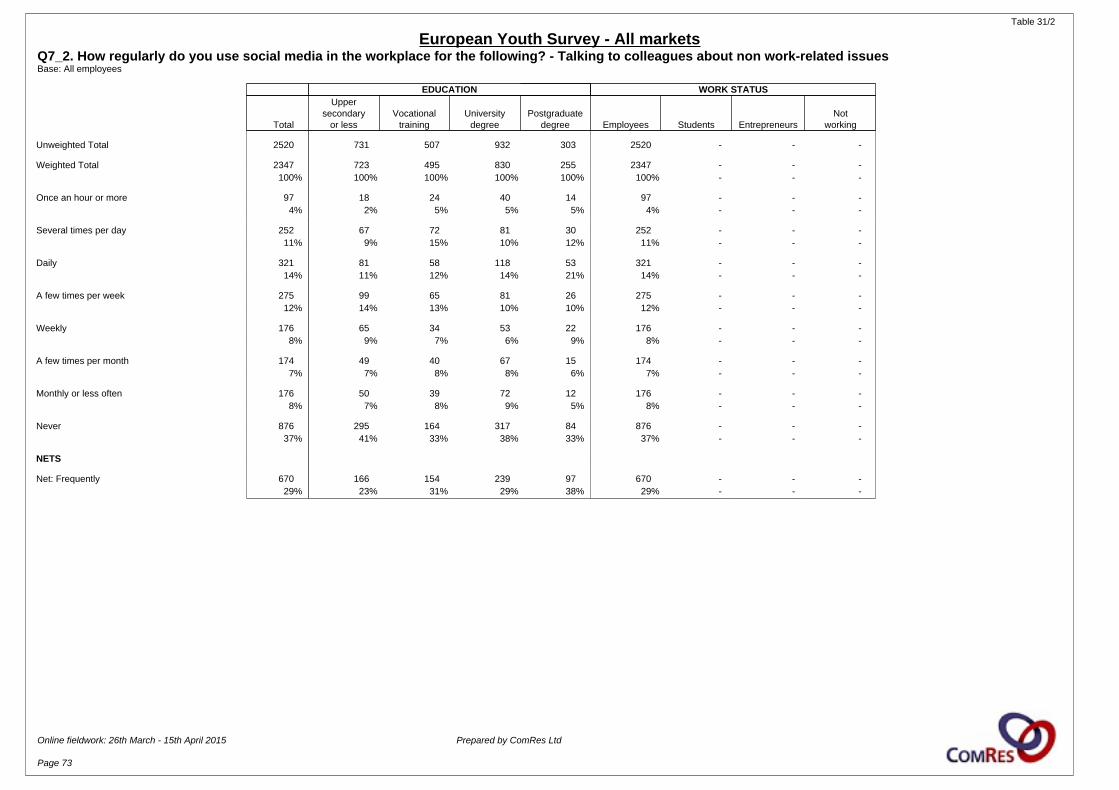
Table 31/2
European Youth Survey - All marketsQ7_2. How regularly do you use social media in the workplace for the following? - Talking to colleagues about non work-related issuesBase: All employees
EDUCATION WORK STATUS
Total
Uppersecondary
or lessVocational
trainingUniversity
degreePostgraduate
degree Employees Students EntrepreneursNot
working
Unweighted Total 2520 731 507 932 303 2520 - - -
Weighted Total 2347 723 495 830 255 2347 - - -100% 100% 100% 100% 100% 100% - - -
Once an hour or more 97 18 24 40 14 97 - - -4% 2% 5% 5% 5% 4% - - -
Several times per day 252 67 72 81 30 252 - - -11% 9% 15% 10% 12% 11% - - -
Daily 321 81 58 118 53 321 - - -14% 11% 12% 14% 21% 14% - - -
A few times per week 275 99 65 81 26 275 - - -12% 14% 13% 10% 10% 12% - - -
Weekly 176 65 34 53 22 176 - - -8% 9% 7% 6% 9% 8% - - -
A few times per month 174 49 40 67 15 174 - - -7% 7% 8% 8% 6% 7% - - -
Monthly or less often 176 50 39 72 12 176 - - -8% 7% 8% 9% 5% 8% - - -
Never 876 295 164 317 84 876 - - -37% 41% 33% 38% 33% 37% - - -
NETS
Net: Frequently 670 166 154 239 97 670 - - -29% 23% 31% 29% 38% 29% - - -
Online fieldwork: 26th March - 15th April 2015 Prepared by ComRes Ltd
Page 73
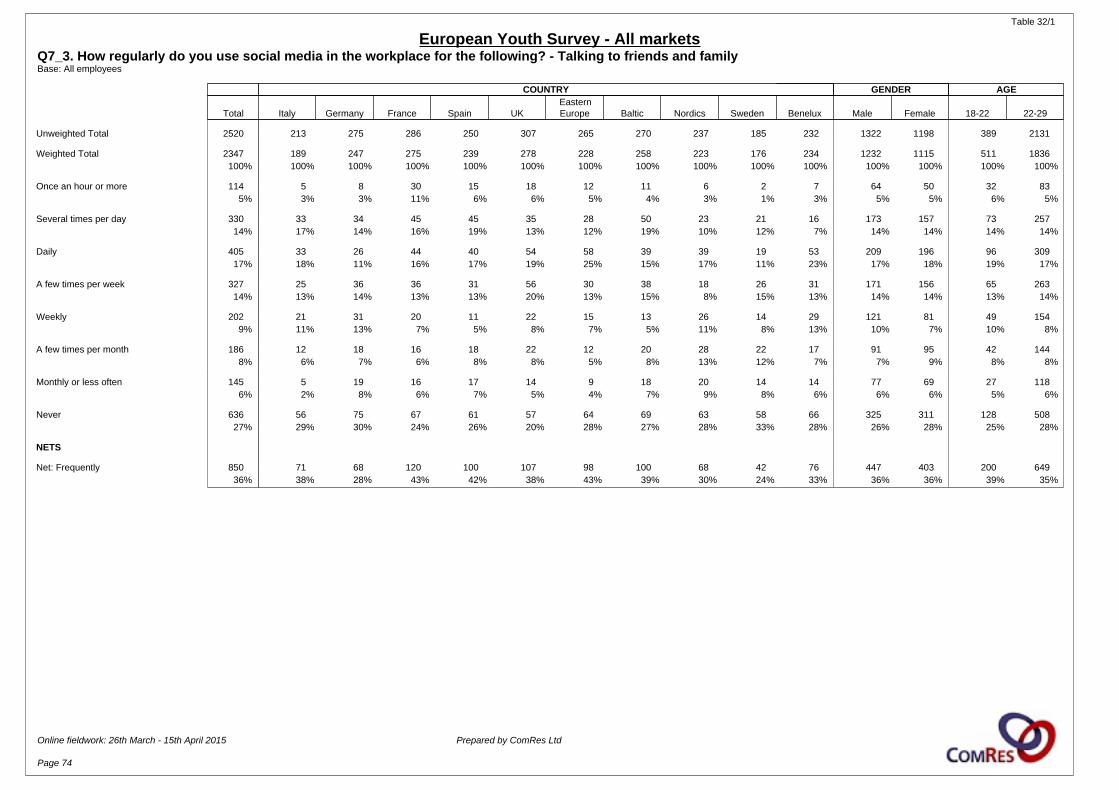
Table 32/1
European Youth Survey - All marketsQ7_3. How regularly do you use social media in the workplace for the following? - Talking to friends and familyBase: All employees
COUNTRY GENDER AGE
Total Italy Germany France Spain UKEasternEurope Baltic Nordics Sweden Benelux Male Female 18-22 22-29
Unweighted Total 2520 213 275 286 250 307 265 270 237 185 232 1322 1198 389 2131
Weighted Total 2347 189 247 275 239 278 228 258 223 176 234 1232 1115 511 1836100% 100% 100% 100% 100% 100% 100% 100% 100% 100% 100% 100% 100% 100% 100%
Once an hour or more 114 5 8 30 15 18 12 11 6 2 7 64 50 32 835% 3% 3% 11% 6% 6% 5% 4% 3% 1% 3% 5% 5% 6% 5%
Several times per day 330 33 34 45 45 35 28 50 23 21 16 173 157 73 25714% 17% 14% 16% 19% 13% 12% 19% 10% 12% 7% 14% 14% 14% 14%
Daily 405 33 26 44 40 54 58 39 39 19 53 209 196 96 30917% 18% 11% 16% 17% 19% 25% 15% 17% 11% 23% 17% 18% 19% 17%
A few times per week 327 25 36 36 31 56 30 38 18 26 31 171 156 65 26314% 13% 14% 13% 13% 20% 13% 15% 8% 15% 13% 14% 14% 13% 14%
Weekly 202 21 31 20 11 22 15 13 26 14 29 121 81 49 1549% 11% 13% 7% 5% 8% 7% 5% 11% 8% 13% 10% 7% 10% 8%
A few times per month 186 12 18 16 18 22 12 20 28 22 17 91 95 42 1448% 6% 7% 6% 8% 8% 5% 8% 13% 12% 7% 7% 9% 8% 8%
Monthly or less often 145 5 19 16 17 14 9 18 20 14 14 77 69 27 1186% 2% 8% 6% 7% 5% 4% 7% 9% 8% 6% 6% 6% 5% 6%
Never 636 56 75 67 61 57 64 69 63 58 66 325 311 128 50827% 29% 30% 24% 26% 20% 28% 27% 28% 33% 28% 26% 28% 25% 28%
NETS
Net: Frequently 850 71 68 120 100 107 98 100 68 42 76 447 403 200 64936% 38% 28% 43% 42% 38% 43% 39% 30% 24% 33% 36% 36% 39% 35%
Online fieldwork: 26th March - 15th April 2015 Prepared by ComRes Ltd
Page 74
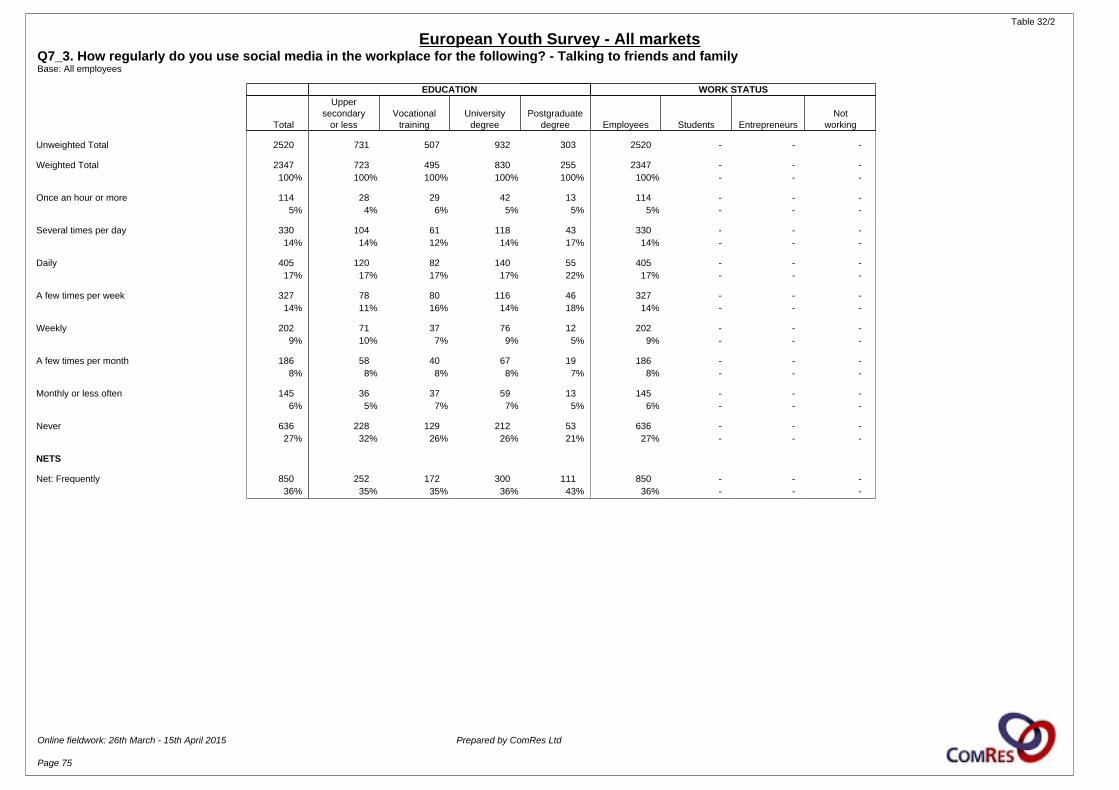
Table 32/2
European Youth Survey - All marketsQ7_3. How regularly do you use social media in the workplace for the following? - Talking to friends and familyBase: All employees
EDUCATION WORK STATUS
Total
Uppersecondary
or lessVocational
trainingUniversity
degreePostgraduate
degree Employees Students EntrepreneursNot
working
Unweighted Total 2520 731 507 932 303 2520 - - -
Weighted Total 2347 723 495 830 255 2347 - - -100% 100% 100% 100% 100% 100% - - -
Once an hour or more 114 28 29 42 13 114 - - -5% 4% 6% 5% 5% 5% - - -
Several times per day 330 104 61 118 43 330 - - -14% 14% 12% 14% 17% 14% - - -
Daily 405 120 82 140 55 405 - - -17% 17% 17% 17% 22% 17% - - -
A few times per week 327 78 80 116 46 327 - - -14% 11% 16% 14% 18% 14% - - -
Weekly 202 71 37 76 12 202 - - -9% 10% 7% 9% 5% 9% - - -
A few times per month 186 58 40 67 19 186 - - -8% 8% 8% 8% 7% 8% - - -
Monthly or less often 145 36 37 59 13 145 - - -6% 5% 7% 7% 5% 6% - - -
Never 636 228 129 212 53 636 - - -27% 32% 26% 26% 21% 27% - - -
NETS
Net: Frequently 850 252 172 300 111 850 - - -36% 35% 35% 36% 43% 36% - - -
Online fieldwork: 26th March - 15th April 2015 Prepared by ComRes Ltd
Page 75
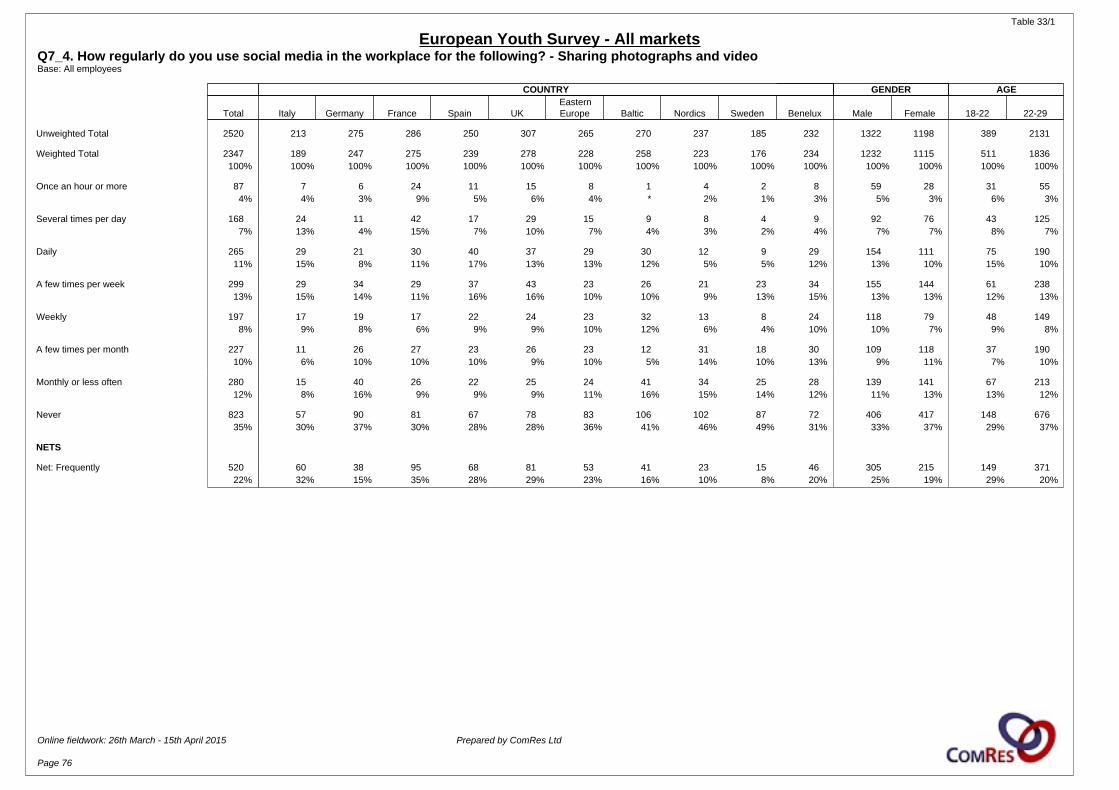
Table 33/1
European Youth Survey - All marketsQ7_4. How regularly do you use social media in the workplace for the following? - Sharing photographs and videoBase: All employees
COUNTRY GENDER AGE
Total Italy Germany France Spain UKEasternEurope Baltic Nordics Sweden Benelux Male Female 18-22 22-29
Unweighted Total 2520 213 275 286 250 307 265 270 237 185 232 1322 1198 389 2131
Weighted Total 2347 189 247 275 239 278 228 258 223 176 234 1232 1115 511 1836100% 100% 100% 100% 100% 100% 100% 100% 100% 100% 100% 100% 100% 100% 100%
Once an hour or more 87 7 6 24 11 15 8 1 4 2 8 59 28 31 554% 4% 3% 9% 5% 6% 4% * 2% 1% 3% 5% 3% 6% 3%
Several times per day 168 24 11 42 17 29 15 9 8 4 9 92 76 43 1257% 13% 4% 15% 7% 10% 7% 4% 3% 2% 4% 7% 7% 8% 7%
Daily 265 29 21 30 40 37 29 30 12 9 29 154 111 75 19011% 15% 8% 11% 17% 13% 13% 12% 5% 5% 12% 13% 10% 15% 10%
A few times per week 299 29 34 29 37 43 23 26 21 23 34 155 144 61 23813% 15% 14% 11% 16% 16% 10% 10% 9% 13% 15% 13% 13% 12% 13%
Weekly 197 17 19 17 22 24 23 32 13 8 24 118 79 48 1498% 9% 8% 6% 9% 9% 10% 12% 6% 4% 10% 10% 7% 9% 8%
A few times per month 227 11 26 27 23 26 23 12 31 18 30 109 118 37 19010% 6% 10% 10% 10% 9% 10% 5% 14% 10% 13% 9% 11% 7% 10%
Monthly or less often 280 15 40 26 22 25 24 41 34 25 28 139 141 67 21312% 8% 16% 9% 9% 9% 11% 16% 15% 14% 12% 11% 13% 13% 12%
Never 823 57 90 81 67 78 83 106 102 87 72 406 417 148 67635% 30% 37% 30% 28% 28% 36% 41% 46% 49% 31% 33% 37% 29% 37%
NETS
Net: Frequently 520 60 38 95 68 81 53 41 23 15 46 305 215 149 37122% 32% 15% 35% 28% 29% 23% 16% 10% 8% 20% 25% 19% 29% 20%
Online fieldwork: 26th March - 15th April 2015 Prepared by ComRes Ltd
Page 76

Table 33/2
European Youth Survey - All marketsQ7_4. How regularly do you use social media in the workplace for the following? - Sharing photographs and videoBase: All employees
EDUCATION WORK STATUS
Total
Uppersecondary
or lessVocational
trainingUniversity
degreePostgraduate
degree Employees Students EntrepreneursNot
working
Unweighted Total 2520 731 507 932 303 2520 - - -
Weighted Total 2347 723 495 830 255 2347 - - -100% 100% 100% 100% 100% 100% - - -
Once an hour or more 87 21 21 31 13 87 - - -4% 3% 4% 4% 5% 4% - - -
Several times per day 168 47 39 55 23 168 - - -7% 7% 8% 7% 9% 7% - - -
Daily 265 70 66 85 39 265 - - -11% 10% 13% 10% 15% 11% - - -
A few times per week 299 99 60 100 34 299 - - -13% 14% 12% 12% 13% 13% - - -
Weekly 197 66 40 69 18 197 - - -8% 9% 8% 8% 7% 8% - - -
A few times per month 227 77 45 76 25 227 - - -10% 11% 9% 9% 10% 10% - - -
Monthly or less often 280 79 63 115 20 280 - - -12% 11% 13% 14% 8% 12% - - -
Never 823 265 160 299 84 823 - - -35% 37% 32% 36% 33% 35% - - -
NETS
Net: Frequently 520 138 126 171 75 520 - - -22% 19% 26% 21% 29% 22% - - -
Online fieldwork: 26th March - 15th April 2015 Prepared by ComRes Ltd
Page 77

Table 34/1
European Youth Survey - All marketsQ7_5. How regularly do you use social media in the workplace for the following? - Reading news and opinions relevant to your workBase: All employees
COUNTRY GENDER AGE
Total Italy Germany France Spain UKEasternEurope Baltic Nordics Sweden Benelux Male Female 18-22 22-29
Unweighted Total 2520 213 275 286 250 307 265 270 237 185 232 1322 1198 389 2131
Weighted Total 2347 189 247 275 239 278 228 258 223 176 234 1232 1115 511 1836100% 100% 100% 100% 100% 100% 100% 100% 100% 100% 100% 100% 100% 100% 100%
Once an hour or more 113 5 12 29 20 19 10 3 3 3 8 74 39 36 775% 3% 5% 11% 8% 7% 4% 1% 1% 2% 3% 6% 4% 7% 4%
Several times per day 278 30 24 39 35 26 29 45 23 7 19 162 116 48 23012% 16% 10% 14% 15% 9% 13% 17% 10% 4% 8% 13% 10% 9% 13%
Daily 343 39 31 46 40 47 41 22 21 21 35 184 159 84 25915% 21% 12% 17% 17% 17% 18% 8% 10% 12% 15% 15% 14% 16% 14%
A few times per week 296 22 28 28 34 47 23 32 28 20 35 175 121 74 22213% 11% 11% 10% 14% 17% 10% 12% 13% 11% 15% 14% 11% 15% 12%
Weekly 187 12 14 18 20 24 15 21 21 22 22 91 96 31 1578% 6% 6% 6% 8% 8% 7% 8% 9% 12% 9% 7% 9% 6% 9%
A few times per month 170 13 18 14 17 16 17 16 20 20 19 87 83 36 1347% 7% 7% 5% 7% 6% 7% 6% 9% 11% 8% 7% 7% 7% 7%
Monthly or less often 209 7 21 22 16 20 24 34 26 21 19 104 105 53 1569% 3% 8% 8% 7% 7% 10% 13% 12% 12% 8% 8% 9% 10% 9%
Never 750 61 99 80 58 78 69 85 80 62 78 353 396 148 60132% 32% 40% 29% 24% 28% 30% 33% 36% 35% 33% 29% 36% 29% 33%
NETS
Net: Frequently 734 75 67 114 95 93 80 70 47 32 61 420 314 169 56631% 40% 27% 41% 40% 33% 35% 27% 21% 18% 26% 34% 28% 33% 31%
Online fieldwork: 26th March - 15th April 2015 Prepared by ComRes Ltd
Page 78

Table 34/2
European Youth Survey - All marketsQ7_5. How regularly do you use social media in the workplace for the following? - Reading news and opinions relevant to your workBase: All employees
EDUCATION WORK STATUS
Total
Uppersecondary
or lessVocational
trainingUniversity
degreePostgraduate
degree Employees Students EntrepreneursNot
working
Unweighted Total 2520 731 507 932 303 2520 - - -
Weighted Total 2347 723 495 830 255 2347 - - -100% 100% 100% 100% 100% 100% - - -
Once an hour or more 113 21 30 45 15 113 - - -5% 3% 6% 5% 6% 5% - - -
Several times per day 278 64 67 102 42 278 - - -12% 9% 14% 12% 17% 12% - - -
Daily 343 95 67 130 45 343 - - -15% 13% 13% 16% 18% 15% - - -
A few times per week 296 105 56 97 31 296 - - -13% 14% 11% 12% 12% 13% - - -
Weekly 187 51 38 71 22 187 - - -8% 7% 8% 9% 9% 8% - - -
A few times per month 170 50 39 62 17 170 - - -7% 7% 8% 7% 7% 7% - - -
Monthly or less often 209 69 38 77 22 209 - - -9% 10% 8% 9% 9% 9% - - -
Never 750 268 161 246 61 750 - - -32% 37% 32% 30% 24% 32% - - -
NETS
Net: Frequently 734 180 164 277 102 734 - - -31% 25% 33% 33% 40% 31% - - -
Online fieldwork: 26th March - 15th April 2015 Prepared by ComRes Ltd
Page 79
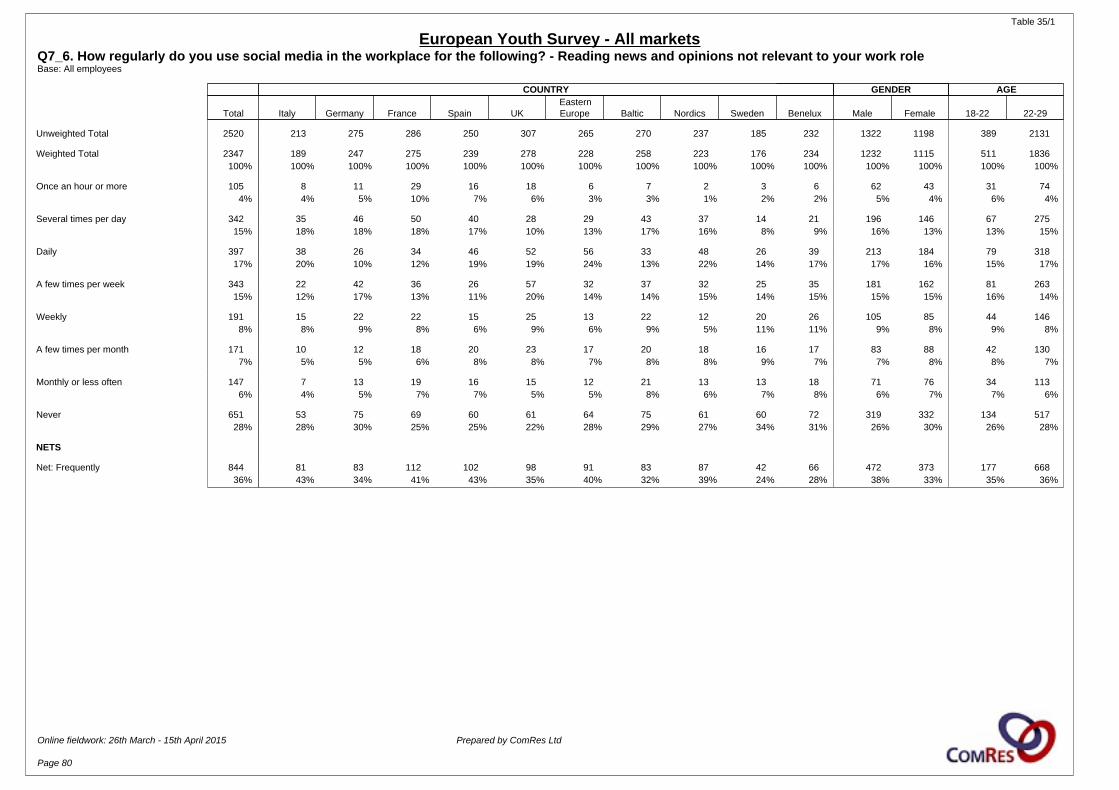
Table 35/1
European Youth Survey - All marketsQ7_6. How regularly do you use social media in the workplace for the following? - Reading news and opinions not relevant to your work roleBase: All employees
COUNTRY GENDER AGE
Total Italy Germany France Spain UKEasternEurope Baltic Nordics Sweden Benelux Male Female 18-22 22-29
Unweighted Total 2520 213 275 286 250 307 265 270 237 185 232 1322 1198 389 2131
Weighted Total 2347 189 247 275 239 278 228 258 223 176 234 1232 1115 511 1836100% 100% 100% 100% 100% 100% 100% 100% 100% 100% 100% 100% 100% 100% 100%
Once an hour or more 105 8 11 29 16 18 6 7 2 3 6 62 43 31 744% 4% 5% 10% 7% 6% 3% 3% 1% 2% 2% 5% 4% 6% 4%
Several times per day 342 35 46 50 40 28 29 43 37 14 21 196 146 67 27515% 18% 18% 18% 17% 10% 13% 17% 16% 8% 9% 16% 13% 13% 15%
Daily 397 38 26 34 46 52 56 33 48 26 39 213 184 79 31817% 20% 10% 12% 19% 19% 24% 13% 22% 14% 17% 17% 16% 15% 17%
A few times per week 343 22 42 36 26 57 32 37 32 25 35 181 162 81 26315% 12% 17% 13% 11% 20% 14% 14% 15% 14% 15% 15% 15% 16% 14%
Weekly 191 15 22 22 15 25 13 22 12 20 26 105 85 44 1468% 8% 9% 8% 6% 9% 6% 9% 5% 11% 11% 9% 8% 9% 8%
A few times per month 171 10 12 18 20 23 17 20 18 16 17 83 88 42 1307% 5% 5% 6% 8% 8% 7% 8% 8% 9% 7% 7% 8% 8% 7%
Monthly or less often 147 7 13 19 16 15 12 21 13 13 18 71 76 34 1136% 4% 5% 7% 7% 5% 5% 8% 6% 7% 8% 6% 7% 7% 6%
Never 651 53 75 69 60 61 64 75 61 60 72 319 332 134 51728% 28% 30% 25% 25% 22% 28% 29% 27% 34% 31% 26% 30% 26% 28%
NETS
Net: Frequently 844 81 83 112 102 98 91 83 87 42 66 472 373 177 66836% 43% 34% 41% 43% 35% 40% 32% 39% 24% 28% 38% 33% 35% 36%
Online fieldwork: 26th March - 15th April 2015 Prepared by ComRes Ltd
Page 80
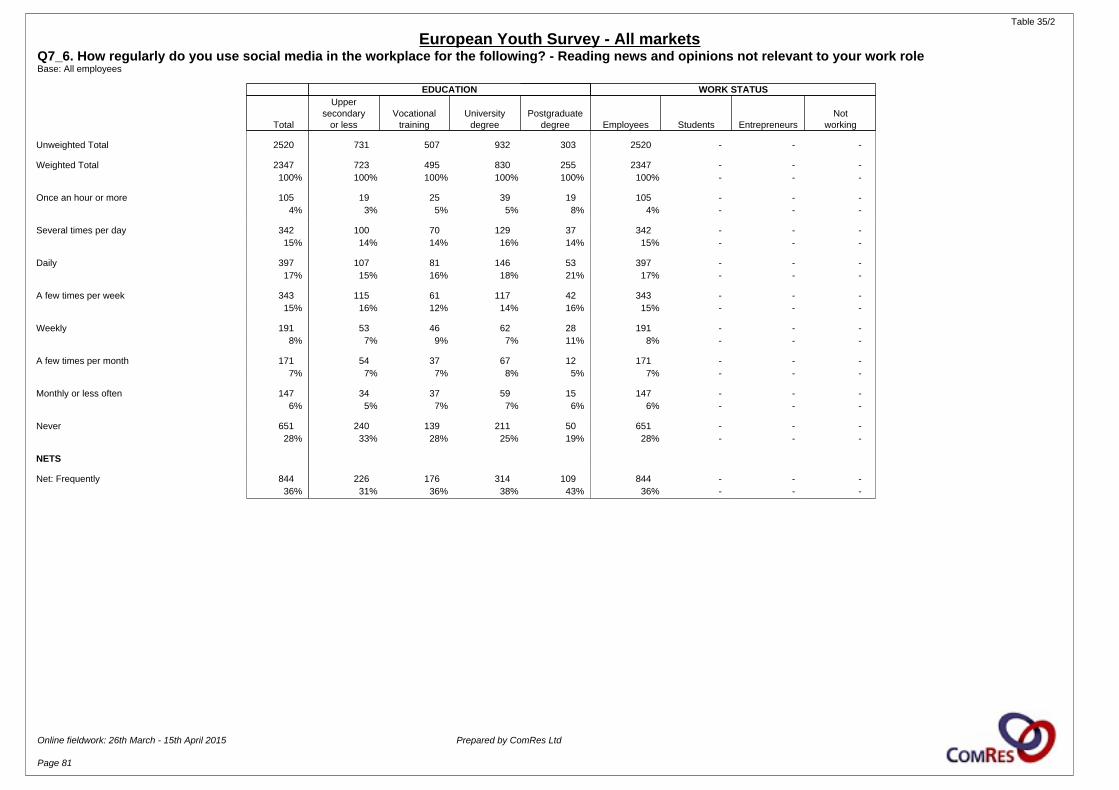
Table 35/2
European Youth Survey - All marketsQ7_6. How regularly do you use social media in the workplace for the following? - Reading news and opinions not relevant to your work roleBase: All employees
EDUCATION WORK STATUS
Total
Uppersecondary
or lessVocational
trainingUniversity
degreePostgraduate
degree Employees Students EntrepreneursNot
working
Unweighted Total 2520 731 507 932 303 2520 - - -
Weighted Total 2347 723 495 830 255 2347 - - -100% 100% 100% 100% 100% 100% - - -
Once an hour or more 105 19 25 39 19 105 - - -4% 3% 5% 5% 8% 4% - - -
Several times per day 342 100 70 129 37 342 - - -15% 14% 14% 16% 14% 15% - - -
Daily 397 107 81 146 53 397 - - -17% 15% 16% 18% 21% 17% - - -
A few times per week 343 115 61 117 42 343 - - -15% 16% 12% 14% 16% 15% - - -
Weekly 191 53 46 62 28 191 - - -8% 7% 9% 7% 11% 8% - - -
A few times per month 171 54 37 67 12 171 - - -7% 7% 7% 8% 5% 7% - - -
Monthly or less often 147 34 37 59 15 147 - - -6% 5% 7% 7% 6% 6% - - -
Never 651 240 139 211 50 651 - - -28% 33% 28% 25% 19% 28% - - -
NETS
Net: Frequently 844 226 176 314 109 844 - - -36% 31% 36% 38% 43% 36% - - -
Online fieldwork: 26th March - 15th April 2015 Prepared by ComRes Ltd
Page 81
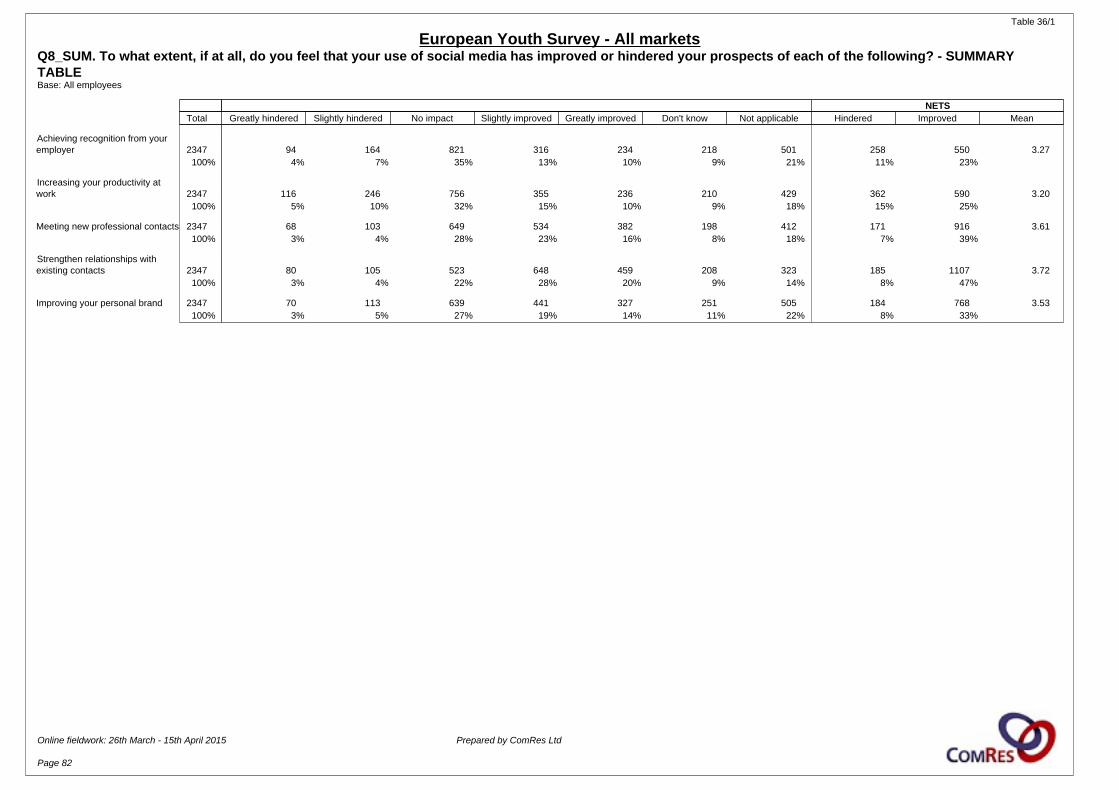
Table 36/1
European Youth Survey - All marketsQ8_SUM. To what extent, if at all, do you feel that your use of social media has improved or hindered your prospects of each of the following? - SUMMARY TABLEBase: All employees
NETS Total Greatly hindered Slightly hindered No impact Slightly improved Greatly improved Don't know Not applicable Hindered Improved Mean
Achieving recognition from youremployer 2347 94 164 821 316 234 218 501 258 550 3.27
100% 4% 7% 35% 13% 10% 9% 21% 11% 23%
Increasing your productivity atwork 2347 116 246 756 355 236 210 429 362 590 3.20
100% 5% 10% 32% 15% 10% 9% 18% 15% 25%
Meeting new professional contacts 2347 68 103 649 534 382 198 412 171 916 3.61100% 3% 4% 28% 23% 16% 8% 18% 7% 39%
Strengthen relationships withexisting contacts 2347 80 105 523 648 459 208 323 185 1107 3.72
100% 3% 4% 22% 28% 20% 9% 14% 8% 47%
Improving your personal brand 2347 70 113 639 441 327 251 505 184 768 3.53100% 3% 5% 27% 19% 14% 11% 22% 8% 33%
Online fieldwork: 26th March - 15th April 2015 Prepared by ComRes Ltd
Page 82
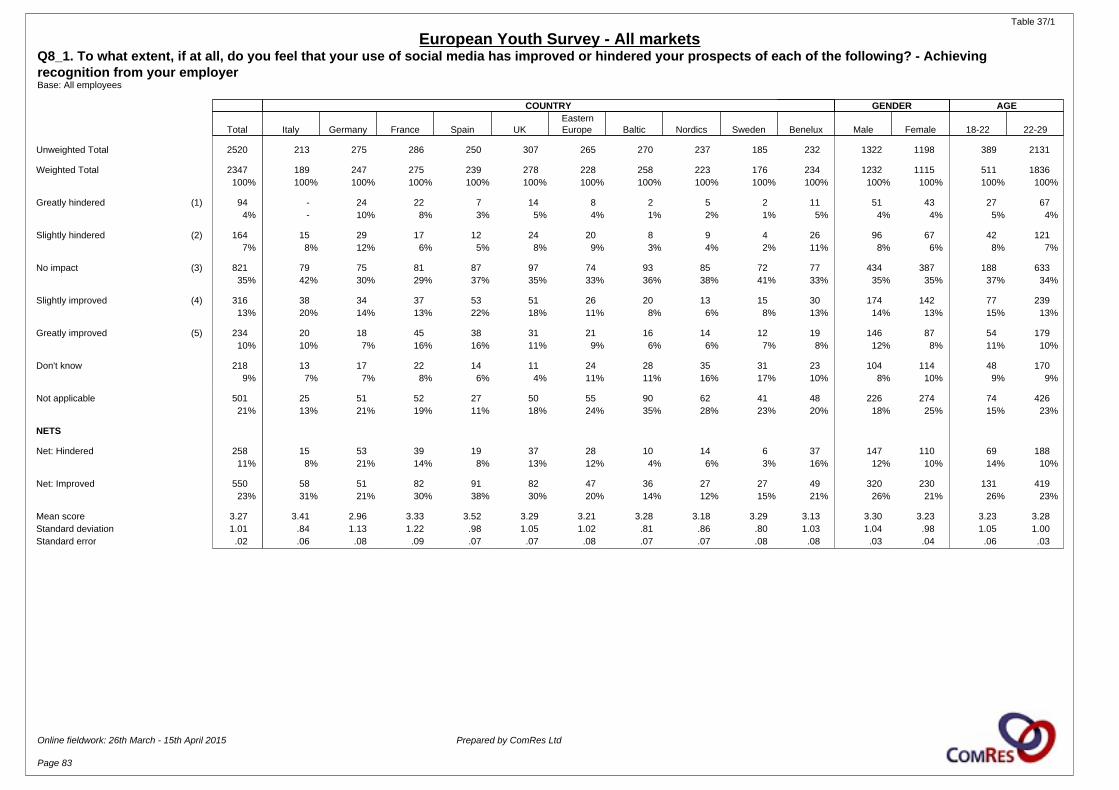
Table 37/1
European Youth Survey - All marketsQ8_1. To what extent, if at all, do you feel that your use of social media has improved or hindered your prospects of each of the following? - Achieving recognition from your employerBase: All employees
COUNTRY GENDER AGE
Total Italy Germany France Spain UKEasternEurope Baltic Nordics Sweden Benelux Male Female 18-22 22-29
Unweighted Total 2520 213 275 286 250 307 265 270 237 185 232 1322 1198 389 2131
Weighted Total 2347 189 247 275 239 278 228 258 223 176 234 1232 1115 511 1836100% 100% 100% 100% 100% 100% 100% 100% 100% 100% 100% 100% 100% 100% 100%
Greatly hindered (1) 94 - 24 22 7 14 8 2 5 2 11 51 43 27 674% - 10% 8% 3% 5% 4% 1% 2% 1% 5% 4% 4% 5% 4%
Slightly hindered (2) 164 15 29 17 12 24 20 8 9 4 26 96 67 42 1217% 8% 12% 6% 5% 8% 9% 3% 4% 2% 11% 8% 6% 8% 7%
No impact (3) 821 79 75 81 87 97 74 93 85 72 77 434 387 188 63335% 42% 30% 29% 37% 35% 33% 36% 38% 41% 33% 35% 35% 37% 34%
Slightly improved (4) 316 38 34 37 53 51 26 20 13 15 30 174 142 77 23913% 20% 14% 13% 22% 18% 11% 8% 6% 8% 13% 14% 13% 15% 13%
Greatly improved (5) 234 20 18 45 38 31 21 16 14 12 19 146 87 54 17910% 10% 7% 16% 16% 11% 9% 6% 6% 7% 8% 12% 8% 11% 10%
Don't know 218 13 17 22 14 11 24 28 35 31 23 104 114 48 1709% 7% 7% 8% 6% 4% 11% 11% 16% 17% 10% 8% 10% 9% 9%
Not applicable 501 25 51 52 27 50 55 90 62 41 48 226 274 74 42621% 13% 21% 19% 11% 18% 24% 35% 28% 23% 20% 18% 25% 15% 23%
NETS
Net: Hindered 258 15 53 39 19 37 28 10 14 6 37 147 110 69 18811% 8% 21% 14% 8% 13% 12% 4% 6% 3% 16% 12% 10% 14% 10%
Net: Improved 550 58 51 82 91 82 47 36 27 27 49 320 230 131 41923% 31% 21% 30% 38% 30% 20% 14% 12% 15% 21% 26% 21% 26% 23%
Mean score 3.27 3.41 2.96 3.33 3.52 3.29 3.21 3.28 3.18 3.29 3.13 3.30 3.23 3.23 3.28Standard deviation 1.01 .84 1.13 1.22 .98 1.05 1.02 .81 .86 .80 1.03 1.04 .98 1.05 1.00Standard error .02 .06 .08 .09 .07 .07 .08 .07 .07 .08 .08 .03 .04 .06 .03
Online fieldwork: 26th March - 15th April 2015 Prepared by ComRes Ltd
Page 83
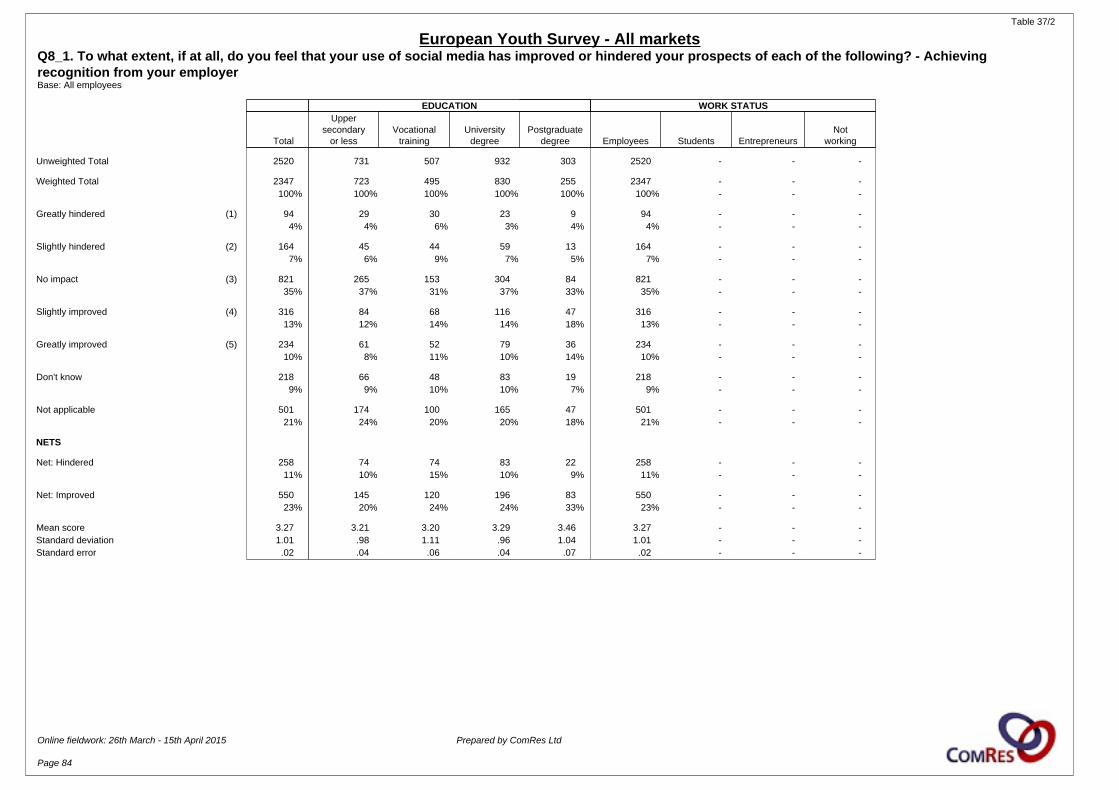
Table 37/2
European Youth Survey - All marketsQ8_1. To what extent, if at all, do you feel that your use of social media has improved or hindered your prospects of each of the following? - Achieving recognition from your employerBase: All employees
EDUCATION WORK STATUS
Total
Uppersecondary
or lessVocational
trainingUniversity
degreePostgraduate
degree Employees Students EntrepreneursNot
working
Unweighted Total 2520 731 507 932 303 2520 - - -
Weighted Total 2347 723 495 830 255 2347 - - -100% 100% 100% 100% 100% 100% - - -
Greatly hindered (1) 94 29 30 23 9 94 - - -4% 4% 6% 3% 4% 4% - - -
Slightly hindered (2) 164 45 44 59 13 164 - - -7% 6% 9% 7% 5% 7% - - -
No impact (3) 821 265 153 304 84 821 - - -35% 37% 31% 37% 33% 35% - - -
Slightly improved (4) 316 84 68 116 47 316 - - -13% 12% 14% 14% 18% 13% - - -
Greatly improved (5) 234 61 52 79 36 234 - - -10% 8% 11% 10% 14% 10% - - -
Don't know 218 66 48 83 19 218 - - -9% 9% 10% 10% 7% 9% - - -
Not applicable 501 174 100 165 47 501 - - -21% 24% 20% 20% 18% 21% - - -
NETS
Net: Hindered 258 74 74 83 22 258 - - -11% 10% 15% 10% 9% 11% - - -
Net: Improved 550 145 120 196 83 550 - - -23% 20% 24% 24% 33% 23% - - -
Mean score 3.27 3.21 3.20 3.29 3.46 3.27 - - -Standard deviation 1.01 .98 1.11 .96 1.04 1.01 - - -Standard error .02 .04 .06 .04 .07 .02 - - -
Online fieldwork: 26th March - 15th April 2015 Prepared by ComRes Ltd
Page 84

Table 38/1
European Youth Survey - All marketsQ8_2. To what extent, if at all, do you feel that your use of social media has improved or hindered your prospects of each of the following? - Increasing your productivity at workBase: All employees
COUNTRY GENDER AGE
Total Italy Germany France Spain UKEasternEurope Baltic Nordics Sweden Benelux Male Female 18-22 22-29
Unweighted Total 2520 213 275 286 250 307 265 270 237 185 232 1322 1198 389 2131
Weighted Total 2347 189 247 275 239 278 228 258 223 176 234 1232 1115 511 1836100% 100% 100% 100% 100% 100% 100% 100% 100% 100% 100% 100% 100% 100% 100%
Greatly hindered (1) 116 2 30 22 8 15 11 9 7 4 7 64 52 32 845% 1% 12% 8% 3% 6% 5% 4% 3% 2% 3% 5% 5% 6% 5%
Slightly hindered (2) 246 11 33 29 23 20 25 35 29 14 27 139 107 49 19710% 6% 13% 11% 10% 7% 11% 14% 13% 8% 12% 11% 10% 10% 11%
No impact (3) 756 78 66 71 67 105 70 71 83 67 79 396 360 175 58132% 41% 26% 26% 28% 38% 31% 27% 37% 38% 34% 32% 32% 34% 32%
Slightly improved (4) 355 44 36 43 58 45 30 28 20 18 32 203 151 86 26815% 23% 15% 16% 24% 16% 13% 11% 9% 10% 14% 17% 14% 17% 15%
Greatly improved (5) 236 15 20 39 39 38 27 18 10 11 20 130 105 55 18010% 8% 8% 14% 16% 14% 12% 7% 4% 6% 8% 11% 9% 11% 10%
Don't know 210 16 18 25 12 11 19 24 32 27 25 102 107 43 1669% 8% 7% 9% 5% 4% 8% 9% 14% 16% 10% 8% 10% 8% 9%
Not applicable 429 22 45 45 32 43 46 74 43 35 44 197 232 70 35918% 12% 18% 16% 13% 16% 20% 29% 19% 20% 19% 16% 21% 14% 20%
NETS
Net: Hindered 362 13 63 52 30 35 36 44 36 18 35 202 159 81 28115% 7% 25% 19% 13% 13% 16% 17% 16% 10% 15% 16% 14% 16% 15%
Net: Improved 590 59 56 83 97 83 57 46 30 29 52 334 257 142 44925% 31% 22% 30% 41% 30% 25% 18% 13% 16% 22% 27% 23% 28% 24%
Mean score 3.20 3.39 2.91 3.24 3.50 3.31 3.23 3.07 2.98 3.15 3.18 3.21 3.19 3.21 3.20Standard deviation 1.06 .82 1.21 1.23 1.06 1.07 1.11 1.03 .89 .89 .99 1.07 1.05 1.08 1.06Standard error .02 .06 .08 .08 .07 .07 .08 .08 .07 .08 .08 .03 .04 .06 .03
Online fieldwork: 26th March - 15th April 2015 Prepared by ComRes Ltd
Page 85
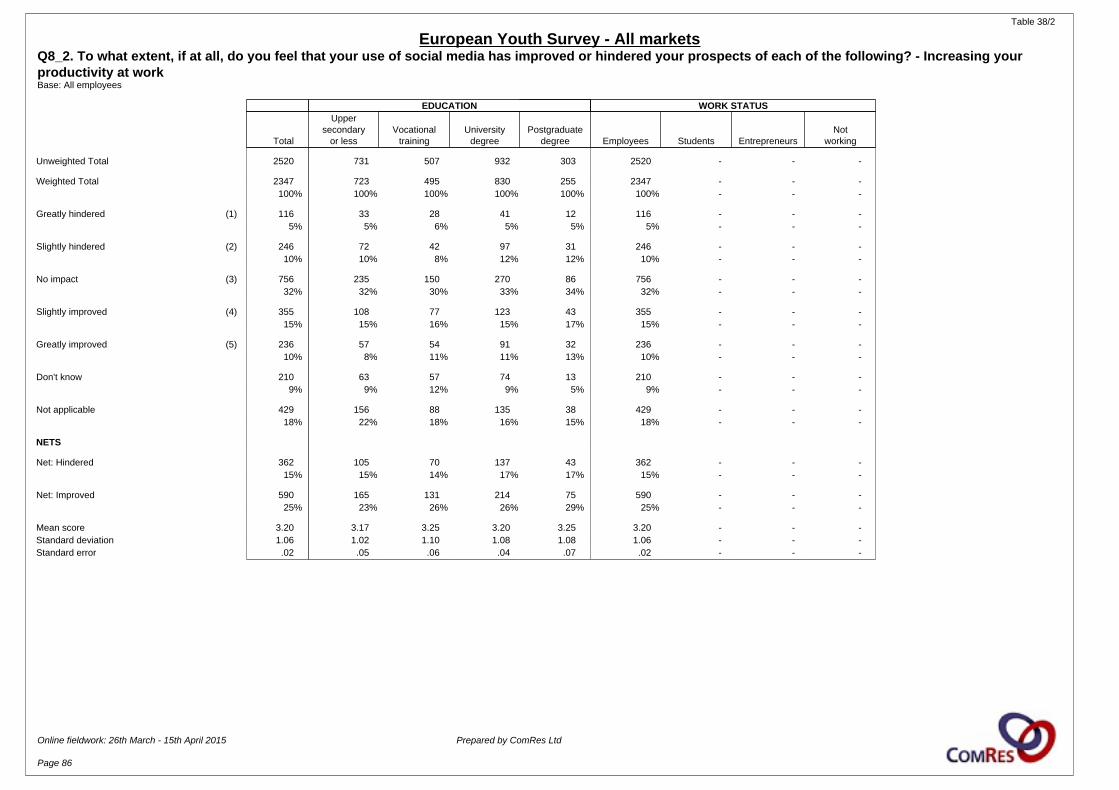
Table 38/2
European Youth Survey - All marketsQ8_2. To what extent, if at all, do you feel that your use of social media has improved or hindered your prospects of each of the following? - Increasing your productivity at workBase: All employees
EDUCATION WORK STATUS
Total
Uppersecondary
or lessVocational
trainingUniversity
degreePostgraduate
degree Employees Students EntrepreneursNot
working
Unweighted Total 2520 731 507 932 303 2520 - - -
Weighted Total 2347 723 495 830 255 2347 - - -100% 100% 100% 100% 100% 100% - - -
Greatly hindered (1) 116 33 28 41 12 116 - - -5% 5% 6% 5% 5% 5% - - -
Slightly hindered (2) 246 72 42 97 31 246 - - -10% 10% 8% 12% 12% 10% - - -
No impact (3) 756 235 150 270 86 756 - - -32% 32% 30% 33% 34% 32% - - -
Slightly improved (4) 355 108 77 123 43 355 - - -15% 15% 16% 15% 17% 15% - - -
Greatly improved (5) 236 57 54 91 32 236 - - -10% 8% 11% 11% 13% 10% - - -
Don't know 210 63 57 74 13 210 - - -9% 9% 12% 9% 5% 9% - - -
Not applicable 429 156 88 135 38 429 - - -18% 22% 18% 16% 15% 18% - - -
NETS
Net: Hindered 362 105 70 137 43 362 - - -15% 15% 14% 17% 17% 15% - - -
Net: Improved 590 165 131 214 75 590 - - -25% 23% 26% 26% 29% 25% - - -
Mean score 3.20 3.17 3.25 3.20 3.25 3.20 - - -Standard deviation 1.06 1.02 1.10 1.08 1.08 1.06 - - -Standard error .02 .05 .06 .04 .07 .02 - - -
Online fieldwork: 26th March - 15th April 2015 Prepared by ComRes Ltd
Page 86

Table 39/1
European Youth Survey - All marketsQ8_3. To what extent, if at all, do you feel that your use of social media has improved or hindered your prospects of each of the following? - Meeting new professional contactsBase: All employees
COUNTRY GENDER AGE
Total Italy Germany France Spain UKEasternEurope Baltic Nordics Sweden Benelux Male Female 18-22 22-29
Unweighted Total 2520 213 275 286 250 307 265 270 237 185 232 1322 1198 389 2131
Weighted Total 2347 189 247 275 239 278 228 258 223 176 234 1232 1115 511 1836100% 100% 100% 100% 100% 100% 100% 100% 100% 100% 100% 100% 100% 100% 100%
Greatly hindered (1) 68 - 6 22 5 15 5 2 3 3 7 39 29 24 443% - 2% 8% 2% 5% 2% 1% 1% 2% 3% 3% 3% 5% 2%
Slightly hindered (2) 103 9 18 14 8 21 8 3 9 4 8 56 47 32 724% 5% 7% 5% 4% 8% 3% 1% 4% 2% 4% 5% 4% 6% 4%
No impact (3) 649 68 62 57 49 89 50 71 80 61 62 334 315 142 50728% 36% 25% 21% 21% 32% 22% 27% 36% 34% 27% 27% 28% 28% 28%
Slightly improved (4) 534 54 60 51 71 61 56 61 31 35 54 305 229 109 42523% 29% 24% 19% 30% 22% 25% 24% 14% 20% 23% 25% 21% 21% 23%
Greatly improved (5) 382 25 39 63 71 37 55 24 19 13 36 211 171 95 28716% 13% 16% 23% 30% 13% 24% 9% 9% 7% 15% 17% 15% 19% 16%
Don't know 198 17 20 24 12 12 15 20 30 28 22 95 104 42 1568% 9% 8% 9% 5% 4% 6% 8% 13% 16% 9% 8% 9% 8% 9%
Not applicable 412 16 42 44 22 42 39 78 51 34 44 192 220 67 34518% 8% 17% 16% 9% 15% 17% 30% 23% 19% 19% 16% 20% 13% 19%
NETS
Net: Hindered 171 9 25 36 14 36 13 6 11 7 16 96 76 56 1167% 5% 10% 13% 6% 13% 6% 2% 5% 4% 7% 8% 7% 11% 6%
Net: Improved 916 79 99 114 142 98 112 84 51 47 89 516 401 204 71339% 42% 40% 41% 60% 35% 49% 33% 23% 27% 38% 42% 36% 40% 39%
Mean score 3.61 3.61 3.58 3.58 3.95 3.38 3.86 3.62 3.39 3.44 3.61 3.63 3.59 3.54 3.63Standard deviation 1.02 .83 1.04 1.27 .99 1.08 1.01 .81 .87 .83 1.02 1.02 1.01 1.11 .98Standard error .02 .06 .07 .09 .07 .07 .07 .06 .07 .08 .08 .03 .03 .06 .02
Online fieldwork: 26th March - 15th April 2015 Prepared by ComRes Ltd
Page 87
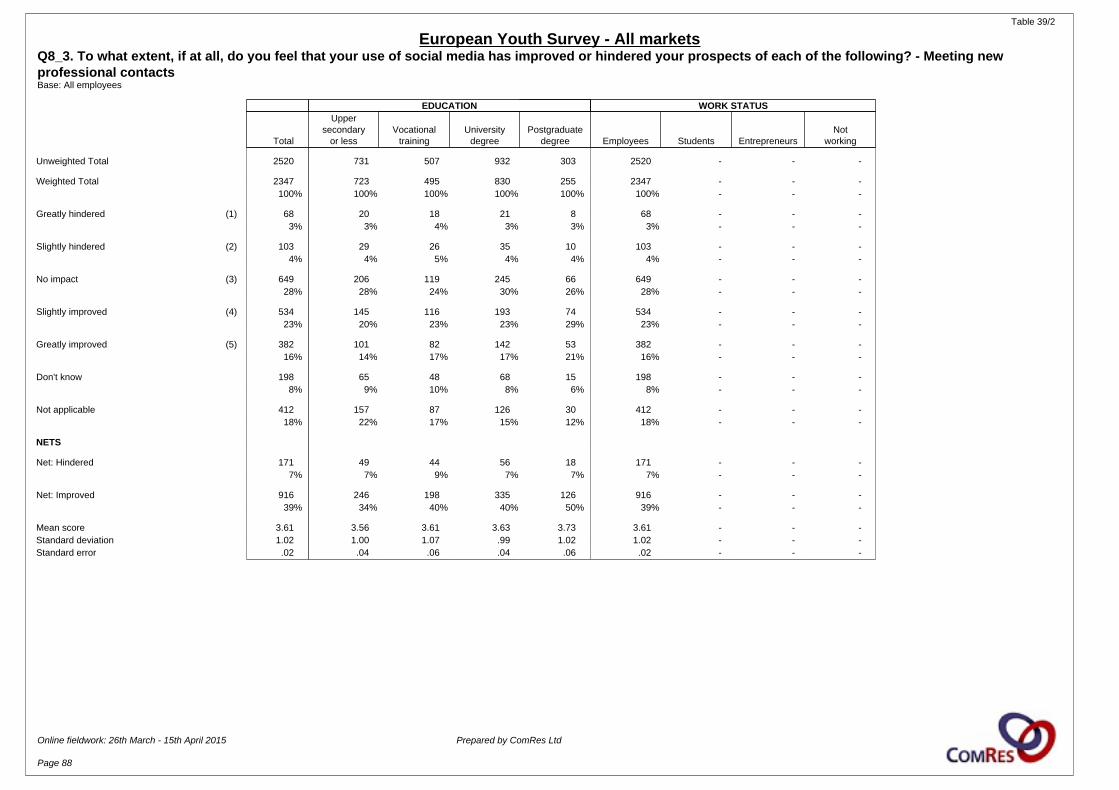
Table 39/2
European Youth Survey - All marketsQ8_3. To what extent, if at all, do you feel that your use of social media has improved or hindered your prospects of each of the following? - Meeting new professional contactsBase: All employees
EDUCATION WORK STATUS
Total
Uppersecondary
or lessVocational
trainingUniversity
degreePostgraduate
degree Employees Students EntrepreneursNot
working
Unweighted Total 2520 731 507 932 303 2520 - - -
Weighted Total 2347 723 495 830 255 2347 - - -100% 100% 100% 100% 100% 100% - - -
Greatly hindered (1) 68 20 18 21 8 68 - - -3% 3% 4% 3% 3% 3% - - -
Slightly hindered (2) 103 29 26 35 10 103 - - -4% 4% 5% 4% 4% 4% - - -
No impact (3) 649 206 119 245 66 649 - - -28% 28% 24% 30% 26% 28% - - -
Slightly improved (4) 534 145 116 193 74 534 - - -23% 20% 23% 23% 29% 23% - - -
Greatly improved (5) 382 101 82 142 53 382 - - -16% 14% 17% 17% 21% 16% - - -
Don't know 198 65 48 68 15 198 - - -8% 9% 10% 8% 6% 8% - - -
Not applicable 412 157 87 126 30 412 - - -18% 22% 17% 15% 12% 18% - - -
NETS
Net: Hindered 171 49 44 56 18 171 - - -7% 7% 9% 7% 7% 7% - - -
Net: Improved 916 246 198 335 126 916 - - -39% 34% 40% 40% 50% 39% - - -
Mean score 3.61 3.56 3.61 3.63 3.73 3.61 - - -Standard deviation 1.02 1.00 1.07 .99 1.02 1.02 - - -Standard error .02 .04 .06 .04 .06 .02 - - -
Online fieldwork: 26th March - 15th April 2015 Prepared by ComRes Ltd
Page 88
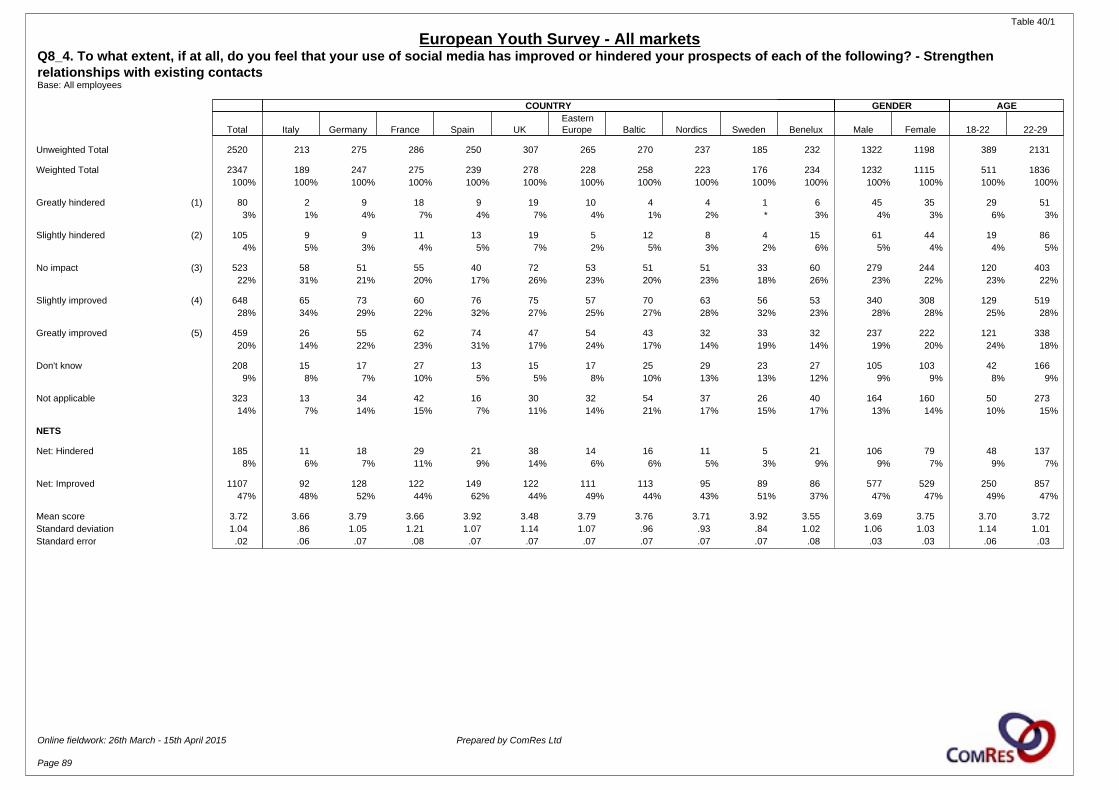
Table 40/1
European Youth Survey - All marketsQ8_4. To what extent, if at all, do you feel that your use of social media has improved or hindered your prospects of each of the following? - Strengthen relationships with existing contactsBase: All employees
COUNTRY GENDER AGE
Total Italy Germany France Spain UKEasternEurope Baltic Nordics Sweden Benelux Male Female 18-22 22-29
Unweighted Total 2520 213 275 286 250 307 265 270 237 185 232 1322 1198 389 2131
Weighted Total 2347 189 247 275 239 278 228 258 223 176 234 1232 1115 511 1836100% 100% 100% 100% 100% 100% 100% 100% 100% 100% 100% 100% 100% 100% 100%
Greatly hindered (1) 80 2 9 18 9 19 10 4 4 1 6 45 35 29 513% 1% 4% 7% 4% 7% 4% 1% 2% * 3% 4% 3% 6% 3%
Slightly hindered (2) 105 9 9 11 13 19 5 12 8 4 15 61 44 19 864% 5% 3% 4% 5% 7% 2% 5% 3% 2% 6% 5% 4% 4% 5%
No impact (3) 523 58 51 55 40 72 53 51 51 33 60 279 244 120 40322% 31% 21% 20% 17% 26% 23% 20% 23% 18% 26% 23% 22% 23% 22%
Slightly improved (4) 648 65 73 60 76 75 57 70 63 56 53 340 308 129 51928% 34% 29% 22% 32% 27% 25% 27% 28% 32% 23% 28% 28% 25% 28%
Greatly improved (5) 459 26 55 62 74 47 54 43 32 33 32 237 222 121 33820% 14% 22% 23% 31% 17% 24% 17% 14% 19% 14% 19% 20% 24% 18%
Don't know 208 15 17 27 13 15 17 25 29 23 27 105 103 42 1669% 8% 7% 10% 5% 5% 8% 10% 13% 13% 12% 9% 9% 8% 9%
Not applicable 323 13 34 42 16 30 32 54 37 26 40 164 160 50 27314% 7% 14% 15% 7% 11% 14% 21% 17% 15% 17% 13% 14% 10% 15%
NETS
Net: Hindered 185 11 18 29 21 38 14 16 11 5 21 106 79 48 1378% 6% 7% 11% 9% 14% 6% 6% 5% 3% 9% 9% 7% 9% 7%
Net: Improved 1107 92 128 122 149 122 111 113 95 89 86 577 529 250 85747% 48% 52% 44% 62% 44% 49% 44% 43% 51% 37% 47% 47% 49% 47%
Mean score 3.72 3.66 3.79 3.66 3.92 3.48 3.79 3.76 3.71 3.92 3.55 3.69 3.75 3.70 3.72Standard deviation 1.04 .86 1.05 1.21 1.07 1.14 1.07 .96 .93 .84 1.02 1.06 1.03 1.14 1.01Standard error .02 .06 .07 .08 .07 .07 .07 .07 .07 .07 .08 .03 .03 .06 .03
Online fieldwork: 26th March - 15th April 2015 Prepared by ComRes Ltd
Page 89

Table 40/2
European Youth Survey - All marketsQ8_4. To what extent, if at all, do you feel that your use of social media has improved or hindered your prospects of each of the following? - Strengthen relationships with existing contactsBase: All employees
EDUCATION WORK STATUS
Total
Uppersecondary
or lessVocational
trainingUniversity
degreePostgraduate
degree Employees Students EntrepreneursNot
working
Unweighted Total 2520 731 507 932 303 2520 - - -
Weighted Total 2347 723 495 830 255 2347 - - -100% 100% 100% 100% 100% 100% - - -
Greatly hindered (1) 80 27 21 21 9 80 - - -3% 4% 4% 3% 4% 3% - - -
Slightly hindered (2) 105 28 28 38 11 105 - - -4% 4% 6% 5% 4% 4% - - -
No impact (3) 523 164 100 196 51 523 - - -22% 23% 20% 24% 20% 22% - - -
Slightly improved (4) 648 186 131 240 82 648 - - -28% 26% 26% 29% 32% 28% - - -
Greatly improved (5) 459 126 95 175 58 459 - - -20% 17% 19% 21% 23% 20% - - -
Don't know 208 66 51 70 18 208 - - -9% 9% 10% 8% 7% 9% - - -
Not applicable 323 126 70 91 26 323 - - -14% 17% 14% 11% 10% 14% - - -
NETS
Net: Hindered 185 55 48 59 20 185 - - -8% 8% 10% 7% 8% 8% - - -
Net: Improved 1107 312 226 415 140 1107 - - -47% 43% 46% 50% 55% 47% - - -
Mean score 3.72 3.67 3.67 3.76 3.80 3.72 - - -Standard deviation 1.04 1.05 1.10 1.00 1.04 1.04 - - -Standard error .02 .05 .06 .04 .07 .02 - - -
Online fieldwork: 26th March - 15th April 2015 Prepared by ComRes Ltd
Page 90
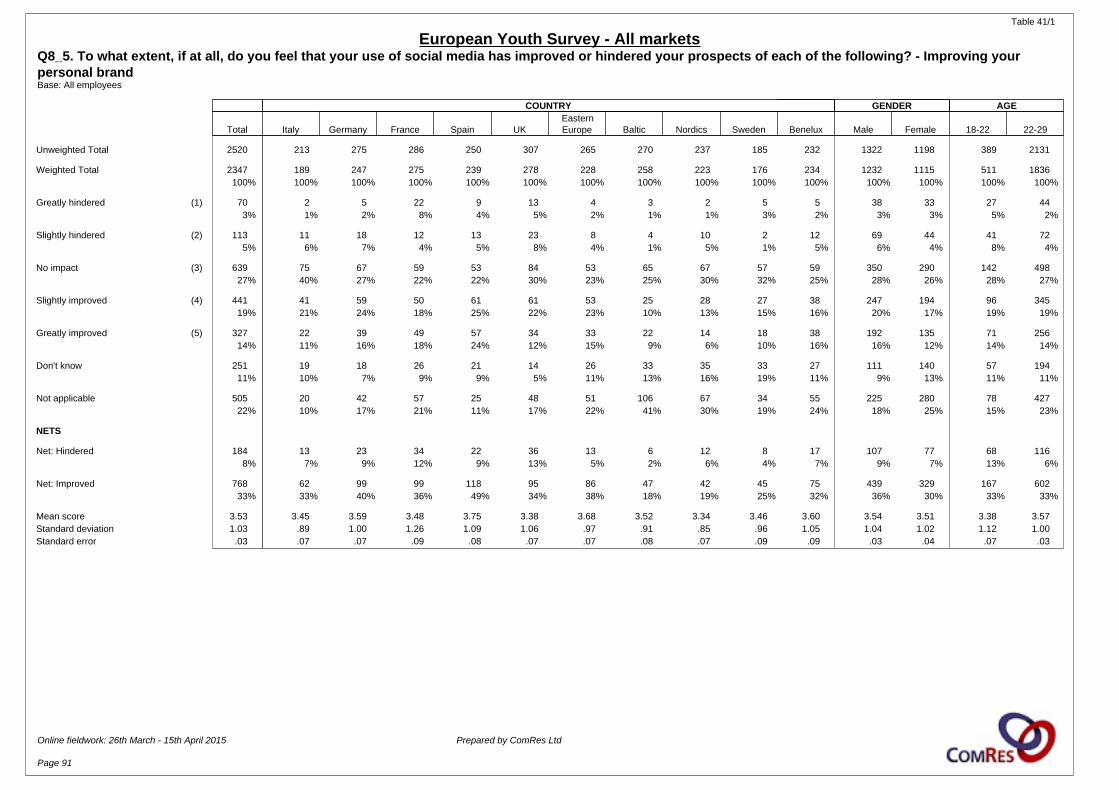
Table 41/1
European Youth Survey - All marketsQ8_5. To what extent, if at all, do you feel that your use of social media has improved or hindered your prospects of each of the following? - Improving your personal brandBase: All employees
COUNTRY GENDER AGE
Total Italy Germany France Spain UKEasternEurope Baltic Nordics Sweden Benelux Male Female 18-22 22-29
Unweighted Total 2520 213 275 286 250 307 265 270 237 185 232 1322 1198 389 2131
Weighted Total 2347 189 247 275 239 278 228 258 223 176 234 1232 1115 511 1836100% 100% 100% 100% 100% 100% 100% 100% 100% 100% 100% 100% 100% 100% 100%
Greatly hindered (1) 70 2 5 22 9 13 4 3 2 5 5 38 33 27 443% 1% 2% 8% 4% 5% 2% 1% 1% 3% 2% 3% 3% 5% 2%
Slightly hindered (2) 113 11 18 12 13 23 8 4 10 2 12 69 44 41 725% 6% 7% 4% 5% 8% 4% 1% 5% 1% 5% 6% 4% 8% 4%
No impact (3) 639 75 67 59 53 84 53 65 67 57 59 350 290 142 49827% 40% 27% 22% 22% 30% 23% 25% 30% 32% 25% 28% 26% 28% 27%
Slightly improved (4) 441 41 59 50 61 61 53 25 28 27 38 247 194 96 34519% 21% 24% 18% 25% 22% 23% 10% 13% 15% 16% 20% 17% 19% 19%
Greatly improved (5) 327 22 39 49 57 34 33 22 14 18 38 192 135 71 25614% 11% 16% 18% 24% 12% 15% 9% 6% 10% 16% 16% 12% 14% 14%
Don't know 251 19 18 26 21 14 26 33 35 33 27 111 140 57 19411% 10% 7% 9% 9% 5% 11% 13% 16% 19% 11% 9% 13% 11% 11%
Not applicable 505 20 42 57 25 48 51 106 67 34 55 225 280 78 42722% 10% 17% 21% 11% 17% 22% 41% 30% 19% 24% 18% 25% 15% 23%
NETS
Net: Hindered 184 13 23 34 22 36 13 6 12 8 17 107 77 68 1168% 7% 9% 12% 9% 13% 5% 2% 6% 4% 7% 9% 7% 13% 6%
Net: Improved 768 62 99 99 118 95 86 47 42 45 75 439 329 167 60233% 33% 40% 36% 49% 34% 38% 18% 19% 25% 32% 36% 30% 33% 33%
Mean score 3.53 3.45 3.59 3.48 3.75 3.38 3.68 3.52 3.34 3.46 3.60 3.54 3.51 3.38 3.57Standard deviation 1.03 .89 1.00 1.26 1.09 1.06 .97 .91 .85 .96 1.05 1.04 1.02 1.12 1.00Standard error .03 .07 .07 .09 .08 .07 .07 .08 .07 .09 .09 .03 .04 .07 .03
Online fieldwork: 26th March - 15th April 2015 Prepared by ComRes Ltd
Page 91
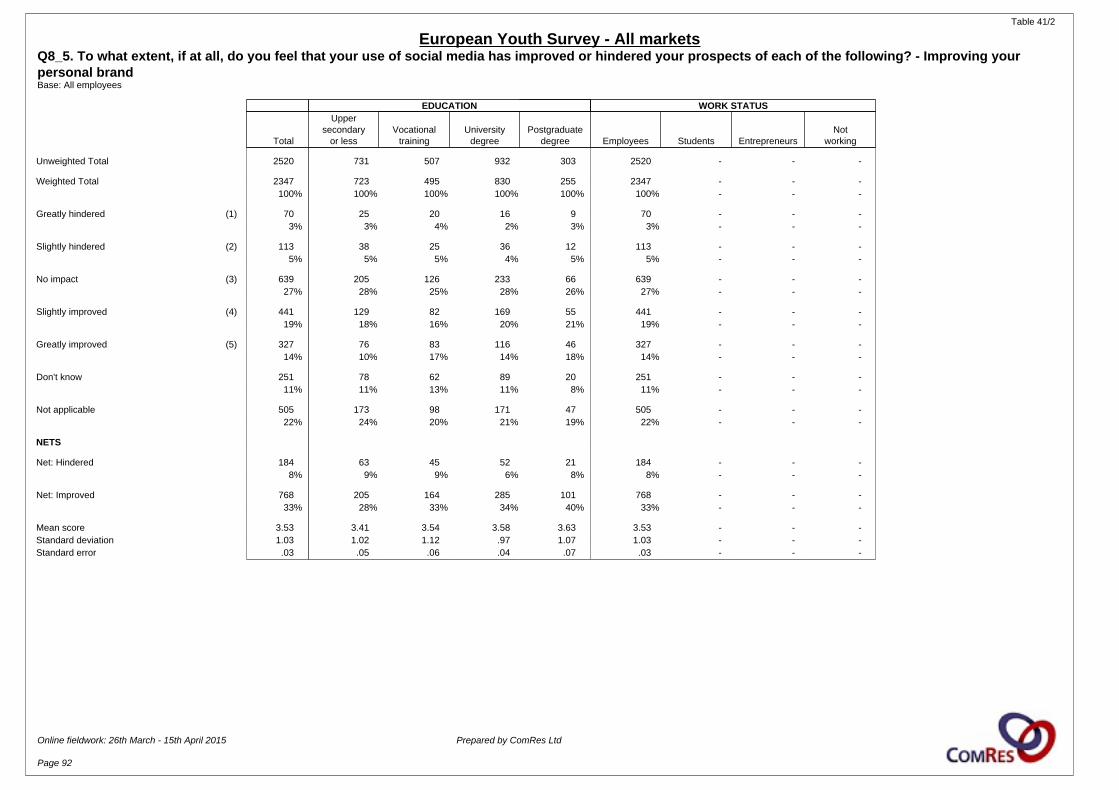
Table 41/2
European Youth Survey - All marketsQ8_5. To what extent, if at all, do you feel that your use of social media has improved or hindered your prospects of each of the following? - Improving your personal brandBase: All employees
EDUCATION WORK STATUS
Total
Uppersecondary
or lessVocational
trainingUniversity
degreePostgraduate
degree Employees Students EntrepreneursNot
working
Unweighted Total 2520 731 507 932 303 2520 - - -
Weighted Total 2347 723 495 830 255 2347 - - -100% 100% 100% 100% 100% 100% - - -
Greatly hindered (1) 70 25 20 16 9 70 - - -3% 3% 4% 2% 3% 3% - - -
Slightly hindered (2) 113 38 25 36 12 113 - - -5% 5% 5% 4% 5% 5% - - -
No impact (3) 639 205 126 233 66 639 - - -27% 28% 25% 28% 26% 27% - - -
Slightly improved (4) 441 129 82 169 55 441 - - -19% 18% 16% 20% 21% 19% - - -
Greatly improved (5) 327 76 83 116 46 327 - - -14% 10% 17% 14% 18% 14% - - -
Don't know 251 78 62 89 20 251 - - -11% 11% 13% 11% 8% 11% - - -
Not applicable 505 173 98 171 47 505 - - -22% 24% 20% 21% 19% 22% - - -
NETS
Net: Hindered 184 63 45 52 21 184 - - -8% 9% 9% 6% 8% 8% - - -
Net: Improved 768 205 164 285 101 768 - - -33% 28% 33% 34% 40% 33% - - -
Mean score 3.53 3.41 3.54 3.58 3.63 3.53 - - -Standard deviation 1.03 1.02 1.12 .97 1.07 1.03 - - -Standard error .03 .05 .06 .04 .07 .03 - - -
Online fieldwork: 26th March - 15th April 2015 Prepared by ComRes Ltd
Page 92
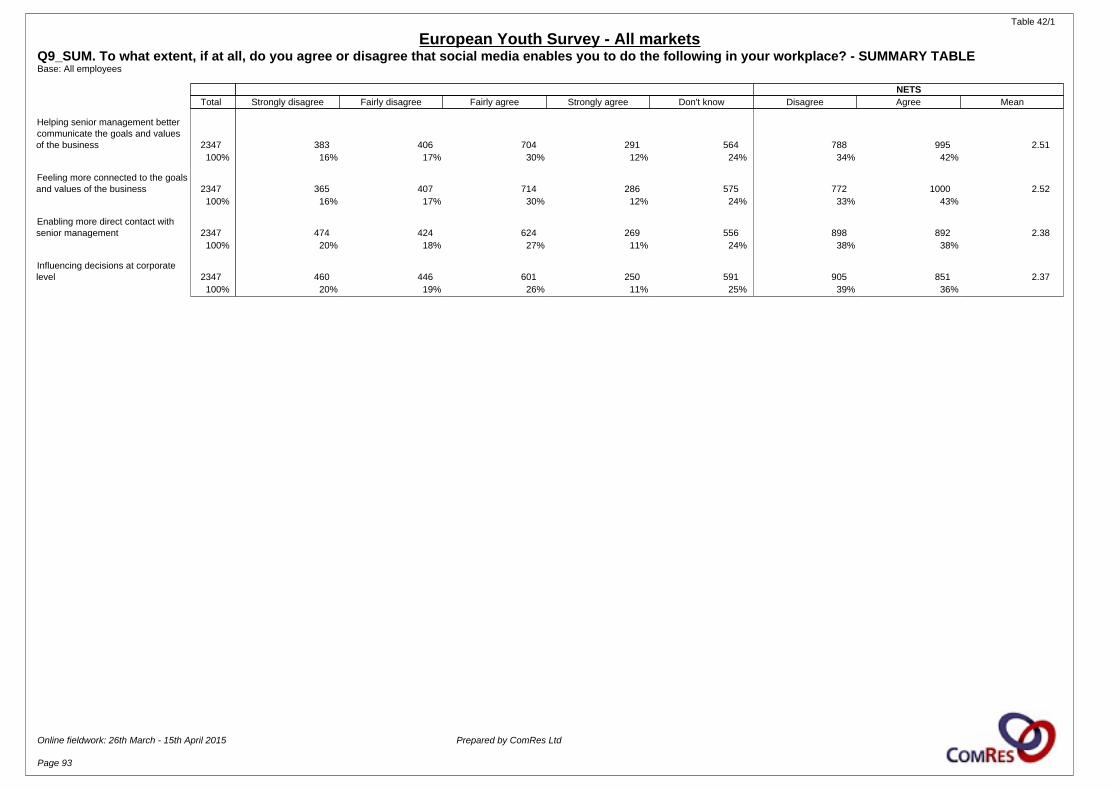
Table 42/1
European Youth Survey - All marketsQ9_SUM. To what extent, if at all, do you agree or disagree that social media enables you to do the following in your workplace? - SUMMARY TABLEBase: All employees
NETS Total Strongly disagree Fairly disagree Fairly agree Strongly agree Don't know Disagree Agree Mean
Helping senior management bettercommunicate the goals and valuesof the business 2347 383 406 704 291 564 788 995 2.51
100% 16% 17% 30% 12% 24% 34% 42%
Feeling more connected to the goalsand values of the business 2347 365 407 714 286 575 772 1000 2.52
100% 16% 17% 30% 12% 24% 33% 43%
Enabling more direct contact withsenior management 2347 474 424 624 269 556 898 892 2.38
100% 20% 18% 27% 11% 24% 38% 38%
Influencing decisions at corporatelevel 2347 460 446 601 250 591 905 851 2.37
100% 20% 19% 26% 11% 25% 39% 36%
Online fieldwork: 26th March - 15th April 2015 Prepared by ComRes Ltd
Page 93
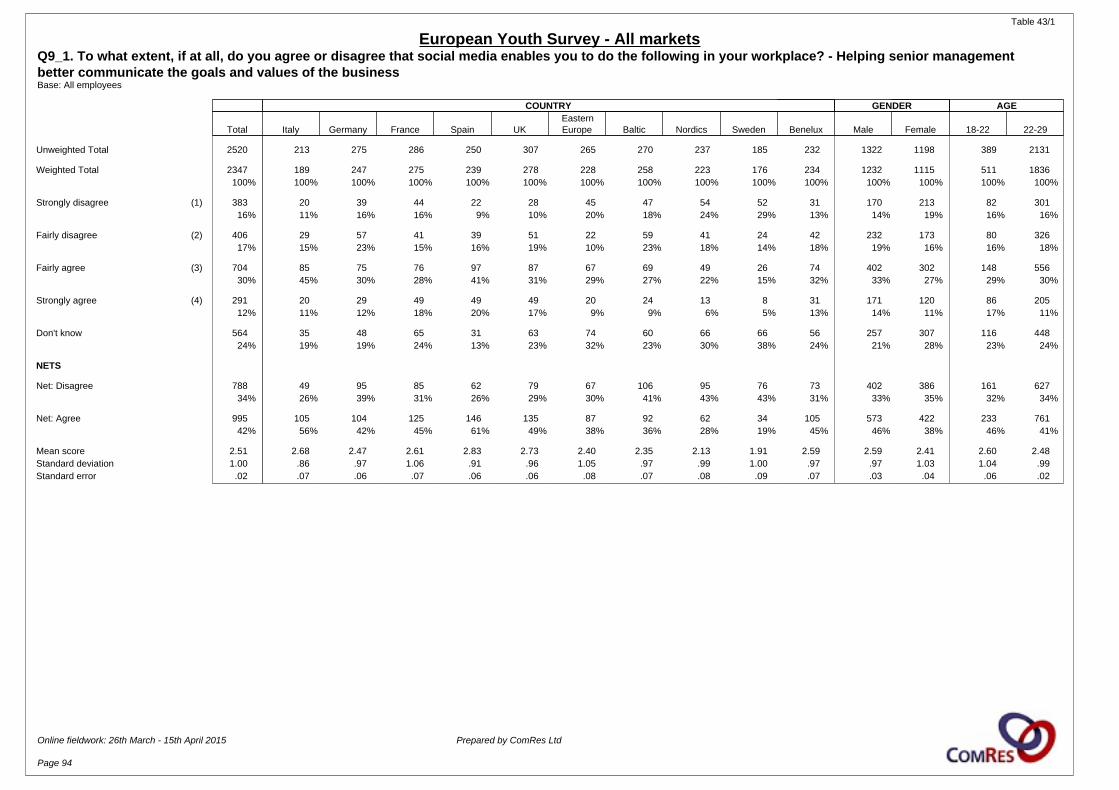
Table 43/1
European Youth Survey - All marketsQ9_1. To what extent, if at all, do you agree or disagree that social media enables you to do the following in your workplace? - Helping senior management better communicate the goals and values of the businessBase: All employees
COUNTRY GENDER AGE
Total Italy Germany France Spain UKEasternEurope Baltic Nordics Sweden Benelux Male Female 18-22 22-29
Unweighted Total 2520 213 275 286 250 307 265 270 237 185 232 1322 1198 389 2131
Weighted Total 2347 189 247 275 239 278 228 258 223 176 234 1232 1115 511 1836100% 100% 100% 100% 100% 100% 100% 100% 100% 100% 100% 100% 100% 100% 100%
Strongly disagree (1) 383 20 39 44 22 28 45 47 54 52 31 170 213 82 30116% 11% 16% 16% 9% 10% 20% 18% 24% 29% 13% 14% 19% 16% 16%
Fairly disagree (2) 406 29 57 41 39 51 22 59 41 24 42 232 173 80 32617% 15% 23% 15% 16% 19% 10% 23% 18% 14% 18% 19% 16% 16% 18%
Fairly agree (3) 704 85 75 76 97 87 67 69 49 26 74 402 302 148 55630% 45% 30% 28% 41% 31% 29% 27% 22% 15% 32% 33% 27% 29% 30%
Strongly agree (4) 291 20 29 49 49 49 20 24 13 8 31 171 120 86 20512% 11% 12% 18% 20% 17% 9% 9% 6% 5% 13% 14% 11% 17% 11%
Don't know 564 35 48 65 31 63 74 60 66 66 56 257 307 116 44824% 19% 19% 24% 13% 23% 32% 23% 30% 38% 24% 21% 28% 23% 24%
NETS
Net: Disagree 788 49 95 85 62 79 67 106 95 76 73 402 386 161 62734% 26% 39% 31% 26% 29% 30% 41% 43% 43% 31% 33% 35% 32% 34%
Net: Agree 995 105 104 125 146 135 87 92 62 34 105 573 422 233 76142% 56% 42% 45% 61% 49% 38% 36% 28% 19% 45% 46% 38% 46% 41%
Mean score 2.51 2.68 2.47 2.61 2.83 2.73 2.40 2.35 2.13 1.91 2.59 2.59 2.41 2.60 2.48Standard deviation 1.00 .86 .97 1.06 .91 .96 1.05 .97 .99 1.00 .97 .97 1.03 1.04 .99Standard error .02 .07 .06 .07 .06 .06 .08 .07 .08 .09 .07 .03 .04 .06 .02
Online fieldwork: 26th March - 15th April 2015 Prepared by ComRes Ltd
Page 94
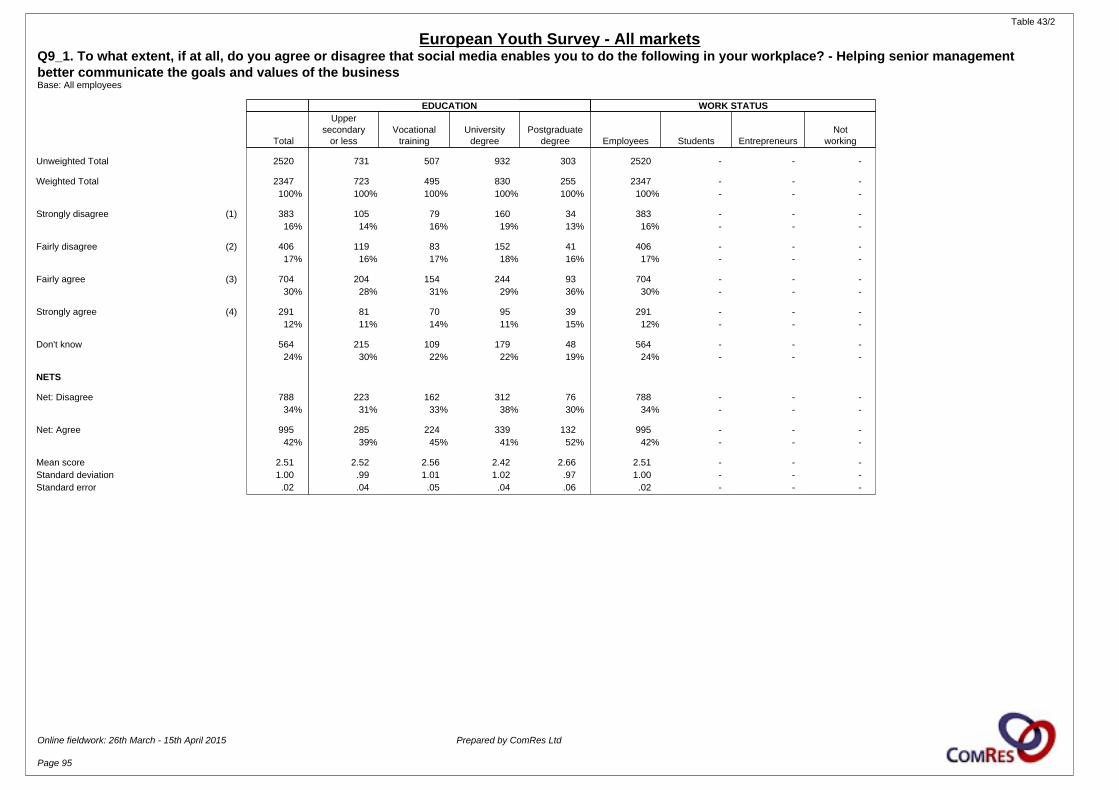
Table 43/2
European Youth Survey - All marketsQ9_1. To what extent, if at all, do you agree or disagree that social media enables you to do the following in your workplace? - Helping senior management better communicate the goals and values of the businessBase: All employees
EDUCATION WORK STATUS
Total
Uppersecondary
or lessVocational
trainingUniversity
degreePostgraduate
degree Employees Students EntrepreneursNot
working
Unweighted Total 2520 731 507 932 303 2520 - - -
Weighted Total 2347 723 495 830 255 2347 - - -100% 100% 100% 100% 100% 100% - - -
Strongly disagree (1) 383 105 79 160 34 383 - - -16% 14% 16% 19% 13% 16% - - -
Fairly disagree (2) 406 119 83 152 41 406 - - -17% 16% 17% 18% 16% 17% - - -
Fairly agree (3) 704 204 154 244 93 704 - - -30% 28% 31% 29% 36% 30% - - -
Strongly agree (4) 291 81 70 95 39 291 - - -12% 11% 14% 11% 15% 12% - - -
Don't know 564 215 109 179 48 564 - - -24% 30% 22% 22% 19% 24% - - -
NETS
Net: Disagree 788 223 162 312 76 788 - - -34% 31% 33% 38% 30% 34% - - -
Net: Agree 995 285 224 339 132 995 - - -42% 39% 45% 41% 52% 42% - - -
Mean score 2.51 2.52 2.56 2.42 2.66 2.51 - - -Standard deviation 1.00 .99 1.01 1.02 .97 1.00 - - -Standard error .02 .04 .05 .04 .06 .02 - - -
Online fieldwork: 26th March - 15th April 2015 Prepared by ComRes Ltd
Page 95
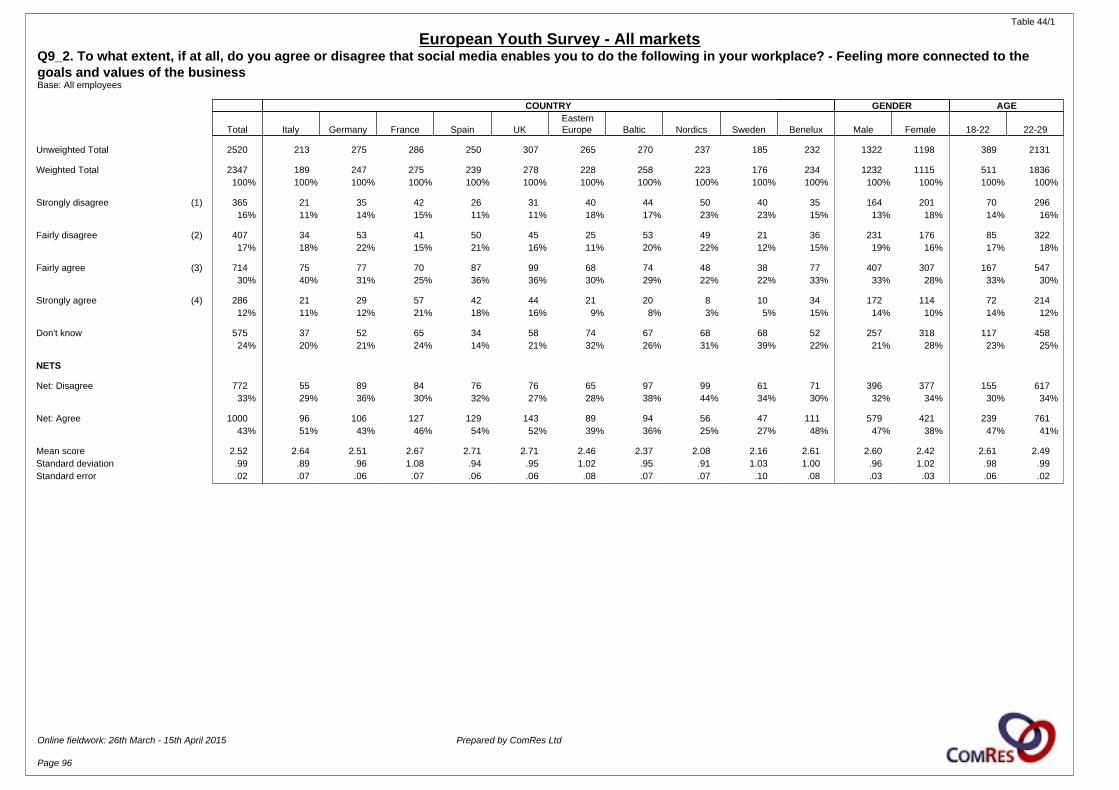
Table 44/1
European Youth Survey - All marketsQ9_2. To what extent, if at all, do you agree or disagree that social media enables you to do the following in your workplace? - Feeling more connected to the goals and values of the businessBase: All employees
COUNTRY GENDER AGE
Total Italy Germany France Spain UKEasternEurope Baltic Nordics Sweden Benelux Male Female 18-22 22-29
Unweighted Total 2520 213 275 286 250 307 265 270 237 185 232 1322 1198 389 2131
Weighted Total 2347 189 247 275 239 278 228 258 223 176 234 1232 1115 511 1836100% 100% 100% 100% 100% 100% 100% 100% 100% 100% 100% 100% 100% 100% 100%
Strongly disagree (1) 365 21 35 42 26 31 40 44 50 40 35 164 201 70 29616% 11% 14% 15% 11% 11% 18% 17% 23% 23% 15% 13% 18% 14% 16%
Fairly disagree (2) 407 34 53 41 50 45 25 53 49 21 36 231 176 85 32217% 18% 22% 15% 21% 16% 11% 20% 22% 12% 15% 19% 16% 17% 18%
Fairly agree (3) 714 75 77 70 87 99 68 74 48 38 77 407 307 167 54730% 40% 31% 25% 36% 36% 30% 29% 22% 22% 33% 33% 28% 33% 30%
Strongly agree (4) 286 21 29 57 42 44 21 20 8 10 34 172 114 72 21412% 11% 12% 21% 18% 16% 9% 8% 3% 5% 15% 14% 10% 14% 12%
Don't know 575 37 52 65 34 58 74 67 68 68 52 257 318 117 45824% 20% 21% 24% 14% 21% 32% 26% 31% 39% 22% 21% 28% 23% 25%
NETS
Net: Disagree 772 55 89 84 76 76 65 97 99 61 71 396 377 155 61733% 29% 36% 30% 32% 27% 28% 38% 44% 34% 30% 32% 34% 30% 34%
Net: Agree 1000 96 106 127 129 143 89 94 56 47 111 579 421 239 76143% 51% 43% 46% 54% 52% 39% 36% 25% 27% 48% 47% 38% 47% 41%
Mean score 2.52 2.64 2.51 2.67 2.71 2.71 2.46 2.37 2.08 2.16 2.61 2.60 2.42 2.61 2.49Standard deviation .99 .89 .96 1.08 .94 .95 1.02 .95 .91 1.03 1.00 .96 1.02 .98 .99Standard error .02 .07 .06 .07 .06 .06 .08 .07 .07 .10 .08 .03 .03 .06 .02
Online fieldwork: 26th March - 15th April 2015 Prepared by ComRes Ltd
Page 96

Table 44/2
European Youth Survey - All marketsQ9_2. To what extent, if at all, do you agree or disagree that social media enables you to do the following in your workplace? - Feeling more connected to the goals and values of the businessBase: All employees
EDUCATION WORK STATUS
Total
Uppersecondary
or lessVocational
trainingUniversity
degreePostgraduate
degree Employees Students EntrepreneursNot
working
Unweighted Total 2520 731 507 932 303 2520 - - -
Weighted Total 2347 723 495 830 255 2347 - - -100% 100% 100% 100% 100% 100% - - -
Strongly disagree (1) 365 96 74 150 39 365 - - -16% 13% 15% 18% 15% 16% - - -
Fairly disagree (2) 407 119 88 139 49 407 - - -17% 17% 18% 17% 19% 17% - - -
Fairly agree (3) 714 220 156 244 85 714 - - -30% 30% 32% 29% 33% 30% - - -
Strongly agree (4) 286 78 70 97 36 286 - - -12% 11% 14% 12% 14% 12% - - -
Don't know 575 210 106 200 46 575 - - -24% 29% 21% 24% 18% 24% - - -
NETS
Net: Disagree 772 216 162 289 88 772 - - -33% 30% 33% 35% 34% 33% - - -
Net: Agree 1000 298 227 341 121 1000 - - -43% 41% 46% 41% 48% 43% - - -
Mean score 2.52 2.54 2.57 2.46 2.57 2.52 - - -Standard deviation .99 .96 1.00 1.02 .99 .99 - - -Standard error .02 .04 .05 .04 .06 .02 - - -
Online fieldwork: 26th March - 15th April 2015 Prepared by ComRes Ltd
Page 97
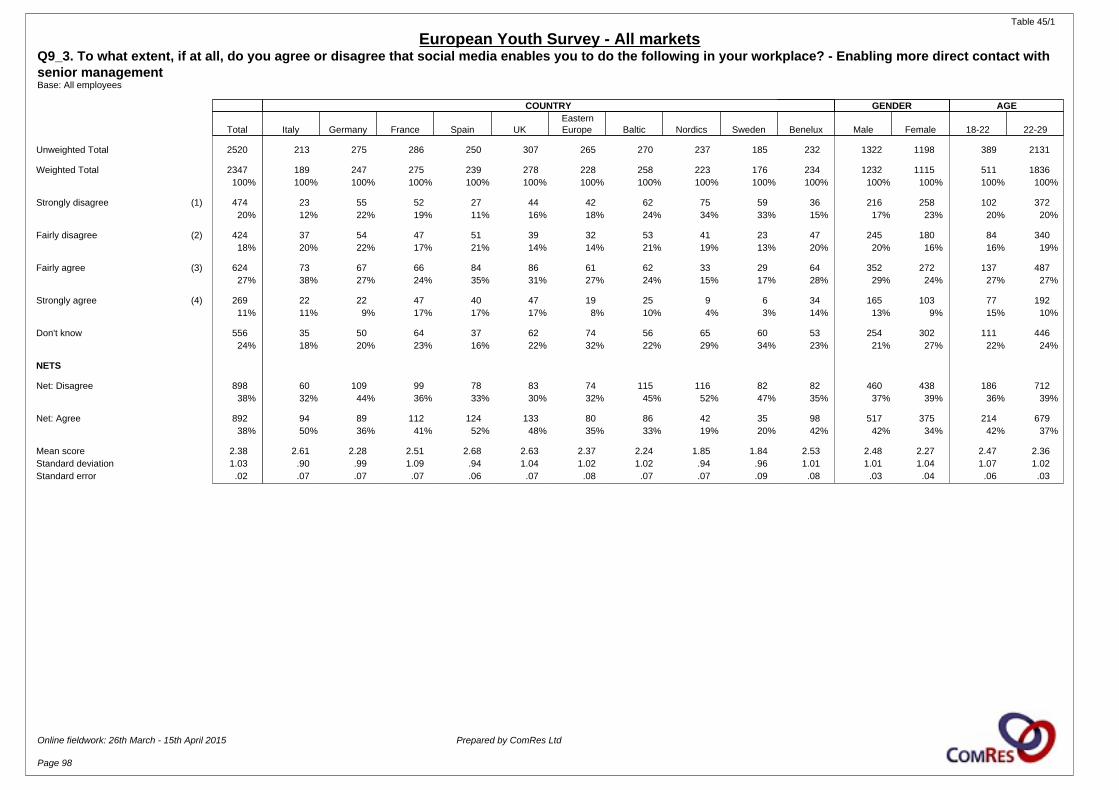
Table 45/1
European Youth Survey - All marketsQ9_3. To what extent, if at all, do you agree or disagree that social media enables you to do the following in your workplace? - Enabling more direct contact with senior managementBase: All employees
COUNTRY GENDER AGE
Total Italy Germany France Spain UKEasternEurope Baltic Nordics Sweden Benelux Male Female 18-22 22-29
Unweighted Total 2520 213 275 286 250 307 265 270 237 185 232 1322 1198 389 2131
Weighted Total 2347 189 247 275 239 278 228 258 223 176 234 1232 1115 511 1836100% 100% 100% 100% 100% 100% 100% 100% 100% 100% 100% 100% 100% 100% 100%
Strongly disagree (1) 474 23 55 52 27 44 42 62 75 59 36 216 258 102 37220% 12% 22% 19% 11% 16% 18% 24% 34% 33% 15% 17% 23% 20% 20%
Fairly disagree (2) 424 37 54 47 51 39 32 53 41 23 47 245 180 84 34018% 20% 22% 17% 21% 14% 14% 21% 19% 13% 20% 20% 16% 16% 19%
Fairly agree (3) 624 73 67 66 84 86 61 62 33 29 64 352 272 137 48727% 38% 27% 24% 35% 31% 27% 24% 15% 17% 28% 29% 24% 27% 27%
Strongly agree (4) 269 22 22 47 40 47 19 25 9 6 34 165 103 77 19211% 11% 9% 17% 17% 17% 8% 10% 4% 3% 14% 13% 9% 15% 10%
Don't know 556 35 50 64 37 62 74 56 65 60 53 254 302 111 44624% 18% 20% 23% 16% 22% 32% 22% 29% 34% 23% 21% 27% 22% 24%
NETS
Net: Disagree 898 60 109 99 78 83 74 115 116 82 82 460 438 186 71238% 32% 44% 36% 33% 30% 32% 45% 52% 47% 35% 37% 39% 36% 39%
Net: Agree 892 94 89 112 124 133 80 86 42 35 98 517 375 214 67938% 50% 36% 41% 52% 48% 35% 33% 19% 20% 42% 42% 34% 42% 37%
Mean score 2.38 2.61 2.28 2.51 2.68 2.63 2.37 2.24 1.85 1.84 2.53 2.48 2.27 2.47 2.36Standard deviation 1.03 .90 .99 1.09 .94 1.04 1.02 1.02 .94 .96 1.01 1.01 1.04 1.07 1.02Standard error .02 .07 .07 .07 .06 .07 .08 .07 .07 .09 .08 .03 .04 .06 .03
Online fieldwork: 26th March - 15th April 2015 Prepared by ComRes Ltd
Page 98
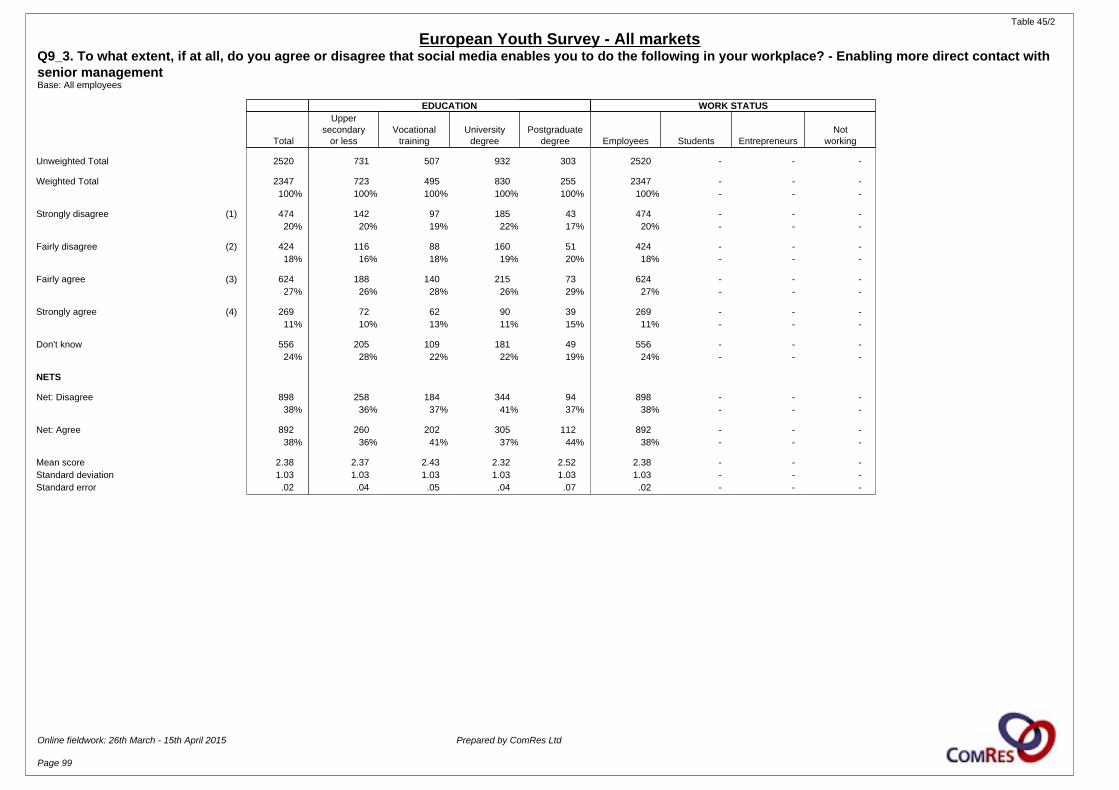
Table 45/2
European Youth Survey - All marketsQ9_3. To what extent, if at all, do you agree or disagree that social media enables you to do the following in your workplace? - Enabling more direct contact with senior managementBase: All employees
EDUCATION WORK STATUS
Total
Uppersecondary
or lessVocational
trainingUniversity
degreePostgraduate
degree Employees Students EntrepreneursNot
working
Unweighted Total 2520 731 507 932 303 2520 - - -
Weighted Total 2347 723 495 830 255 2347 - - -100% 100% 100% 100% 100% 100% - - -
Strongly disagree (1) 474 142 97 185 43 474 - - -20% 20% 19% 22% 17% 20% - - -
Fairly disagree (2) 424 116 88 160 51 424 - - -18% 16% 18% 19% 20% 18% - - -
Fairly agree (3) 624 188 140 215 73 624 - - -27% 26% 28% 26% 29% 27% - - -
Strongly agree (4) 269 72 62 90 39 269 - - -11% 10% 13% 11% 15% 11% - - -
Don't know 556 205 109 181 49 556 - - -24% 28% 22% 22% 19% 24% - - -
NETS
Net: Disagree 898 258 184 344 94 898 - - -38% 36% 37% 41% 37% 38% - - -
Net: Agree 892 260 202 305 112 892 - - -38% 36% 41% 37% 44% 38% - - -
Mean score 2.38 2.37 2.43 2.32 2.52 2.38 - - -Standard deviation 1.03 1.03 1.03 1.03 1.03 1.03 - - -Standard error .02 .04 .05 .04 .07 .02 - - -
Online fieldwork: 26th March - 15th April 2015 Prepared by ComRes Ltd
Page 99

Table 46/1
European Youth Survey - All marketsQ9_4. To what extent, if at all, do you agree or disagree that social media enables you to do the following in your workplace? - Influencing decisions at corporate levelBase: All employees
COUNTRY GENDER AGE
Total Italy Germany France Spain UKEasternEurope Baltic Nordics Sweden Benelux Male Female 18-22 22-29
Unweighted Total 2520 213 275 286 250 307 265 270 237 185 232 1322 1198 389 2131
Weighted Total 2347 189 247 275 239 278 228 258 223 176 234 1232 1115 511 1836100% 100% 100% 100% 100% 100% 100% 100% 100% 100% 100% 100% 100% 100% 100%
Strongly disagree (1) 460 23 53 48 22 36 45 56 75 62 40 208 252 89 37120% 12% 21% 17% 9% 13% 20% 22% 34% 35% 17% 17% 23% 17% 20%
Fairly disagree (2) 446 34 56 36 63 55 42 58 36 17 49 249 197 103 34219% 18% 23% 13% 26% 20% 18% 23% 16% 10% 21% 20% 18% 20% 19%
Fairly agree (3) 601 71 53 81 84 85 50 59 35 25 57 343 258 135 46626% 38% 21% 30% 35% 31% 22% 23% 16% 14% 24% 28% 23% 26% 25%
Strongly agree (4) 250 21 31 43 36 39 18 16 8 5 33 163 88 69 18111% 11% 13% 16% 15% 14% 8% 6% 3% 3% 14% 13% 8% 13% 10%
Don't know 591 40 54 67 33 62 74 68 69 68 55 270 320 115 47525% 21% 22% 24% 14% 22% 32% 26% 31% 39% 24% 22% 29% 23% 26%
NETS
Net: Disagree 905 56 109 83 85 91 87 114 112 78 89 456 449 192 71339% 30% 44% 30% 36% 33% 38% 44% 50% 44% 38% 37% 40% 38% 39%
Net: Agree 851 93 85 124 120 124 68 75 42 30 89 505 346 203 64836% 49% 34% 45% 50% 45% 30% 29% 19% 17% 38% 41% 31% 40% 35%
Mean score 2.37 2.61 2.33 2.58 2.65 2.59 2.26 2.19 1.84 1.76 2.46 2.48 2.23 2.46 2.34Standard deviation 1.02 .91 1.05 1.06 .90 .97 1.01 .96 .95 .97 1.03 1.01 1.02 1.02 1.02Standard error .02 .07 .07 .07 .06 .06 .07 .07 .07 .09 .08 .03 .03 .06 .03
Online fieldwork: 26th March - 15th April 2015 Prepared by ComRes Ltd
Page 100

Table 46/2
European Youth Survey - All marketsQ9_4. To what extent, if at all, do you agree or disagree that social media enables you to do the following in your workplace? - Influencing decisions at corporate levelBase: All employees
EDUCATION WORK STATUS
Total
Uppersecondary
or lessVocational
trainingUniversity
degreePostgraduate
degree Employees Students EntrepreneursNot
working
Unweighted Total 2520 731 507 932 303 2520 - - -
Weighted Total 2347 723 495 830 255 2347 - - -100% 100% 100% 100% 100% 100% - - -
Strongly disagree (1) 460 124 102 188 37 460 - - -20% 17% 21% 23% 15% 20% - - -
Fairly disagree (2) 446 140 91 156 51 446 - - -19% 19% 18% 19% 20% 19% - - -
Fairly agree (3) 601 177 126 208 81 601 - - -26% 24% 25% 25% 32% 26% - - -
Strongly agree (4) 250 71 58 81 36 250 - - -11% 10% 12% 10% 14% 11% - - -
Don't know 591 211 118 197 50 591 - - -25% 29% 24% 24% 20% 25% - - -
NETS
Net: Disagree 905 264 193 344 88 905 - - -39% 37% 39% 41% 35% 39% - - -
Net: Agree 851 248 184 289 117 851 - - -36% 34% 37% 35% 46% 36% - - -
Mean score 2.37 2.38 2.37 2.29 2.56 2.37 - - -Standard deviation 1.02 1.00 1.04 1.03 .98 1.02 - - -Standard error .02 .04 .05 .04 .06 .02 - - -
Online fieldwork: 26th March - 15th April 2015 Prepared by ComRes Ltd
Page 101
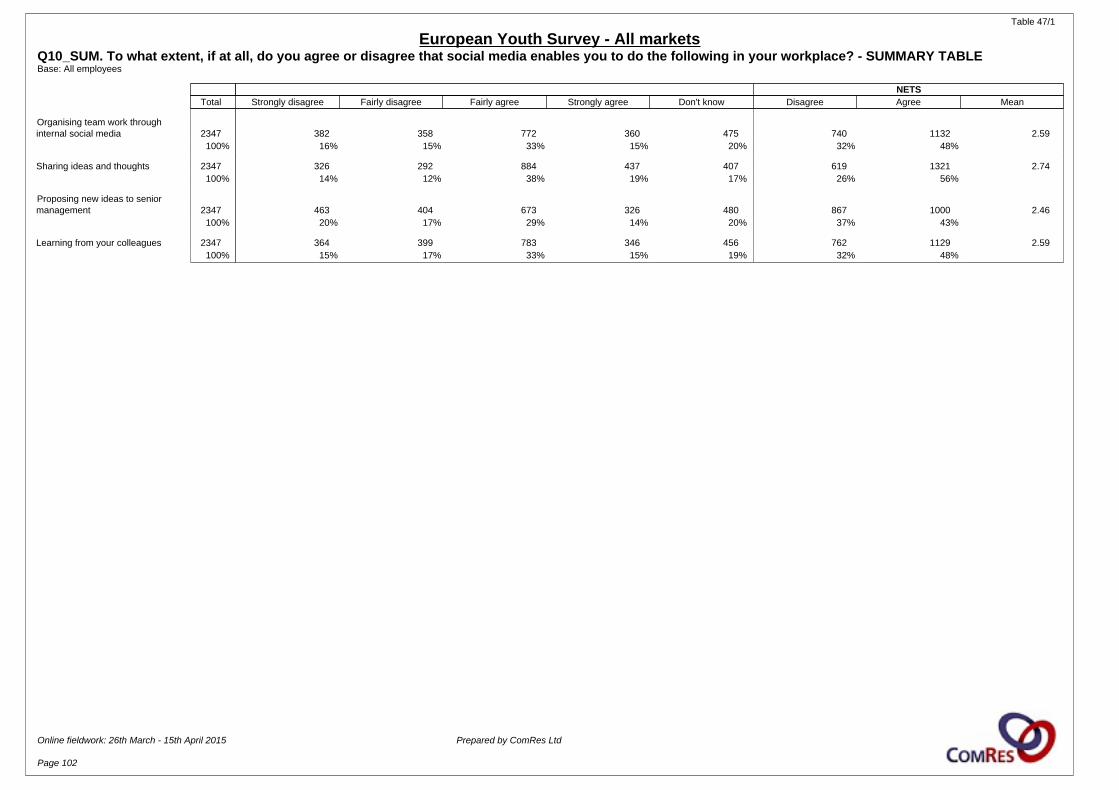
Table 47/1
European Youth Survey - All marketsQ10_SUM. To what extent, if at all, do you agree or disagree that social media enables you to do the following in your workplace? - SUMMARY TABLEBase: All employees
NETS Total Strongly disagree Fairly disagree Fairly agree Strongly agree Don't know Disagree Agree Mean
Organising team work throughinternal social media 2347 382 358 772 360 475 740 1132 2.59
100% 16% 15% 33% 15% 20% 32% 48%
Sharing ideas and thoughts 2347 326 292 884 437 407 619 1321 2.74100% 14% 12% 38% 19% 17% 26% 56%
Proposing new ideas to seniormanagement 2347 463 404 673 326 480 867 1000 2.46
100% 20% 17% 29% 14% 20% 37% 43%
Learning from your colleagues 2347 364 399 783 346 456 762 1129 2.59100% 15% 17% 33% 15% 19% 32% 48%
Online fieldwork: 26th March - 15th April 2015 Prepared by ComRes Ltd
Page 102

Table 48/1
European Youth Survey - All marketsQ10_1. To what extent, if at all, do you agree or disagree that social media enables you to do the following in your workplace? - Organising team work through internal social mediaBase: All employees
COUNTRY GENDER AGE
Total Italy Germany France Spain UKEasternEurope Baltic Nordics Sweden Benelux Male Female 18-22 22-29
Unweighted Total 2520 213 275 286 250 307 265 270 237 185 232 1322 1198 389 2131
Weighted Total 2347 189 247 275 239 278 228 258 223 176 234 1232 1115 511 1836100% 100% 100% 100% 100% 100% 100% 100% 100% 100% 100% 100% 100% 100% 100%
Strongly disagree (1) 382 17 38 37 20 36 41 48 56 53 36 182 200 71 31116% 9% 16% 13% 8% 13% 18% 19% 25% 30% 16% 15% 18% 14% 17%
Fairly disagree (2) 358 33 37 42 40 42 23 46 35 24 38 208 150 70 28915% 17% 15% 15% 17% 15% 10% 18% 16% 14% 16% 17% 13% 14% 16%
Fairly agree (3) 772 80 88 80 95 90 83 86 52 32 86 417 355 172 60033% 42% 36% 29% 40% 32% 36% 33% 23% 18% 37% 34% 32% 34% 33%
Strongly agree (4) 360 26 42 54 51 66 26 26 19 17 33 208 151 107 25315% 14% 17% 20% 21% 24% 12% 10% 8% 10% 14% 17% 14% 21% 14%
Don't know 475 34 42 63 33 44 55 52 62 50 41 217 258 91 38420% 18% 17% 23% 14% 16% 24% 20% 28% 28% 17% 18% 23% 18% 21%
NETS
Net: Disagree 740 50 76 79 59 78 63 94 91 77 74 390 350 140 60032% 26% 31% 29% 25% 28% 28% 36% 41% 44% 32% 32% 31% 28% 33%
Net: Agree 1132 106 130 133 146 156 109 112 70 49 119 625 507 279 85348% 56% 53% 48% 61% 56% 48% 44% 32% 28% 51% 51% 45% 55% 46%
Mean score 2.59 2.73 2.65 2.71 2.86 2.79 2.55 2.44 2.20 2.11 2.60 2.64 2.53 2.75 2.55Standard deviation 1.02 .87 1.01 1.03 .90 1.02 1.01 .98 1.05 1.10 .98 1.00 1.03 1.02 1.01Standard error .02 .07 .07 .07 .06 .06 .07 .07 .08 .10 .07 .03 .03 .06 .02
Online fieldwork: 26th March - 15th April 2015 Prepared by ComRes Ltd
Page 103

Table 48/2
European Youth Survey - All marketsQ10_1. To what extent, if at all, do you agree or disagree that social media enables you to do the following in your workplace? - Organising team work through internal social mediaBase: All employees
EDUCATION WORK STATUS
Total
Uppersecondary
or lessVocational
trainingUniversity
degreePostgraduate
degree Employees Students EntrepreneursNot
working
Unweighted Total 2520 731 507 932 303 2520 - - -
Weighted Total 2347 723 495 830 255 2347 - - -100% 100% 100% 100% 100% 100% - - -
Strongly disagree (1) 382 101 78 163 34 382 - - -16% 14% 16% 20% 13% 16% - - -
Fairly disagree (2) 358 108 67 135 39 358 - - -15% 15% 14% 16% 15% 15% - - -
Fairly agree (3) 772 222 175 267 99 772 - - -33% 31% 35% 32% 39% 33% - - -
Strongly agree (4) 360 112 79 115 48 360 - - -15% 15% 16% 14% 19% 15% - - -
Don't know 475 180 96 151 34 475 - - -20% 25% 19% 18% 13% 20% - - -
NETS
Net: Disagree 740 209 145 298 73 740 - - -32% 29% 29% 36% 29% 32% - - -
Net: Agree 1132 334 254 381 148 1132 - - -48% 46% 51% 46% 58% 48% - - -
Mean score 2.59 2.63 2.64 2.49 2.73 2.59 - - -Standard deviation 1.02 1.01 1.01 1.03 .97 1.02 - - -Standard error .02 .04 .05 .04 .06 .02 - - -
Online fieldwork: 26th March - 15th April 2015 Prepared by ComRes Ltd
Page 104

Table 49/1
European Youth Survey - All marketsQ10_2. To what extent, if at all, do you agree or disagree that social media enables you to do the following in your workplace? - Sharing ideas and thoughtsBase: All employees
COUNTRY GENDER AGE
Total Italy Germany France Spain UKEasternEurope Baltic Nordics Sweden Benelux Male Female 18-22 22-29
Unweighted Total 2520 213 275 286 250 307 265 270 237 185 232 1322 1198 389 2131
Weighted Total 2347 189 247 275 239 278 228 258 223 176 234 1232 1115 511 1836100% 100% 100% 100% 100% 100% 100% 100% 100% 100% 100% 100% 100% 100% 100%
Strongly disagree (1) 326 15 27 28 20 38 39 37 45 48 30 161 166 63 26314% 8% 11% 10% 8% 14% 17% 14% 20% 27% 13% 13% 15% 12% 14%
Fairly disagree (2) 292 24 45 33 24 35 18 32 31 15 35 153 140 60 23312% 13% 18% 12% 10% 13% 8% 13% 14% 9% 15% 12% 13% 12% 13%
Fairly agree (3) 884 92 88 97 108 99 89 102 67 54 89 478 406 209 67538% 49% 36% 35% 45% 36% 39% 39% 30% 30% 38% 39% 36% 41% 37%
Strongly agree (4) 437 29 51 63 58 63 30 50 23 23 46 252 185 108 32919% 15% 21% 23% 24% 23% 13% 19% 10% 13% 20% 20% 17% 21% 18%
Don't know 407 28 37 55 29 43 51 36 56 37 34 189 218 71 33617% 15% 15% 20% 12% 15% 23% 14% 25% 21% 15% 15% 20% 14% 18%
NETS
Net: Disagree 619 39 72 60 44 72 57 70 76 63 64 313 305 123 49626% 21% 29% 22% 19% 26% 25% 27% 34% 36% 27% 25% 27% 24% 27%
Net: Agree 1321 122 139 160 166 162 119 152 91 76 135 730 592 317 100556% 64% 56% 58% 69% 58% 52% 59% 41% 43% 58% 59% 53% 62% 55%
Mean score 2.74 2.84 2.77 2.89 2.97 2.80 2.63 2.74 2.41 2.37 2.76 2.79 2.68 2.82 2.71Standard deviation .99 .83 .96 .96 .88 1.01 1.01 .99 1.03 1.12 .97 .98 1.00 .96 1.00Standard error .02 .06 .06 .06 .06 .06 .07 .06 .08 .09 .07 .03 .03 .05 .02
Online fieldwork: 26th March - 15th April 2015 Prepared by ComRes Ltd
Page 105
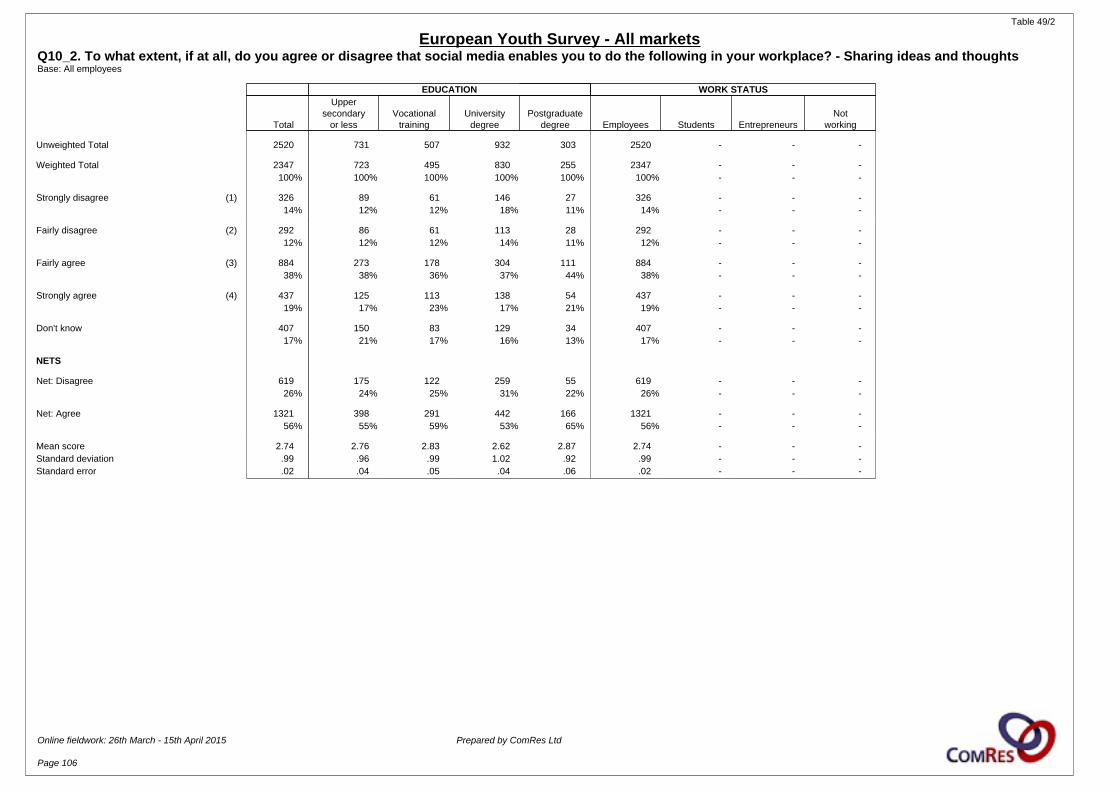
Table 49/2
European Youth Survey - All marketsQ10_2. To what extent, if at all, do you agree or disagree that social media enables you to do the following in your workplace? - Sharing ideas and thoughtsBase: All employees
EDUCATION WORK STATUS
Total
Uppersecondary
or lessVocational
trainingUniversity
degreePostgraduate
degree Employees Students EntrepreneursNot
working
Unweighted Total 2520 731 507 932 303 2520 - - -
Weighted Total 2347 723 495 830 255 2347 - - -100% 100% 100% 100% 100% 100% - - -
Strongly disagree (1) 326 89 61 146 27 326 - - -14% 12% 12% 18% 11% 14% - - -
Fairly disagree (2) 292 86 61 113 28 292 - - -12% 12% 12% 14% 11% 12% - - -
Fairly agree (3) 884 273 178 304 111 884 - - -38% 38% 36% 37% 44% 38% - - -
Strongly agree (4) 437 125 113 138 54 437 - - -19% 17% 23% 17% 21% 19% - - -
Don't know 407 150 83 129 34 407 - - -17% 21% 17% 16% 13% 17% - - -
NETS
Net: Disagree 619 175 122 259 55 619 - - -26% 24% 25% 31% 22% 26% - - -
Net: Agree 1321 398 291 442 166 1321 - - -56% 55% 59% 53% 65% 56% - - -
Mean score 2.74 2.76 2.83 2.62 2.87 2.74 - - -Standard deviation .99 .96 .99 1.02 .92 .99 - - -Standard error .02 .04 .05 .04 .06 .02 - - -
Online fieldwork: 26th March - 15th April 2015 Prepared by ComRes Ltd
Page 106

Table 50/1
European Youth Survey - All marketsQ10_3. To what extent, if at all, do you agree or disagree that social media enables you to do the following in your workplace? - Proposing new ideas to senior managementBase: All employees
COUNTRY GENDER AGE
Total Italy Germany France Spain UKEasternEurope Baltic Nordics Sweden Benelux Male Female 18-22 22-29
Unweighted Total 2520 213 275 286 250 307 265 270 237 185 232 1322 1198 389 2131
Weighted Total 2347 189 247 275 239 278 228 258 223 176 234 1232 1115 511 1836100% 100% 100% 100% 100% 100% 100% 100% 100% 100% 100% 100% 100% 100% 100%
Strongly disagree (1) 463 18 49 45 22 47 50 60 65 66 42 213 250 87 37620% 9% 20% 16% 9% 17% 22% 23% 29% 37% 18% 17% 22% 17% 20%
Fairly disagree (2) 404 34 51 37 42 46 29 57 42 21 45 233 170 84 32017% 18% 21% 13% 18% 17% 13% 22% 19% 12% 19% 19% 15% 16% 17%
Fairly agree (3) 673 83 64 72 93 88 71 64 33 33 73 366 307 152 52129% 44% 26% 26% 39% 32% 31% 25% 15% 19% 31% 30% 28% 30% 28%
Strongly agree (4) 326 22 39 63 51 47 20 26 13 15 32 202 124 91 23514% 12% 16% 23% 21% 17% 9% 10% 6% 8% 13% 16% 11% 18% 13%
Don't know 480 33 44 59 32 50 60 52 69 42 41 216 264 96 38420% 17% 18% 21% 13% 18% 26% 20% 31% 24% 18% 18% 24% 19% 21%
NETS
Net: Disagree 867 51 100 81 64 93 78 117 108 86 88 447 420 171 69637% 27% 41% 30% 27% 34% 34% 45% 48% 49% 38% 36% 38% 34% 38%
Net: Agree 1000 105 103 135 143 134 90 89 47 48 105 569 431 243 75743% 56% 42% 49% 60% 48% 40% 35% 21% 27% 45% 46% 39% 48% 41%
Mean score 2.46 2.70 2.46 2.71 2.83 2.59 2.36 2.27 1.97 1.98 2.49 2.55 2.36 2.59 2.42Standard deviation 1.05 .85 1.06 1.10 .92 1.03 1.03 1.02 1.00 1.09 1.01 1.03 1.05 1.05 1.04Standard error .02 .06 .07 .07 .06 .07 .07 .07 .08 .09 .07 .03 .03 .06 .03
Online fieldwork: 26th March - 15th April 2015 Prepared by ComRes Ltd
Page 107

Table 50/2
European Youth Survey - All marketsQ10_3. To what extent, if at all, do you agree or disagree that social media enables you to do the following in your workplace? - Proposing new ideas to senior managementBase: All employees
EDUCATION WORK STATUS
Total
Uppersecondary
or lessVocational
trainingUniversity
degreePostgraduate
degree Employees Students EntrepreneursNot
working
Unweighted Total 2520 731 507 932 303 2520 - - -
Weighted Total 2347 723 495 830 255 2347 - - -100% 100% 100% 100% 100% 100% - - -
Strongly disagree (1) 463 125 95 195 41 463 - - -20% 17% 19% 23% 16% 20% - - -
Fairly disagree (2) 404 131 61 157 45 404 - - -17% 18% 12% 19% 18% 17% - - -
Fairly agree (3) 673 204 143 233 83 673 - - -29% 28% 29% 28% 33% 29% - - -
Strongly agree (4) 326 88 92 92 49 326 - - -14% 12% 19% 11% 19% 14% - - -
Don't know 480 176 104 153 37 480 - - -20% 24% 21% 18% 14% 20% - - -
NETS
Net: Disagree 867 256 156 352 86 867 - - -37% 35% 31% 42% 34% 37% - - -
Net: Agree 1000 292 235 326 132 1000 - - -43% 40% 48% 39% 52% 43% - - -
Mean score 2.46 2.47 2.59 2.33 2.64 2.46 - - -Standard deviation 1.05 1.01 1.10 1.03 1.03 1.05 - - -Standard error .02 .04 .05 .04 .06 .02 - - -
Online fieldwork: 26th March - 15th April 2015 Prepared by ComRes Ltd
Page 108
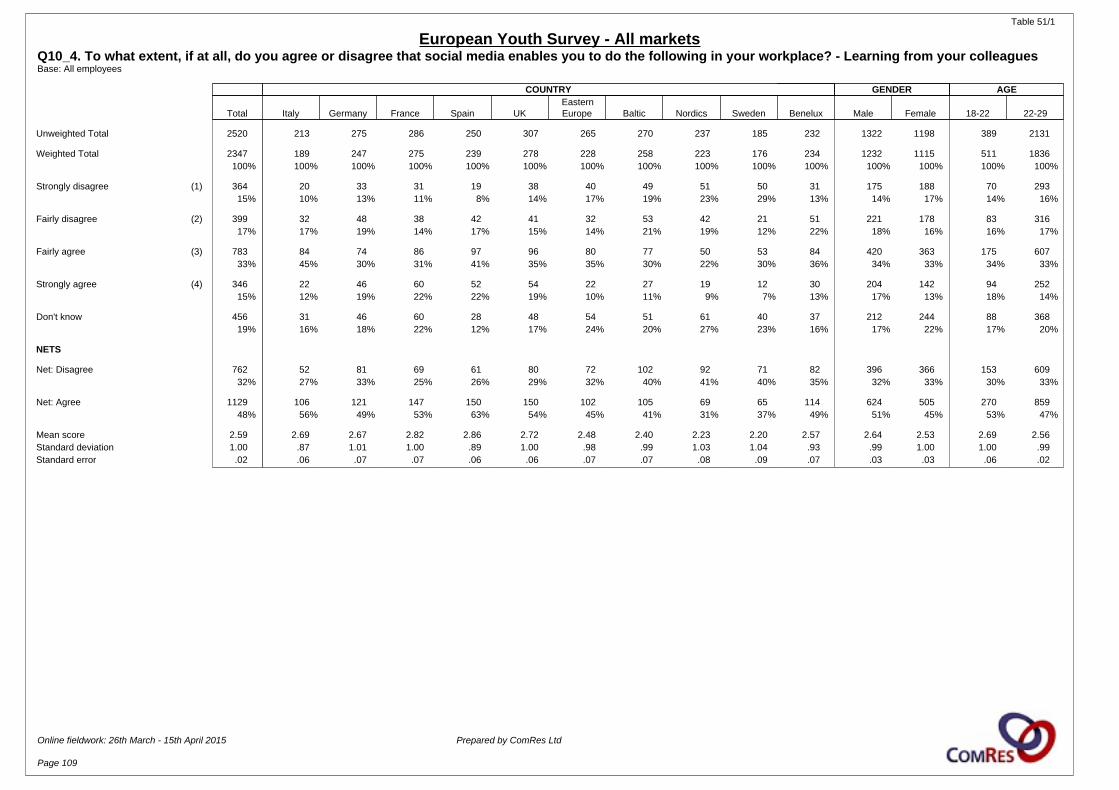
Table 51/1
European Youth Survey - All marketsQ10_4. To what extent, if at all, do you agree or disagree that social media enables you to do the following in your workplace? - Learning from your colleaguesBase: All employees
COUNTRY GENDER AGE
Total Italy Germany France Spain UKEasternEurope Baltic Nordics Sweden Benelux Male Female 18-22 22-29
Unweighted Total 2520 213 275 286 250 307 265 270 237 185 232 1322 1198 389 2131
Weighted Total 2347 189 247 275 239 278 228 258 223 176 234 1232 1115 511 1836100% 100% 100% 100% 100% 100% 100% 100% 100% 100% 100% 100% 100% 100% 100%
Strongly disagree (1) 364 20 33 31 19 38 40 49 51 50 31 175 188 70 29315% 10% 13% 11% 8% 14% 17% 19% 23% 29% 13% 14% 17% 14% 16%
Fairly disagree (2) 399 32 48 38 42 41 32 53 42 21 51 221 178 83 31617% 17% 19% 14% 17% 15% 14% 21% 19% 12% 22% 18% 16% 16% 17%
Fairly agree (3) 783 84 74 86 97 96 80 77 50 53 84 420 363 175 60733% 45% 30% 31% 41% 35% 35% 30% 22% 30% 36% 34% 33% 34% 33%
Strongly agree (4) 346 22 46 60 52 54 22 27 19 12 30 204 142 94 25215% 12% 19% 22% 22% 19% 10% 11% 9% 7% 13% 17% 13% 18% 14%
Don't know 456 31 46 60 28 48 54 51 61 40 37 212 244 88 36819% 16% 18% 22% 12% 17% 24% 20% 27% 23% 16% 17% 22% 17% 20%
NETS
Net: Disagree 762 52 81 69 61 80 72 102 92 71 82 396 366 153 60932% 27% 33% 25% 26% 29% 32% 40% 41% 40% 35% 32% 33% 30% 33%
Net: Agree 1129 106 121 147 150 150 102 105 69 65 114 624 505 270 85948% 56% 49% 53% 63% 54% 45% 41% 31% 37% 49% 51% 45% 53% 47%
Mean score 2.59 2.69 2.67 2.82 2.86 2.72 2.48 2.40 2.23 2.20 2.57 2.64 2.53 2.69 2.56Standard deviation 1.00 .87 1.01 1.00 .89 1.00 .98 .99 1.03 1.04 .93 .99 1.00 1.00 .99Standard error .02 .06 .07 .07 .06 .06 .07 .07 .08 .09 .07 .03 .03 .06 .02
Online fieldwork: 26th March - 15th April 2015 Prepared by ComRes Ltd
Page 109

Table 51/2
European Youth Survey - All marketsQ10_4. To what extent, if at all, do you agree or disagree that social media enables you to do the following in your workplace? - Learning from your colleaguesBase: All employees
EDUCATION WORK STATUS
Total
Uppersecondary
or lessVocational
trainingUniversity
degreePostgraduate
degree Employees Students EntrepreneursNot
working
Unweighted Total 2520 731 507 932 303 2520 - - -
Weighted Total 2347 723 495 830 255 2347 - - -100% 100% 100% 100% 100% 100% - - -
Strongly disagree (1) 364 112 76 144 26 364 - - -15% 15% 15% 17% 10% 15% - - -
Fairly disagree (2) 399 115 78 148 48 399 - - -17% 16% 16% 18% 19% 17% - - -
Fairly agree (3) 783 227 168 274 103 783 - - -33% 31% 34% 33% 41% 33% - - -
Strongly agree (4) 346 102 78 119 43 346 - - -15% 14% 16% 14% 17% 15% - - -
Don't know 456 167 96 146 34 456 - - -19% 23% 19% 18% 13% 19% - - -
NETS
Net: Disagree 762 227 153 292 75 762 - - -32% 31% 31% 35% 29% 32% - - -
Net: Agree 1129 329 247 393 147 1129 - - -48% 46% 50% 47% 57% 48% - - -
Mean score 2.59 2.57 2.62 2.54 2.74 2.59 - - -Standard deviation 1.00 1.01 1.00 1.01 .91 1.00 - - -Standard error .02 .04 .05 .04 .06 .02 - - -
Online fieldwork: 26th March - 15th April 2015 Prepared by ComRes Ltd
Page 110
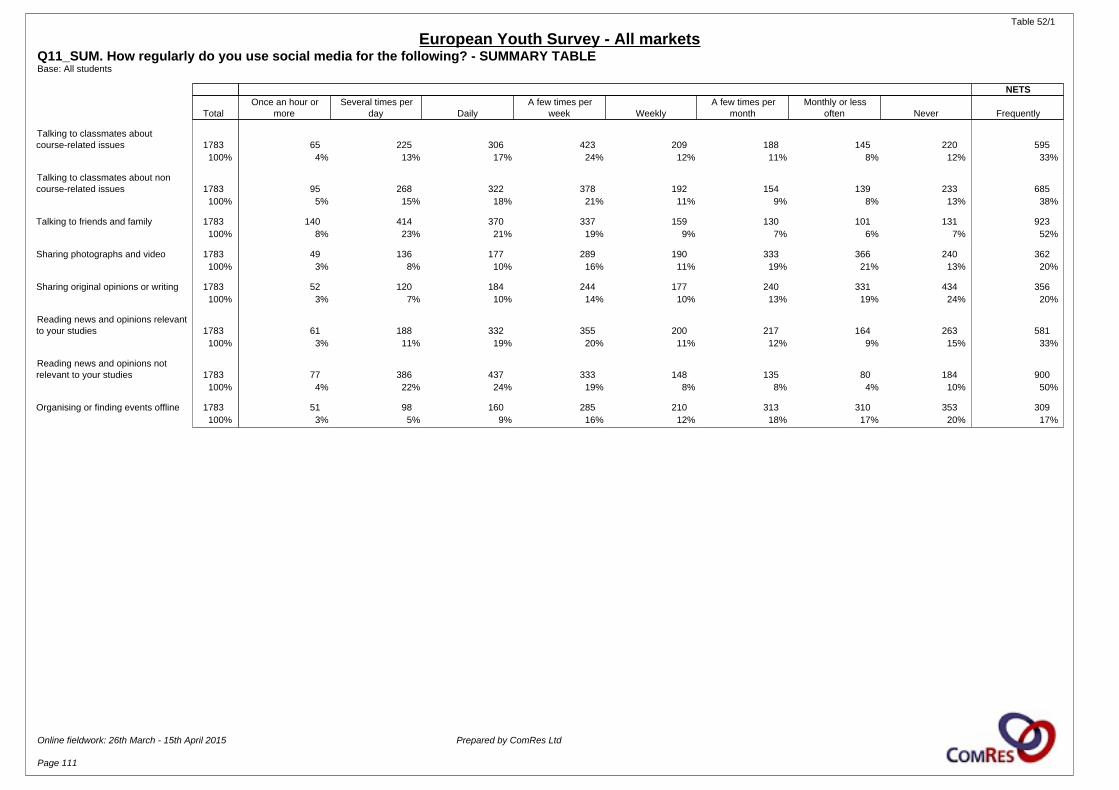
Table 52/1
European Youth Survey - All marketsQ11_SUM. How regularly do you use social media for the following? - SUMMARY TABLEBase: All students
NETS
TotalOnce an hour or
moreSeveral times per
day DailyA few times per
week WeeklyA few times per
monthMonthly or less
often Never Frequently
Talking to classmates aboutcourse-related issues 1783 65 225 306 423 209 188 145 220 595
100% 4% 13% 17% 24% 12% 11% 8% 12% 33%
Talking to classmates about noncourse-related issues 1783 95 268 322 378 192 154 139 233 685
100% 5% 15% 18% 21% 11% 9% 8% 13% 38%
Talking to friends and family 1783 140 414 370 337 159 130 101 131 923100% 8% 23% 21% 19% 9% 7% 6% 7% 52%
Sharing photographs and video 1783 49 136 177 289 190 333 366 240 362100% 3% 8% 10% 16% 11% 19% 21% 13% 20%
Sharing original opinions or writing 1783 52 120 184 244 177 240 331 434 356100% 3% 7% 10% 14% 10% 13% 19% 24% 20%
Reading news and opinions relevantto your studies 1783 61 188 332 355 200 217 164 263 581
100% 3% 11% 19% 20% 11% 12% 9% 15% 33%
Reading news and opinions notrelevant to your studies 1783 77 386 437 333 148 135 80 184 900
100% 4% 22% 24% 19% 8% 8% 4% 10% 50%
Organising or finding events offline 1783 51 98 160 285 210 313 310 353 309100% 3% 5% 9% 16% 12% 18% 17% 20% 17%
Online fieldwork: 26th March - 15th April 2015 Prepared by ComRes Ltd
Page 111

Table 53/1
European Youth Survey - All marketsQ11_1. How regularly do you use social media for the following? - Talking to classmates about course-related issuesBase: All students
COUNTRY GENDER AGE
Total Italy Germany France Spain UKEasternEurope Baltic Nordics Sweden Benelux Male Female 18-22 22-29
Unweighted Total 1613 153 173 111 150 103 124 157 295 163 184 770 843 907 706
Weighted Total 1783 176 199 121 161 131 161 170 308 175 182 842 941 1173 610100% 100% 100% 100% 100% 100% 100% 100% 100% 100% 100% 100% 100% 100% 100%
Once an hour or more 65 10 1 7 12 8 10 3 1 4 9 38 27 48 164% 6% * 6% 7% 6% 6% 2% * 2% 5% 4% 3% 4% 3%
Several times per day 225 26 20 23 29 20 15 26 25 13 27 103 122 163 6213% 15% 10% 19% 18% 16% 9% 15% 8% 7% 15% 12% 13% 14% 10%
Daily 306 34 16 14 36 20 53 30 57 26 19 144 162 228 7817% 19% 8% 11% 23% 15% 33% 18% 18% 15% 10% 17% 17% 19% 13%
A few times per week 423 38 40 25 39 27 37 42 75 58 41 196 226 280 14324% 22% 20% 21% 24% 21% 23% 25% 24% 33% 23% 23% 24% 24% 23%
Weekly 209 15 31 8 14 12 8 30 49 21 22 93 116 135 7412% 8% 15% 7% 9% 9% 5% 18% 16% 12% 12% 11% 12% 12% 12%
A few times per month 188 20 24 14 10 14 16 19 31 24 17 86 102 115 7411% 11% 12% 12% 7% 11% 10% 11% 10% 14% 9% 10% 11% 10% 12%
Monthly or less often 145 8 21 12 9 9 8 12 34 12 19 68 77 74 718% 5% 11% 10% 6% 7% 5% 7% 11% 7% 11% 8% 8% 6% 12%
Never 220 24 44 17 11 20 14 8 36 18 28 114 106 129 9112% 14% 22% 14% 7% 15% 9% 5% 12% 10% 15% 13% 11% 11% 15%
NETS
Net: Frequently 595 71 37 44 77 49 78 59 83 43 55 285 310 439 15633% 40% 19% 36% 48% 37% 49% 35% 27% 24% 30% 34% 33% 37% 26%
Online fieldwork: 26th March - 15th April 2015 Prepared by ComRes Ltd
Page 112

Table 53/2
European Youth Survey - All marketsQ11_1. How regularly do you use social media for the following? - Talking to classmates about course-related issuesBase: All students
EDUCATION WORK STATUS
Total
Uppersecondary
or lessVocational
trainingUniversity
degreePostgraduate
degree Employees Students EntrepreneursNot
working
Unweighted Total 1613 894 182 451 59 - 1613 - -
Weighted Total 1783 1062 203 437 52 - 1783 - -100% 100% 100% 100% 100% - 100% - -
Once an hour or more 65 35 7 18 3 - 65 - -4% 3% 3% 4% 6% - 4% - -
Several times per day 225 130 19 61 12 - 225 - -13% 12% 9% 14% 22% - 13% - -
Daily 306 195 33 71 2 - 306 - -17% 18% 16% 16% 4% - 17% - -
A few times per week 423 234 47 118 12 - 423 - -24% 22% 23% 27% 23% - 24% - -
Weekly 209 133 20 50 6 - 209 - -12% 12% 10% 11% 12% - 12% - -
A few times per month 188 110 23 47 6 - 188 - -11% 10% 11% 11% 12% - 11% - -
Monthly or less often 145 89 18 34 2 - 145 - -8% 8% 9% 8% 3% - 8% - -
Never 220 136 36 37 9 - 220 - -12% 13% 18% 9% 17% - 12% - -
NETS
Net: Frequently 595 359 59 151 17 - 595 - -33% 34% 29% 34% 33% - 33% - -
Online fieldwork: 26th March - 15th April 2015 Prepared by ComRes Ltd
Page 113
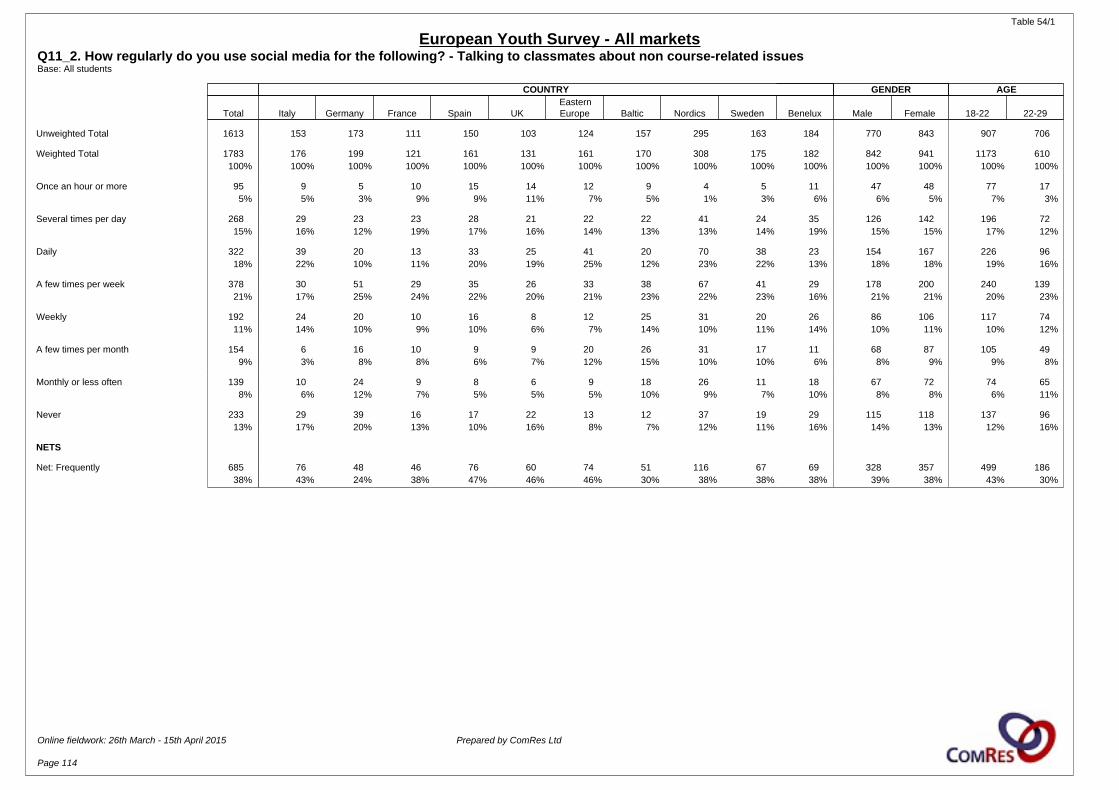
Table 54/1
European Youth Survey - All marketsQ11_2. How regularly do you use social media for the following? - Talking to classmates about non course-related issuesBase: All students
COUNTRY GENDER AGE
Total Italy Germany France Spain UKEasternEurope Baltic Nordics Sweden Benelux Male Female 18-22 22-29
Unweighted Total 1613 153 173 111 150 103 124 157 295 163 184 770 843 907 706
Weighted Total 1783 176 199 121 161 131 161 170 308 175 182 842 941 1173 610100% 100% 100% 100% 100% 100% 100% 100% 100% 100% 100% 100% 100% 100% 100%
Once an hour or more 95 9 5 10 15 14 12 9 4 5 11 47 48 77 175% 5% 3% 9% 9% 11% 7% 5% 1% 3% 6% 6% 5% 7% 3%
Several times per day 268 29 23 23 28 21 22 22 41 24 35 126 142 196 7215% 16% 12% 19% 17% 16% 14% 13% 13% 14% 19% 15% 15% 17% 12%
Daily 322 39 20 13 33 25 41 20 70 38 23 154 167 226 9618% 22% 10% 11% 20% 19% 25% 12% 23% 22% 13% 18% 18% 19% 16%
A few times per week 378 30 51 29 35 26 33 38 67 41 29 178 200 240 13921% 17% 25% 24% 22% 20% 21% 23% 22% 23% 16% 21% 21% 20% 23%
Weekly 192 24 20 10 16 8 12 25 31 20 26 86 106 117 7411% 14% 10% 9% 10% 6% 7% 14% 10% 11% 14% 10% 11% 10% 12%
A few times per month 154 6 16 10 9 9 20 26 31 17 11 68 87 105 499% 3% 8% 8% 6% 7% 12% 15% 10% 10% 6% 8% 9% 9% 8%
Monthly or less often 139 10 24 9 8 6 9 18 26 11 18 67 72 74 658% 6% 12% 7% 5% 5% 5% 10% 9% 7% 10% 8% 8% 6% 11%
Never 233 29 39 16 17 22 13 12 37 19 29 115 118 137 9613% 17% 20% 13% 10% 16% 8% 7% 12% 11% 16% 14% 13% 12% 16%
NETS
Net: Frequently 685 76 48 46 76 60 74 51 116 67 69 328 357 499 18638% 43% 24% 38% 47% 46% 46% 30% 38% 38% 38% 39% 38% 43% 30%
Online fieldwork: 26th March - 15th April 2015 Prepared by ComRes Ltd
Page 114

Table 54/2
European Youth Survey - All marketsQ11_2. How regularly do you use social media for the following? - Talking to classmates about non course-related issuesBase: All students
EDUCATION WORK STATUS
Total
Uppersecondary
or lessVocational
trainingUniversity
degreePostgraduate
degree Employees Students EntrepreneursNot
working
Unweighted Total 1613 894 182 451 59 - 1613 - -
Weighted Total 1783 1062 203 437 52 - 1783 - -100% 100% 100% 100% 100% - 100% - -
Once an hour or more 95 46 9 28 8 - 95 - -5% 4% 5% 6% 15% - 5% - -
Several times per day 268 180 28 53 4 - 268 - -15% 17% 14% 12% 9% - 15% - -
Daily 322 196 25 88 5 - 322 - -18% 18% 12% 20% 10% - 18% - -
A few times per week 378 212 46 106 9 - 378 - -21% 20% 23% 24% 17% - 21% - -
Weekly 192 103 28 49 9 - 192 - -11% 10% 14% 11% 18% - 11% - -
A few times per month 154 92 16 42 5 - 154 - -9% 9% 8% 10% 9% - 9% - -
Monthly or less often 139 87 15 29 3 - 139 - -8% 8% 8% 7% 6% - 8% - -
Never 233 144 37 42 8 - 233 - -13% 14% 18% 10% 15% - 13% - -
NETS
Net: Frequently 685 422 61 168 18 - 685 - -38% 40% 30% 38% 34% - 38% - -
Online fieldwork: 26th March - 15th April 2015 Prepared by ComRes Ltd
Page 115
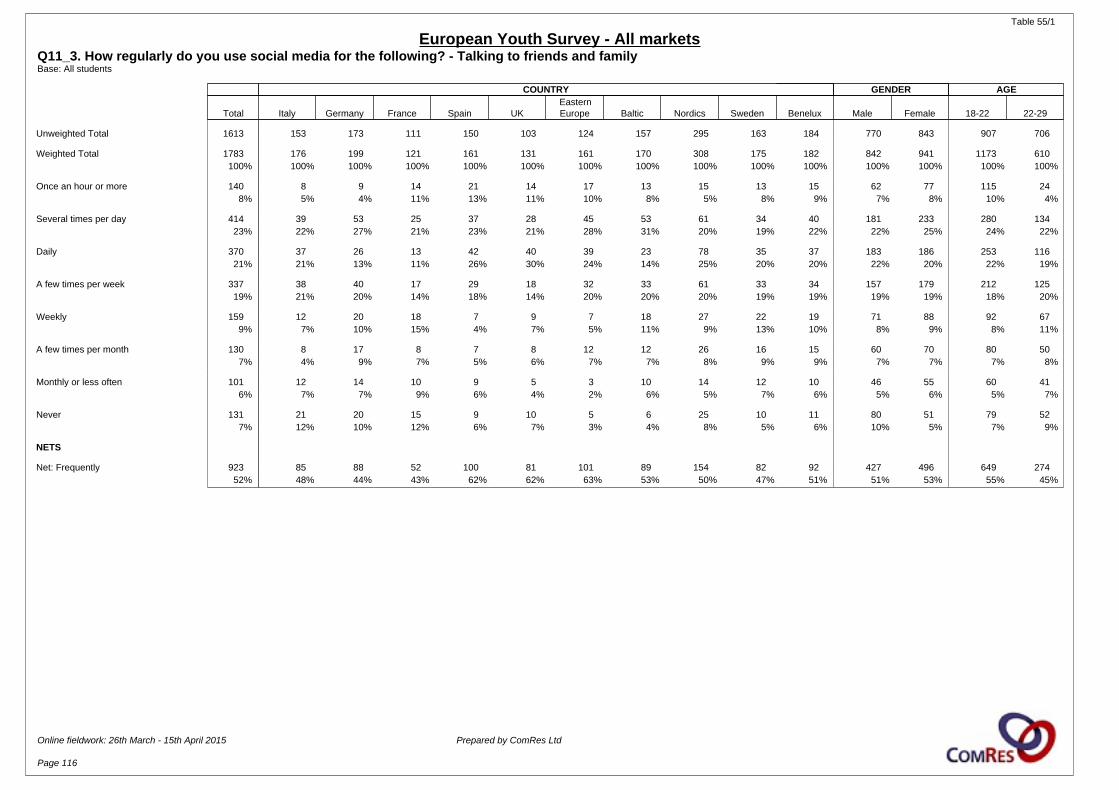
Table 55/1
European Youth Survey - All marketsQ11_3. How regularly do you use social media for the following? - Talking to friends and familyBase: All students
COUNTRY GENDER AGE
Total Italy Germany France Spain UKEasternEurope Baltic Nordics Sweden Benelux Male Female 18-22 22-29
Unweighted Total 1613 153 173 111 150 103 124 157 295 163 184 770 843 907 706
Weighted Total 1783 176 199 121 161 131 161 170 308 175 182 842 941 1173 610100% 100% 100% 100% 100% 100% 100% 100% 100% 100% 100% 100% 100% 100% 100%
Once an hour or more 140 8 9 14 21 14 17 13 15 13 15 62 77 115 248% 5% 4% 11% 13% 11% 10% 8% 5% 8% 9% 7% 8% 10% 4%
Several times per day 414 39 53 25 37 28 45 53 61 34 40 181 233 280 13423% 22% 27% 21% 23% 21% 28% 31% 20% 19% 22% 22% 25% 24% 22%
Daily 370 37 26 13 42 40 39 23 78 35 37 183 186 253 11621% 21% 13% 11% 26% 30% 24% 14% 25% 20% 20% 22% 20% 22% 19%
A few times per week 337 38 40 17 29 18 32 33 61 33 34 157 179 212 12519% 21% 20% 14% 18% 14% 20% 20% 20% 19% 19% 19% 19% 18% 20%
Weekly 159 12 20 18 7 9 7 18 27 22 19 71 88 92 679% 7% 10% 15% 4% 7% 5% 11% 9% 13% 10% 8% 9% 8% 11%
A few times per month 130 8 17 8 7 8 12 12 26 16 15 60 70 80 507% 4% 9% 7% 5% 6% 7% 7% 8% 9% 9% 7% 7% 7% 8%
Monthly or less often 101 12 14 10 9 5 3 10 14 12 10 46 55 60 416% 7% 7% 9% 6% 4% 2% 6% 5% 7% 6% 5% 6% 5% 7%
Never 131 21 20 15 9 10 5 6 25 10 11 80 51 79 527% 12% 10% 12% 6% 7% 3% 4% 8% 5% 6% 10% 5% 7% 9%
NETS
Net: Frequently 923 85 88 52 100 81 101 89 154 82 92 427 496 649 27452% 48% 44% 43% 62% 62% 63% 53% 50% 47% 51% 51% 53% 55% 45%
Online fieldwork: 26th March - 15th April 2015 Prepared by ComRes Ltd
Page 116
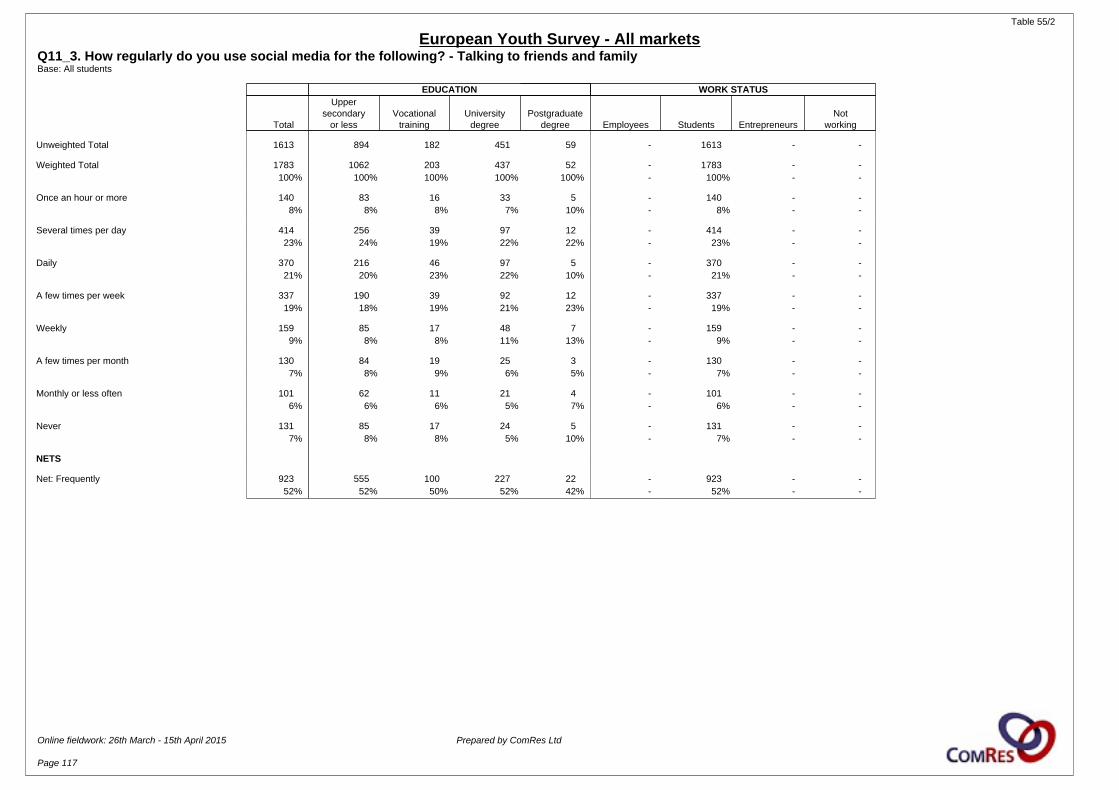
Table 55/2
European Youth Survey - All marketsQ11_3. How regularly do you use social media for the following? - Talking to friends and familyBase: All students
EDUCATION WORK STATUS
Total
Uppersecondary
or lessVocational
trainingUniversity
degreePostgraduate
degree Employees Students EntrepreneursNot
working
Unweighted Total 1613 894 182 451 59 - 1613 - -
Weighted Total 1783 1062 203 437 52 - 1783 - -100% 100% 100% 100% 100% - 100% - -
Once an hour or more 140 83 16 33 5 - 140 - -8% 8% 8% 7% 10% - 8% - -
Several times per day 414 256 39 97 12 - 414 - -23% 24% 19% 22% 22% - 23% - -
Daily 370 216 46 97 5 - 370 - -21% 20% 23% 22% 10% - 21% - -
A few times per week 337 190 39 92 12 - 337 - -19% 18% 19% 21% 23% - 19% - -
Weekly 159 85 17 48 7 - 159 - -9% 8% 8% 11% 13% - 9% - -
A few times per month 130 84 19 25 3 - 130 - -7% 8% 9% 6% 5% - 7% - -
Monthly or less often 101 62 11 21 4 - 101 - -6% 6% 6% 5% 7% - 6% - -
Never 131 85 17 24 5 - 131 - -7% 8% 8% 5% 10% - 7% - -
NETS
Net: Frequently 923 555 100 227 22 - 923 - -52% 52% 50% 52% 42% - 52% - -
Online fieldwork: 26th March - 15th April 2015 Prepared by ComRes Ltd
Page 117
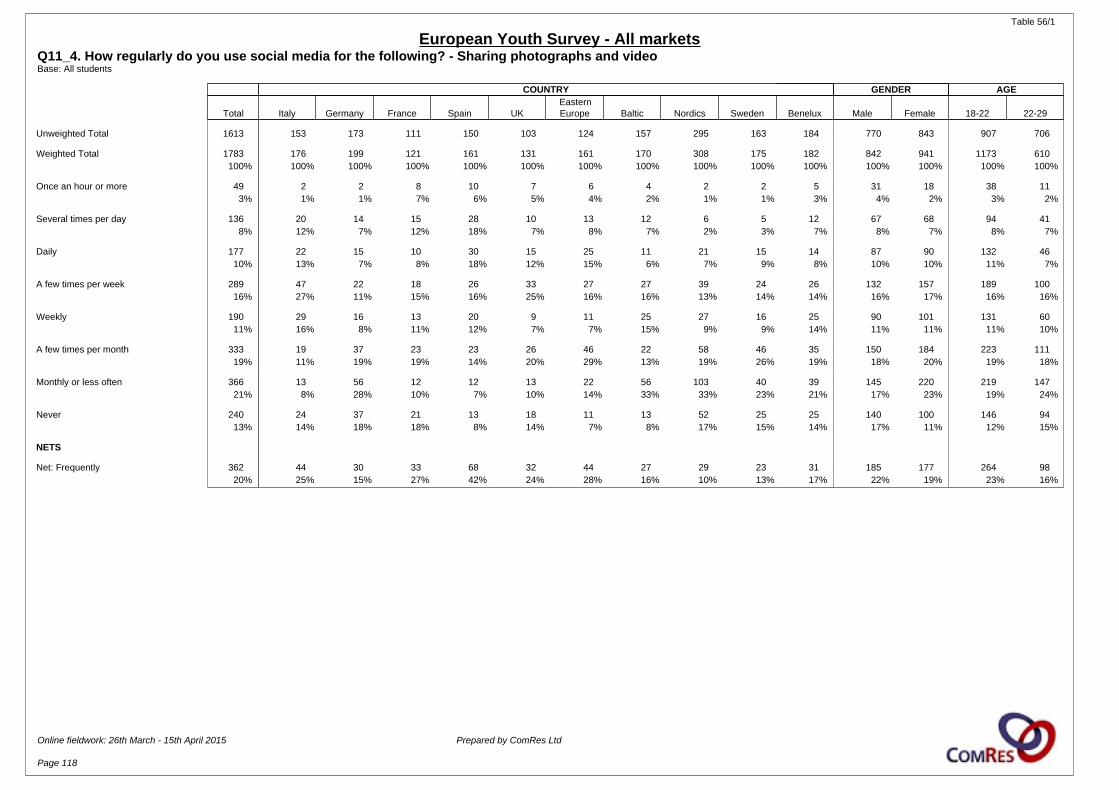
Table 56/1
European Youth Survey - All marketsQ11_4. How regularly do you use social media for the following? - Sharing photographs and videoBase: All students
COUNTRY GENDER AGE
Total Italy Germany France Spain UKEasternEurope Baltic Nordics Sweden Benelux Male Female 18-22 22-29
Unweighted Total 1613 153 173 111 150 103 124 157 295 163 184 770 843 907 706
Weighted Total 1783 176 199 121 161 131 161 170 308 175 182 842 941 1173 610100% 100% 100% 100% 100% 100% 100% 100% 100% 100% 100% 100% 100% 100% 100%
Once an hour or more 49 2 2 8 10 7 6 4 2 2 5 31 18 38 113% 1% 1% 7% 6% 5% 4% 2% 1% 1% 3% 4% 2% 3% 2%
Several times per day 136 20 14 15 28 10 13 12 6 5 12 67 68 94 418% 12% 7% 12% 18% 7% 8% 7% 2% 3% 7% 8% 7% 8% 7%
Daily 177 22 15 10 30 15 25 11 21 15 14 87 90 132 4610% 13% 7% 8% 18% 12% 15% 6% 7% 9% 8% 10% 10% 11% 7%
A few times per week 289 47 22 18 26 33 27 27 39 24 26 132 157 189 10016% 27% 11% 15% 16% 25% 16% 16% 13% 14% 14% 16% 17% 16% 16%
Weekly 190 29 16 13 20 9 11 25 27 16 25 90 101 131 6011% 16% 8% 11% 12% 7% 7% 15% 9% 9% 14% 11% 11% 11% 10%
A few times per month 333 19 37 23 23 26 46 22 58 46 35 150 184 223 11119% 11% 19% 19% 14% 20% 29% 13% 19% 26% 19% 18% 20% 19% 18%
Monthly or less often 366 13 56 12 12 13 22 56 103 40 39 145 220 219 14721% 8% 28% 10% 7% 10% 14% 33% 33% 23% 21% 17% 23% 19% 24%
Never 240 24 37 21 13 18 11 13 52 25 25 140 100 146 9413% 14% 18% 18% 8% 14% 7% 8% 17% 15% 14% 17% 11% 12% 15%
NETS
Net: Frequently 362 44 30 33 68 32 44 27 29 23 31 185 177 264 9820% 25% 15% 27% 42% 24% 28% 16% 10% 13% 17% 22% 19% 23% 16%
Online fieldwork: 26th March - 15th April 2015 Prepared by ComRes Ltd
Page 118

Table 56/2
European Youth Survey - All marketsQ11_4. How regularly do you use social media for the following? - Sharing photographs and videoBase: All students
EDUCATION WORK STATUS
Total
Uppersecondary
or lessVocational
trainingUniversity
degreePostgraduate
degree Employees Students EntrepreneursNot
working
Unweighted Total 1613 894 182 451 59 - 1613 - -
Weighted Total 1783 1062 203 437 52 - 1783 - -100% 100% 100% 100% 100% - 100% - -
Once an hour or more 49 26 6 8 7 - 49 - -3% 2% 3% 2% 13% - 3% - -
Several times per day 136 72 20 39 5 - 136 - -8% 7% 10% 9% 10% - 8% - -
Daily 177 94 25 48 5 - 177 - -10% 9% 12% 11% 10% - 10% - -
A few times per week 289 164 33 84 5 - 289 - -16% 15% 16% 19% 10% - 16% - -
Weekly 190 119 23 37 4 - 190 - -11% 11% 12% 9% 7% - 11% - -
A few times per month 333 198 37 84 12 - 333 - -19% 19% 18% 19% 23% - 19% - -
Monthly or less often 366 238 32 85 6 - 366 - -21% 22% 16% 20% 12% - 21% - -
Never 240 151 28 51 8 - 240 - -13% 14% 14% 12% 15% - 13% - -
NETS
Net: Frequently 362 191 51 95 17 - 362 - -20% 18% 25% 22% 33% - 20% - -
Online fieldwork: 26th March - 15th April 2015 Prepared by ComRes Ltd
Page 119
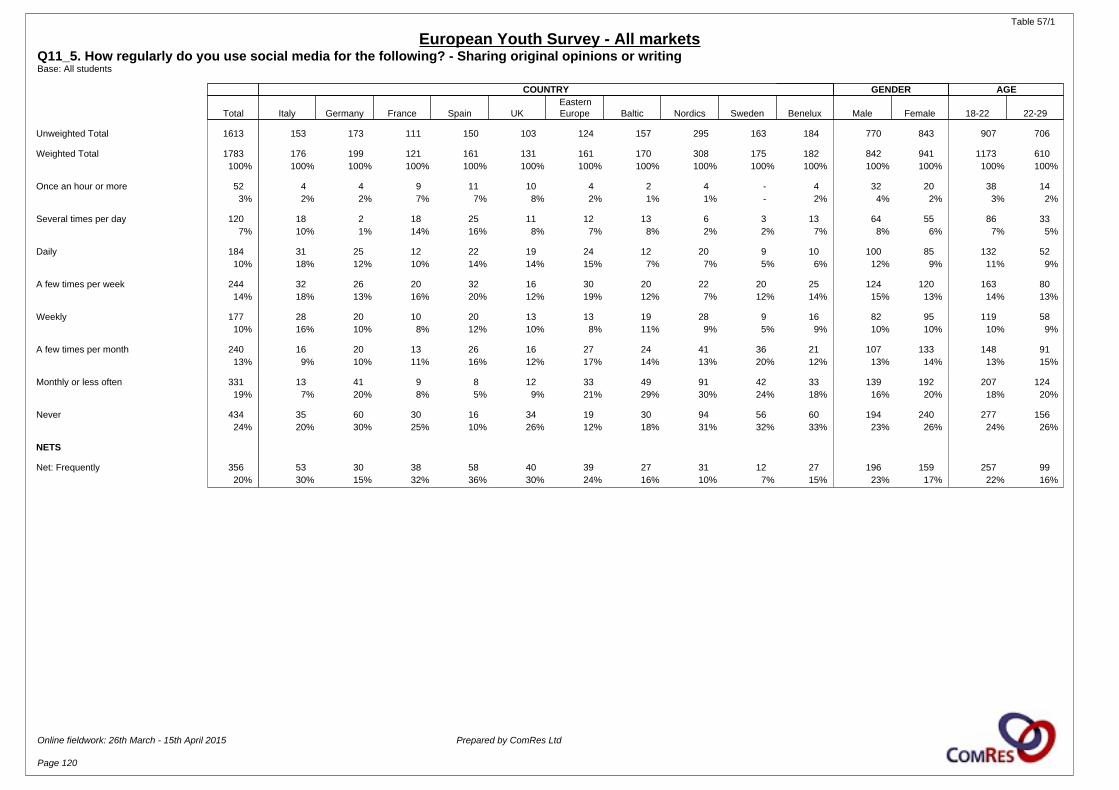
Table 57/1
European Youth Survey - All marketsQ11_5. How regularly do you use social media for the following? - Sharing original opinions or writingBase: All students
COUNTRY GENDER AGE
Total Italy Germany France Spain UKEasternEurope Baltic Nordics Sweden Benelux Male Female 18-22 22-29
Unweighted Total 1613 153 173 111 150 103 124 157 295 163 184 770 843 907 706
Weighted Total 1783 176 199 121 161 131 161 170 308 175 182 842 941 1173 610100% 100% 100% 100% 100% 100% 100% 100% 100% 100% 100% 100% 100% 100% 100%
Once an hour or more 52 4 4 9 11 10 4 2 4 - 4 32 20 38 143% 2% 2% 7% 7% 8% 2% 1% 1% - 2% 4% 2% 3% 2%
Several times per day 120 18 2 18 25 11 12 13 6 3 13 64 55 86 337% 10% 1% 14% 16% 8% 7% 8% 2% 2% 7% 8% 6% 7% 5%
Daily 184 31 25 12 22 19 24 12 20 9 10 100 85 132 5210% 18% 12% 10% 14% 14% 15% 7% 7% 5% 6% 12% 9% 11% 9%
A few times per week 244 32 26 20 32 16 30 20 22 20 25 124 120 163 8014% 18% 13% 16% 20% 12% 19% 12% 7% 12% 14% 15% 13% 14% 13%
Weekly 177 28 20 10 20 13 13 19 28 9 16 82 95 119 5810% 16% 10% 8% 12% 10% 8% 11% 9% 5% 9% 10% 10% 10% 9%
A few times per month 240 16 20 13 26 16 27 24 41 36 21 107 133 148 9113% 9% 10% 11% 16% 12% 17% 14% 13% 20% 12% 13% 14% 13% 15%
Monthly or less often 331 13 41 9 8 12 33 49 91 42 33 139 192 207 12419% 7% 20% 8% 5% 9% 21% 29% 30% 24% 18% 16% 20% 18% 20%
Never 434 35 60 30 16 34 19 30 94 56 60 194 240 277 15624% 20% 30% 25% 10% 26% 12% 18% 31% 32% 33% 23% 26% 24% 26%
NETS
Net: Frequently 356 53 30 38 58 40 39 27 31 12 27 196 159 257 9920% 30% 15% 32% 36% 30% 24% 16% 10% 7% 15% 23% 17% 22% 16%
Online fieldwork: 26th March - 15th April 2015 Prepared by ComRes Ltd
Page 120

Table 57/2
European Youth Survey - All marketsQ11_5. How regularly do you use social media for the following? - Sharing original opinions or writingBase: All students
EDUCATION WORK STATUS
Total
Uppersecondary
or lessVocational
trainingUniversity
degreePostgraduate
degree Employees Students EntrepreneursNot
working
Unweighted Total 1613 894 182 451 59 - 1613 - -
Weighted Total 1783 1062 203 437 52 - 1783 - -100% 100% 100% 100% 100% - 100% - -
Once an hour or more 52 24 4 16 5 - 52 - -3% 2% 2% 4% 9% - 3% - -
Several times per day 120 60 18 34 4 - 120 - -7% 6% 9% 8% 8% - 7% - -
Daily 184 102 22 51 9 - 184 - -10% 10% 11% 12% 17% - 10% - -
A few times per week 244 147 23 63 7 - 244 - -14% 14% 11% 14% 13% - 14% - -
Weekly 177 108 17 44 7 - 177 - -10% 10% 8% 10% 13% - 10% - -
A few times per month 240 129 37 66 3 - 240 - -13% 12% 18% 15% 6% - 13% - -
Monthly or less often 331 219 31 69 6 - 331 - -19% 21% 15% 16% 11% - 19% - -
Never 434 271 49 94 12 - 434 - -24% 26% 24% 22% 23% - 24% - -
NETS
Net: Frequently 356 187 45 101 18 - 356 - -20% 18% 22% 23% 34% - 20% - -
Online fieldwork: 26th March - 15th April 2015 Prepared by ComRes Ltd
Page 121

Table 58/1
European Youth Survey - All marketsQ11_6. How regularly do you use social media for the following? - Reading news and opinions relevant to your studiesBase: All students
COUNTRY GENDER AGE
Total Italy Germany France Spain UKEasternEurope Baltic Nordics Sweden Benelux Male Female 18-22 22-29
Unweighted Total 1613 153 173 111 150 103 124 157 295 163 184 770 843 907 706
Weighted Total 1783 176 199 121 161 131 161 170 308 175 182 842 941 1173 610100% 100% 100% 100% 100% 100% 100% 100% 100% 100% 100% 100% 100% 100% 100%
Once an hour or more 61 3 4 12 13 4 13 4 1 - 7 35 26 46 143% 1% 2% 10% 8% 3% 8% 2% * - 4% 4% 3% 4% 2%
Several times per day 188 30 12 13 26 15 20 25 21 8 18 91 98 117 7211% 17% 6% 11% 16% 11% 13% 15% 7% 4% 10% 11% 10% 10% 12%
Daily 332 46 26 21 33 29 43 27 44 28 34 157 175 236 9519% 26% 13% 18% 20% 22% 27% 16% 14% 16% 19% 19% 19% 20% 16%
A few times per week 355 38 36 20 32 20 40 34 69 37 30 156 199 230 12520% 22% 18% 17% 20% 15% 25% 20% 22% 21% 16% 19% 21% 20% 21%
Weekly 200 19 28 12 18 13 11 23 40 17 20 96 104 135 6511% 11% 14% 10% 11% 10% 7% 14% 13% 10% 11% 11% 11% 12% 11%
A few times per month 217 15 17 11 19 16 17 22 46 33 22 106 112 135 8312% 8% 8% 9% 12% 12% 10% 13% 15% 19% 12% 13% 12% 11% 14%
Monthly or less often 164 6 25 6 8 10 3 21 42 22 22 73 91 106 589% 3% 12% 5% 5% 8% 2% 12% 14% 12% 12% 9% 10% 9% 10%
Never 263 20 51 25 12 24 14 14 45 30 29 128 136 167 9615% 11% 25% 21% 7% 19% 8% 8% 15% 17% 16% 15% 14% 14% 16%
NETS
Net: Frequently 581 79 42 46 71 48 77 56 66 36 60 282 298 399 18233% 45% 21% 38% 44% 37% 48% 33% 22% 20% 33% 34% 32% 34% 30%
Online fieldwork: 26th March - 15th April 2015 Prepared by ComRes Ltd
Page 122

Table 58/2
European Youth Survey - All marketsQ11_6. How regularly do you use social media for the following? - Reading news and opinions relevant to your studiesBase: All students
EDUCATION WORK STATUS
Total
Uppersecondary
or lessVocational
trainingUniversity
degreePostgraduate
degree Employees Students EntrepreneursNot
working
Unweighted Total 1613 894 182 451 59 - 1613 - -
Weighted Total 1783 1062 203 437 52 - 1783 - -100% 100% 100% 100% 100% - 100% - -
Once an hour or more 61 27 6 22 2 - 61 - -3% 2% 3% 5% 3% - 3% - -
Several times per day 188 101 18 56 9 - 188 - -11% 9% 9% 13% 17% - 11% - -
Daily 332 201 37 86 5 - 332 - -19% 19% 18% 20% 10% - 19% - -
A few times per week 355 208 38 91 9 - 355 - -20% 20% 19% 21% 17% - 20% - -
Weekly 200 131 14 46 9 - 200 - -11% 12% 7% 11% 16% - 11% - -
A few times per month 217 119 29 56 9 - 217 - -12% 11% 14% 13% 18% - 12% - -
Monthly or less often 164 98 27 34 3 - 164 - -9% 9% 14% 8% 6% - 9% - -
Never 263 176 34 45 6 - 263 - -15% 17% 17% 10% 12% - 15% - -
NETS
Net: Frequently 581 328 61 165 15 - 581 - -33% 31% 30% 38% 30% - 33% - -
Online fieldwork: 26th March - 15th April 2015 Prepared by ComRes Ltd
Page 123

Table 59/1
European Youth Survey - All marketsQ11_7. How regularly do you use social media for the following? - Reading news and opinions not relevant to your studiesBase: All students
COUNTRY GENDER AGE
Total Italy Germany France Spain UKEasternEurope Baltic Nordics Sweden Benelux Male Female 18-22 22-29
Unweighted Total 1613 153 173 111 150 103 124 157 295 163 184 770 843 907 706
Weighted Total 1783 176 199 121 161 131 161 170 308 175 182 842 941 1173 610100% 100% 100% 100% 100% 100% 100% 100% 100% 100% 100% 100% 100% 100% 100%
Once an hour or more 77 7 3 14 12 8 6 7 6 7 9 35 42 56 214% 4% 1% 11% 7% 6% 4% 4% 2% 4% 5% 4% 4% 5% 3%
Several times per day 386 50 47 21 39 26 35 53 51 29 35 184 202 255 13222% 28% 24% 17% 24% 20% 22% 31% 17% 16% 19% 22% 21% 22% 22%
Daily 437 34 35 17 43 34 51 29 105 51 40 198 239 285 15224% 19% 17% 14% 27% 26% 31% 17% 34% 29% 22% 24% 25% 24% 25%
A few times per week 333 38 43 23 26 21 33 33 58 25 32 151 182 216 11719% 21% 21% 19% 16% 16% 20% 20% 19% 15% 18% 18% 19% 18% 19%
Weekly 148 21 9 13 13 13 6 17 22 18 18 70 78 100 488% 12% 4% 10% 8% 10% 4% 10% 7% 10% 10% 8% 8% 9% 8%
A few times per month 135 12 17 9 9 5 18 9 22 16 17 56 79 88 478% 7% 9% 8% 6% 4% 11% 5% 7% 9% 9% 7% 8% 8% 8%
Monthly or less often 80 5 14 2 6 5 5 7 11 14 11 37 42 52 274% 3% 7% 2% 4% 4% 3% 4% 3% 8% 6% 4% 5% 4% 4%
Never 184 10 30 22 13 18 8 14 33 15 21 109 75 119 6510% 6% 15% 18% 8% 14% 5% 8% 11% 8% 12% 13% 8% 10% 11%
NETS
Net: Frequently 900 91 85 51 94 67 92 89 162 87 83 418 483 596 30550% 51% 42% 43% 58% 52% 57% 53% 53% 50% 46% 50% 51% 51% 50%
Online fieldwork: 26th March - 15th April 2015 Prepared by ComRes Ltd
Page 124

Table 59/2
European Youth Survey - All marketsQ11_7. How regularly do you use social media for the following? - Reading news and opinions not relevant to your studiesBase: All students
EDUCATION WORK STATUS
Total
Uppersecondary
or lessVocational
trainingUniversity
degreePostgraduate
degree Employees Students EntrepreneursNot
working
Unweighted Total 1613 894 182 451 59 - 1613 - -
Weighted Total 1783 1062 203 437 52 - 1783 - -100% 100% 100% 100% 100% - 100% - -
Once an hour or more 77 46 5 21 4 - 77 - -4% 4% 3% 5% 7% - 4% - -
Several times per day 386 226 35 98 17 - 386 - -22% 21% 17% 23% 33% - 22% - -
Daily 437 257 52 116 8 - 437 - -24% 24% 25% 26% 16% - 24% - -
A few times per week 333 209 27 86 7 - 333 - -19% 20% 13% 20% 13% - 19% - -
Weekly 148 85 14 40 5 - 148 - -8% 8% 7% 9% 9% - 8% - -
A few times per month 135 72 22 34 6 - 135 - -8% 7% 11% 8% 11% - 8% - -
Monthly or less often 80 48 14 17 1 - 80 - -4% 4% 7% 4% 3% - 4% - -
Never 184 118 33 26 5 - 184 - -10% 11% 16% 6% 9% - 10% - -
NETS
Net: Frequently 900 529 92 235 29 - 900 - -50% 50% 45% 54% 56% - 50% - -
Online fieldwork: 26th March - 15th April 2015 Prepared by ComRes Ltd
Page 125
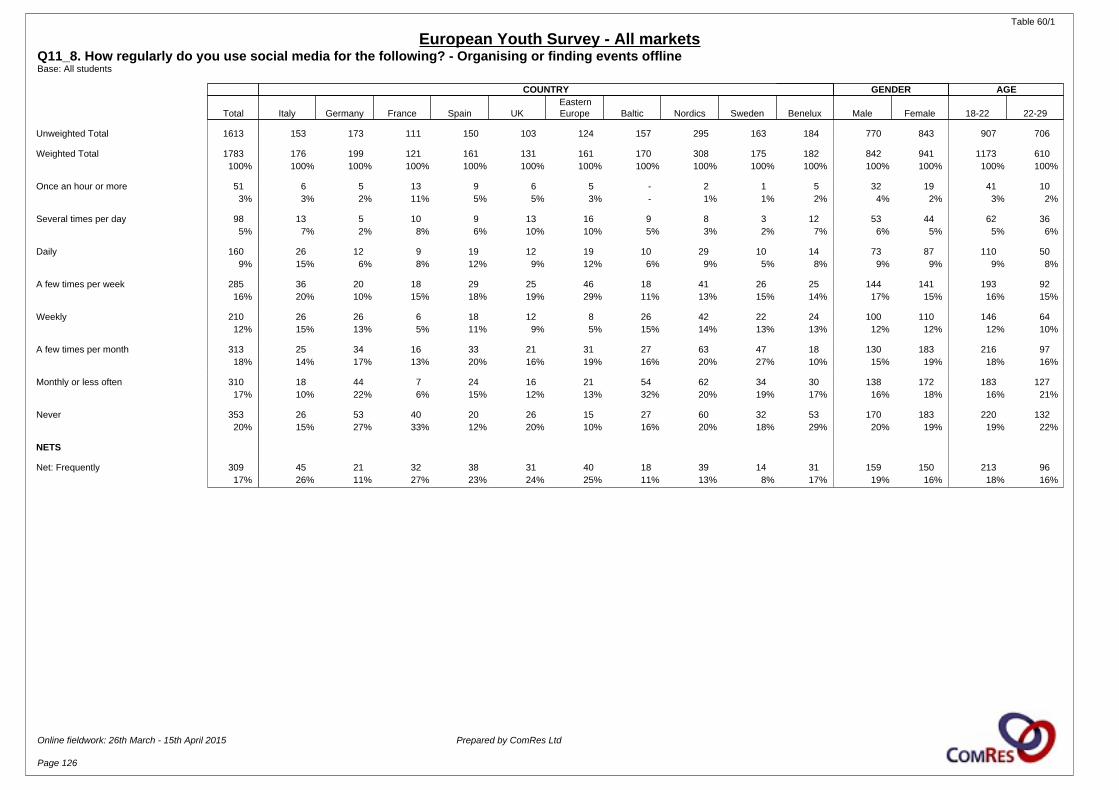
Table 60/1
European Youth Survey - All marketsQ11_8. How regularly do you use social media for the following? - Organising or finding events offlineBase: All students
COUNTRY GENDER AGE
Total Italy Germany France Spain UKEasternEurope Baltic Nordics Sweden Benelux Male Female 18-22 22-29
Unweighted Total 1613 153 173 111 150 103 124 157 295 163 184 770 843 907 706
Weighted Total 1783 176 199 121 161 131 161 170 308 175 182 842 941 1173 610100% 100% 100% 100% 100% 100% 100% 100% 100% 100% 100% 100% 100% 100% 100%
Once an hour or more 51 6 5 13 9 6 5 - 2 1 5 32 19 41 103% 3% 2% 11% 5% 5% 3% - 1% 1% 2% 4% 2% 3% 2%
Several times per day 98 13 5 10 9 13 16 9 8 3 12 53 44 62 365% 7% 2% 8% 6% 10% 10% 5% 3% 2% 7% 6% 5% 5% 6%
Daily 160 26 12 9 19 12 19 10 29 10 14 73 87 110 509% 15% 6% 8% 12% 9% 12% 6% 9% 5% 8% 9% 9% 9% 8%
A few times per week 285 36 20 18 29 25 46 18 41 26 25 144 141 193 9216% 20% 10% 15% 18% 19% 29% 11% 13% 15% 14% 17% 15% 16% 15%
Weekly 210 26 26 6 18 12 8 26 42 22 24 100 110 146 6412% 15% 13% 5% 11% 9% 5% 15% 14% 13% 13% 12% 12% 12% 10%
A few times per month 313 25 34 16 33 21 31 27 63 47 18 130 183 216 9718% 14% 17% 13% 20% 16% 19% 16% 20% 27% 10% 15% 19% 18% 16%
Monthly or less often 310 18 44 7 24 16 21 54 62 34 30 138 172 183 12717% 10% 22% 6% 15% 12% 13% 32% 20% 19% 17% 16% 18% 16% 21%
Never 353 26 53 40 20 26 15 27 60 32 53 170 183 220 13220% 15% 27% 33% 12% 20% 10% 16% 20% 18% 29% 20% 19% 19% 22%
NETS
Net: Frequently 309 45 21 32 38 31 40 18 39 14 31 159 150 213 9617% 26% 11% 27% 23% 24% 25% 11% 13% 8% 17% 19% 16% 18% 16%
Online fieldwork: 26th March - 15th April 2015 Prepared by ComRes Ltd
Page 126
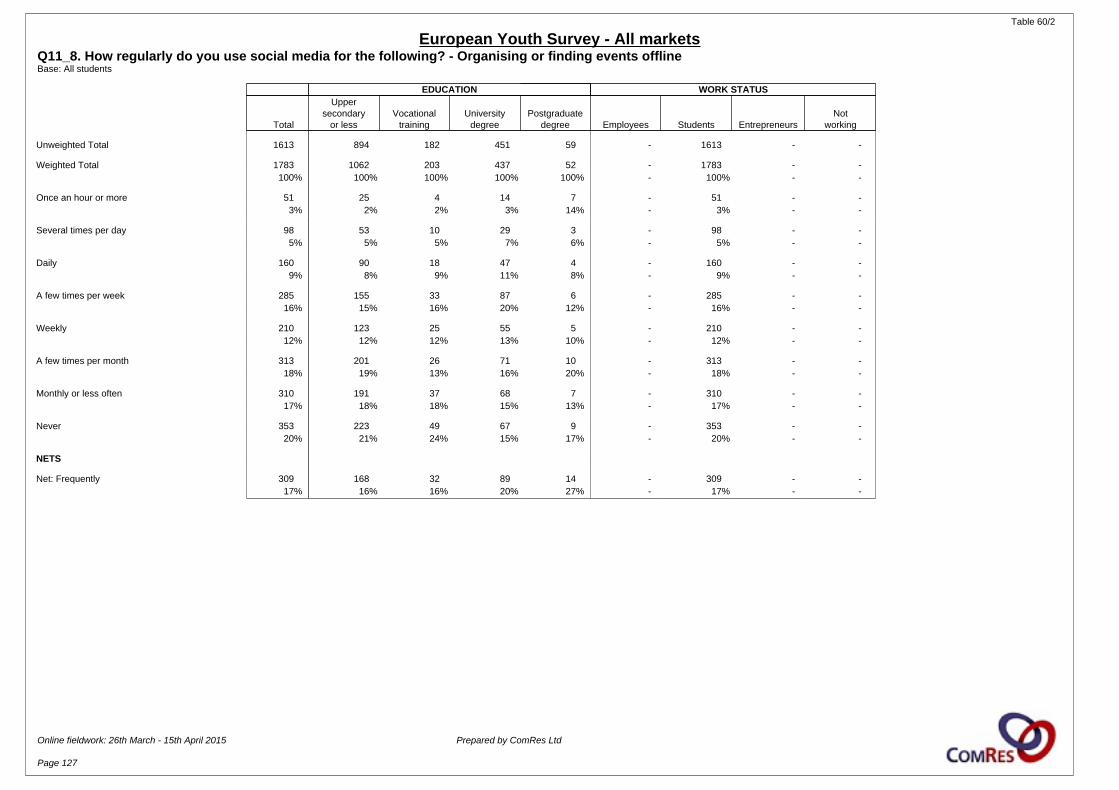
Table 60/2
European Youth Survey - All marketsQ11_8. How regularly do you use social media for the following? - Organising or finding events offlineBase: All students
EDUCATION WORK STATUS
Total
Uppersecondary
or lessVocational
trainingUniversity
degreePostgraduate
degree Employees Students EntrepreneursNot
working
Unweighted Total 1613 894 182 451 59 - 1613 - -
Weighted Total 1783 1062 203 437 52 - 1783 - -100% 100% 100% 100% 100% - 100% - -
Once an hour or more 51 25 4 14 7 - 51 - -3% 2% 2% 3% 14% - 3% - -
Several times per day 98 53 10 29 3 - 98 - -5% 5% 5% 7% 6% - 5% - -
Daily 160 90 18 47 4 - 160 - -9% 8% 9% 11% 8% - 9% - -
A few times per week 285 155 33 87 6 - 285 - -16% 15% 16% 20% 12% - 16% - -
Weekly 210 123 25 55 5 - 210 - -12% 12% 12% 13% 10% - 12% - -
A few times per month 313 201 26 71 10 - 313 - -18% 19% 13% 16% 20% - 18% - -
Monthly or less often 310 191 37 68 7 - 310 - -17% 18% 18% 15% 13% - 17% - -
Never 353 223 49 67 9 - 353 - -20% 21% 24% 15% 17% - 20% - -
NETS
Net: Frequently 309 168 32 89 14 - 309 - -17% 16% 16% 20% 27% - 17% - -
Online fieldwork: 26th March - 15th April 2015 Prepared by ComRes Ltd
Page 127
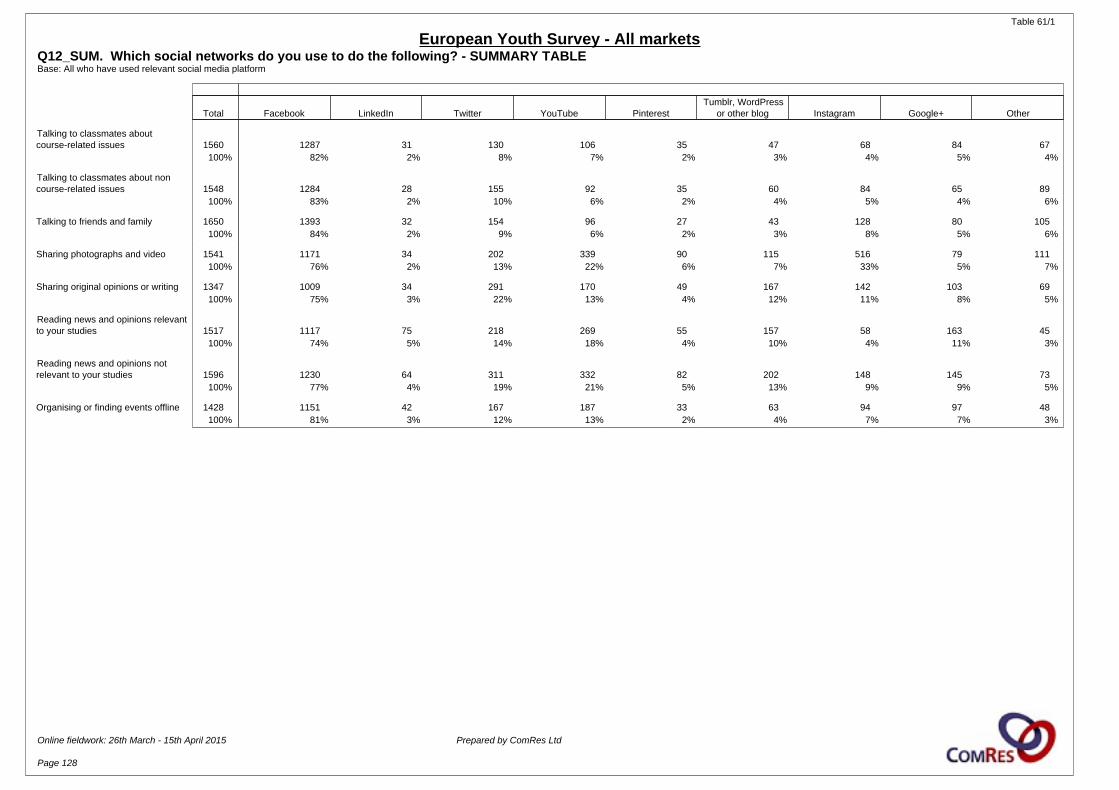
Table 61/1
European Youth Survey - All marketsQ12_SUM. Which social networks do you use to do the following? - SUMMARY TABLEBase: All who have used relevant social media platform
Total Facebook LinkedIn Twitter YouTube PinterestTumblr, WordPress
or other blog Instagram Google+ Other
Talking to classmates aboutcourse-related issues 1560 1287 31 130 106 35 47 68 84 67
100% 82% 2% 8% 7% 2% 3% 4% 5% 4%
Talking to classmates about noncourse-related issues 1548 1284 28 155 92 35 60 84 65 89
100% 83% 2% 10% 6% 2% 4% 5% 4% 6%
Talking to friends and family 1650 1393 32 154 96 27 43 128 80 105100% 84% 2% 9% 6% 2% 3% 8% 5% 6%
Sharing photographs and video 1541 1171 34 202 339 90 115 516 79 111100% 76% 2% 13% 22% 6% 7% 33% 5% 7%
Sharing original opinions or writing 1347 1009 34 291 170 49 167 142 103 69100% 75% 3% 22% 13% 4% 12% 11% 8% 5%
Reading news and opinions relevantto your studies 1517 1117 75 218 269 55 157 58 163 45
100% 74% 5% 14% 18% 4% 10% 4% 11% 3%
Reading news and opinions notrelevant to your studies 1596 1230 64 311 332 82 202 148 145 73
100% 77% 4% 19% 21% 5% 13% 9% 9% 5%
Organising or finding events offline 1428 1151 42 167 187 33 63 94 97 48100% 81% 3% 12% 13% 2% 4% 7% 7% 3%
Online fieldwork: 26th March - 15th April 2015 Prepared by ComRes Ltd
Page 128
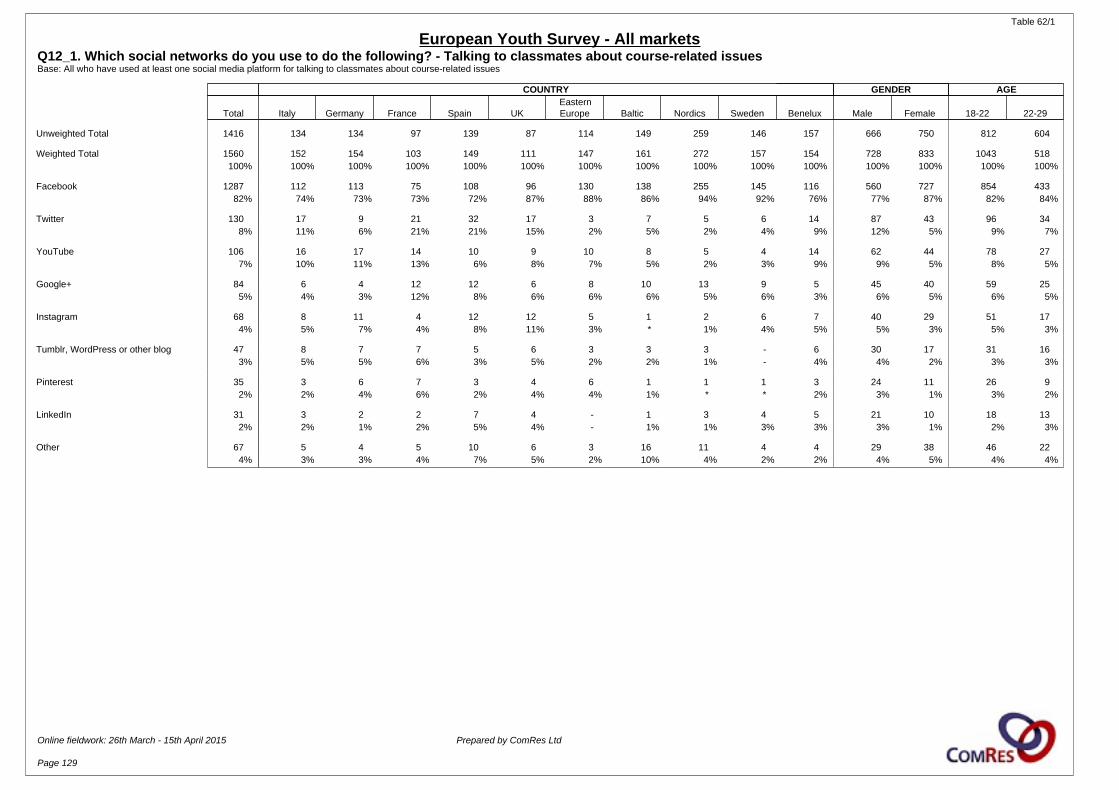
Table 62/1
European Youth Survey - All marketsQ12_1. Which social networks do you use to do the following? - Talking to classmates about course-related issuesBase: All who have used at least one social media platform for talking to classmates about course-related issues
COUNTRY GENDER AGE
Total Italy Germany France Spain UKEasternEurope Baltic Nordics Sweden Benelux Male Female 18-22 22-29
Unweighted Total 1416 134 134 97 139 87 114 149 259 146 157 666 750 812 604
Weighted Total 1560 152 154 103 149 111 147 161 272 157 154 728 833 1043 518100% 100% 100% 100% 100% 100% 100% 100% 100% 100% 100% 100% 100% 100% 100%
Facebook 1287 112 113 75 108 96 130 138 255 145 116 560 727 854 43382% 74% 73% 73% 72% 87% 88% 86% 94% 92% 76% 77% 87% 82% 84%
Twitter 130 17 9 21 32 17 3 7 5 6 14 87 43 96 348% 11% 6% 21% 21% 15% 2% 5% 2% 4% 9% 12% 5% 9% 7%
YouTube 106 16 17 14 10 9 10 8 5 4 14 62 44 78 277% 10% 11% 13% 6% 8% 7% 5% 2% 3% 9% 9% 5% 8% 5%
Google+ 84 6 4 12 12 6 8 10 13 9 5 45 40 59 255% 4% 3% 12% 8% 6% 6% 6% 5% 6% 3% 6% 5% 6% 5%
Instagram 68 8 11 4 12 12 5 1 2 6 7 40 29 51 174% 5% 7% 4% 8% 11% 3% * 1% 4% 5% 5% 3% 5% 3%
Tumblr, WordPress or other blog 47 8 7 7 5 6 3 3 3 - 6 30 17 31 163% 5% 5% 6% 3% 5% 2% 2% 1% - 4% 4% 2% 3% 3%
Pinterest 35 3 6 7 3 4 6 1 1 1 3 24 11 26 92% 2% 4% 6% 2% 4% 4% 1% * * 2% 3% 1% 3% 2%
LinkedIn 31 3 2 2 7 4 - 1 3 4 5 21 10 18 132% 2% 1% 2% 5% 4% - 1% 1% 3% 3% 3% 1% 2% 3%
Other 67 5 4 5 10 6 3 16 11 4 4 29 38 46 224% 3% 3% 4% 7% 5% 2% 10% 4% 2% 2% 4% 5% 4% 4%
Online fieldwork: 26th March - 15th April 2015 Prepared by ComRes Ltd
Page 129

Table 62/2
European Youth Survey - All marketsQ12_1. Which social networks do you use to do the following? - Talking to classmates about course-related issuesBase: All who have used at least one social media platform for talking to classmates about course-related issues
EDUCATION WORK STATUS
Total
Uppersecondary
or lessVocational
trainingUniversity
degreePostgraduate
degree Employees Students EntrepreneursNot
working
Unweighted Total 1416 779 150 412 49 - 1416 - -
Weighted Total 1560 925 166 399 44 - 1560 - -100% 100% 100% 100% 100% - 100% - -
Facebook 1287 777 129 328 31 - 1287 - -82% 84% 78% 82% 72% - 82% - -
Twitter 130 70 15 38 6 - 130 - -8% 8% 9% 10% 14% - 8% - -
YouTube 106 47 16 33 4 - 106 - -7% 5% 10% 8% 9% - 7% - -
Google+ 84 60 9 15 - - 84 - -5% 6% 5% 4% - - 5% - -
Instagram 68 35 11 18 3 - 68 - -4% 4% 6% 5% 7% - 4% - -
Tumblr, WordPress or other blog 47 16 11 15 3 - 47 - -3% 2% 7% 4% 7% - 3% - -
Pinterest 35 20 7 6 3 - 35 - -2% 2% 4% 2% 7% - 2% - -
LinkedIn 31 13 5 10 3 - 31 - -2% 1% 3% 3% 7% - 2% - -
Other 67 42 5 15 2 - 67 - -4% 5% 3% 4% 5% - 4% - -
Online fieldwork: 26th March - 15th April 2015 Prepared by ComRes Ltd
Page 130

Table 63/1
European Youth Survey - All marketsQ12_2. Which social networks do you use to do the following? - Talking to classmates about non course-related issuesBase: All who have used at least one social media platform for talking to classmates about non course-related issues
COUNTRY GENDER AGE
Total Italy Germany France Spain UKEasternEurope Baltic Nordics Sweden Benelux Male Female 18-22 22-29
Unweighted Total 1402 129 137 96 135 86 115 145 259 145 155 663 739 804 598
Weighted Total 1548 147 159 104 144 109 148 158 271 156 153 727 821 1035 513100% 100% 100% 100% 100% 100% 100% 100% 100% 100% 100% 100% 100% 100% 100%
Facebook 1284 113 111 79 105 88 133 140 257 138 119 566 718 851 43383% 77% 70% 76% 73% 81% 90% 89% 95% 89% 78% 78% 87% 82% 84%
Twitter 155 12 12 19 44 23 7 10 5 13 10 103 52 117 3810% 8% 7% 18% 31% 21% 5% 6% 2% 8% 6% 14% 6% 11% 7%
YouTube 92 15 22 11 14 5 7 3 6 2 8 49 43 77 156% 10% 14% 11% 10% 4% 5% 2% 2% 1% 5% 7% 5% 7% 3%
Instagram 84 3 7 7 16 9 3 3 15 15 6 32 53 62 225% 2% 5% 7% 11% 8% 2% 2% 5% 9% 4% 4% 6% 6% 4%
Google+ 65 7 4 12 8 7 6 9 3 2 7 46 19 45 214% 5% 3% 11% 5% 7% 4% 6% 1% 1% 5% 6% 2% 4% 4%
Tumblr, WordPress or other blog 60 8 7 9 6 8 6 3 6 3 5 37 23 38 224% 5% 5% 9% 4% 7% 4% 2% 2% 2% 3% 5% 3% 4% 4%
Pinterest 35 4 6 4 7 5 1 1 2 2 4 19 17 23 122% 3% 3% 4% 5% 5% 1% 1% 1% 1% 3% 3% 2% 2% 2%
LinkedIn 28 7 1 3 3 3 2 1 2 2 3 15 13 14 142% 5% 1% 3% 2% 3% 1% 1% 1% 1% 2% 2% 2% 1% 3%
Other 89 4 4 5 6 7 7 18 24 7 7 31 59 64 256% 3% 3% 5% 4% 6% 5% 12% 9% 4% 5% 4% 7% 6% 5%
Online fieldwork: 26th March - 15th April 2015 Prepared by ComRes Ltd
Page 131
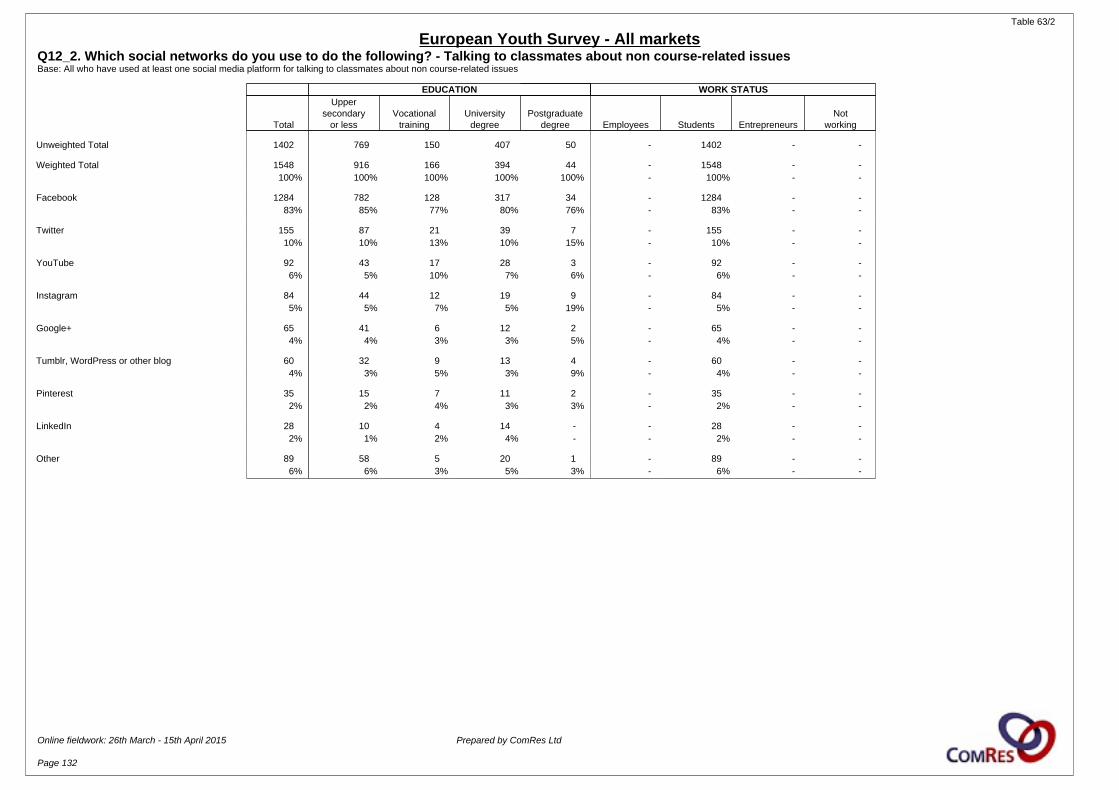
Table 63/2
European Youth Survey - All marketsQ12_2. Which social networks do you use to do the following? - Talking to classmates about non course-related issuesBase: All who have used at least one social media platform for talking to classmates about non course-related issues
EDUCATION WORK STATUS
Total
Uppersecondary
or lessVocational
trainingUniversity
degreePostgraduate
degree Employees Students EntrepreneursNot
working
Unweighted Total 1402 769 150 407 50 - 1402 - -
Weighted Total 1548 916 166 394 44 - 1548 - -100% 100% 100% 100% 100% - 100% - -
Facebook 1284 782 128 317 34 - 1284 - -83% 85% 77% 80% 76% - 83% - -
Twitter 155 87 21 39 7 - 155 - -10% 10% 13% 10% 15% - 10% - -
YouTube 92 43 17 28 3 - 92 - -6% 5% 10% 7% 6% - 6% - -
Instagram 84 44 12 19 9 - 84 - -5% 5% 7% 5% 19% - 5% - -
Google+ 65 41 6 12 2 - 65 - -4% 4% 3% 3% 5% - 4% - -
Tumblr, WordPress or other blog 60 32 9 13 4 - 60 - -4% 3% 5% 3% 9% - 4% - -
Pinterest 35 15 7 11 2 - 35 - -2% 2% 4% 3% 3% - 2% - -
LinkedIn 28 10 4 14 - - 28 - -2% 1% 2% 4% - - 2% - -
Other 89 58 5 20 1 - 89 - -6% 6% 3% 5% 3% - 6% - -
Online fieldwork: 26th March - 15th April 2015 Prepared by ComRes Ltd
Page 132

Table 64/1
European Youth Survey - All marketsQ12_3. Which social networks do you use to do the following? - Talking to friends and familyBase: All who have used at least one social media platform for talking to friends and family
COUNTRY GENDER AGE
Total Italy Germany France Spain UKEasternEurope Baltic Nordics Sweden Benelux Male Female 18-22 22-29
Unweighted Total 1495 136 154 97 142 96 120 151 271 154 174 695 800 847 648
Weighted Total 1650 155 178 105 152 121 156 164 283 165 171 761 888 1093 557100% 100% 100% 100% 100% 100% 100% 100% 100% 100% 100% 100% 100% 100% 100%
Facebook 1393 118 127 79 117 108 139 147 266 151 140 606 787 912 48184% 76% 72% 75% 77% 89% 89% 90% 94% 91% 82% 80% 89% 83% 86%
Twitter 154 16 12 20 41 24 3 10 6 8 15 87 67 104 509% 10% 7% 19% 27% 20% 2% 6% 2% 5% 9% 11% 8% 10% 9%
Instagram 128 13 7 8 15 20 4 6 21 22 11 65 63 95 328% 9% 4% 7% 10% 17% 3% 4% 7% 13% 7% 9% 7% 9% 6%
YouTube 96 14 24 11 10 11 8 1 5 4 9 63 33 73 236% 9% 13% 11% 6% 9% 5% * 2% 3% 5% 8% 4% 7% 4%
Google+ 80 12 7 11 10 9 8 10 4 3 6 45 34 61 195% 8% 4% 11% 7% 7% 5% 6% 1% 2% 3% 6% 4% 6% 3%
Tumblr, WordPress or other blog 43 7 7 4 4 4 1 5 6 2 3 19 24 23 203% 4% 4% 3% 3% 3% 1% 3% 2% 1% 2% 3% 3% 2% 4%
LinkedIn 32 7 3 8 5 3 1 1 1 - 3 21 11 17 162% 4% 2% 7% 4% 3% 1% 1% * - 2% 3% 1% 2% 3%
Pinterest 27 3 3 4 7 4 2 - - 1 2 15 12 17 102% 2% 2% 4% 5% 3% 2% - - 1% 1% 2% 1% 2% 2%
Other 105 3 6 4 10 10 4 17 27 13 10 34 71 68 376% 2% 4% 4% 7% 8% 2% 10% 10% 8% 6% 4% 8% 6% 7%
Online fieldwork: 26th March - 15th April 2015 Prepared by ComRes Ltd
Page 133
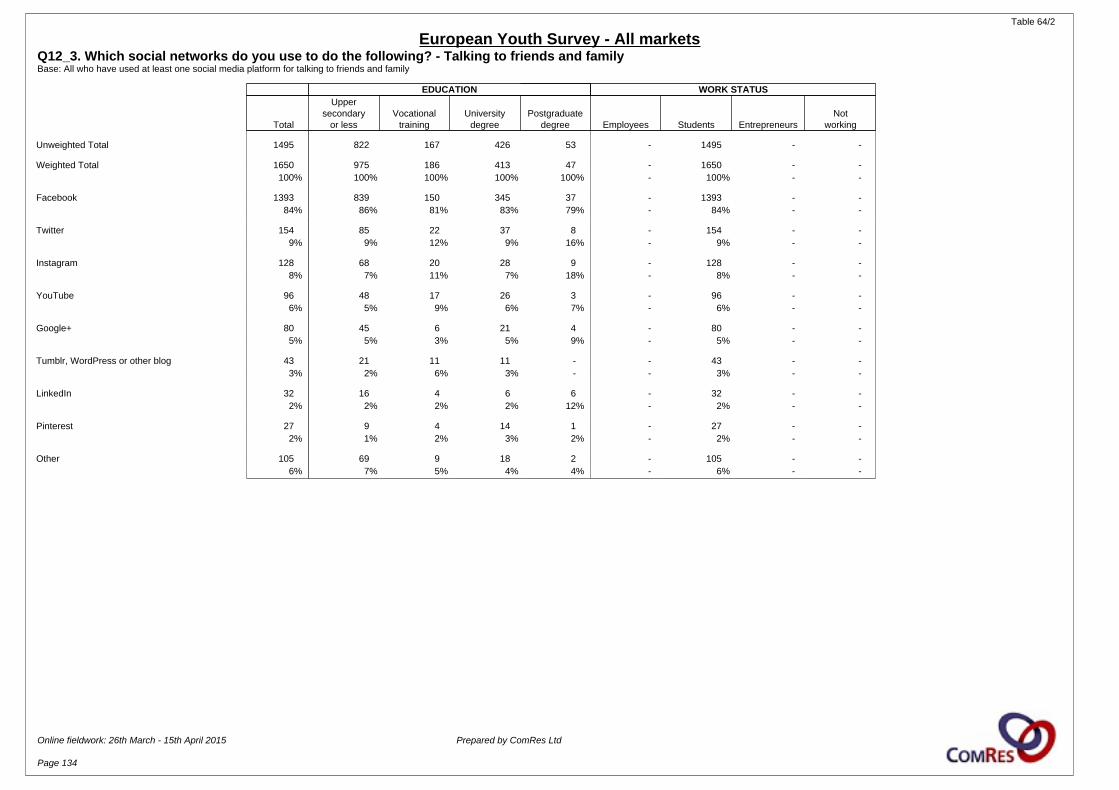
Table 64/2
European Youth Survey - All marketsQ12_3. Which social networks do you use to do the following? - Talking to friends and familyBase: All who have used at least one social media platform for talking to friends and family
EDUCATION WORK STATUS
Total
Uppersecondary
or lessVocational
trainingUniversity
degreePostgraduate
degree Employees Students EntrepreneursNot
working
Unweighted Total 1495 822 167 426 53 - 1495 - -
Weighted Total 1650 975 186 413 47 - 1650 - -100% 100% 100% 100% 100% - 100% - -
Facebook 1393 839 150 345 37 - 1393 - -84% 86% 81% 83% 79% - 84% - -
Twitter 154 85 22 37 8 - 154 - -9% 9% 12% 9% 16% - 9% - -
Instagram 128 68 20 28 9 - 128 - -8% 7% 11% 7% 18% - 8% - -
YouTube 96 48 17 26 3 - 96 - -6% 5% 9% 6% 7% - 6% - -
Google+ 80 45 6 21 4 - 80 - -5% 5% 3% 5% 9% - 5% - -
Tumblr, WordPress or other blog 43 21 11 11 - - 43 - -3% 2% 6% 3% - - 3% - -
LinkedIn 32 16 4 6 6 - 32 - -2% 2% 2% 2% 12% - 2% - -
Pinterest 27 9 4 14 1 - 27 - -2% 1% 2% 3% 2% - 2% - -
Other 105 69 9 18 2 - 105 - -6% 7% 5% 4% 4% - 6% - -
Online fieldwork: 26th March - 15th April 2015 Prepared by ComRes Ltd
Page 134

Table 65/1
European Youth Survey - All marketsQ12_4. Which social networks do you use to do the following? - Sharing photographs and videoBase: All who have used at least one social media platform for sharing photographs and video
COUNTRY GENDER AGE
Total Italy Germany France Spain UKEasternEurope Baltic Nordics Sweden Benelux Male Female 18-22 22-29
Unweighted Total 1396 134 139 91 139 90 115 144 244 140 160 642 754 793 603
Weighted Total 1541 152 161 99 148 113 150 156 256 149 156 701 839 1025 515100% 100% 100% 100% 100% 100% 100% 100% 100% 100% 100% 100% 100% 100% 100%
Facebook 1171 99 109 68 106 86 129 135 210 108 121 506 665 766 40576% 65% 68% 69% 72% 77% 86% 86% 82% 72% 77% 72% 79% 75% 79%
Instagram 516 30 37 24 55 50 12 51 106 92 58 184 331 374 14133% 19% 23% 24% 37% 44% 8% 33% 41% 62% 37% 26% 39% 37% 27%
YouTube 339 25 21 29 50 26 49 28 46 28 37 208 131 229 11022% 17% 13% 29% 34% 23% 32% 18% 18% 19% 23% 30% 16% 22% 21%
Twitter 202 18 8 20 49 27 5 23 13 21 18 108 94 146 5613% 12% 5% 21% 33% 24% 4% 15% 5% 14% 12% 15% 11% 14% 11%
Tumblr, WordPress or other blog 115 12 14 12 18 10 9 8 17 5 11 45 70 86 297% 8% 9% 12% 12% 9% 6% 5% 7% 3% 7% 6% 8% 8% 6%
Pinterest 90 12 3 6 10 9 5 9 9 9 18 32 57 55 356% 8% 2% 6% 7% 8% 3% 6% 3% 6% 11% 5% 7% 5% 7%
Google+ 79 3 2 11 10 9 20 7 3 4 11 49 30 64 155% 2% 1% 11% 6% 8% 13% 4% 1% 3% 7% 7% 4% 6% 3%
LinkedIn 34 3 1 5 4 5 5 1 2 1 6 22 12 22 122% 2% 1% 5% 3% 5% 3% * 1% 1% 4% 3% 1% 2% 2%
Other 111 5 6 6 9 11 6 17 31 12 7 40 71 74 377% 3% 4% 6% 6% 10% 4% 11% 12% 8% 5% 6% 8% 7% 7%
Online fieldwork: 26th March - 15th April 2015 Prepared by ComRes Ltd
Page 135
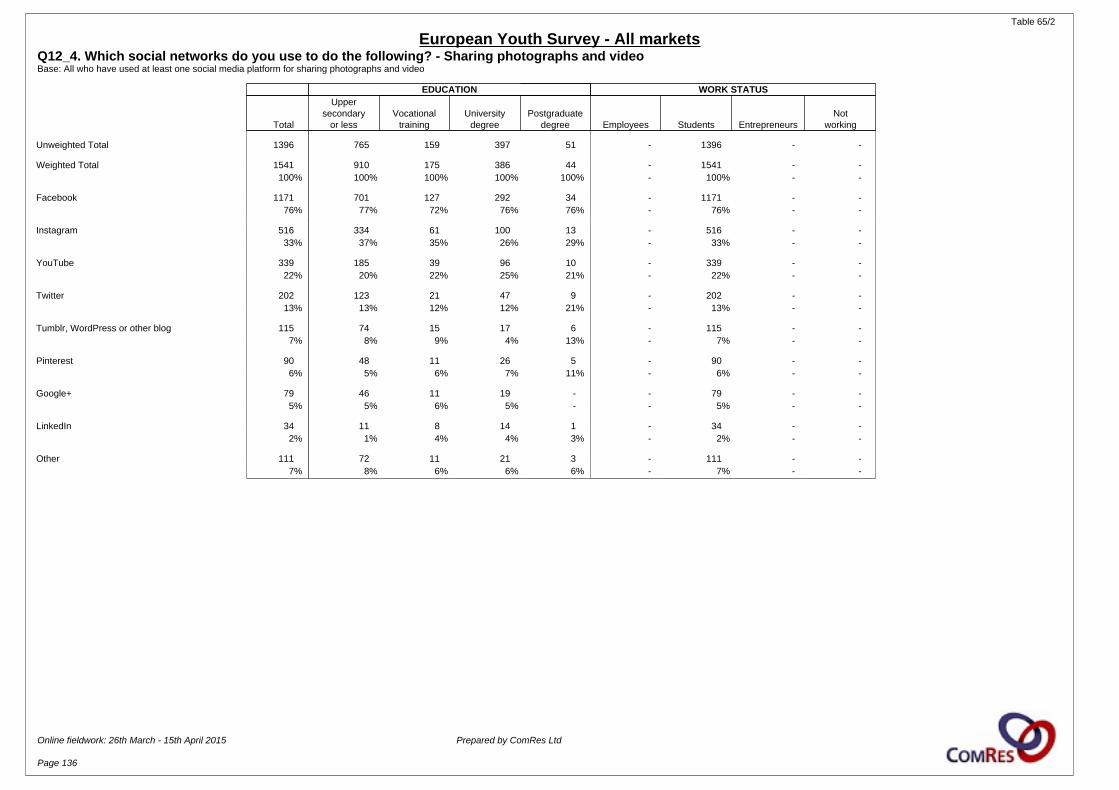
Table 65/2
European Youth Survey - All marketsQ12_4. Which social networks do you use to do the following? - Sharing photographs and videoBase: All who have used at least one social media platform for sharing photographs and video
EDUCATION WORK STATUS
Total
Uppersecondary
or lessVocational
trainingUniversity
degreePostgraduate
degree Employees Students EntrepreneursNot
working
Unweighted Total 1396 765 159 397 51 - 1396 - -
Weighted Total 1541 910 175 386 44 - 1541 - -100% 100% 100% 100% 100% - 100% - -
Facebook 1171 701 127 292 34 - 1171 - -76% 77% 72% 76% 76% - 76% - -
Instagram 516 334 61 100 13 - 516 - -33% 37% 35% 26% 29% - 33% - -
YouTube 339 185 39 96 10 - 339 - -22% 20% 22% 25% 21% - 22% - -
Twitter 202 123 21 47 9 - 202 - -13% 13% 12% 12% 21% - 13% - -
Tumblr, WordPress or other blog 115 74 15 17 6 - 115 - -7% 8% 9% 4% 13% - 7% - -
Pinterest 90 48 11 26 5 - 90 - -6% 5% 6% 7% 11% - 6% - -
Google+ 79 46 11 19 - - 79 - -5% 5% 6% 5% - - 5% - -
LinkedIn 34 11 8 14 1 - 34 - -2% 1% 4% 4% 3% - 2% - -
Other 111 72 11 21 3 - 111 - -7% 8% 6% 6% 6% - 7% - -
Online fieldwork: 26th March - 15th April 2015 Prepared by ComRes Ltd
Page 136
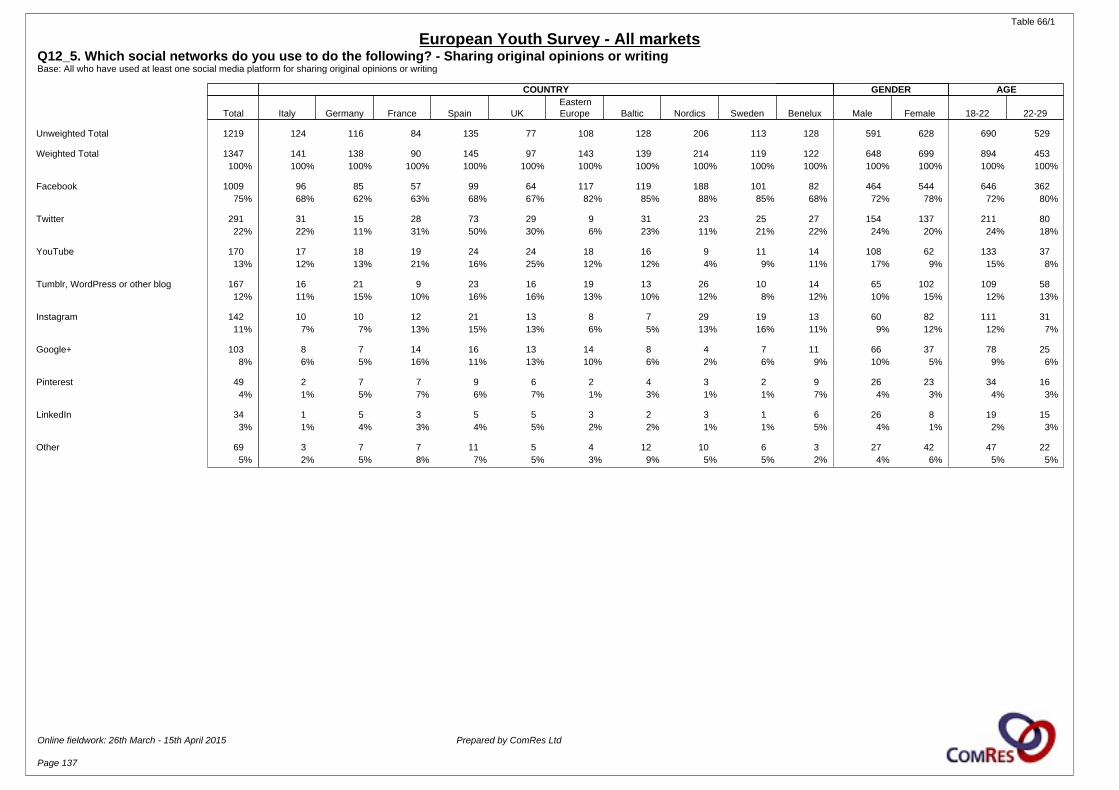
Table 66/1
European Youth Survey - All marketsQ12_5. Which social networks do you use to do the following? - Sharing original opinions or writingBase: All who have used at least one social media platform for sharing original opinions or writing
COUNTRY GENDER AGE
Total Italy Germany France Spain UKEasternEurope Baltic Nordics Sweden Benelux Male Female 18-22 22-29
Unweighted Total 1219 124 116 84 135 77 108 128 206 113 128 591 628 690 529
Weighted Total 1347 141 138 90 145 97 143 139 214 119 122 648 699 894 453100% 100% 100% 100% 100% 100% 100% 100% 100% 100% 100% 100% 100% 100% 100%
Facebook 1009 96 85 57 99 64 117 119 188 101 82 464 544 646 36275% 68% 62% 63% 68% 67% 82% 85% 88% 85% 68% 72% 78% 72% 80%
Twitter 291 31 15 28 73 29 9 31 23 25 27 154 137 211 8022% 22% 11% 31% 50% 30% 6% 23% 11% 21% 22% 24% 20% 24% 18%
YouTube 170 17 18 19 24 24 18 16 9 11 14 108 62 133 3713% 12% 13% 21% 16% 25% 12% 12% 4% 9% 11% 17% 9% 15% 8%
Tumblr, WordPress or other blog 167 16 21 9 23 16 19 13 26 10 14 65 102 109 5812% 11% 15% 10% 16% 16% 13% 10% 12% 8% 12% 10% 15% 12% 13%
Instagram 142 10 10 12 21 13 8 7 29 19 13 60 82 111 3111% 7% 7% 13% 15% 13% 6% 5% 13% 16% 11% 9% 12% 12% 7%
Google+ 103 8 7 14 16 13 14 8 4 7 11 66 37 78 258% 6% 5% 16% 11% 13% 10% 6% 2% 6% 9% 10% 5% 9% 6%
Pinterest 49 2 7 7 9 6 2 4 3 2 9 26 23 34 164% 1% 5% 7% 6% 7% 1% 3% 1% 1% 7% 4% 3% 4% 3%
LinkedIn 34 1 5 3 5 5 3 2 3 1 6 26 8 19 153% 1% 4% 3% 4% 5% 2% 2% 1% 1% 5% 4% 1% 2% 3%
Other 69 3 7 7 11 5 4 12 10 6 3 27 42 47 225% 2% 5% 8% 7% 5% 3% 9% 5% 5% 2% 4% 6% 5% 5%
Online fieldwork: 26th March - 15th April 2015 Prepared by ComRes Ltd
Page 137

Table 66/2
European Youth Survey - All marketsQ12_5. Which social networks do you use to do the following? - Sharing original opinions or writingBase: All who have used at least one social media platform for sharing original opinions or writing
EDUCATION WORK STATUS
Total
Uppersecondary
or lessVocational
trainingUniversity
degreePostgraduate
degree Employees Students EntrepreneursNot
working
Unweighted Total 1219 658 140 355 46 - 1219 - -
Weighted Total 1347 790 153 343 41 - 1347 - -100% 100% 100% 100% 100% - 100% - -
Facebook 1009 602 111 250 30 - 1009 - -75% 76% 72% 73% 74% - 75% - -
Twitter 291 161 34 81 11 - 291 - -22% 20% 22% 24% 28% - 22% - -
YouTube 170 90 25 49 2 - 170 - -13% 11% 16% 14% 4% - 13% - -
Tumblr, WordPress or other blog 167 100 21 36 6 - 167 - -12% 13% 14% 11% 14% - 12% - -
Instagram 142 87 17 34 3 - 142 - -11% 11% 11% 10% 7% - 11% - -
Google+ 103 58 12 24 4 - 103 - -8% 7% 8% 7% 9% - 8% - -
Pinterest 49 24 8 15 3 - 49 - -4% 3% 5% 4% 6% - 4% - -
LinkedIn 34 12 6 13 2 - 34 - -3% 2% 4% 4% 5% - 3% - -
Other 69 43 6 13 2 - 69 - -5% 6% 4% 4% 5% - 5% - -
Online fieldwork: 26th March - 15th April 2015 Prepared by ComRes Ltd
Page 138

Table 67/1
European Youth Survey - All marketsQ12_6. Which social networks do you use to do the following? - Reading news and opinions relevant to your studiesBase: All who have used at least one social media platform for reading news and opinions relevant to your studies
COUNTRY GENDER AGE
Total Italy Germany France Spain UKEasternEurope Baltic Nordics Sweden Benelux Male Female 18-22 22-29
Unweighted Total 1376 136 124 88 139 85 117 144 252 135 156 651 725 779 597
Weighted Total 1517 156 147 95 149 107 148 156 263 144 153 714 804 1005 513100% 100% 100% 100% 100% 100% 100% 100% 100% 100% 100% 100% 100% 100% 100%
Facebook 1117 115 97 54 93 76 125 116 224 106 112 507 610 722 39574% 74% 66% 57% 62% 71% 84% 75% 85% 73% 73% 71% 76% 72% 77%
YouTube 269 15 39 30 30 21 31 30 29 22 22 161 108 190 7918% 9% 27% 31% 20% 20% 21% 19% 11% 16% 14% 23% 13% 19% 15%
Twitter 218 19 11 20 55 29 10 16 24 15 18 133 85 149 6914% 12% 7% 21% 37% 27% 7% 10% 9% 11% 12% 19% 11% 15% 13%
Google+ 163 3 13 15 19 15 23 21 16 18 20 70 93 122 4111% 2% 9% 16% 13% 14% 15% 14% 6% 13% 13% 10% 12% 12% 8%
Tumblr, WordPress or other blog 157 14 13 11 23 10 23 20 14 12 17 74 83 113 4410% 9% 9% 12% 15% 9% 16% 13% 6% 8% 11% 10% 10% 11% 9%
LinkedIn 75 8 5 5 10 8 6 5 12 7 9 40 35 39 365% 5% 3% 5% 7% 8% 4% 3% 5% 5% 6% 6% 4% 4% 7%
Instagram 58 4 7 5 9 8 3 6 7 6 4 26 32 47 124% 3% 5% 5% 6% 7% 2% 4% 3% 4% 3% 4% 4% 5% 2%
Pinterest 55 1 7 8 6 7 4 8 4 2 8 25 30 35 194% * 5% 8% 4% 6% 3% 5% 2% 1% 5% 4% 4% 4% 4%
Other 45 3 6 4 8 3 3 9 6 3 1 14 31 35 103% 2% 4% 4% 5% 3% 2% 6% 2% 2% 1% 2% 4% 3% 2%
Online fieldwork: 26th March - 15th April 2015 Prepared by ComRes Ltd
Page 139
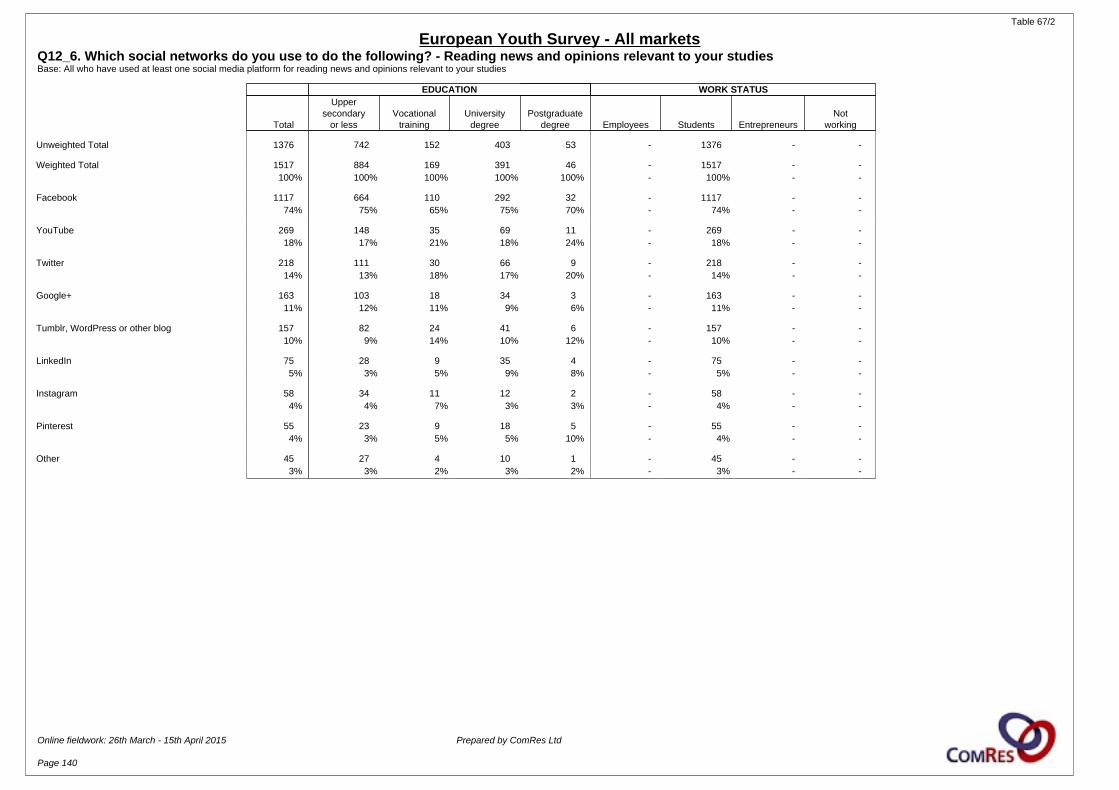
Table 67/2
European Youth Survey - All marketsQ12_6. Which social networks do you use to do the following? - Reading news and opinions relevant to your studiesBase: All who have used at least one social media platform for reading news and opinions relevant to your studies
EDUCATION WORK STATUS
Total
Uppersecondary
or lessVocational
trainingUniversity
degreePostgraduate
degree Employees Students EntrepreneursNot
working
Unweighted Total 1376 742 152 403 53 - 1376 - -
Weighted Total 1517 884 169 391 46 - 1517 - -100% 100% 100% 100% 100% - 100% - -
Facebook 1117 664 110 292 32 - 1117 - -74% 75% 65% 75% 70% - 74% - -
YouTube 269 148 35 69 11 - 269 - -18% 17% 21% 18% 24% - 18% - -
Twitter 218 111 30 66 9 - 218 - -14% 13% 18% 17% 20% - 14% - -
Google+ 163 103 18 34 3 - 163 - -11% 12% 11% 9% 6% - 11% - -
Tumblr, WordPress or other blog 157 82 24 41 6 - 157 - -10% 9% 14% 10% 12% - 10% - -
LinkedIn 75 28 9 35 4 - 75 - -5% 3% 5% 9% 8% - 5% - -
Instagram 58 34 11 12 2 - 58 - -4% 4% 7% 3% 3% - 4% - -
Pinterest 55 23 9 18 5 - 55 - -4% 3% 5% 5% 10% - 4% - -
Other 45 27 4 10 1 - 45 - -3% 3% 2% 3% 2% - 3% - -
Online fieldwork: 26th March - 15th April 2015 Prepared by ComRes Ltd
Page 140
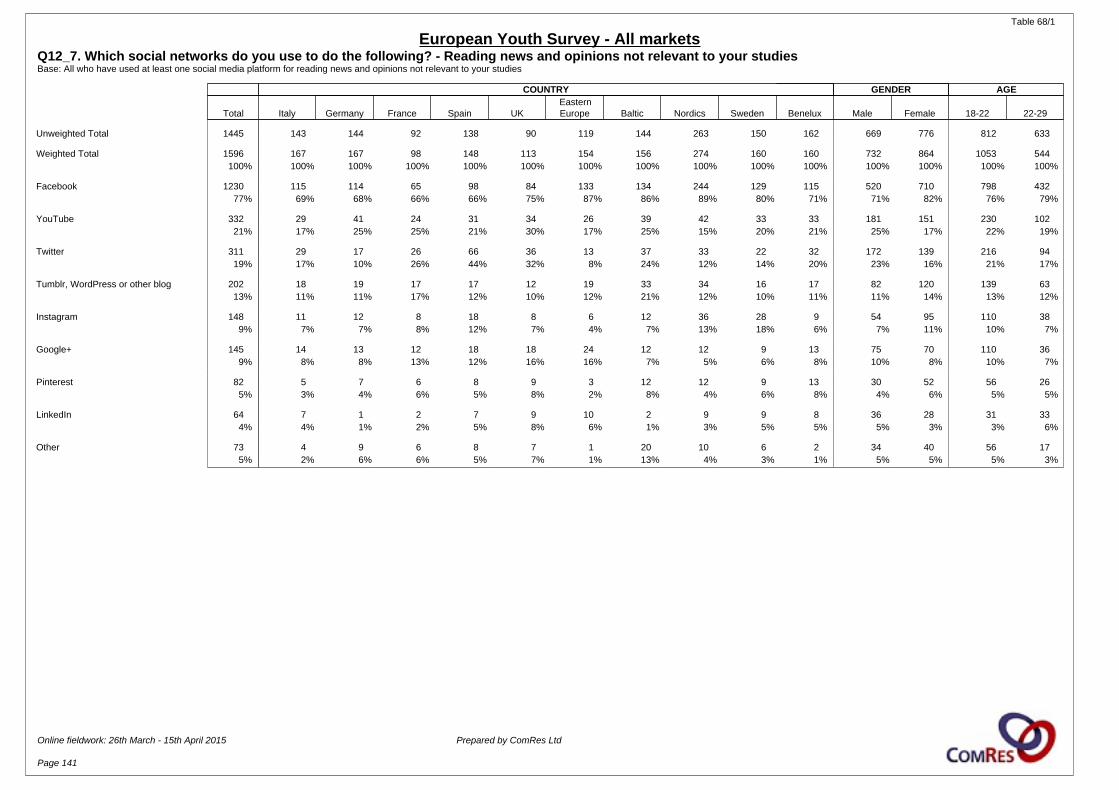
Table 68/1
European Youth Survey - All marketsQ12_7. Which social networks do you use to do the following? - Reading news and opinions not relevant to your studiesBase: All who have used at least one social media platform for reading news and opinions not relevant to your studies
COUNTRY GENDER AGE
Total Italy Germany France Spain UKEasternEurope Baltic Nordics Sweden Benelux Male Female 18-22 22-29
Unweighted Total 1445 143 144 92 138 90 119 144 263 150 162 669 776 812 633
Weighted Total 1596 167 167 98 148 113 154 156 274 160 160 732 864 1053 544100% 100% 100% 100% 100% 100% 100% 100% 100% 100% 100% 100% 100% 100% 100%
Facebook 1230 115 114 65 98 84 133 134 244 129 115 520 710 798 43277% 69% 68% 66% 66% 75% 87% 86% 89% 80% 71% 71% 82% 76% 79%
YouTube 332 29 41 24 31 34 26 39 42 33 33 181 151 230 10221% 17% 25% 25% 21% 30% 17% 25% 15% 20% 21% 25% 17% 22% 19%
Twitter 311 29 17 26 66 36 13 37 33 22 32 172 139 216 9419% 17% 10% 26% 44% 32% 8% 24% 12% 14% 20% 23% 16% 21% 17%
Tumblr, WordPress or other blog 202 18 19 17 17 12 19 33 34 16 17 82 120 139 6313% 11% 11% 17% 12% 10% 12% 21% 12% 10% 11% 11% 14% 13% 12%
Instagram 148 11 12 8 18 8 6 12 36 28 9 54 95 110 389% 7% 7% 8% 12% 7% 4% 7% 13% 18% 6% 7% 11% 10% 7%
Google+ 145 14 13 12 18 18 24 12 12 9 13 75 70 110 369% 8% 8% 13% 12% 16% 16% 7% 5% 6% 8% 10% 8% 10% 7%
Pinterest 82 5 7 6 8 9 3 12 12 9 13 30 52 56 265% 3% 4% 6% 5% 8% 2% 8% 4% 6% 8% 4% 6% 5% 5%
LinkedIn 64 7 1 2 7 9 10 2 9 9 8 36 28 31 334% 4% 1% 2% 5% 8% 6% 1% 3% 5% 5% 5% 3% 3% 6%
Other 73 4 9 6 8 7 1 20 10 6 2 34 40 56 175% 2% 6% 6% 5% 7% 1% 13% 4% 3% 1% 5% 5% 5% 3%
Online fieldwork: 26th March - 15th April 2015 Prepared by ComRes Ltd
Page 141
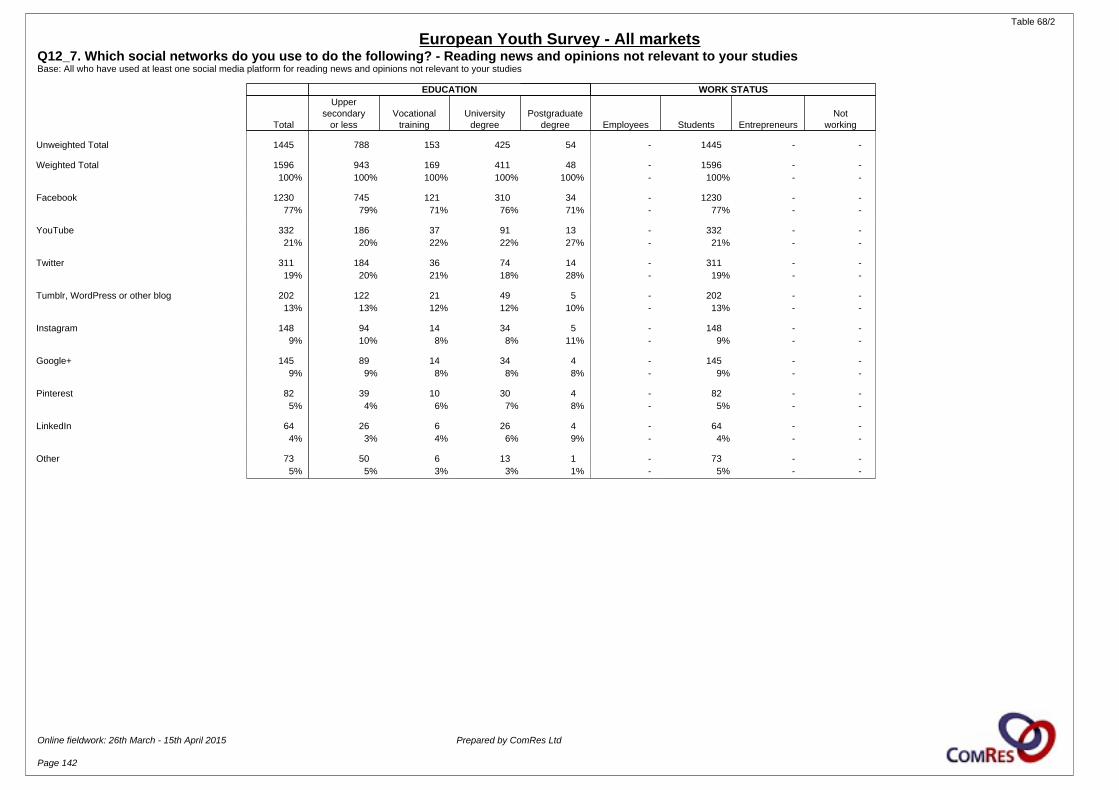
Table 68/2
European Youth Survey - All marketsQ12_7. Which social networks do you use to do the following? - Reading news and opinions not relevant to your studiesBase: All who have used at least one social media platform for reading news and opinions not relevant to your studies
EDUCATION WORK STATUS
Total
Uppersecondary
or lessVocational
trainingUniversity
degreePostgraduate
degree Employees Students EntrepreneursNot
working
Unweighted Total 1445 788 153 425 54 - 1445 - -
Weighted Total 1596 943 169 411 48 - 1596 - -100% 100% 100% 100% 100% - 100% - -
Facebook 1230 745 121 310 34 - 1230 - -77% 79% 71% 76% 71% - 77% - -
YouTube 332 186 37 91 13 - 332 - -21% 20% 22% 22% 27% - 21% - -
Twitter 311 184 36 74 14 - 311 - -19% 20% 21% 18% 28% - 19% - -
Tumblr, WordPress or other blog 202 122 21 49 5 - 202 - -13% 13% 12% 12% 10% - 13% - -
Instagram 148 94 14 34 5 - 148 - -9% 10% 8% 8% 11% - 9% - -
Google+ 145 89 14 34 4 - 145 - -9% 9% 8% 8% 8% - 9% - -
Pinterest 82 39 10 30 4 - 82 - -5% 4% 6% 7% 8% - 5% - -
LinkedIn 64 26 6 26 4 - 64 - -4% 3% 4% 6% 9% - 4% - -
Other 73 50 6 13 1 - 73 - -5% 5% 3% 3% 1% - 5% - -
Online fieldwork: 26th March - 15th April 2015 Prepared by ComRes Ltd
Page 142
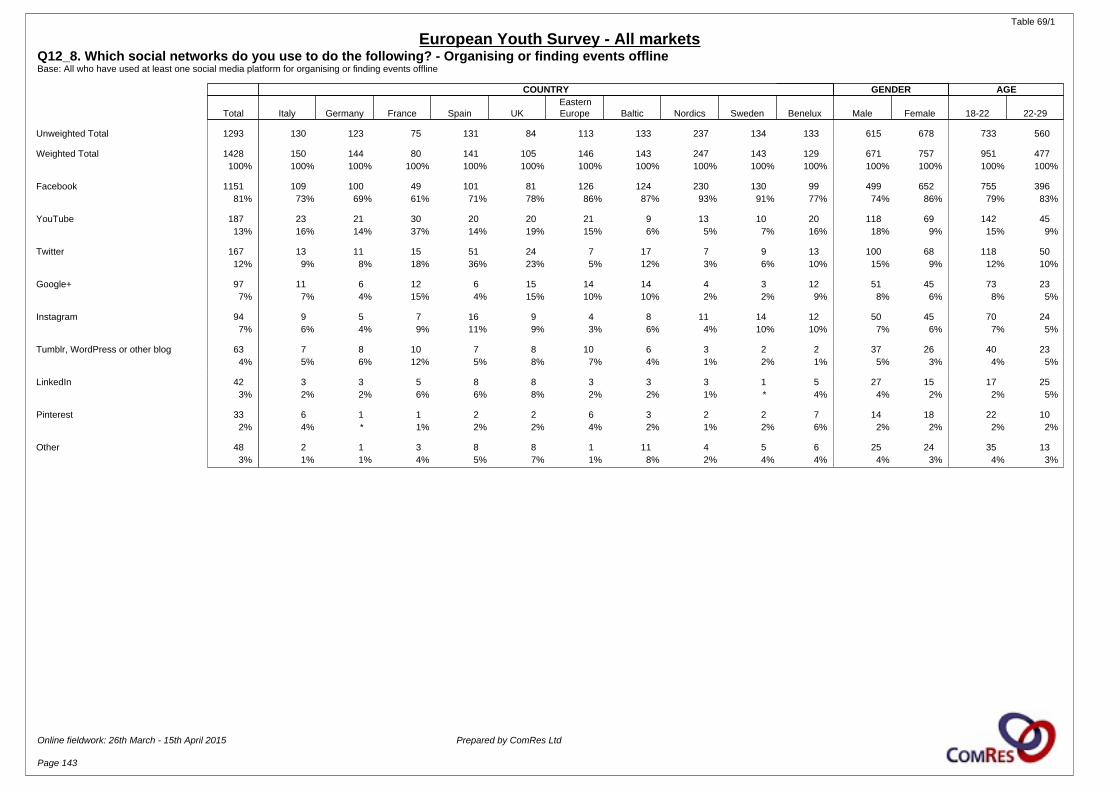
Table 69/1
European Youth Survey - All marketsQ12_8. Which social networks do you use to do the following? - Organising or finding events offlineBase: All who have used at least one social media platform for organising or finding events offline
COUNTRY GENDER AGE
Total Italy Germany France Spain UKEasternEurope Baltic Nordics Sweden Benelux Male Female 18-22 22-29
Unweighted Total 1293 130 123 75 131 84 113 133 237 134 133 615 678 733 560
Weighted Total 1428 150 144 80 141 105 146 143 247 143 129 671 757 951 477100% 100% 100% 100% 100% 100% 100% 100% 100% 100% 100% 100% 100% 100% 100%
Facebook 1151 109 100 49 101 81 126 124 230 130 99 499 652 755 39681% 73% 69% 61% 71% 78% 86% 87% 93% 91% 77% 74% 86% 79% 83%
YouTube 187 23 21 30 20 20 21 9 13 10 20 118 69 142 4513% 16% 14% 37% 14% 19% 15% 6% 5% 7% 16% 18% 9% 15% 9%
Twitter 167 13 11 15 51 24 7 17 7 9 13 100 68 118 5012% 9% 8% 18% 36% 23% 5% 12% 3% 6% 10% 15% 9% 12% 10%
Google+ 97 11 6 12 6 15 14 14 4 3 12 51 45 73 237% 7% 4% 15% 4% 15% 10% 10% 2% 2% 9% 8% 6% 8% 5%
Instagram 94 9 5 7 16 9 4 8 11 14 12 50 45 70 247% 6% 4% 9% 11% 9% 3% 6% 4% 10% 10% 7% 6% 7% 5%
Tumblr, WordPress or other blog 63 7 8 10 7 8 10 6 3 2 2 37 26 40 234% 5% 6% 12% 5% 8% 7% 4% 1% 2% 1% 5% 3% 4% 5%
LinkedIn 42 3 3 5 8 8 3 3 3 1 5 27 15 17 253% 2% 2% 6% 6% 8% 2% 2% 1% * 4% 4% 2% 2% 5%
Pinterest 33 6 1 1 2 2 6 3 2 2 7 14 18 22 102% 4% * 1% 2% 2% 4% 2% 1% 2% 6% 2% 2% 2% 2%
Other 48 2 1 3 8 8 1 11 4 5 6 25 24 35 133% 1% 1% 4% 5% 7% 1% 8% 2% 4% 4% 4% 3% 4% 3%
Online fieldwork: 26th March - 15th April 2015 Prepared by ComRes Ltd
Page 143
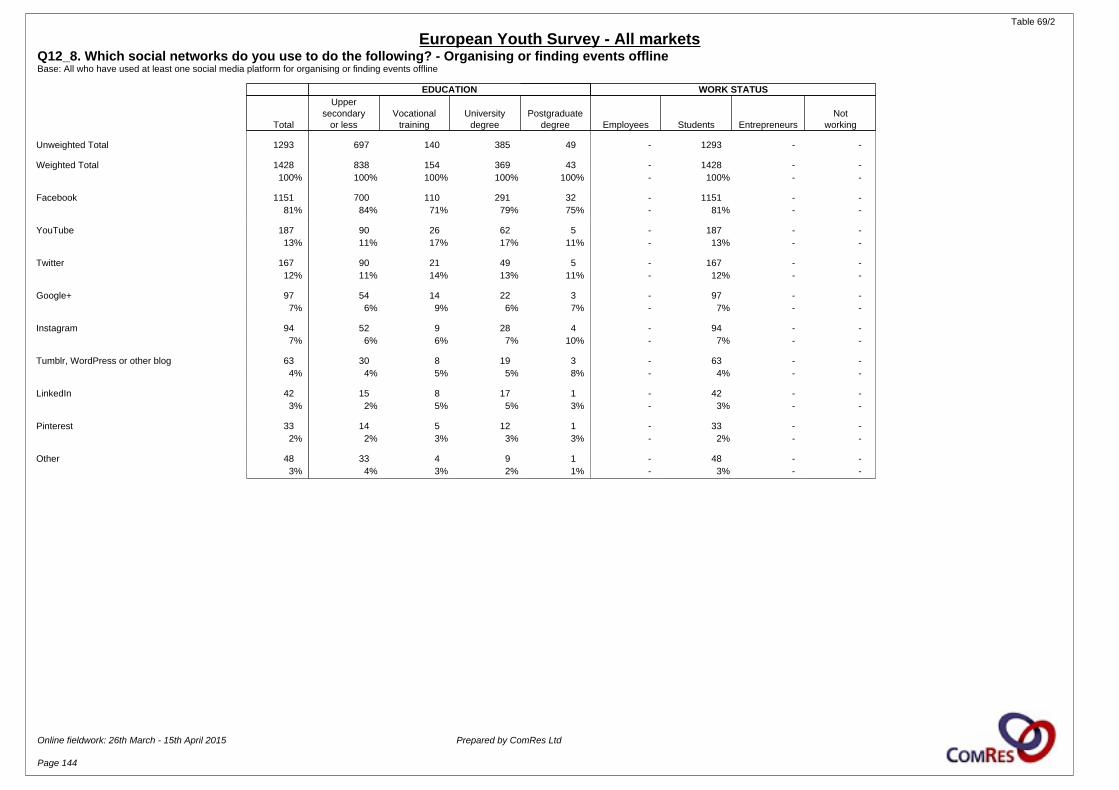
Table 69/2
European Youth Survey - All marketsQ12_8. Which social networks do you use to do the following? - Organising or finding events offlineBase: All who have used at least one social media platform for organising or finding events offline
EDUCATION WORK STATUS
Total
Uppersecondary
or lessVocational
trainingUniversity
degreePostgraduate
degree Employees Students EntrepreneursNot
working
Unweighted Total 1293 697 140 385 49 - 1293 - -
Weighted Total 1428 838 154 369 43 - 1428 - -100% 100% 100% 100% 100% - 100% - -
Facebook 1151 700 110 291 32 - 1151 - -81% 84% 71% 79% 75% - 81% - -
YouTube 187 90 26 62 5 - 187 - -13% 11% 17% 17% 11% - 13% - -
Twitter 167 90 21 49 5 - 167 - -12% 11% 14% 13% 11% - 12% - -
Google+ 97 54 14 22 3 - 97 - -7% 6% 9% 6% 7% - 7% - -
Instagram 94 52 9 28 4 - 94 - -7% 6% 6% 7% 10% - 7% - -
Tumblr, WordPress or other blog 63 30 8 19 3 - 63 - -4% 4% 5% 5% 8% - 4% - -
LinkedIn 42 15 8 17 1 - 42 - -3% 2% 5% 5% 3% - 3% - -
Pinterest 33 14 5 12 1 - 33 - -2% 2% 3% 3% 3% - 2% - -
Other 48 33 4 9 1 - 48 - -3% 4% 3% 2% 1% - 3% - -
Online fieldwork: 26th March - 15th April 2015 Prepared by ComRes Ltd
Page 144
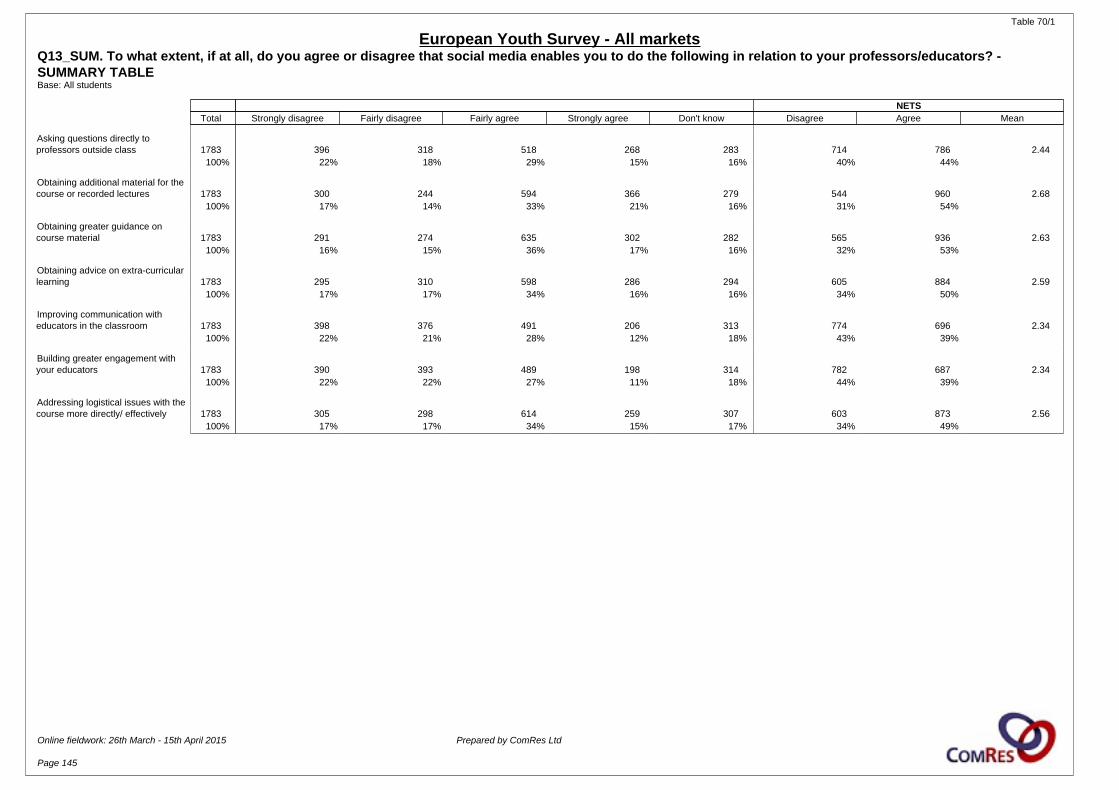
Table 70/1
European Youth Survey - All marketsQ13_SUM. To what extent, if at all, do you agree or disagree that social media enables you to do the following in relation to your professors/educators? - SUMMARY TABLEBase: All students
NETS Total Strongly disagree Fairly disagree Fairly agree Strongly agree Don't know Disagree Agree Mean
Asking questions directly toprofessors outside class 1783 396 318 518 268 283 714 786 2.44
100% 22% 18% 29% 15% 16% 40% 44%
Obtaining additional material for thecourse or recorded lectures 1783 300 244 594 366 279 544 960 2.68
100% 17% 14% 33% 21% 16% 31% 54%
Obtaining greater guidance oncourse material 1783 291 274 635 302 282 565 936 2.63
100% 16% 15% 36% 17% 16% 32% 53%
Obtaining advice on extra-curricularlearning 1783 295 310 598 286 294 605 884 2.59
100% 17% 17% 34% 16% 16% 34% 50%
Improving communication witheducators in the classroom 1783 398 376 491 206 313 774 696 2.34
100% 22% 21% 28% 12% 18% 43% 39%
Building greater engagement withyour educators 1783 390 393 489 198 314 782 687 2.34
100% 22% 22% 27% 11% 18% 44% 39%
Addressing logistical issues with thecourse more directly/ effectively 1783 305 298 614 259 307 603 873 2.56
100% 17% 17% 34% 15% 17% 34% 49%
Online fieldwork: 26th March - 15th April 2015 Prepared by ComRes Ltd
Page 145

Table 71/1
European Youth Survey - All marketsQ13_1. To what extent, if at all, do you agree or disagree that social media enables you to do the following in relation to your professors/educators? - Asking questions directly to professors outside classBase: All students
COUNTRY GENDER AGE
Total Italy Germany France Spain UKEasternEurope Baltic Nordics Sweden Benelux Male Female 18-22 22-29
Unweighted Total 1613 153 173 111 150 103 124 157 295 163 184 770 843 907 706
Weighted Total 1783 176 199 121 161 131 161 170 308 175 182 842 941 1173 610100% 100% 100% 100% 100% 100% 100% 100% 100% 100% 100% 100% 100% 100% 100%
Strongly disagree (1) 396 18 61 23 18 30 21 29 90 71 34 166 230 226 17022% 10% 31% 19% 11% 23% 13% 17% 29% 41% 18% 20% 24% 19% 28%
Fairly disagree (2) 318 43 40 21 26 26 35 34 46 11 35 159 159 209 11018% 24% 20% 18% 16% 20% 22% 20% 15% 6% 20% 19% 17% 18% 18%
Fairly agree (3) 518 66 46 42 59 31 44 62 77 41 52 251 267 354 16429% 37% 23% 35% 37% 23% 27% 36% 25% 23% 29% 30% 28% 30% 27%
Strongly agree (4) 268 28 22 19 39 20 36 24 34 13 31 135 132 196 7215% 16% 11% 16% 24% 16% 23% 14% 11% 8% 17% 16% 14% 17% 12%
Don't know 283 21 30 16 19 24 26 20 60 38 29 131 152 189 9416% 12% 15% 13% 12% 18% 16% 12% 20% 22% 16% 16% 16% 16% 15%
NETS
Net: Disagree 714 61 101 44 44 56 56 64 136 83 69 325 390 435 27940% 35% 51% 37% 28% 43% 35% 37% 44% 47% 38% 39% 41% 37% 46%
Net: Agree 786 94 68 61 98 51 80 86 111 54 84 386 400 549 23644% 53% 34% 50% 61% 39% 50% 51% 36% 31% 46% 46% 42% 47% 39%
Mean score 2.44 2.67 2.17 2.54 2.83 2.39 2.70 2.54 2.22 1.97 2.53 2.50 2.38 2.53 2.27Standard deviation 1.06 .91 1.06 1.03 .98 1.09 1.03 .99 1.09 1.10 1.05 1.05 1.08 1.05 1.07Standard error .03 .08 .09 .10 .08 .12 .10 .08 .07 .10 .08 .04 .04 .04 .04
Online fieldwork: 26th March - 15th April 2015 Prepared by ComRes Ltd
Page 146

Table 71/2
European Youth Survey - All marketsQ13_1. To what extent, if at all, do you agree or disagree that social media enables you to do the following in relation to your professors/educators? - Asking questions directly to professors outside classBase: All students
EDUCATION WORK STATUS
Total
Uppersecondary
or lessVocational
trainingUniversity
degreePostgraduate
degree Employees Students EntrepreneursNot
working
Unweighted Total 1613 894 182 451 59 - 1613 - -
Weighted Total 1783 1062 203 437 52 - 1783 - -100% 100% 100% 100% 100% - 100% - -
Strongly disagree (1) 396 231 47 102 9 - 396 - -22% 22% 23% 23% 17% - 22% - -
Fairly disagree (2) 318 192 34 77 10 - 318 - -18% 18% 17% 18% 19% - 18% - -
Fairly agree (3) 518 315 59 126 15 - 518 - -29% 30% 29% 29% 28% - 29% - -
Strongly agree (4) 268 143 37 71 10 - 268 - -15% 14% 18% 16% 19% - 15% - -
Don't know 283 182 26 62 9 - 283 - -16% 17% 13% 14% 17% - 16% - -
NETS
Net: Disagree 714 422 81 179 19 - 714 - -40% 40% 40% 41% 36% - 40% - -
Net: Agree 786 458 96 197 24 - 786 - -44% 43% 47% 45% 47% - 44% - -
Mean score 2.44 2.42 2.49 2.44 2.58 - 2.44 - -Standard deviation 1.06 1.05 1.10 1.08 1.06 - 1.06 - -Standard error .03 .04 .09 .05 .15 - .03 - -
Online fieldwork: 26th March - 15th April 2015 Prepared by ComRes Ltd
Page 147

Table 72/1
European Youth Survey - All marketsQ13_2. To what extent, if at all, do you agree or disagree that social media enables you to do the following in relation to your professors/educators? - Obtaining additional material for the course or recorded lecturesBase: All students
COUNTRY GENDER AGE
Total Italy Germany France Spain UKEasternEurope Baltic Nordics Sweden Benelux Male Female 18-22 22-29
Unweighted Total 1613 153 173 111 150 103 124 157 295 163 184 770 843 907 706
Weighted Total 1783 176 199 121 161 131 161 170 308 175 182 842 941 1173 610100% 100% 100% 100% 100% 100% 100% 100% 100% 100% 100% 100% 100% 100% 100%
Strongly disagree (1) 300 15 48 25 15 22 14 14 68 64 16 132 168 165 13517% 8% 24% 20% 9% 17% 9% 8% 22% 37% 9% 16% 18% 14% 22%
Fairly disagree (2) 244 31 30 11 20 19 19 28 44 19 23 125 119 154 9014% 17% 15% 9% 12% 15% 12% 16% 14% 11% 13% 15% 13% 13% 15%
Fairly agree (3) 594 79 63 37 65 48 52 62 85 42 60 286 308 411 18333% 45% 32% 31% 41% 37% 32% 36% 28% 24% 33% 34% 33% 35% 30%
Strongly agree (4) 366 30 24 32 43 19 51 50 49 13 54 174 192 245 12121% 17% 12% 27% 27% 14% 32% 29% 16% 8% 30% 21% 20% 21% 20%
Don't know 279 22 34 15 18 23 25 17 62 36 28 125 154 198 8116% 12% 17% 13% 11% 17% 15% 10% 20% 21% 15% 15% 16% 17% 13%
NETS
Net: Disagree 544 45 78 36 35 41 33 42 112 83 39 257 287 319 22531% 26% 39% 30% 22% 32% 20% 24% 36% 48% 22% 31% 31% 27% 37%
Net: Agree 960 109 87 69 108 67 104 112 134 56 115 460 500 656 30454% 62% 44% 57% 67% 51% 64% 66% 44% 32% 63% 55% 53% 56% 50%
Mean score 2.68 2.81 2.38 2.73 2.95 2.59 3.03 2.96 2.47 2.03 3.00 2.70 2.67 2.75 2.55Standard deviation 1.05 .86 1.06 1.13 .93 1.00 .97 .94 1.10 1.07 .96 1.03 1.07 1.01 1.10Standard error .03 .07 .09 .12 .08 .11 .09 .08 .07 .09 .08 .04 .04 .04 .04
Online fieldwork: 26th March - 15th April 2015 Prepared by ComRes Ltd
Page 148
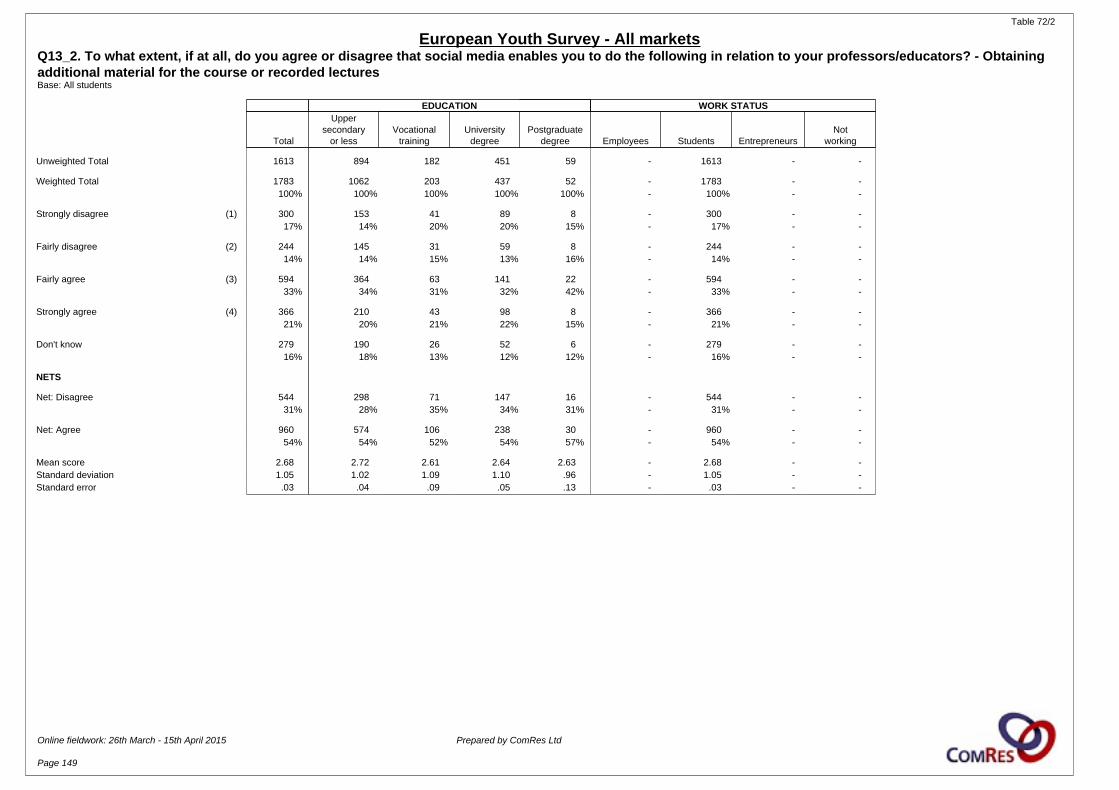
Table 72/2
European Youth Survey - All marketsQ13_2. To what extent, if at all, do you agree or disagree that social media enables you to do the following in relation to your professors/educators? - Obtaining additional material for the course or recorded lecturesBase: All students
EDUCATION WORK STATUS
Total
Uppersecondary
or lessVocational
trainingUniversity
degreePostgraduate
degree Employees Students EntrepreneursNot
working
Unweighted Total 1613 894 182 451 59 - 1613 - -
Weighted Total 1783 1062 203 437 52 - 1783 - -100% 100% 100% 100% 100% - 100% - -
Strongly disagree (1) 300 153 41 89 8 - 300 - -17% 14% 20% 20% 15% - 17% - -
Fairly disagree (2) 244 145 31 59 8 - 244 - -14% 14% 15% 13% 16% - 14% - -
Fairly agree (3) 594 364 63 141 22 - 594 - -33% 34% 31% 32% 42% - 33% - -
Strongly agree (4) 366 210 43 98 8 - 366 - -21% 20% 21% 22% 15% - 21% - -
Don't know 279 190 26 52 6 - 279 - -16% 18% 13% 12% 12% - 16% - -
NETS
Net: Disagree 544 298 71 147 16 - 544 - -31% 28% 35% 34% 31% - 31% - -
Net: Agree 960 574 106 238 30 - 960 - -54% 54% 52% 54% 57% - 54% - -
Mean score 2.68 2.72 2.61 2.64 2.63 - 2.68 - -Standard deviation 1.05 1.02 1.09 1.10 .96 - 1.05 - -Standard error .03 .04 .09 .05 .13 - .03 - -
Online fieldwork: 26th March - 15th April 2015 Prepared by ComRes Ltd
Page 149

Table 73/1
European Youth Survey - All marketsQ13_3. To what extent, if at all, do you agree or disagree that social media enables you to do the following in relation to your professors/educators? - Obtaining greater guidance on course materialBase: All students
COUNTRY GENDER AGE
Total Italy Germany France Spain UKEasternEurope Baltic Nordics Sweden Benelux Male Female 18-22 22-29
Unweighted Total 1613 153 173 111 150 103 124 157 295 163 184 770 843 907 706
Weighted Total 1783 176 199 121 161 131 161 170 308 175 182 842 941 1173 610100% 100% 100% 100% 100% 100% 100% 100% 100% 100% 100% 100% 100% 100% 100%
Strongly disagree (1) 291 11 42 20 18 22 16 16 68 58 20 123 168 164 12816% 6% 21% 17% 11% 17% 10% 9% 22% 33% 11% 15% 18% 14% 21%
Fairly disagree (2) 274 35 32 19 25 25 22 15 53 18 29 145 129 177 9715% 20% 16% 16% 15% 19% 14% 9% 17% 10% 16% 17% 14% 15% 16%
Fairly agree (3) 635 80 69 42 60 42 60 74 90 52 67 284 351 432 20336% 45% 34% 35% 37% 32% 37% 43% 29% 30% 37% 34% 37% 37% 33%
Strongly agree (4) 302 27 29 18 39 18 36 46 36 14 39 151 151 204 9817% 15% 14% 15% 24% 14% 22% 27% 12% 8% 21% 18% 16% 17% 16%
Don't know 282 23 28 21 19 23 28 18 61 33 27 139 142 197 8516% 13% 14% 17% 12% 18% 17% 11% 20% 19% 15% 17% 15% 17% 14%
NETS
Net: Disagree 565 46 74 39 42 48 38 31 121 76 49 267 297 340 22432% 26% 37% 33% 26% 36% 24% 18% 39% 44% 27% 32% 32% 29% 37%
Net: Agree 936 107 97 61 99 60 96 120 126 66 106 435 501 636 30153% 61% 49% 50% 62% 46% 59% 71% 41% 38% 58% 52% 53% 54% 49%
Mean score 2.63 2.80 2.49 2.58 2.85 2.51 2.86 2.99 2.38 2.15 2.81 2.66 2.61 2.69 2.52Standard deviation 1.01 .82 1.04 1.01 .97 1.00 .95 .91 1.04 1.07 .96 1.00 1.02 .98 1.05Standard error .03 .07 .09 .11 .08 .11 .09 .08 .07 .09 .08 .04 .04 .04 .04
Online fieldwork: 26th March - 15th April 2015 Prepared by ComRes Ltd
Page 150

Table 73/2
European Youth Survey - All marketsQ13_3. To what extent, if at all, do you agree or disagree that social media enables you to do the following in relation to your professors/educators? - Obtaining greater guidance on course materialBase: All students
EDUCATION WORK STATUS
Total
Uppersecondary
or lessVocational
trainingUniversity
degreePostgraduate
degree Employees Students EntrepreneursNot
working
Unweighted Total 1613 894 182 451 59 - 1613 - -
Weighted Total 1783 1062 203 437 52 - 1783 - -100% 100% 100% 100% 100% - 100% - -
Strongly disagree (1) 291 159 41 76 7 - 291 - -16% 15% 20% 17% 14% - 16% - -
Fairly disagree (2) 274 155 27 82 8 - 274 - -15% 15% 13% 19% 15% - 15% - -
Fairly agree (3) 635 392 60 152 21 - 635 - -36% 37% 29% 35% 39% - 36% - -
Strongly agree (4) 302 177 45 65 10 - 302 - -17% 17% 22% 15% 20% - 17% - -
Don't know 282 180 30 62 6 - 282 - -16% 17% 15% 14% 12% - 16% - -
NETS
Net: Disagree 565 314 68 158 15 - 565 - -32% 30% 34% 36% 29% - 32% - -
Net: Agree 936 569 105 217 31 - 936 - -53% 54% 52% 50% 59% - 53% - -
Mean score 2.63 2.67 2.63 2.55 2.74 - 2.63 - -Standard deviation 1.01 .99 1.11 1.00 .99 - 1.01 - -Standard error .03 .04 .09 .05 .14 - .03 - -
Online fieldwork: 26th March - 15th April 2015 Prepared by ComRes Ltd
Page 151

Table 74/1
European Youth Survey - All marketsQ13_4. To what extent, if at all, do you agree or disagree that social media enables you to do the following in relation to your professors/educators? - Obtaining advice on extra-curricular learningBase: All students
COUNTRY GENDER AGE
Total Italy Germany France Spain UKEasternEurope Baltic Nordics Sweden Benelux Male Female 18-22 22-29
Unweighted Total 1613 153 173 111 150 103 124 157 295 163 184 770 843 907 706
Weighted Total 1783 176 199 121 161 131 161 170 308 175 182 842 941 1173 610100% 100% 100% 100% 100% 100% 100% 100% 100% 100% 100% 100% 100% 100% 100%
Strongly disagree (1) 295 12 48 23 14 15 24 21 63 57 18 119 176 180 11517% 7% 24% 19% 9% 12% 15% 12% 21% 33% 10% 14% 19% 15% 19%
Fairly disagree (2) 310 58 38 21 18 22 25 26 52 17 34 151 159 194 11517% 33% 19% 17% 11% 17% 15% 15% 17% 10% 19% 18% 17% 17% 19%
Fairly agree (3) 598 67 63 36 65 42 54 68 101 42 60 298 300 399 20034% 38% 31% 29% 40% 32% 33% 40% 33% 24% 33% 35% 32% 34% 33%
Strongly agree (4) 286 16 19 24 45 31 34 36 33 14 35 142 145 198 8816% 9% 9% 19% 28% 23% 21% 22% 11% 8% 19% 17% 15% 17% 14%
Don't know 294 24 32 19 19 21 24 18 59 44 34 133 161 202 9216% 13% 16% 15% 12% 16% 15% 11% 19% 25% 18% 16% 17% 17% 15%
NETS
Net: Disagree 605 69 86 43 32 37 49 46 115 74 53 270 335 375 23034% 39% 43% 36% 20% 28% 30% 27% 37% 43% 29% 32% 36% 32% 38%
Net: Agree 884 83 81 59 110 73 88 105 134 56 95 440 445 597 28850% 47% 41% 49% 68% 56% 55% 62% 44% 32% 53% 52% 47% 51% 47%
Mean score 2.59 2.57 2.31 2.59 2.99 2.80 2.72 2.80 2.42 2.10 2.76 2.65 2.53 2.63 2.50Standard deviation 1.01 .78 1.01 1.08 .93 1.00 1.03 .96 1.01 1.09 .95 .98 1.04 1.01 1.02Standard error .03 .07 .08 .11 .08 .11 .10 .08 .06 .10 .08 .04 .04 .04 .04
Online fieldwork: 26th March - 15th April 2015 Prepared by ComRes Ltd
Page 152

Table 74/2
European Youth Survey - All marketsQ13_4. To what extent, if at all, do you agree or disagree that social media enables you to do the following in relation to your professors/educators? - Obtaining advice on extra-curricular learningBase: All students
EDUCATION WORK STATUS
Total
Uppersecondary
or lessVocational
trainingUniversity
degreePostgraduate
degree Employees Students EntrepreneursNot
working
Unweighted Total 1613 894 182 451 59 - 1613 - -
Weighted Total 1783 1062 203 437 52 - 1783 - -100% 100% 100% 100% 100% - 100% - -
Strongly disagree (1) 295 163 43 74 7 - 295 - -17% 15% 21% 17% 14% - 17% - -
Fairly disagree (2) 310 195 24 78 8 - 310 - -17% 18% 12% 18% 15% - 17% - -
Fairly agree (3) 598 360 68 146 19 - 598 - -34% 34% 34% 33% 36% - 34% - -
Strongly agree (4) 286 149 39 83 11 - 286 - -16% 14% 19% 19% 21% - 16% - -
Don't know 294 196 29 57 8 - 294 - -16% 18% 14% 13% 15% - 16% - -
NETS
Net: Disagree 605 358 67 152 15 - 605 - -34% 34% 33% 35% 29% - 34% - -
Net: Agree 884 509 107 229 30 - 884 - -50% 48% 53% 52% 57% - 50% - -
Mean score 2.59 2.57 2.59 2.62 2.75 - 2.59 - -Standard deviation 1.01 .98 1.09 1.03 1.02 - 1.01 - -Standard error .03 .04 .09 .05 .14 - .03 - -
Online fieldwork: 26th March - 15th April 2015 Prepared by ComRes Ltd
Page 153

Table 75/1
European Youth Survey - All marketsQ13_5. To what extent, if at all, do you agree or disagree that social media enables you to do the following in relation to your professors/educators? - Improving communication with educators in the classroomBase: All students
COUNTRY GENDER AGE
Total Italy Germany France Spain UKEasternEurope Baltic Nordics Sweden Benelux Male Female 18-22 22-29
Unweighted Total 1613 153 173 111 150 103 124 157 295 163 184 770 843 907 706
Weighted Total 1783 176 199 121 161 131 161 170 308 175 182 842 941 1173 610100% 100% 100% 100% 100% 100% 100% 100% 100% 100% 100% 100% 100% 100% 100%
Strongly disagree (1) 398 21 65 25 17 29 28 33 85 64 33 162 236 219 17922% 12% 32% 21% 11% 22% 17% 19% 28% 37% 18% 19% 25% 19% 29%
Fairly disagree (2) 376 53 32 30 30 25 41 41 65 13 46 181 194 255 12121% 30% 16% 25% 19% 19% 26% 24% 21% 8% 25% 22% 21% 22% 20%
Fairly agree (3) 491 65 48 30 64 32 42 51 66 45 49 241 249 337 15428% 37% 24% 24% 40% 24% 26% 30% 22% 26% 27% 29% 27% 29% 25%
Strongly agree (4) 206 16 24 14 31 23 21 17 27 12 22 115 91 145 6012% 9% 12% 11% 19% 17% 13% 10% 9% 7% 12% 14% 10% 12% 10%
Don't know 313 22 32 23 19 23 30 29 64 40 32 142 171 217 9618% 12% 16% 19% 12% 17% 18% 17% 21% 23% 17% 17% 18% 18% 16%
NETS
Net: Disagree 774 74 96 55 47 54 69 73 150 77 79 344 430 474 30043% 42% 48% 45% 29% 41% 43% 43% 49% 44% 43% 41% 46% 40% 49%
Net: Agree 696 81 72 43 94 55 62 68 93 57 71 356 340 482 21439% 46% 36% 36% 59% 42% 39% 40% 30% 33% 39% 42% 36% 41% 35%
Mean score 2.34 2.49 2.19 2.33 2.76 2.45 2.42 2.37 2.15 2.04 2.40 2.44 2.25 2.43 2.19Standard deviation 1.02 .85 1.10 1.01 .93 1.10 .99 .97 1.02 1.09 .99 1.02 1.02 1.00 1.04Standard error .03 .07 .09 .11 .08 .12 .10 .09 .07 .10 .08 .04 .04 .04 .04
Online fieldwork: 26th March - 15th April 2015 Prepared by ComRes Ltd
Page 154

Table 75/2
European Youth Survey - All marketsQ13_5. To what extent, if at all, do you agree or disagree that social media enables you to do the following in relation to your professors/educators? - Improving communication with educators in the classroomBase: All students
EDUCATION WORK STATUS
Total
Uppersecondary
or lessVocational
trainingUniversity
degreePostgraduate
degree Employees Students EntrepreneursNot
working
Unweighted Total 1613 894 182 451 59 - 1613 - -
Weighted Total 1783 1062 203 437 52 - 1783 - -100% 100% 100% 100% 100% - 100% - -
Strongly disagree (1) 398 223 45 108 12 - 398 - -22% 21% 22% 25% 23% - 22% - -
Fairly disagree (2) 376 232 37 92 11 - 376 - -21% 22% 18% 21% 20% - 21% - -
Fairly agree (3) 491 290 59 124 10 - 491 - -28% 27% 29% 28% 19% - 28% - -
Strongly agree (4) 206 115 31 47 11 - 206 - -12% 11% 15% 11% 21% - 12% - -
Don't know 313 202 32 66 9 - 313 - -18% 19% 16% 15% 17% - 18% - -
NETS
Net: Disagree 774 456 81 200 23 - 774 - -43% 43% 40% 46% 43% - 43% - -
Net: Agree 696 405 90 171 21 - 696 - -39% 38% 44% 39% 40% - 39% - -
Mean score 2.34 2.34 2.44 2.30 2.46 - 2.34 - -Standard deviation 1.02 1.01 1.06 1.02 1.16 - 1.02 - -Standard error .03 .04 .09 .05 .17 - .03 - -
Online fieldwork: 26th March - 15th April 2015 Prepared by ComRes Ltd
Page 155
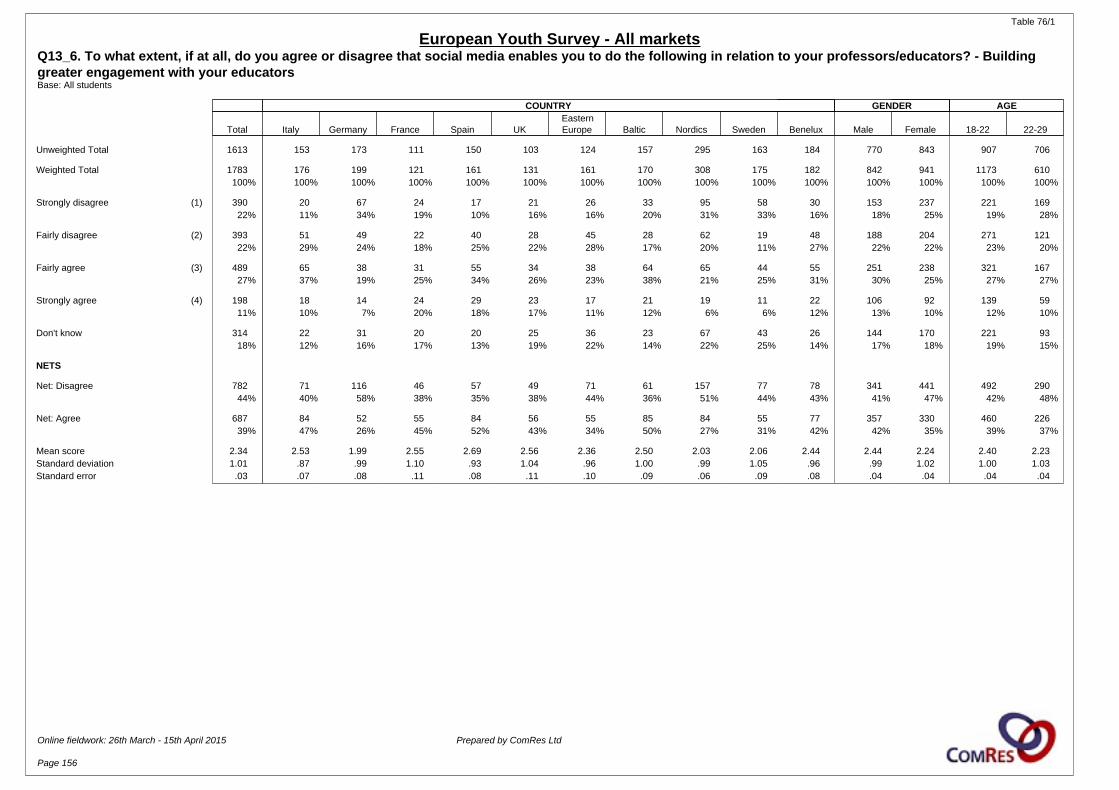
Table 76/1
European Youth Survey - All marketsQ13_6. To what extent, if at all, do you agree or disagree that social media enables you to do the following in relation to your professors/educators? - Building greater engagement with your educatorsBase: All students
COUNTRY GENDER AGE
Total Italy Germany France Spain UKEasternEurope Baltic Nordics Sweden Benelux Male Female 18-22 22-29
Unweighted Total 1613 153 173 111 150 103 124 157 295 163 184 770 843 907 706
Weighted Total 1783 176 199 121 161 131 161 170 308 175 182 842 941 1173 610100% 100% 100% 100% 100% 100% 100% 100% 100% 100% 100% 100% 100% 100% 100%
Strongly disagree (1) 390 20 67 24 17 21 26 33 95 58 30 153 237 221 16922% 11% 34% 19% 10% 16% 16% 20% 31% 33% 16% 18% 25% 19% 28%
Fairly disagree (2) 393 51 49 22 40 28 45 28 62 19 48 188 204 271 12122% 29% 24% 18% 25% 22% 28% 17% 20% 11% 27% 22% 22% 23% 20%
Fairly agree (3) 489 65 38 31 55 34 38 64 65 44 55 251 238 321 16727% 37% 19% 25% 34% 26% 23% 38% 21% 25% 31% 30% 25% 27% 27%
Strongly agree (4) 198 18 14 24 29 23 17 21 19 11 22 106 92 139 5911% 10% 7% 20% 18% 17% 11% 12% 6% 6% 12% 13% 10% 12% 10%
Don't know 314 22 31 20 20 25 36 23 67 43 26 144 170 221 9318% 12% 16% 17% 13% 19% 22% 14% 22% 25% 14% 17% 18% 19% 15%
NETS
Net: Disagree 782 71 116 46 57 49 71 61 157 77 78 341 441 492 29044% 40% 58% 38% 35% 38% 44% 36% 51% 44% 43% 41% 47% 42% 48%
Net: Agree 687 84 52 55 84 56 55 85 84 55 77 357 330 460 22639% 47% 26% 45% 52% 43% 34% 50% 27% 31% 42% 42% 35% 39% 37%
Mean score 2.34 2.53 1.99 2.55 2.69 2.56 2.36 2.50 2.03 2.06 2.44 2.44 2.24 2.40 2.23Standard deviation 1.01 .87 .99 1.10 .93 1.04 .96 1.00 .99 1.05 .96 .99 1.02 1.00 1.03Standard error .03 .07 .08 .11 .08 .11 .10 .09 .06 .09 .08 .04 .04 .04 .04
Online fieldwork: 26th March - 15th April 2015 Prepared by ComRes Ltd
Page 156
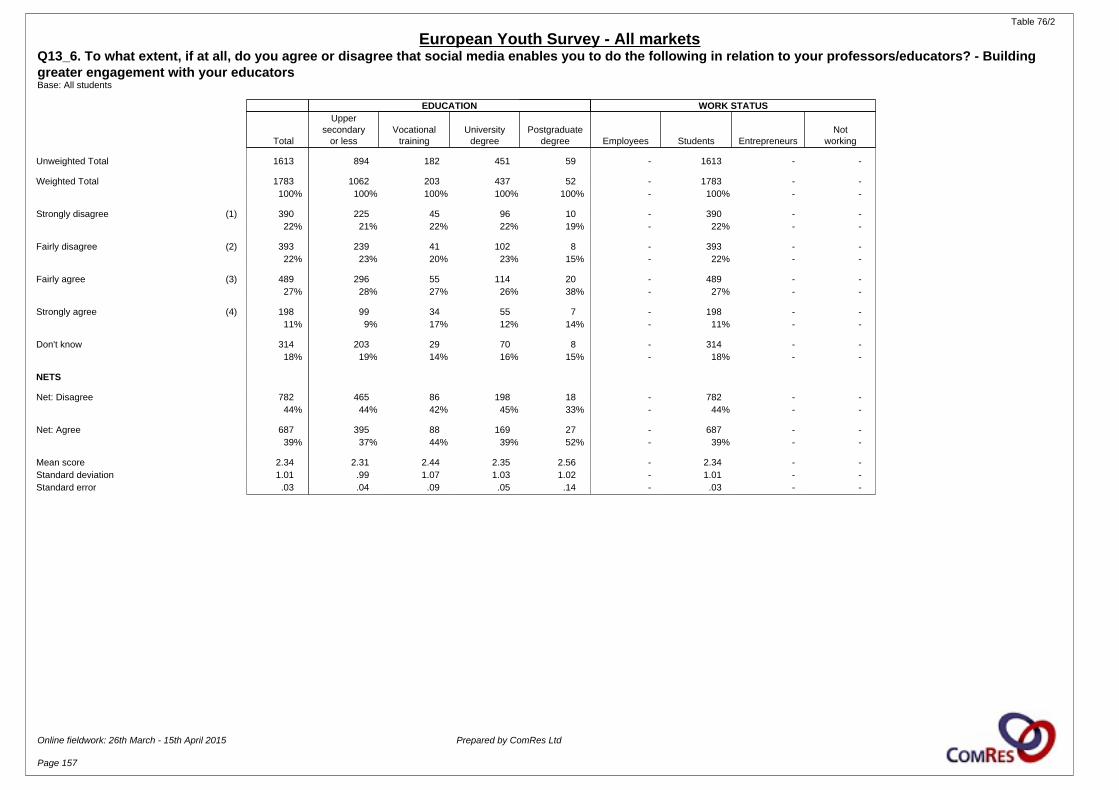
Table 76/2
European Youth Survey - All marketsQ13_6. To what extent, if at all, do you agree or disagree that social media enables you to do the following in relation to your professors/educators? - Building greater engagement with your educatorsBase: All students
EDUCATION WORK STATUS
Total
Uppersecondary
or lessVocational
trainingUniversity
degreePostgraduate
degree Employees Students EntrepreneursNot
working
Unweighted Total 1613 894 182 451 59 - 1613 - -
Weighted Total 1783 1062 203 437 52 - 1783 - -100% 100% 100% 100% 100% - 100% - -
Strongly disagree (1) 390 225 45 96 10 - 390 - -22% 21% 22% 22% 19% - 22% - -
Fairly disagree (2) 393 239 41 102 8 - 393 - -22% 23% 20% 23% 15% - 22% - -
Fairly agree (3) 489 296 55 114 20 - 489 - -27% 28% 27% 26% 38% - 27% - -
Strongly agree (4) 198 99 34 55 7 - 198 - -11% 9% 17% 12% 14% - 11% - -
Don't know 314 203 29 70 8 - 314 - -18% 19% 14% 16% 15% - 18% - -
NETS
Net: Disagree 782 465 86 198 18 - 782 - -44% 44% 42% 45% 33% - 44% - -
Net: Agree 687 395 88 169 27 - 687 - -39% 37% 44% 39% 52% - 39% - -
Mean score 2.34 2.31 2.44 2.35 2.56 - 2.34 - -Standard deviation 1.01 .99 1.07 1.03 1.02 - 1.01 - -Standard error .03 .04 .09 .05 .14 - .03 - -
Online fieldwork: 26th March - 15th April 2015 Prepared by ComRes Ltd
Page 157
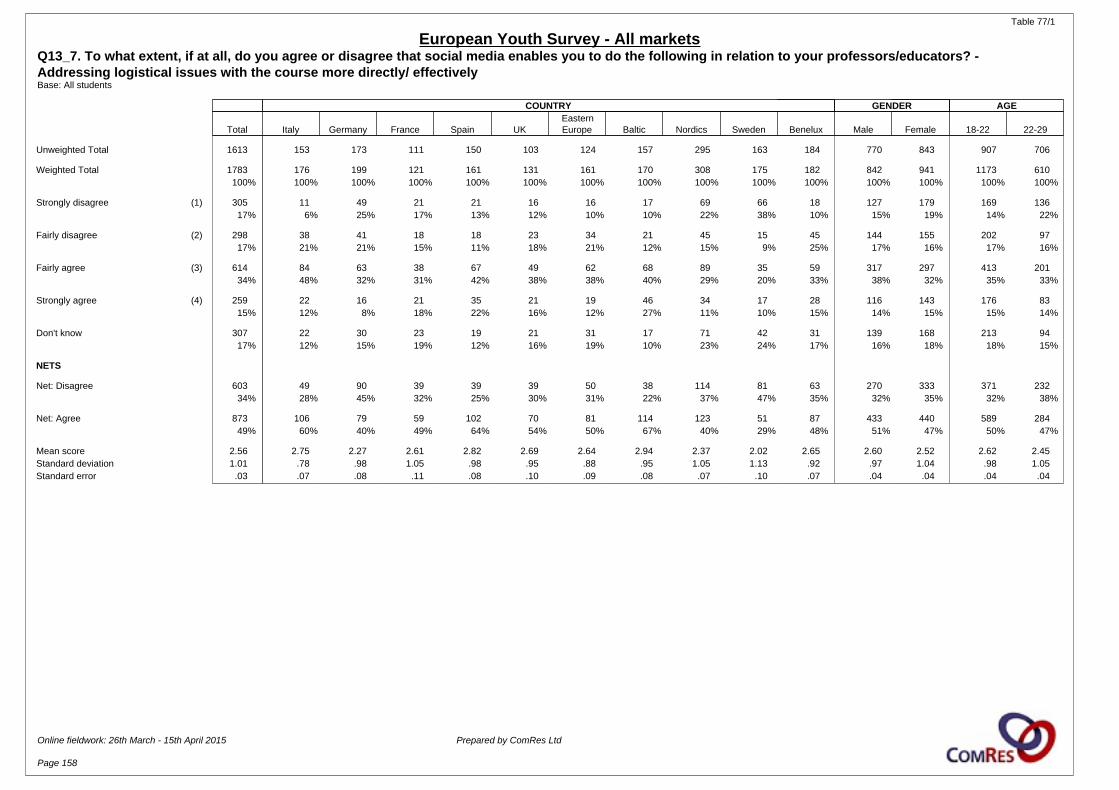
Table 77/1
European Youth Survey - All marketsQ13_7. To what extent, if at all, do you agree or disagree that social media enables you to do the following in relation to your professors/educators? - Addressing logistical issues with the course more directly/ effectivelyBase: All students
COUNTRY GENDER AGE
Total Italy Germany France Spain UKEasternEurope Baltic Nordics Sweden Benelux Male Female 18-22 22-29
Unweighted Total 1613 153 173 111 150 103 124 157 295 163 184 770 843 907 706
Weighted Total 1783 176 199 121 161 131 161 170 308 175 182 842 941 1173 610100% 100% 100% 100% 100% 100% 100% 100% 100% 100% 100% 100% 100% 100% 100%
Strongly disagree (1) 305 11 49 21 21 16 16 17 69 66 18 127 179 169 13617% 6% 25% 17% 13% 12% 10% 10% 22% 38% 10% 15% 19% 14% 22%
Fairly disagree (2) 298 38 41 18 18 23 34 21 45 15 45 144 155 202 9717% 21% 21% 15% 11% 18% 21% 12% 15% 9% 25% 17% 16% 17% 16%
Fairly agree (3) 614 84 63 38 67 49 62 68 89 35 59 317 297 413 20134% 48% 32% 31% 42% 38% 38% 40% 29% 20% 33% 38% 32% 35% 33%
Strongly agree (4) 259 22 16 21 35 21 19 46 34 17 28 116 143 176 8315% 12% 8% 18% 22% 16% 12% 27% 11% 10% 15% 14% 15% 15% 14%
Don't know 307 22 30 23 19 21 31 17 71 42 31 139 168 213 9417% 12% 15% 19% 12% 16% 19% 10% 23% 24% 17% 16% 18% 18% 15%
NETS
Net: Disagree 603 49 90 39 39 39 50 38 114 81 63 270 333 371 23234% 28% 45% 32% 25% 30% 31% 22% 37% 47% 35% 32% 35% 32% 38%
Net: Agree 873 106 79 59 102 70 81 114 123 51 87 433 440 589 28449% 60% 40% 49% 64% 54% 50% 67% 40% 29% 48% 51% 47% 50% 47%
Mean score 2.56 2.75 2.27 2.61 2.82 2.69 2.64 2.94 2.37 2.02 2.65 2.60 2.52 2.62 2.45Standard deviation 1.01 .78 .98 1.05 .98 .95 .88 .95 1.05 1.13 .92 .97 1.04 .98 1.05Standard error .03 .07 .08 .11 .08 .10 .09 .08 .07 .10 .07 .04 .04 .04 .04
Online fieldwork: 26th March - 15th April 2015 Prepared by ComRes Ltd
Page 158
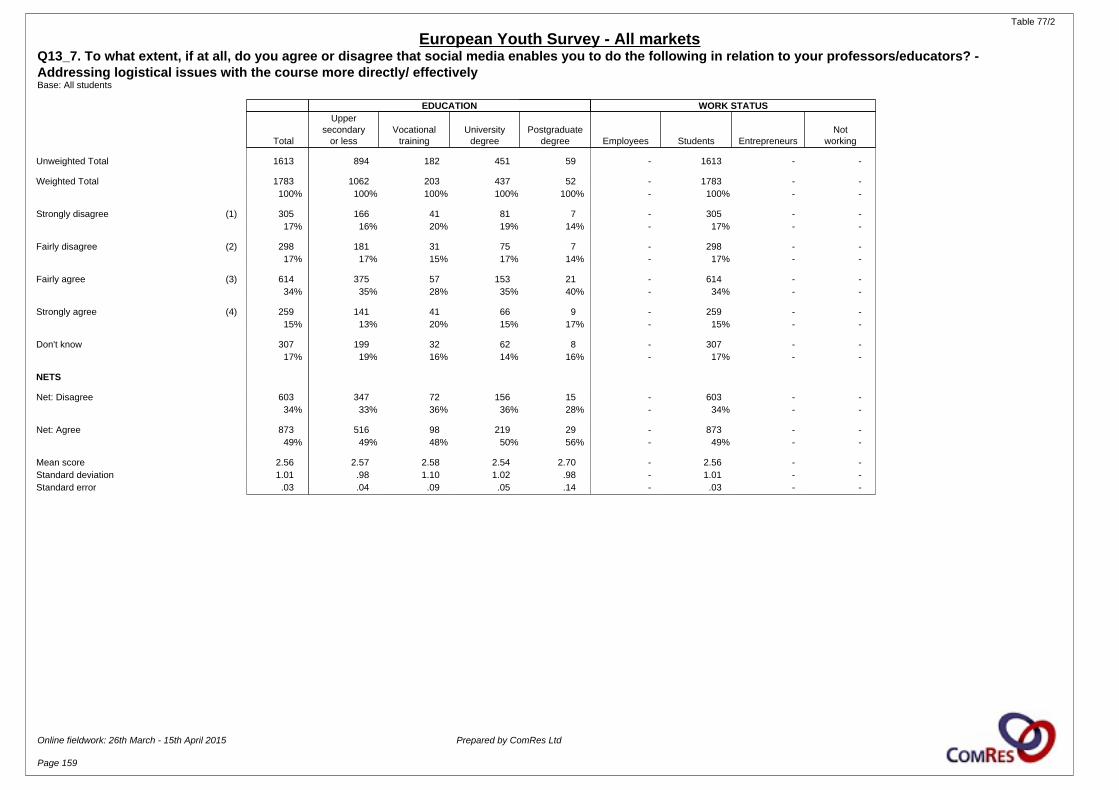
Table 77/2
European Youth Survey - All marketsQ13_7. To what extent, if at all, do you agree or disagree that social media enables you to do the following in relation to your professors/educators? - Addressing logistical issues with the course more directly/ effectivelyBase: All students
EDUCATION WORK STATUS
Total
Uppersecondary
or lessVocational
trainingUniversity
degreePostgraduate
degree Employees Students EntrepreneursNot
working
Unweighted Total 1613 894 182 451 59 - 1613 - -
Weighted Total 1783 1062 203 437 52 - 1783 - -100% 100% 100% 100% 100% - 100% - -
Strongly disagree (1) 305 166 41 81 7 - 305 - -17% 16% 20% 19% 14% - 17% - -
Fairly disagree (2) 298 181 31 75 7 - 298 - -17% 17% 15% 17% 14% - 17% - -
Fairly agree (3) 614 375 57 153 21 - 614 - -34% 35% 28% 35% 40% - 34% - -
Strongly agree (4) 259 141 41 66 9 - 259 - -15% 13% 20% 15% 17% - 15% - -
Don't know 307 199 32 62 8 - 307 - -17% 19% 16% 14% 16% - 17% - -
NETS
Net: Disagree 603 347 72 156 15 - 603 - -34% 33% 36% 36% 28% - 34% - -
Net: Agree 873 516 98 219 29 - 873 - -49% 49% 48% 50% 56% - 49% - -
Mean score 2.56 2.57 2.58 2.54 2.70 - 2.56 - -Standard deviation 1.01 .98 1.10 1.02 .98 - 1.01 - -Standard error .03 .04 .09 .05 .14 - .03 - -
Online fieldwork: 26th March - 15th April 2015 Prepared by ComRes Ltd
Page 159
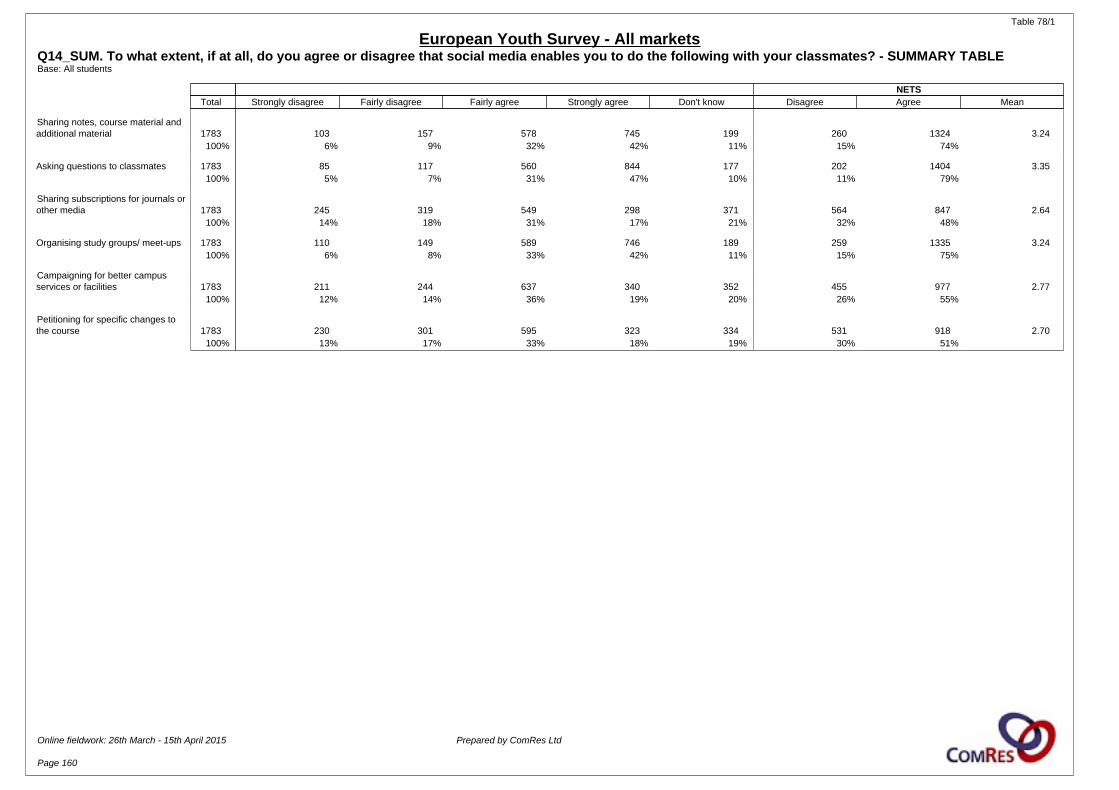
Table 78/1
European Youth Survey - All marketsQ14_SUM. To what extent, if at all, do you agree or disagree that social media enables you to do the following with your classmates? - SUMMARY TABLEBase: All students
NETS Total Strongly disagree Fairly disagree Fairly agree Strongly agree Don't know Disagree Agree Mean
Sharing notes, course material andadditional material 1783 103 157 578 745 199 260 1324 3.24
100% 6% 9% 32% 42% 11% 15% 74%
Asking questions to classmates 1783 85 117 560 844 177 202 1404 3.35100% 5% 7% 31% 47% 10% 11% 79%
Sharing subscriptions for journals orother media 1783 245 319 549 298 371 564 847 2.64
100% 14% 18% 31% 17% 21% 32% 48%
Organising study groups/ meet-ups 1783 110 149 589 746 189 259 1335 3.24100% 6% 8% 33% 42% 11% 15% 75%
Campaigning for better campusservices or facilities 1783 211 244 637 340 352 455 977 2.77
100% 12% 14% 36% 19% 20% 26% 55%
Petitioning for specific changes tothe course 1783 230 301 595 323 334 531 918 2.70
100% 13% 17% 33% 18% 19% 30% 51%
Online fieldwork: 26th March - 15th April 2015 Prepared by ComRes Ltd
Page 160

Table 79/1
European Youth Survey - All marketsQ14_1. To what extent, if at all, do you agree or disagree that social media enables you to do the following with your classmates? - Sharing notes, course material and additional materialBase: All students
COUNTRY GENDER AGE
Total Italy Germany France Spain UKEasternEurope Baltic Nordics Sweden Benelux Male Female 18-22 22-29
Unweighted Total 1613 153 173 111 150 103 124 157 295 163 184 770 843 907 706
Weighted Total 1783 176 199 121 161 131 161 170 308 175 182 842 941 1173 610100% 100% 100% 100% 100% 100% 100% 100% 100% 100% 100% 100% 100% 100% 100%
Strongly disagree (1) 103 7 17 13 5 8 9 8 17 14 6 51 52 51 526% 4% 8% 10% 3% 6% 5% 5% 6% 8% 3% 6% 6% 4% 9%
Fairly disagree (2) 157 25 28 16 13 9 8 10 23 10 14 90 67 97 609% 14% 14% 13% 8% 7% 5% 6% 8% 6% 8% 11% 7% 8% 10%
Fairly agree (3) 578 75 68 40 71 42 28 52 90 51 60 295 283 376 20332% 43% 34% 33% 44% 32% 17% 31% 29% 29% 33% 35% 30% 32% 33%
Strongly agree (4) 745 50 55 40 58 53 99 93 137 76 85 316 430 504 24242% 28% 27% 33% 36% 41% 61% 55% 45% 44% 47% 38% 46% 43% 40%
Don't know 199 19 32 12 14 18 18 7 40 22 17 89 109 145 5411% 11% 16% 10% 8% 14% 11% 4% 13% 13% 9% 11% 12% 12% 9%
NETS
Net: Disagree 260 32 45 29 18 17 17 18 40 25 20 142 119 149 11215% 18% 22% 24% 11% 13% 10% 11% 13% 14% 11% 17% 13% 13% 18%
Net: Agree 1324 125 123 80 129 96 126 145 228 128 145 611 713 879 44474% 71% 62% 66% 80% 73% 78% 86% 74% 73% 80% 73% 76% 75% 73%
Mean score 3.24 3.07 2.96 2.99 3.23 3.25 3.51 3.41 3.30 3.24 3.36 3.16 3.31 3.30 3.14Standard deviation .88 .81 .95 1.00 .76 .89 .85 .81 .88 .95 .78 .89 .87 .84 .95Standard error .02 .07 .08 .10 .06 .09 .08 .07 .05 .08 .06 .03 .03 .03 .04
Online fieldwork: 26th March - 15th April 2015 Prepared by ComRes Ltd
Page 161

Table 79/2
European Youth Survey - All marketsQ14_1. To what extent, if at all, do you agree or disagree that social media enables you to do the following with your classmates? - Sharing notes, course material and additional materialBase: All students
EDUCATION WORK STATUS
Total
Uppersecondary
or lessVocational
trainingUniversity
degreePostgraduate
degree Employees Students EntrepreneursNot
working
Unweighted Total 1613 894 182 451 59 - 1613 - -
Weighted Total 1783 1062 203 437 52 - 1783 - -100% 100% 100% 100% 100% - 100% - -
Strongly disagree (1) 103 51 19 27 3 - 103 - -6% 5% 10% 6% 5% - 6% - -
Fairly disagree (2) 157 84 23 42 6 - 157 - -9% 8% 11% 10% 12% - 9% - -
Fairly agree (3) 578 342 64 146 17 - 578 - -32% 32% 32% 33% 33% - 32% - -
Strongly agree (4) 745 459 74 184 18 - 745 - -42% 43% 36% 42% 35% - 42% - -
Don't know 199 126 22 39 8 - 199 - -11% 12% 11% 9% 16% - 11% - -
NETS
Net: Disagree 260 135 43 69 9 - 260 - -15% 13% 21% 16% 17% - 15% - -
Net: Agree 1324 801 138 329 35 - 1324 - -74% 75% 68% 75% 67% - 74% - -
Mean score 3.24 3.29 3.06 3.22 3.15 - 3.24 - -Standard deviation .88 .85 .98 .89 .88 - .88 - -Standard error .02 .03 .08 .04 .12 - .02 - -
Online fieldwork: 26th March - 15th April 2015 Prepared by ComRes Ltd
Page 162
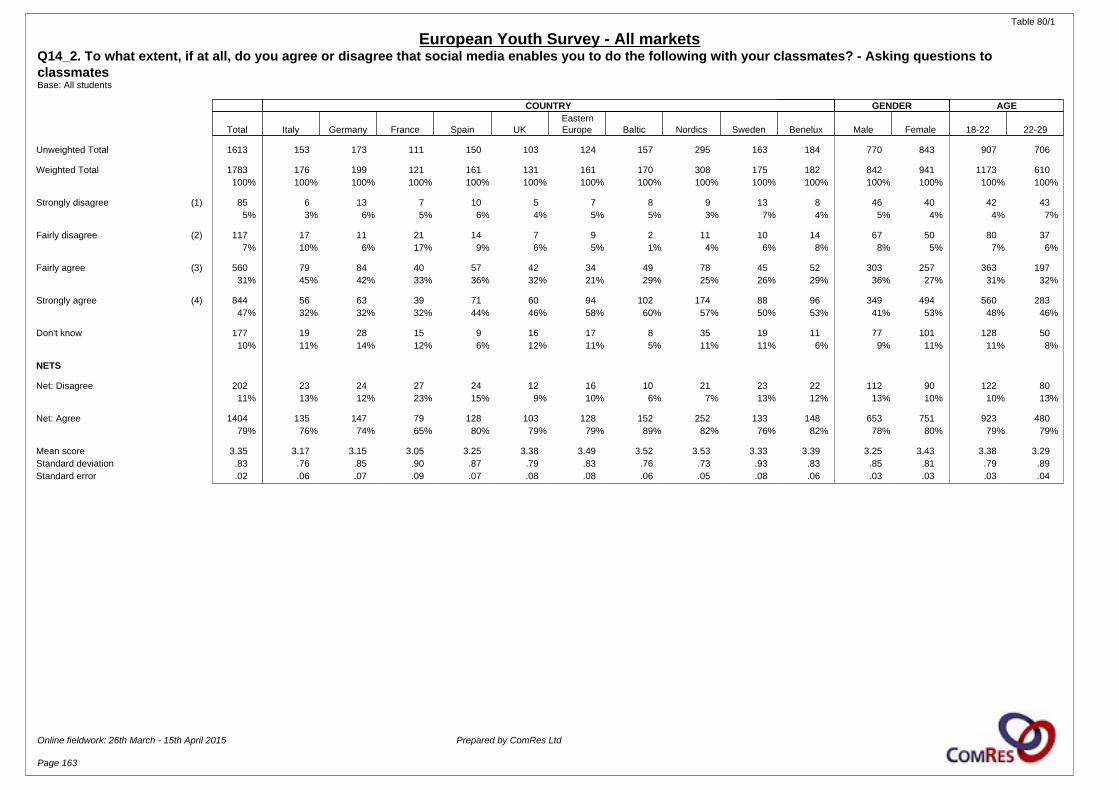
Table 80/1
European Youth Survey - All marketsQ14_2. To what extent, if at all, do you agree or disagree that social media enables you to do the following with your classmates? - Asking questions to classmatesBase: All students
COUNTRY GENDER AGE
Total Italy Germany France Spain UKEasternEurope Baltic Nordics Sweden Benelux Male Female 18-22 22-29
Unweighted Total 1613 153 173 111 150 103 124 157 295 163 184 770 843 907 706
Weighted Total 1783 176 199 121 161 131 161 170 308 175 182 842 941 1173 610100% 100% 100% 100% 100% 100% 100% 100% 100% 100% 100% 100% 100% 100% 100%
Strongly disagree (1) 85 6 13 7 10 5 7 8 9 13 8 46 40 42 435% 3% 6% 5% 6% 4% 5% 5% 3% 7% 4% 5% 4% 4% 7%
Fairly disagree (2) 117 17 11 21 14 7 9 2 11 10 14 67 50 80 377% 10% 6% 17% 9% 6% 5% 1% 4% 6% 8% 8% 5% 7% 6%
Fairly agree (3) 560 79 84 40 57 42 34 49 78 45 52 303 257 363 19731% 45% 42% 33% 36% 32% 21% 29% 25% 26% 29% 36% 27% 31% 32%
Strongly agree (4) 844 56 63 39 71 60 94 102 174 88 96 349 494 560 28347% 32% 32% 32% 44% 46% 58% 60% 57% 50% 53% 41% 53% 48% 46%
Don't know 177 19 28 15 9 16 17 8 35 19 11 77 101 128 5010% 11% 14% 12% 6% 12% 11% 5% 11% 11% 6% 9% 11% 11% 8%
NETS
Net: Disagree 202 23 24 27 24 12 16 10 21 23 22 112 90 122 8011% 13% 12% 23% 15% 9% 10% 6% 7% 13% 12% 13% 10% 10% 13%
Net: Agree 1404 135 147 79 128 103 128 152 252 133 148 653 751 923 48079% 76% 74% 65% 80% 79% 79% 89% 82% 76% 82% 78% 80% 79% 79%
Mean score 3.35 3.17 3.15 3.05 3.25 3.38 3.49 3.52 3.53 3.33 3.39 3.25 3.43 3.38 3.29Standard deviation .83 .76 .85 .90 .87 .79 .83 .76 .73 .93 .83 .85 .81 .79 .89Standard error .02 .06 .07 .09 .07 .08 .08 .06 .05 .08 .06 .03 .03 .03 .04
Online fieldwork: 26th March - 15th April 2015 Prepared by ComRes Ltd
Page 163
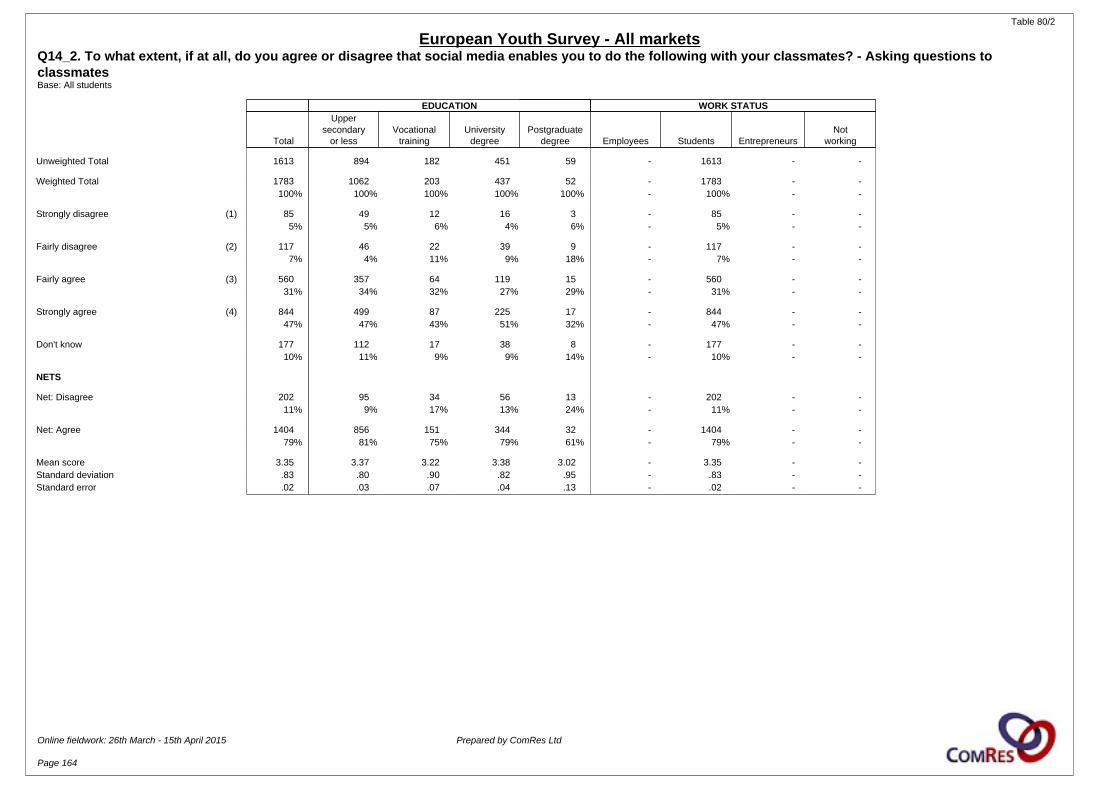
Table 80/2
European Youth Survey - All marketsQ14_2. To what extent, if at all, do you agree or disagree that social media enables you to do the following with your classmates? - Asking questions to classmatesBase: All students
EDUCATION WORK STATUS
Total
Uppersecondary
or lessVocational
trainingUniversity
degreePostgraduate
degree Employees Students EntrepreneursNot
working
Unweighted Total 1613 894 182 451 59 - 1613 - -
Weighted Total 1783 1062 203 437 52 - 1783 - -100% 100% 100% 100% 100% - 100% - -
Strongly disagree (1) 85 49 12 16 3 - 85 - -5% 5% 6% 4% 6% - 5% - -
Fairly disagree (2) 117 46 22 39 9 - 117 - -7% 4% 11% 9% 18% - 7% - -
Fairly agree (3) 560 357 64 119 15 - 560 - -31% 34% 32% 27% 29% - 31% - -
Strongly agree (4) 844 499 87 225 17 - 844 - -47% 47% 43% 51% 32% - 47% - -
Don't know 177 112 17 38 8 - 177 - -10% 11% 9% 9% 14% - 10% - -
NETS
Net: Disagree 202 95 34 56 13 - 202 - -11% 9% 17% 13% 24% - 11% - -
Net: Agree 1404 856 151 344 32 - 1404 - -79% 81% 75% 79% 61% - 79% - -
Mean score 3.35 3.37 3.22 3.38 3.02 - 3.35 - -Standard deviation .83 .80 .90 .82 .95 - .83 - -Standard error .02 .03 .07 .04 .13 - .02 - -
Online fieldwork: 26th March - 15th April 2015 Prepared by ComRes Ltd
Page 164
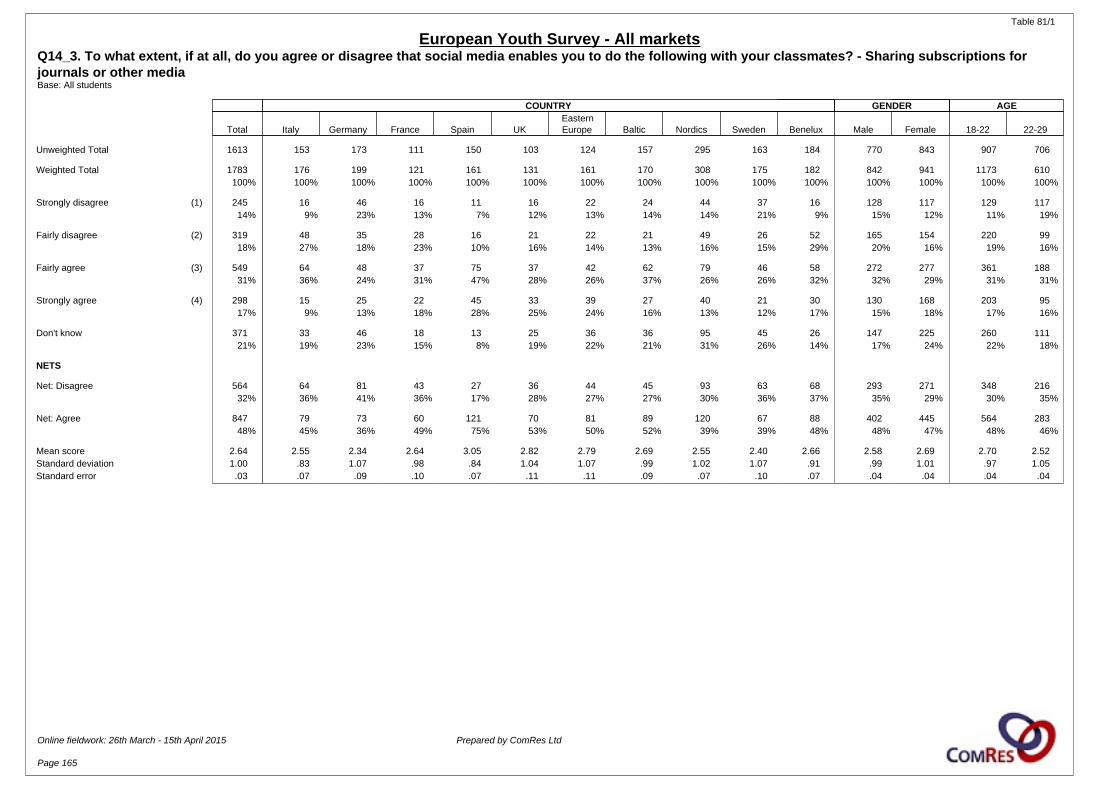
Table 81/1
European Youth Survey - All marketsQ14_3. To what extent, if at all, do you agree or disagree that social media enables you to do the following with your classmates? - Sharing subscriptions for journals or other mediaBase: All students
COUNTRY GENDER AGE
Total Italy Germany France Spain UKEasternEurope Baltic Nordics Sweden Benelux Male Female 18-22 22-29
Unweighted Total 1613 153 173 111 150 103 124 157 295 163 184 770 843 907 706
Weighted Total 1783 176 199 121 161 131 161 170 308 175 182 842 941 1173 610100% 100% 100% 100% 100% 100% 100% 100% 100% 100% 100% 100% 100% 100% 100%
Strongly disagree (1) 245 16 46 16 11 16 22 24 44 37 16 128 117 129 11714% 9% 23% 13% 7% 12% 13% 14% 14% 21% 9% 15% 12% 11% 19%
Fairly disagree (2) 319 48 35 28 16 21 22 21 49 26 52 165 154 220 9918% 27% 18% 23% 10% 16% 14% 13% 16% 15% 29% 20% 16% 19% 16%
Fairly agree (3) 549 64 48 37 75 37 42 62 79 46 58 272 277 361 18831% 36% 24% 31% 47% 28% 26% 37% 26% 26% 32% 32% 29% 31% 31%
Strongly agree (4) 298 15 25 22 45 33 39 27 40 21 30 130 168 203 9517% 9% 13% 18% 28% 25% 24% 16% 13% 12% 17% 15% 18% 17% 16%
Don't know 371 33 46 18 13 25 36 36 95 45 26 147 225 260 11121% 19% 23% 15% 8% 19% 22% 21% 31% 26% 14% 17% 24% 22% 18%
NETS
Net: Disagree 564 64 81 43 27 36 44 45 93 63 68 293 271 348 21632% 36% 41% 36% 17% 28% 27% 27% 30% 36% 37% 35% 29% 30% 35%
Net: Agree 847 79 73 60 121 70 81 89 120 67 88 402 445 564 28348% 45% 36% 49% 75% 53% 50% 52% 39% 39% 48% 48% 47% 48% 46%
Mean score 2.64 2.55 2.34 2.64 3.05 2.82 2.79 2.69 2.55 2.40 2.66 2.58 2.69 2.70 2.52Standard deviation 1.00 .83 1.07 .98 .84 1.04 1.07 .99 1.02 1.07 .91 .99 1.01 .97 1.05Standard error .03 .07 .09 .10 .07 .11 .11 .09 .07 .10 .07 .04 .04 .04 .04
Online fieldwork: 26th March - 15th April 2015 Prepared by ComRes Ltd
Page 165
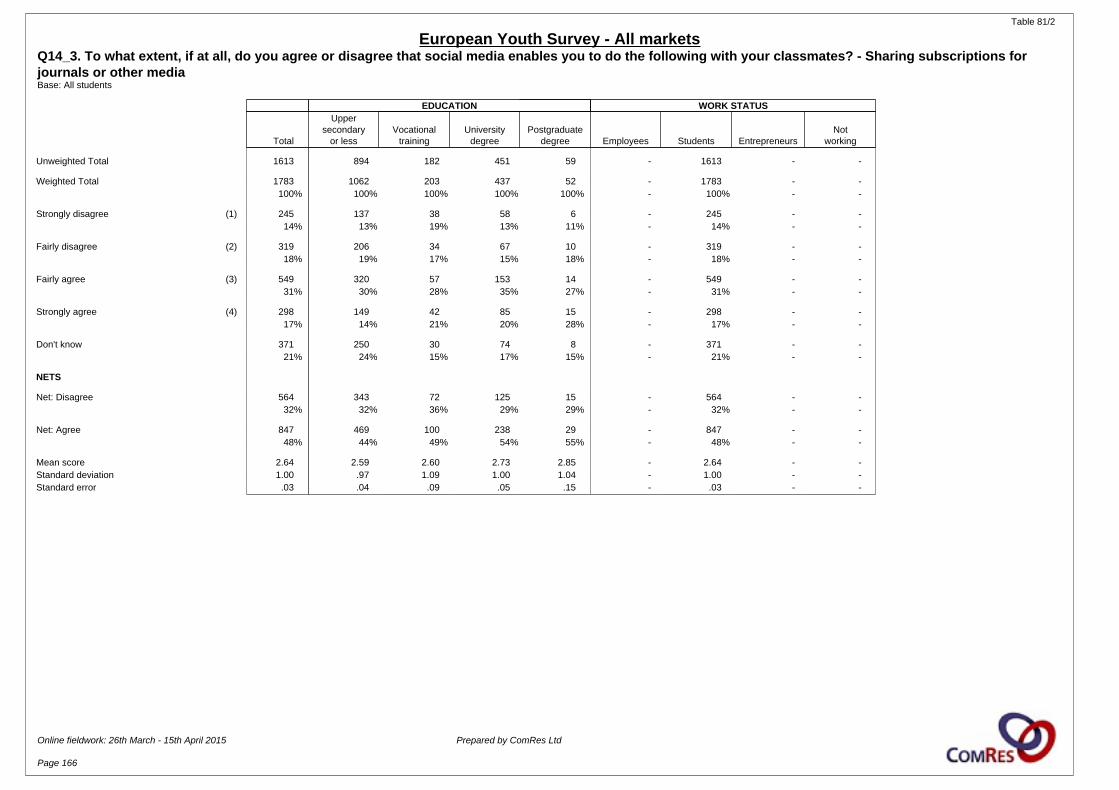
Table 81/2
European Youth Survey - All marketsQ14_3. To what extent, if at all, do you agree or disagree that social media enables you to do the following with your classmates? - Sharing subscriptions for journals or other mediaBase: All students
EDUCATION WORK STATUS
Total
Uppersecondary
or lessVocational
trainingUniversity
degreePostgraduate
degree Employees Students EntrepreneursNot
working
Unweighted Total 1613 894 182 451 59 - 1613 - -
Weighted Total 1783 1062 203 437 52 - 1783 - -100% 100% 100% 100% 100% - 100% - -
Strongly disagree (1) 245 137 38 58 6 - 245 - -14% 13% 19% 13% 11% - 14% - -
Fairly disagree (2) 319 206 34 67 10 - 319 - -18% 19% 17% 15% 18% - 18% - -
Fairly agree (3) 549 320 57 153 14 - 549 - -31% 30% 28% 35% 27% - 31% - -
Strongly agree (4) 298 149 42 85 15 - 298 - -17% 14% 21% 20% 28% - 17% - -
Don't know 371 250 30 74 8 - 371 - -21% 24% 15% 17% 15% - 21% - -
NETS
Net: Disagree 564 343 72 125 15 - 564 - -32% 32% 36% 29% 29% - 32% - -
Net: Agree 847 469 100 238 29 - 847 - -48% 44% 49% 54% 55% - 48% - -
Mean score 2.64 2.59 2.60 2.73 2.85 - 2.64 - -Standard deviation 1.00 .97 1.09 1.00 1.04 - 1.00 - -Standard error .03 .04 .09 .05 .15 - .03 - -
Online fieldwork: 26th March - 15th April 2015 Prepared by ComRes Ltd
Page 166
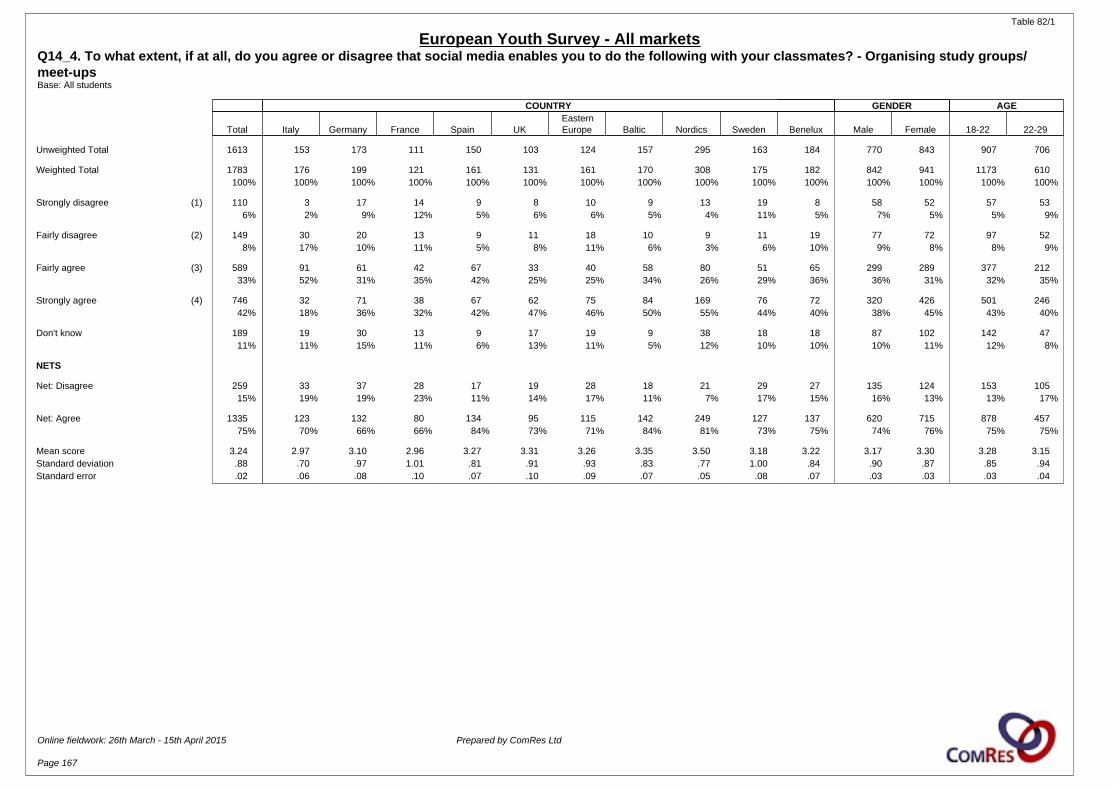
Table 82/1
European Youth Survey - All marketsQ14_4. To what extent, if at all, do you agree or disagree that social media enables you to do the following with your classmates? - Organising study groups/ meet-upsBase: All students
COUNTRY GENDER AGE
Total Italy Germany France Spain UKEasternEurope Baltic Nordics Sweden Benelux Male Female 18-22 22-29
Unweighted Total 1613 153 173 111 150 103 124 157 295 163 184 770 843 907 706
Weighted Total 1783 176 199 121 161 131 161 170 308 175 182 842 941 1173 610100% 100% 100% 100% 100% 100% 100% 100% 100% 100% 100% 100% 100% 100% 100%
Strongly disagree (1) 110 3 17 14 9 8 10 9 13 19 8 58 52 57 536% 2% 9% 12% 5% 6% 6% 5% 4% 11% 5% 7% 5% 5% 9%
Fairly disagree (2) 149 30 20 13 9 11 18 10 9 11 19 77 72 97 528% 17% 10% 11% 5% 8% 11% 6% 3% 6% 10% 9% 8% 8% 9%
Fairly agree (3) 589 91 61 42 67 33 40 58 80 51 65 299 289 377 21233% 52% 31% 35% 42% 25% 25% 34% 26% 29% 36% 36% 31% 32% 35%
Strongly agree (4) 746 32 71 38 67 62 75 84 169 76 72 320 426 501 24642% 18% 36% 32% 42% 47% 46% 50% 55% 44% 40% 38% 45% 43% 40%
Don't know 189 19 30 13 9 17 19 9 38 18 18 87 102 142 4711% 11% 15% 11% 6% 13% 11% 5% 12% 10% 10% 10% 11% 12% 8%
NETS
Net: Disagree 259 33 37 28 17 19 28 18 21 29 27 135 124 153 10515% 19% 19% 23% 11% 14% 17% 11% 7% 17% 15% 16% 13% 13% 17%
Net: Agree 1335 123 132 80 134 95 115 142 249 127 137 620 715 878 45775% 70% 66% 66% 84% 73% 71% 84% 81% 73% 75% 74% 76% 75% 75%
Mean score 3.24 2.97 3.10 2.96 3.27 3.31 3.26 3.35 3.50 3.18 3.22 3.17 3.30 3.28 3.15Standard deviation .88 .70 .97 1.01 .81 .91 .93 .83 .77 1.00 .84 .90 .87 .85 .94Standard error .02 .06 .08 .10 .07 .10 .09 .07 .05 .08 .07 .03 .03 .03 .04
Online fieldwork: 26th March - 15th April 2015 Prepared by ComRes Ltd
Page 167

Table 82/2
European Youth Survey - All marketsQ14_4. To what extent, if at all, do you agree or disagree that social media enables you to do the following with your classmates? - Organising study groups/ meet-upsBase: All students
EDUCATION WORK STATUS
Total
Uppersecondary
or lessVocational
trainingUniversity
degreePostgraduate
degree Employees Students EntrepreneursNot
working
Unweighted Total 1613 894 182 451 59 - 1613 - -
Weighted Total 1783 1062 203 437 52 - 1783 - -100% 100% 100% 100% 100% - 100% - -
Strongly disagree (1) 110 60 19 22 5 - 110 - -6% 6% 10% 5% 10% - 6% - -
Fairly disagree (2) 149 84 20 34 9 - 149 - -8% 8% 10% 8% 18% - 8% - -
Fairly agree (3) 589 352 69 150 11 - 589 - -33% 33% 34% 34% 21% - 33% - -
Strongly agree (4) 746 447 70 196 20 - 746 - -42% 42% 35% 45% 38% - 42% - -
Don't know 189 120 24 36 7 - 189 - -11% 11% 12% 8% 13% - 11% - -
NETS
Net: Disagree 259 144 39 56 15 - 259 - -15% 14% 19% 13% 28% - 15% - -
Net: Agree 1335 799 140 346 31 - 1335 - -75% 75% 69% 79% 60% - 75% - -
Mean score 3.24 3.26 3.07 3.29 3.01 - 3.24 - -Standard deviation .88 .87 .97 .84 1.06 - .88 - -Standard error .02 .03 .08 .04 .15 - .02 - -
Online fieldwork: 26th March - 15th April 2015 Prepared by ComRes Ltd
Page 168

Table 83/1
European Youth Survey - All marketsQ14_5. To what extent, if at all, do you agree or disagree that social media enables you to do the following with your classmates? - Campaigning for better campus services or facilitiesBase: All students
COUNTRY GENDER AGE
Total Italy Germany France Spain UKEasternEurope Baltic Nordics Sweden Benelux Male Female 18-22 22-29
Unweighted Total 1613 153 173 111 150 103 124 157 295 163 184 770 843 907 706
Weighted Total 1783 176 199 121 161 131 161 170 308 175 182 842 941 1173 610100% 100% 100% 100% 100% 100% 100% 100% 100% 100% 100% 100% 100% 100% 100%
Strongly disagree (1) 211 6 35 16 19 17 15 21 32 39 11 105 106 111 10012% 4% 17% 13% 12% 13% 9% 13% 10% 22% 6% 13% 11% 9% 16%
Fairly disagree (2) 244 30 36 17 26 13 25 25 27 17 28 121 123 163 8114% 17% 18% 14% 16% 10% 16% 15% 9% 9% 15% 14% 13% 14% 13%
Fairly agree (3) 637 89 64 44 60 37 46 52 117 50 78 329 308 418 21936% 51% 32% 37% 37% 28% 28% 31% 38% 29% 43% 39% 33% 36% 36%
Strongly agree (4) 340 23 23 24 42 37 46 32 49 23 41 152 188 233 10719% 13% 11% 20% 26% 28% 29% 19% 16% 13% 22% 18% 20% 20% 17%
Don't know 352 29 42 20 14 27 30 39 83 46 24 134 218 248 10320% 16% 21% 16% 9% 21% 18% 23% 27% 26% 13% 16% 23% 21% 17%
NETS
Net: Disagree 455 36 70 33 45 30 40 47 59 56 39 227 228 274 18126% 20% 35% 27% 28% 23% 25% 28% 19% 32% 21% 27% 24% 23% 30%
Net: Agree 977 112 87 68 101 74 92 84 166 74 119 481 495 651 32655% 63% 44% 56% 63% 57% 57% 49% 54% 42% 66% 57% 53% 55% 53%
Mean score 2.77 2.87 2.48 2.75 2.84 2.91 2.94 2.72 2.81 2.45 2.94 2.75 2.80 2.84 2.66Standard deviation .97 .72 .99 .99 .98 1.06 1.00 1.01 .94 1.11 .84 .96 .99 .94 1.02Standard error .03 .06 .08 .10 .08 .12 .10 .09 .06 .10 .07 .04 .04 .04 .04
Online fieldwork: 26th March - 15th April 2015 Prepared by ComRes Ltd
Page 169
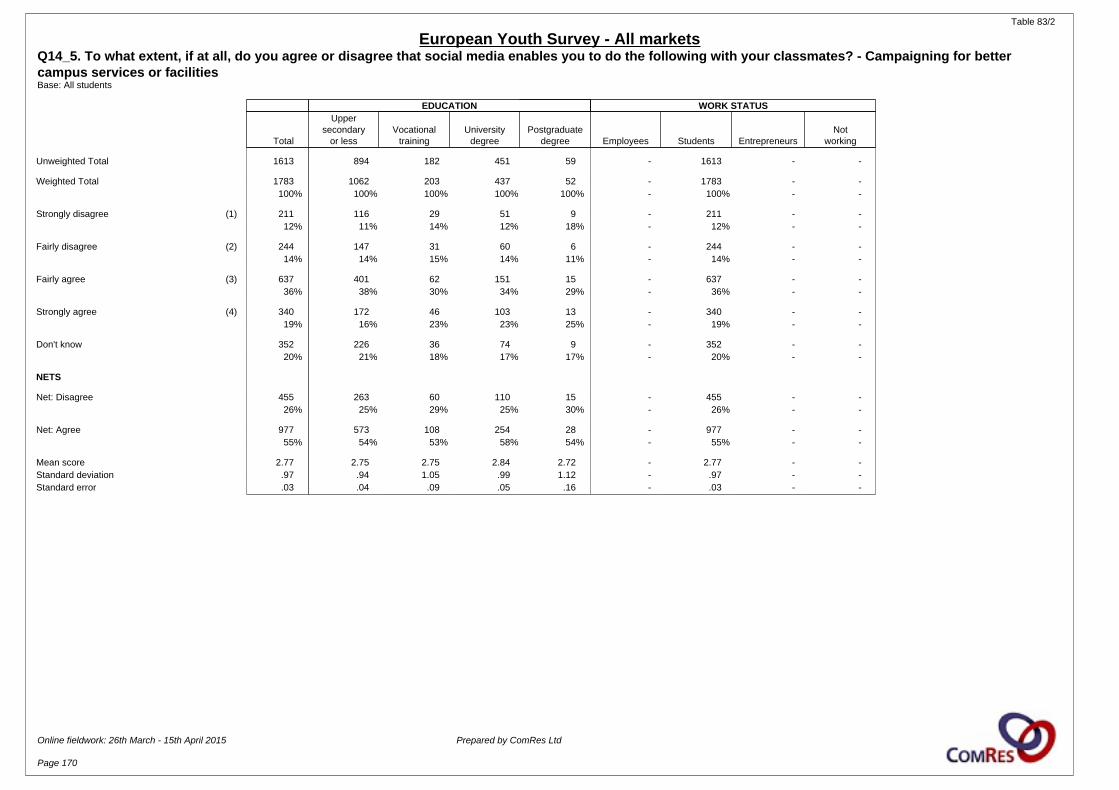
Table 83/2
European Youth Survey - All marketsQ14_5. To what extent, if at all, do you agree or disagree that social media enables you to do the following with your classmates? - Campaigning for better campus services or facilitiesBase: All students
EDUCATION WORK STATUS
Total
Uppersecondary
or lessVocational
trainingUniversity
degreePostgraduate
degree Employees Students EntrepreneursNot
working
Unweighted Total 1613 894 182 451 59 - 1613 - -
Weighted Total 1783 1062 203 437 52 - 1783 - -100% 100% 100% 100% 100% - 100% - -
Strongly disagree (1) 211 116 29 51 9 - 211 - -12% 11% 14% 12% 18% - 12% - -
Fairly disagree (2) 244 147 31 60 6 - 244 - -14% 14% 15% 14% 11% - 14% - -
Fairly agree (3) 637 401 62 151 15 - 637 - -36% 38% 30% 34% 29% - 36% - -
Strongly agree (4) 340 172 46 103 13 - 340 - -19% 16% 23% 23% 25% - 19% - -
Don't know 352 226 36 74 9 - 352 - -20% 21% 18% 17% 17% - 20% - -
NETS
Net: Disagree 455 263 60 110 15 - 455 - -26% 25% 29% 25% 30% - 26% - -
Net: Agree 977 573 108 254 28 - 977 - -55% 54% 53% 58% 54% - 55% - -
Mean score 2.77 2.75 2.75 2.84 2.72 - 2.77 - -Standard deviation .97 .94 1.05 .99 1.12 - .97 - -Standard error .03 .04 .09 .05 .16 - .03 - -
Online fieldwork: 26th March - 15th April 2015 Prepared by ComRes Ltd
Page 170

Table 84/1
European Youth Survey - All marketsQ14_6. To what extent, if at all, do you agree or disagree that social media enables you to do the following with your classmates? - Petitioning for specific changes to the courseBase: All students
COUNTRY GENDER AGE
Total Italy Germany France Spain UKEasternEurope Baltic Nordics Sweden Benelux Male Female 18-22 22-29
Unweighted Total 1613 153 173 111 150 103 124 157 295 163 184 770 843 907 706
Weighted Total 1783 176 199 121 161 131 161 170 308 175 182 842 941 1173 610100% 100% 100% 100% 100% 100% 100% 100% 100% 100% 100% 100% 100% 100% 100%
Strongly disagree (1) 230 15 36 6 21 18 15 21 43 37 19 116 113 118 11213% 9% 18% 5% 13% 14% 9% 12% 14% 21% 10% 14% 12% 10% 18%
Fairly disagree (2) 301 31 37 25 35 26 18 26 52 18 34 158 143 197 10417% 18% 19% 20% 22% 20% 11% 16% 17% 10% 19% 19% 15% 17% 17%
Fairly agree (3) 595 80 57 44 58 36 54 58 91 49 67 296 299 401 19433% 45% 29% 36% 36% 28% 34% 34% 30% 28% 37% 35% 32% 34% 32%
Strongly agree (4) 323 27 27 26 31 23 45 34 39 33 39 134 189 218 10518% 15% 13% 22% 19% 17% 28% 20% 13% 19% 21% 16% 20% 19% 17%
Don't know 334 23 43 20 16 28 29 31 83 37 24 138 196 239 9519% 13% 21% 17% 10% 22% 18% 18% 27% 21% 13% 16% 21% 20% 16%
NETS
Net: Disagree 531 46 73 31 55 44 33 47 95 55 53 274 257 315 21630% 26% 36% 25% 35% 33% 20% 28% 31% 31% 29% 33% 27% 27% 35%
Net: Agree 918 107 84 70 90 59 99 92 130 83 105 429 489 619 29951% 61% 42% 58% 56% 45% 62% 54% 42% 47% 58% 51% 52% 53% 49%
Mean score 2.70 2.77 2.48 2.89 2.69 2.62 2.98 2.76 2.56 2.58 2.79 2.63 2.76 2.77 2.57Standard deviation .99 .85 1.03 .86 .97 1.02 .97 .99 .99 1.13 .95 .97 1.00 .95 1.04Standard error .03 .07 .09 .09 .08 .11 .09 .09 .07 .10 .08 .04 .04 .04 .04
Online fieldwork: 26th March - 15th April 2015 Prepared by ComRes Ltd
Page 171
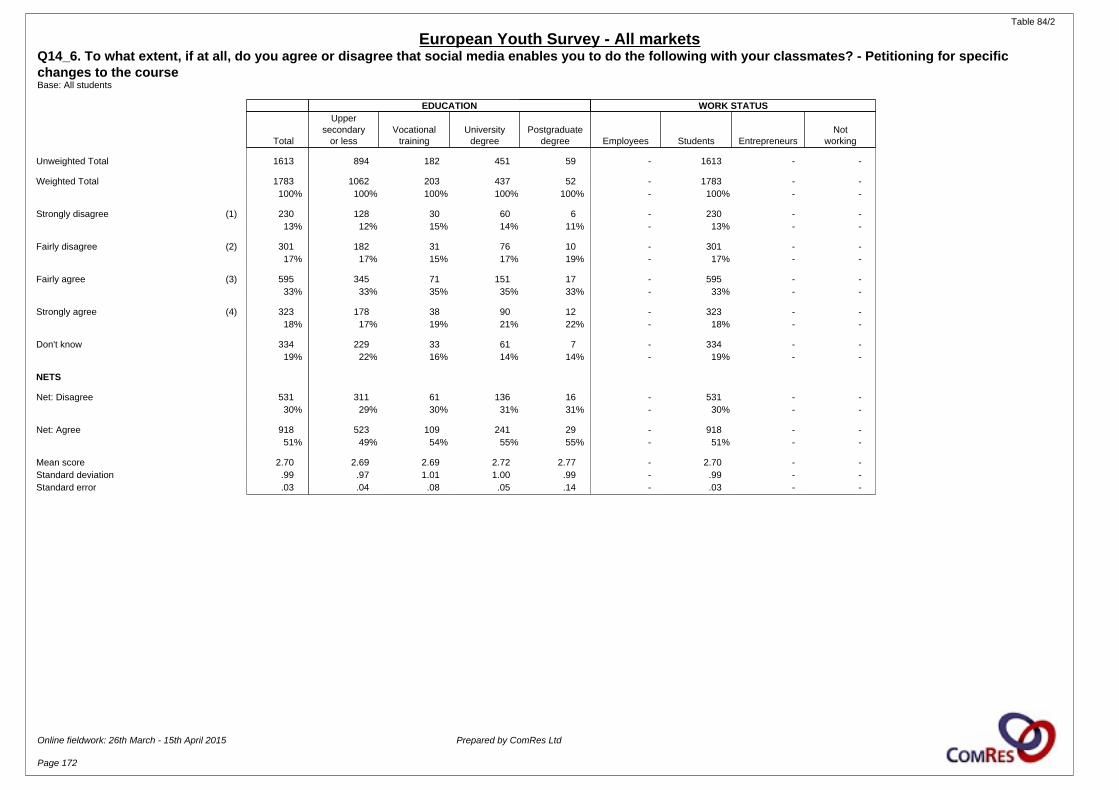
Table 84/2
European Youth Survey - All marketsQ14_6. To what extent, if at all, do you agree or disagree that social media enables you to do the following with your classmates? - Petitioning for specific changes to the courseBase: All students
EDUCATION WORK STATUS
Total
Uppersecondary
or lessVocational
trainingUniversity
degreePostgraduate
degree Employees Students EntrepreneursNot
working
Unweighted Total 1613 894 182 451 59 - 1613 - -
Weighted Total 1783 1062 203 437 52 - 1783 - -100% 100% 100% 100% 100% - 100% - -
Strongly disagree (1) 230 128 30 60 6 - 230 - -13% 12% 15% 14% 11% - 13% - -
Fairly disagree (2) 301 182 31 76 10 - 301 - -17% 17% 15% 17% 19% - 17% - -
Fairly agree (3) 595 345 71 151 17 - 595 - -33% 33% 35% 35% 33% - 33% - -
Strongly agree (4) 323 178 38 90 12 - 323 - -18% 17% 19% 21% 22% - 18% - -
Don't know 334 229 33 61 7 - 334 - -19% 22% 16% 14% 14% - 19% - -
NETS
Net: Disagree 531 311 61 136 16 - 531 - -30% 29% 30% 31% 31% - 30% - -
Net: Agree 918 523 109 241 29 - 918 - -51% 49% 54% 55% 55% - 51% - -
Mean score 2.70 2.69 2.69 2.72 2.77 - 2.70 - -Standard deviation .99 .97 1.01 1.00 .99 - .99 - -Standard error .03 .04 .08 .05 .14 - .03 - -
Online fieldwork: 26th March - 15th April 2015 Prepared by ComRes Ltd
Page 172
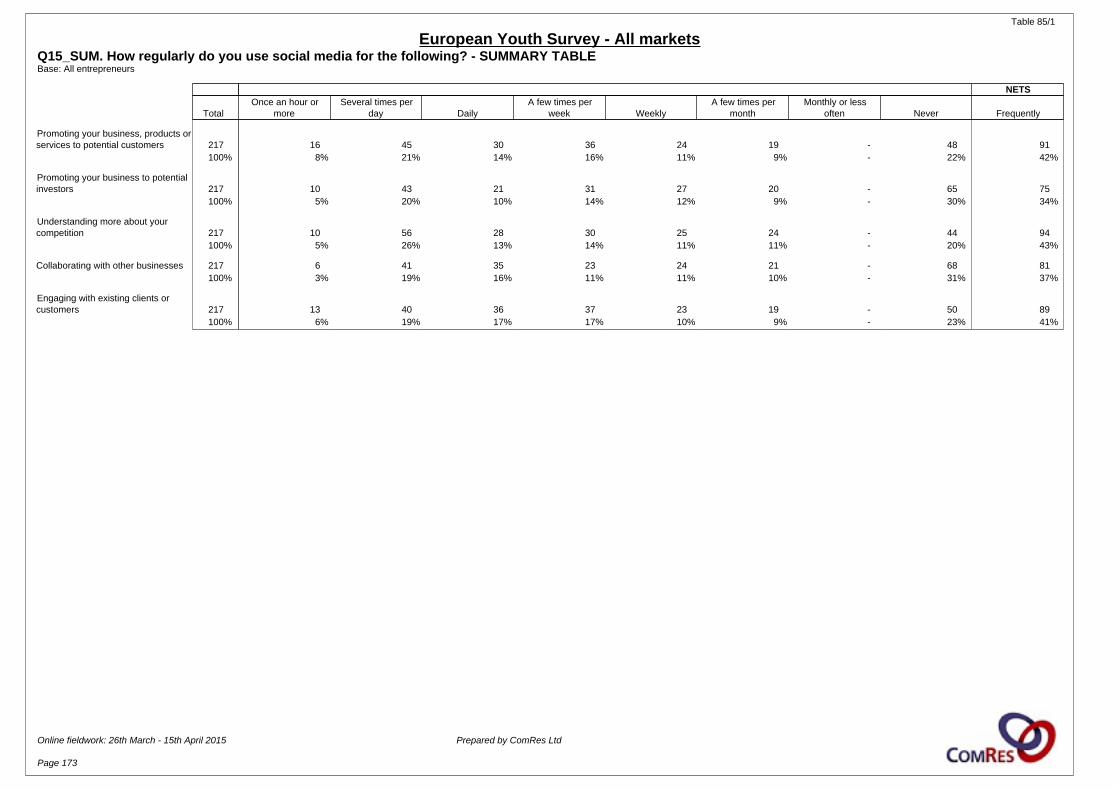
Table 85/1
European Youth Survey - All marketsQ15_SUM. How regularly do you use social media for the following? - SUMMARY TABLEBase: All entrepreneurs
NETS
TotalOnce an hour or
moreSeveral times per
day DailyA few times per
week WeeklyA few times per
monthMonthly or less
often Never Frequently
Promoting your business, products orservices to potential customers 217 16 45 30 36 24 19 - 48 91
100% 8% 21% 14% 16% 11% 9% - 22% 42%
Promoting your business to potentialinvestors 217 10 43 21 31 27 20 - 65 75
100% 5% 20% 10% 14% 12% 9% - 30% 34%
Understanding more about yourcompetition 217 10 56 28 30 25 24 - 44 94
100% 5% 26% 13% 14% 11% 11% - 20% 43%
Collaborating with other businesses 217 6 41 35 23 24 21 - 68 81100% 3% 19% 16% 11% 11% 10% - 31% 37%
Engaging with existing clients orcustomers 217 13 40 36 37 23 19 - 50 89
100% 6% 19% 17% 17% 10% 9% - 23% 41%
Online fieldwork: 26th March - 15th April 2015 Prepared by ComRes Ltd
Page 173
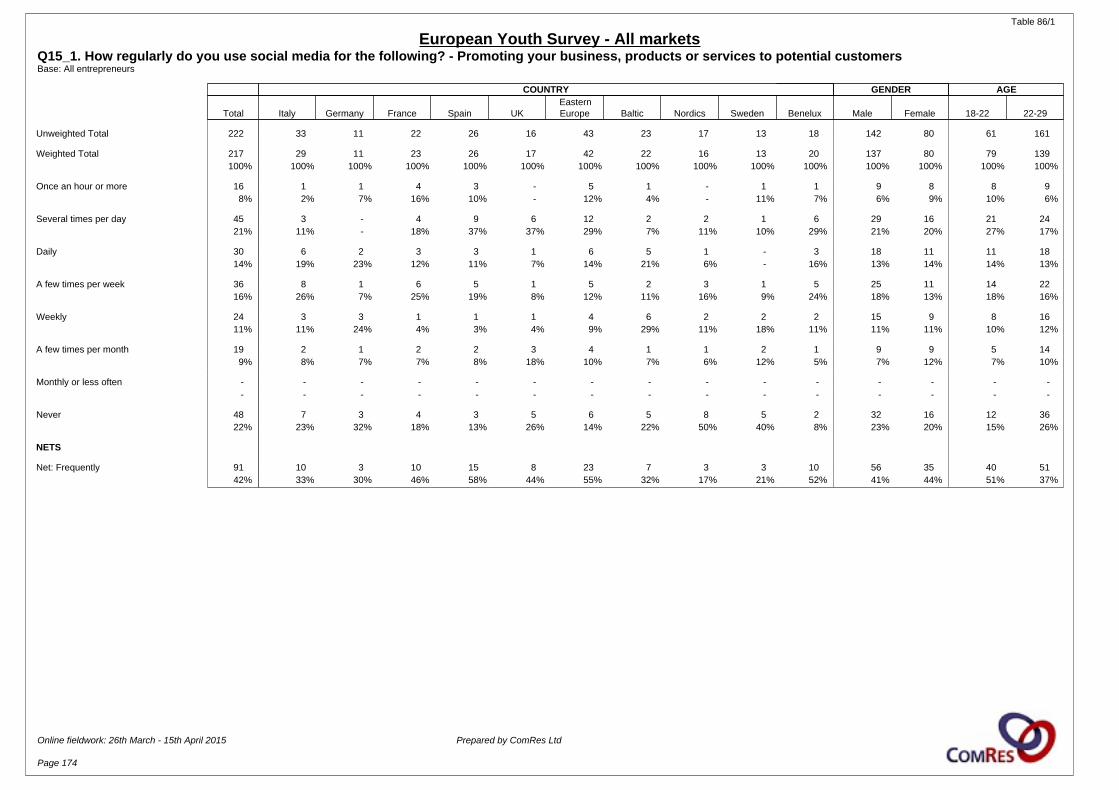
Table 86/1
European Youth Survey - All marketsQ15_1. How regularly do you use social media for the following? - Promoting your business, products or services to potential customersBase: All entrepreneurs
COUNTRY GENDER AGE
Total Italy Germany France Spain UKEasternEurope Baltic Nordics Sweden Benelux Male Female 18-22 22-29
Unweighted Total 222 33 11 22 26 16 43 23 17 13 18 142 80 61 161
Weighted Total 217 29 11 23 26 17 42 22 16 13 20 137 80 79 139100% 100% 100% 100% 100% 100% 100% 100% 100% 100% 100% 100% 100% 100% 100%
Once an hour or more 16 1 1 4 3 - 5 1 - 1 1 9 8 8 98% 2% 7% 16% 10% - 12% 4% - 11% 7% 6% 9% 10% 6%
Several times per day 45 3 - 4 9 6 12 2 2 1 6 29 16 21 2421% 11% - 18% 37% 37% 29% 7% 11% 10% 29% 21% 20% 27% 17%
Daily 30 6 2 3 3 1 6 5 1 - 3 18 11 11 1814% 19% 23% 12% 11% 7% 14% 21% 6% - 16% 13% 14% 14% 13%
A few times per week 36 8 1 6 5 1 5 2 3 1 5 25 11 14 2216% 26% 7% 25% 19% 8% 12% 11% 16% 9% 24% 18% 13% 18% 16%
Weekly 24 3 3 1 1 1 4 6 2 2 2 15 9 8 1611% 11% 24% 4% 3% 4% 9% 29% 11% 18% 11% 11% 11% 10% 12%
A few times per month 19 2 1 2 2 3 4 1 1 2 1 9 9 5 149% 8% 7% 7% 8% 18% 10% 7% 6% 12% 5% 7% 12% 7% 10%
Monthly or less often - - - - - - - - - - - - - - -- - - - - - - - - - - - - - -
Never 48 7 3 4 3 5 6 5 8 5 2 32 16 12 3622% 23% 32% 18% 13% 26% 14% 22% 50% 40% 8% 23% 20% 15% 26%
NETS
Net: Frequently 91 10 3 10 15 8 23 7 3 3 10 56 35 40 5142% 33% 30% 46% 58% 44% 55% 32% 17% 21% 52% 41% 44% 51% 37%
Online fieldwork: 26th March - 15th April 2015 Prepared by ComRes Ltd
Page 174
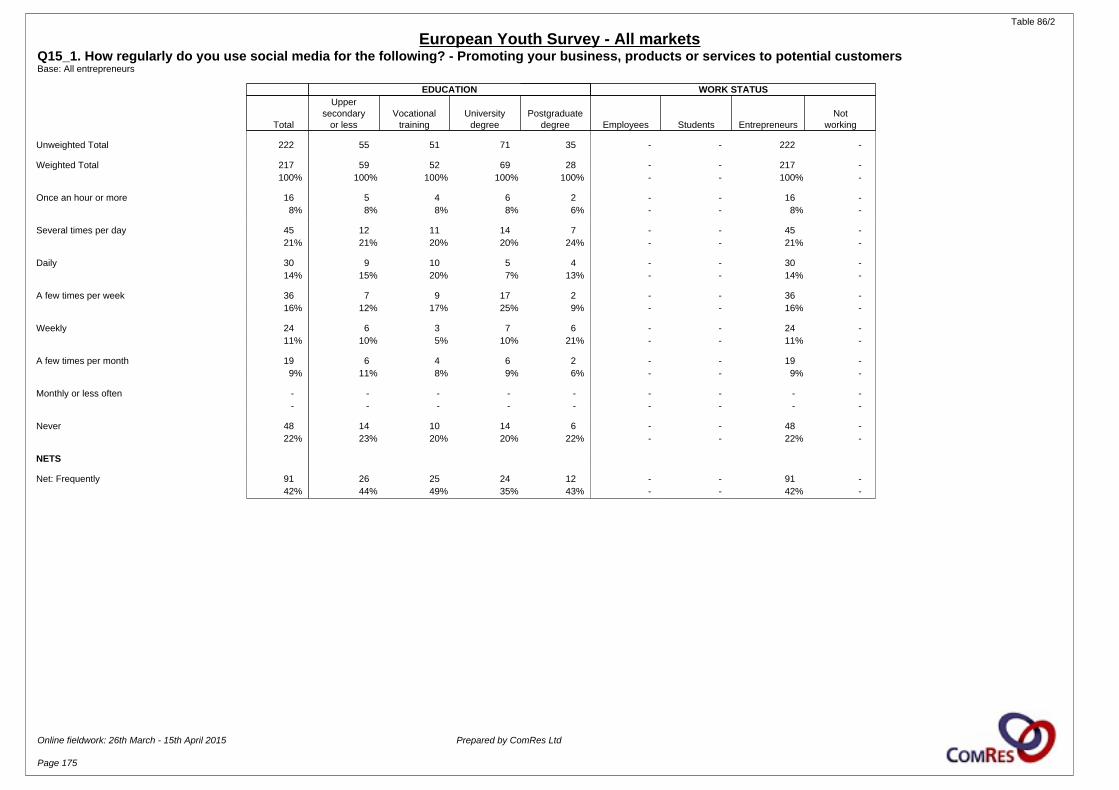
Table 86/2
European Youth Survey - All marketsQ15_1. How regularly do you use social media for the following? - Promoting your business, products or services to potential customersBase: All entrepreneurs
EDUCATION WORK STATUS
Total
Uppersecondary
or lessVocational
trainingUniversity
degreePostgraduate
degree Employees Students EntrepreneursNot
working
Unweighted Total 222 55 51 71 35 - - 222 -
Weighted Total 217 59 52 69 28 - - 217 -100% 100% 100% 100% 100% - - 100% -
Once an hour or more 16 5 4 6 2 - - 16 -8% 8% 8% 8% 6% - - 8% -
Several times per day 45 12 11 14 7 - - 45 -21% 21% 20% 20% 24% - - 21% -
Daily 30 9 10 5 4 - - 30 -14% 15% 20% 7% 13% - - 14% -
A few times per week 36 7 9 17 2 - - 36 -16% 12% 17% 25% 9% - - 16% -
Weekly 24 6 3 7 6 - - 24 -11% 10% 5% 10% 21% - - 11% -
A few times per month 19 6 4 6 2 - - 19 -9% 11% 8% 9% 6% - - 9% -
Monthly or less often - - - - - - - - -- - - - - - - - -
Never 48 14 10 14 6 - - 48 -22% 23% 20% 20% 22% - - 22% -
NETS
Net: Frequently 91 26 25 24 12 - - 91 -42% 44% 49% 35% 43% - - 42% -
Online fieldwork: 26th March - 15th April 2015 Prepared by ComRes Ltd
Page 175

Table 87/1
European Youth Survey - All marketsQ15_2. How regularly do you use social media for the following? - Promoting your business to potential investorsBase: All entrepreneurs
COUNTRY GENDER AGE
Total Italy Germany France Spain UKEasternEurope Baltic Nordics Sweden Benelux Male Female 18-22 22-29
Unweighted Total 222 33 11 22 26 16 43 23 17 13 18 142 80 61 161
Weighted Total 217 29 11 23 26 17 42 22 16 13 20 137 80 79 139100% 100% 100% 100% 100% 100% 100% 100% 100% 100% 100% 100% 100% 100% 100%
Once an hour or more 10 1 - 3 2 - 1 - - 1 3 7 3 7 45% 2% - 14% 7% - 2% - - 11% 13% 5% 4% 8% 3%
Several times per day 43 4 1 3 10 4 12 4 2 1 3 27 15 17 2620% 13% 7% 15% 38% 21% 28% 18% 11% 6% 16% 20% 19% 21% 19%
Daily 21 3 1 3 3 2 6 1 - - 3 16 5 8 1310% 11% 7% 13% 12% 10% 15% 4% - - 16% 12% 7% 10% 10%
A few times per week 31 6 1 5 2 2 7 2 2 - 3 20 11 14 1714% 22% 14% 22% 6% 11% 17% 11% 12% - 16% 15% 13% 18% 12%
Weekly 27 2 1 3 3 2 3 3 2 2 5 18 9 10 1712% 8% 9% 15% 10% 12% 8% 15% 11% 17% 25% 13% 11% 12% 12%
A few times per month 20 4 2 1 1 2 3 4 1 2 1 12 8 6 149% 13% 16% 4% 3% 10% 8% 19% 6% 14% 5% 9% 10% 8% 10%
Monthly or less often - - - - - - - - - - - - - - -- - - - - - - - - - - - - - -
Never 65 9 5 4 6 6 9 7 10 7 2 37 28 17 4830% 31% 47% 18% 23% 37% 22% 34% 60% 52% 8% 27% 36% 22% 35%
NETS
Net: Frequently 75 8 1 9 15 5 19 5 2 2 9 51 24 31 4334% 26% 14% 41% 58% 30% 45% 22% 11% 17% 46% 37% 30% 40% 31%
Online fieldwork: 26th March - 15th April 2015 Prepared by ComRes Ltd
Page 176
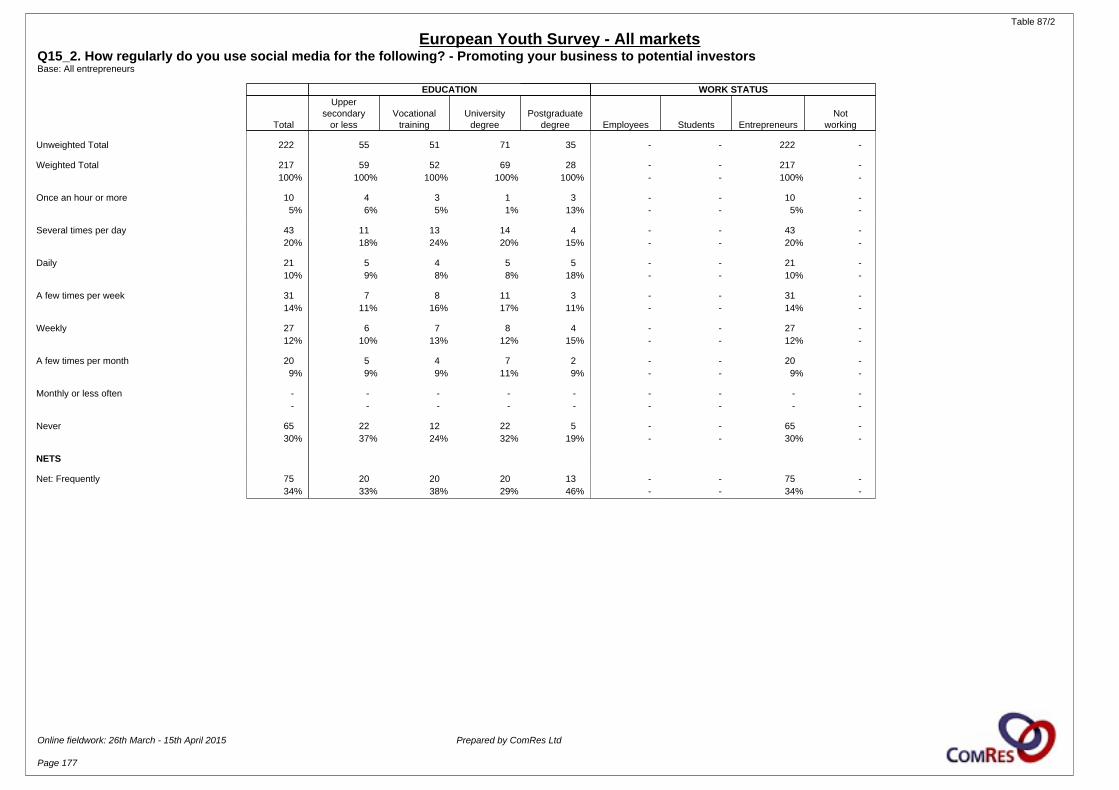
Table 87/2
European Youth Survey - All marketsQ15_2. How regularly do you use social media for the following? - Promoting your business to potential investorsBase: All entrepreneurs
EDUCATION WORK STATUS
Total
Uppersecondary
or lessVocational
trainingUniversity
degreePostgraduate
degree Employees Students EntrepreneursNot
working
Unweighted Total 222 55 51 71 35 - - 222 -
Weighted Total 217 59 52 69 28 - - 217 -100% 100% 100% 100% 100% - - 100% -
Once an hour or more 10 4 3 1 3 - - 10 -5% 6% 5% 1% 13% - - 5% -
Several times per day 43 11 13 14 4 - - 43 -20% 18% 24% 20% 15% - - 20% -
Daily 21 5 4 5 5 - - 21 -10% 9% 8% 8% 18% - - 10% -
A few times per week 31 7 8 11 3 - - 31 -14% 11% 16% 17% 11% - - 14% -
Weekly 27 6 7 8 4 - - 27 -12% 10% 13% 12% 15% - - 12% -
A few times per month 20 5 4 7 2 - - 20 -9% 9% 9% 11% 9% - - 9% -
Monthly or less often - - - - - - - - -- - - - - - - - -
Never 65 22 12 22 5 - - 65 -30% 37% 24% 32% 19% - - 30% -
NETS
Net: Frequently 75 20 20 20 13 - - 75 -34% 33% 38% 29% 46% - - 34% -
Online fieldwork: 26th March - 15th April 2015 Prepared by ComRes Ltd
Page 177
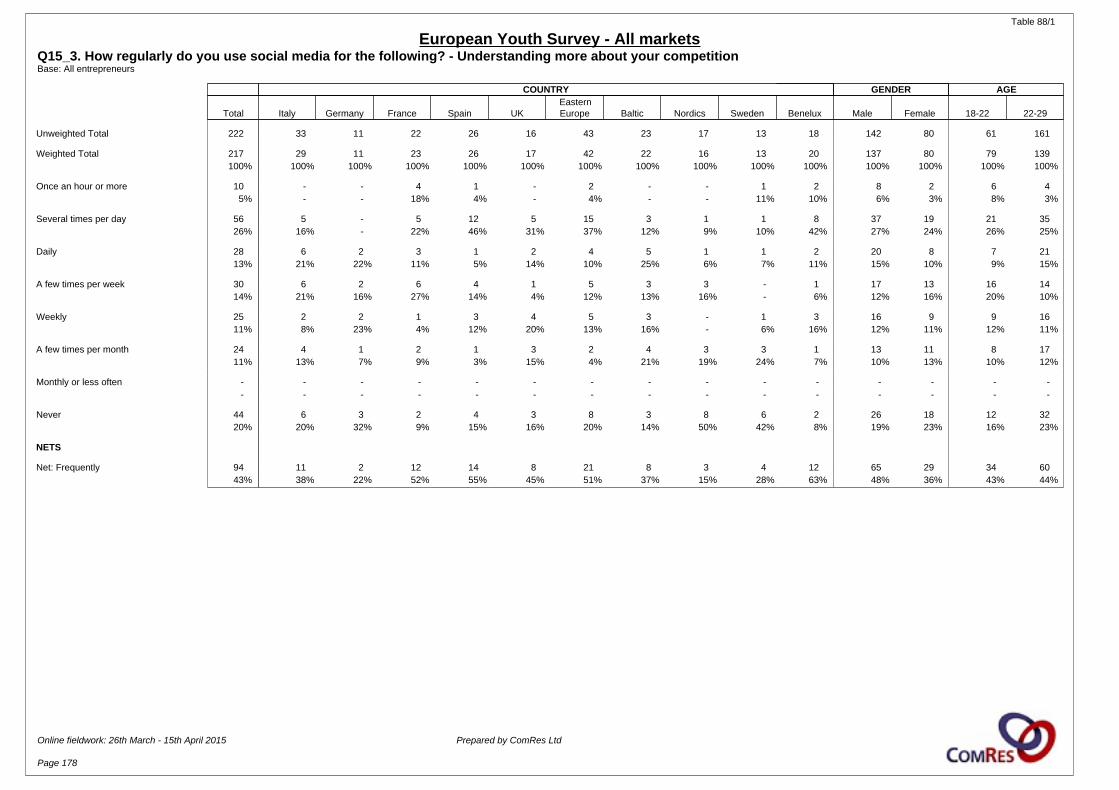
Table 88/1
European Youth Survey - All marketsQ15_3. How regularly do you use social media for the following? - Understanding more about your competitionBase: All entrepreneurs
COUNTRY GENDER AGE
Total Italy Germany France Spain UKEasternEurope Baltic Nordics Sweden Benelux Male Female 18-22 22-29
Unweighted Total 222 33 11 22 26 16 43 23 17 13 18 142 80 61 161
Weighted Total 217 29 11 23 26 17 42 22 16 13 20 137 80 79 139100% 100% 100% 100% 100% 100% 100% 100% 100% 100% 100% 100% 100% 100% 100%
Once an hour or more 10 - - 4 1 - 2 - - 1 2 8 2 6 45% - - 18% 4% - 4% - - 11% 10% 6% 3% 8% 3%
Several times per day 56 5 - 5 12 5 15 3 1 1 8 37 19 21 3526% 16% - 22% 46% 31% 37% 12% 9% 10% 42% 27% 24% 26% 25%
Daily 28 6 2 3 1 2 4 5 1 1 2 20 8 7 2113% 21% 22% 11% 5% 14% 10% 25% 6% 7% 11% 15% 10% 9% 15%
A few times per week 30 6 2 6 4 1 5 3 3 - 1 17 13 16 1414% 21% 16% 27% 14% 4% 12% 13% 16% - 6% 12% 16% 20% 10%
Weekly 25 2 2 1 3 4 5 3 - 1 3 16 9 9 1611% 8% 23% 4% 12% 20% 13% 16% - 6% 16% 12% 11% 12% 11%
A few times per month 24 4 1 2 1 3 2 4 3 3 1 13 11 8 1711% 13% 7% 9% 3% 15% 4% 21% 19% 24% 7% 10% 13% 10% 12%
Monthly or less often - - - - - - - - - - - - - - -- - - - - - - - - - - - - - -
Never 44 6 3 2 4 3 8 3 8 6 2 26 18 12 3220% 20% 32% 9% 15% 16% 20% 14% 50% 42% 8% 19% 23% 16% 23%
NETS
Net: Frequently 94 11 2 12 14 8 21 8 3 4 12 65 29 34 6043% 38% 22% 52% 55% 45% 51% 37% 15% 28% 63% 48% 36% 43% 44%
Online fieldwork: 26th March - 15th April 2015 Prepared by ComRes Ltd
Page 178
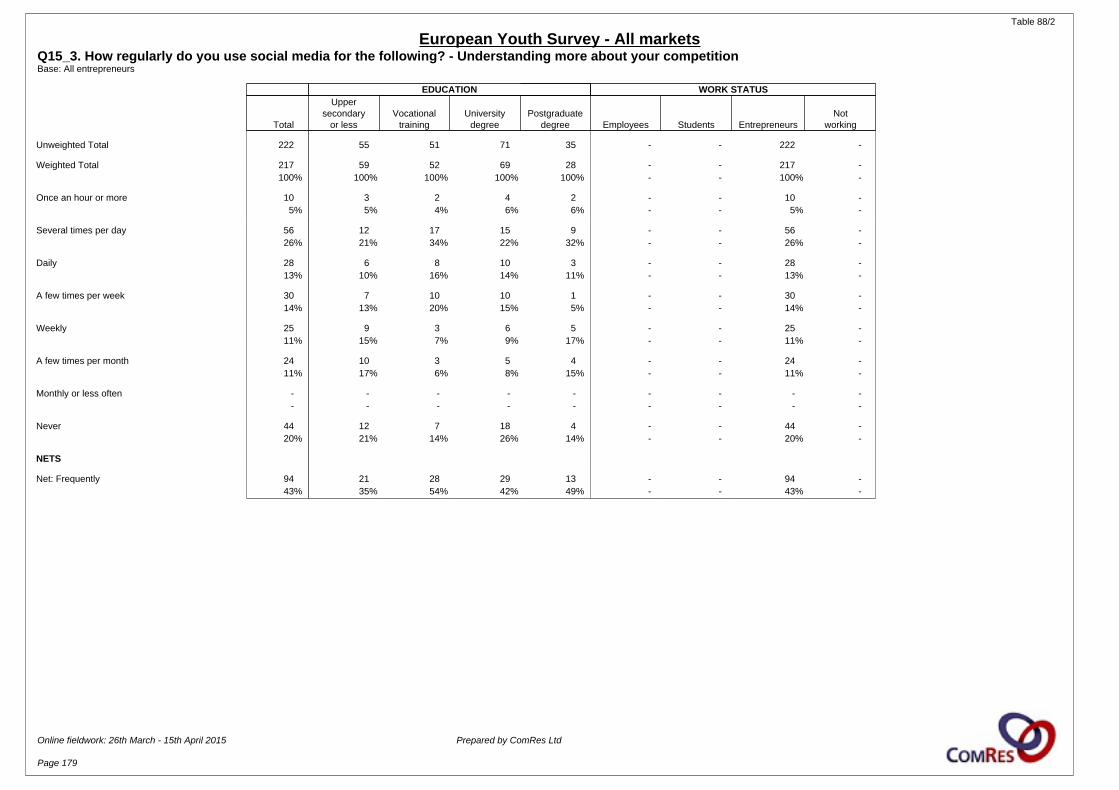
Table 88/2
European Youth Survey - All marketsQ15_3. How regularly do you use social media for the following? - Understanding more about your competitionBase: All entrepreneurs
EDUCATION WORK STATUS
Total
Uppersecondary
or lessVocational
trainingUniversity
degreePostgraduate
degree Employees Students EntrepreneursNot
working
Unweighted Total 222 55 51 71 35 - - 222 -
Weighted Total 217 59 52 69 28 - - 217 -100% 100% 100% 100% 100% - - 100% -
Once an hour or more 10 3 2 4 2 - - 10 -5% 5% 4% 6% 6% - - 5% -
Several times per day 56 12 17 15 9 - - 56 -26% 21% 34% 22% 32% - - 26% -
Daily 28 6 8 10 3 - - 28 -13% 10% 16% 14% 11% - - 13% -
A few times per week 30 7 10 10 1 - - 30 -14% 13% 20% 15% 5% - - 14% -
Weekly 25 9 3 6 5 - - 25 -11% 15% 7% 9% 17% - - 11% -
A few times per month 24 10 3 5 4 - - 24 -11% 17% 6% 8% 15% - - 11% -
Monthly or less often - - - - - - - - -- - - - - - - - -
Never 44 12 7 18 4 - - 44 -20% 21% 14% 26% 14% - - 20% -
NETS
Net: Frequently 94 21 28 29 13 - - 94 -43% 35% 54% 42% 49% - - 43% -
Online fieldwork: 26th March - 15th April 2015 Prepared by ComRes Ltd
Page 179
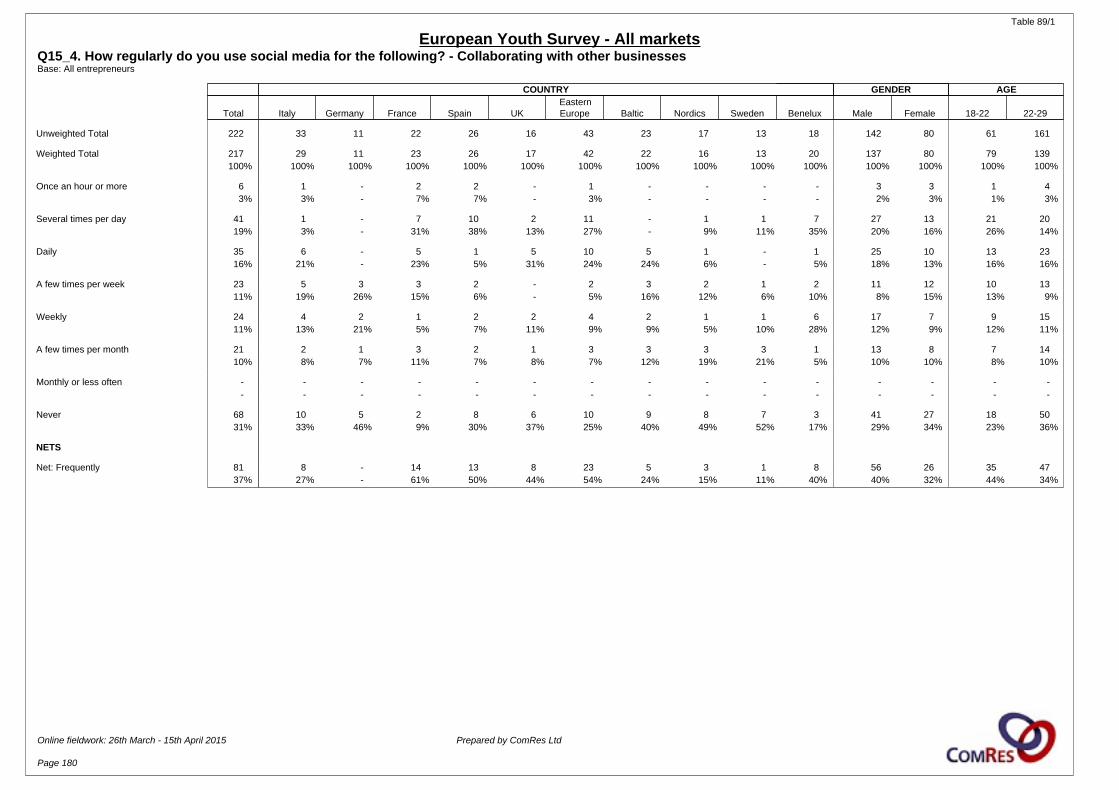
Table 89/1
European Youth Survey - All marketsQ15_4. How regularly do you use social media for the following? - Collaborating with other businessesBase: All entrepreneurs
COUNTRY GENDER AGE
Total Italy Germany France Spain UKEasternEurope Baltic Nordics Sweden Benelux Male Female 18-22 22-29
Unweighted Total 222 33 11 22 26 16 43 23 17 13 18 142 80 61 161
Weighted Total 217 29 11 23 26 17 42 22 16 13 20 137 80 79 139100% 100% 100% 100% 100% 100% 100% 100% 100% 100% 100% 100% 100% 100% 100%
Once an hour or more 6 1 - 2 2 - 1 - - - - 3 3 1 43% 3% - 7% 7% - 3% - - - - 2% 3% 1% 3%
Several times per day 41 1 - 7 10 2 11 - 1 1 7 27 13 21 2019% 3% - 31% 38% 13% 27% - 9% 11% 35% 20% 16% 26% 14%
Daily 35 6 - 5 1 5 10 5 1 - 1 25 10 13 2316% 21% - 23% 5% 31% 24% 24% 6% - 5% 18% 13% 16% 16%
A few times per week 23 5 3 3 2 - 2 3 2 1 2 11 12 10 1311% 19% 26% 15% 6% - 5% 16% 12% 6% 10% 8% 15% 13% 9%
Weekly 24 4 2 1 2 2 4 2 1 1 6 17 7 9 1511% 13% 21% 5% 7% 11% 9% 9% 5% 10% 28% 12% 9% 12% 11%
A few times per month 21 2 1 3 2 1 3 3 3 3 1 13 8 7 1410% 8% 7% 11% 7% 8% 7% 12% 19% 21% 5% 10% 10% 8% 10%
Monthly or less often - - - - - - - - - - - - - - -- - - - - - - - - - - - - - -
Never 68 10 5 2 8 6 10 9 8 7 3 41 27 18 5031% 33% 46% 9% 30% 37% 25% 40% 49% 52% 17% 29% 34% 23% 36%
NETS
Net: Frequently 81 8 - 14 13 8 23 5 3 1 8 56 26 35 4737% 27% - 61% 50% 44% 54% 24% 15% 11% 40% 40% 32% 44% 34%
Online fieldwork: 26th March - 15th April 2015 Prepared by ComRes Ltd
Page 180

Table 89/2
European Youth Survey - All marketsQ15_4. How regularly do you use social media for the following? - Collaborating with other businessesBase: All entrepreneurs
EDUCATION WORK STATUS
Total
Uppersecondary
or lessVocational
trainingUniversity
degreePostgraduate
degree Employees Students EntrepreneursNot
working
Unweighted Total 222 55 51 71 35 - - 222 -
Weighted Total 217 59 52 69 28 - - 217 -100% 100% 100% 100% 100% - - 100% -
Once an hour or more 6 - 2 1 2 - - 6 -3% - 4% 2% 9% - - 3% -
Several times per day 41 7 13 12 7 - - 41 -19% 12% 25% 17% 25% - - 19% -
Daily 35 11 8 11 4 - - 35 -16% 19% 16% 16% 13% - - 16% -
A few times per week 23 5 6 11 1 - - 23 -11% 8% 11% 16% 3% - - 11% -
Weekly 24 7 4 6 4 - - 24 -11% 11% 9% 9% 16% - - 11% -
A few times per month 21 7 4 6 3 - - 21 -10% 11% 8% 9% 13% - - 10% -
Monthly or less often - - - - - - - - -- - - - - - - - -
Never 68 23 14 21 6 - - 68 -31% 39% 28% 30% 22% - - 31% -
NETS
Net: Frequently 81 18 23 24 13 - - 81 -37% 30% 45% 36% 46% - - 37% -
Online fieldwork: 26th March - 15th April 2015 Prepared by ComRes Ltd
Page 181
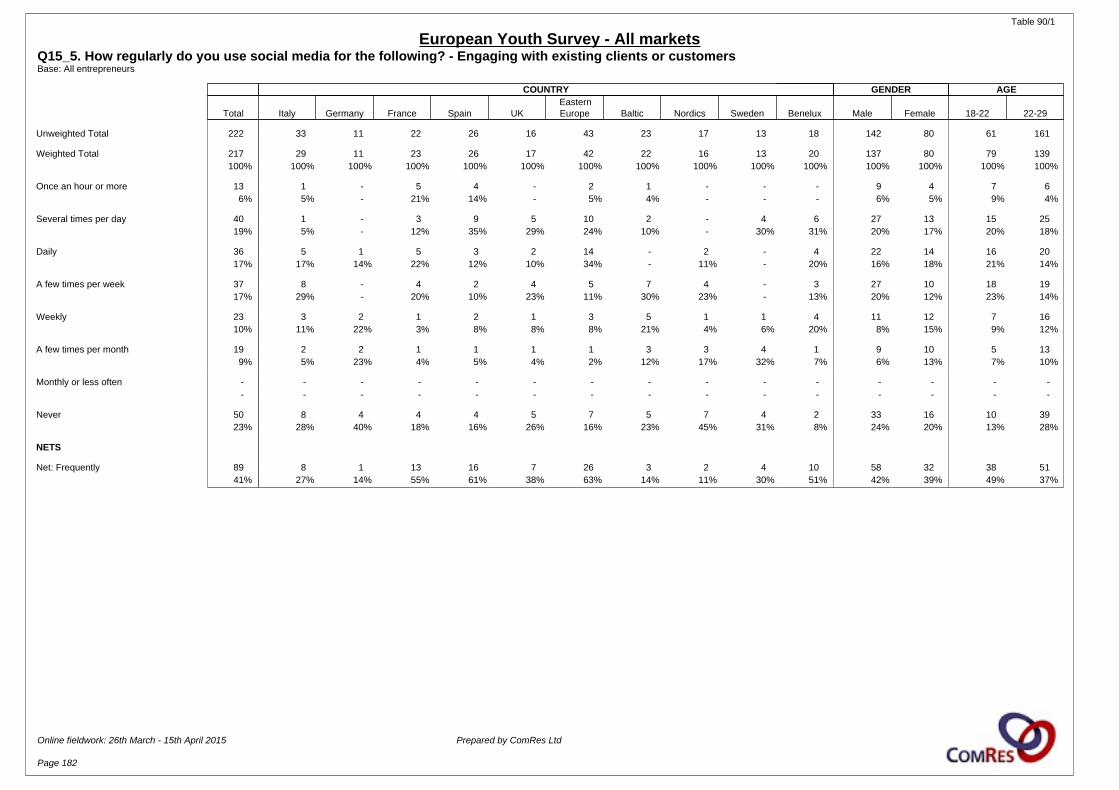
Table 90/1
European Youth Survey - All marketsQ15_5. How regularly do you use social media for the following? - Engaging with existing clients or customersBase: All entrepreneurs
COUNTRY GENDER AGE
Total Italy Germany France Spain UKEasternEurope Baltic Nordics Sweden Benelux Male Female 18-22 22-29
Unweighted Total 222 33 11 22 26 16 43 23 17 13 18 142 80 61 161
Weighted Total 217 29 11 23 26 17 42 22 16 13 20 137 80 79 139100% 100% 100% 100% 100% 100% 100% 100% 100% 100% 100% 100% 100% 100% 100%
Once an hour or more 13 1 - 5 4 - 2 1 - - - 9 4 7 66% 5% - 21% 14% - 5% 4% - - - 6% 5% 9% 4%
Several times per day 40 1 - 3 9 5 10 2 - 4 6 27 13 15 2519% 5% - 12% 35% 29% 24% 10% - 30% 31% 20% 17% 20% 18%
Daily 36 5 1 5 3 2 14 - 2 - 4 22 14 16 2017% 17% 14% 22% 12% 10% 34% - 11% - 20% 16% 18% 21% 14%
A few times per week 37 8 - 4 2 4 5 7 4 - 3 27 10 18 1917% 29% - 20% 10% 23% 11% 30% 23% - 13% 20% 12% 23% 14%
Weekly 23 3 2 1 2 1 3 5 1 1 4 11 12 7 1610% 11% 22% 3% 8% 8% 8% 21% 4% 6% 20% 8% 15% 9% 12%
A few times per month 19 2 2 1 1 1 1 3 3 4 1 9 10 5 139% 5% 23% 4% 5% 4% 2% 12% 17% 32% 7% 6% 13% 7% 10%
Monthly or less often - - - - - - - - - - - - - - -- - - - - - - - - - - - - - -
Never 50 8 4 4 4 5 7 5 7 4 2 33 16 10 3923% 28% 40% 18% 16% 26% 16% 23% 45% 31% 8% 24% 20% 13% 28%
NETS
Net: Frequently 89 8 1 13 16 7 26 3 2 4 10 58 32 38 5141% 27% 14% 55% 61% 38% 63% 14% 11% 30% 51% 42% 39% 49% 37%
Online fieldwork: 26th March - 15th April 2015 Prepared by ComRes Ltd
Page 182

Table 90/2
European Youth Survey - All marketsQ15_5. How regularly do you use social media for the following? - Engaging with existing clients or customersBase: All entrepreneurs
EDUCATION WORK STATUS
Total
Uppersecondary
or lessVocational
trainingUniversity
degreePostgraduate
degree Employees Students EntrepreneursNot
working
Unweighted Total 222 55 51 71 35 - - 222 -
Weighted Total 217 59 52 69 28 - - 217 -100% 100% 100% 100% 100% - - 100% -
Once an hour or more 13 1 5 2 3 - - 13 -6% 2% 10% 3% 11% - - 6% -
Several times per day 40 8 14 13 6 - - 40 -19% 14% 27% 18% 20% - - 19% -
Daily 36 9 6 15 4 - - 36 -17% 15% 12% 22% 15% - - 17% -
A few times per week 37 13 7 15 2 - - 37 -17% 21% 14% 22% 8% - - 17% -
Weekly 23 6 6 5 3 - - 23 -10% 11% 11% 8% 11% - - 10% -
A few times per month 19 6 2 6 3 - - 19 -9% 10% 5% 8% 12% - - 9% -
Monthly or less often - - - - - - - - -- - - - - - - - -
Never 50 16 11 13 6 - - 50 -23% 27% 22% 19% 22% - - 23% -
NETS
Net: Frequently 89 18 25 29 13 - - 89 -41% 31% 49% 43% 46% - - 41% -
Online fieldwork: 26th March - 15th April 2015 Prepared by ComRes Ltd
Page 183
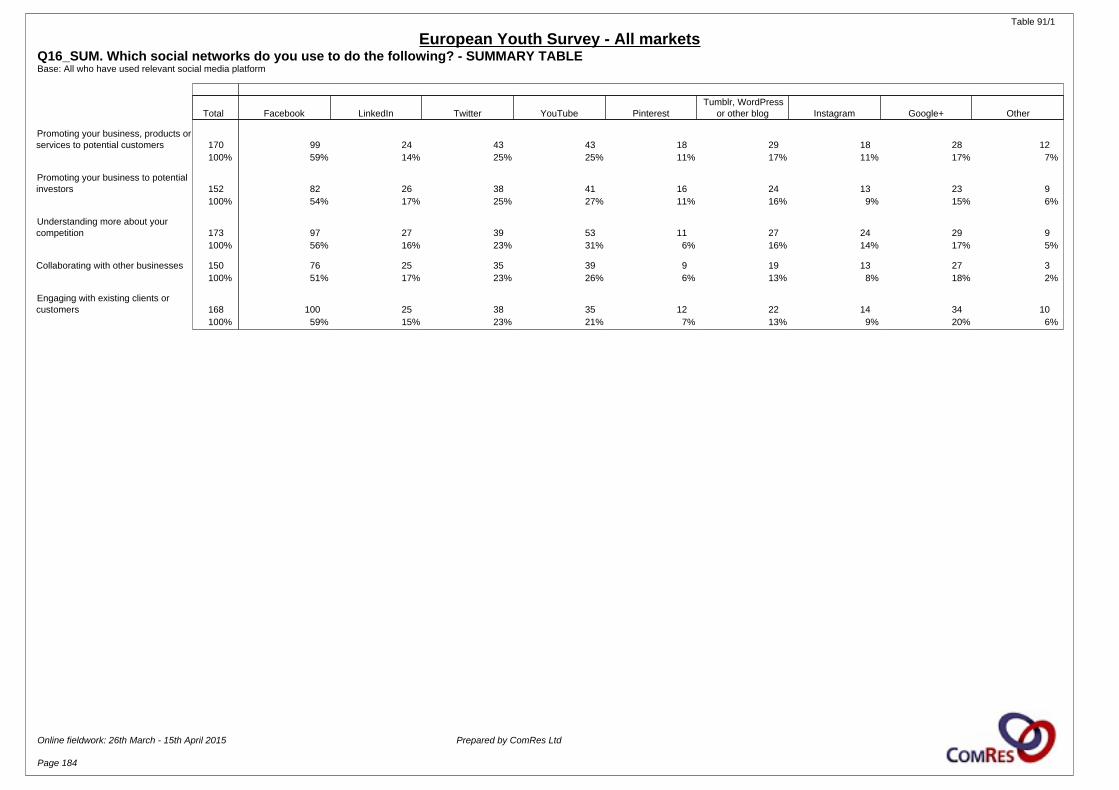
Table 91/1
European Youth Survey - All marketsQ16_SUM. Which social networks do you use to do the following? - SUMMARY TABLEBase: All who have used relevant social media platform
Total Facebook LinkedIn Twitter YouTube PinterestTumblr, WordPress
or other blog Instagram Google+ Other
Promoting your business, products orservices to potential customers 170 99 24 43 43 18 29 18 28 12
100% 59% 14% 25% 25% 11% 17% 11% 17% 7%
Promoting your business to potentialinvestors 152 82 26 38 41 16 24 13 23 9
100% 54% 17% 25% 27% 11% 16% 9% 15% 6%
Understanding more about yourcompetition 173 97 27 39 53 11 27 24 29 9
100% 56% 16% 23% 31% 6% 16% 14% 17% 5%
Collaborating with other businesses 150 76 25 35 39 9 19 13 27 3100% 51% 17% 23% 26% 6% 13% 8% 18% 2%
Engaging with existing clients orcustomers 168 100 25 38 35 12 22 14 34 10
100% 59% 15% 23% 21% 7% 13% 9% 20% 6%
Online fieldwork: 26th March - 15th April 2015 Prepared by ComRes Ltd
Page 184
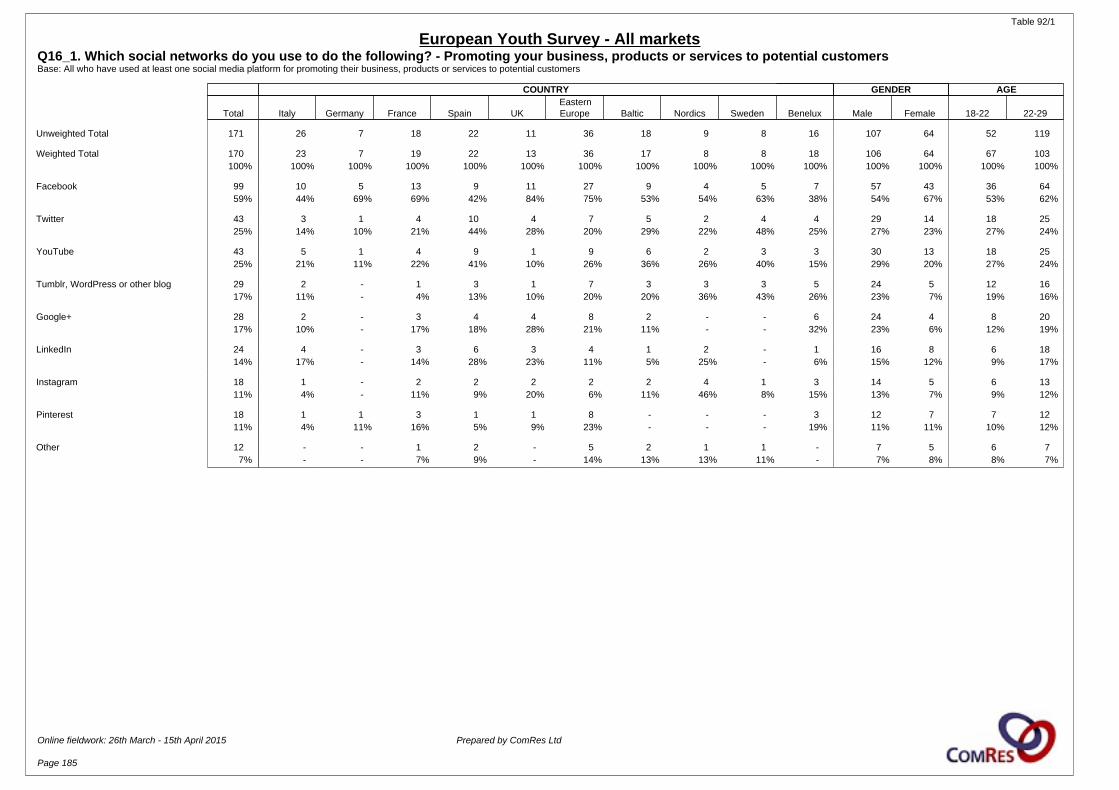
Table 92/1
European Youth Survey - All marketsQ16_1. Which social networks do you use to do the following? - Promoting your business, products or services to potential customersBase: All who have used at least one social media platform for promoting their business, products or services to potential customers
COUNTRY GENDER AGE
Total Italy Germany France Spain UKEasternEurope Baltic Nordics Sweden Benelux Male Female 18-22 22-29
Unweighted Total 171 26 7 18 22 11 36 18 9 8 16 107 64 52 119
Weighted Total 170 23 7 19 22 13 36 17 8 8 18 106 64 67 103100% 100% 100% 100% 100% 100% 100% 100% 100% 100% 100% 100% 100% 100% 100%
Facebook 99 10 5 13 9 11 27 9 4 5 7 57 43 36 6459% 44% 69% 69% 42% 84% 75% 53% 54% 63% 38% 54% 67% 53% 62%
Twitter 43 3 1 4 10 4 7 5 2 4 4 29 14 18 2525% 14% 10% 21% 44% 28% 20% 29% 22% 48% 25% 27% 23% 27% 24%
YouTube 43 5 1 4 9 1 9 6 2 3 3 30 13 18 2525% 21% 11% 22% 41% 10% 26% 36% 26% 40% 15% 29% 20% 27% 24%
Tumblr, WordPress or other blog 29 2 - 1 3 1 7 3 3 3 5 24 5 12 1617% 11% - 4% 13% 10% 20% 20% 36% 43% 26% 23% 7% 19% 16%
Google+ 28 2 - 3 4 4 8 2 - - 6 24 4 8 2017% 10% - 17% 18% 28% 21% 11% - - 32% 23% 6% 12% 19%
LinkedIn 24 4 - 3 6 3 4 1 2 - 1 16 8 6 1814% 17% - 14% 28% 23% 11% 5% 25% - 6% 15% 12% 9% 17%
Instagram 18 1 - 2 2 2 2 2 4 1 3 14 5 6 1311% 4% - 11% 9% 20% 6% 11% 46% 8% 15% 13% 7% 9% 12%
Pinterest 18 1 1 3 1 1 8 - - - 3 12 7 7 1211% 4% 11% 16% 5% 9% 23% - - - 19% 11% 11% 10% 12%
Other 12 - - 1 2 - 5 2 1 1 - 7 5 6 77% - - 7% 9% - 14% 13% 13% 11% - 7% 8% 8% 7%
Online fieldwork: 26th March - 15th April 2015 Prepared by ComRes Ltd
Page 185
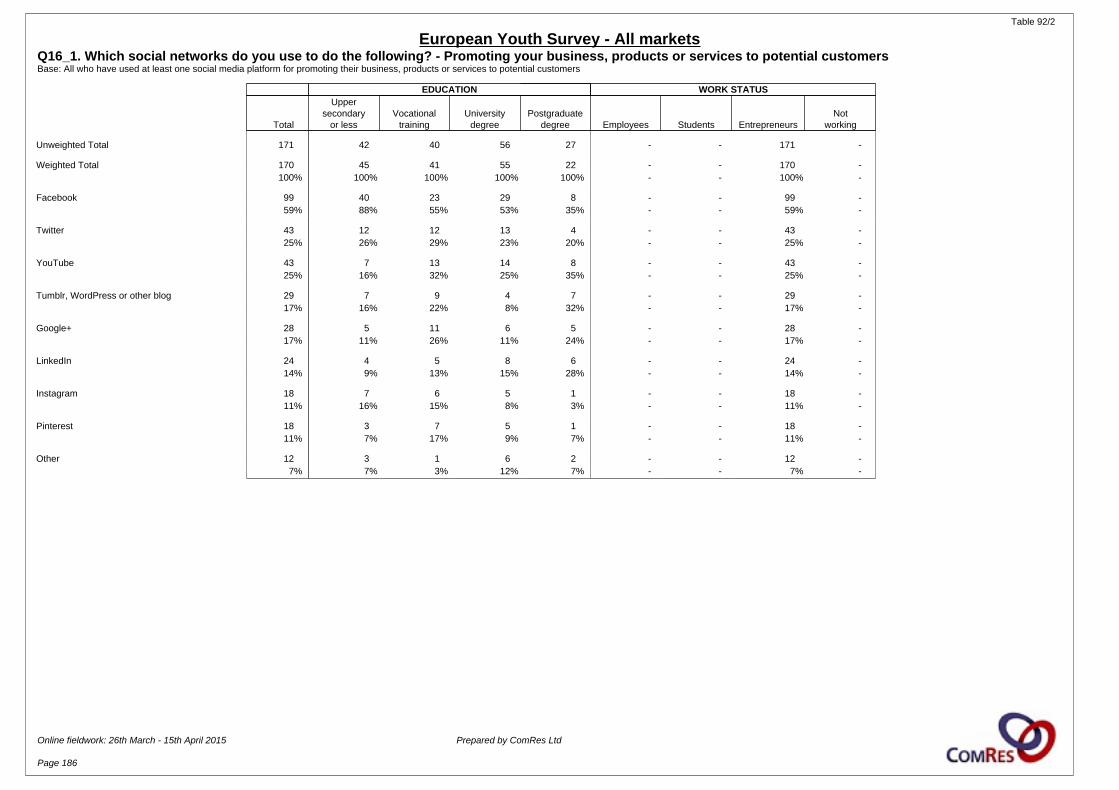
Table 92/2
European Youth Survey - All marketsQ16_1. Which social networks do you use to do the following? - Promoting your business, products or services to potential customersBase: All who have used at least one social media platform for promoting their business, products or services to potential customers
EDUCATION WORK STATUS
Total
Uppersecondary
or lessVocational
trainingUniversity
degreePostgraduate
degree Employees Students EntrepreneursNot
working
Unweighted Total 171 42 40 56 27 - - 171 -
Weighted Total 170 45 41 55 22 - - 170 -100% 100% 100% 100% 100% - - 100% -
Facebook 99 40 23 29 8 - - 99 -59% 88% 55% 53% 35% - - 59% -
Twitter 43 12 12 13 4 - - 43 -25% 26% 29% 23% 20% - - 25% -
YouTube 43 7 13 14 8 - - 43 -25% 16% 32% 25% 35% - - 25% -
Tumblr, WordPress or other blog 29 7 9 4 7 - - 29 -17% 16% 22% 8% 32% - - 17% -
Google+ 28 5 11 6 5 - - 28 -17% 11% 26% 11% 24% - - 17% -
LinkedIn 24 4 5 8 6 - - 24 -14% 9% 13% 15% 28% - - 14% -
Instagram 18 7 6 5 1 - - 18 -11% 16% 15% 8% 3% - - 11% -
Pinterest 18 3 7 5 1 - - 18 -11% 7% 17% 9% 7% - - 11% -
Other 12 3 1 6 2 - - 12 -7% 7% 3% 12% 7% - - 7% -
Online fieldwork: 26th March - 15th April 2015 Prepared by ComRes Ltd
Page 186
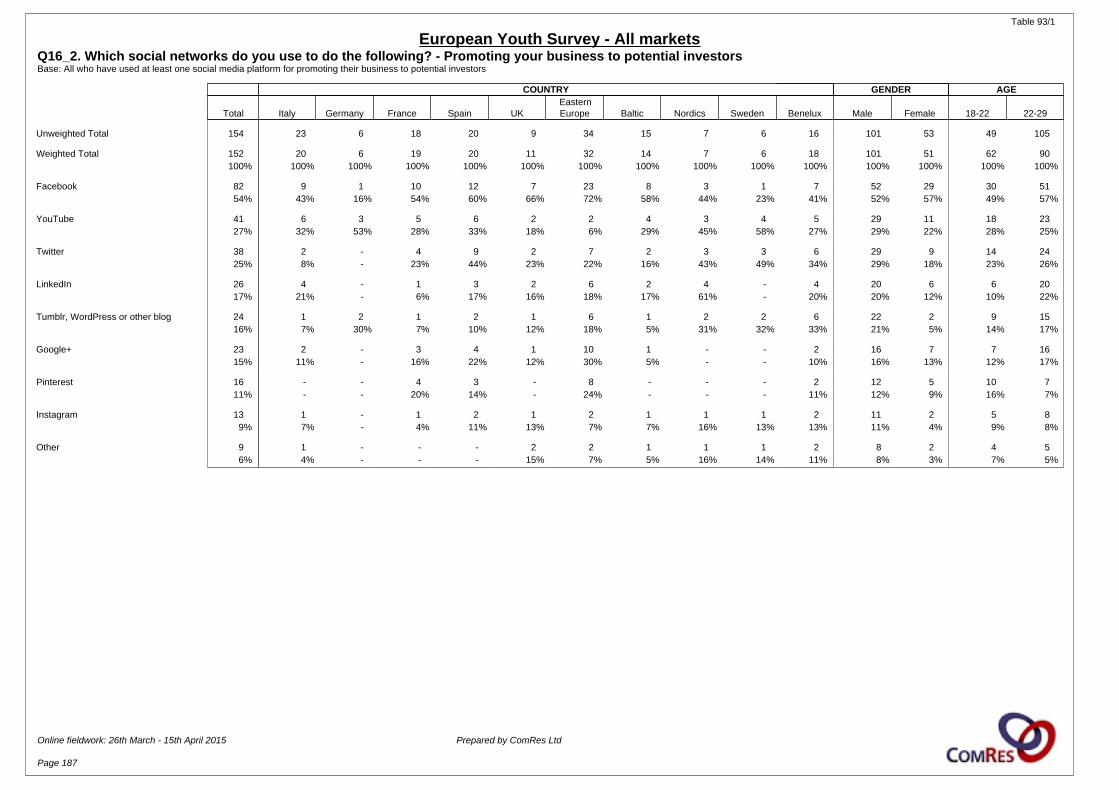
Table 93/1
European Youth Survey - All marketsQ16_2. Which social networks do you use to do the following? - Promoting your business to potential investorsBase: All who have used at least one social media platform for promoting their business to potential investors
COUNTRY GENDER AGE
Total Italy Germany France Spain UKEasternEurope Baltic Nordics Sweden Benelux Male Female 18-22 22-29
Unweighted Total 154 23 6 18 20 9 34 15 7 6 16 101 53 49 105
Weighted Total 152 20 6 19 20 11 32 14 7 6 18 101 51 62 90100% 100% 100% 100% 100% 100% 100% 100% 100% 100% 100% 100% 100% 100% 100%
Facebook 82 9 1 10 12 7 23 8 3 1 7 52 29 30 5154% 43% 16% 54% 60% 66% 72% 58% 44% 23% 41% 52% 57% 49% 57%
YouTube 41 6 3 5 6 2 2 4 3 4 5 29 11 18 2327% 32% 53% 28% 33% 18% 6% 29% 45% 58% 27% 29% 22% 28% 25%
Twitter 38 2 - 4 9 2 7 2 3 3 6 29 9 14 2425% 8% - 23% 44% 23% 22% 16% 43% 49% 34% 29% 18% 23% 26%
LinkedIn 26 4 - 1 3 2 6 2 4 - 4 20 6 6 2017% 21% - 6% 17% 16% 18% 17% 61% - 20% 20% 12% 10% 22%
Tumblr, WordPress or other blog 24 1 2 1 2 1 6 1 2 2 6 22 2 9 1516% 7% 30% 7% 10% 12% 18% 5% 31% 32% 33% 21% 5% 14% 17%
Google+ 23 2 - 3 4 1 10 1 - - 2 16 7 7 1615% 11% - 16% 22% 12% 30% 5% - - 10% 16% 13% 12% 17%
Pinterest 16 - - 4 3 - 8 - - - 2 12 5 10 711% - - 20% 14% - 24% - - - 11% 12% 9% 16% 7%
Instagram 13 1 - 1 2 1 2 1 1 1 2 11 2 5 89% 7% - 4% 11% 13% 7% 7% 16% 13% 13% 11% 4% 9% 8%
Other 9 1 - - - 2 2 1 1 1 2 8 2 4 56% 4% - - - 15% 7% 5% 16% 14% 11% 8% 3% 7% 5%
Online fieldwork: 26th March - 15th April 2015 Prepared by ComRes Ltd
Page 187
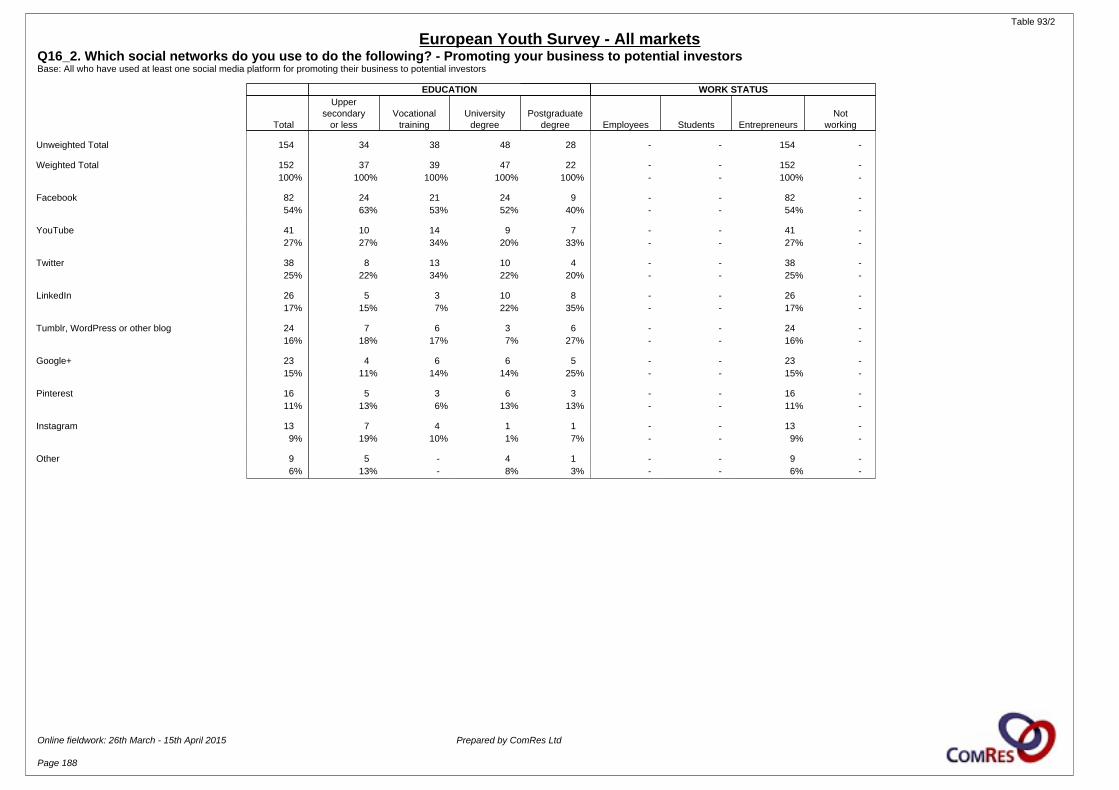
Table 93/2
European Youth Survey - All marketsQ16_2. Which social networks do you use to do the following? - Promoting your business to potential investorsBase: All who have used at least one social media platform for promoting their business to potential investors
EDUCATION WORK STATUS
Total
Uppersecondary
or lessVocational
trainingUniversity
degreePostgraduate
degree Employees Students EntrepreneursNot
working
Unweighted Total 154 34 38 48 28 - - 154 -
Weighted Total 152 37 39 47 22 - - 152 -100% 100% 100% 100% 100% - - 100% -
Facebook 82 24 21 24 9 - - 82 -54% 63% 53% 52% 40% - - 54% -
YouTube 41 10 14 9 7 - - 41 -27% 27% 34% 20% 33% - - 27% -
Twitter 38 8 13 10 4 - - 38 -25% 22% 34% 22% 20% - - 25% -
LinkedIn 26 5 3 10 8 - - 26 -17% 15% 7% 22% 35% - - 17% -
Tumblr, WordPress or other blog 24 7 6 3 6 - - 24 -16% 18% 17% 7% 27% - - 16% -
Google+ 23 4 6 6 5 - - 23 -15% 11% 14% 14% 25% - - 15% -
Pinterest 16 5 3 6 3 - - 16 -11% 13% 6% 13% 13% - - 11% -
Instagram 13 7 4 1 1 - - 13 -9% 19% 10% 1% 7% - - 9% -
Other 9 5 - 4 1 - - 9 -6% 13% - 8% 3% - - 6% -
Online fieldwork: 26th March - 15th April 2015 Prepared by ComRes Ltd
Page 188

Table 94/1
European Youth Survey - All marketsQ16_3. Which social networks do you use to do the following? - Understanding more about your competitionBase: All who have used at least one social media platform for understanding more about their competition
COUNTRY GENDER AGE
Total Italy Germany France Spain UKEasternEurope Baltic Nordics Sweden Benelux Male Female 18-22 22-29
Unweighted Total 175 27 7 20 22 13 35 19 9 7 16 112 63 52 123
Weighted Total 173 23 7 21 22 15 33 19 8 8 18 112 62 66 107100% 100% 100% 100% 100% 100% 100% 100% 100% 100% 100% 100% 100% 100% 100%
Facebook 97 10 2 13 12 10 20 9 4 4 11 55 42 32 6556% 43% 33% 61% 55% 70% 61% 50% 55% 56% 63% 49% 68% 48% 60%
YouTube 53 5 2 5 6 6 6 10 2 6 4 43 11 19 3531% 20% 34% 23% 29% 45% 19% 53% 29% 81% 23% 38% 17% 28% 32%
Twitter 39 2 1 4 6 5 9 5 3 1 1 31 9 19 2123% 7% 21% 22% 29% 33% 28% 28% 42% 18% 7% 27% 14% 28% 19%
Google+ 29 5 - 4 3 1 8 3 - - 4 26 3 6 2317% 21% - 20% 15% 9% 25% 16% - - 23% 23% 5% 8% 22%
Tumblr, WordPress or other blog 27 1 2 3 2 2 8 3 2 1 5 22 6 11 1716% 3% 33% 14% 7% 13% 23% 14% 26% 11% 26% 19% 9% 16% 15%
LinkedIn 27 8 - 1 4 2 6 1 2 2 2 18 9 10 1716% 33% - 6% 17% 13% 18% 4% 25% 22% 12% 16% 15% 15% 16%
Instagram 24 4 1 - 3 2 6 1 2 1 4 17 7 10 1414% 18% 11% - 13% 12% 18% 7% 20% 19% 24% 15% 12% 15% 14%
Pinterest 11 2 1 - 2 1 5 - - - - 7 4 5 66% 10% 13% - 9% 8% 14% - - - - 6% 7% 7% 6%
Other 9 - - - 1 - 2 2 1 3 1 8 1 3 65% - - - 5% - 7% 8% 12% 33% 4% 7% 2% 5% 6%
Online fieldwork: 26th March - 15th April 2015 Prepared by ComRes Ltd
Page 189
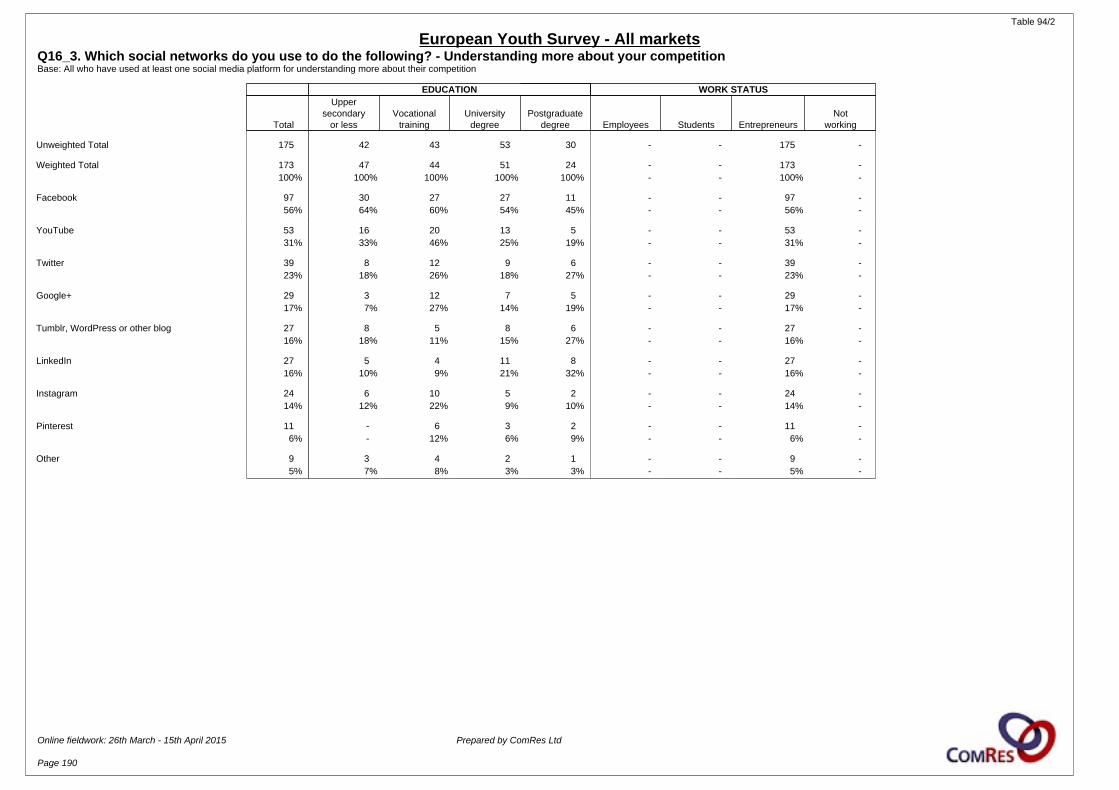
Table 94/2
European Youth Survey - All marketsQ16_3. Which social networks do you use to do the following? - Understanding more about your competitionBase: All who have used at least one social media platform for understanding more about their competition
EDUCATION WORK STATUS
Total
Uppersecondary
or lessVocational
trainingUniversity
degreePostgraduate
degree Employees Students EntrepreneursNot
working
Unweighted Total 175 42 43 53 30 - - 175 -
Weighted Total 173 47 44 51 24 - - 173 -100% 100% 100% 100% 100% - - 100% -
Facebook 97 30 27 27 11 - - 97 -56% 64% 60% 54% 45% - - 56% -
YouTube 53 16 20 13 5 - - 53 -31% 33% 46% 25% 19% - - 31% -
Twitter 39 8 12 9 6 - - 39 -23% 18% 26% 18% 27% - - 23% -
Google+ 29 3 12 7 5 - - 29 -17% 7% 27% 14% 19% - - 17% -
Tumblr, WordPress or other blog 27 8 5 8 6 - - 27 -16% 18% 11% 15% 27% - - 16% -
LinkedIn 27 5 4 11 8 - - 27 -16% 10% 9% 21% 32% - - 16% -
Instagram 24 6 10 5 2 - - 24 -14% 12% 22% 9% 10% - - 14% -
Pinterest 11 - 6 3 2 - - 11 -6% - 12% 6% 9% - - 6% -
Other 9 3 4 2 1 - - 9 -5% 7% 8% 3% 3% - - 5% -
Online fieldwork: 26th March - 15th April 2015 Prepared by ComRes Ltd
Page 190
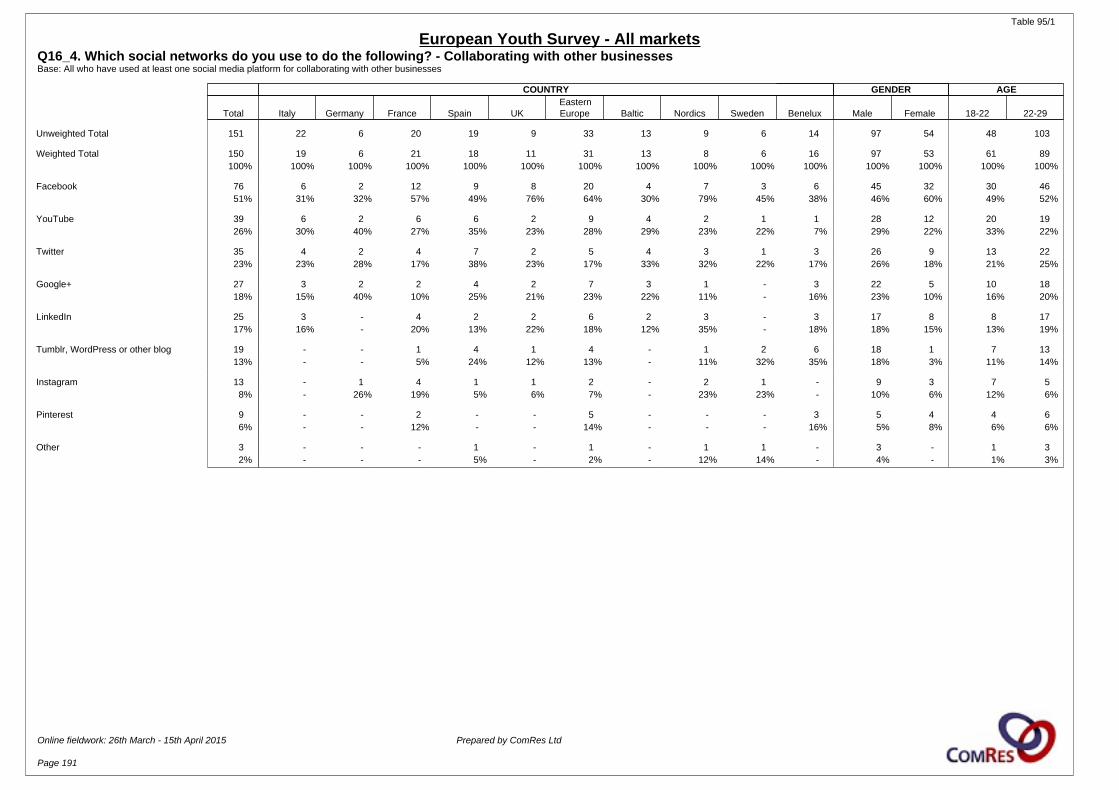
Table 95/1
European Youth Survey - All marketsQ16_4. Which social networks do you use to do the following? - Collaborating with other businessesBase: All who have used at least one social media platform for collaborating with other businesses
COUNTRY GENDER AGE
Total Italy Germany France Spain UKEasternEurope Baltic Nordics Sweden Benelux Male Female 18-22 22-29
Unweighted Total 151 22 6 20 19 9 33 13 9 6 14 97 54 48 103
Weighted Total 150 19 6 21 18 11 31 13 8 6 16 97 53 61 89100% 100% 100% 100% 100% 100% 100% 100% 100% 100% 100% 100% 100% 100% 100%
Facebook 76 6 2 12 9 8 20 4 7 3 6 45 32 30 4651% 31% 32% 57% 49% 76% 64% 30% 79% 45% 38% 46% 60% 49% 52%
YouTube 39 6 2 6 6 2 9 4 2 1 1 28 12 20 1926% 30% 40% 27% 35% 23% 28% 29% 23% 22% 7% 29% 22% 33% 22%
Twitter 35 4 2 4 7 2 5 4 3 1 3 26 9 13 2223% 23% 28% 17% 38% 23% 17% 33% 32% 22% 17% 26% 18% 21% 25%
Google+ 27 3 2 2 4 2 7 3 1 - 3 22 5 10 1818% 15% 40% 10% 25% 21% 23% 22% 11% - 16% 23% 10% 16% 20%
LinkedIn 25 3 - 4 2 2 6 2 3 - 3 17 8 8 1717% 16% - 20% 13% 22% 18% 12% 35% - 18% 18% 15% 13% 19%
Tumblr, WordPress or other blog 19 - - 1 4 1 4 - 1 2 6 18 1 7 1313% - - 5% 24% 12% 13% - 11% 32% 35% 18% 3% 11% 14%
Instagram 13 - 1 4 1 1 2 - 2 1 - 9 3 7 58% - 26% 19% 5% 6% 7% - 23% 23% - 10% 6% 12% 6%
Pinterest 9 - - 2 - - 5 - - - 3 5 4 4 66% - - 12% - - 14% - - - 16% 5% 8% 6% 6%
Other 3 - - - 1 - 1 - 1 1 - 3 - 1 32% - - - 5% - 2% - 12% 14% - 4% - 1% 3%
Online fieldwork: 26th March - 15th April 2015 Prepared by ComRes Ltd
Page 191
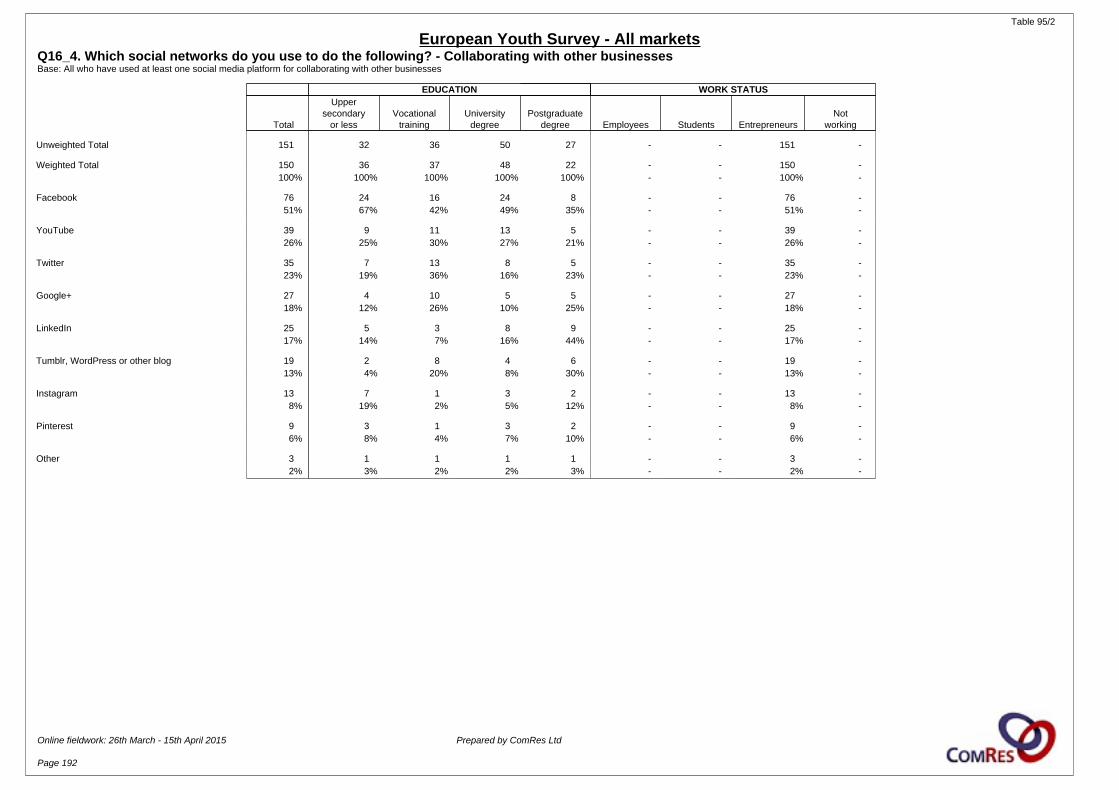
Table 95/2
European Youth Survey - All marketsQ16_4. Which social networks do you use to do the following? - Collaborating with other businessesBase: All who have used at least one social media platform for collaborating with other businesses
EDUCATION WORK STATUS
Total
Uppersecondary
or lessVocational
trainingUniversity
degreePostgraduate
degree Employees Students EntrepreneursNot
working
Unweighted Total 151 32 36 50 27 - - 151 -
Weighted Total 150 36 37 48 22 - - 150 -100% 100% 100% 100% 100% - - 100% -
Facebook 76 24 16 24 8 - - 76 -51% 67% 42% 49% 35% - - 51% -
YouTube 39 9 11 13 5 - - 39 -26% 25% 30% 27% 21% - - 26% -
Twitter 35 7 13 8 5 - - 35 -23% 19% 36% 16% 23% - - 23% -
Google+ 27 4 10 5 5 - - 27 -18% 12% 26% 10% 25% - - 18% -
LinkedIn 25 5 3 8 9 - - 25 -17% 14% 7% 16% 44% - - 17% -
Tumblr, WordPress or other blog 19 2 8 4 6 - - 19 -13% 4% 20% 8% 30% - - 13% -
Instagram 13 7 1 3 2 - - 13 -8% 19% 2% 5% 12% - - 8% -
Pinterest 9 3 1 3 2 - - 9 -6% 8% 4% 7% 10% - - 6% -
Other 3 1 1 1 1 - - 3 -2% 3% 2% 2% 3% - - 2% -
Online fieldwork: 26th March - 15th April 2015 Prepared by ComRes Ltd
Page 192
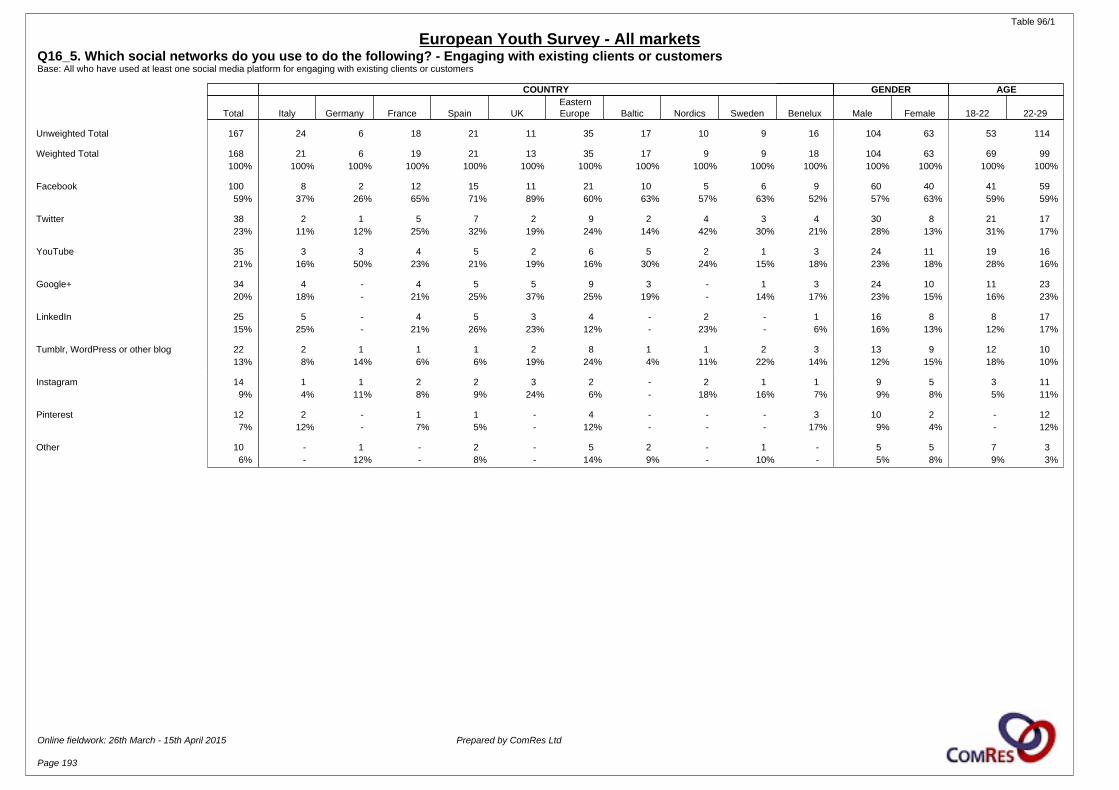
Table 96/1
European Youth Survey - All marketsQ16_5. Which social networks do you use to do the following? - Engaging with existing clients or customersBase: All who have used at least one social media platform for engaging with existing clients or customers
COUNTRY GENDER AGE
Total Italy Germany France Spain UKEasternEurope Baltic Nordics Sweden Benelux Male Female 18-22 22-29
Unweighted Total 167 24 6 18 21 11 35 17 10 9 16 104 63 53 114
Weighted Total 168 21 6 19 21 13 35 17 9 9 18 104 63 69 99100% 100% 100% 100% 100% 100% 100% 100% 100% 100% 100% 100% 100% 100% 100%
Facebook 100 8 2 12 15 11 21 10 5 6 9 60 40 41 5959% 37% 26% 65% 71% 89% 60% 63% 57% 63% 52% 57% 63% 59% 59%
Twitter 38 2 1 5 7 2 9 2 4 3 4 30 8 21 1723% 11% 12% 25% 32% 19% 24% 14% 42% 30% 21% 28% 13% 31% 17%
YouTube 35 3 3 4 5 2 6 5 2 1 3 24 11 19 1621% 16% 50% 23% 21% 19% 16% 30% 24% 15% 18% 23% 18% 28% 16%
Google+ 34 4 - 4 5 5 9 3 - 1 3 24 10 11 2320% 18% - 21% 25% 37% 25% 19% - 14% 17% 23% 15% 16% 23%
LinkedIn 25 5 - 4 5 3 4 - 2 - 1 16 8 8 1715% 25% - 21% 26% 23% 12% - 23% - 6% 16% 13% 12% 17%
Tumblr, WordPress or other blog 22 2 1 1 1 2 8 1 1 2 3 13 9 12 1013% 8% 14% 6% 6% 19% 24% 4% 11% 22% 14% 12% 15% 18% 10%
Instagram 14 1 1 2 2 3 2 - 2 1 1 9 5 3 119% 4% 11% 8% 9% 24% 6% - 18% 16% 7% 9% 8% 5% 11%
Pinterest 12 2 - 1 1 - 4 - - - 3 10 2 - 127% 12% - 7% 5% - 12% - - - 17% 9% 4% - 12%
Other 10 - 1 - 2 - 5 2 - 1 - 5 5 7 36% - 12% - 8% - 14% 9% - 10% - 5% 8% 9% 3%
Online fieldwork: 26th March - 15th April 2015 Prepared by ComRes Ltd
Page 193
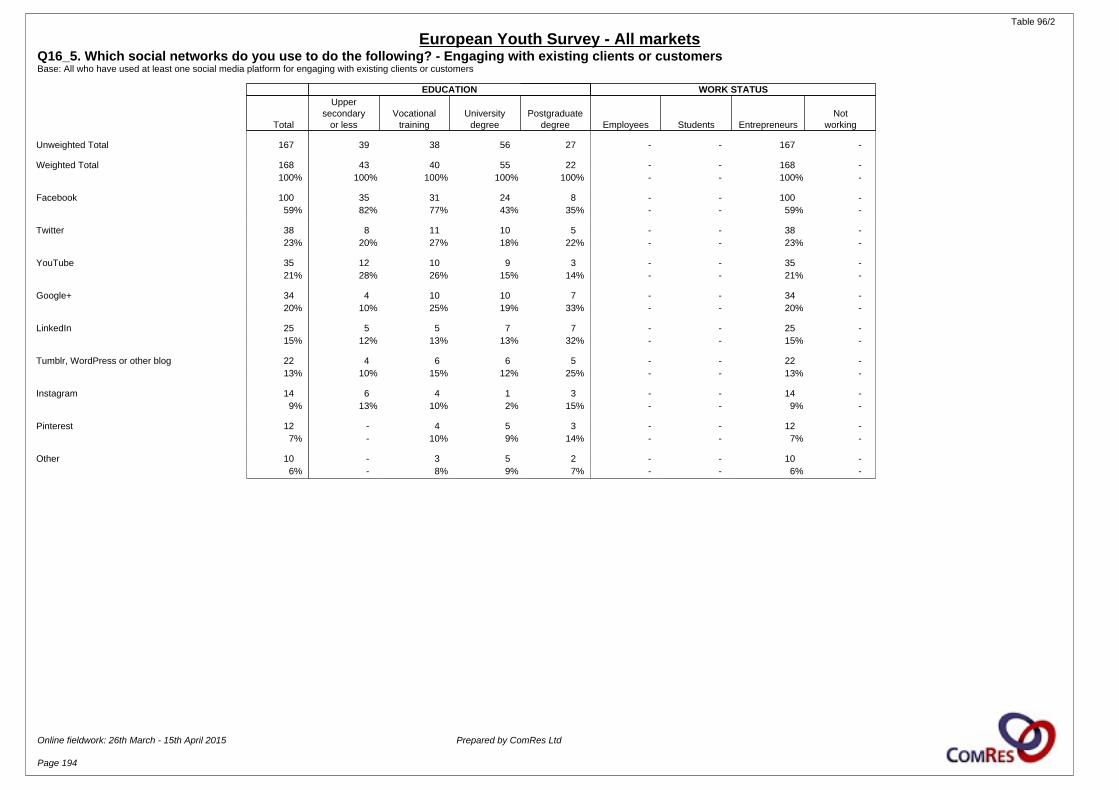
Table 96/2
European Youth Survey - All marketsQ16_5. Which social networks do you use to do the following? - Engaging with existing clients or customersBase: All who have used at least one social media platform for engaging with existing clients or customers
EDUCATION WORK STATUS
Total
Uppersecondary
or lessVocational
trainingUniversity
degreePostgraduate
degree Employees Students EntrepreneursNot
working
Unweighted Total 167 39 38 56 27 - - 167 -
Weighted Total 168 43 40 55 22 - - 168 -100% 100% 100% 100% 100% - - 100% -
Facebook 100 35 31 24 8 - - 100 -59% 82% 77% 43% 35% - - 59% -
Twitter 38 8 11 10 5 - - 38 -23% 20% 27% 18% 22% - - 23% -
YouTube 35 12 10 9 3 - - 35 -21% 28% 26% 15% 14% - - 21% -
Google+ 34 4 10 10 7 - - 34 -20% 10% 25% 19% 33% - - 20% -
LinkedIn 25 5 5 7 7 - - 25 -15% 12% 13% 13% 32% - - 15% -
Tumblr, WordPress or other blog 22 4 6 6 5 - - 22 -13% 10% 15% 12% 25% - - 13% -
Instagram 14 6 4 1 3 - - 14 -9% 13% 10% 2% 15% - - 9% -
Pinterest 12 - 4 5 3 - - 12 -7% - 10% 9% 14% - - 7% -
Other 10 - 3 5 2 - - 10 -6% - 8% 9% 7% - - 6% -
Online fieldwork: 26th March - 15th April 2015 Prepared by ComRes Ltd
Page 194
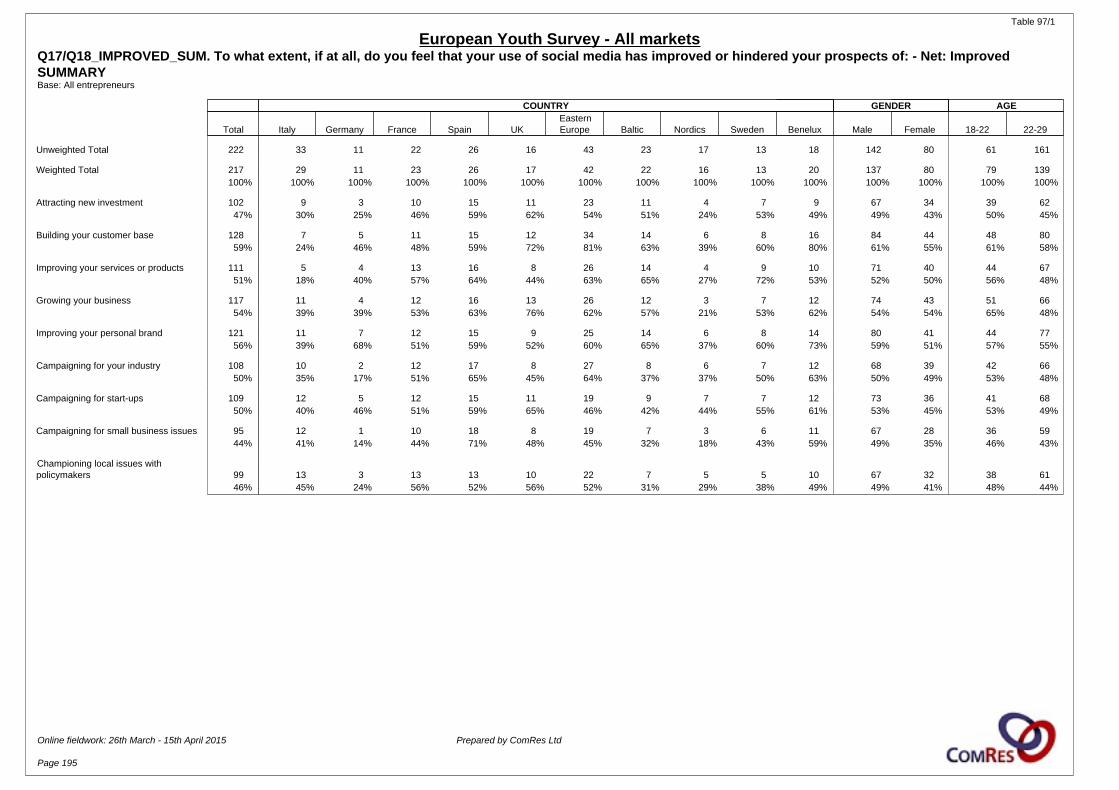
Table 97/1
European Youth Survey - All marketsQ17/Q18_IMPROVED_SUM. To what extent, if at all, do you feel that your use of social media has improved or hindered your prospects of: - Net: Improved SUMMARYBase: All entrepreneurs
COUNTRY GENDER AGE
Total Italy Germany France Spain UKEasternEurope Baltic Nordics Sweden Benelux Male Female 18-22 22-29
Unweighted Total 222 33 11 22 26 16 43 23 17 13 18 142 80 61 161
Weighted Total 217 29 11 23 26 17 42 22 16 13 20 137 80 79 139100% 100% 100% 100% 100% 100% 100% 100% 100% 100% 100% 100% 100% 100% 100%
Attracting new investment 102 9 3 10 15 11 23 11 4 7 9 67 34 39 6247% 30% 25% 46% 59% 62% 54% 51% 24% 53% 49% 49% 43% 50% 45%
Building your customer base 128 7 5 11 15 12 34 14 6 8 16 84 44 48 8059% 24% 46% 48% 59% 72% 81% 63% 39% 60% 80% 61% 55% 61% 58%
Improving your services or products 111 5 4 13 16 8 26 14 4 9 10 71 40 44 6751% 18% 40% 57% 64% 44% 63% 65% 27% 72% 53% 52% 50% 56% 48%
Growing your business 117 11 4 12 16 13 26 12 3 7 12 74 43 51 6654% 39% 39% 53% 63% 76% 62% 57% 21% 53% 62% 54% 54% 65% 48%
Improving your personal brand 121 11 7 12 15 9 25 14 6 8 14 80 41 44 7756% 39% 68% 51% 59% 52% 60% 65% 37% 60% 73% 59% 51% 57% 55%
Campaigning for your industry 108 10 2 12 17 8 27 8 6 7 12 68 39 42 6650% 35% 17% 51% 65% 45% 64% 37% 37% 50% 63% 50% 49% 53% 48%
Campaigning for start-ups 109 12 5 12 15 11 19 9 7 7 12 73 36 41 6850% 40% 46% 51% 59% 65% 46% 42% 44% 55% 61% 53% 45% 53% 49%
Campaigning for small business issues 95 12 1 10 18 8 19 7 3 6 11 67 28 36 5944% 41% 14% 44% 71% 48% 45% 32% 18% 43% 59% 49% 35% 46% 43%
Championing local issues withpolicymakers 99 13 3 13 13 10 22 7 5 5 10 67 32 38 61
46% 45% 24% 56% 52% 56% 52% 31% 29% 38% 49% 49% 41% 48% 44%
Online fieldwork: 26th March - 15th April 2015 Prepared by ComRes Ltd
Page 195
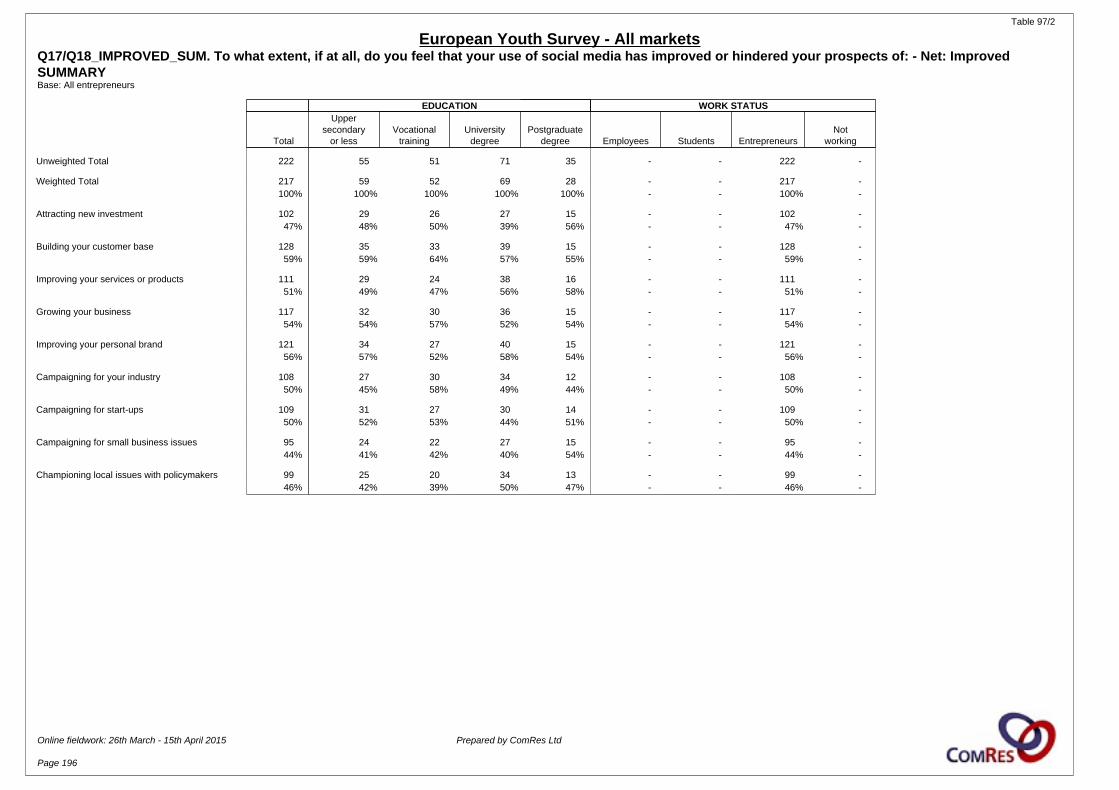
Table 97/2
European Youth Survey - All marketsQ17/Q18_IMPROVED_SUM. To what extent, if at all, do you feel that your use of social media has improved or hindered your prospects of: - Net: Improved SUMMARYBase: All entrepreneurs
EDUCATION WORK STATUS
Total
Uppersecondary
or lessVocational
trainingUniversity
degreePostgraduate
degree Employees Students EntrepreneursNot
working
Unweighted Total 222 55 51 71 35 - - 222 -
Weighted Total 217 59 52 69 28 - - 217 -100% 100% 100% 100% 100% - - 100% -
Attracting new investment 102 29 26 27 15 - - 102 -47% 48% 50% 39% 56% - - 47% -
Building your customer base 128 35 33 39 15 - - 128 -59% 59% 64% 57% 55% - - 59% -
Improving your services or products 111 29 24 38 16 - - 111 -51% 49% 47% 56% 58% - - 51% -
Growing your business 117 32 30 36 15 - - 117 -54% 54% 57% 52% 54% - - 54% -
Improving your personal brand 121 34 27 40 15 - - 121 -56% 57% 52% 58% 54% - - 56% -
Campaigning for your industry 108 27 30 34 12 - - 108 -50% 45% 58% 49% 44% - - 50% -
Campaigning for start-ups 109 31 27 30 14 - - 109 -50% 52% 53% 44% 51% - - 50% -
Campaigning for small business issues 95 24 22 27 15 - - 95 -44% 41% 42% 40% 54% - - 44% -
Championing local issues with policymakers 99 25 20 34 13 - - 99 -46% 42% 39% 50% 47% - - 46% -
Online fieldwork: 26th March - 15th April 2015 Prepared by ComRes Ltd
Page 196
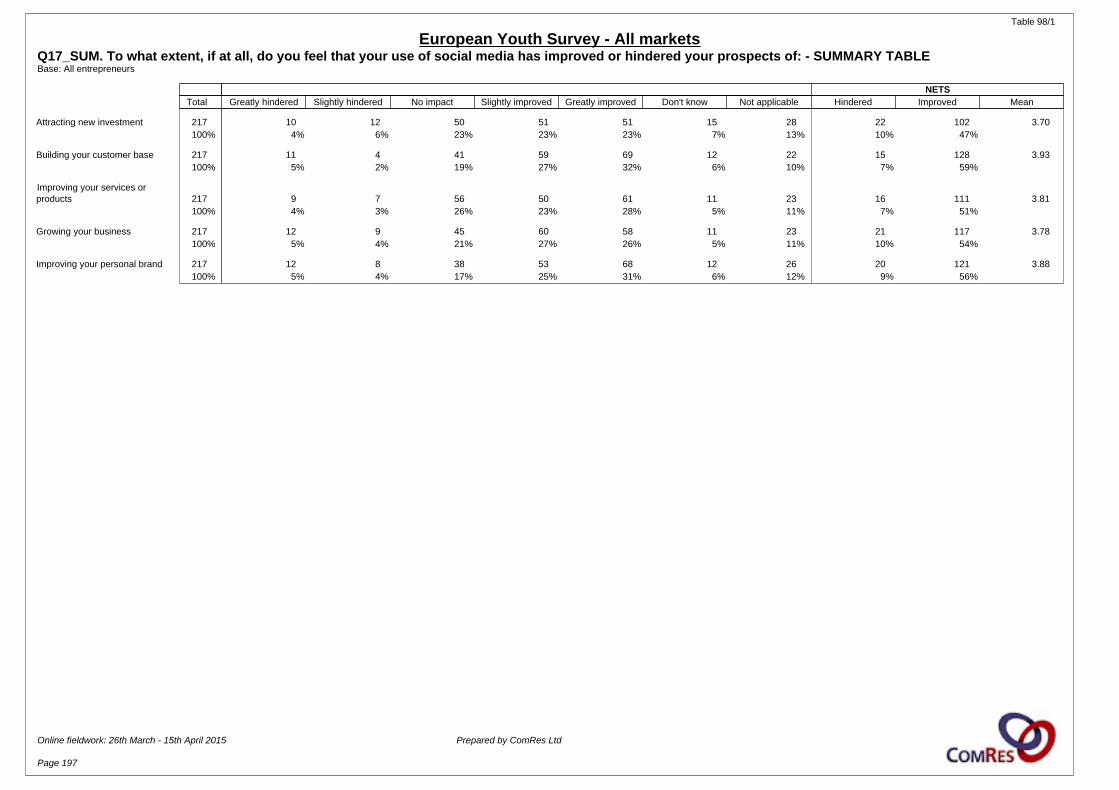
Table 98/1
European Youth Survey - All marketsQ17_SUM. To what extent, if at all, do you feel that your use of social media has improved or hindered your prospects of: - SUMMARY TABLEBase: All entrepreneurs
NETS Total Greatly hindered Slightly hindered No impact Slightly improved Greatly improved Don't know Not applicable Hindered Improved Mean
Attracting new investment 217 10 12 50 51 51 15 28 22 102 3.70100% 4% 6% 23% 23% 23% 7% 13% 10% 47%
Building your customer base 217 11 4 41 59 69 12 22 15 128 3.93100% 5% 2% 19% 27% 32% 6% 10% 7% 59%
Improving your services orproducts 217 9 7 56 50 61 11 23 16 111 3.81
100% 4% 3% 26% 23% 28% 5% 11% 7% 51%
Growing your business 217 12 9 45 60 58 11 23 21 117 3.78100% 5% 4% 21% 27% 26% 5% 11% 10% 54%
Improving your personal brand 217 12 8 38 53 68 12 26 20 121 3.88100% 5% 4% 17% 25% 31% 6% 12% 9% 56%
Online fieldwork: 26th March - 15th April 2015 Prepared by ComRes Ltd
Page 197
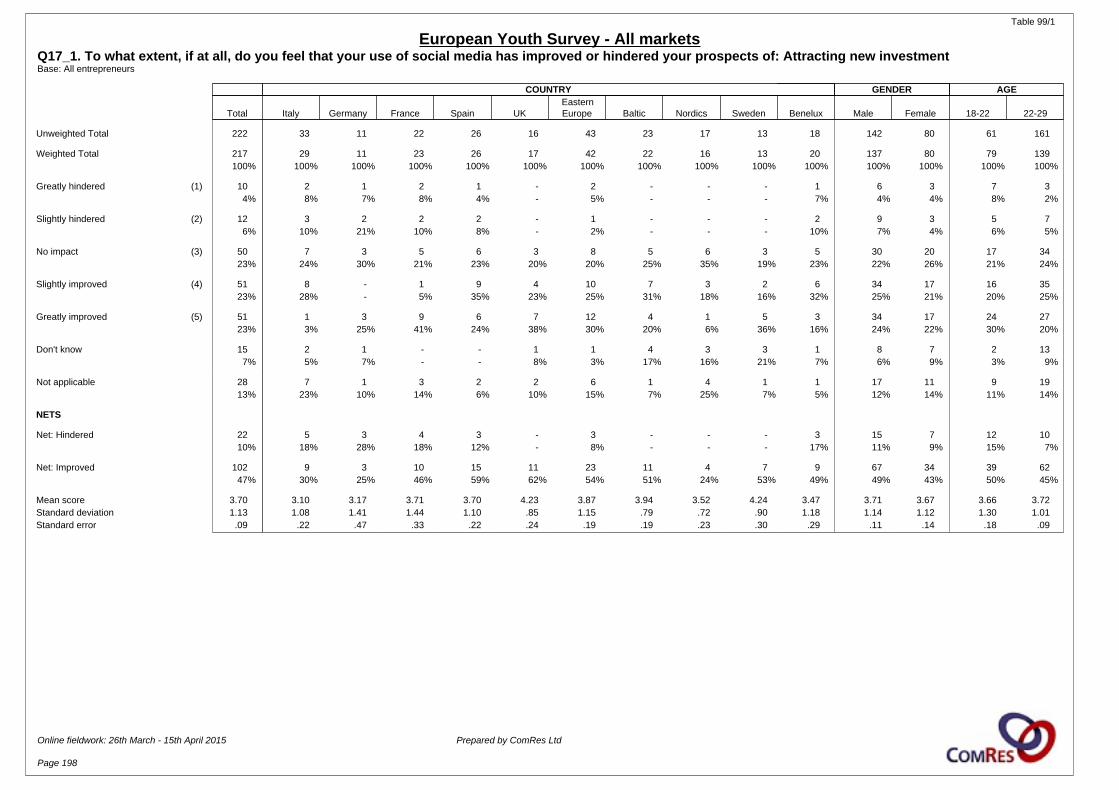
Table 99/1
European Youth Survey - All marketsQ17_1. To what extent, if at all, do you feel that your use of social media has improved or hindered your prospects of: Attracting new investmentBase: All entrepreneurs
COUNTRY GENDER AGE
Total Italy Germany France Spain UKEasternEurope Baltic Nordics Sweden Benelux Male Female 18-22 22-29
Unweighted Total 222 33 11 22 26 16 43 23 17 13 18 142 80 61 161
Weighted Total 217 29 11 23 26 17 42 22 16 13 20 137 80 79 139100% 100% 100% 100% 100% 100% 100% 100% 100% 100% 100% 100% 100% 100% 100%
Greatly hindered (1) 10 2 1 2 1 - 2 - - - 1 6 3 7 34% 8% 7% 8% 4% - 5% - - - 7% 4% 4% 8% 2%
Slightly hindered (2) 12 3 2 2 2 - 1 - - - 2 9 3 5 76% 10% 21% 10% 8% - 2% - - - 10% 7% 4% 6% 5%
No impact (3) 50 7 3 5 6 3 8 5 6 3 5 30 20 17 3423% 24% 30% 21% 23% 20% 20% 25% 35% 19% 23% 22% 26% 21% 24%
Slightly improved (4) 51 8 - 1 9 4 10 7 3 2 6 34 17 16 3523% 28% - 5% 35% 23% 25% 31% 18% 16% 32% 25% 21% 20% 25%
Greatly improved (5) 51 1 3 9 6 7 12 4 1 5 3 34 17 24 2723% 3% 25% 41% 24% 38% 30% 20% 6% 36% 16% 24% 22% 30% 20%
Don't know 15 2 1 - - 1 1 4 3 3 1 8 7 2 137% 5% 7% - - 8% 3% 17% 16% 21% 7% 6% 9% 3% 9%
Not applicable 28 7 1 3 2 2 6 1 4 1 1 17 11 9 1913% 23% 10% 14% 6% 10% 15% 7% 25% 7% 5% 12% 14% 11% 14%
NETS
Net: Hindered 22 5 3 4 3 - 3 - - - 3 15 7 12 1010% 18% 28% 18% 12% - 8% - - - 17% 11% 9% 15% 7%
Net: Improved 102 9 3 10 15 11 23 11 4 7 9 67 34 39 6247% 30% 25% 46% 59% 62% 54% 51% 24% 53% 49% 49% 43% 50% 45%
Mean score 3.70 3.10 3.17 3.71 3.70 4.23 3.87 3.94 3.52 4.24 3.47 3.71 3.67 3.66 3.72Standard deviation 1.13 1.08 1.41 1.44 1.10 .85 1.15 .79 .72 .90 1.18 1.14 1.12 1.30 1.01Standard error .09 .22 .47 .33 .22 .24 .19 .19 .23 .30 .29 .11 .14 .18 .09
Online fieldwork: 26th March - 15th April 2015 Prepared by ComRes Ltd
Page 198

Table 99/2
European Youth Survey - All marketsQ17_1. To what extent, if at all, do you feel that your use of social media has improved or hindered your prospects of: Attracting new investmentBase: All entrepreneurs
EDUCATION WORK STATUS
Total
Uppersecondary
or lessVocational
trainingUniversity
degreePostgraduate
degree Employees Students EntrepreneursNot
working
Unweighted Total 222 55 51 71 35 - - 222 -
Weighted Total 217 59 52 69 28 - - 217 -100% 100% 100% 100% 100% - - 100% -
Greatly hindered (1) 10 1 2 4 1 - - 10 -4% 2% 4% 6% 2% - - 4% -
Slightly hindered (2) 12 3 2 4 3 - - 12 -6% 5% 4% 6% 12% - - 6% -
No impact (3) 50 15 9 22 4 - - 50 -23% 26% 18% 32% 13% - - 23% -
Slightly improved (4) 51 13 9 16 10 - - 51 -23% 21% 18% 24% 38% - - 23% -
Greatly improved (5) 51 16 16 11 5 - - 51 -23% 27% 32% 16% 18% - - 23% -
Don't know 15 3 4 6 1 - - 15 -7% 5% 8% 8% 2% - - 7% -
Not applicable 28 7 8 6 4 - - 28 -13% 12% 17% 9% 14% - - 13% -
NETS
Net: Hindered 22 4 4 8 4 - - 22 -10% 7% 8% 12% 15% - - 10% -
Net: Improved 102 29 26 27 15 - - 102 -47% 48% 50% 39% 56% - - 47% -
Mean score 3.70 3.80 3.93 3.45 3.68 - - 3.70 -Standard deviation 1.13 1.07 1.15 1.11 1.07 - - 1.13 -Standard error .09 .16 .19 .14 .20 - - .09 -
Online fieldwork: 26th March - 15th April 2015 Prepared by ComRes Ltd
Page 199

Table 100/1
European Youth Survey - All marketsQ17_2. To what extent, if at all, do you feel that your use of social media has improved or hindered your prospects of: Building your customer baseBase: All entrepreneurs
COUNTRY GENDER AGE
Total Italy Germany France Spain UKEasternEurope Baltic Nordics Sweden Benelux Male Female 18-22 22-29
Unweighted Total 222 33 11 22 26 16 43 23 17 13 18 142 80 61 161
Weighted Total 217 29 11 23 26 17 42 22 16 13 20 137 80 79 139100% 100% 100% 100% 100% 100% 100% 100% 100% 100% 100% 100% 100% 100% 100%
Greatly hindered (1) 11 3 1 3 3 - - - - - 2 7 4 8 45% 11% 7% 14% 10% - - - - - 10% 5% 5% 10% 3%
Slightly hindered (2) 4 1 - - 1 - 2 - 1 - - 2 1 2 22% 2% - - 3% - 4% - 4% - - 2% 2% 2% 2%
No impact (3) 41 13 3 5 5 2 2 2 5 2 1 23 18 14 2719% 46% 29% 24% 18% 12% 5% 11% 30% 13% 6% 17% 22% 18% 19%
Slightly improved (4) 59 6 4 4 5 3 16 11 4 1 4 36 23 19 4027% 21% 38% 18% 19% 18% 39% 49% 26% 10% 22% 26% 29% 24% 29%
Greatly improved (5) 69 1 1 7 10 9 18 3 2 7 11 48 21 29 4032% 3% 9% 30% 40% 54% 42% 15% 13% 50% 58% 35% 26% 36% 29%
Don't know 12 1 1 - 1 2 1 2 1 3 - 7 5 1 116% 5% 7% - 3% 12% 3% 9% 6% 21% - 5% 7% 1% 8%
Not applicable 22 4 1 3 2 1 3 4 3 1 1 14 7 7 1510% 12% 10% 14% 6% 4% 7% 17% 21% 7% 5% 10% 9% 8% 11%
NETS
Net: Hindered 15 4 1 3 3 - 2 - 1 - 2 9 6 9 67% 13% 7% 14% 13% - 4% - 4% - 10% 7% 7% 12% 4%
Net: Improved 128 7 5 11 15 12 34 14 6 8 16 84 44 48 8059% 24% 46% 48% 59% 72% 81% 63% 39% 60% 80% 61% 55% 61% 58%
Mean score 3.93 3.04 3.49 3.60 3.84 4.50 4.33 4.05 3.64 4.52 4.24 3.99 3.82 3.84 3.98Standard deviation 1.11 .98 1.05 1.41 1.36 .76 .77 .60 .87 .82 1.27 1.12 1.10 1.29 .99Standard error .08 .19 .35 .32 .28 .22 .13 .15 .24 .27 .31 .10 .14 .17 .09
Online fieldwork: 26th March - 15th April 2015 Prepared by ComRes Ltd
Page 200
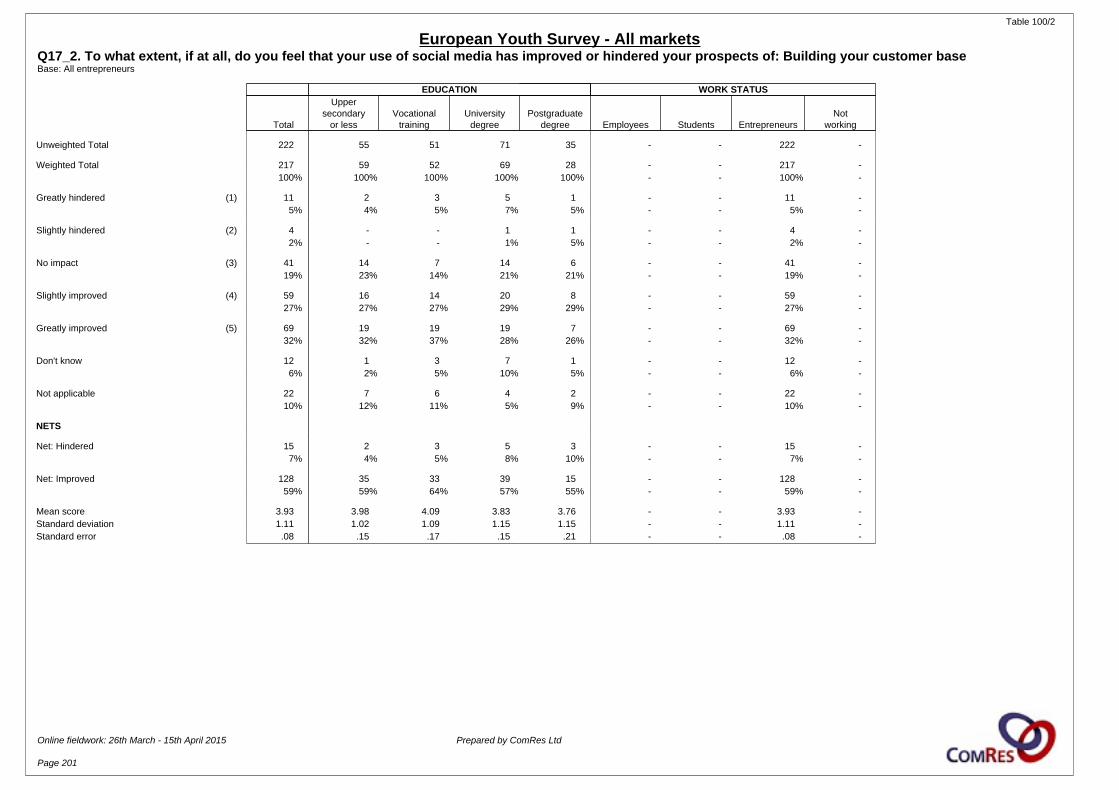
Table 100/2
European Youth Survey - All marketsQ17_2. To what extent, if at all, do you feel that your use of social media has improved or hindered your prospects of: Building your customer baseBase: All entrepreneurs
EDUCATION WORK STATUS
Total
Uppersecondary
or lessVocational
trainingUniversity
degreePostgraduate
degree Employees Students EntrepreneursNot
working
Unweighted Total 222 55 51 71 35 - - 222 -
Weighted Total 217 59 52 69 28 - - 217 -100% 100% 100% 100% 100% - - 100% -
Greatly hindered (1) 11 2 3 5 1 - - 11 -5% 4% 5% 7% 5% - - 5% -
Slightly hindered (2) 4 - - 1 1 - - 4 -2% - - 1% 5% - - 2% -
No impact (3) 41 14 7 14 6 - - 41 -19% 23% 14% 21% 21% - - 19% -
Slightly improved (4) 59 16 14 20 8 - - 59 -27% 27% 27% 29% 29% - - 27% -
Greatly improved (5) 69 19 19 19 7 - - 69 -32% 32% 37% 28% 26% - - 32% -
Don't know 12 1 3 7 1 - - 12 -6% 2% 5% 10% 5% - - 6% -
Not applicable 22 7 6 4 2 - - 22 -10% 12% 11% 5% 9% - - 10% -
NETS
Net: Hindered 15 2 3 5 3 - - 15 -7% 4% 5% 8% 10% - - 7% -
Net: Improved 128 35 33 39 15 - - 128 -59% 59% 64% 57% 55% - - 59% -
Mean score 3.93 3.98 4.09 3.83 3.76 - - 3.93 -Standard deviation 1.11 1.02 1.09 1.15 1.15 - - 1.11 -Standard error .08 .15 .17 .15 .21 - - .08 -
Online fieldwork: 26th March - 15th April 2015 Prepared by ComRes Ltd
Page 201

Table 101/1
European Youth Survey - All marketsQ17_3. To what extent, if at all, do you feel that your use of social media has improved or hindered your prospects of: Improving your services or productsBase: All entrepreneurs
COUNTRY GENDER AGE
Total Italy Germany France Spain UKEasternEurope Baltic Nordics Sweden Benelux Male Female 18-22 22-29
Unweighted Total 222 33 11 22 26 16 43 23 17 13 18 142 80 61 161
Weighted Total 217 29 11 23 26 17 42 22 16 13 20 137 80 79 139100% 100% 100% 100% 100% 100% 100% 100% 100% 100% 100% 100% 100% 100% 100%
Greatly hindered (1) 9 3 1 1 1 - 2 - - - 2 5 4 6 44% 10% 7% 3% 4% - 4% - - - 10% 4% 5% 7% 3%
Slightly hindered (2) 7 1 - 1 1 - 1 1 1 - 1 4 2 3 33% 3% - 5% 3% - 2% 5% 4% - 6% 3% 3% 4% 2%
No impact (3) 56 14 4 6 6 6 9 3 5 - 4 36 20 17 3926% 49% 36% 27% 23% 37% 21% 13% 29% - 19% 26% 25% 21% 28%
Slightly improved (4) 50 5 4 3 7 2 11 4 3 5 6 28 22 13 3723% 16% 40% 14% 28% 13% 25% 17% 21% 36% 32% 20% 27% 17% 27%
Greatly improved (5) 61 1 - 10 9 5 16 10 1 5 4 43 18 31 3028% 3% - 43% 37% 31% 38% 48% 6% 36% 21% 32% 22% 40% 22%
Don't know 11 1 1 - 1 1 2 1 1 3 1 5 6 - 115% 3% 7% - 3% 8% 5% 3% 6% 21% 7% 4% 8% - 8%
Not applicable 23 5 1 2 1 2 2 3 5 1 1 15 7 9 1411% 17% 10% 9% 3% 10% 5% 13% 33% 7% 5% 11% 9% 11% 10%
NETS
Net: Hindered 16 4 1 2 2 - 3 1 1 - 3 9 6 9 77% 13% 7% 8% 7% - 6% 5% 4% - 17% 7% 8% 11% 5%
Net: Improved 111 5 4 13 16 8 26 14 4 9 10 71 40 44 6751% 18% 40% 57% 64% 44% 63% 65% 27% 72% 53% 52% 50% 56% 48%
Mean score 3.81 2.98 3.30 3.96 3.96 3.93 4.01 4.28 3.48 4.50 3.53 3.86 3.71 3.87 3.77Standard deviation 1.10 .95 .91 1.17 1.09 .95 1.08 .98 .82 .53 1.29 1.10 1.10 1.27 .98Standard error .08 .18 .30 .26 .22 .27 .17 .22 .25 .18 .32 .10 .14 .17 .09
Online fieldwork: 26th March - 15th April 2015 Prepared by ComRes Ltd
Page 202

Table 101/2
European Youth Survey - All marketsQ17_3. To what extent, if at all, do you feel that your use of social media has improved or hindered your prospects of: Improving your services or productsBase: All entrepreneurs
EDUCATION WORK STATUS
Total
Uppersecondary
or lessVocational
trainingUniversity
degreePostgraduate
degree Employees Students EntrepreneursNot
working
Unweighted Total 222 55 51 71 35 - - 222 -
Weighted Total 217 59 52 69 28 - - 217 -100% 100% 100% 100% 100% - - 100% -
Greatly hindered (1) 9 1 2 4 1 - - 9 -4% 2% 4% 5% 2% - - 4% -
Slightly hindered (2) 7 1 1 2 3 - - 7 -3% 2% 2% 3% 10% - - 3% -
No impact (3) 56 17 15 17 5 - - 56 -26% 28% 30% 25% 19% - - 26% -
Slightly improved (4) 50 13 10 18 8 - - 50 -23% 22% 20% 26% 29% - - 23% -
Greatly improved (5) 61 16 14 20 8 - - 61 -28% 27% 26% 30% 29% - - 28% -
Don't know 11 2 3 5 1 - - 11 -5% 4% 6% 7% 2% - - 5% -
Not applicable 23 9 6 2 2 - - 23 -11% 15% 12% 4% 9% - - 11% -
NETS
Net: Hindered 16 3 3 6 3 - - 16 -7% 4% 6% 8% 12% - - 7% -
Net: Improved 111 29 24 38 16 - - 111 -51% 49% 47% 56% 58% - - 51% -
Mean score 3.81 3.86 3.78 3.81 3.81 - - 3.81 -Standard deviation 1.10 1.02 1.07 1.13 1.11 - - 1.10 -Standard error .08 .15 .17 .14 .20 - - .08 -
Online fieldwork: 26th March - 15th April 2015 Prepared by ComRes Ltd
Page 203
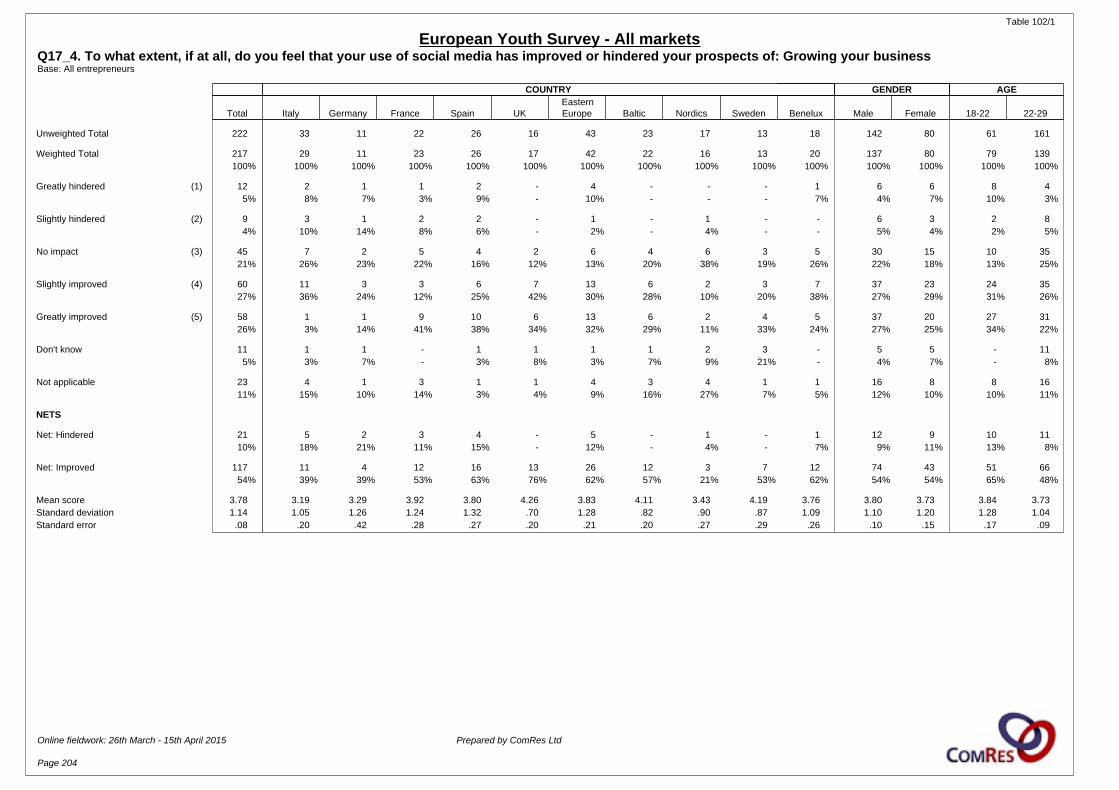
Table 102/1
European Youth Survey - All marketsQ17_4. To what extent, if at all, do you feel that your use of social media has improved or hindered your prospects of: Growing your businessBase: All entrepreneurs
COUNTRY GENDER AGE
Total Italy Germany France Spain UKEasternEurope Baltic Nordics Sweden Benelux Male Female 18-22 22-29
Unweighted Total 222 33 11 22 26 16 43 23 17 13 18 142 80 61 161
Weighted Total 217 29 11 23 26 17 42 22 16 13 20 137 80 79 139100% 100% 100% 100% 100% 100% 100% 100% 100% 100% 100% 100% 100% 100% 100%
Greatly hindered (1) 12 2 1 1 2 - 4 - - - 1 6 6 8 45% 8% 7% 3% 9% - 10% - - - 7% 4% 7% 10% 3%
Slightly hindered (2) 9 3 1 2 2 - 1 - 1 - - 6 3 2 84% 10% 14% 8% 6% - 2% - 4% - - 5% 4% 2% 5%
No impact (3) 45 7 2 5 4 2 6 4 6 3 5 30 15 10 3521% 26% 23% 22% 16% 12% 13% 20% 38% 19% 26% 22% 18% 13% 25%
Slightly improved (4) 60 11 3 3 6 7 13 6 2 3 7 37 23 24 3527% 36% 24% 12% 25% 42% 30% 28% 10% 20% 38% 27% 29% 31% 26%
Greatly improved (5) 58 1 1 9 10 6 13 6 2 4 5 37 20 27 3126% 3% 14% 41% 38% 34% 32% 29% 11% 33% 24% 27% 25% 34% 22%
Don't know 11 1 1 - 1 1 1 1 2 3 - 5 5 - 115% 3% 7% - 3% 8% 3% 7% 9% 21% - 4% 7% - 8%
Not applicable 23 4 1 3 1 1 4 3 4 1 1 16 8 8 1611% 15% 10% 14% 3% 4% 9% 16% 27% 7% 5% 12% 10% 10% 11%
NETS
Net: Hindered 21 5 2 3 4 - 5 - 1 - 1 12 9 10 1110% 18% 21% 11% 15% - 12% - 4% - 7% 9% 11% 13% 8%
Net: Improved 117 11 4 12 16 13 26 12 3 7 12 74 43 51 6654% 39% 39% 53% 63% 76% 62% 57% 21% 53% 62% 54% 54% 65% 48%
Mean score 3.78 3.19 3.29 3.92 3.80 4.26 3.83 4.11 3.43 4.19 3.76 3.80 3.73 3.84 3.73Standard deviation 1.14 1.05 1.26 1.24 1.32 .70 1.28 .82 .90 .87 1.09 1.10 1.20 1.28 1.04Standard error .08 .20 .42 .28 .27 .20 .21 .20 .27 .29 .26 .10 .15 .17 .09
Online fieldwork: 26th March - 15th April 2015 Prepared by ComRes Ltd
Page 204
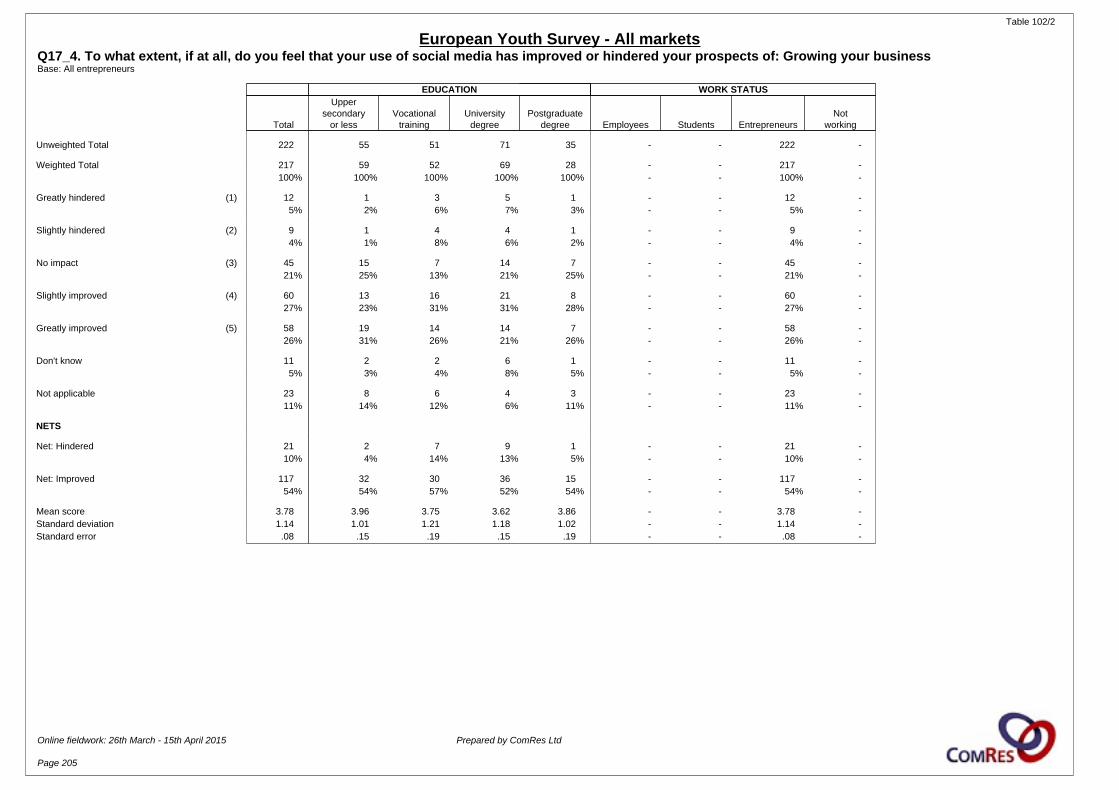
Table 102/2
European Youth Survey - All marketsQ17_4. To what extent, if at all, do you feel that your use of social media has improved or hindered your prospects of: Growing your businessBase: All entrepreneurs
EDUCATION WORK STATUS
Total
Uppersecondary
or lessVocational
trainingUniversity
degreePostgraduate
degree Employees Students EntrepreneursNot
working
Unweighted Total 222 55 51 71 35 - - 222 -
Weighted Total 217 59 52 69 28 - - 217 -100% 100% 100% 100% 100% - - 100% -
Greatly hindered (1) 12 1 3 5 1 - - 12 -5% 2% 6% 7% 3% - - 5% -
Slightly hindered (2) 9 1 4 4 1 - - 9 -4% 1% 8% 6% 2% - - 4% -
No impact (3) 45 15 7 14 7 - - 45 -21% 25% 13% 21% 25% - - 21% -
Slightly improved (4) 60 13 16 21 8 - - 60 -27% 23% 31% 31% 28% - - 27% -
Greatly improved (5) 58 19 14 14 7 - - 58 -26% 31% 26% 21% 26% - - 26% -
Don't know 11 2 2 6 1 - - 11 -5% 3% 4% 8% 5% - - 5% -
Not applicable 23 8 6 4 3 - - 23 -11% 14% 12% 6% 11% - - 11% -
NETS
Net: Hindered 21 2 7 9 1 - - 21 -10% 4% 14% 13% 5% - - 10% -
Net: Improved 117 32 30 36 15 - - 117 -54% 54% 57% 52% 54% - - 54% -
Mean score 3.78 3.96 3.75 3.62 3.86 - - 3.78 -Standard deviation 1.14 1.01 1.21 1.18 1.02 - - 1.14 -Standard error .08 .15 .19 .15 .19 - - .08 -
Online fieldwork: 26th March - 15th April 2015 Prepared by ComRes Ltd
Page 205
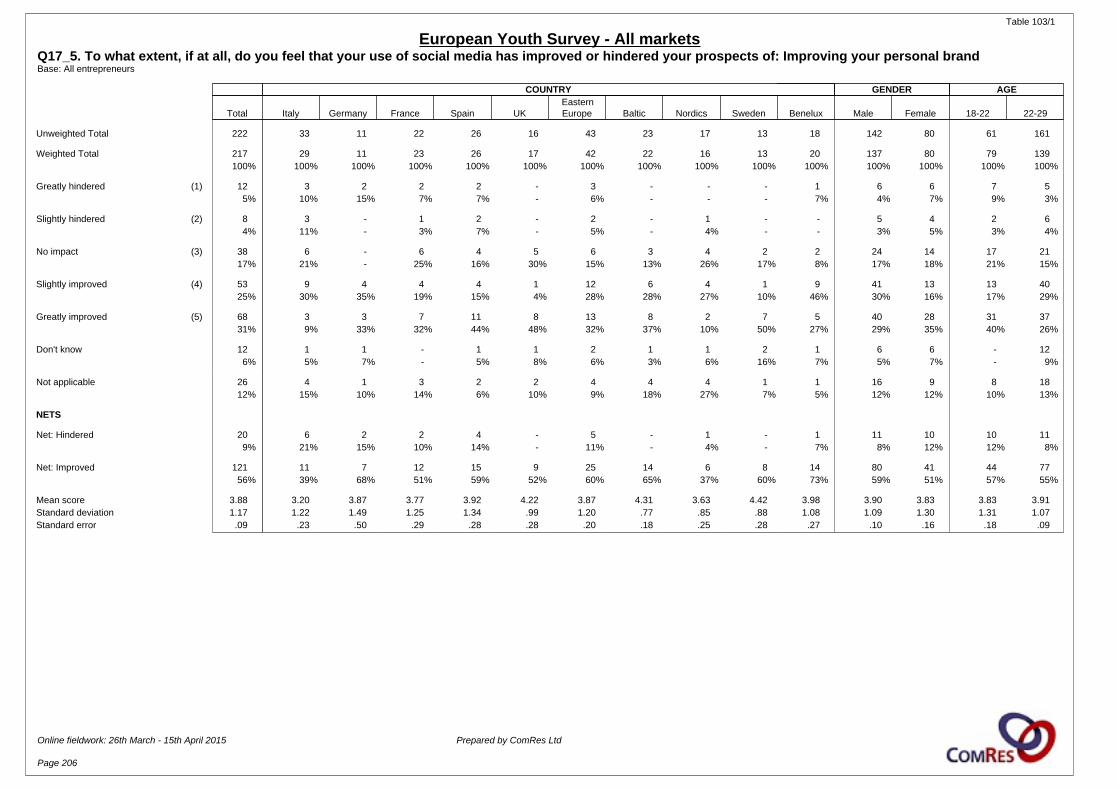
Table 103/1
European Youth Survey - All marketsQ17_5. To what extent, if at all, do you feel that your use of social media has improved or hindered your prospects of: Improving your personal brandBase: All entrepreneurs
COUNTRY GENDER AGE
Total Italy Germany France Spain UKEasternEurope Baltic Nordics Sweden Benelux Male Female 18-22 22-29
Unweighted Total 222 33 11 22 26 16 43 23 17 13 18 142 80 61 161
Weighted Total 217 29 11 23 26 17 42 22 16 13 20 137 80 79 139100% 100% 100% 100% 100% 100% 100% 100% 100% 100% 100% 100% 100% 100% 100%
Greatly hindered (1) 12 3 2 2 2 - 3 - - - 1 6 6 7 55% 10% 15% 7% 7% - 6% - - - 7% 4% 7% 9% 3%
Slightly hindered (2) 8 3 - 1 2 - 2 - 1 - - 5 4 2 64% 11% - 3% 7% - 5% - 4% - - 3% 5% 3% 4%
No impact (3) 38 6 - 6 4 5 6 3 4 2 2 24 14 17 2117% 21% - 25% 16% 30% 15% 13% 26% 17% 8% 17% 18% 21% 15%
Slightly improved (4) 53 9 4 4 4 1 12 6 4 1 9 41 13 13 4025% 30% 35% 19% 15% 4% 28% 28% 27% 10% 46% 30% 16% 17% 29%
Greatly improved (5) 68 3 3 7 11 8 13 8 2 7 5 40 28 31 3731% 9% 33% 32% 44% 48% 32% 37% 10% 50% 27% 29% 35% 40% 26%
Don't know 12 1 1 - 1 1 2 1 1 2 1 6 6 - 126% 5% 7% - 5% 8% 6% 3% 6% 16% 7% 5% 7% - 9%
Not applicable 26 4 1 3 2 2 4 4 4 1 1 16 9 8 1812% 15% 10% 14% 6% 10% 9% 18% 27% 7% 5% 12% 12% 10% 13%
NETS
Net: Hindered 20 6 2 2 4 - 5 - 1 - 1 11 10 10 119% 21% 15% 10% 14% - 11% - 4% - 7% 8% 12% 12% 8%
Net: Improved 121 11 7 12 15 9 25 14 6 8 14 80 41 44 7756% 39% 68% 51% 59% 52% 60% 65% 37% 60% 73% 59% 51% 57% 55%
Mean score 3.88 3.20 3.87 3.77 3.92 4.22 3.87 4.31 3.63 4.42 3.98 3.90 3.83 3.83 3.91Standard deviation 1.17 1.22 1.49 1.25 1.34 .99 1.20 .77 .85 .88 1.08 1.09 1.30 1.31 1.07Standard error .09 .23 .50 .29 .28 .28 .20 .18 .25 .28 .27 .10 .16 .18 .09
Online fieldwork: 26th March - 15th April 2015 Prepared by ComRes Ltd
Page 206
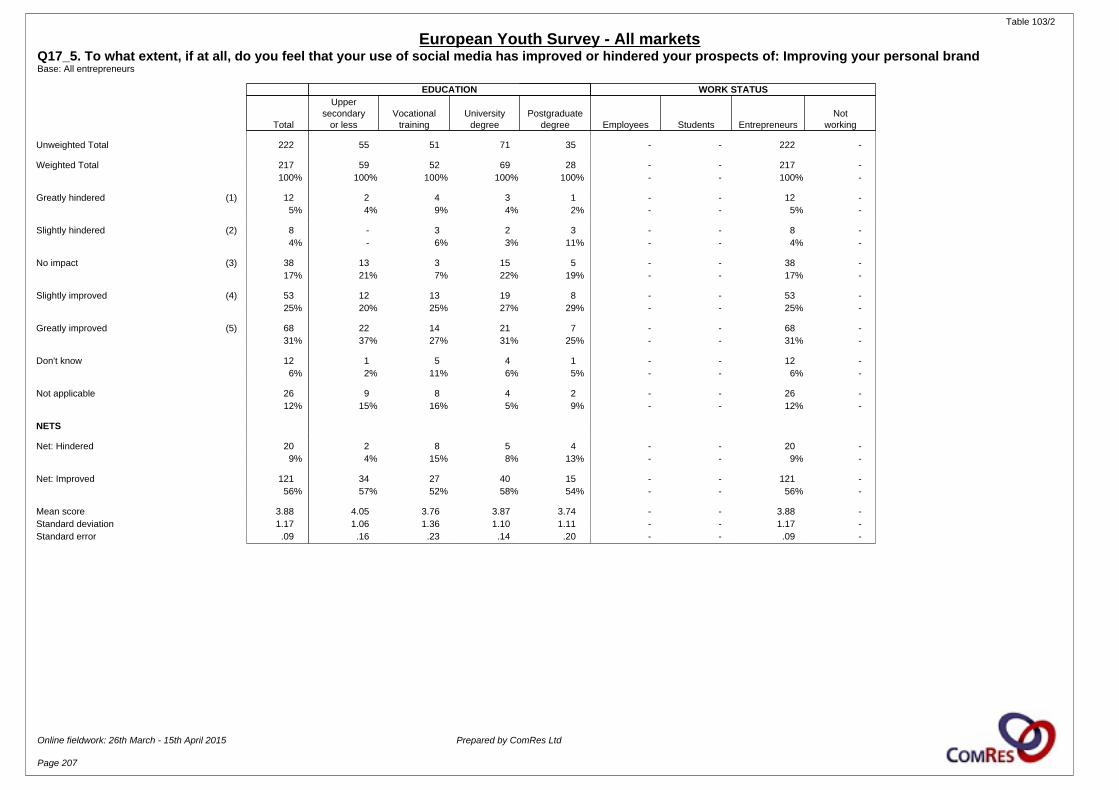
Table 103/2
European Youth Survey - All marketsQ17_5. To what extent, if at all, do you feel that your use of social media has improved or hindered your prospects of: Improving your personal brandBase: All entrepreneurs
EDUCATION WORK STATUS
Total
Uppersecondary
or lessVocational
trainingUniversity
degreePostgraduate
degree Employees Students EntrepreneursNot
working
Unweighted Total 222 55 51 71 35 - - 222 -
Weighted Total 217 59 52 69 28 - - 217 -100% 100% 100% 100% 100% - - 100% -
Greatly hindered (1) 12 2 4 3 1 - - 12 -5% 4% 9% 4% 2% - - 5% -
Slightly hindered (2) 8 - 3 2 3 - - 8 -4% - 6% 3% 11% - - 4% -
No impact (3) 38 13 3 15 5 - - 38 -17% 21% 7% 22% 19% - - 17% -
Slightly improved (4) 53 12 13 19 8 - - 53 -25% 20% 25% 27% 29% - - 25% -
Greatly improved (5) 68 22 14 21 7 - - 68 -31% 37% 27% 31% 25% - - 31% -
Don't know 12 1 5 4 1 - - 12 -6% 2% 11% 6% 5% - - 6% -
Not applicable 26 9 8 4 2 - - 26 -12% 15% 16% 5% 9% - - 12% -
NETS
Net: Hindered 20 2 8 5 4 - - 20 -9% 4% 15% 8% 13% - - 9% -
Net: Improved 121 34 27 40 15 - - 121 -56% 57% 52% 58% 54% - - 56% -
Mean score 3.88 4.05 3.76 3.87 3.74 - - 3.88 -Standard deviation 1.17 1.06 1.36 1.10 1.11 - - 1.17 -Standard error .09 .16 .23 .14 .20 - - .09 -
Online fieldwork: 26th March - 15th April 2015 Prepared by ComRes Ltd
Page 207
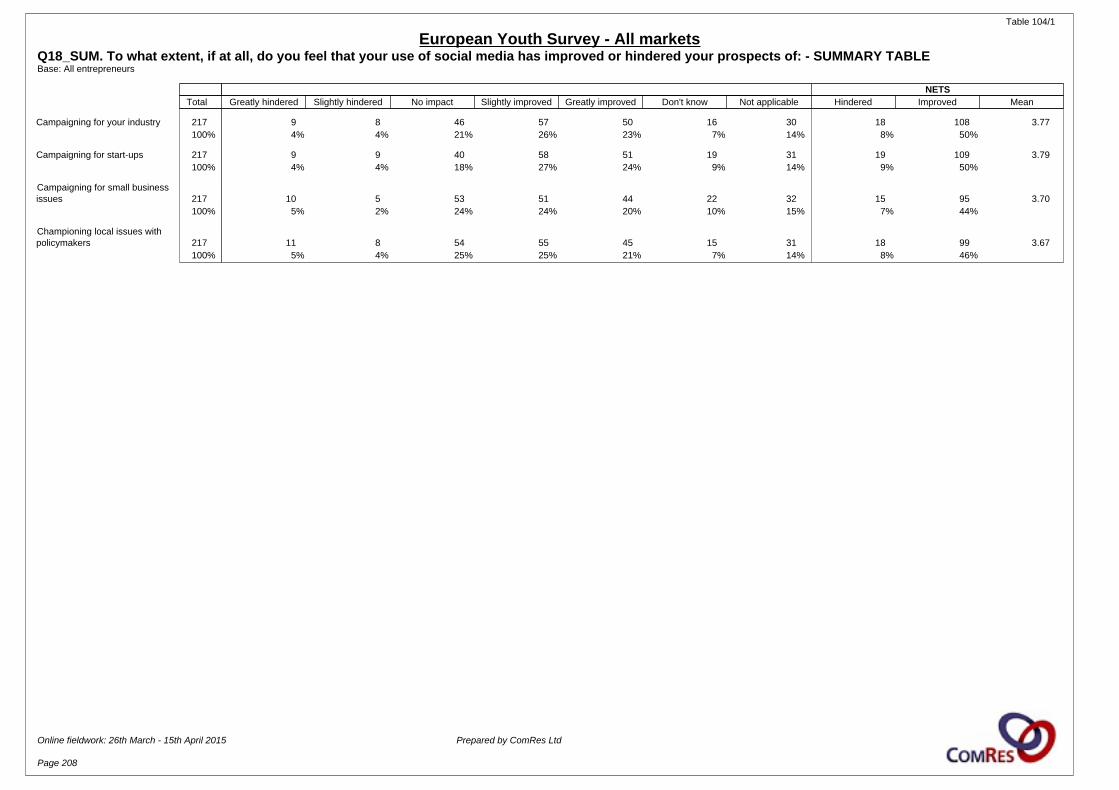
Table 104/1
European Youth Survey - All marketsQ18_SUM. To what extent, if at all, do you feel that your use of social media has improved or hindered your prospects of: - SUMMARY TABLEBase: All entrepreneurs
NETS Total Greatly hindered Slightly hindered No impact Slightly improved Greatly improved Don't know Not applicable Hindered Improved Mean
Campaigning for your industry 217 9 8 46 57 50 16 30 18 108 3.77100% 4% 4% 21% 26% 23% 7% 14% 8% 50%
Campaigning for start-ups 217 9 9 40 58 51 19 31 19 109 3.79100% 4% 4% 18% 27% 24% 9% 14% 9% 50%
Campaigning for small businessissues 217 10 5 53 51 44 22 32 15 95 3.70
100% 5% 2% 24% 24% 20% 10% 15% 7% 44%
Championing local issues withpolicymakers 217 11 8 54 55 45 15 31 18 99 3.67
100% 5% 4% 25% 25% 21% 7% 14% 8% 46%
Online fieldwork: 26th March - 15th April 2015 Prepared by ComRes Ltd
Page 208

Table 105/1
European Youth Survey - All marketsQ18_1. To what extent, if at all, do you feel that your use of social media has improved or hindered your prospects of: Campaigning for your industryBase: All entrepreneurs
COUNTRY GENDER AGE
Total Italy Germany France Spain UKEasternEurope Baltic Nordics Sweden Benelux Male Female 18-22 22-29
Unweighted Total 222 33 11 22 26 16 43 23 17 13 18 142 80 61 161
Weighted Total 217 29 11 23 26 17 42 22 16 13 20 137 80 79 139100% 100% 100% 100% 100% 100% 100% 100% 100% 100% 100% 100% 100% 100% 100%
Greatly hindered (1) 9 2 1 1 2 - 3 - - - 2 6 3 6 34% 6% 7% 3% 7% - 6% - - - 10% 4% 4% 8% 2%
Slightly hindered (2) 8 2 - 3 1 - 1 - 1 - 1 5 4 4 54% 7% - 11% 3% - 2% - 4% - 6% 3% 4% 5% 3%
No impact (3) 46 8 5 4 5 4 7 4 6 2 2 31 15 19 2721% 27% 45% 17% 19% 22% 16% 20% 40% 13% 10% 22% 19% 24% 19%
Slightly improved (4) 57 10 2 4 8 6 12 5 3 1 7 32 25 17 4026% 35% 17% 17% 32% 35% 29% 21% 16% 6% 35% 23% 32% 22% 29%
Greatly improved (5) 50 - - 8 8 2 14 3 3 6 5 36 14 25 2623% - - 35% 33% 10% 35% 16% 21% 44% 28% 26% 18% 31% 19%
Don't know 16 1 2 1 1 1 1 4 1 2 1 10 6 - 167% 5% 21% 3% 3% 8% 3% 18% 6% 16% 7% 7% 8% - 12%
Not applicable 30 6 1 3 1 4 4 5 2 3 1 18 12 8 2214% 20% 10% 13% 3% 25% 9% 25% 13% 21% 5% 13% 15% 10% 16%
NETS
Net: Hindered 18 4 1 3 2 - 4 - 1 - 3 11 7 10 88% 13% 7% 15% 10% - 9% - 4% - 16% 8% 9% 13% 6%
Net: Improved 108 10 2 12 17 8 27 8 6 7 12 68 39 42 6650% 35% 17% 51% 65% 45% 64% 37% 37% 50% 63% 50% 49% 53% 48%
Mean score 3.77 3.22 3.04 3.81 3.87 3.82 3.95 3.94 3.66 4.50 3.74 3.80 3.70 3.72 3.80Standard deviation 1.10 .92 .88 1.26 1.17 .69 1.16 .82 .96 .86 1.31 1.11 1.07 1.25 .98Standard error .08 .18 .33 .30 .24 .22 .19 .23 .26 .33 .33 .11 .14 .17 .09
Online fieldwork: 26th March - 15th April 2015 Prepared by ComRes Ltd
Page 209

Table 105/2
European Youth Survey - All marketsQ18_1. To what extent, if at all, do you feel that your use of social media has improved or hindered your prospects of: Campaigning for your industryBase: All entrepreneurs
EDUCATION WORK STATUS
Total
Uppersecondary
or lessVocational
trainingUniversity
degreePostgraduate
degree Employees Students EntrepreneursNot
working
Unweighted Total 222 55 51 71 35 - - 222 -
Weighted Total 217 59 52 69 28 - - 217 -100% 100% 100% 100% 100% - - 100% -
Greatly hindered (1) 9 1 3 2 1 - - 9 -4% 2% 6% 3% 3% - - 4% -
Slightly hindered (2) 8 1 1 4 3 - - 8 -4% 1% 2% 6% 9% - - 4% -
No impact (3) 46 17 4 17 9 - - 46 -21% 28% 7% 24% 31% - - 21% -
Slightly improved (4) 57 15 14 19 6 - - 57 -26% 26% 27% 28% 21% - - 26% -
Greatly improved (5) 50 11 16 14 6 - - 50 -23% 19% 31% 21% 23% - - 23% -
Don't know 16 3 6 6 1 - - 16 -7% 5% 11% 8% 5% - - 7% -
Not applicable 30 11 9 6 2 - - 30 -14% 18% 17% 9% 9% - - 14% -
NETS
Net: Hindered 18 2 4 6 3 - - 18 -8% 4% 7% 9% 12% - - 8% -
Net: Improved 108 27 30 34 12 - - 108 -50% 45% 58% 49% 44% - - 50% -
Mean score 3.77 3.76 4.04 3.69 3.60 - - 3.77 -Standard deviation 1.10 .95 1.16 1.07 1.10 - - 1.10 -Standard error .08 .15 .19 .14 .20 - - .08 -
Online fieldwork: 26th March - 15th April 2015 Prepared by ComRes Ltd
Page 210
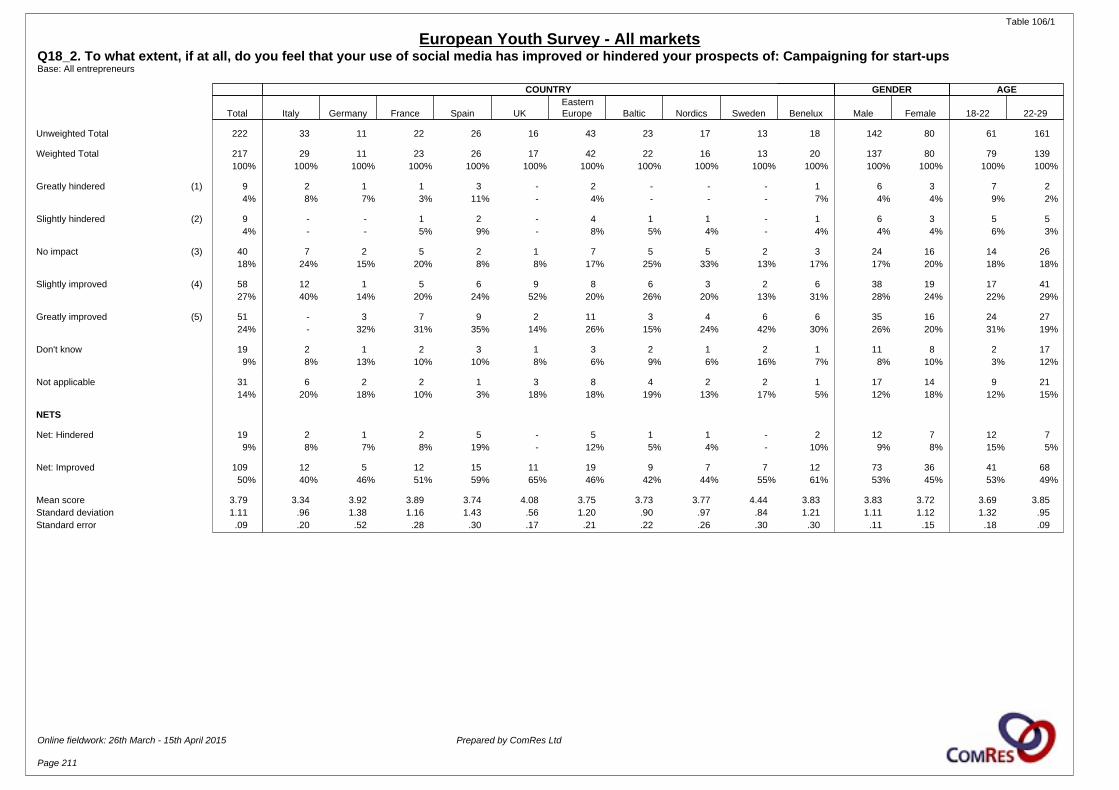
Table 106/1
European Youth Survey - All marketsQ18_2. To what extent, if at all, do you feel that your use of social media has improved or hindered your prospects of: Campaigning for start-upsBase: All entrepreneurs
COUNTRY GENDER AGE
Total Italy Germany France Spain UKEasternEurope Baltic Nordics Sweden Benelux Male Female 18-22 22-29
Unweighted Total 222 33 11 22 26 16 43 23 17 13 18 142 80 61 161
Weighted Total 217 29 11 23 26 17 42 22 16 13 20 137 80 79 139100% 100% 100% 100% 100% 100% 100% 100% 100% 100% 100% 100% 100% 100% 100%
Greatly hindered (1) 9 2 1 1 3 - 2 - - - 1 6 3 7 24% 8% 7% 3% 11% - 4% - - - 7% 4% 4% 9% 2%
Slightly hindered (2) 9 - - 1 2 - 4 1 1 - 1 6 3 5 54% - - 5% 9% - 8% 5% 4% - 4% 4% 4% 6% 3%
No impact (3) 40 7 2 5 2 1 7 5 5 2 3 24 16 14 2618% 24% 15% 20% 8% 8% 17% 25% 33% 13% 17% 17% 20% 18% 18%
Slightly improved (4) 58 12 1 5 6 9 8 6 3 2 6 38 19 17 4127% 40% 14% 20% 24% 52% 20% 26% 20% 13% 31% 28% 24% 22% 29%
Greatly improved (5) 51 - 3 7 9 2 11 3 4 6 6 35 16 24 2724% - 32% 31% 35% 14% 26% 15% 24% 42% 30% 26% 20% 31% 19%
Don't know 19 2 1 2 3 1 3 2 1 2 1 11 8 2 179% 8% 13% 10% 10% 8% 6% 9% 6% 16% 7% 8% 10% 3% 12%
Not applicable 31 6 2 2 1 3 8 4 2 2 1 17 14 9 2114% 20% 18% 10% 3% 18% 18% 19% 13% 17% 5% 12% 18% 12% 15%
NETS
Net: Hindered 19 2 1 2 5 - 5 1 1 - 2 12 7 12 79% 8% 7% 8% 19% - 12% 5% 4% - 10% 9% 8% 15% 5%
Net: Improved 109 12 5 12 15 11 19 9 7 7 12 73 36 41 6850% 40% 46% 51% 59% 65% 46% 42% 44% 55% 61% 53% 45% 53% 49%
Mean score 3.79 3.34 3.92 3.89 3.74 4.08 3.75 3.73 3.77 4.44 3.83 3.83 3.72 3.69 3.85Standard deviation 1.11 .96 1.38 1.16 1.43 .56 1.20 .90 .97 .84 1.21 1.11 1.12 1.32 .95Standard error .09 .20 .52 .28 .30 .17 .21 .22 .26 .30 .30 .11 .15 .18 .09
Online fieldwork: 26th March - 15th April 2015 Prepared by ComRes Ltd
Page 211
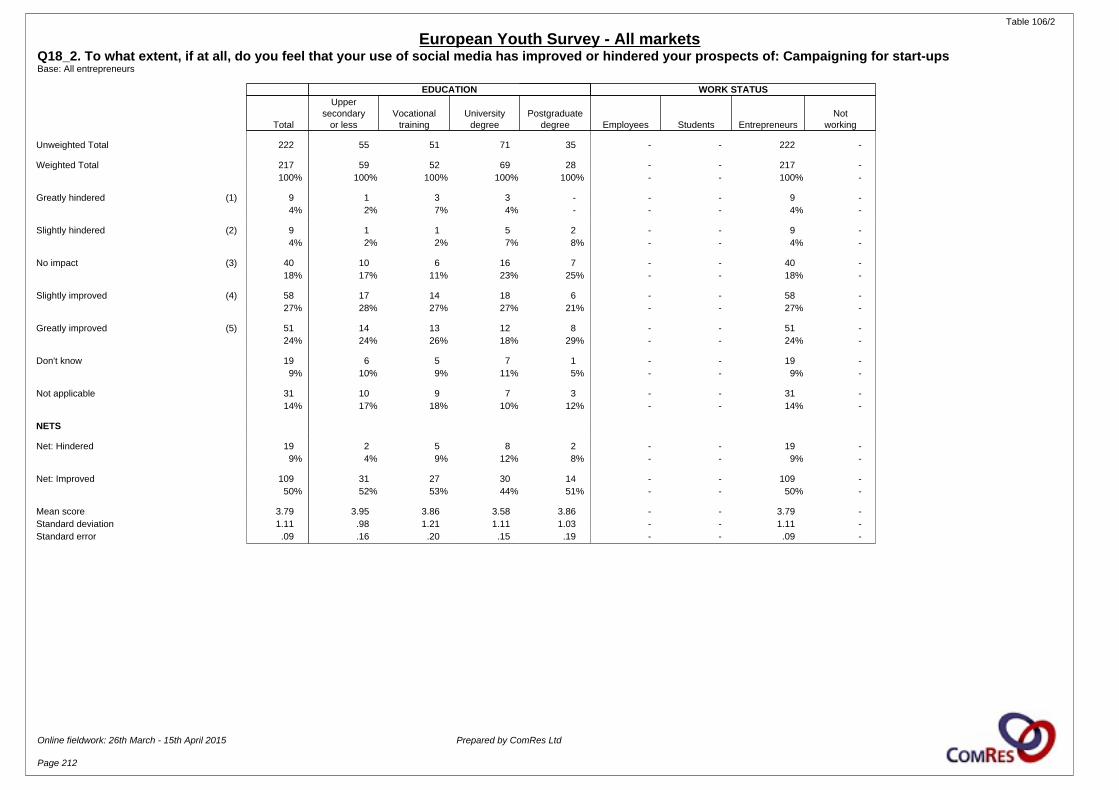
Table 106/2
European Youth Survey - All marketsQ18_2. To what extent, if at all, do you feel that your use of social media has improved or hindered your prospects of: Campaigning for start-upsBase: All entrepreneurs
EDUCATION WORK STATUS
Total
Uppersecondary
or lessVocational
trainingUniversity
degreePostgraduate
degree Employees Students EntrepreneursNot
working
Unweighted Total 222 55 51 71 35 - - 222 -
Weighted Total 217 59 52 69 28 - - 217 -100% 100% 100% 100% 100% - - 100% -
Greatly hindered (1) 9 1 3 3 - - - 9 -4% 2% 7% 4% - - - 4% -
Slightly hindered (2) 9 1 1 5 2 - - 9 -4% 2% 2% 7% 8% - - 4% -
No impact (3) 40 10 6 16 7 - - 40 -18% 17% 11% 23% 25% - - 18% -
Slightly improved (4) 58 17 14 18 6 - - 58 -27% 28% 27% 27% 21% - - 27% -
Greatly improved (5) 51 14 13 12 8 - - 51 -24% 24% 26% 18% 29% - - 24% -
Don't know 19 6 5 7 1 - - 19 -9% 10% 9% 11% 5% - - 9% -
Not applicable 31 10 9 7 3 - - 31 -14% 17% 18% 10% 12% - - 14% -
NETS
Net: Hindered 19 2 5 8 2 - - 19 -9% 4% 9% 12% 8% - - 9% -
Net: Improved 109 31 27 30 14 - - 109 -50% 52% 53% 44% 51% - - 50% -
Mean score 3.79 3.95 3.86 3.58 3.86 - - 3.79 -Standard deviation 1.11 .98 1.21 1.11 1.03 - - 1.11 -Standard error .09 .16 .20 .15 .19 - - .09 -
Online fieldwork: 26th March - 15th April 2015 Prepared by ComRes Ltd
Page 212
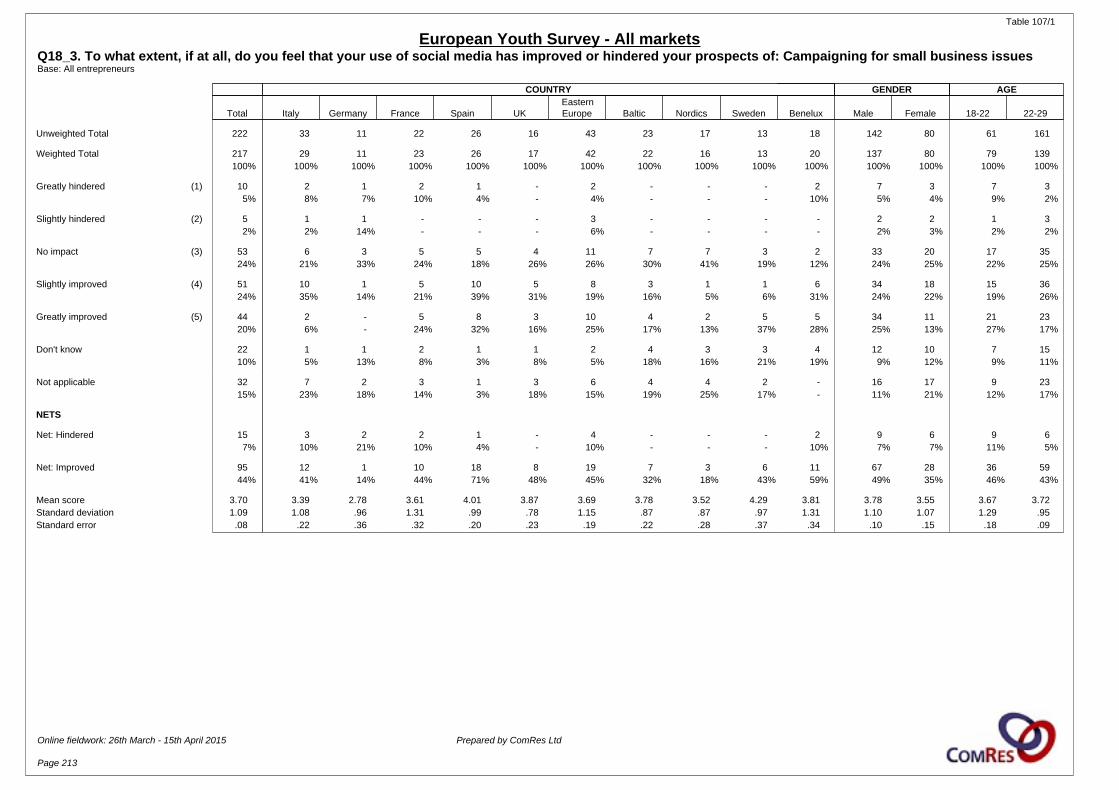
Table 107/1
European Youth Survey - All marketsQ18_3. To what extent, if at all, do you feel that your use of social media has improved or hindered your prospects of: Campaigning for small business issuesBase: All entrepreneurs
COUNTRY GENDER AGE
Total Italy Germany France Spain UKEasternEurope Baltic Nordics Sweden Benelux Male Female 18-22 22-29
Unweighted Total 222 33 11 22 26 16 43 23 17 13 18 142 80 61 161
Weighted Total 217 29 11 23 26 17 42 22 16 13 20 137 80 79 139100% 100% 100% 100% 100% 100% 100% 100% 100% 100% 100% 100% 100% 100% 100%
Greatly hindered (1) 10 2 1 2 1 - 2 - - - 2 7 3 7 35% 8% 7% 10% 4% - 4% - - - 10% 5% 4% 9% 2%
Slightly hindered (2) 5 1 1 - - - 3 - - - - 2 2 1 32% 2% 14% - - - 6% - - - - 2% 3% 2% 2%
No impact (3) 53 6 3 5 5 4 11 7 7 3 2 33 20 17 3524% 21% 33% 24% 18% 26% 26% 30% 41% 19% 12% 24% 25% 22% 25%
Slightly improved (4) 51 10 1 5 10 5 8 3 1 1 6 34 18 15 3624% 35% 14% 21% 39% 31% 19% 16% 5% 6% 31% 24% 22% 19% 26%
Greatly improved (5) 44 2 - 5 8 3 10 4 2 5 5 34 11 21 2320% 6% - 24% 32% 16% 25% 17% 13% 37% 28% 25% 13% 27% 17%
Don't know 22 1 1 2 1 1 2 4 3 3 4 12 10 7 1510% 5% 13% 8% 3% 8% 5% 18% 16% 21% 19% 9% 12% 9% 11%
Not applicable 32 7 2 3 1 3 6 4 4 2 - 16 17 9 2315% 23% 18% 14% 3% 18% 15% 19% 25% 17% - 11% 21% 12% 17%
NETS
Net: Hindered 15 3 2 2 1 - 4 - - - 2 9 6 9 67% 10% 21% 10% 4% - 10% - - - 10% 7% 7% 11% 5%
Net: Improved 95 12 1 10 18 8 19 7 3 6 11 67 28 36 5944% 41% 14% 44% 71% 48% 45% 32% 18% 43% 59% 49% 35% 46% 43%
Mean score 3.70 3.39 2.78 3.61 4.01 3.87 3.69 3.78 3.52 4.29 3.81 3.78 3.55 3.67 3.72Standard deviation 1.09 1.08 .96 1.31 .99 .78 1.15 .87 .87 .97 1.31 1.10 1.07 1.29 .95Standard error .08 .22 .36 .32 .20 .23 .19 .22 .28 .37 .34 .10 .15 .18 .09
Online fieldwork: 26th March - 15th April 2015 Prepared by ComRes Ltd
Page 213
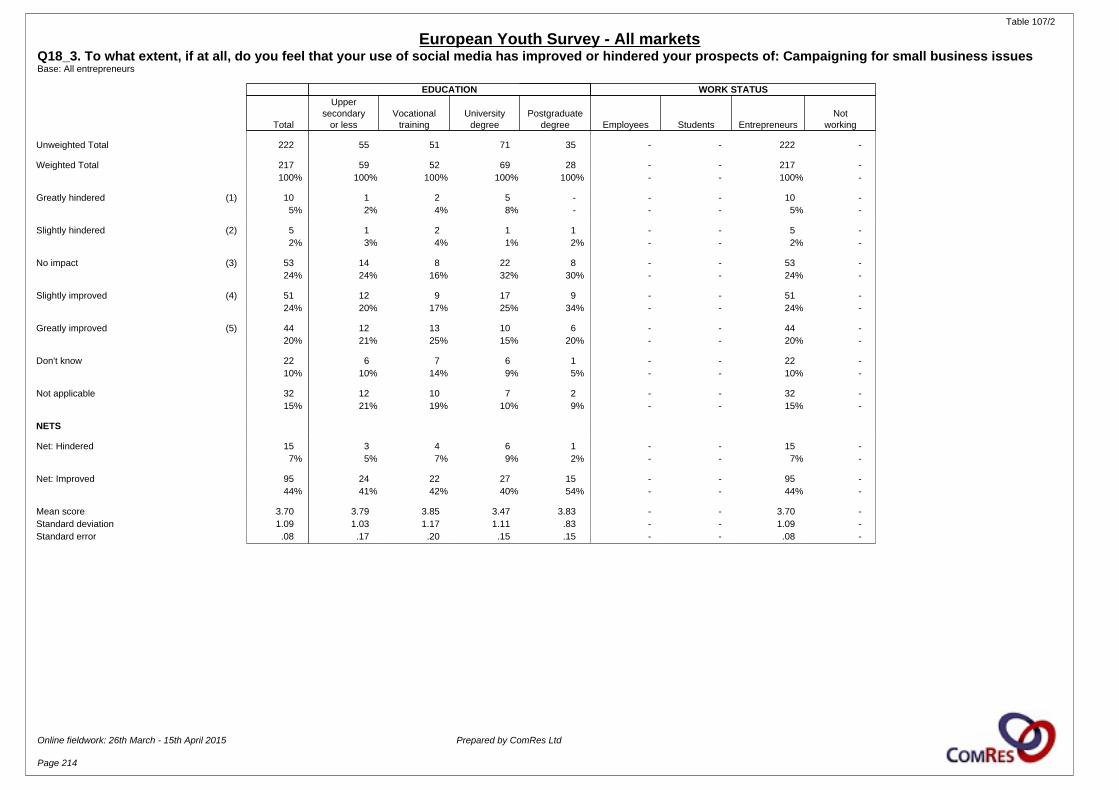
Table 107/2
European Youth Survey - All marketsQ18_3. To what extent, if at all, do you feel that your use of social media has improved or hindered your prospects of: Campaigning for small business issuesBase: All entrepreneurs
EDUCATION WORK STATUS
Total
Uppersecondary
or lessVocational
trainingUniversity
degreePostgraduate
degree Employees Students EntrepreneursNot
working
Unweighted Total 222 55 51 71 35 - - 222 -
Weighted Total 217 59 52 69 28 - - 217 -100% 100% 100% 100% 100% - - 100% -
Greatly hindered (1) 10 1 2 5 - - - 10 -5% 2% 4% 8% - - - 5% -
Slightly hindered (2) 5 1 2 1 1 - - 5 -2% 3% 4% 1% 2% - - 2% -
No impact (3) 53 14 8 22 8 - - 53 -24% 24% 16% 32% 30% - - 24% -
Slightly improved (4) 51 12 9 17 9 - - 51 -24% 20% 17% 25% 34% - - 24% -
Greatly improved (5) 44 12 13 10 6 - - 44 -20% 21% 25% 15% 20% - - 20% -
Don't know 22 6 7 6 1 - - 22 -10% 10% 14% 9% 5% - - 10% -
Not applicable 32 12 10 7 2 - - 32 -15% 21% 19% 10% 9% - - 15% -
NETS
Net: Hindered 15 3 4 6 1 - - 15 -7% 5% 7% 9% 2% - - 7% -
Net: Improved 95 24 22 27 15 - - 95 -44% 41% 42% 40% 54% - - 44% -
Mean score 3.70 3.79 3.85 3.47 3.83 - - 3.70 -Standard deviation 1.09 1.03 1.17 1.11 .83 - - 1.09 -Standard error .08 .17 .20 .15 .15 - - .08 -
Online fieldwork: 26th March - 15th April 2015 Prepared by ComRes Ltd
Page 214
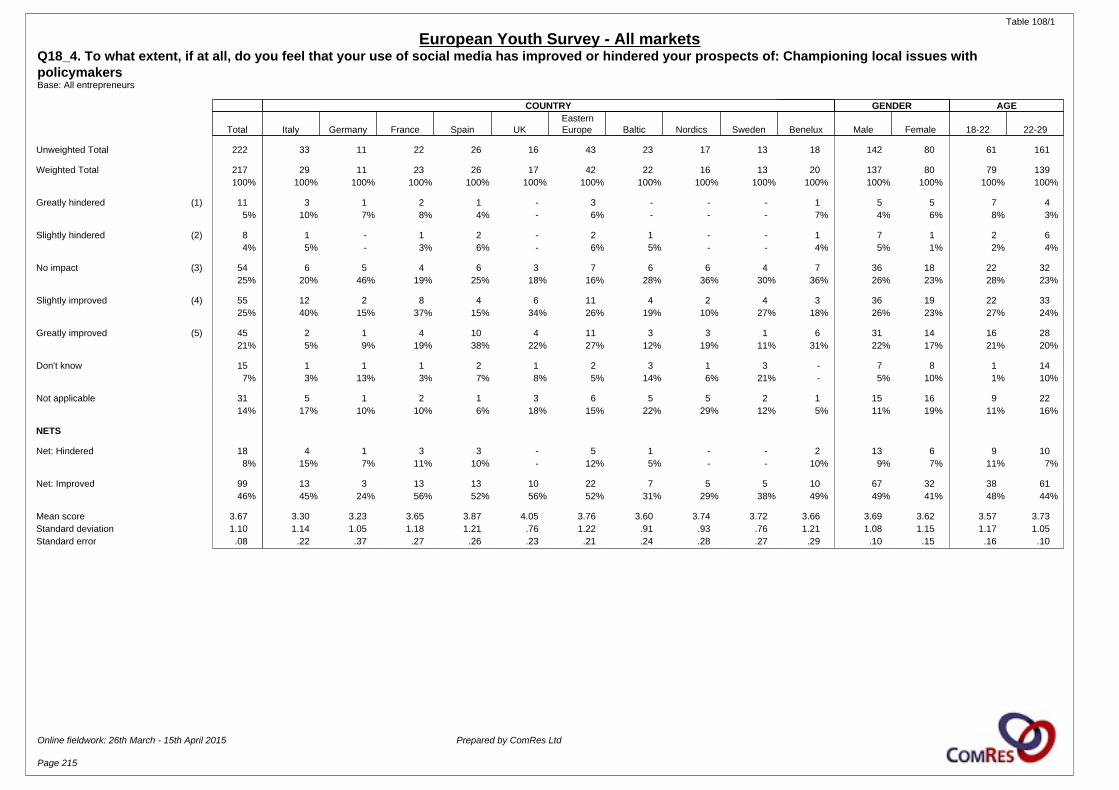
Table 108/1
European Youth Survey - All marketsQ18_4. To what extent, if at all, do you feel that your use of social media has improved or hindered your prospects of: Championing local issues with policymakersBase: All entrepreneurs
COUNTRY GENDER AGE
Total Italy Germany France Spain UKEasternEurope Baltic Nordics Sweden Benelux Male Female 18-22 22-29
Unweighted Total 222 33 11 22 26 16 43 23 17 13 18 142 80 61 161
Weighted Total 217 29 11 23 26 17 42 22 16 13 20 137 80 79 139100% 100% 100% 100% 100% 100% 100% 100% 100% 100% 100% 100% 100% 100% 100%
Greatly hindered (1) 11 3 1 2 1 - 3 - - - 1 5 5 7 45% 10% 7% 8% 4% - 6% - - - 7% 4% 6% 8% 3%
Slightly hindered (2) 8 1 - 1 2 - 2 1 - - 1 7 1 2 64% 5% - 3% 6% - 6% 5% - - 4% 5% 1% 2% 4%
No impact (3) 54 6 5 4 6 3 7 6 6 4 7 36 18 22 3225% 20% 46% 19% 25% 18% 16% 28% 36% 30% 36% 26% 23% 28% 23%
Slightly improved (4) 55 12 2 8 4 6 11 4 2 4 3 36 19 22 3325% 40% 15% 37% 15% 34% 26% 19% 10% 27% 18% 26% 23% 27% 24%
Greatly improved (5) 45 2 1 4 10 4 11 3 3 1 6 31 14 16 2821% 5% 9% 19% 38% 22% 27% 12% 19% 11% 31% 22% 17% 21% 20%
Don't know 15 1 1 1 2 1 2 3 1 3 - 7 8 1 147% 3% 13% 3% 7% 8% 5% 14% 6% 21% - 5% 10% 1% 10%
Not applicable 31 5 1 2 1 3 6 5 5 2 1 15 16 9 2214% 17% 10% 10% 6% 18% 15% 22% 29% 12% 5% 11% 19% 11% 16%
NETS
Net: Hindered 18 4 1 3 3 - 5 1 - - 2 13 6 9 108% 15% 7% 11% 10% - 12% 5% - - 10% 9% 7% 11% 7%
Net: Improved 99 13 3 13 13 10 22 7 5 5 10 67 32 38 6146% 45% 24% 56% 52% 56% 52% 31% 29% 38% 49% 49% 41% 48% 44%
Mean score 3.67 3.30 3.23 3.65 3.87 4.05 3.76 3.60 3.74 3.72 3.66 3.69 3.62 3.57 3.73Standard deviation 1.10 1.14 1.05 1.18 1.21 .76 1.22 .91 .93 .76 1.21 1.08 1.15 1.17 1.05Standard error .08 .22 .37 .27 .26 .23 .21 .24 .28 .27 .29 .10 .15 .16 .10
Online fieldwork: 26th March - 15th April 2015 Prepared by ComRes Ltd
Page 215
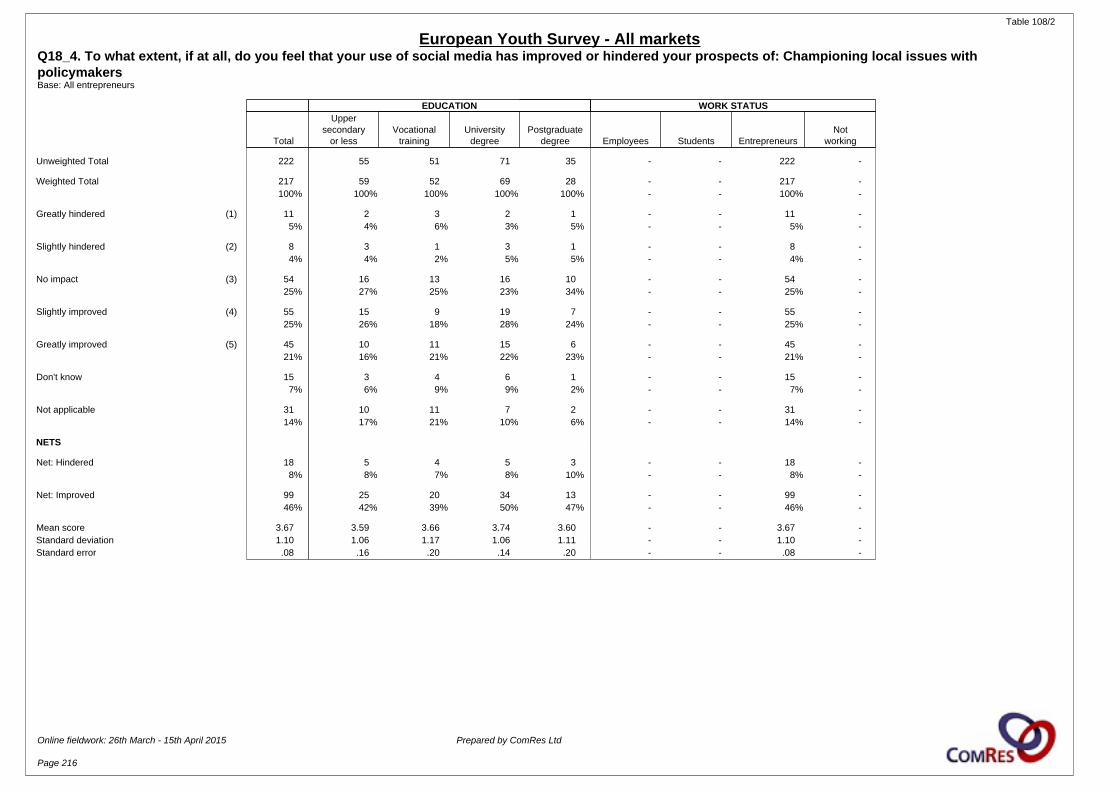
Table 108/2
European Youth Survey - All marketsQ18_4. To what extent, if at all, do you feel that your use of social media has improved or hindered your prospects of: Championing local issues with policymakersBase: All entrepreneurs
EDUCATION WORK STATUS
Total
Uppersecondary
or lessVocational
trainingUniversity
degreePostgraduate
degree Employees Students EntrepreneursNot
working
Unweighted Total 222 55 51 71 35 - - 222 -
Weighted Total 217 59 52 69 28 - - 217 -100% 100% 100% 100% 100% - - 100% -
Greatly hindered (1) 11 2 3 2 1 - - 11 -5% 4% 6% 3% 5% - - 5% -
Slightly hindered (2) 8 3 1 3 1 - - 8 -4% 4% 2% 5% 5% - - 4% -
No impact (3) 54 16 13 16 10 - - 54 -25% 27% 25% 23% 34% - - 25% -
Slightly improved (4) 55 15 9 19 7 - - 55 -25% 26% 18% 28% 24% - - 25% -
Greatly improved (5) 45 10 11 15 6 - - 45 -21% 16% 21% 22% 23% - - 21% -
Don't know 15 3 4 6 1 - - 15 -7% 6% 9% 9% 2% - - 7% -
Not applicable 31 10 11 7 2 - - 31 -14% 17% 21% 10% 6% - - 14% -
NETS
Net: Hindered 18 5 4 5 3 - - 18 -8% 8% 7% 8% 10% - - 8% -
Net: Improved 99 25 20 34 13 - - 99 -46% 42% 39% 50% 47% - - 46% -
Mean score 3.67 3.59 3.66 3.74 3.60 - - 3.67 -Standard deviation 1.10 1.06 1.17 1.06 1.11 - - 1.10 -Standard error .08 .16 .20 .14 .20 - - .08 -
Online fieldwork: 26th March - 15th April 2015 Prepared by ComRes Ltd
Page 216
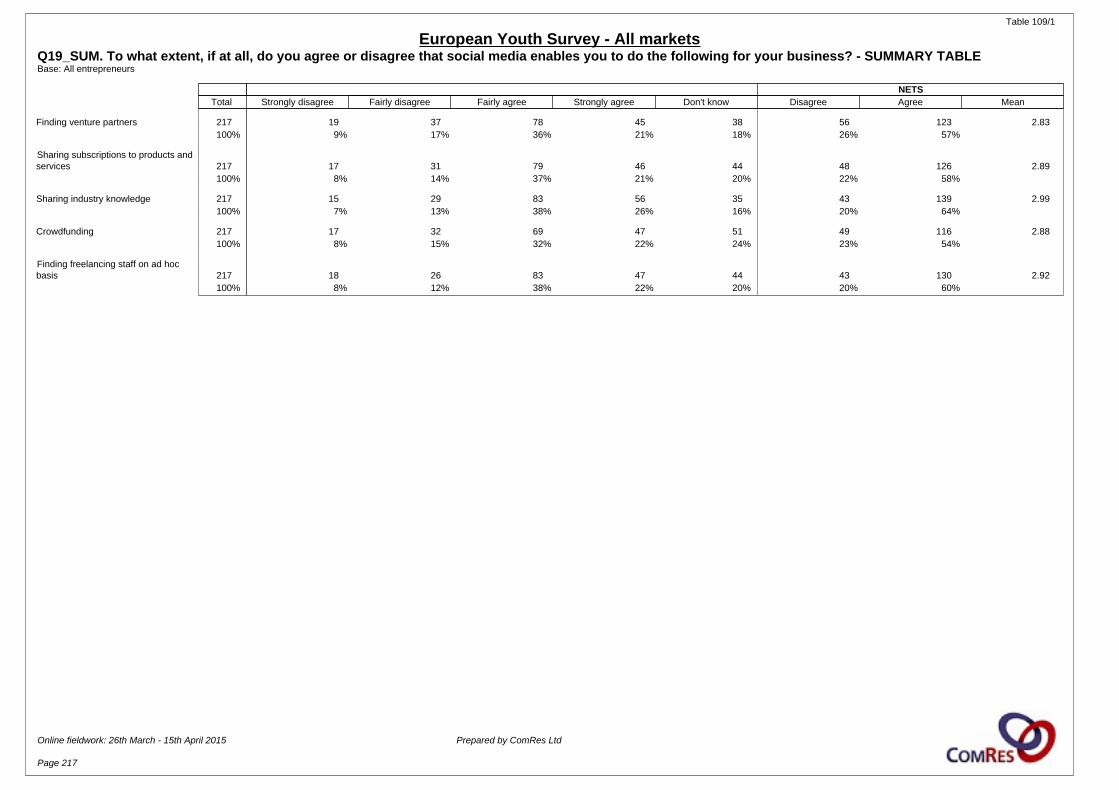
Table 109/1
European Youth Survey - All marketsQ19_SUM. To what extent, if at all, do you agree or disagree that social media enables you to do the following for your business? - SUMMARY TABLEBase: All entrepreneurs
NETS Total Strongly disagree Fairly disagree Fairly agree Strongly agree Don't know Disagree Agree Mean
Finding venture partners 217 19 37 78 45 38 56 123 2.83100% 9% 17% 36% 21% 18% 26% 57%
Sharing subscriptions to products andservices 217 17 31 79 46 44 48 126 2.89
100% 8% 14% 37% 21% 20% 22% 58%
Sharing industry knowledge 217 15 29 83 56 35 43 139 2.99100% 7% 13% 38% 26% 16% 20% 64%
Crowdfunding 217 17 32 69 47 51 49 116 2.88100% 8% 15% 32% 22% 24% 23% 54%
Finding freelancing staff on ad hocbasis 217 18 26 83 47 44 43 130 2.92
100% 8% 12% 38% 22% 20% 20% 60%
Online fieldwork: 26th March - 15th April 2015 Prepared by ComRes Ltd
Page 217
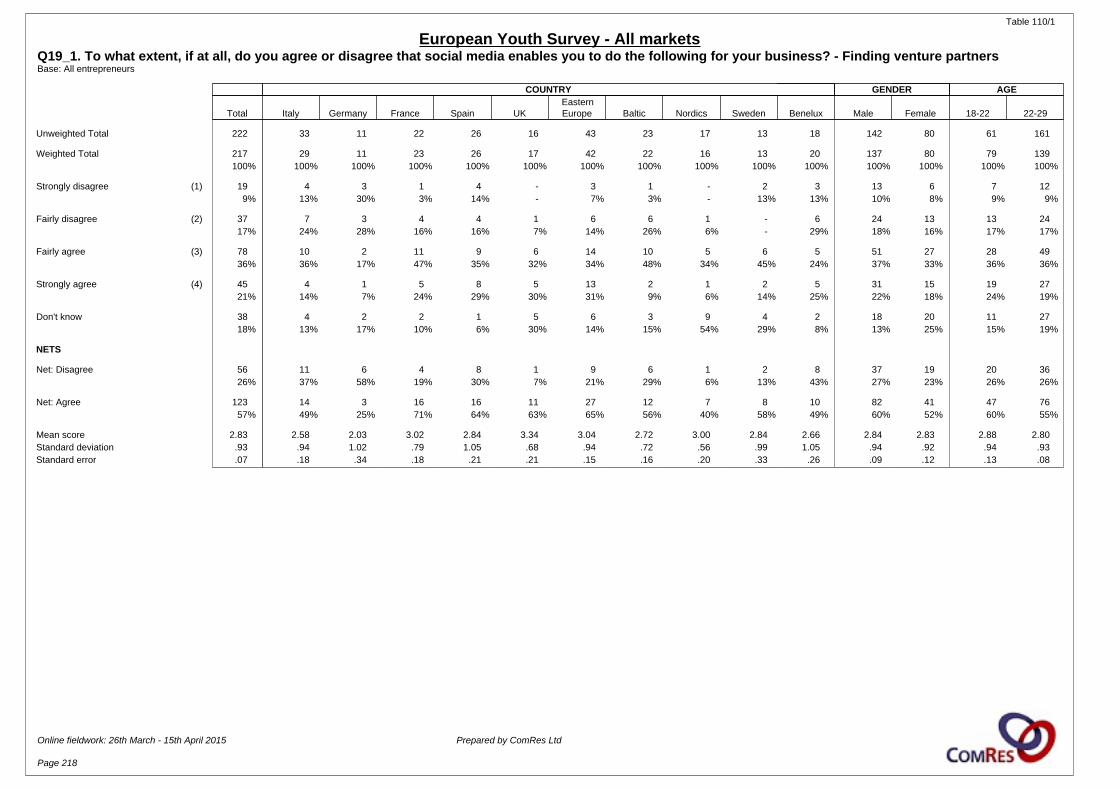
Table 110/1
European Youth Survey - All marketsQ19_1. To what extent, if at all, do you agree or disagree that social media enables you to do the following for your business? - Finding venture partnersBase: All entrepreneurs
COUNTRY GENDER AGE
Total Italy Germany France Spain UKEasternEurope Baltic Nordics Sweden Benelux Male Female 18-22 22-29
Unweighted Total 222 33 11 22 26 16 43 23 17 13 18 142 80 61 161
Weighted Total 217 29 11 23 26 17 42 22 16 13 20 137 80 79 139100% 100% 100% 100% 100% 100% 100% 100% 100% 100% 100% 100% 100% 100% 100%
Strongly disagree (1) 19 4 3 1 4 - 3 1 - 2 3 13 6 7 129% 13% 30% 3% 14% - 7% 3% - 13% 13% 10% 8% 9% 9%
Fairly disagree (2) 37 7 3 4 4 1 6 6 1 - 6 24 13 13 2417% 24% 28% 16% 16% 7% 14% 26% 6% - 29% 18% 16% 17% 17%
Fairly agree (3) 78 10 2 11 9 6 14 10 5 6 5 51 27 28 4936% 36% 17% 47% 35% 32% 34% 48% 34% 45% 24% 37% 33% 36% 36%
Strongly agree (4) 45 4 1 5 8 5 13 2 1 2 5 31 15 19 2721% 14% 7% 24% 29% 30% 31% 9% 6% 14% 25% 22% 18% 24% 19%
Don't know 38 4 2 2 1 5 6 3 9 4 2 18 20 11 2718% 13% 17% 10% 6% 30% 14% 15% 54% 29% 8% 13% 25% 15% 19%
NETS
Net: Disagree 56 11 6 4 8 1 9 6 1 2 8 37 19 20 3626% 37% 58% 19% 30% 7% 21% 29% 6% 13% 43% 27% 23% 26% 26%
Net: Agree 123 14 3 16 16 11 27 12 7 8 10 82 41 47 7657% 49% 25% 71% 64% 63% 65% 56% 40% 58% 49% 60% 52% 60% 55%
Mean score 2.83 2.58 2.03 3.02 2.84 3.34 3.04 2.72 3.00 2.84 2.66 2.84 2.83 2.88 2.80Standard deviation .93 .94 1.02 .79 1.05 .68 .94 .72 .56 .99 1.05 .94 .92 .94 .93Standard error .07 .18 .34 .18 .21 .21 .15 .16 .20 .33 .26 .09 .12 .13 .08
Online fieldwork: 26th March - 15th April 2015 Prepared by ComRes Ltd
Page 218
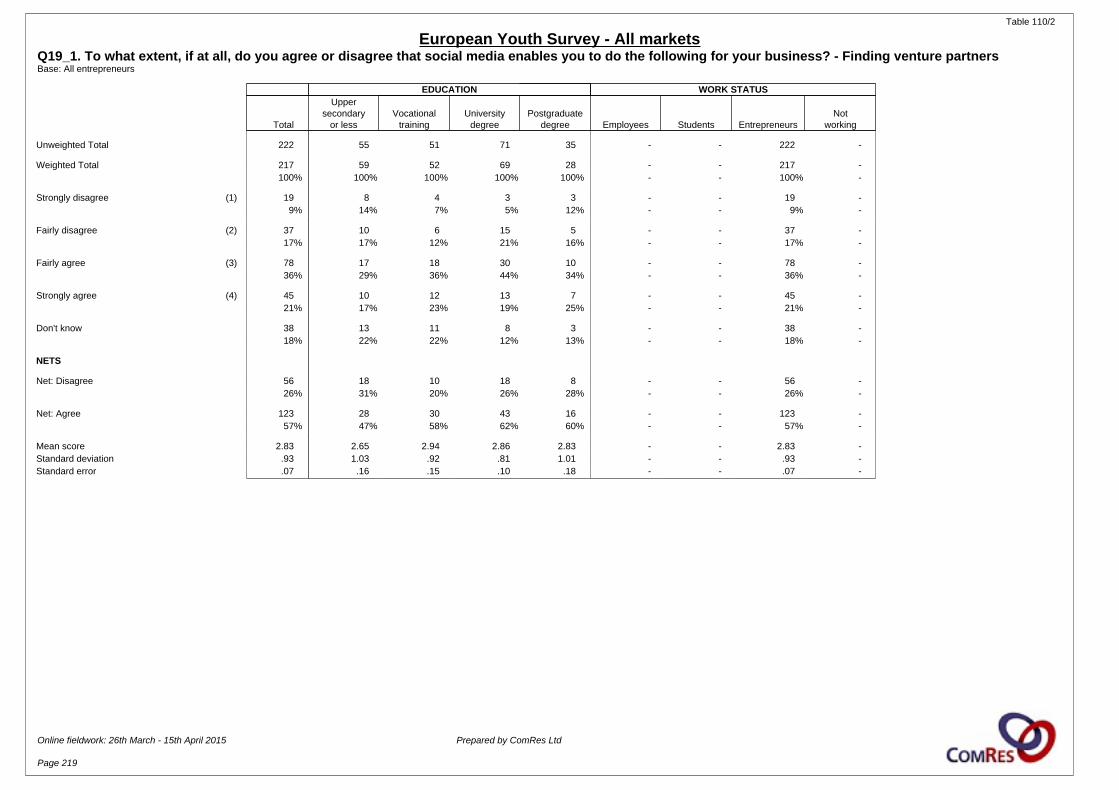
Table 110/2
European Youth Survey - All marketsQ19_1. To what extent, if at all, do you agree or disagree that social media enables you to do the following for your business? - Finding venture partnersBase: All entrepreneurs
EDUCATION WORK STATUS
Total
Uppersecondary
or lessVocational
trainingUniversity
degreePostgraduate
degree Employees Students EntrepreneursNot
working
Unweighted Total 222 55 51 71 35 - - 222 -
Weighted Total 217 59 52 69 28 - - 217 -100% 100% 100% 100% 100% - - 100% -
Strongly disagree (1) 19 8 4 3 3 - - 19 -9% 14% 7% 5% 12% - - 9% -
Fairly disagree (2) 37 10 6 15 5 - - 37 -17% 17% 12% 21% 16% - - 17% -
Fairly agree (3) 78 17 18 30 10 - - 78 -36% 29% 36% 44% 34% - - 36% -
Strongly agree (4) 45 10 12 13 7 - - 45 -21% 17% 23% 19% 25% - - 21% -
Don't know 38 13 11 8 3 - - 38 -18% 22% 22% 12% 13% - - 18% -
NETS
Net: Disagree 56 18 10 18 8 - - 56 -26% 31% 20% 26% 28% - - 26% -
Net: Agree 123 28 30 43 16 - - 123 -57% 47% 58% 62% 60% - - 57% -
Mean score 2.83 2.65 2.94 2.86 2.83 - - 2.83 -Standard deviation .93 1.03 .92 .81 1.01 - - .93 -Standard error .07 .16 .15 .10 .18 - - .07 -
Online fieldwork: 26th March - 15th April 2015 Prepared by ComRes Ltd
Page 219
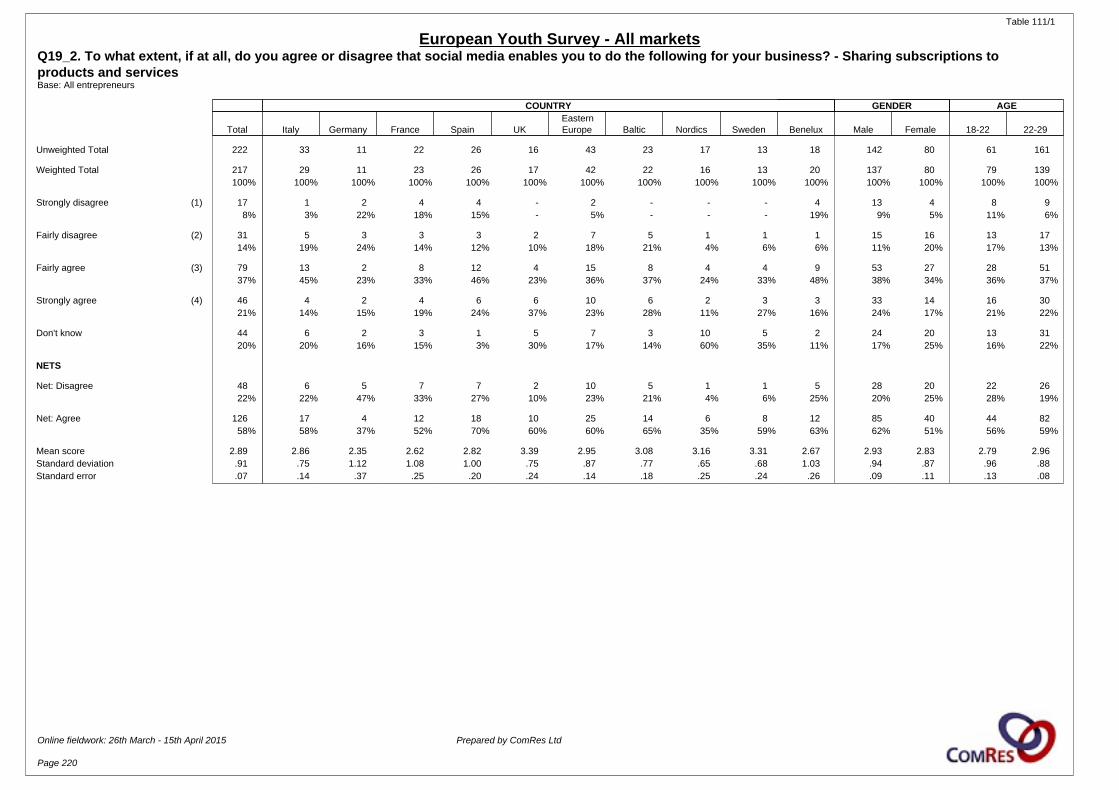
Table 111/1
European Youth Survey - All marketsQ19_2. To what extent, if at all, do you agree or disagree that social media enables you to do the following for your business? - Sharing subscriptions to products and servicesBase: All entrepreneurs
COUNTRY GENDER AGE
Total Italy Germany France Spain UKEasternEurope Baltic Nordics Sweden Benelux Male Female 18-22 22-29
Unweighted Total 222 33 11 22 26 16 43 23 17 13 18 142 80 61 161
Weighted Total 217 29 11 23 26 17 42 22 16 13 20 137 80 79 139100% 100% 100% 100% 100% 100% 100% 100% 100% 100% 100% 100% 100% 100% 100%
Strongly disagree (1) 17 1 2 4 4 - 2 - - - 4 13 4 8 98% 3% 22% 18% 15% - 5% - - - 19% 9% 5% 11% 6%
Fairly disagree (2) 31 5 3 3 3 2 7 5 1 1 1 15 16 13 1714% 19% 24% 14% 12% 10% 18% 21% 4% 6% 6% 11% 20% 17% 13%
Fairly agree (3) 79 13 2 8 12 4 15 8 4 4 9 53 27 28 5137% 45% 23% 33% 46% 23% 36% 37% 24% 33% 48% 38% 34% 36% 37%
Strongly agree (4) 46 4 2 4 6 6 10 6 2 3 3 33 14 16 3021% 14% 15% 19% 24% 37% 23% 28% 11% 27% 16% 24% 17% 21% 22%
Don't know 44 6 2 3 1 5 7 3 10 5 2 24 20 13 3120% 20% 16% 15% 3% 30% 17% 14% 60% 35% 11% 17% 25% 16% 22%
NETS
Net: Disagree 48 6 5 7 7 2 10 5 1 1 5 28 20 22 2622% 22% 47% 33% 27% 10% 23% 21% 4% 6% 25% 20% 25% 28% 19%
Net: Agree 126 17 4 12 18 10 25 14 6 8 12 85 40 44 8258% 58% 37% 52% 70% 60% 60% 65% 35% 59% 63% 62% 51% 56% 59%
Mean score 2.89 2.86 2.35 2.62 2.82 3.39 2.95 3.08 3.16 3.31 2.67 2.93 2.83 2.79 2.96Standard deviation .91 .75 1.12 1.08 1.00 .75 .87 .77 .65 .68 1.03 .94 .87 .96 .88Standard error .07 .14 .37 .25 .20 .24 .14 .18 .25 .24 .26 .09 .11 .13 .08
Online fieldwork: 26th March - 15th April 2015 Prepared by ComRes Ltd
Page 220
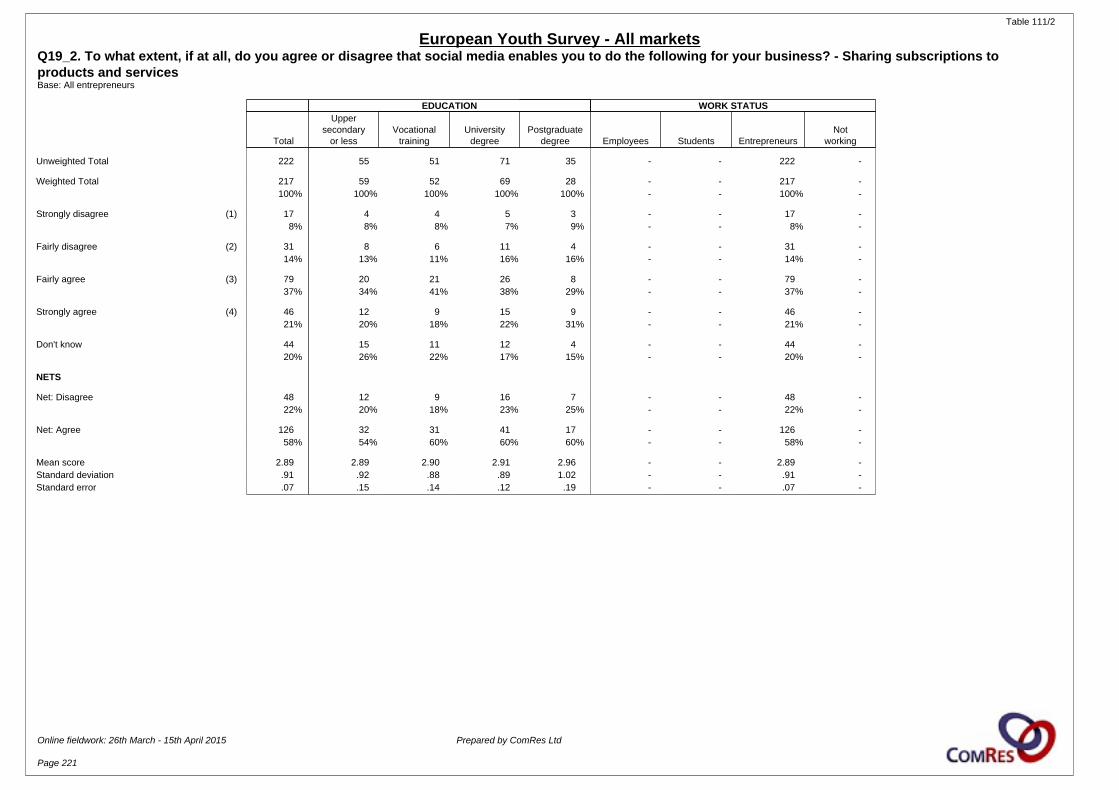
Table 111/2
European Youth Survey - All marketsQ19_2. To what extent, if at all, do you agree or disagree that social media enables you to do the following for your business? - Sharing subscriptions to products and servicesBase: All entrepreneurs
EDUCATION WORK STATUS
Total
Uppersecondary
or lessVocational
trainingUniversity
degreePostgraduate
degree Employees Students EntrepreneursNot
working
Unweighted Total 222 55 51 71 35 - - 222 -
Weighted Total 217 59 52 69 28 - - 217 -100% 100% 100% 100% 100% - - 100% -
Strongly disagree (1) 17 4 4 5 3 - - 17 -8% 8% 8% 7% 9% - - 8% -
Fairly disagree (2) 31 8 6 11 4 - - 31 -14% 13% 11% 16% 16% - - 14% -
Fairly agree (3) 79 20 21 26 8 - - 79 -37% 34% 41% 38% 29% - - 37% -
Strongly agree (4) 46 12 9 15 9 - - 46 -21% 20% 18% 22% 31% - - 21% -
Don't know 44 15 11 12 4 - - 44 -20% 26% 22% 17% 15% - - 20% -
NETS
Net: Disagree 48 12 9 16 7 - - 48 -22% 20% 18% 23% 25% - - 22% -
Net: Agree 126 32 31 41 17 - - 126 -58% 54% 60% 60% 60% - - 58% -
Mean score 2.89 2.89 2.90 2.91 2.96 - - 2.89 -Standard deviation .91 .92 .88 .89 1.02 - - .91 -Standard error .07 .15 .14 .12 .19 - - .07 -
Online fieldwork: 26th March - 15th April 2015 Prepared by ComRes Ltd
Page 221
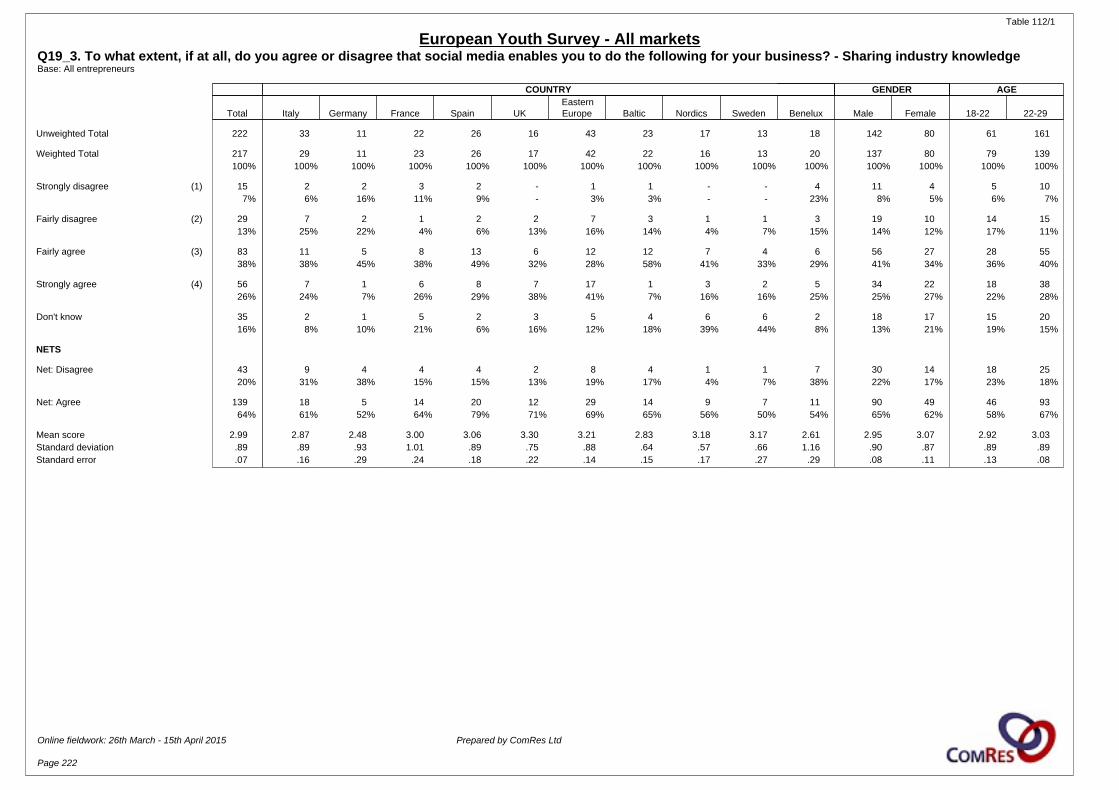
Table 112/1
European Youth Survey - All marketsQ19_3. To what extent, if at all, do you agree or disagree that social media enables you to do the following for your business? - Sharing industry knowledgeBase: All entrepreneurs
COUNTRY GENDER AGE
Total Italy Germany France Spain UKEasternEurope Baltic Nordics Sweden Benelux Male Female 18-22 22-29
Unweighted Total 222 33 11 22 26 16 43 23 17 13 18 142 80 61 161
Weighted Total 217 29 11 23 26 17 42 22 16 13 20 137 80 79 139100% 100% 100% 100% 100% 100% 100% 100% 100% 100% 100% 100% 100% 100% 100%
Strongly disagree (1) 15 2 2 3 2 - 1 1 - - 4 11 4 5 107% 6% 16% 11% 9% - 3% 3% - - 23% 8% 5% 6% 7%
Fairly disagree (2) 29 7 2 1 2 2 7 3 1 1 3 19 10 14 1513% 25% 22% 4% 6% 13% 16% 14% 4% 7% 15% 14% 12% 17% 11%
Fairly agree (3) 83 11 5 8 13 6 12 12 7 4 6 56 27 28 5538% 38% 45% 38% 49% 32% 28% 58% 41% 33% 29% 41% 34% 36% 40%
Strongly agree (4) 56 7 1 6 8 7 17 1 3 2 5 34 22 18 3826% 24% 7% 26% 29% 38% 41% 7% 16% 16% 25% 25% 27% 22% 28%
Don't know 35 2 1 5 2 3 5 4 6 6 2 18 17 15 2016% 8% 10% 21% 6% 16% 12% 18% 39% 44% 8% 13% 21% 19% 15%
NETS
Net: Disagree 43 9 4 4 4 2 8 4 1 1 7 30 14 18 2520% 31% 38% 15% 15% 13% 19% 17% 4% 7% 38% 22% 17% 23% 18%
Net: Agree 139 18 5 14 20 12 29 14 9 7 11 90 49 46 9364% 61% 52% 64% 79% 71% 69% 65% 56% 50% 54% 65% 62% 58% 67%
Mean score 2.99 2.87 2.48 3.00 3.06 3.30 3.21 2.83 3.18 3.17 2.61 2.95 3.07 2.92 3.03Standard deviation .89 .89 .93 1.01 .89 .75 .88 .64 .57 .66 1.16 .90 .87 .89 .89Standard error .07 .16 .29 .24 .18 .22 .14 .15 .17 .27 .29 .08 .11 .13 .08
Online fieldwork: 26th March - 15th April 2015 Prepared by ComRes Ltd
Page 222
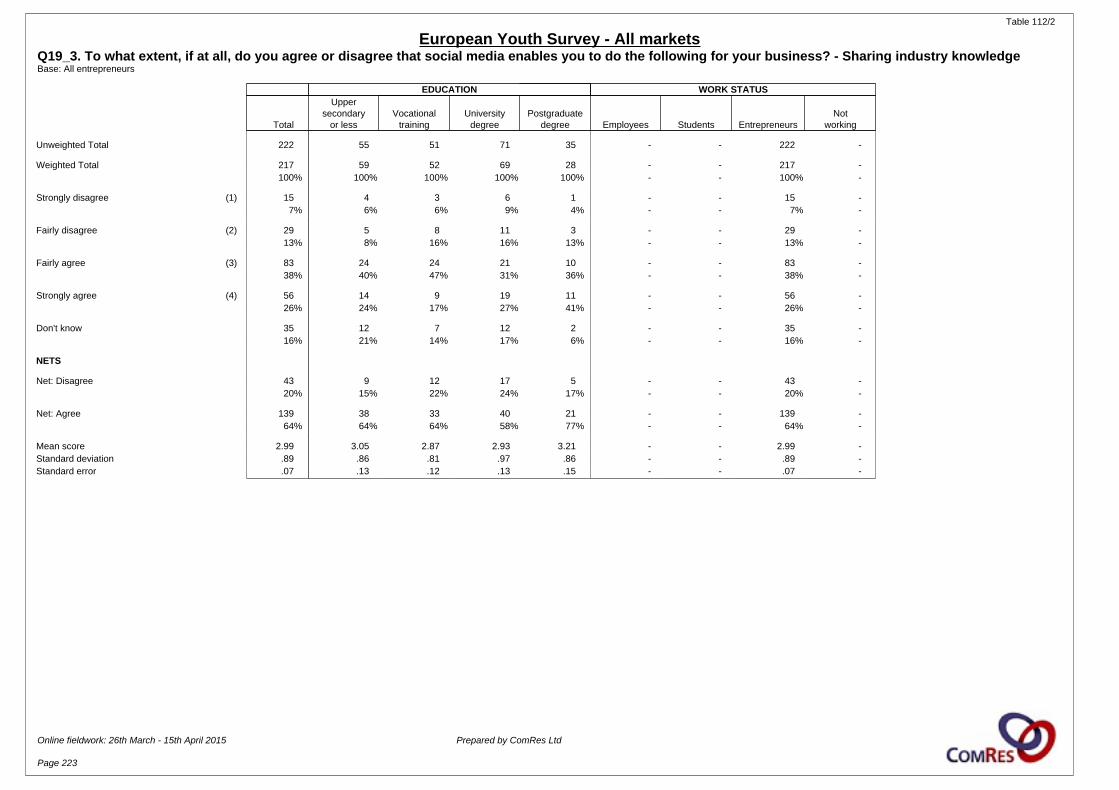
Table 112/2
European Youth Survey - All marketsQ19_3. To what extent, if at all, do you agree or disagree that social media enables you to do the following for your business? - Sharing industry knowledgeBase: All entrepreneurs
EDUCATION WORK STATUS
Total
Uppersecondary
or lessVocational
trainingUniversity
degreePostgraduate
degree Employees Students EntrepreneursNot
working
Unweighted Total 222 55 51 71 35 - - 222 -
Weighted Total 217 59 52 69 28 - - 217 -100% 100% 100% 100% 100% - - 100% -
Strongly disagree (1) 15 4 3 6 1 - - 15 -7% 6% 6% 9% 4% - - 7% -
Fairly disagree (2) 29 5 8 11 3 - - 29 -13% 8% 16% 16% 13% - - 13% -
Fairly agree (3) 83 24 24 21 10 - - 83 -38% 40% 47% 31% 36% - - 38% -
Strongly agree (4) 56 14 9 19 11 - - 56 -26% 24% 17% 27% 41% - - 26% -
Don't know 35 12 7 12 2 - - 35 -16% 21% 14% 17% 6% - - 16% -
NETS
Net: Disagree 43 9 12 17 5 - - 43 -20% 15% 22% 24% 17% - - 20% -
Net: Agree 139 38 33 40 21 - - 139 -64% 64% 64% 58% 77% - - 64% -
Mean score 2.99 3.05 2.87 2.93 3.21 - - 2.99 -Standard deviation .89 .86 .81 .97 .86 - - .89 -Standard error .07 .13 .12 .13 .15 - - .07 -
Online fieldwork: 26th March - 15th April 2015 Prepared by ComRes Ltd
Page 223
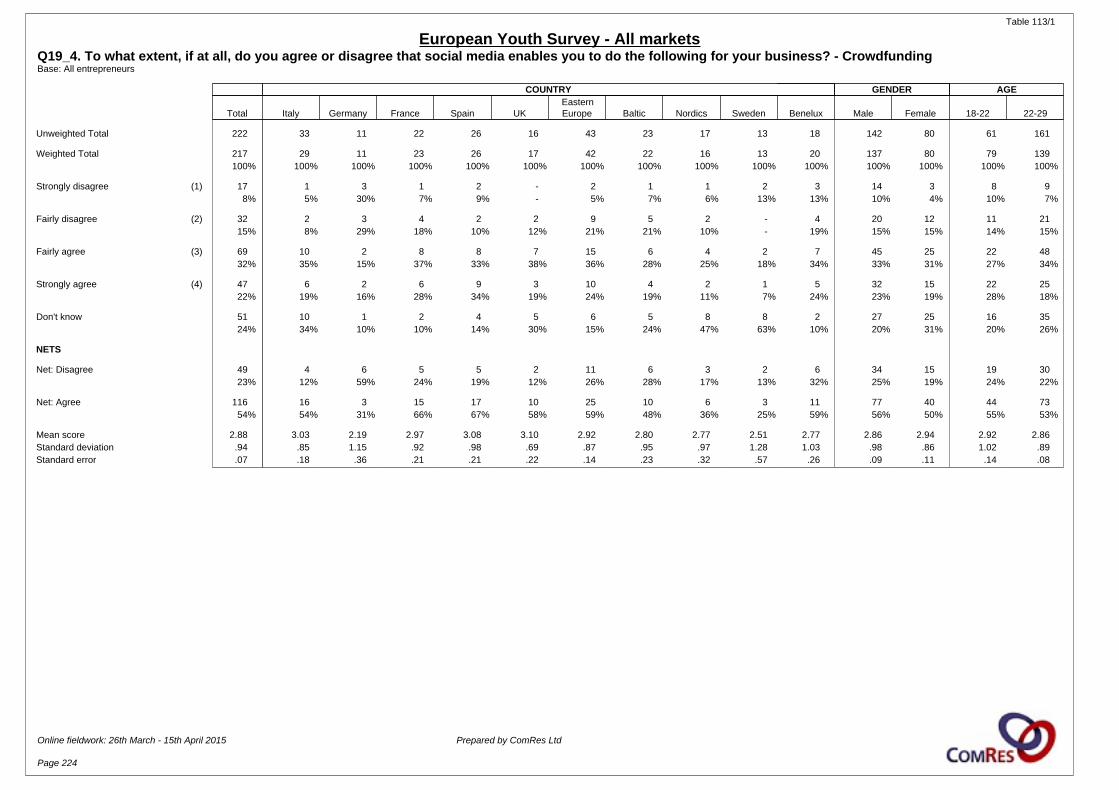
Table 113/1
European Youth Survey - All marketsQ19_4. To what extent, if at all, do you agree or disagree that social media enables you to do the following for your business? - CrowdfundingBase: All entrepreneurs
COUNTRY GENDER AGE
Total Italy Germany France Spain UKEasternEurope Baltic Nordics Sweden Benelux Male Female 18-22 22-29
Unweighted Total 222 33 11 22 26 16 43 23 17 13 18 142 80 61 161
Weighted Total 217 29 11 23 26 17 42 22 16 13 20 137 80 79 139100% 100% 100% 100% 100% 100% 100% 100% 100% 100% 100% 100% 100% 100% 100%
Strongly disagree (1) 17 1 3 1 2 - 2 1 1 2 3 14 3 8 98% 5% 30% 7% 9% - 5% 7% 6% 13% 13% 10% 4% 10% 7%
Fairly disagree (2) 32 2 3 4 2 2 9 5 2 - 4 20 12 11 2115% 8% 29% 18% 10% 12% 21% 21% 10% - 19% 15% 15% 14% 15%
Fairly agree (3) 69 10 2 8 8 7 15 6 4 2 7 45 25 22 4832% 35% 15% 37% 33% 38% 36% 28% 25% 18% 34% 33% 31% 27% 34%
Strongly agree (4) 47 6 2 6 9 3 10 4 2 1 5 32 15 22 2522% 19% 16% 28% 34% 19% 24% 19% 11% 7% 24% 23% 19% 28% 18%
Don't know 51 10 1 2 4 5 6 5 8 8 2 27 25 16 3524% 34% 10% 10% 14% 30% 15% 24% 47% 63% 10% 20% 31% 20% 26%
NETS
Net: Disagree 49 4 6 5 5 2 11 6 3 2 6 34 15 19 3023% 12% 59% 24% 19% 12% 26% 28% 17% 13% 32% 25% 19% 24% 22%
Net: Agree 116 16 3 15 17 10 25 10 6 3 11 77 40 44 7354% 54% 31% 66% 67% 58% 59% 48% 36% 25% 59% 56% 50% 55% 53%
Mean score 2.88 3.03 2.19 2.97 3.08 3.10 2.92 2.80 2.77 2.51 2.77 2.86 2.94 2.92 2.86Standard deviation .94 .85 1.15 .92 .98 .69 .87 .95 .97 1.28 1.03 .98 .86 1.02 .89Standard error .07 .18 .36 .21 .21 .22 .14 .23 .32 .57 .26 .09 .11 .14 .08
Online fieldwork: 26th March - 15th April 2015 Prepared by ComRes Ltd
Page 224
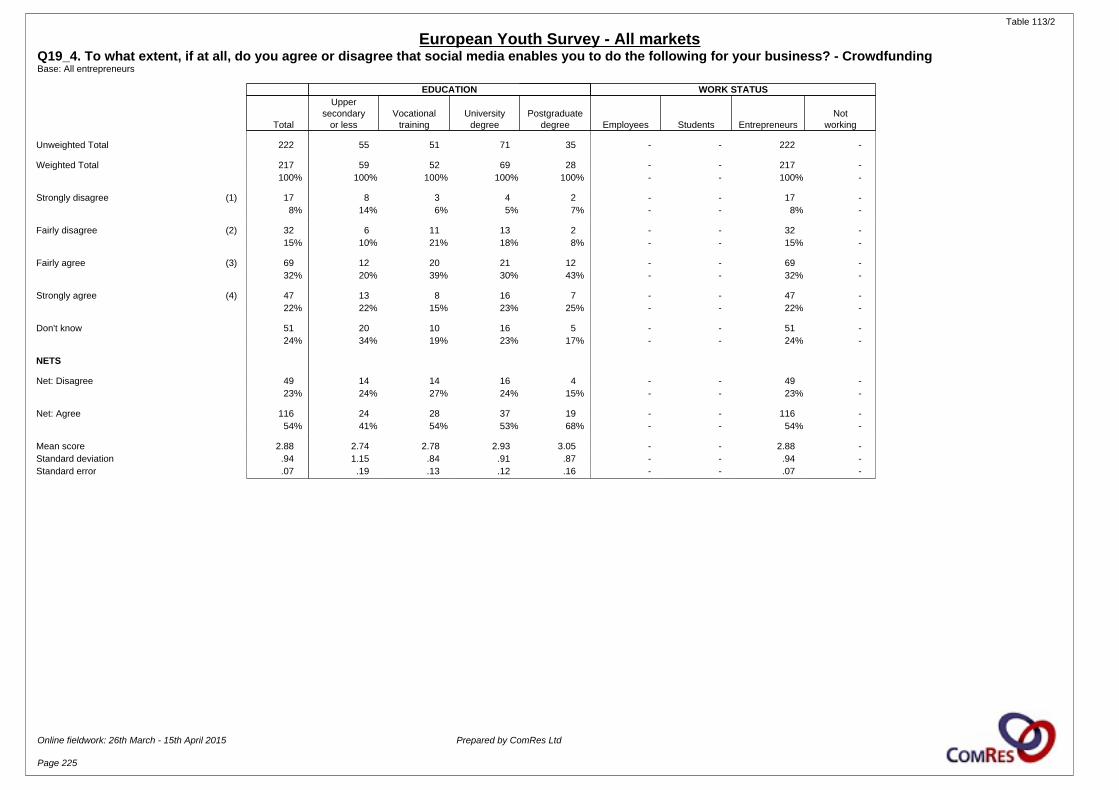
Table 113/2
European Youth Survey - All marketsQ19_4. To what extent, if at all, do you agree or disagree that social media enables you to do the following for your business? - CrowdfundingBase: All entrepreneurs
EDUCATION WORK STATUS
Total
Uppersecondary
or lessVocational
trainingUniversity
degreePostgraduate
degree Employees Students EntrepreneursNot
working
Unweighted Total 222 55 51 71 35 - - 222 -
Weighted Total 217 59 52 69 28 - - 217 -100% 100% 100% 100% 100% - - 100% -
Strongly disagree (1) 17 8 3 4 2 - - 17 -8% 14% 6% 5% 7% - - 8% -
Fairly disagree (2) 32 6 11 13 2 - - 32 -15% 10% 21% 18% 8% - - 15% -
Fairly agree (3) 69 12 20 21 12 - - 69 -32% 20% 39% 30% 43% - - 32% -
Strongly agree (4) 47 13 8 16 7 - - 47 -22% 22% 15% 23% 25% - - 22% -
Don't know 51 20 10 16 5 - - 51 -24% 34% 19% 23% 17% - - 24% -
NETS
Net: Disagree 49 14 14 16 4 - - 49 -23% 24% 27% 24% 15% - - 23% -
Net: Agree 116 24 28 37 19 - - 116 -54% 41% 54% 53% 68% - - 54% -
Mean score 2.88 2.74 2.78 2.93 3.05 - - 2.88 -Standard deviation .94 1.15 .84 .91 .87 - - .94 -Standard error .07 .19 .13 .12 .16 - - .07 -
Online fieldwork: 26th March - 15th April 2015 Prepared by ComRes Ltd
Page 225
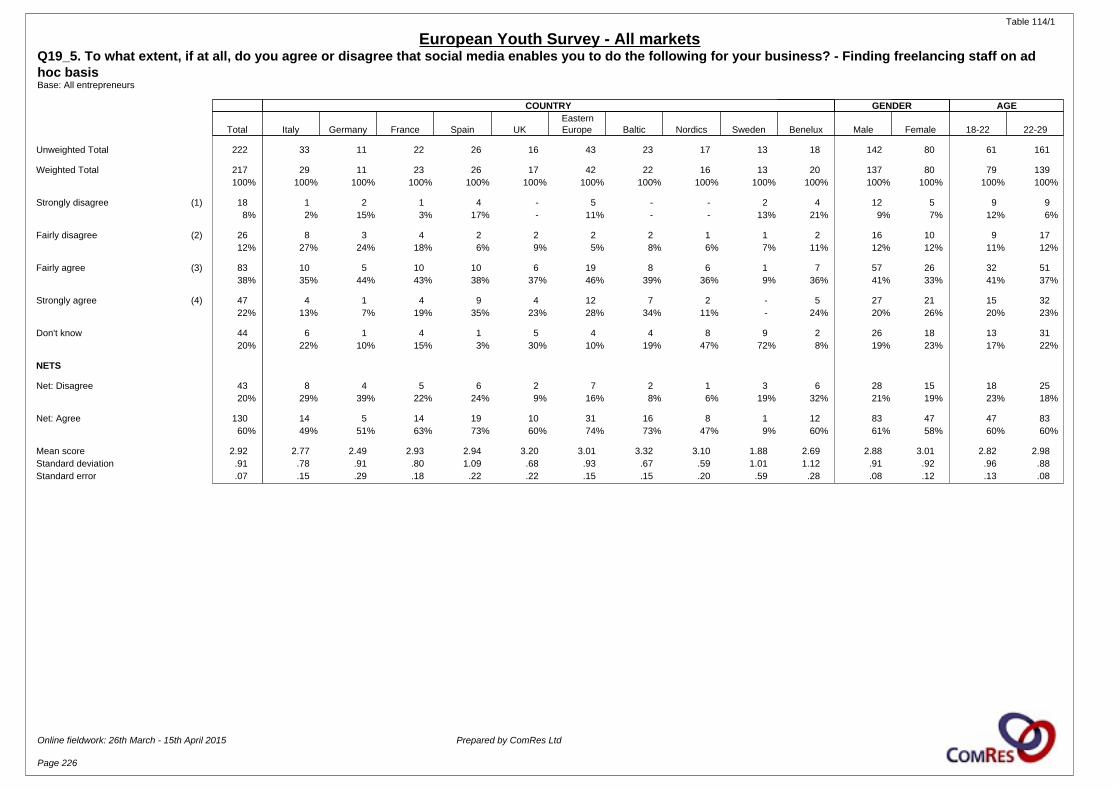
Table 114/1
European Youth Survey - All marketsQ19_5. To what extent, if at all, do you agree or disagree that social media enables you to do the following for your business? - Finding freelancing staff on ad hoc basisBase: All entrepreneurs
COUNTRY GENDER AGE
Total Italy Germany France Spain UKEasternEurope Baltic Nordics Sweden Benelux Male Female 18-22 22-29
Unweighted Total 222 33 11 22 26 16 43 23 17 13 18 142 80 61 161
Weighted Total 217 29 11 23 26 17 42 22 16 13 20 137 80 79 139100% 100% 100% 100% 100% 100% 100% 100% 100% 100% 100% 100% 100% 100% 100%
Strongly disagree (1) 18 1 2 1 4 - 5 - - 2 4 12 5 9 98% 2% 15% 3% 17% - 11% - - 13% 21% 9% 7% 12% 6%
Fairly disagree (2) 26 8 3 4 2 2 2 2 1 1 2 16 10 9 1712% 27% 24% 18% 6% 9% 5% 8% 6% 7% 11% 12% 12% 11% 12%
Fairly agree (3) 83 10 5 10 10 6 19 8 6 1 7 57 26 32 5138% 35% 44% 43% 38% 37% 46% 39% 36% 9% 36% 41% 33% 41% 37%
Strongly agree (4) 47 4 1 4 9 4 12 7 2 - 5 27 21 15 3222% 13% 7% 19% 35% 23% 28% 34% 11% - 24% 20% 26% 20% 23%
Don't know 44 6 1 4 1 5 4 4 8 9 2 26 18 13 3120% 22% 10% 15% 3% 30% 10% 19% 47% 72% 8% 19% 23% 17% 22%
NETS
Net: Disagree 43 8 4 5 6 2 7 2 1 3 6 28 15 18 2520% 29% 39% 22% 24% 9% 16% 8% 6% 19% 32% 21% 19% 23% 18%
Net: Agree 130 14 5 14 19 10 31 16 8 1 12 83 47 47 8360% 49% 51% 63% 73% 60% 74% 73% 47% 9% 60% 61% 58% 60% 60%
Mean score 2.92 2.77 2.49 2.93 2.94 3.20 3.01 3.32 3.10 1.88 2.69 2.88 3.01 2.82 2.98Standard deviation .91 .78 .91 .80 1.09 .68 .93 .67 .59 1.01 1.12 .91 .92 .96 .88Standard error .07 .15 .29 .18 .22 .22 .15 .15 .20 .59 .28 .08 .12 .13 .08
Online fieldwork: 26th March - 15th April 2015 Prepared by ComRes Ltd
Page 226
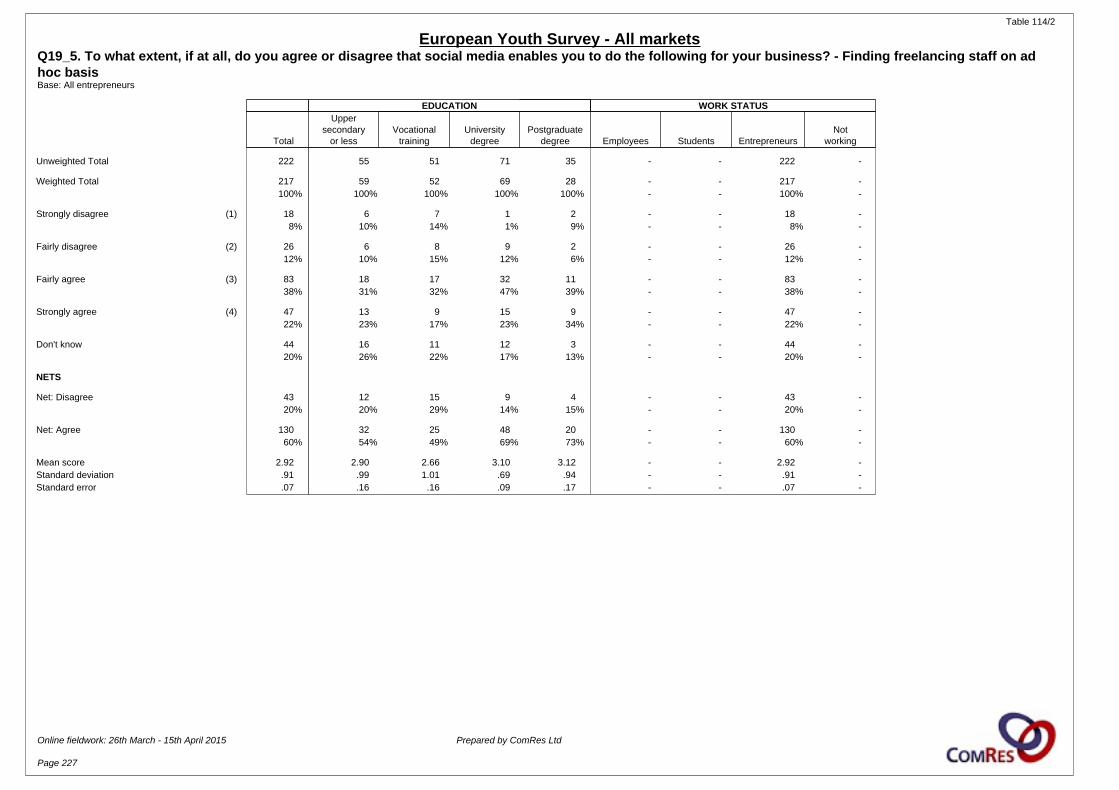
Table 114/2
European Youth Survey - All marketsQ19_5. To what extent, if at all, do you agree or disagree that social media enables you to do the following for your business? - Finding freelancing staff on ad hoc basisBase: All entrepreneurs
EDUCATION WORK STATUS
Total
Uppersecondary
or lessVocational
trainingUniversity
degreePostgraduate
degree Employees Students EntrepreneursNot
working
Unweighted Total 222 55 51 71 35 - - 222 -
Weighted Total 217 59 52 69 28 - - 217 -100% 100% 100% 100% 100% - - 100% -
Strongly disagree (1) 18 6 7 1 2 - - 18 -8% 10% 14% 1% 9% - - 8% -
Fairly disagree (2) 26 6 8 9 2 - - 26 -12% 10% 15% 12% 6% - - 12% -
Fairly agree (3) 83 18 17 32 11 - - 83 -38% 31% 32% 47% 39% - - 38% -
Strongly agree (4) 47 13 9 15 9 - - 47 -22% 23% 17% 23% 34% - - 22% -
Don't know 44 16 11 12 3 - - 44 -20% 26% 22% 17% 13% - - 20% -
NETS
Net: Disagree 43 12 15 9 4 - - 43 -20% 20% 29% 14% 15% - - 20% -
Net: Agree 130 32 25 48 20 - - 130 -60% 54% 49% 69% 73% - - 60% -
Mean score 2.92 2.90 2.66 3.10 3.12 - - 2.92 -Standard deviation .91 .99 1.01 .69 .94 - - .91 -Standard error .07 .16 .16 .09 .17 - - .07 -
Online fieldwork: 26th March - 15th April 2015 Prepared by ComRes Ltd
Page 227
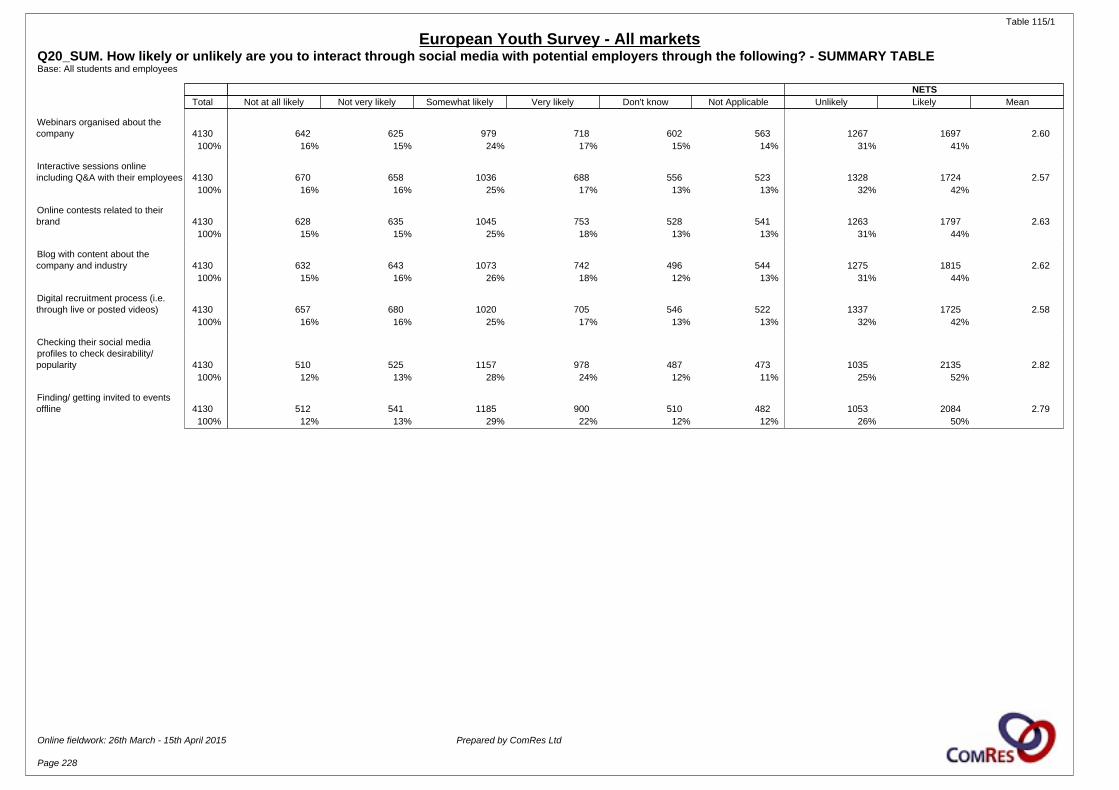
Table 115/1
European Youth Survey - All marketsQ20_SUM. How likely or unlikely are you to interact through social media with potential employers through the following? - SUMMARY TABLEBase: All students and employees
NETS Total Not at all likely Not very likely Somewhat likely Very likely Don't know Not Applicable Unlikely Likely Mean
Webinars organised about thecompany 4130 642 625 979 718 602 563 1267 1697 2.60
100% 16% 15% 24% 17% 15% 14% 31% 41%
Interactive sessions onlineincluding Q&A with their employees 4130 670 658 1036 688 556 523 1328 1724 2.57
100% 16% 16% 25% 17% 13% 13% 32% 42%
Online contests related to theirbrand 4130 628 635 1045 753 528 541 1263 1797 2.63
100% 15% 15% 25% 18% 13% 13% 31% 44%
Blog with content about thecompany and industry 4130 632 643 1073 742 496 544 1275 1815 2.62
100% 15% 16% 26% 18% 12% 13% 31% 44%
Digital recruitment process (i.e.through live or posted videos) 4130 657 680 1020 705 546 522 1337 1725 2.58
100% 16% 16% 25% 17% 13% 13% 32% 42%
Checking their social mediaprofiles to check desirability/popularity 4130 510 525 1157 978 487 473 1035 2135 2.82
100% 12% 13% 28% 24% 12% 11% 25% 52%
Finding/ getting invited to eventsoffline 4130 512 541 1185 900 510 482 1053 2084 2.79
100% 12% 13% 29% 22% 12% 12% 26% 50%
Online fieldwork: 26th March - 15th April 2015 Prepared by ComRes Ltd
Page 228
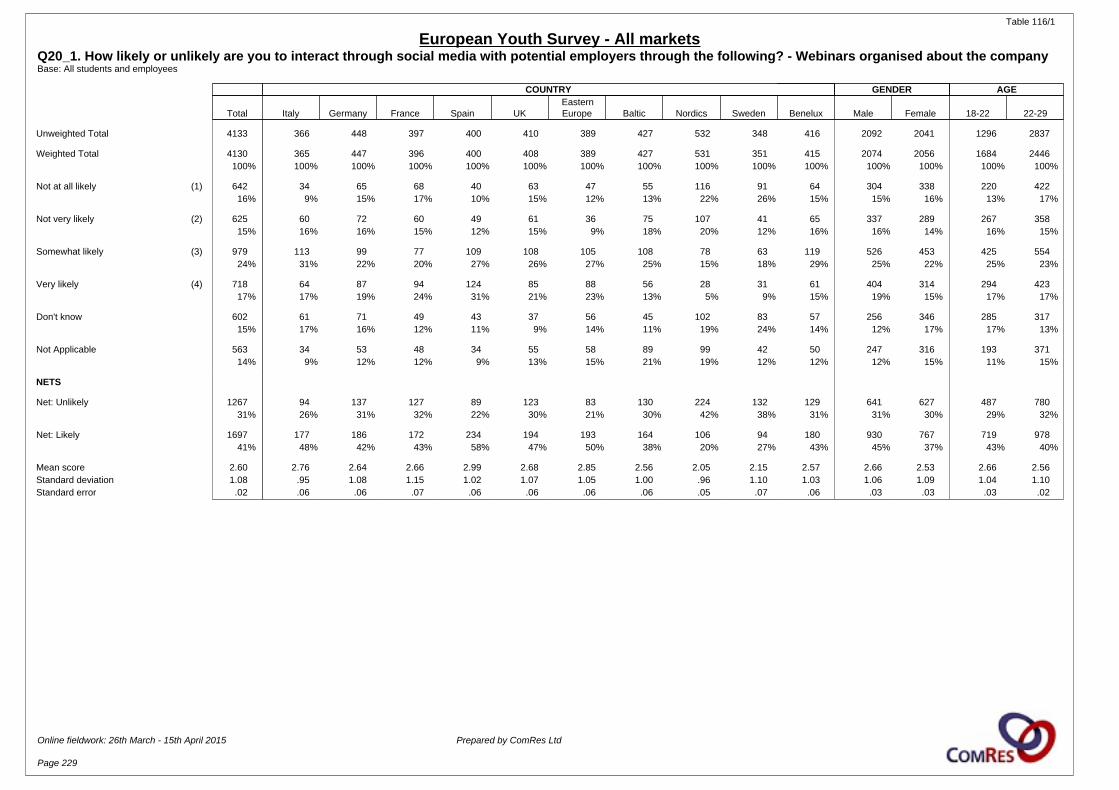
Table 116/1
European Youth Survey - All marketsQ20_1. How likely or unlikely are you to interact through social media with potential employers through the following? - Webinars organised about the companyBase: All students and employees
COUNTRY GENDER AGE
Total Italy Germany France Spain UKEasternEurope Baltic Nordics Sweden Benelux Male Female 18-22 22-29
Unweighted Total 4133 366 448 397 400 410 389 427 532 348 416 2092 2041 1296 2837
Weighted Total 4130 365 447 396 400 408 389 427 531 351 415 2074 2056 1684 2446100% 100% 100% 100% 100% 100% 100% 100% 100% 100% 100% 100% 100% 100% 100%
Not at all likely (1) 642 34 65 68 40 63 47 55 116 91 64 304 338 220 42216% 9% 15% 17% 10% 15% 12% 13% 22% 26% 15% 15% 16% 13% 17%
Not very likely (2) 625 60 72 60 49 61 36 75 107 41 65 337 289 267 35815% 16% 16% 15% 12% 15% 9% 18% 20% 12% 16% 16% 14% 16% 15%
Somewhat likely (3) 979 113 99 77 109 108 105 108 78 63 119 526 453 425 55424% 31% 22% 20% 27% 26% 27% 25% 15% 18% 29% 25% 22% 25% 23%
Very likely (4) 718 64 87 94 124 85 88 56 28 31 61 404 314 294 42317% 17% 19% 24% 31% 21% 23% 13% 5% 9% 15% 19% 15% 17% 17%
Don't know 602 61 71 49 43 37 56 45 102 83 57 256 346 285 31715% 17% 16% 12% 11% 9% 14% 11% 19% 24% 14% 12% 17% 17% 13%
Not Applicable 563 34 53 48 34 55 58 89 99 42 50 247 316 193 37114% 9% 12% 12% 9% 13% 15% 21% 19% 12% 12% 12% 15% 11% 15%
NETS
Net: Unlikely 1267 94 137 127 89 123 83 130 224 132 129 641 627 487 78031% 26% 31% 32% 22% 30% 21% 30% 42% 38% 31% 31% 30% 29% 32%
Net: Likely 1697 177 186 172 234 194 193 164 106 94 180 930 767 719 97841% 48% 42% 43% 58% 47% 50% 38% 20% 27% 43% 45% 37% 43% 40%
Mean score 2.60 2.76 2.64 2.66 2.99 2.68 2.85 2.56 2.05 2.15 2.57 2.66 2.53 2.66 2.56Standard deviation 1.08 .95 1.08 1.15 1.02 1.07 1.05 1.00 .96 1.10 1.03 1.06 1.09 1.04 1.10Standard error .02 .06 .06 .07 .06 .06 .06 .06 .05 .07 .06 .03 .03 .03 .02
Online fieldwork: 26th March - 15th April 2015 Prepared by ComRes Ltd
Page 229
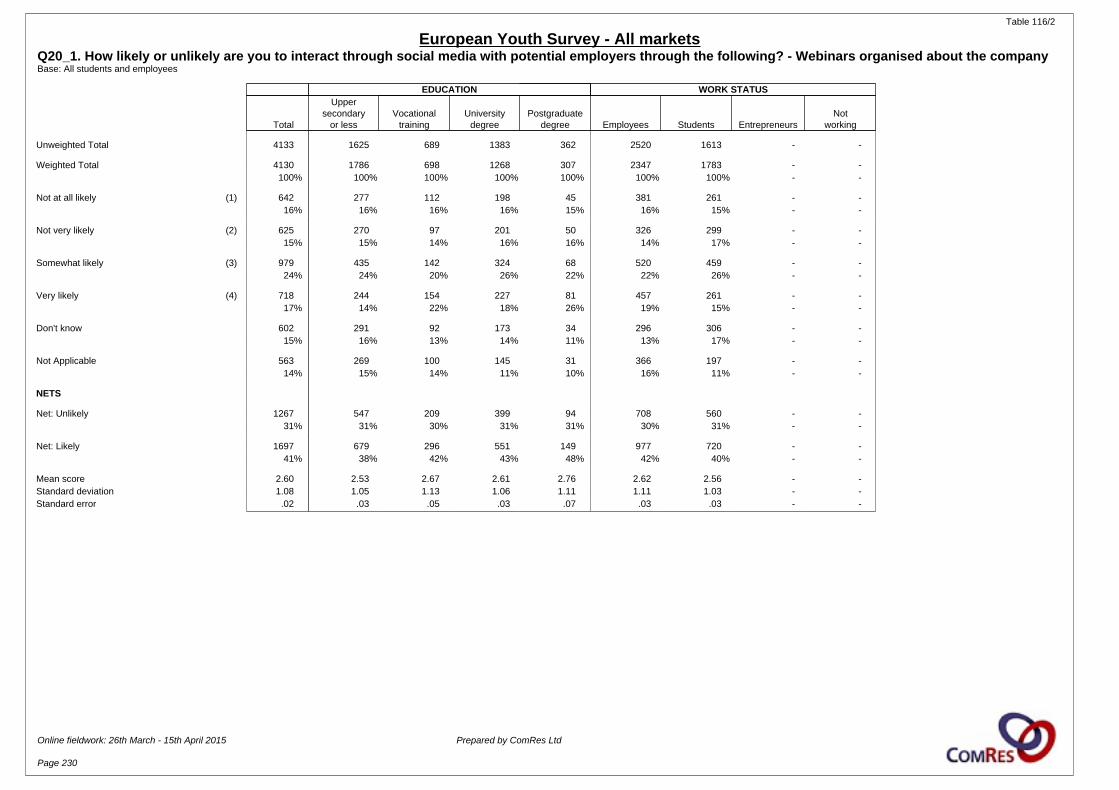
Table 116/2
European Youth Survey - All marketsQ20_1. How likely or unlikely are you to interact through social media with potential employers through the following? - Webinars organised about the companyBase: All students and employees
EDUCATION WORK STATUS
Total
Uppersecondary
or lessVocational
trainingUniversity
degreePostgraduate
degree Employees Students EntrepreneursNot
working
Unweighted Total 4133 1625 689 1383 362 2520 1613 - -
Weighted Total 4130 1786 698 1268 307 2347 1783 - -100% 100% 100% 100% 100% 100% 100% - -
Not at all likely (1) 642 277 112 198 45 381 261 - -16% 16% 16% 16% 15% 16% 15% - -
Not very likely (2) 625 270 97 201 50 326 299 - -15% 15% 14% 16% 16% 14% 17% - -
Somewhat likely (3) 979 435 142 324 68 520 459 - -24% 24% 20% 26% 22% 22% 26% - -
Very likely (4) 718 244 154 227 81 457 261 - -17% 14% 22% 18% 26% 19% 15% - -
Don't know 602 291 92 173 34 296 306 - -15% 16% 13% 14% 11% 13% 17% - -
Not Applicable 563 269 100 145 31 366 197 - -14% 15% 14% 11% 10% 16% 11% - -
NETS
Net: Unlikely 1267 547 209 399 94 708 560 - -31% 31% 30% 31% 31% 30% 31% - -
Net: Likely 1697 679 296 551 149 977 720 - -41% 38% 42% 43% 48% 42% 40% - -
Mean score 2.60 2.53 2.67 2.61 2.76 2.62 2.56 - -Standard deviation 1.08 1.05 1.13 1.06 1.11 1.11 1.03 - -Standard error .02 .03 .05 .03 .07 .03 .03 - -
Online fieldwork: 26th March - 15th April 2015 Prepared by ComRes Ltd
Page 230
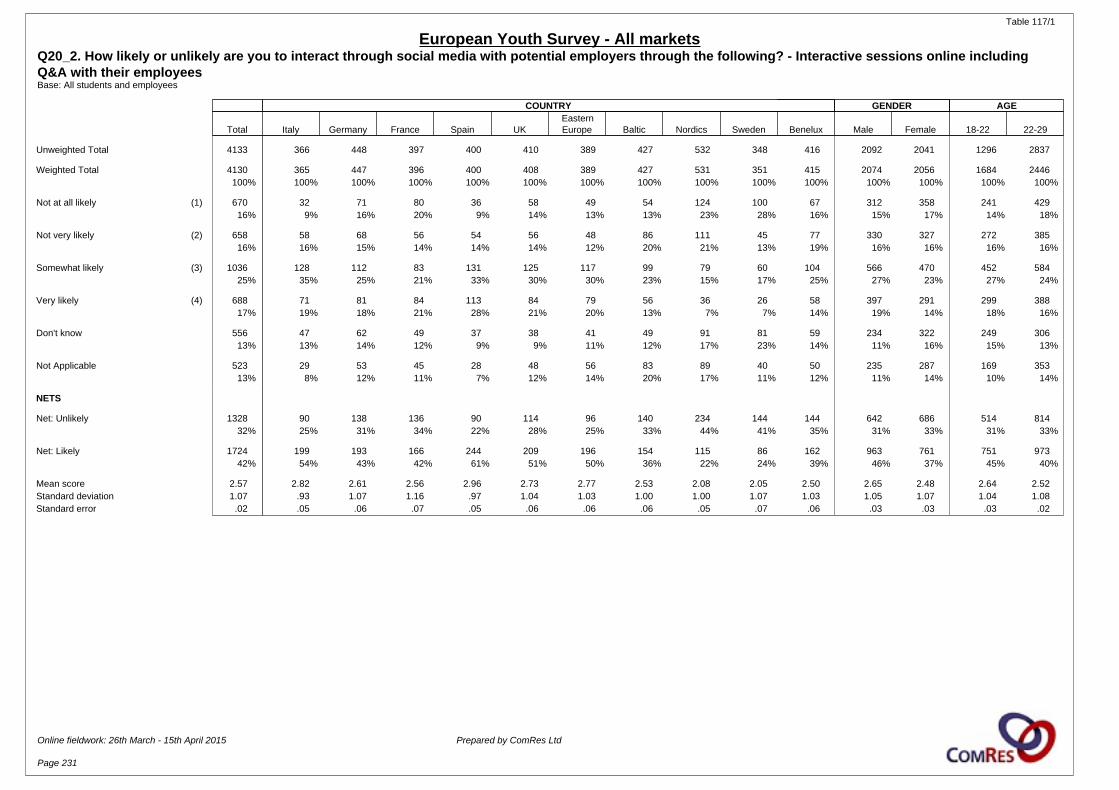
Table 117/1
European Youth Survey - All marketsQ20_2. How likely or unlikely are you to interact through social media with potential employers through the following? - Interactive sessions online including Q&A with their employeesBase: All students and employees
COUNTRY GENDER AGE
Total Italy Germany France Spain UKEasternEurope Baltic Nordics Sweden Benelux Male Female 18-22 22-29
Unweighted Total 4133 366 448 397 400 410 389 427 532 348 416 2092 2041 1296 2837
Weighted Total 4130 365 447 396 400 408 389 427 531 351 415 2074 2056 1684 2446100% 100% 100% 100% 100% 100% 100% 100% 100% 100% 100% 100% 100% 100% 100%
Not at all likely (1) 670 32 71 80 36 58 49 54 124 100 67 312 358 241 42916% 9% 16% 20% 9% 14% 13% 13% 23% 28% 16% 15% 17% 14% 18%
Not very likely (2) 658 58 68 56 54 56 48 86 111 45 77 330 327 272 38516% 16% 15% 14% 14% 14% 12% 20% 21% 13% 19% 16% 16% 16% 16%
Somewhat likely (3) 1036 128 112 83 131 125 117 99 79 60 104 566 470 452 58425% 35% 25% 21% 33% 30% 30% 23% 15% 17% 25% 27% 23% 27% 24%
Very likely (4) 688 71 81 84 113 84 79 56 36 26 58 397 291 299 38817% 19% 18% 21% 28% 21% 20% 13% 7% 7% 14% 19% 14% 18% 16%
Don't know 556 47 62 49 37 38 41 49 91 81 59 234 322 249 30613% 13% 14% 12% 9% 9% 11% 12% 17% 23% 14% 11% 16% 15% 13%
Not Applicable 523 29 53 45 28 48 56 83 89 40 50 235 287 169 35313% 8% 12% 11% 7% 12% 14% 20% 17% 11% 12% 11% 14% 10% 14%
NETS
Net: Unlikely 1328 90 138 136 90 114 96 140 234 144 144 642 686 514 81432% 25% 31% 34% 22% 28% 25% 33% 44% 41% 35% 31% 33% 31% 33%
Net: Likely 1724 199 193 166 244 209 196 154 115 86 162 963 761 751 97342% 54% 43% 42% 61% 51% 50% 36% 22% 24% 39% 46% 37% 45% 40%
Mean score 2.57 2.82 2.61 2.56 2.96 2.73 2.77 2.53 2.08 2.05 2.50 2.65 2.48 2.64 2.52Standard deviation 1.07 .93 1.07 1.16 .97 1.04 1.03 1.00 1.00 1.07 1.03 1.05 1.07 1.04 1.08Standard error .02 .05 .06 .07 .05 .06 .06 .06 .05 .07 .06 .03 .03 .03 .02
Online fieldwork: 26th March - 15th April 2015 Prepared by ComRes Ltd
Page 231
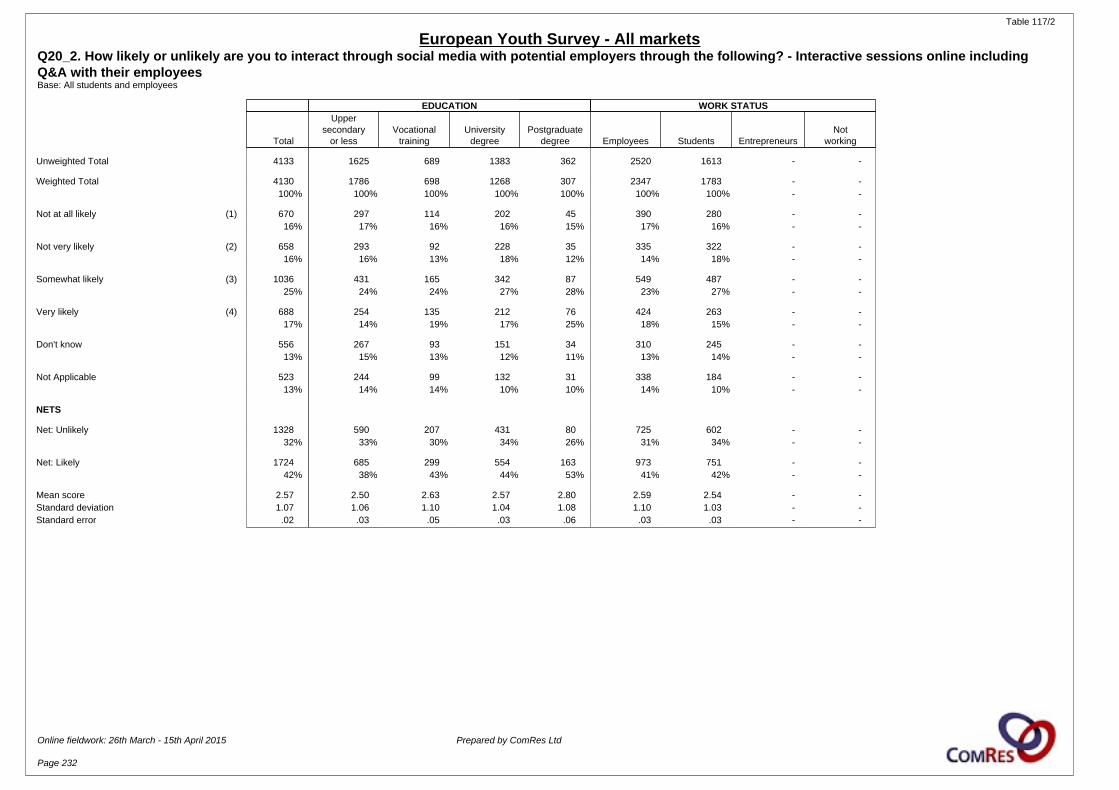
Table 117/2
European Youth Survey - All marketsQ20_2. How likely or unlikely are you to interact through social media with potential employers through the following? - Interactive sessions online including Q&A with their employeesBase: All students and employees
EDUCATION WORK STATUS
Total
Uppersecondary
or lessVocational
trainingUniversity
degreePostgraduate
degree Employees Students EntrepreneursNot
working
Unweighted Total 4133 1625 689 1383 362 2520 1613 - -
Weighted Total 4130 1786 698 1268 307 2347 1783 - -100% 100% 100% 100% 100% 100% 100% - -
Not at all likely (1) 670 297 114 202 45 390 280 - -16% 17% 16% 16% 15% 17% 16% - -
Not very likely (2) 658 293 92 228 35 335 322 - -16% 16% 13% 18% 12% 14% 18% - -
Somewhat likely (3) 1036 431 165 342 87 549 487 - -25% 24% 24% 27% 28% 23% 27% - -
Very likely (4) 688 254 135 212 76 424 263 - -17% 14% 19% 17% 25% 18% 15% - -
Don't know 556 267 93 151 34 310 245 - -13% 15% 13% 12% 11% 13% 14% - -
Not Applicable 523 244 99 132 31 338 184 - -13% 14% 14% 10% 10% 14% 10% - -
NETS
Net: Unlikely 1328 590 207 431 80 725 602 - -32% 33% 30% 34% 26% 31% 34% - -
Net: Likely 1724 685 299 554 163 973 751 - -42% 38% 43% 44% 53% 41% 42% - -
Mean score 2.57 2.50 2.63 2.57 2.80 2.59 2.54 - -Standard deviation 1.07 1.06 1.10 1.04 1.08 1.10 1.03 - -Standard error .02 .03 .05 .03 .06 .03 .03 - -
Online fieldwork: 26th March - 15th April 2015 Prepared by ComRes Ltd
Page 232

Table 118/1
European Youth Survey - All marketsQ20_3. How likely or unlikely are you to interact through social media with potential employers through the following? - Online contests related to their brandBase: All students and employees
COUNTRY GENDER AGE
Total Italy Germany France Spain UKEasternEurope Baltic Nordics Sweden Benelux Male Female 18-22 22-29
Unweighted Total 4133 366 448 397 400 410 389 427 532 348 416 2092 2041 1296 2837
Weighted Total 4130 365 447 396 400 408 389 427 531 351 415 2074 2056 1684 2446100% 100% 100% 100% 100% 100% 100% 100% 100% 100% 100% 100% 100% 100% 100%
Not at all likely (1) 628 30 83 71 33 46 40 46 117 94 67 290 338 211 41715% 8% 19% 18% 8% 11% 10% 11% 22% 27% 16% 14% 16% 13% 17%
Not very likely (2) 635 56 76 61 48 63 35 69 110 43 74 316 319 280 35515% 15% 17% 16% 12% 16% 9% 16% 21% 12% 18% 15% 16% 17% 15%
Somewhat likely (3) 1045 105 93 93 125 113 130 107 90 81 107 561 483 438 60625% 29% 21% 24% 31% 28% 33% 25% 17% 23% 26% 27% 23% 26% 25%
Very likely (4) 753 82 66 71 122 101 99 67 46 33 66 416 336 334 41818% 22% 15% 18% 31% 25% 25% 16% 9% 10% 16% 20% 16% 20% 17%
Don't know 528 52 73 54 44 34 41 41 82 59 49 243 286 238 29113% 14% 16% 14% 11% 8% 10% 10% 15% 17% 12% 12% 14% 14% 12%
Not Applicable 541 40 56 45 28 51 45 98 86 39 52 247 294 182 35913% 11% 12% 11% 7% 12% 12% 23% 16% 11% 13% 12% 14% 11% 15%
NETS
Net: Unlikely 1263 86 159 132 80 110 75 115 227 138 141 606 657 491 77231% 23% 36% 33% 20% 27% 19% 27% 43% 39% 34% 29% 32% 29% 32%
Net: Likely 1797 187 160 165 247 214 228 173 136 115 173 978 820 773 102444% 51% 36% 42% 62% 52% 59% 41% 26% 33% 42% 47% 40% 46% 42%
Mean score 2.63 2.87 2.45 2.56 3.03 2.83 2.95 2.67 2.18 2.21 2.55 2.70 2.55 2.71 2.57Standard deviation 1.07 .96 1.09 1.10 .96 1.03 .98 1.00 1.02 1.09 1.05 1.05 1.08 1.03 1.08Standard error .02 .06 .06 .06 .05 .06 .06 .06 .05 .07 .06 .03 .03 .03 .02
Online fieldwork: 26th March - 15th April 2015 Prepared by ComRes Ltd
Page 233
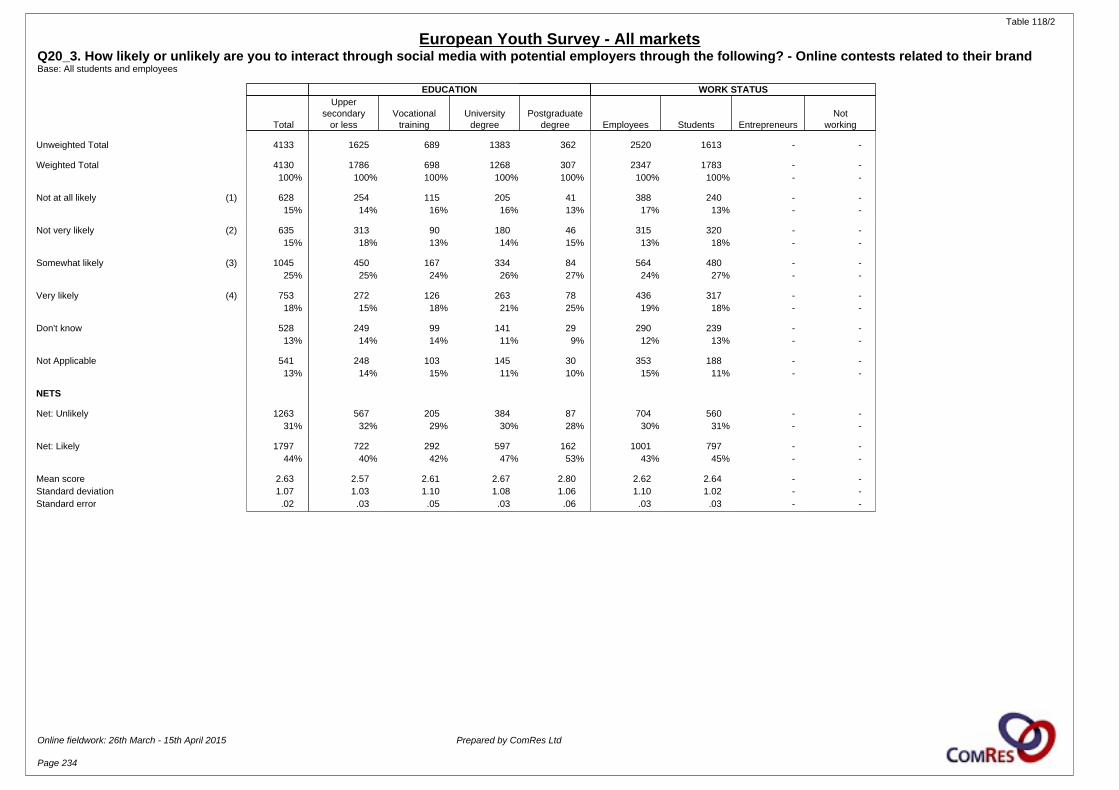
Table 118/2
European Youth Survey - All marketsQ20_3. How likely or unlikely are you to interact through social media with potential employers through the following? - Online contests related to their brandBase: All students and employees
EDUCATION WORK STATUS
Total
Uppersecondary
or lessVocational
trainingUniversity
degreePostgraduate
degree Employees Students EntrepreneursNot
working
Unweighted Total 4133 1625 689 1383 362 2520 1613 - -
Weighted Total 4130 1786 698 1268 307 2347 1783 - -100% 100% 100% 100% 100% 100% 100% - -
Not at all likely (1) 628 254 115 205 41 388 240 - -15% 14% 16% 16% 13% 17% 13% - -
Not very likely (2) 635 313 90 180 46 315 320 - -15% 18% 13% 14% 15% 13% 18% - -
Somewhat likely (3) 1045 450 167 334 84 564 480 - -25% 25% 24% 26% 27% 24% 27% - -
Very likely (4) 753 272 126 263 78 436 317 - -18% 15% 18% 21% 25% 19% 18% - -
Don't know 528 249 99 141 29 290 239 - -13% 14% 14% 11% 9% 12% 13% - -
Not Applicable 541 248 103 145 30 353 188 - -13% 14% 15% 11% 10% 15% 11% - -
NETS
Net: Unlikely 1263 567 205 384 87 704 560 - -31% 32% 29% 30% 28% 30% 31% - -
Net: Likely 1797 722 292 597 162 1001 797 - -44% 40% 42% 47% 53% 43% 45% - -
Mean score 2.63 2.57 2.61 2.67 2.80 2.62 2.64 - -Standard deviation 1.07 1.03 1.10 1.08 1.06 1.10 1.02 - -Standard error .02 .03 .05 .03 .06 .03 .03 - -
Online fieldwork: 26th March - 15th April 2015 Prepared by ComRes Ltd
Page 234

Table 119/1
European Youth Survey - All marketsQ20_4. How likely or unlikely are you to interact through social media with potential employers through the following? - Blog with content about the company and industryBase: All students and employees
COUNTRY GENDER AGE
Total Italy Germany France Spain UKEasternEurope Baltic Nordics Sweden Benelux Male Female 18-22 22-29
Unweighted Total 4133 366 448 397 400 410 389 427 532 348 416 2092 2041 1296 2837
Weighted Total 4130 365 447 396 400 408 389 427 531 351 415 2074 2056 1684 2446100% 100% 100% 100% 100% 100% 100% 100% 100% 100% 100% 100% 100% 100% 100%
Not at all likely (1) 632 26 67 71 24 59 43 48 114 118 62 312 321 217 41515% 7% 15% 18% 6% 14% 11% 11% 21% 34% 15% 15% 16% 13% 17%
Not very likely (2) 643 64 72 67 38 61 46 67 105 49 74 328 315 290 35316% 17% 16% 17% 9% 15% 12% 16% 20% 14% 18% 16% 15% 17% 14%
Somewhat likely (3) 1073 126 112 79 138 123 120 108 103 53 111 560 513 445 62826% 34% 25% 20% 34% 30% 31% 25% 19% 15% 27% 27% 25% 26% 26%
Very likely (4) 742 67 93 82 135 74 92 74 36 20 69 407 335 319 42418% 18% 21% 21% 34% 18% 24% 17% 7% 6% 17% 20% 16% 19% 17%
Don't know 496 51 49 43 38 37 33 43 85 69 48 224 272 224 27312% 14% 11% 11% 9% 9% 9% 10% 16% 20% 11% 11% 13% 13% 11%
Not Applicable 544 32 54 53 27 54 55 87 87 42 52 244 300 189 35513% 9% 12% 13% 7% 13% 14% 20% 16% 12% 13% 12% 15% 11% 14%
NETS
Net: Unlikely 1275 90 139 139 62 119 90 115 219 167 136 639 636 508 76831% 25% 31% 35% 16% 29% 23% 27% 41% 48% 33% 31% 31% 30% 31%
Net: Likely 1815 193 205 161 273 198 212 182 139 73 180 967 848 763 105144% 53% 46% 41% 68% 48% 54% 43% 26% 21% 43% 47% 41% 45% 43%
Mean score 2.62 2.83 2.67 2.57 3.15 2.67 2.86 2.70 2.17 1.90 2.59 2.66 2.58 2.68 2.58Standard deviation 1.06 .90 1.07 1.13 .89 1.03 1.01 1.02 .99 1.02 1.04 1.06 1.06 1.03 1.08Standard error .02 .05 .06 .07 .05 .06 .06 .06 .05 .07 .06 .03 .03 .03 .02
Online fieldwork: 26th March - 15th April 2015 Prepared by ComRes Ltd
Page 235
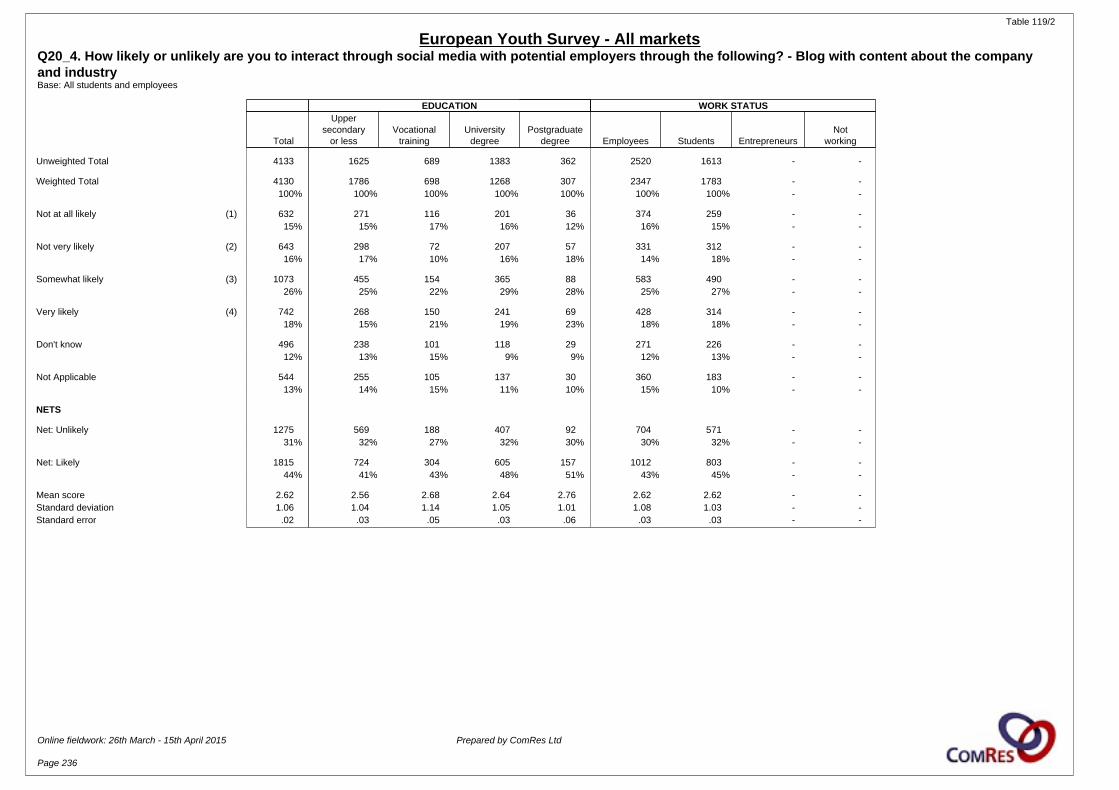
Table 119/2
European Youth Survey - All marketsQ20_4. How likely or unlikely are you to interact through social media with potential employers through the following? - Blog with content about the company and industryBase: All students and employees
EDUCATION WORK STATUS
Total
Uppersecondary
or lessVocational
trainingUniversity
degreePostgraduate
degree Employees Students EntrepreneursNot
working
Unweighted Total 4133 1625 689 1383 362 2520 1613 - -
Weighted Total 4130 1786 698 1268 307 2347 1783 - -100% 100% 100% 100% 100% 100% 100% - -
Not at all likely (1) 632 271 116 201 36 374 259 - -15% 15% 17% 16% 12% 16% 15% - -
Not very likely (2) 643 298 72 207 57 331 312 - -16% 17% 10% 16% 18% 14% 18% - -
Somewhat likely (3) 1073 455 154 365 88 583 490 - -26% 25% 22% 29% 28% 25% 27% - -
Very likely (4) 742 268 150 241 69 428 314 - -18% 15% 21% 19% 23% 18% 18% - -
Don't know 496 238 101 118 29 271 226 - -12% 13% 15% 9% 9% 12% 13% - -
Not Applicable 544 255 105 137 30 360 183 - -13% 14% 15% 11% 10% 15% 10% - -
NETS
Net: Unlikely 1275 569 188 407 92 704 571 - -31% 32% 27% 32% 30% 30% 32% - -
Net: Likely 1815 724 304 605 157 1012 803 - -44% 41% 43% 48% 51% 43% 45% - -
Mean score 2.62 2.56 2.68 2.64 2.76 2.62 2.62 - -Standard deviation 1.06 1.04 1.14 1.05 1.01 1.08 1.03 - -Standard error .02 .03 .05 .03 .06 .03 .03 - -
Online fieldwork: 26th March - 15th April 2015 Prepared by ComRes Ltd
Page 236
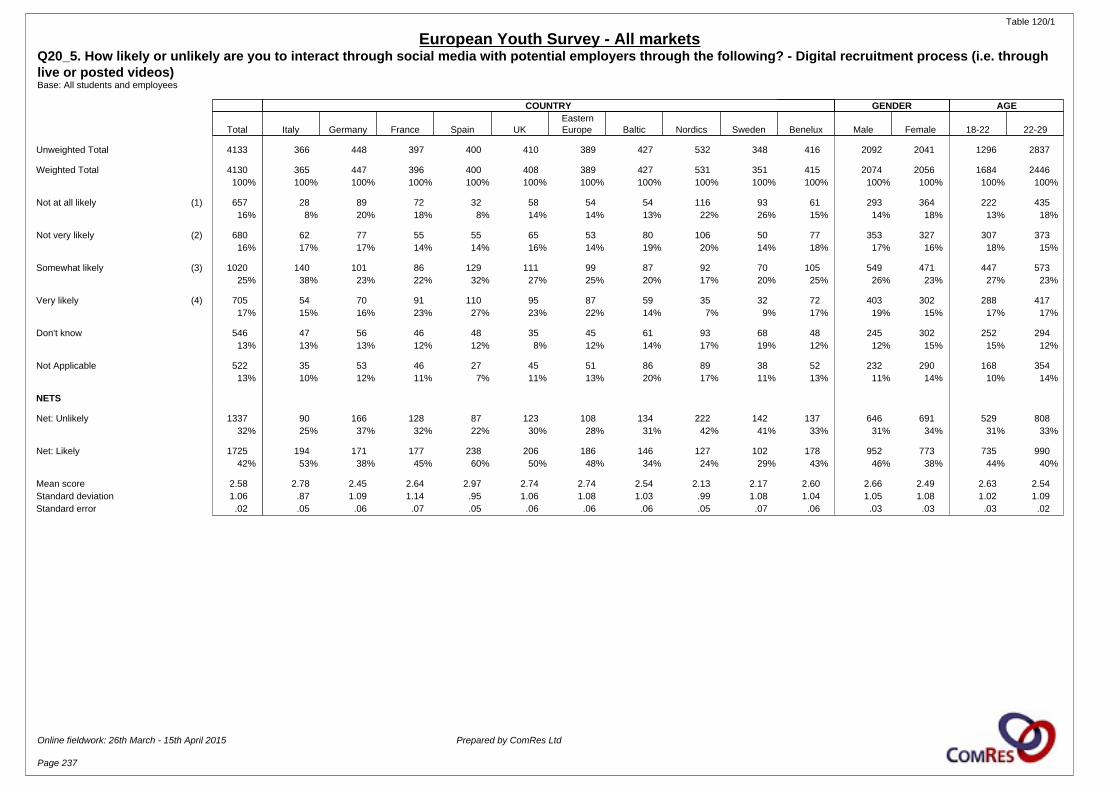
Table 120/1
European Youth Survey - All marketsQ20_5. How likely or unlikely are you to interact through social media with potential employers through the following? - Digital recruitment process (i.e. through live or posted videos)Base: All students and employees
COUNTRY GENDER AGE
Total Italy Germany France Spain UKEasternEurope Baltic Nordics Sweden Benelux Male Female 18-22 22-29
Unweighted Total 4133 366 448 397 400 410 389 427 532 348 416 2092 2041 1296 2837
Weighted Total 4130 365 447 396 400 408 389 427 531 351 415 2074 2056 1684 2446100% 100% 100% 100% 100% 100% 100% 100% 100% 100% 100% 100% 100% 100% 100%
Not at all likely (1) 657 28 89 72 32 58 54 54 116 93 61 293 364 222 43516% 8% 20% 18% 8% 14% 14% 13% 22% 26% 15% 14% 18% 13% 18%
Not very likely (2) 680 62 77 55 55 65 53 80 106 50 77 353 327 307 37316% 17% 17% 14% 14% 16% 14% 19% 20% 14% 18% 17% 16% 18% 15%
Somewhat likely (3) 1020 140 101 86 129 111 99 87 92 70 105 549 471 447 57325% 38% 23% 22% 32% 27% 25% 20% 17% 20% 25% 26% 23% 27% 23%
Very likely (4) 705 54 70 91 110 95 87 59 35 32 72 403 302 288 41717% 15% 16% 23% 27% 23% 22% 14% 7% 9% 17% 19% 15% 17% 17%
Don't know 546 47 56 46 48 35 45 61 93 68 48 245 302 252 29413% 13% 13% 12% 12% 8% 12% 14% 17% 19% 12% 12% 15% 15% 12%
Not Applicable 522 35 53 46 27 45 51 86 89 38 52 232 290 168 35413% 10% 12% 11% 7% 11% 13% 20% 17% 11% 13% 11% 14% 10% 14%
NETS
Net: Unlikely 1337 90 166 128 87 123 108 134 222 142 137 646 691 529 80832% 25% 37% 32% 22% 30% 28% 31% 42% 41% 33% 31% 34% 31% 33%
Net: Likely 1725 194 171 177 238 206 186 146 127 102 178 952 773 735 99042% 53% 38% 45% 60% 50% 48% 34% 24% 29% 43% 46% 38% 44% 40%
Mean score 2.58 2.78 2.45 2.64 2.97 2.74 2.74 2.54 2.13 2.17 2.60 2.66 2.49 2.63 2.54Standard deviation 1.06 .87 1.09 1.14 .95 1.06 1.08 1.03 .99 1.08 1.04 1.05 1.08 1.02 1.09Standard error .02 .05 .06 .07 .05 .06 .06 .06 .05 .07 .06 .03 .03 .03 .02
Online fieldwork: 26th March - 15th April 2015 Prepared by ComRes Ltd
Page 237
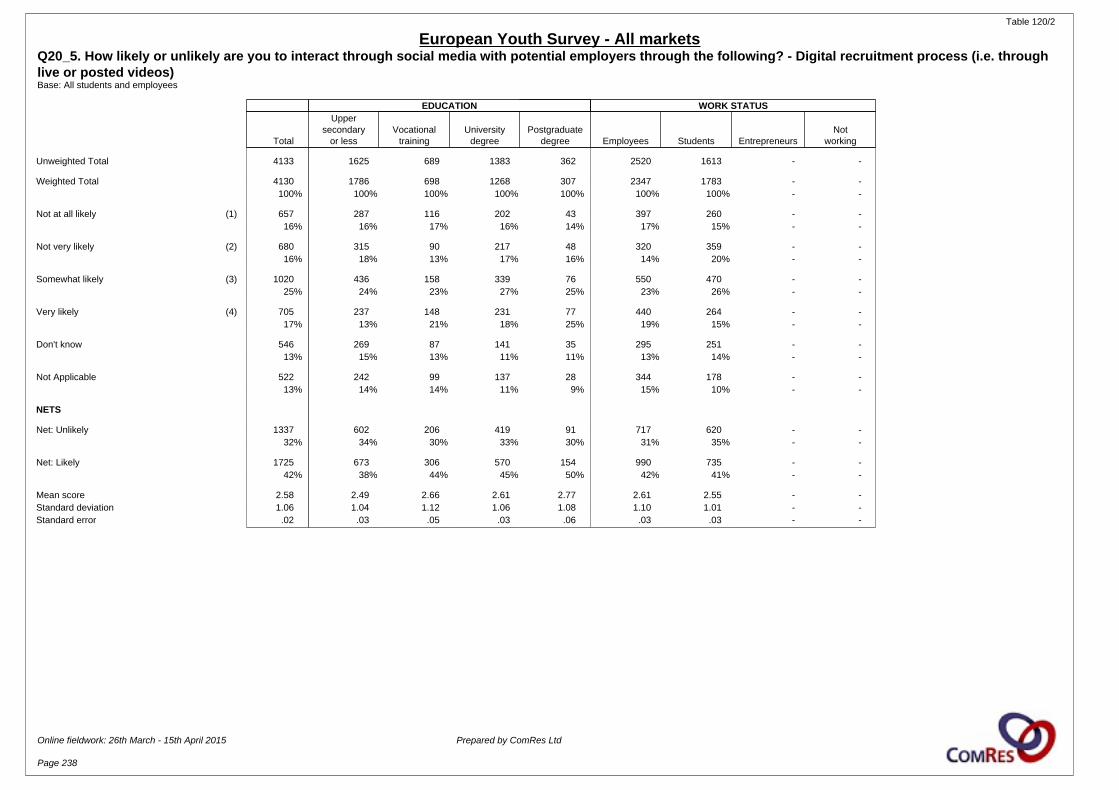
Table 120/2
European Youth Survey - All marketsQ20_5. How likely or unlikely are you to interact through social media with potential employers through the following? - Digital recruitment process (i.e. through live or posted videos)Base: All students and employees
EDUCATION WORK STATUS
Total
Uppersecondary
or lessVocational
trainingUniversity
degreePostgraduate
degree Employees Students EntrepreneursNot
working
Unweighted Total 4133 1625 689 1383 362 2520 1613 - -
Weighted Total 4130 1786 698 1268 307 2347 1783 - -100% 100% 100% 100% 100% 100% 100% - -
Not at all likely (1) 657 287 116 202 43 397 260 - -16% 16% 17% 16% 14% 17% 15% - -
Not very likely (2) 680 315 90 217 48 320 359 - -16% 18% 13% 17% 16% 14% 20% - -
Somewhat likely (3) 1020 436 158 339 76 550 470 - -25% 24% 23% 27% 25% 23% 26% - -
Very likely (4) 705 237 148 231 77 440 264 - -17% 13% 21% 18% 25% 19% 15% - -
Don't know 546 269 87 141 35 295 251 - -13% 15% 13% 11% 11% 13% 14% - -
Not Applicable 522 242 99 137 28 344 178 - -13% 14% 14% 11% 9% 15% 10% - -
NETS
Net: Unlikely 1337 602 206 419 91 717 620 - -32% 34% 30% 33% 30% 31% 35% - -
Net: Likely 1725 673 306 570 154 990 735 - -42% 38% 44% 45% 50% 42% 41% - -
Mean score 2.58 2.49 2.66 2.61 2.77 2.61 2.55 - -Standard deviation 1.06 1.04 1.12 1.06 1.08 1.10 1.01 - -Standard error .02 .03 .05 .03 .06 .03 .03 - -
Online fieldwork: 26th March - 15th April 2015 Prepared by ComRes Ltd
Page 238
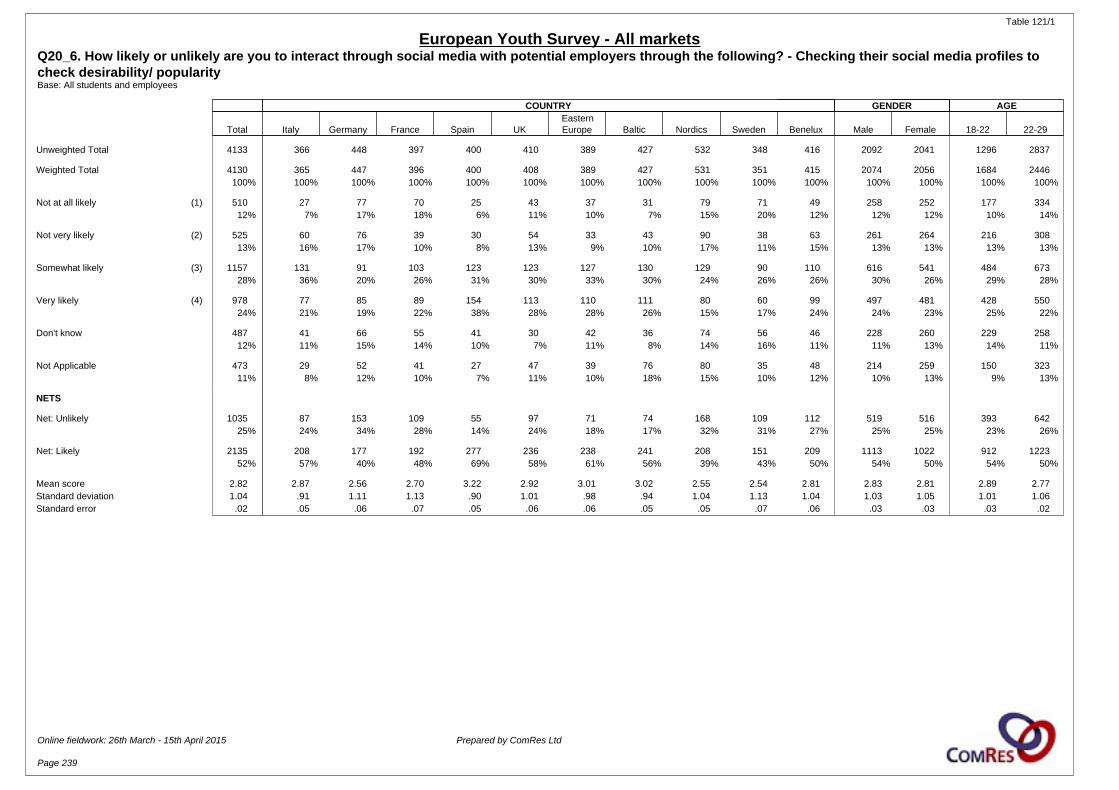
Table 121/1
European Youth Survey - All marketsQ20_6. How likely or unlikely are you to interact through social media with potential employers through the following? - Checking their social media profiles to check desirability/ popularityBase: All students and employees
COUNTRY GENDER AGE
Total Italy Germany France Spain UKEasternEurope Baltic Nordics Sweden Benelux Male Female 18-22 22-29
Unweighted Total 4133 366 448 397 400 410 389 427 532 348 416 2092 2041 1296 2837
Weighted Total 4130 365 447 396 400 408 389 427 531 351 415 2074 2056 1684 2446100% 100% 100% 100% 100% 100% 100% 100% 100% 100% 100% 100% 100% 100% 100%
Not at all likely (1) 510 27 77 70 25 43 37 31 79 71 49 258 252 177 33412% 7% 17% 18% 6% 11% 10% 7% 15% 20% 12% 12% 12% 10% 14%
Not very likely (2) 525 60 76 39 30 54 33 43 90 38 63 261 264 216 30813% 16% 17% 10% 8% 13% 9% 10% 17% 11% 15% 13% 13% 13% 13%
Somewhat likely (3) 1157 131 91 103 123 123 127 130 129 90 110 616 541 484 67328% 36% 20% 26% 31% 30% 33% 30% 24% 26% 26% 30% 26% 29% 28%
Very likely (4) 978 77 85 89 154 113 110 111 80 60 99 497 481 428 55024% 21% 19% 22% 38% 28% 28% 26% 15% 17% 24% 24% 23% 25% 22%
Don't know 487 41 66 55 41 30 42 36 74 56 46 228 260 229 25812% 11% 15% 14% 10% 7% 11% 8% 14% 16% 11% 11% 13% 14% 11%
Not Applicable 473 29 52 41 27 47 39 76 80 35 48 214 259 150 32311% 8% 12% 10% 7% 11% 10% 18% 15% 10% 12% 10% 13% 9% 13%
NETS
Net: Unlikely 1035 87 153 109 55 97 71 74 168 109 112 519 516 393 64225% 24% 34% 28% 14% 24% 18% 17% 32% 31% 27% 25% 25% 23% 26%
Net: Likely 2135 208 177 192 277 236 238 241 208 151 209 1113 1022 912 122352% 57% 40% 48% 69% 58% 61% 56% 39% 43% 50% 54% 50% 54% 50%
Mean score 2.82 2.87 2.56 2.70 3.22 2.92 3.01 3.02 2.55 2.54 2.81 2.83 2.81 2.89 2.77Standard deviation 1.04 .91 1.11 1.13 .90 1.01 .98 .94 1.04 1.13 1.04 1.03 1.05 1.01 1.06Standard error .02 .05 .06 .07 .05 .06 .06 .05 .05 .07 .06 .03 .03 .03 .02
Online fieldwork: 26th March - 15th April 2015 Prepared by ComRes Ltd
Page 239
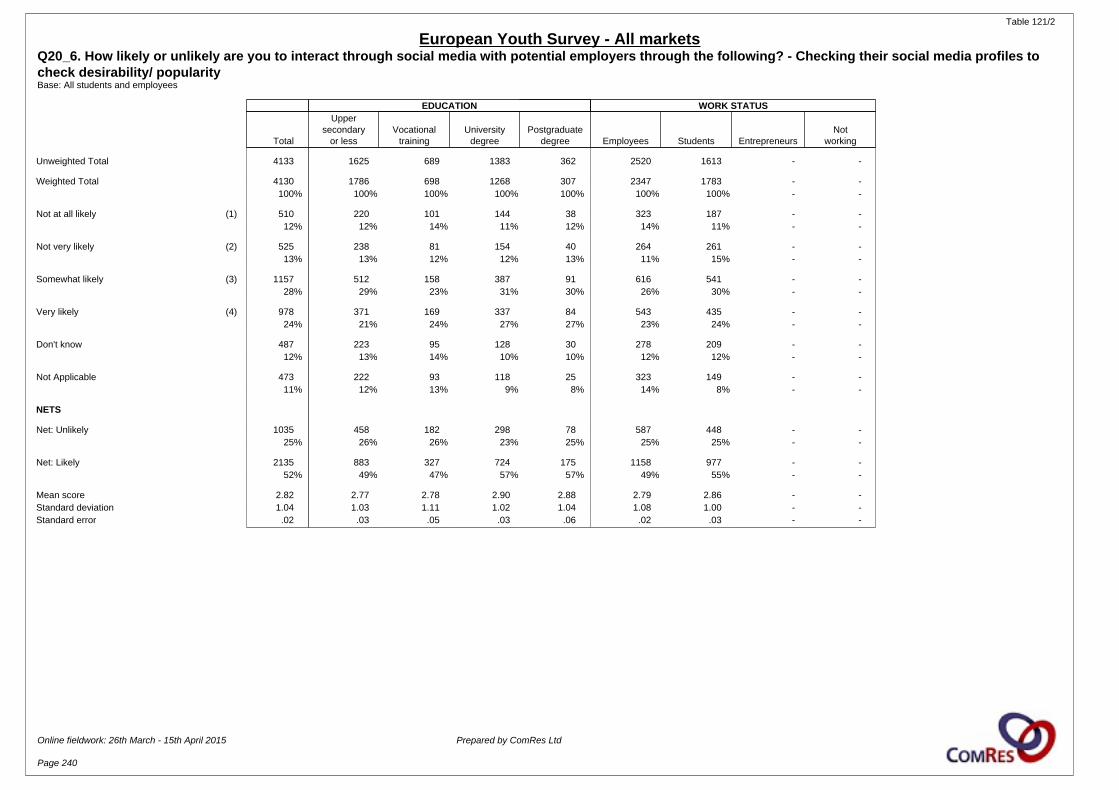
Table 121/2
European Youth Survey - All marketsQ20_6. How likely or unlikely are you to interact through social media with potential employers through the following? - Checking their social media profiles to check desirability/ popularityBase: All students and employees
EDUCATION WORK STATUS
Total
Uppersecondary
or lessVocational
trainingUniversity
degreePostgraduate
degree Employees Students EntrepreneursNot
working
Unweighted Total 4133 1625 689 1383 362 2520 1613 - -
Weighted Total 4130 1786 698 1268 307 2347 1783 - -100% 100% 100% 100% 100% 100% 100% - -
Not at all likely (1) 510 220 101 144 38 323 187 - -12% 12% 14% 11% 12% 14% 11% - -
Not very likely (2) 525 238 81 154 40 264 261 - -13% 13% 12% 12% 13% 11% 15% - -
Somewhat likely (3) 1157 512 158 387 91 616 541 - -28% 29% 23% 31% 30% 26% 30% - -
Very likely (4) 978 371 169 337 84 543 435 - -24% 21% 24% 27% 27% 23% 24% - -
Don't know 487 223 95 128 30 278 209 - -12% 13% 14% 10% 10% 12% 12% - -
Not Applicable 473 222 93 118 25 323 149 - -11% 12% 13% 9% 8% 14% 8% - -
NETS
Net: Unlikely 1035 458 182 298 78 587 448 - -25% 26% 26% 23% 25% 25% 25% - -
Net: Likely 2135 883 327 724 175 1158 977 - -52% 49% 47% 57% 57% 49% 55% - -
Mean score 2.82 2.77 2.78 2.90 2.88 2.79 2.86 - -Standard deviation 1.04 1.03 1.11 1.02 1.04 1.08 1.00 - -Standard error .02 .03 .05 .03 .06 .02 .03 - -
Online fieldwork: 26th March - 15th April 2015 Prepared by ComRes Ltd
Page 240

Table 122/1
European Youth Survey - All marketsQ20_7. How likely or unlikely are you to interact through social media with potential employers through the following? - Finding/ getting invited to events offlineBase: All students and employees
COUNTRY GENDER AGE
Total Italy Germany France Spain UKEasternEurope Baltic Nordics Sweden Benelux Male Female 18-22 22-29
Unweighted Total 4133 366 448 397 400 410 389 427 532 348 416 2092 2041 1296 2837
Weighted Total 4130 365 447 396 400 408 389 427 531 351 415 2074 2056 1684 2446100% 100% 100% 100% 100% 100% 100% 100% 100% 100% 100% 100% 100% 100% 100%
Not at all likely (1) 512 29 58 64 32 46 37 47 83 63 53 249 263 176 33612% 8% 13% 16% 8% 11% 10% 11% 16% 18% 13% 12% 13% 10% 14%
Not very likely (2) 541 50 65 50 39 41 36 64 89 38 69 280 261 228 31313% 14% 15% 13% 10% 10% 9% 15% 17% 11% 17% 14% 13% 14% 13%
Somewhat likely (3) 1185 127 112 95 122 135 102 128 135 102 128 610 575 501 68429% 35% 25% 24% 31% 33% 26% 30% 25% 29% 31% 29% 28% 30% 28%
Very likely (4) 900 72 101 88 142 98 130 72 72 52 72 485 415 390 51022% 20% 23% 22% 35% 24% 33% 17% 14% 15% 17% 23% 20% 23% 21%
Don't know 510 55 56 57 40 42 39 41 79 58 43 220 290 226 28412% 15% 13% 14% 10% 10% 10% 10% 15% 17% 10% 11% 14% 13% 12%
Not Applicable 482 32 55 44 25 46 44 77 73 36 51 229 253 163 31912% 9% 12% 11% 6% 11% 11% 18% 14% 10% 12% 11% 12% 10% 13%
NETS
Net: Unlikely 1053 79 123 113 71 87 73 110 172 102 122 530 523 404 64926% 22% 28% 29% 18% 21% 19% 26% 32% 29% 29% 26% 25% 24% 27%
Net: Likely 2084 200 213 182 264 233 232 199 207 155 200 1095 990 890 119450% 55% 48% 46% 66% 57% 60% 47% 39% 44% 48% 53% 48% 53% 49%
Mean score 2.79 2.87 2.76 2.70 3.12 2.89 3.06 2.72 2.52 2.56 2.68 2.82 2.75 2.85 2.74Standard deviation 1.03 .92 1.06 1.11 .95 1.00 1.02 .98 1.03 1.07 1.00 1.03 1.04 1.00 1.05Standard error .02 .05 .06 .06 .05 .06 .06 .06 .05 .07 .06 .03 .03 .03 .02
Online fieldwork: 26th March - 15th April 2015 Prepared by ComRes Ltd
Page 241

Table 122/2
European Youth Survey - All marketsQ20_7. How likely or unlikely are you to interact through social media with potential employers through the following? - Finding/ getting invited to events offlineBase: All students and employees
EDUCATION WORK STATUS
Total
Uppersecondary
or lessVocational
trainingUniversity
degreePostgraduate
degree Employees Students EntrepreneursNot
working
Unweighted Total 4133 1625 689 1383 362 2520 1613 - -
Weighted Total 4130 1786 698 1268 307 2347 1783 - -100% 100% 100% 100% 100% 100% 100% - -
Not at all likely (1) 512 224 96 149 35 316 196 - -12% 13% 14% 12% 11% 13% 11% - -
Not very likely (2) 541 245 80 178 29 277 264 - -13% 14% 11% 14% 9% 12% 15% - -
Somewhat likely (3) 1185 524 175 372 100 622 563 - -29% 29% 25% 29% 33% 26% 32% - -
Very likely (4) 900 336 162 306 84 520 380 - -22% 19% 23% 24% 27% 22% 21% - -
Don't know 510 237 98 133 31 283 228 - -12% 13% 14% 10% 10% 12% 13% - -
Not Applicable 482 220 89 130 29 330 152 - -12% 12% 13% 10% 9% 14% 9% - -
NETS
Net: Unlikely 1053 469 176 327 63 593 460 - -26% 26% 25% 26% 21% 25% 26% - -
Net: Likely 2084 860 336 677 185 1142 943 - -50% 48% 48% 53% 60% 49% 53% - -
Mean score 2.79 2.73 2.79 2.83 2.95 2.78 2.80 - -Standard deviation 1.03 1.02 1.08 1.02 1.01 1.07 .99 - -Standard error .02 .03 .05 .03 .06 .02 .03 - -
Online fieldwork: 26th March - 15th April 2015 Prepared by ComRes Ltd
Page 242
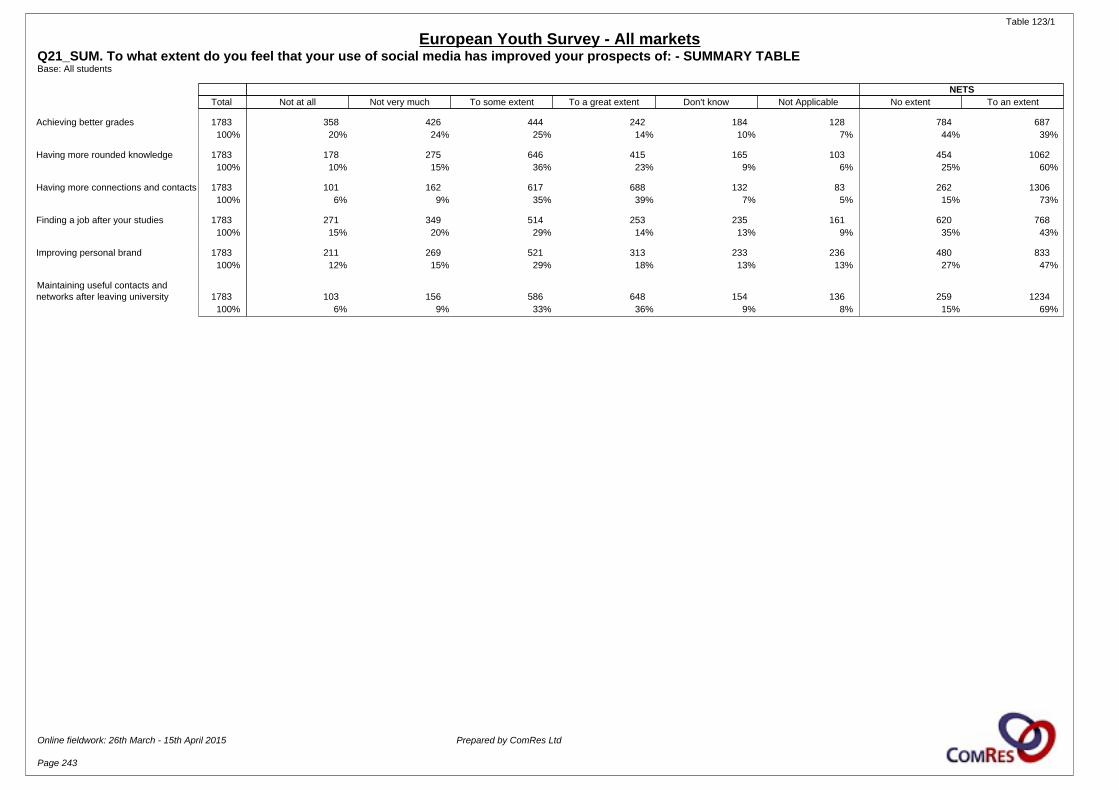
Table 123/1
European Youth Survey - All marketsQ21_SUM. To what extent do you feel that your use of social media has improved your prospects of: - SUMMARY TABLEBase: All students
NETS Total Not at all Not very much To some extent To a great extent Don't know Not Applicable No extent To an extent
Achieving better grades 1783 358 426 444 242 184 128 784 687100% 20% 24% 25% 14% 10% 7% 44% 39%
Having more rounded knowledge 1783 178 275 646 415 165 103 454 1062100% 10% 15% 36% 23% 9% 6% 25% 60%
Having more connections and contacts 1783 101 162 617 688 132 83 262 1306100% 6% 9% 35% 39% 7% 5% 15% 73%
Finding a job after your studies 1783 271 349 514 253 235 161 620 768100% 15% 20% 29% 14% 13% 9% 35% 43%
Improving personal brand 1783 211 269 521 313 233 236 480 833100% 12% 15% 29% 18% 13% 13% 27% 47%
Maintaining useful contacts andnetworks after leaving university 1783 103 156 586 648 154 136 259 1234
100% 6% 9% 33% 36% 9% 8% 15% 69%
Online fieldwork: 26th March - 15th April 2015 Prepared by ComRes Ltd
Page 243

Table 124/1
European Youth Survey - All marketsQ21_1. To what extent do you feel that your use of social media has improved your prospects of: Achieving better gradesBase: All students
COUNTRY GENDER AGE
Total Italy Germany France Spain UKEasternEurope Baltic Nordics Sweden Benelux Male Female 18-22 22-29
Unweighted Total 1613 153 173 111 150 103 124 157 295 163 184 770 843 907 706
Weighted Total 1783 176 199 121 161 131 161 170 308 175 182 842 941 1173 610100% 100% 100% 100% 100% 100% 100% 100% 100% 100% 100% 100% 100% 100% 100%
Not at all (1) 358 30 50 20 19 19 14 24 100 49 35 162 197 204 15420% 17% 25% 16% 12% 14% 8% 14% 32% 28% 19% 19% 21% 17% 25%
Not very much (2) 426 50 60 26 26 23 28 34 86 49 44 186 239 280 14524% 29% 30% 21% 16% 18% 17% 20% 28% 28% 24% 22% 25% 24% 24%
To some extent (3) 444 41 30 30 51 51 50 48 53 38 52 234 210 297 14725% 23% 15% 25% 32% 39% 31% 28% 17% 22% 29% 28% 22% 25% 24%
To a great extent (4) 242 19 21 19 48 21 30 28 18 16 23 131 111 173 7014% 11% 11% 16% 30% 16% 18% 17% 6% 9% 13% 16% 12% 15% 11%
Don't know 184 27 26 18 14 13 18 18 24 14 12 83 101 133 5010% 15% 13% 15% 9% 10% 11% 10% 8% 8% 6% 10% 11% 11% 8%
Not Applicable 128 9 13 8 3 3 23 18 27 8 16 45 83 85 437% 5% 7% 6% 2% 2% 14% 11% 9% 5% 9% 5% 9% 7% 7%
NETS
Net: No extent 784 80 109 46 45 42 41 58 186 98 79 348 436 485 30044% 45% 55% 38% 28% 32% 26% 34% 60% 56% 43% 41% 46% 41% 49%
Net: To an extent 687 60 51 49 99 72 80 76 71 55 75 365 321 470 21739% 34% 25% 41% 61% 55% 50% 45% 23% 31% 41% 43% 34% 40% 36%
Mean score 2.39 2.35 2.14 2.51 2.88 2.65 2.79 2.60 1.96 2.15 2.41 2.47 2.31 2.46 2.26Standard deviation 1.03 .96 1.00 1.04 1.02 .96 .94 1.01 .93 .99 1.00 1.04 1.01 1.02 1.03Standard error .03 .09 .09 .11 .09 .10 .09 .09 .06 .08 .08 .04 .04 .04 .04
Online fieldwork: 26th March - 15th April 2015 Prepared by ComRes Ltd
Page 244

Table 124/2
European Youth Survey - All marketsQ21_1. To what extent do you feel that your use of social media has improved your prospects of: Achieving better gradesBase: All students
EDUCATION WORK STATUS
Total
Uppersecondary
or lessVocational
trainingUniversity
degreePostgraduate
degree Employees Students EntrepreneursNot
working
Unweighted Total 1613 894 182 451 59 - 1613 - -
Weighted Total 1783 1062 203 437 52 - 1783 - -100% 100% 100% 100% 100% - 100% - -
Not at all (1) 358 215 41 92 3 - 358 - -20% 20% 20% 21% 7% - 20% - -
Not very much (2) 426 269 38 102 10 - 426 - -24% 25% 19% 23% 19% - 24% - -
To some extent (3) 444 256 55 109 18 - 444 - -25% 24% 27% 25% 35% - 25% - -
To a great extent (4) 242 125 30 69 13 - 242 - -14% 12% 15% 16% 26% - 14% - -
Don't know 184 107 27 42 4 - 184 - -10% 10% 13% 10% 8% - 10% - -
Not Applicable 128 90 12 23 3 - 128 - -7% 8% 6% 5% 6% - 7% - -
NETS
Net: No extent 784 484 79 194 13 - 784 - -44% 46% 39% 44% 26% - 44% - -
Net: To an extent 687 381 85 178 32 - 687 - -39% 36% 42% 41% 61% - 39% - -
Mean score 2.39 2.34 2.45 2.42 2.92 - 2.39 - -Standard deviation 1.03 1.01 1.06 1.06 .91 - 1.03 - -Standard error .03 .04 .09 .05 .13 - .03 - -
Online fieldwork: 26th March - 15th April 2015 Prepared by ComRes Ltd
Page 245

Table 125/1
European Youth Survey - All marketsQ21_2. To what extent do you feel that your use of social media has improved your prospects of: Having more rounded knowledgeBase: All students
COUNTRY GENDER AGE
Total Italy Germany France Spain UKEasternEurope Baltic Nordics Sweden Benelux Male Female 18-22 22-29
Unweighted Total 1613 153 173 111 150 103 124 157 295 163 184 770 843 907 706
Weighted Total 1783 176 199 121 161 131 161 170 308 175 182 842 941 1173 610100% 100% 100% 100% 100% 100% 100% 100% 100% 100% 100% 100% 100% 100% 100%
Not at all (1) 178 12 29 12 14 8 9 10 36 29 18 82 96 100 7810% 7% 15% 10% 9% 6% 6% 6% 12% 17% 10% 10% 10% 9% 13%
Not very much (2) 275 27 35 19 18 14 16 24 63 37 22 122 153 166 11015% 16% 18% 16% 11% 11% 10% 14% 20% 21% 12% 15% 16% 14% 18%
To some extent (3) 646 62 70 43 50 54 61 72 107 50 77 300 346 425 22236% 35% 35% 35% 31% 41% 38% 43% 35% 29% 42% 36% 37% 36% 36%
To a great extent (4) 415 48 28 31 62 38 44 40 50 34 41 217 199 291 12423% 27% 14% 26% 39% 29% 27% 24% 16% 19% 22% 26% 21% 25% 20%
Don't know 165 18 26 8 13 10 18 13 27 20 11 82 83 120 459% 10% 13% 7% 8% 8% 11% 8% 9% 12% 6% 10% 9% 10% 7%
Not Applicable 103 9 11 7 4 6 12 10 25 5 13 39 64 72 316% 5% 6% 6% 2% 5% 7% 6% 8% 3% 7% 5% 7% 6% 5%
NETS
Net: No extent 454 39 64 31 32 22 25 34 99 66 40 204 249 266 18825% 22% 32% 26% 20% 17% 16% 20% 32% 38% 22% 24% 27% 23% 31%
Net: To an extent 1062 110 98 74 112 92 106 112 157 84 118 517 545 716 34660% 62% 49% 61% 69% 70% 65% 66% 51% 48% 65% 61% 58% 61% 57%
Mean score 2.86 2.98 2.60 2.89 3.11 3.06 3.07 2.97 2.66 2.59 2.89 2.90 2.81 2.92 2.73Standard deviation .95 .91 .98 .97 .97 .86 .86 .85 .95 1.04 .92 .96 .95 .93 .98Standard error .03 .08 .08 .10 .08 .09 .08 .07 .06 .09 .07 .04 .04 .03 .04
Online fieldwork: 26th March - 15th April 2015 Prepared by ComRes Ltd
Page 246
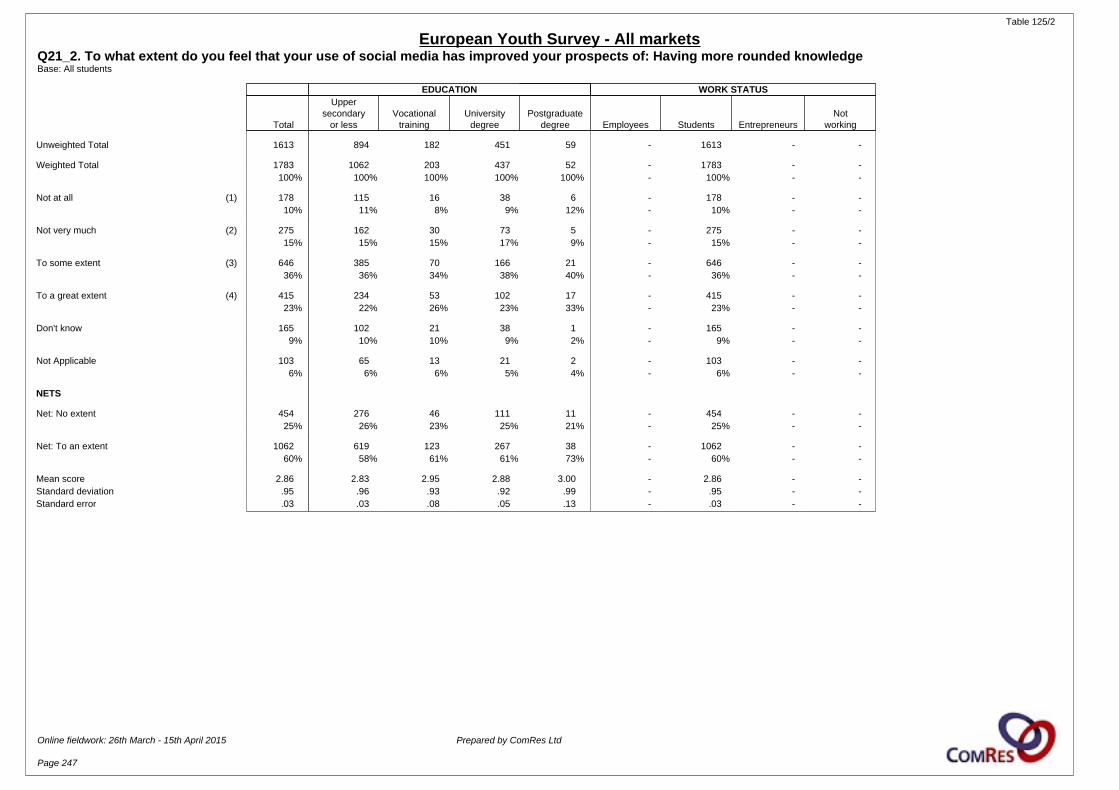
Table 125/2
European Youth Survey - All marketsQ21_2. To what extent do you feel that your use of social media has improved your prospects of: Having more rounded knowledgeBase: All students
EDUCATION WORK STATUS
Total
Uppersecondary
or lessVocational
trainingUniversity
degreePostgraduate
degree Employees Students EntrepreneursNot
working
Unweighted Total 1613 894 182 451 59 - 1613 - -
Weighted Total 1783 1062 203 437 52 - 1783 - -100% 100% 100% 100% 100% - 100% - -
Not at all (1) 178 115 16 38 6 - 178 - -10% 11% 8% 9% 12% - 10% - -
Not very much (2) 275 162 30 73 5 - 275 - -15% 15% 15% 17% 9% - 15% - -
To some extent (3) 646 385 70 166 21 - 646 - -36% 36% 34% 38% 40% - 36% - -
To a great extent (4) 415 234 53 102 17 - 415 - -23% 22% 26% 23% 33% - 23% - -
Don't know 165 102 21 38 1 - 165 - -9% 10% 10% 9% 2% - 9% - -
Not Applicable 103 65 13 21 2 - 103 - -6% 6% 6% 5% 4% - 6% - -
NETS
Net: No extent 454 276 46 111 11 - 454 - -25% 26% 23% 25% 21% - 25% - -
Net: To an extent 1062 619 123 267 38 - 1062 - -60% 58% 61% 61% 73% - 60% - -
Mean score 2.86 2.83 2.95 2.88 3.00 - 2.86 - -Standard deviation .95 .96 .93 .92 .99 - .95 - -Standard error .03 .03 .08 .05 .13 - .03 - -
Online fieldwork: 26th March - 15th April 2015 Prepared by ComRes Ltd
Page 247
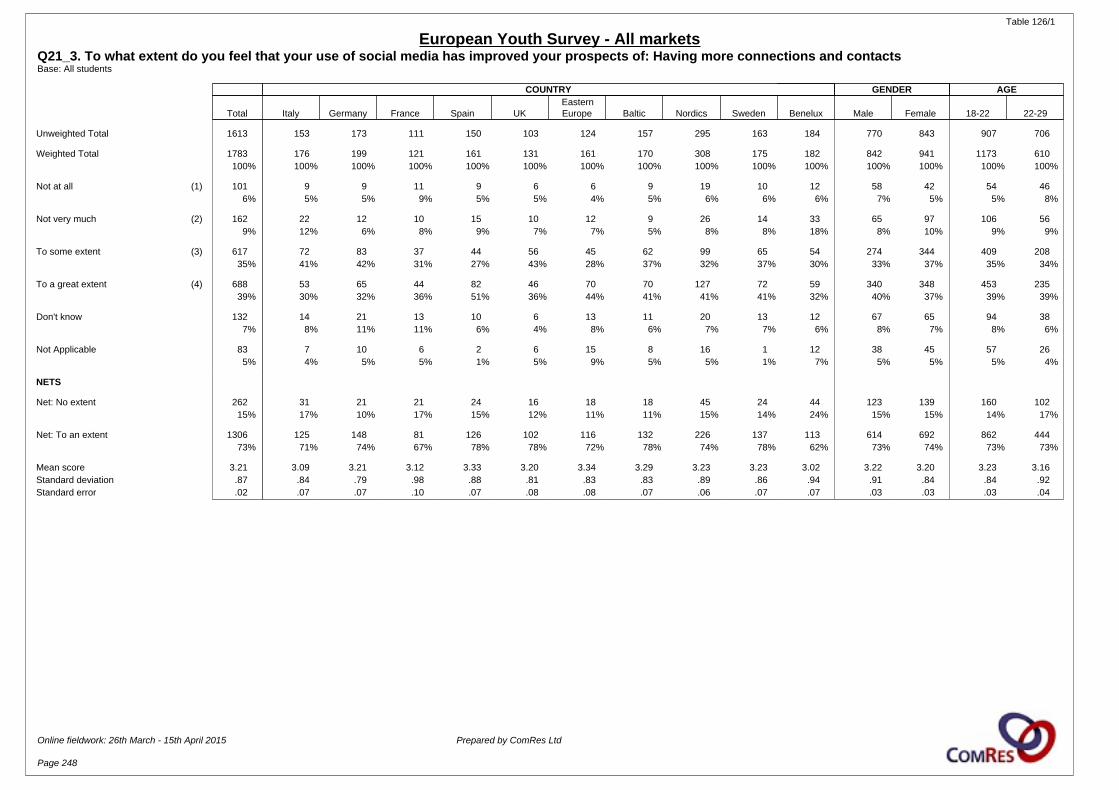
Table 126/1
European Youth Survey - All marketsQ21_3. To what extent do you feel that your use of social media has improved your prospects of: Having more connections and contactsBase: All students
COUNTRY GENDER AGE
Total Italy Germany France Spain UKEasternEurope Baltic Nordics Sweden Benelux Male Female 18-22 22-29
Unweighted Total 1613 153 173 111 150 103 124 157 295 163 184 770 843 907 706
Weighted Total 1783 176 199 121 161 131 161 170 308 175 182 842 941 1173 610100% 100% 100% 100% 100% 100% 100% 100% 100% 100% 100% 100% 100% 100% 100%
Not at all (1) 101 9 9 11 9 6 6 9 19 10 12 58 42 54 466% 5% 5% 9% 5% 5% 4% 5% 6% 6% 6% 7% 5% 5% 8%
Not very much (2) 162 22 12 10 15 10 12 9 26 14 33 65 97 106 569% 12% 6% 8% 9% 7% 7% 5% 8% 8% 18% 8% 10% 9% 9%
To some extent (3) 617 72 83 37 44 56 45 62 99 65 54 274 344 409 20835% 41% 42% 31% 27% 43% 28% 37% 32% 37% 30% 33% 37% 35% 34%
To a great extent (4) 688 53 65 44 82 46 70 70 127 72 59 340 348 453 23539% 30% 32% 36% 51% 36% 44% 41% 41% 41% 32% 40% 37% 39% 39%
Don't know 132 14 21 13 10 6 13 11 20 13 12 67 65 94 387% 8% 11% 11% 6% 4% 8% 6% 7% 7% 6% 8% 7% 8% 6%
Not Applicable 83 7 10 6 2 6 15 8 16 1 12 38 45 57 265% 4% 5% 5% 1% 5% 9% 5% 5% 1% 7% 5% 5% 5% 4%
NETS
Net: No extent 262 31 21 21 24 16 18 18 45 24 44 123 139 160 10215% 17% 10% 17% 15% 12% 11% 11% 15% 14% 24% 15% 15% 14% 17%
Net: To an extent 1306 125 148 81 126 102 116 132 226 137 113 614 692 862 44473% 71% 74% 67% 78% 78% 72% 78% 74% 78% 62% 73% 74% 73% 73%
Mean score 3.21 3.09 3.21 3.12 3.33 3.20 3.34 3.29 3.23 3.23 3.02 3.22 3.20 3.23 3.16Standard deviation .87 .84 .79 .98 .88 .81 .83 .83 .89 .86 .94 .91 .84 .84 .92Standard error .02 .07 .07 .10 .07 .08 .08 .07 .06 .07 .07 .03 .03 .03 .04
Online fieldwork: 26th March - 15th April 2015 Prepared by ComRes Ltd
Page 248
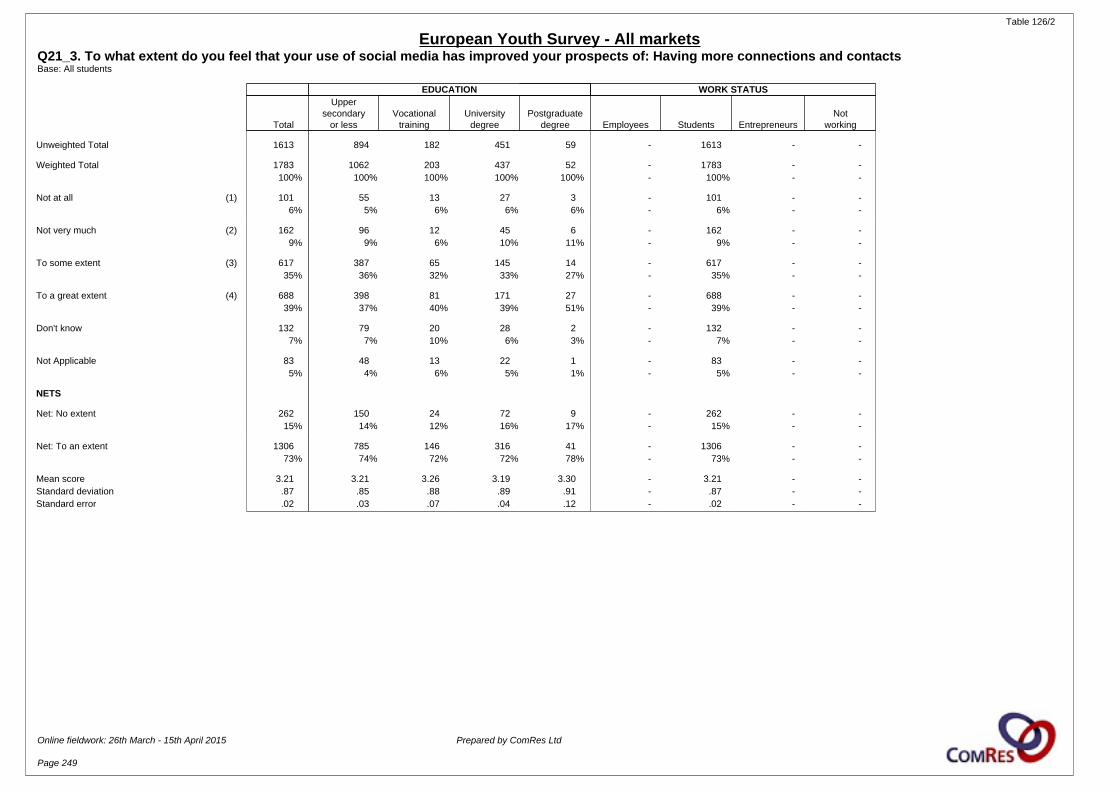
Table 126/2
European Youth Survey - All marketsQ21_3. To what extent do you feel that your use of social media has improved your prospects of: Having more connections and contactsBase: All students
EDUCATION WORK STATUS
Total
Uppersecondary
or lessVocational
trainingUniversity
degreePostgraduate
degree Employees Students EntrepreneursNot
working
Unweighted Total 1613 894 182 451 59 - 1613 - -
Weighted Total 1783 1062 203 437 52 - 1783 - -100% 100% 100% 100% 100% - 100% - -
Not at all (1) 101 55 13 27 3 - 101 - -6% 5% 6% 6% 6% - 6% - -
Not very much (2) 162 96 12 45 6 - 162 - -9% 9% 6% 10% 11% - 9% - -
To some extent (3) 617 387 65 145 14 - 617 - -35% 36% 32% 33% 27% - 35% - -
To a great extent (4) 688 398 81 171 27 - 688 - -39% 37% 40% 39% 51% - 39% - -
Don't know 132 79 20 28 2 - 132 - -7% 7% 10% 6% 3% - 7% - -
Not Applicable 83 48 13 22 1 - 83 - -5% 4% 6% 5% 1% - 5% - -
NETS
Net: No extent 262 150 24 72 9 - 262 - -15% 14% 12% 16% 17% - 15% - -
Net: To an extent 1306 785 146 316 41 - 1306 - -73% 74% 72% 72% 78% - 73% - -
Mean score 3.21 3.21 3.26 3.19 3.30 - 3.21 - -Standard deviation .87 .85 .88 .89 .91 - .87 - -Standard error .02 .03 .07 .04 .12 - .02 - -
Online fieldwork: 26th March - 15th April 2015 Prepared by ComRes Ltd
Page 249

Table 127/1
European Youth Survey - All marketsQ21_4. To what extent do you feel that your use of social media has improved your prospects of: Finding a job after your studiesBase: All students
COUNTRY GENDER AGE
Total Italy Germany France Spain UKEasternEurope Baltic Nordics Sweden Benelux Male Female 18-22 22-29
Unweighted Total 1613 153 173 111 150 103 124 157 295 163 184 770 843 907 706
Weighted Total 1783 176 199 121 161 131 161 170 308 175 182 842 941 1173 610100% 100% 100% 100% 100% 100% 100% 100% 100% 100% 100% 100% 100% 100% 100%
Not at all (1) 271 22 29 22 21 16 16 23 59 36 28 131 140 156 11515% 12% 15% 18% 13% 12% 10% 14% 19% 21% 15% 16% 15% 13% 19%
Not very much (2) 349 36 54 15 32 20 22 30 68 38 33 158 190 214 13520% 21% 27% 13% 20% 15% 14% 18% 22% 22% 18% 19% 20% 18% 22%
To some extent (3) 514 58 47 33 51 50 46 35 83 57 55 245 269 339 17529% 33% 23% 27% 32% 38% 29% 21% 27% 32% 30% 29% 29% 29% 29%
To a great extent (4) 253 21 18 25 35 29 35 28 21 20 22 138 115 183 7114% 12% 9% 20% 22% 22% 22% 17% 7% 11% 12% 16% 12% 16% 12%
Don't know 235 29 38 17 12 10 24 26 44 18 15 103 131 167 6713% 17% 19% 14% 8% 8% 15% 15% 14% 11% 8% 12% 14% 14% 11%
Not Applicable 161 10 14 8 10 6 19 27 33 6 28 66 95 114 479% 6% 7% 7% 6% 4% 12% 16% 11% 4% 16% 8% 10% 10% 8%
NETS
Net: No extent 620 58 83 37 53 36 38 54 127 74 61 289 331 370 25035% 33% 42% 31% 33% 27% 23% 32% 41% 42% 34% 34% 35% 32% 41%
Net: To an extent 768 79 64 58 86 79 81 64 104 76 77 384 384 522 24643% 45% 32% 48% 53% 60% 50% 38% 34% 44% 43% 46% 41% 44% 40%
Mean score 2.54 2.57 2.36 2.63 2.72 2.80 2.85 2.59 2.29 2.40 2.52 2.58 2.50 2.62 2.41Standard deviation 1.00 .93 .93 1.11 1.01 .97 .99 1.07 .95 .99 .99 1.02 .98 1.00 1.00Standard error .03 .09 .08 .12 .09 .10 .10 .10 .06 .08 .08 .04 .04 .04 .04
Online fieldwork: 26th March - 15th April 2015 Prepared by ComRes Ltd
Page 250

Table 127/2
European Youth Survey - All marketsQ21_4. To what extent do you feel that your use of social media has improved your prospects of: Finding a job after your studiesBase: All students
EDUCATION WORK STATUS
Total
Uppersecondary
or lessVocational
trainingUniversity
degreePostgraduate
degree Employees Students EntrepreneursNot
working
Unweighted Total 1613 894 182 451 59 - 1613 - -
Weighted Total 1783 1062 203 437 52 - 1783 - -100% 100% 100% 100% 100% - 100% - -
Not at all (1) 271 164 32 61 6 - 271 - -15% 15% 16% 14% 12% - 15% - -
Not very much (2) 349 213 36 85 9 - 349 - -20% 20% 18% 19% 17% - 20% - -
To some extent (3) 514 278 62 149 18 - 514 - -29% 26% 31% 34% 34% - 29% - -
To a great extent (4) 253 134 34 71 13 - 253 - -14% 13% 17% 16% 25% - 14% - -
Don't know 235 164 19 42 4 - 235 - -13% 15% 10% 10% 7% - 13% - -
Not Applicable 161 109 19 29 3 - 161 - -9% 10% 9% 7% 5% - 9% - -
NETS
Net: No extent 620 376 68 146 15 - 620 - -35% 35% 34% 33% 29% - 35% - -
Net: To an extent 768 412 96 220 31 - 768 - -43% 39% 47% 50% 59% - 43% - -
Mean score 2.54 2.48 2.59 2.63 2.82 - 2.54 - -Standard deviation 1.00 1.00 1.02 .98 1.01 - 1.00 - -Standard error .03 .04 .08 .05 .14 - .03 - -
Online fieldwork: 26th March - 15th April 2015 Prepared by ComRes Ltd
Page 251
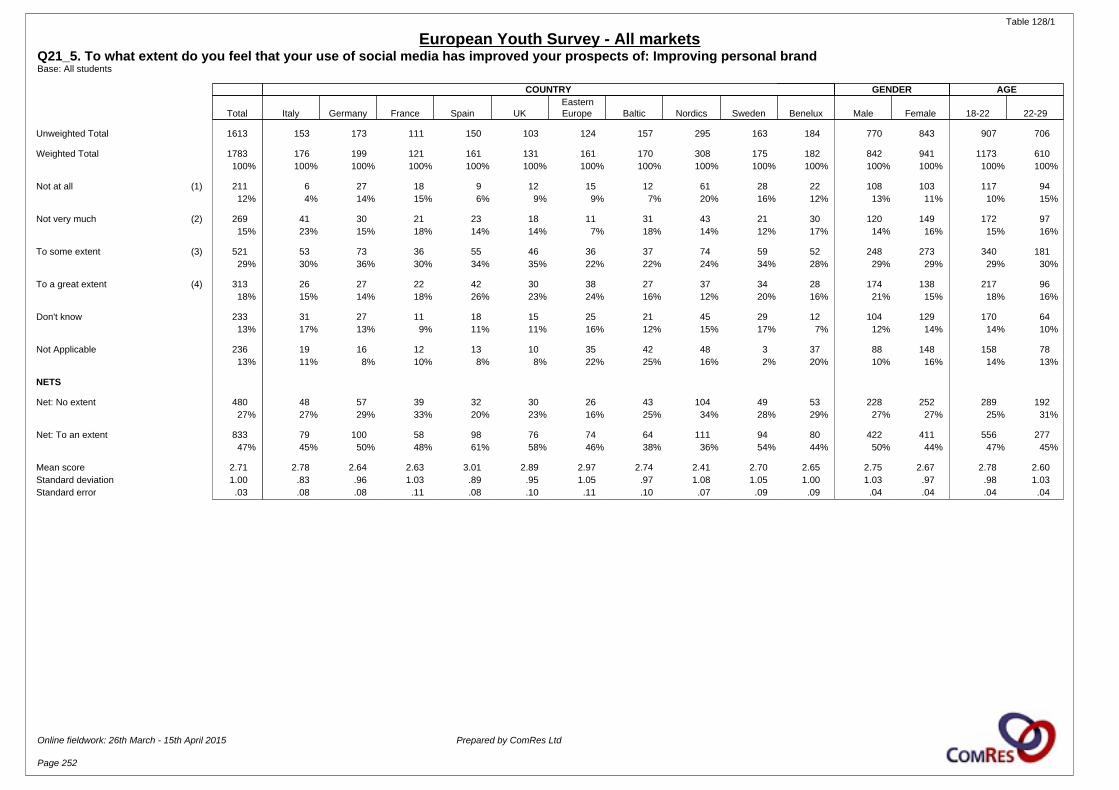
Table 128/1
European Youth Survey - All marketsQ21_5. To what extent do you feel that your use of social media has improved your prospects of: Improving personal brandBase: All students
COUNTRY GENDER AGE
Total Italy Germany France Spain UKEasternEurope Baltic Nordics Sweden Benelux Male Female 18-22 22-29
Unweighted Total 1613 153 173 111 150 103 124 157 295 163 184 770 843 907 706
Weighted Total 1783 176 199 121 161 131 161 170 308 175 182 842 941 1173 610100% 100% 100% 100% 100% 100% 100% 100% 100% 100% 100% 100% 100% 100% 100%
Not at all (1) 211 6 27 18 9 12 15 12 61 28 22 108 103 117 9412% 4% 14% 15% 6% 9% 9% 7% 20% 16% 12% 13% 11% 10% 15%
Not very much (2) 269 41 30 21 23 18 11 31 43 21 30 120 149 172 9715% 23% 15% 18% 14% 14% 7% 18% 14% 12% 17% 14% 16% 15% 16%
To some extent (3) 521 53 73 36 55 46 36 37 74 59 52 248 273 340 18129% 30% 36% 30% 34% 35% 22% 22% 24% 34% 28% 29% 29% 29% 30%
To a great extent (4) 313 26 27 22 42 30 38 27 37 34 28 174 138 217 9618% 15% 14% 18% 26% 23% 24% 16% 12% 20% 16% 21% 15% 18% 16%
Don't know 233 31 27 11 18 15 25 21 45 29 12 104 129 170 6413% 17% 13% 9% 11% 11% 16% 12% 15% 17% 7% 12% 14% 14% 10%
Not Applicable 236 19 16 12 13 10 35 42 48 3 37 88 148 158 7813% 11% 8% 10% 8% 8% 22% 25% 16% 2% 20% 10% 16% 14% 13%
NETS
Net: No extent 480 48 57 39 32 30 26 43 104 49 53 228 252 289 19227% 27% 29% 33% 20% 23% 16% 25% 34% 28% 29% 27% 27% 25% 31%
Net: To an extent 833 79 100 58 98 76 74 64 111 94 80 422 411 556 27747% 45% 50% 48% 61% 58% 46% 38% 36% 54% 44% 50% 44% 47% 45%
Mean score 2.71 2.78 2.64 2.63 3.01 2.89 2.97 2.74 2.41 2.70 2.65 2.75 2.67 2.78 2.60Standard deviation 1.00 .83 .96 1.03 .89 .95 1.05 .97 1.08 1.05 1.00 1.03 .97 .98 1.03Standard error .03 .08 .08 .11 .08 .10 .11 .10 .07 .09 .09 .04 .04 .04 .04
Online fieldwork: 26th March - 15th April 2015 Prepared by ComRes Ltd
Page 252

Table 128/2
European Youth Survey - All marketsQ21_5. To what extent do you feel that your use of social media has improved your prospects of: Improving personal brandBase: All students
EDUCATION WORK STATUS
Total
Uppersecondary
or lessVocational
trainingUniversity
degreePostgraduate
degree Employees Students EntrepreneursNot
working
Unweighted Total 1613 894 182 451 59 - 1613 - -
Weighted Total 1783 1062 203 437 52 - 1783 - -100% 100% 100% 100% 100% - 100% - -
Not at all (1) 211 123 23 58 2 - 211 - -12% 12% 12% 13% 4% - 12% - -
Not very much (2) 269 158 31 66 8 - 269 - -15% 15% 15% 15% 15% - 15% - -
To some extent (3) 521 301 64 134 17 - 521 - -29% 28% 32% 31% 33% - 29% - -
To a great extent (4) 313 166 34 89 16 - 313 - -18% 16% 17% 20% 31% - 18% - -
Don't know 233 160 29 38 2 - 233 - -13% 15% 14% 9% 5% - 13% - -
Not Applicable 236 154 21 52 6 - 236 - -13% 15% 11% 12% 11% - 13% - -
NETS
Net: No extent 480 281 54 124 10 - 480 - -27% 26% 27% 28% 20% - 27% - -
Net: To an extent 833 467 98 224 34 - 833 - -47% 44% 48% 51% 64% - 47% - -
Mean score 2.71 2.68 2.71 2.73 3.08 - 2.71 - -Standard deviation 1.00 1.00 .98 1.02 .88 - 1.00 - -Standard error .03 .04 .08 .05 .13 - .03 - -
Online fieldwork: 26th March - 15th April 2015 Prepared by ComRes Ltd
Page 253
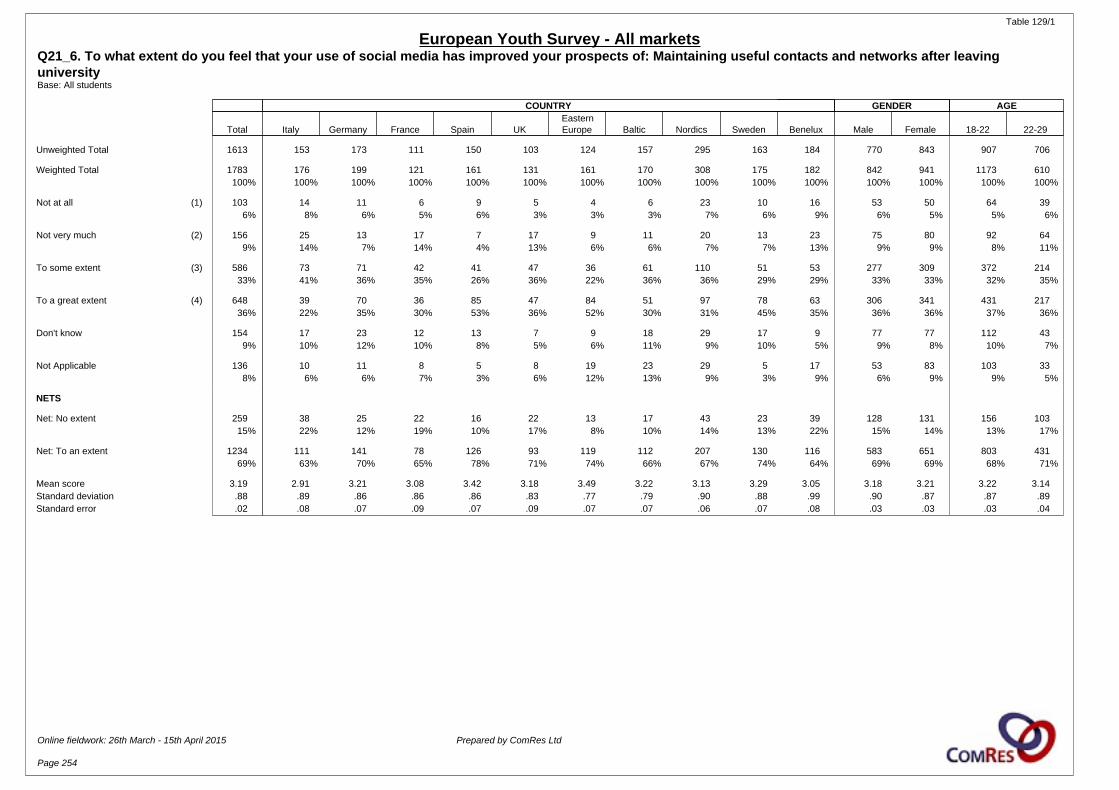
Table 129/1
European Youth Survey - All marketsQ21_6. To what extent do you feel that your use of social media has improved your prospects of: Maintaining useful contacts and networks after leaving universityBase: All students
COUNTRY GENDER AGE
Total Italy Germany France Spain UKEasternEurope Baltic Nordics Sweden Benelux Male Female 18-22 22-29
Unweighted Total 1613 153 173 111 150 103 124 157 295 163 184 770 843 907 706
Weighted Total 1783 176 199 121 161 131 161 170 308 175 182 842 941 1173 610100% 100% 100% 100% 100% 100% 100% 100% 100% 100% 100% 100% 100% 100% 100%
Not at all (1) 103 14 11 6 9 5 4 6 23 10 16 53 50 64 396% 8% 6% 5% 6% 3% 3% 3% 7% 6% 9% 6% 5% 5% 6%
Not very much (2) 156 25 13 17 7 17 9 11 20 13 23 75 80 92 649% 14% 7% 14% 4% 13% 6% 6% 7% 7% 13% 9% 9% 8% 11%
To some extent (3) 586 73 71 42 41 47 36 61 110 51 53 277 309 372 21433% 41% 36% 35% 26% 36% 22% 36% 36% 29% 29% 33% 33% 32% 35%
To a great extent (4) 648 39 70 36 85 47 84 51 97 78 63 306 341 431 21736% 22% 35% 30% 53% 36% 52% 30% 31% 45% 35% 36% 36% 37% 36%
Don't know 154 17 23 12 13 7 9 18 29 17 9 77 77 112 439% 10% 12% 10% 8% 5% 6% 11% 9% 10% 5% 9% 8% 10% 7%
Not Applicable 136 10 11 8 5 8 19 23 29 5 17 53 83 103 338% 6% 6% 7% 3% 6% 12% 13% 9% 3% 9% 6% 9% 9% 5%
NETS
Net: No extent 259 38 25 22 16 22 13 17 43 23 39 128 131 156 10315% 22% 12% 19% 10% 17% 8% 10% 14% 13% 22% 15% 14% 13% 17%
Net: To an extent 1234 111 141 78 126 93 119 112 207 130 116 583 651 803 43169% 63% 70% 65% 78% 71% 74% 66% 67% 74% 64% 69% 69% 68% 71%
Mean score 3.19 2.91 3.21 3.08 3.42 3.18 3.49 3.22 3.13 3.29 3.05 3.18 3.21 3.22 3.14Standard deviation .88 .89 .86 .86 .86 .83 .77 .79 .90 .88 .99 .90 .87 .87 .89Standard error .02 .08 .07 .09 .07 .09 .07 .07 .06 .07 .08 .03 .03 .03 .04
Online fieldwork: 26th March - 15th April 2015 Prepared by ComRes Ltd
Page 254
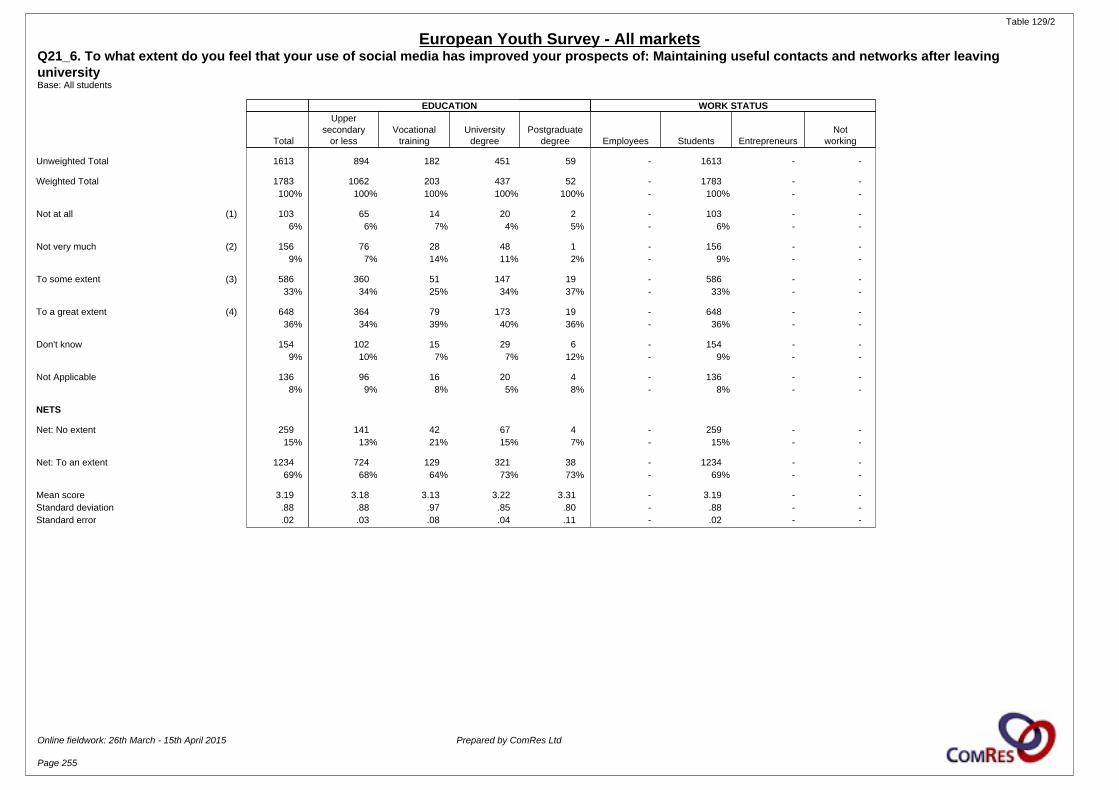
Table 129/2
European Youth Survey - All marketsQ21_6. To what extent do you feel that your use of social media has improved your prospects of: Maintaining useful contacts and networks after leaving universityBase: All students
EDUCATION WORK STATUS
Total
Uppersecondary
or lessVocational
trainingUniversity
degreePostgraduate
degree Employees Students EntrepreneursNot
working
Unweighted Total 1613 894 182 451 59 - 1613 - -
Weighted Total 1783 1062 203 437 52 - 1783 - -100% 100% 100% 100% 100% - 100% - -
Not at all (1) 103 65 14 20 2 - 103 - -6% 6% 7% 4% 5% - 6% - -
Not very much (2) 156 76 28 48 1 - 156 - -9% 7% 14% 11% 2% - 9% - -
To some extent (3) 586 360 51 147 19 - 586 - -33% 34% 25% 34% 37% - 33% - -
To a great extent (4) 648 364 79 173 19 - 648 - -36% 34% 39% 40% 36% - 36% - -
Don't know 154 102 15 29 6 - 154 - -9% 10% 7% 7% 12% - 9% - -
Not Applicable 136 96 16 20 4 - 136 - -8% 9% 8% 5% 8% - 8% - -
NETS
Net: No extent 259 141 42 67 4 - 259 - -15% 13% 21% 15% 7% - 15% - -
Net: To an extent 1234 724 129 321 38 - 1234 - -69% 68% 64% 73% 73% - 69% - -
Mean score 3.19 3.18 3.13 3.22 3.31 - 3.19 - -Standard deviation .88 .88 .97 .85 .80 - .88 - -Standard error .02 .03 .08 .04 .11 - .02 - -
Online fieldwork: 26th March - 15th April 2015 Prepared by ComRes Ltd
Page 255

Table 130/1
European Youth Survey - All marketsQ22_1. For each pair, please pick the statement you most agree with.Base: All respondents
COUNTRY GENDER AGE
Total Italy Germany France Spain UKEasternEurope Baltic Nordics Sweden Benelux Male Female 18-22 22-29
Unweighted Total 5024 502 502 500 500 504 501 507 605 402 501 2492 2532 1527 3497
Weighted Total 5024 502 502 500 500 504 501 507 605 402 501 2472 2552 1996 3028100% 100% 100% 100% 100% 100% 100% 100% 100% 100% 100% 100% 100% 100% 100%
Social networks have helped my careerby increasing the possibility to find newopportunities 1445 149 100 140 245 186 161 130 130 100 104 752 692 608 837
29% 30% 20% 28% 49% 37% 32% 26% 22% 25% 21% 30% 27% 30% 28%
Social networks have hindered mycareer because they require too muchtime that could be better spent 826 75 102 87 77 76 63 108 87 69 81 459 366 389 436
16% 15% 20% 17% 15% 15% 13% 21% 14% 17% 16% 19% 14% 20% 14%
Don't know 820 100 81 80 33 62 61 60 152 107 82 369 450 361 45916% 20% 16% 16% 7% 12% 12% 12% 25% 27% 16% 15% 18% 18% 15%
Not applicable 1934 178 218 194 144 179 215 210 235 126 235 891 1043 638 129638% 36% 44% 39% 29% 36% 43% 41% 39% 31% 47% 36% 41% 32% 43%
Online fieldwork: 26th March - 15th April 2015 Prepared by ComRes Ltd
Page 256
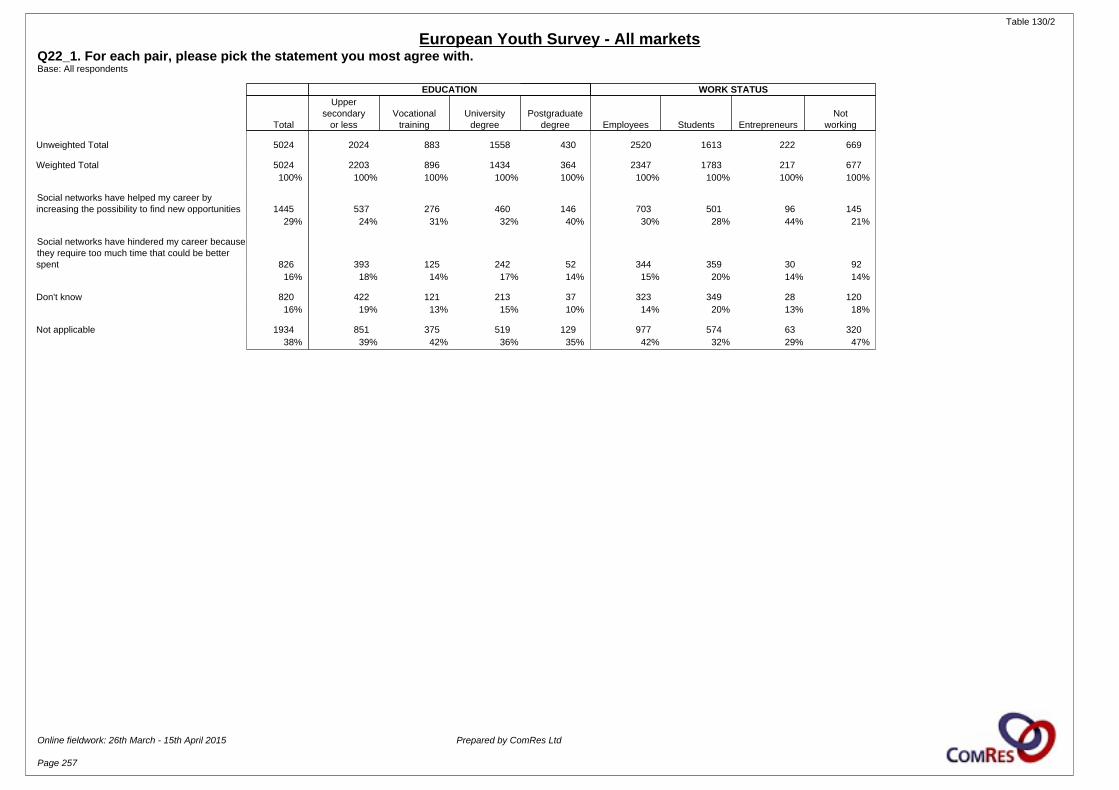
Table 130/2
European Youth Survey - All marketsQ22_1. For each pair, please pick the statement you most agree with.Base: All respondents
EDUCATION WORK STATUS
Total
Uppersecondary
or lessVocational
trainingUniversity
degreePostgraduate
degree Employees Students EntrepreneursNot
working
Unweighted Total 5024 2024 883 1558 430 2520 1613 222 669
Weighted Total 5024 2203 896 1434 364 2347 1783 217 677100% 100% 100% 100% 100% 100% 100% 100% 100%
Social networks have helped my career byincreasing the possibility to find new opportunities 1445 537 276 460 146 703 501 96 145
29% 24% 31% 32% 40% 30% 28% 44% 21%
Social networks have hindered my career becausethey require too much time that could be betterspent 826 393 125 242 52 344 359 30 92
16% 18% 14% 17% 14% 15% 20% 14% 14%
Don't know 820 422 121 213 37 323 349 28 12016% 19% 13% 15% 10% 14% 20% 13% 18%
Not applicable 1934 851 375 519 129 977 574 63 32038% 39% 42% 36% 35% 42% 32% 29% 47%
Online fieldwork: 26th March - 15th April 2015 Prepared by ComRes Ltd
Page 257
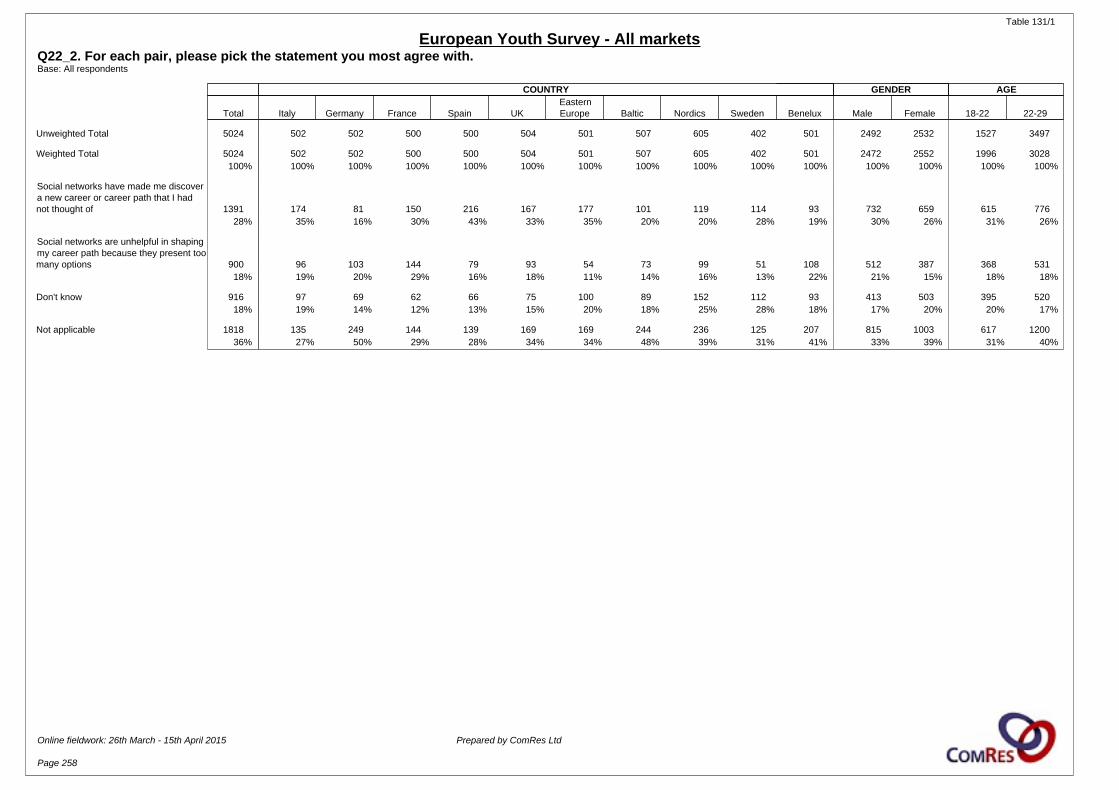
Table 131/1
European Youth Survey - All marketsQ22_2. For each pair, please pick the statement you most agree with.Base: All respondents
COUNTRY GENDER AGE
Total Italy Germany France Spain UKEasternEurope Baltic Nordics Sweden Benelux Male Female 18-22 22-29
Unweighted Total 5024 502 502 500 500 504 501 507 605 402 501 2492 2532 1527 3497
Weighted Total 5024 502 502 500 500 504 501 507 605 402 501 2472 2552 1996 3028100% 100% 100% 100% 100% 100% 100% 100% 100% 100% 100% 100% 100% 100% 100%
Social networks have made me discovera new career or career path that I hadnot thought of 1391 174 81 150 216 167 177 101 119 114 93 732 659 615 776
28% 35% 16% 30% 43% 33% 35% 20% 20% 28% 19% 30% 26% 31% 26%
Social networks are unhelpful in shapingmy career path because they present toomany options 900 96 103 144 79 93 54 73 99 51 108 512 387 368 531
18% 19% 20% 29% 16% 18% 11% 14% 16% 13% 22% 21% 15% 18% 18%
Don't know 916 97 69 62 66 75 100 89 152 112 93 413 503 395 52018% 19% 14% 12% 13% 15% 20% 18% 25% 28% 18% 17% 20% 20% 17%
Not applicable 1818 135 249 144 139 169 169 244 236 125 207 815 1003 617 120036% 27% 50% 29% 28% 34% 34% 48% 39% 31% 41% 33% 39% 31% 40%
Online fieldwork: 26th March - 15th April 2015 Prepared by ComRes Ltd
Page 258
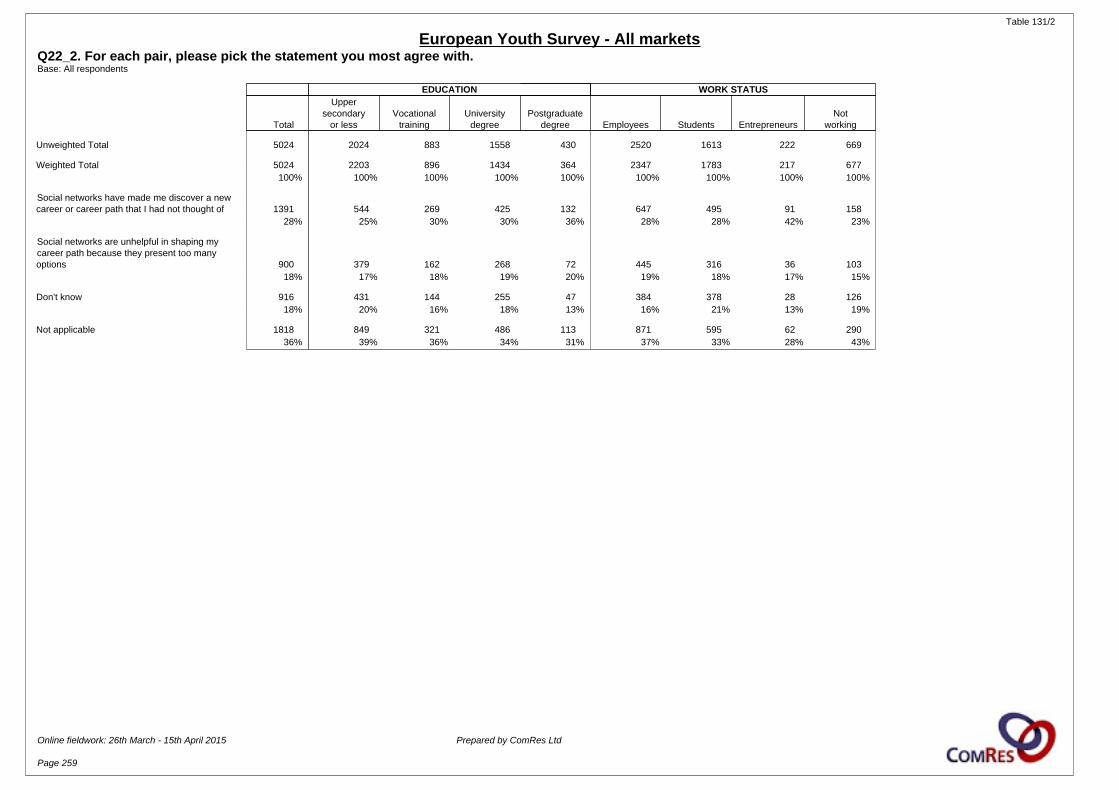
Table 131/2
European Youth Survey - All marketsQ22_2. For each pair, please pick the statement you most agree with.Base: All respondents
EDUCATION WORK STATUS
Total
Uppersecondary
or lessVocational
trainingUniversity
degreePostgraduate
degree Employees Students EntrepreneursNot
working
Unweighted Total 5024 2024 883 1558 430 2520 1613 222 669
Weighted Total 5024 2203 896 1434 364 2347 1783 217 677100% 100% 100% 100% 100% 100% 100% 100% 100%
Social networks have made me discover a newcareer or career path that I had not thought of 1391 544 269 425 132 647 495 91 158
28% 25% 30% 30% 36% 28% 28% 42% 23%
Social networks are unhelpful in shaping mycareer path because they present too manyoptions 900 379 162 268 72 445 316 36 103
18% 17% 18% 19% 20% 19% 18% 17% 15%
Don't know 916 431 144 255 47 384 378 28 12618% 20% 16% 18% 13% 16% 21% 13% 19%
Not applicable 1818 849 321 486 113 871 595 62 29036% 39% 36% 34% 31% 37% 33% 28% 43%
Online fieldwork: 26th March - 15th April 2015 Prepared by ComRes Ltd
Page 259
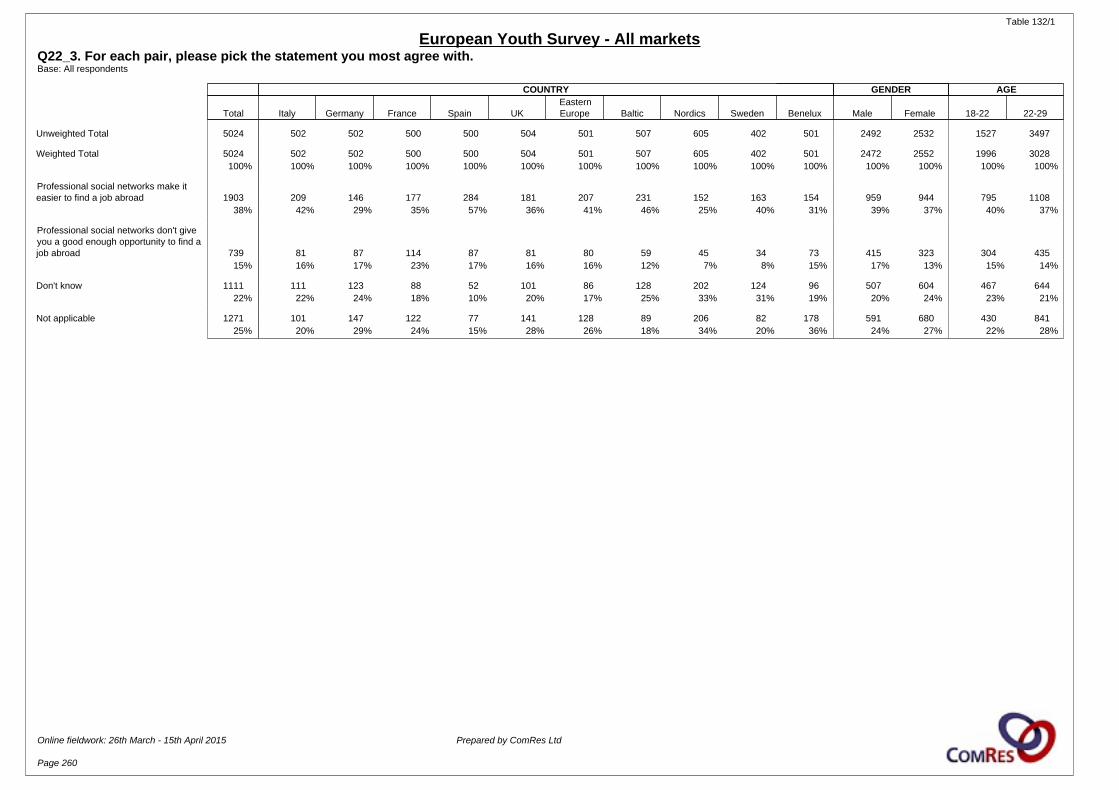
Table 132/1
European Youth Survey - All marketsQ22_3. For each pair, please pick the statement you most agree with.Base: All respondents
COUNTRY GENDER AGE
Total Italy Germany France Spain UKEasternEurope Baltic Nordics Sweden Benelux Male Female 18-22 22-29
Unweighted Total 5024 502 502 500 500 504 501 507 605 402 501 2492 2532 1527 3497
Weighted Total 5024 502 502 500 500 504 501 507 605 402 501 2472 2552 1996 3028100% 100% 100% 100% 100% 100% 100% 100% 100% 100% 100% 100% 100% 100% 100%
Professional social networks make iteasier to find a job abroad 1903 209 146 177 284 181 207 231 152 163 154 959 944 795 1108
38% 42% 29% 35% 57% 36% 41% 46% 25% 40% 31% 39% 37% 40% 37%
Professional social networks don't giveyou a good enough opportunity to find ajob abroad 739 81 87 114 87 81 80 59 45 34 73 415 323 304 435
15% 16% 17% 23% 17% 16% 16% 12% 7% 8% 15% 17% 13% 15% 14%
Don't know 1111 111 123 88 52 101 86 128 202 124 96 507 604 467 64422% 22% 24% 18% 10% 20% 17% 25% 33% 31% 19% 20% 24% 23% 21%
Not applicable 1271 101 147 122 77 141 128 89 206 82 178 591 680 430 84125% 20% 29% 24% 15% 28% 26% 18% 34% 20% 36% 24% 27% 22% 28%
Online fieldwork: 26th March - 15th April 2015 Prepared by ComRes Ltd
Page 260
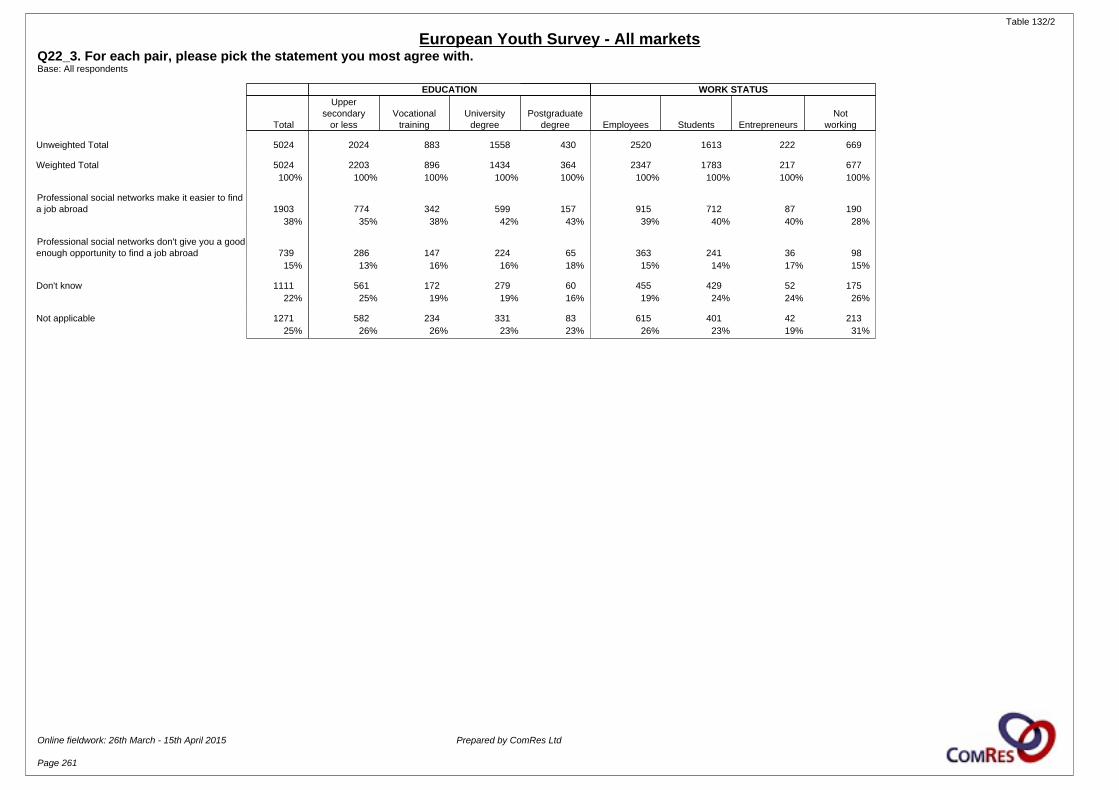
Table 132/2
European Youth Survey - All marketsQ22_3. For each pair, please pick the statement you most agree with.Base: All respondents
EDUCATION WORK STATUS
Total
Uppersecondary
or lessVocational
trainingUniversity
degreePostgraduate
degree Employees Students EntrepreneursNot
working
Unweighted Total 5024 2024 883 1558 430 2520 1613 222 669
Weighted Total 5024 2203 896 1434 364 2347 1783 217 677100% 100% 100% 100% 100% 100% 100% 100% 100%
Professional social networks make it easier to finda job abroad 1903 774 342 599 157 915 712 87 190
38% 35% 38% 42% 43% 39% 40% 40% 28%
Professional social networks don't give you a goodenough opportunity to find a job abroad 739 286 147 224 65 363 241 36 98
15% 13% 16% 16% 18% 15% 14% 17% 15%
Don't know 1111 561 172 279 60 455 429 52 17522% 25% 19% 19% 16% 19% 24% 24% 26%
Not applicable 1271 582 234 331 83 615 401 42 21325% 26% 26% 23% 23% 26% 23% 19% 31%
Online fieldwork: 26th March - 15th April 2015 Prepared by ComRes Ltd
Page 261
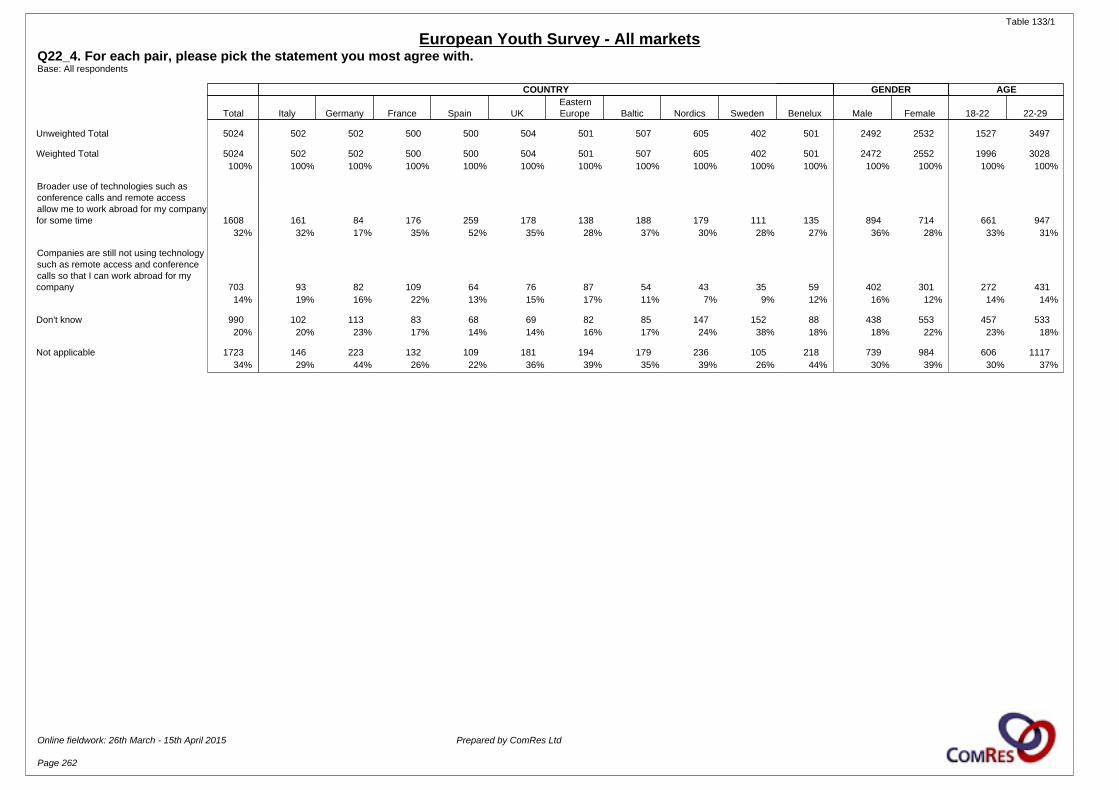
Table 133/1
European Youth Survey - All marketsQ22_4. For each pair, please pick the statement you most agree with.Base: All respondents
COUNTRY GENDER AGE
Total Italy Germany France Spain UKEasternEurope Baltic Nordics Sweden Benelux Male Female 18-22 22-29
Unweighted Total 5024 502 502 500 500 504 501 507 605 402 501 2492 2532 1527 3497
Weighted Total 5024 502 502 500 500 504 501 507 605 402 501 2472 2552 1996 3028100% 100% 100% 100% 100% 100% 100% 100% 100% 100% 100% 100% 100% 100% 100%
Broader use of technologies such asconference calls and remote accessallow me to work abroad for my companyfor some time 1608 161 84 176 259 178 138 188 179 111 135 894 714 661 947
32% 32% 17% 35% 52% 35% 28% 37% 30% 28% 27% 36% 28% 33% 31%
Companies are still not using technologysuch as remote access and conferencecalls so that I can work abroad for mycompany 703 93 82 109 64 76 87 54 43 35 59 402 301 272 431
14% 19% 16% 22% 13% 15% 17% 11% 7% 9% 12% 16% 12% 14% 14%
Don't know 990 102 113 83 68 69 82 85 147 152 88 438 553 457 53320% 20% 23% 17% 14% 14% 16% 17% 24% 38% 18% 18% 22% 23% 18%
Not applicable 1723 146 223 132 109 181 194 179 236 105 218 739 984 606 111734% 29% 44% 26% 22% 36% 39% 35% 39% 26% 44% 30% 39% 30% 37%
Online fieldwork: 26th March - 15th April 2015 Prepared by ComRes Ltd
Page 262
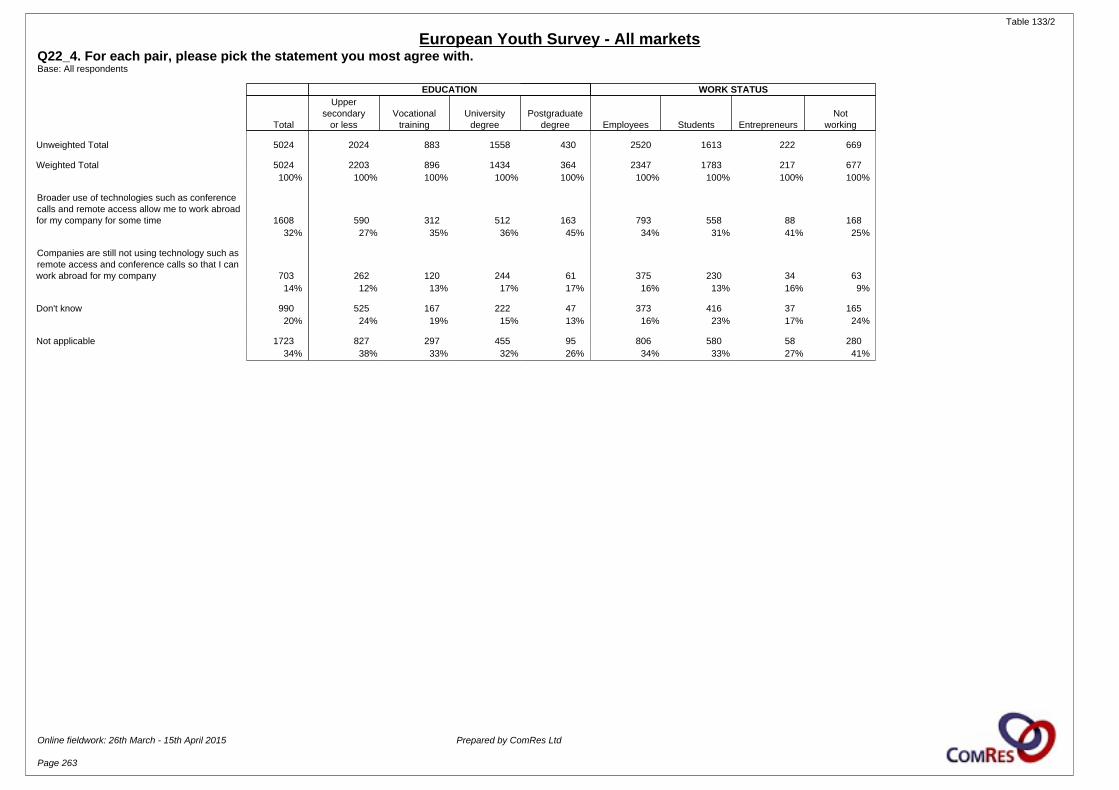
Table 133/2
European Youth Survey - All marketsQ22_4. For each pair, please pick the statement you most agree with.Base: All respondents
EDUCATION WORK STATUS
Total
Uppersecondary
or lessVocational
trainingUniversity
degreePostgraduate
degree Employees Students EntrepreneursNot
working
Unweighted Total 5024 2024 883 1558 430 2520 1613 222 669
Weighted Total 5024 2203 896 1434 364 2347 1783 217 677100% 100% 100% 100% 100% 100% 100% 100% 100%
Broader use of technologies such as conferencecalls and remote access allow me to work abroadfor my company for some time 1608 590 312 512 163 793 558 88 168
32% 27% 35% 36% 45% 34% 31% 41% 25%
Companies are still not using technology such asremote access and conference calls so that I canwork abroad for my company 703 262 120 244 61 375 230 34 63
14% 12% 13% 17% 17% 16% 13% 16% 9%
Don't know 990 525 167 222 47 373 416 37 16520% 24% 19% 15% 13% 16% 23% 17% 24%
Not applicable 1723 827 297 455 95 806 580 58 28034% 38% 33% 32% 26% 34% 33% 27% 41%
Online fieldwork: 26th March - 15th April 2015 Prepared by ComRes Ltd
Page 263
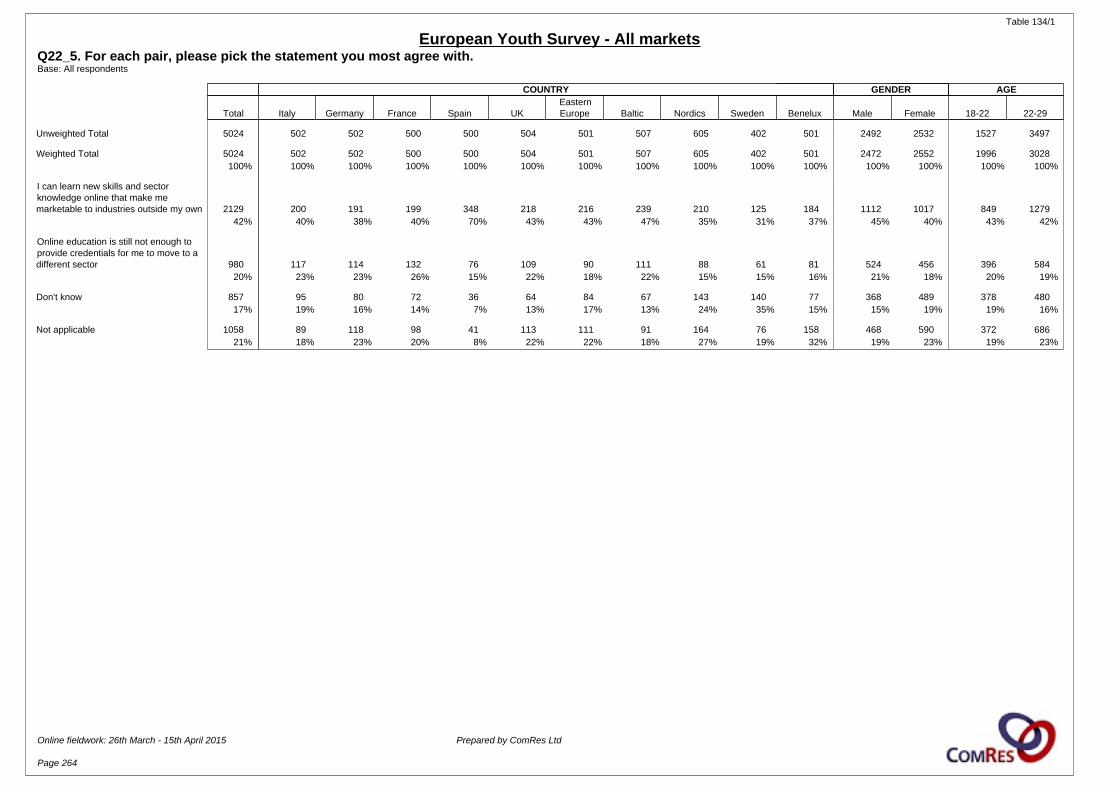
Table 134/1
European Youth Survey - All marketsQ22_5. For each pair, please pick the statement you most agree with.Base: All respondents
COUNTRY GENDER AGE
Total Italy Germany France Spain UKEasternEurope Baltic Nordics Sweden Benelux Male Female 18-22 22-29
Unweighted Total 5024 502 502 500 500 504 501 507 605 402 501 2492 2532 1527 3497
Weighted Total 5024 502 502 500 500 504 501 507 605 402 501 2472 2552 1996 3028100% 100% 100% 100% 100% 100% 100% 100% 100% 100% 100% 100% 100% 100% 100%
I can learn new skills and sectorknowledge online that make memarketable to industries outside my own 2129 200 191 199 348 218 216 239 210 125 184 1112 1017 849 1279
42% 40% 38% 40% 70% 43% 43% 47% 35% 31% 37% 45% 40% 43% 42%
Online education is still not enough toprovide credentials for me to move to adifferent sector 980 117 114 132 76 109 90 111 88 61 81 524 456 396 584
20% 23% 23% 26% 15% 22% 18% 22% 15% 15% 16% 21% 18% 20% 19%
Don't know 857 95 80 72 36 64 84 67 143 140 77 368 489 378 48017% 19% 16% 14% 7% 13% 17% 13% 24% 35% 15% 15% 19% 19% 16%
Not applicable 1058 89 118 98 41 113 111 91 164 76 158 468 590 372 68621% 18% 23% 20% 8% 22% 22% 18% 27% 19% 32% 19% 23% 19% 23%
Online fieldwork: 26th March - 15th April 2015 Prepared by ComRes Ltd
Page 264
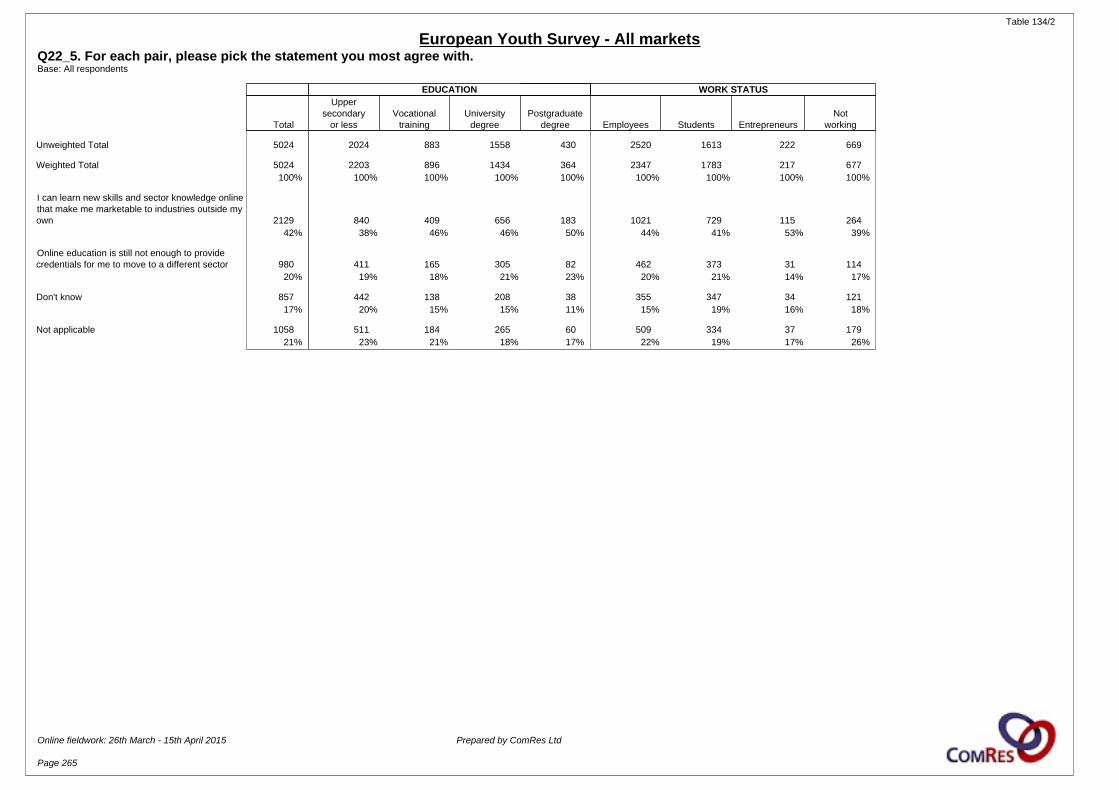
Table 134/2
European Youth Survey - All marketsQ22_5. For each pair, please pick the statement you most agree with.Base: All respondents
EDUCATION WORK STATUS
Total
Uppersecondary
or lessVocational
trainingUniversity
degreePostgraduate
degree Employees Students EntrepreneursNot
working
Unweighted Total 5024 2024 883 1558 430 2520 1613 222 669
Weighted Total 5024 2203 896 1434 364 2347 1783 217 677100% 100% 100% 100% 100% 100% 100% 100% 100%
I can learn new skills and sector knowledge onlinethat make me marketable to industries outside myown 2129 840 409 656 183 1021 729 115 264
42% 38% 46% 46% 50% 44% 41% 53% 39%
Online education is still not enough to providecredentials for me to move to a different sector 980 411 165 305 82 462 373 31 114
20% 19% 18% 21% 23% 20% 21% 14% 17%
Don't know 857 442 138 208 38 355 347 34 12117% 20% 15% 15% 11% 15% 19% 16% 18%
Not applicable 1058 511 184 265 60 509 334 37 17921% 23% 21% 18% 17% 22% 19% 17% 26%
Online fieldwork: 26th March - 15th April 2015 Prepared by ComRes Ltd
Page 265
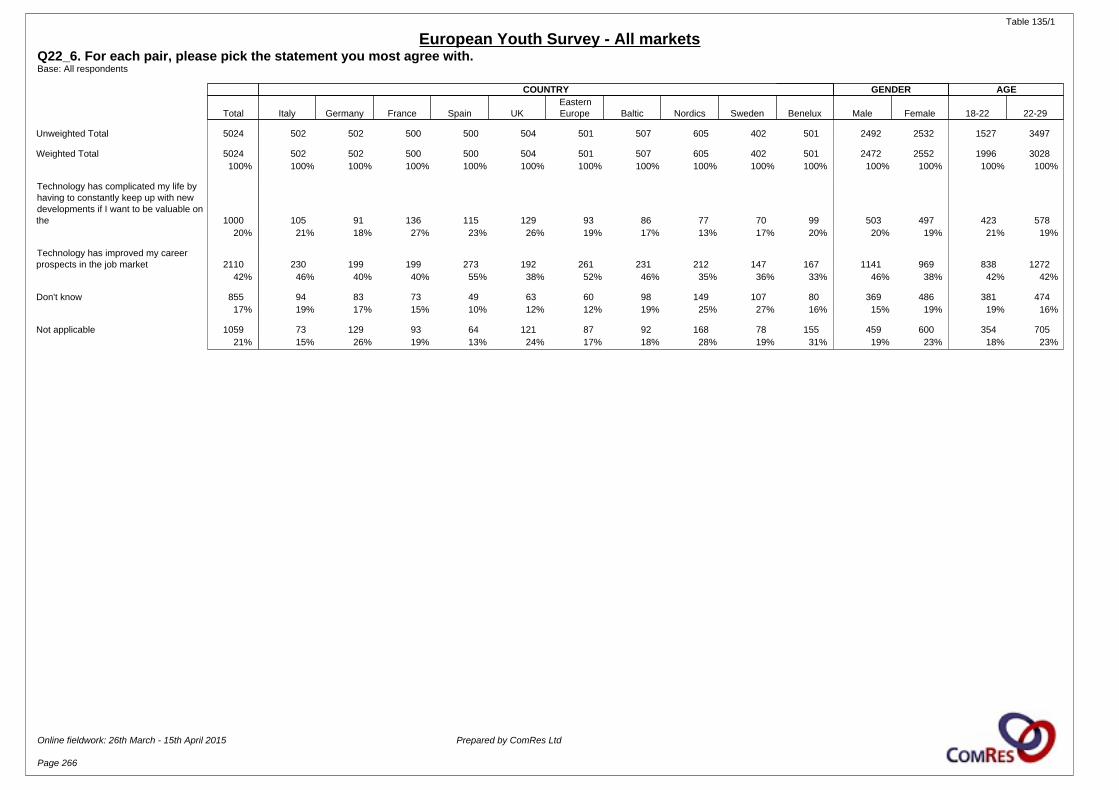
Table 135/1
European Youth Survey - All marketsQ22_6. For each pair, please pick the statement you most agree with.Base: All respondents
COUNTRY GENDER AGE
Total Italy Germany France Spain UKEasternEurope Baltic Nordics Sweden Benelux Male Female 18-22 22-29
Unweighted Total 5024 502 502 500 500 504 501 507 605 402 501 2492 2532 1527 3497
Weighted Total 5024 502 502 500 500 504 501 507 605 402 501 2472 2552 1996 3028100% 100% 100% 100% 100% 100% 100% 100% 100% 100% 100% 100% 100% 100% 100%
Technology has complicated my life byhaving to constantly keep up with newdevelopments if I want to be valuable onthe 1000 105 91 136 115 129 93 86 77 70 99 503 497 423 578
20% 21% 18% 27% 23% 26% 19% 17% 13% 17% 20% 20% 19% 21% 19%
Technology has improved my careerprospects in the job market 2110 230 199 199 273 192 261 231 212 147 167 1141 969 838 1272
42% 46% 40% 40% 55% 38% 52% 46% 35% 36% 33% 46% 38% 42% 42%
Don't know 855 94 83 73 49 63 60 98 149 107 80 369 486 381 47417% 19% 17% 15% 10% 12% 12% 19% 25% 27% 16% 15% 19% 19% 16%
Not applicable 1059 73 129 93 64 121 87 92 168 78 155 459 600 354 70521% 15% 26% 19% 13% 24% 17% 18% 28% 19% 31% 19% 23% 18% 23%
Online fieldwork: 26th March - 15th April 2015 Prepared by ComRes Ltd
Page 266

Table 135/2
European Youth Survey - All marketsQ22_6. For each pair, please pick the statement you most agree with.Base: All respondents
EDUCATION WORK STATUS
Total
Uppersecondary
or lessVocational
trainingUniversity
degreePostgraduate
degree Employees Students EntrepreneursNot
working
Unweighted Total 5024 2024 883 1558 430 2520 1613 222 669
Weighted Total 5024 2203 896 1434 364 2347 1783 217 677100% 100% 100% 100% 100% 100% 100% 100% 100%
Technology has complicated my life by having toconstantly keep up with new developments if Iwant to be valuable on the 1000 384 222 289 84 492 337 44 128
20% 17% 25% 20% 23% 21% 19% 20% 19%
Technology has improved my career prospects inthe job market 2110 852 353 682 187 966 782 116 245
42% 39% 39% 48% 51% 41% 44% 53% 36%
Don't know 855 472 128 189 36 355 344 27 13017% 21% 14% 13% 10% 15% 19% 12% 19%
Not applicable 1059 495 193 275 57 534 320 30 17421% 22% 21% 19% 16% 23% 18% 14% 26%
Online fieldwork: 26th March - 15th April 2015 Prepared by ComRes Ltd
Page 267
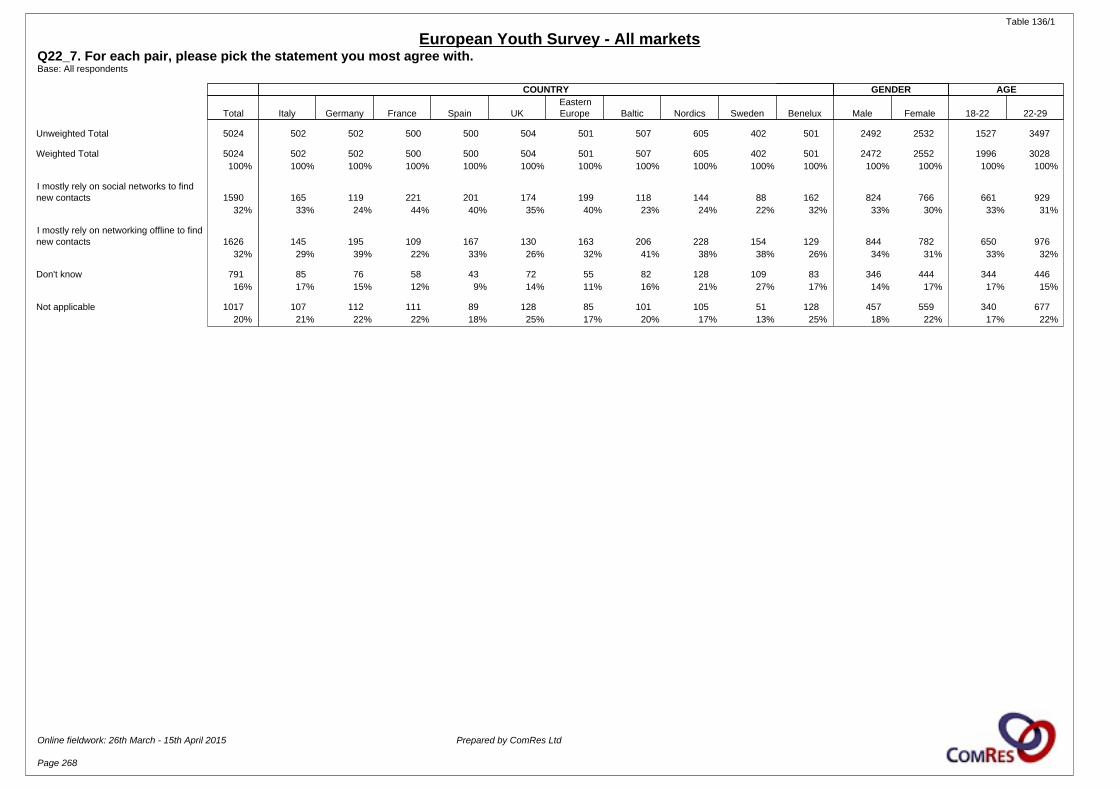
Table 136/1
European Youth Survey - All marketsQ22_7. For each pair, please pick the statement you most agree with.Base: All respondents
COUNTRY GENDER AGE
Total Italy Germany France Spain UKEasternEurope Baltic Nordics Sweden Benelux Male Female 18-22 22-29
Unweighted Total 5024 502 502 500 500 504 501 507 605 402 501 2492 2532 1527 3497
Weighted Total 5024 502 502 500 500 504 501 507 605 402 501 2472 2552 1996 3028100% 100% 100% 100% 100% 100% 100% 100% 100% 100% 100% 100% 100% 100% 100%
I mostly rely on social networks to findnew contacts 1590 165 119 221 201 174 199 118 144 88 162 824 766 661 929
32% 33% 24% 44% 40% 35% 40% 23% 24% 22% 32% 33% 30% 33% 31%
I mostly rely on networking offline to findnew contacts 1626 145 195 109 167 130 163 206 228 154 129 844 782 650 976
32% 29% 39% 22% 33% 26% 32% 41% 38% 38% 26% 34% 31% 33% 32%
Don't know 791 85 76 58 43 72 55 82 128 109 83 346 444 344 44616% 17% 15% 12% 9% 14% 11% 16% 21% 27% 17% 14% 17% 17% 15%
Not applicable 1017 107 112 111 89 128 85 101 105 51 128 457 559 340 67720% 21% 22% 22% 18% 25% 17% 20% 17% 13% 25% 18% 22% 17% 22%
Online fieldwork: 26th March - 15th April 2015 Prepared by ComRes Ltd
Page 268
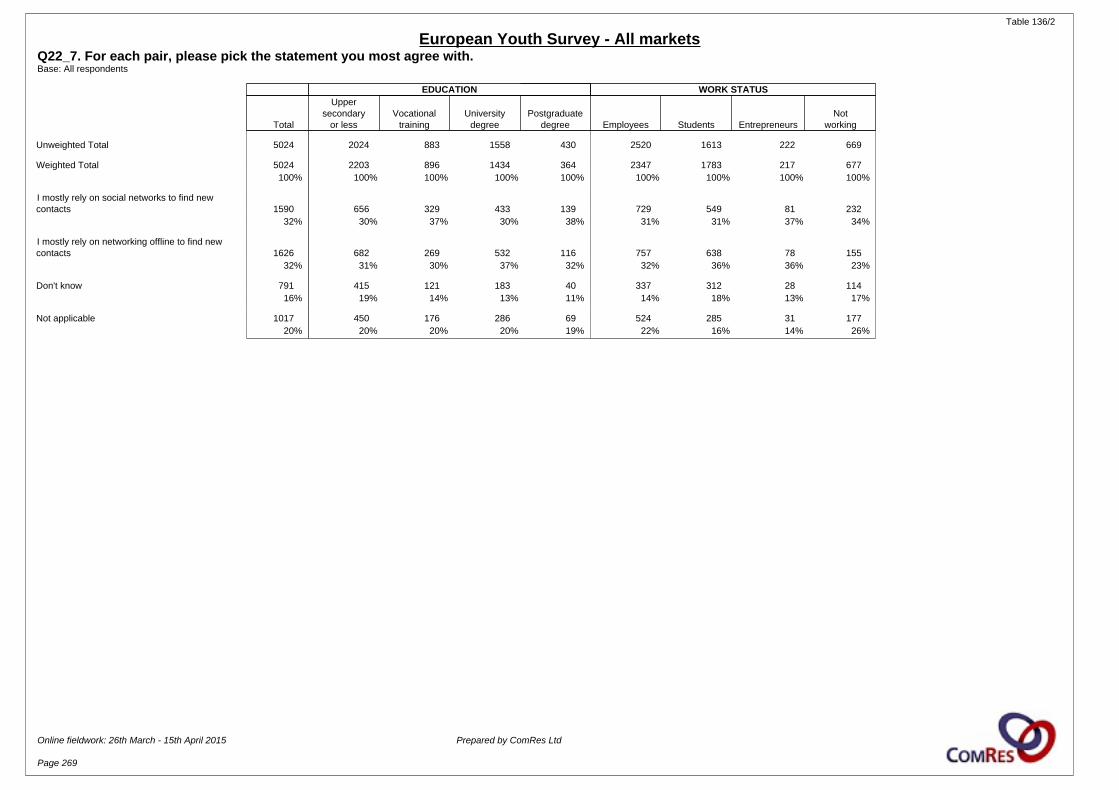
Table 136/2
European Youth Survey - All marketsQ22_7. For each pair, please pick the statement you most agree with.Base: All respondents
EDUCATION WORK STATUS
Total
Uppersecondary
or lessVocational
trainingUniversity
degreePostgraduate
degree Employees Students EntrepreneursNot
working
Unweighted Total 5024 2024 883 1558 430 2520 1613 222 669
Weighted Total 5024 2203 896 1434 364 2347 1783 217 677100% 100% 100% 100% 100% 100% 100% 100% 100%
I mostly rely on social networks to find newcontacts 1590 656 329 433 139 729 549 81 232
32% 30% 37% 30% 38% 31% 31% 37% 34%
I mostly rely on networking offline to find newcontacts 1626 682 269 532 116 757 638 78 155
32% 31% 30% 37% 32% 32% 36% 36% 23%
Don't know 791 415 121 183 40 337 312 28 11416% 19% 14% 13% 11% 14% 18% 13% 17%
Not applicable 1017 450 176 286 69 524 285 31 17720% 20% 20% 20% 19% 22% 16% 14% 26%
Online fieldwork: 26th March - 15th April 2015 Prepared by ComRes Ltd
Page 269
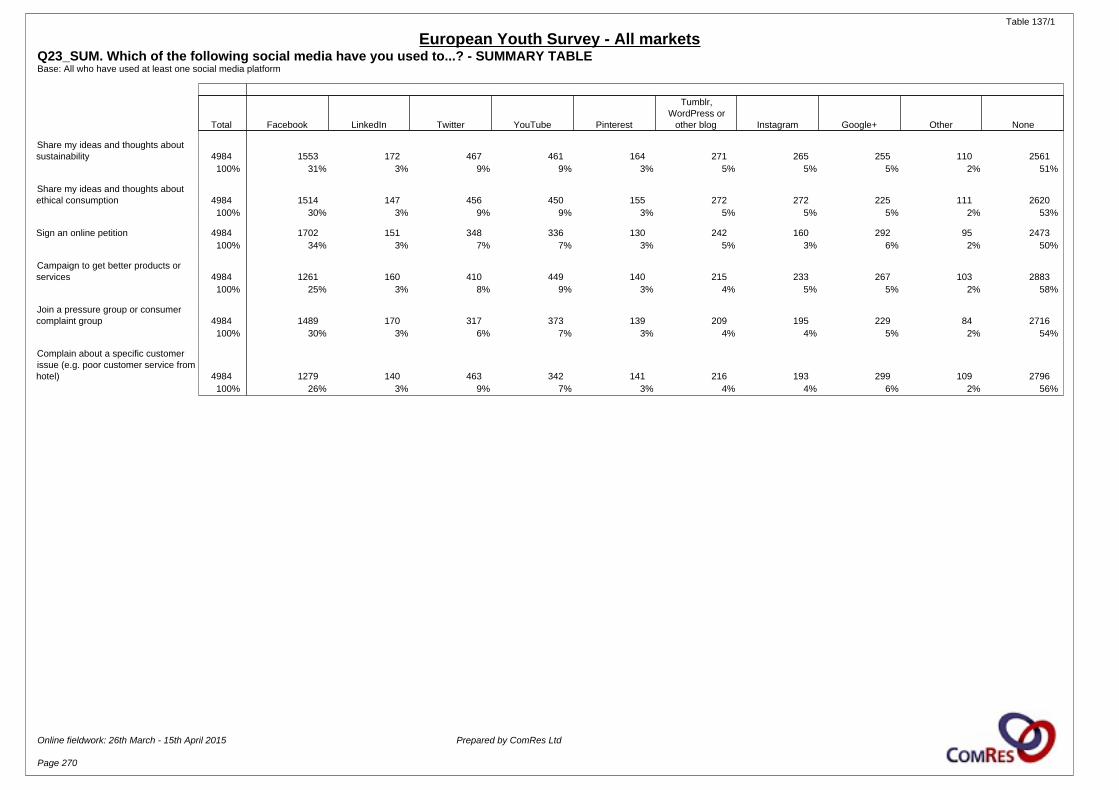
Table 137/1
European Youth Survey - All marketsQ23_SUM. Which of the following social media have you used to...? - SUMMARY TABLEBase: All who have used at least one social media platform
Total Facebook LinkedIn Twitter YouTube Pinterest
Tumblr,WordPress or
other blog Instagram Google+ Other None
Share my ideas and thoughts aboutsustainability 4984 1553 172 467 461 164 271 265 255 110 2561
100% 31% 3% 9% 9% 3% 5% 5% 5% 2% 51%
Share my ideas and thoughts aboutethical consumption 4984 1514 147 456 450 155 272 272 225 111 2620
100% 30% 3% 9% 9% 3% 5% 5% 5% 2% 53%
Sign an online petition 4984 1702 151 348 336 130 242 160 292 95 2473100% 34% 3% 7% 7% 3% 5% 3% 6% 2% 50%
Campaign to get better products orservices 4984 1261 160 410 449 140 215 233 267 103 2883
100% 25% 3% 8% 9% 3% 4% 5% 5% 2% 58%
Join a pressure group or consumercomplaint group 4984 1489 170 317 373 139 209 195 229 84 2716
100% 30% 3% 6% 7% 3% 4% 4% 5% 2% 54%
Complain about a specific customerissue (e.g. poor customer service fromhotel) 4984 1279 140 463 342 141 216 193 299 109 2796
100% 26% 3% 9% 7% 3% 4% 4% 6% 2% 56%
Online fieldwork: 26th March - 15th April 2015 Prepared by ComRes Ltd
Page 270
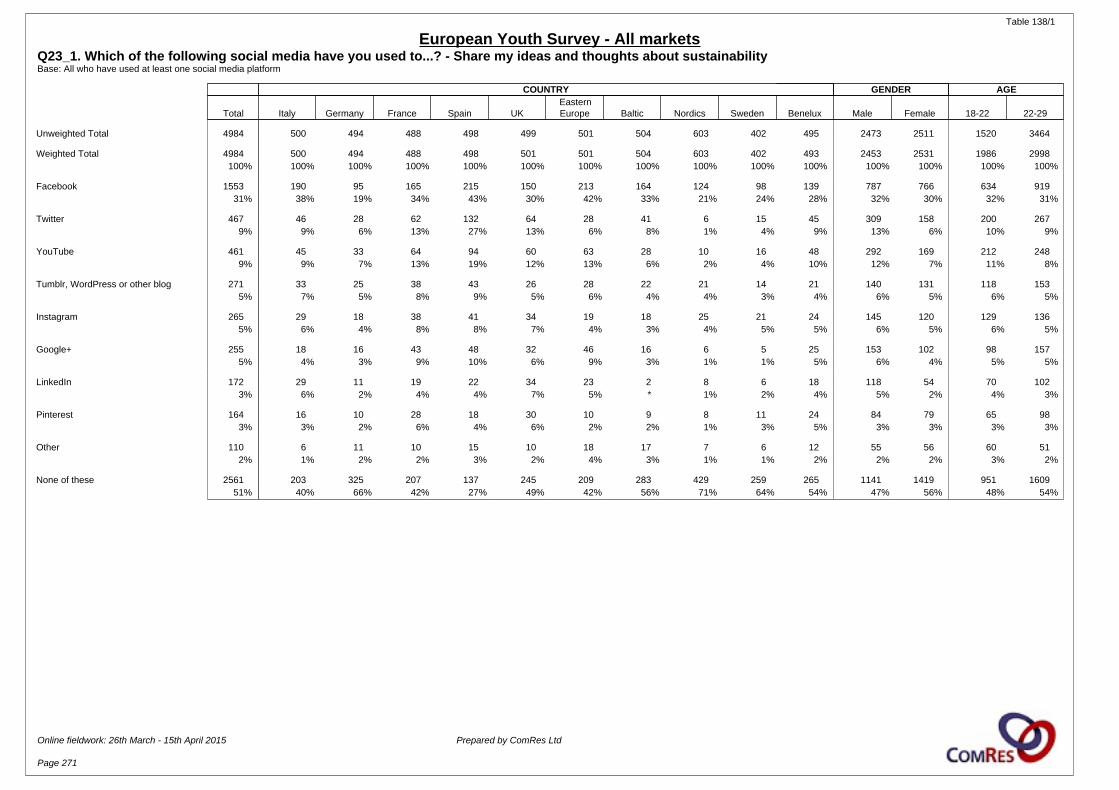
Table 138/1
European Youth Survey - All marketsQ23_1. Which of the following social media have you used to...? - Share my ideas and thoughts about sustainabilityBase: All who have used at least one social media platform
COUNTRY GENDER AGE
Total Italy Germany France Spain UKEasternEurope Baltic Nordics Sweden Benelux Male Female 18-22 22-29
Unweighted Total 4984 500 494 488 498 499 501 504 603 402 495 2473 2511 1520 3464
Weighted Total 4984 500 494 488 498 501 501 504 603 402 493 2453 2531 1986 2998100% 100% 100% 100% 100% 100% 100% 100% 100% 100% 100% 100% 100% 100% 100%
Facebook 1553 190 95 165 215 150 213 164 124 98 139 787 766 634 91931% 38% 19% 34% 43% 30% 42% 33% 21% 24% 28% 32% 30% 32% 31%
Twitter 467 46 28 62 132 64 28 41 6 15 45 309 158 200 2679% 9% 6% 13% 27% 13% 6% 8% 1% 4% 9% 13% 6% 10% 9%
YouTube 461 45 33 64 94 60 63 28 10 16 48 292 169 212 2489% 9% 7% 13% 19% 12% 13% 6% 2% 4% 10% 12% 7% 11% 8%
Tumblr, WordPress or other blog 271 33 25 38 43 26 28 22 21 14 21 140 131 118 1535% 7% 5% 8% 9% 5% 6% 4% 4% 3% 4% 6% 5% 6% 5%
Instagram 265 29 18 38 41 34 19 18 25 21 24 145 120 129 1365% 6% 4% 8% 8% 7% 4% 3% 4% 5% 5% 6% 5% 6% 5%
Google+ 255 18 16 43 48 32 46 16 6 5 25 153 102 98 1575% 4% 3% 9% 10% 6% 9% 3% 1% 1% 5% 6% 4% 5% 5%
LinkedIn 172 29 11 19 22 34 23 2 8 6 18 118 54 70 1023% 6% 2% 4% 4% 7% 5% * 1% 2% 4% 5% 2% 4% 3%
Pinterest 164 16 10 28 18 30 10 9 8 11 24 84 79 65 983% 3% 2% 6% 4% 6% 2% 2% 1% 3% 5% 3% 3% 3% 3%
Other 110 6 11 10 15 10 18 17 7 6 12 55 56 60 512% 1% 2% 2% 3% 2% 4% 3% 1% 1% 2% 2% 2% 3% 2%
None of these 2561 203 325 207 137 245 209 283 429 259 265 1141 1419 951 160951% 40% 66% 42% 27% 49% 42% 56% 71% 64% 54% 47% 56% 48% 54%
Online fieldwork: 26th March - 15th April 2015 Prepared by ComRes Ltd
Page 271
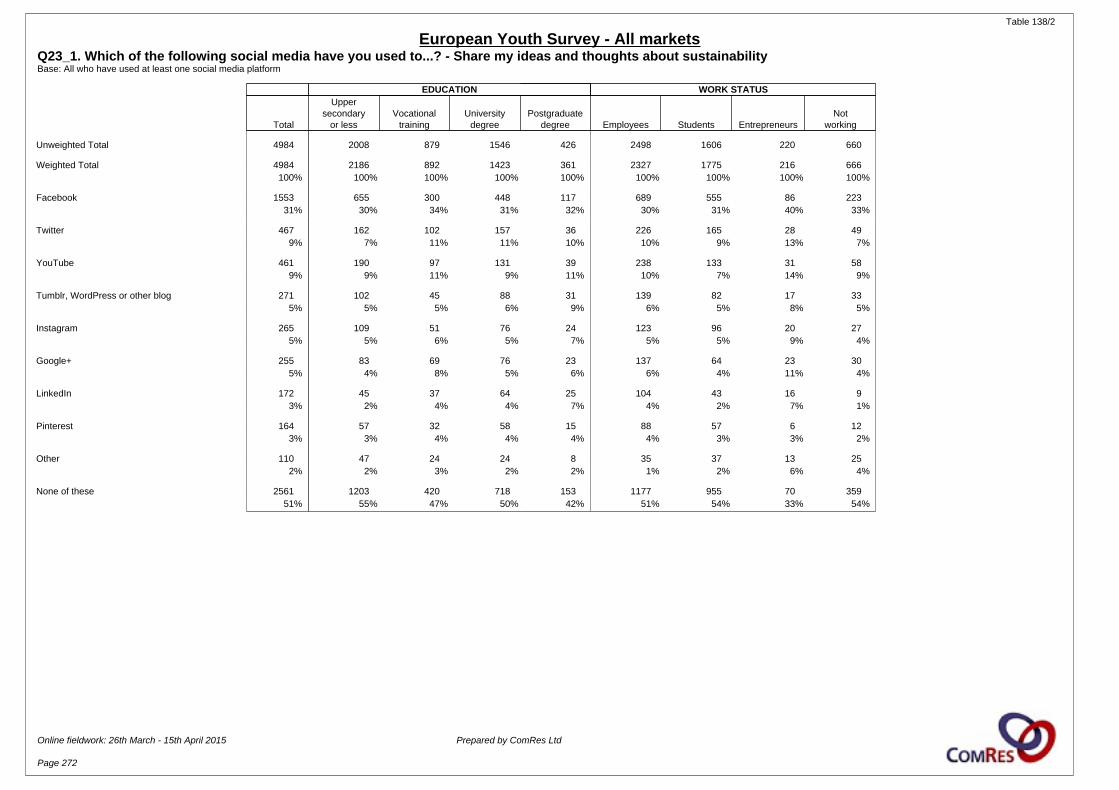
Table 138/2
European Youth Survey - All marketsQ23_1. Which of the following social media have you used to...? - Share my ideas and thoughts about sustainabilityBase: All who have used at least one social media platform
EDUCATION WORK STATUS
Total
Uppersecondary
or lessVocational
trainingUniversity
degreePostgraduate
degree Employees Students EntrepreneursNot
working
Unweighted Total 4984 2008 879 1546 426 2498 1606 220 660
Weighted Total 4984 2186 892 1423 361 2327 1775 216 666100% 100% 100% 100% 100% 100% 100% 100% 100%
Facebook 1553 655 300 448 117 689 555 86 22331% 30% 34% 31% 32% 30% 31% 40% 33%
Twitter 467 162 102 157 36 226 165 28 499% 7% 11% 11% 10% 10% 9% 13% 7%
YouTube 461 190 97 131 39 238 133 31 589% 9% 11% 9% 11% 10% 7% 14% 9%
Tumblr, WordPress or other blog 271 102 45 88 31 139 82 17 335% 5% 5% 6% 9% 6% 5% 8% 5%
Instagram 265 109 51 76 24 123 96 20 275% 5% 6% 5% 7% 5% 5% 9% 4%
Google+ 255 83 69 76 23 137 64 23 305% 4% 8% 5% 6% 6% 4% 11% 4%
LinkedIn 172 45 37 64 25 104 43 16 93% 2% 4% 4% 7% 4% 2% 7% 1%
Pinterest 164 57 32 58 15 88 57 6 123% 3% 4% 4% 4% 4% 3% 3% 2%
Other 110 47 24 24 8 35 37 13 252% 2% 3% 2% 2% 1% 2% 6% 4%
None of these 2561 1203 420 718 153 1177 955 70 35951% 55% 47% 50% 42% 51% 54% 33% 54%
Online fieldwork: 26th March - 15th April 2015 Prepared by ComRes Ltd
Page 272
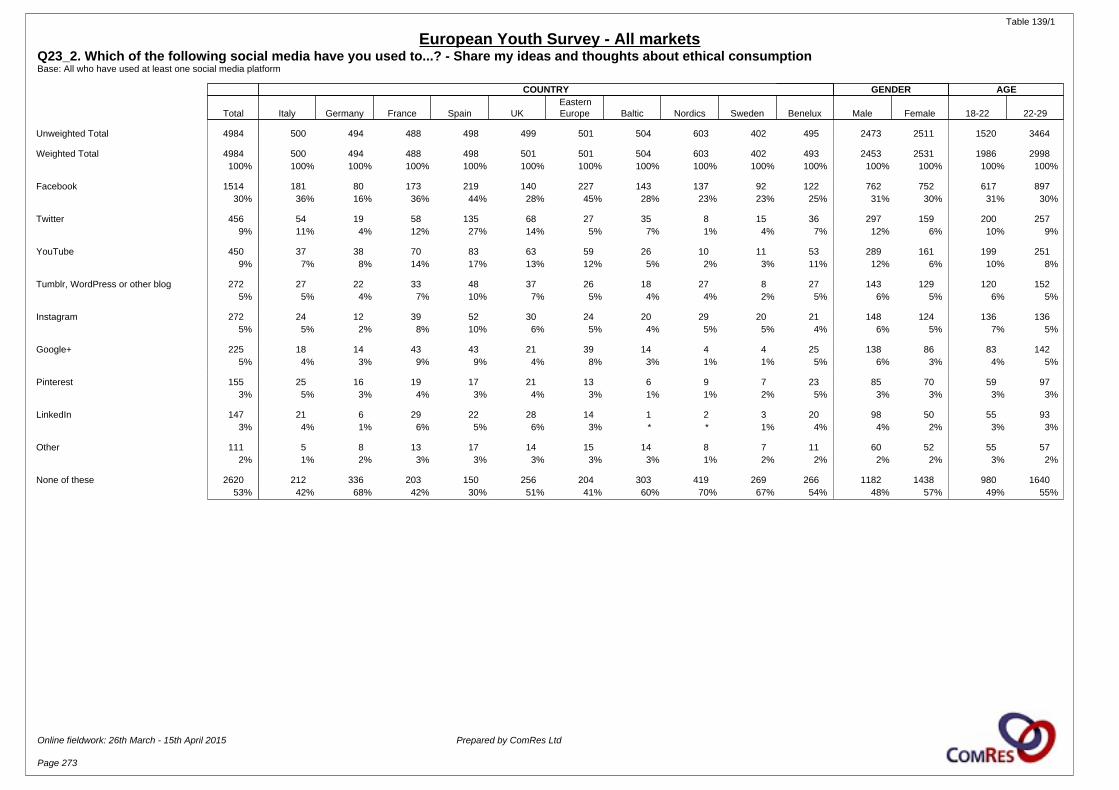
Table 139/1
European Youth Survey - All marketsQ23_2. Which of the following social media have you used to...? - Share my ideas and thoughts about ethical consumptionBase: All who have used at least one social media platform
COUNTRY GENDER AGE
Total Italy Germany France Spain UKEasternEurope Baltic Nordics Sweden Benelux Male Female 18-22 22-29
Unweighted Total 4984 500 494 488 498 499 501 504 603 402 495 2473 2511 1520 3464
Weighted Total 4984 500 494 488 498 501 501 504 603 402 493 2453 2531 1986 2998100% 100% 100% 100% 100% 100% 100% 100% 100% 100% 100% 100% 100% 100% 100%
Facebook 1514 181 80 173 219 140 227 143 137 92 122 762 752 617 89730% 36% 16% 36% 44% 28% 45% 28% 23% 23% 25% 31% 30% 31% 30%
Twitter 456 54 19 58 135 68 27 35 8 15 36 297 159 200 2579% 11% 4% 12% 27% 14% 5% 7% 1% 4% 7% 12% 6% 10% 9%
YouTube 450 37 38 70 83 63 59 26 10 11 53 289 161 199 2519% 7% 8% 14% 17% 13% 12% 5% 2% 3% 11% 12% 6% 10% 8%
Tumblr, WordPress or other blog 272 27 22 33 48 37 26 18 27 8 27 143 129 120 1525% 5% 4% 7% 10% 7% 5% 4% 4% 2% 5% 6% 5% 6% 5%
Instagram 272 24 12 39 52 30 24 20 29 20 21 148 124 136 1365% 5% 2% 8% 10% 6% 5% 4% 5% 5% 4% 6% 5% 7% 5%
Google+ 225 18 14 43 43 21 39 14 4 4 25 138 86 83 1425% 4% 3% 9% 9% 4% 8% 3% 1% 1% 5% 6% 3% 4% 5%
Pinterest 155 25 16 19 17 21 13 6 9 7 23 85 70 59 973% 5% 3% 4% 3% 4% 3% 1% 1% 2% 5% 3% 3% 3% 3%
LinkedIn 147 21 6 29 22 28 14 1 2 3 20 98 50 55 933% 4% 1% 6% 5% 6% 3% * * 1% 4% 4% 2% 3% 3%
Other 111 5 8 13 17 14 15 14 8 7 11 60 52 55 572% 1% 2% 3% 3% 3% 3% 3% 1% 2% 2% 2% 2% 3% 2%
None of these 2620 212 336 203 150 256 204 303 419 269 266 1182 1438 980 164053% 42% 68% 42% 30% 51% 41% 60% 70% 67% 54% 48% 57% 49% 55%
Online fieldwork: 26th March - 15th April 2015 Prepared by ComRes Ltd
Page 273

Table 139/2
European Youth Survey - All marketsQ23_2. Which of the following social media have you used to...? - Share my ideas and thoughts about ethical consumptionBase: All who have used at least one social media platform
EDUCATION WORK STATUS
Total
Uppersecondary
or lessVocational
trainingUniversity
degreePostgraduate
degree Employees Students EntrepreneursNot
working
Unweighted Total 4984 2008 879 1546 426 2498 1606 220 660
Weighted Total 4984 2186 892 1423 361 2327 1775 216 666100% 100% 100% 100% 100% 100% 100% 100% 100%
Facebook 1514 627 295 441 122 675 552 74 21230% 29% 33% 31% 34% 29% 31% 34% 32%
Twitter 456 169 105 130 44 218 154 28 569% 8% 12% 9% 12% 9% 9% 13% 8%
YouTube 450 163 112 120 42 255 121 31 439% 7% 13% 8% 12% 11% 7% 14% 6%
Tumblr, WordPress or other blog 272 97 43 98 28 136 88 18 305% 4% 5% 7% 8% 6% 5% 8% 5%
Instagram 272 117 50 78 23 133 94 18 275% 5% 6% 5% 6% 6% 5% 8% 4%
Google+ 225 77 65 56 21 122 58 17 285% 4% 7% 4% 6% 5% 3% 8% 4%
Pinterest 155 52 29 56 14 79 48 7 223% 2% 3% 4% 4% 3% 3% 3% 3%
LinkedIn 147 43 31 50 22 102 25 9 103% 2% 4% 4% 6% 4% 1% 4% 1%
Other 111 47 26 24 7 42 36 12 212% 2% 3% 2% 2% 2% 2% 5% 3%
None of these 2620 1243 414 735 153 1177 991 83 36953% 57% 46% 52% 42% 51% 56% 38% 55%
Online fieldwork: 26th March - 15th April 2015 Prepared by ComRes Ltd
Page 274
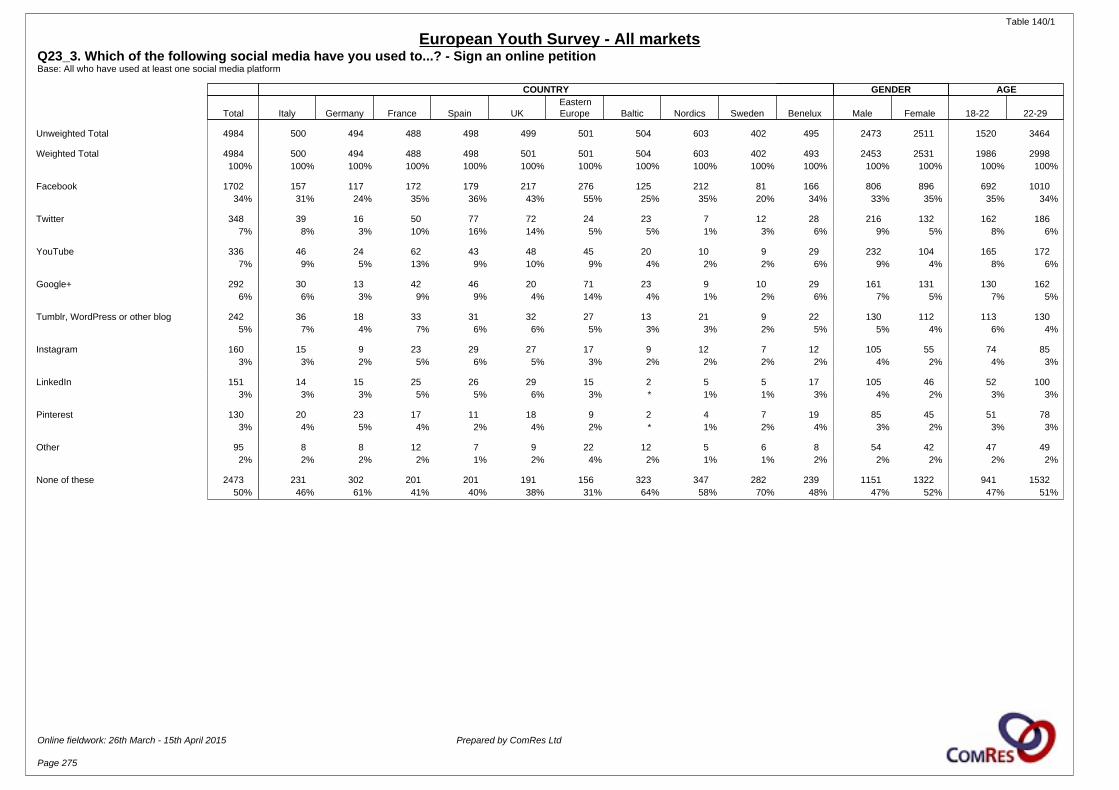
Table 140/1
European Youth Survey - All marketsQ23_3. Which of the following social media have you used to...? - Sign an online petitionBase: All who have used at least one social media platform
COUNTRY GENDER AGE
Total Italy Germany France Spain UKEasternEurope Baltic Nordics Sweden Benelux Male Female 18-22 22-29
Unweighted Total 4984 500 494 488 498 499 501 504 603 402 495 2473 2511 1520 3464
Weighted Total 4984 500 494 488 498 501 501 504 603 402 493 2453 2531 1986 2998100% 100% 100% 100% 100% 100% 100% 100% 100% 100% 100% 100% 100% 100% 100%
Facebook 1702 157 117 172 179 217 276 125 212 81 166 806 896 692 101034% 31% 24% 35% 36% 43% 55% 25% 35% 20% 34% 33% 35% 35% 34%
Twitter 348 39 16 50 77 72 24 23 7 12 28 216 132 162 1867% 8% 3% 10% 16% 14% 5% 5% 1% 3% 6% 9% 5% 8% 6%
YouTube 336 46 24 62 43 48 45 20 10 9 29 232 104 165 1727% 9% 5% 13% 9% 10% 9% 4% 2% 2% 6% 9% 4% 8% 6%
Google+ 292 30 13 42 46 20 71 23 9 10 29 161 131 130 1626% 6% 3% 9% 9% 4% 14% 4% 1% 2% 6% 7% 5% 7% 5%
Tumblr, WordPress or other blog 242 36 18 33 31 32 27 13 21 9 22 130 112 113 1305% 7% 4% 7% 6% 6% 5% 3% 3% 2% 5% 5% 4% 6% 4%
Instagram 160 15 9 23 29 27 17 9 12 7 12 105 55 74 853% 3% 2% 5% 6% 5% 3% 2% 2% 2% 2% 4% 2% 4% 3%
LinkedIn 151 14 15 25 26 29 15 2 5 5 17 105 46 52 1003% 3% 3% 5% 5% 6% 3% * 1% 1% 3% 4% 2% 3% 3%
Pinterest 130 20 23 17 11 18 9 2 4 7 19 85 45 51 783% 4% 5% 4% 2% 4% 2% * 1% 2% 4% 3% 2% 3% 3%
Other 95 8 8 12 7 9 22 12 5 6 8 54 42 47 492% 2% 2% 2% 1% 2% 4% 2% 1% 1% 2% 2% 2% 2% 2%
None of these 2473 231 302 201 201 191 156 323 347 282 239 1151 1322 941 153250% 46% 61% 41% 40% 38% 31% 64% 58% 70% 48% 47% 52% 47% 51%
Online fieldwork: 26th March - 15th April 2015 Prepared by ComRes Ltd
Page 275
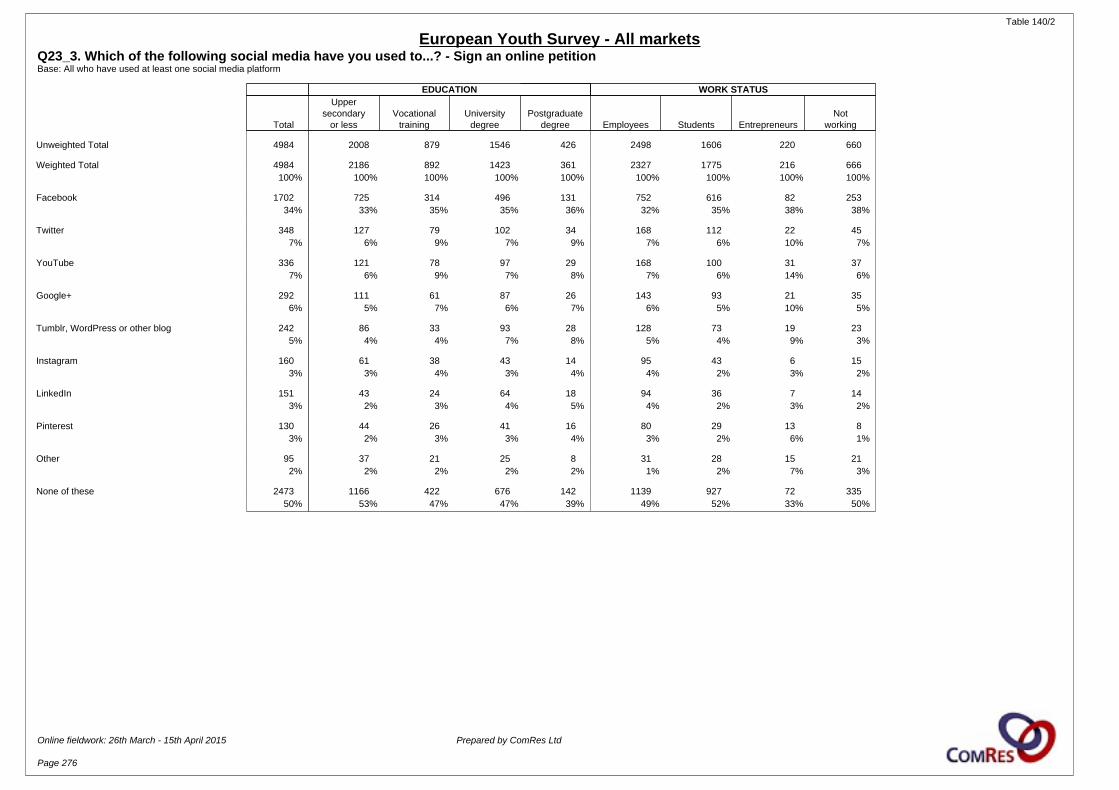
Table 140/2
European Youth Survey - All marketsQ23_3. Which of the following social media have you used to...? - Sign an online petitionBase: All who have used at least one social media platform
EDUCATION WORK STATUS
Total
Uppersecondary
or lessVocational
trainingUniversity
degreePostgraduate
degree Employees Students EntrepreneursNot
working
Unweighted Total 4984 2008 879 1546 426 2498 1606 220 660
Weighted Total 4984 2186 892 1423 361 2327 1775 216 666100% 100% 100% 100% 100% 100% 100% 100% 100%
Facebook 1702 725 314 496 131 752 616 82 25334% 33% 35% 35% 36% 32% 35% 38% 38%
Twitter 348 127 79 102 34 168 112 22 457% 6% 9% 7% 9% 7% 6% 10% 7%
YouTube 336 121 78 97 29 168 100 31 377% 6% 9% 7% 8% 7% 6% 14% 6%
Google+ 292 111 61 87 26 143 93 21 356% 5% 7% 6% 7% 6% 5% 10% 5%
Tumblr, WordPress or other blog 242 86 33 93 28 128 73 19 235% 4% 4% 7% 8% 5% 4% 9% 3%
Instagram 160 61 38 43 14 95 43 6 153% 3% 4% 3% 4% 4% 2% 3% 2%
LinkedIn 151 43 24 64 18 94 36 7 143% 2% 3% 4% 5% 4% 2% 3% 2%
Pinterest 130 44 26 41 16 80 29 13 83% 2% 3% 3% 4% 3% 2% 6% 1%
Other 95 37 21 25 8 31 28 15 212% 2% 2% 2% 2% 1% 2% 7% 3%
None of these 2473 1166 422 676 142 1139 927 72 33550% 53% 47% 47% 39% 49% 52% 33% 50%
Online fieldwork: 26th March - 15th April 2015 Prepared by ComRes Ltd
Page 276
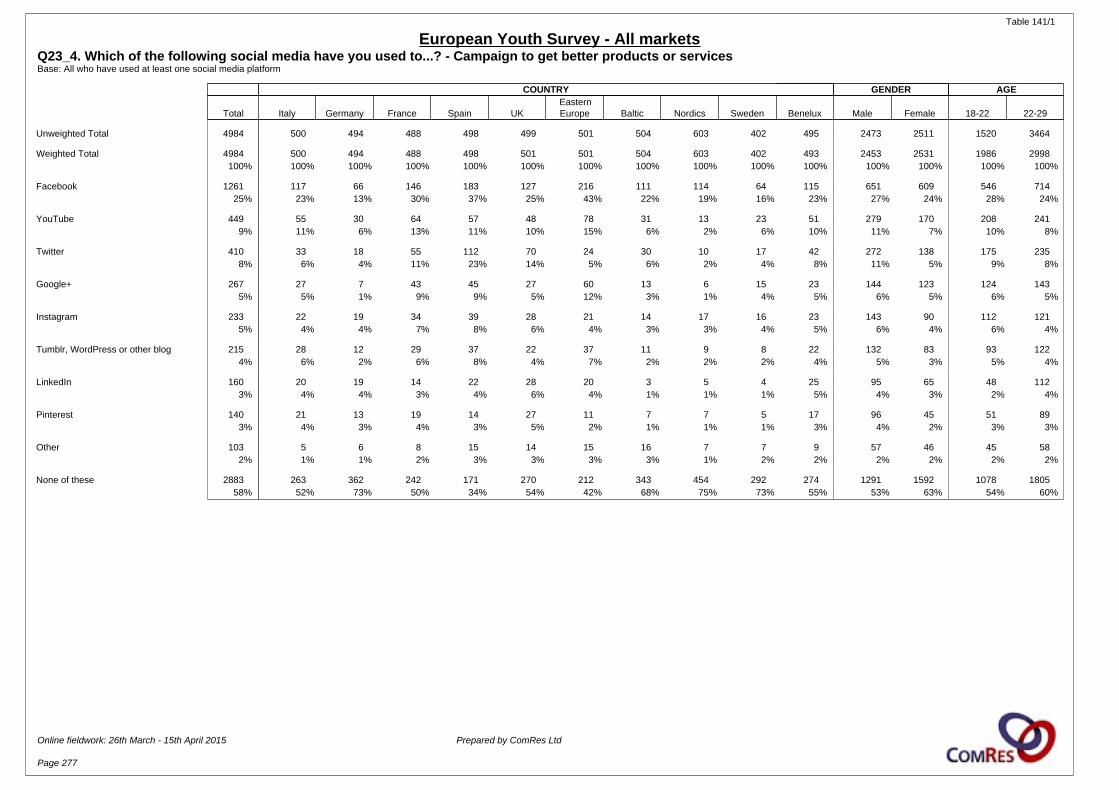
Table 141/1
European Youth Survey - All marketsQ23_4. Which of the following social media have you used to...? - Campaign to get better products or servicesBase: All who have used at least one social media platform
COUNTRY GENDER AGE
Total Italy Germany France Spain UKEasternEurope Baltic Nordics Sweden Benelux Male Female 18-22 22-29
Unweighted Total 4984 500 494 488 498 499 501 504 603 402 495 2473 2511 1520 3464
Weighted Total 4984 500 494 488 498 501 501 504 603 402 493 2453 2531 1986 2998100% 100% 100% 100% 100% 100% 100% 100% 100% 100% 100% 100% 100% 100% 100%
Facebook 1261 117 66 146 183 127 216 111 114 64 115 651 609 546 71425% 23% 13% 30% 37% 25% 43% 22% 19% 16% 23% 27% 24% 28% 24%
YouTube 449 55 30 64 57 48 78 31 13 23 51 279 170 208 2419% 11% 6% 13% 11% 10% 15% 6% 2% 6% 10% 11% 7% 10% 8%
Twitter 410 33 18 55 112 70 24 30 10 17 42 272 138 175 2358% 6% 4% 11% 23% 14% 5% 6% 2% 4% 8% 11% 5% 9% 8%
Google+ 267 27 7 43 45 27 60 13 6 15 23 144 123 124 1435% 5% 1% 9% 9% 5% 12% 3% 1% 4% 5% 6% 5% 6% 5%
Instagram 233 22 19 34 39 28 21 14 17 16 23 143 90 112 1215% 4% 4% 7% 8% 6% 4% 3% 3% 4% 5% 6% 4% 6% 4%
Tumblr, WordPress or other blog 215 28 12 29 37 22 37 11 9 8 22 132 83 93 1224% 6% 2% 6% 8% 4% 7% 2% 2% 2% 4% 5% 3% 5% 4%
LinkedIn 160 20 19 14 22 28 20 3 5 4 25 95 65 48 1123% 4% 4% 3% 4% 6% 4% 1% 1% 1% 5% 4% 3% 2% 4%
Pinterest 140 21 13 19 14 27 11 7 7 5 17 96 45 51 893% 4% 3% 4% 3% 5% 2% 1% 1% 1% 3% 4% 2% 3% 3%
Other 103 5 6 8 15 14 15 16 7 7 9 57 46 45 582% 1% 1% 2% 3% 3% 3% 3% 1% 2% 2% 2% 2% 2% 2%
None of these 2883 263 362 242 171 270 212 343 454 292 274 1291 1592 1078 180558% 52% 73% 50% 34% 54% 42% 68% 75% 73% 55% 53% 63% 54% 60%
Online fieldwork: 26th March - 15th April 2015 Prepared by ComRes Ltd
Page 277
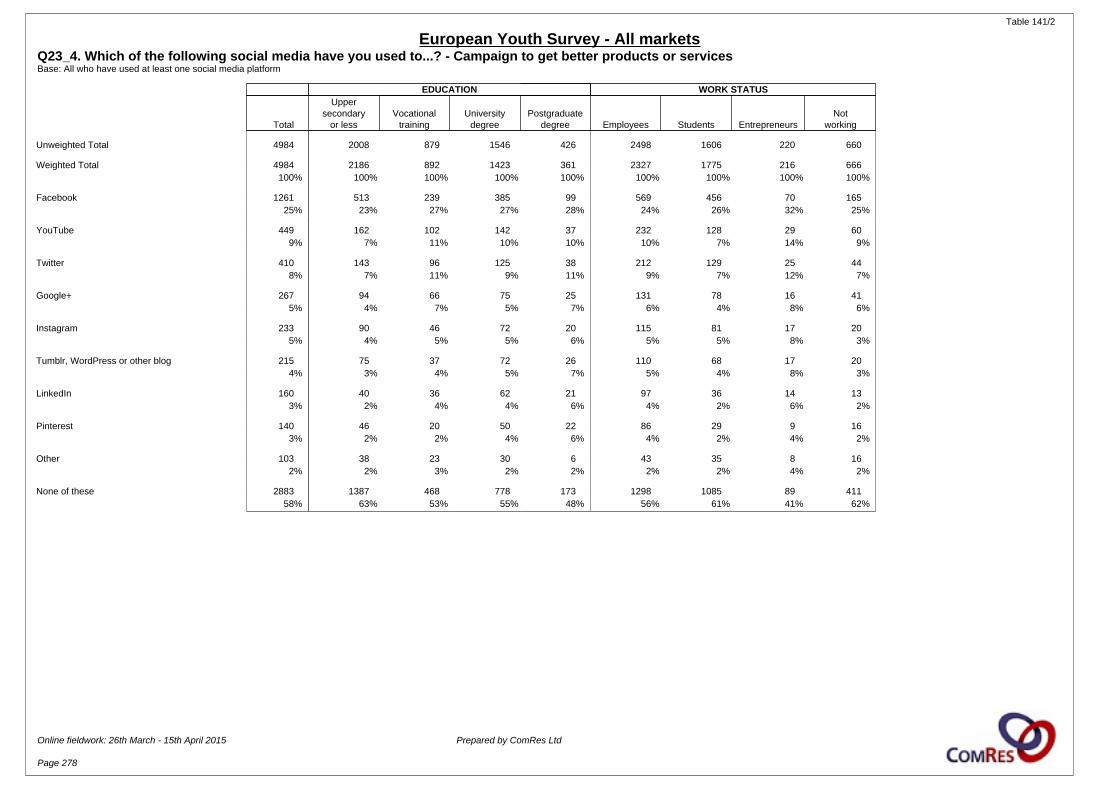
Table 141/2
European Youth Survey - All marketsQ23_4. Which of the following social media have you used to...? - Campaign to get better products or servicesBase: All who have used at least one social media platform
EDUCATION WORK STATUS
Total
Uppersecondary
or lessVocational
trainingUniversity
degreePostgraduate
degree Employees Students EntrepreneursNot
working
Unweighted Total 4984 2008 879 1546 426 2498 1606 220 660
Weighted Total 4984 2186 892 1423 361 2327 1775 216 666100% 100% 100% 100% 100% 100% 100% 100% 100%
Facebook 1261 513 239 385 99 569 456 70 16525% 23% 27% 27% 28% 24% 26% 32% 25%
YouTube 449 162 102 142 37 232 128 29 609% 7% 11% 10% 10% 10% 7% 14% 9%
Twitter 410 143 96 125 38 212 129 25 448% 7% 11% 9% 11% 9% 7% 12% 7%
Google+ 267 94 66 75 25 131 78 16 415% 4% 7% 5% 7% 6% 4% 8% 6%
Instagram 233 90 46 72 20 115 81 17 205% 4% 5% 5% 6% 5% 5% 8% 3%
Tumblr, WordPress or other blog 215 75 37 72 26 110 68 17 204% 3% 4% 5% 7% 5% 4% 8% 3%
LinkedIn 160 40 36 62 21 97 36 14 133% 2% 4% 4% 6% 4% 2% 6% 2%
Pinterest 140 46 20 50 22 86 29 9 163% 2% 2% 4% 6% 4% 2% 4% 2%
Other 103 38 23 30 6 43 35 8 162% 2% 3% 2% 2% 2% 2% 4% 2%
None of these 2883 1387 468 778 173 1298 1085 89 41158% 63% 53% 55% 48% 56% 61% 41% 62%
Online fieldwork: 26th March - 15th April 2015 Prepared by ComRes Ltd
Page 278
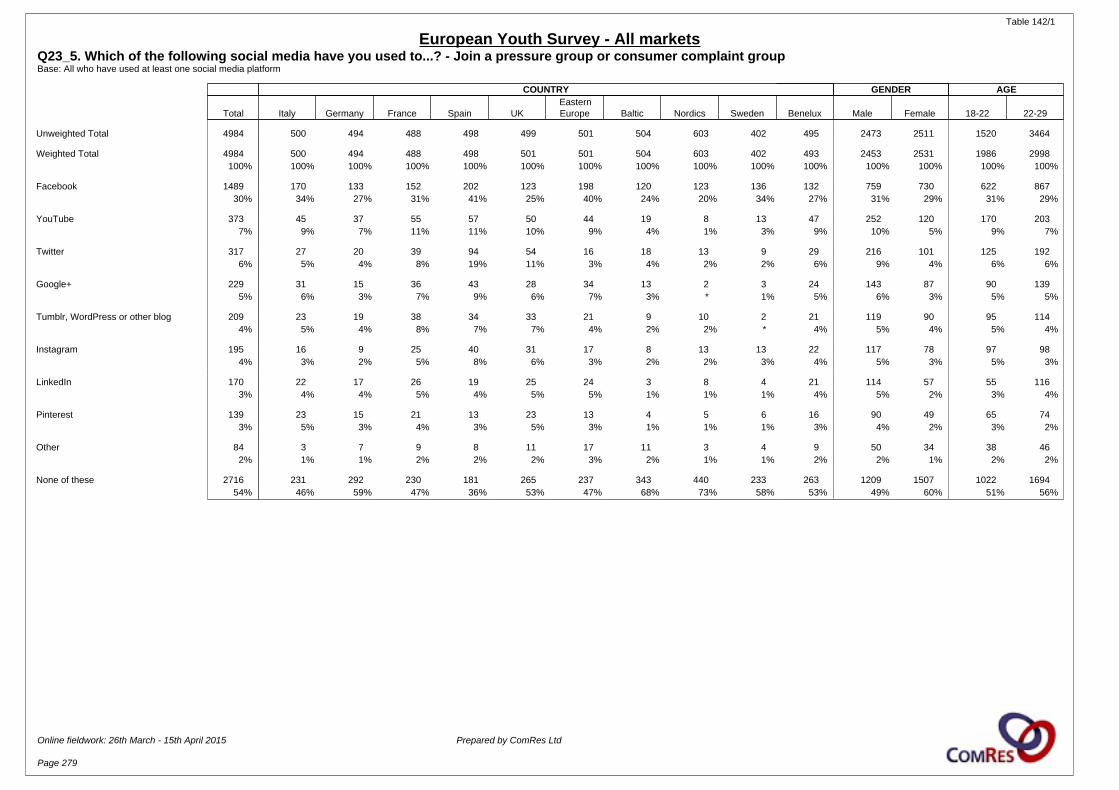
Table 142/1
European Youth Survey - All marketsQ23_5. Which of the following social media have you used to...? - Join a pressure group or consumer complaint groupBase: All who have used at least one social media platform
COUNTRY GENDER AGE
Total Italy Germany France Spain UKEasternEurope Baltic Nordics Sweden Benelux Male Female 18-22 22-29
Unweighted Total 4984 500 494 488 498 499 501 504 603 402 495 2473 2511 1520 3464
Weighted Total 4984 500 494 488 498 501 501 504 603 402 493 2453 2531 1986 2998100% 100% 100% 100% 100% 100% 100% 100% 100% 100% 100% 100% 100% 100% 100%
Facebook 1489 170 133 152 202 123 198 120 123 136 132 759 730 622 86730% 34% 27% 31% 41% 25% 40% 24% 20% 34% 27% 31% 29% 31% 29%
YouTube 373 45 37 55 57 50 44 19 8 13 47 252 120 170 2037% 9% 7% 11% 11% 10% 9% 4% 1% 3% 9% 10% 5% 9% 7%
Twitter 317 27 20 39 94 54 16 18 13 9 29 216 101 125 1926% 5% 4% 8% 19% 11% 3% 4% 2% 2% 6% 9% 4% 6% 6%
Google+ 229 31 15 36 43 28 34 13 2 3 24 143 87 90 1395% 6% 3% 7% 9% 6% 7% 3% * 1% 5% 6% 3% 5% 5%
Tumblr, WordPress or other blog 209 23 19 38 34 33 21 9 10 2 21 119 90 95 1144% 5% 4% 8% 7% 7% 4% 2% 2% * 4% 5% 4% 5% 4%
Instagram 195 16 9 25 40 31 17 8 13 13 22 117 78 97 984% 3% 2% 5% 8% 6% 3% 2% 2% 3% 4% 5% 3% 5% 3%
LinkedIn 170 22 17 26 19 25 24 3 8 4 21 114 57 55 1163% 4% 4% 5% 4% 5% 5% 1% 1% 1% 4% 5% 2% 3% 4%
Pinterest 139 23 15 21 13 23 13 4 5 6 16 90 49 65 743% 5% 3% 4% 3% 5% 3% 1% 1% 1% 3% 4% 2% 3% 2%
Other 84 3 7 9 8 11 17 11 3 4 9 50 34 38 462% 1% 1% 2% 2% 2% 3% 2% 1% 1% 2% 2% 1% 2% 2%
None of these 2716 231 292 230 181 265 237 343 440 233 263 1209 1507 1022 169454% 46% 59% 47% 36% 53% 47% 68% 73% 58% 53% 49% 60% 51% 56%
Online fieldwork: 26th March - 15th April 2015 Prepared by ComRes Ltd
Page 279

Table 142/2
European Youth Survey - All marketsQ23_5. Which of the following social media have you used to...? - Join a pressure group or consumer complaint groupBase: All who have used at least one social media platform
EDUCATION WORK STATUS
Total
Uppersecondary
or lessVocational
trainingUniversity
degreePostgraduate
degree Employees Students EntrepreneursNot
working
Unweighted Total 4984 2008 879 1546 426 2498 1606 220 660
Weighted Total 4984 2186 892 1423 361 2327 1775 216 666100% 100% 100% 100% 100% 100% 100% 100% 100%
Facebook 1489 632 284 429 116 683 552 63 19230% 29% 32% 30% 32% 29% 31% 29% 29%
YouTube 373 137 86 113 29 215 96 25 377% 6% 10% 8% 8% 9% 5% 12% 6%
Twitter 317 118 73 92 35 177 86 22 326% 5% 8% 6% 10% 8% 5% 10% 5%
Google+ 229 75 62 61 26 123 59 18 295% 3% 7% 4% 7% 5% 3% 9% 4%
Tumblr, WordPress or other blog 209 60 44 78 24 122 55 17 154% 3% 5% 5% 7% 5% 3% 8% 2%
Instagram 195 67 47 54 24 111 52 13 194% 3% 5% 4% 7% 5% 3% 6% 3%
LinkedIn 170 55 28 59 28 99 39 18 143% 2% 3% 4% 8% 4% 2% 8% 2%
Pinterest 139 46 27 49 15 75 40 13 113% 2% 3% 3% 4% 3% 2% 6% 2%
Other 84 27 21 26 5 38 22 11 132% 1% 2% 2% 2% 2% 1% 5% 2%
None of these 2716 1275 453 757 155 1200 1021 94 40154% 58% 51% 53% 43% 52% 58% 44% 60%
Online fieldwork: 26th March - 15th April 2015 Prepared by ComRes Ltd
Page 280
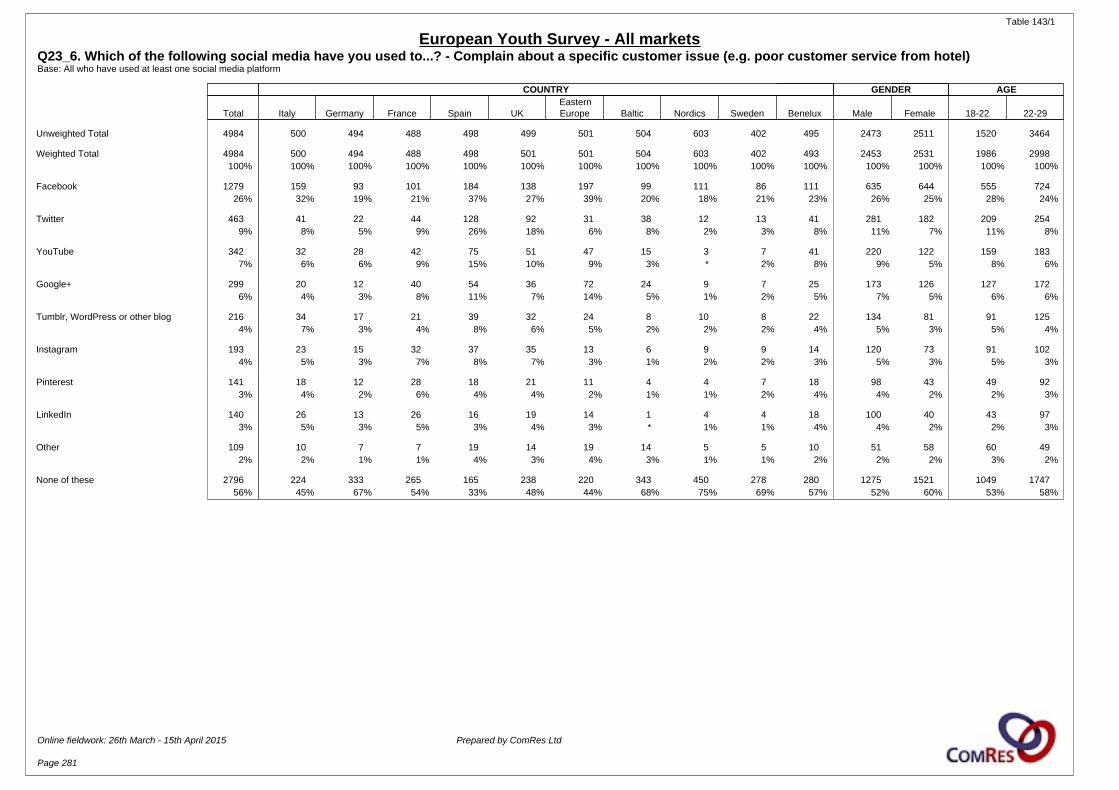
Table 143/1
European Youth Survey - All marketsQ23_6. Which of the following social media have you used to...? - Complain about a specific customer issue (e.g. poor customer service from hotel)Base: All who have used at least one social media platform
COUNTRY GENDER AGE
Total Italy Germany France Spain UKEasternEurope Baltic Nordics Sweden Benelux Male Female 18-22 22-29
Unweighted Total 4984 500 494 488 498 499 501 504 603 402 495 2473 2511 1520 3464
Weighted Total 4984 500 494 488 498 501 501 504 603 402 493 2453 2531 1986 2998100% 100% 100% 100% 100% 100% 100% 100% 100% 100% 100% 100% 100% 100% 100%
Facebook 1279 159 93 101 184 138 197 99 111 86 111 635 644 555 72426% 32% 19% 21% 37% 27% 39% 20% 18% 21% 23% 26% 25% 28% 24%
Twitter 463 41 22 44 128 92 31 38 12 13 41 281 182 209 2549% 8% 5% 9% 26% 18% 6% 8% 2% 3% 8% 11% 7% 11% 8%
YouTube 342 32 28 42 75 51 47 15 3 7 41 220 122 159 1837% 6% 6% 9% 15% 10% 9% 3% * 2% 8% 9% 5% 8% 6%
Google+ 299 20 12 40 54 36 72 24 9 7 25 173 126 127 1726% 4% 3% 8% 11% 7% 14% 5% 1% 2% 5% 7% 5% 6% 6%
Tumblr, WordPress or other blog 216 34 17 21 39 32 24 8 10 8 22 134 81 91 1254% 7% 3% 4% 8% 6% 5% 2% 2% 2% 4% 5% 3% 5% 4%
Instagram 193 23 15 32 37 35 13 6 9 9 14 120 73 91 1024% 5% 3% 7% 8% 7% 3% 1% 2% 2% 3% 5% 3% 5% 3%
Pinterest 141 18 12 28 18 21 11 4 4 7 18 98 43 49 923% 4% 2% 6% 4% 4% 2% 1% 1% 2% 4% 4% 2% 2% 3%
LinkedIn 140 26 13 26 16 19 14 1 4 4 18 100 40 43 973% 5% 3% 5% 3% 4% 3% * 1% 1% 4% 4% 2% 2% 3%
Other 109 10 7 7 19 14 19 14 5 5 10 51 58 60 492% 2% 1% 1% 4% 3% 4% 3% 1% 1% 2% 2% 2% 3% 2%
None of these 2796 224 333 265 165 238 220 343 450 278 280 1275 1521 1049 174756% 45% 67% 54% 33% 48% 44% 68% 75% 69% 57% 52% 60% 53% 58%
Online fieldwork: 26th March - 15th April 2015 Prepared by ComRes Ltd
Page 281
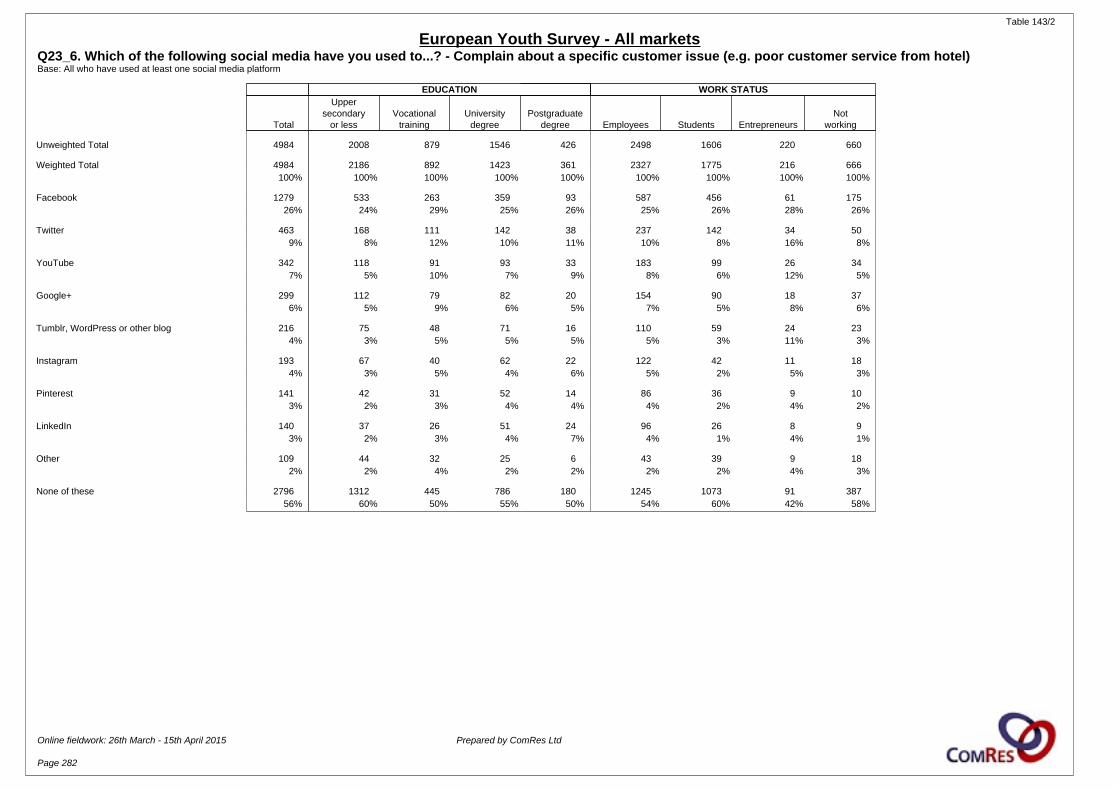
Table 143/2
European Youth Survey - All marketsQ23_6. Which of the following social media have you used to...? - Complain about a specific customer issue (e.g. poor customer service from hotel)Base: All who have used at least one social media platform
EDUCATION WORK STATUS
Total
Uppersecondary
or lessVocational
trainingUniversity
degreePostgraduate
degree Employees Students EntrepreneursNot
working
Unweighted Total 4984 2008 879 1546 426 2498 1606 220 660
Weighted Total 4984 2186 892 1423 361 2327 1775 216 666100% 100% 100% 100% 100% 100% 100% 100% 100%
Facebook 1279 533 263 359 93 587 456 61 17526% 24% 29% 25% 26% 25% 26% 28% 26%
Twitter 463 168 111 142 38 237 142 34 509% 8% 12% 10% 11% 10% 8% 16% 8%
YouTube 342 118 91 93 33 183 99 26 347% 5% 10% 7% 9% 8% 6% 12% 5%
Google+ 299 112 79 82 20 154 90 18 376% 5% 9% 6% 5% 7% 5% 8% 6%
Tumblr, WordPress or other blog 216 75 48 71 16 110 59 24 234% 3% 5% 5% 5% 5% 3% 11% 3%
Instagram 193 67 40 62 22 122 42 11 184% 3% 5% 4% 6% 5% 2% 5% 3%
Pinterest 141 42 31 52 14 86 36 9 103% 2% 3% 4% 4% 4% 2% 4% 2%
LinkedIn 140 37 26 51 24 96 26 8 93% 2% 3% 4% 7% 4% 1% 4% 1%
Other 109 44 32 25 6 43 39 9 182% 2% 4% 2% 2% 2% 2% 4% 3%
None of these 2796 1312 445 786 180 1245 1073 91 38756% 60% 50% 55% 50% 54% 60% 42% 58%
Online fieldwork: 26th March - 15th April 2015 Prepared by ComRes Ltd
Page 282
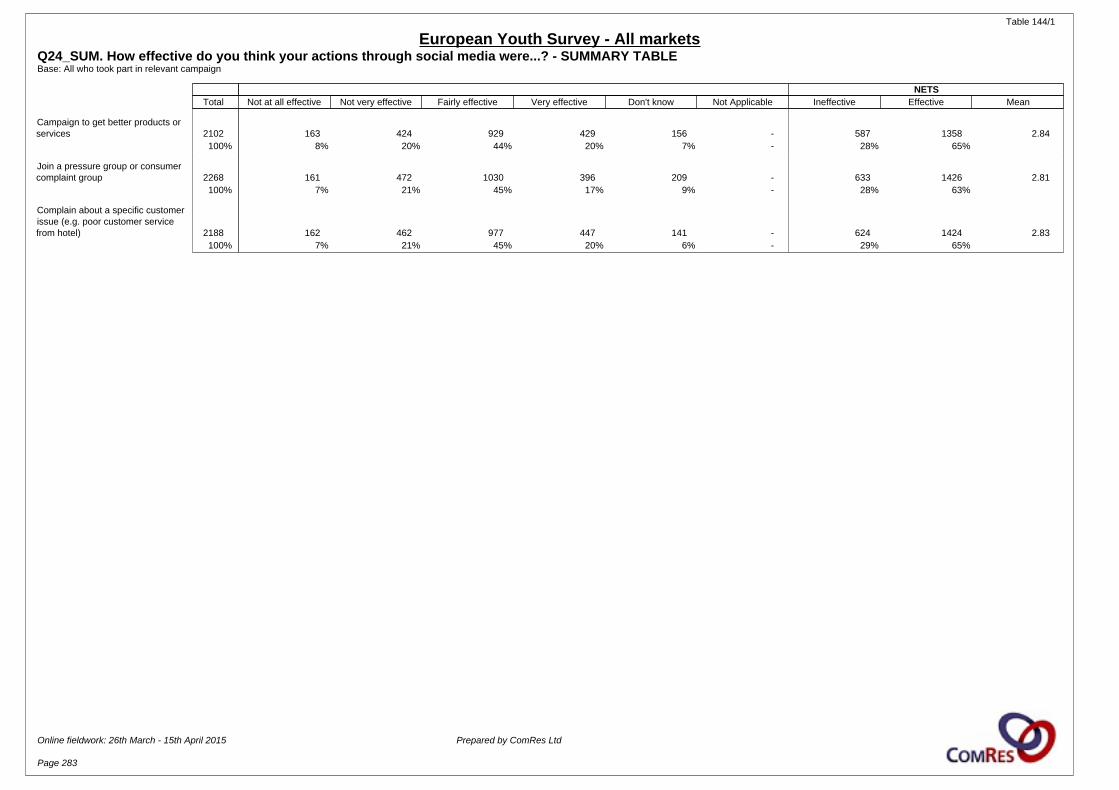
Table 144/1
European Youth Survey - All marketsQ24_SUM. How effective do you think your actions through social media were...? - SUMMARY TABLEBase: All who took part in relevant campaign
NETS Total Not at all effective Not very effective Fairly effective Very effective Don't know Not Applicable Ineffective Effective Mean
Campaign to get better products orservices 2102 163 424 929 429 156 - 587 1358 2.84
100% 8% 20% 44% 20% 7% - 28% 65%
Join a pressure group or consumercomplaint group 2268 161 472 1030 396 209 - 633 1426 2.81
100% 7% 21% 45% 17% 9% - 28% 63%
Complain about a specific customerissue (e.g. poor customer servicefrom hotel) 2188 162 462 977 447 141 - 624 1424 2.83
100% 7% 21% 45% 20% 6% - 29% 65%
Online fieldwork: 26th March - 15th April 2015 Prepared by ComRes Ltd
Page 283
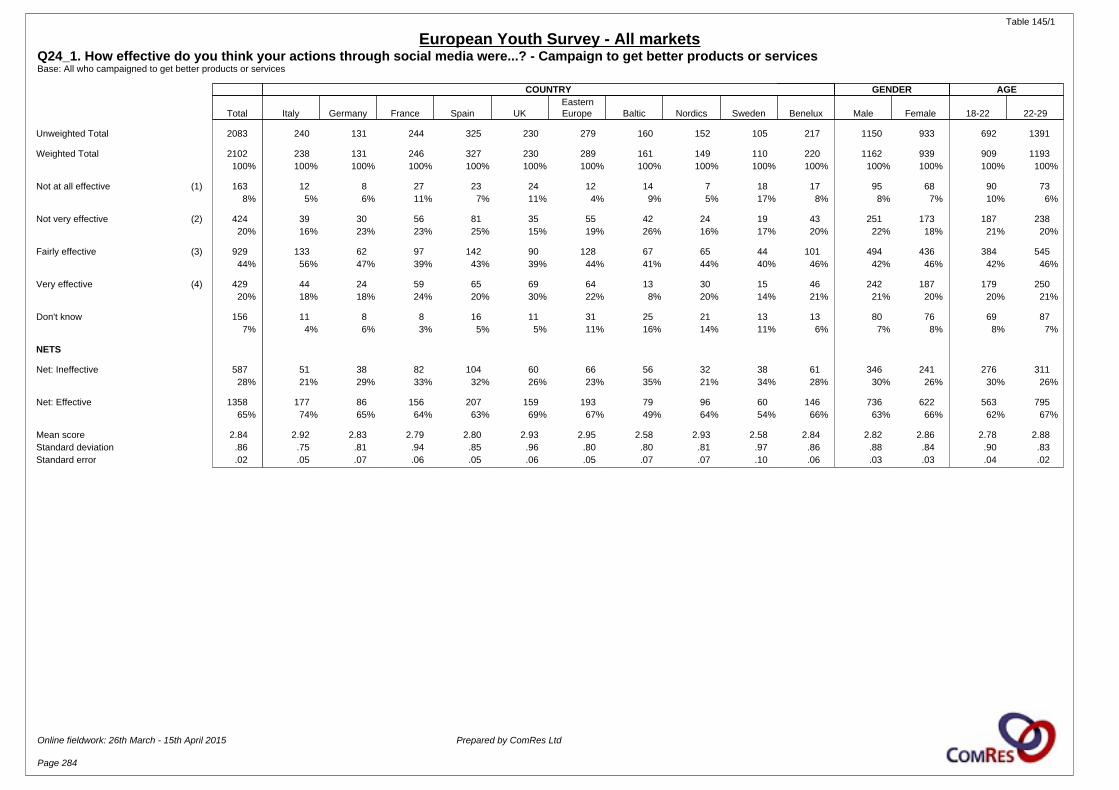
Table 145/1
European Youth Survey - All marketsQ24_1. How effective do you think your actions through social media were...? - Campaign to get better products or servicesBase: All who campaigned to get better products or services
COUNTRY GENDER AGE
Total Italy Germany France Spain UKEasternEurope Baltic Nordics Sweden Benelux Male Female 18-22 22-29
Unweighted Total 2083 240 131 244 325 230 279 160 152 105 217 1150 933 692 1391
Weighted Total 2102 238 131 246 327 230 289 161 149 110 220 1162 939 909 1193100% 100% 100% 100% 100% 100% 100% 100% 100% 100% 100% 100% 100% 100% 100%
Not at all effective (1) 163 12 8 27 23 24 12 14 7 18 17 95 68 90 738% 5% 6% 11% 7% 11% 4% 9% 5% 17% 8% 8% 7% 10% 6%
Not very effective (2) 424 39 30 56 81 35 55 42 24 19 43 251 173 187 23820% 16% 23% 23% 25% 15% 19% 26% 16% 17% 20% 22% 18% 21% 20%
Fairly effective (3) 929 133 62 97 142 90 128 67 65 44 101 494 436 384 54544% 56% 47% 39% 43% 39% 44% 41% 44% 40% 46% 42% 46% 42% 46%
Very effective (4) 429 44 24 59 65 69 64 13 30 15 46 242 187 179 25020% 18% 18% 24% 20% 30% 22% 8% 20% 14% 21% 21% 20% 20% 21%
Don't know 156 11 8 8 16 11 31 25 21 13 13 80 76 69 877% 4% 6% 3% 5% 5% 11% 16% 14% 11% 6% 7% 8% 8% 7%
NETS
Net: Ineffective 587 51 38 82 104 60 66 56 32 38 61 346 241 276 31128% 21% 29% 33% 32% 26% 23% 35% 21% 34% 28% 30% 26% 30% 26%
Net: Effective 1358 177 86 156 207 159 193 79 96 60 146 736 622 563 79565% 74% 65% 64% 63% 69% 67% 49% 64% 54% 66% 63% 66% 62% 67%
Mean score 2.84 2.92 2.83 2.79 2.80 2.93 2.95 2.58 2.93 2.58 2.84 2.82 2.86 2.78 2.88Standard deviation .86 .75 .81 .94 .85 .96 .80 .80 .81 .97 .86 .88 .84 .90 .83Standard error .02 .05 .07 .06 .05 .06 .05 .07 .07 .10 .06 .03 .03 .04 .02
Online fieldwork: 26th March - 15th April 2015 Prepared by ComRes Ltd
Page 284
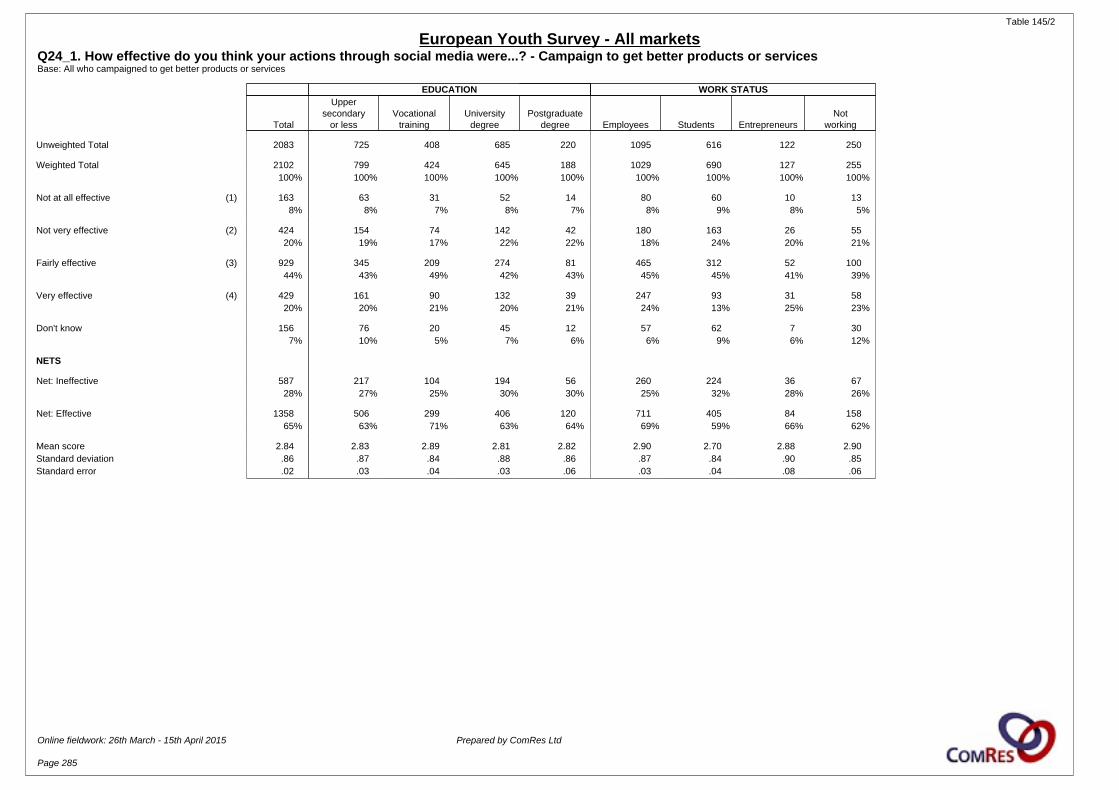
Table 145/2
European Youth Survey - All marketsQ24_1. How effective do you think your actions through social media were...? - Campaign to get better products or servicesBase: All who campaigned to get better products or services
EDUCATION WORK STATUS
Total
Uppersecondary
or lessVocational
trainingUniversity
degreePostgraduate
degree Employees Students EntrepreneursNot
working
Unweighted Total 2083 725 408 685 220 1095 616 122 250
Weighted Total 2102 799 424 645 188 1029 690 127 255100% 100% 100% 100% 100% 100% 100% 100% 100%
Not at all effective (1) 163 63 31 52 14 80 60 10 138% 8% 7% 8% 7% 8% 9% 8% 5%
Not very effective (2) 424 154 74 142 42 180 163 26 5520% 19% 17% 22% 22% 18% 24% 20% 21%
Fairly effective (3) 929 345 209 274 81 465 312 52 10044% 43% 49% 42% 43% 45% 45% 41% 39%
Very effective (4) 429 161 90 132 39 247 93 31 5820% 20% 21% 20% 21% 24% 13% 25% 23%
Don't know 156 76 20 45 12 57 62 7 307% 10% 5% 7% 6% 6% 9% 6% 12%
NETS
Net: Ineffective 587 217 104 194 56 260 224 36 6728% 27% 25% 30% 30% 25% 32% 28% 26%
Net: Effective 1358 506 299 406 120 711 405 84 15865% 63% 71% 63% 64% 69% 59% 66% 62%
Mean score 2.84 2.83 2.89 2.81 2.82 2.90 2.70 2.88 2.90Standard deviation .86 .87 .84 .88 .86 .87 .84 .90 .85Standard error .02 .03 .04 .03 .06 .03 .04 .08 .06
Online fieldwork: 26th March - 15th April 2015 Prepared by ComRes Ltd
Page 285

Table 146/1
European Youth Survey - All marketsQ24_2. How effective do you think your actions through social media were...? - Join a pressure group or consumer complaint groupBase: All who joined a pressure group or consumer complaint group
COUNTRY GENDER AGE
Total Italy Germany France Spain UKEasternEurope Baltic Nordics Sweden Benelux Male Female 18-22 22-29
Unweighted Total 2244 264 201 252 316 231 253 163 167 167 230 1238 1006 736 1508
Weighted Total 2268 269 201 258 317 236 264 161 163 169 231 1244 1024 964 1304100% 100% 100% 100% 100% 100% 100% 100% 100% 100% 100% 100% 100% 100% 100%
Not at all effective (1) 161 11 12 27 20 18 17 13 10 15 17 103 58 83 787% 4% 6% 10% 6% 8% 7% 8% 6% 9% 7% 8% 6% 9% 6%
Not very effective (2) 472 58 41 49 66 40 28 49 32 53 55 269 203 200 27221% 22% 21% 19% 21% 17% 11% 31% 20% 31% 24% 22% 20% 21% 21%
Fairly effective (3) 1030 149 93 106 136 110 128 62 75 57 113 551 479 436 59445% 55% 46% 41% 43% 47% 48% 39% 46% 34% 49% 44% 47% 45% 46%
Very effective (4) 396 37 35 60 80 59 46 13 26 11 28 231 165 154 24217% 14% 17% 23% 25% 25% 17% 8% 16% 7% 12% 19% 16% 16% 19%
Don't know 209 14 20 17 14 9 44 23 19 32 17 91 118 91 1189% 5% 10% 7% 4% 4% 17% 14% 12% 19% 7% 7% 12% 9% 9%
NETS
Net: Ineffective 633 69 53 75 86 58 46 63 43 69 73 372 262 283 35028% 25% 26% 29% 27% 25% 17% 39% 26% 41% 31% 30% 26% 29% 27%
Net: Effective 1426 187 128 166 217 169 174 76 101 68 141 782 644 590 83663% 69% 64% 64% 68% 72% 66% 47% 62% 40% 61% 63% 63% 61% 64%
Mean score 2.81 2.84 2.84 2.82 2.92 2.92 2.92 2.55 2.81 2.47 2.71 2.79 2.83 2.76 2.84Standard deviation .83 .72 .81 .93 .86 .87 .81 .80 .81 .80 .80 .86 .80 .85 .82Standard error .02 .05 .06 .06 .05 .06 .06 .07 .07 .07 .05 .03 .03 .03 .02
Online fieldwork: 26th March - 15th April 2015 Prepared by ComRes Ltd
Page 286
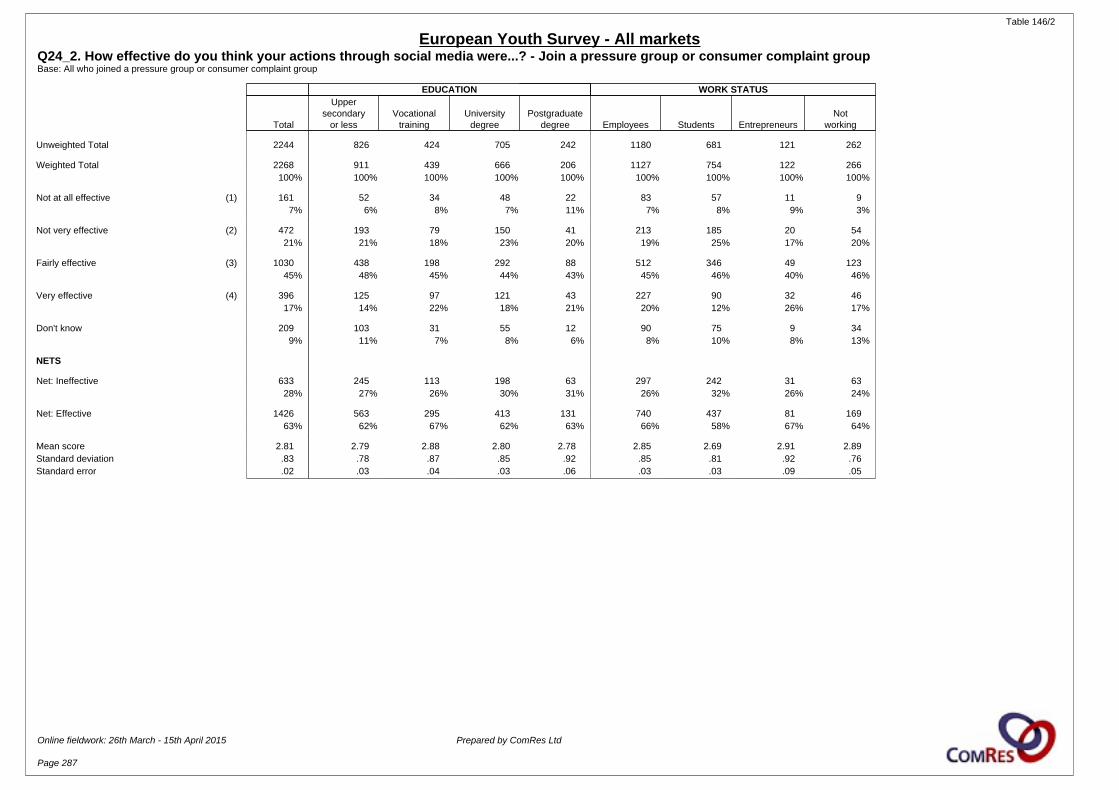
Table 146/2
European Youth Survey - All marketsQ24_2. How effective do you think your actions through social media were...? - Join a pressure group or consumer complaint groupBase: All who joined a pressure group or consumer complaint group
EDUCATION WORK STATUS
Total
Uppersecondary
or lessVocational
trainingUniversity
degreePostgraduate
degree Employees Students EntrepreneursNot
working
Unweighted Total 2244 826 424 705 242 1180 681 121 262
Weighted Total 2268 911 439 666 206 1127 754 122 266100% 100% 100% 100% 100% 100% 100% 100% 100%
Not at all effective (1) 161 52 34 48 22 83 57 11 97% 6% 8% 7% 11% 7% 8% 9% 3%
Not very effective (2) 472 193 79 150 41 213 185 20 5421% 21% 18% 23% 20% 19% 25% 17% 20%
Fairly effective (3) 1030 438 198 292 88 512 346 49 12345% 48% 45% 44% 43% 45% 46% 40% 46%
Very effective (4) 396 125 97 121 43 227 90 32 4617% 14% 22% 18% 21% 20% 12% 26% 17%
Don't know 209 103 31 55 12 90 75 9 349% 11% 7% 8% 6% 8% 10% 8% 13%
NETS
Net: Ineffective 633 245 113 198 63 297 242 31 6328% 27% 26% 30% 31% 26% 32% 26% 24%
Net: Effective 1426 563 295 413 131 740 437 81 16963% 62% 67% 62% 63% 66% 58% 67% 64%
Mean score 2.81 2.79 2.88 2.80 2.78 2.85 2.69 2.91 2.89Standard deviation .83 .78 .87 .85 .92 .85 .81 .92 .76Standard error .02 .03 .04 .03 .06 .03 .03 .09 .05
Online fieldwork: 26th March - 15th April 2015 Prepared by ComRes Ltd
Page 287

Table 147/1
European Youth Survey - All marketsQ24_3. How effective do you think your actions through social media were...? - Complain about a specific customer issue (e.g. poor customer service from hotel)Base: All who complained about a specific customer issue (e.g. poor customer service from hotel)
COUNTRY GENDER AGE
Total Italy Germany France Spain UKEasternEurope Baltic Nordics Sweden Benelux Male Female 18-22 22-29
Unweighted Total 2171 275 162 223 338 258 271 159 157 123 205 1173 998 709 1462
Weighted Total 2188 277 161 223 332 263 281 161 153 124 214 1178 1010 938 1250100% 100% 100% 100% 100% 100% 100% 100% 100% 100% 100% 100% 100% 100% 100%
Not at all effective (1) 162 17 13 25 25 16 13 17 8 10 18 102 60 85 787% 6% 8% 11% 7% 6% 5% 11% 5% 8% 8% 9% 6% 9% 6%
Not very effective (2) 462 70 34 46 65 61 56 36 30 29 35 254 208 227 23521% 25% 21% 21% 20% 23% 20% 22% 20% 23% 16% 22% 21% 24% 19%
Fairly effective (3) 977 141 82 75 149 107 130 68 68 50 106 519 457 393 58345% 51% 51% 34% 45% 41% 46% 42% 45% 41% 50% 44% 45% 42% 47%
Very effective (4) 447 39 25 67 79 70 56 15 29 21 46 240 207 172 27520% 14% 16% 30% 24% 27% 20% 9% 19% 17% 21% 20% 20% 18% 22%
Don't know 141 10 6 9 15 8 26 25 17 15 9 63 78 61 796% 4% 4% 4% 4% 3% 9% 16% 11% 12% 4% 5% 8% 7% 6%
NETS
Net: Ineffective 624 87 47 72 90 78 69 53 38 38 52 356 268 311 31329% 31% 29% 32% 27% 30% 25% 33% 25% 31% 25% 30% 27% 33% 25%
Net: Effective 1424 179 108 143 228 177 185 83 97 71 152 760 664 565 85865% 65% 67% 64% 69% 67% 66% 51% 64% 57% 71% 64% 66% 60% 69%
Mean score 2.83 2.75 2.78 2.86 2.89 2.91 2.89 2.60 2.88 2.75 2.88 2.80 2.87 2.74 2.90Standard deviation .86 .78 .82 .99 .87 .87 .80 .85 .82 .87 .85 .88 .83 .88 .83Standard error .02 .05 .07 .07 .05 .06 .05 .07 .07 .08 .06 .03 .03 .03 .02
Online fieldwork: 26th March - 15th April 2015 Prepared by ComRes Ltd
Page 288
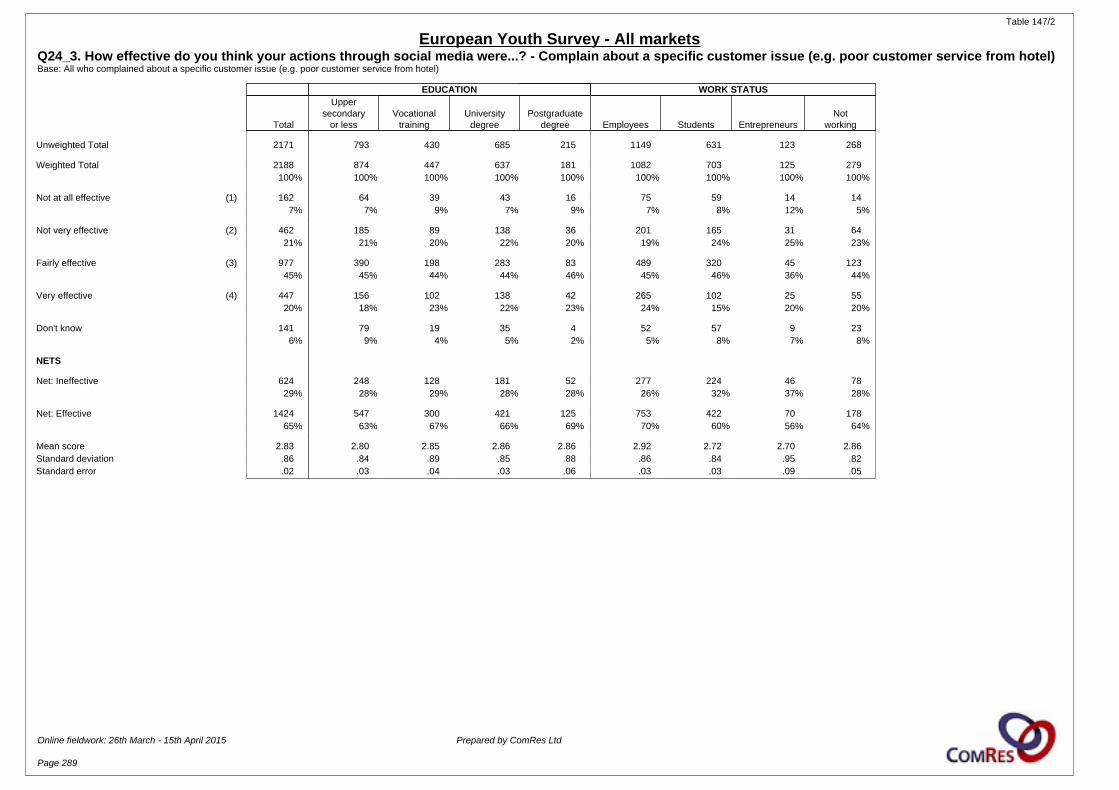
Table 147/2
European Youth Survey - All marketsQ24_3. How effective do you think your actions through social media were...? - Complain about a specific customer issue (e.g. poor customer service from hotel)Base: All who complained about a specific customer issue (e.g. poor customer service from hotel)
EDUCATION WORK STATUS
Total
Uppersecondary
or lessVocational
trainingUniversity
degreePostgraduate
degree Employees Students EntrepreneursNot
working
Unweighted Total 2171 793 430 685 215 1149 631 123 268
Weighted Total 2188 874 447 637 181 1082 703 125 279100% 100% 100% 100% 100% 100% 100% 100% 100%
Not at all effective (1) 162 64 39 43 16 75 59 14 147% 7% 9% 7% 9% 7% 8% 12% 5%
Not very effective (2) 462 185 89 138 36 201 165 31 6421% 21% 20% 22% 20% 19% 24% 25% 23%
Fairly effective (3) 977 390 198 283 83 489 320 45 12345% 45% 44% 44% 46% 45% 46% 36% 44%
Very effective (4) 447 156 102 138 42 265 102 25 5520% 18% 23% 22% 23% 24% 15% 20% 20%
Don't know 141 79 19 35 4 52 57 9 236% 9% 4% 5% 2% 5% 8% 7% 8%
NETS
Net: Ineffective 624 248 128 181 52 277 224 46 7829% 28% 29% 28% 28% 26% 32% 37% 28%
Net: Effective 1424 547 300 421 125 753 422 70 17865% 63% 67% 66% 69% 70% 60% 56% 64%
Mean score 2.83 2.80 2.85 2.86 2.86 2.92 2.72 2.70 2.86Standard deviation .86 .84 .89 .85 .88 .86 .84 .95 .82Standard error .02 .03 .04 .03 .06 .03 .03 .09 .05
Online fieldwork: 26th March - 15th April 2015 Prepared by ComRes Ltd
Page 289