Embed Size (px)
Citation preview

TASMANIA
• UBERTAS•ET•FIDELITAS •
TASMANIA
• UBERTAS•ET•FIDELITAS •
TASMANIA
• UBERTAS•ET•FIDELITAS •
TASMANIA
• UBERTAS•ET•FIDELITAS •
TASMANIA
• UBERTAS•ET•FIDELITAS •
TASMANIA
• UBERTAS•ET•FIDELITAS •
Tasmanian sTaTe service
employee survey reporT 2007
survey reporTconducTed by:
The Tasmanian sTaTe
service commissioner
Office of the State Service Commissioner144 Macquarie StreetGPO Box 621, Hobart, 7001Tasmania AustraliaWebsite: www.ossc.tas.gov.auTelephone: 03 6233 3637Facsimile: 03 6233 2693Email: [email protected]

Report Produced By: The Office of the State Service Commissioner
Published November 2007
Copyright – Office of the State Service Commissioner
Contributing Authors: Nick Vrisakis, Dr Peter Langford, Sarah Locke, Simon Mingo Voice Project, Department of Psychology, Macquarie University
Print: ISSN 1833-0703
Permission to copy is granted provided the source is acknowledged
Contact: Office of the State Service Commissioner
Level 2/144 Macquarie Street GPO Box 621, Hobart, 7001 Tasmania, Australia
Telephone: 03 6233 3637 Email: [email protected] Facsimile: 03 6233 2693
TASMANIAN STATE SERVICE EMPLOYEE SURVEY REPORT 2007 59
Contents of this CD
1. State Service Employee Survey Report 2007
2. State Service Employee Survey 2007 Pamphlet – Summary of Findings
3. State Service Principles
4. Commissioner’s Direction No. 2 – State Service Principles
5. State Service Code of Conduct
6. Commissioner’s Direction No. 5 – Procedures for investigation and determination of whether an employee has breached the Code of Conduct
7. State Service Commissioner’s Annual Report 2005-2006
8. State Service Commissioner’s Annual Report 2006-2007
TASMANIAN STATE SERVICE EMPLOYEE SURVEY REPORT 2007 1
Contents
Commissioner’s Foreword 2
Acknowledgements 3
1.0 Executive Summary 4
1.1 Background 4
1.2 Key positive findings 4
1.3 Key opportunities for improvement 5
1.4 Next steps 7
2.0 Background 8
2.1 State Service Act 2000 8
2.2 Survey methodology 8
2.3 Scoring of responses 9
2.4 Response rates 9
2.5 Sample profile 10
3.0 Overall Results 17
3.1 Awareness of Principles
and Code of Conduct 17
3.2 Category scores for 14 Principles 17
4.0 Apolitical, Impartial & Ethical 19
5.0 Accountable For Actions & Performance 20
6.0 Community Service & Fairness 21
7.0 Managing Performance 22
8.0 Employment Based On Merit 25
9.0 Application For Employment Open To All 28
10.0 Equity In Employment 29
11.0 Discrimination Free & Diversity Recognised 30
12.0 Quality Leadership 34
13.0 Employee Consultation & Input Encouraged 35
14.0 Safe Workplace 37
15.0 Flexible Workplace 38
16.0 Rewarding Workplace 39
17.0 Fair Internal Grievance Resolution System 43
Additional Results 45
18.0 Part 2 of the Survey 46
19.0 Top 10 and bottom 10 items compared to the 2005 Survey 47
20.0 Gap analysis & key driver analysis 49
Appendix 1 – State Service Employee Survey 51
Appendix 2 – Contents of this CD 59
2 TASMANIAN STATE SERVICE EMPLOYEE SURVEY REPORT 2007
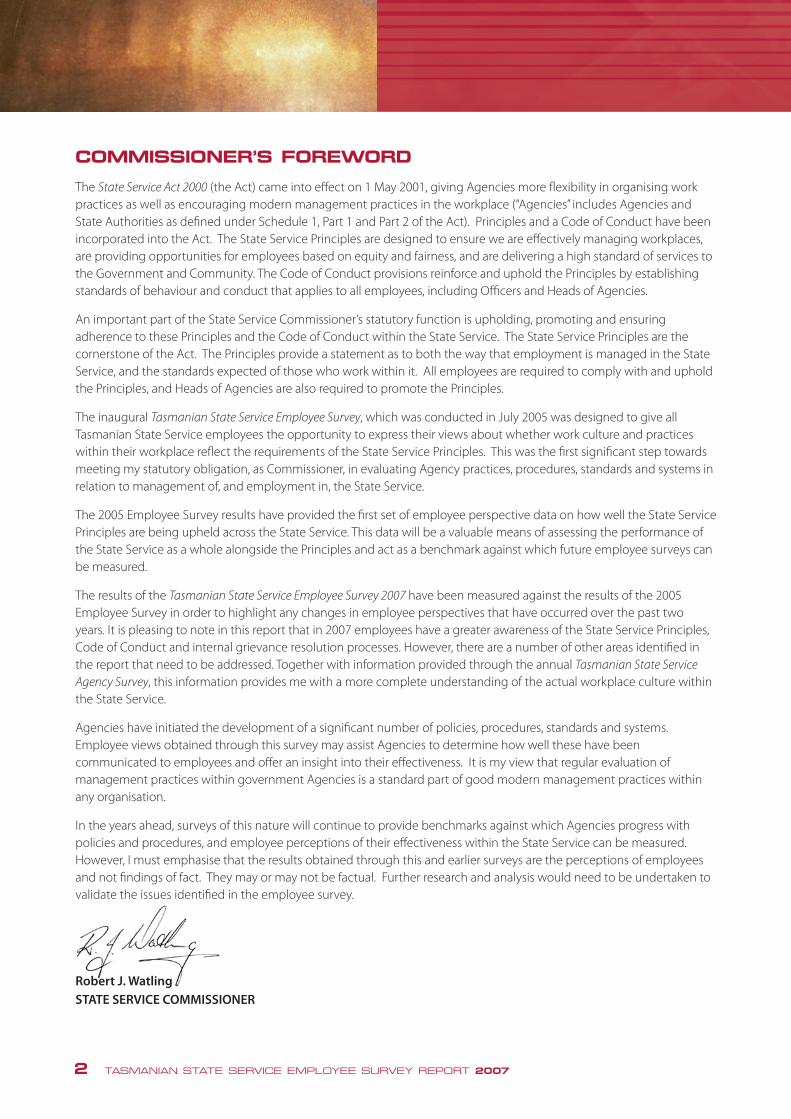
COMMISSIONER’S FOREWORD
The State Service Act 2000 (the Act) came into effect on 1 May 2001, giving Agencies more flexibility in organising work practices as well as encouraging modern management practices in the workplace (“Agencies” includes Agencies and State Authorities as defined under Schedule 1, Part 1 and Part 2 of the Act). Principles and a Code of Conduct have been incorporated into the Act. The State Service Principles are designed to ensure we are effectively managing workplaces, are providing opportunities for employees based on equity and fairness, and are delivering a high standard of services to the Government and Community. The Code of Conduct provisions reinforce and uphold the Principles by establishing standards of behaviour and conduct that applies to all employees, including Officers and Heads of Agencies.
An important part of the State Service Commissioner’s statutory function is upholding, promoting and ensuring adherence to these Principles and the Code of Conduct within the State Service. The State Service Principles are the cornerstone of the Act. The Principles provide a statement as to both the way that employment is managed in the State Service, and the standards expected of those who work within it. All employees are required to comply with and uphold the Principles, and Heads of Agencies are also required to promote the Principles.
The inaugural Tasmanian State Service Employee Survey, which was conducted in July 2005 was designed to give all Tasmanian State Service employees the opportunity to express their views about whether work culture and practices within their workplace reflect the requirements of the State Service Principles. This was the first significant step towards meeting my statutory obligation, as Commissioner, in evaluating Agency practices, procedures, standards and systems in relation to management of, and employment in, the State Service.
The 2005 Employee Survey results have provided the first set of employee perspective data on how well the State Service Principles are being upheld across the State Service. This data will be a valuable means of assessing the performance of the State Service as a whole alongside the Principles and act as a benchmark against which future employee surveys can be measured.
The results of the Tasmanian State Service Employee Survey 2007 have been measured against the results of the 2005 Employee Survey in order to highlight any changes in employee perspectives that have occurred over the past two years. It is pleasing to note in this report that in 2007 employees have a greater awareness of the State Service Principles, Code of Conduct and internal grievance resolution processes. However, there are a number of other areas identified in the report that need to be addressed. Together with information provided through the annual Tasmanian State Service Agency Survey, this information provides me with a more complete understanding of the actual workplace culture within the State Service.
Agencies have initiated the development of a significant number of policies, procedures, standards and systems. Employee views obtained through this survey may assist Agencies to determine how well these have been communicated to employees and offer an insight into their effectiveness. It is my view that regular evaluation of management practices within government Agencies is a standard part of good modern management practices within any organisation.
In the years ahead, surveys of this nature will continue to provide benchmarks against which Agencies progress with policies and procedures, and employee perceptions of their effectiveness within the State Service can be measured. However, I must emphasise that the results obtained through this and earlier surveys are the perceptions of employees and not findings of fact. They may or may not be factual. Further research and analysis would need to be undertaken to validate the issues identified in the employee survey.
Robert J. Watling STATE SERVICE COMMISSIONER
TASMANIAN STATE SERVICE EMPLOYEE SURVEY REPORT 2007 3
Acknowledgements
I would like to acknowledge the assistance provided by Dr Peter Langford B Sc Psych Hons, M Clin Psych, MBA, PhD, Director, Voice Project, Department of Psychology, Macquarie University, NSW and the contributing authors from the Psychology Department, who assisted in the Tasmanian State Service Employee Survey 2007, as well as conducted the independent analysis of the data obtained through the Survey and the specific findings outlined in this report. Their technical expertise and input was much appreciated.
I would also like to acknowledge the support and assistance provided by all Agencies and the unions in promoting and encouraging employees to pass on their views by completing the Tasmania State Service Employee Survey 2007.
Finally I want to thank and acknowledge the efforts or Mr Ian Wilcox from my office, who managed this project.
4 TASMANIAN STATE SERVICE EMPLOYEE SURVEY REPORT 2007
1. EXECUTIVE SUMMARY
1.1 Background
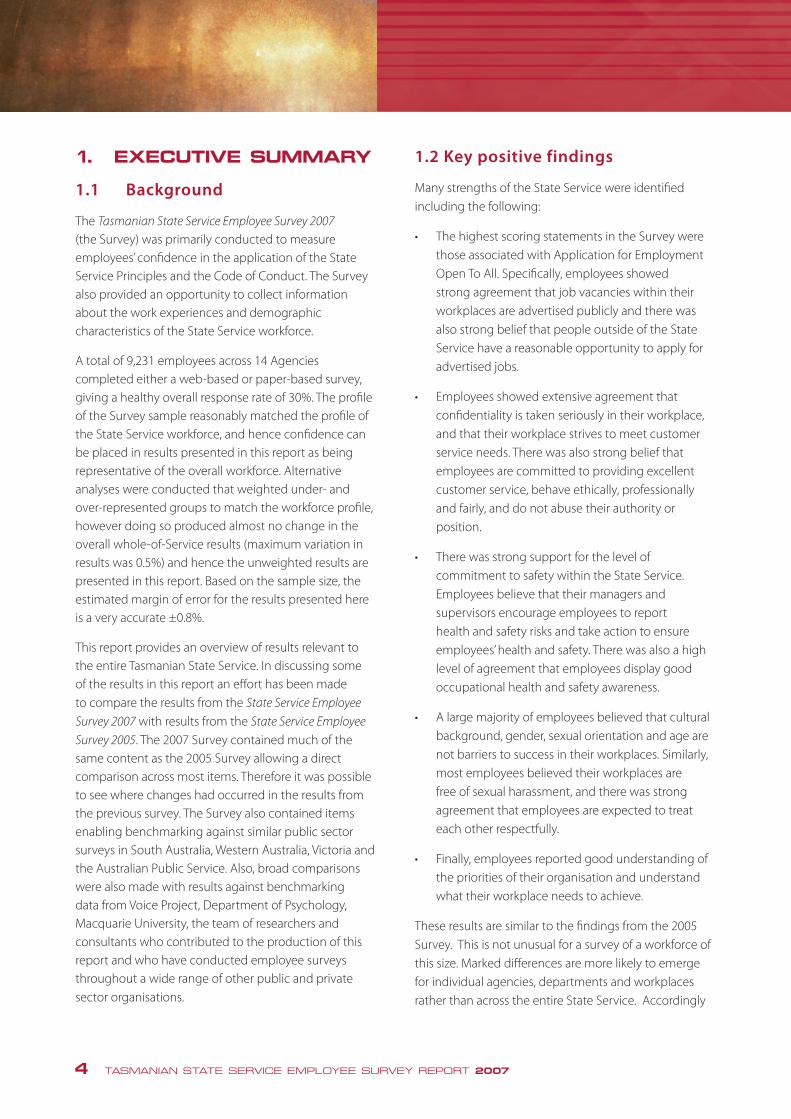
The Tasmanian State Service Employee Survey 2007 (the Survey) was primarily conducted to measure employees’ confidence in the application of the State Service Principles and the Code of Conduct. The Survey also provided an opportunity to collect information about the work experiences and demographic characteristics of the State Service workforce.
A total of 9,231 employees across 14 Agencies completed either a web-based or paper-based survey, giving a healthy overall response rate of 30%. The profile of the Survey sample reasonably matched the profile of the State Service workforce, and hence confidence can be placed in results presented in this report as being representative of the overall workforce. Alternative analyses were conducted that weighted under- and over-represented groups to match the workforce profile, however doing so produced almost no change in the overall whole-of-Service results (maximum variation in results was 0.5%) and hence the unweighted results are presented in this report. Based on the sample size, the estimated margin of error for the results presented here is a very accurate ±0.8%.
This report provides an overview of results relevant to the entire Tasmanian State Service. In discussing some of the results in this report an effort has been made to compare the results from the State Service Employee
Survey 2007 with results from the State Service Employee
Survey 2005. The 2007 Survey contained much of the same content as the 2005 Survey allowing a direct comparison across most items. Therefore it was possible to see where changes had occurred in the results from the previous survey. The Survey also contained items enabling benchmarking against similar public sector surveys in South Australia, Western Australia, Victoria and the Australian Public Service. Also, broad comparisons were also made with results against benchmarking data from Voice Project, Department of Psychology, Macquarie University, the team of researchers and consultants who contributed to the production of this report and who have conducted employee surveys throughout a wide range of other public and private sector organisations.
1.2 Key positive findings
Many strengths of the State Service were identified including the following:
• ThehighestscoringstatementsintheSurveywerethose associated with Application for Employment Open To All. Specifically, employees showed strong agreement that job vacancies within their workplaces are advertised publicly and there was also strong belief that people outside of the State Service have a reasonable opportunity to apply for advertised jobs.
• Employeesshowedextensiveagreementthatconfidentiality is taken seriously in their workplace, and that their workplace strives to meet customer service needs. There was also strong belief that employees are committed to providing excellent customer service, behave ethically, professionally and fairly, and do not abuse their authority or position.
• Therewasstrongsupportforthelevelofcommitment to safety within the State Service. Employees believe that their managers and supervisors encourage employees to report health and safety risks and take action to ensure employees’ health and safety. There was also a high level of agreement that employees display good occupational health and safety awareness.
• Alargemajorityofemployeesbelievedthatculturalbackground, gender, sexual orientation and age are not barriers to success in their workplaces. Similarly, most employees believed their workplaces are free of sexual harassment, and there was strong agreement that employees are expected to treat each other respectfully.
• Finally,employeesreportedgoodunderstandingofthe priorities of their organisation and understand what their workplace needs to achieve.
These results are similar to the findings from the 2005 Survey. This is not unusual for a survey of a workforce of this size. Marked differences are more likely to emerge for individual agencies, departments and workplaces rather than across the entire State Service. Accordingly
TASMANIAN STATE SERVICE EMPLOYEE SURVEY REPORT 2007 5
a comparison was made between the 2007 and 2005 Surveys to determine where there had been increases or decreases from the 2005 Survey. A comparison for all items and Principles was not possible as the 2007 Survey included some items that were not included in the 2005 Survey. In accordance with best practice for employee surveys, direct comparisons are only made where the item or category content is identical.
The main improvements compared to the 2005 Survey were:
• Agreaterpercentageofemployeesreportedanawareness of State Service principles and the State Service Code of Conduct.
• Employeesindicatedagreaterawarenessofformalprocesses or procedures for resolving grievances and disputes in their workplace.
• Therewasstrongerbeliefthatacademicqualifications and achievements are valued in the workplace.
• Therewasalsoastrongerbeliefintheview that effort is invested in matching services to customer needs.
1.3 Key opportunities for improvement
Overall, as was the case for the 2005 Survey, the results in this report are similar to, and some areas better than, results from large-scale surveys of other public and private sector organisations. The results suggest there are opportunities for improvement in the following areas:
• Aswasfoundinthe2005Survey,approximatelyhalf of the workforce showed uncertainty or disagreement that employment decisions were based primarily on merit, and a similar number did not agree that recruitment and promotion decisions were fair. Related concerns were a lack of confidence in the people who serve on selection panels, and being unsure that people with the right knowledge, skills and abilities are chosen for vacancies. As was highlighted in the 2005 report, employee surveys such as the State Service Employee Survey will never
demonstrate universal support for recruitment and promotion processes because of the limited number of promotion opportunities within organisations (for example, those employees who have had an unsuccessful job application showed significantly less confidence in recruitment and selection decisions). Nevertheless, the scores shown in this report suggest there may be some room for improvement on these issues. Interestingly, as for the 2005 Survey, those employees who have participated on a selection panel showed noticeably greater confidence in recruitment and selection processes. It should be noted that there has been an increase in the percentage of respondents participating on a selection panel; this participation over time may increase confidence in recruitment and selection processes, although such an increase was not evident across the 2005 and 2007 Surveys.
• Mirroringresultsfromthe2005Survey,ofallthe issues measured in the Survey, employees showed their lowest level of confidence in the way their managers handle employees who are performing poorly. Similarly, approximately only half of employees agreed that good performance was sufficiently recognised. As was suggested in the 2005 report, a potential reason for this lack of confidence is that many employees believe that managers and supervisors give insufficient feedback about performance. Once again, matching results from the 2005 Survey, the 2007 Survey found that those employees who have had a sit-down performance management discussion with their manager or supervisor reported noticeably greater overall confidence in the way performance is managed.
• Asmentionedpreviously,therewasanoticeableincrease in awareness of, and confidence, in formal grievance handling procedures. Nevertheless, still only half of the workforce has confidence in the formal processes and in the way their manager would handle grievances. Only a minority of employees felt confidence in these processes and felt that they would not suffer any negative consequences if they lodged a grievance. Additionally, compared to the 2005 Survey results,
6 TASMANIAN STATE SERVICE EMPLOYEE SURVEY REPORT 2007
there was a decrease in employees’ confidence regarding their manager’s or supervisor’s capacity to deal with grievances and disputes in the workplace.
• Themajorityofemployeesshowedsupportforthe quality of leadership within their workplace. Also, more employees felt that leadership was of a high standard than they did in the 2005 Survey. Nevertheless, a large minority of employees expressed a lack of confidence regarding leadership quality and a majority lacked confidence in the way change is managed. It should be noted that leadership is commonly a poorly performing section of many employee surveys, in part because employees often have insufficient knowledge of their senior leaders to have strong confidence in their abilities. A further possible reason identified in the current survey for this lack of confidence might be the lack of opportunities for leadership training reported by some employees.
• Comparedtothe2005results,slightlyfeweremployees are reporting satisfaction with their workload, although there is evidence that levels of stress have marginally decreased. Overall, only half of the workforce is reporting being satisfied with workload and stress levels.
• Mostemployeesreportedtheirworkplacesasbeingfree of bullying or harassment. Nevertheless, a significant minority of employees disagreed. Indeed, reports of experiencing bullying or harassment have marginally increased since the 2005 Survey. As was found in 2005, there is a significant correlation between personal experience of bullying or harassment and overall satisfaction levels. In the 2007 Survey, a far more detailed set of questions was included to improve understanding of the source and nature of bullying and harassment. Bullying and harassment are perceived to be equally enacted by fellow employees as well as managers and supervisors, and to a still significant but noticeably lesser extent by clients. The most common forms of bullying and harassment are
intimidating and aggressive body language, shouting and offensive verbal behaviour, verbal threats, persistent criticism, sarcasm and humiliation, gossip and rumours being spread, inequitable treatment, withholding information, and being isolated and ostracised.
• Finally,agapanalysisandkeydriveranalysiswereconducted to explore the potential priorities arising from the Survey. The two issues identified by both of the analyses as being key areas for improvement were building a fair internal grievance resolution system and creating a more rewarding workplace. These two issues were also highlighted in the 2005 report, providing confirmation of the need to continue pursuing improvements in these areas. Other potential priorities identified by either the gap analysis or the key driver analysis included better managing performance, encouraging employee consultation and input, strengthening the perception of merit in recruitment and promotion decisions, improving confidence in leadership, creating greater recognition of diversity and enhancing the perception of the State Service being apolitical, impartial and ethical.
The main decreases compared to the 2005 Survey were:
• Asmallerpercentagefeltthatemployeesintheirworkplace are committed to helping to achieve in the workplace’s goals.
• Feweremployeesfeltcomfortableapproachingtheir manager/supervisor to discuss a workplace grievance or dispute. Similarly, fewer employees also felt that their manager or supervisor was skilled enough to effectively resolve grievances and disputes that arise in the workplace.
• Aslightlysmallerpercentageofemployees felt that their workplace was free of bullying and/or harassment.
• Therewerefeweremployeeswhofeltthattheir
workload was at the right level.

TASMANIAN STATE SERVICE EMPLOYEE SURVEY REPORT 2007 7
1.4 Next steps
One of the highest priorities immediately following any employee survey is the distribution of results to managers, employees and other critical stakeholders. Senior managers need to understand the results for the entire State Service as well as for their own area of responsibility. Most employees will not want to know the detailed results of the Survey but they will want to know the key findings and the actions that will be taken to address at least some of the identified areas for improvement.
A substantial challenge following any large-scale employee survey is planning actions to be taken across the entire organisation level as well as actions specific to individual agencies. Following communication of results to senior executives within each agency, these same senior executives need to decide upon both global and local interventions to address agreed priorities. Action plans need to be developed and monitored, with senior executives taking responsibility for fulfilling the plans and reporting progress towards achieving set goals.

8 TASMANIAN STATE SERVICE EMPLOYEE SURVEY REPORT 2007
2. Background
2.1 State Service Act 2000
The State Service Act 2000 (the Act) was enacted in
December 2000 and commenced on 1 May 2001,
following a review of the Tasmanian State Service Act
1984. The intention of the Act is to provide a professional
State Service that is equitable, flexible, forward looking
and accountable, while providing the best possible
services to the Government and the community.
The Act, which is supplemented and supported by
State Service Regulations 2001, Ministerial Directions,
Commissioner’s Directions, Commissioner’s Advices and
Agency-based Standing Orders, includes a number of
innovative features.
Key amongst these is that all employment decisions in
the State Service are to be based on merit. There is a
revised definition of merit that provides the increased
flexibility needed to address past concerns about
merit, workplace diversity, succession planning and
employment-related decision-making.
In addition, the Act introduced a set of State Service
Principles that provides overarching statements
concerning the values of the State Service, the nature
of its operations and what is expected of those within
it. Many of these Principles had been implicit in the
expectations of managers and employees in the past but
now they have been specified in legislation in a way that
clearly indicates to members of the community what
they can expect from their State Service.
Accountability, leadership, ethical behaviour, merit,
workplace diversity, fairness and flexibility have all
been included in these Principles. The State Service
Commissioner, Heads of Agencies, holders of prescribed
offices, senior executives and employees are all required
to uphold them.
Another significant innovation in the Act is a Code of
Conduct. This Code compliments the State Service
Principles and clearly sets out the standards of behaviour
that are expected from Heads of Agencies, holders of
prescribed offices, senior executives and employees.
This Code reverses the previous provisions where issues of conduct were expressed negatively in terms of discipline and offences and enables agencies to develop specific conduct provisions appropriate to their operational requirements.
The Act has also established revised procedures for the investigation and determination of alleged breaches of the Code of Conduct. These provisions aim to ensure procedural fairness in the determination of any alleged breach and where a breach has occurred, provided a range of sanctions from counselling to termination of employment.
2.2 Survey methodology
The survey was developed specifically to meet the needs of the Tasmanian State Service and in particular to assess the performance of the State Service against the State Service Principles and Code of Conduct within the State
Service Act 2000.
The initial survey content was developed and refined in 2005 by the Office of the State Service Commissioner. The 2007 Survey was based primarily on the 2005 Survey; however, some amendments were made based on the review of the 2005 Survey and in consultation with stakeholders and between Voice Project at Macquarie University and the Office of the State Service Commissioner.
The Survey comprised three parts and can be viewed in its entirety in Appendix 1. Part 1 explored employees’ awareness of the State Service Principles and Code of Conduct, and assessed employees’ level of agreement (on a five-point Strongly Agree to Strongly Disagree rating scale) with 73 statements associated with the State Service Principles.
Part 2 of the Survey involved 13 Yes-No statements on which employees reported their experiences with events including job applications, selection processes, performance management, bullying and/or harassment, grievance processes, and recreational leave. Some of these Yes-No statements had branching questions if employees answered Yes to an initial question.
Part 3 of the Survey requested background information about employees, including information about gender,

TASMANIAN STATE SERVICE EMPLOYEE SURVEY REPORT 2007 9
age, place of birth, first language, identification as being
Aboriginal or Torres Strait Islander, having a disability
and whether the disability required a work-related
adjustment, length of service for the Service and their
Agency, employment status, management status, salary,
education, caring responsibilities, retirement intentions,
and region of work within Tasmania.
Employees’ answers to Parts 2 and 3 of the Survey
were used to analyse differences in confidence in
the Principles across groups with different working
experiences and backgrounds.
2.3 Scoring of responses
The primary score that is used to report employees’
confidence in the application of the Principles is the
percentage of employees who agreed or strongly
agreed with the statements regarding the Principles.
For example, the score for the statement “Confidentiality
of information is taken seriously in my workplace” is
84% indicating that 84% of employees answered
Agree or Strongly Agree with this particular statement.
It should be noted that this result does not mean
that 16% of employees disagreed – for this particular
statement, 8% of employees answered “Neither Agree
Or Disagree” (the middle of the five response options)
and only 8% of employees answered Disagree or Strongly
Disagree. Employees who did not answer a question or
responded “Don’t know” are not included in calculations
of “% Agree & Strongly Agree” or “% Yes”.
The 73 Agree-Disagree statements in Part 1 of the
Survey were sorted into 14 categories, with each
category representing a Principle within the State Service
Act 2000. The 14 Principles can be seen in the Survey
shown in Appendix 1. Scores for these Principles were
calculated by averaging the scores for all statements
within the category. For example, statements 1.3, 1.4,
1.5 and 1.6 were all grouped into a Principle called
“Apolitical, Impartial & Ethical”; a score for this Principle
was calculated by averaging the scores for the four
statements within the category. The bulk of this report is
structured around these 14 Principles, with each Principle
having its own section within this report. Within each
section the results are shown for the overall category
(highlighted in blue) and for individual statements.
2.4 Response rates
The overall response rate across the whole State Service
was 30%, with 9,231 responses received from the 30,682
employees who were given the opportunity to complete
the Survey. Surveys were forwarded to employees in
each agency who had a current employment contract
as at the date of the Survey being conducted. This group
included those employees who may have had a current
employment contract but may not have been at work
at the time of the Survey. From a statistical point of view,
and given the very large and diverse workforce that
was being targeted, 30% can be regarded as a strong
response rate. The response rate was slightly higher for
the web-based Survey (32%) than it was for the paper-
based Survey (26%). While this was lower than the
response rate for the 2005 Survey (38%), it still affords a
very high degree of confidence in that data.
The response rates for individual Agencies are shown in
Figure 2.1. Although not universally the case, response
rates tended to be higher for the smaller Agencies and
lower for the larger Agencies, which is a typical finding
for employee surveys given that larger workforces
are harder to communicate with and motivate to
complete the Survey. The Department of Treasury and
Finance and the Department of Primary Industries and
Water produced the highest response rates of 67%
and 60% respectively, while the lowest response rates
were reported by the Department of Education and
TAFE Tasmania with response rates of 23% and 28%
respectively.
As is shown in the following section, the demographic
profile of the employees who completed the Survey
closely matches the demographic profile of the overall
workforce. Given the strong response rate and the
representativeness of the Survey sample, the results
can be confidently assumed to accurately represent the
entire State Service. Given this assumption, the response
rate of 30% for the overall Service provides a very small
margin of error of ±0.8%; that is, the true scores for the
whole Service can be confidently assumed to be within
a range of 0.8% lower and 0.7% higher than the scores
presented in this report.
10 TASMANIAN STATE SERVICE EMPLOYEE SURVEY REPORT 2007
2.5 Sample profile
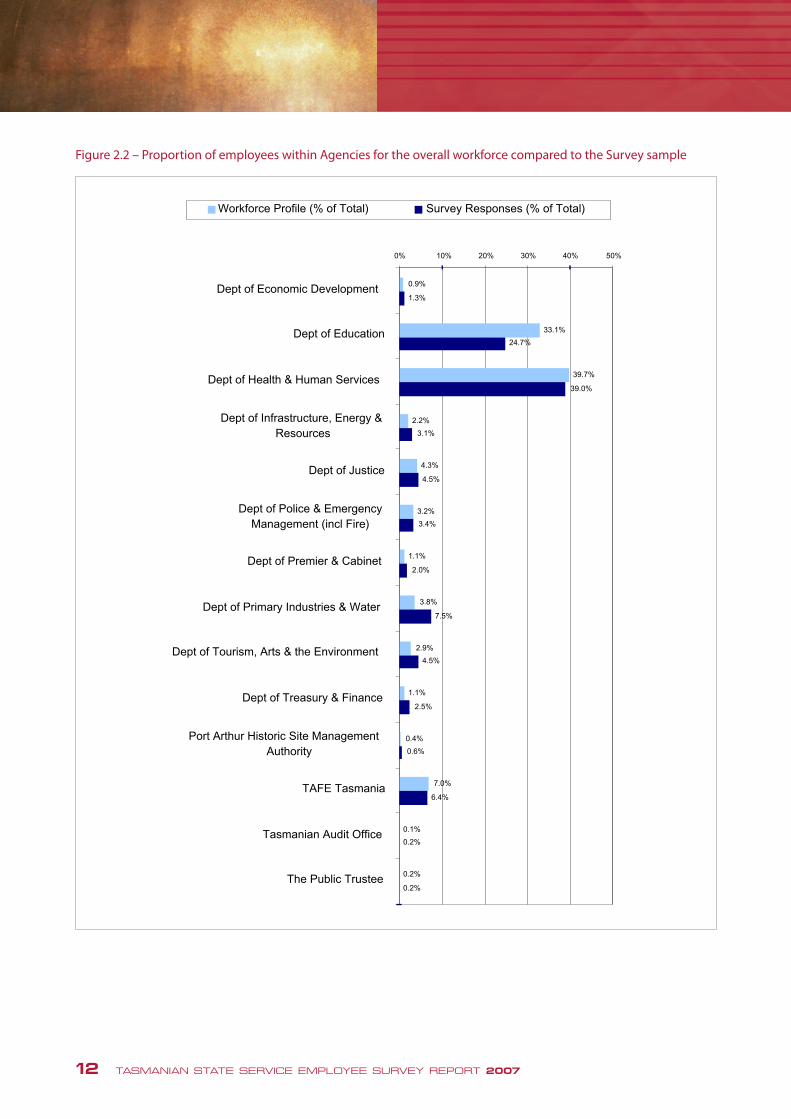
Figures 2.2, 2.3 and 2.4 compare the characteristics
of the overall State Service workforce with the Survey
sample. To a very large extent the workforce profile
closely matches the sample profile. Nevertheless, there
are some differences. The Survey sample is slightly
under-represented by the Department of Education
(this may have been due to the Department of
Education recently undergoing another survey) and
slightly over-represented by the Department of Primary
Industries and Water (see Figure 2.2). Employees with
less than 1 year tenure and 1 year in Agency (Figure 2.3)
are slightly under-represented, employees with more
than 20 years service are slightly over-represented.
Employees in the salary range $65,000 - $69,999 are
also slightly under-represented. Part-time employees
(Figure 2.3) and fixed- term employees are also slightly
under-represented.
Figure 2.5 shows further details of the Survey sample.
As shown in Figure 2.5, 14% of the Survey sample were
born overseas, 4% do not have English as their first
language, 2% have an Aboriginal or Torres Strait Islander
background, 7% have a disability, 23% are managers or
supervisors, 48% have a degree and a further 25% have a
TAFE qualification, 34% care for a child and 49% have no
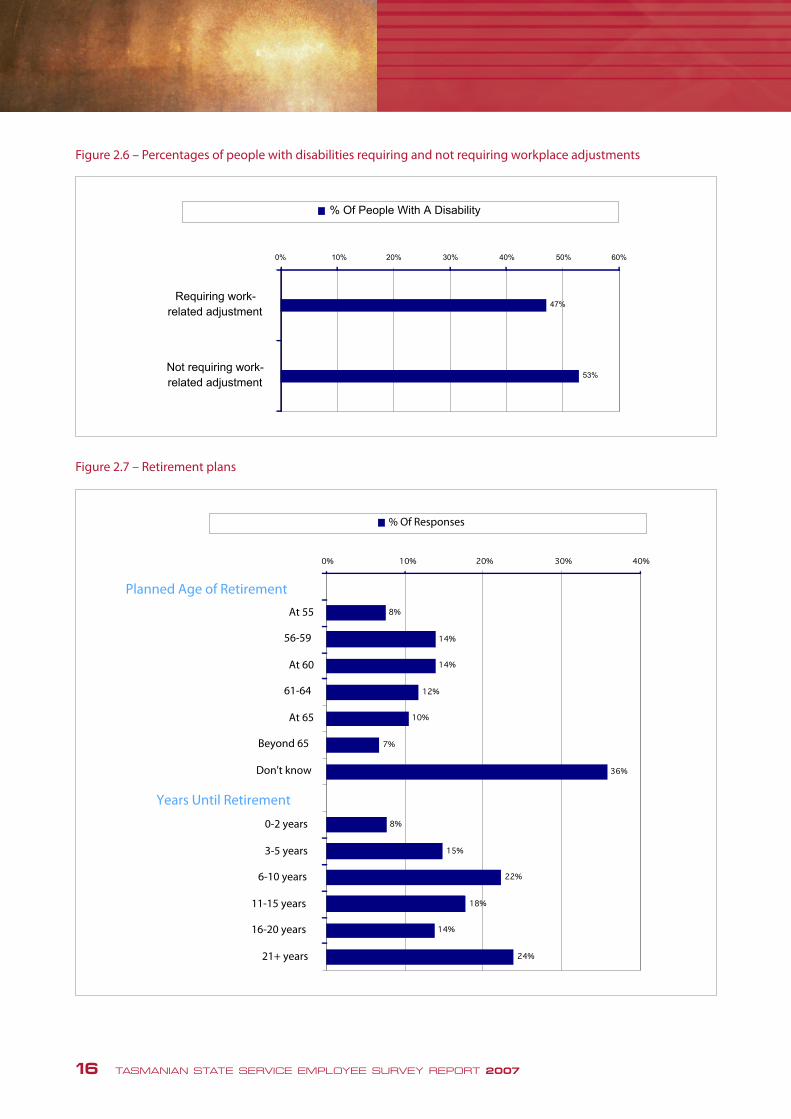
caring responsibilities. Figure 2.6 indicates that of those
who have a disability approximately half require a work
related adjustment.
Finally, employees were asked about their retirement
plans. Responses are shown in Figure 2.7, with 28%
planning to retire between the ages of 56 and 60 and
a further 8% planning to retire at age 55; however 36%
of respondents are still uncertain regarding the age
they will retire. By combining employees’ current age
with their planned age of retirement it was possible to
calculate the number of years until retirement. As shown
in Figure 2.7, 23% of employees are planning to retire
within the next 5 years and a further 22% are planning to
retire within 6 to 10 years, giving a total of 45% planning
to retire within the next 10 years. This represents a
2% decrease on the corresponding figures for the
2005 Survey, suggesting that there may be a trend
towards delaying retirement amongst the Tasmanian
State Service.

TASMANIAN STATE SERVICE EMPLOYEE SURVEY REPORT 2007 11
Figure 2.1 – Response rates for the State Service and individual Agencies
Tasmanian State Service Employee Survey Report 2007 12
Figure 2.1 – Response rates for the State Service and individual Agencies
30%
40%
23%
30%
43%
32%
33%
53%
60%
48%
67%
43%
28%
44%
44%
0% 10% 20% 30% 40% 50% 60% 70% 80%
WHOLE OF SERVICE
Dept of Economic Development
Dept of Education
Dept of Health & Human Services
Dept of Infrastructure, Energy &
Resources
Dept of Justice
Dept of Police & EmergencyManagement (incl Fire)
Dept of Premier & Cabinet
Dept of Primary Industries & Water
Dept of Tourism, Arts & the Environment
Dept of Treasury & Finance
Port Arthur Historic Site Management
Authority
TAFE Tasmania
Tasmanian Audit Office
The Public Trustee
Overall response rate
12 TASMANIAN STATE SERVICE EMPLOYEE SURVEY REPORT 2007
Figure 2.2 – Proportion of employees within Agencies for the overall workforce compared to the Survey sample
Tasmanian State Service Employee Survey Report 2007 13
Figure 2.2 – Proportion of employees within Agencies for the overall workforce comparedto the survey sample
0.9%
33.1%
39.7%
2.2%
4.3%
3.2%
1.1%
3.8%
2.9%
1.1%
0.4%
7.0%
0.1%
0.2%
1.3%
24.7%
39.0%
3.1%
4.5%
3.4%
2.0%
7.5%
4.5%
2.5%
0.6%
6.4%
0.2%
0.2%
0% 10% 20% 30% 40% 50%
Dept of Economic Development
Dept of Education
Dept of Health & Human Services
Dept of Infrastructure, Energy &Resources
Dept of Justice
Dept of Police & EmergencyManagement (incl Fire)
Dept of Premier & Cabinet
Dept of Primary Industries & Water
Dept of Tourism, Arts & the Environment
Dept of Treasury & Finance
Port Arthur Historic Site ManagementAuthority
TAFE Tasmania
Tasmanian Audit Office
The Public Trustee
Workforce Profile (% of Total) Survey Responses (% of Total)

TASMANIAN STATE SERVICE EMPLOYEE SURVEY REPORT 2007 13
Figure 2.3 – Comparison of the workforce profile against the Survey sample profile for gender, age, length of service, and full-time/part-time status
Tasmanian State Service Employee Survey Report 2007 15
33%
67%
0%
4%
7%
9%
12%
14%
18%
17%
12%
5%
2%
9%
26%
21%
11%
12%
21%
9%
30%
21%
11%
11%
17%
62%
38%
33%
67%
0%
3%
6%
8%
12%
14%
18%
19%
13%
6%
2%
4%
22%
23%
12%
12%
28%
5%
29%
24%
11%
11%
20%
69%
31%
0% 10% 20% 30% 40% 50% 60% 70% 80%
Male employees
Female employees
15-19
20-24
25-29
30-34
35-39
40-44
45-49
50-54
55-59
60-64
65+
Less than 1 year
1-4 years
5-10 years
11-14 years
15-19 years
More than 20 years
Less than 1 year
1-4 years
5-10 years
11-14 years
15-19 years
More than 20 years
Full-time employees
Part-time employees
Workforce Profile Survey Responses
Gender
Age
Years in Service
Years in Agency
Employment Status

14 TASMANIAN STATE SERVICE EMPLOYEE SURVEY REPORT 2007
Figure 2.4 – Comparison of the workforce profile against the Survey sample profile for employment category, salary, region, and survey method
Tasmanian State Service Employee Survey Report 2007 16
Figure 2.4 – Comparison of the workforce profile against the survey sample profile foremployment category, salary, region, and survey method
1%
70%
29%
1%
0%
0%
0%
10%
15%
9%
8%
6%
9%
7%
18%
6%
5%
2%
1%
1%
0%
2%
58%
25%
17%
0%
72%
28%
2%
79%
19%
3%
2%
3%
3%
7%
10%
10%
9%
9%
7%
10%
10%
7%
3%
3%
1%
1%
1%
2%
60%
24%
16%
0%
76%
24%
0% 10% 20% 30% 40% 50% 60% 70% 80%
Senior executive
Permanent
Fixed term
Earning < $15,000
$15,000 - 19,999
$20,000 - 24,999
$25,000 – 29,999
$30,000 – 34,999
$35,000 – 39,999
$40,000 – 44,999
$45,000 – 49,999
$50,000 – 54,999
$55,000 – 59,999
$60,000 – 64,999
$65,000 – 69,999
$70,000 – 74,999
$75,000 – 79,999
$80,000 – 84,999
$85,000 – 89,999
$90,000 – 94,999
$95,000 – 99,999
More than $100,000
South (incl south-east)
North (incl north-east)
North West (incl west)
Outside Tasmania
Online surveys
Paper based surveys
Workforce Profile Survey Responses
Employment Category
Salary
Region
Survey Method

TASMANIAN STATE SERVICE EMPLOYEE SURVEY REPORT 2007 15
Figure 2.5 – Sample characteristics for place of birth, first language, ATSI background, disability, manager status, education, and caring responsibilities
Tasmanian State Service Employee Survey Report 2007 17
Figure 2.5 – Sample characteristics for place of birth, �rst language, ATSI background,disability, manager status, education, and caring responsibilities
86%
14%
96%
4%
2%
98%
7%
93%
23%
77%
3%
16%
29%
12%
13%
9%
16%
1%
0%
34%
6%
4%
49%
6%
0% 10% 20% 30% 40% 50% 60% 70% 80% 90% 100%
Australia
Outside Australia
Yes
No
Yes
No
Disability
No disability
Manager or supervisor
Not a manager
Postgraduate research degree
Postgraduate coursework degree
Bachelor degree (incl Honours)
TAFE diploma
TAFE certi�cate
Matriculation or HSC (Year 12)
High school (Year 10)
Primary education
None
Child or children
Elderly relatives(s)
Any other person
No caring responsibilities
More than one option chosen
% Of Responses
Place of Birth
English First Language
ATSI Background
Disability
Manager/Supervisor
Education
Caring Responsibility
16 TASMANIAN STATE SERVICE EMPLOYEE SURVEY REPORT 2007
Figure 2.6 – Percentages of people with disabilities requiring and not requiring workplace adjustments
Figure 2.7 – Retirement plans
Tasmanian State Service Employee Survey Report 2007 18
Figure 2.6 – Percentages of people with disabilities requiring and not requiring workplaceadjustments
47%
53%
0% 10% 20% 30% 40% 50% 60%
Requiring work-related adjustment
Not requiring work-related adjustment
% Of People With A Disability
Tasmanian State Service Employee Survey Report 2007 19
Figure 2.7 – Retirement plans
8%
14%
14%
12%
10%
7%
36%
8%
15%
22%
18%
14%
24%
0% 10% 20% 30% 40%
At 55
56-59
At 60
61-64
At 65
Beyond 65
Don't know
0-2 years
3-5 years
6-10 years
11-15 years
16-20 years
21+ years
% Of Responses
Planned Age of Retirement
Years Until Retirement
TASMANIAN STATE SERVICE EMPLOYEE SURVEY REPORT 2007 17
3. Overall Results
3.1 Awareness of Principles and Code of Conduct
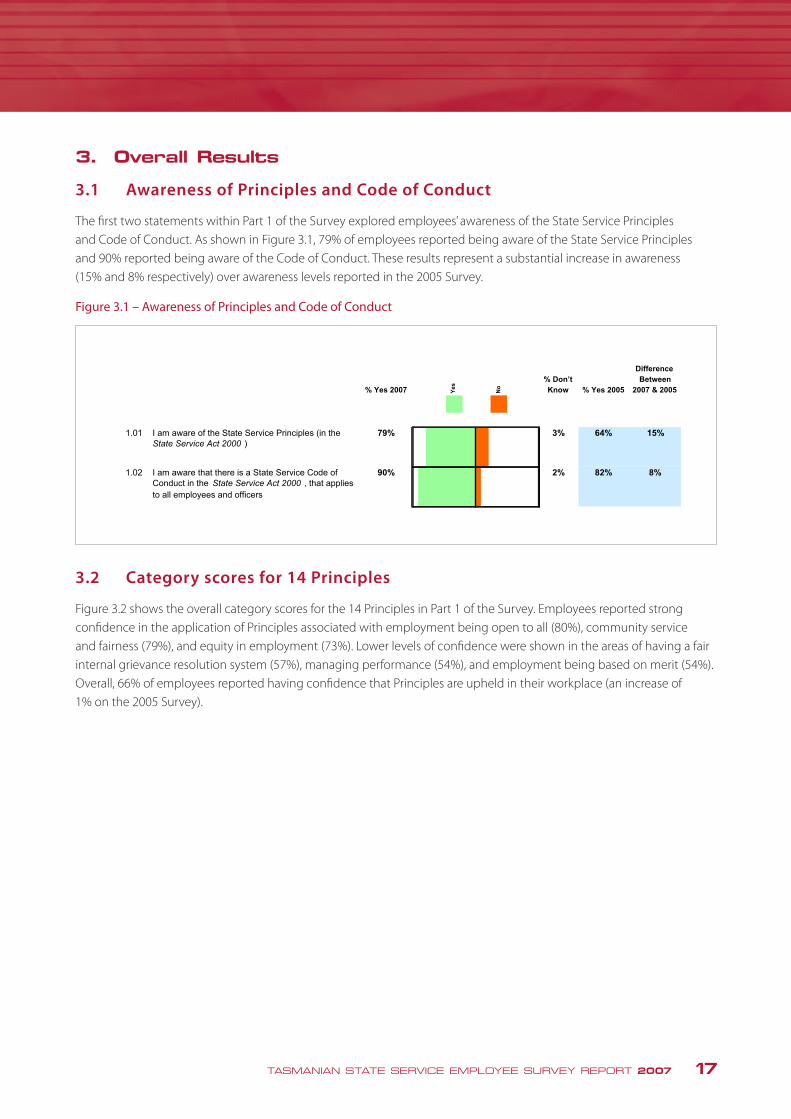
The first two statements within Part 1 of the Survey explored employees’ awareness of the State Service Principles and Code of Conduct. As shown in Figure 3.1, 79% of employees reported being aware of the State Service Principles and 90% reported being aware of the Code of Conduct. These results represent a substantial increase in awareness (15% and 8% respectively) over awareness levels reported in the 2005 Survey.
Figure 3.1 – Awareness of Principles and Code of Conduct
3.2 Category scores for 14 Principles
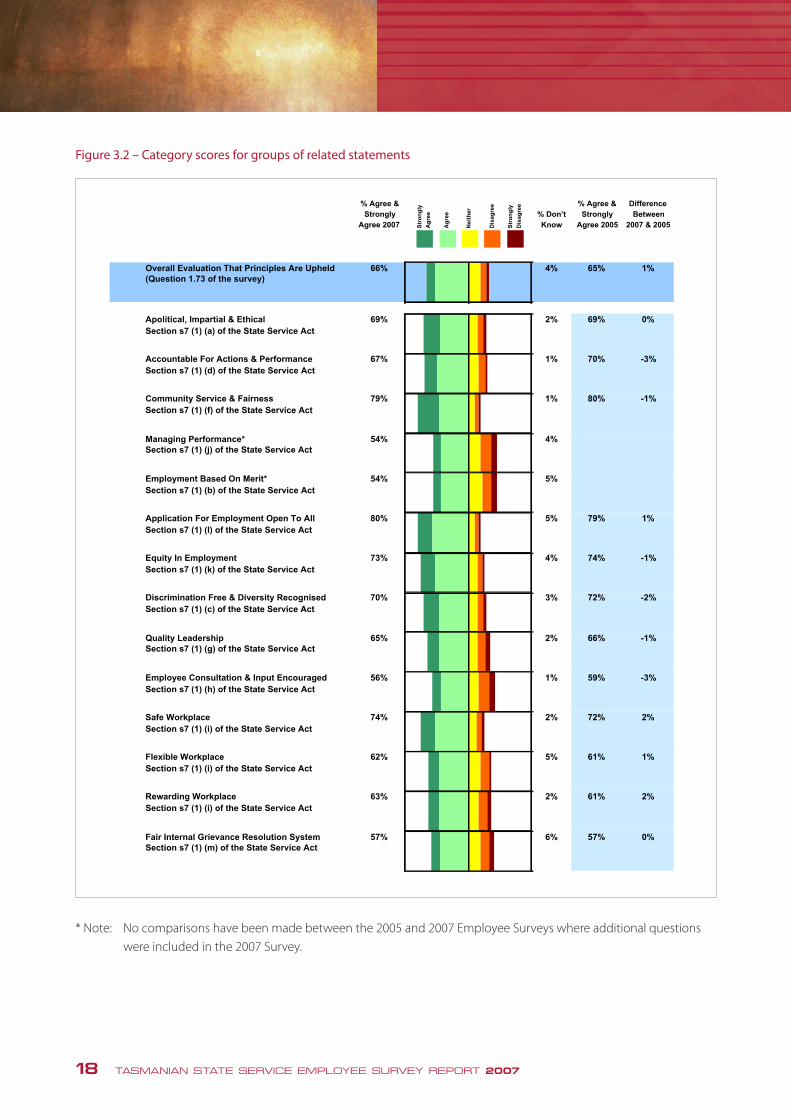
Figure 3.2 shows the overall category scores for the 14 Principles in Part 1 of the Survey. Employees reported strong confidence in the application of Principles associated with employment being open to all (80%), community service and fairness (79%), and equity in employment (73%). Lower levels of confidence were shown in the areas of having a fair internal grievance resolution system (57%), managing performance (54%), and employment being based on merit (54%). Overall, 66% of employees reported having confidence that Principles are upheld in their workplace (an increase of 1% on the 2005 Survey).
Tasmanian State Service Employee Survey Report 2007 20
3.0 Overall Results
3.1 Awareness of Principles and Code of Conduct
The first two statements within Part 1 of the survey explored employees’ awareness of the StateService Principles and Code of Conduct. As shown in Figure 3.1, 79% of employees reportedbeing aware of the State Service Principles and 90% reported being aware of the Code ofConduct. These results represent a substantial increase in awareness (15% and 8%respectively) over awareness levels reported in the 2005 survey.
Figure 3.1 – Awareness of Principles and Code of Conduct
% Yes 2007
% Don’t
Know % Yes 2005
Difference
Between
2007 & 2005Ye
s
No
1.01 I am aware of the State Service Principles (in the
State Service Act 2000 )
79% 3% 64% 15%
1.02 I am aware that there is a State Service Code of
Conduct in the State Service Act 2000 , that applies
to all employees and officers
90% 2% 82% 8%
3.2 Category scores for 14 Principles
Figure 3.2 shows the overall category scores for the 14 Principles in Part 1 of the survey.Employees reported strong confidence in the application of Principles associated withemployment being open to all (80%), community service and fairness (79%), and equity inemployment (73%). Lower levels of confidence were shown in the areas of having a fair internalgrievance resolution system (57%), managing performance (54%), and employment beingbased on merit (54%). Overall, 66% of employees reported having confidence that Principlesare upheld in their workplace (an increase of 1% on the 2005 survey).
18 TASMANIAN STATE SERVICE EMPLOYEE SURVEY REPORT 2007
Figure 3.2 – Category scores for groups of related statements
* Note: No comparisons have been made between the 2005 and 2007 Employee Surveys where additional questions were included in the 2007 Survey.
Tasmanian State Service Employee Survey Report 2007 21
Figure 3.2 – Category scores for groups of related statements
% Agree &
Strongly
Agree 2007
% Don’t
Know
% Agree &
Strongly
Agree 2005
Difference
Between
2007 & 2005Str
on
gly
Dis
ag
ree
Str
on
gly
Ag
ree
Ag
ree
Ne
ith
er
Dis
ag
ree
Overall Evaluation That Principles Are Upheld
(Question 1.73 of the survey)
66% 4% 65% 1%
Apolitical, Impartial & Ethical
Section s7 (1) (a) of the State Service Act
69% 2% 69% 0%
Accountable For Actions & Performance
Section s7 (1) (d) of the State Service Act
67% 1% 70% -3%
Community Service & Fairness
Section s7 (1) (f) of the State Service Act
79% 1% 80% -1%
Managing Performance*
Section s7 (1) (j) of the State Service Act
54% 4%
Employment Based On Merit*
Section s7 (1) (b) of the State Service Act
54% 5%
Application For Employment Open To All
Section s7 (1) (l) of the State Service Act
80% 5% 79% 1%
Equity In Employment
Section s7 (1) (k) of the State Service Act
73% 4% 74% -1%
Discrimination Free & Diversity Recognised
Section s7 (1) (c) of the State Service Act
70% 3% 72% -2%
Quality Leadership
Section s7 (1) (g) of the State Service Act
65% 2% 66% -1%
Employee Consultation & Input Encouraged
Section s7 (1) (h) of the State Service Act
56% 1% 59% -3%
Safe Workplace
Section s7 (1) (i) of the State Service Act
74% 2% 72% 2%
Flexible Workplace
Section s7 (1) (i) of the State Service Act
62% 5% 61% 1%
Rewarding Workplace
Section s7 (1) (i) of the State Service Act
63% 2% 61% 2%
Fair Internal Grievance Resolution System
Section s7 (1) (m) of the State Service Act
57% 6% 57% 0%
* Note: No comparisons have been made between the 2005 and 2007 employee surveys whereadditional questions were included in the 2007 survey.

TASMANIAN STATE SERVICE EMPLOYEE SURVEY REPORT 2007 19
4. Apolitical, Impartial & Ethical
Section 7(1)(a) of the State Service Act 2000 states: “the State Service is apolitical, performing its functions in an impartial,
ethical and professional manner”. The results for this Principle are shown in Figure 4.1.
Figure 4.1 – Apolitical, impartial & ethical
• EmployeesgenerallyagreedthattheirAgencyandtheServiceactsinanapolitical,impartialandethicalmanner.
• Mostemployees(67-68%)agreedthattheirmanagerorsupervisortakesappropriateactiontocorrectinappropriatebehaviour of others and encourages employees to avoid conflicts of interest.
• Aslightlylargerpercentage(83%)ofemployeesbelievedtheirorganisationencouragesemployeestobehavein an ethical manner, whereas only 59% believed that decisions were fair, objective and ethical.
Tasmanian State Service Employee Survey Report 2007 22
4.0 Apolitical, Impartial & Ethical
Section 7(1)(a) of the State Service Act 2000 states: “the State Service is apolitical, performingits functions in an impartial, ethical and professional manner”. The results for this Principle areshown in Figure 4.1.
Figure 4.1 – Apolitical, impartial & ethical
% Agree &
Strongly
Agree 2007
% Don’t
Know
% Agree &
Strongly
Agree 2005
Difference
Between
2007 & 2005Str
on
gly
Dis
ag
ree
Str
on
gly
Ag
ree
Ag
ree
Ne
ith
er
Dis
ag
ree
Apolitical, Impartial & Ethical
Section s7 (1) (a) of the State Service Act
69% 2% 69% 0%
1.03 My organisation actively encourages all employees
to behave in an ethical manner
83% 1% 82% 1%
1.04 In my workplace, decisions about all work matters
are made fairly, objectively and ethically
59% 1% 60% -1%
1.05 My manager/supervisor would take appropriate
action if decisions being made about work matters
were not objective, fair and ethical
67% 2% 69% -2%
1.06 My manager/supervisor encourages employees to
avoid conflicts of interest
68% 3% 66% 2%
• Employees generally agreed that their Agency and the Service acts in an apolitical,impartial and ethical manner.
• Most employees (67-68%) agreed that their manager or supervisor takes appropriate actionto correct inappropriate behaviour of others and encourages employees to avoid conflicts ofinterest.
• A slightly larger percentage (83%) of employees believed their organisation encouragesemployees to behave in an ethical manner, whereas only 59% believed that decisions werefair, objective and ethical.
20 TASMANIAN STATE SERVICE EMPLOYEE SURVEY REPORT 2007
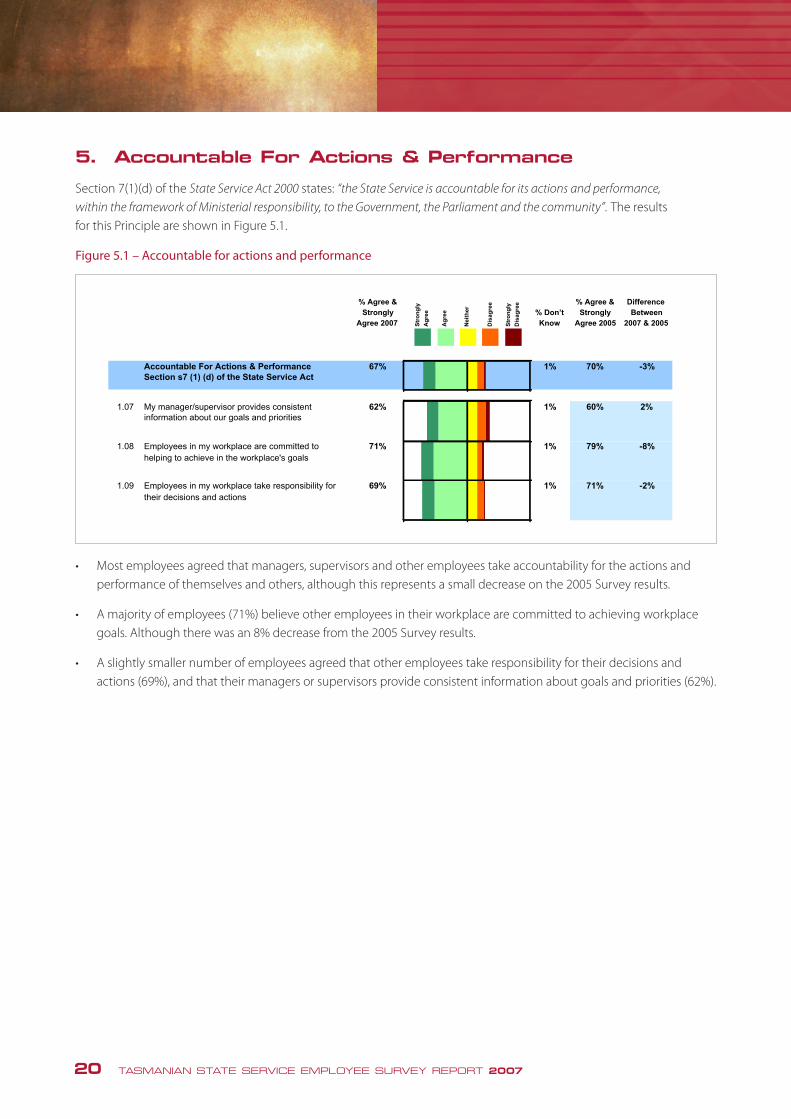
• Mostemployeesagreedthatmanagers,supervisorsandotheremployeestakeaccountabilityfortheactionsandperformance of themselves and others, although this represents a small decrease on the 2005 Survey results.
• Amajorityofemployees(71%)believeotheremployeesintheirworkplacearecommittedtoachievingworkplacegoals. Although there was an 8% decrease from the 2005 Survey results.
• Aslightlysmallernumberofemployeesagreedthatotheremployeestakeresponsibilityfortheirdecisionsandactions (69%), and that their managers or supervisors provide consistent information about goals and priorities (62%).
5. Accountable For Actions & Performance
Section 7(1)(d) of the State Service Act 2000 states: “the State Service is accountable for its actions and performance,
within the framework of Ministerial responsibility, to the Government, the Parliament and the community”. The results for this Principle are shown in Figure 5.1.
Figure 5.1 – Accountable for actions and performance
Tasmanian State Service Employee Survey Report 2007 23
5.0 Accountable For Actions & Performance
Section 7(1)(d) of the State Service Act 2000 states: “the State Service is accountable for itsactions and performance, within the framework of Ministerial responsibility, to the Government,the Parliament and the community”. The results for this Principle are shown in Figure 5.1.
Figure 5.1 – Accountable for actions and performance
% Agree &
Strongly
Agree 2007
% Don’t
Know
% Agree &
Strongly
Agree 2005
Difference
Between
2007 & 2005Str
on
gly
Dis
ag
ree
Str
on
gly
Ag
ree
Ag
ree
Ne
ith
er
Dis
ag
ree
Accountable For Actions & Performance
Section s7 (1) (d) of the State Service Act
67% 1% 70% -3%
1.07 My manager/supervisor provides consistent
information about our goals and priorities
62% 1% 60% 2%
1.08 Employees in my workplace are committed to
helping to achieve in the workplace's goals
71% 1% 79% -8%
1.09 Employees in my workplace take responsibility for
their decisions and actions
69% 1% 71% -2%
• Most employees agreed that managers, supervisors and other employees takeaccountability for the actions and performance of themselves and others, although thisrepresents a small decrease on the 2005 survey results.
• A majority of employees (71%) believe other employees in their workplace are committed toachieving workplace goals. Although there was an 8% decrease from the 2005 surveyresults.
• A slightly smaller number of employees agreed that other employees take responsibility fortheir decisions and actions (69%), and that their managers or supervisors provideconsistent information about goals and priorities (62%).

TASMANIAN STATE SERVICE EMPLOYEE SURVEY REPORT 2007 21
6. Community Service & Fairness
Section 7(1)(f ) of the State Service Act 2000 states: “the State Service delivers services fairly and impartially to the community”. The results for this Principle are shown in Figure 6.1.
Figure 6.1 – Community service and fairness
• Employeesshowedstrongsupportforthelevelofcommunityserviceandfairnessdemonstratedwithintheiragencyand the Service.
• Alargemajorityofemployees(84%)agreedthatconfidentialityofinformationistakenseriously.
• Employeesalsostronglybelieved(80-82%)thatemployeesintheirworkplaceactethicallyandprofessionally towards customers, are committed to excellent customer service, and do not abuse their position when dealing with customers.
• Whilestillshowinganadequatescore,alowerpercentageofemployees(66%)believedthattheirworkplaceusescustomer feedback to improve service delivery.
• Generallyemployeesshowedmarginallylesssupportforthisareathaninthe2005Surveyalthoughthepercentageof employees who felt that their workplace strives to match customer service needs has increased from 2005.
Tasmanian State Service Employee Survey Report 2007 24
6.0 Community Service & Fairness
Section 7(1)(f) of the State Service Act 2000 states: “the State Service delivers services fairlyand impartially to the community”. The results for this Principle are shown in Figure 6.1.
Figure 6.1 – Community service and fairness
% Agree &
Strongly
Agree 2007
% Don’t
Know
% Agree &
Strongly
Agree 2005
Difference
Between
2007 & 2005Str
on
gly
Dis
ag
ree
Str
on
gly
Ag
ree
Ag
ree
Ne
ith
er
Dis
ag
ree
Community Service & Fairness
Section s7 (1) (f) of the State Service Act
79% 1% 80% -1%
1.10 My workplace strives to match services to customer
needs
82% 1% 78% 4%
1.11 Employees in my workplace are committed to
providing excellent customer service
81% 1% 82% -1%
1.12 In my workplace, we use feedback from our
customers and clients to improve the services we
deliver
66% 2% 69% -3%
1.13 Employees in my workplace behave ethically,
professionally and fairly when making decisions that
affect their clients and customers
80% 1% 83% -3%
1.14 Confidentiality of information is taken seriously in my
workplace
84% 1% 86% -2%
1.15 Employees in my workplace do not abuse their
authority or position when dealing with customers or
clients
82% 1% 83% -1%
• Employees showed strong support for the level of community service and fairnessdemonstrated within their agency and the Service.
• A large majority of employees (84%) agreed that confidentiality of information is takenseriously.
• Employees also strongly believed (80-82%) that employees in their workplace act ethicallyand professionally towards customers, are committed to excellent customer service, and donot abuse their position when dealing with customers.
• While still showing an adequate score, a lower percentage of employees (66%) believedthat their workplace uses customer feedback to improve service delivery.
• Generally employees showed marginally less support for this area than in the 2005 surveyalthough the percentage of employees who felt that their workplace strives to matchcustomer service needs has increased from 2005.
22 TASMANIAN STATE SERVICE EMPLOYEE SURVEY REPORT 2007
7. Managing Performance
Section 7(1)(j) of the State Service Act 2000 states: “the State Service focuses on managing its performance and achieving
results”. The results for this Principle are shown in Figure 7.1.
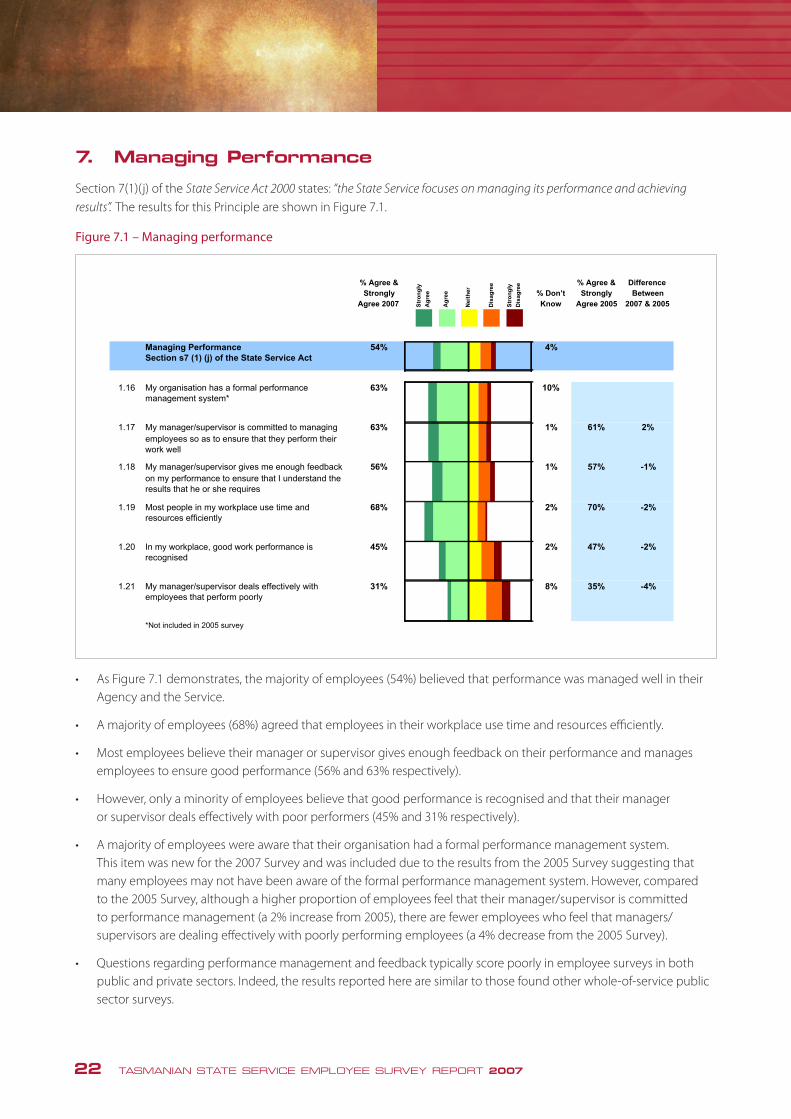
Figure 7.1 – Managing performance
• AsFigure7.1demonstrates,themajorityofemployees(54%)believedthatperformancewasmanagedwellintheirAgency and the Service.
• Amajorityofemployees(68%)agreedthatemployeesintheirworkplaceusetimeandresourcesefficiently.
• Mostemployeesbelievetheirmanagerorsupervisorgivesenoughfeedbackontheirperformanceandmanagesemployees to ensure good performance (56% and 63% respectively).
• However,onlyaminorityofemployeesbelievethatgoodperformanceisrecognisedandthattheirmanager or supervisor deals effectively with poor performers (45% and 31% respectively).
• Amajorityofemployeeswereawarethattheirorganisationhadaformalperformancemanagementsystem. This item was new for the 2007 Survey and was included due to the results from the 2005 Survey suggesting that many employees may not have been aware of the formal performance management system. However, compared to the 2005 Survey, although a higher proportion of employees feel that their manager/supervisor is committed to performance management (a 2% increase from 2005), there are fewer employees who feel that managers/supervisors are dealing effectively with poorly performing employees (a 4% decrease from the 2005 Survey).
• Questionsregardingperformancemanagementandfeedbacktypicallyscorepoorlyinemployeesurveysinbothpublic and private sectors. Indeed, the results reported here are similar to those found other whole-of-service public sector surveys.
Tasmanian State Service Employee Survey Report 2007 25
7.0 Managing Performance
Section 7(1)(j) of the State Service Act 2000 states: “the State Service focuses on managing itsperformance and achieving results”. The results for this Principle are shown in Figure 7.1.
Figure 7.1 – Managing performance
% Agree &
Strongly
Agree 2007
% Don’t
Know
% Agree &
Strongly
Agree 2005
Difference
Between
2007 & 2005Str
on
gly
Dis
ag
ree
Str
on
gly
Ag
ree
Ag
ree
Ne
ith
er
Dis
ag
ree
Managing Performance
Section s7 (1) (j) of the State Service Act
54% 4%
1.16 My organisation has a formal performance
management system*
63% 10%
1.17 My manager/supervisor is committed to managing
employees so as to ensure that they perform their
work well
63% 1% 61% 2%
1.18 My manager/supervisor gives me enough feedback
on my performance to ensure that I understand the
results that he or she requires
56% 1% 57% -1%
1.19 Most people in my workplace use time and
resources efficiently
68% 2% 70% -2%
1.20 In my workplace, good work performance is
recognised
45% 2% 47% -2%
1.21 My manager/supervisor deals effectively with
employees that perform poorly
31% 8% 35% -4%
*Not included in 2005 survey
• As Figure 7.1 demonstrates, the majority of employees (54%) believed that performancewas managed well in their Agency and the Service.
• A majority of employees (68%) agreed that employees in their workplace use time andresources efficiently.
• Most employees believe their manager or supervisor gives enough feedback on theirperformance and manages employees to ensure good performance (57% and 63%respectively).
• However, only a minority of employees believe that good performance is recognised andthat their manager or supervisor deals effectively with poor performers (45% and 31%respectively).
• A majority of employees were aware that their organisation had a formal performancemanagement system. This item was new for the 2007 survey and was included due to theresults from the 2005 survey suggesting that many employees may not have been aware ofthe formal performance management system. However, compared to the 2005 survey,although a higher proportion of employees feel that their manager/supervisor is committedto performance management (a 2% increase from 2005), there are fewer employees who

TASMANIAN STATE SERVICE EMPLOYEE SURVEY REPORT 2007 23
Figure 7.2 – Performance management experience against confidence in performance management processes
• AsshowninFigure7.2,thoseemployeeswhohaveparticipatedinaformalperformancemanagementdiscussionwith their manager or supervisor have noticeably stronger confidence in the way performance is managed in their workplace (as was the case for the 2005 Survey).
Tasmanian State Service Employee Survey Report 2007 26
feel that managers/supervisors are dealing effectively with poorly performing employees (a4% decrease from the 2005 survey).
Questions regarding performance management and feedback typically score poorly inemployee surveys in both public and private sectors. Indeed, the results reported here aresimilar to those found other whole-of-service public sector surveys.
Figure 7.2 – Performance management experience against confidence in performancemanagement processes
"I have participated in a formal 'sit-down' performance management discussion with my manager/supervisor"
65%
84%
73%
70%
70%
52%
39%
48%
48%
57%
46%
66%
41%
26%
0% 10% 20% 30% 40% 50% 60% 70% 80% 90% 100%
Managing Performance
Section s7 (1) (j) of the State Service Act
My organisation has a formal performance managementsystem
My manager/supervisor is committed to managingemployees so as to ensure that they perform their work well
My manager/supervisor gives me enough feedback on my
performance to ensure that I understand the results that heor she requires
Most people in my workplace use time and resourcesefficiently
In my workplace, good work performance is recognised
My manager/supervisor deals effectively with employees
that perform poorly
% Agree & Strongly Agree
Yes - Had Performance Management Discussion
No - Not Had Performance Management Discussion
As shown in Figure 7.2, those employees who have participated in a formal performancemanagement discussion with their manager or supervisor have noticeably strongerconfidence in the way performance is managed in their workplace (as was the case for the2005 survey).
24 TASMANIAN STATE SERVICE EMPLOYEE SURVEY REPORT 2007
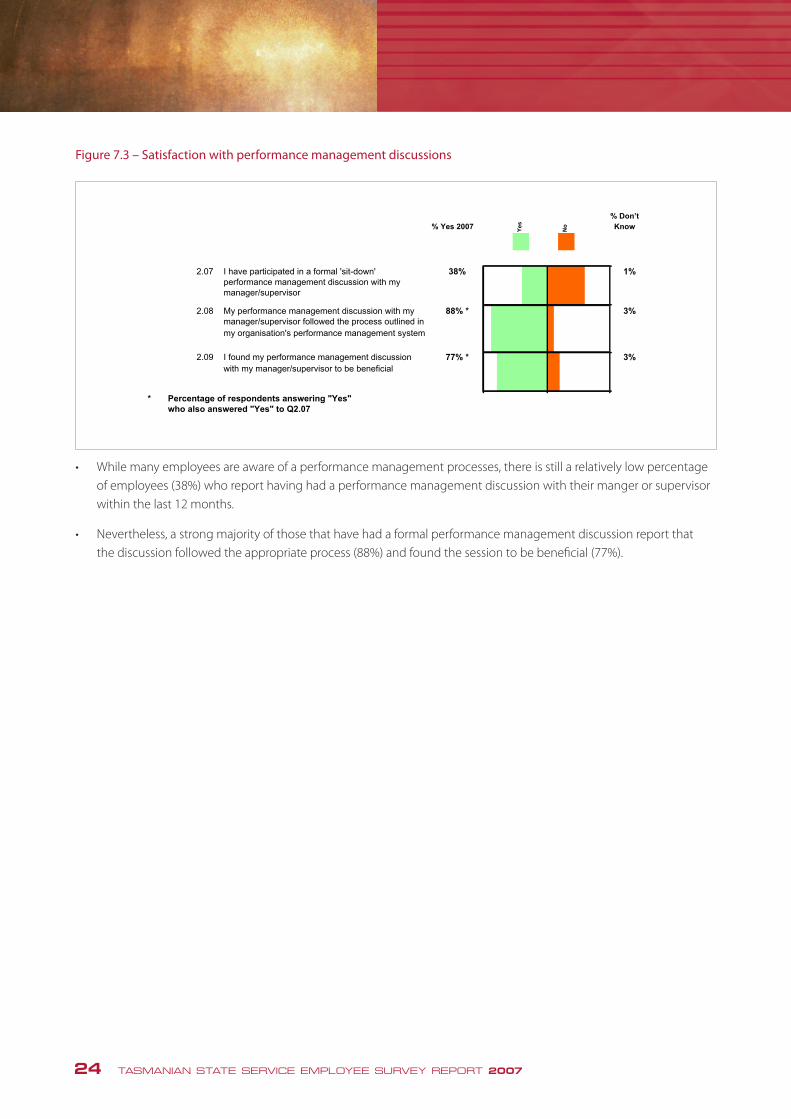
Figure 7.3 – Satisfaction with performance management discussions
• Whilemanyemployeesareawareofaperformancemanagementprocesses,thereisstillarelativelylowpercentageof employees (38%) who report having had a performance management discussion with their manger or supervisor within the last 12 months.
• Nevertheless,astrongmajorityofthosethathavehadaformalperformancemanagementdiscussionreportthat the discussion followed the appropriate process (88%) and found the session to be beneficial (77%).
Tasmanian State Service Employee Survey Report 2007 27
Figure 7.3 – Satisfaction with performance management discussions
9231 % Yes 2007
% Don’t
Know
Yes
No
2.07 I have participated in a formal 'sit-down'
performance management discussion with my
manager/supervisor
38% 1%
2.08 My performance management discussion with my
manager/supervisor followed the process outlined in
my organisation's performance management system
88% * 3%
2.09 I found my performance management discussion
with my manager/supervisor to be beneficial
77% * 3%
* Percentage of respondents answering "Yes"
who also answered "Yes" to Q2.07
• While many employees are aware of a performance management processes, there is still arelatively low percentage of employees (38%) who report having had a performancemanagement discussion with their manger or supervisor within the last 12 months.
• Nevertheless, a strong majority of those that have had a formal performance managementdiscussion report that the discussion followed the appropriate process (88%) and found thesession to be beneficial (77%).
TASMANIAN STATE SERVICE EMPLOYEE SURVEY REPORT 2007 25
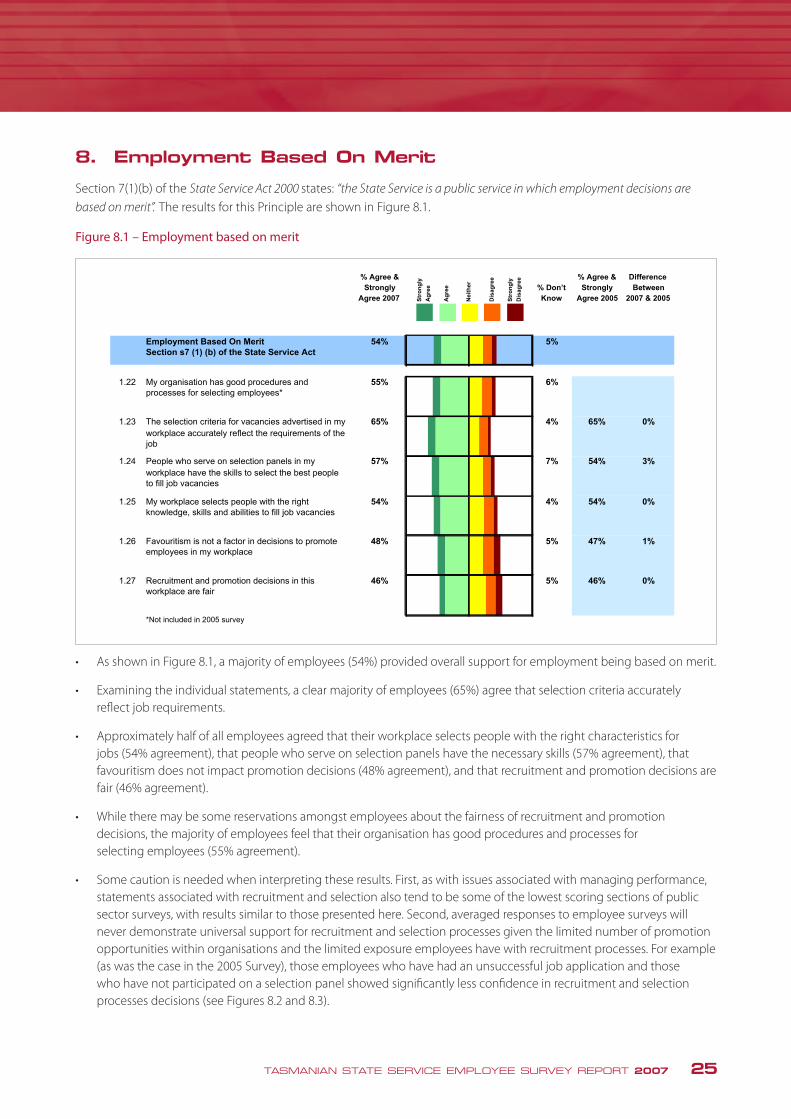
8. Employment Based On Merit
Section 7(1)(b) of the State Service Act 2000 states: “the State Service is a public service in which employment decisions are
based on merit”. The results for this Principle are shown in Figure 8.1.
Figure 8.1 – Employment based on merit
• AsshowninFigure8.1,amajorityofemployees(54%)providedoverallsupportforemploymentbeingbasedonmerit.
• Examiningtheindividualstatements,aclearmajorityofemployees(65%)agreethatselectioncriteriaaccuratelyreflect job requirements.
• Approximatelyhalfofallemployeesagreedthattheirworkplaceselectspeoplewiththerightcharacteristicsforjobs (54% agreement), that people who serve on selection panels have the necessary skills (57% agreement), that favouritism does not impact promotion decisions (48% agreement), and that recruitment and promotion decisions are fair (46% agreement).
• Whiletheremaybesomereservationsamongstemployeesaboutthefairnessofrecruitmentandpromotiondecisions, the majority of employees feel that their organisation has good procedures and processes for selecting employees (55% agreement).
• Somecautionisneededwheninterpretingtheseresults.First,aswithissuesassociatedwithmanagingperformance,statements associated with recruitment and selection also tend to be some of the lowest scoring sections of public sector surveys, with results similar to those presented here. Second, averaged responses to employee surveys will never demonstrate universal support for recruitment and selection processes given the limited number of promotion opportunities within organisations and the limited exposure employees have with recruitment processes. For example (as was the case in the 2005 Survey), those employees who have had an unsuccessful job application and those who have not participated on a selection panel showed significantly less confidence in recruitment and selection processes decisions (see Figures 8.2 and 8.3).
Tasmanian State Service Employee Survey Report 2007 28
8.0 Employment Based On Merit
Section 7(1)(b) of the State Service Act 2000 states: “the State Service is a public service inwhich employment decisions are based on merit”. The results for this Principle are shown inFigure 8.1.
Figure 8.1 – Employment based on merit
% Agree &
Strongly
Agree 2007
% Don’t
Know
% Agree &
Strongly
Agree 2005
Difference
Between
2007 & 2005Str
on
gly
Dis
ag
ree
Str
on
gly
Ag
ree
Ag
ree
Ne
ith
er
Dis
ag
ree
Employment Based On Merit
Section s7 (1) (b) of the State Service Act
54% 5%
1.22 My organisation has good procedures and
processes for selecting employees*
55% 6%
1.23 The selection criteria for vacancies advertised in my
workplace accurately reflect the requirements of the
job
65% 4% 65% 0%
1.24 People who serve on selection panels in my
workplace have the skills to select the best people
to fill job vacancies
57% 7% 54% 3%
1.25 My workplace selects people with the right
knowledge, skills and abilities to fill job vacancies
54% 4% 54% 0%
1.26 Favouritism is not a factor in decisions to promote
employees in my workplace
48% 5% 47% 1%
1.27 Recruitment and promotion decisions in this
workplace are fair
46% 5% 46% 0%
*Not included in 2005 survey
• As shown in Figure 8.1, a majority of employees (54%) provided overall support foremployment being based on merit.
• Examining the individual statements, a clear majority of employees (65%) agree thatselection criteria accurately reflect job requirements.
• Approximately half of all employees agreed that their workplace selects people with the rightcharacteristics for jobs (54% agreement), that people who serve on selection panels havethe necessary skills (57% agreement), that favouritism does not impact promotion decisions(48% agreement), and that recruitment and promotion decisions are fair (46% agreement).
• While there may be some reservations amongst employees about the fairness ofrecruitment and promotion decisions, the majority of employees feel that their organisationhas good procedures and processes for selecting employees (55% agreement).

26 TASMANIAN STATE SERVICE EMPLOYEE SURVEY REPORT 2007
Figure 8.2 – Successful selection experience against confidence in the application of the merit Principle
Tasmanian State Service Employee Survey Report 2007 29
Some caution is needed when interpreting these results. First, as with issues associatedwith managing performance, statements associated with recruitment and selection also tendto be some of the lowest scoring sections of public sector surveys, with results similar tothose presented here. Second, averaged responses to employee surveys will neverdemonstrate universal support for recruitment and selection processes given the limitednumber of promotion opportunities within organisations and the limited exposure employeeshave with recruitment processes. For example (as was the case in the 2005 survey), thoseemployees who have had an unsuccessful job application and those who have notparticipated on a selection panel showed significantly less confidence in recruitment andselection processes decisions (see Figures 8.2 and 8.3).
Figure 8.2 – Successful selection experience against confidence in the application of themerit Principle
"I have applied for a job within the State Service and been successful"
60%
61%
70%
64%
61%
53%
51%
48%
52%
60%
53%
49%
40%
38%
0% 10% 20% 30% 40% 50% 60% 70% 80%
Employment Based On MeritSection s7 (1) (b) of the State Service Act
My organisation has good procedures and processes for
selecting employees
The selection criteria for vacancies advertised in myworkplace accurately reflect the requirements of the job
People who serve on selection panels in my workplace havethe skills to select the best people to fill job vacancies
My workplace selects people with the right knowledge, skills
and abilities to fill job vacancies
Favouritism is not a factor in decisions to promote
employees in my workplace
Recruitment and promotion decisions in this workplace arefair
% Agree & Strongly Agree
Applied & Been Successful Applied & Been Unsuccessful
Figure 8.2 shows the relationship between employees’ confidence in the application of themerit Principle and whether they have had successful or unsuccessful experiences with jobapplications within the Service.
As shown in Figure 8.2, a successful job application process is associated with noticeablyhigher confidence in the application of the merit Principle.
• Figure8.2showstherelationshipbetweenemployees’confidenceintheapplicationofthemeritPrinciple and whether they have had successful or unsuccessful experiences with job applications within the Service.
• AsshowninFigure8.2,asuccessfuljobapplicationprocessisassociatedwithnoticeablyhigherconfidence in the application of the merit Principle.
TASMANIAN STATE SERVICE EMPLOYEE SURVEY REPORT 2007 27
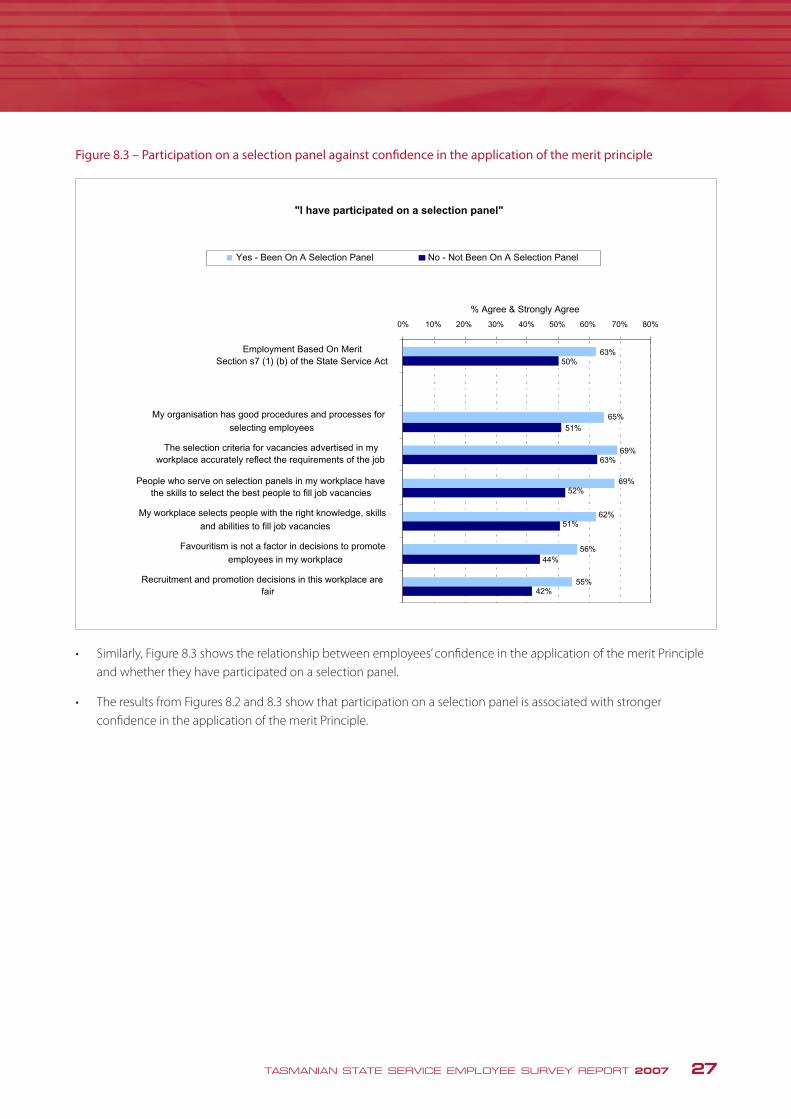
Figure 8.3 – Participation on a selection panel against confidence in the application of the merit principle
Tasmanian State Service Employee Survey Report 2007 30
Figure 8.3 – Participation on a selection panel against confidence in the application ofthe merit principle
"I have participated on a selection panel"
63%
65%
69%
69%
62%
56%
55%
50%
51%
63%
52%
51%
44%
42%
0% 10% 20% 30% 40% 50% 60% 70% 80%
Employment Based On MeritSection s7 (1) (b) of the State Service Act
My organisation has good procedures and processes for
selecting employees
The selection criteria for vacancies advertised in myworkplace accurately reflect the requirements of the job
People who serve on selection panels in my workplace havethe skills to select the best people to fill job vacancies
My workplace selects people with the right knowledge, skills
and abilities to fill job vacancies
Favouritism is not a factor in decisions to promote
employees in my workplace
Recruitment and promotion decisions in this workplace arefair
% Agree & Strongly Agree
Yes - Been On A Selection Panel No - Not Been On A Selection Panel
Similarly, Figure 8.3 shows the relationship between employees’ confidence in theapplication of the merit Principle and whether they have participated on a selection panel.
The results from Figures 8.2 and 8.3 show that participation on a selection panel isassociated with stronger confidence in the application of the merit Principle.
• Similarly,Figure8.3showstherelationshipbetweenemployees’confidenceintheapplicationofthemeritPrincipleand whether they have participated on a selection panel.
• TheresultsfromFigures8.2and8.3showthatparticipationonaselectionpanelisassociatedwithstrongerconfidence in the application of the merit Principle.
28 TASMANIAN STATE SERVICE EMPLOYEE SURVEY REPORT 2007
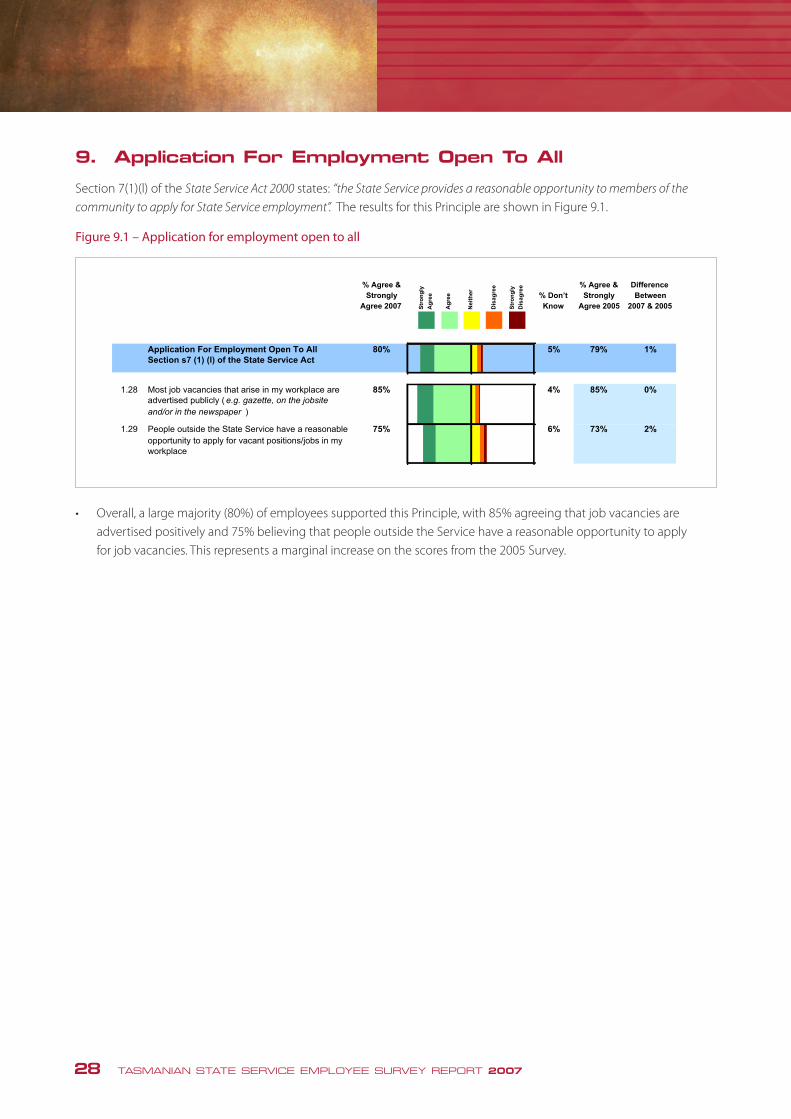
9. Application For Employment Open To All
Section 7(1)(l) of the State Service Act 2000 states: “the State Service provides a reasonable opportunity to members of the
community to apply for State Service employment”. The results for this Principle are shown in Figure 9.1.
Figure 9.1 – Application for employment open to all
• Overall,alargemajority(80%)ofemployeessupportedthisPrinciple,with85%agreeingthatjobvacanciesareadvertised positively and 75% believing that people outside the Service have a reasonable opportunity to apply for job vacancies. This represents a marginal increase on the scores from the 2005 Survey.
Tasmanian State Service Employee Survey Report 2007 31
9.0 Application For Employment Open To All
Section 7(1)(l) of the State Service Act 2000 states: “the State Service provides a reasonableopportunity to members of the community to apply for State Service employment”. The resultsfor this Principle are shown in Figure 9.1.
Figure 9.1 – Application for employment open to all
% Agree &
Strongly
Agree 2007
% Don’t
Know
% Agree &
Strongly
Agree 2005
Difference
Between
2007 & 2005Str
on
gly
Dis
ag
ree
Str
on
gly
Ag
ree
Ag
ree
Ne
ith
er
Dis
ag
ree
Application For Employment Open To All
Section s7 (1) (l) of the State Service Act
80% 5% 79% 1%
1.28 Most job vacancies that arise in my workplace are
advertised publicly ( e.g. gazette, on the jobsite
and/or in the newspaper )
85% 4% 85% 0%
1.29 People outside the State Service have a reasonable
opportunity to apply for vacant positions/jobs in my
workplace
75% 6% 73% 2%
• Overall, a large majority (80%) of employees supported this Principle, with 85% agreeingthat job vacancies are advertised positively and 75% believing that people outside theService have a reasonable opportunity to apply for vacant positions. This represents amarginal increase on the scores from the 2005 survey.

TASMANIAN STATE SERVICE EMPLOYEE SURVEY REPORT 2007 29
10. Equity In Employment
Section 7(1)(k) of the State Service Act 2000 states: “the State Service promotes equity in employment”. The results for this Principle are shown in Figure 10.1.
Figure 10.1 – Equity in employment
• AsshowninFigure10.1,employeesshowedstrongsupportforthePrincipleofequityinemployment, producing an overall score of 73%.
• Particularlystrongagreementwasshownforculture,sexualorientation,genderandagenotbeingbarriers for success in their Agency (77% to 82% agreement).
• Whileshowingslightlylowerscores,asubstantialmajorityofemployeesagreedthatfamilyresponsibilities and having a disability are not barriers to success (72% and 64% respectively).
• Thelowestscorewasgivenforperceptionsregardingpart-timeworkandflexibleworkoptions,with61%ofemployees believing these work patterns were not barriers to success. In general, 70% of employees believed their organisation is committed to promoting equity in employment.
• Thesefiguresarequiteconsistentwiththeresultsfromthe2005Survey.Itisinterestingtonotehowever,thatthereis a slight increase (2%) in employees who believe that their organisation is committed to promoting equity in employment.
Tasmanian State Service Employee Survey Report 2007 32
10.0 Equity In Employment
Section 7(1)(k) of the State Service Act 2000 states: “the State Service promotes equity inemployment”. The results for this Principle are shown in Figure 10.1.
Figure 10.1 – Equity in employment
% Agree &
Strongly
Agree 2007
% Don’t
Know
% Agree &
Strongly
Agree 2005
Difference
Between
2007 & 2005Str
on
gly
Dis
ag
ree
Str
on
gly
Ag
ree
Ag
ree
Ne
ith
er
Dis
ag
ree
Equity In Employment
Section s7 (1) (k) of the State Service Act
73% 4% 74% -1%
1.30 My organisation is committed to promoting equity in
employment
70% 4% 68% 2%
1.31 Gender is not a barrier to success in my workplace 80% 2% 81% -1%
1.32 Age is not a barrier to success in my workplace 77% 3% 78% -1%
1.33 Cultural background is not a barrier to success in
my workplace
82% 4% 84% -2%
1.34 Sexual orientation is not a barrier to success in my
workplace
81% 6% 81% 0%
1.35 Having a disability is not a barrier to success in my
workplace
64% 7% 65% -1%
1.36 Having family responsibilities is not a barrier to
success in my workplace
72% 3% 74% -2%
1.37 Working part-time or using other flexible work
options is not a barrier to success ( including career
progression ) in my workplace
61% 4% 60% 1%
• As shown in Figure 10.1, employees showed strong support for the Principle of equity inemployment, producing an overall score of 73%.
• Particularly strong agreement was shown for culture, sexual orientation, gender and age notbeing barriers for success in their Agency (77% to 82% agreement).
• While showing slightly lower scores, a substantial majority of employees agreed that familyresponsibilities and having a disability are not barriers to success (72% and 64%respectively).
• The lowest score was given for perceptions regarding part-time work and flexible workoptions, with 61% of employees believing these work patterns were not barriers to success.In general, 70% of employees believed their organisation is committed to promoting equityin employment.

30 TASMANIAN STATE SERVICE EMPLOYEE SURVEY REPORT 2007
• AsFigure11.1demonstrates,employeesgenerallyagreethattheirworkplacemanagesdiscriminationanddiversitysatisfactorily (70% overall agreement).
• Alargemajorityofemployees(88%)reportedthatpeopleintheirworkplaceareexpectedtotreatothersrespectfully,most employees (73%) believe their manager or supervisor treats employees with dignity and respect, and a majority of employees also believe their agency is committed to creating a diverse workforce (62%).
• Morethanfourfifthsofemployeesbelievetheirworkplaceisfreefromsexualharassment.
• Asforthe2005Survey,whilemostemployees(65%)believethatbullyingandharassmentisnottolerated,only half (51%) believe their workplace is free of bullying and harassment. These results are very similar to those found in other States.
• WhilethepatternofresultsforthisPrincipleissimilartothe2005Survey,therehasbeenaslightdecreaseinsomeof the scores with the most notable of these being in relation to employees belief that their workplace is free of bullying and/or harassment (a 5% decrease from the 2005 Survey).
11. Discrimination Free & Diversity Recognised
Section 7(1)(c) of the State Service Act 2000 states: “the State Service provides a workplace that is free from discrimination and
recognises and utilises the diversity of the community it serves”. The results for this Principle are shown in Figure 11.1.
Figure 11.1 – Discrimination free and diversity recognised
Tasmanian State Service Employee Survey Report 2007 34
11.0 Discrimination Free & Diversity Recognised
Section 7(1)(c) of the State Service Act 2000 states: “the State Service provides a workplacethat is free from discrimination and recognises and utilises the diversity of the community itserves”. The results for this Principle are shown in Figure 11.1.
Figure 11.1 – Discrimination free and diversity recognised
% Agree &
Strongly
Agree 2007
% Don’t
Know
% Agree &
Strongly
Agree 2005
Difference
Between
2007 & 2005Str
on
gly
Dis
ag
ree
Str
on
gly
Ag
ree
Ag
ree
Ne
ith
er
Dis
ag
ree
Discrimination Free & Diversity Recognised
Section s7 (1) (c) of the State Service Act
70% 3% 72% -2%
1.38 My organisation is committed to creating a diverse
workforce
62% 5% 65% -3%
1.39 My manager/supervisor treats employees with
dignity and respect
73% 1% 73% 0%
1.40 People in my workplace are expected to treat each
other respectfully
88% 1% 90% -2%
1.41 Bullying and/or harassment is not tolerated in my
workplace
66% 1% 68% -2%
1.42 My workplace is free of bullying and/or harassment 51% 3% 56% -5%
1.43 My workplace is free from sexual harassment 81% 5% 81% 0%
• As Figure 11.1 demonstrates, employees generally agree that their workplace managesdiscrimination and diversity satisfactorily (70% overall agreement).
• A large majority of employees (88%) reported that people in their workplace are expected totreat others respectfully, most employees (73%) believe their manager or supervisor treatsemployees with dignity and respect, and a majority of employees also believe their agencyis committed to creating a diverse workforce (62%).
• More than four fifths of employees believe their workplace is free from sexual harassment.
• As for the 2005 survey, while most employees (65%) believe that bullying and harassmentis not tolerated, only half (51%) believe their workplace is free of bullying and harassment.These results are very similar to those found in other States.
• While the pattern of results for this Principle is similar to the 2005 survey, there has been aslight decrease in some of the scores with the most notable of these being in relation toemployees belief that their workplace is free of bullying and/or harassment (a 5% decreasefrom the 2005 survey).

TASMANIAN STATE SERVICE EMPLOYEE SURVEY REPORT 2007 31
Figure 11.2 – Experience of bullying and harassment in the last 12 months
• Overall,28%ofemployeesreportedhavingbeenbulliedorharassedinthelast12months.
Figure 11.3 – Reports of bullying and harassment in the last 12 months
• Figure11.3indicatesthatofthoseemployeeswhohaveindicatedthattheyhadbeenbulliedand/orharassed (Figure 11.2 above) the majority expressed their concerns verbally, but a much smaller number expressed their concerns in writing.
Figure 11.4 – Satisfaction with how bullying and harassment was dealt with
• Figure11.4indicatesthatofthoseemployeeswhohaveindicatedthattheyhadbeenbulliedand/orharassed (Figure 11.2 above) only a relatively small percentage were satisfied with the way the matter has been dealt with by the organisation.
NB. It should be noted that of those employees who reported being bullied and/or harassed, 4% gave no answer regarding whether or not they reported their concern verbally and 25% gave no answer regarding whether or not they reported their concern in writing, therefore some caution should be used when interpreting this figure.
NB. It should be noted that 19% of those employees who reported being bullied and/or harassed gave no answer regarding whether or not they were satisfied with the way the matter was handled by their organisation, therefore some caution should be used when interpreting this figure.
Tasmanian State Service Employee Survey Report 2007 35
Figure 11.2 – Experience of bullying and harassment in the last 12 months
% Yes 2007
% Don’t
Know % Yes 2005
Difference
Between
2007 & 2005Ye
s
No
2.12 I have been bullied and/or harassed in my
workplace
28% 2% 26% 2%
2.13 (a)
1
If you have been bullied or harassed in your
workplace, did you formally report your concern to
someone in authority within the organisation
verbally?
69% ** 4%
2.13 (a)
2
If you have been bullied or harassed in your
workplace, did you formally report your concern to
someone in authority within the organisation in
writing?
27% ** 25%
2.13 (b) Were you satisfied with how this matter was dealt
with by the organisation?
28% ** 19%
* Percentage of respondents Strongly Agreeing/
Agreeing who answered "Yes" to Q2.07
** Percentage of respondents Strongly Agreeing/
Agreeing who answered "Yes" to Q2.12
• Overall, 28% of employees reported having been bullied or harassed in the last 12 months.
Figure 11.3 – Reports of bullying and harassment in the last 12 months
• Figure 11.3 indicates that of those employees who have indicated that they had beenbullied and/or harassed (Figure 11.2 above) the majority expressed their concerns verbally,but a much smaller number expressed their concerns in writing.
Figure 11.4 – Satisfaction with how bullying and harassment was dealt with
• Figure 11.4 indicates that of those employees who have indicated that they had beenbullied and/or harassed (Figure 11.2 above) only a relatively small percentage weresatisfied with the way the matter has been dealt with by the organisation.
% Yes 2007
% Don’t
Know % Yes 2005
Difference
Between
2007 & 2005Ye
s
No
2.12 I have been bullied and/or harassed in my
workplace
28% 2% 26% 2%
2.13 (a)
1
If you have been bullied or harassed in your
workplace, did you formally report your concern to
someone in authority within the organisation
verbally?
69% ** 4%
2.13 (a)
2
If you have been bullied or harassed in your
workplace, did you formally report your concern to
someone in authority within the organisation in
writing?
27% ** 25%
2.13 (b) Were you satisfied with how this matter was dealt
with by the organisation?
28% ** 19%
* Percentage of respondents Strongly Agreeing/
Agreeing who answered "Yes" to Q2.07
** Percentage of respondents Strongly Agreeing/
Agreeing who answered "Yes" to Q2.12
** Percentage of respondents answering "Yes"
who also answered "Yes" to Q2.12
NB. It should be noted that of those employees who reported being bullied and/or harassed,4% gave no answer regarding whether or not they reported their concern verbally and 25%gave no answer regarding whether or not they reported their concern in writing, therefore somecaution should be used when interpreting this figure.
% Yes 2007
% Don’t
Know % Yes 2005
Difference
Between
2007 & 2005Ye
s
No
2.12 I have been bullied and/or harassed in my
workplace
28% 2% 26% 2%
2.13 (a)
1
If you have been bullied or harassed in your
workplace, did you formally report your concern to
someone in authority within the organisation
verbally?
69% ** 4%
2.13 (a)
2
If you have been bullied or harassed in your
workplace, did you formally report your concern to
someone in authority within the organisation in
writing?
27% ** 25%
2.13 (b) Were you satisfied with how this matter was dealt
with by the organisation?
28% ** 19%
* Percentage of respondents Strongly Agreeing/
Agreeing who answered "Yes" to Q2.07
** Percentage of respondents Strongly Agreeing/
Agreeing who answered "Yes" to Q2.12
** Percentage of respondents answering "Yes"
who also answered "Yes" to Q2.12
NB. It should be noted that 19% of those employees who reported being bullied and/orharassed gave no answer regarding whether or not they were satisfied with the way the matterwas handled by their organisation, therefore some caution should be used when interpretingthis figure.

32 TASMANIAN STATE SERVICE EMPLOYEE SURVEY REPORT 2007
Figure 11.5 – Experience of being bullied and/or harassed against confidence in all Principles
• Figure11.5showstherelationshipbetweenbullyingandharassmentandemployees’confidenceintheapplicationof all Principles. The experience of bullying and harassment is quite strongly associated with lower confidence in the application of all Principles.
Tasmanian State Service Employee Survey Report 2007 36
Figure 11.5 – Experience of being bullied and/or harassed against confidence in allPrinciples
"I have been bullied and/or harassed in my workplace"
39%
50%
52%
67%
39%
38%
73%
60%
48%
49%
37%
59%
45%
47%
38%
76%
76%
73%
84%
60%
60%
82%
78%
78%
71%
63%
80%
68%
68%
65%
0% 10% 20% 30% 40% 50% 60% 70% 80% 90% 100%
Overall Evaluation That Principles Are Upheld
Apolitical, Impartial & Ethical
Accountable For Actions & Performance
Community Service & Fairness
Managing Performance
Employment Based On Merit
Application For Employment Open To All
Equity In Employment
Discrimination Free & Diversity Recognised
Quality Leadership
Employee Consultation & Input Encouraged
Safe Workplace
Flexible Workplace
Rewarding Workplace
Fair Internal Review System
% Agree & Strongly Agree
Yes - Been Bullied and/or Harassed No - Not Been Bullied and/or Harassed
Figure 11.5 shows the relationship between bullying and harassment and employees’confidence in the application of all Principles. The experience of bullying and harassment isquite strongly associated with lower confidence in the application of all Principles.
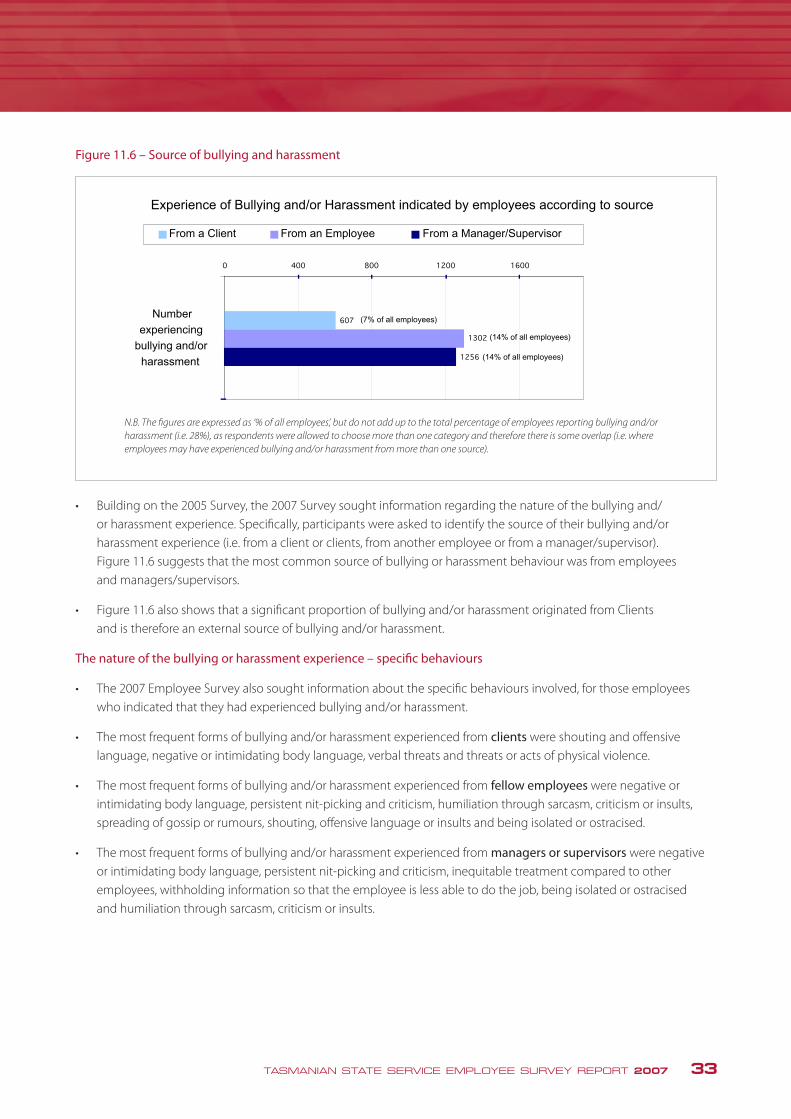
TASMANIAN STATE SERVICE EMPLOYEE SURVEY REPORT 2007 33
Figure 11.6 – Source of bullying and harassment
Tasmanian State Service Employee Survey Report 2007 37
Figure 11.6 – Source of bullying and harassment
Experience of Bullying and/or Harassment indicated by employees according to source
607
1302
1256
0 400 800 1200 1600
Number
experiencing
bullying and/or
harassment
From a Client From an Employee From a Manager/Supervisor
(7% of all employees)
(14% of all employees)
(14% of all employees)
N.B. The figures are expressed as ‘% of all employees’, but do not add up to the totalpercentage of employees reporting bullying and/or harassment (i.e. 28%), as respondentswere allowed to choose more than one category and therefore there is some overlap (i.e.where employees may have experienced bullying and/or harassment from more than onesource).
Building on the 2005 survey, the 2007 survey sought information regarding the nature of thebullying and/or harassment experience. Specifically, participants were asked to identify thesource of their bullying and/or harassment experience (i.e. from a client or clients, fromanother employee or from a manager/supervisor). Figure 11.6 suggests that the mostcommon source of bullying or harassment behaviour was from employees andmanagers/supervisors.
Figure 11.6 also shows that a significant proportion of bullying and/or harassment originatedfrom Clients and is therefore an external source of bullying and/or harassment.
The nature of the bullying or harassment experience – specific behaviours
The 2007 Employee Survey also sought information about the specific behaviours involved,for those employees who indicated that they had experienced bullying and/or harassment.
The most frequent forms of bullying and/or harassment experienced from clients wereshouting and offensive language, negative or intimidating body language, verbal threats andthreats or acts of physical violence.
The most frequent forms of bullying and/or harassment experienced from fel lowemployees were negative or intimidating body language, persistent nit-picking andcriticism, humiliation through sarcasm, criticism or insults, spreading of gossip or rumours,shouting, offensive language or insults and being isolated or ostracised.
The most frequent forms of bullying and/or harassment experienced from managers orsupervisors were negative or intimidating body language, persistent nit-picking andcriticism, inequitable treatment compared to other employees, withholding information sothat the employee is less able to do the job, being isolated or ostracised and humiliationthrough sarcasm, criticism or insults.
• Buildingonthe2005Survey,the2007Surveysoughtinformationregardingthenatureofthebullyingand/or harassment experience. Specifically, participants were asked to identify the source of their bullying and/or harassment experience (i.e. from a client or clients, from another employee or from a manager/supervisor). Figure 11.6 suggests that the most common source of bullying or harassment behaviour was from employees and managers/supervisors.
• Figure11.6alsoshowsthatasignificantproportionofbullyingand/orharassmentoriginatedfromClients and is therefore an external source of bullying and/or harassment.
The nature of the bullying or harassment experience – specific behaviours
• The2007EmployeeSurveyalsosoughtinformationaboutthespecificbehavioursinvolved,forthoseemployeeswho indicated that they had experienced bullying and/or harassment.
• Themostfrequentformsofbullyingand/orharassmentexperiencedfromclients were shouting and offensive language, negative or intimidating body language, verbal threats and threats or acts of physical violence.
• Themostfrequentformsofbullyingand/orharassmentexperiencedfromfellow employees were negative or intimidating body language, persistent nit-picking and criticism, humiliation through sarcasm, criticism or insults, spreading of gossip or rumours, shouting, offensive language or insults and being isolated or ostracised.
• Themostfrequentformsofbullyingand/orharassmentexperiencedfrommanagers or supervisors were negative or intimidating body language, persistent nit-picking and criticism, inequitable treatment compared to other employees, withholding information so that the employee is less able to do the job, being isolated or ostracised and humiliation through sarcasm, criticism or insults.
N.B. The figures are expressed as ‘% of all employees’, but do not add up to the total percentage of employees reporting bullying and/or harassment (i.e. 28%), as respondents were allowed to choose more than one category and therefore there is some overlap (i.e. where employees may have experienced bullying and/or harassment from more than one source).

34 TASMANIAN STATE SERVICE EMPLOYEE SURVEY REPORT 2007
12. Quality Leadership
Section 7(1)(g) of the State Service Act 2000 states: “the State Service develops leadership of the highest quality”. The results for this Principle are shown in Figure 12.1.
Figure 12.1 – Quality leadership
• AsshowninFigure12.1employeesgenerallysupportedthequalityofleadershipwithintheirorganisation (65% overall agreement score).
• Thevastmajorityofemployeesreportedunderstandingwhattheirorganisationneedstoachieveandwhat its priorities are (85% and 78% respectively).
• Smallermajoritiesofemployeesbelievedtheirseniormanagersleadbyexampleinethicalbehaviour(58%) and leadership is of a high standard (56%).
• Similarnumbersofemployeesbelievedtheirmanagerorsupervisorisgoodatmanagingpeople(56%)andthat their workplace provides leadership training opportunities (56%).
• Whileoveralltheviewsonqualityofleadershiphaschangedonlymarginallycomparedtothe2005Survey,therearesome more notable differences among the individual items. Three of the items (1.45, 1.46 and 1.48) are somewhat lower, but interestingly (1.44) is somewhat higher suggesting that employees perceive that the standard of leadership has improved.
• Itshouldbenotedthatthetopicofleadershipisoneofthelowerperformingsectionsofmostemployeesurveys,in part because it is often difficult for leaders to communicate and interact with employees sufficiently to meet employees’ expectations. The results presented here are similar to, and in some cases noticeably better than, results of many other public and private sector organisations.
Tasmanian State Service Employee Survey Report 2007 38
12.0 Quality Leadership
Section 7(1)(g) of the State Service Act 2000 states: “the State Service develops leadership ofthe highest quality”. The results for this Principle are shown in Figure 12.1.
Figure 12.1 – Quality leadership
% Agree &
Strongly
Agree 2007
% Don’t
Know
% Agree &
Strongly
Agree 2005
Difference
Between
2007 & 2005Str
on
gly
Dis
ag
ree
Str
on
gly
Ag
ree
Ag
ree
Ne
ith
er
Dis
ag
ree
Quality Leadership
Section s7 (1) (g) of the State Service Act
65% 2% 66% -1%
1.44 The leadership in my workplace is of a high
standard
56% 1% 52% 4%
1.45 Senior managers in my organisation lead by
example in ethical behaviour
58% 3% 61% -3%
1.46 My manager/supervisor is good at managing people 56% 1% 59% -3%
1.47 I understand what my organisation's priorities are 78% 2% 79% -1%
1.48 I understand what my workplace needs to achieve 85% 1% 88% -3%
1.49 My workplace provides leadership training
opportunities its employees
56% 4% 55% 1%
• As shown in Figure 12.1 employees generally supported the quality of leadership withintheir organisation (65% overall agreement score).
• The vast majority of employees reported understanding what their organisation needs toachieve and what its priorities are (85% and 78% respectively).
• Smaller majorities of employees believed their senior managers lead by example in ethicalbehaviour (58%) and leadership is of a high standard (56%).
• Similar numbers of employees believed their manager or supervisor is good at managingpeople (56%) and that their workplace provides leadership training opportunities (56%).
• While overall the views on quality of leadership has changed only marginally compared tothe 2005 survey, there are some more notable differences among the individual items.Three of the items (1.45, 1.46 and 1.48) are somewhat lower, but interestingly (1.44) issomewhat higher suggesting that employees perceive that the standard of leadership hasimproved.
• It should be noted that the topic of leadership is one of the lower performing sections ofmost employee surveys, in part because it is often difficult for leaders to communicate andinteract with employees sufficiently to meet employees’ expectations. The results presentedhere are similar to, and in some cases noticeably better than, results of many other publicand private sector organisations.
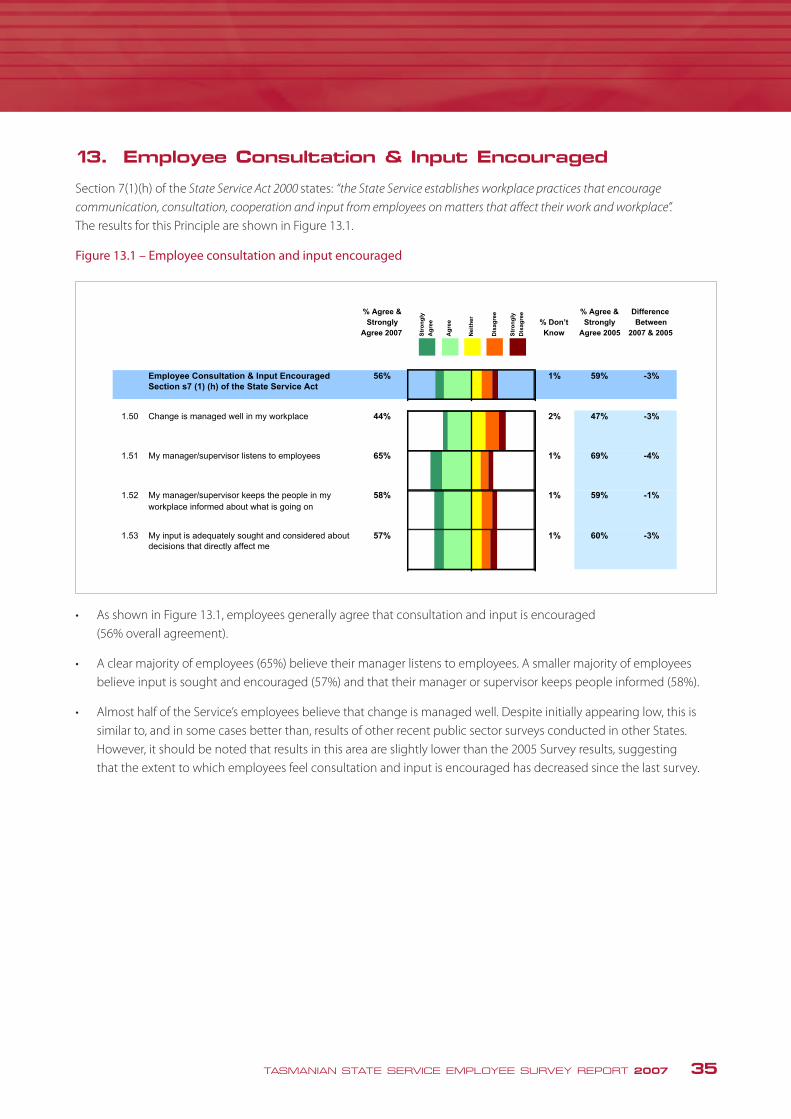
TASMANIAN STATE SERVICE EMPLOYEE SURVEY REPORT 2007 35
13. Employee Consultation & Input Encouraged
Section 7(1)(h) of the State Service Act 2000 states: “the State Service establishes workplace practices that encourage
communication, consultation, cooperation and input from employees on matters that affect their work and workplace”. The results for this Principle are shown in Figure 13.1.
Figure 13.1 – Employee consultation and input encouraged
• AsshowninFigure13.1,employeesgenerallyagreethatconsultationandinputisencouraged (56% overall agreement).
• Aclearmajorityofemployees(65%)believetheirmanagerlistenstoemployees.Asmallermajorityofemployeesbelieve input is sought and encouraged (57%) and that their manager or supervisor keeps people informed (58%).
• AlmosthalfoftheService’semployeesbelievethatchangeismanagedwell.Despiteinitiallyappearinglow,thisissimilar to, and in some cases better than, results of other recent public sector surveys conducted in other States. However, it should be noted that results in this area are slightly lower than the 2005 Survey results, suggesting that the extent to which employees feel consultation and input is encouraged has decreased since the last survey.
Tasmanian State Service Employee Survey Report 2007 39
13.0 Employee Consultation & Input Encouraged
Section 7(1)(h) of the State Service Act 2000 states: “the State Service establishes workplacepractices that encourage communication, consultation, cooperation and input from employeeson matters that affect their work and workplace”. The results for this Principle are shown inFigure 13.1.
Figure 13.1 – Employee consultation and input encouraged
% Agree &
Strongly
Agree 2007
% Don’t
Know
% Agree &
Strongly
Agree 2005
Difference
Between
2007 & 2005Str
on
gly
Dis
ag
ree
Str
on
gly
Ag
ree
Ag
ree
Ne
ith
er
Dis
ag
ree
Employee Consultation & Input Encouraged
Section s7 (1) (h) of the State Service Act
56% 1% 59% -3%
1.50 Change is managed well in my workplace 44% 2% 47% -3%
1.51 My manager/supervisor listens to employees 65% 1% 69% -4%
1.52 My manager/supervisor keeps the people in my
workplace informed about what is going on
58% 1% 59% -1%
1.53 My input is adequately sought and considered about
decisions that directly affect me
57% 1% 60% -3%
• As shown in Figure 13.1, employees generally agree that consultation and input isencouraged (56% overall agreement).
• A clear majority of employees (65%) believe their manager listens to employees. A smallermajority of employees believe input is sought and encouraged (57%) and that their manageror supervisor keeps people informed (58%).
• Almost half of the Service’s employees believe that change is managed well. Despiteinitially appearing low, this is similar to, and in some cases better than, results of otherrecent public sector surveys conducted in other States. However, it should be noted thatresults in this area are slightly lower than the 2005 survey results, suggesting that the extentto which employees feel consultation and input is encouraged has decreased since the lastsurvey.
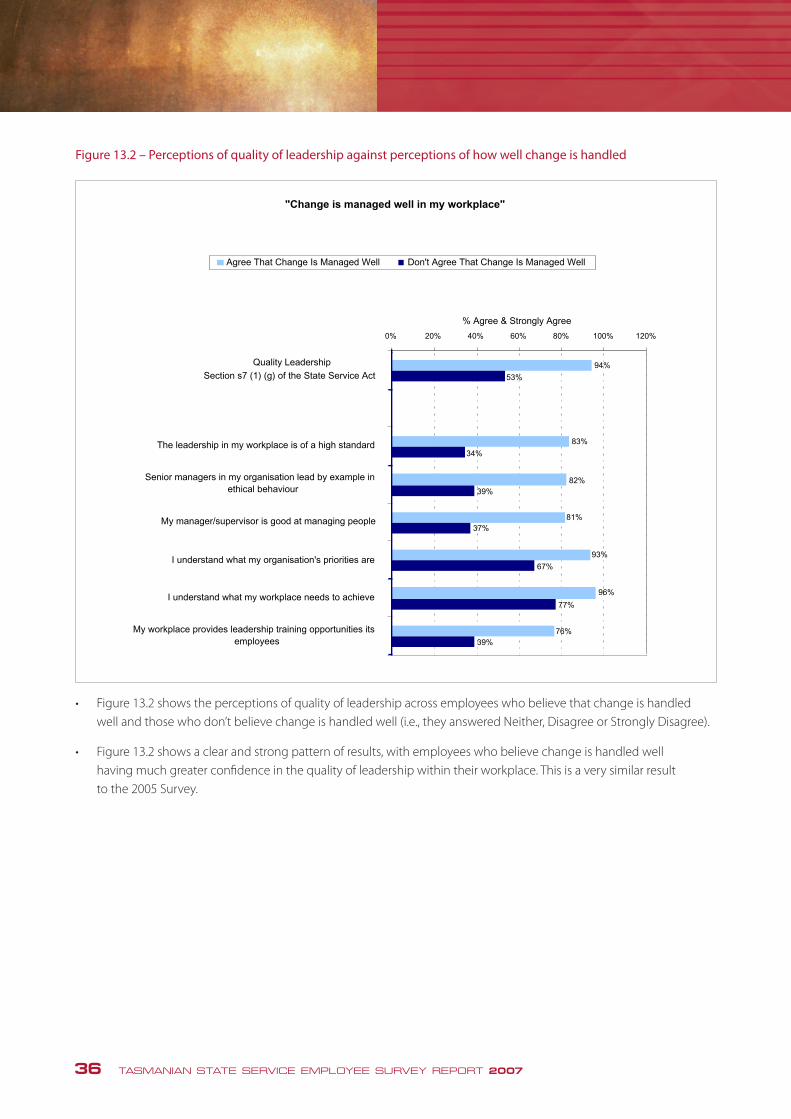
36 TASMANIAN STATE SERVICE EMPLOYEE SURVEY REPORT 2007
Figure 13.2 – Perceptions of quality of leadership against perceptions of how well change is handled
Tasmanian State Service Employee Survey Report 2007 40
Figure 13.2 – Perceptions of quality of leadership against perceptions of how well changeis handled
"Change is managed well in my workplace"
94%
83%
82%
81%
93%
96%
76%
53%
34%
39%
37%
67%
77%
39%
0% 20% 40% 60% 80% 100% 120%
Quality Leadership
Section s7 (1) (g) of the State Service Act
The leadership in my workplace is of a high standard
Senior managers in my organisation lead by example inethical behaviour
My manager/supervisor is good at managing people
I understand what my organisation's priorities are
I understand what my workplace needs to achieve
My workplace provides leadership training opportunities itsemployees
% Agree & Strongly Agree
Agree That Change Is Managed Well Don't Agree That Change Is Managed Well
Figure 13.2 shows the perceptions of quality of leadership across employees who believethat change is handled well and those who don’t believe change is handled well (i.e., theyanswered Neither, Disagree or Strongly Disagree).
Figure 13.2 shows a clear and strong pattern of results, with employees who believechange is handled well having much greater confidence in the quality of leadership withintheir workplace. This is a very similar result to the 2005 survey.
• Figure13.2showstheperceptionsofqualityofleadershipacrossemployeeswhobelievethatchangeishandled well and those who don’t believe change is handled well (i.e., they answered Neither, Disagree or Strongly Disagree).
• Figure13.2showsaclearandstrongpatternofresults,withemployeeswhobelievechangeishandledwell having much greater confidence in the quality of leadership within their workplace. This is a very similar result to the 2005 Survey.

TASMANIAN STATE SERVICE EMPLOYEE SURVEY REPORT 2007 37
14. Safe Workplace
Section 7(1)(i) of the State Service Act 2000 states: “the State Service provides a fair, flexible, safe and rewarding workplace”. The results for this Principle are shown in Figure 14.1.
Figure 14.1 – Safe workplace
• Figure14.1demonstratesthatemployeesstronglybelieveinthesafetyoftheirworkplace.Astrongmajority of employees believe their manager or supervisor encourages employees to report safety risks (82%) and takes action to ensure employees’ health and safety (76%).
• Asimilarnumberofemployeesagreethatemployeesintheirworkplacedisplaygoodsafetyawareness(80%) and are committed to employee health and safety (80%).
• ApproximatelyhalfoftheService’semployeesreportnotbeingoverlystressedatwork.
• Resultsinthisareaareslightlybutconsistentlyhigherthanthe2005Survey,indicatingthatemployeesfeelthat their workplace is becoming safer.
Tasmanian State Service Employee Survey Report 2007 41
14.0 Safe Workplace
Section 7(1)(i) of the State Service Act 2000 states: “the State Service provides a fair, flexible,safe and rewarding workplace”. The results for this Principle are shown in Figure 14.1.
Figure 14.1 – Safe workplace
% Agree &
Strongly
Agree 2007
% Don’t
Know
% Agree &
Strongly
Agree 2005
Difference
Between
2007 & 2005Str
on
gly
Dis
ag
ree
Str
on
gly
Ag
ree
Ag
ree
Ne
ith
er
Dis
ag
ree
Safe Workplace
Section s7 (1) (i) of the State Service Act
74% 2% 72% 2%
1.54 My workplace is committed to employee health and
safety
80% 1% 78% 2%
1.55 My manager/supervisor takes action to ensure
employee’s health and safety
76% 2% 73% 3%
1.56 My manager/supervisor encourages employees to
report health and safety incidents and hazards
82% 2% 80% 2%
1.57 Employees in my workplace display good
occupational health and safety awareness
80% 2% 79% 1%
1.58 At present, I do not feel overly stressed at work 54% 1% 52% 2%
• Figure 14.1 demonstrates that employees strongly believe in the safety of their workplace. Astrong majority of employees believe their manager or supervisor encourages employees toreport safety risks (82%) and takes action to ensure employees’ health and safety (76%).
• A similar number of employees agree that employees in their workplace display good safetyawareness (80%) and are committed to employee health and safety (80%).
• Approximately half of the Service’s employees report not being overly stressed at work.
• Results in this area are slightly but consistently higher than the 2005 survey, indicating thatemployees feel that their workplace is becoming safer.
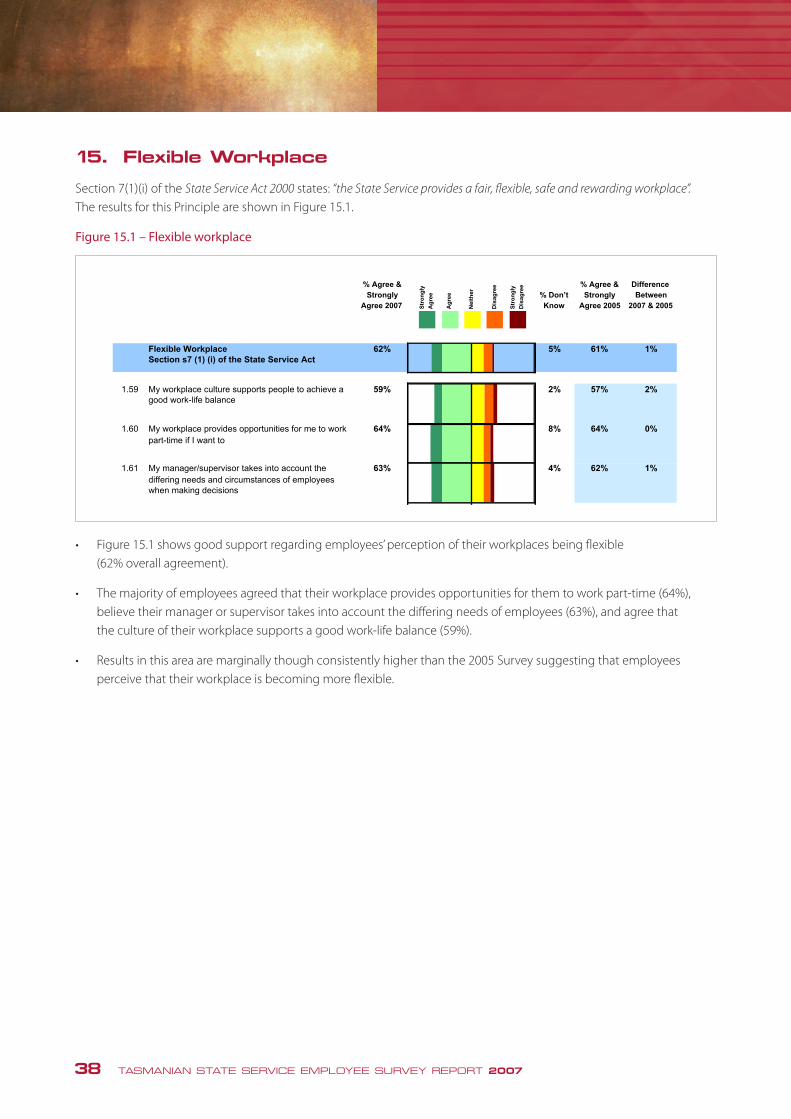
38 TASMANIAN STATE SERVICE EMPLOYEE SURVEY REPORT 2007
15. Flexible Workplace
Section 7(1)(i) of the State Service Act 2000 states: “the State Service provides a fair, flexible, safe and rewarding workplace”. The results for this Principle are shown in Figure 15.1.
Figure 15.1 – Flexible workplace
• Figure15.1showsgoodsupportregardingemployees’perceptionoftheirworkplacesbeingflexible (62% overall agreement).
• Themajorityofemployeesagreedthattheirworkplaceprovidesopportunitiesforthemtoworkpart-time(64%),believe their manager or supervisor takes into account the differing needs of employees (63%), and agree that the culture of their workplace supports a good work-life balance (59%).
• Resultsinthisareaaremarginallythoughconsistentlyhigherthanthe2005Surveysuggestingthatemployeesperceive that their workplace is becoming more flexible.
Tasmanian State Service Employee Survey Report 2007 42
15.0 Flexible Workplace
Section 7(1)(i) of the State Service Act 2000 states: “the State Service provides a fair, flexible,safe and rewarding workplace”. The results for this Principle are shown in Figure 15.1.
Figure 15.1 – Flexible workplace
% Agree &
Strongly
Agree 2007
% Don’t
Know
% Agree &
Strongly
Agree 2005
Difference
Between
2007 & 2005Str
on
gly
Dis
ag
ree
Str
on
gly
Ag
ree
Ag
ree
Ne
ith
er
Dis
ag
ree
Flexible Workplace
Section s7 (1) (i) of the State Service Act
62% 5% 61% 1%
1.59 My workplace culture supports people to achieve a
good work-life balance
59% 2% 57% 2%
1.60 My workplace provides opportunities for me to work
part-time if I want to
64% 8% 64% 0%
1.61 My manager/supervisor takes into account the
differing needs and circumstances of employees
when making decisions
63% 4% 62% 1%
• Figure 15.1 shows good support regarding employees’ perception of their workplaces beingflexible (62% overall agreement).
• The majority of employees agreed that their workplace provides opportunities for them towork part-time (64%), believe their manager or supervisor takes into account the differingneeds of employees (63%), and agree that the culture of their workplace supports a goodwork-life balance (59%).
• Results in this area are marginally though consistently higher than the 2005 surveysuggesting that employees perceive that their workplace is becoming more flexible.
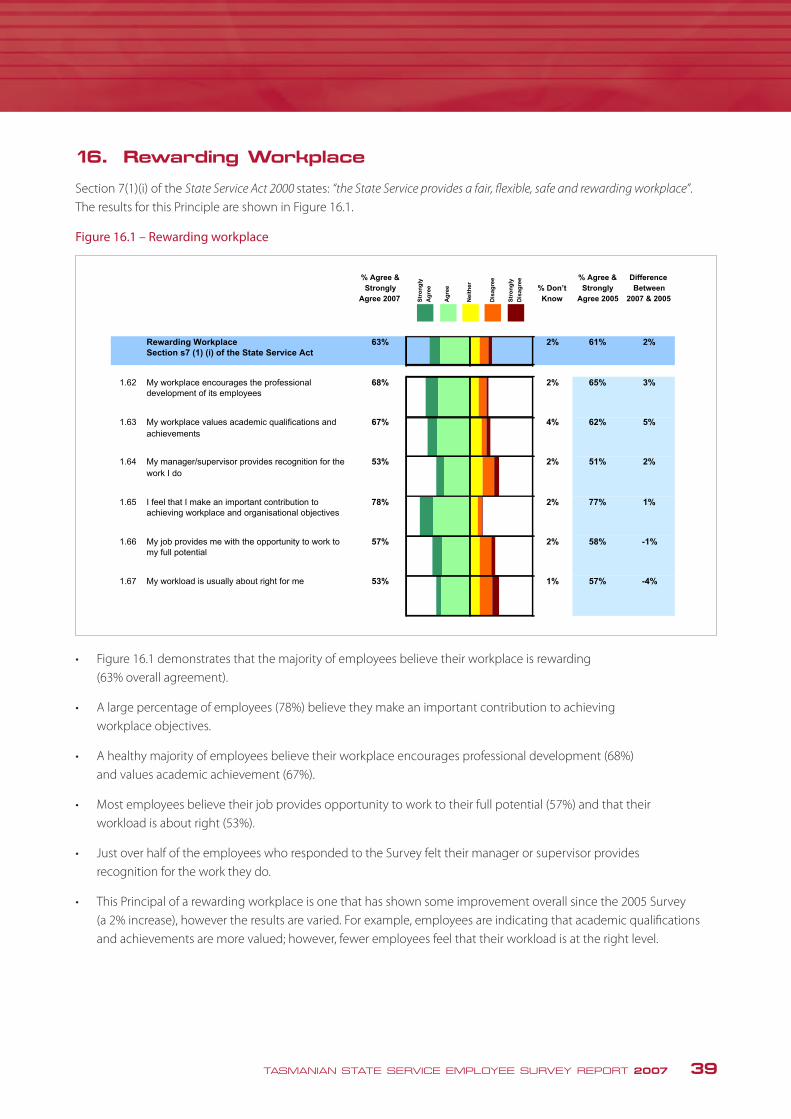
TASMANIAN STATE SERVICE EMPLOYEE SURVEY REPORT 2007 39
16. Rewarding Workplace
Section 7(1)(i) of the State Service Act 2000 states: “the State Service provides a fair, flexible, safe and rewarding workplace”. The results for this Principle are shown in Figure 16.1.
Figure 16.1 – Rewarding workplace
• Figure16.1demonstratesthatthemajorityofemployeesbelievetheirworkplaceisrewarding (63% overall agreement).
• Alargepercentageofemployees(78%)believetheymakeanimportantcontributiontoachieving workplace objectives.
• Ahealthymajorityofemployeesbelievetheirworkplaceencouragesprofessionaldevelopment(68%) and values academic achievement (67%).
• Mostemployeesbelievetheirjobprovidesopportunitytoworktotheirfullpotential(57%)andthattheir workload is about right (53%).
• JustoverhalfoftheemployeeswhorespondedtotheSurveyfelttheirmanagerorsupervisorprovides recognition for the work they do.
• ThisPrincipalofarewardingworkplaceisonethathasshownsomeimprovementoverallsincethe2005Survey (a 2% increase), however the results are varied. For example, employees are indicating that academic qualifications and achievements are more valued; however, fewer employees feel that their workload is at the right level.
Tasmanian State Service Employee Survey Report 2007 43
16.0 Rewarding Workplace
Section 7(1)(i) of the State Service Act 2000 states: “the State Service provides a fair, flexible,safe and rewarding workplace”. The results for this Principle are shown in Figure 16.1.
Figure 16.1 – Rewarding workplace
% Agree &
Strongly
Agree 2007
% Don’t
Know
% Agree &
Strongly
Agree 2005
Difference
Between
2007 & 2005Str
on
gly
Dis
ag
ree
Str
on
gly
Ag
ree
Ag
ree
Ne
ith
er
Dis
ag
ree
Rewarding Workplace
Section s7 (1) (i) of the State Service Act
63% 2% 61% 2%
1.62 My workplace encourages the professional
development of its employees
68% 2% 65% 3%
1.63 My workplace values academic qualifications and
achievements
67% 4% 62% 5%
1.64 My manager/supervisor provides recognition for the
work I do
53% 2% 51% 2%
1.65 I feel that I make an important contribution to
achieving workplace and organisational objectives
78% 2% 77% 1%
1.66 My job provides me with the opportunity to work to
my full potential
57% 2% 58% -1%
1.67 My workload is usually about right for me 53% 1% 57% -4%
• Figure 16.1 demonstrates that the majority of employees believe their workplace isrewarding (63% overall agreement).
• A large percentage of employees (78%) believe they make an important contribution toachieving workplace objectives.
• A healthy majority of employees believe their workplace encourages professionaldevelopment (68%) and values academic achievement (67%).
• Most employees believe their job provides opportunity to work to their full potential (57%)and that their workload is about right (53%).
• Just over half of the employees who responded to the survey felt their manager orsupervisor provides recognition for the work they do.
• This Principal of a rewarding workplace is one that has shown some improvement overallsince the 2005 survey (a 2% increase), however the results are varied. For example,employees are indicating that academic qualifications and achievements are more valued;however, fewer employees feel that their workload is at the right level.
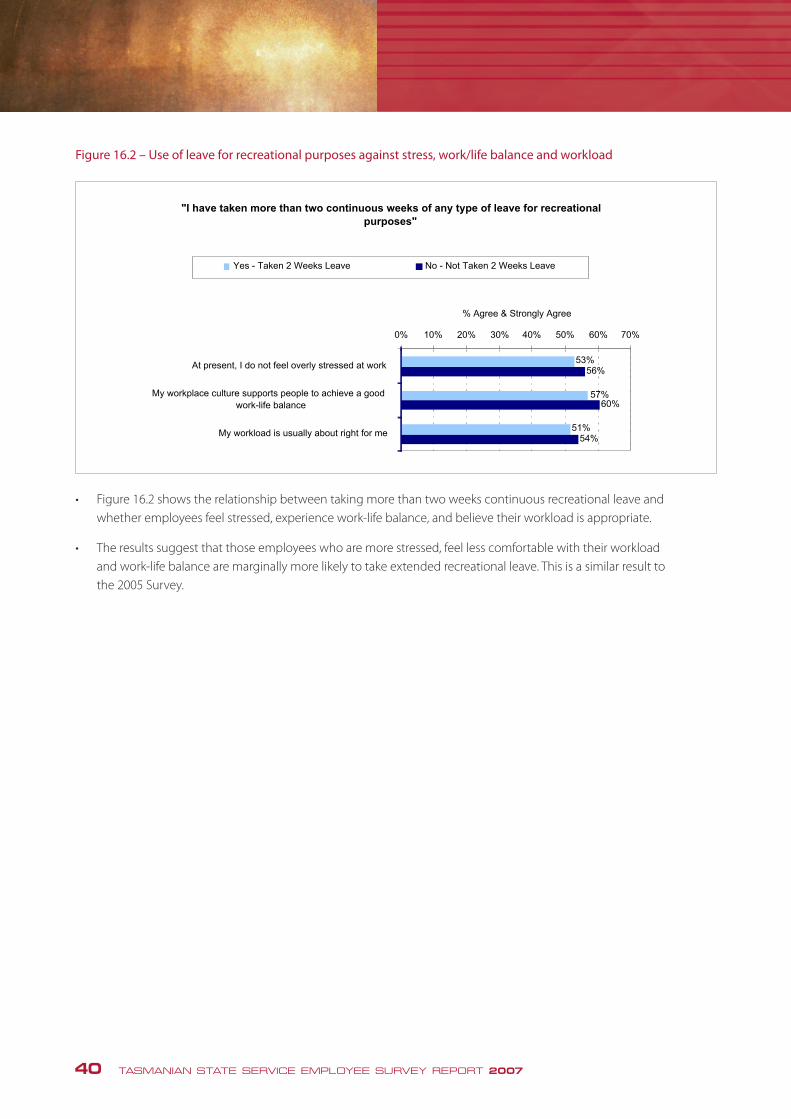
40 TASMANIAN STATE SERVICE EMPLOYEE SURVEY REPORT 2007
Figure 16.2 – Use of leave for recreational purposes against stress, work/life balance and workload
Tasmanian State Service Employee Survey Report 2007 44
Figure 16.2 – Use of leave for recreational purposes against stress, work/life balance andworkload
"I have taken more than two continuous weeks of any type of leave for recreational purposes"
53%
57%
51%
56%
60%
54%
0% 10% 20% 30% 40% 50% 60% 70%
At present, I do not feel overly stressed at work
My workplace culture supports people to achieve a goodwork-life balance
My workload is usually about right for me
% Agree & Strongly Agree
Yes - Taken 2 Weeks Leave No - Not Taken 2 Weeks Leave
Figure 16.2 shows the relationship between taking more than two weeks continuousrecreational leave and whether employees feel stressed, experience work-life balance, andbelieve their workload is appropriate.
The results suggest that those employees who are more stressed, feel less comfortablewith their workload and work-life balance are marginally more likely to take extendedrecreational leave. This is a similar result to the 2005 survey.
• Figure16.2showstherelationshipbetweentakingmorethantwoweekscontinuousrecreationalleaveand whether employees feel stressed, experience work-life balance, and believe their workload is appropriate.
• Theresultssuggestthatthoseemployeeswhoaremorestressed,feellesscomfortablewiththeirworkload and work-life balance are marginally more likely to take extended recreational leave. This is a similar result to the 2005 Survey.
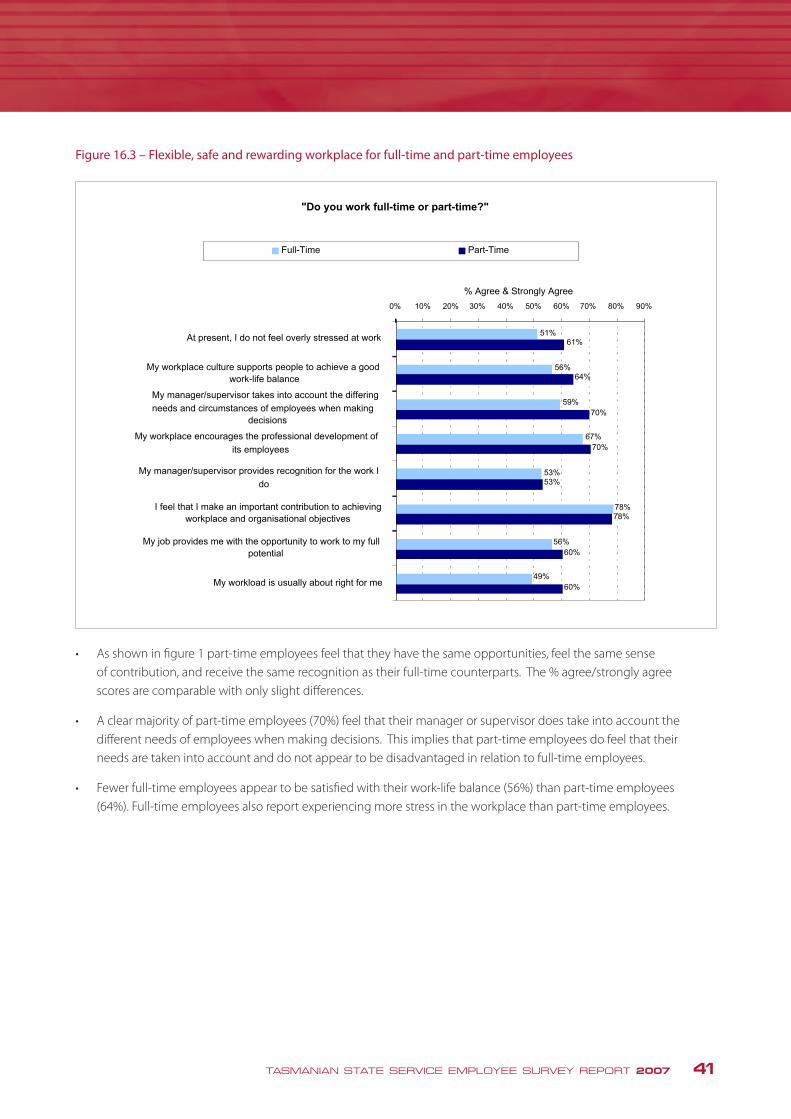
TASMANIAN STATE SERVICE EMPLOYEE SURVEY REPORT 2007 41
Figure 16.3 – Flexible, safe and rewarding workplace for full-time and part-time employees
• Asshowninfigure1part-timeemployeesfeelthattheyhavethesameopportunities,feelthesamesense of contribution, and receive the same recognition as their full-time counterparts. The % agree/strongly agree scores are comparable with only slight differences.
• Aclearmajorityofpart-timeemployees(70%)feelthattheirmanagerorsupervisordoestakeintoaccountthedifferent needs of employees when making decisions. This implies that part-time employees do feel that their needs are taken into account and do not appear to be disadvantaged in relation to full-time employees.
• Fewerfull-timeemployeesappeartobesatisfiedwiththeirwork-lifebalance(56%)thanpart-timeemployees (64%). Full-time employees also report experiencing more stress in the workplace than part-time employees.
Tasmanian State Service Employee Survey Report 2007 45
Figure 16.3 – Flexible, safe and rewarding workplace for full-time and part-timeemployees
As shown in figure 1 part-time employees feel that they have the same opportunities, feelthe same sense of contribution, and receive the same recognition as their full-timecounterparts. The % agree/strongly agree scores are comparable with only slightdifferences.
A clear majority of part-time employees (70%) feel that their manager or supervisor doestake into account the different needs of employees when making decisions. This impliesthat part-time employees do feel that their needs are taken into account and do not appearto be disadvantaged in relation to full-time employees.
Fewer full-time employees appear to be satisfied with their work-life balance (56%) thanpart-time employees (64%). Full-time employees also report experiencing more stress in theworkplace than part-time employees.
"Do you work full-time or part-time?"
51%
56%
59%
67%
53%
78%
56%
49%
61%
64%
70%
70%
53%
78%
60%
60%
0% 10% 20% 30% 40% 50% 60% 70% 80% 90%
At present, I do not feel overly stressed at work
My workplace culture supports people to achieve a goodwork-life balance
My manager/supervisor takes into account the differing
needs and circumstances of employees when makingdecisions
My workplace encourages the professional development of
its employees
My manager/supervisor provides recognition for the work I
do
I feel that I make an important contribution to achievingworkplace and organisational objectives
My job provides me with the opportunity to work to my fullpotential
My workload is usually about right for me
% Agree & Strongly Agree
Full-Time Part-Time
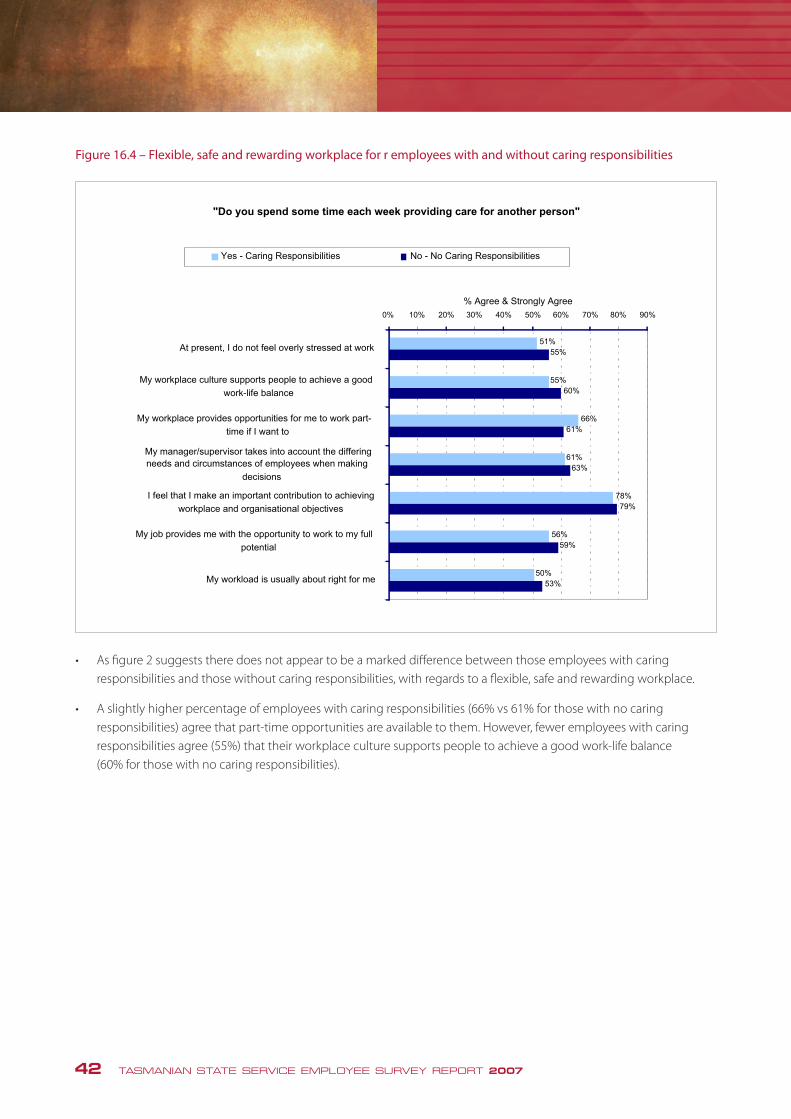
42 TASMANIAN STATE SERVICE EMPLOYEE SURVEY REPORT 2007
Figure 16.4 – Flexible, safe and rewarding workplace for r employees with and without caring responsibilities
Tasmanian State Service Employee Survey Report 2007 46
Figure 16.4 – Flexible, safe and rewarding workplace for r employees with and withoutcaring responsibilities
"Do you spend some time each week providing care for another person"
51%
55%
66%
61%
78%
56%
50%
55%
60%
61%
63%
79%
59%
53%
0% 10% 20% 30% 40% 50% 60% 70% 80% 90%
At present, I do not feel overly stressed at work
My workplace culture supports people to achieve a good
work-life balance
My workplace provides opportunities for me to work part-
time if I want to
My manager/supervisor takes into account the differingneeds and circumstances of employees when making
decisions
I feel that I make an important contribution to achieving
workplace and organisational objectives
My job provides me with the opportunity to work to my full
potential
My workload is usually about right for me
% Agree & Strongly Agree
Yes - Caring Responsibilities No - No Caring Responsibilities
As figure 2 suggests there does not appear to be a marked difference between thoseemployees with caring responsibilities and those without caring responsibilities, with regardsto a flexible, safe and rewarding workplace.
A slightly higher percentage of employees with caring responsibilities (66% vs 61% forthose with no caring responsibilities) agree that part-time opportunities are available tothem. However, fewer employees with caring responsibilities agree (55%) that theirworkplace culture supports people to achieve a good work-life balance (60% for those withno caring responsibilities).
• Asfigure2suggeststheredoesnotappeartobeamarkeddifferencebetweenthoseemployeeswithcaringresponsibilities and those without caring responsibilities, with regards to a flexible, safe and rewarding workplace.
• Aslightlyhigherpercentageofemployeeswithcaringresponsibilities(66%vs61%forthosewithnocaringresponsibilities) agree that part-time opportunities are available to them. However, fewer employees with caring responsibilities agree (55%) that their workplace culture supports people to achieve a good work-life balance (60% for those with no caring responsibilities).
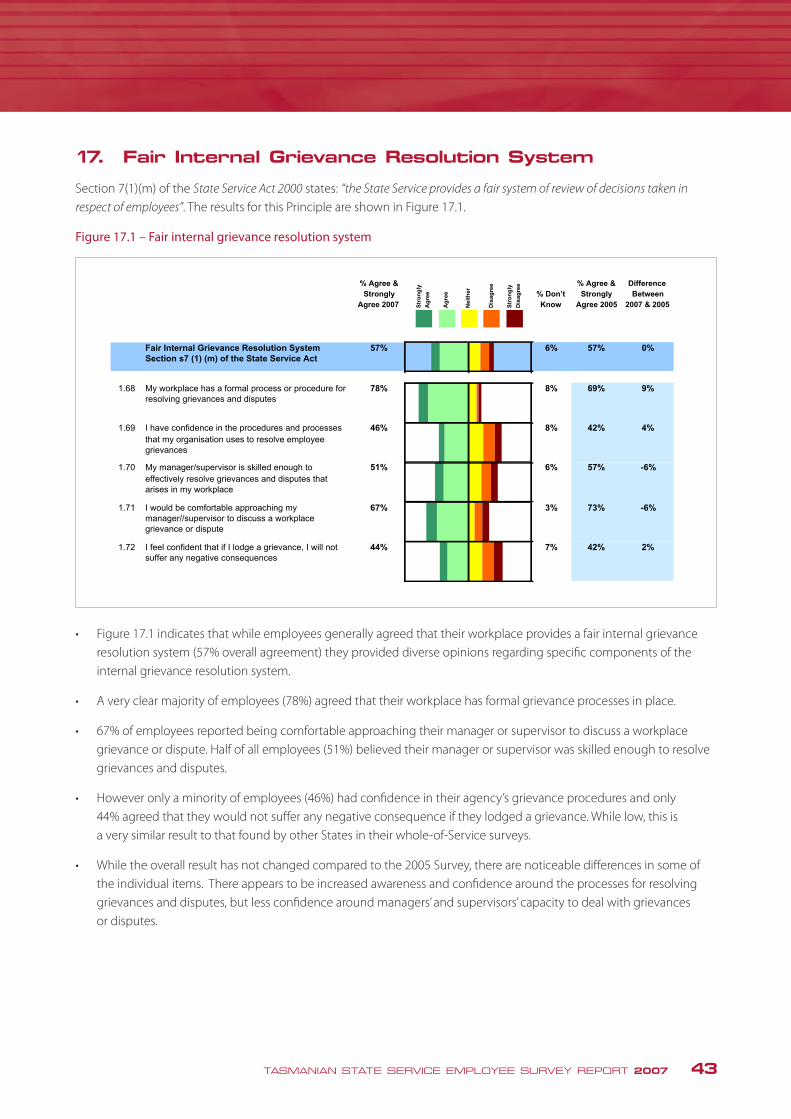
TASMANIAN STATE SERVICE EMPLOYEE SURVEY REPORT 2007 43
17. Fair Internal Grievance Resolution System
Section 7(1)(m) of the State Service Act 2000 states: “the State Service provides a fair system of review of decisions taken in
respect of employees”. The results for this Principle are shown in Figure 17.1.
Figure 17.1 – Fair internal grievance resolution system
• Figure17.1indicatesthatwhileemployeesgenerallyagreedthattheirworkplaceprovidesafairinternalgrievanceresolution system (57% overall agreement) they provided diverse opinions regarding specific components of the internal grievance resolution system.
• Averyclearmajorityofemployees(78%)agreedthattheirworkplacehasformalgrievanceprocessesinplace.
• 67%ofemployeesreportedbeingcomfortableapproachingtheirmanagerorsupervisortodiscussaworkplacegrievance or dispute. Half of all employees (51%) believed their manager or supervisor was skilled enough to resolve grievances and disputes.
• Howeveronlyaminorityofemployees(46%)hadconfidenceintheiragency’sgrievanceproceduresandonly 44% agreed that they would not suffer any negative consequence if they lodged a grievance. While low, this is a very similar result to that found by other States in their whole-of-Service surveys.
• Whiletheoverallresulthasnotchangedcomparedtothe2005Survey,therearenoticeabledifferencesinsomeofthe individual items. There appears to be increased awareness and confidence around the processes for resolving grievances and disputes, but less confidence around managers’ and supervisors’ capacity to deal with grievances or disputes.
Tasmanian State Service Employee Survey Report 2007 47
17.0 Fair Internal Grievance Resolution System
Section 7(1)(m) of the State Service Act 2000 states: “the State Service provides a fair systemof review of decisions taken in respect of employees”. The results for this Principle are shown inFigure 17.1.
Figure 17.1 – Fair internal grievance resolution system
% Agree &
Strongly
Agree 2007
% Don’t
Know
% Agree &
Strongly
Agree 2005
Difference
Between
2007 & 2005Str
on
gly
Dis
ag
ree
Str
on
gly
Ag
ree
Ag
ree
Ne
ith
er
Dis
ag
ree
Fair Internal Grievance Resolution System
Section s7 (1) (m) of the State Service Act
57% 6% 57% 0%
1.68 My workplace has a formal process or procedure for
resolving grievances and disputes
78% 8% 69% 9%
1.69 I have confidence in the procedures and processes
that my organisation uses to resolve employee
grievances
46% 8% 42% 4%
1.70 My manager/supervisor is skilled enough to
effectively resolve grievances and disputes that
arises in my workplace
51% 6% 57% -6%
1.71 I would be comfortable approaching my
manager//supervisor to discuss a workplace
grievance or dispute
67% 3% 73% -6%
1.72 I feel confident that if I lodge a grievance, I will not
suffer any negative consequences
44% 7% 42% 2%
• Figure 17.1 indicates that while employees generally agreed that their workplace provides afair internal grievance resolution system (57% overall agreement) they provided diverseopinions regarding specific components of the internal grievance resolution system.
• A very clear majority of employees (78%) agreed that their workplace has formal grievanceprocesses in place.
• 67% of employees reported being comfortable approaching their manager or supervisor todiscuss a workplace grievance or dispute. Half of all employees (51%) believed theirmanager or supervisor was skilled enough to resolve grievances and disputes.
• However only a minority of employees (46%) had confidence in their agency’s grievanceprocedures and only 44% agreed that they would not suffer any negative consequence ifthey lodged a grievance. While low, this is a very similar result to that found by other Statesin their whole-of-Service surveys.
• While the overall result has not changed compared to the 2005 survey, there are noticeabledifferences in some of the individual items. There appears to be increased awareness andconfidence around the processes for resolving grievances and disputes, but less confidencearound managers’ and supervisors’ capacity to deal with grievances or disputes.

44 TASMANIAN STATE SERVICE EMPLOYEE SURVEY REPORT 2007
Figure 17.2 – Use of internal grievance or dispute resolution processes against confidence in the processes
Tasmanian State Service Employee Survey Report 2007 48
Figure 17.2 – Use of internal grievance or dispute resolution processes againstconfidence in the processes
"I have used my organisation's internal grievance or dispute resolution process"
50%
78%
36%
39%
58%
35%
58%
78%
47%
53%
68%
45%
0% 10% 20% 30% 40% 50% 60% 70% 80% 90%
100
%
Fair Internal Grievance Resolution System
Section s7 (1) (m) of the State Service Act
My workplace has a formal process or procedure for
resolving grievances and disputes
I have confidence in the procedures and processes that myorganisation uses to resolve employee grievances
My manager/supervisor is skilled enough to effectivelyresolve grievances and disputes that arises in my
workplace
I would be comfortable approaching my
manager//supervisor to discuss a workplace grievance ordispute
I feel confident that if I lodge a grievance, I will not suffer any
negative consequences
% Agree & Strongly Agree
Yes - Used Dispute Resolution Process No - Not Used Dispute Resolution Process
Figure 17.2 shows that there is a relationship between employees’ use of their internalgrievance or dispute resolution processes and their belief that their workplace has a fairinternal grievance resolution system.
Those employees who have used their internal grievance or dispute resolution processeshad on average a lower level of confidence in the review system than did employees whohad not used internal grievance or dispute resolution processes. This result may be areflection of the lower level of confidence shown in managers’ or supervisors’ capacity todeal with grievances and disputes (in Figure 17.1 above).
• Figure17.2showsthatthereisarelationshipbetweenemployees’useoftheirinternalgrievanceordisputeresolutionprocesses and their belief that their workplace has a fair internal grievance resolution system.
• Thoseemployeeswhohaveusedtheirinternalgrievanceordisputeresolutionprocesseshadonaveragealowerlevel of confidence in the review system than did employees who had not used internal grievance or dispute resolution processes. This result may be a reflection of the lower level of confidence shown in managers’ or supervisors’ capacity to deal with grievances and disputes (in Figure 17.1 above).

TASMANIAN STATE SERVICE EMPLOYEE SURVEY REPORT 2007 45
ADDITIONAL RESULTS
This section of the report presents survey results that may not be directly linked to any particular Principle.
18. Part 2 of the Survey
Figure 18.1 shows employees’ responses to all of Part 2 of the Survey (some of which has also been presented earlier in this report) in which employees answered the listed questions based on their personal experiences over the 12 months prior to the Survey.
Almost all employees answered Part 2 of the Survey, with 97% of employees answering most of the questions in Part 2. Notable results shown in Figure 18.1 include 28% of employees have participated on a selection panel, 38% of employees had a performance management discussion with their supervisor, and only 11% of employees have used their organisation’s grievance or dispute resolution processes.
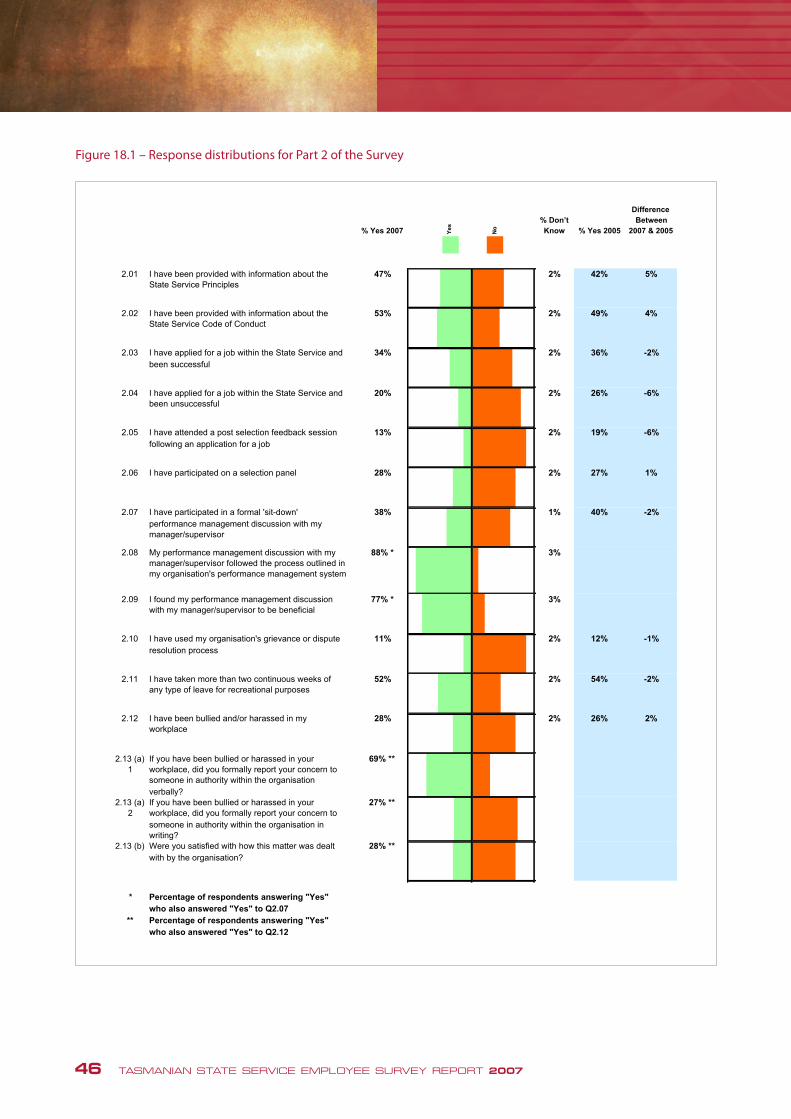
46 TASMANIAN STATE SERVICE EMPLOYEE SURVEY REPORT 2007
Figure 18.1 – Response distributions for Part 2 of the Survey
Tasmanian State Service Employee Survey Report 2007 50
Figure 18.1 – Response distributions for Part 2 of the survey
% Yes 2007
% Don’t
Know % Yes 2005
Difference
Between
2007 & 2005Ye
s
No
2.01 I have been provided with information about the
State Service Principles
47% 2% 42% 5%
2.02 I have been provided with information about the
State Service Code of Conduct
53% 2% 49% 4%
2.03 I have applied for a job within the State Service and
been successful
34% 2% 36% -2%
2.04 I have applied for a job within the State Service and
been unsuccessful
20% 2% 26% -6%
2.05 I have attended a post selection feedback session
following an application for a job
13% 2% 19% -6%
2.06 I have participated on a selection panel 28% 2% 27% 1%
2.07 I have participated in a formal 'sit-down'
performance management discussion with my
manager/supervisor
38% 1% 40% -2%
2.08 My performance management discussion with my
manager/supervisor followed the process outlined in
my organisation's performance management system
88% * 3%
2.09 I found my performance management discussion
with my manager/supervisor to be beneficial
77% * 3%
2.10 I have used my organisation's grievance or dispute
resolution process
11% 2% 12% -1%
2.11 I have taken more than two continuous weeks of
any type of leave for recreational purposes
52% 2% 54% -2%
2.12 I have been bullied and/or harassed in my
workplace
28% 2% 26% 2%
2.13 (a)
1
If you have been bullied or harassed in your
workplace, did you formally report your concern to
someone in authority within the organisation
verbally?
69% **
2.13 (a)
2
If you have been bullied or harassed in your
workplace, did you formally report your concern to
someone in authority within the organisation in
writing?
27% **
2.13 (b) Were you satisfied with how this matter was dealt
with by the organisation?
28% **
* Percentage of respondents answering "Yes"
who also answered "Yes" to Q2.07
** Percentage of respondents answering "Yes"
who also answered "Yes" to Q2.12

TASMANIAN STATE SERVICE EMPLOYEE SURVEY REPORT 2007 47
19. Top 10 and bottom 10 items compared to the 2005 survey
One of the advantages of having run two consecutive surveys is that it enables historical benchmarking of data comparing results between the 2005 Employee Survey and the 2007 Survey. For each category or item where a direct comparison could be made the results from the 2005 Survey and the difference between the 2007 and 2005 scores have been listed throughout this report. Figures 19.1 and 19.2 below identify the 10 largest increases and decreases between the 2005 and 2007 Surveys.
Of the top 10 increases, two relate to awareness of the State Service Principles, and another two items are from the principle Rewarding Workplace with the remainder coming from a variety of the remaining 14 Principles.
Of the 10 largest decreases, two relate to the principle Fair Internal Grievance Resolution System and two relate to the principle Discrimination Free and Diversity Recognised.
Figure 19.1 – Top 10 increases since the 2005 Survey
Tasmanian State Service Employee Survey Report 2007 51
18.2 Top 10 and bottom 10 items compared to the 2005 survey
One of the advantages of having run two consecutive surveys is that it enables historicalbenchmarking of data comparing results between the 2005 employee survey and the 2007survey. For each category or item where a direct comparison could be made the results fromthe 2005 survey and the difference between the 2007 and 2005 scores have been listedthroughout this report. Figures 18.2 and 18.3 below identify the 10 largest increases anddecreases between the 2005 and 2007 surveys.
Of the top 10 increases, two relate to awareness of the State Service Principles, and anothertwo items are from the principle Rewarding Workplace with the remainder coming from a varietyof the remaining 14 Principles.
Of the 10 largest decreases, two relate to the principle Fair Internal Grievance ResolutionSystem and two relate to the principle Discrimination Free and Diversity Recognised.
Figure 18.2 – Top 10 increases since the 2005 survey
9231
Whole Of Service % Agree &
Strongly
Agree 2007
% Don’t
Know
% Agree &
Strongly
Agree 2005
Difference
Between
2007 & 2005
Responses: 9231S
tro
ng
ly
Dis
ag
ree
Str
on
gly
Ag
ree
Ag
ree
/ Y
es
Ne
ith
er
Dis
ag
ree
/ N
o
1.01 I am aware of the State Service Principles (in the
State Service Act 2000 )
79% 3% 64% 15%
1.68 My workplace has a formal process or procedure for
resolving grievances and disputes
78% 8% 69% 9%
1.02 I am aware that there is a State Service Code of
Conduct in the State Service Act 2000 , that applies
to all employees and officers
90% 2% 82% 8%
1.63 My workplace values academic qualifications and
achievements
67% 4% 62% 5%
1.10 My workplace strives to match services to customer
needs
82% 1% 78% 4%
1.69 I have confidence in the procedures and processes
that my organisation uses to resolve employee
grievances
46% 8% 42% 4%
1.44 The leadership in my workplace is of a high
standard
56% 1% 52% 4%
1.24 People who serve on selection panels in my
workplace have the skills to select the best people
to fill job vacancies
57% 7% 54% 3%
1.62 My workplace encourages the professional
development of its employees
68% 2% 65% 3%
1.55 My manager/supervisor takes action to ensure
employee’s health and safety
76% 2% 73% 3%
.
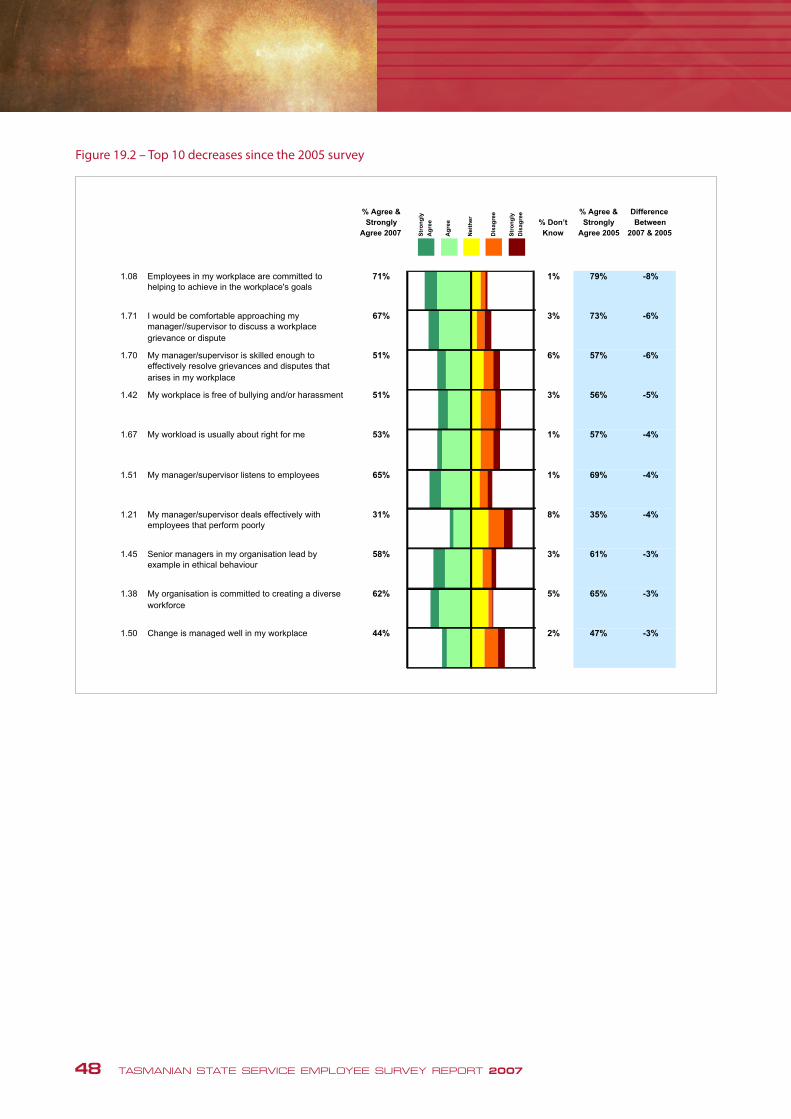
48 TASMANIAN STATE SERVICE EMPLOYEE SURVEY REPORT 2007
Figure 19.2 – Top 10 decreases since the 2005 survey
Tasmanian State Service Employee Survey Report 2007 52
Figure 18.3 – Top 10 decreases since the 2005 survey
% Agree &
Strongly
Agree 2007
% Don’t
Know
% Agree &
Strongly
Agree 2005
Difference
Between
2007 & 2005Str
on
gly
Dis
ag
ree
Str
on
gly
Ag
ree
Ag
ree
Ne
ith
er
Dis
ag
ree
1.08 Employees in my workplace are committed to
helping to achieve in the workplace's goals
71% 1% 79% -8%
1.71 I would be comfortable approaching my
manager//supervisor to discuss a workplace
grievance or dispute
67% 3% 73% -6%
1.70 My manager/supervisor is skilled enough to
effectively resolve grievances and disputes that
arises in my workplace
51% 6% 57% -6%
1.42 My workplace is free of bullying and/or harassment 51% 3% 56% -5%
1.67 My workload is usually about right for me 53% 1% 57% -4%
1.51 My manager/supervisor listens to employees 65% 1% 69% -4%
1.21 My manager/supervisor deals effectively with
employees that perform poorly
31% 8% 35% -4%
1.45 Senior managers in my organisation lead by
example in ethical behaviour
58% 3% 61% -3%
1.38 My organisation is committed to creating a diverse
workforce
62% 5% 65% -3%
1.50 Change is managed well in my workplace 44% 2% 47% -3%
18.3 Gap analysis & key driver analysis
Figure 18.4 highlights the potential priorities for attention if the State Service wishes to improveemployees’ overall evaluation of the Principles being upheld in their workplace. The 14Principles in the survey are plotted on two axes. The vertical axis shows the relative agreementthat employees reported in each of the 14 categories. The horizontal axis shows the strength ofrelationship (using statistical correlations) between how people rated the 14 Principles and theiroverall evaluation.
The benefit of such an analysis is that it allows identification of possible gaps between how wellthe Principles were scored and how important they appear to be for employees. ThosePrinciples that appear within the oval in Figure 18.4 show an acceptable match between howwell they were scored and how important they may be.
If the State Service wishes to improve employees’ overall evaluation of the Principles, thosePrinciples in the bottom right corner of Figure 18.4 are potential priorities for action given theyare closely associated with employees’ overall evaluation of the Principles but show some of thelowest scores. Figure 18.4 suggests the highest priorities for action may be improving thePrinciples of Managing Performance, Employment Based On Merit, Fair Internal GrievanceResolution System, Employee Consultation and Input Encouraged, Rewarding Workplace, andQuality Leadership.
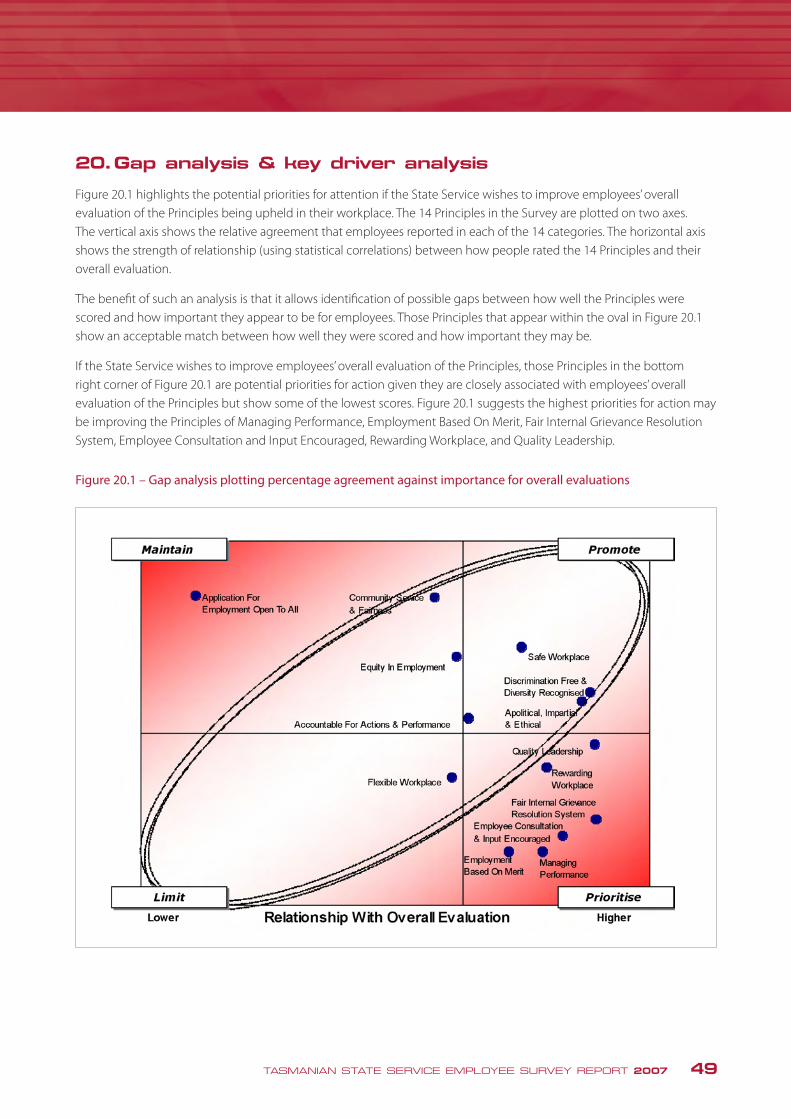
TASMANIAN STATE SERVICE EMPLOYEE SURVEY REPORT 2007 49
20. Gap analysis & key driver analysis
Figure 20.1 highlights the potential priorities for attention if the State Service wishes to improve employees’ overall evaluation of the Principles being upheld in their workplace. The 14 Principles in the Survey are plotted on two axes. The vertical axis shows the relative agreement that employees reported in each of the 14 categories. The horizontal axis shows the strength of relationship (using statistical correlations) between how people rated the 14 Principles and their overall evaluation.
The benefit of such an analysis is that it allows identification of possible gaps between how well the Principles were scored and how important they appear to be for employees. Those Principles that appear within the oval in Figure 20.1 show an acceptable match between how well they were scored and how important they may be.
If the State Service wishes to improve employees’ overall evaluation of the Principles, those Principles in the bottom right corner of Figure 20.1 are potential priorities for action given they are closely associated with employees’ overall evaluation of the Principles but show some of the lowest scores. Figure 20.1 suggests the highest priorities for action may be improving the Principles of Managing Performance, Employment Based On Merit, Fair Internal Grievance Resolution System,EmployeeConsultationandInputEncouraged,RewardingWorkplace,andQualityLeadership.
Figure 20.1 – Gap analysis plotting percentage agreement against importance for overall evaluations

50 TASMANIAN STATE SERVICE EMPLOYEE SURVEY REPORT 2007
RewardingWorkplace
+
Incr
easi
ng
Imp
ort
ance +
+
Overall Evaluation"All things considered,I think the State Service
Principles are upheldin my workplace"
Apolitical,
Discrimination Free & Diversity
Recognised
+
Employment Based on Merit
Impartial &Ethical
Fair Internal Grievence Resolution
Figure 20.2 – Key driver analysis showing the strongest predictors of employees’ overall evaluations
Another method of estimating priorities for action is shown in Figure 20.2. Using a statistical technique called “regression” (sometimes referred to as a “key driver analysis”) employees’ overall evaluation of the Principles being upheld was most strongly predicted by the five Principles of having a Fair Internal Grievance Resolution System, being Apolitical, Impartial and Ethical, having a Rewarding Workplace and Discrimination Free and Diversity Recognised. That is, if the State Service wished to improve employees’ overall evaluation this analysis suggests these may be the four Principles that would have the largest impact.
By considering the results in Figures 20.1 and 20.2 simultaneously we see that the two Principles of having a Fair Internal Grievance Resolution System and a Rewarding Workplace are prominent in both, suggesting these two Principles may be the highest priorities for action. These results reemphasise one of the main findings from the previously discussed Figure 19.2 (showing the 10 largest decreases since 2005), which suggested that a Fair Internal Grievance Resolution system may be a priority for improvement. The following Principles appear once as priorities in either Figure 20.1 or 20.2 (but not both), and hence may be secondary priorities for action: Managing Performance, Employee Consultation and InputEncouraged,EmploymentBasedOnMerit,QualityLeadership,DiscriminationFreeandDiversityrecognised,andbeing Apolitical, Impartial and Ethical. Of course, the results of these statistical analyses need to be considered within the context of other priorities, plans and activities within the State Service. These results should be considered as “food for thought” rather than being firmly conclusive.

TASMANIAN STATE SERVICE EMPLOYEE SURVEY REPORT 2007 51
Appendix 1 – State Service Employee Survey 2007
State Service Employee Survey 2007 1
State Service Commissioner’s State Service Employee Survey 2007
This survey aims to measure employee perceptions of how well the State Service Principles are upheld within individual Agencies and across the State Service as a whole. The survey results will be analysed for the Office of State Service Commissioner by Macquarie University and will be measured against the 2005 Survey results, with the major findings being published later this year at www.ossc.tas.gov.au.
Following the findings of the Employee Survey in 2005, and to address some of the issues raised by the Survey, a major project was undertaken by the Commissioner to evaluate performance management systems in all Agencies and a report was produced in 2006. The findings of this report have been published on the OSSC website at www.ossc.tas.gov.au. The 2007 Employee Survey will continue to provide a means of evaluating employment practices, procedures and standards in Agencies, and the results will help shape the future work programs of the Office of State Service Commissioner.
Survey responses will be anonymous and utmost confidentiality will be maintained with regard to all data. The results will be aggregated and reported in a way that makes it impossible to identify individuals.
How to complete the survey The Commissioner is interested in your personal views, perceptions and experiences. There are no right or wrong answers to the questions.
The survey should take about 15-20 minutes to complete. To complete the survey please:
Place a cross in the box that best represents your views about the situation in your workplace Cross only one box for each question unless otherwise instructed.Use a blue or black pen.Complete both sides of the page.DO NOT write on (or mark) the form except where indicated. If there are extra marks or writing on the form it may not be possible for the scanner to ‘read’ your responses.
Definitions Please use the following definitions when completing the survey questions.
Manager/Supervisor: The person in your workplace or team to whom you report. If you work for more than one team/work unit, please think of the manager or supervisor with whom you work most frequently.
Workplace: The immediate workplace, office, work unit or team where you spend the largest proportion of your time at work.
Organisation: The organisation (e.g. Department, Agency, Authority etc) in which you are employed.
Returning the surveyPlease complete and return the survey before Friday 3 August 2007. If you receive a survey by email in addition to this paper survey, please complete one or the other, not both.
Any questions or problems completing the survey in this format?
Please call the Employee Survey Hotline during business hours on 03 6233 3637
or email [email protected]
State Service Principles and Code of Conduct. The State Service Principles are the cornerstone of the State Service Act 2000. The Principles provide a statement as to both the way that employment is managed in the State Service, and the standards expected of those who work within it. All employees are required to comply with and uphold the Principles, and Heads of Agencies are also required to promote the Principles.
The Principles incorporate a number of inter-related themes: merit and opportunity; equity and diversity; performance management; leadership and development; ethics and accountability, including fair and impartial service to the community; and a fair, flexible, safe and rewarding workplace.
The State Service Code of Conduct (which is contained in section 9 of the State Service Act 2000) reinforces and upholds the Principles by establishing standards of behaviour and conduct that apply to all employees and officers, including Heads of

52 TASMANIAN STATE SERVICE EMPLOYEE SURVEY REPORT 2007
Appendix 1 – State Service Employee Survey 2007
I Invite Your Views
State Service Employee Survey 2007 2
Agencies.
PART 1 STATE SERVICE PRINCIPLES. Please select the answer that best represents your views.
1.1 I am aware of the State Service Principles (in the State Service Act 2000). 1 Yes 2 No 3 Not before today
1.2 I am aware that there is a State Service Code of Conduct in the StateService Act 2000 that applies to all employees and officers. 1 Yes 2 No 3 Not before today
StronglyAgree Agree
NeitherAgree nor Disagree Disagree
StronglyDisagree
Don’t know
APOLITICAL, IMPARTIAL & ETHICAL The State Service is apolitical, performing its functions in an impartial, ethical and professional manner. Section 7(1)(a) of the Act.
1.3 My organisation actively encourages all employees to behave in an ethical manner. 5 4 3 2 1 6
1.4 In my workplace, decisions about all work matters are made fairly, objectively and ethically. 5 4 3 2 1 6
1.5 My manager/supervisor would take appropriate action if decisions being made about work matters were not objective, fair and ethical.
5 4 3 2 1 6
1.6 My manager/supervisor encourages employees to avoid conflicts of interest. 5 4 3 2 1 6
ACCOUNTABLE FOR ACTIONS & PERFORMANCE The State Service is accountable for its actions and performance, within the framework of Ministerial responsibility, to the Government, the Parliament and the community. Section 7(1)(d) of the Act.
1.7 My manager/supervisor provides consistent information about our goals and priorities. 5 4 3 2 1 6
1.8 Employees in my workplace are committed to helping to achieve the workplace’s goals. 5 4 3 2 1 6
1.9 Employees in my workplace take responsibility for their decisions and actions. 5 4 3 2 1 6
COMMUNITY SERVICE & FAIRNESS The State Service delivers services fairly and impartially to the community. Section 7(1)(f) of the Act.
1.10 My workplace strives to match services to customer needs. 5 4 3 2 1 6
1.11 Employees in my workplace are committed to providing excellent customer service. 5 4 3 2 1 6
1.12 In my workplace, we use feedback from our customers and clients to improve the services we deliver. 5 4 3 2 1 6
1.13 Employees in my workplace behave ethically, professionally and fairly when making decisions that affect their clients and customers.
5 4 3 2 1 6
1.14 Confidentiality of information is taken seriously in my workplace. 5 4 3 2 1 6
1.15 Employees in my workplace do not abuse their authority or position when dealing with customers or clients. 5 4 3 2 1 6
MANAGING PERFORMANCE The State Service focuses on managing its performance and achieving results. Section 7(1)(j) of the Act.
1.16 My organisation has a formal performance management system. 5 4 3 2 1 6

TASMANIAN STATE SERVICE EMPLOYEE SURVEY REPORT 2007 53
Appendix 1 – State Service Employee Survey 2007
I Invite Your Views
State Service Employee Survey 2007 3
StronglyAgree Agree
NeitherAgree nor Disagree Disagree
StronglyDisagree
Don’t know
1.17 My manager/supervisor is committed to managing employees so as to ensure that they perform their work well. 5 4 3 2 1 6
1.18 My manager/supervisor gives me enough feedback on my performance to ensure that I understand the results that he or she requires.
5 4 3 2 1 6
1.19 Most people in my workplace use time and resources efficiently. 5 4 3 2 1 6
1.20 In my workplace, good work performance is recognised. 5 4 3 2 1 6
1.21 My manager/supervisor deals effectively with employees that perform poorly. 5 4 3 2 1 6
EMPLOYMENT BASED ON MERIT The State Service is a public service in which employment decisions are based on merit. Section 7(1)(b) of the Act.
1.22 My organisation has good procedures and processes for selecting employees. 5 4 3 2 1 6
1.23 The selection criteria for vacancies advertised in my workplace accurately reflect the requirements of the job. 5 4 3 2 1 6
1.24 People who serve on selection panels in my workplace have the skills to select the best people to fill job vacancies. 5 4 3 2 1 6
1.25 My workplace selects people with the right knowledge, skills and abilities to fill job vacancies. 5 4 3 2 1 6
1.26 Favouritism is not a factor in decisions to promote employees in my workplace. 5 4 3 2 1 6
1.27 Recruitment and promotion decisions in this workplace are fair. 5 4 3 2 1 6
APPLICATION FOR EMPLOYMENT OPEN TO ALL The State Service provides a reasonable opportunity to members of the community to apply for State Service employment. Section 7(1)(l) of the Act.
1.28 Most job vacancies that arise in my workplace are advertised publicly (e.g. gazette, on the jobsite and/or in the newspaper).
5 4 3 2 1 6
1.29 People outside the State Service have a reasonable opportunity to apply for vacant positions/jobs in my workplace.
5 4 3 2 1 6
EQUITY IN EMPLOYMENT The State Service promotes equity in employment. Section 7(1)(k) of the Act.
1.30 My organisation is committed to promoting equity in employment. 5 4 3 2 1 6
1.31 Gender is not a barrier to success in my workplace. 5 4 3 2 1 6
1.32 Age is not a barrier to success in my workplace. 5 4 3 2 1 6
1.33 Cultural background is not a barrier to success in my workplace. 5 4 3 2 1 6
1.34 Sexual orientation is not a barrier to success in my workplace. 5 4 3 2 1 6
1.35 Having a disability is not a barrier to success in my workplace. 5 4 3 2 1 6
1.36 Having family responsibilities is not a barrier to success in my workplace. 5 4 3 2 1 6
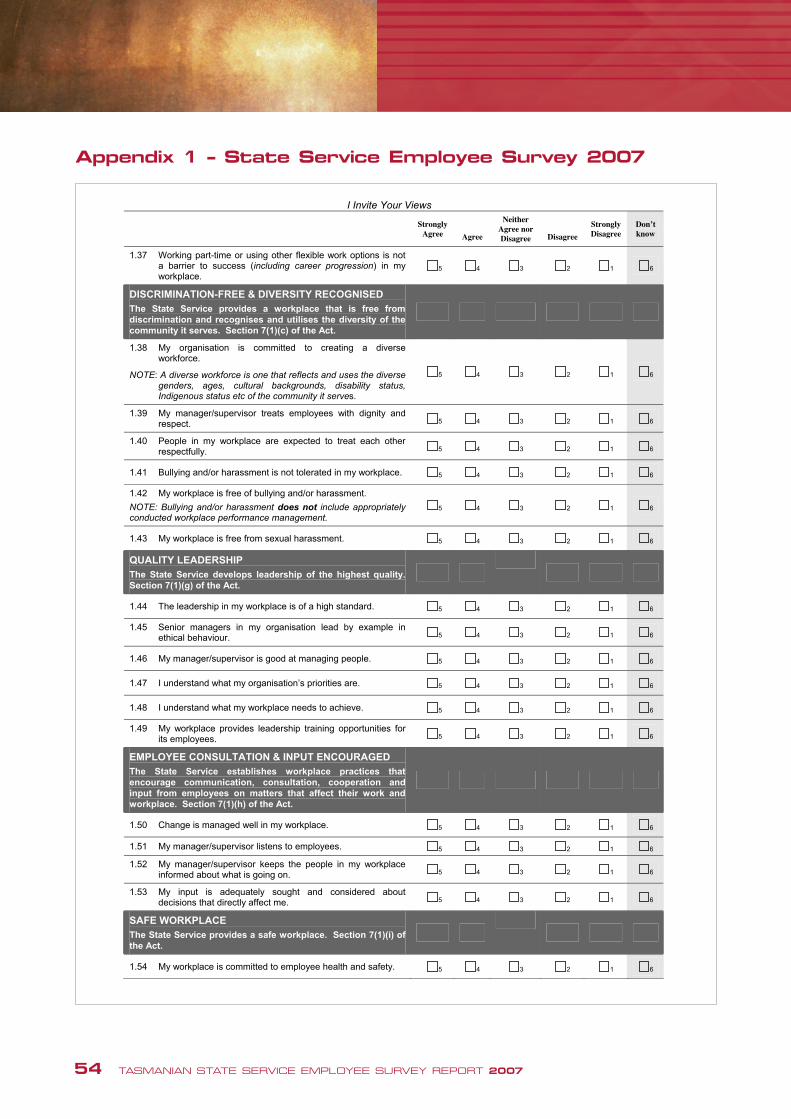
54 TASMANIAN STATE SERVICE EMPLOYEE SURVEY REPORT 2007
Appendix 1 – State Service Employee Survey 2007
I Invite Your Views
State Service Employee Survey 2007 4
StronglyAgree Agree
NeitherAgree nor Disagree Disagree
StronglyDisagree
Don’t know
1.37 Working part-time or using other flexible work options is not a barrier to success (including career progression) in my workplace.
5 4 3 2 1 6
DISCRIMINATION-FREE & DIVERSITY RECOGNISED The State Service provides a workplace that is free from discrimination and recognises and utilises the diversity of the community it serves. Section 7(1)(c) of the Act.
1.38 My organisation is committed to creating a diverse workforce.
NOTE: A diverse workforce is one that reflects and uses the diverse genders, ages, cultural backgrounds, disability status, Indigenous status etc of the community it serves.
5 4 3 2 1 6
1.39 My manager/supervisor treats employees with dignity and respect. 5 4 3 2 1 6
1.40 People in my workplace are expected to treat each other respectfully. 5 4 3 2 1 6
1.41 Bullying and/or harassment is not tolerated in my workplace. 5 4 3 2 1 6
1.42 My workplace is free of bullying and/or harassment.
NOTE: Bullying and/or harassment does not include appropriately conducted workplace performance management.
5 4 3 2 1 6
1.43 My workplace is free from sexual harassment. 5 4 3 2 1 6
QUALITY LEADERSHIP The State Service develops leadership of the highest quality. Section 7(1)(g) of the Act.
1.44 The leadership in my workplace is of a high standard. 5 4 3 2 1 6
1.45 Senior managers in my organisation lead by example in ethical behaviour. 5 4 3 2 1 6
1.46 My manager/supervisor is good at managing people. 5 4 3 2 1 6
1.47 I understand what my organisation’s priorities are. 5 4 3 2 1 6
1.48 I understand what my workplace needs to achieve. 5 4 3 2 1 6
1.49 My workplace provides leadership training opportunities for its employees. 5 4 3 2 1 6
EMPLOYEE CONSULTATION & INPUT ENCOURAGED The State Service establishes workplace practices that encourage communication, consultation, cooperation and input from employees on matters that affect their work and workplace. Section 7(1)(h) of the Act.
1.50 Change is managed well in my workplace. 5 4 3 2 1 6
1.51 My manager/supervisor listens to employees. 5 4 3 2 1 6
1.52 My manager/supervisor keeps the people in my workplace informed about what is going on. 5 4 3 2 1 6
1.53 My input is adequately sought and considered about decisions that directly affect me. 5 4 3 2 1 6
SAFE WORKPLACE The State Service provides a safe workplace. Section 7(1)(i) of the Act.
1.54 My workplace is committed to employee health and safety. 5 4 3 2 1 6

TASMANIAN STATE SERVICE EMPLOYEE SURVEY REPORT 2007 55
Appendix 1 – State Service Employee Survey 2007
I Invite Your Views
State Service Employee Survey 2007 5
StronglyAgree Agree
NeitherAgree nor Disagree Disagree
StronglyDisagree
Don’t know
1.55 My manager/supervisor takes action to ensure employee’s health and safety. 5 4 3 2 1 6
1.56 My manager/supervisor encourages employees to report health and safety incidents and hazards. 5 4 3 2 1 6
1.57 Employees in my workplace display good occupational health and safety awareness. 5 4 3 2 1 6
1.58 At present, I do not feel overly stressed at work. 5 4 3 2 1 6
FLEXIBLE WORKPLACE The State Service provides a flexible workplace. Section 7(1)(i) of the Act.
1.59 My workplace culture supports people to achieve a good work-life balance. 5 4 3 2 1 6
1.60 My workplace provides opportunities for me to work part-time if I want to. 5 4 3 2 1 6
1.61 My manager/supervisor takes into account the differing needs and circumstances of employees when making decisions.
5 4 3 2 1 6
REWARDING WORKPLACE The State Service provides a rewarding workplace. Section 7(1)(i) of the Act.
1.62 My workplace encourages the professional development of its employees. 5 4 3 2 1 6
1.63 My workplace values academic qualifications and achievements. 5 4 3 2 1 6
1.64 My manager/supervisor provides recognition for the work I do. 5 4 3 2 1 6
1.65 I feel that I make an important contribution to achieving workplace and organisational objectives. 5 4 3 2 1 6
1.66 My job provides me with the opportunity to work to my full potential. 5 4 3 2 1 6
1.67 My workload is usually about right for me. 5 4 3 2 1 6
FAIR INTERNAL REVIEW SYSTEM The State Service provides a fair system of review of decisions taken in respect of employees. Section 7(1)(m) of the Act.
1.68 My workplace has a formal process or procedure for resolving grievances and disputes. 5 4 3 2 1 6
1.69 I have confidence in the procedures and processes that my organisation uses to resolve employee grievances. 5 4 3 2 1 6
1.70 My manager/supervisor is skilled enough to effectively resolve grievances and disputes that arise in my workplace. 5 4 3 2 1 6
1.71 I would be comfortable approaching my manager/supervisor to discuss a workplace grievance or dispute. 5 4 3 2 1 6
1.72 I feel confident that if I lodge a grievance, I will not suffer any negative consequences. 5 4 3 2 1 6
General Comment.
1.73 All things considered, I think that the State Service Principles are upheld in my workplace. 5 4 3 2 1 6
1.74 If you would like to make any additional BRIEF comments, please use the text box below.
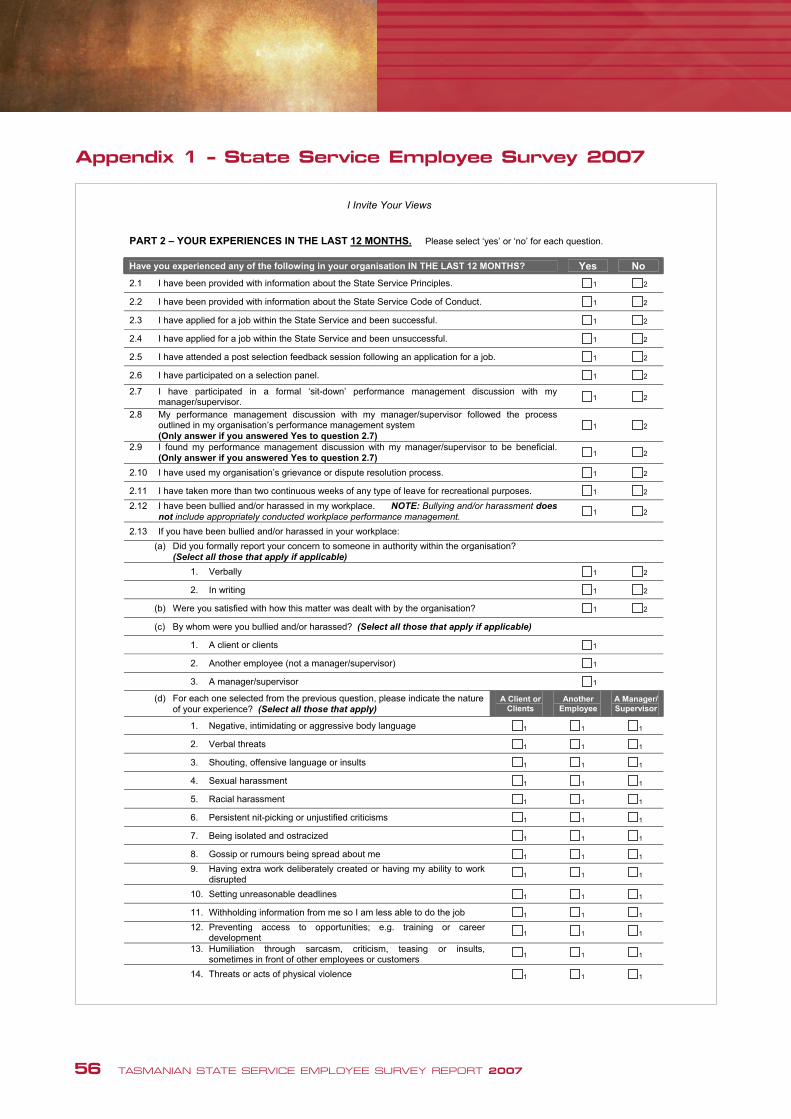
56 TASMANIAN STATE SERVICE EMPLOYEE SURVEY REPORT 2007
Appendix 1 – State Service Employee Survey 2007
I Invite Your Views
State Service Employee Survey 2007 6
PART 2 – YOUR EXPERIENCES IN THE LAST 12 MONTHS. Please select ‘yes’ or ‘no’ for each question.
Have you experienced any of the following in your organisation IN THE LAST 12 MONTHS? Yes No
2.1 I have been provided with information about the State Service Principles. 1 2
2.2 I have been provided with information about the State Service Code of Conduct. 1 2
2.3 I have applied for a job within the State Service and been successful. 1 2
2.4 I have applied for a job within the State Service and been unsuccessful. 1 2
2.5 I have attended a post selection feedback session following an application for a job. 1 2
2.6 I have participated on a selection panel. 1 2
2.7 I have participated in a formal ‘sit-down’ performance management discussion with my manager/supervisor. 1 2
2.8 My performance management discussion with my manager/supervisor followed the process outlined in my organisation’s performance management system (Only answer if you answered Yes to question 2.7)
1 2
2.9 I found my performance management discussion with my manager/supervisor to be beneficial.(Only answer if you answered Yes to question 2.7) 1 2
2.10 I have used my organisation’s grievance or dispute resolution process. 1 2
2.11 I have taken more than two continuous weeks of any type of leave for recreational purposes. 1 2
2.12 I have been bullied and/or harassed in my workplace. NOTE: Bullying and/or harassment does not include appropriately conducted workplace performance management.
1 2
2.13 If you have been bullied and/or harassed in your workplace:
(a) Did you formally report your concern to someone in authority within the organisation?(Select all those that apply if applicable)
1. Verbally 1 2
2. In writing 1 2
(b) Were you satisfied with how this matter was dealt with by the organisation? 1 2
(c) By whom were you bullied and/or harassed? (Select all those that apply if applicable)
1. A client or clients 1
2. Another employee (not a manager/supervisor) 1
3. A manager/supervisor 1
(d) For each one selected from the previous question, please indicate the nature of your experience? (Select all those that apply)
A Client or Clients
Another Employee
A Manager/ Supervisor
1. Negative, intimidating or aggressive body language 1 1 1
2. Verbal threats 1 1 1
3. Shouting, offensive language or insults 1 1 1
4. Sexual harassment 1 1 1
5. Racial harassment 1 1 1
6. Persistent nit-picking or unjustified criticisms 1 1 1
7. Being isolated and ostracized 1 1 1
8. Gossip or rumours being spread about me 1 1 1
9. Having extra work deliberately created or having my ability to work disrupted 1 1 1
10. Setting unreasonable deadlines 1 1 1
11. Withholding information from me so I am less able to do the job 1 1 1
12. Preventing access to opportunities; e.g. training or career development 1 1 1
13. Humiliation through sarcasm, criticism, teasing or insults, sometimes in front of other employees or customers 1 1 1
14. Threats or acts of physical violence 1 1 1
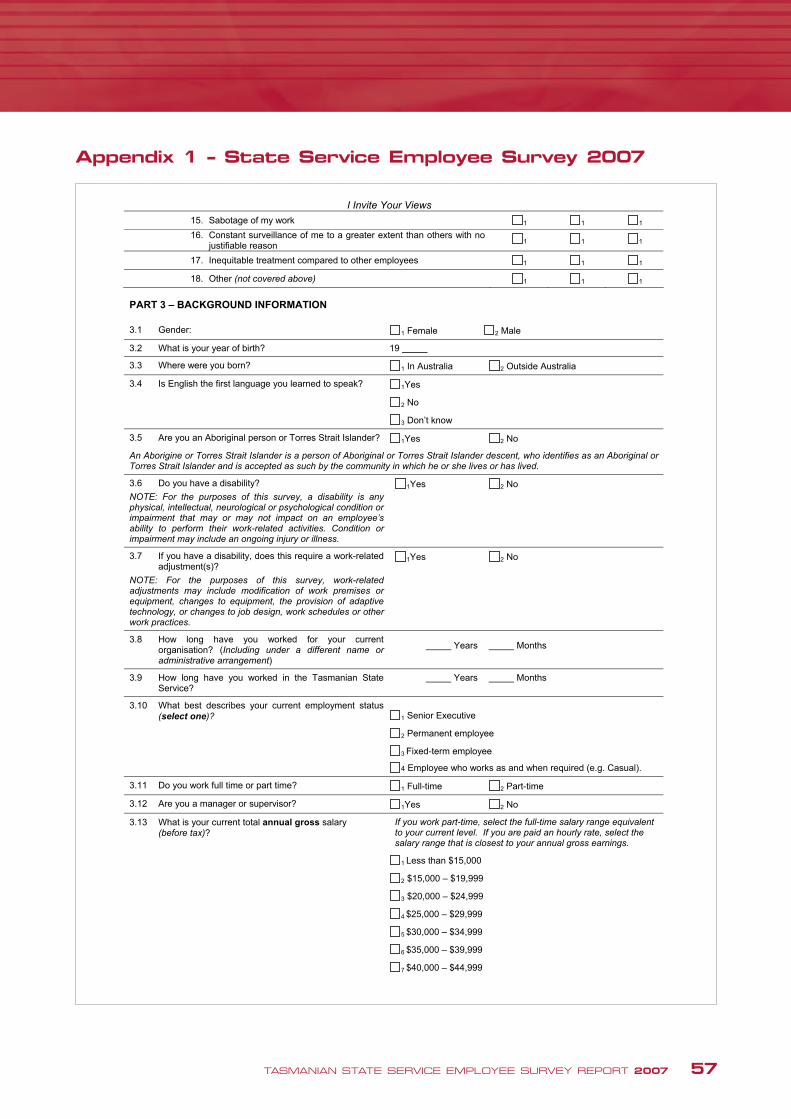
TASMANIAN STATE SERVICE EMPLOYEE SURVEY REPORT 2007 57
Appendix 1 – State Service Employee Survey 2007
I Invite Your Views
State Service Employee Survey 2007 7
15. Sabotage of my work 1 1 1
16. Constant surveillance of me to a greater extent than others with no justifiable reason 1 1 1
17. Inequitable treatment compared to other employees 1 1 1
18. Other (not covered above) 1 1 1
PART 3 – BACKGROUND INFORMATION
3.1 Gender: 1 Female 2 Male
3.2 What is your year of birth? 19
3.3 Where were you born? 1 In Australia 2 Outside Australia
3.4 Is English the first language you learned to speak? 1Yes
2 No
3 Don’t know
3.5 Are you an Aboriginal person or Torres Strait Islander? 1Yes 2 No
An Aborigine or Torres Strait Islander is a person of Aboriginal or Torres Strait Islander descent, who identifies as an Aboriginal or Torres Strait Islander and is accepted as such by the community in which he or she lives or has lived.
3.6 Do you have a disability?
NOTE: For the purposes of this survey, a disability is any physical, intellectual, neurological or psychological condition or impairment that may or may not impact on an employee’s ability to perform their work-related activities. Condition or impairment may include an ongoing injury or illness.
1Yes 2 No
3.7 If you have a disability, does this require a work-related adjustment(s)?
NOTE: For the purposes of this survey, work-related adjustments may include modification of work premises or equipment, changes to equipment, the provision of adaptive technology, or changes to job design, work schedules or other work practices.
1Yes 2 No
3.8 How long have you worked for your current organisation? (Including under a different name or administrative arrangement)
Years Months
3.9 How long have you worked in the Tasmanian State Service?
Years Months
3.10 What best describes your current employment status (select one)? 1 Senior Executive
2 Permanent employee
3 Fixed-term employee
4 Employee who works as and when required (e.g. Casual).
3.11 Do you work full time or part time? 1 Full-time 2 Part-time
3.12 Are you a manager or supervisor? 1Yes 2 No
3.13 What is your current total annual gross salary (before tax)?
If you work part-time, select the full-time salary range equivalent to your current level. If you are paid an hourly rate, select the salary range that is closest to your annual gross earnings.
1 Less than $15,000
2 $15,000 – $19,999
3 $20,000 – $24,999
4 $25,000 – $29,999
5 $30,000 – $34,999
6 $35,000 – $39,999
7 $40,000 – $44,999

58 TASMANIAN STATE SERVICE EMPLOYEE SURVEY REPORT 2007
Appendix 1 – State Service Employee Survey 2007
I Invite Your Views
State Service Employee Survey 2007 8
8 $45,000 – $49,999
9 $50,000 – $54,999
10 $55,000 - $59,999
11 $60,000 - $64,999
12 $65,000 - $69,999
13 $70,000 - $74,999
14 $75,000 - $79,999
15 $80,000 - $84,999
16 $85,000 - $89,999
17 $90,000 - $94,999
18 $95,000 - $99,999
19 $100,000 or more
3.14 What is the highest level of formal education you have completed? 1 Postgraduate Research Degree (Doctorate or Masters by
Research)
2 Post-Graduate Masters by coursework, Graduate Diploma or Graduate Certificate
3 Bachelor Degree (including Honours Degree)
4 TAFE Advanced Diploma or Diploma level
5 TAFE Certificate level, including Trade Certificate or equiv.
6 Matriculation or HSC (Year 12)
7 High School (Year 10)
8 Primary Education
9 None
3.15 Do you spend some time each week providing care* for another person (mark any or all that apply)? 1 Child or children
1 Elderly relative/s
1 Any other person
1 No, I don’t have any caring responsibilities
*In this sense ‘care’ means looking after a person, as they are too young to look after themselves independently, or they are ill,disabled or elderly and need assistance with cooking meals, shopping, housekeeping, transport or personal care (showering etc).
3.16 At what age do you intend to retire from the State Service? 1 At 55
2 Between 56 - 59
3 At 60
4 Between 61 - 64
5 At 65
6 Beyond 65
7 Don’t know
3.17 In which region of Tasmania do you usually work? 1 North/North East
2 North West/West Coast
3 South/South East
4 Outside Tasmania
THANK YOU FOR YOUR ASSISTANCE

Report Produced By: The Office of the State Service Commissioner
Published November 2007
Copyright – Office of the State Service Commissioner
Contributing Authors: Nick Vrisakis, Dr Peter Langford, Sarah Locke, Simon Mingo Voice Project, Department of Psychology, Macquarie University
Print: ISSN 1833-0703
Permission to copy is granted provided the source is acknowledged
Contact: Office of the State Service Commissioner
Level 2/144 Macquarie Street GPO Box 621, Hobart, 7001 Tasmania, Australia
Telephone: 03 6233 3637 Email: [email protected] Facsimile: 03 6233 2693
TASMANIAN STATE SERVICE EMPLOYEE SURVEY REPORT 2007 59
Contents of this CD
1. State Service Employee Survey Report 2007
2. State Service Employee Survey 2007 Pamphlet – Summary of Findings
3. State Service Principles
4. Commissioner’s Direction No. 2 – State Service Principles
5. State Service Code of Conduct
6. Commissioner’s Direction No. 5 – Procedures for investigation and determination of whether an employee has breached the Code of Conduct
7. State Service Commissioner’s Annual Report 2005-2006
8. State Service Commissioner’s Annual Report 2006-2007

TASMANIA
• UBERTAS•ET•FIDELITAS •
TASMANIA
• UBERTAS•ET•FIDELITAS •
TASMANIA
• UBERTAS•ET•FIDELITAS •
TASMANIA
• UBERTAS•ET•FIDELITAS •
TASMANIA
• UBERTAS•ET•FIDELITAS •
TASMANIA
• UBERTAS•ET•FIDELITAS •
Tasmanian sTaTe service
employee survey reporT 2007
survey reporTconducTed by:
The Tasmanian sTaTe
service commissioner
Office of the State Service Commissioner144 Macquarie StreetGPO Box 621, Hobart, 7001Tasmania AustraliaWebsite: www.ossc.tas.gov.auTelephone: 03 6233 3637Facsimile: 03 6233 2693Email: [email protected]