Embed Size (px)
Citation preview
8/12/2019 Taskings and Instructions on Atlantic Ocean Cyclonic Activity
http://slidepdf.com/reader/full/taskings-and-instructions-on-atlantic-ocean-cyclonic-activity 1/19
1
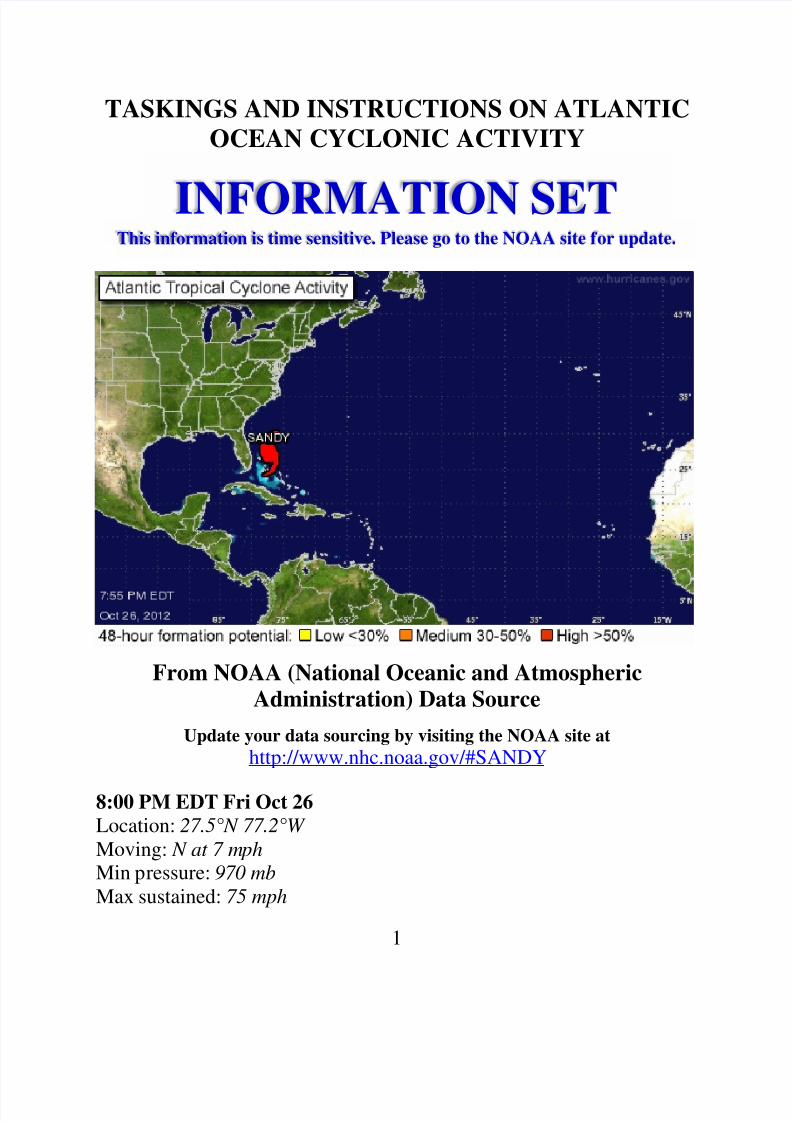
TASKINGS AND INSTRUCTIONS ON ATLANTIC
OCEAN CYCLONIC ACTIVITY
INFORMATION SETThis information is time sensitive. Please go to the NOAA site for update.
From NOAA (National Oceanic and Atmospheric
Administration) Data Source
Update your data sourcing by visiting the NOAA site at
http://www.nhc.noaa.gov/#SANDY
8:00 PM EDT Fri Oct 26
Location: 27.5°N 77.2°W
Moving: N at 7 mph Min pressure: 970 mb
Max sustained: 75 mph
8/12/2019 Taskings and Instructions on Atlantic Ocean Cyclonic Activity
http://slidepdf.com/reader/full/taskings-and-instructions-on-atlantic-ocean-cyclonic-activity 2/19
2
HURRICANE SANDY IS CENTERED NEAR 27.5N 77.2W AT
27/0000 UTC OR ABOUT 75 MI...120 KM N OF GREAT ABACOISLAND...OR ABOUT 400
MI...645 KM SSE OF CHARLESTON SOUTH CAROLINA MOVING
N AT 6 KT. ESTIMATED MINIMUM CENTRAL PRESSURE IS 970MB. MAXIMUM SUSTAINED WIND SPEED IS 65 KT WITH
GUSTS TO 80 KT. SEE LATEST NHC INTERMEDIATE PUBLIC
ADVISORY UNDER AWIPS/WMO HEADERS MIATCPAT3 /
WTNT33 KNHC AND THE FULL FORECAST/ADVISORY UNDER
AWIPS/WMO HEADERS MIATCMAT3 /WTNT23 KNHC FOR
MORE DETAILS.
SCATTERED MODERATE/ISOLATED STRONG CONVECTION ISN OF THE CENTER FROM 28N-32N BETWEEN 75W-80W.SIMILAR ACTIVITY IS WELL E OF THE CENTER FROM 23N-31N
BETWEEN 65W-72W. ONE OF THE OUTER BANDS ALSO
EXTENDS ALL THE WAY INTO THE CARIBBEAN WHEREWIDELY SCATTERED MODERATE CONVECTION LINGERS
WITHIN 150 NM EITHER SIDE OF THE LINE FROM 22N65W TO
14N76W TO INCLUDE HISPANIOLA AND PUERTO RICO.HISPANIOLA IS EXPERIENCING SUSTAINED RAINFALL OVER
SEVERAL DAYS...WHICH COULD CAUSE LIFE-THREATENING
FLASH FLOODS AND MUD SLIDES...ESPECIALLY IN AREAS OF
HIGH TERRAIN.
TROPICAL WAVES...
TROPICAL WAVE IS ALONG 17N43W TO 10N43W MOVING W
NEAR 10 KT. THE WAVE IS EMBEDDED WITHIN A LARGE
AREA OF ENHANCED MOISTURE PRESENT IN TOTALRECIPITABLE WATER IMAGERY. AN ASCAT PASS FROM
EARLIER TODAY ALSO INDICATES THAT CYCLONIC
SURFACE FLOW IS AROUND THE WAVE AXIS. WIDELYSCATTERED SHOWERS AND ISOLATED THUNDERSTORMS
ARE WITHIN 120 NM OF THE WAVE AXIS.
8/12/2019 Taskings and Instructions on Atlantic Ocean Cyclonic Activity
http://slidepdf.com/reader/full/taskings-and-instructions-on-atlantic-ocean-cyclonic-activity 3/19
3
TROPICAL WAVE IS ALONG 15N50W TO 11N49W MOVINGWEST AT 10 KT. THE WAVE IS EMBEDDED WITHIN THE SAME
BROAD AREA OF ENHANCED MOISTURE THAT THE WAVE TO
THE EAST IS WITHIN. A 1536 UTC OSCAT PASS CONFIRMED ALOW LEVEL CYCLONIC CIRCULATION AROUND THE WAVE.
WIDELY SCATTERED SHOWERS AND ISOLATED
THUNDERSTORMS ARE WITHIN 90 NM OF THE WAVE AXIS.
ITCZ/MONSOON TROUGH
THE MONSOON TROUGH EXTENDS ACROSS W AFRICA TO
THE NORTHERN COAST OF GUINEA AT 11N15W TO 9N21W.THE ITCZ BEGINS AT 9N21W AND CONTINUES ALONG 6N30W
12N41W. THE ITCZ RESUMES W OF THE TROPICAL WAVES
FROM 7N50W TO THE COAST OF GUYANA AT 8N59W.
ISOLATED MODERATE CONVECTION IS FROM 4N-9N
BETWEEN 23W-29W. WIDELY SCATTERED MODERATECONVECTION IS FROM 10N-15N BETWEEN 34W-40W.
ATLANTIC OCEAN
HURRICANE SANDY IS CENTERED N OF THE BAHAMAS. SEE
ABOVE. S OF 31N...A TROPICAL STORM WARNING IS INEFFECT FOR THE FLORIDA EAST COAST FROM NORTH OF
DEERFIELD BEACH TO ST AUGUSTINE...AS WELL AS
OVER THE GREAT ABACO AND GRAND BAHAMA ISLANDS.
ELSEWHERE... A STATIONARY FRONT IS OVER THE CENTRALATLANTIC FROM 31N45W TO 30N50W TO 30N57W.
SCATTERED MODERATE CONVECTION IS N OF 25N
BETWEEN 33W-53W. A 1016 MB HIGH IS OVER THE E
ATLANTIC AT 24N26W.

8/12/2019 Taskings and Instructions on Atlantic Ocean Cyclonic Activity
http://slidepdf.com/reader/full/taskings-and-instructions-on-atlantic-ocean-cyclonic-activity 4/19
4
MORE SPECIFIC PRODUCTS
About this product:
Note: The time of the tropical cyclone's center location at the bottom
of the graphic will be 3 hours earlier than the time of the current
advisory. The forecast cycle for each advisory begins 3 hours prior
to the issuance of the advisory products.
These graphics show probabilities of sustained (1-minute average)
surface wind speeds equal to or exceeding 64 kt...74 mph (hurricaneforce). These wind speed probability graphics are based on the official
National Hurricane Center (NHC) track, intensity, and wind radii
forecasts, and on NHC forecast error statistics for those forecastvariables during recent years. Each graphic provides cumulative
8/12/2019 Taskings and Instructions on Atlantic Ocean Cyclonic Activity
http://slidepdf.com/reader/full/taskings-and-instructions-on-atlantic-ocean-cyclonic-activity 5/19
5
probabilities that wind speeds of at least 74 mph will occur during
cumulative time periods at each specific point on the map. Thecumulative periods begin at the start of the forecast period and extend
through the entire 5-day forecast period at cumulative 12-hour intervals
(i.e., 0-12 h, 0-24 h, 0-36 h, ... , 0-120 h). An individual graphic isproduced for each cumulative interval, and the capability to zoom and
animate through the periods is provided. To assess the overall risk of
experiencing winds of at least 74 mph at any location, the 120-h
graphics are recommended.
These probabilities will be updated by the NHC with each advisory
package for all active tropical cyclones in the Atlantic and eastern North
Pacific basins. While separate graphics are focused on each individual
tropical cyclone, probabilities resulting from more than one activetropical cyclone may be seen on each graphic.
Additionally, these probability products are available on the
National Weather Service's National Digital Forecast
Database (NDFD) graphical tropical webpage. The previously provided strike probability product (discontinued after
2005) conveyed the chances of a "close" approach of the center of the
cyclone. However, these new probability products are about the weather.That is, these cumulative wind speed probabilities provide the chances
that wind speeds of at least 74 mph will occur at individual locations.
The cumulative probabilities can answer the question, "What are the
chances that sustained winds of tropical storm or hurricane force will
occur at any specific location?" This can also help one answer the
question, "Do I need to take certain actions to prepare?" A companion
product, the wind speed probability text product, will also be issued and
updated with each advisory package. That product is recommended tomore easily assess when winds of each threshold are most likely to start
at any specific location, helping to answer the question, "How long do Ihave to prepare?" Overall, these probabilities provide users withinformation that can enhance their ability to make preparedness
decisions specific to their own situations.
It is important for users to realize that wind speed probabilities that
might seem relatively small at their location might still be quite

8/12/2019 Taskings and Instructions on Atlantic Ocean Cyclonic Activity
http://slidepdf.com/reader/full/taskings-and-instructions-on-atlantic-ocean-cyclonic-activity 6/19
6
significant, since they indicate that there is a chance that a damaging or
even extreme event could occur that warrants preparations to protectlives and property.
Tropical Storm Force Wind Speed Probabilities - 120Hours
About this product:
Note: The time of the tropical cyclone's center location at the bottom
of the graphic will be 3 hours earlier than the time of the current
advisory. The forecast cycle for each advisory begins 3 hours prior
to the issuance of the advisory products.
8/12/2019 Taskings and Instructions on Atlantic Ocean Cyclonic Activity
http://slidepdf.com/reader/full/taskings-and-instructions-on-atlantic-ocean-cyclonic-activity 7/19
7
These graphics show probabilities of sustained (1-minute average)
surface wind speeds equal to or exceeding 34 kt...39 mph (tropical stormforce). These wind speed probability graphics are based on the official
National Hurricane Center (NHC) track, intensity, and wind radii
forecasts, and on NHC forecast error statistics for those forecastvariables during recent years. Each graphic provides cumulative
probabilities that wind speeds of at least 39 mph will occur during
cumulative time periods at each specific point on the map. The
cumulative periods begin at the start of the forecast period and extend
through the entire 5-day forecast period at cumulative 12-hour intervals
(i.e., 0-12 h, 0-24 h, 0-36 h, ... , 0-120 h). An individual graphic is
produced for each cumulative interval, and the capability to zoom and
animate through the periods is provided. To assess the overall risk ofexperiencing winds of at least 39 mph at any location, the 120-hgraphics are recommended.
These probabilities will be updated by the NHC with each advisory
package for all active tropical cyclones in the Atlantic and eastern NorthPacific basins. While separate graphics are focused on each individual
tropical cyclone, probabilities resulting from more than one active
tropical cyclone may be seen on each graphic.
Additionally, these probability products are available on the
National Weather Service's National Digital Forecast
Database (NDFD) graphical tropical webpage. The previously provided strike probability product (discontinued after
2005) conveyed the chances of a "close" approach of the center of the
cyclone. However, these new probability products are about the weather.
That is, these cumulative wind speed probabilities provide the chances
that wind speeds of at least 39 mph will occur at individual locations.The cumulative probabilities can answer the question, "What are the
chances that sustained winds of tropical storm or hurricane force willoccur at any specific location?" This can also help one answer thequestion, "Do I need to take certain actions to prepare?" A companion
product, the wind speed probability text product, will also be issued and
updated with each advisory package. That product is recommended to
more easily assess when winds of each threshold are most likely to start
8/12/2019 Taskings and Instructions on Atlantic Ocean Cyclonic Activity
http://slidepdf.com/reader/full/taskings-and-instructions-on-atlantic-ocean-cyclonic-activity 8/19
8
at any specific location, helping to answer the question, "How long do I
have to prepare?" Overall, these probabilities provide users withinformation that can enhance their ability to make preparedness
decisions specific to their own situations.
It is important for users to realize that wind speed probabilities thatmight seem relatively small at their location might still be quite
significant, since they indicate that there is a chance that a damaging or
even extreme event could occur that warrants preparations to protect
lives and property.
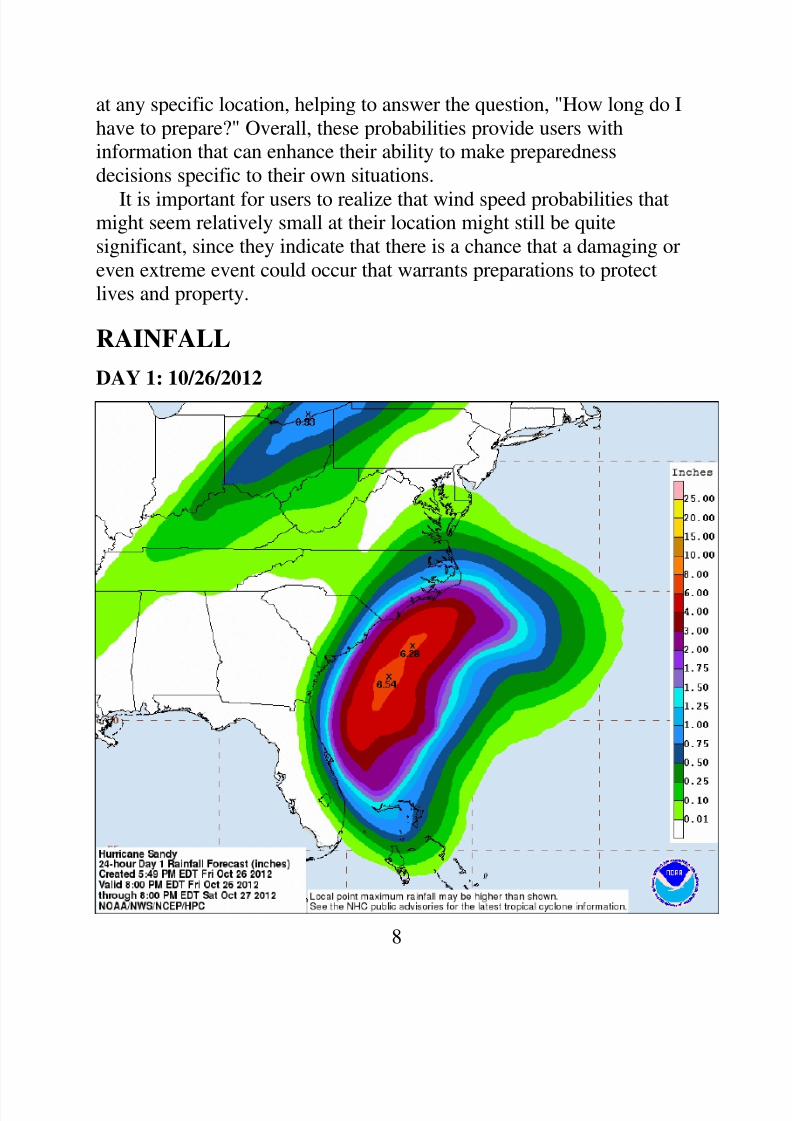
RAINFALL
DAY 1: 10/26/2012

8/12/2019 Taskings and Instructions on Atlantic Ocean Cyclonic Activity
http://slidepdf.com/reader/full/taskings-and-instructions-on-atlantic-ocean-cyclonic-activity 9/19
9
DAY 2: 10/27/2012
8/12/2019 Taskings and Instructions on Atlantic Ocean Cyclonic Activity
http://slidepdf.com/reader/full/taskings-and-instructions-on-atlantic-ocean-cyclonic-activity 10/19
10
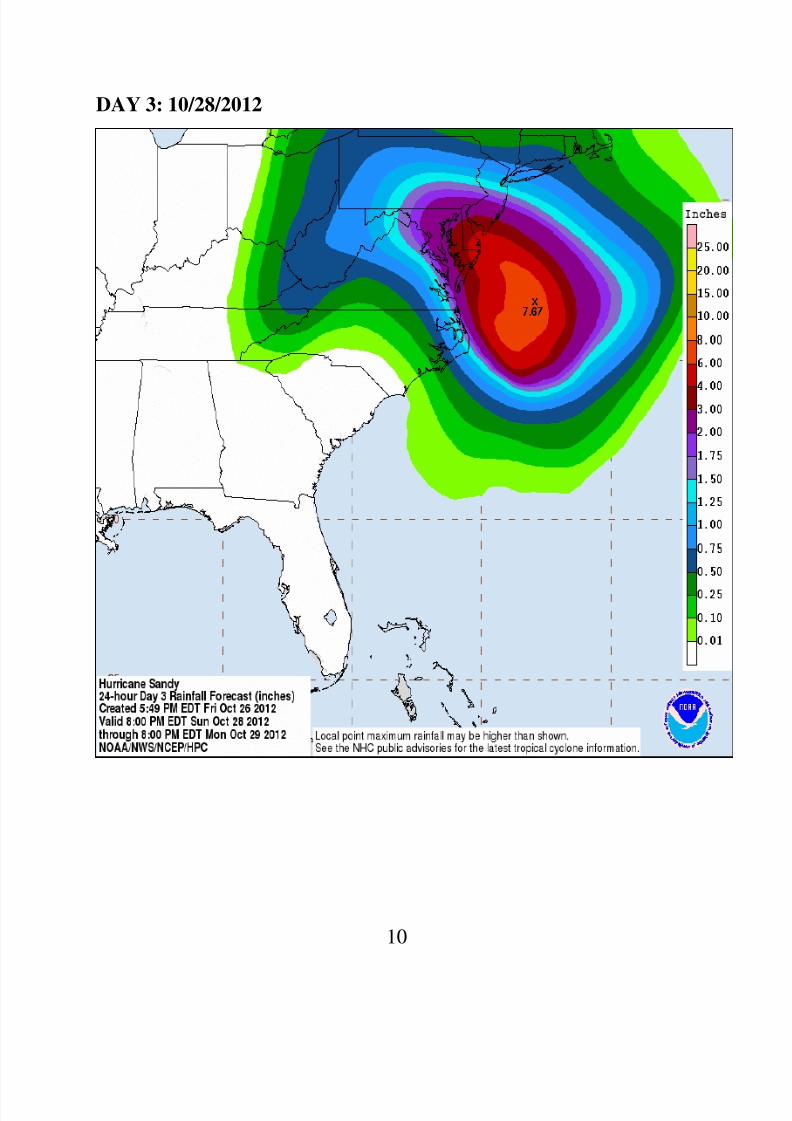
DAY 3: 10/28/2012

8/12/2019 Taskings and Instructions on Atlantic Ocean Cyclonic Activity
http://slidepdf.com/reader/full/taskings-and-instructions-on-atlantic-ocean-cyclonic-activity 11/19
11
RAINFALL POTENTIAL
DAY 1-3: 10/26/2012

8/12/2019 Taskings and Instructions on Atlantic Ocean Cyclonic Activity
http://slidepdf.com/reader/full/taskings-and-instructions-on-atlantic-ocean-cyclonic-activity 12/19
12
DAY 2-3: 10/27/2012
8/12/2019 Taskings and Instructions on Atlantic Ocean Cyclonic Activity
http://slidepdf.com/reader/full/taskings-and-instructions-on-atlantic-ocean-cyclonic-activity 13/19
13
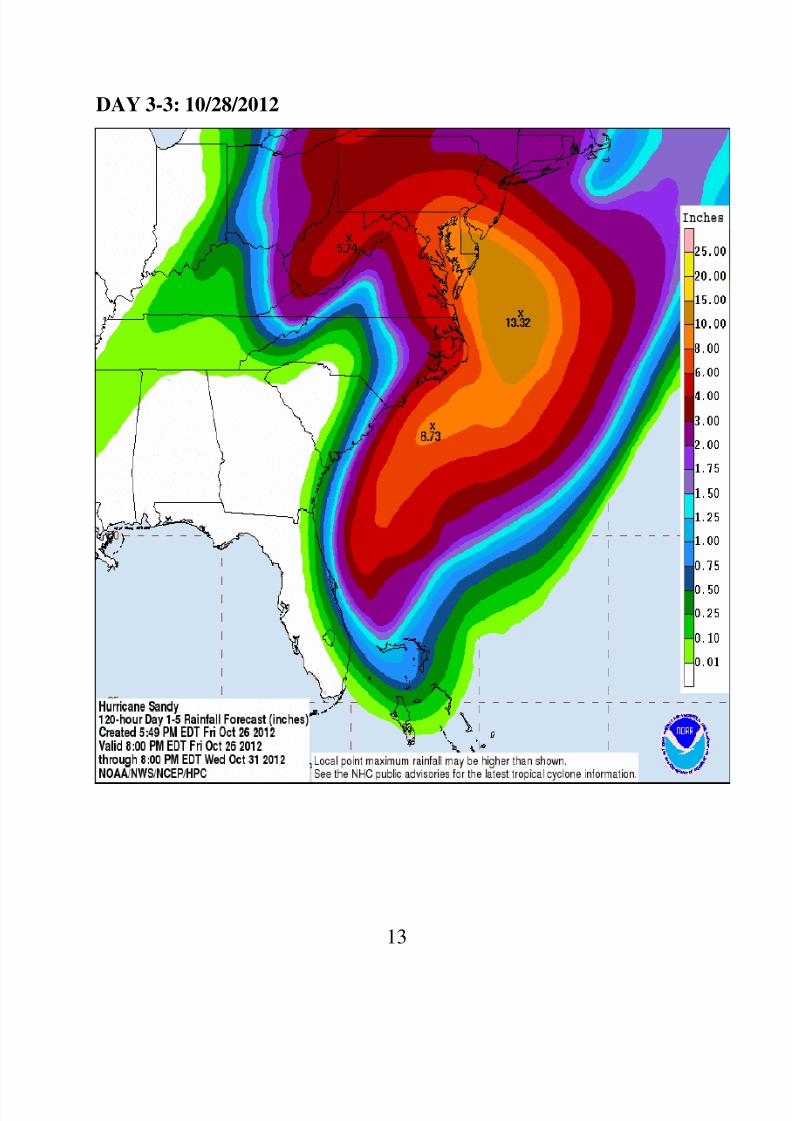
DAY 3-3: 10/28/2012
8/12/2019 Taskings and Instructions on Atlantic Ocean Cyclonic Activity
http://slidepdf.com/reader/full/taskings-and-instructions-on-atlantic-ocean-cyclonic-activity 14/19
14
SANDY PROGRESS
NHC Tropical Cyclone Forecast Verification
NHC receives frequent inquiries on the accuracy and skill of its forecasts
and of the computer models available to it. To help answer these
questions, these verification web pages were established in March 2005.The development of this resource will be completed in stages; ultimately
all available records dating back to the earliest NHC forecasts in 1954
will be included. A digital database of NHC official track forecast errorshas been constructed for the period 1970 to the present, and it is this
period that is presented initially here. A digital database of intensity
errors has been constructed dating back to 1990. These pages will be
updated as extensions to the database are completed. Questions on NHC
forecast verifications may be directed [email protected].
For more information, visit http://www.nhc.noaa.gov/verification/
TTTT AAAA SSSS KKKK IIII NNNN GGGG SSSSBefore you move onto these taskings, you need to have thoroughly and
carefully read the foregoing. Additional information you need are
source-indicated along the way as links. Please visit them to update theinformation set with which you and your pair will work. It now becomes
8/12/2019 Taskings and Instructions on Atlantic Ocean Cyclonic Activity
http://slidepdf.com/reader/full/taskings-and-instructions-on-atlantic-ocean-cyclonic-activity 15/19
15
your responsibility to have the most updated information on storm
movements
TASKINGS
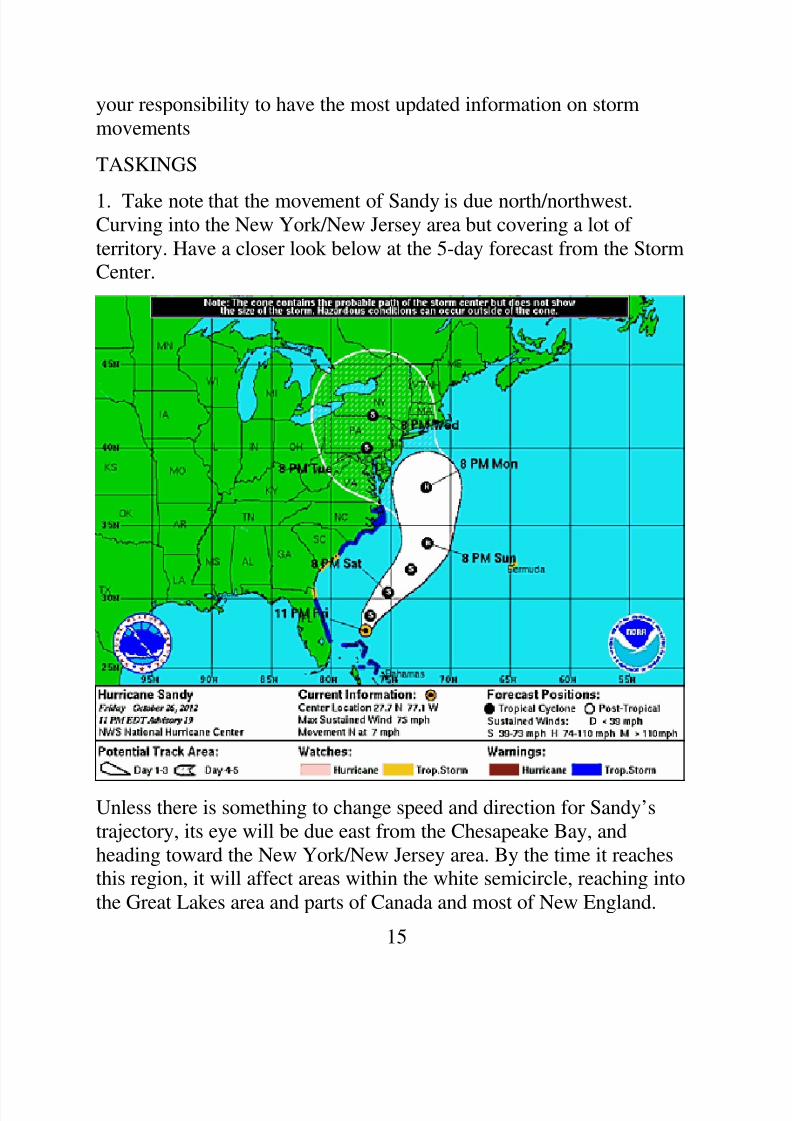
1. Take note that the movement of Sandy is due north/northwest.Curving into the New York/New Jersey area but covering a lot of
territory. Have a closer look below at the 5-day forecast from the StormCenter.
Unless there is something to change speed and direction for Sandy’s
trajectory, its eye will be due east from the Chesapeake Bay, and
heading toward the New York/New Jersey area. By the time it reachesthis region, it will affect areas within the white semicircle, reaching into
the Great Lakes area and parts of Canada and most of New England.

8/12/2019 Taskings and Instructions on Atlantic Ocean Cyclonic Activity
http://slidepdf.com/reader/full/taskings-and-instructions-on-atlantic-ocean-cyclonic-activity 16/19
16
Now the question becomes: what’s to the east of Sandy’s trajectory,
such that it will keep it on its course? Well, let’s take a look at the imagebelow and extrapolate.
The storm mass close to the CONUS (continental US) is a low pressure
center (running counterclockwise). There is another low pressure centernortheast of Sandy and due east of its path north. This presents a
problem: there is no room for Sandy to have a chance to move east,
instead of west and into land. Tropical
Depression Tony is in its way (which by
now may be turning into a tropical
storm). So we need to help both do whatis best for all human beings along the
East Coast.Tasking 1: We need to handshake with
BOTH simultaneously. Once
connectivity is established, we need tonudge their strange attractors (edges of an atmospheric convection) see
image to the right. We need to get the edges to come together and duff
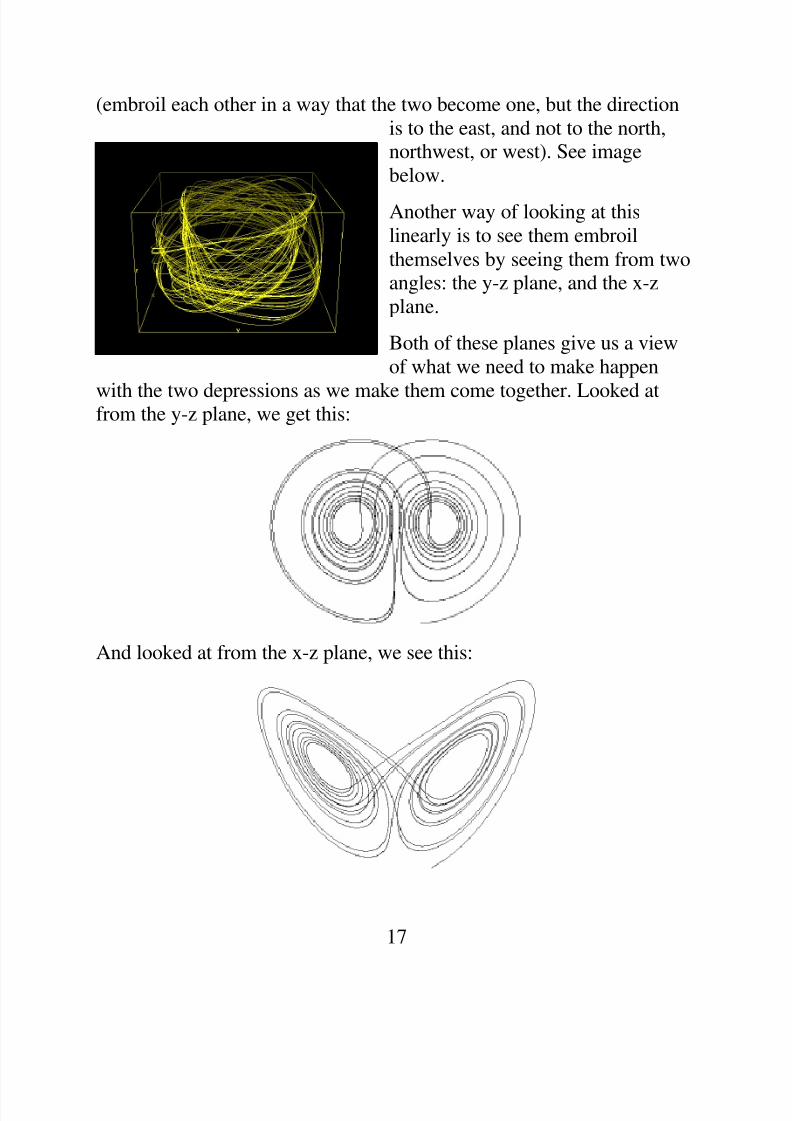
8/12/2019 Taskings and Instructions on Atlantic Ocean Cyclonic Activity
http://slidepdf.com/reader/full/taskings-and-instructions-on-atlantic-ocean-cyclonic-activity 17/19
17
(embroil each other in a way that the two become one, but the direction
is to the east, and not to the north,northwest, or west). See image
below.
Another way of looking at this
linearly is to see them embroil
themselves by seeing them from twoangles: the y-z plane, and the x-z
plane.
Both of these planes give us a view
of what we need to make happen
with the two depressions as we make them come together. Looked atfrom the y-z plane, we get this:
And looked at from the x-z plane, we see this:
8/12/2019 Taskings and Instructions on Atlantic Ocean Cyclonic Activity
http://slidepdf.com/reader/full/taskings-and-instructions-on-atlantic-ocean-cyclonic-activity 18/19
18
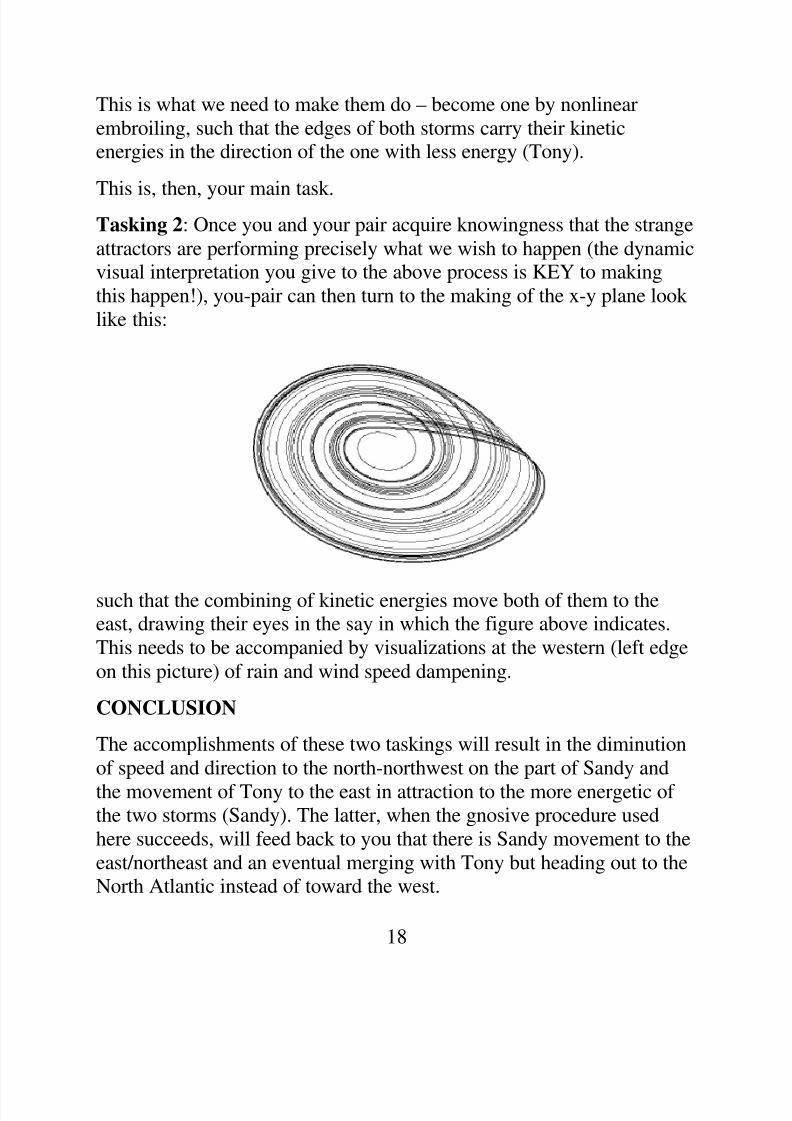
This is what we need to make them do – become one by nonlinear
embroiling, such that the edges of both storms carry their kineticenergies in the direction of the one with less energy (Tony).
This is, then, your main task.Tasking 2: Once you and your pair acquire knowingness that the strange
attractors are performing precisely what we wish to happen (the dynamicvisual interpretation you give to the above process is KEY to making
this happen!), you-pair can then turn to the making of the x-y plane look
like this:
such that the combining of kinetic energies move both of them to theeast, drawing their eyes in the say in which the figure above indicates.
This needs to be accompanied by visualizations at the western (left edge
on this picture) of rain and wind speed dampening.
CONCLUSION
The accomplishments of these two taskings will result in the diminution
of speed and direction to the north-northwest on the part of Sandy and
the movement of Tony to the east in attraction to the more energetic ofthe two storms (Sandy). The latter, when the gnosive procedure used
here succeeds, will feed back to you that there is Sandy movement to the
east/northeast and an eventual merging with Tony but heading out to the
North Atlantic instead of toward the west.
8/12/2019 Taskings and Instructions on Atlantic Ocean Cyclonic Activity
http://slidepdf.com/reader/full/taskings-and-instructions-on-atlantic-ocean-cyclonic-activity 19/19
19
PROCOTOLS
The protocols to be used here are identical to those used in the Beta test.
Pairs focus on the process described above, developing both an emotive-
energetic frame that is harmonically resonated to a waveguide (S.D.S.),who will collocate the energetics of the vectored-intentions to induce the
storms to perform the sequences described above.
Any further questions, send them to Aegis contact at the following
email: [email protected].
The time frame for everything begins at 0200 EDT Saturday 10/27/2012.
Action on the focus must be pair-simultaneous, as before, and done
twice a day at the same time for the next four days (10-27-2012 to 11-01-2012 ending on this day at 0159:59 AM).