Embed Size (px)
Citation preview
Task 6Statistical Approaches
Scope of Work
Bob Youngs
NGA Workshop #5
March 25, 2003

Working Group 6
• Norm Abrahamson
• David Brillinger
• Brian Chiou
• Bob Youngs
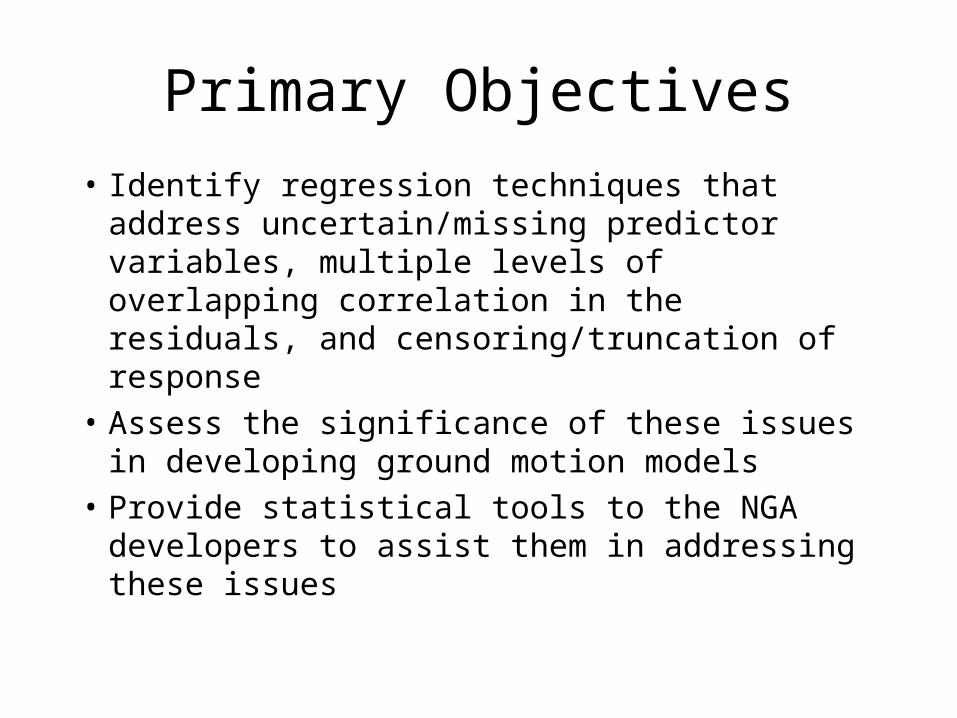
Primary Objectives
• Identify regression techniques that address uncertain/missing predictor variables, multiple levels of overlapping correlation in the residuals, and censoring/truncation of response
• Assess the significance of these issues in developing ground motion models
• Provide statistical tools to the NGA developers to assist them in addressing these issues
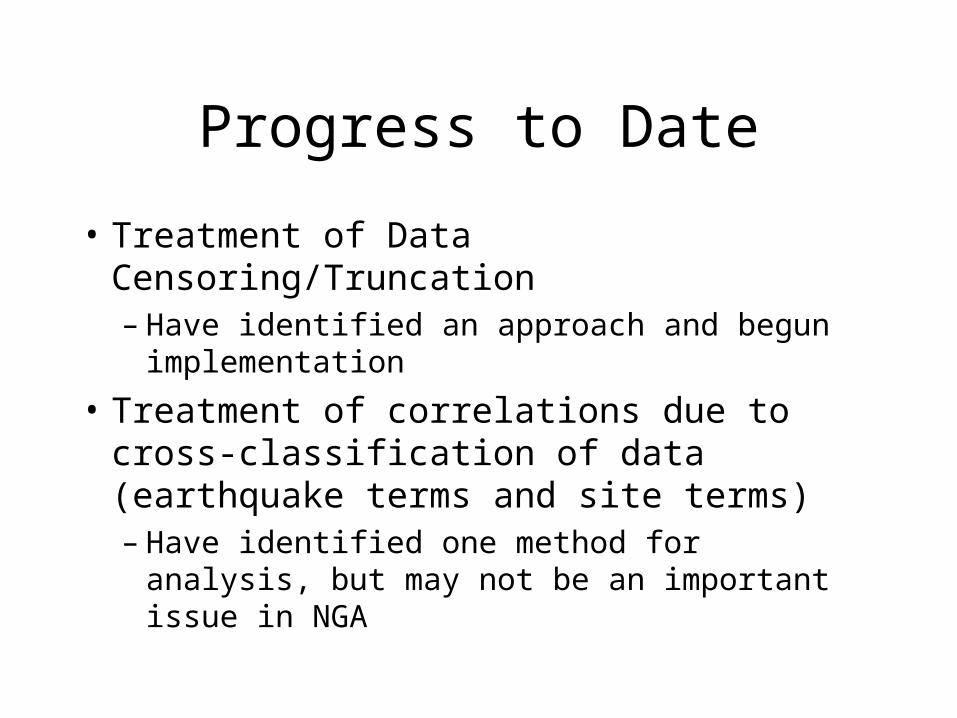
Progress to Date
• Treatment of Data Censoring/Truncation– Have identified an approach and begun
implementation
• Treatment of correlations due to cross-classification of data (earthquake terms and site terms)– Have identified one method for analysis, but
may not be an important issue in NGA
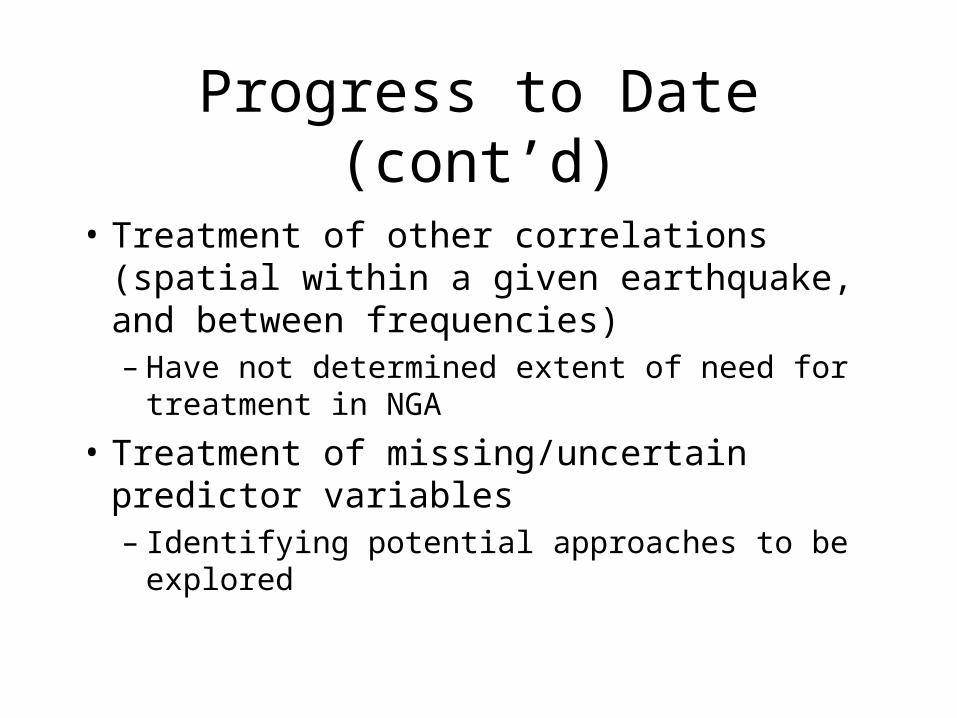
Progress to Date (cont’d)
• Treatment of other correlations (spatial within a given earthquake, and between frequencies)– Have not determined extent of need for
treatment in NGA
• Treatment of missing/uncertain predictor variables– Identifying potential approaches to be explored
Treatment of Censored/Truncated Response Data
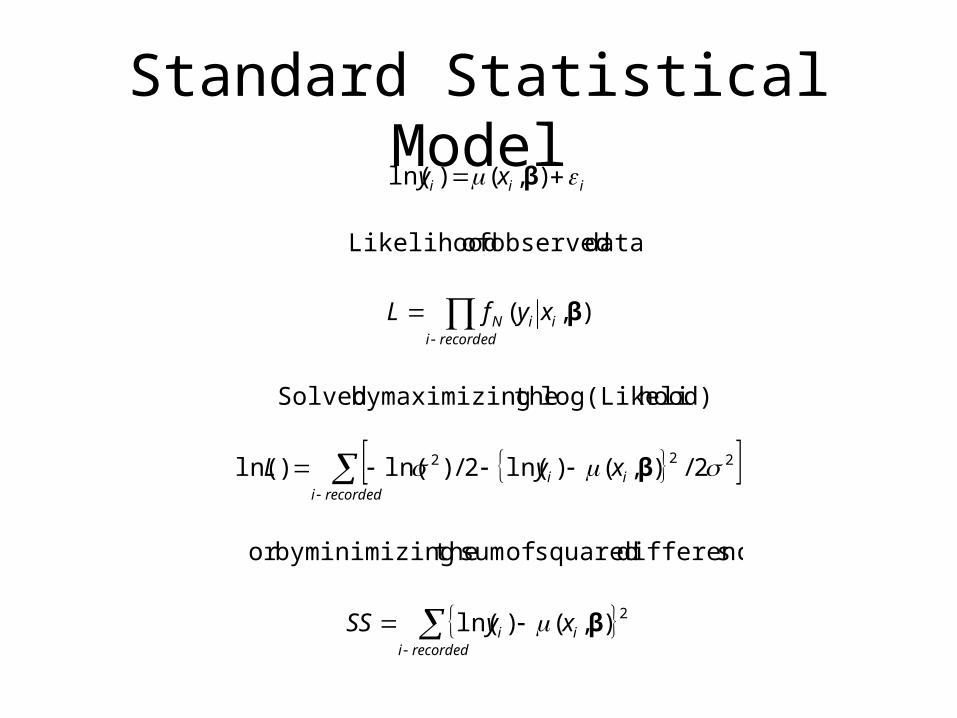
Standard Statistical Model
recordediii
recordediii
recordediiiN
iii
xySS
xyL
xyfL
xy
2
222
),()ln(
sdifference squared of sum theminimizingby or
2/),()ln(2/)ln()ln(
hood)log(Likeli themaximizingby Solved
),(
data observed of Likelihood
),()ln(
β
β
β
β
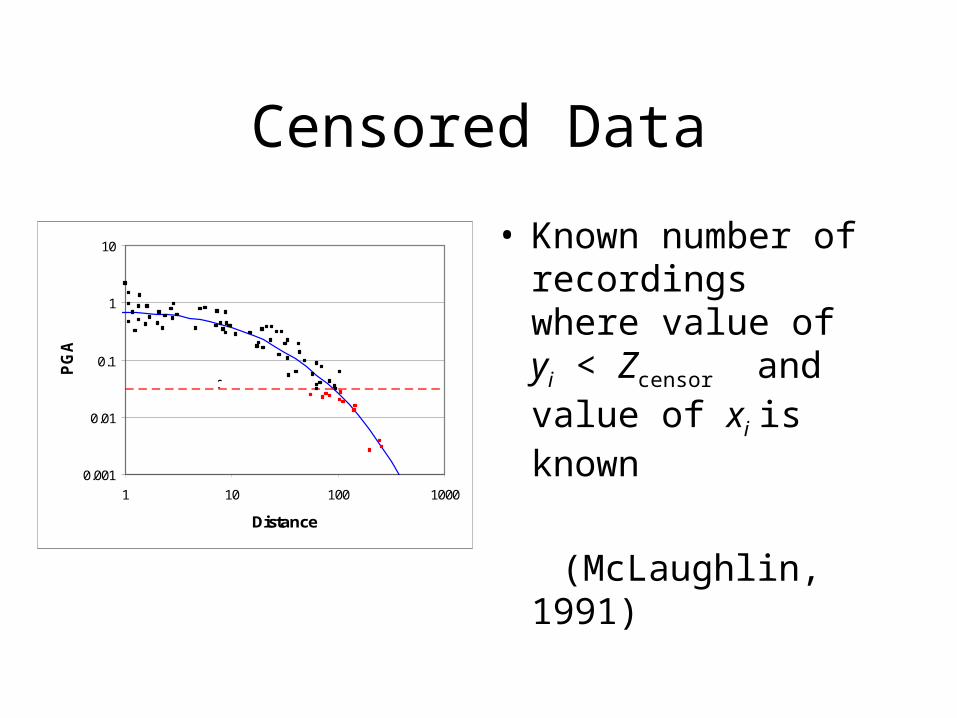
Censored Data
• Known number of recordings where value of yi < Zcensor and value of xi is known
(McLaughlin, 1991)0.001
0.01
0.1
1
10
1 10 100 1000
Distance
PG
A
Zcensor

Censored Data Statistical Model
censoredjjcensorN
recordediii
recordedi censoredjjcensorNiiN
xZF
xyL
xZFxyfL
),(ln
2/),()ln(2/)ln()ln(
hood)log(Likeli themaximizingby Solved
),(),(
data observed of Likelihood
222
β
β
ββ
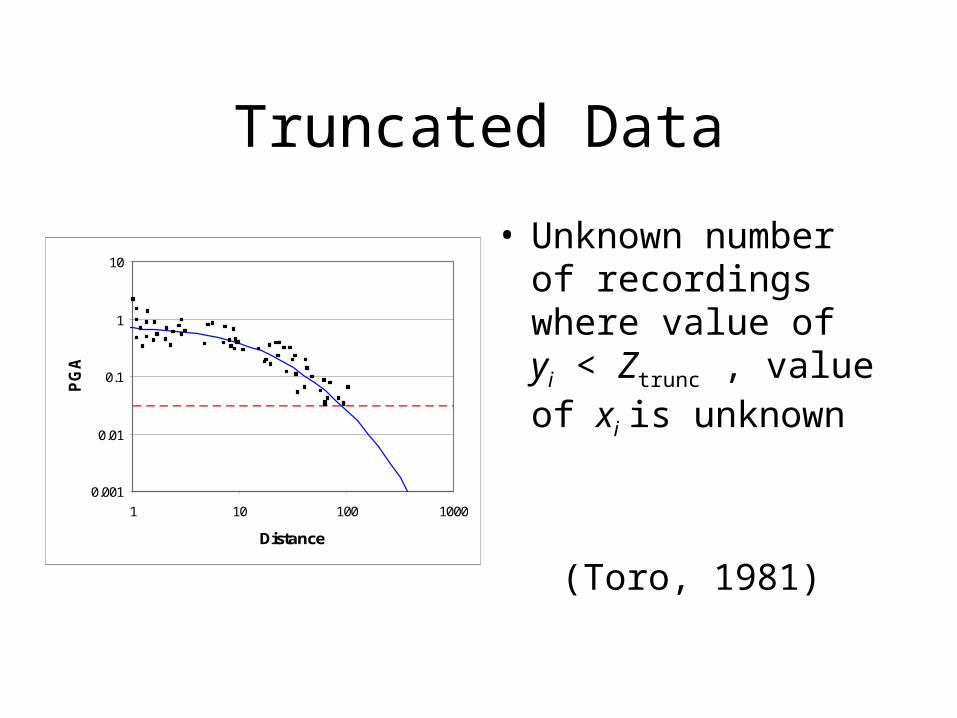
Truncated Data
• Unknown number of recordings where value of yi < Ztrunc , value of xi is unknown
(Toro, 1981)
0.001
0.01
0.1
1
10
1 10 100 1000
Distance
PG
A
Ztrunc
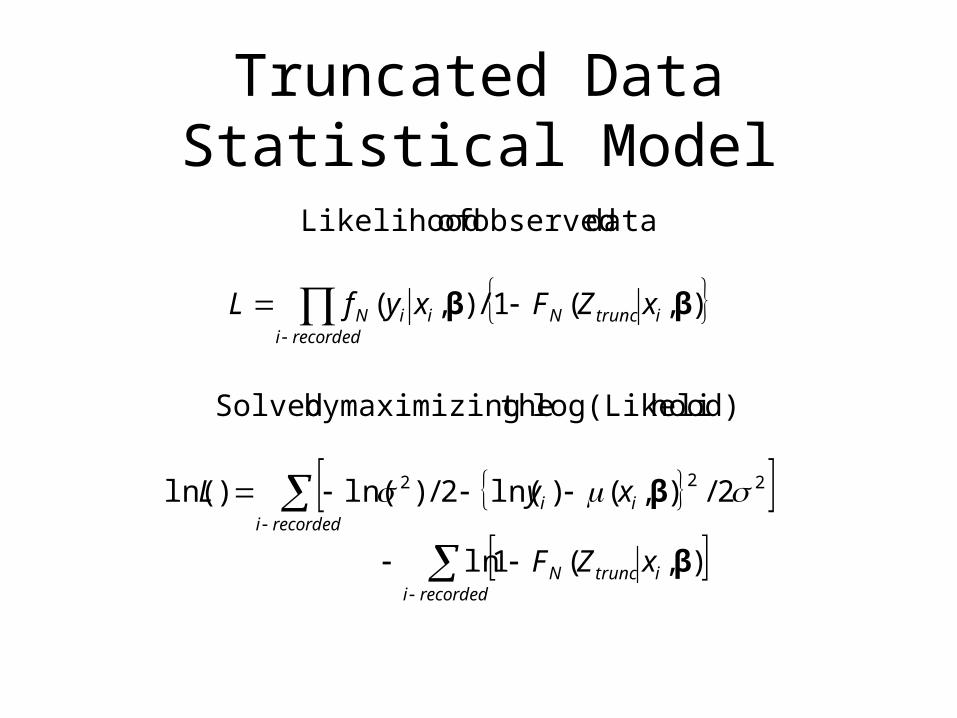
Truncated Data Statistical Model
recordediitruncN
recordediii
recordediitruncNiiN
xZF
xyL
xZFxyfL
),(1ln
2/),()ln(2/)ln()ln(
hood)log(Likeli themaximizingby Solved
),(1/),(
data observed of Likelihood
222
β
β
ββ
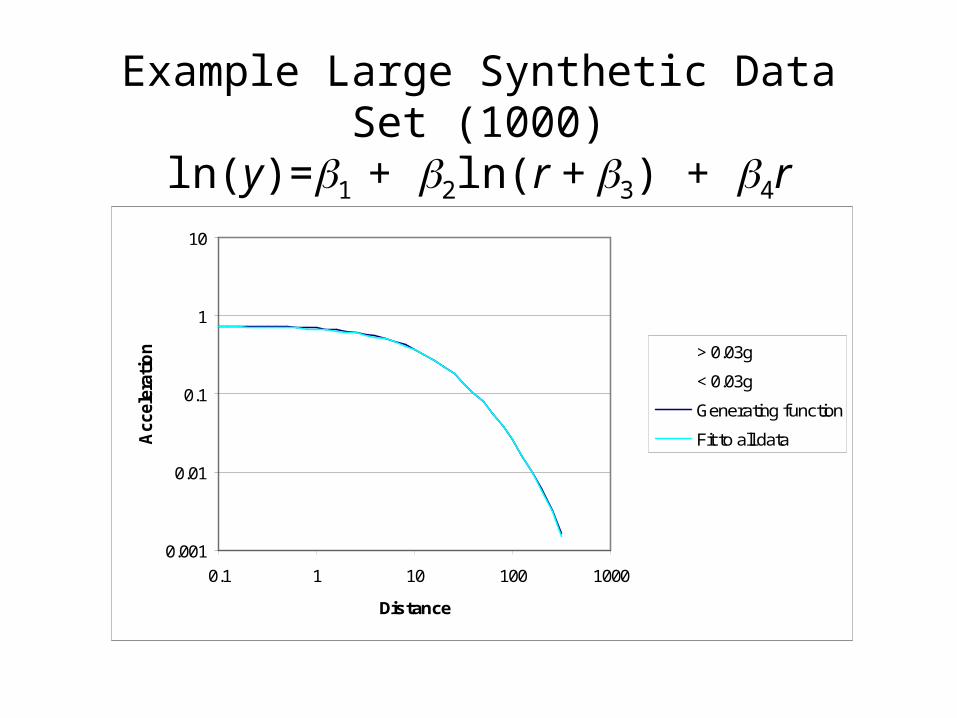
Example Large Synthetic Data Set (1000)ln(y)=1 + 2ln(r + 3) + 4r
0.001
0.01
0.1
1
10
0.1 1 10 100 1000
Distance
Acc
eler
atio
n > 0.03g
< 0.03g
Generating function
Fit to all data
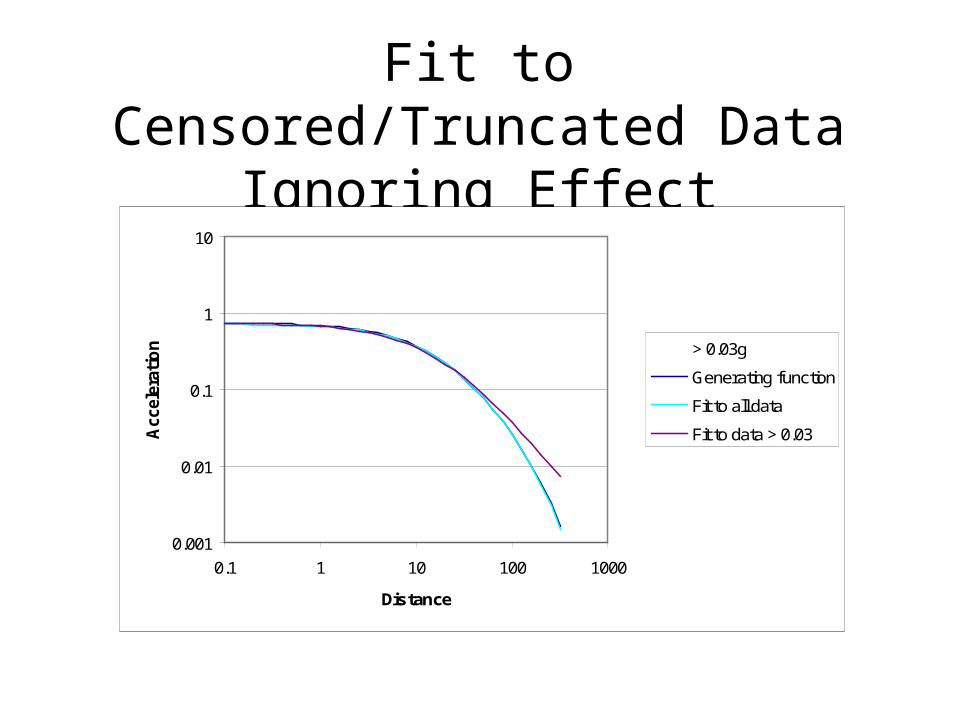
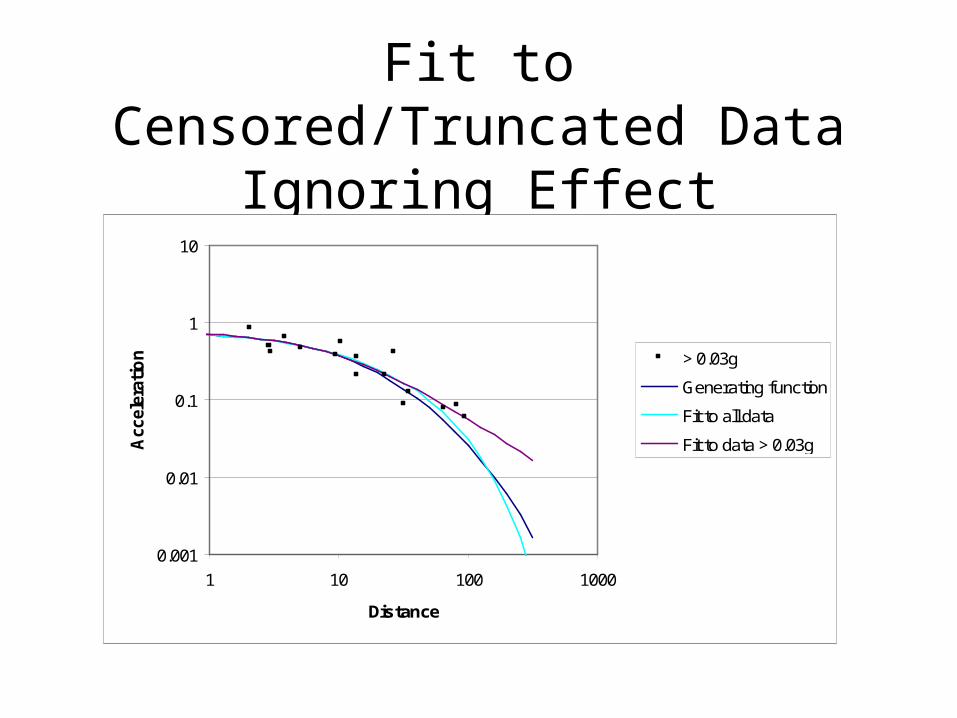
Fit to Censored/Truncated Data Ignoring Effect
0.001
0.01
0.1
1
10
0.1 1 10 100 1000
Distance
Acc
eler
atio
n > 0.03g
Generating function
Fit to all data
Fit to data > 0.03
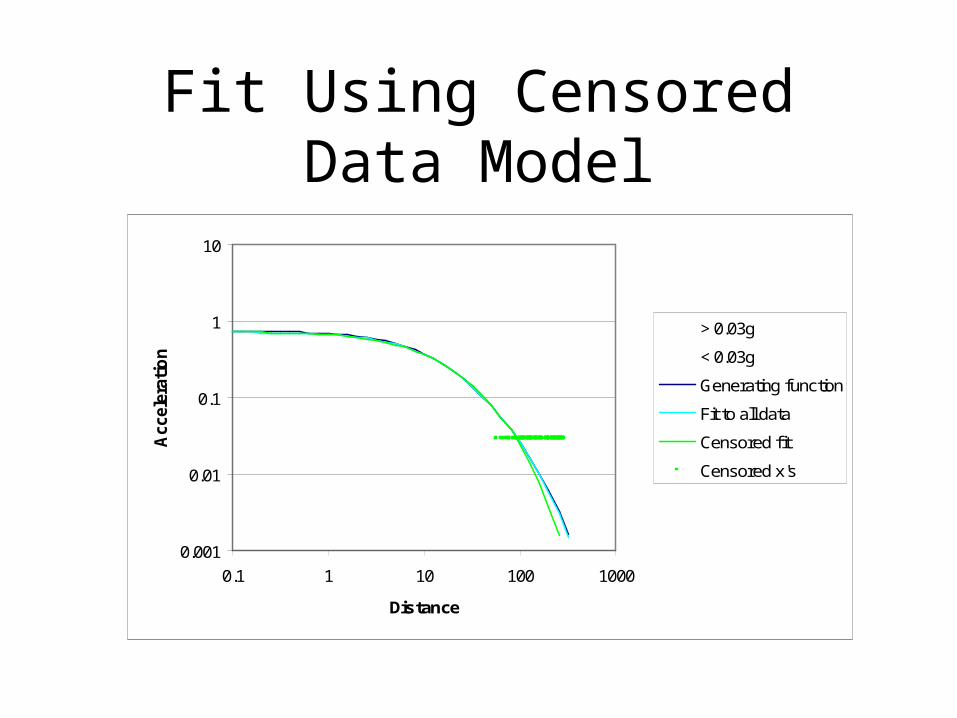
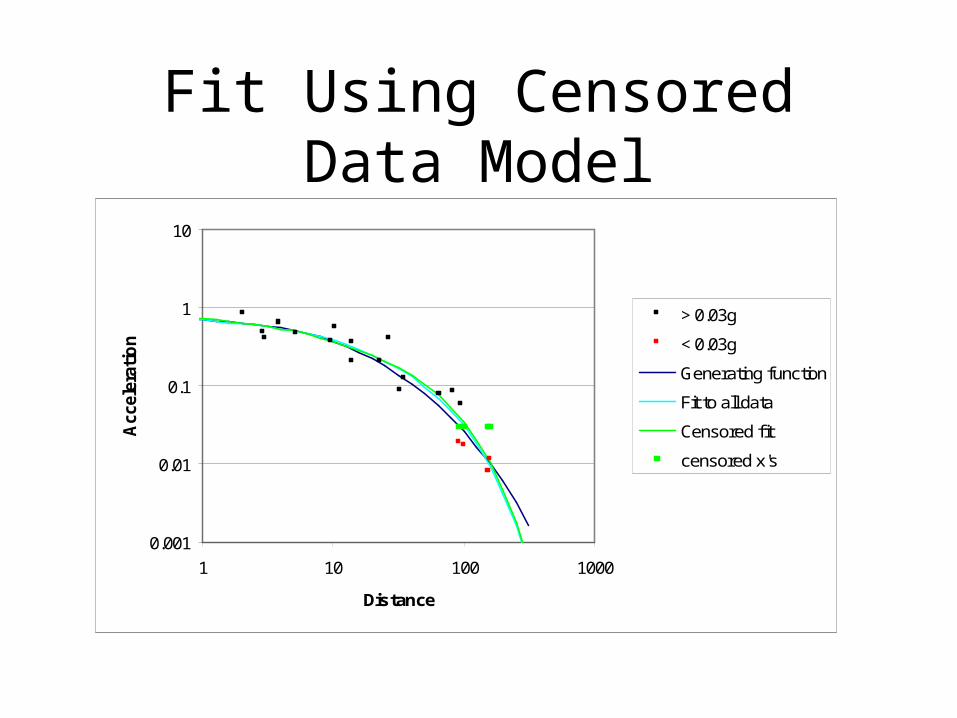
Fit Using Censored Data Model
0.001
0.01
0.1
1
10
0.1 1 10 100 1000
Distance
Acc
eler
atio
n
> 0.03g
< 0.03g
Generating function
Fit to all data
Censored fit
Censored x's
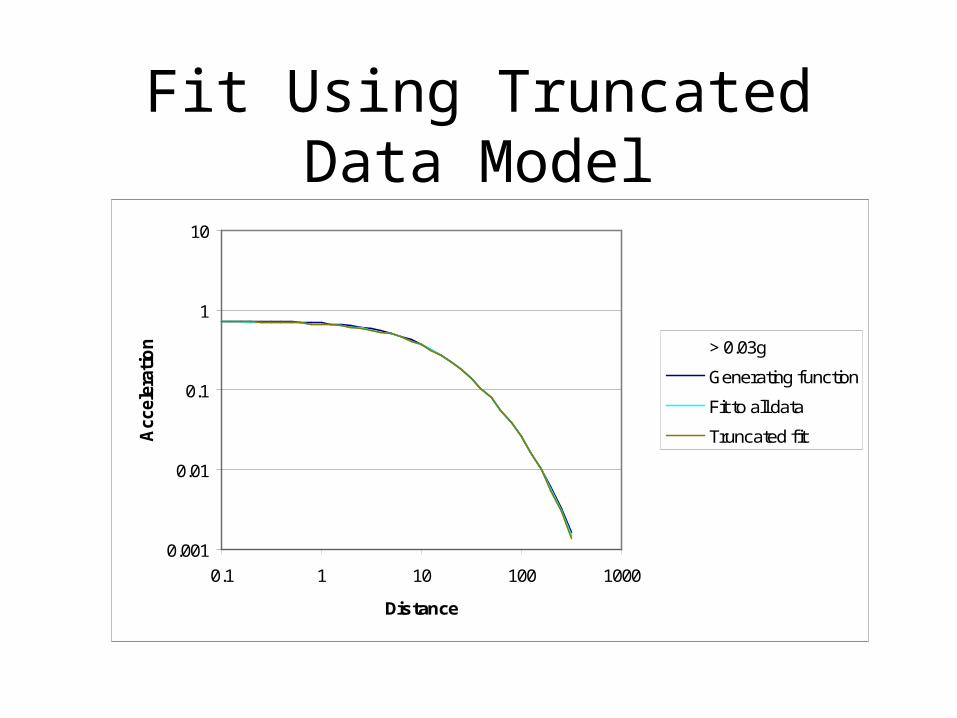
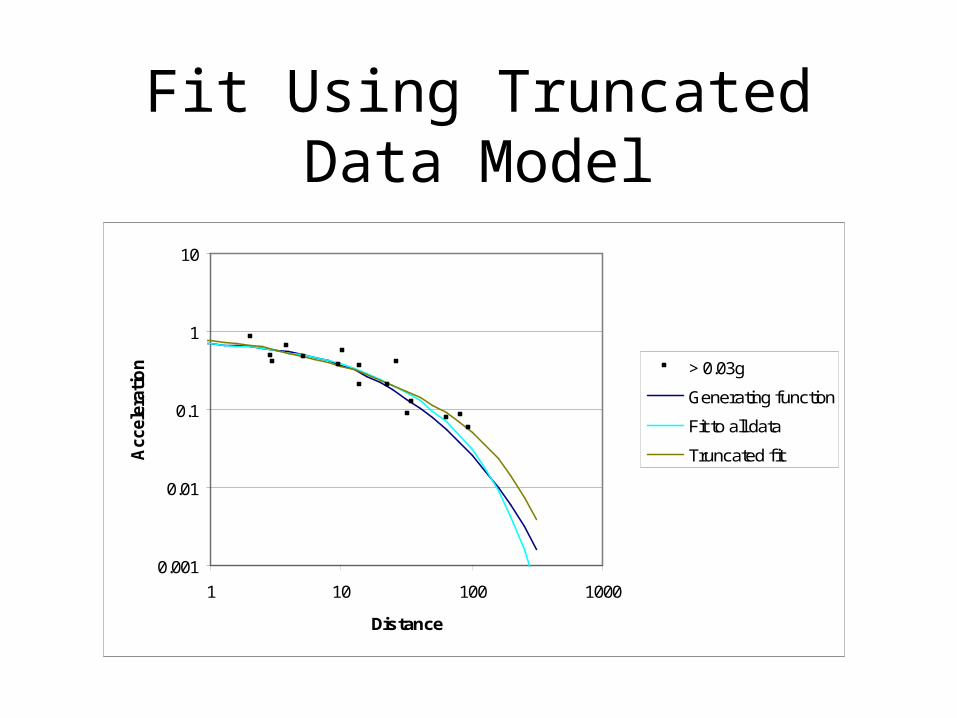
Fit Using Truncated Data Model
0.001
0.01
0.1
1
10
0.1 1 10 100 1000
Distance
Acc
eler
atio
n > 0.03g
Generating function
Fit to all data
Truncated fit
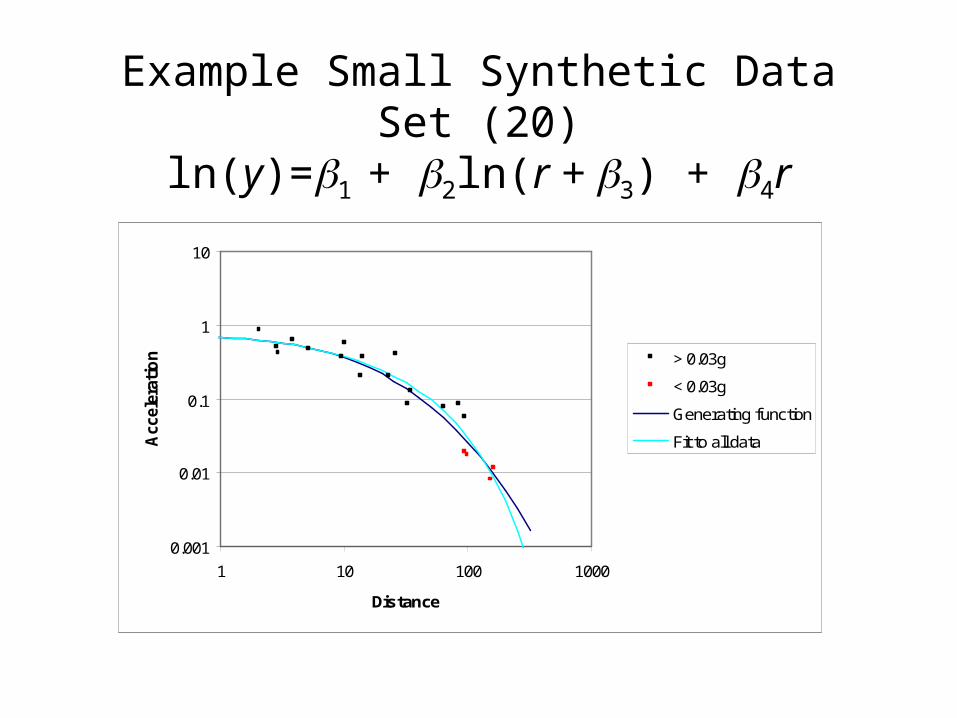
Example Small Synthetic Data Set (20)ln(y)=1 + 2ln(r + 3) + 4r
0.001
0.01
0.1
1
10
1 10 100 1000
Distance
Acc
eler
atio
n > 0.03g
< 0.03g
Generating function
Fit to all data
Fit to Censored/Truncated Data Ignoring Effect
0.001
0.01
0.1
1
10
1 10 100 1000
Distance
Acc
eler
atio
n > 0.03g
Generating function
Fit to all data
Fit to data > 0.03g
Fit Using Censored Data Model
0.001
0.01
0.1
1
10
1 10 100 1000
Distance
Acc
eler
atio
n
> 0.03g
< 0.03g
Generating function
Fit to all data
Censored fit
censored x's
Fit Using Truncated Data Model
0.001
0.01
0.1
1
10
1 10 100 1000
Distance
Acc
eler
atio
n > 0.03g
Generating function
Fit to all data
Truncated fit
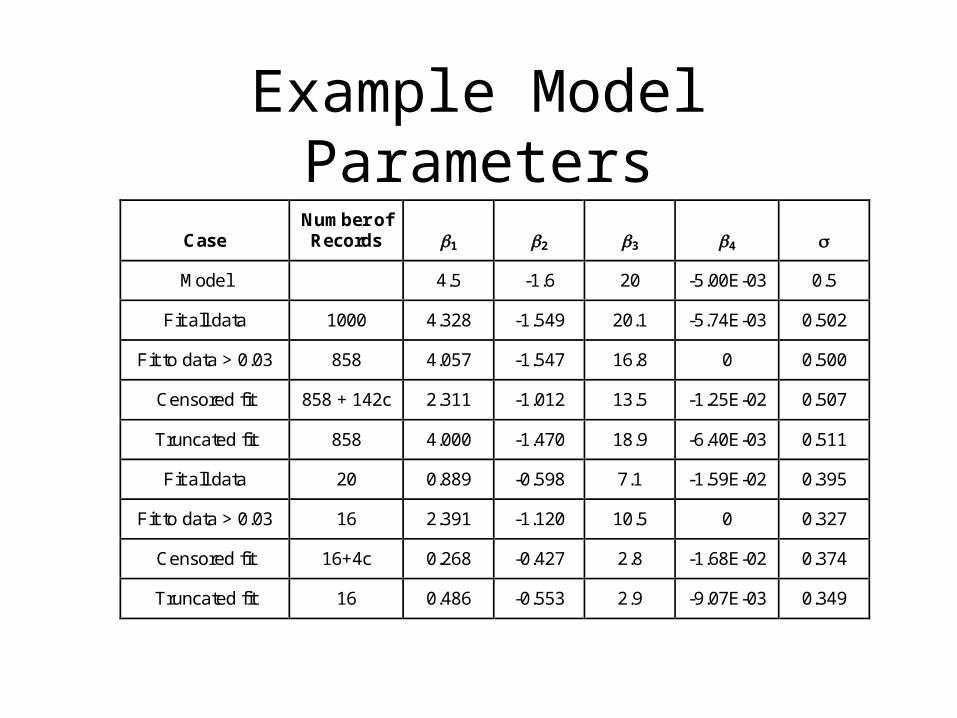
Example Model Parameters
Case Number of Records 1 2 3 4
Model 4.5 -1.6 20 -5.00E-03 0.5
Fit all data 1000 4.328 -1.549 20.1 -5.74E-03 0.502
Fit to data > 0.03 858 4.057 -1.547 16.8 0 0.500
Censored fit 858 + 142c 2.311 -1.012 13.5 -1.25E-02 0.507
Truncated fit 858 4.000 -1.470 18.9 -6.40E-03 0.511
Fit all data 20 0.889 -0.598 7.1 -1.59E-02 0.395
Fit to data > 0.03 16 2.391 -1.120 10.5 0 0.327
Censored fit 16+4c 0.268 -0.427 2.8 -1.68E-02 0.374
Truncated fit 16 0.486 -0.553 2.9 -9.07E-03 0.349
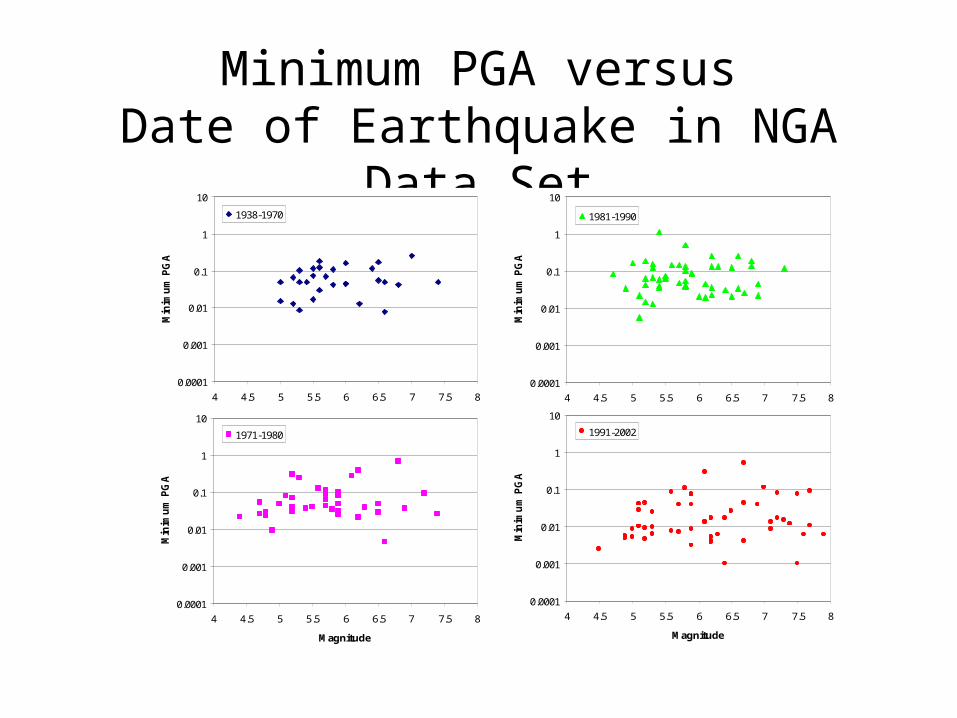
Minimum PGA versusDate of Earthquake in NGA Data Set
0.0001
0.001
0.01
0.1
1
10
4 4.5 5 5.5 6 6.5 7 7.5 8
Magnitude
Min
imu
m P
GA
1938-1970
0.0001
0.001
0.01
0.1
1
10
4 4.5 5 5.5 6 6.5 7 7.5 8
Magnitude
Min
imu
m P
GA
1971-1980
0.0001
0.001
0.01
0.1
1
10
4 4.5 5 5.5 6 6.5 7 7.5 8
Magnitude
Min
imu
m P
GA
1981-1990
0.0001
0.001
0.01
0.1
1
10
4 4.5 5 5.5 6 6.5 7 7.5 8
Magnitude
Min
imu
m P
GA
1991-2002
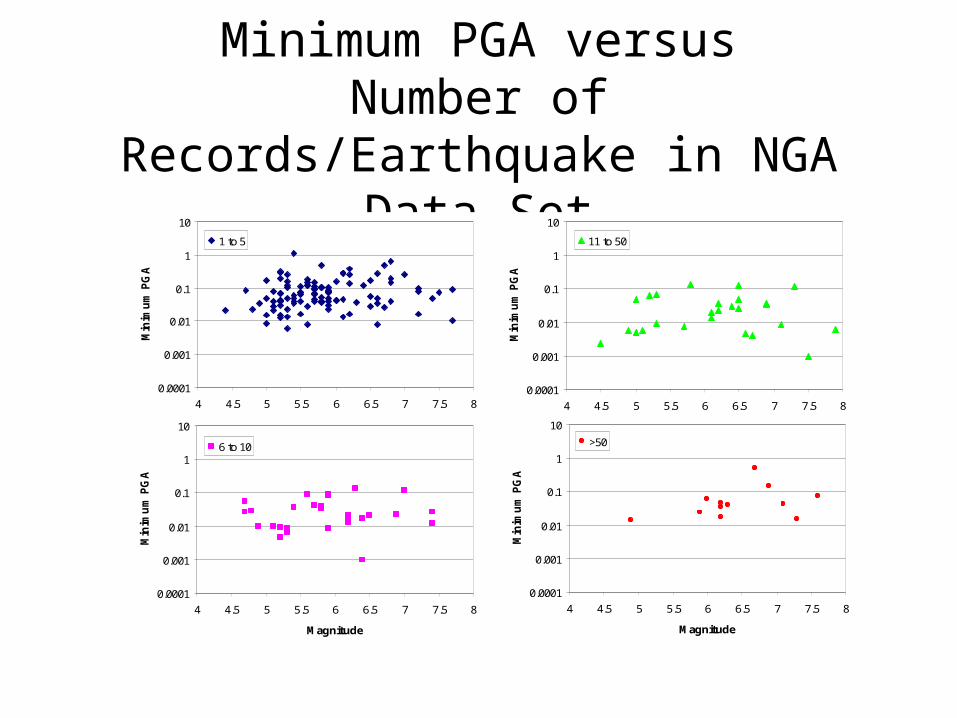
Minimum PGA versusNumber of Records/Earthquake in NGA
Data Set
0.0001
0.001
0.01
0.1
1
10
4 4.5 5 5.5 6 6.5 7 7.5 8
Magnitude
Min
imu
m P
GA
1 to 5
0.0001
0.001
0.01
0.1
1
10
4 4.5 5 5.5 6 6.5 7 7.5 8
Magnitude
Min
imu
m P
GA
6 to 10
0.0001
0.001
0.01
0.1
1
10
4 4.5 5 5.5 6 6.5 7 7.5 8
Magnitude
Min
imu
m P
GA
11 to 50
0.0001
0.001
0.01
0.1
1
10
4 4.5 5 5.5 6 6.5 7 7.5 8
Magnitude
Min
imu
m P
GA
>50
Addition Work to be Done
• Incorporate into random effects model
• Investigate stability of estimation algorithms – maximum likelihood appears to be primary approach
• Evaluate sensitivity to selection of truncation level – treat as uncertain?
Treatment of Correlations in Response Data(Peak Motions)

Source and Site Data Correlations
• Earthquake effect – correlation in peak motions from the ith earthquake– presently incorporated by random effects and
two-stage regression approaches
• Site effect – correlations in peak motions recorded at the jth site.– This effect is cross-classified with the
earthquake effect – eliminates block-diagonal variance matrix, requiring “tricks”
effectsitej
effectearthquakeiijij xy ),( β
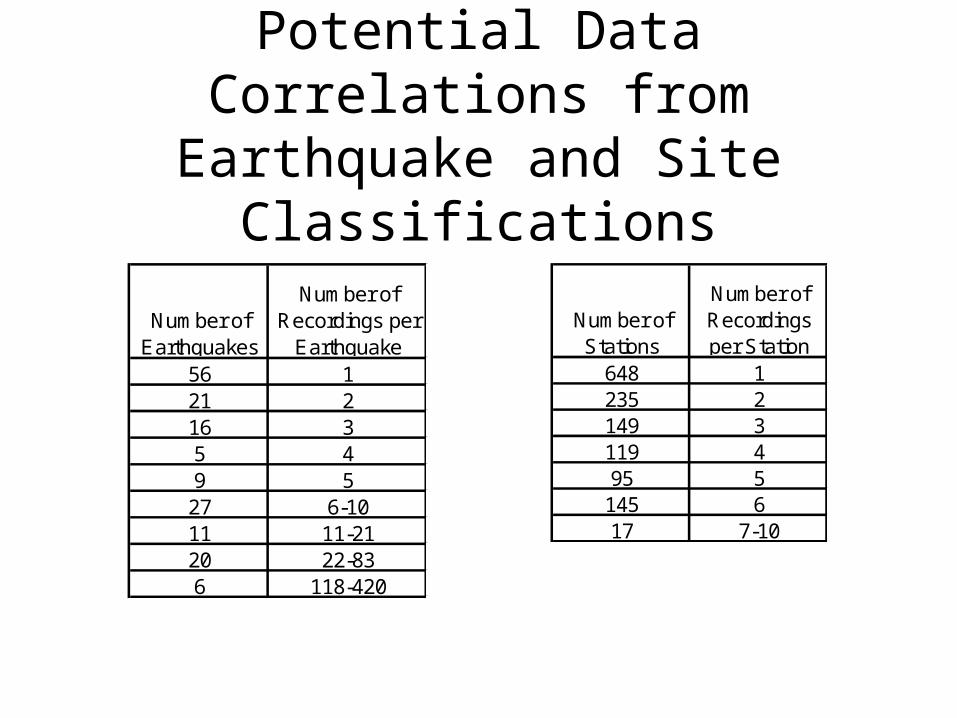
Potential Data Correlations from Earthquake and Site Classifications
Number of Stations
Number of Recordings per Station
648 1235 2149 3119 495 5
145 617 7-10
Number of Earthquakes
Number of Recordings per
Earthquake56 121 216 35 49 527 6-1011 11-2120 22-836 118-420
Tentative Conclusions
• Earthquake effect already addressed by developers
• Cross-classification by site effect term not a significant issue because of limited number of sites with many recordings– Need to do some testing with simulated data
sets to confirm this conclusion
Additional Correlations
• Spatial Correlation of adjacent sites– Readily handled as nested classifications
provided one has the correlation model– Need to investigate the potential extent in NGA
data
• Correlation between adjacent spectral frequencies in a “global” regression– Is this of interest to then developers?

Treatment of Missing or Uncertain Predictor Variables
Missing Predictor Variables
• Site classification variables– VS30, NEHRP Categories, Other Site Categories,
– Depth to VS of 1.0 and 2.5 km/sec
• Rupture geometry variables– Directivity variables
– Hanging wall/footwall determinations
– Confined to smaller events/distant recordings where effect is believed to be minimal?
Possible Approaches
• Estimation of variable by an external model– Example: correlation of VS30 with surficial
geology
• Correlations with other variables in the NGA data set– Technique used in multivariate normal models
Treatment of Uncertainty in Predictor Variables
• Magnitude uncertainty– partition of earthquake random effect into an
magnitude error term and an event term (Rhodes, 1997)
• Propagation of variable uncertainty into resulting model parameter uncertainty– Formal errors in variable methods– Simulation methods