Embed Size (px)
Citation preview

TASK 3
ACTION TAKEN BY
THE SOUTH YORKSHIRE POLICE
IN RESPECT OF SHEFFIELD UNITED FOOTBALL CLUB
FOLLOWING THE RECOMMENDATIONS OF
THE INTERIM REPORT
OF
LORD JUSTICE TAYLOR
nc i u a f f f 10S> DSG69G OF 93') * ALLOCATE ACTION PR IN"l 1 ^ 3
i j.Oi'M NUMB -.R : A 6 8 9ORIGINATING rROn : D166 D167 D168
NATURE OF ACTION w: :c.CK i' .Gfc. bUL'v! iSS i ON Hb. NO * i3 HASS1NG i FKOUvji■■! CiA i L C
13-06-90 1310 C -931 RAISED FROM D166 D -67 D-.6S_:>-06-90 160-1 OP 93"! ALLOCATED TO DI CLEVERLEY
JRIGINATING FROM : D 1 6 6 D167 0168ASSOCIATED DOCS 3
_INKED ACTIONS' : A690 A691
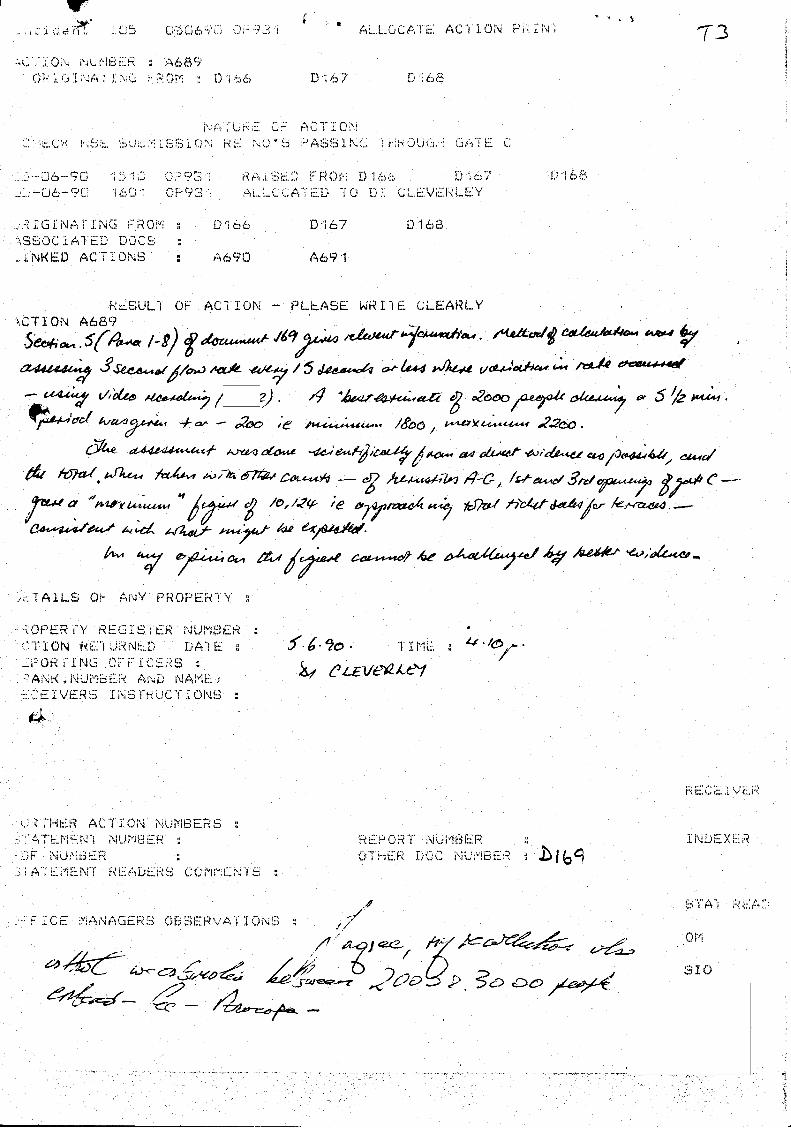
RESULT OF ACTION - PLEASE WRI'lE CLEARLY ACTION A6S9 , ■ .Seefi^.SfA** I'S) J f t ^ a ***4 |r
04UA4t*up SSe<uu*&/ /cr»J Aa.A- / 5 o te+4 y ^ M t/ituJcchc** t** /vaM e*aeuj-*4ef
~~~Ct4*Utg i/ictte> Al&e-* £e**y / u^etXZ o2c>c>0 jO&epU* olu*u~iy & S
a -f- — Jfoo /<f JS00 , *?-2c>0 ■
ok**- ajt&q oU M otu*sA cu*c/
tfu W t U t tSku* *>fki srn&t c*^ush — eg & G , /tS-a**/ 3tctyju**<yi C -
$**** ° Uiu-i*!.! /&, /(f- rg Cf-yXpfva A. /fdif' t ec& ar fes-ro&A. _—
C*<*-u*S£*tS t-jTufLS~
j z . 1 AILS Ofr ANY PROPER i Y :
ROPER TY REGISTER NUMBER sOTION RE"i UR NED DATE s • 1 I ME :-G-ORfiNG OFFICERS : C A j jzi t£*ti L. RANK , NUMBER AND NAME ) * * C l& /e *L A .e i“GEIVERb INSTRUCTIONS s
GATHER ACTION NUMBERS s •G'ATEMEN'i NUMBER s OF NUMBER :
J i A i Li'IElNi i KbADEKS COMr'ifc.N I
REPORT NUMBER ;OTHER DOC NUMBER
INDEXER
T I C E MANAGERS OBSERVATIONS ; y//> <2*2-fry
P . <£>&
STA‘1 READ
or
SIO
Incident Report
HEAIIIH AND SAFFTV EXECUTIVE
RESEARCH AND IABORATORY SERVICES DIVISION
Broad lane, Sheffield S3 7HQ
The Hillsboroutfi Incident 15 April 1989: An Investigation into Various Technical Aspects prepared for the Court of Tngm -ry
by
C E Nicholson HiD CEng MIM
JJR/L/ME/m/89/1
Distribution
Bie Court of Inquiry (25 copies)Mr J D G HammerDr J MoQuaidDr A JonesMr A Barrell TDMr M S Nattrass EMD Area 14Mr J P Gil trow HFS (N)Mr M R Stephenson NE PCGMr M Fountain TD3Dr J H FoleyDr C E NicholsonMr P F HeyesMr D WaterhouseMr G A C GamesMr M James TD3Mr C J Pertee NE FOGMr J B Hifcbs NE PCGRPSLibrary (2)Registry File
Issue authorised by: Dr A Jones Date: 13 June 1989
TO RLSD/DIAS STAFF ONLY: NOT TO BE COMMUNICATED OUTSIDE HSE WITHOUT THE APPROVAL OF THE AUTHORISING OFFICER
SMV343/235/01
S80.02.C3H.814
tt
x iNraopucnoN
1.1 Following an incident on 15 April 1989, I visited Sheffield Wednesday Football Club's (SWPC) Hillsborough Stadium on 16 April 1989 at the request of Mr M S Nattrass, Area Director of South Yorkshire and Humberside Factory and Agricultural Inspectorate of the Health and Safety Executive (HSE). Subsequently I was appointed to head the HSE team investigating the incident following correspondence between the Court of Inquiry and the Deputy Director General of the HSE, Mr J D G Hammer.
1.2 This report contains details of examinations performed on site and in the laboratory. The work was carried out by me and by other staff of HSE working on my instructions and under my general supervision.
2 SURVEY OF PENS 3 AND 4
2.1 Using the drawings prepared by Ralph Brade & Associates, 1340/02 and 03, and comparing with figures stated in the Guide to Safety at Sports Grounds 1986, the following assessments were made.
2.2 The heights of crush barriers should be 1.02m to 1.12m with a preferred height of 1.1m. In Ben 3 four out of five barriers do not conform. In Ben 4 six out of nine barriers do not conform.
2.3 The alignment of gaps in successive reus of barriers on a terrace should form an angle of less than 60° to the barriers. Of the four 'paths of gaps' in Ben 3, two do not conform. Of the eleven 'paths of gaps' in Ben 4, one does not conform.
2.4 Gaps in the line of crush barriers should be at least 1.1m and not more than 1.4m in width. In Ben 3, four out of five gaps do not conform. In Ben 4, nine out of ten gaps do not conform.
2.5 For a terrace slcpe of approximately 14° the interpolated maximum horizontal distance between barriers is 3.9m. In Ben 3 only one spacing does not conform. In Ben 4 only two spacings do not conform.
2.6 Gates or other access points should have a minimum width of 1.1m. The gate to Ben 3 has a clearance width of 0.81 to 0.82m and the gate to Ben 4 has a clearance width of 0.77 to 0.79m. Both therefore do not conform.
2.7 The aim is for every spectator on the terraces to be within 12m of a gangway or exit. If the perimeter gaps are not considered as exits then approximately 40% of the spectators in Bens 3 and 4 will not be within 12 metres of an exit.
3 EXAMINATION OF THE BROKEN BftKRIER - NO 124A
3.1 Barrier 124A was examined by HSE staff at Hillsborough Football Ground chi 17 April 1989. Various parts of this barrier and 3 core samples of concrete were taken to the Sheffield Laboratory on 24 April 1989 for detailed assessment.
3.2 It was deduced that barrier 124A had consisted of a continuous horizontal tube, made from wrought iron, and four vertical supports each made from two lengths of steel angle section joined at the tcp by a steel gusset
1

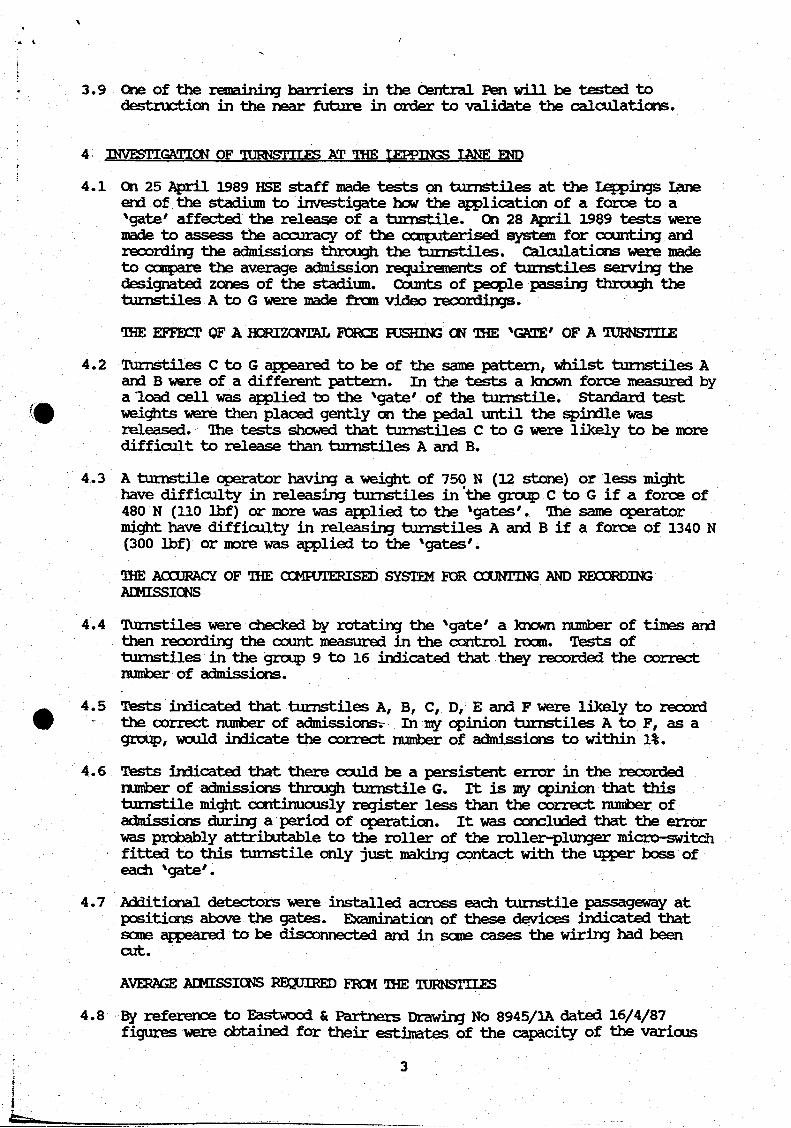
plate. Five of the eight support feet were reinforced by additional angle sections which appeared to be let into the concrete terrace steps. TVro of the rear support legs were braced by further angle sections. A reconstruction is shewn in Figure 1. The barrier had failed apparently by partial collapse and fracture of supports 3 and 4, and by fracture of the horizontal tube at supports 2, 3 and 4, as shewn in Figure 2. Hie portion of the tube which had been located between supports 2 and 3 had been bent uniformly to give a maximum permanent deflection of 133mn at midspan. The portion of the tube which had been located between supports 3 and 4 had been bent uniformly to give a maximum permanent deflection of 20Qnsn at midspan. Carrier 124A was estimated to be approximately 60 years old, although it had received a number of modifications during its lifetime.
3.3 The tensile strength of the wrought iron 'tube material was measured at 365MPa (23.6 tanf/in2) with an estimated elastic limit of 150MPa(9.7 tanf/in2). The tensile strength of the mild steel angle used for the supports was measured at 36GMPa (23.3 tonf/in ) with a yield stress of 288MPa (18.6 tonf/in2).
3.4 The tube fractures had occurred in areas which had been located under the metal straps designed to retain the tube. At these locations the tubes had not been painted, and the tube wall thicknesses, nominally 4.5mm, had been reduced significantly by corrosion. At the fracture surface corresponding to support 2 the residual thickness of the tube wall was found to vary from 0.4mm to 4.4mm arcund the circumference. Similarly at the fracture surface corresponding to support 3 the wall thickness was in the range 1.6nm to 4.5mm. At support 4, however, there was evidence that the tube wall had been perforated by corrosion at two locations producing holes which would have been approximately 10mm and 20mm in diameter before the collapse. Elsewhere, around the fracture corresponding to support 4, the wall thickness was in the range 1.1mm to 4.5nm.
3.5 In general the appearance of the tube fractures was typical of wrought iron which had fractured in a single-stage bending/tensile mode. Fracture of the tube adjacent to support 3 appeared to have initiated on the uphill side of the barrier at a position approximately 90° frcm top dead centre. The other tube fractures had suffered seme post-failure damage and the origins were not readily identifiable.
3.6 The failed supports had been corroded, particularly at the junction with the concrete steps and/or reinforcement angles. In these regions residual thicknesses in the range 3.1mm - 5.9mm were measured compared with a nominal thickness of 6.3mm.
3.7 large amounts of metal had been lost by corrosion fran supports 3 and 4 near, what would have been, the original junctions between the support feet and the terrace. In one case (rear leg support 4) a ligament of metal 8nm wide was all that remained of the original angle section (50 x 50nsn). On two of the four feet this region had been reinforced by the addition of a length of metal angle which had been bolted on top of the original angle front which the support had been made. The height of the concrete terrace had been raised at some stage and this had concealed the previous aorrosion damage. The appearance of the concrete cores, extracted from near the support feet, was consistent with this observation.
3.8 Calculations to establish the force required to cause the collapse of barrier 124A, and the collapse sequence are currently underway.
9 One of the refining barriers in the Centred. Pen will be tested to destruction in the near future in order to validate the calculations.
INVESTIGATION OF TURNSTILES AT TOE T JPPTNGS IANE END
1 On 25 April 1989 HSE staff made tests on turnstiles at the Leppings Lane end of the stadium to investigate how the application of a farce to a 'gate' affected the release of a turnstile. On 28 April 1989 tests were made to assess the accuracy of the computerised, system for counting and recording the admissions through the turnstiles. Calculations were made to ccnpare the average admission requirements of turnstiles serving the designated zones of the stadium. Counts of people passing through the turnstiles A to G were made from video recordings.
THE EFFECT QF A HORIZONTAL FORCE HJSHING ON THE 'GATE' OF A TURNSTILE
2 Turnstiles C to G appeared to be of the same pattern, whilst turnstiles A and B were of a different pattern. In the tests a known force measured by a load cell was applied to the 'gate' of the turnstile. Standard test weights were then placed gently on the pedal until the spindle was released. The tests showed that turnstiles C to G were likely to be moredifficult to release than turnstiles A and B.
3 A turnstile operator having a weight of 750 N (12 stone) or less mighthave difficulty in releasing turnstiles in the group C to G if a force of 480 N (110 lbf) or more was applied to the 'gates'. The same operator might have difficulty in releasing turnstiles A and B if a force of 1340 N (300 lbf) or more was applied to the 'gates'.
THE ACCURACY OF THE CCMRJTERISED SYSTEM FOR COUNTING AND RECORDING ADMISSIONS
4 Turnstiles were checked by rotating the 'gate' a known number of times and then recording the count measured in the control room. Tests of turnstiles in the group 9 to 16 indicated that they recorded the correct number of admissions.
5 Tests indicated that turnstiles A, B, C, D, E and F were likely to recordthe correct number of admissions^ In my opinion turnstiles A to F, as a group, wculd indicate the correct number of admissions to within 1%.
6 Tests indicated that there could be a persistent error in the recorded number of admissions through turnstile G. It is my opinion that this turnstile might continuously register less than the correct number of admissions during a period of operation. It was concluded that the error was probably attributable to the roller of the roller-plunger micro-switch fitted to this turnstile only just making contact with the upper boss of each 'gate'.
7 Additional detectors were installed across each turnstile passageway at positions above the gates. Examination of these devices indicated that seme appeared to be disconnected and in sane cases the wiring had been cut.
AVERAGE AEMISSIONS REQUIRED FRCM THE TURNSTILES
8 By reference to Eastwood & Partners Drawing No 8945/1A dated 16/4/87 figures were obtained for their estimates of the capacity of the various
zones of the stadium. On 28 April 1989 HSE staff surveyed the outside perimeter of the stadium to identify the numbers of turnstiles used by each zone. Six groups of turnstiles served the six zones of the stadium. These are summarised in the following Table.
<•
4.9 The three groups of turnstiles having the highest average admission requirements were sited at the Leppings Lane end of the stadium, i.e. West Terrace Standing, North Stand Seating and West Stand Seating.
4.10 The average admission requirement of the turnstiles serving the West Terrace was the highest for any zone of the stadium. It was almost 3.5 times the lcwest average admission requirement which is that for the South Stand Uncovered Seating and approximately 2.9 times the average admission requirement for Spion Kqp.
OCUNTTNG OF PEOPLE AEMCTTED THR0CX3I TURNSTILES A TO G FRCM VIDEO RECORDINGS
4.11 The video recordings used for the counting were delivered by West Midlands Police and were identified RJH2/E/Part 1, RJH2/E/Part 2, RJH2/E/Part 3, RJH2/F/Part 1, RJH2/F/Part 2, RJH2/F/Part 3. They showed the exits of turnstile booths A to G frcm approximately 12.55pm until 3.10pm on15 April 1989. The continuous reference timings on the video recordings were with respect to the start of each recording, and not to British Summer Time (BST), hut the relationship between the recording times and BST was determined frcm the observation of specific events in conjunction with West Midlands Police.
4.12 The method of counting used a micrx>-<xxnputer and specially developed program. A push-button was depressed every time a person was seen to emerge frcm an identified turnstile booth and the computer recorded the signal and its time. People emerging frcm turnstiles A and B were counted together because it was not always possible to differentiate between people emerging frcm these individual turnstiles.
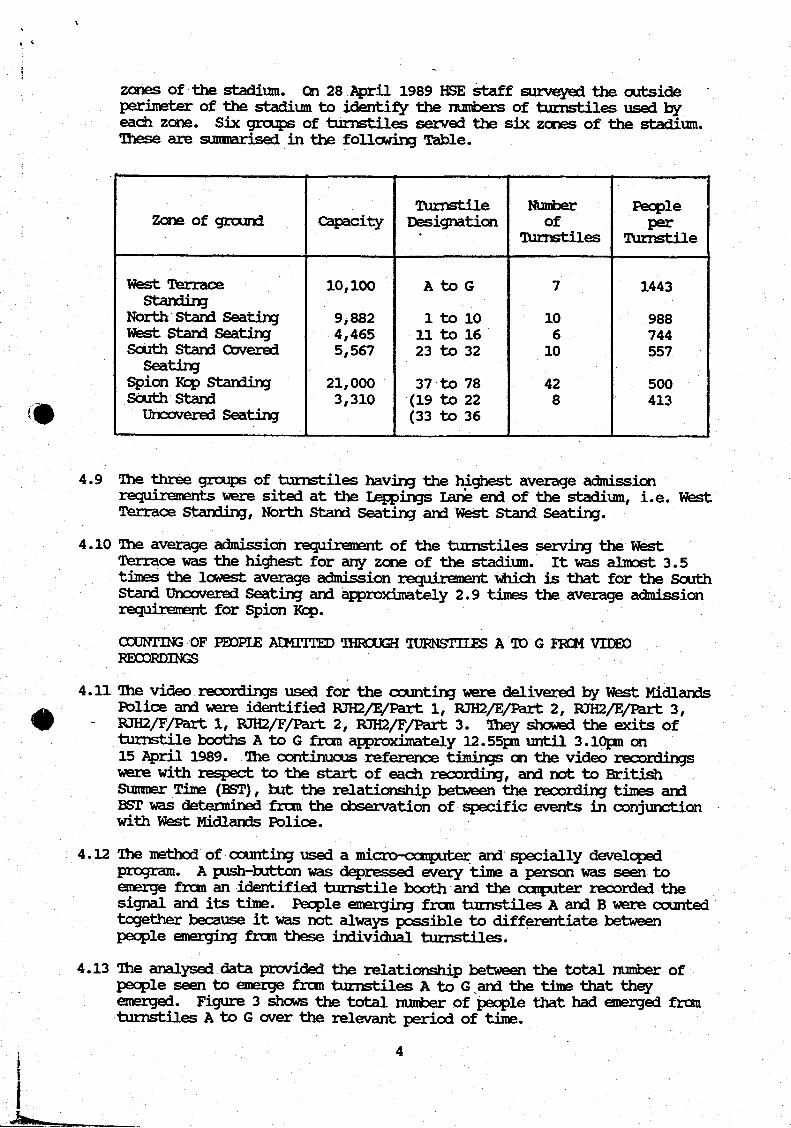
4.13 The analysed data provided the relationship between the total number of people seai to emerge frcm turnstiles A to G and the time that they emerged. Figure 3 shows the total number of people that had emerged from turnstiles A to G over the relevant period of time.
Zone of ground CapacityTurnstileDesignation
Nunfcerof
Turnstiles
Peopleper
Turnstile
West Terrace 10,100 A to G 7 1443Standing
North Stand Seating 9,882 1 to 10 10 988West Stand Seating 4,465 11 to 16 6 744South Stand Covered 5,567 23 to 32 10 557Seating
Spion Kcp Standing 21,000 37 to 78 42 500South Stand Uncovered Seating
3,310 (19 to 22 (33 to 36
8 413
4
4.14 I was informed by West Midlands Police that the turnstiles were opened before the start of the video recordings. At approximately 2.00pm just over 2,000 people had been counted and at 2.52pm this number had risen to approximately 6,000. The final total count was 7247 people.
The HSE count totals are surtraarised in the following table and compared with the SWPC computer print-out, taken bn 15 April 1989, a copy of which was provided by West Midlands Police.
Turnstiles HSECount
SWPCComputer
Difference
A+B 1930 2004 -3.7%
C 1168 1206 -3.3%
D4-E 2130 2196 -3.0%
F+G 2019 1632*
TOTAL 7247 7038*
* See paragraph 4.15
Turnstiles A and B, D and E and F and G had cannon exits, and hence the HSE and SWPC counts of these pairs of turnstiles have been combined.
4.15 Paragraph 4.6 of this report referred to a persistent error in the count obtained from turnstile G. This could result in no signal being sent to the computer even though a person had passed through the turnstile and could account for the discrepancy between the HSE count of 2019 for F plus G and the SWPC count of 1632.
4.16 Based on the assumption that the SWEC computer printout accurately recorded A to E and that the HSE count for F and G was less than the number who actually passed through F and G by a similar percentage to that obtained frcm A to E, the estimate for the total number of people that entered through turnstiles A to G is 7494. In my opinion the actual number is unlikely -to have exceeded this value by more than 2%, i.e. 7644.
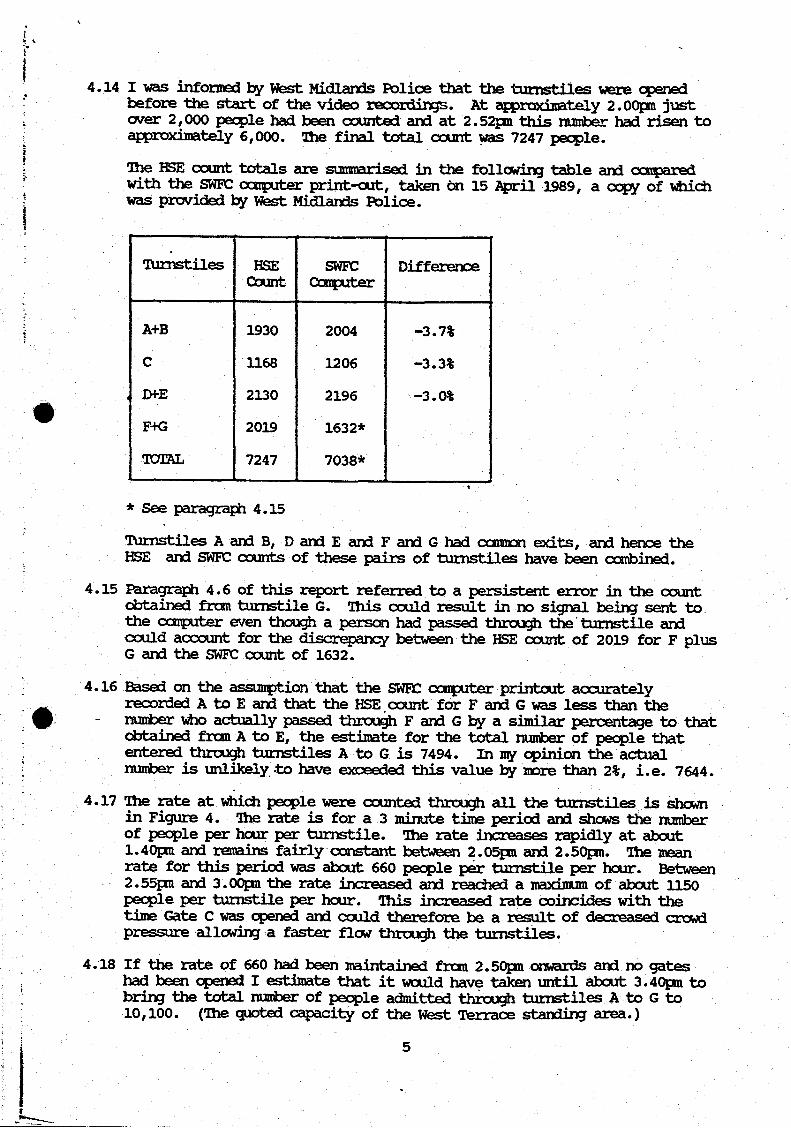
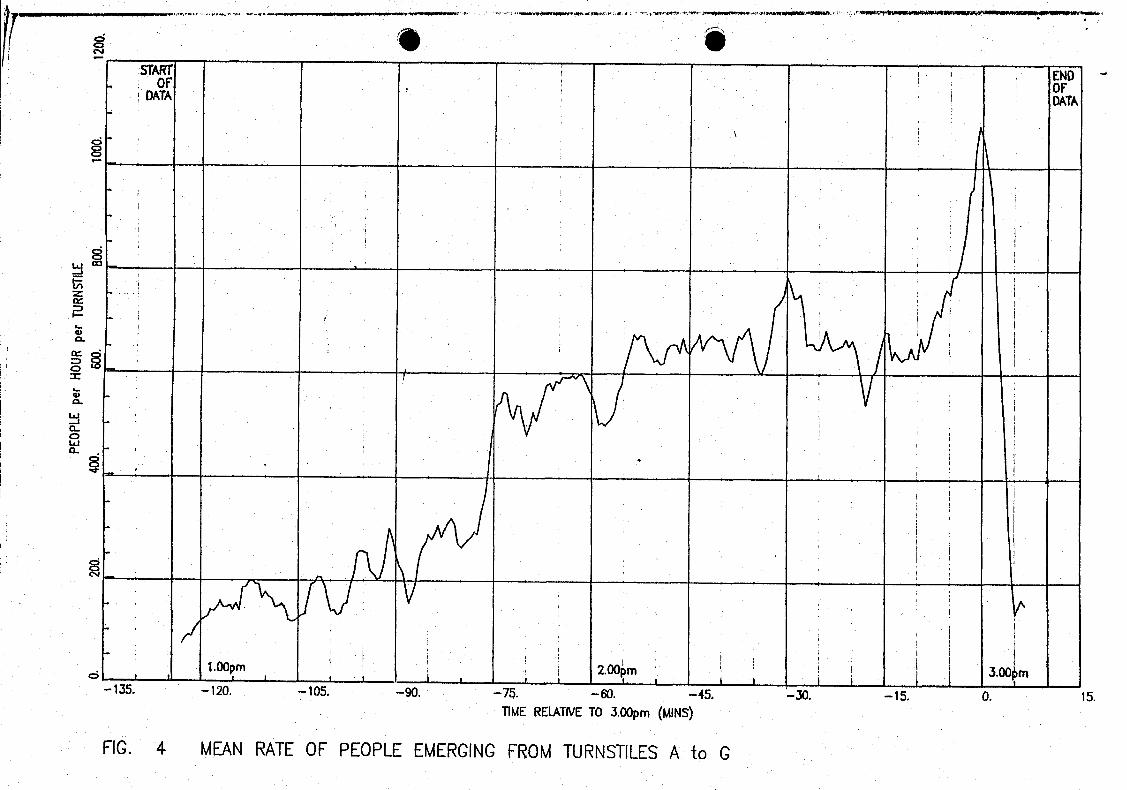
4.17 The rate at which people were counted through all the turnstiles is shown in Figure 4. The rate is for a 3 minute time period and shows the number of people per hour per turnstile. The rate increases rapidly at about 1.40pm and remains fairly constant between 2.05pm and 2.50pm. The mean rate for this period was about 660 people per turnstile per hour. Between 2.55pm and 3.00pm the rate increased and reached a maximum of about 1150 people per turnstile per hour. This increased rate coincides with the time Gate C was opened and could therefore be a result of decreased crowd pressure allowing a faster flew through the turnstiles.
4.18 If the rate of 660 had been maintained frcm 2.50pm onwards and no gates had been opened I estimate that it would have taken until about 3.40pm to bring the total number of people admitted through turnstiles A to G to 10,100. (The quoted capacity of the West Terrace standing area.)
5
#
5 ESTIMATE OF FBQPTJ3 AEMTITED THRCQgi 'GATE C' TAKEN FRCM VIDBO RECORDINGS
5.1 A video recording labelled RJH2, delivered by West Midlands Police, was used for this analysis. It was copied by HSE photographers and a timing reference added. This copy was given the identification DF1/B. It showed the exits of turnstile booths A to G, Gate C and the general area on the West Stand side of these turnstiles. The continuous reference timings on the video recording related to the start of the tape and not to BST.
5.2 I was told by West Midlands Police that, following scrutiny of synchronised video recordings, the 'First Opening' of Gate C had occurred at approximately 14.48pm for a duration of ~30 seconds. I was also told that the 'Second Opening' of Gate Chad started at ~ 14.52pm and finished at ~14.58pm, a duration of-5^ minutes. A 'Third Opening' then .occurred approximately one minute later when the gate was opened for approximately8 minutes, sufficient to allcw the entry of people in single file.
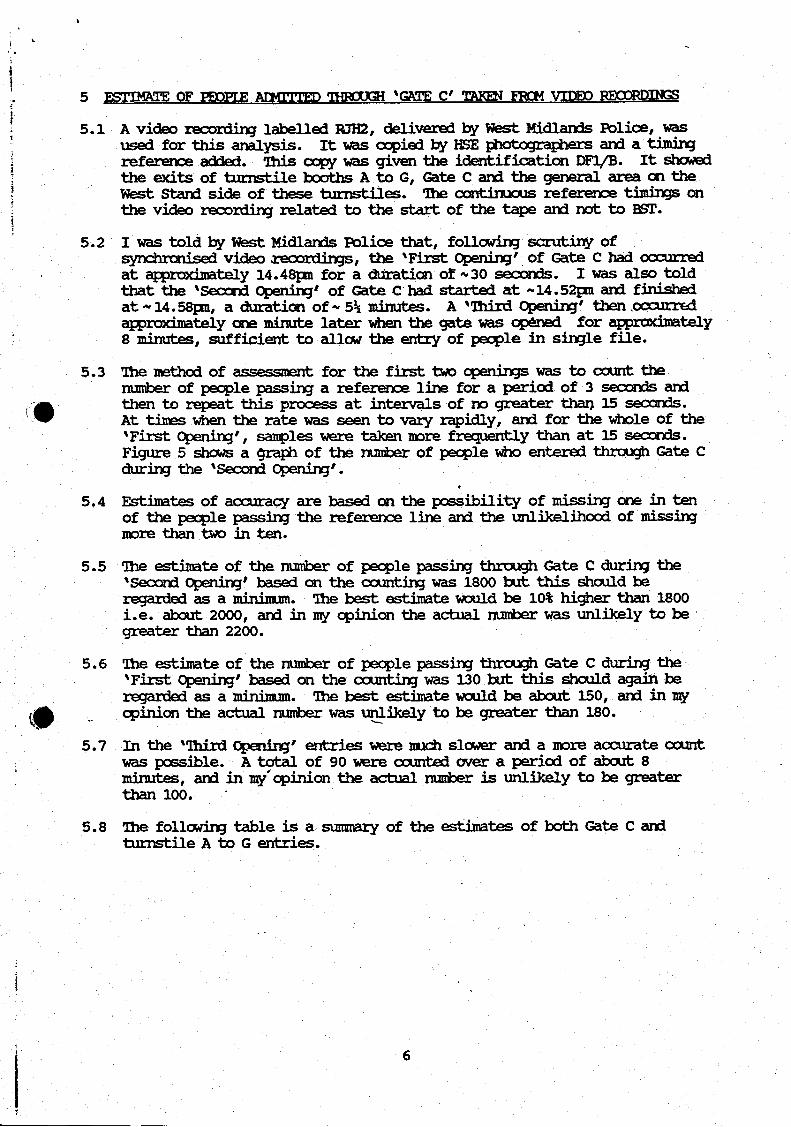
5.3 The method of assessment for the first two openings was to count the number of people passing a reference line for a period of 3 seconds and then to repeat this process at intervals of no greater than 15 seconds.At times when the rate was seen to vary rapidly, and for the whole of the 'First Opening', sanples were taken more frequently than at 15 seconds. Figure 5 shews a Cfraph of the number of people who entered through Gate C during the 'Second Opening'.
•
5.4 Estimates of accuracy are based on the possibility of missing one in ten of the people passing the reference line and the unlikelihood of missing more than two in ten.
5.5 Hie estimate of the number of people passing thrcugh Gate C during the 'Second Opening' based on the counting was 1800 tut this should be regarded as a minimum. The best estimate would be 10% higher than 1800 i.e. about 2000, and in xny opinion the actual number was unlikely to be greater than 2200.
5.6 The estimate of the number of people passing thrcugh Gate C during the 'First Opening' based on the counting was 130 but this should again be regarded as a minimum. The best estimate would be abcut 150, and in my opinion the actual number was unlikely to be greater than 180.
5.7 In the 'Third Opening' entries were much slower and a more accurate count was possible. A total of 90 were counted over a period of abcut 8 minutes, and in my'opinion the actual number is unlikely to be greater than 100.
5.8 The following table is a summary of the estimates of both Gate C and turnstile A to G entries.
?
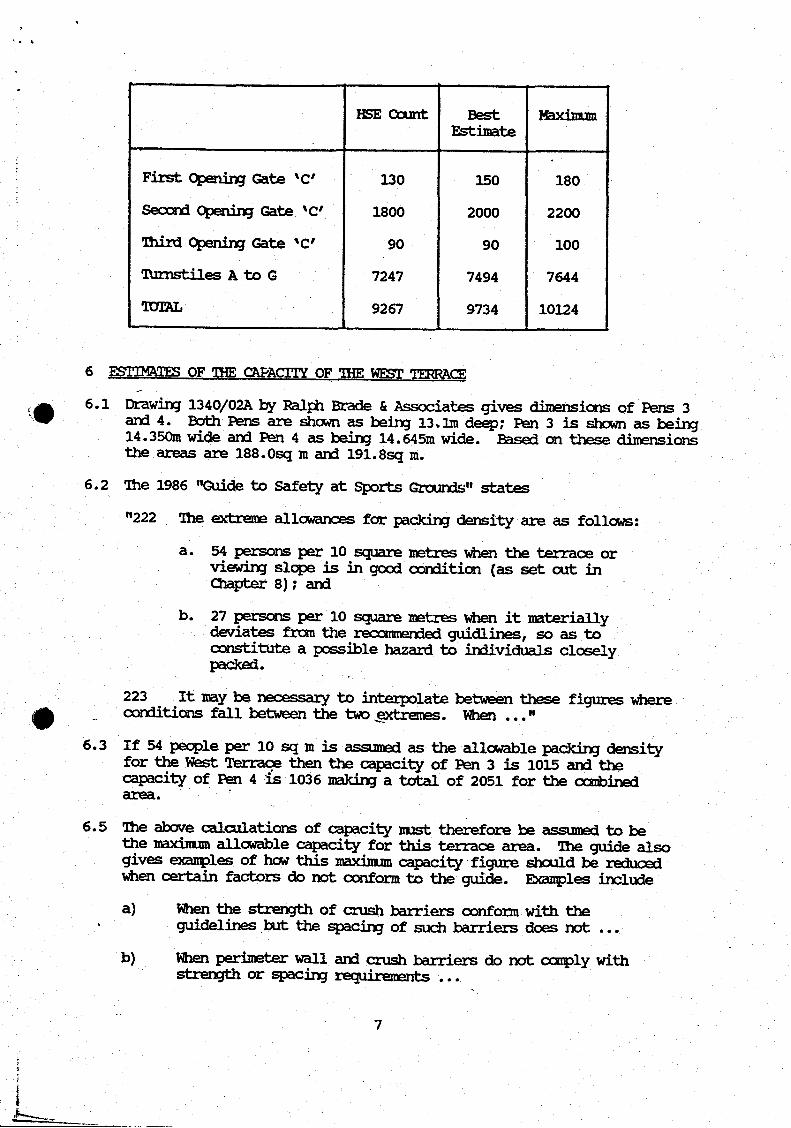
HSE Count BestEstimate
Maximum
First Opening Gate 'C' 130 150 180
Second opening Gate 'C' 1800 2000 2200
Third Opening Gate 'C' 90 90 100
Turnstiles A to G 7247 7494 7644
TOTAL 9267 9734 10124
6 ESTIMATES OF THE CAPACITY OF THE WEST TERRACE
6.1 Drawing 1340/02A by Ralph Brade & Associates gives dimensions of Pens 3 and 4. Both Pens are shewn as being 13.1m deep; Pen 3 is shown as being 14.350m wide and Pen 4 as being 14.645m wide. Based chi these dimensions the areas are 188. Osq m and 191.8sq m.
6.2 The 1986 "Guide to Safety at Sports Grounds" states
"222 The extreme allowances for packing density are as follows:
a. 54 persons per 10 square metres when the terrace or viewing slcpe is in good condition (as set out in Chapter 8); and
b. 27 persons per 10 square metres when it materially deviates frcra the reconmended guidlines, so as to constitute a possible hazard to individuals closely packed.
223 It may be necessary to interpolate between these figures whereconditions fall between the two extremes. When ..."
6.3 If 54 people per 10 sq m is assumed as the allowable packing density for the West Terrace then the capacity of Pen 3 is 1015 and the capacity of Pen 4 is 1036 making a total of 2051 for the canbined area.
6.5 The above calculations of capacity must therefore be ag.«=annp<i to be the maximum allowable capacity for this terrace area. The guide aicn gives examples of how this maximum capacity figure should be reduced when certain factors do not conform to the guide. Examples include
a) When the strength of crush barriers conform with the guidelines but the spacing of such barriers does not ...
b) Mien perimeter wall and crush barriers do not ccnply with strength or spacing requirements ...
c) When the positioning and width of gangways do not meet with the recommendations of Chapter 8. ...
6.6 It also states that when crush barriers do not meet the guidelines onstrength but are well constructed, consideration may be given toallowing a lower packing density figure for the purpose of calculation.
7 ESTIMATES OF THE PACKING DENSITTFS OF THE WEST TERRACE
7.1 West Midlands Police provided me with several albums of photographs, taken at Hillsborough on 15 April 1989, and several of these photographs were identified as providing material for the estimation of the numbers inPen 3. Enlargements of photographs FR1/7A and FR1/8A were provided by West Midlands Police and these two photographs were analysed in detail.The time identification marking on both these photographs was 15.03.
7.2 The method of assessment entailed mounting the photographs on an electronic digitising table (Digitiser) and then marking the head of each person who was discernible. The Digitiser was linked to Computer Aided Drafting software and the act of marking each person cn the photograph enabled the physical points cn the photograph to be placed cn an electronic grid which could then be displayed, under computer control, on a VEU screen or printed cut cn a graphics plotter. Actual counting of the number of those identified within a specified area was carried out automatically and no allowance was made for people that were hidden from view.
7.3 On 22 May 1989 photographs were taken of the empty pons by the same photographer, using the same camera and camera position. This enabled the boundaries and barrier locations in Pen 3 to be transposed onto the computer image of photographs taken on 15 April 1989. ER1/7A arri ER1/8A covered abcut 75% of Pen 3 and it was assumed that the density of people in the remaining 25% was similar to that in the photographed area ofPen 3.
7.4 The estimated headcount for the whole of Pen 3 was 1408 people but areas at the front of the pen were masked by people outside the pen and heads in the area forward of the first barriers were generally less discernible than those behind the first barrier; 1408 is therefore a minimum estimate.
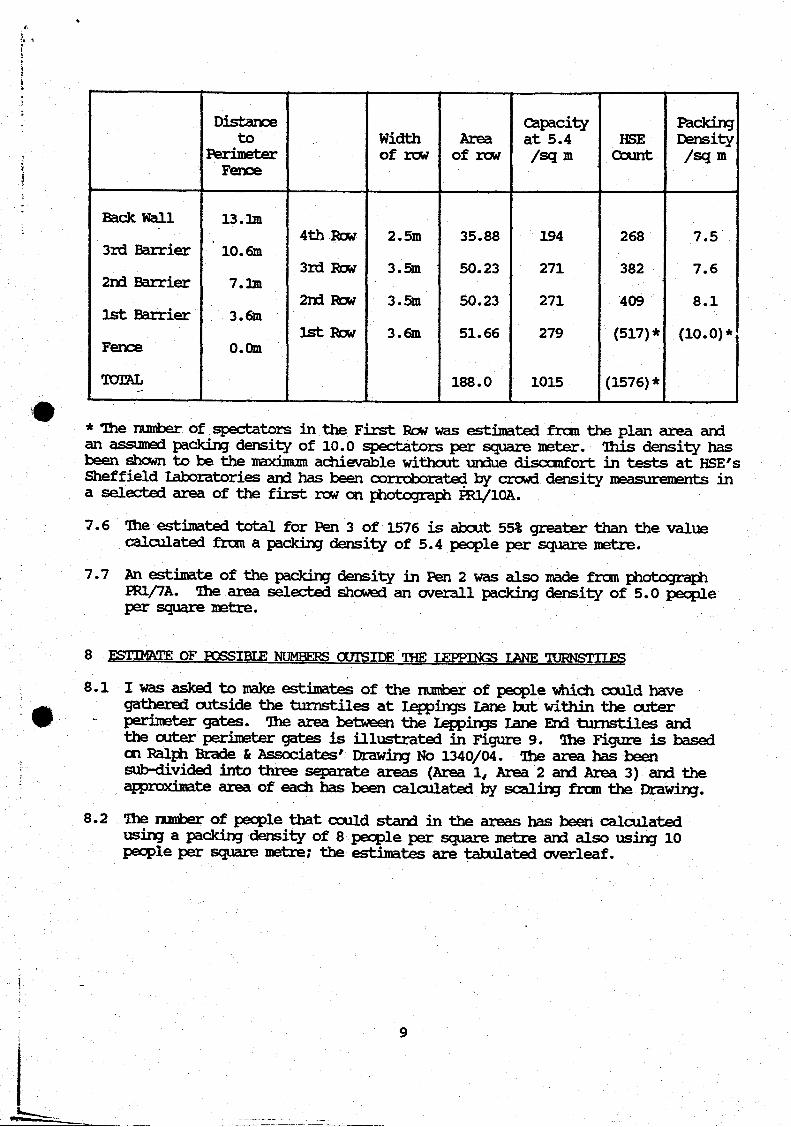
7.5 The results from a more detailed analysis, in which Pen 3 was sub-divided into four rows, bounded by the perimeter fence and the rows of crush barriers, are summarised in the Table overleaf. Figures 6, 7 and 8 illustrate the four rows and the numbers counted in rows 2, 3 and 4.
8
Distanceto
PerimeterFence
Width of I W
Area of I W
Capacity at 5.4 /sq m
HSECount
Packing Density /sq m
Back Wall 13.1m
3rd Barrier 10.6m4th Row 2.5m 35.88 194 268 7.5
2nd Barrier 7.2m3rd Row 3.5m 50.23 271 382 7.6
1st Barrier 3.6m2nd Row 3.5m 50.23 271 409 8.1
Fence 0.0m1st Row 3.6m 51.66 279 (517)* (10.0)*
TOTAL 188.0 1015 (1576)*
* The number of spectators in the First Rcw was estimated from the plan area and an assumed packing density of 10.0 spectators per square meter. This density has been shewn to be the maximum achievable without undue discomfort in tests at HSE's Sheffield laboratories and has been corroborated by crcwd density measurements in a selected area of the first row on photograph HU/10A.
7.6 The estimated total for Pen 3 of 1576 is about 55% greater than the value calculated frcm a packing density of 5.4 people per square metre.
7.7 An estimate of the packing density in Pen 2 was also made frcm photograph FR1/7A. The area selected shewed an overall packing density of 5.0 people per square metre.
8 ESTIMATE OF POSSIBLE NUMBERS OLTTSIDE TWK TFPPTNGS IANE TURNSTIIES
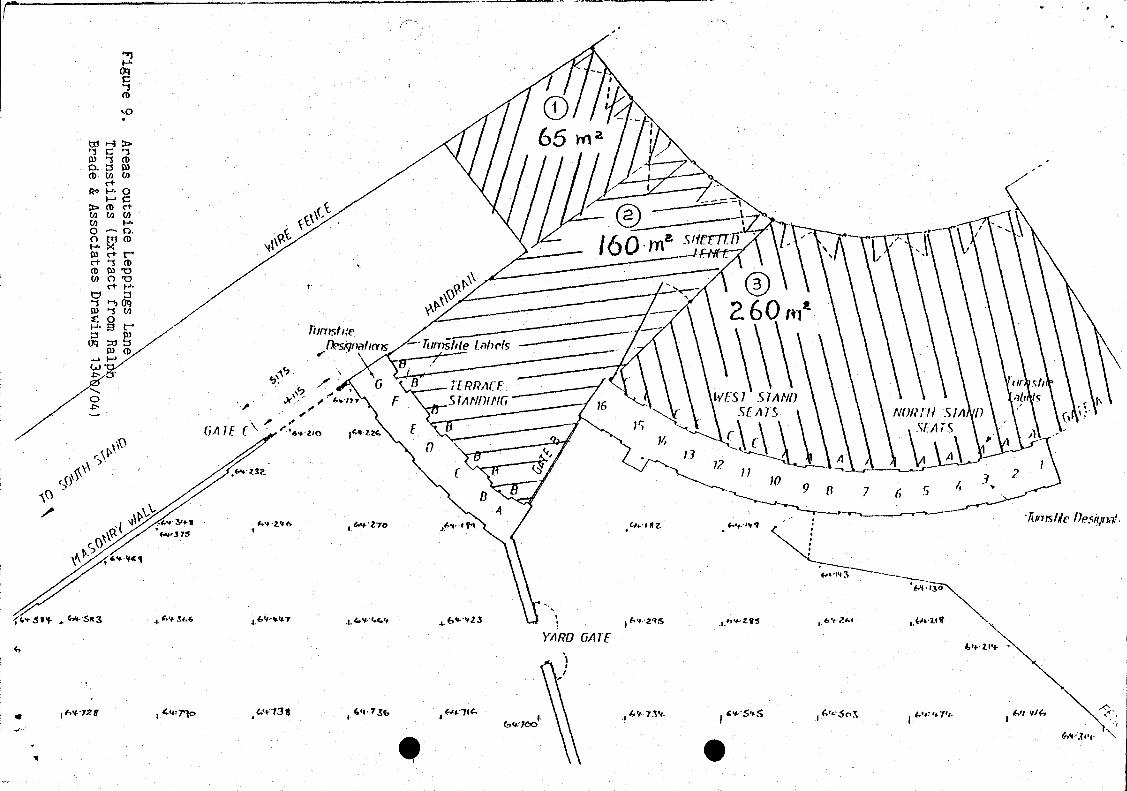
8.1 I was asked to make estimates of the number of people which could have gathered outside the turnstiles at Leppings Lane but within the outer perimeter gates. The area between the Leppings Lane End turnstiles and the cuter perimeter gates is illustrated in Figure 9. The Figure is based cn Ralph Brade & Associates' Drawing No 1340/04. The area has been sub-divided into three separate areas (Area 1, Area 2 and Area 3) and the approximate area of each has been calculated by scaling frcm the Drawing.
8.2 The number of people that could stand in the areas has been rg>ir»iat-gH using a packing density of 8 people per square metre and also using 10 people per square metre; the estimates are tabulated overleaf.

Area insquaremetres
People at density of 8.0 per square m
People at density of 10.0 per square m
Area 1 65 520 650
Area 2 160 1280 1600
Area 3 260 2080 2600
Area 1+2 225 1800 2250
Area 1+2+3 485 ( 3880 4850
9 SUMMARY
Various aspects of the crush barriers and perimeter gates in Pens 3 and 4 did not conform to the 'Guide to Safely at Sports Grounds 1986'.
Die broken barrier, 124A, was made from wrought iron tube and mild steel angle section. Both tube and angle sections were heavily corroded in seine areas. Calculations on the mechanism and force required to cause the collapse of the barrier are proceeding.
Examination of turnstiles A~G indicated that there was a fault in the counting mechanism of G. Frcm assessment of video recordings, a best estimate of pecple entering through A~G was 7494, with a maximum of 7644.
If Gate C had not been opened, HSE estimate that it would have taken until abcut 3.40pm to admit 10,100 pecple through turnstiles A to G.
Assessment of the numbers of turnstiles allocated to various zones of the stadium revealed that the average admission requirement of the turnstiles serving the West Terrace was the highest for any zone of the stadium, and was approximately 2.9 times the requirement for Spion Kop.
HSE's best estimate of the totat number of pecple who entered the ground during the three openings of Gate C was 2240 with a maximum of 2480.
HSE's best estimate of the total number of pecple who entered the ground through gate C (3 openings) and turnstiles A-G was 9734, with a maximum value of 10124.
Even if the strength and spacing of the barriers had complied with the 'Guide to Safety at Sports Grounds 1986', HSE's calculations showed that the capacity of Pens 3 and 4 was 1015 and 1036 respectively.
Since the barriers did not caiply in all respects with the Guide (see 9.1) the estimated capacity of Pens 3 and 4 would be less than in 9.7 above.
9.10 Ihe best estimate, based on photographs, of the number of pecple in Pen 3 at 15.03 was 1576.
9.11 Ihe nuntoer of pecple who could be accomodated theoretically between the perimeter gates and the turnstiles at Leppings Lane was estimated to be 3880 and 4850 for crowd packing densities 8.0 and 10.0 per square metre respectively.
9.1
9.2
9.3
9.4
9.5
9 i6
9 .7
9.8
9.9
10

RADIAL FENCE BETWEEN PENS 2 & 3
PITCH
Fig. 1 - Reconstruction of Barrier 124A
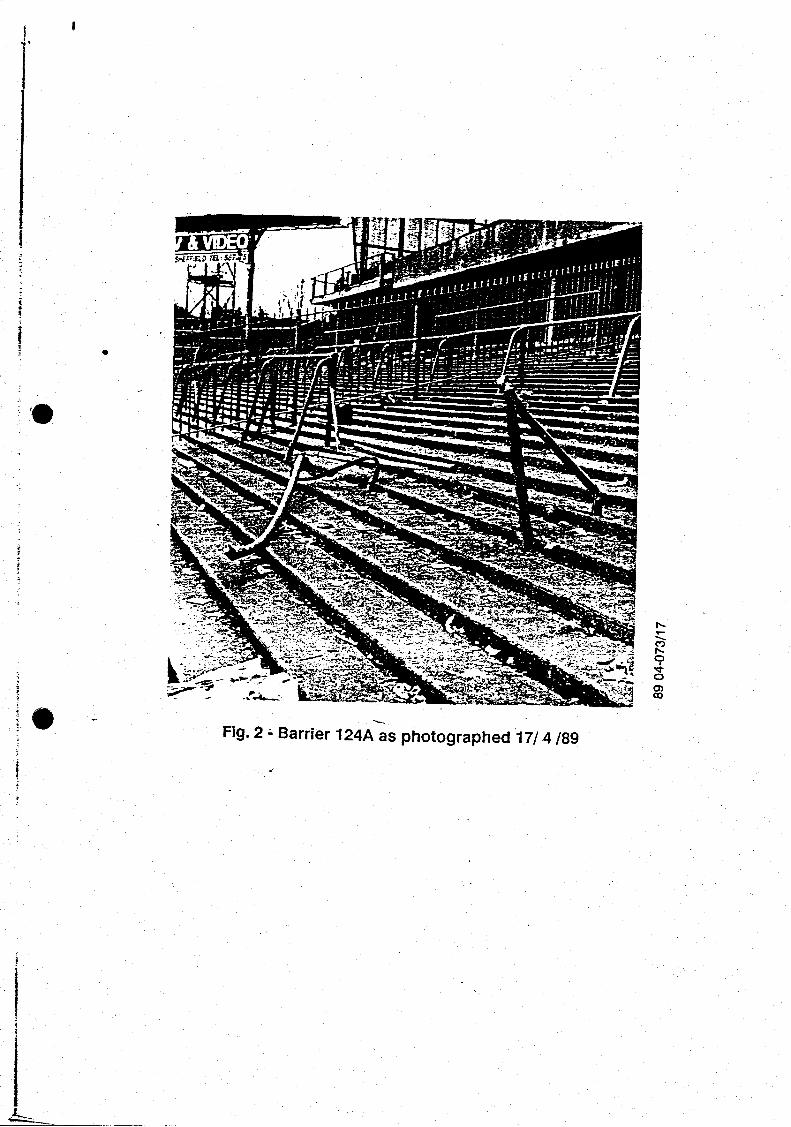
Fig. 2 - Barrier 124A as photographed 17/4 /89
tr
89
04
-07
3/1
7

PE
OP
LE
1000
. 20
00.
3000
. 40
00.
5000
. 60
00.
7000
.
!rSTART
OF i DATA DATA
2.00pmo
135. 120. 105. 90. 75. 60. 45. 30. 15. 0. 15.
FIG, 3
TIME RELATIVE TO 3.00pm (MINS)
TOTAL NUMBER OF PEOPLE EMERGING EROM TURNSTILES A to G
PEO
PLE
per
HOUR
pe
r TU
RN
STI
LE
.■ r > l . : •H.-’WTf-1'
%START END
DATA DATA
CO
CM
1.00pm 2.00pm 3.00pm
-1 3 5 . - 120. 105. 90. •75. -6 0 .
TIME RELATIVE TO 3.00pm (MINS)
45. -3 0 . 15.
FIG. 4 MEAN RATE OF PEOPLE EMERGING FROM TURNSTILES A to G

TIME in seconds
FIG. 5 NUMBER OF PEOPLE EMERGING FROM GATE 'C* AT THE "SECOND OPENING"
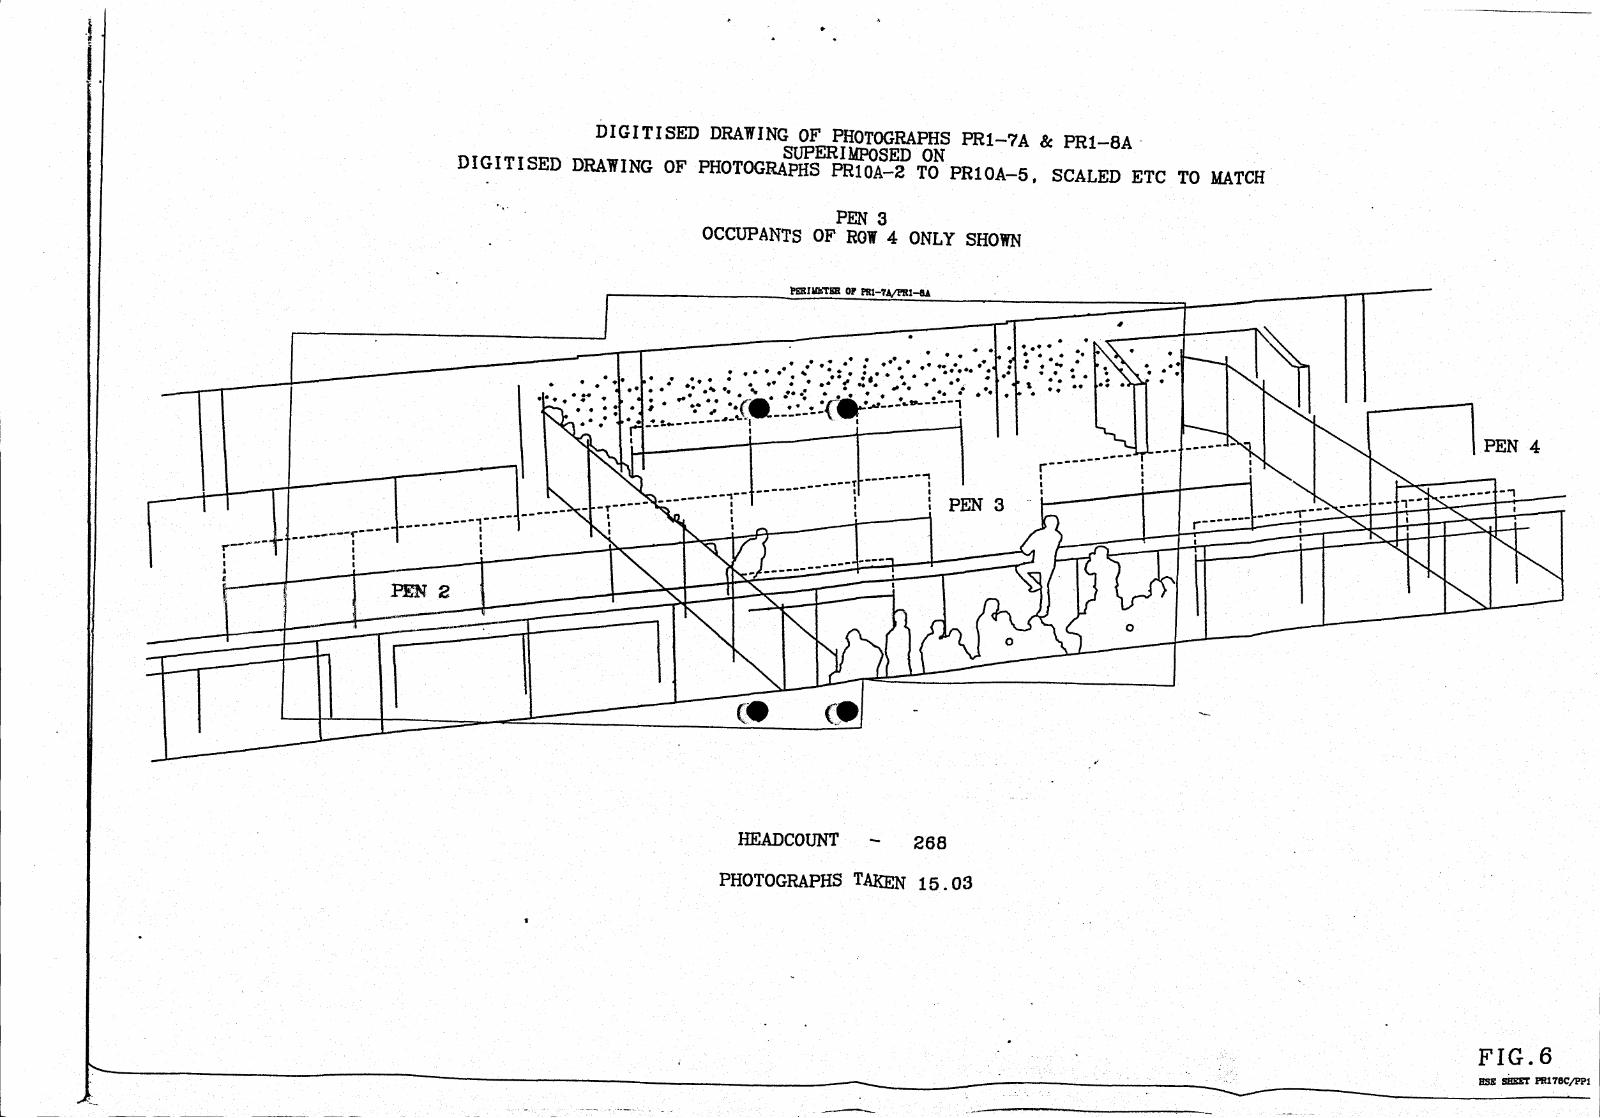
DIGITISED DRAWING OF PHOTOGRAPHS PR1-7A & PR1-8A
DIGITISED DRAWING OF PHOTOGRAPHS*3f S ? T o W o A —5, SCALED ETC TO MATCH
PEN 3OCCUPANTS OF ROW 4 ONLY SHOWN
frSSIMHTEB OP FBI—74/PB1—8A
:• •
PEN 4r"
--T
PEN 3
r— "
PEN 2
HEADCOUNT - 268
PHOTOGRAPHS TAKEN 15.03
F I G . 6ESS SHEET PR17BC/PP1

DIGITISED DRAWING of PHOTOGRAPHS PR1-7A & PR1-8ASUPERIMPOSED ON
DIGITISED DRAWING OF PHOTOGRAPHS PR10A-2 TO PR10A-5, SCALED ETC TO MATCH
PEN 3OCCUPANTS OF ROW 2 ONLY SHOWN
(NB ESTIMATED CROWD - 118 OCCUPANTS — SHOWN HATCHED)
f « (•-
PEN 4PEN 3
r "
PEN 2
HEADCOUNT - 409
PHOTOGRAPHS TAKEN 15.03
A.
F I G . 8HSK SHEET PH17BE/FP1131

4
DIGITISED DRAWING OF PHOTOGRAPHS PR1-7A & PR1-8A
S C S La) m ^«. ' , 'i
PEN 3 A(NB F S T T H fA T ^ S ^ 3 ° F R0W 3 0NLY SH0*N(NB ESTIMATED CROWD - 60 OCCUPANTS - SHOWN HATCHED)
pkbiukt.sh or pa-7i/psi-aA
PEN 4
\1
HEADCOUNT - 382
PHOTOGRAPHS TAKEN 15.03
F I G . 7HSE SHEET P3178D/F
f
65 w
— a. m n>
lumsfne / — ■Designations TumsiHe Labels
TE RRAC F STANDINGo v V / / /
M W /'/ / STAND , SEATS \C> A I E f
y* ■ i jo
V71ff0 GATE
AV-73V

•. r, c x d e n T, i. [ J G o 3 3 9 CJ O P93 i A L. i_ 0 0 A 1 E ACT I ON PK i. N S
A C i i O iM O :V1 y C. K 1 A o ' Y U
0 R 1 6 1 N A T 1 N G r 9 u ; L) 1 6 6 D "i o 7 0 : fc 3
, M i'’J N f c . O A C i j. O N
0 H 3 C N O i C 9 3 E i 7 ' b K i - - . 3 - I N A T 3 3 O h N O ' 3 £ • ’, : t K i K ' a C i A i c.
f ' H I S A C T I O N b l - ' A r t . O r ■ A b K > - 3 .
U3~03'-~9G 15 ;7 OP 90 H AI3 3 u -90M D"66 0167 013806-06-90 '1433 0^90-: A0 1 10N UPDATE ■-•• AC TION 7tX r ADDEO
] i- N. 3 A 0 ION 1 3 P AH": 0 r T A 3 K "!U 6 - 0 6 - 9 U ' : O 3 0 0 9 9 3 7 A i _ i _ O C A T f c . D
0 K I G 1 N A : I N G I- K 0 r : i 3 1 6 3
A b i d O ’ 0 1 A : r. ....
__ i T i:::. "0 A 0 ' ) 1 0 " 3 A o " /
1.0 : 3 7 D 1 3 3
A i : ; T 1
.EVEra
~ ~ C 3
I n c i d e n t 1 C 5 0 6 0 6 9 0 u H V j I
A C V I ON. i T u M E E R i A f c T r l
O G I G I i'-'i A T - « G r r i i ) h ; D i 6 6
A L L O C A l ' E A C T I G G
Dl6:
N A T 1. . R E OF’ A C i .1 .0 ^
C n E C K >40''. E S 1 0 : T I L E . R E N O S E rG ! ,~R I G G G A "I G 0
C H E C K ’ N O r E S T O C G O i N C I L 5 T , : L E a N D O T H E R R E T O R T S R E T v R B E R S E N T E E V . , .
T H I S A C T I O N -i. 7 P A R T O f T A S K 3 - (>'. \X4 , ^ - C . ^
0 i , _ u 6 _ c , 0 -;.,.2 E oh931 RAISGL r KOn D166 DIG? D16S0 6 —D 6 - - 9 G ' >V;T *, O P 9 3 " ; A C T I O N U P D A T E A C ' I Or-- ; E a ; A u U fc .L ;
" H I S A C T j . O T I S R a R " I O T T A S K
0 6 - L i 6 T O l - o G O R 9 3 1
Clr-i ; L.. 0
... R 1. u ... :V ■
f- i CH-^ A v y,
E -
.. G i'v
A u l . 0 0 A T EG T O GT G L ^ V ; - 'T ..E V
IT ■: 6 6 L; i> T G C:.G
/' l/
~T
:'' A O