Embed Size (px)
Citation preview

INITIATE COVERAGE Tuesday, 2 April 2014
FBM KLCI: 1847.76
Sector: Property
MENARA TA ONE, 22 JALAN P. RAMLEE, 50250 KUALA LUMPUR, MALAYSIA TEL: +603-20721277 / FAX: +603-20325048
Page 1 of 16
TA SecuritiesA Member of the TA Group
Sentoria Group Bhd TP: RM1.20 (+31.1%) Splashing Out Fun Days Across Malaysia Last Traded: RM0.92 THIS REPORT IS STRICTLY FOR INTERNAL CIRCULATION ONLY* Buy
Thiam Chiann Wen Tel: +603-2167 9615 [email protected] www.taonline.com.my
2013 was an eventful year for Sentoria as it has proposed two massive
integrated resort cities in Morib and Kuching. The group should see busy
years ahead given Bandar Samariang and Morib Bay will commence in
2014 and 2015 respectively. We like Sentoria' synergistic business model,
which allows it to enjoy earnings upside from property development and at
the same time benefiting from its strong cash-generating leisure and
hospitality business. We initiate coverage on Sentoria with a Buy
recommendation. Target price of RM1.20/share is based on sum-of-part
valuation, representing an attractive capital upside of 31.1%
Sentoria Group Berhad (Sentoria) is operating in two business divisions,
namely 1) property development and 2) leisure and hospitality. The group has
around 1,500 acres of undeveloped landbank with estimated GDV of RM6.6bn.
On the other hand, the group’s leisure and hospitality operation consists of two
theme parks and two resorts within Bukit Gambang Resort City.
The group was co-founded by Dato’ Chan Kong San and Dato’ Gan Kim Leong in
1999. Collectively holding 62% equity interest in Sentoria, Dato’ Chan and Dato’
Gan are the joint managing director of the group and play an important role in
shaping future direction of the group.
Investment case
1) Bukit Gambang Resort City (BGRC) receives strong local supports;
2) Replicating the success of BGRC in Kuching and Morib;
3) Niche Developer that specialises in building integrated resort.
We expect earnings to grow 3-33% for FY14-16. Our earnings projections are
premised upon the following key assumptions:
• New property sales assumptions of RM240mn- RM390mn for FY14-16, with
a blended EBIT margin of 28-30%
• Theme Park Visitors grew 4-8% YoY for FY14-16, with average spending
per visitor of RM39/41/42 for FY14/15/16 respectively.
• Effective tax rate of 1%, given capex incurred for development of theme
park and resorts in BGRC are tax exempted until 2017.
Earnings Summary (RM mn)
YE Sep 30 2012 2013 2014F 2015F 2016F
Revenue 179.3 207.5 250.9 318.2 416.8
EBITDA 57.1 55.2 74.1 98.9 128.9
EBITDA Margins (%) 31.9 26.6 29.5 31.1 30.9
Pretax profit 49.4 43.8 55.0 72.9 94.3
Net profit 47.8 53.1 54.5 72.2 93.3
Net profit -adj 47.8 53.1 54.5 72.2 93.3
EPS -Adj (sen) 10.9 12.1 12.4 16.4 21.2
EPS Growth (%) 24.0 11.0 2.6 32.5 29.3
PER (x) 8.4 7.6 7.4 5.6 4.3
Gross Div - adj (sen) 1.8 2.0 2.0 2.0 2.0
Div Yield (%) 2.0 2.2 2.2 2.2 2.2
ROE (%) 31.1 23.7 20.1 22.2 23.4
EPS and DPS are adjusted for 1:10 bonus issue completed in FY13
Share Information
Bloomberg Code SNT MK
Stock Name SNTORIA
Stock Code 5211
Listing Main Market
Share Cap (mn) 440.0
Market Cap (RMmn) 402.6
Par Value 0.20
52-wk Hi/Lo (RM) 0.92/0.60
12-mth Avg Daily Vol ('000 shrs) 207.40
Estimated Free Float (%) 22.5
Beta 0.54
Major Shareholders (%)
Sentoria Capital - 62.0
State Secretary Pahang - 10.5
Lembanga Kemajuan Perusaha - 5.0
Forecast Revision
FY14 FY15
Forecast Revision (%) - -
Net profit (RMm) 54.5 72.2
Consensus n.a n.a
TA's / Consensus (%) n.a n.a
Previous Rating
Financial Indicators
FY14 FY15
Net Debt / Equity (%) 40.3 49.7
FCPS (sen) (0.1) (0.1)
Price / CFPS (x) nm nm
ROA (%) 17.1 17.6
NTA/Share (RM) 0.7 0.8
Price/NTA (x) 1.3 1.1
Share Performance (%)
Price Change SNTORIA FBM KLCI
1 mth 7.6 0.7
3 mth 36.6 (0.3)
6 mth 52.5 4.4
12 mth 42.7 9.7
-
(12-Mth) Share Price relative to the FBM KLCI
Source: Bloomberg
2-Apr-14
Page 2 of 16
TA SecuritiesA Member of the TA Group
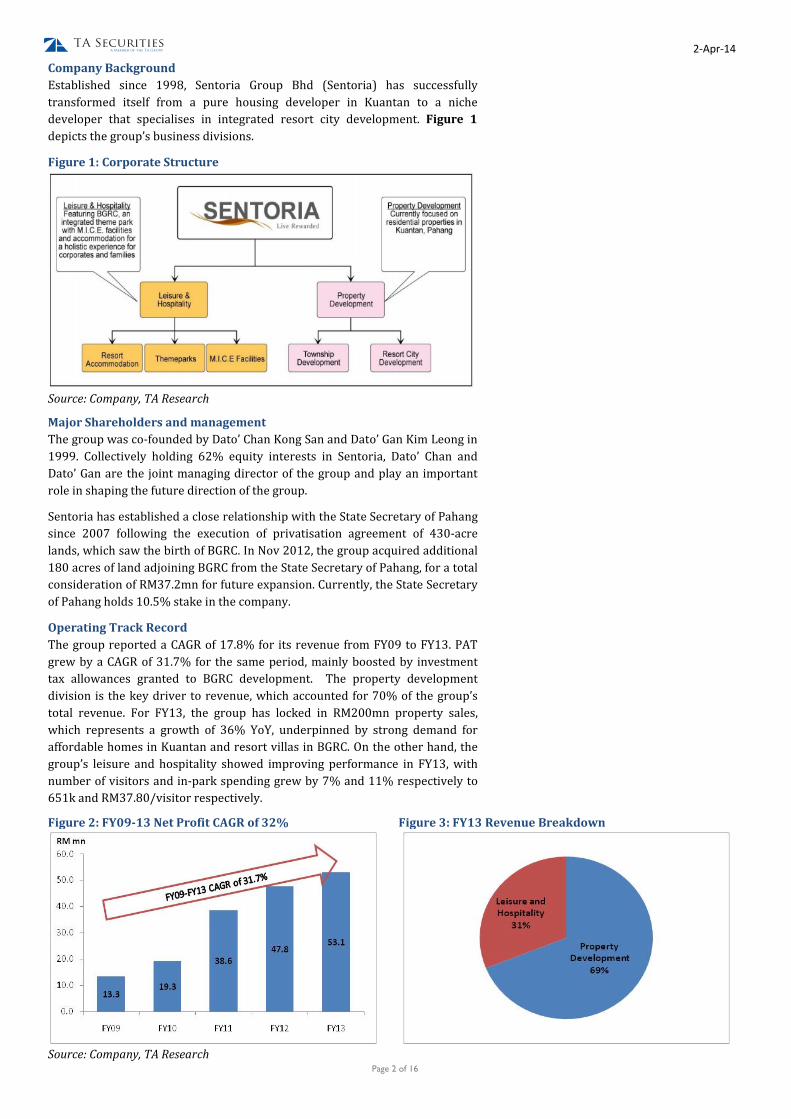
Company Background
Established since 1998, Sentoria Group Bhd (Sentoria) has successfully
transformed itself from a pure housing developer in Kuantan to a niche
developer that specialises in integrated resort city development. Figure 1
depicts the group’s business divisions.
Figure 1: Corporate Structure
Source: Company, TA Research
Major Shareholders and management
The group was co-founded by Dato’ Chan Kong San and Dato’ Gan Kim Leong in
1999. Collectively holding 62% equity interests in Sentoria, Dato’ Chan and
Dato’ Gan are the joint managing director of the group and play an important
role in shaping the future direction of the group.
Sentoria has established a close relationship with the State Secretary of Pahang
since 2007 following the execution of privatisation agreement of 430-acre
lands, which saw the birth of BGRC. In Nov 2012, the group acquired additional
180 acres of land adjoining BGRC from the State Secretary of Pahang, for a total
consideration of RM37.2mn for future expansion. Currently, the State Secretary
of Pahang holds 10.5% stake in the company.
Operating Track Record
The group reported a CAGR of 17.8% for its revenue from FY09 to FY13. PAT
grew by a CAGR of 31.7% for the same period, mainly boosted by investment
tax allowances granted to BGRC development. The property development
division is the key driver to revenue, which accounted for 70% of the group’s
total revenue. For FY13, the group has locked in RM200mn property sales,
which represents a growth of 36% YoY, underpinned by strong demand for
affordable homes in Kuantan and resort villas in BGRC. On the other hand, the
group’s leisure and hospitality showed improving performance in FY13, with
number of visitors and in-park spending grew by 7% and 11% respectively to
651k and RM37.80/visitor respectively.
Figure 2: FY09-13 Net Profit CAGR of 32%
Figure 3: FY13 Revenue Breakdown
Source: Company, TA Research

2-Apr-14
Page 3 of 16
TA SecuritiesA Member of the TA Group
Investment Merits
1) Bukit Gambang Resort City (BGRC) receives strong local supports
BGRC is Gaining Popularity
Although Sentoria has a relatively short operating history in the leisure and
hospitality business, its 727-acre BGRC has been growing by leaps and bounds
in recent years. We believe BGRC, which features water, adventure, nature and
wildlife; has various elements to draw the crowds and maintain its
attractiveness. Besides, the two resorts within BGRC, i.e. 868-room Arabian Bay
Resort and 998-room Caribbean Bay Resort, which provide convenient
accommodations, also encourage visitors to spend more than a day without
rushing through the theme parks. In addition, BGRC is fully-equipped with
MICE and team-building facilities to accommodate multiple corporate functions
and events simultaneously.
According to management, BGRC witnessed increasing popularity among the
locals since its opening in 2009, attracting more than 600k visitors in 2012
alone, from 525k visitors in 2011. Thanks to rising media coverage of the
company post IPO in 2012 as well as the opening of Safari Park in Mar-2013,
BGRC marked record attendance in 2013, which grew 7% YoY to 651k visitors.
In addition to this, total spending also increased by 11% to RM37.80 per visitor,
mainly driven by higher ancillary revenue from water park equipments rental,
F&B and merchandise sales.
Figure 4: BGRC is Gaining Popularity
Source: Company, TA Research
BGRC receives strong local supports
Being the first and largest premier integrated destination resort in the East
Coast of Peninsular Malaysia; we attribute BGRC’s rising park attendance to
absence of direct competition in the vicinity and overwhelming supports from
the locals. Couple with its reasonable entrance fees, we believe BGRC attracts
frequent day-trippers from neighbouring areas as we opine that visiting water
park is one of the best ways to escape heat and strengthen family relationships,
According to management, foreign tourists make up less than 10% of the total
park attendance.
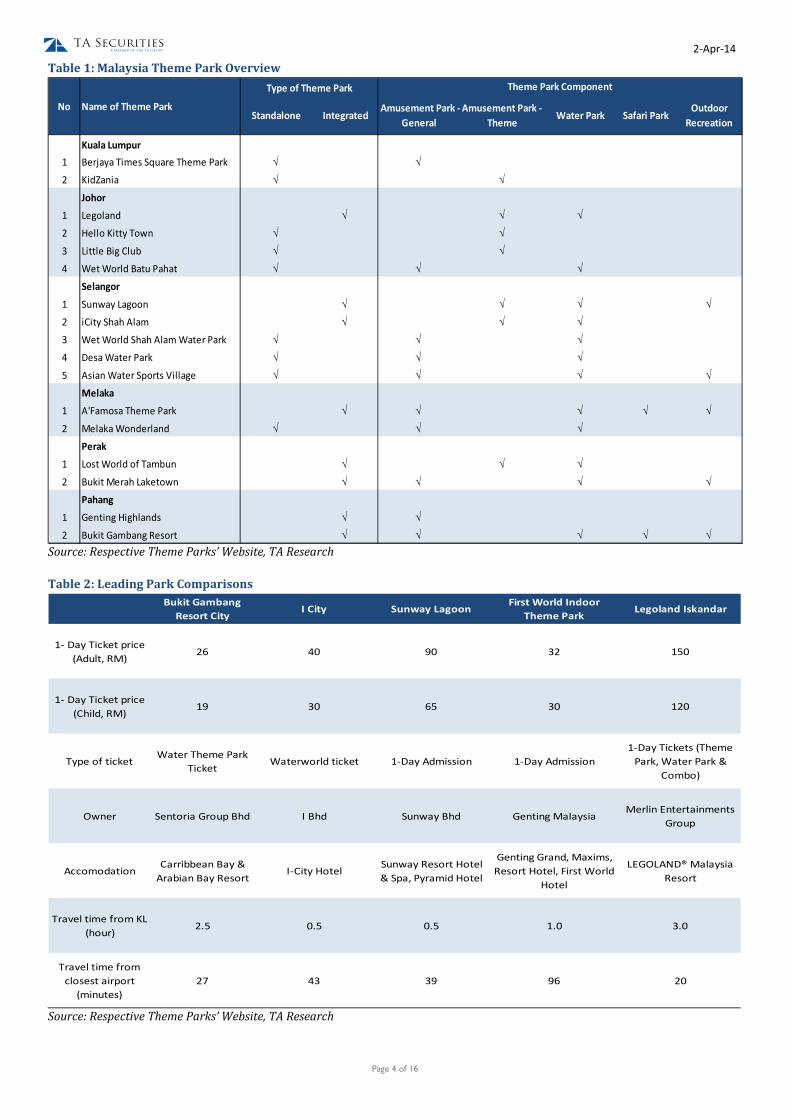
At first glance, the competition in the theme park industry appears stiff given
there are currently 17 leading theme parks in Malaysia; and 12 of these are
water parks with some amusement park and/or outdoor recreation facilities –
see Table 1. However, we do not see BGRC to face direct competition from
other theme parks, given its strategy is to target mainly local visitors by
offering affordable ticket price of RM26 and RM19 for adult and child
respectively. Table 2 shows that BGRC’s reasonable pricing is the trump card
over other leading theme park in Malaysia.
2-Apr-14
Page 4 of 16
TA SecuritiesA Member of the TA Group
Table 1: Malaysia Theme Park Overview
Standalone IntegratedAmusement Park -
General
Amusement Park -
ThemeWater Park Safari Park
Outdoor
Recreation
Kuala Lumpur
1 Berjaya Times Square Theme Park √ √
2 KidZania √ √
Johor
1 Legoland √ √ √
2 Hello Kitty Town √ √
3 Little Big Club √ √
4 Wet World Batu Pahat √ √ √
Selangor
1 Sunway Lagoon √ √ √ √
2 iCity Shah Alam √ √ √
3 Wet World Shah Alam Water Park √ √ √
4 Desa Water Park √ √ √
5 Asian Water Sports Village √ √ √ √
Melaka
1 A'Famosa Theme Park √ √ √ √ √
2 Melaka Wonderland √ √ √
Perak
1 Lost World of Tambun √ √ √
2 Bukit Merah Laketown √ √ √ √
Pahang
1 Genting Highlands √ √
2 Bukit Gambang Resort √ √ √ √ √
Type of Theme Park Theme Park Component
Name of Theme ParkNo
Source: Respective Theme Parks’ Website, TA Research
Table 2: Leading Park Comparisons
Bukit Gambang
Resort CityI City Sunway Lagoon
First World Indoor
Theme ParkLegoland Iskandar
1- Day Ticket price
(Adult, RM)26 40 90 32 150
1- Day Ticket price
(Child, RM)19 30 65 30 120
Type of ticketWater Theme Park
TicketWaterworld ticket 1-Day Admission 1-Day Admission
1-Day Tickets (Theme
Park, Water Park &
Combo)
Owner Sentoria Group Bhd I Bhd Sunway Bhd Genting Malaysia Merlin Entertainments
Group
AccomodationCarribbean Bay &
Arabian Bay ResortI-City Hotel
Sunway Resort Hotel
& Spa, Pyramid Hotel
Genting Grand, Maxims,
Resort Hotel, First World
Hotel
LEGOLAND® Malaysia
Resort
Travel time from KL
(hour)2.5 0.5 0.5 1.0 3.0
Travel time from
closest airport
(minutes)
27 43 39 96 20
Source: Respective Theme Parks’ Website, TA Research

2-Apr-14
Page 5 of 16
TA SecuritiesA Member of the TA Group
2) Replicating BGRC in Morib and Kuching
Aspires to be one of the largest integrated resort city operator in Malaysia,
Sentoria is embarking a growth strategy geared towards national expansion of
its core property development business together with its leisure and hospitality
business. As such, Sentoria’s landbanking focus has been on areas that are
feasible for the development of integrated resort city. In 2013, the group had
inked two agreements to expand its geographical reach into two exciting
markets; Morib, a popular beach in Selangor; and Kuching, a relatively
untapped market. Table 3 summarizes the key highlights of the two resort city
developments.
Table 3: Highlights of Morib Bay RC and Borneo Samariang RC
Morib Bay Resort City Borneo Samariang Resort City
Description JV with Seriemas, Subsidiary of PNB Strategic Land Acqusition from CMSB
Location Morib, Selangor Bandar Samariang, Kuching
Total Land Size (acres) 354 500
Estimated GDV (RM mn) 2600 2000
Resort Development
Total Land Size (acres) 150 200
Estimated GDV (RM mn) 1000 730
Key Components - Resort & Convention Centre - 3 Resorts with MICE facilities
- Boutique hotel -Water Theme Park
- Water Theme Park -Safari Park
- River Safari Park -Brands Village
Time Frame 5 years 8 years
Mixed-Development
Total Land Size (acres) 204 300
Estimated GDV (RM mn) 1600 1270
Residential/Commercial mix 70/30 80/20
Time Frame 10 years 10 years
Expected commenced date 4QFY15 4QFY14
Source: Company, Bursa Malaysia, TA Research
Ambitious but Realisable Growth Strategy
A small company with market cap of below RM500mn, the expansion strategy
is ambitious but realisable, in our opinion, and by 2025 Sentoria will set to be
one of the largest integrated resorts operators in Malaysia. We expect Morib
Bay and Borneo Samariang to replicate the success of BGRC or could possibly
do better than BGRC, owing to its huge target market in the areas with little
direct competition. To further compound this, the low land costs and
investment outlays could help to lift profit higher.
Although BGRC serves mainly the local tourists, it has been demonstrating
impressive growth in terms of park attendance and average revenue per
visitors. As such, we believe that suitable location is important to resort city
development. Based on population census 2010, we estimate there is a ready
catchment of 7.9mn people surrounding Morib Bay, if we take into account
population from Kuala Lumpur, Selangor, and Negeri Sembilan, whereas
Borneo Samariang should be able to serve the 2.5mn population from Sarawak,
or to be specific 620k people from Kuching. In view of the higher household
income level of the catchment surrounding Morib Bay and Borneo Samariang
compared to BGRC, we believe the prospect of these two developments is
bright.

2-Apr-14
Page 6 of 16
TA SecuritiesA Member of the TA Group
Table 4: BGRC, Morib Bay and Borneo Samariang comparison
Bukit
GambangMorib Bay
Borneo
Samariang
Estimated Catchment (mn) 2.6 7.8 2.5
No of Household (mn) 0.6 2.0 0.5
Estimated Mean
Household Income(RM '000) 3.9 7.7 4.3
Hotel with > 300 rooms (number) 14 62 5
Source: Company, Bursa Malaysia, TA Research
We gather that Sentoria’s involvement in Morib Bay and Borneo Samariang was
by special invitation from the respective land owners. While BGRC has received
strong supports from the State Secretary of Pahang, Morib Bay and Borneo
Samariang should also get a head start given that they are linked to PNB and
Cahya Mata Sarawak Bhd (CMSB) respectively. First, forming a strong tie with
GLC-linked companies allows Sentoria to secure lands at a very low entry level.
For instance, Sentoria is paying RM3.10psf to PNB, for the 150 acres lands in
Morib Bay. This is a bargain if we compare it with the RM7-19psf that Mah Sing
and S P Setia paid to acquire lands in Bangi, Semenyih and Beranang during
2011-2012. In addition, the payment of land cost for the remaining 204 acres of
lands which are slated for mixed development will be in the form of revenue
sharing of between 10-15%. This would also significantly reduce the risk of
overstretching the group’s balance sheet.
For its Borneo Samariang project, the acquisition price of RM30mn for 300-acre
development lands in Bandar Samariang, which translates to RM2.30 psf is fair,
comparing it with RM2.12 psf that Hock Seng Lee paid to acquire 276-acre
lands in Bandar Samariang back in 2012. Meanwhile, the resort developments
land measuring 200 acres were acquired for RM17mn (or RM1.90psf).
3) Niche Developer that specialises in building integrated resort
Sentoria’s business model is uniquely designed to commence its theme park
and property development concurrently, in which the theme park and resort
operation will generate stable recurring income whereas the property
development will provide earnings growth opportunities. This business model
could also minimize earnings risks during cyclical downturn of property
development.
The group has around 1,500 acres of undeveloped landbank with an estimated
GDV of RM6.6bn – see Figure 5 and 6. Currently, the group’s on-going
developments are mainly the 400-acre remaining landbank in Pahang which
has an outstanding GDV of RM600mn. Figure 7 and 8 show Sentoria’s high-
involvement in resort development. According to development plans, the group
will sell RM400mn and RM490mn worth of resort villas within Morib Bay and
Borneo Samariang respectively, under a sale-and-leaseback arrangement. We
view the sale-and-leaseback arrangements augur well for Sentoria as it
improves the balance sheet while retaining control of the resort villas for
accommodations of theme parks guests.

2-Apr-14
Page 7 of 16
TA SecuritiesA Member of the TA Group
Figure 5: 1,500 acres landbank across 3 States
Figure 6: RM6.6bn GDV to last the group till 2025
Figure 7: Remaining Landbank breakdown by segment
Figure 8: Outstanding GDV breakdown by segment
Source: Company, TA Research
Sale of affordable homes and resort villas drive sales
Sentoria’s FY13 property sales grew 36% YoY to RM200mn from FY12’s
RM147mn, driven by strong demand for affordable housing in Kuantan and
resort villas in BGRC. Currently, the group has lined-up projects worth
RM690mn within Kuantan and Gambang, Pahang for FY14-16. Of these, we
expect the group’s latest affordable housing project in Gambang with an
estimated GDV of RM160mn to be well-received. Spanning over 80 acres land
near Bukit Gambang Resort City, this new project, to be named Taman Bukit
Gambang, is expected to be launched in 2HFY14.
Future property sales are expected to rise further, driven by maiden launch of
its mixed development in Borneo Samariang and Morib Bay in end FY14 and
FY15 respectively. According to development plans, Phase 1 of Borneo
Samariang and Morib Bay comprises mainly affordable homes and resort villas.
We estimate these two projects to collectively generate RM150-200mn of new
property sales in FY15 and FY16, with a profit margin of 25-30%.

2-Apr-14
Page 8 of 16
TA SecuritiesA Member of the TA Group
Figure 9 : Sentoria’s New Property Sales
Source: Company, TA Research
Financial Review and Outlook
In FY13, the group achieved net profit growth of 11% YoY to RM53.1mn on the
back of 16% growth in revenue. Gross margin contracted 6.5ppt YoY, mainly to
due to high start-up costs incurred for Arabian Bay Resorts which was opened
in 4Q12.
The property development division remains as the key driver to revenue – see
Figure 10. Nonetheless, the group expects contribution from the leisure and
hospitality segment to have an equal revenue contribution with property
development division by 2020, when BGRC is fully developed.
Figure 10: Historical Financial Performance
Source: Company, TA Research
1QFY14 Results hit by Flood
In 1QFY14, Sentoria’s revenue grew 10% to RM47.6mn driven by higher
contribution from the property development division (+46% YoY). However,
this was offset by lower revenue recorded from leisure and hospitality division
as park attendance was affected by the flood that struck the East Coast Region
in Dec-13. Meanwhile, the increase in revenue has failed to filter down to PBT,
which saw 1QFY14 PBT decreased 26% YoY to RM7.5mn, due to higher
depreciation and finance expenses of the leisure and hospitality division.

2-Apr-14
Page 9 of 16
TA SecuritiesA Member of the TA Group
Earnings Outlook
We expect earnings to grow 3-33% for FY14-16. Our earnings projections are
premised upon the following key assumptions:
Leisure and Hospitality
1) Number of visitors to theme park to increase by 4-8% pa in FY14 - 16 (from
600k annual visitors currently) respectively driven by the opening of safari
park and Visit Malaysia Year 2014.
2) Average revenue per visitor to increase to RM39-RM42 for FY14 - FY16
respectively (vs RM38/visitor currently)
3) Total 1,866 hotel rooms: average room rate of RM300/night and occupancy
rates of 23-24% in FY14-16.
Property development
1) New property sales assumptions of RM240mn- RM390mn for FY14-16, with
a blended EBIT margin of 28-30%
2) Unbilled sales of RM164mn as at Sep-13, representing 1.1x FY13 property
revenue.
Net Gearing to rise to 0.64x in FY16
We estimate the group’s capital commitment for theme parks and resorts
development to amount to RM640mn, of which RM240mn allocated for Borneo
Samariang RC, RM200mn each for Morib Bay RC and BGRC. Recently, Sentoria
Group Bhd has received the approval from the Securities Commission (SC) to
issue up to RM120mn in nominal value of medium-term note (MTN) to partly
finance the capex requirement for its leisure and hospitality operations.
Sentoria’s net gearing is expected to peak at 0.64x in FY16, from 0.31x in FY13,
after it fully draw down the MTN with additional borrowings to fund the capex
for theme park. Nevertheless, we believe the impact to cash flow is insignificant
as we expect it continue to generate strong operating cash flows from its on-
going property development, and recurring income from theme park ticket
sales, food and merchandise sales. In our earnings model, we expect the group
to turn FCF positive in FY18, supported by higher visitor spending, as well as
progressive billings from its property development divisions.
Minimal tax payment until 2017
We have assumed an effective tax rate of 1%, given its leisure and hospitality
subsidiary is entitled for a tax exemption of an amount equivalent to 100% of
capex incurred from 2008 to 2017. According to the group’s FY13 annual
report, its unutilised tax allowances which can be carried forward to offset
against future taxable profit amounted to approximately RM203.8mn.
Expect Token Payout
While Sentoria does not have a formal dividend policy, the group has been
paying dividend of 2sen/share for past two financial years. Although the group
has huge capex commitment over the next 5 years, Sentoria has indicated its
intention to continue paying dividend to shareholders. In our earnings
forecasts, we have assumed a 2.0sen DPS in FY14-16, translating into 2.2%
yield.
Risks
Project concentration risks: High concentrated risks drawing from its
exposure to the state of development of Pahang. Note that property
development in Kuantan and BGRC are the major contributors to Sentoria’s
earnings. However, this risk will be diversified when Kuching and Morib
projects come on stream from FY15 onwards.

2-Apr-14
Page 10 of 16
TA SecuritiesA Member of the TA Group
Future earnings could be affected by competition amongst amusement
parks: There are currently 17 leading theme parks in Malaysia; 12 of these are
water parks with some amusement park and/or outdoor recreation facilities.
All of these theme parks are located in Peninsular Malaysia. Sentoria’s BGRC
and the upcoming Morib Bay RC and Borneo Samariang RC are classified as
integrated theme park which incorporates a hotel or other forms of
accommodation to accommodate guest. We believe Sentoria’s theme parks
have an edge over its competitors given its reasonable ticket pricing and
affordable room rates.
Valuation
We initiate coverage on Sentoria Group Bhd with a Buy recommendation. We
arrive at a target price of RM1.20/share, based on SOP valuation – see Table 5.
This represents an attractive capital upside of 31%. For property division, we
value it based on 7x CY15 EPS, in line with our target PER for small cap
developers. Pegging a 55% discount to the average PER of global peers which
operates in the theme park industry, we value Sentoria’s leisure and hospital
business based on 10x CY15 EPS. Our target price is at a 38% discount to the
group’s fully-diluted RNAV of RM1.95/share – see Table 8. There could be
further upside to RNAV as we have conservatively assumed a 70% take up rate
for properties in Morib Bay RC and Borneo Samariang RC.
Earnings Summary
YE Sep 30 2012 2013 2014F 2015F 2016F
Revenue 179.3 207.5 250.9 318.2 416.8
EBITDA 57.1 55.2 74.1 98.9 128.9
EBITDA Margins (%) 31.9 26.6 29.5 31.1 30.9
Pretax profit 49.4 43.8 55.0 72.9 94.3
Net profit 47.8 53.1 54.5 72.2 93.3
Net profit -adj 47.8 53.1 54.5 72.2 93.3
EPS -Adj (sen) 10.9 12.1 12.4 16.4 21.2
EPS Growth (%) 24.0 11.0 2.6 32.5 29.3
PER (x) 8.4 7.6 7.4 5.6 4.3
Gross Div - adj (sen) 1.8 2.0 2.0 2.0 2.0
Div Yield (%) 2.0 2.2 2.2 2.2 2.2
ROE (%) 31.1 23.7 20.1 22.2 23.4
Table 5: SOP Valuation
SegmentsCY15 Net
Profit
Target CY15
PER Value Value/share Remarks
(RM mn) (x) (RM mn) (RM)
Property 65.2 7 456.3 1.04 Target PER for small cap developer
Leisure 12.3 10 123.5 0.28 55% discount to global peers PER average of 22x
77.5 579.7 1.32
Warrant Proceeds 52.8 - 88 mn warrant @ RM0.60
Total 632.5 1.20

2-Apr-14
Page 11 of 16
TA SecuritiesA Member of the TA Group
Table 6: Local Property Developer Comparisons
Company Price Target price
Call (RM) (RM) CY14 CY15 CY14 CY15 FY14 FY15 FY14 FY15
SP Setia Hold 2.93 3.20 10.5 29.8 15.4 11.9 7.9 9.8 3.9 4.1
Sunway Buy 2.98 3.85 8.4 6.9 9.8 9.2 9.5 9.6 3.9 4.0
Mah Sing Buy 2.20 2.55 20.1 20.7 9.2 7.6 16.3 17.4 4.3 5.0
IOIPG Buy 2.68 4.40 24.9 30.7 12.4 9.5 7.6 9.2 2.2 3.0
Glomac Hold 1.08 1.15 1.9 6.3 7.0 6.6 13.8 12.2 5.6 5.6
Crescendo Hold 3.00 3.20 12.2 15.0 7.5 6.6 18.4 12.1 5.3 5.3
Hua Yang Hold 1.76 1.93 22.8 17.3 5.4 4.6 19.1 21.3 5.7 6.3
Sentoria Buy 0.92 1.20 10.2 31.5 6.8 5.2 20.2 22.4 2.2 2.2
Sector (Simple Average) 13.9 19.8 9.2 7.6 14.1 14.3 4.1 4.4
Sector (Market Weighted) 16.0 23.3 11.9 9.6 9.9 11.0 3.5 3.9
Big/Medium cap 16.0 22.0 11.7 9.5 10.3 11.5 3.6 4.0
Small Cap 11.8 17.5 6.7 5.7 17.9 17.0 4.7 4.8
Peer Comparison
EPS growth (%) ROE (%) Div Yield (%)PER (x)
Table 7: Global Theme Park Operators Comparisons
Price Market Cap
(Local Cur) (USD bn) FY14 FY15 FY14 FY15 FY14 FY15 FY14 FY15
Sentoria 0.9 RM 0.1 2.6 32.5 7.4 5.6 1.4 1.1 2.2 2.2
Merlin Entertainments 375.0 GBP 6.3 0.0 10.1 22.2 20.2 3.5 3.2 1.4 1.7
Six Flags Entertainment 40.5 USD 3.8 25.0 6.2 27.7 26.1 7.9 7.3 4.7 5.1
Seaworld Entertainment 30.2 USD 2.8 20.5 22.7 21.8 17.8 3.8 3.3 2.7 2.9
Oriental Land Co 15630.0 JPY 13.9 35.3 -14.1 18.7 21.8 2.7 2.4 0.8 0.8
Cedar Fair 50.9 USD 2.8 37.2 17.1 16.4 14.0 18.3 16.8 5.5 6.1
Hangzhou Sung Cheng Tourism 25.4 CHY 2.3 28.9 25.0 35.8 28.6 4.1 3.7 0.5 0.8
Average (ex- Sentoria) 24.5 11.1 23.8 21.4 6.7 6.1 2.6 2.9
Earnings growth (%) PER (x) P/B (x) Div Yield (%)Company
Table 8: RNAV Table
Property Remaining GDV (RM mn) NPV (RM mn)
Taman Bukit Rangin 2 @ Kuantan 70 10.61
Global Heritage @ BGRC 30 6.52
Taman Salak Maju @ Salak Tinggi 12 1.68
Taman Bukit Gambang 160 18.77
Bukit Gambang Resort City 1000 51.86
Morib Bay Resort City 2000 75.68
Borneo Samariang Resort City 1740 104.99
Current unbilled sales 164 39.40
Total Property 309.50
Theme Park DCF (RM mn)
Bukit Gambang Resort City 157.28
Morib Bay Resort City 120.99
Borneo Samariang Resort City 142.16
Total Theme Park 420.43
Total shareholders' funds 248.27
RNAV 978.20
No of share (mn) 440.00
RNAV/share (RM) 2.22
Proceeds from warrant conversions 52.80
Enlarged RNAV 1031.00
Fully diluted no of shares (mn) 528.00
Fully diluted RNAV/share (RM) 1.95

2-Apr-14
Page 12 of 16
TA SecuritiesA Member of the TA Group
Profit & Loss (RMm) Balance Sheet (RMm)
YE Sep 30 2012 2013 2014f 2015f 2016f YE Sep 30 2012 2013 2014f 2015f 2016f
Revenue 179.3 207.5 250.9 318.2 416.8 PPE 157.6 218.9 276.5 380.5 494.4
EBITDA 57.1 55.2 74.1 98.9 128.9 Investment Properties 7.6 8.2 9.2 10.2 11.2
Dep. & amortisation (5.4) (8.0) (13.4) (18.1) (24.1) Others 30.0 53.6 71.7 72.7 94.0
Net finance cost (2.3) (3.4) (5.7) (7.9) (10.6) Total Non Current Assets 195.2 280.6 357.3 463.4 599.5
PBT 49.4 43.8 55.0 72.9 94.3 Trade Receivables 74.9 123.2 149.0 188.9 247.4
Taxation (1.6) 9.3 (0.6) (0.7) (0.9) Inventories 5.5 7.1 8.5 10.8 14.2
MI 0.0 0.0 0.0 0.0 0.0 Cash 18.9 6.2 19.6 15.5 4.8
Reported Net profit 47.8 53.1 54.5 72.2 93.3 Others 27.7 42.0 50.7 64.1 83.8
Core net profit 47.8 53.1 54.5 72.2 93.3 Current Assets 127.0 178.5 227.8 279.3 350.2
Core EPS (sen) 10.9 12.1 12.4 16.4 21.2
GDPS (sen) 1.8 2.0 2.0 2.0 2.0 Total assets 322.2 459.1 585.1 742.7 949.7
Div Yield (%) 2.0 2.2 2.2 2.2 2.2
ST debt 15.1 24.9 29.9 34.9 39.9
Cash Flow (RMm) Trade Payables 64.6 120.9 146.3 185.5 242.9
YE Sep 30 2012 2013 2014f 2015f 2016f Other current liabilities 13.1 6.7 6.7 6.7 6.7
PBT 49.4 43.8 55.0 72.9 94.3 Current Liabilities 92.8 152.5 182.8 227.0 289.5
Adjustments 1.8 (1.0) 5.7 7.9 10.6 Shareholders' funds 199.4 248.3 294.0 357.4 441.9
Dep. & amortisation 5.4 8.0 13.4 18.1 24.1 MI 0.2 0.2 0.2 0.2 0.2
Changes in WC (6.7) (10.6) (16.8) (25.1) (35.6) Total long term Liabilities 29.8 58.1 108.1 158.1 218.1
Operational cash flow 50.0 40.2 57.2 73.8 93.3
Capex (65.7) (74.3) (90.1) (124.1) (160.2) Total Equity and Liabilities 322.2 459.1 585.1 742.7 949.7
Others (0.2) 7.1 0.0 0.0 0.0
Investment cash flow (65.8) (67.2) (90.1) (124.1) (160.2)
Debt raised/(repaid) (7.9) 29.3 55.0 55.0 65.0
Equity raised(repaid) 0.0 0.0 0.0 0.0 0.0 Ratio
Dividend (4.0) (4.0) (8.8) (8.8) (8.8) YE Sep 30 2012 2013 2014f 2015f 2016f
Others 46.9 (0.5) 0.0 0.0 0.0 EPS Growth (%) 24.0 11.0 2.6 32.5 29.3
Financial cash flow 35.1 24.8 46.2 46.2 56.2 PER (x) 8.4 7.6 7.4 5.6 4.3
Net cash flow 19.2 (2.2) 13.3 (4.1) (10.7) GDPS (sen) 1.8 2.0 2.0 2.0 2.0
Div Yield (%) 2.0 2.2 2.2 2.2 2.2
Assumptions Net Debt/ (Net cash) (RMm) (26.0) (76.8) (118.5) (177.6) (253.2)
YE Sep 30 2012 2013 2014f 2015f 2016f Net gearing (x) 0.1 0.3 0.4 0.5 0.6
New Sales (RM mn) 147 200 240 302 390 ROE (%) 31.1 23.7 20.1 22.2 23.4
Prop Dev Margins (%) 60 59 54 54 54 ROA (%) 30.4 22.3 17.1 17.6 17.6
No of Visitors ('000) 610 651 700 736 762 NTA/share (RM) 0.5 0.6 0.7 0.8 1.0
Revenue/Visitor (RM) 34 38 39 41 42 P/NTA (x) 2.0 1.6 1.4 1.1 0.9

2-Apr-14
Page 13 of 16
TA SecuritiesA Member of the TA Group
Appendix 1: Overview of Bukit Gambang Resort City
Sentoria is the developer and operator of Bukit Gambang Resort City (BGRC) in
Kuantan, Pahang. Built on 727 acres of land, BGRC is one of the largest
integrated resort cities with theme park, MICE facilities and accommodation in
Malaysia.
Bukit Gambang Water Park (Bukit Gambang WP)
BGWP spans an area of 45.8 acres, including a 17.1 acre manmade lake. It has
cemented its brand by having Malaysia’s first and only dedicated parent-
toddler tube slide and other signature water attractions which include the 24k
sq ft 8-mode wave pool, 6-lane racer slide, and Glacier River.
Figure 11: Family Raft Ride
Figure 12: 6-lane racer slide
Figure 13: 8-mode wave pool
Source: Company, TA Research
Figure 14: Bukit Gambang Water Park Map

2-Apr-14
Page 14 of 16
TA SecuritiesA Member of the TA Group
Bukit Gambang Safari Park
Bukit Gambang Safari Park (BG Safari Park), the second themed attraction
within BGRC, is opened in Mar-13. Touted as the largest safari park in
Malaysia, it spans over 138 acres of land and features a total of seven dedicated
sections namely Safari Lobby, Simba Hill Plaza, Night Jungle, Foreign Village,
Forest Land, Land of Predators (featuring soon), and Wild Savannah. BG Safari
Park features first and only while lion in Malaysia, and offers visitors an
enchanting dining experience with white lion at Simba Hill Gourmet Hall.
Figure 15: Dining with White Lion
Figure 16: Tram Drive Through Wild Savannah
Source: Company, TA Research
Figure 17: Bukit Gambang Safari Park Map
Aquarium Park and Adventure Land
Aquarium Park and Adventure Land; are the pipeline theme parks to be
featured in BGRC over the next few years – see Figure 19. Aquarium Park will
showcase local fresh water fish and marine wildlife whereas Adventure land
will feature themed amusement park. We expect Aquarium Park and Adventure
Land to commence operation in FY17 and FY20 respectively, which is beyond
our forecast period. However, we have factored in a total capex assumptions of
RM20mn for the construction of Aquarium Park in FY15-16.

2-Apr-14
Page 15 of 16
TA SecuritiesA Member of the TA Group
Figure 18: Bukit Gambang Resort City Existing Components
Figure 19: Bukit Gambang Resort City Master Plan

2-Apr-14
Page 16 of 16
TA SecuritiesA Member of the TA Group
(THIS PAGE IS INTENTIONALLY LEFT BLANK)
Disclaimer
The information in this report has been obtained from sources believed to be reliable. Its accuracy or completeness is not guaranteed and opinions are subject to change without notice. This report is for information only and not to be construed as a solicitation for contracts. We accept no liability for any direct or indirect loss arising from the use of this document. We, our associates, directors, employees may have an interest in the securities and/or companies mentioned herein.
for TA SECURITIES HOLDINGS BERHAD (14948-M)
MENARA TA ONE, 22 JALAN P. RAMLEE, 50250 KUALA LUMPUR, MALAYSIA TEL: +603-20721277 / FAX: +603-20325048
(A Participating Organisation of Bursa Malaysia Securities Berhad)
Kaladher Govindan – Head of Research