Embed Size (px)
Citation preview

Fort Bend ISD Compensation System Review
April 1, 2013
Amy CampbellTASB HR Services
Agenda• Project Activities and Timeline• Understanding Pay Systems and Market Data• Current FBISD Pay Characteristics• Market Summary• Major Recommendations• Stipend Findings and Recommendations• Cost Estimates• Pay Comparisons – Before and After
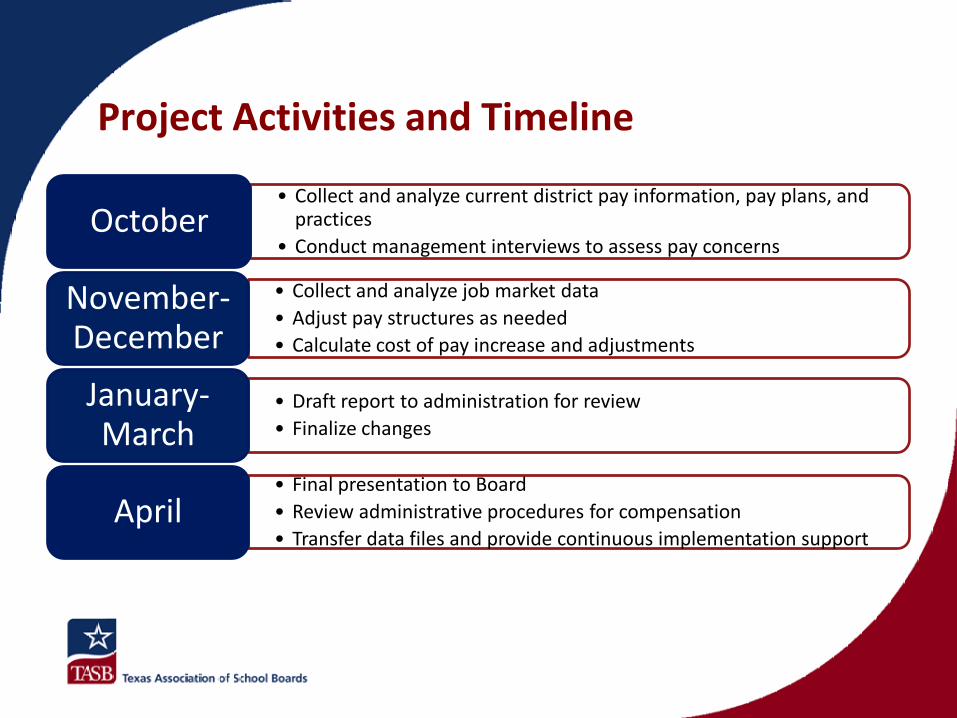
Project Activities and Timeline
• Collect and analyze current district pay information, pay plans, and practices
• Conduct management interviews to assess pay concernsOctober
• Collect and analyze job market data• Adjust pay structures as needed• Calculate cost of pay increase and adjustments
November-December
• Draft report to administration for review• Finalize changes
January-March
• Final presentation to Board• Review administrative procedures for compensation• Transfer data files and provide continuous implementation support
April
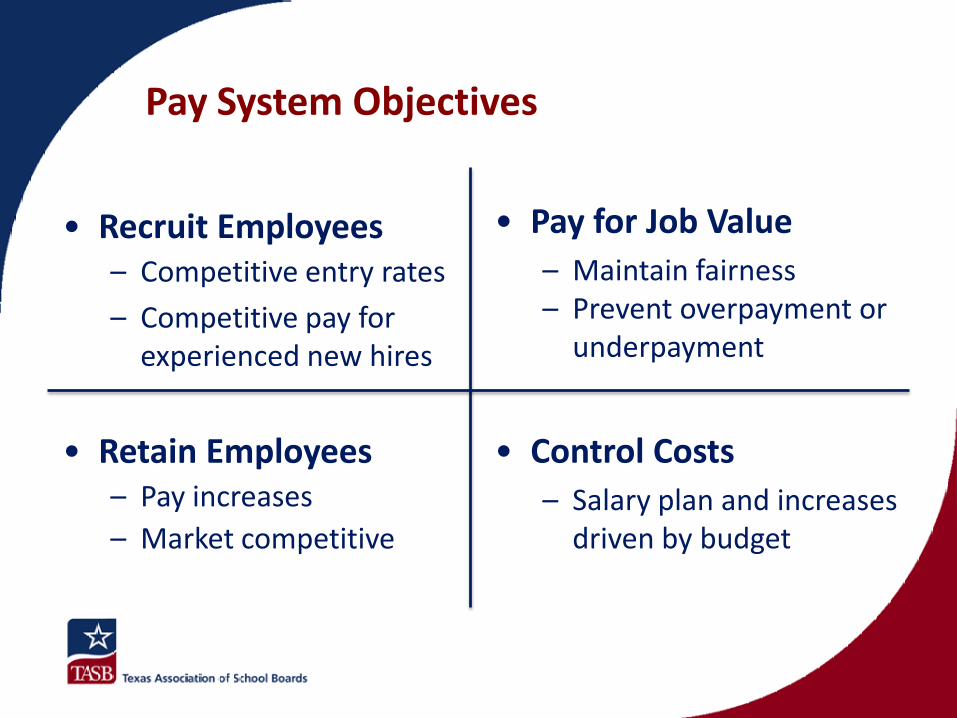
Pay System Objectives
• Recruit Employees– Competitive entry rates
– Competitive pay for experienced new hires
• Retain Employees– Pay increases– Market competitive
• Pay for Job Value– Maintain fairness– Prevent overpayment or
underpayment
• Control Costs– Salary plan and increases
driven by budget
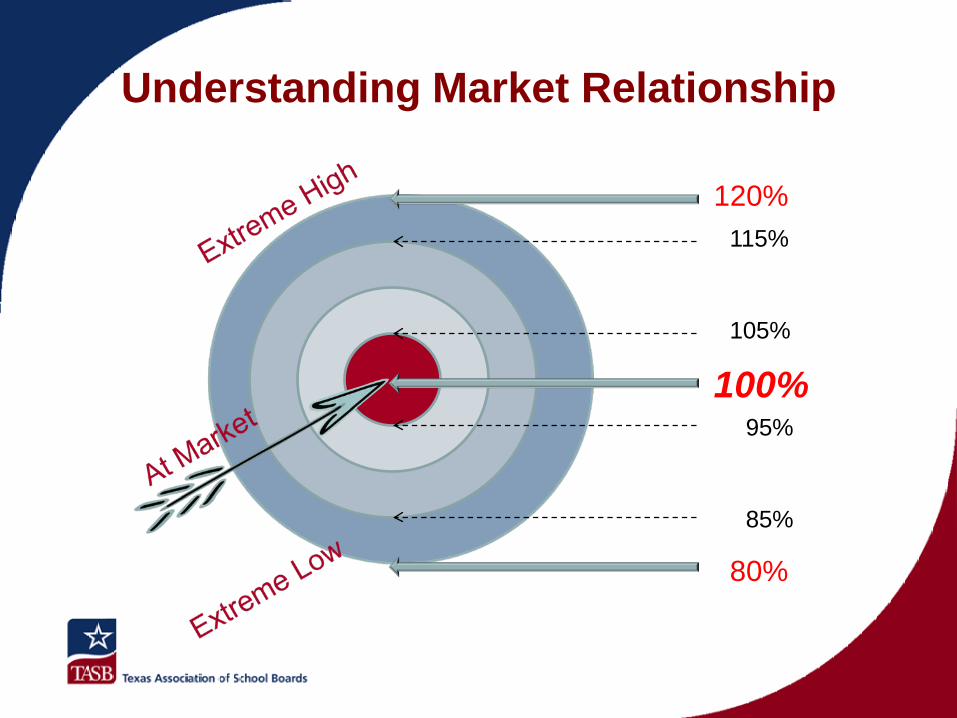
Understanding Market Relationship
100%105%
115%
120%
95%
85%
80%
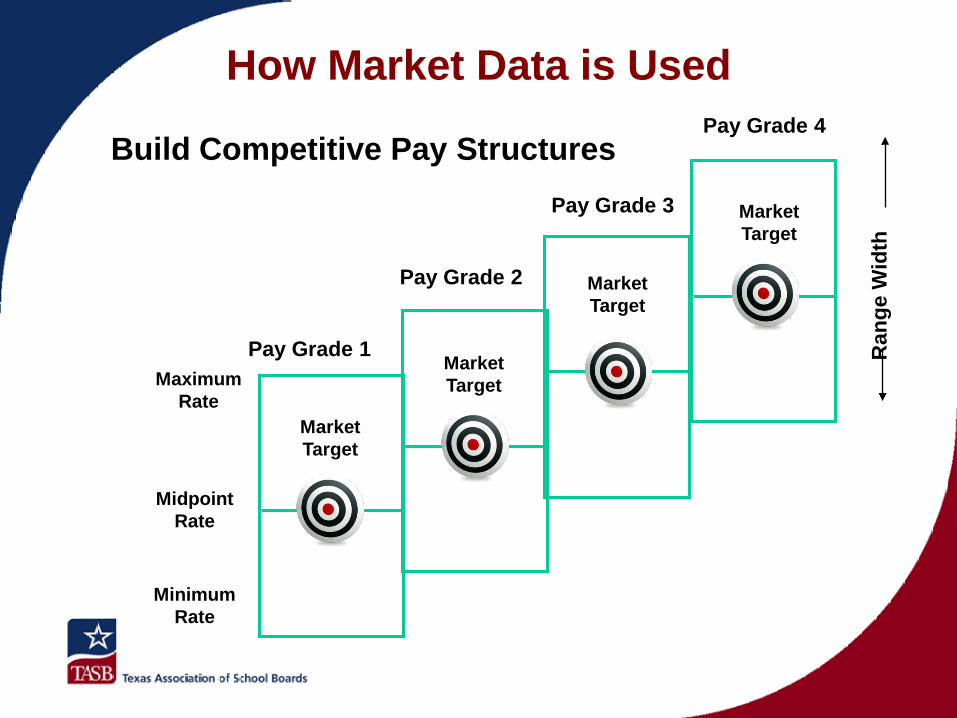
Pay Grade 1
Pay Grade 3
Pay Grade 4
Pay Grade 2
Minimum Rate
Ran
ge W
idth
Market Target
Market Target
Market Target
Market Target
Build Competitive Pay Structures
Midpoint Rate
Maximum Rate
How Market Data is Used
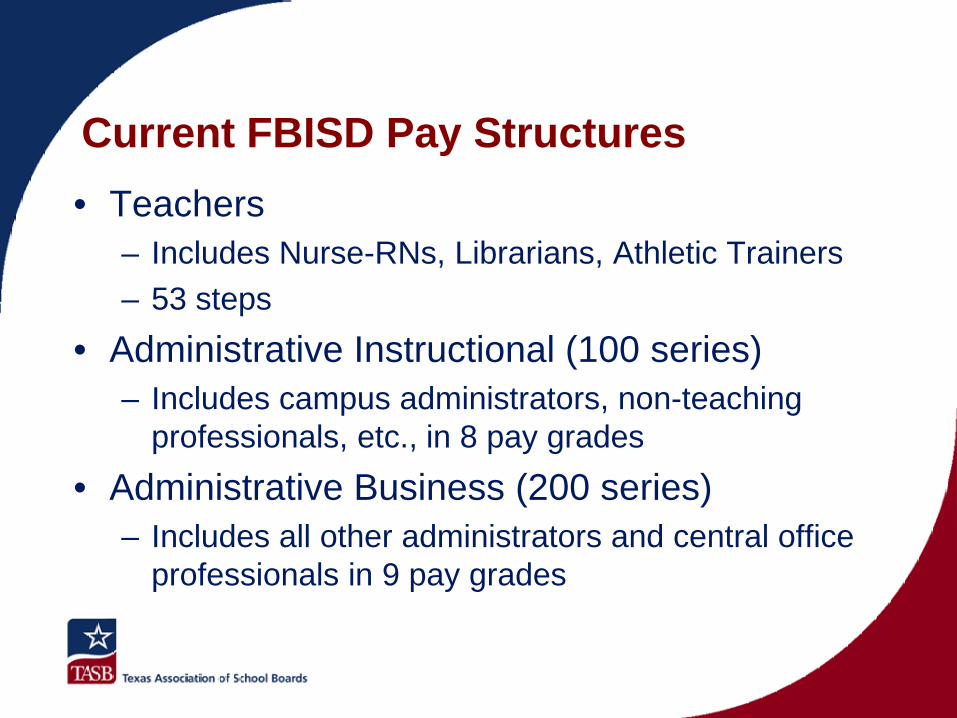
Current FBISD Pay Structures• Teachers
– Includes Nurse-RNs, Librarians, Athletic Trainers– 53 steps
• Administrative Instructional (100 series)– Includes campus administrators, non-teaching
professionals, etc., in 8 pay grades• Administrative Business (200 series)
– Includes all other administrators and central office professionals in 9 pay grades
Current FBISD Pay Structures
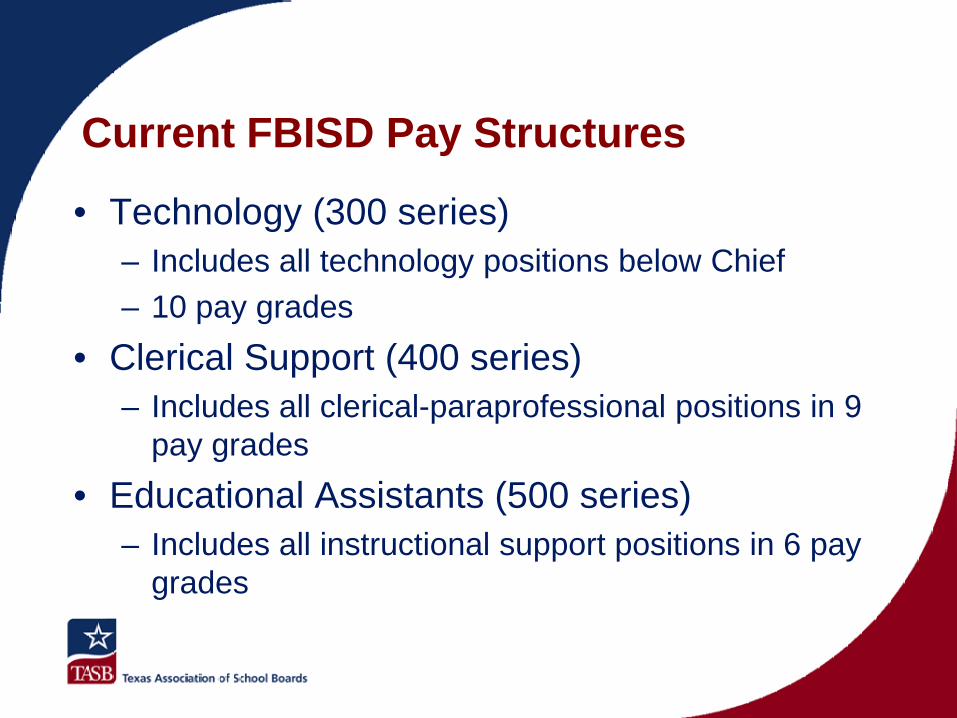
• Technology (300 series)– Includes all technology positions below Chief– 10 pay grades
• Clerical Support (400 series)– Includes all clerical-paraprofessional positions in 9
pay grades• Educational Assistants (500 series)
– Includes all instructional support positions in 6 pay grades

Current FBISD Pay Structures
• Auxiliary (600 series)– Includes transportation, food service, skilled trades,
and custodial positions in 10 pay grades• Public Safety (700 series)
– Includes all public safety positions below Chief– 6 pay grades
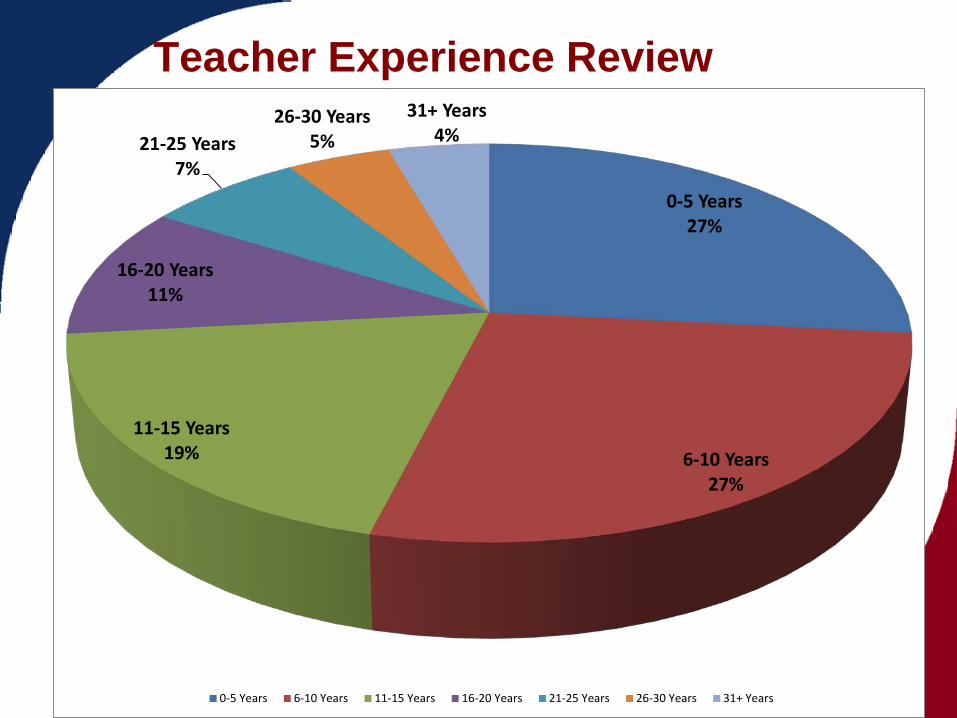
Teacher Experience Review
0-5 Years27%
6-10 Years27%
11-15 Years19%
16-20 Years11%
21-25 Years7%
26-30 Years5%
31+ Years4%
0-5 Years 6-10 Years 11-15 Years 16-20 Years 21-25 Years 26-30 Years 31+ Years
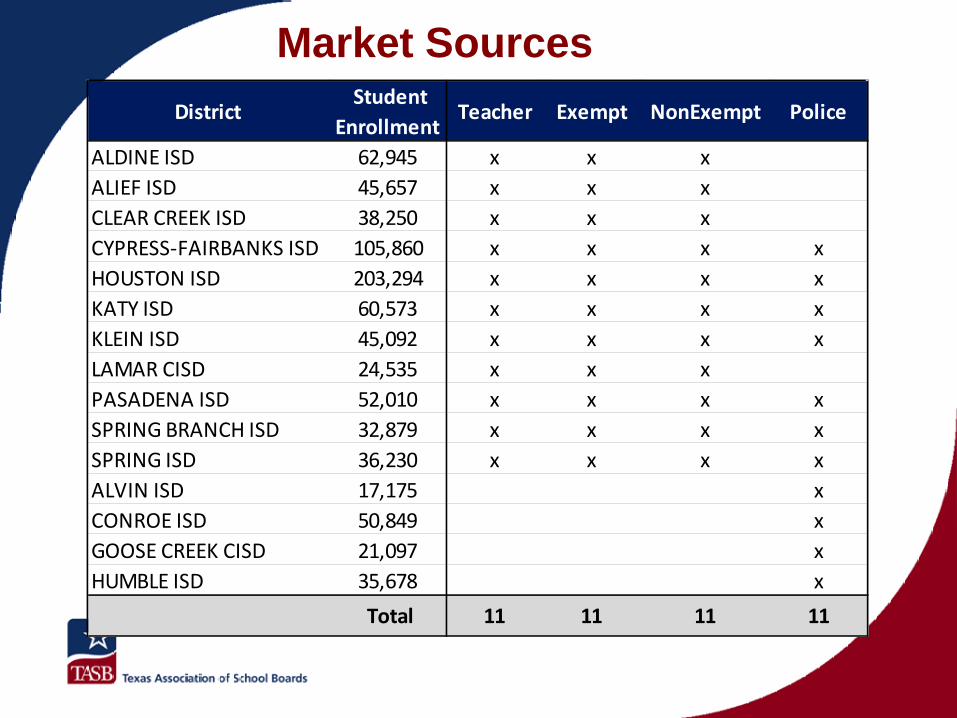
Market SourcesDistrict
Student Enrollment
Teacher Exempt NonExempt Police
ALDINE ISD 62,945 x x xALIEF ISD 45,657 x x xCLEAR CREEK ISD 38,250 x x xCYPRESS-FAIRBANKS ISD 105,860 x x x xHOUSTON ISD 203,294 x x x xKATY ISD 60,573 x x x xKLEIN ISD 45,092 x x x xLAMAR CISD 24,535 x x xPASADENA ISD 52,010 x x x xSPRING BRANCH ISD 32,879 x x x xSPRING ISD 36,230 x x x xALVIN ISD 17,175 xCONROE ISD 50,849 xGOOSE CREEK CISD 21,097 xHUMBLE ISD 35,678 x
Total 11 11 11 11

Other Market Sources
• Regional Private Sector Data– Economic Research Institute (ERI)– Kenexa CompAnalyst– Texas Workforce Commission
(http://www.texaswages.com)
– Mercer• Other Public Sector Data
– Colleges and Universities
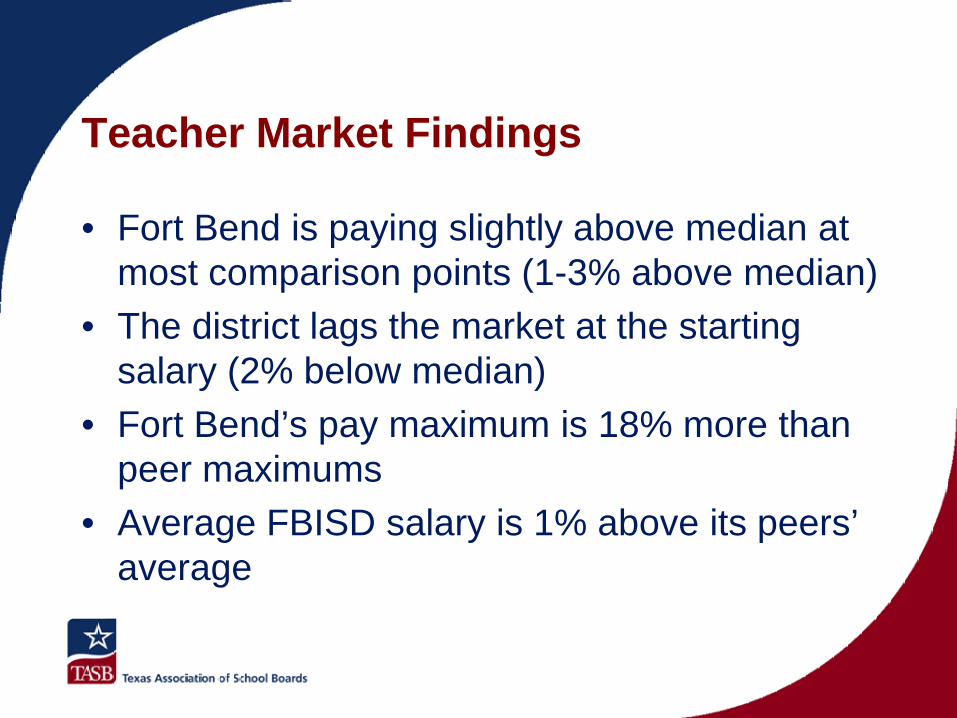
Teacher Market Findings
• Fort Bend is paying slightly above median at most comparison points (1-3% above median)
• The district lags the market at the starting salary (2% below median)
• Fort Bend’s pay maximum is 18% more than peer maximums
• Average FBISD salary is 1% above its peers’ average
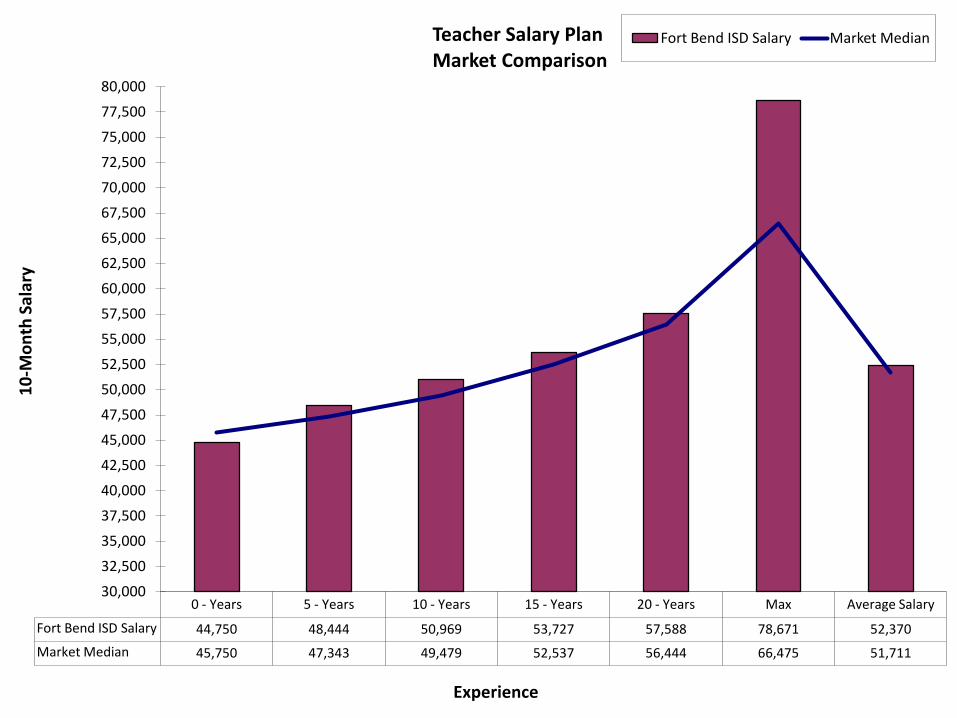
0 - Years 5 - Years 10 - Years 15 - Years 20 - Years Max Average Salary
Fort Bend ISD Salary 44,750 48,444 50,969 53,727 57,588 78,671 52,370
Market Median 45,750 47,343 49,479 52,537 56,444 66,475 51,711
30,000
32,500
35,000
37,500
40,000
42,500
45,000
47,500
50,000
52,500
55,000
57,500
60,000
62,500
65,000
67,500
70,000
72,500
75,000
77,500
80,000
10-M
onth
Sal
ary
Experience
Teacher Salary PlanMarket Comparison
Fort Bend ISD Salary Market Median
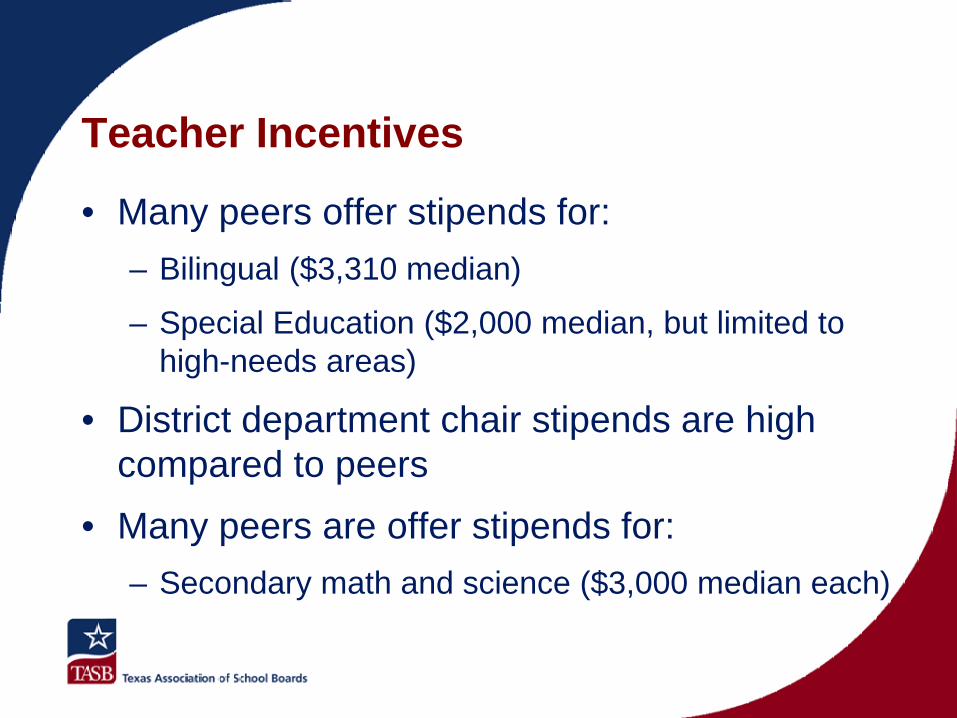
Teacher Incentives
• Many peers offer stipends for:– Bilingual ($3,310 median)
– Special Education ($2,000 median, but limited to high-needs areas)
• District department chair stipends are high compared to peers
• Many peers are offer stipends for: – Secondary math and science ($3,000 median each)
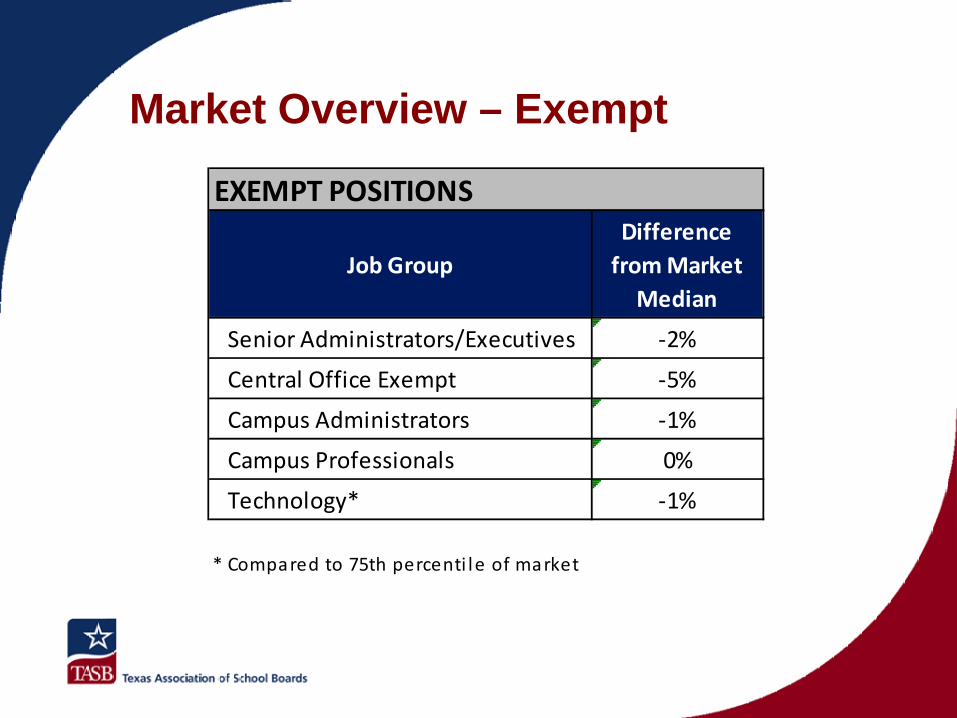
Market Overview – Exempt
EXEMPT POSITIONS
Job GroupDifference
from Market Median
Senior Administrators/Executives -2%
Central Office Exempt -5%
Campus Administrators -1%
Campus Professionals 0%
Technology* -1%
* Compared to 75th percenti le of market
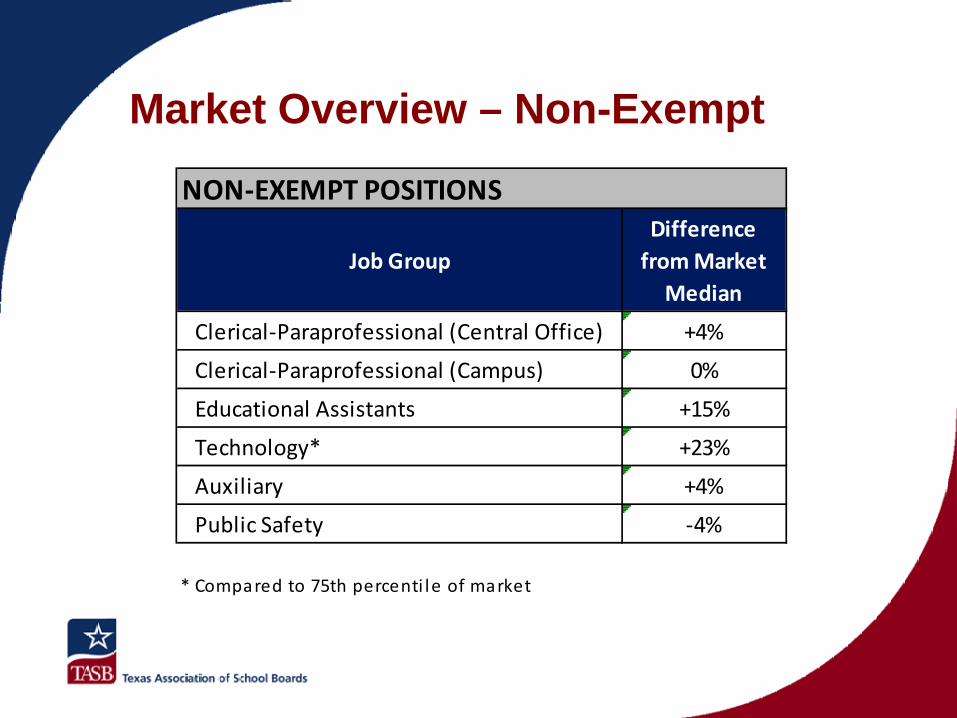
Market Overview – Non-Exempt
NON-EXEMPT POSITIONS
Job GroupDifference
from Market Median
Clerical-Paraprofessional (Central Office) +4%
Clerical-Paraprofessional (Campus) 0%
Educational Assistants +15%
Technology* +23%
Auxiliary +4%
Public Safety -4%
* Compared to 75th percenti le of market
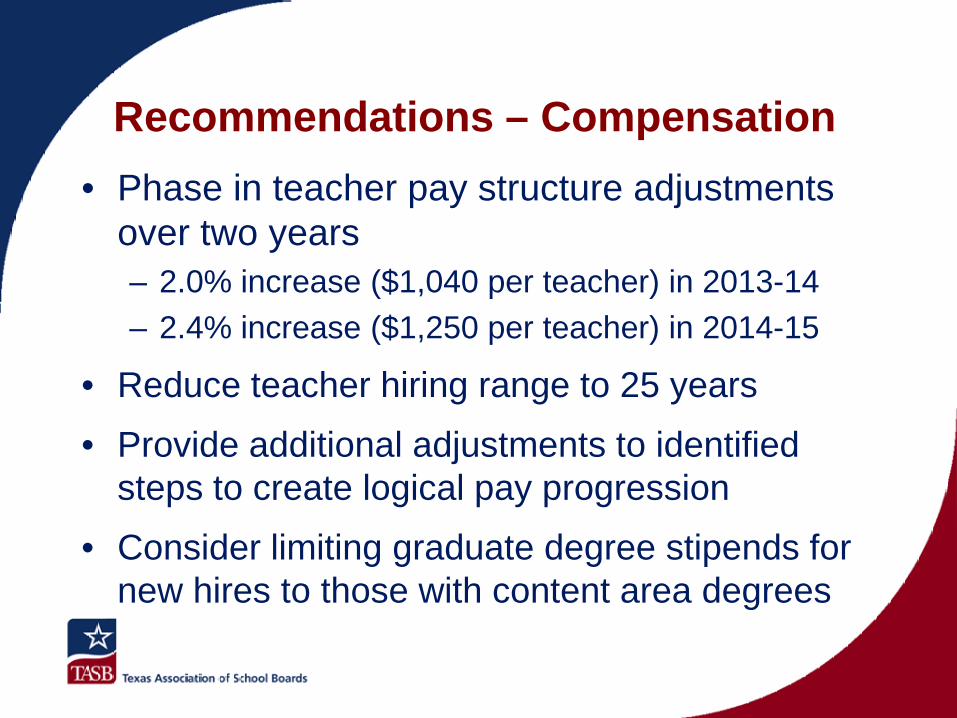
Recommendations – Compensation• Phase in teacher pay structure adjustments
over two years– 2.0% increase ($1,040 per teacher) in 2013-14– 2.4% increase ($1,250 per teacher) in 2014-15
• Reduce teacher hiring range to 25 years• Provide additional adjustments to identified
steps to create logical pay progression• Consider limiting graduate degree stipends for
new hires to those with content area degrees
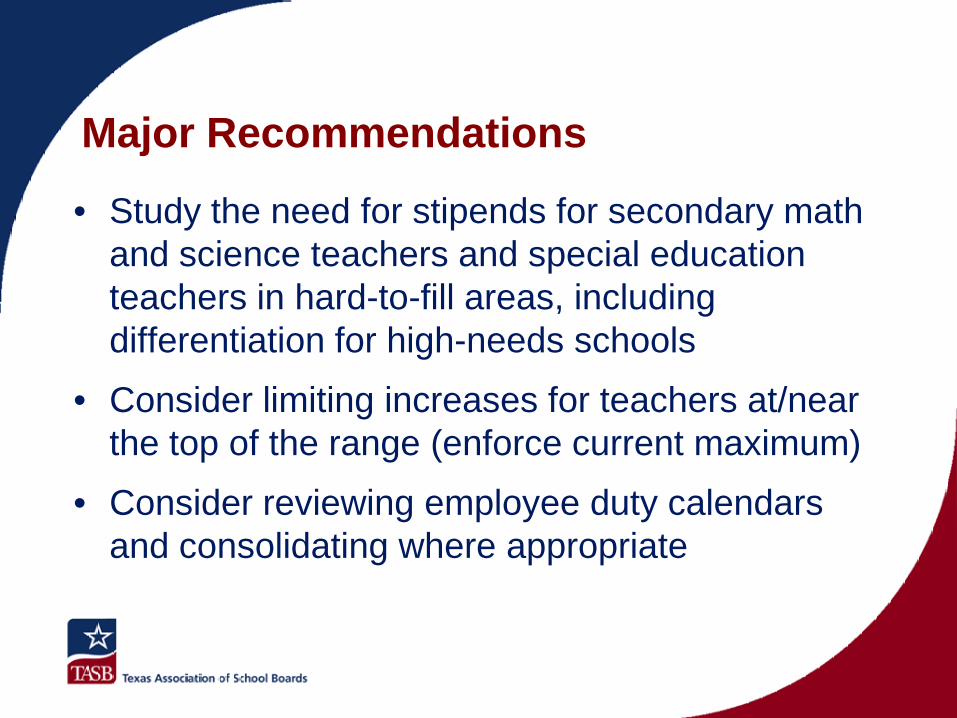
Major Recommendations
• Study the need for stipends for secondary math and science teachers and special education teachers in hard-to-fill areas, including differentiation for high-needs schools
• Consider limiting increases for teachers at/near the top of the range (enforce current maximum)
• Consider reviewing employee duty calendars and consolidating where appropriate
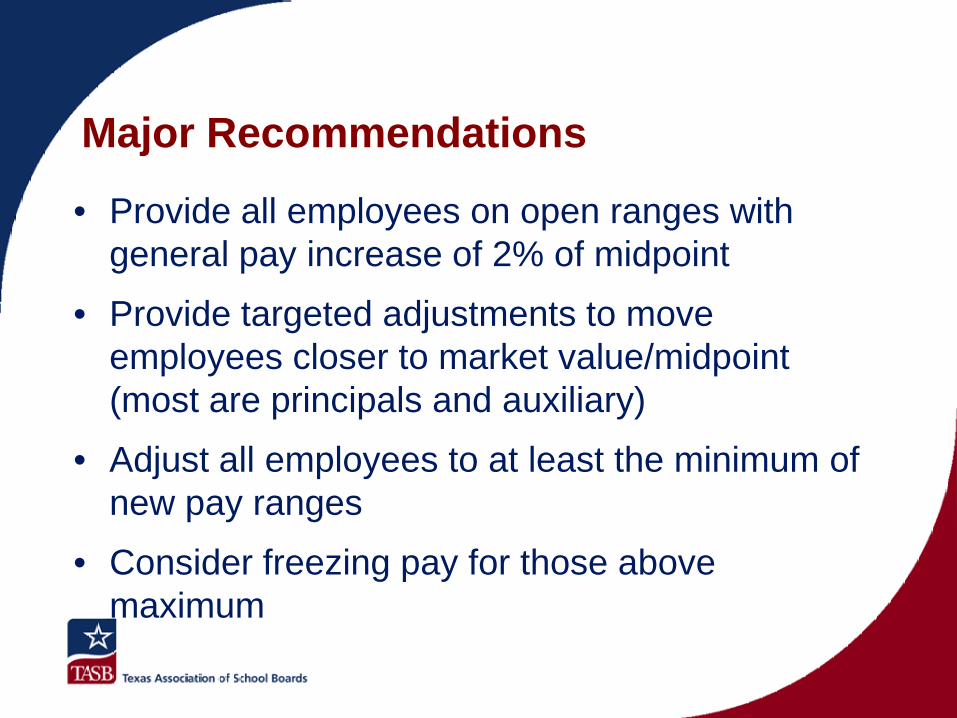
Major Recommendations
• Provide all employees on open ranges with general pay increase of 2% of midpoint
• Provide targeted adjustments to move employees closer to market value/midpoint (most are principals and auxiliary)
• Adjust all employees to at least the minimum of new pay ranges
• Consider freezing pay for those above maximum
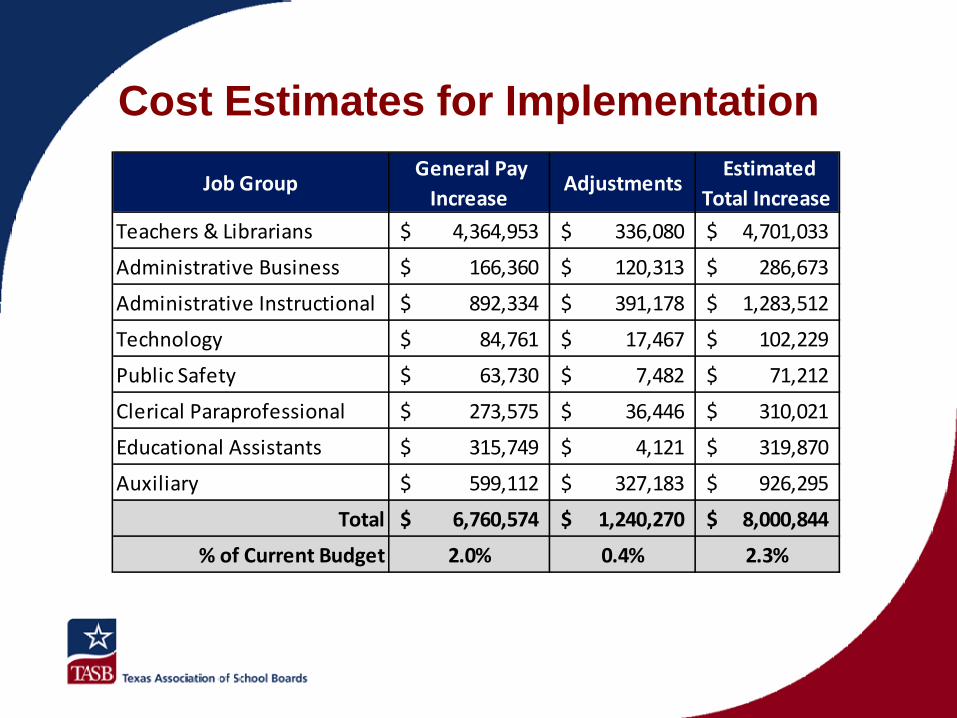
Cost Estimates for Implementation
Job Group General Pay
Increase Adjustments
Estimated Total Increase
Teachers & Librarians 4,364,953$ 336,080$ 4,701,033$
Administrative Business 166,360$ 120,313$ 286,673$
Administrative Instructional 892,334$ 391,178$ 1,283,512$
Technology 84,761$ 17,467$ 102,229$
Public Safety 63,730$ 7,482$ 71,212$
Clerical Paraprofessional 273,575$ 36,446$ 310,021$
Educational Assistants 315,749$ 4,121$ 319,870$
Auxiliary 599,112$ 327,183$ 926,295$
Total 6,760,574$ 1,240,270$ 8,000,844$
% of Current Budget 2.0% 0.4% 2.3%
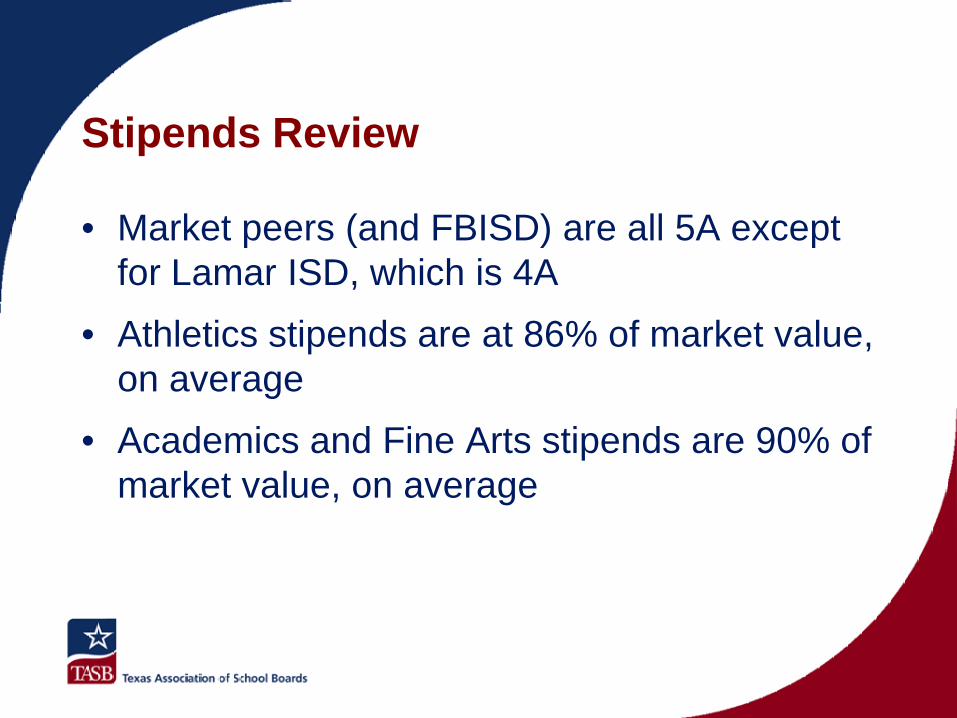
Stipends Review
• Market peers (and FBISD) are all 5A except for Lamar ISD, which is 4A
• Athletics stipends are at 86% of market value, on average
• Academics and Fine Arts stipends are 90% of market value, on average
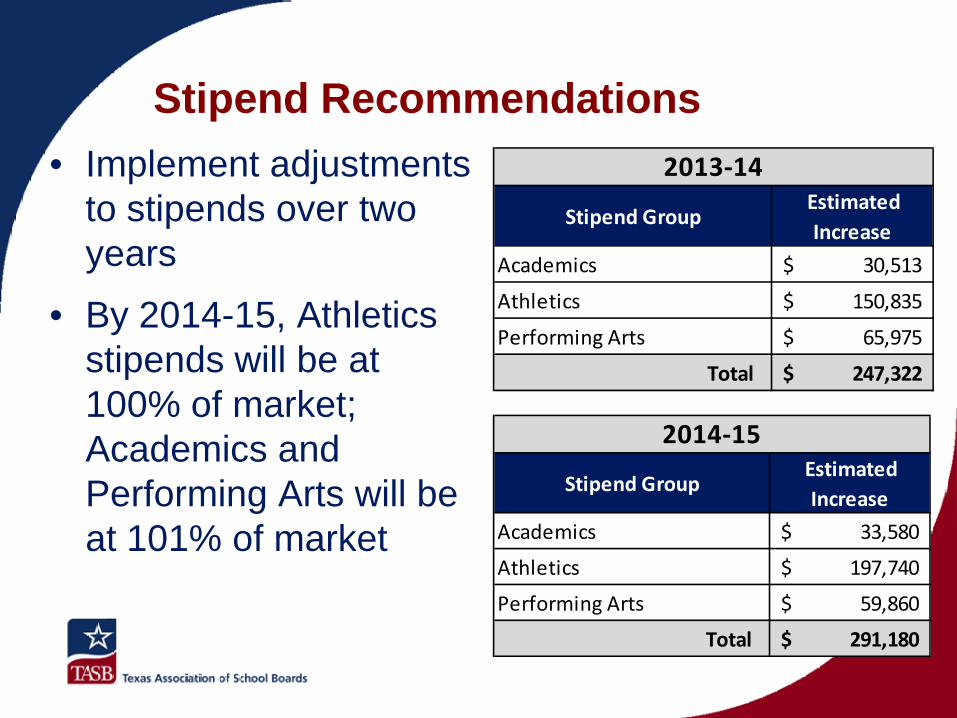
Stipend Recommendations• Implement adjustments
to stipends over two years
• By 2014-15, Athletics stipends will be at 100% of market; Academics and Performing Arts will be at 101% of market
Stipend Group Estimated
Increase
Academics 30,513$
Athletics 150,835$
Performing Arts 65,975$
Total 247,322$
2013-14
Stipend Group Estimated
Increase
Academics 33,580$
Athletics 197,740$
Performing Arts 59,860$
Total 291,180$
2014-15
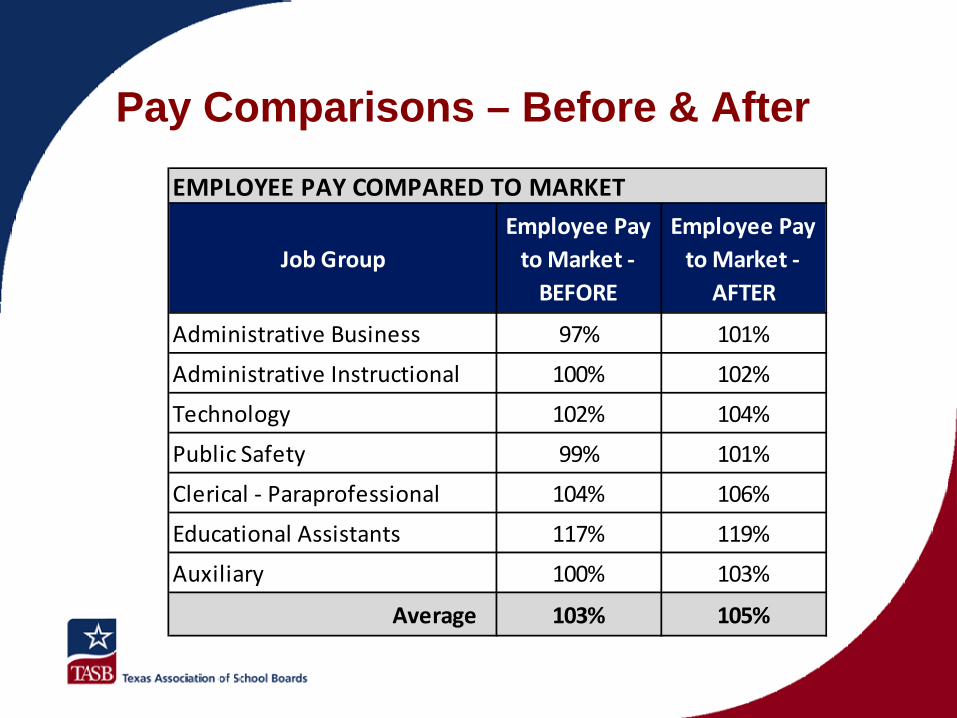
Pay Comparisons – Before & After
EMPLOYEE PAY COMPARED TO MARKET
Job GroupEmployee Pay
to Market - BEFORE
Employee Pay to Market -
AFTER
Administrative Business 97% 101%
Administrative Instructional 100% 102%
Technology 102% 104%
Public Safety 99% 101%
Clerical - Paraprofessional 104% 106%
Educational Assistants 117% 119%
Auxiliary 100% 103%
Average 103% 105%