Embed Size (px)
Citation preview

Dental Materials Journal 2010; 29(3): 330–335
Tarnish resistance evaluation of experimental Pd-free Ag-Au-Pt-Cu dental alloysYasuko TAKUMA, Takanobu SHIRAISHI, Takeshi FUJITA and Kunihiro HISATSUNE
Department of Dental and Biomedical Materials Science, Unit of Basic Medical Sciences, Graduate School of Biomedical Sciences, Nagasaki University, 1-7-1 Sakamoto, Nagasaki 852-8588, JapanCorresponding author, Takanobu SHIRAISHI; E-mail: [email protected]
This study evaluated the tarnish resistance of eight experimental Pd-free Ag-Au-Pt-Cu dental alloys in a 0.1% Na2S aqueous solution at 37°C. Color measurements of the plate samples were made using a computerized spectrophotometer before and after immersion in the test solution for up to 72 hours. Tarnish discoloration was evaluated using the color difference vector, ΔE*, in the CIELAB color space. Microstructural observation of each sample through an optical microscope revealed the matrix phase as the major constituent and second-phase small grains in the matrix phase. Selective tarnish discoloration occurred in the matrix, and fractional area of the matrix to the whole surface area was influenced by the sum of Au and Ag concentrations. The ΔE* value significantly decreased with increasing Au/(Au+Ag) atomic ratio. In conclusion, the Au/(Au+Ag) ratio in an alloy and the fractional area of the matrix were found to be primary and auxiliary factors affecting the tarnish resistance of the experimental alloys.
Keywords: Dental alloys, Tarnish resistance, Discoloration
INTRODUCTION
Dental precious metal alloys have been used in clinical dentistry as restorative materials because of their excellent mechanical properties and long-term durability in the oral environment. Palladium is usually contained in dental precious metal alloys because it is known to be effective in grain size refinement, hence a boon to increasing the hardness of alloys1). On another critical benefit of palladium for alloys, Lang et al.2) demonstrated that palladium was more effective than gold in improving tarnish resistance. With regard to the contribution of palladium in inhibiting the tarnishing of precious metal alloys by sulfide, Suoninen et al.3) examined the effectiveness thereof by carrying out an experiment using Au-Ag-Cu alloy with a small addition of palladium intended for dental castings. By means of X-ray photoelectron spectroscopy analysis, they reported that it was possible that the active sites for sulfide formation on the Au-Ag-Cu alloy were preferentially blocked by the palladium atom3).
While palladium is a boon to silver-based alloys in that it dramatically improves their tarnish and corrosion resistance, it can be a bane due to both inherent and external factors. On the inherent factor of palladium, Wataha and Hanks4) reported that in an ionic form and at sufficiently high concentrations, palladium almost always triggered allergic reactions in individuals who were sensitive to nickel. On the external factor related to the supply and price of palladium, the limited supply of palladium has led to volatile price fluctuations and hence uncertainty on the part of dental alloy manufacturers about their stable supply of Pd-containing dental alloys into the market5). Therefore, from the dual perspectives of improved
biocompatibility and the assurance of a stable supply of dental precious metal alloys to the market, it is definitely meaningful to develop Pd-free dental precious metal alloys.
Platinum was a popular element in dental gold alloys, and it was usually contained in a small amount in dental casting gold alloys6). Therefore in this study, we designed quaternary Ag-Au-Pt-Cu alloys of which the gold content approximately corresponded to those of low-karat gold alloys in the current dental market. However, as these experimental alloys did not contain palladium, there were concerns about their chemical stability and tarnish resistance. In view of these concerns, it was thus deemed necessary to investigate the tarnish behavior of these experimental alloys since chemical stability was one of the most important properties of dental materials.
For low-gold alloys, tarnish is minimized by a homogeneous microstructure and a high nobility7). In a study by Treacy and German8), tarnish testing of five gold-based commercial dental alloys was performed using various test solutions. It was found that the ratio of elements in the alloy was one key factor which affected the latter’s tarnish resistance8). Moreover, it was reported that an examination of the microstructure provided more insight on the tarnish behavior. In another study by Ohta et al.9) which focused on the effect of microstructure on tarnish resistance, it was found that palladium-bearing alloy showed no increase in the degree of tarnishing by phase separation, though the tarnishing susceptibility of dual-phase Au-Cu-Ag alloy was twice as high as that of single-phase alloy.
In this study, the objective was to investigate the effects of chemical composition and microstructure on the tarnish behavior of experimental Ag-Au-Pt-Cu dental alloys —which contained no palladium— in a
Received Oct 8, 2009: Accepted Feb 5, 2010doi:10.4012/dmj.2009-093 JOI JST.JSTAGE/dmj/2009-093
Dent Mater J 2010; 29(3): 330–335 331
0.1% Na2S aqueous solution.
MATERIALS AND METHODS
Preparation of experimental Pd-free alloysTable 1 lists the nominal compositions of the eight experimental Ag-Au-Pt-Cu quaternary alloys designed in this study. They were divided into three groups according to their copper content, where alloys in Group 1 contained 10 at% Cu and alloys in Groups 2 and 3 contained 15 and 20 at% Cu contents respectively. As for the sum of Au and Ag concentrations in each group, they were 80, 75, and 70 at% in Groups 1 to 3 respectively (Table 1).
Appropriate amounts of pure metal components were accurately weighed and melted in a high frequency induction furnace under argon atmosphere. The ingots obtained were subjected to alternate cold rolling and annealing heat treatment at high temperatures, thereby producing plate samples of 10×10×0.5 mm3 dimensions. Upon analysis, the compositions of all the prepared alloys were found to be close to the nominal compositions listed in Table 1. The Au/(Au+Ag) ratios in the right column were calculated from the analyzed compositions in atomic percent.
Tarnish evaluationThree plate samples from each alloy were subjected to solution heat treatment at 850ºC for 30 minutes under argon atmosphere and then quenched into ice brine. They were individually embedded in an epoxy resin and mechanically ground using waterproof abrasive papers down to 2000-grit. The samples were then mirror-polished using 0.3- and 0.06-µm alumina suspensions. Eight 100-mL containers containing 50 mL of a 0.1% Na2S aqueous solution were prepared, whereby each specimen was placed with its polished face up on the bottom surface of the container. The
containers were sealed and kept at 37ºC in a constant temperature water bath.
Color measurements of the samples were made using a computerized spectrophotometer (CM-3600d, Konica Minolta Sensing, Inc., Osaka, Japan) before and after immersion in the test solution for 24, 48, and 72 hours. After the specimens were removed from their test solutions, they were rinsed with pure water and dried with an air jet. Sample measurement area was 7 mm in diameter and after color measurement, each specimen was returned to its container that had been emptied and filled with a fresh test solution. The Commission Internationale de l’Eclairage (CIE) L*a*b* color system was used to evaluate the tarnish discoloration of the samples. Color difference, ∆E*, was calculated according to the following equation:
(1)
In this equation, ∆L*, ∆a*, and ∆b* are the differences in the color coordinates on the three-dimensional CIELAB uniform color space of the sample before and after immersion in the test solution.
Optical microscopic observationAfter tarnish evaluation, the microstructures of all the experimental alloys were examined using an optical microscope (Nikon Eclipse TE200, Nikon Corp., Tokyo, Japan) and their images were captured. To evaluate the fractional area of the matrix to the whole surface area, the captured images were transformed into black-and-white images by a threshold method. Fractional area of the matrix to the whole surface area in each binary image was then computed using a fractal dimension calculation program, Fractal 3.4.8, which was provided by the National Agriculture and Food Research Organization in Japan. Data were statistically analyzed using Student’s t-test to determine significant differences among Groups, 1, 2,
Group CodeCompositions (at%)
Au+Ag Au/(Au+Ag) ratio*Ag Au Pt Cu
1
A 70 10 10 10 80 0.115
B 60 20 10 10 80 0.253
C 50 30 10 10 80 0.374
2D 50 25 10 15 75 0.334
E 40 35 10 15 75 0.464
3
F 55 15 10 20 70 0.222
G 45 25 10 20 70 0.354
H 35 35 10 20 70 0.499
PtCu − − 50 50 − −
* Calculated from analyzed compositions of the prepared alloys
Table 1 Nominal compositions of the experimental alloys designed in this study
Dent Mater J 2010; 29(3): 330–335332
and 3 of the experimental alloys.
RESULTS
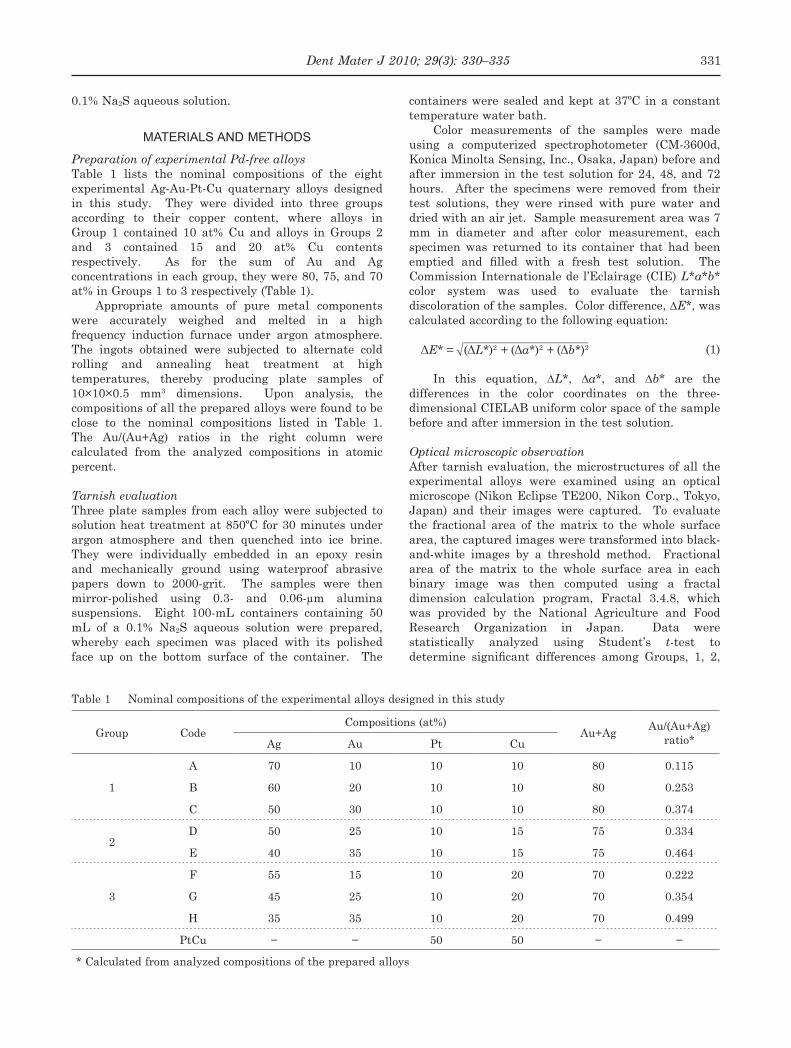
Tarnish discolorationFor each sample, its degree of tarnish discoloration was evaluated based on the color change from its initial state. Figure 1 shows the variations of color difference, ∆E*, with immersion time —up to 72 hours— for all the alloys in the test solution. By comparing the observed ∆E* values in Fig. 1 with Au/(Au+Ag) atomic ratios in Table 1, it was found that the ∆E* value significantly decreased with increasing Au/(Au+Ag) atomic ratio in each group with the same Cu content. This trend indicated that increases in Au/(Au+Ag) atomic ratio markedly improved the tarnish resistance. Moreover, the degree of decrease in ∆E* value was greater in Group 1 (alloys A, B, and C) than in Groups 2 (alloys D and E) and 3 (alloys F, G, and H). This meant that the effect of Au/(Au+Ag) atomic ratio on tarnish resistance was particularly greater in Group 1 alloys than in the alloys of Groups 2 and 3.
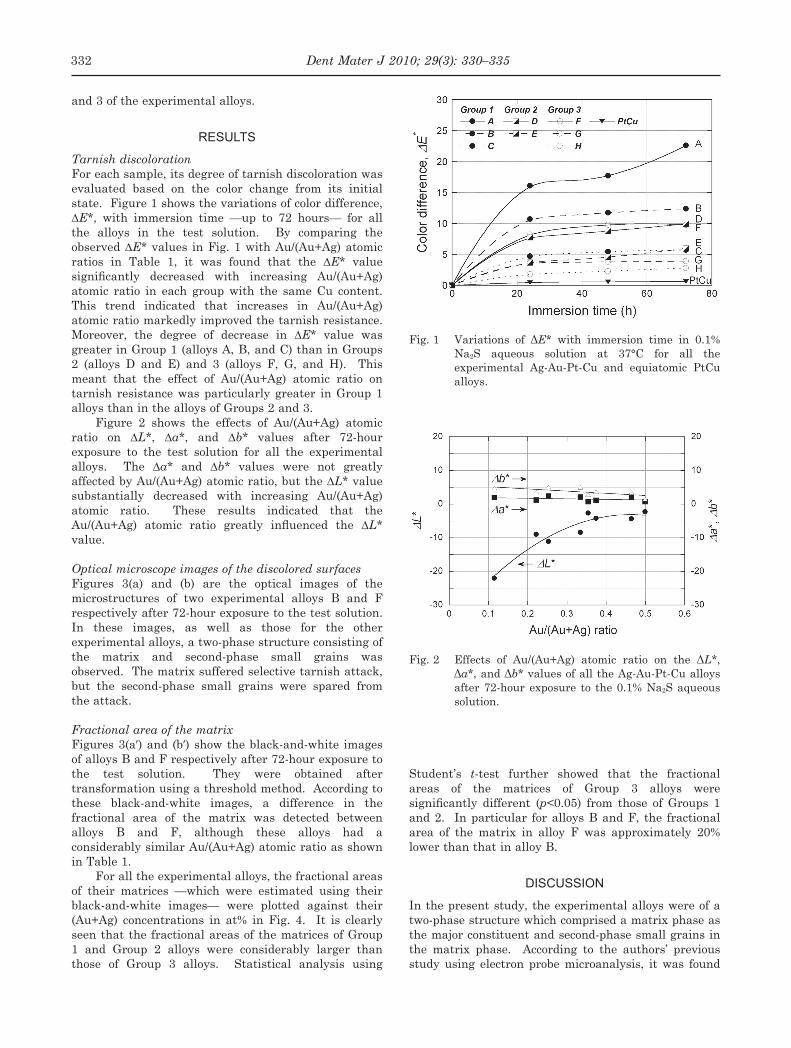
Figure 2 shows the effects of Au/(Au+Ag) atomic ratio on ∆L*, ∆a*, and ∆b* values after 72-hour exposure to the test solution for all the experimental alloys. The ∆a* and ∆b* values were not greatly affected by Au/(Au+Ag) atomic ratio, but the ∆L* value substantially decreased with increasing Au/(Au+Ag) atomic ratio. These results indicated that the Au/(Au+Ag) atomic ratio greatly influenced the ∆L* value.
Optical microscope images of the discolored surfacesFigures 3(a) and (b) are the optical images of the microstructures of two experimental alloys B and F respectively after 72-hour exposure to the test solution. In these images, as well as those for the other experimental alloys, a two-phase structure consisting of the matrix and second-phase small grains was observed. The matrix suffered selective tarnish attack, but the second-phase small grains were spared from the attack.
Fractional area of the matrixFigures 3(a′) and (b′) show the black-and-white images of alloys B and F respectively after 72-hour exposure to the test solution. They were obtained after transformation using a threshold method. According to these black-and-white images, a difference in the fractional area of the matrix was detected between alloys B and F, although these alloys had a considerably similar Au/(Au+Ag) atomic ratio as shown in Table 1.
For all the experimental alloys, the fractional areas of their matrices —which were estimated using their black-and-white images— were plotted against their (Au+Ag) concentrations in at% in Fig. 4. It is clearly seen that the fractional areas of the matrices of Group 1 and Group 2 alloys were considerably larger than those of Group 3 alloys. Statistical analysis using
Student’s t-test further showed that the fractional areas of the matrices of Group 3 alloys were significantly different (p<0.05) from those of Groups 1 and 2. In particular for alloys B and F, the fractional area of the matrix in alloy F was approximately 20% lower than that in alloy B.
DISCUSSION
In the present study, the experimental alloys were of a two-phase structure which comprised a matrix phase as the major constituent and second-phase small grains in the matrix phase. According to the authors’ previous study using electron probe microanalysis, it was found
Fig. 1 Variations of ΔE* with immersion time in 0.1% Na2S aqueous solution at 37°C for all the experimental Ag-Au-Pt-Cu and equiatomic PtCu alloys.
Fig. 2 Effects of Au/(Au+Ag) atomic ratio on the ΔL*, Δa*, and Δb* values of all the Ag-Au-Pt-Cu alloys after 72-hour exposure to the 0.1% Na2S aqueous solution.

Dent Mater J 2010; 29(3): 330–335 333
that the matrix was rich in Ag and Au while the second-phase small grains were rich in Pt and Cu10). The Pt-Cu-rich second-phase grains were well protected from the tarnish attack in all the samples, as shown in Fig. 3. To confirm the highly tarnish-resistant nature of the Pt-Cu-rich phase, an equiatomic PtCu binary alloy was prepared as a simplified model of the Pt-Cu-rich phase and its tarnish resistance was evaluated in the same manner. As given in Fig. 1, the obtained ∆E* value for the PtCu alloy was smaller than 1. Therefore, it was suggested that the tarnish resistance of the quaternary Ag-Au-Pt-Cu alloys designed in the present study would principally depend on the tarnishing behavior of the Ag-Au-rich matrix phase. As for the deposit formed on the Ag-Au-rich matrix, it was most probably silver sulfide based on the experimental setup of the present study for the tarnishing environment11-13).
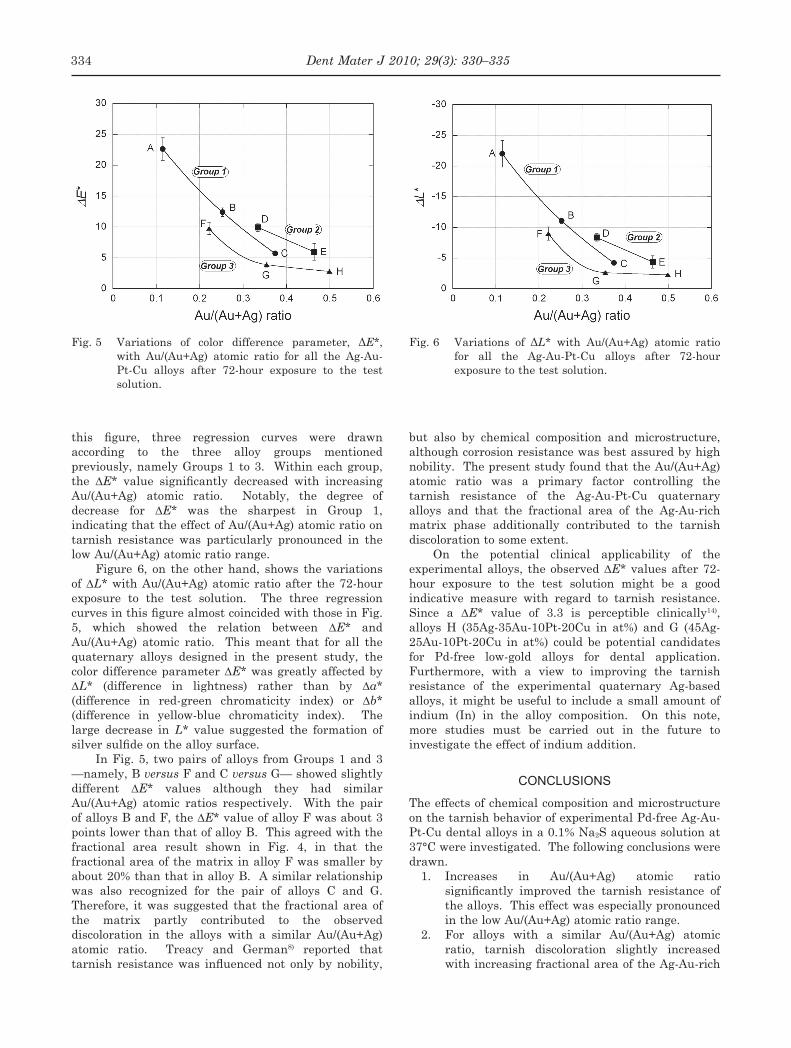
After 72-hour exposure to the test solution, the ∆E* values of all the Ag-Au-Pt-Cu alloys were plotted against their Au/(Au+Ag) atomic ratios in Fig. 5. In
Fig. 4 Estimated fractional areas of the matrices of all the experimental alloys.
Fig. 3 Optical micrographs (a) and (b) of alloys B and F respectively after 72-hour exposure to the 0.1% Na2S aqueous solution at 37°C. Their corresponding black-and-white images are shown in (a′) and (b′). Dark areas in (a) and (b) corresponded to the matrix which suffered from selective tarnish attack. Second-phase small grains were indicated by arrows.
Dent Mater J 2010; 29(3): 330–335334
this figure, three regression curves were drawn according to the three alloy groups mentioned previously, namely Groups 1 to 3. Within each group, the ∆E* value significantly decreased with increasing Au/(Au+Ag) atomic ratio. Notably, the degree of decrease for ∆E* was the sharpest in Group 1, indicating that the effect of Au/(Au+Ag) atomic ratio on tarnish resistance was particularly pronounced in the low Au/(Au+Ag) atomic ratio range.
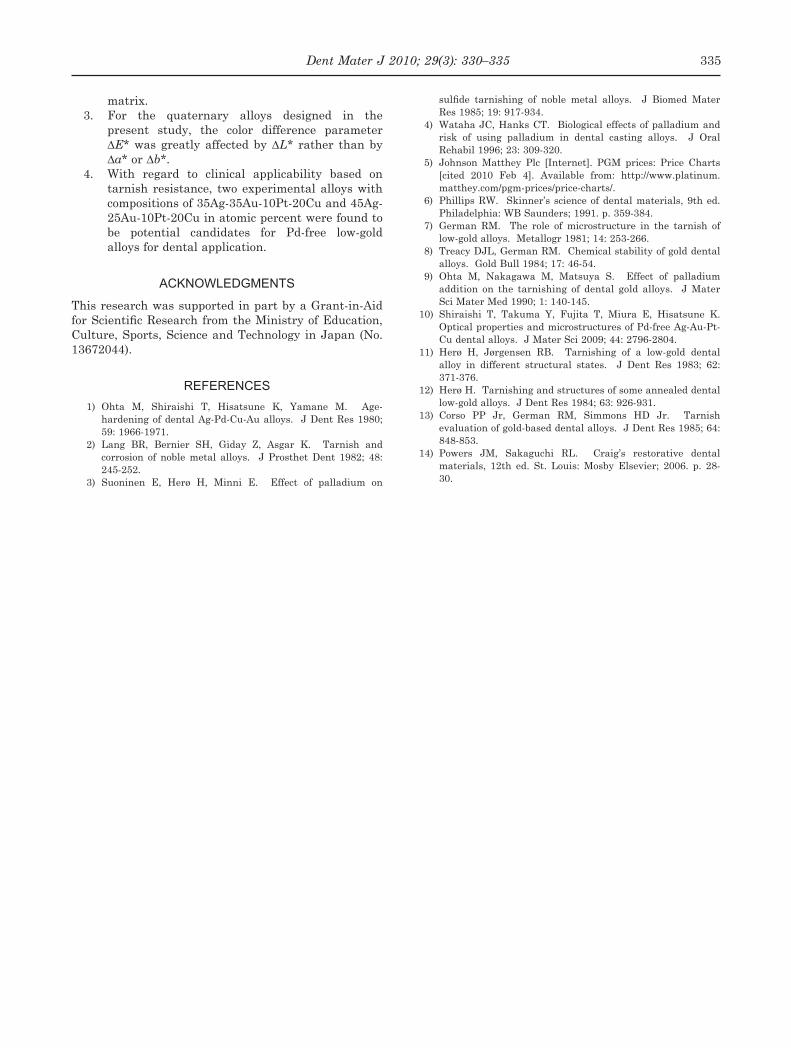
Figure 6, on the other hand, shows the variations of ∆L* with Au/(Au+Ag) atomic ratio after the 72-hour exposure to the test solution. The three regression curves in this figure almost coincided with those in Fig. 5, which showed the relation between ∆E* and Au/(Au+Ag) atomic ratio. This meant that for all the quaternary alloys designed in the present study, the color difference parameter ∆E* was greatly affected by ∆L* (difference in lightness) rather than by ∆a* (difference in red-green chromaticity index) or ∆b* (difference in yellow-blue chromaticity index). The large decrease in L* value suggested the formation of silver sulfide on the alloy surface.
In Fig. 5, two pairs of alloys from Groups 1 and 3 —namely, B versus F and C versus G— showed slightly different ∆E* values although they had similar Au/(Au+Ag) atomic ratios respectively. With the pair of alloys B and F, the ∆E* value of alloy F was about 3 points lower than that of alloy B. This agreed with the fractional area result shown in Fig. 4, in that the fractional area of the matrix in alloy F was smaller by about 20% than that in alloy B. A similar relationship was also recognized for the pair of alloys C and G. Therefore, it was suggested that the fractional area of the matrix partly contributed to the observed discoloration in the alloys with a similar Au/(Au+Ag) atomic ratio. Treacy and German8) reported that tarnish resistance was influenced not only by nobility,
but also by chemical composition and microstructure, although corrosion resistance was best assured by high nobility. The present study found that the Au/(Au+Ag) atomic ratio was a primary factor controlling the tarnish resistance of the Ag-Au-Pt-Cu quaternary alloys and that the fractional area of the Ag-Au-rich matrix phase additionally contributed to the tarnish discoloration to some extent.
On the potential clinical applicability of the experimental alloys, the observed ∆E* values after 72-hour exposure to the test solution might be a good indicative measure with regard to tarnish resistance. Since a ∆E* value of 3.3 is perceptible clinically14), alloys H (35Ag-35Au-10Pt-20Cu in at%) and G (45Ag-25Au-10Pt-20Cu in at%) could be potential candidates for Pd-free low-gold alloys for dental application. Furthermore, with a view to improving the tarnish resistance of the experimental quaternary Ag-based alloys, it might be useful to include a small amount of indium (In) in the alloy composition. On this note, more studies must be carried out in the future to investigate the effect of indium addition.
CONCLUSIONS
The effects of chemical composition and microstructure on the tarnish behavior of experimental Pd-free Ag-Au-Pt-Cu dental alloys in a 0.1% Na2S aqueous solution at 37°C were investigated. The following conclusions were drawn.
1. Increases in Au/(Au+Ag) atomic ratio significantly improved the tarnish resistance of the alloys. This effect was especially pronounced in the low Au/(Au+Ag) atomic ratio range.
2. For alloys with a similar Au/(Au+Ag) atomic ratio, tarnish discoloration slightly increased with increasing fractional area of the Ag-Au-rich
Fig. 6 Variations of ΔL* with Au/(Au+Ag) atomic ratio for all the Ag-Au-Pt-Cu alloys after 72-hour exposure to the test solution.
Fig. 5 Variations of color difference parameter, ΔE*, with Au/(Au+Ag) atomic ratio for all the Ag-Au-Pt-Cu alloys after 72-hour exposure to the test solution.
Dent Mater J 2010; 29(3): 330–335 335
matrix.3. For the quaternary alloys designed in the
present study, the color difference parameter ∆E* was greatly affected by ∆L* rather than by ∆a* or ∆b*.
4. With regard to clinical applicability based on tarnish resistance, two experimental alloys with compositions of 35Ag-35Au-10Pt-20Cu and 45Ag-25Au-10Pt-20Cu in atomic percent were found to be potential candidates for Pd-free low-gold alloys for dental application.
ACKNOWLEDGMENTS
This research was supported in part by a Grant-in-Aid for Scientific Research from the Ministry of Education, Culture, Sports, Science and Technology in Japan (No. 13672044).
REFERENCES1) Ohta M, Shiraishi T, Hisatsune K, Yamane M. Age-
hardening of dental Ag-Pd-Cu-Au alloys. J Dent Res 1980; 59: 1966-1971.
2) Lang BR, Bernier SH, Giday Z, Asgar K. Tarnish and corrosion of noble metal alloys. J Prosthet Dent 1982; 48: 245-252.
3) Suoninen E, Herø H, Minni E. Effect of palladium on
sulfide tarnishing of noble metal alloys. J Biomed Mater Res 1985; 19: 917-934.
4) Wataha JC, Hanks CT. Biological effects of palladium and risk of using palladium in dental casting alloys. J Oral Rehabil 1996; 23: 309-320.
5) Johnson Matthey Plc [Internet]. PGM prices: Price Charts [cited 2010 Feb 4]. Available from: http://www.platinum.matthey.com/pgm-prices/price-charts/.
6) Phillips RW. Skinner’s science of dental materials, 9th ed. Philadelphia: WB Saunders; 1991. p. 359-384.
7) German RM. The role of microstructure in the tarnish of low-gold alloys. Metallogr 1981; 14: 253-266.
8) Treacy DJL, German RM. Chemical stability of gold dental alloys. Gold Bull 1984; 17: 46-54.
9) Ohta M, Nakagawa M, Matsuya S. Effect of palladium addition on the tarnishing of dental gold alloys. J Mater Sci Mater Med 1990; 1: 140-145.
10) Shiraishi T, Takuma Y, Fujita T, Miura E, Hisatsune K. Optical properties and microstructures of Pd-free Ag-Au-Pt-Cu dental alloys. J Mater Sci 2009; 44: 2796-2804.
11) Herø H, Jørgensen RB. Tarnishing of a low-gold dental alloy in different structural states. J Dent Res 1983; 62: 371-376.
12) Herø H. Tarnishing and structures of some annealed dental low-gold alloys. J Dent Res 1984; 63: 926-931.
13) Corso PP Jr, German RM, Simmons HD Jr. Tarnish evaluation of gold-based dental alloys. J Dent Res 1985; 64: 848-853.
14) Powers JM, Sakaguchi RL. Craig’s restorative dental materials, 12th ed. St. Louis: Mosby Elsevier; 2006. p. 28-30.


![Tarnish resisting silver alloys. - NIST Page bureauofstandards georgex.burgess,director technologicpapersofthebureauofstandards,no.348 [partofvol.21] tarnishresistingsilveralloys h](https://img.pdfslide.us/doc/110x75/5adced927f8b9a9a768c2fee/tarnish-resisting-silver-alloys-nist-page-bureauofstandards-georgexburgessdirector.jpg)