Embed Size (px)
Citation preview
Targets in the New Zealand Waste Strategy
2006 Review of Progress
Prepared by the Ministry for the Environment
Published in April 2007 by the Ministry for the Environment
Manatū Mō Te Taiao PO Box 10362, Wellington, New Zealand
ISBN: 0-478-30133-2 Publication number: 802
This document is available on the Ministry for the Environment’s website: www.mfe.govt.nz
Targets in the New Zealand Waste Strategy: 2006 Review of Progress i
Contents
Foreword iv
Executive Summary vi The New Zealand Waste Strategy vi Progress against targets vi Report findings vii Report recommendations viii
1 Background 1 1.1 Purpose of this report 1 1.2 Report structure 1 1.3 The New Zealand Waste Strategy 2 1.4 Targets in the Strategy 3 1.5 Findings of the 2003 Review of Targets 3 1.6 Method for the 2006 review of targets 4 1.7 Limitations of the data 5
2 Overview of progress in implementing the Strategy 7 2.1 Introduction 7 2.2 Waste disposal 7
2.2.1 Landfills 7 2.2.2 Solid waste to landfill 8 2.2.3 Cleanfills 9 2.2.4 Recovered materials 11 2.2.5 Waste composition 12
2.3 Product stewardship schemes 13 2.4 Central government action 14 2.5 Local government action 16 2.6 Waste industry action 18
3 Review of Progress against Targets 20 3.1 Introduction 20 3.2 Waste minimisation 20
3.2.1 Introduction 20 3.2.2 Summary of progress 21 3.2.3 Looking forward 22 3.2.4 Review of progress 22
3.3 Organic waste 29 3.3.1 Introduction 29 3.3.2 Summary of progress 30 3.3.3 Looking forward 31 3.3.4 Review of progress 31
3.4 Special waste 37
ii Targets in the New Zealand Waste Strategy: 2006 Review of Progress
3.4.1 Introduction 37 3.4.2 Summary of progress 37 3.4.3 Looking forward 38 3.4.4 Review of progress 38
3.5 Construction and demolition waste 41 3.5.1 Introduction 41 3.5.2 Summary of progress 42 3.5.3 Looking forward 42 3.5.4 Review of progress 43
3.6 Hazardous waste and contaminated sites 44 3.6.1 Introduction 44 3.6.2 Summary of progress 44 3.6.3 Looking forward 45 3.6.4 Review of progress 46
3.7 Organochlorines 48 3.7.1 Introduction 48 3.7.2 Summary of progress 49 3.7.3 Looking forward 50 3.7.4 Review of progress 50
3.8 Trade waste and waste disposal 52 3.8.1 Introduction 52 3.8.2 Summary of progress 52 3.8.3 Looking forward 53 3.8.4 Review of progress 53
4 Conclusions 60 4.1 Progress against Strategy targets 60 4.2 Progress in priority areas 61
4.2.1 Waste minimisation 61 4.2.2 Business 61 4.2.3 Waste sector 62 4.2.4 Special wastes 62 4.2.5 Organics 62 4.2.6 Construction and demolition 63 4.2.7 Hazardous wastes / contaminated sites 63 4.2.8 Waste data 63
5 Recommendations 65
Appendix 1: Targets in the New Zealand Waste Strategy 67
References 70
Glossary 72
Targets in the New Zealand Waste Strategy: 2006 Review of Progress iii
Tables Table 1: Summary of findings from the 2003 Review of Strategy Targets 4 Table 2: Number of operating landfills and tonnage of solid waste to landfill,
1983–2006 9 Table 3: Tonnages to cleanfill 10 Table 4: Estimates of materials diverted from landfill and cleanfill (tonnes) 12 Table 5: Progress against Strategy actions (central government) 15 Table 6: Recycling in metropolitan, urban, and rural areas, 2006 27 Table 7: Section of Green Star rating tool – recycling waste storage criteria 28 Table 8: Summary results from the National Landfill Census (1995, 1998 and 2006)
and Landfill Review and Audit Survey (2002) 58
Figures Figure 1: Number of operating landfills and tonnage of solid waste to landfill 8 Figure 2: Composition of cleanfill material, 2003/04 11 Figure 3: Composition of waste to landfill, 2004 13 Figure 4: Packaging consumption and collection trends, 2006 (per capita) 14 Figure 5: Percentage of territorial authorities with Waste Management Plans,
1994−2005 16 Figure 6: Tonnes of recycling diverted from landfill, by region, 2005/06 17 Figure 7: Recycling in New Zealand by metropolitan, urban and rural areas, 2005/06 18 Figure 8: Reporting by territorial authorities on waste minimisation activities, 2005/06 23 Figure 9: Materials collected at kerbside or drop-off centres, 2005/06 26 Figure 10: Local authority organic waste measurement systems, 2005/06 32 Figure 11: Organic waste diverted from landfill by territorial authorities, 2005/06 33 Figure 12: Breakdown of the total organic waste stream, 2005/06 34 Figure 13: Biosolids beneficially re-used and sent to landfill, 2006 35 Figure 14: Average composition of construction and demolition waste to landfill 41
iv Targets in the New Zealand Waste Strategy: 2006 Review of Progress
Foreword As the Prime Minister emphasised earlier this year, New Zealand’s future is dependent on long-term, sustainable strategies. These include taking steps to move towards zero waste. Five years on from the launch of the New Zealand Waste Strategy (2002), this review of progress against the targets in the Strategy has been a valuable exercise. The review confirms that local government, central government and industry have made some important steps along the journey towards zero waste. It has also enabled us to take stock of areas where more needs to be done and to set priorities for future waste work. There has been good progress in improving waste management and waste minimisation services and infrastructure across the country, and 97 per cent of New Zealanders now have access to recycling facilities. Many communities have also taken the initiative to minimise waste and improve resource recovery. One example is the resource recovery plant recently established in Palmerston North. Built on an old landfill site, the plant includes a domestic recycling facility, a composting plant for green and food waste, a glass-crushing facility, and a business and education centre to support best practice in waste minimisation. Despite these successes, however, waste minimisation and management practices are still widely variable, and the challenge now is to ensure a consistently high level of service throughout New Zealand. One area where I would like to see progress is in increasing the variety of recyclable materials diverted from landfills without compromising their value through inappropriate mixing or handling. In line with the Government’s commitment to sustainable development, I am also seeking to promote the onshore recovery and processing of recycled materials. I have asked territorial authorities to consider what can be done in regard to both these issues as we move towards zero waste. Many businesses already see the benefits of reducing waste and improving resource efficiency through good design and more efficient manufacturing. It simply makes good economic sense, particularly as consumer demand for environmentally sustainable products grows. I would encourage other businesses to embrace the benefits of supplying a truly “clean and green” product or service. Central government has developed a number of guidelines and standards to manage waste disposed of to landfills and cleanfills. Similarly, a range of tools, guidelines and product stewardship schemes are available to ensure the safe management of hazardous wastes and other special wastes. We need to maintain and build on the momentum in this area, where possible. This review shows the need for increased effort to better understand and manage organic wastes and the construction and demolition waste stream. These wastes currently represent almost half of our waste to landfill, so there are many exciting opportunities to recover these materials and re-use them. This report also shows that existing monitoring and reporting systems for waste are insufficient. If we are to better manage and minimise waste in this country, we need to be able to measure, monitor and report waste flows accurately.
Targets in the New Zealand Waste Strategy: 2006 Review of Progress v
As Minister for the Environment, I challenge local government, the waste sector, business and local communities to consider the findings of this review and to play their part in moving towards zero waste. We all have a role to play if New Zealand is to achieve a truly sustainable future.
Hon David Benson-Pope MINISTER FOR THE ENVIRONMENT
vi Targets in the New Zealand Waste Strategy: 2006 Review of Progress
Executive Summary Waste is an important issue for New Zealand and the world because of the impacts it can have on the health of the community and on the natural and physical environment. Waste also represents an inefficient use of our limited resources, and the ability to use resources efficiently is a central tenet of New Zealand’s sustainable future.
The New Zealand Waste Strategy The New Zealand Waste Strategy (the Strategy) is the Government’s primary policy on waste. Developed in partnership with local government in 2002, the Strategy has as its vision ‘towards zero waste and a sustainable New Zealand’. The Strategy has three goals: • lower the costs and risks of waste to society • reduce environmental damage from the generation and disposal of waste • increase economic benefit by using material resources efficiently. The Strategy contains 30 aspirational targets for improved waste management, waste minimisation and resource efficiency. These were developed to provide a framework for action and a measuring stick against which progress towards the Strategy goals can be charted. The central focus of this report is to provide information on how New Zealand is progressing towards these targets. A summary of progress is provided for each priority waste stream, followed by a detailed analysis of individual targets. The report also briefly summarises progress since 2002 in implementing the Strategy and its goals against the backdrop of a significantly evolving waste landscape.
Progress against targets This report shows that much of the groundwork for achieving the Strategy’s wider goals and objectives for waste management, waste minimisation and resource efficiency has been laid, but that progress against the Strategy targets has been variable. Ten of the 30 targets have been achieved, achieved ahead of time, or have had significant progress made towards achieving them. However, the report also highlights areas where progress against the targets has been limited. Three targets have not been achieved, four targets were unable to be achieved, and progress against five targets was unable to be measured. Eight targets have a deadline to be achieved in future, so progress towards these is considered in the report in general terms only.
Targets in the New Zealand Waste Strategy: 2006 Review of Progress vii
Report findings The report confirms that there have been improvements in waste management, waste minimisation and resource efficiency in New Zealand since the development of the Strategy. The establishment of comprehensive waste management and minimisation facilities and services has, however, taken time. Although territorial authorities and the waste industry have made progress in putting in place the infrastructure and services needed to drive waste minimisation, the level and type of services provided across the country remain highly variable. Further progress could be made by ensuring minimum levels of service for every community. Recycling has become easier for the householder, with 97 per cent of New Zealanders now having access to domestic recycling facilities (either kerbside or drop-off), 73 per cent of them at the kerbside. Although access to community recycling is high, volumes of waste recycled per person vary considerably across regions. Greater effort is required to ensure existing community recycling services are better used. Local government has made some progress in implementing recycling systems within their own buildings and reporting on council waste minimisation and management activities, although reporting is not consistent across the country. Business and industry have also made gains in better managing and minimising their waste. In response, community recycling services in many areas have been extended to businesses, with some larger companies partnering the waste industry to secure tailored collection and recycling services. The waste and recycling industry has grown considerably since 2002, with many services now operated by the private sector. New markets are opening for materials previously disposed of to landfill. Although this is driving some new commercial activity, there are still barriers to increased resource recovery in some areas. The private sector also plays a key role in designing products and processes to minimise waste and maximise resource recovery. This is a relatively new area which we can expect to be given greater attention in the future. Industry has made progress in implementing product stewardship schemes for packaging (paint, paper, plastic, glass, steel and aluminium) and “special wastes” such as waste oil, waste electronic and electrical equipment, farm plastics and tyres. That said, continued effort in this area is essential if these wastes are to be more comprehensively diverted from landfill. Work is also needed to address the concern of some participants in product stewardship schemes that non-participants gain cost advantages in the market-place by continuing with wasteful practices. A policy framework is now in place to manage hazardous waste. Work has begun to implement a nationwide tracking scheme and to develop minimum storage, transport and disposal requirements for hazardous wastes, but continued effort is required to consolidate this early work to track and manage our hazardous wastes more effectively. Likewise, ongoing effort is required to ensure New Zealand’s contaminated sites are appropriately screened and managed. A number of regional councils have started the process of identifying and screening potentially contaminated sites, but progress has been slow and varies throughout the country.
viii Targets in the New Zealand Waste Strategy: 2006 Review of Progress
Report recommendations The report points to several areas for further action, including the need for greater leadership by local government and central government, further work to build on existing guidelines and standards, and increased public awareness to drive greater community and householder action on waste. The report recommends a greater focus on priority areas in the Strategy, such as organic waste (including food wastes), construction and demolition waste, and contaminated sites. There are real opportunities for increasing the diversion of commercial organic waste and construction and demolition wastes from landfill. At present, systematic diversion of these wastes is very limited. The report also signals the urgent need for enhanced data collection and improvements in waste monitoring and reporting. Council measurement of waste disposal and recycling has improved, but it is often difficult to compare data from different areas due to the lack of standardised monitoring and reporting by territorial authorities and waste and recycling operators. To achieve an accurate picture of waste collection, disposal and recycling across New Zealand it may be necessary to introduce mandatory waste data collection and reporting. A lack of funding is often cited as a barrier to greater waste minimisation at the local level. Enhanced funding support is one way of improving the scope of, and access to, kerbside recycling and green and food waste collections. While confirming that the New Zealand Waste Strategy remains an appropriate framework to improve waste management and drive waste minimisation, the report recommends that some Strategy targets be revised in recognition of the many changes to the waste landscape that have occurred since 2002. Revisions to some targets are expected to improve measurement of progress against Strategy goals, add momentum to present waste management and minimisation initiatives, and ensure a more sustainable use of New Zealand’s valuable material resources. However, the report proposes that any revisions should await Government decisions on the future direction of waste policy.
Targets in the New Zealand Waste Strategy: 2006 Review of Progress 1
1 Background
1.1 Purpose of this report The New Zealand Waste Strategy (Ministry for the Environment, 2002d) is a comprehensive policy framework to reduce waste and improve its management in New Zealand. Launched in 2002, the Strategy sets a long-term strategic direction for New Zealand waste policy. It is designed to gradually progress from managing waste disposal to a greater focus on waste prevention and resource efficiency. The Strategy contains a number of principles, action plans and national targets for managing priority wastes. The targets are intended to provide a basis for action and a measuring stick against which progress towards the wider Strategy principles can be charted. The Strategy acknowledges the importance of monitoring and evaluating progress towards the targets, both in order to check the effectiveness of the Strategy and to identify any required changes to targets. The Ministry for the Environment, in conjunction with local government, was delegated the role of monitoring and reporting on progress against Strategy targets. A preliminary review of progress against Strategy targets was conducted in 2003, with the findings published in early 2004. Because of limited information available at that time, a further review of progress against Strategy targets was recommended for 2006. This report summarises the findings of the 2006 review of progress against targets in the New Zealand Waste Strategy.
1.2 Report structure This report contains five sections. Section 1 provides background on the New Zealand Waste Strategy and the 2003 review of progress against Strategy targets. It also discusses the methods used for the 2006 review. Section 2 provides an overview of progress in implementing the New Zealand Waste Strategy. It also highlights key changes in the waste landscape in New Zealand since the Strategy was launched, including information on landfill management, recovered materials, composting and product stewardship. This section also discusses the roles played by central government, local government and industry in waste management, waste minimisation and resource efficiency. Section 3 reviews progress against each of the Strategy targets. Initiatives underway for each priority waste stream are briefly summarised, followed by a more detailed discussion on progress towards the relevant target or targets. The final two sections present the conclusions of the report and recommendations for further work.

2 Targets in the New Zealand Waste Strategy: 2006 Review of Progress
1.3 The New Zealand Waste Strategy The New Zealand Waste Strategy is based on the principle of sustainability in resource use, which includes progress towards the concept of zero waste. Its vision, goals and targets all express central and local government commitment to minimise waste and to manage it better. The New Zealand Waste Strategy was developed in partnership with Local Government New Zealand, reflecting the crucial role that local government plays in providing waste services in this country. Territorial authorities hold the primary responsibility for implementing waste policies in their communities and are required to develop waste management plans under the Local Government Act 2002. Throughout the country, territorial authorities undertake a range of important local waste management and minimisation activities, including the collection of household waste, support for cleaner production, education programmes, kerbside recycling systems, user-pays charging policies, the identification and management of contaminated sites, and implementing improved landfill management standards. Industry and business have an important part to play in waste reduction given their role as designers, manufacturers and distributors of products and services that generate waste. Private sector interests are key providers of many waste industry services, both directly to other businesses and under contract to territorial authorities. Community groups and non-governmental organisations also have a keen interest in many waste matters. In recognition of this wider interest in waste, a number of groups were invited to help in the development of the Strategy. A Waste Minimisation and Management Working Group, a multi-sector body, was set up to advise on the Strategy’s content and direction. The advice of the Group was then released for public submission. Both the Working Group and public submissions called for clear national leadership in waste management and minimisation. The crucial role that regional and local government plays in addressing New Zealand’s waste needs was also recognised in the submission process, and there was widespread agreement that all New Zealanders must take responsibility for waste if the aims and objectives of the Strategy are to be achieved. The Strategy was subsequently written to reflect this consensus. Its vision, goals and targets all express the commitment by central and local government to minimise waste and manage it better, and to help communities, householders and businesses play their part in this. To achieve this, the Strategy seeks to focus action in five core policy areas: • sound legislation • high environmental standards • efficient pricing • adequate and accessible information • the efficient use of materials. The 30 national-level targets set out in the Strategy were selected for their importance in driving behaviour change to achieve these core policy outcomes. Importantly, the Strategy recognises that both policy and targets will need to develop and evolve over time in order to remain relevant to the changing waste landscape in New Zealand.
Targets in the New Zealand Waste Strategy: 2006 Review of Progress 3
1.4 Targets in the Strategy The New Zealand Waste Strategy targets were initially developed by the Waste Minimisation and Management Working Group. The targets focus on priority actions and waste streams identified in the Strategy: • waste minimisation • organic waste • special waste • construction and demolition waste • hazardous waste and contaminated sites • organochlorines • trade waste and waste disposal. While the targets were being developed it was recognised that information on waste flows and volumes used to set the targets was incomplete. For that reason, the New Zealand Waste Strategy states that the targets should be considered “goal statements rather than mandatory requirements”. The Strategy specifically provides for regular reviews of the targets. The expectation at the time was that improved information would either confirm the targets or inform their revision. There was also an expectation that local government would take the targets into account and progressively develop a set of their own localised targets to drive community action in waste management and minimisation. In particular, local government can set such localised targets through their waste management plans. A number of councils have adopted the Strategy targets as their localised targets through this mechanism.
1.5 Findings of the 2003 Review of Targets A preliminary review of the Strategy targets was undertaken in 2003. The resulting report, Review of Targets in the New Zealand Waste Strategy (Ministry for the Environment, 2004d), found that implementation of the Strategy was progressing positively. A key conclusion was that while some targets in the Strategy were likely to be readily achieved, the Strategy was still in the early stages of implementation and so progress towards many targets was difficult to assess. It was therefore recommended that a further review of targets be considered in 2006. The review did, however, identify several actions that would help improve the interpretation and implementation of the targets and allow future progress against targets to be better measured. The main findings of the 2003 review are summarised in the table below.
4 Targets in the New Zealand Waste Strategy: 2006 Review of Progress
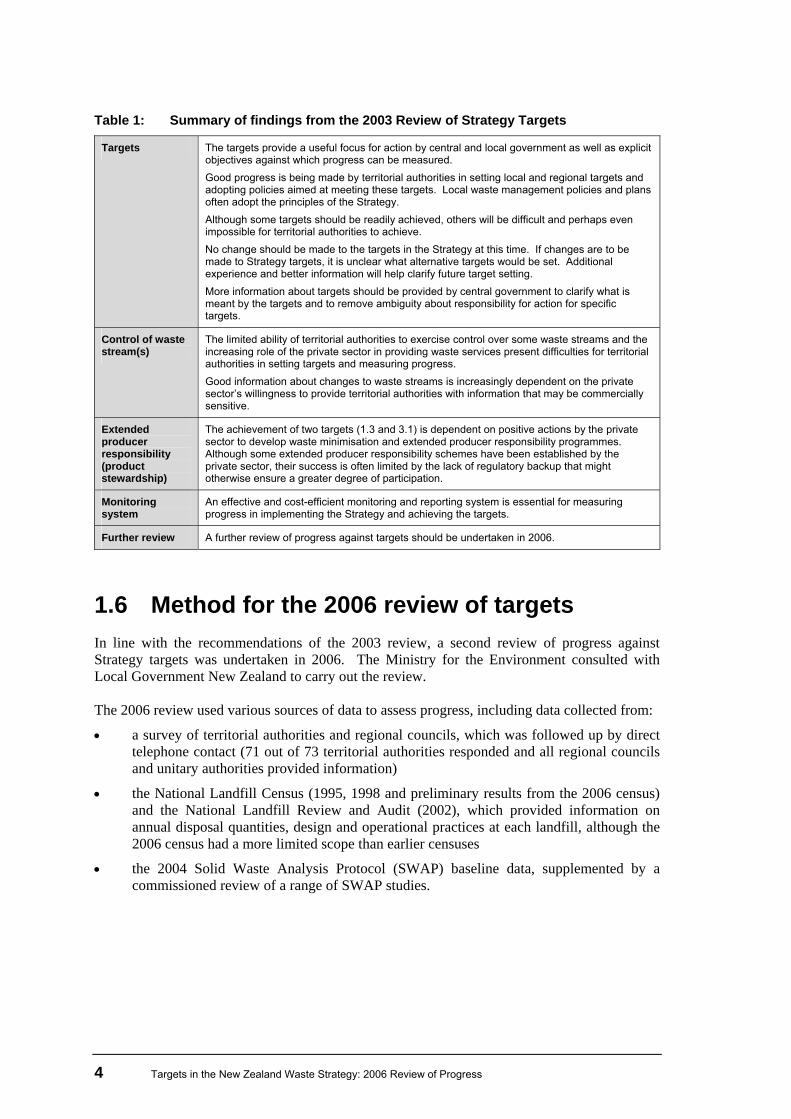
Table 1: Summary of findings from the 2003 Review of Strategy Targets
Targets The targets provide a useful focus for action by central and local government as well as explicit objectives against which progress can be measured. Good progress is being made by territorial authorities in setting local and regional targets and adopting policies aimed at meeting these targets. Local waste management policies and plans often adopt the principles of the Strategy. Although some targets should be readily achieved, others will be difficult and perhaps even impossible for territorial authorities to achieve. No change should be made to the targets in the Strategy at this time. If changes are to be made to Strategy targets, it is unclear what alternative targets would be set. Additional experience and better information will help clarify future target setting. More information about targets should be provided by central government to clarify what is meant by the targets and to remove ambiguity about responsibility for action for specific targets.
Control of waste stream(s)
The limited ability of territorial authorities to exercise control over some waste streams and the increasing role of the private sector in providing waste services present difficulties for territorial authorities in setting targets and measuring progress. Good information about changes to waste streams is increasingly dependent on the private sector’s willingness to provide territorial authorities with information that may be commercially sensitive.
Extended producer responsibility (product stewardship)
The achievement of two targets (1.3 and 3.1) is dependent on positive actions by the private sector to develop waste minimisation and extended producer responsibility programmes. Although some extended producer responsibility schemes have been established by the private sector, their success is often limited by the lack of regulatory backup that might otherwise ensure a greater degree of participation.
Monitoring system
An effective and cost-efficient monitoring and reporting system is essential for measuring progress in implementing the Strategy and achieving the targets.
Further review A further review of progress against targets should be undertaken in 2006.
1.6 Method for the 2006 review of targets In line with the recommendations of the 2003 review, a second review of progress against Strategy targets was undertaken in 2006. The Ministry for the Environment consulted with Local Government New Zealand to carry out the review. The 2006 review used various sources of data to assess progress, including data collected from:
• a survey of territorial authorities and regional councils, which was followed up by direct telephone contact (71 out of 73 territorial authorities responded and all regional councils and unitary authorities provided information)
• the National Landfill Census (1995, 1998 and preliminary results from the 2006 census) and the National Landfill Review and Audit (2002), which provided information on annual disposal quantities, design and operational practices at each landfill, although the 2006 census had a more limited scope than earlier censuses
• the 2004 Solid Waste Analysis Protocol (SWAP) baseline data, supplemented by a commissioned review of a range of SWAP studies.
Targets in the New Zealand Waste Strategy: 2006 Review of Progress 5
Additional information drawn from national databases was also used in the review, including:
• WINFO – a database containing information on the public wastewater treatment infrastructure in New Zealand (the database was established jointly by the New Zealand Water and Waste Association and the Ministry for the Environment, and data population of the database began in June 2006)
• WasteTRACK – a national hazardous waste-tracking system implemented by the Ministry for the Environment
• Tyretrack – a nationwide tracking system for used tyres established by the Motor Trades Association and the Ministry for the Environment.
Information was also provided by the private sector through personal contacts and industry working groups. A full list of published sources of data is provided in the References section of this report.
1.7 Limitations of the data The 2003 review of Strategy targets proposed a monitoring and evaluation system for waste that would: • consistently measure and report on waste data • collect data only when required for assessing progress towards meeting targets • be as simple as possible. The methodology used in the 2006 review meets these criteria. Although the data collected has not been independently verified or validated, every attempt has been made, through direct contact with territorial authorities and industry groups, to ensure that the data has been correctly interpreted. Waste composition data is based on physically sorting or visually estimating the proportion of various components in a small sample of the total waste stream. The SWAP methodology ensures that the results have some statistical validity. However, it should be remembered that the results are indicative rather than definitive, particularly for smaller components of the waste stream. The specification for the SWAP baseline programme was to measure the three major components of the waste stream (organic waste, paper, plastics) to an accuracy of plus or minus 20 per cent. The accuracy for other waste streams is likely to be much lower.
6 Targets in the New Zealand Waste Strategy: 2006 Review of Progress
The 2003 review also recommended that the proposed monitoring and evaluation system include a national survey of cleanfills.1 At the time, it was anticipated that a pilot data collection exercise conducted in the Waikato and Bay of Plenty regions could be extended to develop a nationally consistent methodology for estimating the amount and composition of material disposed of at cleanfills. However, because many cleanfills are temporary and permitted under various district and regional plans, and all are privately owned, the pilot exercise did not prove as useful in this respect as first hoped. As a result, no national survey has been undertaken. All cleanfill information used in this report is therefore based on data provided by territorial authorities, or as estimated in the report Waste Composition and Construction Waste Data (Waste Not Consulting, 2006). Construction and demolition waste diversion rates are derived from a mix of information provided by industry and other sources.
1 Refer to section 2 for a definition of and more information on cleanfills.
Targets in the New Zealand Waste Strategy: 2006 Review of Progress 7
2 Overview of progress in implementing the Strategy
2.1 Introduction A review of progress against targets in the New Zealand Waste Strategy provides a snapshot of how well we are doing in relation to specific waste streams and actions. It does not necessarily reflect wider changes in waste management, waste minimisation and resource use that have occurred since the Strategy was launched. This section therefore provides a brief overview of the New Zealand waste landscape and the changes that have occurred since the introduction of the New Zealand Waste Strategy in 2002.
2.2 Waste disposal
2.2.1 Landfills
New Zealand landfill management practices are monitored through the National Landfill Review and Audit programme and the Landfill Census programme. A landfill census was carried out in 1995, 1998 and 2006. The results of the 2006 landfill census will be published later this year. However, because it presents the most up to date information available, raw data from the 2006 census is used in this report. A landfill review and audit was conducted in 2002. These surveys show that there has been a significant improvement in the management of landfills across New Zealand. Improvements include:
• an increase in the proportion of sites with an engineered liner from 20 per cent in 2002 to 52 per cent in 2006
• improvement in leachate collection at landfill sites from 47 per cent of all sites in 2002 to 78 per cent in 2006, with some of the remaining landfills having natural outlets for leachate
• 93 per cent of landfills now measure the amount of waste being disposed of, an increase from 83 per cent in 2002.
Overall, the number of operating landfills has dropped from 115 in 2002 to 60 in 2006 (see Figure 1), and a further eight to 10 are due to close over the next 24 months. Further information on landfill management and details of previous audit information are provided in section 3.
8 Targets in the New Zealand Waste Strategy: 2006 Review of Progress
2.2.2 Solid waste to landfill
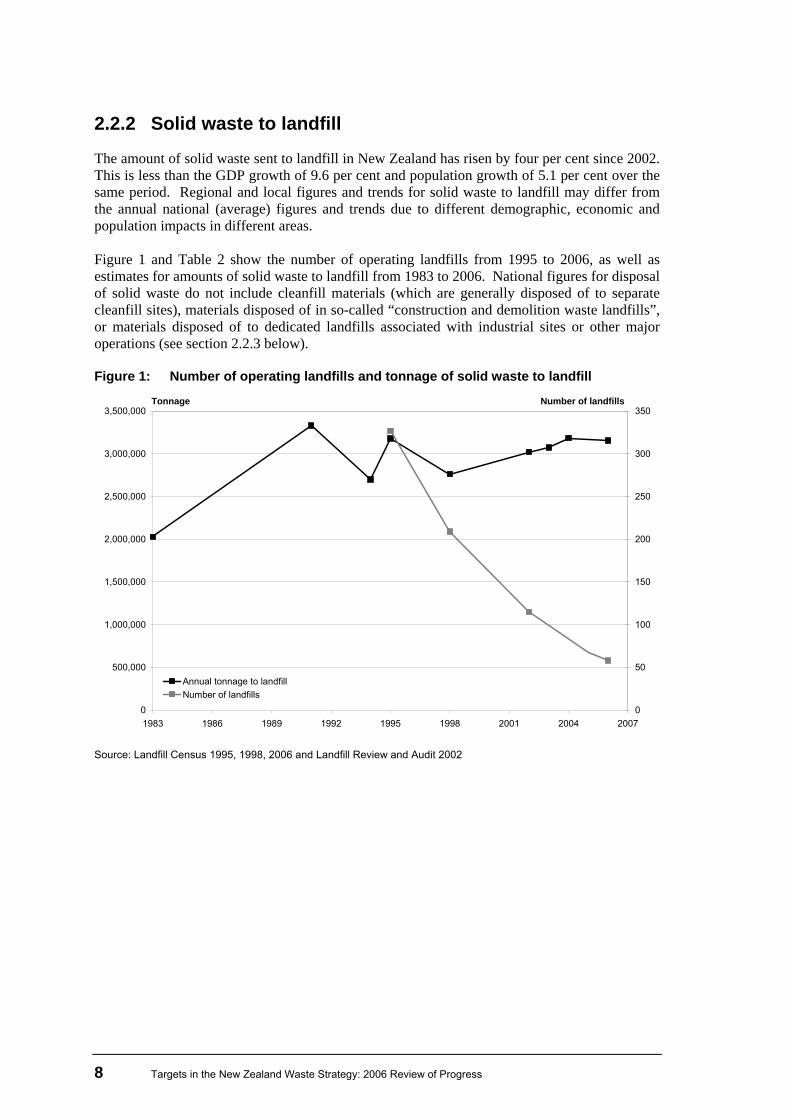
The amount of solid waste sent to landfill in New Zealand has risen by four per cent since 2002. This is less than the GDP growth of 9.6 per cent and population growth of 5.1 per cent over the same period. Regional and local figures and trends for solid waste to landfill may differ from the annual national (average) figures and trends due to different demographic, economic and population impacts in different areas. Figure 1 and Table 2 show the number of operating landfills from 1995 to 2006, as well as estimates for amounts of solid waste to landfill from 1983 to 2006. National figures for disposal of solid waste do not include cleanfill materials (which are generally disposed of to separate cleanfill sites), materials disposed of in so-called “construction and demolition waste landfills”, or materials disposed of to dedicated landfills associated with industrial sites or other major operations (see section 2.2.3 below). Figure 1: Number of operating landfills and tonnage of solid waste to landfill
0
500,000
1,000,000
1,500,000
2,000,000
2,500,000
3,000,000
3,500,000
1983 1986 1989 1992 1995 1998 2001 2004 20070
50
100
150
200
250
300
350
Annual tonnage to landfillNumber of landfills
Tonnage Number of landfills
Source: Landfill Census 1995, 1998, 2006 and Landfill Review and Audit 2002
Targets in the New Zealand Waste Strategy: 2006 Review of Progress 9
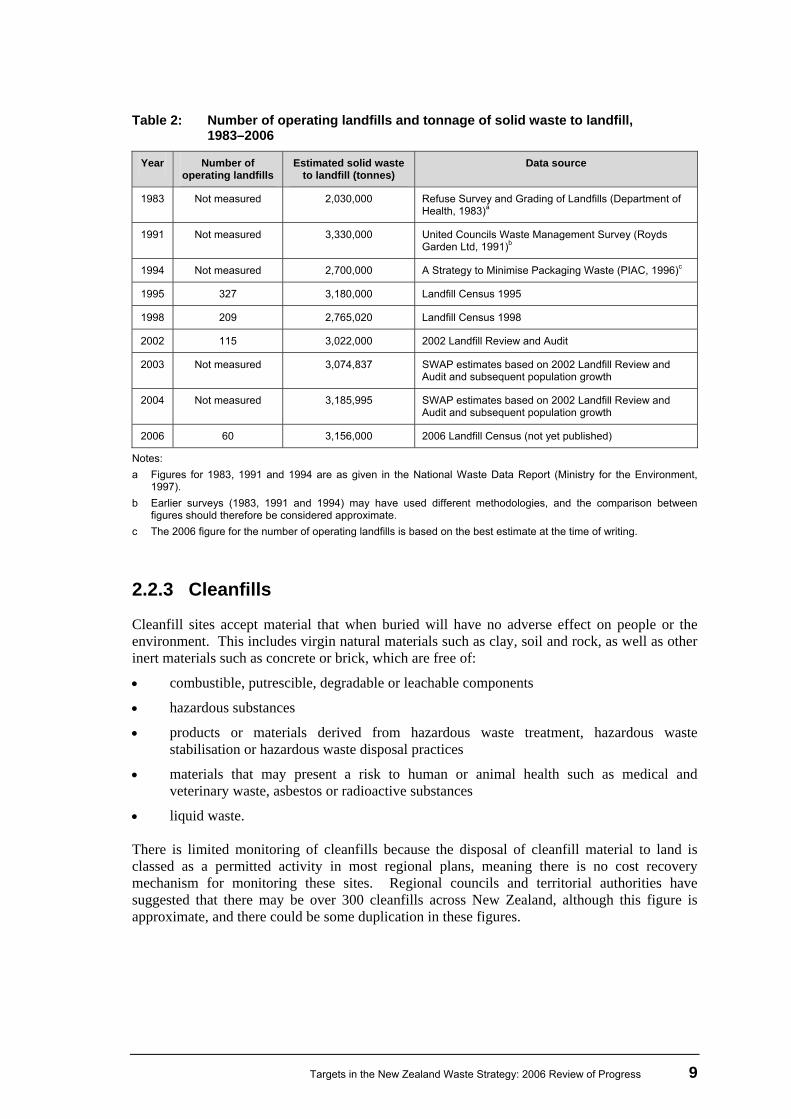
Table 2: Number of operating landfills and tonnage of solid waste to landfill, 1983–2006
Year Number of operating landfills
Estimated solid waste to landfill (tonnes)
Data source
1983 Not measured 2,030,000 Refuse Survey and Grading of Landfills (Department of Health, 1983)a
1991 Not measured 3,330,000 United Councils Waste Management Survey (Royds Garden Ltd, 1991)b
1994 Not measured 2,700,000 A Strategy to Minimise Packaging Waste (PIAC, 1996)c
1995 327 3,180,000 Landfill Census 1995
1998 209 2,765,020 Landfill Census 1998
2002 115 3,022,000 2002 Landfill Review and Audit
2003 Not measured 3,074,837 SWAP estimates based on 2002 Landfill Review and Audit and subsequent population growth
2004 Not measured 3,185,995 SWAP estimates based on 2002 Landfill Review and Audit and subsequent population growth
2006 60 3,156,000 2006 Landfill Census (not yet published)
Notes: a Figures for 1983, 1991 and 1994 are as given in the National Waste Data Report (Ministry for the Environment,
1997). b Earlier surveys (1983, 1991 and 1994) may have used different methodologies, and the comparison between
figures should therefore be considered approximate. c The 2006 figure for the number of operating landfills is based on the best estimate at the time of writing.
2.2.3 Cleanfills
Cleanfill sites accept material that when buried will have no adverse effect on people or the environment. This includes virgin natural materials such as clay, soil and rock, as well as other inert materials such as concrete or brick, which are free of:
• combustible, putrescible, degradable or leachable components
• hazardous substances
• products or materials derived from hazardous waste treatment, hazardous waste stabilisation or hazardous waste disposal practices
• materials that may present a risk to human or animal health such as medical and veterinary waste, asbestos or radioactive substances
• liquid waste. There is limited monitoring of cleanfills because the disposal of cleanfill material to land is classed as a permitted activity in most regional plans, meaning there is no cost recovery mechanism for monitoring these sites. Regional councils and territorial authorities have suggested that there may be over 300 cleanfills across New Zealand, although this figure is approximate, and there could be some duplication in these figures.
10 Targets in the New Zealand Waste Strategy: 2006 Review of Progress
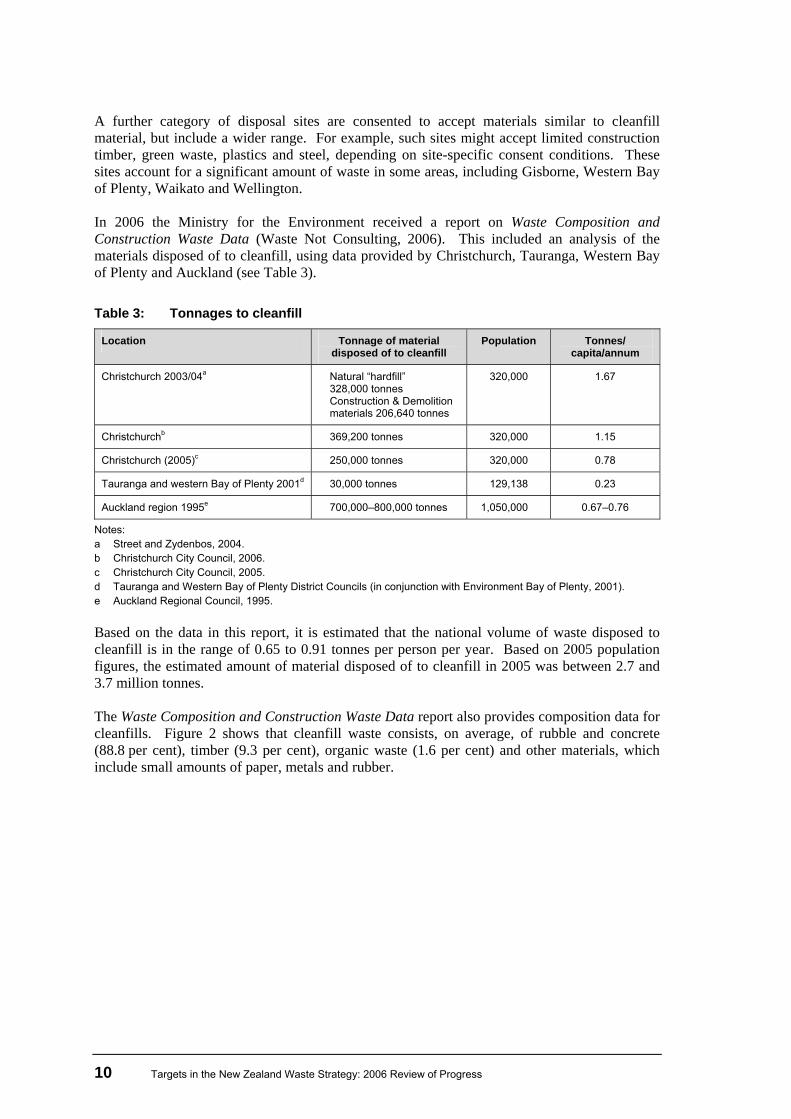
A further category of disposal sites are consented to accept materials similar to cleanfill material, but include a wider range. For example, such sites might accept limited construction timber, green waste, plastics and steel, depending on site-specific consent conditions. These sites account for a significant amount of waste in some areas, including Gisborne, Western Bay of Plenty, Waikato and Wellington. In 2006 the Ministry for the Environment received a report on Waste Composition and Construction Waste Data (Waste Not Consulting, 2006). This included an analysis of the materials disposed of to cleanfill, using data provided by Christchurch, Tauranga, Western Bay of Plenty and Auckland (see Table 3). Table 3: Tonnages to cleanfill
Location Tonnage of material disposed of to cleanfill
Population Tonnes/ capita/annum
Christchurch 2003/04a Natural “hardfill” 328,000 tonnes Construction & Demolition materials 206,640 tonnes
320,000 1.67
Christchurchb 369,200 tonnes 320,000 1.15
Christchurch (2005)c 250,000 tonnes 320,000 0.78
Tauranga and western Bay of Plenty 2001d 30,000 tonnes 129,138 0.23
Auckland region 1995e 700,000–800,000 tonnes 1,050,000 0.67–0.76
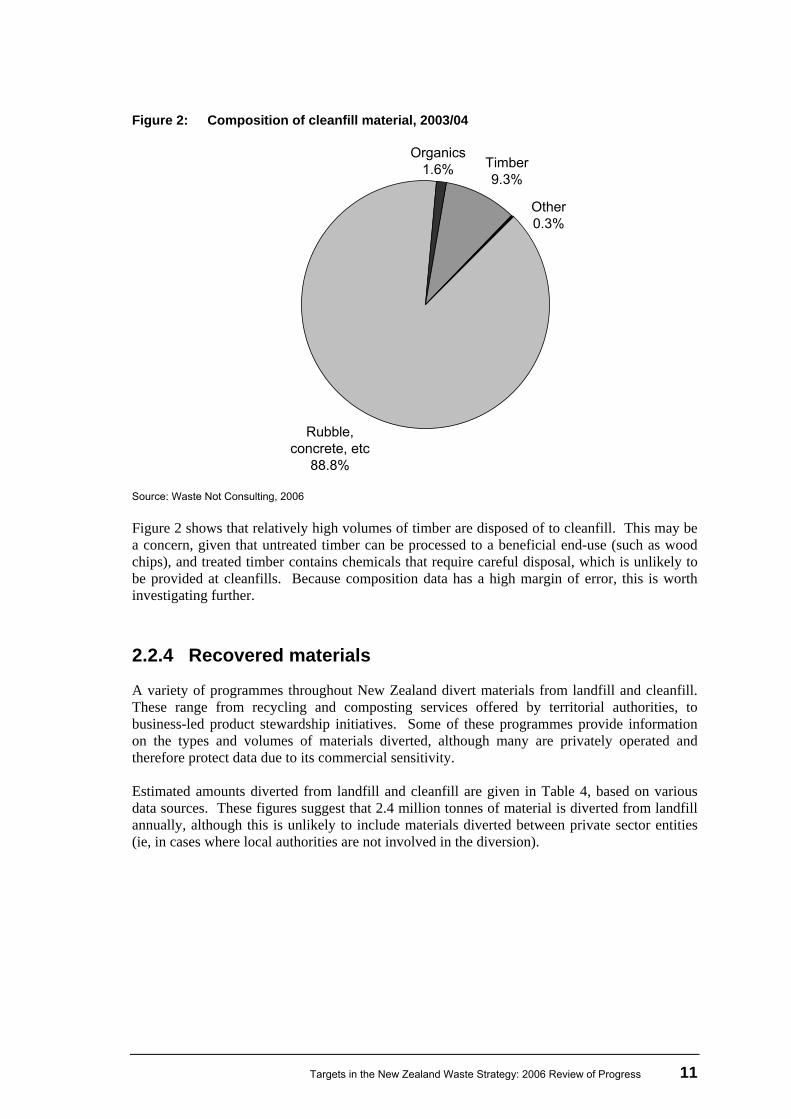
Notes: a Street and Zydenbos, 2004. b Christchurch City Council, 2006. c Christchurch City Council, 2005. d Tauranga and Western Bay of Plenty District Councils (in conjunction with Environment Bay of Plenty, 2001). e Auckland Regional Council, 1995. Based on the data in this report, it is estimated that the national volume of waste disposed to cleanfill is in the range of 0.65 to 0.91 tonnes per person per year. Based on 2005 population figures, the estimated amount of material disposed of to cleanfill in 2005 was between 2.7 and 3.7 million tonnes. The Waste Composition and Construction Waste Data report also provides composition data for cleanfills. Figure 2 shows that cleanfill waste consists, on average, of rubble and concrete (88.8 per cent), timber (9.3 per cent), organic waste (1.6 per cent) and other materials, which include small amounts of paper, metals and rubber.
Targets in the New Zealand Waste Strategy: 2006 Review of Progress 11
Figure 2: Composition of cleanfill material, 2003/04
Rubble, concrete, etc
88.8%
Timber9.3%
Organics1.6%
Other0.3%
Source: Waste Not Consulting, 2006 Figure 2 shows that relatively high volumes of timber are disposed of to cleanfill. This may be a concern, given that untreated timber can be processed to a beneficial end-use (such as wood chips), and treated timber contains chemicals that require careful disposal, which is unlikely to be provided at cleanfills. Because composition data has a high margin of error, this is worth investigating further.
2.2.4 Recovered materials
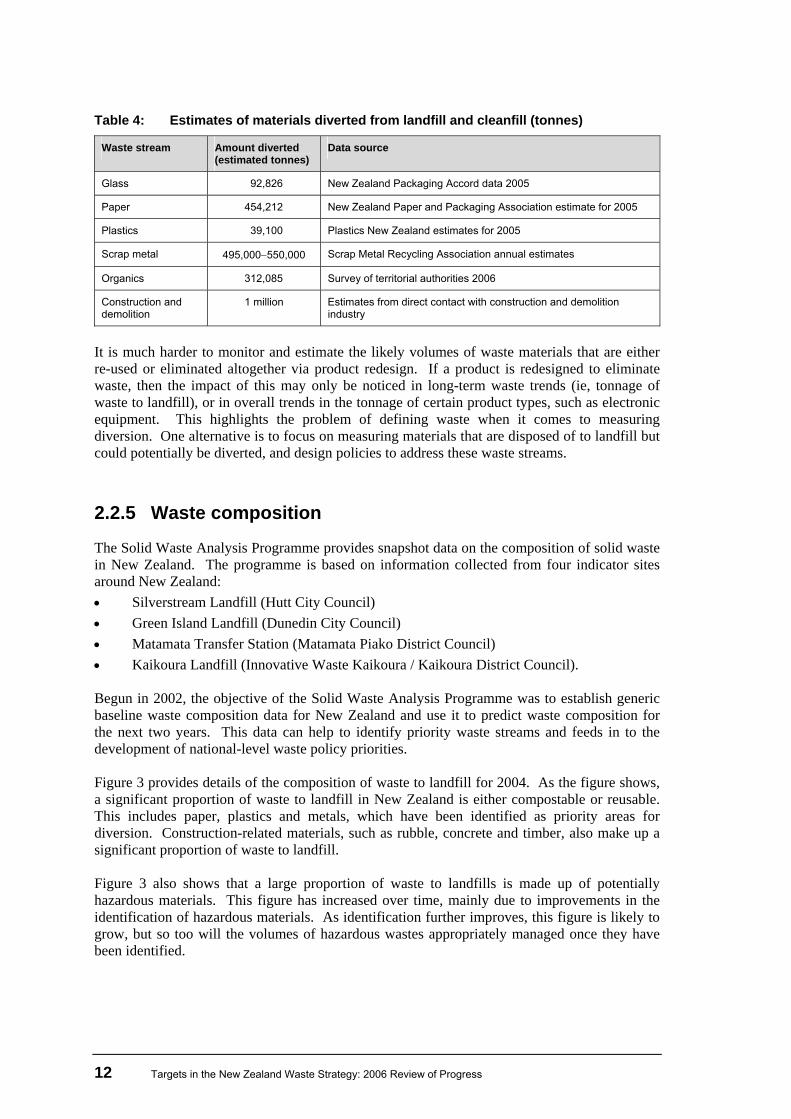
A variety of programmes throughout New Zealand divert materials from landfill and cleanfill. These range from recycling and composting services offered by territorial authorities, to business-led product stewardship initiatives. Some of these programmes provide information on the types and volumes of materials diverted, although many are privately operated and therefore protect data due to its commercial sensitivity. Estimated amounts diverted from landfill and cleanfill are given in Table 4, based on various data sources. These figures suggest that 2.4 million tonnes of material is diverted from landfill annually, although this is unlikely to include materials diverted between private sector entities (ie, in cases where local authorities are not involved in the diversion).
12 Targets in the New Zealand Waste Strategy: 2006 Review of Progress
Table 4: Estimates of materials diverted from landfill and cleanfill (tonnes)
Waste stream Amount diverted (estimated tonnes)
Data source
Glass 92,826 New Zealand Packaging Accord data 2005
Paper 454,212 New Zealand Paper and Packaging Association estimate for 2005
Plastics 39,100 Plastics New Zealand estimates for 2005
Scrap metal 495,000−550,000 Scrap Metal Recycling Association annual estimates
Organics 312,085 Survey of territorial authorities 2006
Construction and demolition
1 million Estimates from direct contact with construction and demolition industry
It is much harder to monitor and estimate the likely volumes of waste materials that are either re-used or eliminated altogether via product redesign. If a product is redesigned to eliminate waste, then the impact of this may only be noticed in long-term waste trends (ie, tonnage of waste to landfill), or in overall trends in the tonnage of certain product types, such as electronic equipment. This highlights the problem of defining waste when it comes to measuring diversion. One alternative is to focus on measuring materials that are disposed of to landfill but could potentially be diverted, and design policies to address these waste streams.
2.2.5 Waste composition
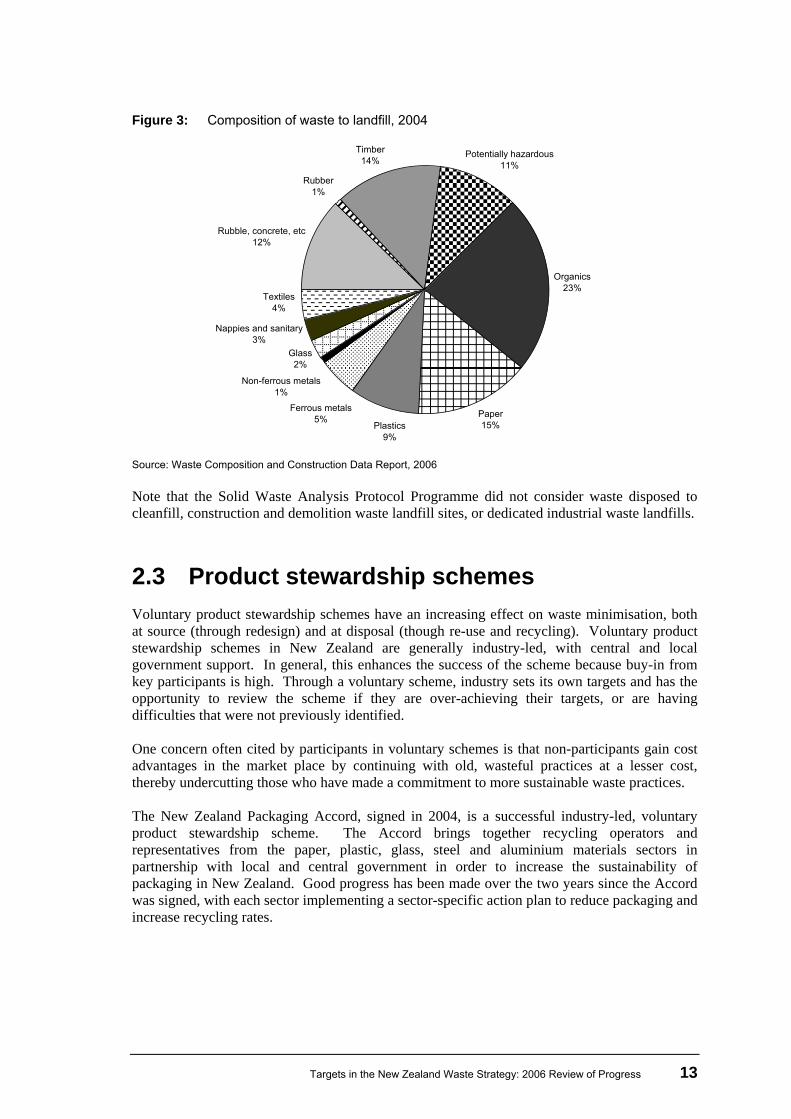
The Solid Waste Analysis Programme provides snapshot data on the composition of solid waste in New Zealand. The programme is based on information collected from four indicator sites around New Zealand: • Silverstream Landfill (Hutt City Council) • Green Island Landfill (Dunedin City Council) • Matamata Transfer Station (Matamata Piako District Council) • Kaikoura Landfill (Innovative Waste Kaikoura / Kaikoura District Council). Begun in 2002, the objective of the Solid Waste Analysis Programme was to establish generic baseline waste composition data for New Zealand and use it to predict waste composition for the next two years. This data can help to identify priority waste streams and feeds in to the development of national-level waste policy priorities. Figure 3 provides details of the composition of waste to landfill for 2004. As the figure shows, a significant proportion of waste to landfill in New Zealand is either compostable or reusable. This includes paper, plastics and metals, which have been identified as priority areas for diversion. Construction-related materials, such as rubble, concrete and timber, also make up a significant proportion of waste to landfill. Figure 3 also shows that a large proportion of waste to landfills is made up of potentially hazardous materials. This figure has increased over time, mainly due to improvements in the identification of hazardous materials. As identification further improves, this figure is likely to grow, but so too will the volumes of hazardous wastes appropriately managed once they have been identified.
Targets in the New Zealand Waste Strategy: 2006 Review of Progress 13
Figure 3: Composition of waste to landfill, 2004
Rubble, concrete, etc12%
Rubber1%
Timber14%
Organics23%
Paper15%
Glass2%
Plastics9%
Ferrous metals5%
Non-ferrous metals1%
Nappies and sanitary3%
Textiles4%
Potentially hazardous11%
Source: Waste Composition and Construction Data Report, 2006 Note that the Solid Waste Analysis Protocol Programme did not consider waste disposed to cleanfill, construction and demolition waste landfill sites, or dedicated industrial waste landfills.
2.3 Product stewardship schemes Voluntary product stewardship schemes have an increasing effect on waste minimisation, both at source (through redesign) and at disposal (though re-use and recycling). Voluntary product stewardship schemes in New Zealand are generally industry-led, with central and local government support. In general, this enhances the success of the scheme because buy-in from key participants is high. Through a voluntary scheme, industry sets its own targets and has the opportunity to review the scheme if they are over-achieving their targets, or are having difficulties that were not previously identified. One concern often cited by participants in voluntary schemes is that non-participants gain cost advantages in the market place by continuing with old, wasteful practices at a lesser cost, thereby undercutting those who have made a commitment to more sustainable waste practices. The New Zealand Packaging Accord, signed in 2004, is a successful industry-led, voluntary product stewardship scheme. The Accord brings together recycling operators and representatives from the paper, plastic, glass, steel and aluminium materials sectors in partnership with local and central government in order to increase the sustainability of packaging in New Zealand. Good progress has been made over the two years since the Accord was signed, with each sector implementing a sector-specific action plan to reduce packaging and increase recycling rates.
14 Targets in the New Zealand Waste Strategy: 2006 Review of Progress
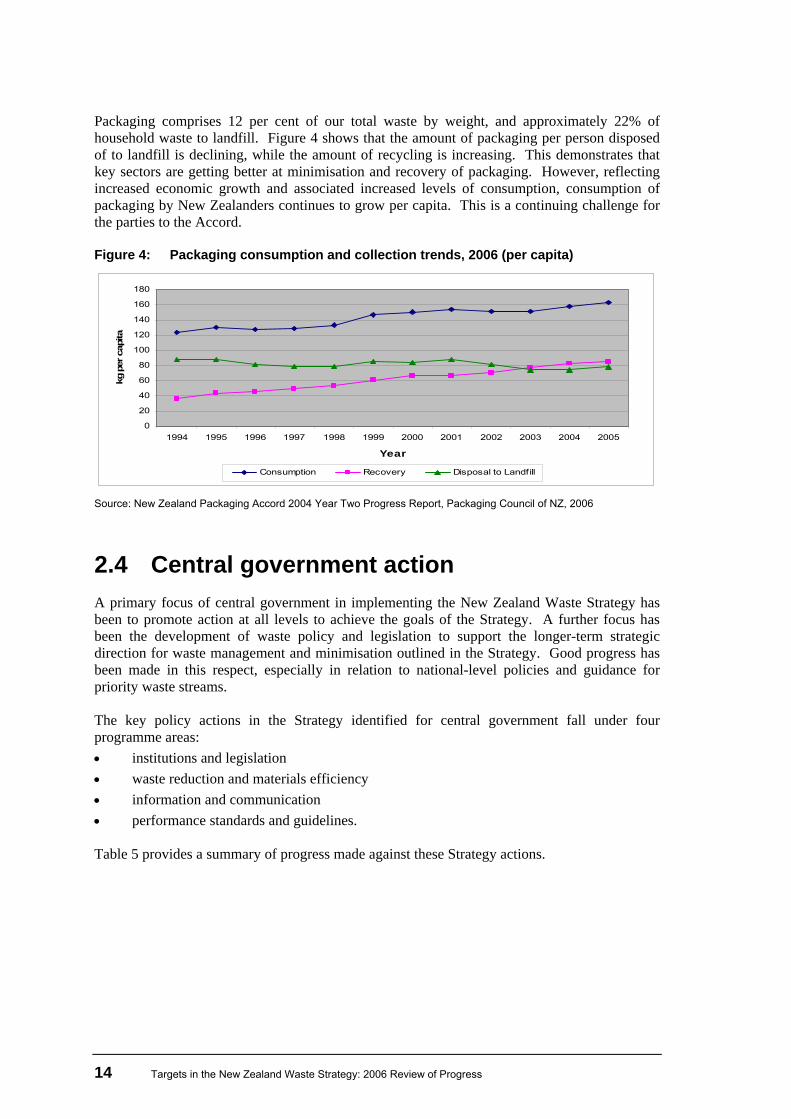
Packaging comprises 12 per cent of our total waste by weight, and approximately 22% of household waste to landfill. Figure 4 shows that the amount of packaging per person disposed of to landfill is declining, while the amount of recycling is increasing. This demonstrates that key sectors are getting better at minimisation and recovery of packaging. However, reflecting increased economic growth and associated increased levels of consumption, consumption of packaging by New Zealanders continues to grow per capita. This is a continuing challenge for the parties to the Accord. Figure 4: Packaging consumption and collection trends, 2006 (per capita)
0
20
40
60
80
100
120
140
160
180
1994 1995 1996 1997 1998 1999 2000 2001 2002 2003 2004 2005
Year
kg p
er c
apita
Consumption Recovery Disposal to Landfill
Source: New Zealand Packaging Accord 2004 Year Two Progress Report, Packaging Council of NZ, 2006
2.4 Central government action A primary focus of central government in implementing the New Zealand Waste Strategy has been to promote action at all levels to achieve the goals of the Strategy. A further focus has been the development of waste policy and legislation to support the longer-term strategic direction for waste management and minimisation outlined in the Strategy. Good progress has been made in this respect, especially in relation to national-level policies and guidance for priority waste streams. The key policy actions in the Strategy identified for central government fall under four programme areas: • institutions and legislation • waste reduction and materials efficiency • information and communication • performance standards and guidelines. Table 5 provides a summary of progress made against these Strategy actions.
Targets in the New Zealand Waste Strategy: 2006 Review of Progress 15
Table 5: Progress against Strategy actions (central government)
Institutions and legislation
Regulation to control discharges of gaseous waste has been passed in the form of national environmental standards for air quality. Legislation to enable controls on the management of hazardous waste has been passed through provisions to enable group standards to be developed under the Hazardous Substances and New Organisms Act 1996. The Hazardous Substances and New Organisms (Stockholm Convention) Amendment 2003 has been passed, governing the management of persistent organic pollutants. The model Trade Waste By-Law has been developed. Progress has been limited in developing other specific waste legislation, although further legislation is under consideration in order to develop other tools and to manage and minimise solid waste.
Waste reduction and materials efficiency
The Govt3 Programme, which helps central government agencies become more sustainable, has enabled government agencies to lead by example in relation to waste minimisation and sustainable purchasing.
Information and communication
The development of nationwide monitoring schemes for some waste areas has enabled the collection of certain baseline information for waste composition to landfill, wastewater treatment plants and hazardous waste.
Performance standards and guidelines
Nationwide policies and best-practice guidance have been developed for landfills, cleanfills, hazardous waste, chemicals usage and contaminated sites. Additional guidance for territorial authorities has also been developed, including a New Zealand Standard for compost, kitchen waste collection, waste management planning and recycling contracts.
Central government has taken action to facilitate waste minimisation in the assets it manages through the Govt3 programme. This programme, which helps 47 central government agencies undertake sustainable initiatives, includes a recycling and waste minimisation component (its other core focus areas are buildings, transport, and office consumables and equipment). The Govt3 programme offers its members practical tools, information on best practice, and networking opportunities with other agencies that have undertaken successful waste minimisation initiatives.
Govt3 achievements in waste Experience has shown that government agencies that conduct a waste audit and implement a recycling system for the collection of paper, plastics (grades 1 and 2) and food waste will achieve at least a 50 per cent reduction in waste to landfill. Following are some examples.
Transit New Zealand
Transit New Zealand has an office waste-monitoring and management programme through which all regional offices and head office conduct annual waste audits. Between 2003 and 2006 Transit New Zealand achieved a reduction of 56 per cent in the amount of waste sent to landfill. Waste management is included in the Corporate Services Manual, which outlines agency procedures and policies, and staff receive regular emails to maintain their awareness.
Ministry for Economic Development
The Ministry for Economic Development started a full recycling scheme in its head office in January 2006. Within six months staff had reduced the Ministry’s landfill waste from 69 kg per person per year to 18 kg. Overall, this represents a reduction in waste to landfill of 62 per cent.
16 Targets in the New Zealand Waste Strategy: 2006 Review of Progress
The Treasury
A baseline audit in 2004 showed that 84 per cent of the Treasury’s waste could be recycled. As a result, a recycling system was established alongside an education promotion and communications plan for staff. Tools to support staff action on recycling include an information video, ongoing inter-floor recycling competitions, posters, an intranet site providing information on how the recycling system works, and a communication line to provide feedback on queries. The Treasury’s waste to landfill has reduced by 80 per cent to 18 kg per person per year.
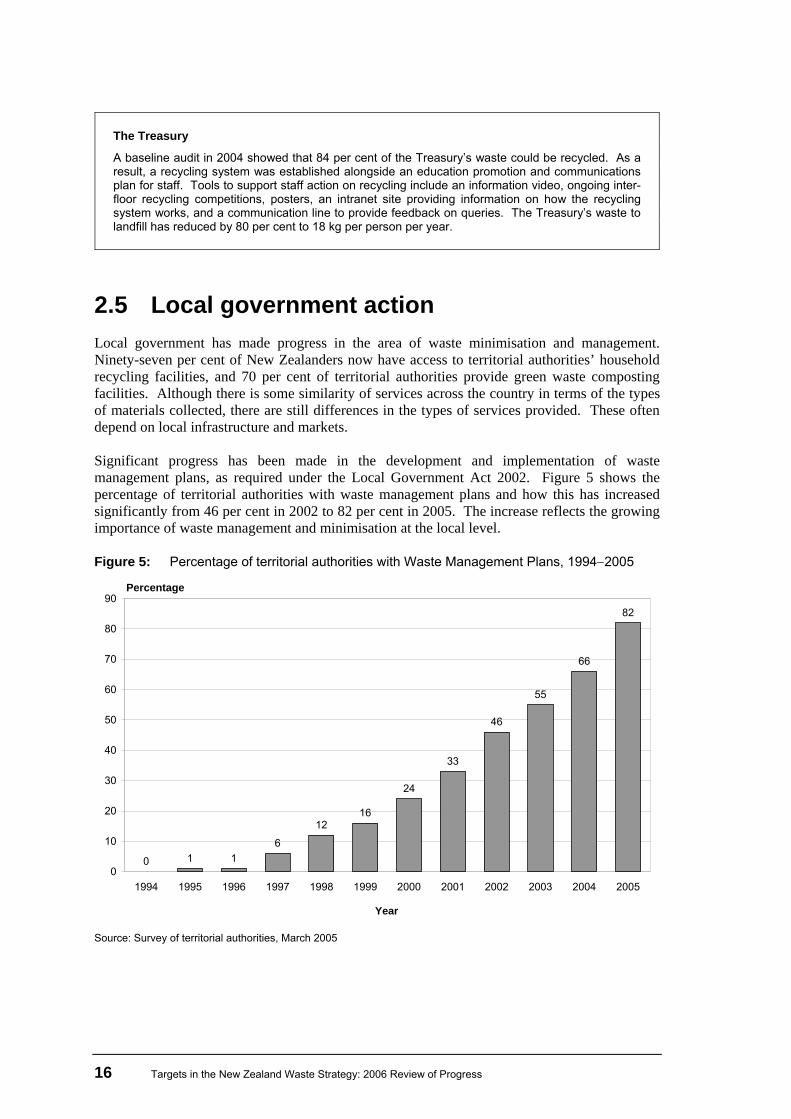
2.5 Local government action Local government has made progress in the area of waste minimisation and management. Ninety-seven per cent of New Zealanders now have access to territorial authorities’ household recycling facilities, and 70 per cent of territorial authorities provide green waste composting facilities. Although there is some similarity of services across the country in terms of the types of materials collected, there are still differences in the types of services provided. These often depend on local infrastructure and markets. Significant progress has been made in the development and implementation of waste management plans, as required under the Local Government Act 2002. Figure 5 shows the percentage of territorial authorities with waste management plans and how this has increased significantly from 46 per cent in 2002 to 82 per cent in 2005. The increase reflects the growing importance of waste management and minimisation at the local level. Figure 5: Percentage of territorial authorities with Waste Management Plans, 1994−2005
0 1 16
1216
24
33
46
55
66
82
0
10
20
30
40
50
60
70
80
90
1994 1995 1996 1997 1998 1999 2000 2001 2002 2003 2004 2005
Year
Percentage
Source: Survey of territorial authorities, March 2005
Targets in the New Zealand Waste Strategy: 2006 Review of Progress 17
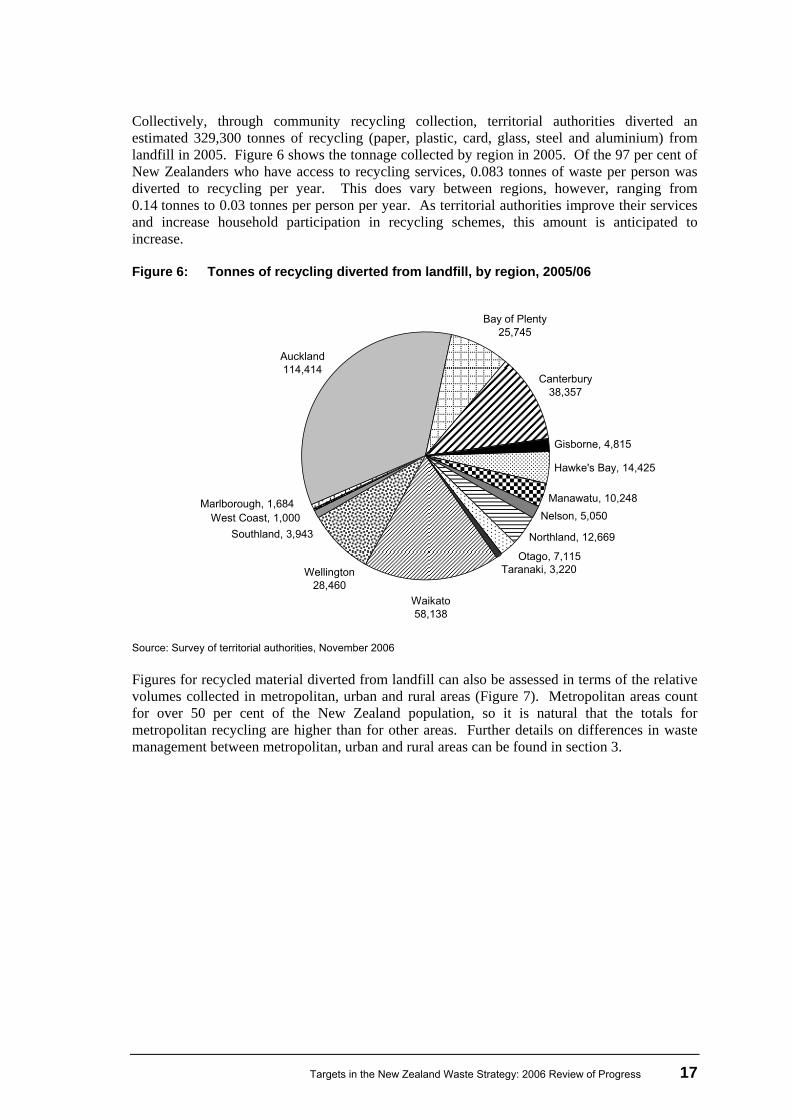
Collectively, through community recycling collection, territorial authorities diverted an estimated 329,300 tonnes of recycling (paper, plastic, card, glass, steel and aluminium) from landfill in 2005. Figure 6 shows the tonnage collected by region in 2005. Of the 97 per cent of New Zealanders who have access to recycling services, 0.083 tonnes of waste per person was diverted to recycling per year. This does vary between regions, however, ranging from 0.14 tonnes to 0.03 tonnes per person per year. As territorial authorities improve their services and increase household participation in recycling schemes, this amount is anticipated to increase. Figure 6: Tonnes of recycling diverted from landfill, by region, 2005/06
Gisborne, 4,815
Hawke's Bay, 14,425
Manawatu, 10,248
Taranaki, 3,220Otago, 7,115
Northland, 12,669
Nelson, 5,050
Southland, 3,943West Coast, 1,000
Marlborough, 1,684
Wellington28,460
Canterbury38,357
Bay of Plenty25,745
Auckland114,414
Waikato58,138
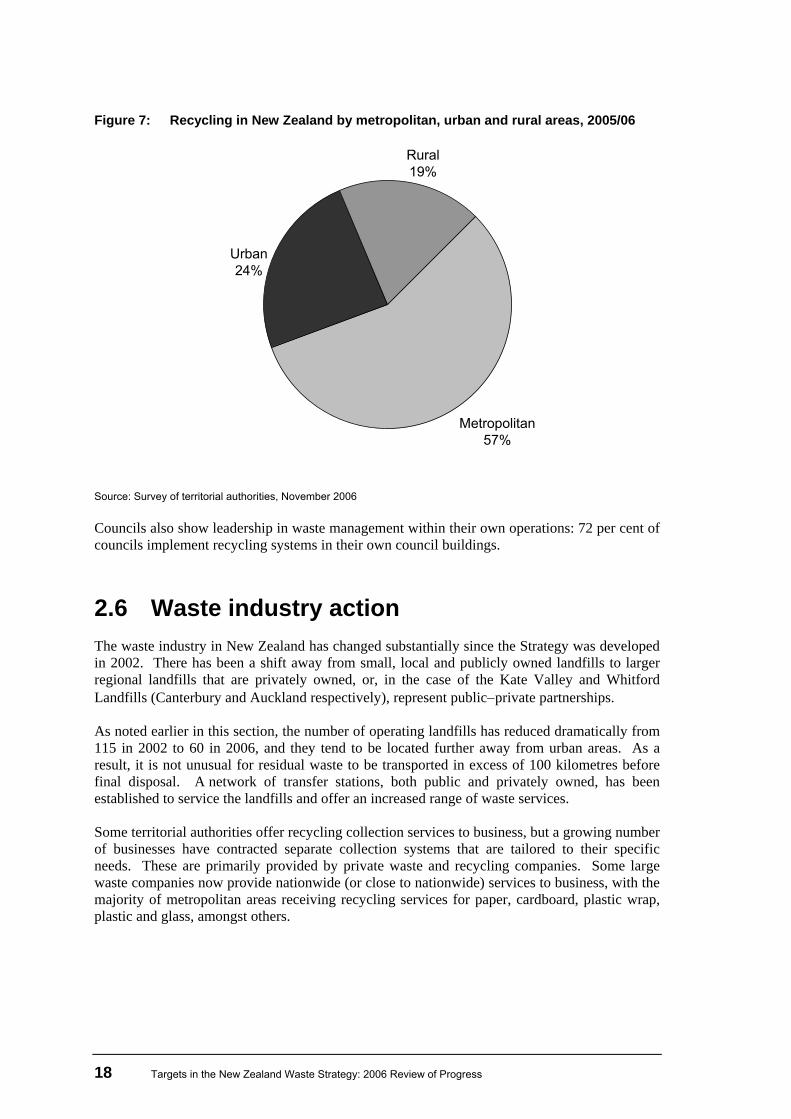
Source: Survey of territorial authorities, November 2006 Figures for recycled material diverted from landfill can also be assessed in terms of the relative volumes collected in metropolitan, urban and rural areas (Figure 7). Metropolitan areas count for over 50 per cent of the New Zealand population, so it is natural that the totals for metropolitan recycling are higher than for other areas. Further details on differences in waste management between metropolitan, urban and rural areas can be found in section 3.
18 Targets in the New Zealand Waste Strategy: 2006 Review of Progress
Figure 7: Recycling in New Zealand by metropolitan, urban and rural areas, 2005/06
Metropolitan57%
Rural19%
Urban24%
Source: Survey of territorial authorities, November 2006 Councils also show leadership in waste management within their own operations: 72 per cent of councils implement recycling systems in their own council buildings.
2.6 Waste industry action The waste industry in New Zealand has changed substantially since the Strategy was developed in 2002. There has been a shift away from small, local and publicly owned landfills to larger regional landfills that are privately owned, or, in the case of the Kate Valley and Whitford Landfills (Canterbury and Auckland respectively), represent public−private partnerships. As noted earlier in this section, the number of operating landfills has reduced dramatically from 115 in 2002 to 60 in 2006, and they tend to be located further away from urban areas. As a result, it is not unusual for residual waste to be transported in excess of 100 kilometres before final disposal. A network of transfer stations, both public and privately owned, has been established to service the landfills and offer an increased range of waste services. Some territorial authorities offer recycling collection services to business, but a growing number of businesses have contracted separate collection systems that are tailored to their specific needs. These are primarily provided by private waste and recycling companies. Some large waste companies now provide nationwide (or close to nationwide) services to business, with the majority of metropolitan areas receiving recycling services for paper, cardboard, plastic wrap, plastic and glass, amongst others.
Targets in the New Zealand Waste Strategy: 2006 Review of Progress 19
This increase in both geographical coverage and type of service offered to business is evidence of the waste industry evolving to meet greater market demand for recycling services. Some larger companies have significantly improved their waste management and minimisation activities because of the increasing cost of landfill disposal and the services now provided by the larger waste companies. Investment in resource recovery is also starting to grow. This is supported through direct investment in private infrastructure, or through territorial authority contracts. Many territorial authorities use a “design, build and implement” framework and have extended the length of contracts to support the level of investment needed. Examples of this include the development of the Living Earth composting facilities in Wellington, and the new 3-2-1 Zero Waste system in Timaru, which involves the design, building and operation of a new materials recovery facility. In Palmerston North the same approach has been taken, but in the form of a partnership between the waste and recycling contractor and the territorial authority.
20 Targets in the New Zealand Waste Strategy: 2006 Review of Progress
3 Review of Progress against Targets
3.1 Introduction This section presents the results of the 2006 review of progress against the New Zealand Waste Strategy targets and provides details of progress made in each priority area. Information on the priority areas in the Strategy is provided in seven sub-sections: • waste minimisation • organic waste • special waste • construction and demolition waste • hazardous waste and contaminated sites • organochlorines • trade waste and waste disposal. Each sub-section begins with a brief introduction to the waste stream under discussion, and goes on to provide a summary of progress against targets. This is followed by a detailed discussion of each target. This section of the report shows that much of the groundwork for achieving the Strategy’s wider goals and objectives for waste management, waste minimisation and resource efficiency has been laid, but that progress against the Strategy targets has been variable. Of the 30 targets in the New Zealand Waste Strategy, 10 have been achieved, achieved ahead of time, or have had significant progress made towards achieving them. Eight targets have a deadline to be achieved in future, so progress is considered in this report in general terms only. Three targets have not been achieved, and four targets were unable to be achieved. Progress against five targets was unable to be measured.
3.2 Waste minimisation
3.2.1 Introduction
The waste minimisation targets in the Strategy focus on the introduction of waste policies by local government, rather than management of specific waste streams. The progress of local government in achieving waste management and minimisation outcomes has been discussed briefly in the previous section. This section focuses specifically on waste minimisation targets.
Targets in the New Zealand Waste Strategy: 2006 Review of Progress 21
3.2.2 Summary of progress
A range of waste minimisation initiatives operate around New Zealand. Seventy-seven per cent of territorial authorities offer household recycling of paper, card, plastic, glass, and steel and aluminium cans, either through kerbside collections or drop-off facilities. Green waste disposal facilities are provided by 70 per cent of territorial authorities, and there are a number of trials for the kerbside collection of green waste, which in some areas includes food waste. In a number of localities, drop-off facilities have provisions for the collection of a wider selection of materials, including electronic and electrical waste, hazardous waste, batteries, waste oil and construction waste. There is some similarity of waste minimisation services throughout the country in terms of the types of materials collected, but there are still differences in the types of services provided. This often depends on local infrastructure and markets. When broken down into metropolitan, urban and rural areas, access to recycling services remains high in all areas, but access to kerbside recycling is significantly higher in metropolitan areas. Most territorial authorities have brought waste minimisation into their formal planning and budgeting cycles so funding for waste minimisation activities is prioritised against other council responsibilities. However, territorial authorities still vary in terms of how they implement waste minimisation activities. There have been some excellent achievements where there are specific drivers (such as high public demand or lack of landfill capacity), but in other areas performance largely depends on the degree to which the territorial authority has embraced the objectives of the New Zealand Waste Strategy. Regional councils, territorial authorities and central government have made good progress in incorporating waste minimisation into their own office practices, but expansion to other council-run buildings is limited by the available knowledge and opportunities. A range of voluntary programmes to reduce waste are available to the business sector. These range from Design for the Environment Guidelines 2006 (Plastics New Zealand 2006) though to business sustainability schemes. Case studies are emerging to illustrate examples where businesses have reduced waste and saved money, or redesigned and created market advantage. Highlighting success and providing practical information on how they achieved this will help other businesses achieve similar results. Waste minimisation is becoming an important consideration where public sector organisations are involved in new and refurbished buildings, especially in relation to construction and demolition waste and the installation of recycling infrastructure. Consideration of waste minimisation principles is gradually becoming the norm for new and redeveloped buildings, particularly in view of the development of environmental rating schemes and best practice guidelines.
Key findings
• Eighty-six per cent of territorial authorities report on waste minimisation and management initiatives annually.
• Seventy-two per cent of territorial authorities and regional councils have recycling facilities within their council buildings.
22 Targets in the New Zealand Waste Strategy: 2006 Review of Progress
• Access to domestic recycling has increased: 97 per cent of New Zealanders have access to domestic recycling facilities, either kerbside recycling or drop-off facilities, with 73 per cent of them at the kerbside.
• An estimated 329,300 tonnes of paper, glass, steel, cardboard, aluminium and plastics (grades 1 and 2) were recovered in 2005/06 through council recycling programmes.
3.2.3 Looking forward
Further opportunities to accelerate waste minimisation activities and standardise best practice across New Zealand need to be examined. These could include:
• sharing best practice among councils in waste diversion methodology
• promoting regional cooperation (ie, working across territorial authorities within a region)
• considering increased funding and additional funding mechanisms for waste minimisation activities, to expand the range of services available and increase participation in existing services
• drawing more heavily on international best practice and experience. Central government could support such activities through the further development of best practice guidelines and by reviewing underlying policy and legislation to ensure that any barriers to action are removed.
3.2.4 Review of progress
Target 1.1 Local authorities will report their progress on waste minimisation and management for their annual report in 2001/02 and quantitatively on an annual basis from then onwards.
Target date: 2001/02, then annually. Good progress towards target but not fully achieved
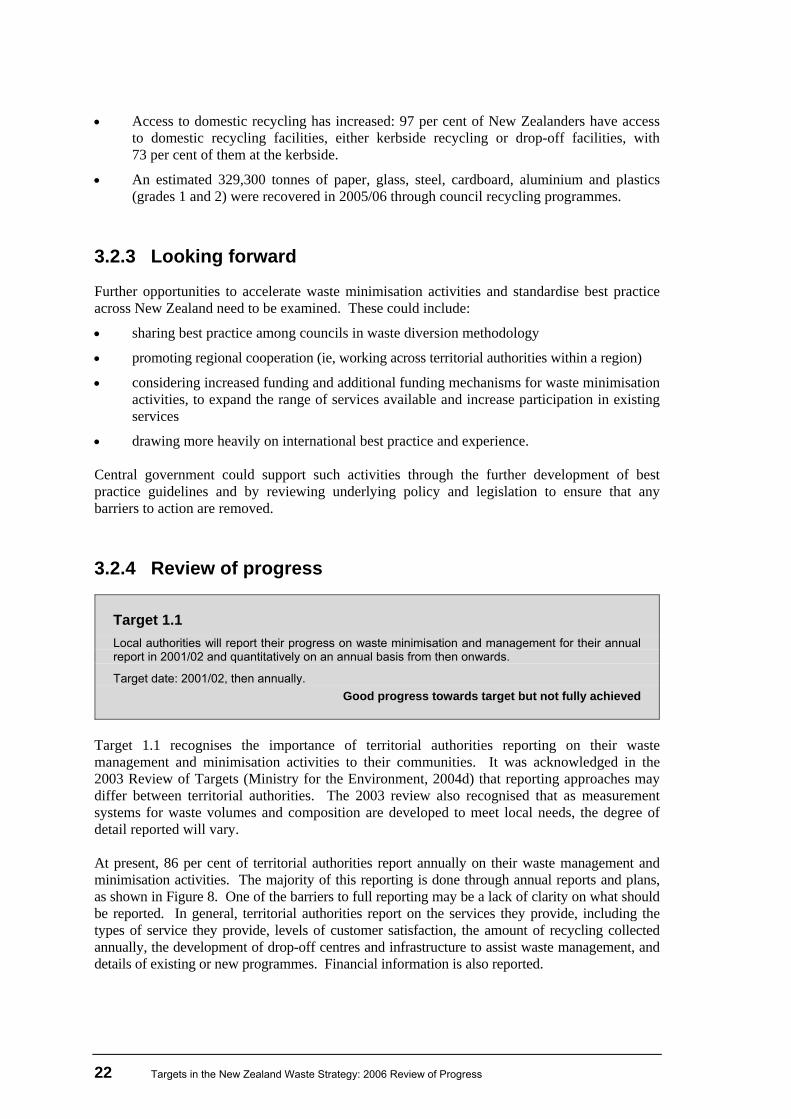
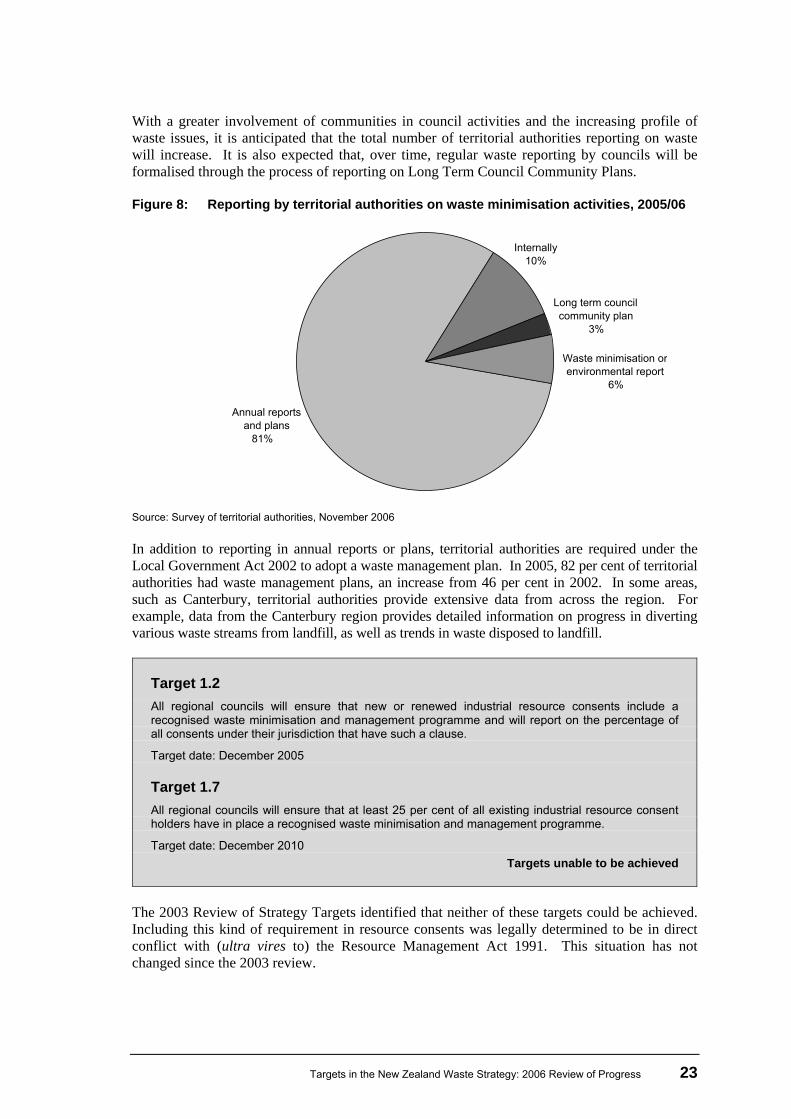
Target 1.1 recognises the importance of territorial authorities reporting on their waste management and minimisation activities to their communities. It was acknowledged in the 2003 Review of Targets (Ministry for the Environment, 2004d) that reporting approaches may differ between territorial authorities. The 2003 review also recognised that as measurement systems for waste volumes and composition are developed to meet local needs, the degree of detail reported will vary. At present, 86 per cent of territorial authorities report annually on their waste management and minimisation activities. The majority of this reporting is done through annual reports and plans, as shown in Figure 8. One of the barriers to full reporting may be a lack of clarity on what should be reported. In general, territorial authorities report on the services they provide, including the types of service they provide, levels of customer satisfaction, the amount of recycling collected annually, the development of drop-off centres and infrastructure to assist waste management, and details of existing or new programmes. Financial information is also reported.
Targets in the New Zealand Waste Strategy: 2006 Review of Progress 23
With a greater involvement of communities in council activities and the increasing profile of waste issues, it is anticipated that the total number of territorial authorities reporting on waste will increase. It is also expected that, over time, regular waste reporting by councils will be formalised through the process of reporting on Long Term Council Community Plans. Figure 8: Reporting by territorial authorities on waste minimisation activities, 2005/06
Source: Survey of territorial authorities, November 2006 In addition to reporting in annual reports or plans, territorial authorities are required under the Local Government Act 2002 to adopt a waste management plan. In 2005, 82 per cent of territorial authorities had waste management plans, an increase from 46 per cent in 2002. In some areas, such as Canterbury, territorial authorities provide extensive data from across the region. For example, data from the Canterbury region provides detailed information on progress in diverting various waste streams from landfill, as well as trends in waste disposed to landfill.
Target 1.2 All regional councils will ensure that new or renewed industrial resource consents include a recognised waste minimisation and management programme and will report on the percentage of all consents under their jurisdiction that have such a clause.
Target date: December 2005
Target 1.7 All regional councils will ensure that at least 25 per cent of all existing industrial resource consent holders have in place a recognised waste minimisation and management programme.
Target date: December 2010 Targets unable to be achieved
The 2003 Review of Strategy Targets identified that neither of these targets could be achieved. Including this kind of requirement in resource consents was legally determined to be in direct conflict with (ultra vires to) the Resource Management Act 1991. This situation has not changed since the 2003 review.
Long term council community plan
3%
Waste minimisation or environmental report
6%
Internally10%
Annual reports and plans
81%
24 Targets in the New Zealand Waste Strategy: 2006 Review of Progress
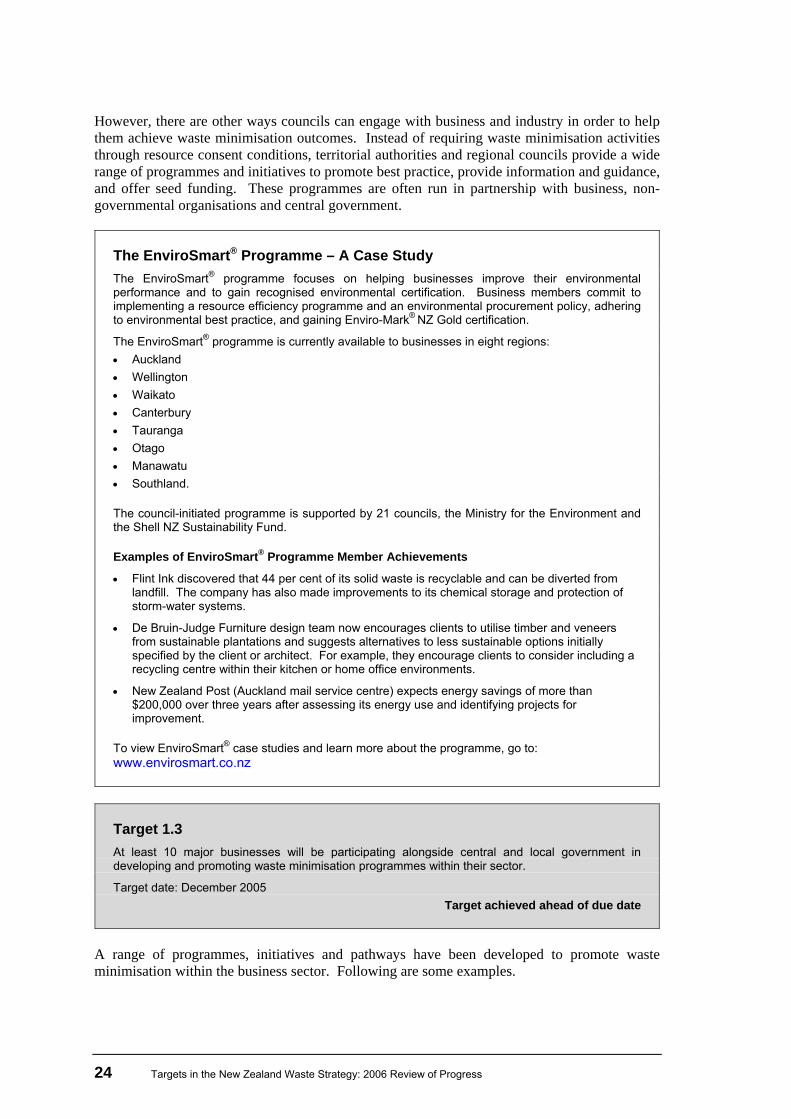
However, there are other ways councils can engage with business and industry in order to help them achieve waste minimisation outcomes. Instead of requiring waste minimisation activities through resource consent conditions, territorial authorities and regional councils provide a wide range of programmes and initiatives to promote best practice, provide information and guidance, and offer seed funding. These programmes are often run in partnership with business, non-governmental organisations and central government.
The EnviroSmart® Programme – A Case Study The EnviroSmart® programme focuses on helping businesses improve their environmental performance and to gain recognised environmental certification. Business members commit to implementing a resource efficiency programme and an environmental procurement policy, adhering to environmental best practice, and gaining Enviro-Mark® NZ Gold certification.
The EnviroSmart® programme is currently available to businesses in eight regions: • Auckland • Wellington • Waikato • Canterbury • Tauranga • Otago • Manawatu • Southland.
The council-initiated programme is supported by 21 councils, the Ministry for the Environment and the Shell NZ Sustainability Fund.
Examples of EnviroSmart® Programme Member Achievements
• Flint Ink discovered that 44 per cent of its solid waste is recyclable and can be diverted from landfill. The company has also made improvements to its chemical storage and protection of storm-water systems.
• De Bruin-Judge Furniture design team now encourages clients to utilise timber and veneers from sustainable plantations and suggests alternatives to less sustainable options initially specified by the client or architect. For example, they encourage clients to consider including a recycling centre within their kitchen or home office environments.
• New Zealand Post (Auckland mail service centre) expects energy savings of more than $200,000 over three years after assessing its energy use and identifying projects for improvement.
To view EnviroSmart® case studies and learn more about the programme, go to: www.envirosmart.co.nz
Target 1.3 At least 10 major businesses will be participating alongside central and local government in developing and promoting waste minimisation programmes within their sector.
Target date: December 2005 Target achieved ahead of due date
A range of programmes, initiatives and pathways have been developed to promote waste minimisation within the business sector. Following are some examples.
Targets in the New Zealand Waste Strategy: 2006 Review of Progress 25
New Zealand Business Council for Sustainable Development
The New Zealand Business Council for Sustainable Development provides business leadership as a catalyst for change towards sustainable development, promoting eco-efficiency, innovation and responsible entrepreneurship. The Council has about 40 member companies, all of whom share a commitment to social and environmental responsibility, as well as financial success. Companies become members by invitation, which ensures that the Council remains a strong group of leading businesses committed to learning by sharing and providing business leadership in sustainable development. Each company is represented on the Council through its CEO or a business leader of equivalent rank.
Sustainable Business Network
The Sustainable Business Network is a forum of over 400 businesses interested in sustainable practices. The Network supports businesses to become sustainable by linking businesses, providing a forum for the exchange of ideas and experiences, and running the Get Sustainable Challenge, an auditing and improvement process.
Enviro-Mark® and EnviroSmart®
Enviro-Mark® is a nationwide environmental certification process for business, which has an easy, step by step pathway for businesses to improve their health, safety and environmental management. Enviro-Mark® has five business certification levels, from bronze (environmental compliance) to diamond level (pre-certification for ISO 14001, the international standard for environmental management). In New Zealand, this certification system is supported by the EnviroSmart® programme, which helps businesses through the certification process. The programme aims to improve environmental performance and resource use efficiency in over 500 recruited businesses nationwide. The programme is sponsored by the Ministry for the Environment and 21 councils to deliver the programme across eight different regions.
New Zealand Packaging Accord
The New Zealand Packaging Accord is a voluntary product stewardship agreement that brings together key players throughout the packaging life cycle to improve the sustainability of packaging used in New Zealand. The Accord includes over 200 companies in the packaged goods industry, as well as central government, local government and recycling operators.
Plastics and paper
The plastics and paper sectors run an environmental best-practice programme for their members which contributes to waste reduction and prevention. The programme aims to create a more environmentally sustainable manufacturing sector in New Zealand through the adoption of environmental management systems, operational resource efficiency gains, and business strategies encompassing full product life cycles.
26 Targets in the New Zealand Waste Strategy: 2006 Review of Progress
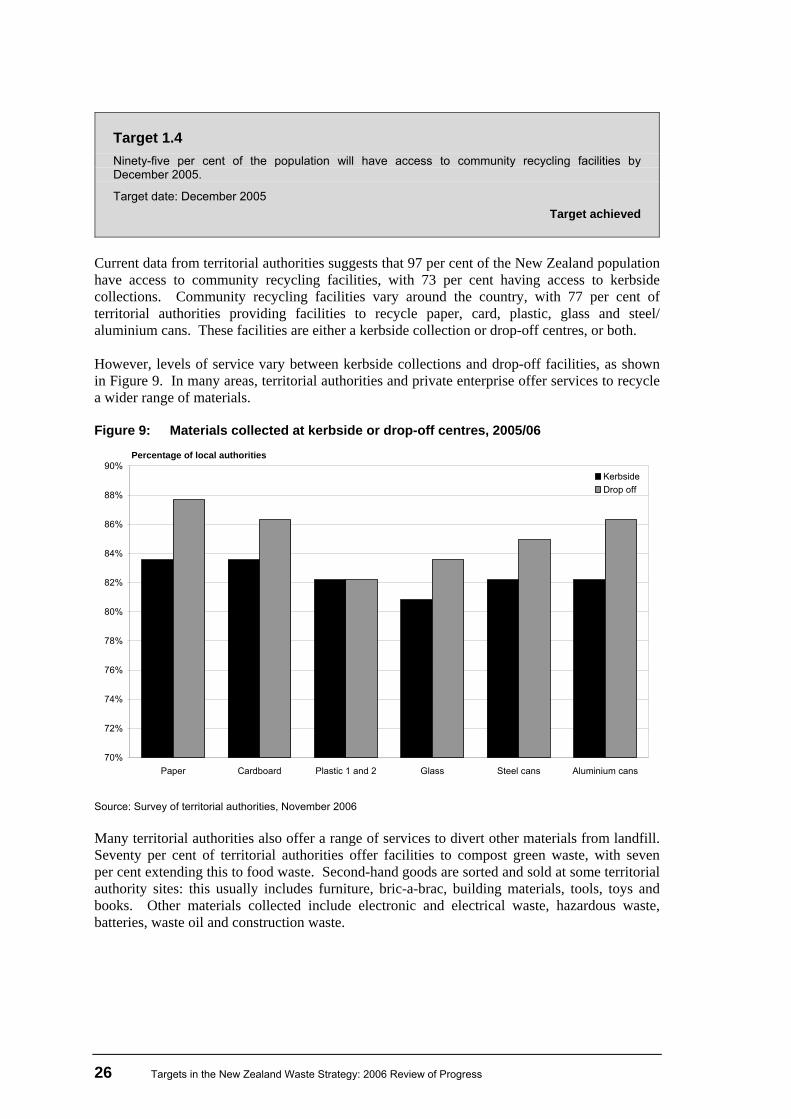
Target 1.4 Ninety-five per cent of the population will have access to community recycling facilities by December 2005.
Target date: December 2005 Target achieved
Current data from territorial authorities suggests that 97 per cent of the New Zealand population have access to community recycling facilities, with 73 per cent having access to kerbside collections. Community recycling facilities vary around the country, with 77 per cent of territorial authorities providing facilities to recycle paper, card, plastic, glass and steel/ aluminium cans. These facilities are either a kerbside collection or drop-off centres, or both. However, levels of service vary between kerbside collections and drop-off facilities, as shown in Figure 9. In many areas, territorial authorities and private enterprise offer services to recycle a wider range of materials. Figure 9: Materials collected at kerbside or drop-off centres, 2005/06
70%
72%
74%
76%
78%
80%
82%
84%
86%
88%
90%
Paper Cardboard Plastic 1 and 2 Glass Steel cans Aluminium cans
KerbsideDrop off
Percentage of local authorities
Source: Survey of territorial authorities, November 2006 Many territorial authorities also offer a range of services to divert other materials from landfill. Seventy per cent of territorial authorities offer facilities to compost green waste, with seven per cent extending this to food waste. Second-hand goods are sorted and sold at some territorial authority sites: this usually includes furniture, bric-a-brac, building materials, tools, toys and books. Other materials collected include electronic and electrical waste, hazardous waste, batteries, waste oil and construction waste.
Targets in the New Zealand Waste Strategy: 2006 Review of Progress 27
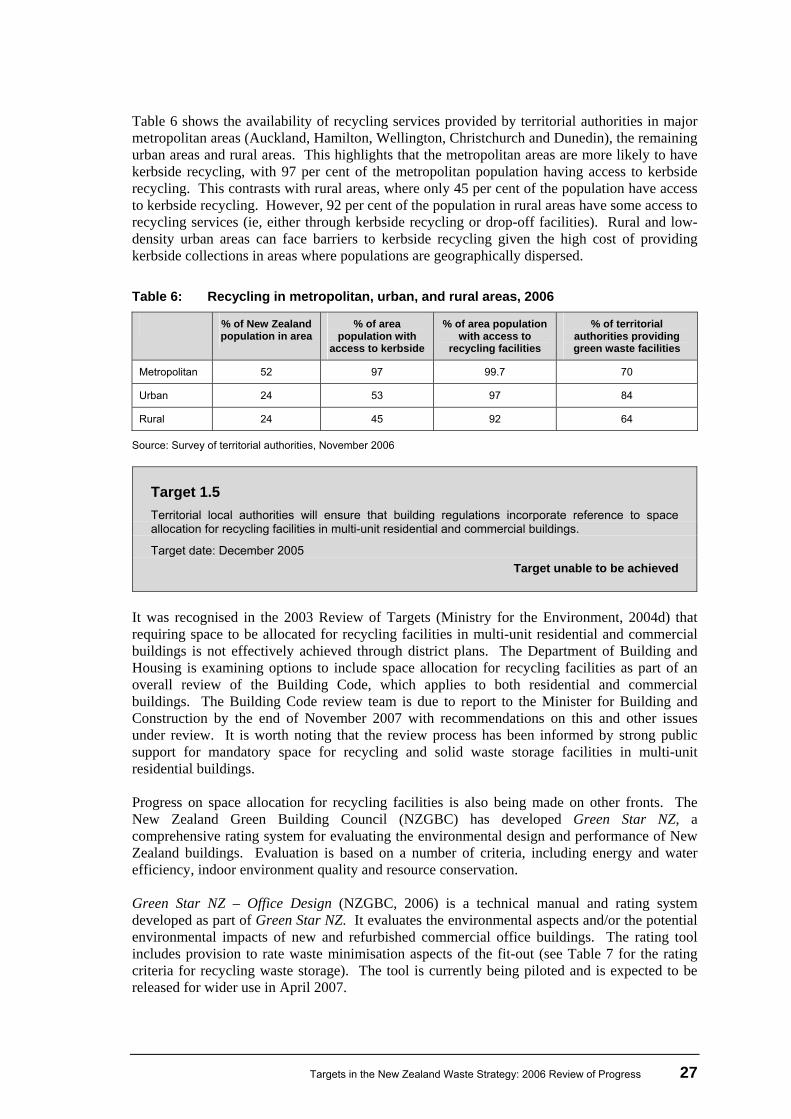
Table 6 shows the availability of recycling services provided by territorial authorities in major metropolitan areas (Auckland, Hamilton, Wellington, Christchurch and Dunedin), the remaining urban areas and rural areas. This highlights that the metropolitan areas are more likely to have kerbside recycling, with 97 per cent of the metropolitan population having access to kerbside recycling. This contrasts with rural areas, where only 45 per cent of the population have access to kerbside recycling. However, 92 per cent of the population in rural areas have some access to recycling services (ie, either through kerbside recycling or drop-off facilities). Rural and low-density urban areas can face barriers to kerbside recycling given the high cost of providing kerbside collections in areas where populations are geographically dispersed. Table 6: Recycling in metropolitan, urban, and rural areas, 2006
% of New Zealand population in area
% of area population with
access to kerbside
% of area population with access to
recycling facilities
% of territorial authorities providing green waste facilities
Metropolitan 52 97 99.7 70
Urban 24 53 97 84
Rural 24 45 92 64
Source: Survey of territorial authorities, November 2006
Target 1.5 Territorial local authorities will ensure that building regulations incorporate reference to space allocation for recycling facilities in multi-unit residential and commercial buildings.
Target date: December 2005 Target unable to be achieved
It was recognised in the 2003 Review of Targets (Ministry for the Environment, 2004d) that requiring space to be allocated for recycling facilities in multi-unit residential and commercial buildings is not effectively achieved through district plans. The Department of Building and Housing is examining options to include space allocation for recycling facilities as part of an overall review of the Building Code, which applies to both residential and commercial buildings. The Building Code review team is due to report to the Minister for Building and Construction by the end of November 2007 with recommendations on this and other issues under review. It is worth noting that the review process has been informed by strong public support for mandatory space for recycling and solid waste storage facilities in multi-unit residential buildings. Progress on space allocation for recycling facilities is also being made on other fronts. The New Zealand Green Building Council (NZGBC) has developed Green Star NZ, a comprehensive rating system for evaluating the environmental design and performance of New Zealand buildings. Evaluation is based on a number of criteria, including energy and water efficiency, indoor environment quality and resource conservation. Green Star NZ – Office Design (NZGBC, 2006) is a technical manual and rating system developed as part of Green Star NZ. It evaluates the environmental aspects and/or the potential environmental impacts of new and refurbished commercial office buildings. The rating tool includes provision to rate waste minimisation aspects of the fit-out (see Table 7 for the rating criteria for recycling waste storage). The tool is currently being piloted and is expected to be released for wider use in April 2007.
28 Targets in the New Zealand Waste Strategy: 2006 Review of Progress
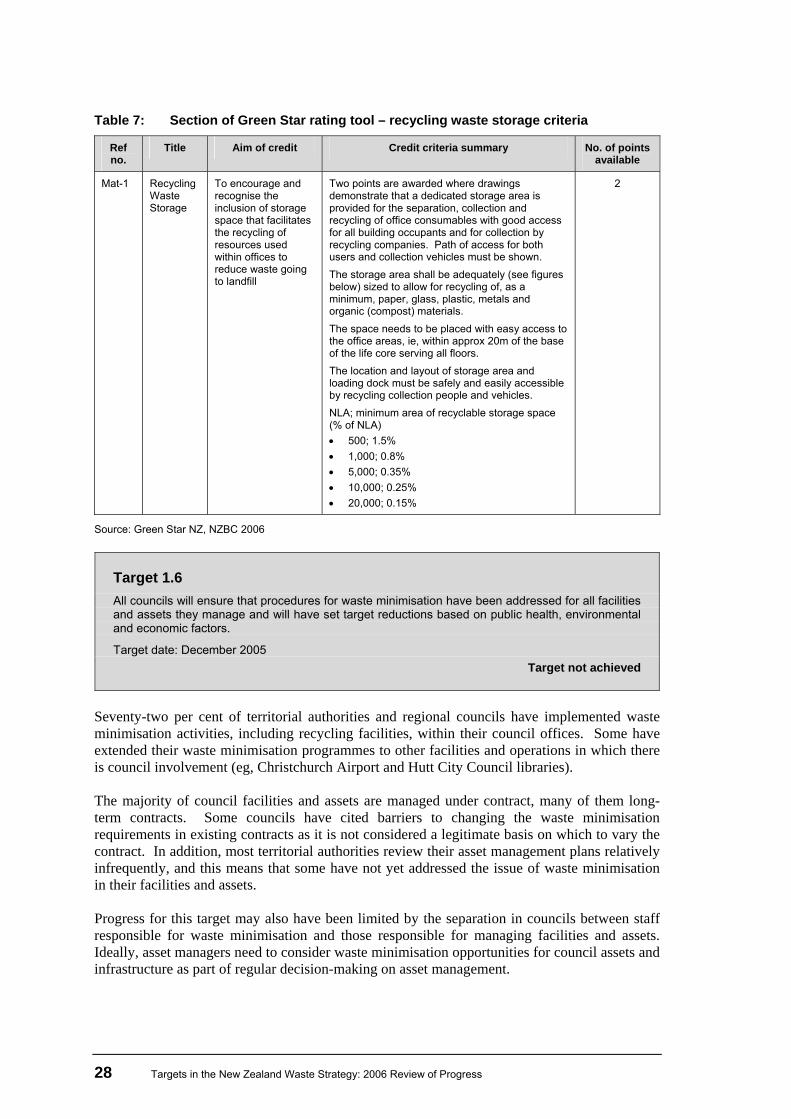
Table 7: Section of Green Star rating tool – recycling waste storage criteria
Ref no.
Title Aim of credit Credit criteria summary No. of points available
Mat-1 Recycling Waste Storage
To encourage and recognise the inclusion of storage space that facilitates the recycling of resources used within offices to reduce waste going to landfill
Two points are awarded where drawings demonstrate that a dedicated storage area is provided for the separation, collection and recycling of office consumables with good access for all building occupants and for collection by recycling companies. Path of access for both users and collection vehicles must be shown. The storage area shall be adequately (see figures below) sized to allow for recycling of, as a minimum, paper, glass, plastic, metals and organic (compost) materials. The space needs to be placed with easy access to the office areas, ie, within approx 20m of the base of the life core serving all floors. The location and layout of storage area and loading dock must be safely and easily accessible by recycling collection people and vehicles. NLA; minimum area of recyclable storage space (% of NLA) • 500; 1.5% • 1,000; 0.8% • 5,000; 0.35% • 10,000; 0.25% • 20,000; 0.15%
2
Source: Green Star NZ, NZBC 2006
Target 1.6 All councils will ensure that procedures for waste minimisation have been addressed for all facilities and assets they manage and will have set target reductions based on public health, environmental and economic factors.
Target date: December 2005 Target not achieved
Seventy-two per cent of territorial authorities and regional councils have implemented waste minimisation activities, including recycling facilities, within their council offices. Some have extended their waste minimisation programmes to other facilities and operations in which there is council involvement (eg, Christchurch Airport and Hutt City Council libraries). The majority of council facilities and assets are managed under contract, many of them long-term contracts. Some councils have cited barriers to changing the waste minimisation requirements in existing contracts as it is not considered a legitimate basis on which to vary the contract. In addition, most territorial authorities review their asset management plans relatively infrequently, and this means that some have not yet addressed the issue of waste minimisation in their facilities and assets. Progress for this target may also have been limited by the separation in councils between staff responsible for waste minimisation and those responsible for managing facilities and assets. Ideally, asset managers need to consider waste minimisation opportunities for council assets and infrastructure as part of regular decision-making on asset management.
Targets in the New Zealand Waste Strategy: 2006 Review of Progress 29
3.3 Organic waste
3.3.1 Introduction
Organic wastes constitute a large portion of the waste stream and make a significant contribution to the environmental effects of waste disposal. These effects include the generation and release of methane (one of the primary landfill gases and a significant greenhouse gas) and the generation of leachate. The term “organic waste” covers many types of waste. The common definition, based on the putrescible waste category used in the Solid Waste Analysis Protocol, or SWAP (Ministry for the Environment, 2002c), includes garden waste (more commonly known as “green waste”), food scraps, biosolids and commercial organic wastes such as food-processing waste. Some other wastes that may biodegrade in landfill are also defined as organic wastes, but these are identified separately in SWAP audits. This includes some paper, cardboard and untreated wood. The Solid Waste Analysis Protocol of Waste to Landfill 2004 indicates that organic waste comprises 23 per cent of the waste stream. If paper, cardboard and timber are added to this figure, biodegradable waste constitutes up to 52 per cent of the total waste to landfill. Not all timber and paper can be easily diverted via existing processes, such as composting or mulching, but certainly a large percentage of biodegradable waste can. This highlights the importance of doing further work on options to increase the diversion of organic and other biodegradable wastes from landfill. A significant proportion of the organic waste stream is green waste, which generally includes household garden waste and commercial landscaping waste. There are a number of ways that organic waste can be disposed of, meaning that final disposal of this waste is more complex than for many other waste streams. Policies and programmes to increase diversion rates from landfill may therefore only address a proportion of organic waste volumes because, in addition to disposal to landfill, organic waste may also be disposed of via: • trade waste sewerage systems when very dilute • domestic sewerage systems through household waste disposal units • food-processing wastes going to stock (eg, pigs and cattle) • land application of effluent from meat and dairy processing facilities • disposal of biosolids at dedicated landfills, composting, drying (with use as soil
conditioner or landfill cover). There are also significant quantities of biosolids effectively stored in oxidation ponds throughout New Zealand.
There are still strong incentives to remove organics from the solid waste stream because of the high environmental impacts of disposing of organic material to landfill and increasing costs of disposal. In addition, unlike many other waste streams there are good prospects for alternative, lower-impact disposal or beneficial end-use options for many organic wastes. For example, market demand is growing for alternative end-uses for organic wastes, such as compost or food stock for animals. However, consumers are demanding an increasing level of quality for such products, and this is a challenge for the waste industry.
30 Targets in the New Zealand Waste Strategy: 2006 Review of Progress
3.3.2 Summary of progress
Good progress on organic waste diversion, especially the composting of green waste, has been made by both territorial authorities and commercial enterprises. Green waste is most commonly composted or mulched at transfer stations and some landfills. The majority of green waste services are provided by territorial authorities. In some areas commercial collection services for green waste are also available to householders. Some territorial authorities have implemented kerbside collections for green and food waste, but there are significant problems with this type of service, especially in relation to proven processing technology, markets and cost, which need to be overcome before such services are likely to become mainstreamed. Improvements in waste infrastructure and services have made the diversion of some types of organic wastes from landfill easier for many householders and businesses. At the same time, these improvements have facilitated commercial collection services which deliver diverted materials to council-operated, or council-supported, processing sites. The challenge now is to maximise the participation and use of the services available, and work with the composting sector to build sustainable markets for diverted processed products. Diversion rates remain high for many of the large, single-waste organic waste streams produced by industry. This is particularly true for freezing works, and wood-processing and food-processing wastes. A logical next step for organic waste diversion is to build on present diversion programmes and expand large-scale industrial organic diversion of single-waste organic waste streams. A greater focus may also be required for smaller commercial waste streams from sources such as supermarkets and restaurants, where the diverse and dispersed nature of the waste streams present greater challenges for diversion. There has been limited progress in measuring the quantity of organic waste disposed of. This includes the amounts diverted by territorial authorities and commercial enterprises, disposal via wastewater treatment systems and sewage sludge diversion, and the diversion of commercial organic waste.
Key findings
• Over 312,000 tonnes of organic waste is diverted from landfill by territorial authorities.
• An estimated 35 per cent of green waste was diverted from landfill in 2005/06.
• Opportunities to dispose of green waste through composting or mulching are provided by 70 per cent of territorial authorities.
• A total of 37,000 tonnes of biosolids, at varying stages of dryness, are diverted from landfill annually (excluding land reclamation).
• The New Zealand Standard for Compost, Mulches and Soil Conditioners is expected to improve the quality of and expand markets for recycled compost products.
Targets in the New Zealand Waste Strategy: 2006 Review of Progress 31
3.3.3 Looking forward
It has proven difficult for territorial authorities to effectively monitor and set targets for organic waste given that they are not involved in the management or processing of a large proportion of this waste stream. Even so, a significant amount of organic waste is diverted from landfill through council-related initiatives. Green waste is a primary focus for territorial authority efforts to reduce organic waste flows to landfill. A better understanding of diversion rates and flows for industrial organic waste is critical if improvements are to be made in organic diversion rates. Additional funding could help accelerate organic waste minimisation initiatives, especially in relation to food waste, where there are still challenges to ensuring a high-quality, marketable end-use product. Overall, achievements in the diversion of biosolids from landfill have been limited, and the target of 95 per cent diversion of biosolids from landfill by December 2007 is unlikely to be achieved. Further work in this area is required to overcome significant cultural and technical difficulties before a greater re-use of biosolids can be expected. Continued work on organics is required to ensure that diversion rates improve and markets are developed for organic materials created through reprocessing. The recently developed New Zealand Standard for Compost, Mulches and Soil Conditioners, for example, is expected to improve the quality of, and expand markets for, recycled compost products. Work is continuing to ensure the Standard is recognised as a mark of quality. It is important that secondary organic materials, such as compost and soil conditioner, are produced for a market that can utilise them on a continuing basis.
3.3.4 Review of progress
Target 2.1 By December 2003 all territorial local authorities will have instituted a measurement programme to identify existing organic waste quantities and set local targets for diversion from disposal.
Target date: December 2003 Target not achieved
Measurement systems for organic wastes vary between territorial authorities. Some territorial authorities monitor all organic wastes that are processed and either sent to landfill or recycled/reprocessed, while others only measure the quantities of certain wastes either diverted or sent to landfill from their territory. Forty-one per cent of territorial authorities employ a formal monitoring system for organic waste (see Figure 10). Of these, half have set local targets for organic waste diversion. Sixty-three per cent of territorial authorities were able to provide figures for organic waste either diverted from landfill or sent to landfill. Although not all territorial authorities have formal measurement systems for all types of organic waste, many measure volumes and flows of green waste and biosolids.
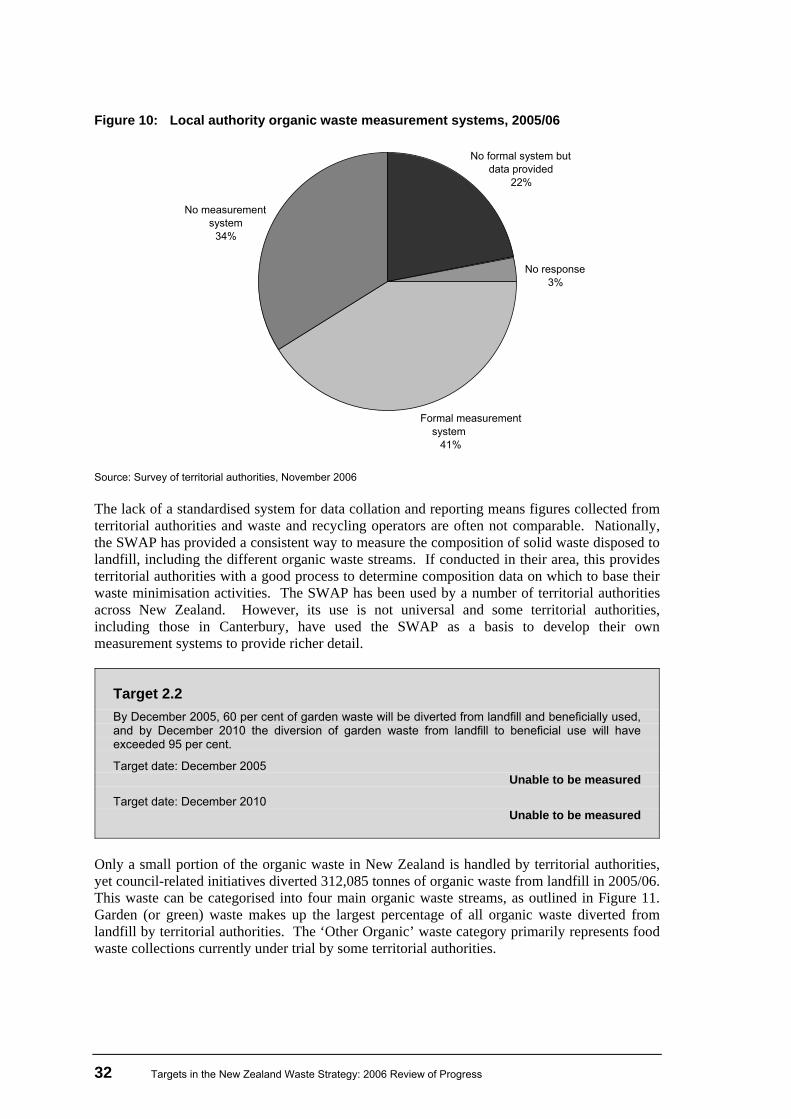
32 Targets in the New Zealand Waste Strategy: 2006 Review of Progress
Figure 10: Local authority organic waste measurement systems, 2005/06
Source: Survey of territorial authorities, November 2006 The lack of a standardised system for data collation and reporting means figures collected from territorial authorities and waste and recycling operators are often not comparable. Nationally, the SWAP has provided a consistent way to measure the composition of solid waste disposed to landfill, including the different organic waste streams. If conducted in their area, this provides territorial authorities with a good process to determine composition data on which to base their waste minimisation activities. The SWAP has been used by a number of territorial authorities across New Zealand. However, its use is not universal and some territorial authorities, including those in Canterbury, have used the SWAP as a basis to develop their own measurement systems to provide richer detail.
Target 2.2 By December 2005, 60 per cent of garden waste will be diverted from landfill and beneficially used, and by December 2010 the diversion of garden waste from landfill to beneficial use will have exceeded 95 per cent.
Target date: December 2005 Unable to be measured
Target date: December 2010 Unable to be measured
Only a small portion of the organic waste in New Zealand is handled by territorial authorities, yet council-related initiatives diverted 312,085 tonnes of organic waste from landfill in 2005/06. This waste can be categorised into four main organic waste streams, as outlined in Figure 11. Garden (or green) waste makes up the largest percentage of all organic waste diverted from landfill by territorial authorities. The ‘Other Organic’ waste category primarily represents food waste collections currently under trial by some territorial authorities.
No formal system but data provided
22%
No response 3%
No measurement system
34%
Formal measurementsystem
41%
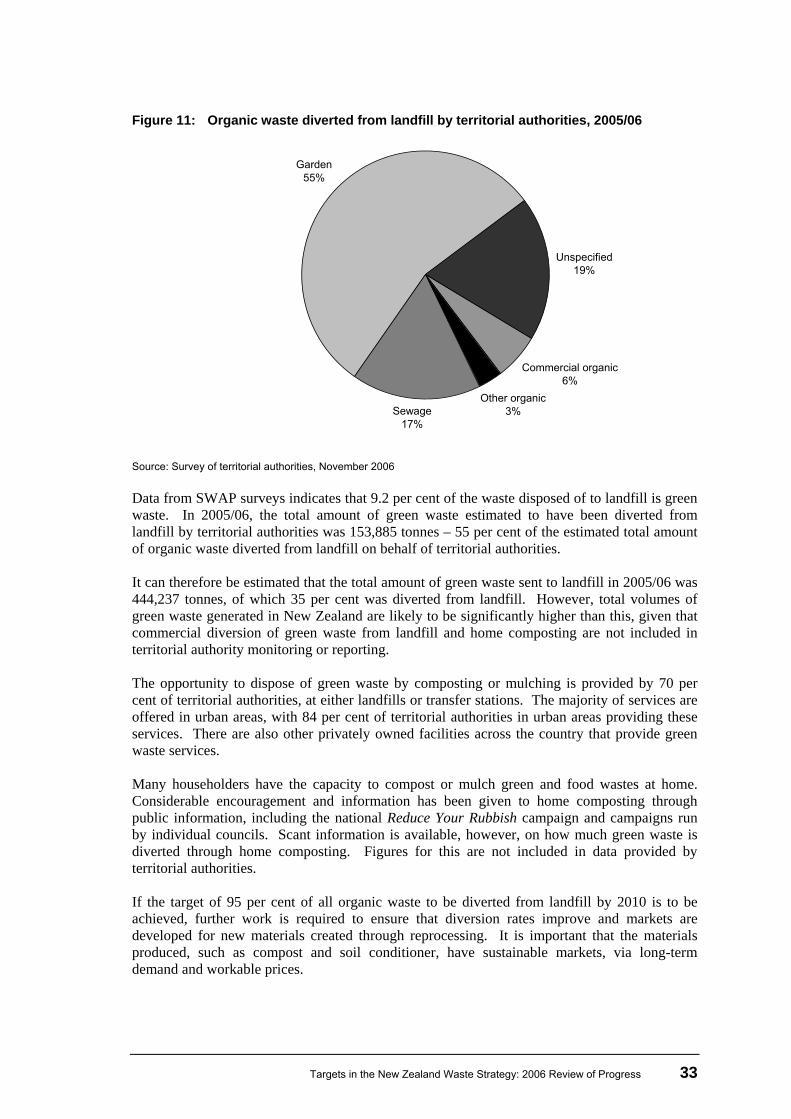
Targets in the New Zealand Waste Strategy: 2006 Review of Progress 33
Figure 11: Organic waste diverted from landfill by territorial authorities, 2005/06
Garden55%
Sewage17%
Commercial organic6%
Unspecified19%
Other organic3%
Source: Survey of territorial authorities, November 2006 Data from SWAP surveys indicates that 9.2 per cent of the waste disposed of to landfill is green waste. In 2005/06, the total amount of green waste estimated to have been diverted from landfill by territorial authorities was 153,885 tonnes – 55 per cent of the estimated total amount of organic waste diverted from landfill on behalf of territorial authorities. It can therefore be estimated that the total amount of green waste sent to landfill in 2005/06 was 444,237 tonnes, of which 35 per cent was diverted from landfill. However, total volumes of green waste generated in New Zealand are likely to be significantly higher than this, given that commercial diversion of green waste from landfill and home composting are not included in territorial authority monitoring or reporting. The opportunity to dispose of green waste by composting or mulching is provided by 70 per cent of territorial authorities, at either landfills or transfer stations. The majority of services are offered in urban areas, with 84 per cent of territorial authorities in urban areas providing these services. There are also other privately owned facilities across the country that provide green waste services. Many householders have the capacity to compost or mulch green and food wastes at home. Considerable encouragement and information has been given to home composting through public information, including the national Reduce Your Rubbish campaign and campaigns run by individual councils. Scant information is available, however, on how much green waste is diverted through home composting. Figures for this are not included in data provided by territorial authorities. If the target of 95 per cent of all organic waste to be diverted from landfill by 2010 is to be achieved, further work is required to ensure that diversion rates improve and markets are developed for new materials created through reprocessing. It is important that the materials produced, such as compost and soil conditioner, have sustainable markets, via long-term demand and workable prices.
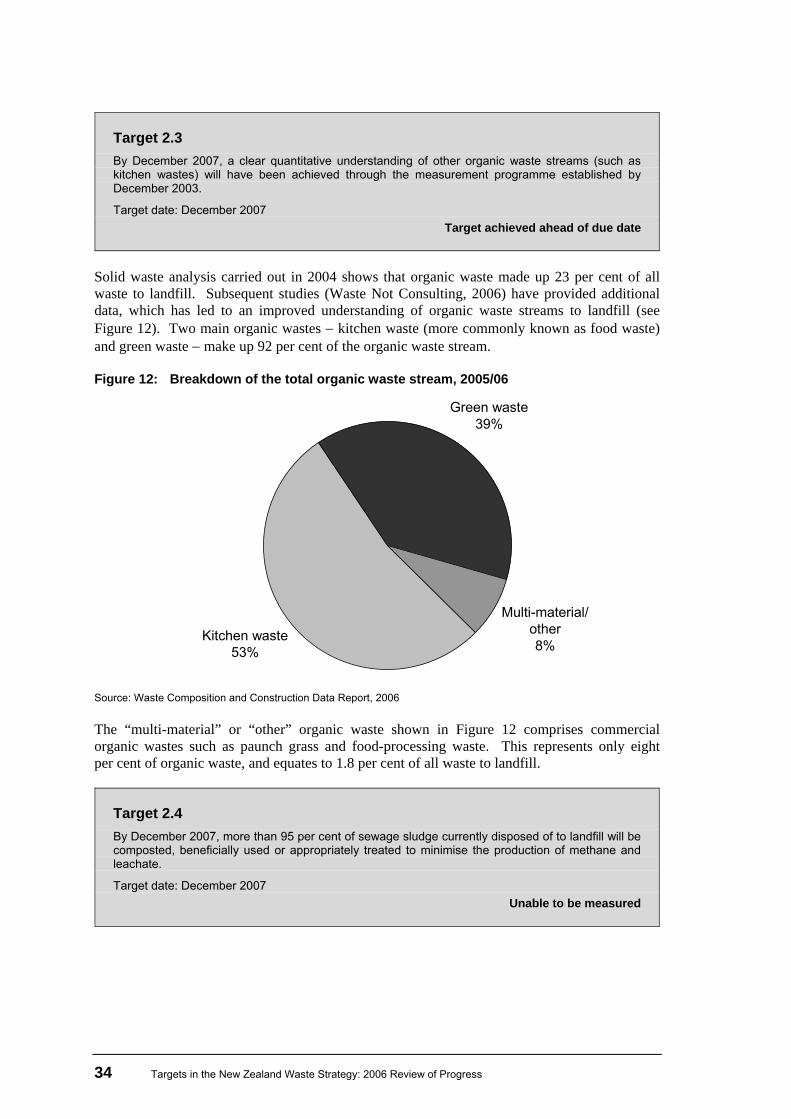
34 Targets in the New Zealand Waste Strategy: 2006 Review of Progress
Target 2.3 By December 2007, a clear quantitative understanding of other organic waste streams (such as kitchen wastes) will have been achieved through the measurement programme established by December 2003.
Target date: December 2007 Target achieved ahead of due date
Solid waste analysis carried out in 2004 shows that organic waste made up 23 per cent of all waste to landfill. Subsequent studies (Waste Not Consulting, 2006) have provided additional data, which has led to an improved understanding of organic waste streams to landfill (see Figure 12). Two main organic wastes − kitchen waste (more commonly known as food waste) and green waste − make up 92 per cent of the organic waste stream. Figure 12: Breakdown of the total organic waste stream, 2005/06
Kitchen waste53%
Multi-material/ other8%
Green waste39%
Source: Waste Composition and Construction Data Report, 2006 The “multi-material” or “other” organic waste shown in Figure 12 comprises commercial organic wastes such as paunch grass and food-processing waste. This represents only eight per cent of organic waste, and equates to 1.8 per cent of all waste to landfill.
Target 2.4 By December 2007, more than 95 per cent of sewage sludge currently disposed of to landfill will be composted, beneficially used or appropriately treated to minimise the production of methane and leachate.
Target date: December 2007 Unable to be measured
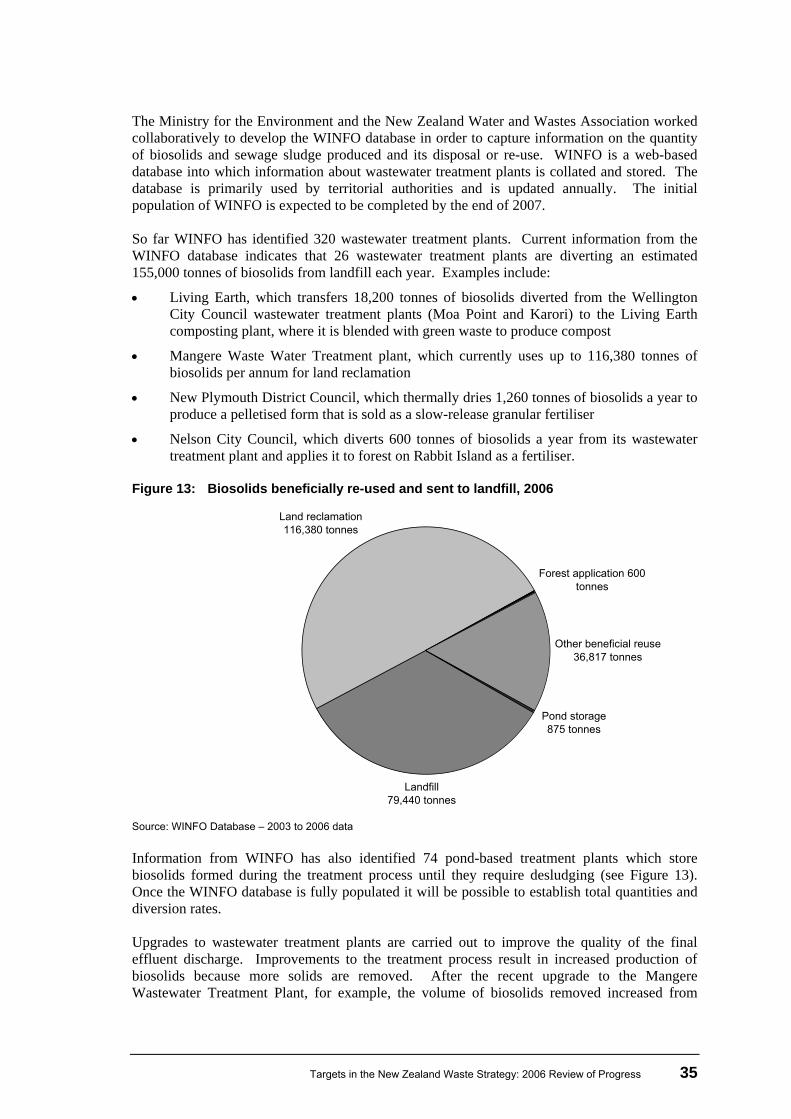
Targets in the New Zealand Waste Strategy: 2006 Review of Progress 35
The Ministry for the Environment and the New Zealand Water and Wastes Association worked collaboratively to develop the WINFO database in order to capture information on the quantity of biosolids and sewage sludge produced and its disposal or re-use. WINFO is a web-based database into which information about wastewater treatment plants is collated and stored. The database is primarily used by territorial authorities and is updated annually. The initial population of WINFO is expected to be completed by the end of 2007. So far WINFO has identified 320 wastewater treatment plants. Current information from the WINFO database indicates that 26 wastewater treatment plants are diverting an estimated 155,000 tonnes of biosolids from landfill each year. Examples include:
• Living Earth, which transfers 18,200 tonnes of biosolids diverted from the Wellington City Council wastewater treatment plants (Moa Point and Karori) to the Living Earth composting plant, where it is blended with green waste to produce compost
• Mangere Waste Water Treatment plant, which currently uses up to 116,380 tonnes of biosolids per annum for land reclamation
• New Plymouth District Council, which thermally dries 1,260 tonnes of biosolids a year to produce a pelletised form that is sold as a slow-release granular fertiliser
• Nelson City Council, which diverts 600 tonnes of biosolids a year from its wastewater treatment plant and applies it to forest on Rabbit Island as a fertiliser.
Figure 13: Biosolids beneficially re-used and sent to landfill, 2006
Landfill79,440 tonnes
Pond storage875 tonnes
Other beneficial reuse 36,817 tonnes
Forest application 600 tonnes
Land reclamation 116,380 tonnes
Source: WINFO Database – 2003 to 2006 data Information from WINFO has also identified 74 pond-based treatment plants which store biosolids formed during the treatment process until they require desludging (see Figure 13). Once the WINFO database is fully populated it will be possible to establish total quantities and diversion rates. Upgrades to wastewater treatment plants are carried out to improve the quality of the final effluent discharge. Improvements to the treatment process result in increased production of biosolids because more solids are removed. After the recent upgrade to the Mangere Wastewater Treatment Plant, for example, the volume of biosolids removed increased from
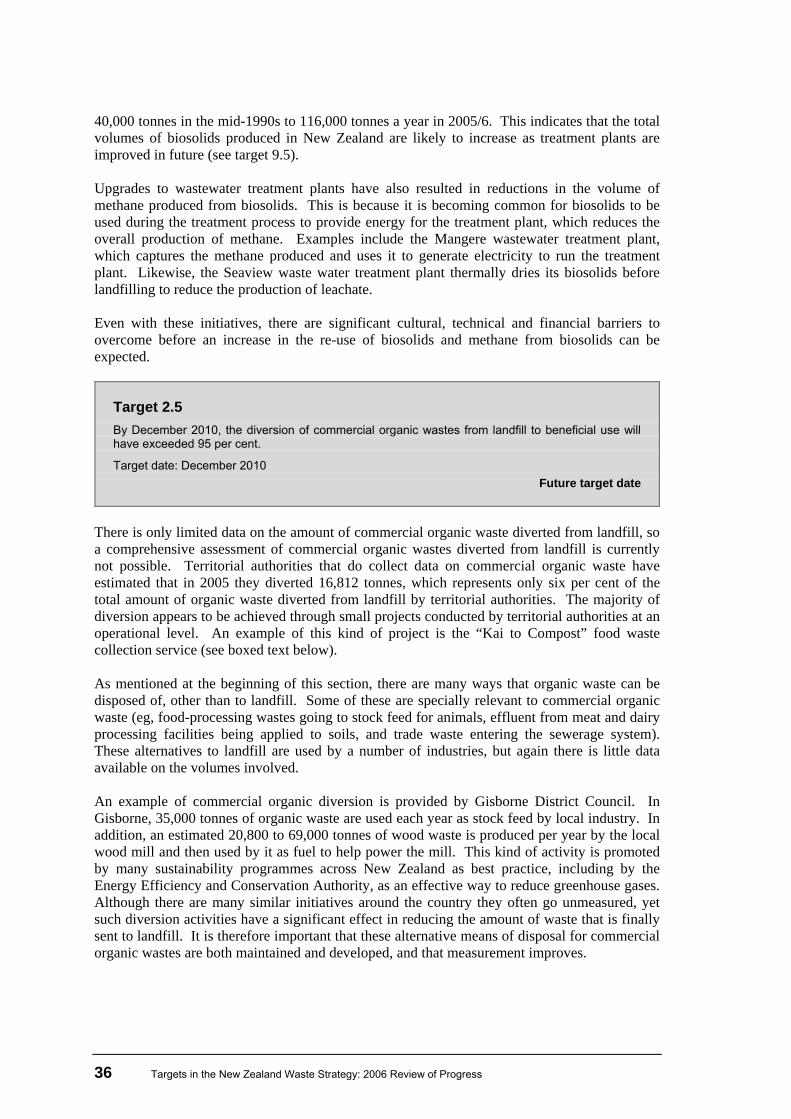
36 Targets in the New Zealand Waste Strategy: 2006 Review of Progress
40,000 tonnes in the mid-1990s to 116,000 tonnes a year in 2005/6. This indicates that the total volumes of biosolids produced in New Zealand are likely to increase as treatment plants are improved in future (see target 9.5). Upgrades to wastewater treatment plants have also resulted in reductions in the volume of methane produced from biosolids. This is because it is becoming common for biosolids to be used during the treatment process to provide energy for the treatment plant, which reduces the overall production of methane. Examples include the Mangere wastewater treatment plant, which captures the methane produced and uses it to generate electricity to run the treatment plant. Likewise, the Seaview waste water treatment plant thermally dries its biosolids before landfilling to reduce the production of leachate. Even with these initiatives, there are significant cultural, technical and financial barriers to overcome before an increase in the re-use of biosolids and methane from biosolids can be expected.
Target 2.5 By December 2010, the diversion of commercial organic wastes from landfill to beneficial use will have exceeded 95 per cent.
Target date: December 2010 Future target date
There is only limited data on the amount of commercial organic waste diverted from landfill, so a comprehensive assessment of commercial organic wastes diverted from landfill is currently not possible. Territorial authorities that do collect data on commercial organic waste have estimated that in 2005 they diverted 16,812 tonnes, which represents only six per cent of the total amount of organic waste diverted from landfill by territorial authorities. The majority of diversion appears to be achieved through small projects conducted by territorial authorities at an operational level. An example of this kind of project is the “Kai to Compost” food waste collection service (see boxed text below). As mentioned at the beginning of this section, there are many ways that organic waste can be disposed of, other than to landfill. Some of these are specially relevant to commercial organic waste (eg, food-processing wastes going to stock feed for animals, effluent from meat and dairy processing facilities being applied to soils, and trade waste entering the sewerage system). These alternatives to landfill are used by a number of industries, but again there is little data available on the volumes involved. An example of commercial organic diversion is provided by Gisborne District Council. In Gisborne, 35,000 tonnes of organic waste are used each year as stock feed by local industry. In addition, an estimated 20,800 to 69,000 tonnes of wood waste is produced per year by the local wood mill and then used by it as fuel to help power the mill. This kind of activity is promoted by many sustainability programmes across New Zealand as best practice, including by the Energy Efficiency and Conservation Authority, as an effective way to reduce greenhouse gases. Although there are many similar initiatives around the country they often go unmeasured, yet such diversion activities have a significant effect in reducing the amount of waste that is finally sent to landfill. It is therefore important that these alternative means of disposal for commercial organic wastes are both maintained and developed, and that measurement improves.
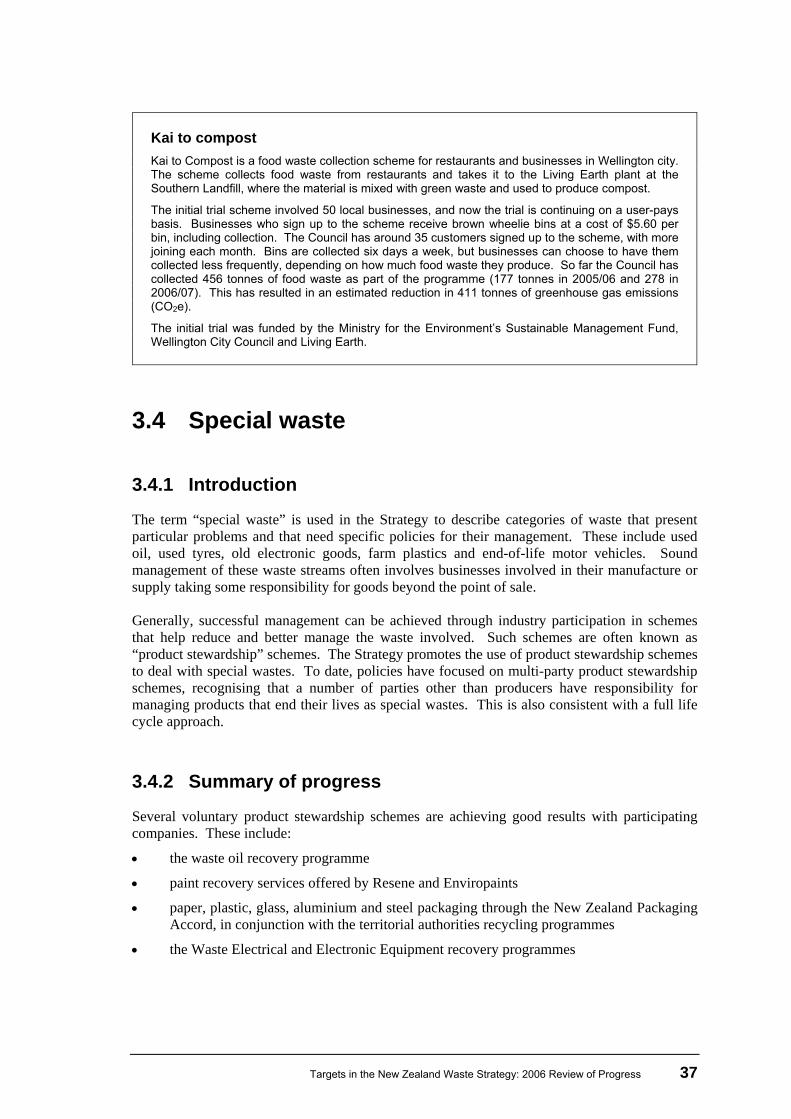
Targets in the New Zealand Waste Strategy: 2006 Review of Progress 37
Kai to compost Kai to Compost is a food waste collection scheme for restaurants and businesses in Wellington city. The scheme collects food waste from restaurants and takes it to the Living Earth plant at the Southern Landfill, where the material is mixed with green waste and used to produce compost.
The initial trial scheme involved 50 local businesses, and now the trial is continuing on a user-pays basis. Businesses who sign up to the scheme receive brown wheelie bins at a cost of $5.60 per bin, including collection. The Council has around 35 customers signed up to the scheme, with more joining each month. Bins are collected six days a week, but businesses can choose to have them collected less frequently, depending on how much food waste they produce. So far the Council has collected 456 tonnes of food waste as part of the programme (177 tonnes in 2005/06 and 278 in 2006/07). This has resulted in an estimated reduction in 411 tonnes of greenhouse gas emissions (CO2e).
The initial trial was funded by the Ministry for the Environment’s Sustainable Management Fund, Wellington City Council and Living Earth.
3.4 Special waste
3.4.1 Introduction
The term “special waste” is used in the Strategy to describe categories of waste that present particular problems and that need specific policies for their management. These include used oil, used tyres, old electronic goods, farm plastics and end-of-life motor vehicles. Sound management of these waste streams often involves businesses involved in their manufacture or supply taking some responsibility for goods beyond the point of sale. Generally, successful management can be achieved through industry participation in schemes that help reduce and better manage the waste involved. Such schemes are often known as “product stewardship” schemes. The Strategy promotes the use of product stewardship schemes to deal with special wastes. To date, policies have focused on multi-party product stewardship schemes, recognising that a number of parties other than producers have responsibility for managing products that end their lives as special wastes. This is also consistent with a full life cycle approach.
3.4.2 Summary of progress
Several voluntary product stewardship schemes are achieving good results with participating companies. These include:
• the waste oil recovery programme
• paint recovery services offered by Resene and Enviropaints
• paper, plastic, glass, aluminium and steel packaging through the New Zealand Packaging Accord, in conjunction with the territorial authorities recycling programmes
• the Waste Electrical and Electronic Equipment recovery programmes
38 Targets in the New Zealand Waste Strategy: 2006 Review of Progress
• programmes for the collection of farm plastics
• Tyre Track, a programme to track end-of-life tyres. A notable feature of these schemes is that they have been established by industry, or in partnership with industry, with an industry body or lead company taking on responsibility for managing and implementing the scheme.
Key findings
• Companies in 10 different sectors are involved in voluntary, industry-led product stewardship schemes.
• A regulated framework for product stewardship is being developed to support such voluntary initiatives when required.
• Used oil recovery programmes collect 21 million litres of used oil per year.
• Seven major companies have introduced voluntary product stewardship schemes for waste electronic and electrical equipment.
• Tyre Track, set up in 2004, links tyre dealers with transporters, recyclers and landfills, has tracked almost two million tyres to a responsible end use.
3.4.3 Looking forward
Ongoing effort in the area of product stewardship is essential if special wastes are to be diverted from landfill. One concern cited by participants in product stewardship schemes is that those who do not participate in the scheme stand to gain a commercial advantage because they can continue with less sustainable practices at a lesser cost, undercutting those involved in the scheme in the marketplace. This is being considered in current policy work.
3.4.4 Review of progress
Target 3.1 By December 2005, businesses in at least eight different sectors will have introduced extended producer responsibility pilot programmes for the collection and re-use, recycling or appropriate treatment and disposal of at least eight categories of special waste.
Target date: December 2005 Target achieved
As noted above, a number of companies in different sectors have introduced or are developing producer-led product stewardship schemes for the collection and re-use, recycling or appropriate treatment and disposal of special waste. Some of these schemes are detailed below. All schemes are voluntary, and reflect the increasing commitment by a range of New Zealand businesses to improving the sustainability of their products.
Targets in the New Zealand Waste Strategy: 2006 Review of Progress 39
Product stewardship schemes internalise the cost of impacts to the environment into their product price, which provides a market incentive to: • reduce the amount of resources needed to produce products • facilitate the re-use and recycling of a product • ensure products are disposed of with the least environmental impact. Multi-party product stewardship schemes have the same objectives but rely on a number of parties − in addition to producers − to take responsibility for managing products that end their lives as special wastes.
Waste oil
Used oil is the single largest non-watery liquid waste stream in New Zealand. An estimated 33 to 40 million litres of waste oil are generated each year. Producer-based used oil recovery programmes have been in place for some years and collect an estimated 21 million litres of waste oil a year. This is estimated to be approximately half to two-thirds of the total amount of used oil generated. The major oil companies involved in the waste oil product stewardship scheme operate a nationwide collection network. This is available for territorial authorities to use at their landfill and transfer stations on a user-pays basis.
Paint
Paint recovery services are provided by Resene Paints (through a service called Paintwise) and Enviropaints. Both collect waste paint in collaboration with territorial authorities and regional councils, and Paintwise is available direct to the public. Coverage is not presently nationwide. Continued work is required to encourage other major paint manufacturers to offer product stewardship schemes for waste paints.
Paper, plastic, glass, aluminium and steel packaging
The New Zealand Packaging Accord (described in section 2) is focused on five packaging waste streams: paper, plastic, glass, aluminium and steel. Its objective is to improve the sustainability of packaging used in New Zealand by creating better partnerships, policies and processes through:
• brand owners and retailers taking the primary responsibility for product stewardship throughout the packaging life cycle
• greater material and energy efficiency in production
• use and recovery of packaging materials
• supply chain initiatives that foster markets for sustainable packaging, including more use of recovered packaging materials.
40 Targets in the New Zealand Waste Strategy: 2006 Review of Progress
Waste electrical and electronic equipment (WEEE)
WEEE includes products such as batteries, computers, cellphones and televisions, and lighting appliances such as fluorescent tubes. Up to 80,000 tonnes of WEEE is discarded to landfill in New Zealand every year. WEEE can contain toxic substances such as lead, cadmium, mercury, chromium and brominated flame retardant plastics. These substances are dangerous if they are burnt or if they leach into the soil or waterways. Disposing of WEEE to landfill also wastes valuable materials such as steel, gold, platinum and copper. Products can often be repaired and given another life, or the materials recycled. Product stewardship schemes to reduce WEEE have been introduced in New Zealand by Hewlett Packard, IBM, Dell, Fisher & Paykel, Vodafone, Telecom and Exide.
Farm plastics
Farm plastics are used mainly for chemical containers and silage wrap. Disposal of these plastics has become a persistent and growing problem for farmers and growers throughout New Zealand. They are dangerous to burn or bury on the farm, and can be hazardous to dispose of to landfill if not properly managed. Agrecovery is a programme for the sustainable recovery of triple-rinsed agriculture and forestry sector plastic containers. It is financed through a 13 cent per litre levy collected by participating brand owners. As a self-funding programme, Agrecovery will provide a long-term recovery solution for the agrichemical sector. AgPac is currently performing trials to provide a user-pays system for farmers to conveniently recycle their silage wrap.
Tyres
Approximately three to four million tyres are disposed of every year in New Zealand. Tyres that have come to the end of their useful life are a waste problem. They are difficult to dispose of because they are bulky and tend to move about, which can make the landfill unstable. If tyres are stacked separately at landfills they pose a fire risk. Tyre Track is a product stewardship scheme, supported by the major tyre importers and the Motor Trade Association, which addresses the problem of waste tyres. It is a voluntary tyre collection system that links tyre dealers, transporters and registered end-points (primarily recyclers and sanitary landfills). Tyre Track works to track end-of-life tyres in New Zealand and ensure they are all properly disposed of.
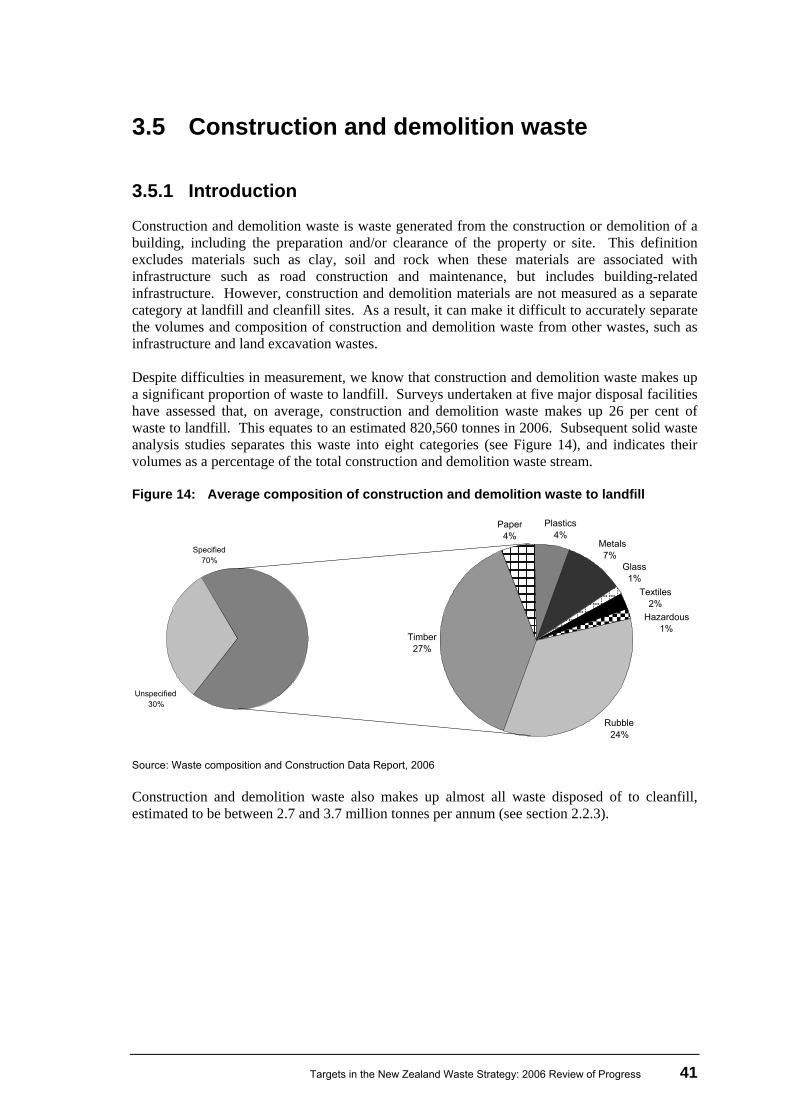
Targets in the New Zealand Waste Strategy: 2006 Review of Progress 41
3.5 Construction and demolition waste
3.5.1 Introduction
Construction and demolition waste is waste generated from the construction or demolition of a building, including the preparation and/or clearance of the property or site. This definition excludes materials such as clay, soil and rock when these materials are associated with infrastructure such as road construction and maintenance, but includes building-related infrastructure. However, construction and demolition materials are not measured as a separate category at landfill and cleanfill sites. As a result, it can make it difficult to accurately separate the volumes and composition of construction and demolition waste from other wastes, such as infrastructure and land excavation wastes. Despite difficulties in measurement, we know that construction and demolition waste makes up a significant proportion of waste to landfill. Surveys undertaken at five major disposal facilities have assessed that, on average, construction and demolition waste makes up 26 per cent of waste to landfill. This equates to an estimated 820,560 tonnes in 2006. Subsequent solid waste analysis studies separates this waste into eight categories (see Figure 14), and indicates their volumes as a percentage of the total construction and demolition waste stream. Figure 14: Average composition of construction and demolition waste to landfill
Source: Waste composition and Construction Data Report, 2006 Construction and demolition waste also makes up almost all waste disposed of to cleanfill, estimated to be between 2.7 and 3.7 million tonnes per annum (see section 2.2.3).
Timber27%
Paper4%
Plastics4%
Metals7%
Rubble 24%
Glass 1%
Textiles2%
Hazardous1%
Specified70%
Unspecified 30%
42 Targets in the New Zealand Waste Strategy: 2006 Review of Progress
3.5.2 Summary of progress
There is evidence that diversion of a range of construction and demolition waste is occurring, with industry recovering an estimated one million tonnes per annum. However, there is no comprehensive data on construction and demolition waste flows, because monitoring of disposal is limited at both landfill and cleanfill sites. Very few territorial authorities have separate measurement systems for construction and demolition waste. This makes it difficult for territorial authorities to monitor the full extent of the waste stream, especially if small volumes of construction and demolition waste are produced in their locality. In addition, the majority of construction and demolition waste goes to cleanfills, which are not operated by territorial authorities.
Key findings
• Construction and demolition waste is estimated to comprise around 26 per cent of waste to landfill, or 820,560 tonnes per year.
• Construction and demolition waste makes up the majority of waste disposed of to cleanfill. This is estimated to be between 2.7 and 3.7 million tonnes in 2005, which is greater than the total volume of waste to landfill in New Zealand.
• An estimated one million tonnes of construction and demolition waste is diverted from landfills and cleanfills by industry.
3.5.3 Looking forward
There needs to be more comprehensive monitoring of construction and demolition waste, in relation to both the disposal of this waste to landfill and cleanfill and diversion rates. The full extent of this waste stream is unknown, with current figures based only on estimates provided by those that re-use or divert relevant materials. Anecdotal evidence suggests that diversion of construction and demolition waste is increasing, but there is little opportunity to measure this. If we want to know more about trends in construction and demolition waste diversion, an improved monitoring and measurement system is needed. Given the scale of the estimates of construction and demolition waste disposed of annually, there is a strong case for focusing on increasing the reprocessing and re-use of this waste. There are excellent examples of reprocessing and re-use, but these tend to be small-scale and locality-specific. There are currently few incentives to divert construction and demolition waste materials from landfill or cleanfill because the low costs of disposal and existing waste collection infrastructure do not drive the waste generator to consider alternatives such as re-use or recycling. One way to address this would be to strengthen the market for the recovery, re-use and recycling of construction and demolition waste. To be successful, the wider industrial sector will need to be engaged in this work. The Resource Efficiency in Building and Related Industries (REBRI) initiative is an example of a successful programme that has produced guidelines to reduce construction and demolition waste. In addition, the regulatory environment could provide greater assistance by, for example, using the Building Code to allow the re-use of building materials.
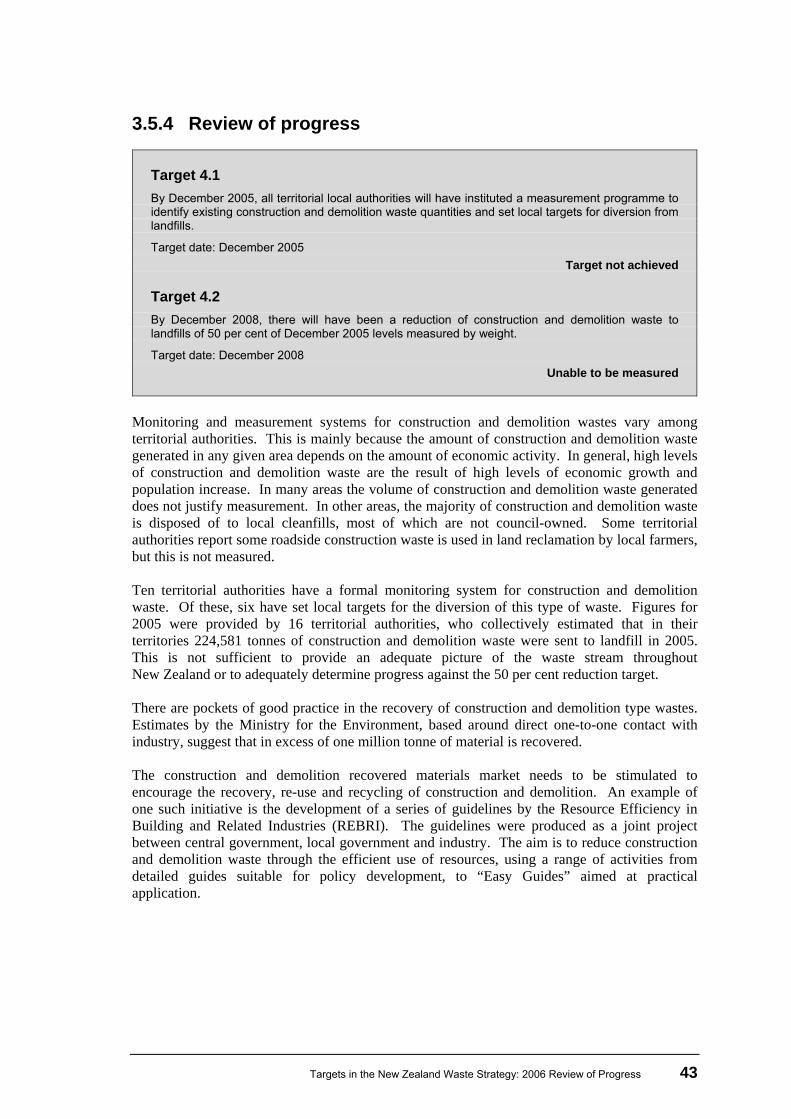
Targets in the New Zealand Waste Strategy: 2006 Review of Progress 43
3.5.4 Review of progress
Target 4.1 By December 2005, all territorial local authorities will have instituted a measurement programme to identify existing construction and demolition waste quantities and set local targets for diversion from landfills.
Target date: December 2005 Target not achieved
Target 4.2 By December 2008, there will have been a reduction of construction and demolition waste to landfills of 50 per cent of December 2005 levels measured by weight.
Target date: December 2008 Unable to be measured
Monitoring and measurement systems for construction and demolition wastes vary among territorial authorities. This is mainly because the amount of construction and demolition waste generated in any given area depends on the amount of economic activity. In general, high levels of construction and demolition waste are the result of high levels of economic growth and population increase. In many areas the volume of construction and demolition waste generated does not justify measurement. In other areas, the majority of construction and demolition waste is disposed of to local cleanfills, most of which are not council-owned. Some territorial authorities report some roadside construction waste is used in land reclamation by local farmers, but this is not measured. Ten territorial authorities have a formal monitoring system for construction and demolition waste. Of these, six have set local targets for the diversion of this type of waste. Figures for 2005 were provided by 16 territorial authorities, who collectively estimated that in their territories 224,581 tonnes of construction and demolition waste were sent to landfill in 2005. This is not sufficient to provide an adequate picture of the waste stream throughout New Zealand or to adequately determine progress against the 50 per cent reduction target. There are pockets of good practice in the recovery of construction and demolition type wastes. Estimates by the Ministry for the Environment, based around direct one-to-one contact with industry, suggest that in excess of one million tonne of material is recovered. The construction and demolition recovered materials market needs to be stimulated to encourage the recovery, re-use and recycling of construction and demolition. An example of one such initiative is the development of a series of guidelines by the Resource Efficiency in Building and Related Industries (REBRI). The guidelines were produced as a joint project between central government, local government and industry. The aim is to reduce construction and demolition waste through the efficient use of resources, using a range of activities from detailed guides suitable for policy development, to “Easy Guides” aimed at practical application.
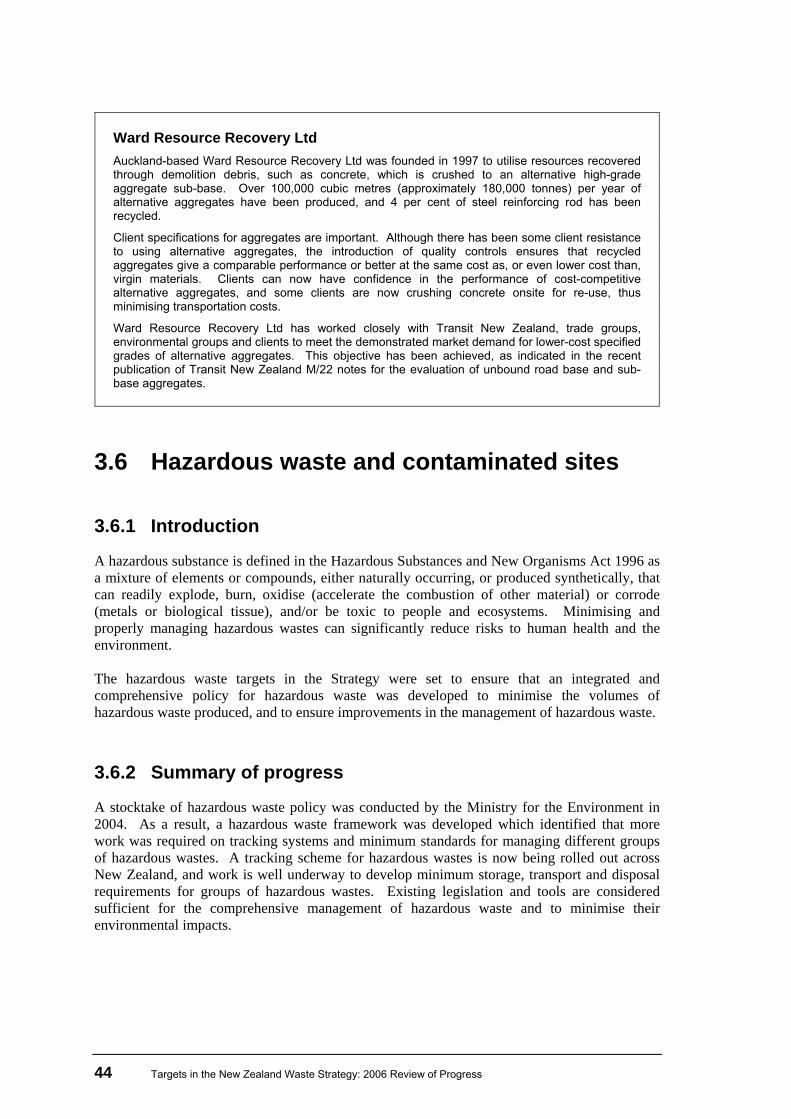
44 Targets in the New Zealand Waste Strategy: 2006 Review of Progress
Ward Resource Recovery Ltd Auckland-based Ward Resource Recovery Ltd was founded in 1997 to utilise resources recovered through demolition debris, such as concrete, which is crushed to an alternative high-grade aggregate sub-base. Over 100,000 cubic metres (approximately 180,000 tonnes) per year of alternative aggregates have been produced, and 4 per cent of steel reinforcing rod has been recycled.
Client specifications for aggregates are important. Although there has been some client resistance to using alternative aggregates, the introduction of quality controls ensures that recycled aggregates give a comparable performance or better at the same cost as, or even lower cost than, virgin materials. Clients can now have confidence in the performance of cost-competitive alternative aggregates, and some clients are now crushing concrete onsite for re-use, thus minimising transportation costs.
Ward Resource Recovery Ltd has worked closely with Transit New Zealand, trade groups, environmental groups and clients to meet the demonstrated market demand for lower-cost specified grades of alternative aggregates. This objective has been achieved, as indicated in the recent publication of Transit New Zealand M/22 notes for the evaluation of unbound road base and sub-base aggregates.
3.6 Hazardous waste and contaminated sites
3.6.1 Introduction
A hazardous substance is defined in the Hazardous Substances and New Organisms Act 1996 as a mixture of elements or compounds, either naturally occurring, or produced synthetically, that can readily explode, burn, oxidise (accelerate the combustion of other material) or corrode (metals or biological tissue), and/or be toxic to people and ecosystems. Minimising and properly managing hazardous wastes can significantly reduce risks to human health and the environment. The hazardous waste targets in the Strategy were set to ensure that an integrated and comprehensive policy for hazardous waste was developed to minimise the volumes of hazardous waste produced, and to ensure improvements in the management of hazardous waste.
3.6.2 Summary of progress
A stocktake of hazardous waste policy was conducted by the Ministry for the Environment in 2004. As a result, a hazardous waste framework was developed which identified that more work was required on tracking systems and minimum standards for managing different groups of hazardous wastes. A tracking scheme for hazardous wastes is now being rolled out across New Zealand, and work is well underway to develop minimum storage, transport and disposal requirements for groups of hazardous wastes. Existing legislation and tools are considered sufficient for the comprehensive management of hazardous waste and to minimise their environmental impacts.
Targets in the New Zealand Waste Strategy: 2006 Review of Progress 45
The Ministry for the Environment is undertaking an intensive programme of work focusing on establishing the policy and legal frameworks for the assessment, management and remediation of contaminated land. The Hazardous Activities and Industries List (HAIL) provides a comprehensive indication of where the risks areas are. Many regional councils and unitary authorities have identified sites that could cause contamination, and there are guidelines available to industry on how to manage certain activities involving the storage, transportation and use of hazardous materials. To date, seven regional councils have subjected 4,424 sites across New Zealand to rapid risk screening. The total number of contaminated sites in New Zealand is presently unknown.
Key findings
• Existing legislative tools are sufficient to ensure the safe management of hazardous waste.
• Earlier identified weaknesses in the management of hazardous wastes are being resolved. WasteTRACK, a tracking scheme for hazardous wastes, is now being rolled out across the country, and work is underway to develop minimum storage, transport and disposal requirements for various groups of hazardous wastes.
• The majority of hazardous waste is disposed of and treated through municipal waste water treatment plants.
• A total of 4,424 contaminated sites have been subjected to rapid screening by seven regional councils.
• Significant progress has been made in providing technical guidance for the management of contaminated sites.
• A review of the framework for managing contaminated land is underway.
• The Contaminated Site Remediation Fund has been valuable in providing impetus to conduct investigations and clean-ups, particularly for “orphan” sites where direct liability is not clear.
3.6.3 Looking forward
Action is still required to minimise the amounts of hazardous waste produced and to establish programmes to recycle hazardous materials. Over time, the hazardous waste tracking scheme will provide detailed information on the amounts and types of hazardous waste produced, and will help identify opportunities to reduce and recycle certain hazardous wastes. Continued work is required to ensure all sites on the HAIL are subjected to screening and are managed appropriately.
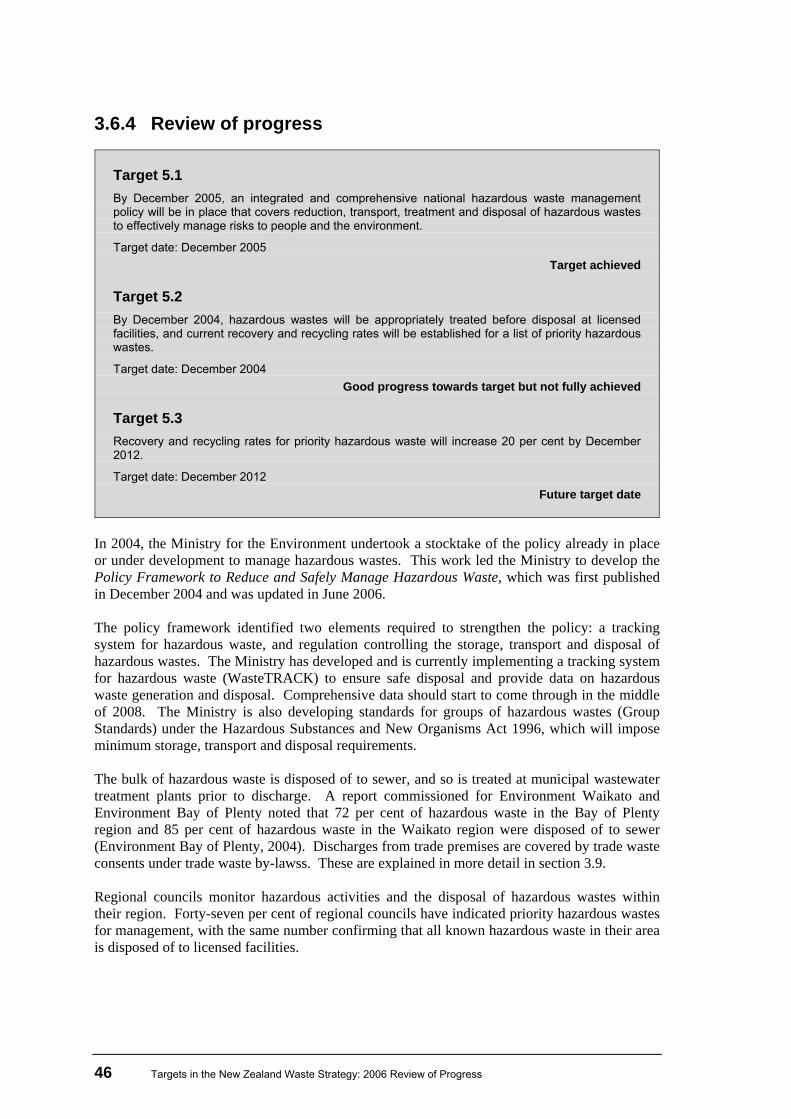
46 Targets in the New Zealand Waste Strategy: 2006 Review of Progress
3.6.4 Review of progress
Target 5.1 By December 2005, an integrated and comprehensive national hazardous waste management policy will be in place that covers reduction, transport, treatment and disposal of hazardous wastes to effectively manage risks to people and the environment.
Target date: December 2005 Target achieved
Target 5.2 By December 2004, hazardous wastes will be appropriately treated before disposal at licensed facilities, and current recovery and recycling rates will be established for a list of priority hazardous wastes.
Target date: December 2004 Good progress towards target but not fully achieved
Target 5.3 Recovery and recycling rates for priority hazardous waste will increase 20 per cent by December 2012.
Target date: December 2012 Future target date
In 2004, the Ministry for the Environment undertook a stocktake of the policy already in place or under development to manage hazardous wastes. This work led the Ministry to develop the Policy Framework to Reduce and Safely Manage Hazardous Waste, which was first published in December 2004 and was updated in June 2006. The policy framework identified two elements required to strengthen the policy: a tracking system for hazardous waste, and regulation controlling the storage, transport and disposal of hazardous wastes. The Ministry has developed and is currently implementing a tracking system for hazardous waste (WasteTRACK) to ensure safe disposal and provide data on hazardous waste generation and disposal. Comprehensive data should start to come through in the middle of 2008. The Ministry is also developing standards for groups of hazardous wastes (Group Standards) under the Hazardous Substances and New Organisms Act 1996, which will impose minimum storage, transport and disposal requirements. The bulk of hazardous waste is disposed of to sewer, and so is treated at municipal wastewater treatment plants prior to discharge. A report commissioned for Environment Waikato and Environment Bay of Plenty noted that 72 per cent of hazardous waste in the Bay of Plenty region and 85 per cent of hazardous waste in the Waikato region were disposed of to sewer (Environment Bay of Plenty, 2004). Discharges from trade premises are covered by trade waste consents under trade waste by-lawss. These are explained in more detail in section 3.9. Regional councils monitor hazardous activities and the disposal of hazardous wastes within their region. Forty-seven per cent of regional councils have indicated priority hazardous wastes for management, with the same number confirming that all known hazardous waste in their area is disposed of to licensed facilities.
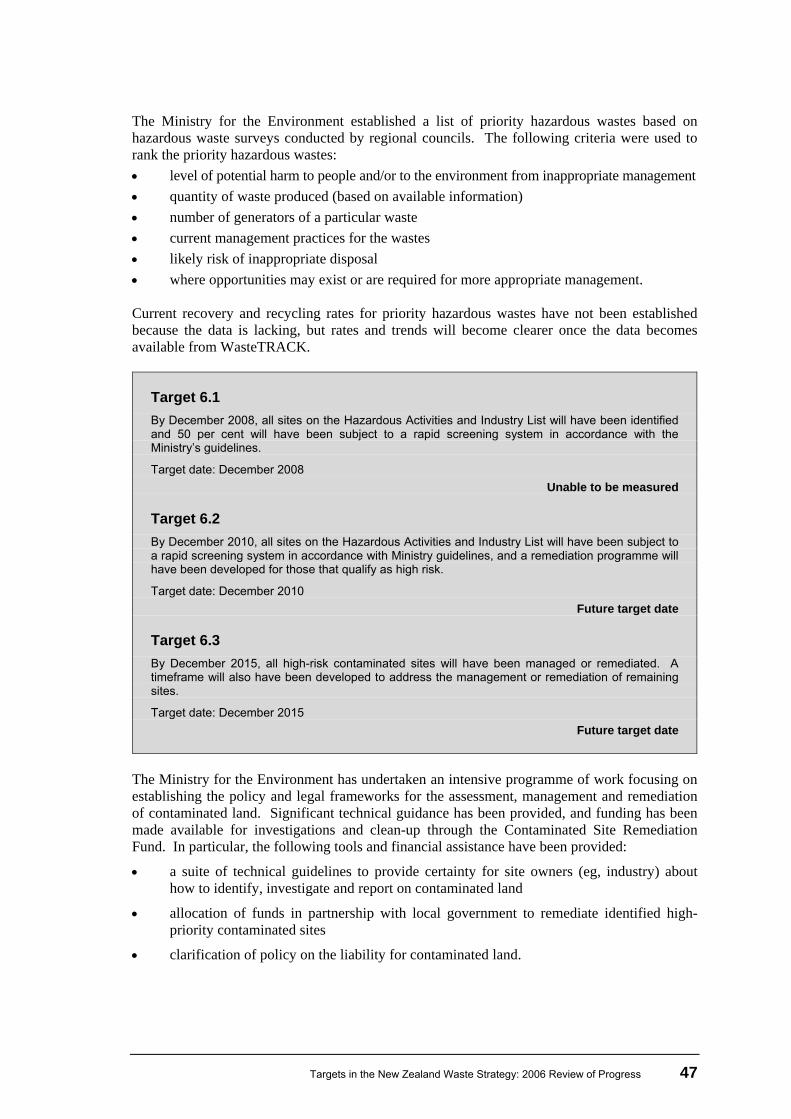
Targets in the New Zealand Waste Strategy: 2006 Review of Progress 47
The Ministry for the Environment established a list of priority hazardous wastes based on hazardous waste surveys conducted by regional councils. The following criteria were used to rank the priority hazardous wastes: • level of potential harm to people and/or to the environment from inappropriate management • quantity of waste produced (based on available information) • number of generators of a particular waste • current management practices for the wastes • likely risk of inappropriate disposal • where opportunities may exist or are required for more appropriate management. Current recovery and recycling rates for priority hazardous wastes have not been established because the data is lacking, but rates and trends will become clearer once the data becomes available from WasteTRACK.
Target 6.1 By December 2008, all sites on the Hazardous Activities and Industry List will have been identified and 50 per cent will have been subject to a rapid screening system in accordance with the Ministry’s guidelines.
Target date: December 2008 Unable to be measured
Target 6.2 By December 2010, all sites on the Hazardous Activities and Industry List will have been subject to a rapid screening system in accordance with Ministry guidelines, and a remediation programme will have been developed for those that qualify as high risk.
Target date: December 2010 Future target date
Target 6.3 By December 2015, all high-risk contaminated sites will have been managed or remediated. A timeframe will also have been developed to address the management or remediation of remaining sites.
Target date: December 2015 Future target date
The Ministry for the Environment has undertaken an intensive programme of work focusing on establishing the policy and legal frameworks for the assessment, management and remediation of contaminated land. Significant technical guidance has been provided, and funding has been made available for investigations and clean-up through the Contaminated Site Remediation Fund. In particular, the following tools and financial assistance have been provided:
• a suite of technical guidelines to provide certainty for site owners (eg, industry) about how to identify, investigate and report on contaminated land
• allocation of funds in partnership with local government to remediate identified high-priority contaminated sites
• clarification of policy on the liability for contaminated land.
48 Targets in the New Zealand Waste Strategy: 2006 Review of Progress
The Hazardous Activities and Industries List (HAIL) is a compilation of activities and industries that typically use or store hazardous substances that could cause contamination if these substances: • escape from safe storage • are disposed of on the site • are lost to the environment through their use. The HAIL and associated guidance provide regional councils with a process to identify and track hazardous activities and industry. Guidelines produced by the Ministry for the Environment provide consistency of reporting on the investigation, assessment and remediation of contaminated sites in New Zealand, including the processes for rapid screening of sites on the HAIL list. Regional councils monitor contaminated sites in their region, usually via a site database. There is no standard system for collecting site information, however, so systems vary between councils. A number of councils report that they are looking to update their system in order to monitor listed sites more effectively. The total number of sites on the HAIL list across the country is unknown. It is therefore difficult to measure progress against the target, which aims to ensure that 50 per cent of sites on the HAIL have been subject to rapid screening in accordance with the Ministry’s guidelines. That said, some progress has been made. Seven regional councils have subjected 4,424 sites to formalised site screening through a rapid screening system. Of the 599 high-risk sites currently identified, 56 per cent have already been through a remediation programme or have a remediation or management programme in place. However, previously contaminated sites are still being identified, and progress against the target for remediation and management of all high-risk sites by 2015 will largely depend on how many “new” previously contaminated sites are identified, and when this identification occurs.
3.7 Organochlorines
3.7.1 Introduction
Certain organochlorine chemicals are classified as persistent organic pollutants (POPs) under the United Nations Stockholm Convention on Persistent Organic Pollutants. The Stockholm Convention aims to protect human health and the environment by banning the production and use of persistent organic pollutants, and minimising total environmental releases of these pollutants at the global level. Chemicals presently listed as POPs under the Stockholm Convention are:
• nine pesticides (aldrin, chlordane, DDT, dieldrin, endrin, heptachlor, mirex, hexachlorobenzene and toxaphene)
• polychlorinated biphenyls (PCBs)
• dioxins and furans (polychlorinated dibenzo-p-dioxins and polychlorinated dibenzofurans).
Targets in the New Zealand Waste Strategy: 2006 Review of Progress 49
Although the POPs pesticides of concern in New Zealand have not been used for many years, a number of sites are contaminated from this historical use and dioxins and furans continue to be released from these sites in small but significant quantities. Most stocks of PCBs have already been collected and destroyed. Measures to minimise dioxins and furan releases are set out in New Zealand’s National Implementation Plan under the Stockholm Convention on Persistent Organic Pollutants (Ministry for the Environment, 2006b). A significant feature of POPs is that they bioaccumulate, or build up within the body, in humans and other mammals. Levels of build-up are known as a “body burden”. Because mothers transfer part of their own “body burden” to embryos in utero, and to infants via breast milk, it will take many generations for the presence of persistent organic pollutants to minimise. However, health experts internationally agree that the demonstrated benefits of breast-feeding for an infant outweigh the potential adverse effects of POPs exposure. The Stockholm Convention came into force for New Zealand on 23 December 2004 when new legislation was enacted to bring New Zealand into line with the legal requirements of the Convention. The Hazardous Substances and New Organisms (Stockholm Convention) Amendment 2003 requires that all persistent organic pollutants are banned from importation, production and use in New Zealand. Under this legislation, PCBs that are presently exempted for ongoing use must be phased out and destroyed by 2016. Another key obligation under the convention is to take measures to reduce or eliminate the release of persistent organic pollutants from stockpiles and wastes.
3.7.2 Summary of progress
Significant progress against the targets for organochlorines has been made. New Zealand’s legislation now complies with the Stockholm Convention, and the Government’s National Implementation Plan (Ministry for the Environment, 2006b) sets out in detail how our obligations under the convention will be met over the longer term. One example of action to reduce POPs from the New Zealand environment is the agrichemicals collection programme. This multi-year programme to collect and dispose of intractable agrichemical pesticides from farms across New Zealand has been very successful, with 290 tonnes of material collected so far. Plans are in place to collect the remaining 175 tonnes by 2009.
Key findings
• New Zealand has ratified the Stockholm Convention on Persistent Organic Pollutants, and New Zealand’s National Implementation Plan under the convention outlines how organochlorines issues are being addressed.
• Legacy agrichemicals are being collected and disposed of from rural areas through the agrichemical collection programme. The majority of these have been persistent organic pollutants.
• Some local authorities collect hazardous wastes to help urban communities safely dispose of unwanted agrichemicals, including organochlorines.
• Government is working with industry to complete the phase-out and destruction of PCBs and implement measures to reduce or eliminate the release of dioxin and furan.
50 Targets in the New Zealand Waste Strategy: 2006 Review of Progress
3.7.3 Looking forward
A programme to manage and reduce organochlorines is now in place through New Zealand’s National Implementation Plan under the Stockholm Convention on Persistent Organic Pollutants (Ministry for the Environment, 2006). The Plan sets out New Zealand’s obligations under the Stockholm Convention and provides details on the programme of action to meet these obligations and significantly reduce environmental and human health risks for New Zealanders from persistent organic pollutants.
3.7.4 Review of progress
Target 7.1 By December 2010, New Zealand will have met international obligations under the Stockholm Convention to collect and destroy PCBs and organochlorine pesticide wastes.
Target date: December 2010 Future target date
In 2002 the Ministry for the Environment worked with regional councils to establish a project to collect and dispose of intractable agrichemical pesticides, some of which are persistent organic pollutants, from farms across New Zealand. This programme built on agrichemical collections undertaken by regional councils from the early 1990s, with funding from rates and the Sustainable Management Fund. Rural agricultural chemical collections are undertaken by all regional councils and unitary authorities. The collections involve trained staff visiting farms across New Zealand to record the amounts of intractable agrichemical pesticides and safely remove them. In some areas industry sectors are involved, such as in the Bay of Plenty, where kiwifruit growers participated in the collection programme. In other areas large publicity campaigns preceded the collections to raise awareness. Once collected, the chemicals are either treated within New Zealand or shipped abroad to be safely treated and disposed of. By June 2006 the agrichemicals project had collected approximately 290 tonnes of material, of which approximately 225 tonnes is “intractable” material. It is estimated that approximately 175 tonnes of uncollected intractable agrichemical pesticides remain in New Zealand. The Ministry for the Environment will continue to support regional councils to collect the remaining agrichemical pesticides before 30 June 2009. More information on this project can be found in Intractable Agricultural Chemicals in New Zealand (Ministry for the Environment, 2006a), available on the Ministry for the Environment website. In urban areas, agrichemicals, persistent organic pollutants and other intractable materials are collected, along with other hazardous materials, through HazMobile collections. The HazMobile is a free service for households which is provided by some local authorities. The HazMobile visits various sites throughout New Zealand several times a year so that householders can safely dispose of their hazardous wastes, including old paints, waste oil, batteries, household and agrichemical POPs and other intractable materials. In addition, a number of local authorities have created permanent drop-off points for agrichemicals, often at transfer stations.
Targets in the New Zealand Waste Strategy: 2006 Review of Progress 51
The Ministry for the Environment and the Environmental Risk Management Authority (ERMA) are working with the industrial sector to minimise the volumes and impacts of polychlorinated biphenyls (PCBs), as follows.
• ERMA will administer the system of exemptions for the use and storage of PCBs to achieve New Zealand’s commitment under the Stockholm Convention to withdraw from use, and dispose of exempted PCB stocks before 2016.
• ERMA and the Ministry will facilitate the ongoing collection and disposal of miscellaneous and minor PCB stocks.
Target 7.2 By December 2020, the average body burdens of dioxins will have been reduced to 10 per cent of present-day levels.2
Target date: December 2020 Future target date
As required under the Stockholm Convention, the Ministry for the Environment has prepared an Action Plan for Dioxins and Other Annex C Chemicals as part of the New Zealand’s National Implementation Plan under the Stockholm Convention on Persistent Organic Pollutants (Ministry for the Environment, 2006). The plan sets out how New Zealand will address its obligations under this aspect of the Convention to minimise future releases and exposures to dioxin. Research undertaken by the Ministry between 1996 and 2001 found that body burdens for most New Zealanders appears to be low, relative to many other countries. Over 90 per cent of our exposure to dioxin (and other POPs) is thought to come from eating foods of animal origin, such as meats, dairy products and fish. New Zealand has already achieved − or is currently undertaking activities that go a long way towards meeting − the objective to minimise dioxin exposure. For example, the entry into force of the National Environmental Standard Relating to Certain Air Pollutants, Dioxins and Other Toxics specifically bans key activities that produce dioxins and other air toxins. The Action Plan for Dioxins builds on this platform and identifies a number of measures to be undertaken over the next three to five years. Good progress has also been made to identify sources of dioxin release and measures to eliminate or reduce them.
2 Ten per cent of “present levels” is referenced to the levels reported in Concentrations of Selected Organochlorines in Serum from the Non-Occupationally Exposed New Zealand Population (Ministry for the Environment, 2001).
52 Targets in the New Zealand Waste Strategy: 2006 Review of Progress
3.8 Trade waste and waste disposal
3.8.1 Introduction
Setting high environmental standards for waste disposal is a key objective of the New Zealand Waste Strategy. The targets for trade waste and waste disposal aim to ensure that policies and procedures are in place that improve performance in the management of trade waste, identify the true costs of disposal of waste and, where appropriate and practical, apply these costs directly to waste generators.
3.8.2 Summary of progress
Targets in the New Zealand Waste Strategy relating to improving standards for wastewater treatment plants, cleanfills and landfills have longer time frames than other targets. This reflects the fact that changes to standards can take time to implement. Good progress has already been made in this area, however, with significant improvement in landfill management, cost recovery and the accelerated closure of substandard landfills. Progress is being made in relation to wastewater treatment plants, with major upgrades completed or underway for a number of plants in urban areas. Upgrades to treatment plants in small communities are eligible for funding support through the government Sanitary Works Subsidy Scheme. However, limited data is available for cleanfills, because cleanfills tend to be privately operated and are often classed as permitted activities under regional plans. Cleanfills that are permitted under a plan are not subject to the same monitoring as landfills. Eighty-nine per cent of territorial authorities report that they have, or are in the process of enacting, the New Zealand Standard Model General Bylaw, Part 23 – Trade Waste. This is a significant achievement in standardising and improving the management of trade waste in New Zealand. The trade waste by-law encourages the development and implementation of waste minimisation and management plans or programmes at each permitted site, although the lack of a “recognised” trade waste plan or programme makes it difficult for a territorial authority to enforce.
Key findings
• The disposal of liquid trade waste to wastewater collection and treatment systems has improved through the model Trade Waste By-law. Eighty-nine per cent of territorial authorities have either enacted or are in the process of enacting a trade waste by-law.
• Although the model Trade Waste By-law has had good uptake, few waste minimisation and management plans or programmes for individual permitted sites are in place.
• Wastewater treatment plants have been steadily upgraded around the country, with a subsidy scheme available for upgrades in small rural areas.
• There has been an overall reduction in the number of landfills operating, from 115 in 2002 to 60 in 2006, with a further eight to 10 due to close over the next 24 months.
Targets in the New Zealand Waste Strategy: 2006 Review of Progress 53
• Best-practice guidelines on the consent process, design and construction, full cost accounting and waste acceptance criteria have improved the management and operation of landfills throughout the country.
• Limited information is available on cleanfills because they tend to be privately operated and are often permitted under regional and district plans.
3.8.3 Looking forward
Continued work is required to ensure best practice standards are implemented nationwide for landfills and wastewater treatment plants. This includes the ongoing identification of and improved management of landfills and wastewater treatment plants. There may be significant opportunities to improve waste diversion from cleanfills if more is known about the types and amounts of materials they manage annually. The Trade Waste By-law has provided a basis for improving waste minimisation and management at permitted sites. However, the development of a standard way to assess waste management and minimisation plans for such sites would help to improve the management of trade wastes.
3.8.4 Review of progress
Target 8.1 By December 2005, all territorial local authorities will have implemented and will be monitoring trade waste by-laws based on the New Zealand Standard Model General Bylaws, Part 23 – Trade Waste or its equivalent.
Target date: December 2005 Good progress towards target but not fully achieved
Target 8.2 By December 2005, all territorial local authorities will ensure that all holders of new or renewed trade waste permits will have in place a recognised waste minimisation and management programme.
Target date: December 2005 Target unable to be achieved
A survey in 2005 identified that 89 per cent of territorial authorities have either implemented or are intending to implement the New Zealand Standard Model General Bylaw, Part 23 – Trade Waste or its equivalent. Seven small territorial authorities have indicated that they do not intend to implement the by-law because there are only a small number of dischargers of trade wastes in their localities.
54 Targets in the New Zealand Waste Strategy: 2006 Review of Progress
The trade waste by-law imposes some costs to industry based on the types and nature of the waste streams they dispose of. This cost is in itself an incentive to minimise waste, but one of the objectives of the trade waste by-law is to improve waste minimisation. Territorial authorities encourage trade waste permit holders to develop waste minimisation and a management plan or programme. Feedback from trade waste officers in territorial authorities, however, indicates that the lack of a recognised standard for waste minimisation or a management plan or programme makes it difficult to comply with this target. Recent surveys of territorial authorities have reported that of the 6,058 known trade waste permits approved under the by-law, only 200 are known to have waste minimisation and management programmes or plans in place. The trade waste by-law is seen as an effective way to encourage waste minimisation of trade waste from industry and business. Tools are available to assist business (eg, Quickstart, Envirosmart, the Natural Step and ISO 14001), but the lack of a nationally recognised waste minimisation and management plan or programme makes it difficult to enforce any requirement for a plan to be in place before permits are granted.
Target 9.1 By December 2003, local authorities will have addressed their funding policy to ensure that full cost recovery can be achieved for all waste treatment and disposal processes.
Target date: December 2003 Target achieved
Under the Local Government Act 2002 all territorial authorities are required to produce a Long Term Council Community Plan, in consultation with their community. This process is comprehensive and transparent and is used to set priorities for funding and policy development by the territorial authority. This means that all finances are considered in conjunction with the local community, who may decide that full cost recovery is not necessary or practical for waste disposal. Evidence suggests that all territorial authorities have implemented full cost recovery in different ways. A recent survey of territorial authorities shows that 59 per cent have a user-pays system for the collection of their residential waste, and at least 93 per cent charge for disposal at their landfill or transfer stations. In many areas the disposal of recycling or green waste at a landfill or transfer station is either free or at a reduced rate.
Target 9.2 By December 2005, operators of all landfills, cleanfills and wastewater treatment plants will have calculated user charges based on the full costs of providing and operating the facilities and established a programme to phase these charges in over a timeframe acceptable to the local community.
Target date: December 2005 Target achieved
For all facilities operated by territorial authorities, the asset management requirement of the Local Government Act 2002 mean that the costs of running these facilities, including long-term replacement costs, are known. Most territorial authorities include costs for domestic wastewater
Targets in the New Zealand Waste Strategy: 2006 Review of Progress 55
treatment in general rates, and industrial wastewater treatment costs are charged through trade waste permits. Charges for refuse collections are often on a user-pays basis. Fifty-nine per cent of territorial authorities operate a user-pays system to fund waste collections. In other areas, costs are built into general rates, targeted rates and/or uniform annual charges. Ninety-eight per cent of territorial authorities charge for access to landfills or transfer stations. However, in many areas there are reduced or no charges for recyclables and green waste in order to incentivise the diversion of materials from landfill. There are also some constraints on charging at rural transfer stations and for domestic rubbish collections, but these are managed at a local level. Although the overall costs involved with wastewater are generally known, the marginal capital and operational costs attributed to an additional connection to the sewerage/sewage system may not be clear. These can be dealt with through development contributions, as laid out in the Local Government Act 2002, but this relies on an appropriate funding policy being articulated in the Long Term Council Community Plan. The costs of providing and replacing infrastructure for wastewater are addressed in detail in asset management programmes that have been implemented by local government and Audit New Zealand following the Local Government Amendment (Number 3) Act. Operational costs tend to be based more closely on historical costs and are subject to challenge from time to time, and the costs associated with domestic wastewater flows compared to commercial and industrial flows (trade wastes) are similarly unclear. For privately owned landfills and cleanfills it is assumed full costs are recovered to ensure the businesses optimise their profit. Although it is not possible to legally require a private company to charge full costs for waste disposal, the Landfill Full Cost Accounting Guide for New Zealand (Ministry for the Environment, 2002b/2004) does provide guidance in support of this. The Guide helps decision-makers, both government sector and private, to implement a consistent, full-cost accounting approach to landfills, which incorporates landfill planning, development, operation, closure and after-care. The Guide was updated in March 2004 to encourage landfill operators to calculate charges (or recover costs) for multiple liner design and additional reporting tools, increase charges over time to meet increasing costs, and forecast annual quantities of waste in order to set appropriate future charges. There is very little information available on charges levied at cleanfills. Due to the commercial nature of the large majority of cleanfill operations, and the commercially sensitive nature of cost and charge information, this data is not readily available. It is worth noting that although there are no requirements on a private company to charge full costs, there are commercial drivers to recover the full costs of disposal.
Target 9.3 By December 2005, all cleanfills will comply with cleanfill disposal guidelines.
Target date: December 2005 Unable to be measured
The Guide to the Management of Cleanfills (Ministry for the Environment, 2002a) outlines the regulatory framework for cleanfills in New Zealand, provides a definition of “cleanfill”, and outlines siting, design and operation considerations for cleanfill sites. This Guide also defines
56 Targets in the New Zealand Waste Strategy: 2006 Review of Progress
“cleanfill material” and identifies lists of acceptable, conditionally acceptable and unacceptable materials for cleanfills. In many parts of New Zealand the operation of a cleanfill is classed as a permitted activity in the relevant regional plan. Territorial authorities and/or regional councils use a threshold approach to determine the appropriate level of monitoring. General cleanfill is permitted at a regional level, while district plans set a threshold on an earthworks basis. This means that smaller sites are permitted with limited monitoring, but larger ones are identified and managed through the resource consent process, often with conditions that specify the range of materials that can be accepted for disposal. In general, where cleanfills are consented they are sizeable, and appropriate monitoring is undertaken. The Guide to the Management of Cleanfills has been adopted by most regional councils and territorial authorities in New Zealand and used as a basis for permitted activity rules and resource consent conditions. In most cases there is no requirement in the permitted activity rules or consents to monitor and report tonnages. In some areas, such as Christchurch, Local Government Act 2002 by-laws have been introduced to require reporting and to put in place waste acceptance criteria for cleanfills (see boxed text below). Information from territorial authorities and regional councils suggests that there are around 300 cleanfills in New Zealand, although there may be some duplication in these figures. Forty-three per cent of those cleanfills are reported to comply with the cleanfill disposal guidelines.
Christchurch Cleanfill By-law In 2004 Christchurch City Council’s Cleanfill Licensing Bylaw came into effect, which regulates the types of materials that may enter local cleanfills to encourage materials recovery, re-use and recycling. The by-law imposes a charge on “non-natural” materials. Implementation of the by-law requires collating and providing basic data on the quantities and origin of all cleanfill materials.
In the first year the total annual volume of material disposed of to cleanfill dropped from 370,000m3 to 300,000m3, equating to around a 20 per cent drop. Around 15 per cent of this reduction is estimated to be directly attributable to the levy. In 2005/06 the total volume of materials increased by 12 per cent, reflecting the continuing high levels of construction activity in Christchurch. However, materials on which a levy could be charged increased less (eight per cent) than other non-levyable materials (15 per cent). Levyable materials have decreased proportionally from 38 per cent to 36 per cent of total materials disposed of.
It has been concluded that the by-law has neither materially nor negatively affected contractors’ profitability in these sectors. Cost increases resulting from the levy are not considered to be high enough to constitute a barrier to construction activities. The by-law did, however, lead to an initial increase in costs for the demolition sector, due to both the levy on materials and a ban on timber being sent to cleanfill. However, the quantity of demolition waste disposed of to cleanfills covered by the by-law fell in 2005/06 as contractors became accustomed to the effects of the by-law.
Targets in the New Zealand Waste Strategy: 2006 Review of Progress 57
Target 9.4 By December 2010, all substandard landfills will be upgraded or closed.
Target date: December 2010 Future target date
There has been a significant improvement in the management of landfills across New Zealand, especially since the publication of a suite of guidelines around the management of landfills:
• Hazardous Waste Guidelines (Module 2): Landfill Waste Acceptance Criteria and Landfill Classification (Ministry for the Environment, 2004)
• Landfill Full Cost Accounting Guide for New Zealand (Ministry for the Environment 2004)
• A Guide to the Management of Closing and Closed Landfills in New Zealand (Ministry for the Environment 2001)
• Guide to Landfill Consent Conditions (Ministry for the Environment, 2001)
• Landfill Guidelines (Centre for Advanced Engineering, 2000). Overall, there has been a reduction in the number of operating landfills, from 115 in 2002 to 60 in 2006, with a further eight to 10 due to close over the next 24 months. The landfills that are closing tend to be smaller or substandard. In line with the guidelines, larger landfills that remain open have been progressively upgraded to comply with improved standards. General improvements in landfill management include:
• an increase in the number of sites with an engineered liner from 20 per cent in 2002 to 52 per cent in 2006 − this increase is mainly due to the number of new, purpose-built sites, and the majority of those without a liner are on natural sites which do not require a lining
• an improvement in leachate collection at landfill sites from 47 per cent in 2002 to 77 per cent in 2006
• an improvement in landfill gas management from five per cent in 1998 to 23 per cent now collecting gas for beneficial use
• 93 per cent of landfills now measure the amount of waste they are disposing of, an increase of 10 per cent from 2002.
One significant change in landfill management in New Zealand has been the increase in the number of sites accepting hazardous waste. This may reflect the increasing number of new sites, which are designed to accept hazardous materials. There have also been positive improvements in monitoring and reporting, with model hazardous waste manifest documentation now used at 85 per cent of sites. Table 8 provides information on the changes to landfill management since 1995. The data in this table comes from the results of the Landfill Census of 1995 and 1998, and the Landfill Review and Audit in 2002. The table also includes some preliminary results from the Landfill Census 2006, which is due to be published later this year.
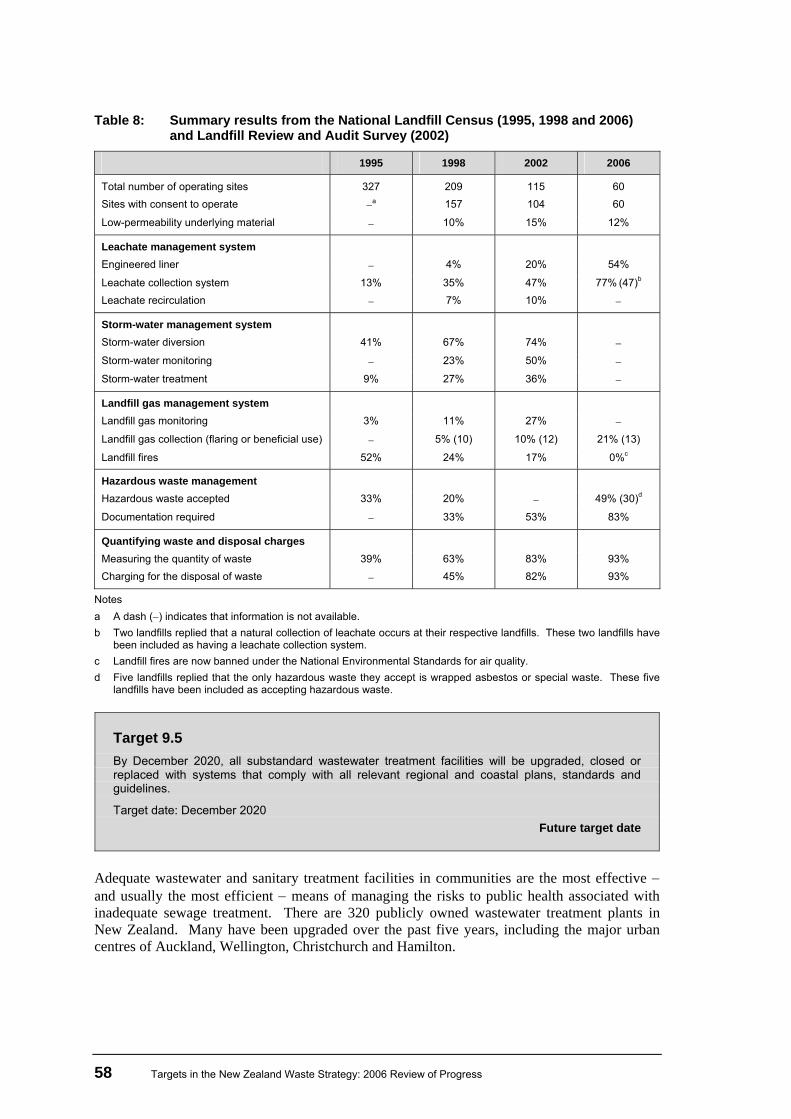
58 Targets in the New Zealand Waste Strategy: 2006 Review of Progress
Table 8: Summary results from the National Landfill Census (1995, 1998 and 2006) and Landfill Review and Audit Survey (2002)
1995 1998 2002 2006
Total number of operating sites 327 209 115 60 Sites with consent to operate −a 157 104 60
Low-permeability underlying material − 10% 15% 12%
Leachate management system Engineered liner − 4% 20% 54%
Leachate collection system 13% 35% 47% 77% (47)b Leachate recirculation − 7% 10% −
Storm-water management system Storm-water diversion 41% 67% 74% − Storm-water monitoring − 23% 50% − Storm-water treatment 9% 27% 36% −
Landfill gas management system Landfill gas monitoring 3% 11% 27% − Landfill gas collection (flaring or beneficial use) − 5% (10) 10% (12) 21% (13)
Landfill fires 52% 24% 17% 0%c
Hazardous waste management Hazardous waste accepted 33% 20% − 49% (30)d
Documentation required − 33% 53% 83%
Quantifying waste and disposal charges Measuring the quantity of waste 39% 63% 83% 93% Charging for the disposal of waste − 45% 82% 93%
Notes a A dash (−) indicates that information is not available. b Two landfills replied that a natural collection of leachate occurs at their respective landfills. These two landfills have
been included as having a leachate collection system. c Landfill fires are now banned under the National Environmental Standards for air quality. d Five landfills replied that the only hazardous waste they accept is wrapped asbestos or special waste. These five
landfills have been included as accepting hazardous waste.
Target 9.5 By December 2020, all substandard wastewater treatment facilities will be upgraded, closed or replaced with systems that comply with all relevant regional and coastal plans, standards and guidelines.
Target date: December 2020 Future target date
Adequate wastewater and sanitary treatment facilities in communities are the most effective − and usually the most efficient − means of managing the risks to public health associated with inadequate sewage treatment. There are 320 publicly owned wastewater treatment plants in New Zealand. Many have been upgraded over the past five years, including the major urban centres of Auckland, Wellington, Christchurch and Hamilton.

Targets in the New Zealand Waste Strategy: 2006 Review of Progress 59
The Resource Management Act 1991 requires all treatment facilities to have consent to operate and therefore meet an appropriate discharge standard for the receiving environment. There is no overall standard for plants, because the final required effluent quality depends on the receiving environment into which the effluent is discharged. As consents are renewed, each individual plant’s performance is assessed and, where appropriate, treatment plants are required to improve the quality of effluent. This consent renewal process has significantly improved the standard of wastewater discharges around New Zealand. The development and improvement of wastewater treatment plants and sewage facilities are mostly funded by ratepayers via rates to territorial authorities. Based on information in the national WINFO database the projected spend on infrastructure upgrade for the next 10 years is over $650 million. Based on experience with recent plant upgrades, it is estimated that between 40 and 50 per cent of these upgrades will be for purely environmental reasons. Some small to medium-sized communities do not have a sufficient rating base to fully fund upgrades to their sanitary works. In 2002 the Government introduced the Sanitary Works Subsidy Scheme to help these communities. The Scheme is run in partnership with local government and is aimed primarily at enabling disadvantaged small and medium-sized communities to achieve good environmental outcomes and safe sanitary conditions. The scheme has proven very successful and is currently oversubscribed.
60 Targets in the New Zealand Waste Strategy: 2006 Review of Progress
4 Conclusions The present review confirms that the principles of the New Zealand Waste Strategy remain relevant in guiding action to improve waste management, waste minimisation and resource efficiency in New Zealand. The review found that all four sectors involved in implementing the Strategy (central government, local government, the waste sector and business) use the Strategy as a focus for waste management and minimisation activities. Many of the specific waste initiatives and actions underway since 2002 have a wider objective than achieving the targets within the Strategy, and reflect efforts to achieve the Strategy’s overall goals and principles.
4.1 Progress against Strategy targets The 2006 review of progress against Strategy targets confirms the 2003 review findings that much of the groundwork for achieving the Strategy’s wider goals and objectives for waste management, waste minimisation and resource efficiency has been laid, but that progress against the Strategy targets has been variable. Ten of the 30 targets have been achieved, achieved ahead of time, or have had significant progress made towards achieving them. Eight targets have a deadline to be achieved in the future, so progress against them is considered in this report in general terms only. Areas of particular achievement against the targets include:
• good progress by local government in improving community access to recycling and green waste diversion schemes within their communities
• increased central government engagement with businesses to achieve waste outcomes (eg, through the New Zealand Packaging Accord and other voluntary product stewardship schemes)
• good progress by central government in developing guidelines to improve the management of landfill sites and hazardous wastes, and by the waste sector and councils in implementing these.
Good progress was also made in: • council action to put in place recycling systems within council-owned buildings • council reporting on their waste minimisation and management activities. However, the report also highlights areas where progress against the targets has been limited. Three targets have not been achieved and four targets were unable to be achieved, while progress against five targets was unable to be measured. Progress was especially limited for:
• targets relating to activities for which councils have been assigned responsibility under the Waste Strategy, but where delivery of the activity is undertaken by another party (eg, commercial organic diversion, construction and demolition waste and cleanfills)
Targets in the New Zealand Waste Strategy: 2006 Review of Progress 61
• targets relating to contaminated sites, although it should be noted that an increasing number of regional councils have started the process of identifying and screening potentially contaminated sites, particularly in terms of ensuring high-risk sites are identified and appropriately managed.
4.2 Progress in priority areas In terms of evaluating progress against the New Zealand Waste Strategy targets, several priority waste areas warrant further discussion.
4.2.1 Waste minimisation
Comprehensive waste minimisation and management initiatives are complex undertakings and take time. In addition, public attitudes about the importance of waste reduction have taken time to evolve. Even so, territorial authorities and the waste industry have steadily implemented actions set out in the Strategy. As a result, waste infrastructure and practices have improved around the country. However, more can still be done. In particular, further effort is required to maintain and increase momentum in waste minimisation initiatives by local government through the development of and support for local programmes. Central government could provide support through the further development of best-practice guidelines and by reviewing underlying policy and legislation to ensure that any barriers to action are removed. In addition, increased effort to raise public awareness of both the importance of waste minimisation and simple actions people can take to reduce their waste could be warranted in order to drive greater community and householder action. The Government is currently reviewing the legislative and policy framework for waste minimisation. This will provide greater clarity on the strategic direction for waste minimisation and support further progress in reducing waste at the national and local level.
4.2.2 Business
Many businesses have realised the economic as well as environmental benefits of implementing waste minimisation plans. Drivers for this include cost reductions from using resources more efficiently and opportunities to meet consumer demand for sustainable products and services. The increased leadership in waste minimisation from the business community shows a growing level of awareness of and commitment to environmental action in this sector than in the past. Government can promote greater effort by the private sector in waste minimisation by highlighting best practice in business and raising the awareness of the tools available to achieve this. In order to achieve greater levels of resource recovery in the business sector, applying economic and regulatory tools may provide a way forward. A continued focus on sustainable purchasing by central government is also important in this respect. Given central government’s significant purchasing power, government leadership in this area supports businesses that adhere to sustainable best practice, including in respect to waste management and minimisation, and sends a strong market signal to suppliers and producers.
62 Targets in the New Zealand Waste Strategy: 2006 Review of Progress
The private sector also has a key role to play in minimising embedded and life cycle waste generation through the up-front design of products. This is a new area of work which we can expect to see given greater attention in future. Lastly, central and local government can build momentum in their present positive engagement with business. As part of this, the development of product stewardship schemes to address special wastes is a priority. The current product stewardship schemes, while making good progress, do not effectively address non-participation. Where voluntary membership does not have the desired effect, it is worth investigating a more regulated approach. This will also help address the concern of some scheme participants that non-participants gain cost advantages in the marketplace by continuing with wasteful practices.
4.2.3 Waste sector
The waste and recycling industry has grown considerably since 2002 and many services are now operated by private sector interests. New markets are opening for materials previously disposed of to landfill, and this is also driving commercial activity. Over the years, central government has developed a number of best-practice guidelines and standards to provide leadership in waste management and minimisation. These have been widely adopted by the waste industry, but further guidance is required to facilitate improvements in waste minimisation and management at a local and regional level.
4.2.4 Special wastes
As mentioned above, most waste reduction for special wastes occurs through product stewardship schemes. Industry has made good progress in implementing such schemes for packaging (paint, paper, plastic, glass, steel and aluminium) and “special wastes” such as waste oil, waste electronic and electrical equipment, farm plastics and tyres. Continued effort in this area is essential if these wastes are to be more comprehensively diverted from landfill.
4.2.5 Organics
Ongoing work in this field has ensured that some progress is being made to manage and minimise organic wastes effectively. Green waste, in particular, has received much attention around the country, resulting in good diversion rates. Although an estimated 35 per cent of green waste is diverted from landfills, there is the opportunity to increase this amount through increased funding for waste diversion management programmes, and the promotion of best practice in the industry. More can be done, too, to divert from landfill other organic wastes such as food waste and commercial organic waste. There are still difficulties monitoring organic waste flows. The figures used in this report are estimates only, given limited data availability, and a process needs to be put in place to gather more accurate data in order to provide better nationwide consistency. There is still a need to develop and improve markets for reprocessed organic wastes, especially in the biosolids area.
Targets in the New Zealand Waste Strategy: 2006 Review of Progress 63
4.2.6 Construction and demolition
Although the amount of construction and demolition waste going to landfill can be estimated, the amount going to cleanfill is relatively unknown. Evidence from the limited data available suggests that significantly more construction and demolition waste goes to cleanfill than landfill. Likewise, the amount of construction and demolition material diverted from disposal to cleanfill is unknown. Improved monitoring and reporting of data on wastes disposed of to cleanfills would help to develop policies and programmes to increase diversion rates for construction and demolition waste. Further efforts are also needed to identify opportunities for increased reprocessing and re-use of construction and demolition waste. Ideally, opportunities for reprocessing and re-use should be investigated alongside increased assistance to develop markets for the resulting reprocessed materials. The suite of guidelines developed by the Resource Efficiency in Building and Related Industries (REBRI), provide an excellent starting point to reduce volumes of construction and demolition waste, but more can be done to improve progress in this area.
4.2.7 Hazardous wastes / contaminated sites
The existing policy framework for hazardous wastes ensures the safe management of these wastes, but a greater focus is needed on diverting hazardous wastes from the waste stream. Over time, use of the hazardous waste tracking system will enable a more accurate picture to be built of national hazardous waste flows (both in terms of volume and type), and will help identify opportunities for further diversion of hazardous wastes. A number of regional councils have begun to identify and screen potentially contaminated sites, but progress has been slow and varies around the country. More work is needed to ensure that all sites on the Hazardous Activities and Industries List can be “rapid screened” and appropriately managed, as per recommended best practice. The process of remediation of contaminated sites is in its early stages, but has been aided by the establishment of the Contaminated Sites Remediation Fund.
4.2.8 Waste data
Progress has been made in the collation and reporting of nationwide data on waste to landfill. However, an improvement in monitoring and reporting of local waste volumes, waste composition and diverted wastes for beneficial use will greatly assist the development of targeted waste programmes. Although some territorial authorities provide excellent data on their waste and recycling activities, others have incomplete data sets, which make it difficult to build a comprehensive national picture of waste flows of various types around New Zealand. These difficulties are compounded by the commercial sensitivity of much of the data held by private sector waste operators. As a result, detailed data on specific waste streams, such as organic wastes and construction and demolition waste, remains very difficult to access. In addition, very few standard waste reporting methodologies are in place, although the Solid Waste Analysis Protocol has laid some groundwork for this. Where standard methodologies do exist, there are difficulties in applying these consistently.
64 Targets in the New Zealand Waste Strategy: 2006 Review of Progress
Current data may be unable to adequately inform policy for some waste types. For example, although it is thought that the amount of waste disposed of to the country’s estimated 300 cleanfills is similar to that disposed of to landfill, no firm data is available. The lack of comprehensive data provides a poor basis on which to formulate new policy or engage the waste sector on possible solutions.
Targets in the New Zealand Waste Strategy: 2006 Review of Progress 65
5 Recommendations There has been good progress by central government, local government and the waste sector in achieving the wider principles and goals of the New Zealand Waste Strategy, but more can be done to make progress against some Strategy targets. In order to build on earlier achievements in waste management, waste minimisation and resource efficiency, and given the variable performance against some targets, this report recommends the following actions:
1. Retain the New Zealand Waste Strategy as an appropriate framework to improve waste management and drive waste minimisation consistent with the direction of the Government’s wider sustainable development objectives for New Zealand.
2. Focus future effort to manage and minimise waste in the following areas.
2.1 Maintain and increase momentum in waste management and minimisation activity by local government through the development of and support for programmes to: 2.1.1 enhance the adoption of best practice 2.1.2 strengthen regional cooperation, where appropriate 2.1.3 draw on international best practice 2.1.4 expand existing services and increase participation in them 2.1.5 increase funding, and additional funding mechanisms, for waste minimisation
initiatives.
2.2 Build on existing guidelines and standards, with an initial focus on the current review of the Building Code to consider recycling facilities for multi-unit apartments, and the development of standard means of evaluating waste minimisation and management programmes for trade wastes.
2.3 Increase public awareness to drive greater community and householder action on waste minimisation.
2.4 Improve the management of priority waste streams as set out in the New Zealand Waste Strategy; specifically:
Organics
2.4.1 Assist in the development and improvement of markets for reprocessed organic wastes, especially biosolids.
2.4.2 Improve organic waste diversion management, best-practice implementation and promotion of emerging technologies.
2.4.3 Improve the monitoring of organic waste streams.
Construction and demolition
2.4.4 Assist in the development and improvement of markets for construction and demolition waste.
2.4.5 Identify opportunities for, and engage the sector in, increased reprocessing and re-use by, for example, a construction sector accord.
66 Targets in the New Zealand Waste Strategy: 2006 Review of Progress
2.4.6 Improve monitoring and reporting of data from cleanfills.
2.4.7 Improve monitoring and reporting of data from landfills.
Hazardous waste and contaminated sites
2.4.8 Further develop existing frameworks and tools.
3. Review and revise some targets in the Strategy in order to:
3.1 update or remove those targets that have proven to be unclear, unable to be adequately measured, unworkable from a legal perspective, or out of date in their allocation of responsibility for action, and for any revised targets ensure consistency of language and fit with baseline data, statutory frameworks and case law
3.2 reflect changes in the wider waste management and minimisation landscape
3.3 better reflect progress against the targets and, where necessary, set new, updated targets
3.4 better reflect the current state of knowledge of waste management, minimisation and resource recovery in New Zealand
3.5 align targets with current central and local government aims relating to environmental sustainability.
4. Any such review should await forthcoming decisions by the Government on the future strategic direction of waste policy in New Zealand. This is to minimise transaction costs, avoid potential duplication, minimise the risk of new targets becoming out of date soon after they are finalised, and enhance stakeholder buy-in and participation to the revision process.
5. Improve and standardise waste data collection, monitoring and reporting (eg, of tonnage and composition of waste to landfill, cleanfill and waste diverted for beneficial re-use) in order to better assess progress against New Zealand Waste Strategy targets. This could be achieved through the development of waste monitoring and reporting guidelines and the introduction of mandatory waste data collection, monitoring and reporting requirements.
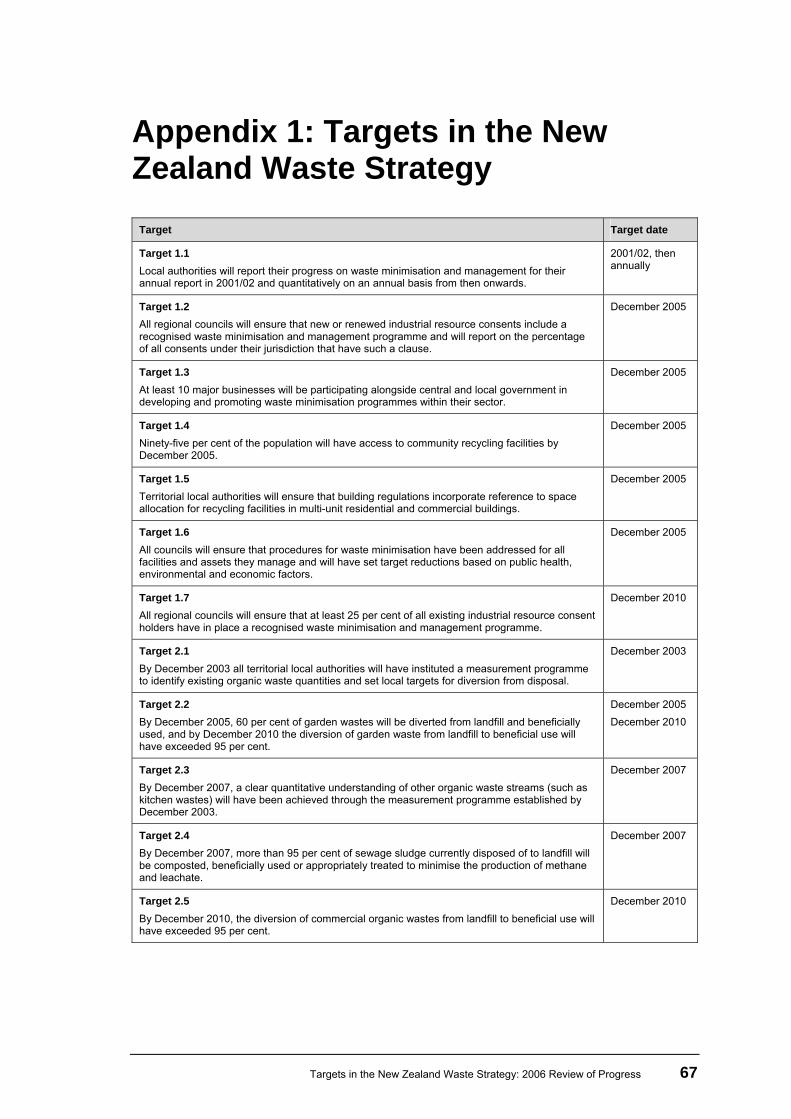
Targets in the New Zealand Waste Strategy: 2006 Review of Progress 67
Appendix 1: Targets in the New Zealand Waste Strategy
Target Target date
Target 1.1 Local authorities will report their progress on waste minimisation and management for their annual report in 2001/02 and quantitatively on an annual basis from then onwards.
2001/02, then annually
Target 1.2 All regional councils will ensure that new or renewed industrial resource consents include a recognised waste minimisation and management programme and will report on the percentage of all consents under their jurisdiction that have such a clause.
December 2005
Target 1.3 At least 10 major businesses will be participating alongside central and local government in developing and promoting waste minimisation programmes within their sector.
December 2005
Target 1.4 Ninety-five per cent of the population will have access to community recycling facilities by December 2005.
December 2005
Target 1.5 Territorial local authorities will ensure that building regulations incorporate reference to space allocation for recycling facilities in multi-unit residential and commercial buildings.
December 2005
Target 1.6 All councils will ensure that procedures for waste minimisation have been addressed for all facilities and assets they manage and will have set target reductions based on public health, environmental and economic factors.
December 2005
Target 1.7 All regional councils will ensure that at least 25 per cent of all existing industrial resource consent holders have in place a recognised waste minimisation and management programme.
December 2010
Target 2.1 By December 2003 all territorial local authorities will have instituted a measurement programme to identify existing organic waste quantities and set local targets for diversion from disposal.
December 2003
Target 2.2 By December 2005, 60 per cent of garden wastes will be diverted from landfill and beneficially used, and by December 2010 the diversion of garden waste from landfill to beneficial use will have exceeded 95 per cent.
December 2005 December 2010
Target 2.3 By December 2007, a clear quantitative understanding of other organic waste streams (such as kitchen wastes) will have been achieved through the measurement programme established by December 2003.
December 2007
Target 2.4 By December 2007, more than 95 per cent of sewage sludge currently disposed of to landfill will be composted, beneficially used or appropriately treated to minimise the production of methane and leachate.
December 2007
Target 2.5 By December 2010, the diversion of commercial organic wastes from landfill to beneficial use will have exceeded 95 per cent.
December 2010
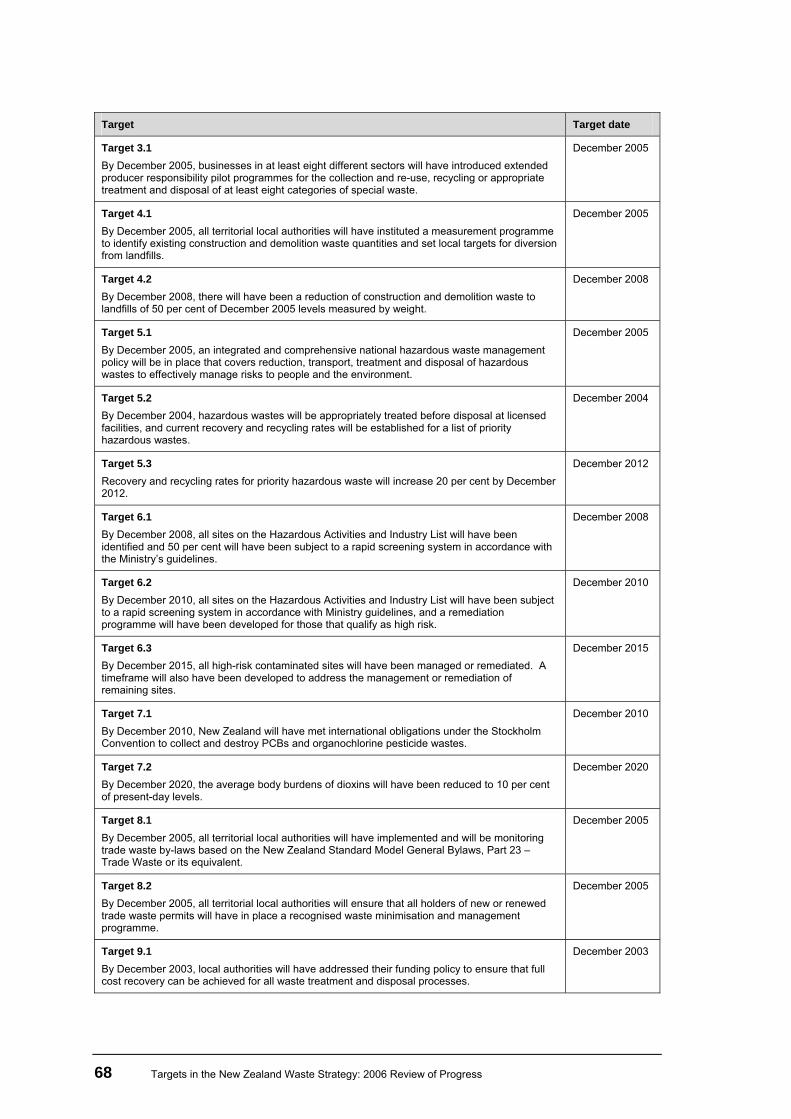
68 Targets in the New Zealand Waste Strategy: 2006 Review of Progress
Target Target date
Target 3.1 By December 2005, businesses in at least eight different sectors will have introduced extended producer responsibility pilot programmes for the collection and re-use, recycling or appropriate treatment and disposal of at least eight categories of special waste.
December 2005
Target 4.1 By December 2005, all territorial local authorities will have instituted a measurement programme to identify existing construction and demolition waste quantities and set local targets for diversion from landfills.
December 2005
Target 4.2 By December 2008, there will have been a reduction of construction and demolition waste to landfills of 50 per cent of December 2005 levels measured by weight.
December 2008
Target 5.1 By December 2005, an integrated and comprehensive national hazardous waste management policy will be in place that covers reduction, transport, treatment and disposal of hazardous wastes to effectively manage risks to people and the environment.
December 2005
Target 5.2 By December 2004, hazardous wastes will be appropriately treated before disposal at licensed facilities, and current recovery and recycling rates will be established for a list of priority hazardous wastes.
December 2004
Target 5.3 Recovery and recycling rates for priority hazardous waste will increase 20 per cent by December 2012.
December 2012
Target 6.1 By December 2008, all sites on the Hazardous Activities and Industry List will have been identified and 50 per cent will have been subject to a rapid screening system in accordance with the Ministry’s guidelines.
December 2008
Target 6.2 By December 2010, all sites on the Hazardous Activities and Industry List will have been subject to a rapid screening system in accordance with Ministry guidelines, and a remediation programme will have been developed for those that qualify as high risk.
December 2010
Target 6.3 By December 2015, all high-risk contaminated sites will have been managed or remediated. A timeframe will also have been developed to address the management or remediation of remaining sites.
December 2015
Target 7.1 By December 2010, New Zealand will have met international obligations under the Stockholm Convention to collect and destroy PCBs and organochlorine pesticide wastes.
December 2010
Target 7.2 By December 2020, the average body burdens of dioxins will have been reduced to 10 per cent of present-day levels.
December 2020
Target 8.1 By December 2005, all territorial local authorities will have implemented and will be monitoring trade waste by-laws based on the New Zealand Standard Model General Bylaws, Part 23 – Trade Waste or its equivalent.
December 2005
Target 8.2 By December 2005, all territorial local authorities will ensure that all holders of new or renewed trade waste permits will have in place a recognised waste minimisation and management programme.
December 2005
Target 9.1 By December 2003, local authorities will have addressed their funding policy to ensure that full cost recovery can be achieved for all waste treatment and disposal processes.
December 2003
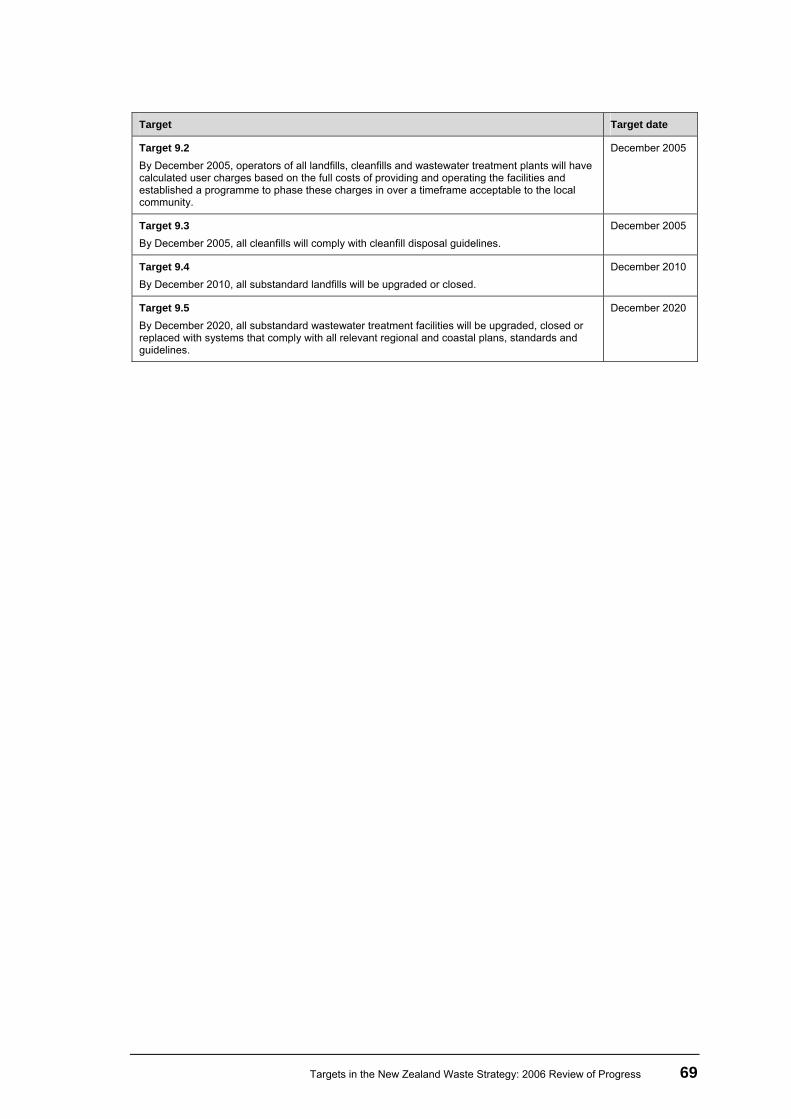
Targets in the New Zealand Waste Strategy: 2006 Review of Progress 69
Target Target date
Target 9.2 By December 2005, operators of all landfills, cleanfills and wastewater treatment plants will have calculated user charges based on the full costs of providing and operating the facilities and established a programme to phase these charges in over a timeframe acceptable to the local community.
December 2005
Target 9.3 By December 2005, all cleanfills will comply with cleanfill disposal guidelines.
December 2005
Target 9.4 By December 2010, all substandard landfills will be upgraded or closed.
December 2010
Target 9.5 By December 2020, all substandard wastewater treatment facilities will be upgraded, closed or replaced with systems that comply with all relevant regional and coastal plans, standards and guidelines.
December 2020
70 Targets in the New Zealand Waste Strategy: 2006 Review of Progress
References Auckland Regional Council. 1995. Auckland Regional Waste Stream Report 1995. ARC Environment Technical Publication No. 72. Auckland: Auckland Regional Council.
Centre for Advanced Engineering. 2000. Landfill Guidelines.
Christchurch City Council. 2005. Toward Zero Waste: Draft Waste Management Plan. http://www.ccc.govt.nz/HaveYourSay/DraftWasteManagementPlan/DraftWasteManagementPlan2005.pdf
Christchurch City Council. 2006. Christchurch Rubbish and Recycling Facts and Stats. http://www.ccc.govt.nz/Waste/Recycling/SolidWasteAndRecyclingStatisticsForChristchurch.pdf
Department of Health. 1982. Refuse Survey and Grading of Landfills.
Environment Bay of Plenty. 2004. Hazardous Waste Survey of the Bay of Plenty and Waikato Regions. Resource Policy Publication 2004/01.
Ministry for the Environment. 1997. National Waste Data Report. Wellington: Ministry for the Environment.
Ministry for the Environment. 2001. Concentrations of Selected Organochlorines in Serum from the Non-Occupationally Exposed New Zealand Population. Wellington: Ministry for the Environment.
Ministry for the Environment. 2002a. A Guide to the Management of Cleanfills. Wellington: Ministry for the Environment.
Ministry for the Environment. 2002b [updated 2004]. Landfill Full Cost Accounting Guide for New Zealand. Wellington: Ministry for the Environment.
Ministry for the Environment. 2002c. Solid Waste Analysis Protocol. Wellington: Ministry for the Environment.
Ministry for the Environment. 2002d. The New Zealand Waste Strategy: Towards Zero Waste and a Sustainable New Zealand. Wellington: Ministry for the Environment.
Ministry for the Environment. 2004a. New Zealand Packaging Accord 2004. Wellington: Ministry for the Environment.
Ministry for the Environment. 2004b. New Zealand Waste Strategy 2002: Reviewing Progress and Moving Forward. Wellington: Ministry for the Environment.
Ministry for the Environment. 2004c [updated 2006]. Policy Framework to Reduce and Safely Manage Hazardous Waste. Wellington: Ministry for the Environment.
Ministry for the Environment. 2004d. Review of Targets in the New Zealand Waste Strategy. Wellington: Ministry for the Environment.
Ministry for the Environment. 2005. Waste Management in New Zealand: A Decade of Progress. Wellington: Ministry for the Environment.
Ministry for the Environment. 2006a. Intractable Agricultural Chemicals in New Zealand.
Ministry for the Environment. 2006b. New Zealand’s National Implementation Plan under the Stockholm Convention on Persistent Organic Pollutants. Wellington: Ministry for the Environment.
Packaging Council of New Zealand. 2005. New Zealand Packaging Accord 2004 Year One Progress Report. Auckland.
Packaging Council of New Zealand. 2006. New Zealand Packaging Accord 2004 Year Two Progress Report. Auckland.
Packaging Industry Advisory Council (PIAC). 1996. A Strategy to Minimise Packaging Waste. Manakau City.
Targets in the New Zealand Waste Strategy: 2006 Review of Progress 71
Royds Garden Ltd. 1991. Waste Management Surveys: A National Compilation of Data. Prepared for the Centre for Advanced Engineering (unpublished).
Street A, Zydenbos S. 2004. Analysis of the Christchurch Mixed Municipal Waste Stream 1 July to 30 June 2004. AgFirst Consultants Report. Christchurch: Christchurch City Council.
Tauranga and Western Bay of Plenty District Councils (in conjunction with Environment BOP). 2001. Waste Management Plan. http://council.tauranga.govt.nz/cm/old/files/WasteManagementPlan.pdf
Waste Not Consulting. 2005. Desktop Survey of Packaging Waste to landfill. Prepared for the Ministry for the Environment (unpublished). Waste Not Consulting. 2006. Waste Composition and Construction Waste Data. Prepared for the Ministry for the Environment (unpublished).
Further information
• Recycling recovery rates published through voluntary product stewardship schemes such as the New Zealand Packaging Accord and the used oil recovery scheme.
• A survey conducted by the Ministry for the Environment on behalf of the New Zealand Packaging Accord of council recycling services and waste management plans.
• A survey conducted by the Ministry for the Environment of council trade waste by-laws.
• Published and unpublished waste data from various territorial and regional councils.
72 Targets in the New Zealand Waste Strategy: 2006 Review of Progress
Glossary Beneficial re-use The re-use of a reprocessed material or substance which would otherwise be
disposed of to landfill or cleanfill.
Biosolids Biosolids are a by-product of sewage collection and treatment processes. They have been treated and/or stabilised to the extent that it is possible to beneficially re-use them. Also known as sewage sludge.
Cleanfills Cleanfills are waste disposal sites that accept only inert wastes that, when buried, will have no adverse effect on people or the environment. These include materials such as clay, soil, rock, concrete and bricks.
Community recycling facilities
Recycling services which are provided to the local community. These include kerbside and drop-off facilities provided by local authorities.
Commercial waste Waste generated from a commercial business or industry.
Construction and demolition waste
Waste generated from the construction or demolition of a building including the preparation and/or clearance of the property or site. This excludes materials such as clay, soil and rock when those materials are associated with infrastructure such as road construction and maintenance, but includes building-related infrastructure.
Contaminated sites Contaminated sites or contaminated land is described as land that has hazardous substances in or on it and is more contaminated than an applicable NES, or has, or is reasonably likely to have, significant adverse effects on the environment.
Domestic recycling Materials recycled by the householder via kerbside collection or drop-off facilities.
Design for the environment
Design for the Environment refers to products that are designed and managed so that minimum environmental impact is caused by their generation, use, recovery and disposal.
Drop-off facilities Recycling services provided to the local community through a specific site or sites where recycled materials can be dropped off.
Farm plastics Chemical containers and silage wrap used on farms which are dangerous to burn or bury on the farm, and can be hazardous to dispose of to landfill, if not properly managed.
Green waste Also known as garden waste, this includes waste produced through gardening both commercial and domestic.
Hazardous substances Hazardous substances include, but are not limited to, any substance defined in section 2 of the Hazardous Substances and New Organisms Act 1996 as a hazardous substance.
Hazardous waste Hazardous waste refers to materials that are flammable, explosive, oxidising, corrosive, toxic, ecotoxic, radioactive or infectious. Examples include solvents and cleaning fluids, medical waste, unused agricultural chemicals and many industrial wastes.
Kerbside facilities Recycling services provided to the local community through the collection of recycled materials directly from households.
Landfill A landfill is an area used for the controlled disposal of solid waste.
Liquid waste Liquid waste is waste generated in, or converted to, a liquid form for disposal. It includes point and non-point source discharges, stormwater and wastewater.
Targets in the New Zealand Waste Strategy: 2006 Review of Progress 73
Organic waste Organic waste includes garden waste (more commonly known as ‘green waste’), food scraps, biosolids and commercial organic wastes such as paunch grass and food-processing waste. It can sometimes include other wastes that may biodegrade in landfill such as paper, cardboard and untreated wood.
Organochlorines Organochlorines are chemicals that contain carbon and chlorine atoms joined together. Some organochlorines are persistent and present a risk to the environment and human health. Examples include dioxin and polychlorinated biphenyls (PCBs).
Product stewardship Product stewardship is a ‘cradle to grave’ tool that helps reduce the environmental impact of manufactured products. Under product stewardship schemes, producers, brand owners, importers, retailers, consumers and other parties accept responsibility for the environmental effects of their products – from the time they are produced until they are finally disposed of.
Recovered materials Materials which have been collected for recycling and reprocessed to create a new material.
Recycled The process of reprocessing a waste material into a new material.
Recycling Recycling describes the action of the consumer when collecting and depositing materials which can be recycled (eg, glass, plastic containers and bottles, aluminium and steel cans, paper and card) and the action of industry when reprocess recycled materials.
Residual waste Remaining waste material once activities to reduce, re-use, recycle, recover and treat have been undertaken.
Resource Management Act
Resource Management Act 1991 is New Zealand’s main piece of environmental legislation and provides a framework for managing the effects of activities on the environment.
Sewage sludge Sewage sludge is a by-product of sewage collection and treatment processes. Also known as biosolids.
Solid waste Solid waste is all waste generated as a solid or converted to a solid for disposal. It includes wastes like paper, plastic, glass, metal, electronic goods, furnishings and organic wastes.
Solid Waste Analysis Protocol
Solid Waste Analysis Protocol is a baseline measurement programme to provide generic solid waste composition data for New Zealand.
Special waste Special wastes are wastes that cause particular management and/or disposal problems and need special care. Examples include used oil, tyres, end-of-life vehicles, batteries and electronic goods.
Stewardship Stewardship, or kaitiakitanga, puts a duty of care on everyone – government, business and the community – for waste prevention and resource recovery.
Storm water Storm water results from rainwater runoff that is channelled through drains from roads and urban properties into waterways and the sea.
Trade waste Trade waste refers to liquid wastes generated by business and disposed of through the sewerage system. Trade waste includes a range of hazardous materials resulting from industrial and manufacturing processes.
Treated timber Treated timber is wood which contains chemicals (eg, copper, chrome, arsenic) which require careful disposal as it can be harmful to the environment.
Used oil Oil contaminated through use with substances that can be hazardous to human health and the environment.
Waste The New Zealand Waste Strategy defines waste as any material, solid, liquid or gas that is unwanted and/or unvalued and discarded or discharged.
74 Targets in the New Zealand Waste Strategy: 2006 Review of Progress
Waste disposal The final placement of material (solid, liquid or gas) which is unwanted and/or unvalued and discarded or discharged.
Waste electronic and electrical equipment
Waste electrical and electronic equipment is electrical and electronic equipment (those products that are dependent on electric currents or electromagnetic fields to work) which are no longer required and are due for waste disposal. Examples include fridges, fluorescent lamps and toasters computers and mobile phones.
Waste hierarchy The waste hierarchy orders preferred waste management options. The most preferred option is reduce, followed by re-use, recycling, recovery, treatment and, lastly, disposal.
Waste management plans
Waste management plans which are produced by territorial authorities outlining what their waste management and minimisation activities are in their area.
Waste minimisation Waste minimisation refers inclusively to all activities aimed at preventing, reducing, re-using or recycling waste.
Waste prevention Waste prevention refers to practices that avoid and reduce the generation of waste.
Waste sector The waste sector is the collective term for industries and businesses specifically involved in the collection, disposal and/or reprocessing waste and recycled materials.
Wastewater Wastewater is a by-product of sewage, liquid trade waste collection and treatment processes.