Embed Size (px)
Citation preview
Therapeutics, Targets, and Chemical Biology
Targeting the MDM2/MDM4 Interaction Interfaceas a Promising Approach for p53 ReactivationTherapyMarsha Pellegrino1, Francesca Mancini1,2, Rossella Luc�a1, Alice Coletti3,Nicola Giacch�e3, Isabella Manni4, Ivan Arisi5, Fulvio Florenzano5, Emanuela Teveroni1,2,Marianna Buttarelli1, Laura Fici1, Rossella Brandi5, Tiziana Bruno4, Maurizio Fanciulli4,Mara D'Onofrio5, Giulia Piaggio4, Roberto Pellicciari3, Alfredo Pontecorvi2,Jean Christophe Marine6,7, Antonio Macchiarulo3, and Fabiola Moretti1
Abstract
Restoration of wild-type p53 tumor suppressor function hasemerged as an attractive anticancer strategy. Therapeutics target-ing the two p53-negative regulators, MDM2 and MDM4, havebeen developed, but most agents selectively target the ability ofonly one of these molecules to interact with p53, leaving theother free to operate. Therefore, we developed a method thattargets the activity of MDM2 and MDM4 simultaneously basedon recent studies indicating that formation of MDM2/MDM4heterodimer complexes are required for efficient inactivation ofp53 function. Using computational and mutagenesis analysesof the heterodimer binding interface, we identified a peptidethat mimics the MDM4 C-terminus, competes with endogenous
MDM4 for MDM2 binding, and activates p53 function. Thispeptide induces p53-dependent apoptosis in vitro and reducestumor growth in vivo. Interestingly, interfering with the MDM2/MDM4 heterodimer specifically activates a p53-dependentoxidative stress response. Consistently, distinct subcellularpools of MDM2/MDM4 complexes were differentially sensitiveto the peptide; nuclear MDM2/MDM4 complexes were partic-ularly highly susceptible to the peptide-displacement activity.Taken together, these data identify the MDM2/MDM4 inter-action interface as a valuable molecular target for therapeuticreactivation of p53 oncosuppressive function. Cancer Res; 75(21);4560–72. �2015 AACR.
IntroductionDiscovery of new molecular targets for cancer therapy is a field
in which considerable efforts are being employed, to develop newand safe therapeutic agents. The p53pathway is an attractive targetbecause of its well-documented oncosuppressive function (1, 2).Since the discovery of MDM2 as crucial p53 inhibitor (3, 4), therehave been numerous attempts to pharmacologically disrupt theinteractionbetween these twoproteins to reactivate p53 inhumanwild-type TP53 tumors (2). This has led to the development ofdifferent classes of molecules that efficiently and specifically
interfere with the formation of the MDM2/p53 complexes (i.e.,Nutlin; refs. 5–7). Although p53 reactivation is observed inmanywild-type TP53 cancer cells exposed to these molecules, only fewof them die by apoptosis (7, 8).
The presence of MDM4 (or MDMX; ref. 9), the MDM2 homo-log, has provided a rational explanation for the relatively modestp53-dependent apoptotic response observed in these cells (10–12). Indeed, computational and molecular studies providedevidence that the p53 binding domain of MDM2 and MDM4are sufficiently dissimilar to explain the lack of activity of theMDM2 inhibitors towards MDM4 (13–15).
Importantly, these data confirmed previous genetic evidencethat optimal p53 reactivation can only be achieved by targetingbothMDMproteins simultaneously (16) and therefore highlight-ed the need of identifying molecules that target both thep53–MDM2 and p53–MDM4 interactions. Therefore, new effortshave been developed to find out newmolecules able to dissociateMDM2 and MDM4 from p53 (2, 17).
Recent genetic evidence indicates that efficient inhibition ofp53 requires the formation of MDM2/MDM4 heterodimers. Theheterodimers are more efficient than the MDM2 homodimers inpromoting ubiquitination and degradation of p53 (18, 19).Heterodimers also efficiently control basal p53 transcriptionalactivity in vivo, and thus even in the absence of MDM2 E3-ubiquitin ligase activity (20). In line with these data, MDM2 andMDM4 have been found together with p53 at the promoter ofsome p53 target genes to inhibit its transactivation activity (21).To further support this model, mice that express MDM4 mutants
1InstituteofCell BiologyandNeurobiology,CNR,Roma, Italy. 2Instituteof Medical Pathology, Catholic University of Roma, Roma, Italy.3Department of Pharmaceutical Sciences, University of Perugia,Perugia, Italy. 4Regina Elena Cancer Institute, Roma, Italy. 5EuropeanBrain Research Institute (EBRI) Rita Levi-Montalcini, Roma, Italy.6Center for Human Genetics, KU-Leuven, Leuven, Belgium. 7Centerfor the Biology of Disease, VIB, Leuven, Belgium.
Note: Supplementary data for this article are available at Cancer ResearchOnline (http://cancerres.aacrjournals.org/).
Accession Codes: Series record GSE62855.
Corresponding Author: Fabiola Moretti, Institute of Cell Biology and Neurobi-ology, National Research Council of Italy (CNR), Via del Fosso di Fiorano, 64,Roma 00143, Italy. Phone: 3906-50170-3242; Fax: 3906-50170-3304; E-mail:[email protected]
doi: 10.1158/0008-5472.CAN-15-0439
�2015 American Association for Cancer Research.
CancerResearch
Cancer Res; 75(21) November 1, 20154560
on February 2, 2018. © 2015 American Association for Cancer Research. cancerres.aacrjournals.org Downloaded from
Published OnlineFirst September 10, 2015; DOI: 10.1158/0008-5472.CAN-15-0439
defective in MDM2 binding die during embryonic development(22, 23). These genetic experiments support the view that theheterodimer is required for proper control of p53 activity.
These data have raised the hypothesis that an alternativetherapeutic approach for p53 reactivation in tumors is to targetthe interaction between MDM2 and MDM4 (18, 20). As theubiquitin ligase activity of the heterodimers depends on the C-terminal RING finger domain of MDM2, and as MDM2 homo-dimers are still able to function as an E3 ligase (24, 25), wesearched formolecules that bindMDM2by simulating theMDM2interaction interface of MDM4.
Materials and MethodsPeptides
Lyophilized Peptide3 (KEIQLVIKVFIA), Peptide3M (KEIQL-VIKVAEA), Peptide SC3A (VQEAFKLIKIVI), andSC3B (AIKIFVKV-LEIQ) (synthesized from Biosynthesis) were dissolved in 100%DMSO at a concentration of 10mmol/L. Peptides purity level was� 96%. Peptides' solutionwas freshly prepared at a concentrationof 0.5 mmol/L in sterile distilled deionized H2O. Peptides werepremixed with growth media at 37�C for 15 minutes beforeaddition to the cells. All peptides were used at 10 mmol/L con-centration unless differently specified. All peptides were chemi-cally modified by a capping acetyl group at the NH2- and anamide group at the C-terminus.
Computational methodsStarting from the crystal structure of the heterodimer complex
(pdb code: 2VJF; ref. 19), one complex of Pep3 with MDM2 wasgenerated shortening the RING domain of MDM4 (chain B) fromresidue E428 to K478, while keeping the RING domain ofMDM2(chain A). Pep3M was obtained editing the structure of Pep3 bymutating residues F488 and I489 into alanine and glutamate,respectively. The geometry of the resulting two complexes wasoptimized using the Protein Preparation Wizard tool as imple-mented in Maestro v.9.7. (Schr€odinger, LLC). Two molecularsystems were then prepared inserting Pep3/MDM2 and Pep3M/MDM2 complexes into a cubic box containing TIP3P watermolecules for protein solvation, and extended 10 Å away fromany protein atom. Each of the systems was neutralized by addingsodium and chlorine ions at a concentration of 0.15 mol/L.Periodic boundary conditions were applied to avoid finite-sizeeffects. Molecular dynamics (MD) simulations were performedusing Desmond v.3.0 and the OPLS-2005 force field. The simu-lation protocol included an initial energy minimization overa maximum of 2,000 steps, with a convergence criterion of50 kcal/mol/Å, and the presence of harmonic restraints on thesolute atoms (force constant ¼ 50.0 kcal/mol/Å2); a secondenergy minimization without restraints; a third stage of 12 pico-seconds (ps) at 10 K with harmonic restraints on the solute heavyatoms (force constant ¼ 50.0 kcal/mol/Å2), using the NVTensemble and Berendsen thermostat; a fourth 12 ps at 10 K,retaining the harmonic restraints, and using the NPT ensembleandBerendsen thermostat andbarostat; afifthheating phase of 24ps at 300 K, retaining the harmonic restraints, and using the NPTensemble and Berendsen thermostat and barostat; a final 24 ps at300 K without harmonic restraints, using the NPT Berendsenthermostat and barostat. The final production phase of 30 nano-seconds (ns) was run using the canonical NPT Berendsen ensem-ble at temperature 300 K. During MD simulations, a time step of
2 femtoseconds (fs) was used inserting constrains on the bondlengths of hydrogen atoms with the M-SHAKE algorithm (26). Atotal of 6252 frames of atomic coordinates were saved along theMD trajectories. The occupancy of intermolecular hydrogenbonds between Pep3, Pep3M, and MDM2 was calculated usinga cut-off value of 10%.
Cell cultures and treatmentsHumanprimaryfibroblasts,MCF7,p53þ/þ andp53�/�HCT116,
HepG2, and H1299 cells were maintained in DMEM, GTL-16 inRPMI supplemented with 10% FBS (Gibco). MCF7, HCT116, andGTL-16 cell identity has been confirmed by PowerPlex 18D System(Promega) by BMR Genomics service (last analysis December2013). Mycoplasma-free conditions have been routinely tested byMycoAlert kit (Lonza). MCF10A cells were maintained in MEBMsupplemented with specific condiments according to the manu-facturer's instructions (Lonza). p53�/�Mdm2�/�Mdm4�/�MEFs(TKO-MEF) were maintained in DMEM high glucose supple-mentedwith10%FBS (FBS-Cambrex). Transient transfectionswereperformed by Lipofectamine Plus reagent (Life Sciences) accordingto the manufacturer's instructions. All stealth siRNAs are fromLife Technologies. MDM2 and MDM4 mutants were generated byQuikChange XL Site-Directed Mutagenesis Kit according to themanufacturer's instructions (Stratagene).
ImagingImaging was performed through a confocal laser scanning
microscope (Leica SP5, Leica Microsystems) equipped with fourlaser lines and a transmitted light detector for differential inter-ference contrast (Nomarski) imaging. The following acquisitionsettings were used: objective 63� oil immersion NA 1.4; zoomfactor 2; image format 1024�1024; sampled image area was x:122 mm, y: 122 mm; pinhole 1 producing an optical sectionthickness of 0.8 mm; speed acquisition 10 Hz. A random set ofsingle plane images of both fluorescence and bright field channelswas taken to analyze the peptide cellular distribution throughoutthe coverslip. The confocal image acquisitions were performed sothat all samples were imaged using the same settings for laserpower and detector gain. Brightness and contrast of images wereglobally enhanced by using linear histogram correction andslightly oversaturated to allow a better qualitative visual evalua-tion of the morphologic features.
Viability and apoptosis analysesFor the Annexin V–propidium iodide staining, cells were col-
lected, washed with PBS, and stained by Annexin V–FITC andpropidium iodide according to the manufacturer's protocol(Clontech). Cells were analyzed by FACScan flow cytometer anddata analyzed by CellQuest Software (Becton Dickinson). Cell-cycle profiles were evaluated by FACS analyses of 70% ethanol-fixed cells stained with 0.1 mg/mL propidium iodide/PBS and 2mg/mL RNaseA solution. Apoptotic DNA fragmentation analysiswas carried out by terminal deoxynucleotidyltransferase–medi-ated dUTP nick end labeling (TUNEL) assays with fluorescent InSitu Cell Death Detection Kit (Roche) following the manufac-turer's instructions.
Immunoprecipitation and Western blot analysisFor immunoprecipitation cells were lysed in Saito modified
buffer (50 mmol/L Tris–HCl, pH 7.4, 0.15 mol/L NaCl, 0.5%
Targeting MDM2/MDM4 Interaction for p53 Reactivation
www.aacrjournals.org Cancer Res; 75(21) November 1, 2015 4561
on February 2, 2018. © 2015 American Association for Cancer Research. cancerres.aacrjournals.org Downloaded from
Published OnlineFirst September 10, 2015; DOI: 10.1158/0008-5472.CAN-15-0439
Triton-X100, 5mmol/L EDTA) containing protease inhibitorsmix(Roche). Immunoprecipitations were performed by preclearinglysateswithproteinG-sepharose (Pierce) and then incubatedwiththe indicated antibody, under gentle rocking at 4�Covernight. ForWestern blot analysis, cells were lysed in RIPA buffer. SDS-PAGEswere transferred onto PVDFmembranes (Millipore). Membraneswere developed using the enhanced chemiluminescence (ECLAmersham) by chemiluminescence imaging system, Alliance2.7 (UVITEC Cambridge) and quantified by the software AllianceV_1607. Primary antibodies: anti-MDM4 BL1258 (Bethyl Labo-ratory), anti-p53 FL393 (Santa Cruz Biotechnology) and PAb421(Calbiochem), anti-MDM2 2A10 (kindly provided byM.E. Perry)and Ab1 (Calbiochem), anti-GFP (Roche), anti-FITC (Abcam),anti-BIK/NBK (FL-160; Santa Cruz Biotechnology), anti-phos-pho-histone H2A.X, anti-PARP-1 (Cell Signaling Technology),anti-a-tubulin DM1A (Sigma), anti-actin C-40 (Sigma).
Isolation of nuclear/cytoplasmic fractionsNuclear and cytoplasmic fractions were prepared as follows:
cells scraped with PBS were resuspended in hypotonic lysis buffer(10 mmol/L HEPES pH 7.9, 10 mmol/L KCl, 0.1 mmol/L EDTA,0.1 mmol/L EGTA) added with protease inhibitors (Roche). Afterresuspension, NP-40 was added to a final concentration of 0.6%and the nuclei were pelleted by centrifugation at 10,000 rpm for30 seconds at 4�C. Supernatant was collected as cytoplasmicfraction. Nuclei pellet was resuspended in nuclear extract buffer(20 mmol/L HEPES pH 7.9, 25% glycerol, 0.4 mol/L NaCl, 0.1mmol/L EDTA, 0.1 mmol/L EGTA), rocked for 15 minutes at 4�Cand then recovered by centrifugation at 14,000 rpm for 5minutesat 4�C. The pellet containing the chromatin enriched fraction wasresuspended in nuclear extract buffer and sonicated by HeatSystems UltraSonics Inc Sonicator W-375 Cell Disruptor at20% of maximum output power for 30 seconds.
Clonogenicity assayMCF7 (250 and 500 cells), and MCF10A (5,000 and 10,000
cells) were plated in complete medium in triplicate in 6, 0, and35 mm dishes, respectively. Treatments (DMSO 0.1%, Pep310 mmol/L, Pep3M 10 mmol/L) were administered every 2 days.Dishes were stained by crystal violet.
Nude mice studyCD1-Foxn1nu 6-week-old male mice were injected subcutane-
ously with luciferase engineered HCT116 (5 � 106/tumor), orGTL-16 (2� 106/tumor) in Matrigel 10 mg/mL (dilution 1:1; BDBiosciences) to induce tumor formation. After detection of pal-pable tumor (tumor volume � 70 mm3), mice were treated witheither Pep3 or control Pep3M injected intratumorally at a dose of10 mg/kg and tumor growth was followed and analyzed byluciferase activity during time. Light emission was detected usingthe IVIS Lumina II CCD camera system, and the bioluminescentsignal was analyzed with the Living Image 2.20 software package(Caliper Life Sciences). All animal experiments were conducted inaccordancewith institutional guidelines, in the full observation ofthe Directive 2010/63/UE. GTL-16 cells were infected with lenti-viral vector pMA3160 (Addgene) to generate luciferase-expressingcells. HCT116 were transfected with pcDNA-Luc and pBABE Puroand selected using 1 mg/mL puromycin.
RNA extraction and analysisTotal RNA fromHCT116 cells untreated or treatedwithDMSO,
Pep3M, or Pep3 was isolated using RNA Purification columns(Norgen, Purification Plus kit) following the manufacturer'sinstruction. Biologic triplicates were performed. RNA quality wasassessed by Bioanalyser (RIN � 9.6). After in vitro retrotranscrip-tion (Applied Biosystem), real-time PCRwas performedusing ABI7900 (Applied Biosystem) and SYBR Green Master Mix (Bioline)using the following primers:(i) BIK (human, BIK, PCR product ¼ 70 bp)fw: 50-GAATGCATG-GAGGGCAGTGAC-30; rev: 50-GGCTCACGTCCATCTCGTC-30
(ii) PIG3 (human, TP53I3, PCR product ¼ 71 bp)fw: 50-AATG-CAGAGACAAGGCCAGT-30; rev: 50-GTCCAGATGCCTCAAGTC-CC-30
(iii) GAPDH (human, GAPDH, PCR product ¼ 184 bp)fw: 50-GAGTCAACGGATTTGGTCGT-30; rev: 50-GACAAGCTTCCCGTT-CTCAG-30
(iv) p21 (human, p21, PCR product ¼ 65 bp)fw: 50-CTGGA-GACTCTCAGGGTCGAAA-30; rev: 50-GGCGTTTGGAGTGGTA-GAAATC-30
(v) MDM2 (human, MDM2, PCR product ¼ 88 bp)fw: 50-ATA-TACCATGATCTACAGGAACTTGGTAGT-30;rev:50-GGTGACACC-TGTTCTCACTCACA-30
(vi) TBP (human, TBP, PCR product ¼ 169 bp)fw: 50-GCACAG-GAGCCAAGAG -30; rev: 50-GTGGGTGAGCACAAGG-30. RelativemRNA levels, normalized to TBP, were calculated as follows:2�[DCt(Pep3 or Pep3M)�DCt(DMSO)] ¼ 2�DDCt, where DCt equals Ct
(BIK, PIG3, GAPDH, p21, or MDM2) � Ct (TBP).
Whole genome expression profilingThe gene expression profiling was performed according to
the standard Agilent one-color microarray protocol (AgilentTechnologies). The cy3-labeled cRNA was hybridized to Agilent8 � 60K whole human genome chip. Images were acquiredby Agilent Scanner; expression data were extracted by FeatureExtraction. Data quality filtering and analysis was performedby GeneSpring GX and Microsoft Excel. Microarray functionaldata analysis was generated through the IPA webtool (27).Clustering analysis was done using MultiExperiment Viewer.Genes associated to specific cancer features were selected on thebasis of the annotations in the Cancer Gene Index of the NCI.
Chromatin immunoprecipitationHCT116 were untreated or treated with 10 mmol/L Pep3 or
Pep3M for 24 hours and then incubated in culturemedia contain-ing 1% formaldehyde for 10 minutes at room temperature. Afterformaldehyde neutralization, cells were washed and harvested byice-cold PBS. Cell lysis was performed in lysis buffer (5 mmol/LPIPES pH 8.0, 85 mmol/L KCl, 0.5% NP-40, protease inhibitors)and nuclei were collected and suspended in nuclei lysis buffer(50mmol/L Tris-HCl pH8.0, 10mmol/L EDTA, 1%SDS, proteaseinhibitors). Nuclei were sonicated by using a Bioruptor sonicator.Extracts were precleared with protein G (Invitrogen), and 50 mgof DNA were used for immunoprecipitation. An aliquot of pre-cleared lysate was taken as input control. Immunoprecipitationwas carried out with anti-p53 sheep polyclonal antibody (Ab-7Calbiochem), conjugated to paramagnetic protein G beads (Invi-trogen). Immune complexes were eluted in elution buffer(50 mmol/L NaHCO3 and 1% SDS) by heating to 65�C for15 minutes. DNA was purified by using QIAquick PCR
Pellegrino et al.
Cancer Res; 75(21) November 1, 2015 Cancer Research4562
on February 2, 2018. © 2015 American Association for Cancer Research. cancerres.aacrjournals.org Downloaded from
Published OnlineFirst September 10, 2015; DOI: 10.1158/0008-5472.CAN-15-0439
Purification Kit (Qiagen). Purified DNA was analyzed by quan-titative real-time PCR using SYBR Green ABI7900. The promoter-specific primer sequences used were as follows: PIG3 50-GATCC-CAGGACTGCGTTTTGCC-30; 50-GGGAACGAGACCCAACCTCT-TG-30; MDM2 50-GCAGGTTGACTCAGCTTTTCCTCT-30; 50-GTG-GTTACAGCCCCATCAGTAGGTA-30.
Reactive oxygen species analysisHCT116 and MCF7 cells were plated in 96-well plates and
treated with Pep3, Pep3M, or DMSO. After 48 or 72 hours, cellswere washed with PBS and incubated with 25 mmol/L 20,-70-dichlorodihydrofluorescein diacetate (H2DCFDA, Sigma) inserum-free media at 37�C for 30minutes. Cells were then washedonce in PBS and incubated for 3 hours in complete mediasupplementedwith orwithout 100 mmol/LH2O2. The fluorescentsignal from fluorescent 20-70-dichlorodihydrofluorescein (DCF)was monitored by multimode plate reader Enspire (PerkinElmer). The obtained results were normalized for the number ofcells/well by Cell Titer viability assay (Promega).
ResultsCharacterization of the MDM2–MDM4 interaction interface
MDM2 and MDM4 form heterodimers via association of theirC-terminal RING finger domains (28) and the last residues of
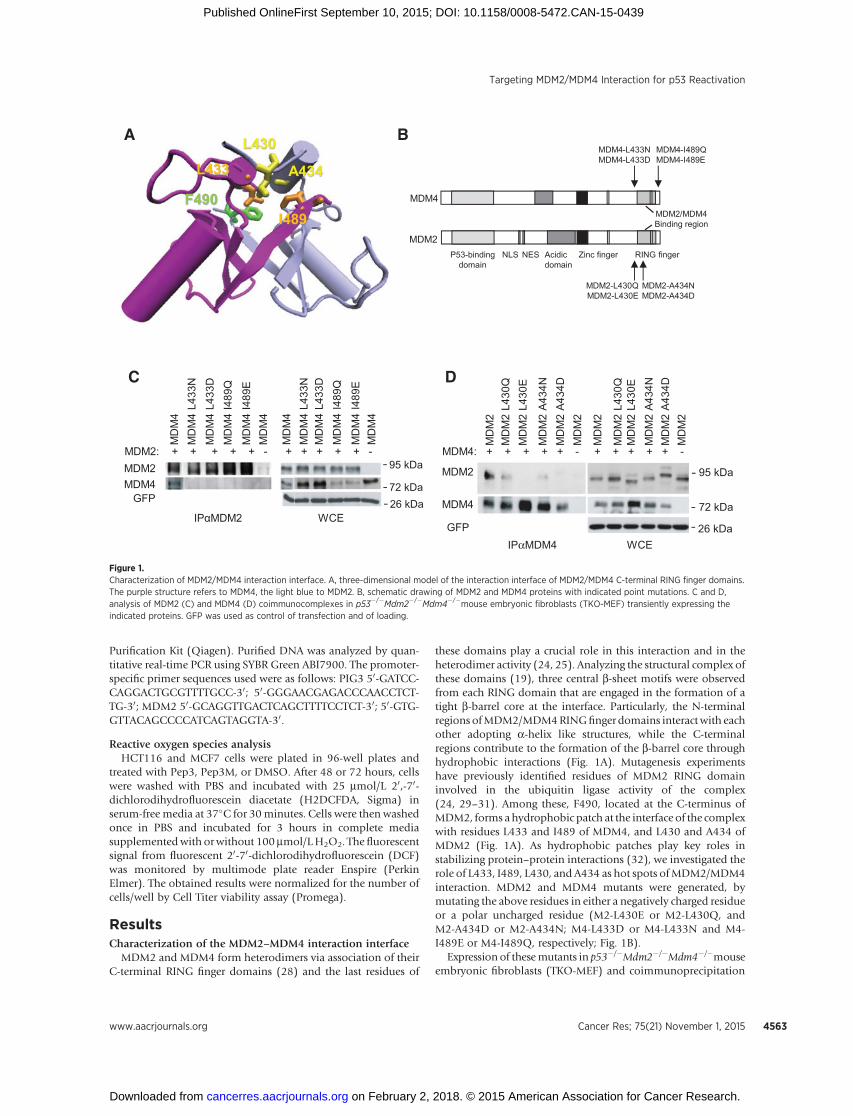
these domains play a crucial role in this interaction and in theheterodimer activity (24, 25). Analyzing the structural complex ofthese domains (19), three central b-sheet motifs were observedfrom each RING domain that are engaged in the formation of atight b-barrel core at the interface. Particularly, the N-terminalregions ofMDM2/MDM4RINGfinger domains interactwith eachother adopting a-helix like structures, while the C-terminalregions contribute to the formation of the b-barrel core throughhydrophobic interactions (Fig. 1A). Mutagenesis experimentshave previously identified residues of MDM2 RING domaininvolved in the ubiquitin ligase activity of the complex(24, 29–31). Among these, F490, located at the C-terminus ofMDM2, forms ahydrophobic patch at the interface of the complexwith residues L433 and I489 of MDM4, and L430 and A434 ofMDM2 (Fig. 1A). As hydrophobic patches play key roles instabilizing protein–protein interactions (32), we investigated therole of L433, I489, L430, and A434 as hot spots ofMDM2/MDM4interaction. MDM2 and MDM4 mutants were generated, bymutating the above residues in either a negatively charged residueor a polar uncharged residue (M2-L430E or M2-L430Q, andM2-A434D or M2-A434N; M4-L433D or M4-L433N and M4-I489E or M4-I489Q, respectively; Fig. 1B).
Expression of thesemutants in p53�/�Mdm2�/�Mdm4�/�mouseembryonic fibroblasts (TKO-MEF) and coimmunoprecipitation
MDM4
MDM2RING fingerZinc fingerP53-binding
domainAcidic domain
NLS NES
MDM2/MDM4Binding region
MDM4-L433N MDM4-L433D
MDM4-I489Q MDM4-I489E
MDM2-L430QMDM2-L430E
MDM2-A434N MDM2-A434D
B
F490
A434
L430
L433
I489
C
IPαMDM2
MDM2
GFP
WCE
72 kDa26 kDa
MDM4
MD
M4
MD
M4
L433
N
MD
M4
L433
DM
DM
4 I4
89Q
MD
M4
I489
EM
DM
4
95 kDaMDM2: + + + + + - + + + + + -
MD
M4
MD
M4
L433
NM
DM
4 L4
33D
MD
M4
I489
Q
MD
M4
I489
EM
DM
4 D
MDM2
MDM4
GFPIPαMDM4
MD
M2
MD
M2
L430
QM
DM
2 L4
30E
MD
M2
A43
4DM
DM
2
MD
M2
A43
4NWCE
MD
M2
MD
M2
L430
QM
DM
2 L4
30E
MD
M2
A43
4DM
DM
2
MD
M2
A43
4N
72 kDa
26 kDa
95 kDa
MDM4: + + + + + - + + + + + -
A
Figure 1.Characterization of MDM2/MDM4 interaction interface. A, three-dimensional model of the interaction interface of MDM2/MDM4 C-terminal RING finger domains.The purple structure refers to MDM4, the light blue to MDM2. B, schematic drawing of MDM2 and MDM4 proteins with indicated point mutations. C and D,analysis of MDM2 (C) and MDM4 (D) coimmunocomplexes in p53�/�Mdm2�/�Mdm4�/�mouse embryonic fibroblasts (TKO-MEF) transiently expressing theindicated proteins. GFP was used as control of transfection and of loading.
Targeting MDM2/MDM4 Interaction for p53 Reactivation
www.aacrjournals.org Cancer Res; 75(21) November 1, 2015 4563
on February 2, 2018. © 2015 American Association for Cancer Research. cancerres.aacrjournals.org Downloaded from
Published OnlineFirst September 10, 2015; DOI: 10.1158/0008-5472.CAN-15-0439
of MDM2/MDM4 complex revealed that mutation of bothMDM4 residues abolishes its binding to MDM2 confirming thatthey are essential for the binding of the two proteins (Fig. 1C).Conversely, the association of MDM2 mutants to MDM4 wasdependent on the replaced residue, with charged residues (L430Eand A434D) and polar uncharged residues (L430Q and A434N)abolishing and reducing the binding to MDM4, respectively (Fig.1D). Collectively, these observations suggest that the hydropho-bic interactions promoted by the side chains of L433 and I489from MDM4 are important for the stabilization of the RINGdomain complex. Conversely, MDM2/MDM4 complexes toleratethe replacement of L430 and A434 from MDM2 with polaruncharged residues to some extent, though not standing the
presence of charged residues. Noteworthy, the ubiquitinatingactivity of all mutants but MDM2L430Q, is abolished (Supple-mentary Fig. S1A), indicating that these residues are important forMDM2/MDM4 heterodimer formation as well as for MDM2activity. In fact, all these mutants still bind p53, indicating thatloss of p53 ubiquitination is due to impairment ofMDM2activityand that the folding of the MDM2 and MDM4 proteins is notaffected by the pointmutations introduced, at least at the levels ofthe p53-binding domain (Supplementary Fig. S1B and S1C).
Identification of a peptide that inhibits p53 ubiquitinationFrom previous data, different peptides that mimic the MDM2
interaction interface of MDM4 were designed. Peptide-3
Pocket 2
Pocket 1L458
V477
F488
I489
Pocket 2
Pocket 1
L458
V477
E489
A488
B
C
A
Actin
MDM2
MDM4
p53
Pep
3M
Pep
3
NT
DM
SO D
55 kDa
95 kDa
72 kDa
42 kDa
Pep3
Pep3
M
Pep3
M
Anti-FITC IP
FITC
MDM2
InputPe
p3
Pep3
M
Pep3
M
95 kDa
10 kDaMDM2: + + + + + + + +
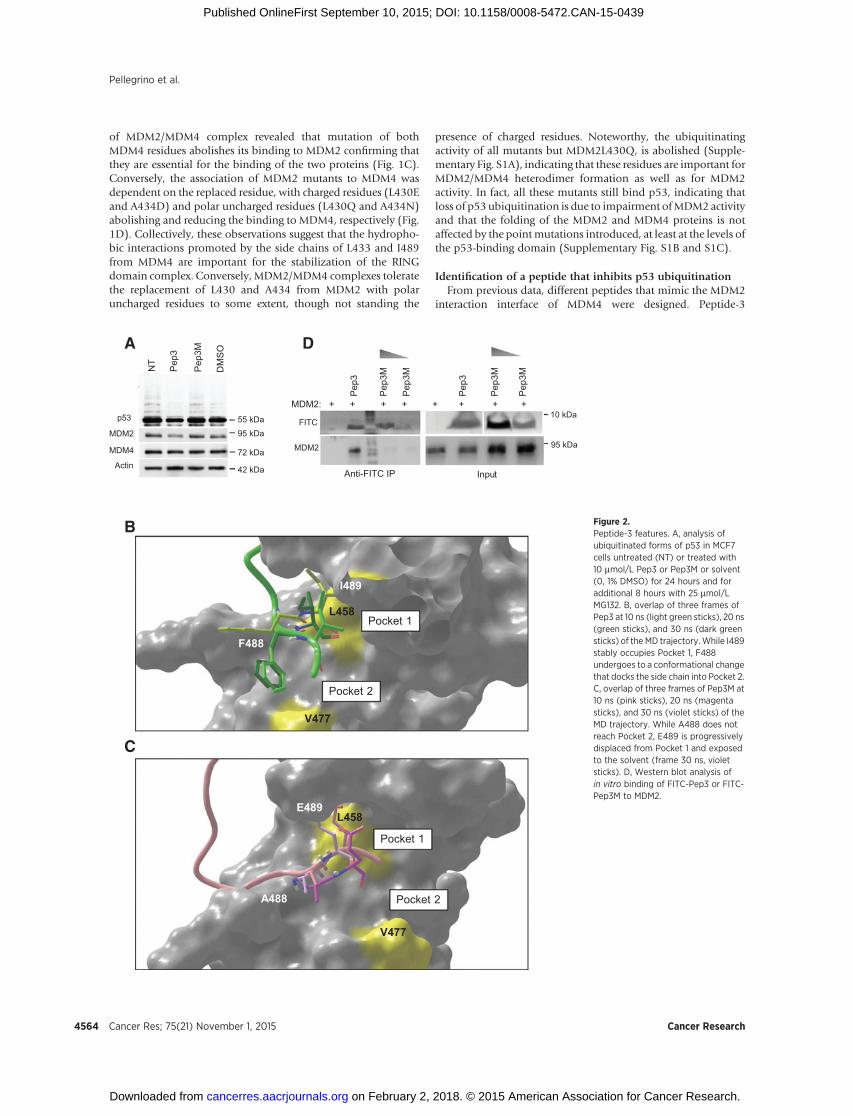
Figure 2.Peptide-3 features. A, analysis ofubiquitinated forms of p53 in MCF7cells untreated (NT) or treated with10 mmol/L Pep3 or Pep3M or solvent(0, 1% DMSO) for 24 hours and foradditional 8 hours with 25 mmol/LMG132. B, overlap of three frames ofPep3 at 10 ns (light green sticks), 20 ns(green sticks), and 30 ns (dark greensticks) of the MD trajectory.While I489stably occupies Pocket 1, F488undergoes to a conformational changethat docks the side chain into Pocket 2.C, overlap of three frames of Pep3M at10 ns (pink sticks), 20 ns (magentasticks), and 30 ns (violet sticks) of theMD trajectory. While A488 does notreach Pocket 2, E489 is progressivelydisplaced from Pocket 1 and exposedto the solvent (frame 30 ns, violetsticks). D, Western blot analysis ofin vitro binding of FITC-Pep3 or FITC-Pep3M to MDM2.
Pellegrino et al.
Cancer Res; 75(21) November 1, 2015 Cancer Research4564
on February 2, 2018. © 2015 American Association for Cancer Research. cancerres.aacrjournals.org Downloaded from
Published OnlineFirst September 10, 2015; DOI: 10.1158/0008-5472.CAN-15-0439
(thereafter Pep3), a dodecapeptide that overlaps the COOH-terminus of MDM4 comprising the I489 residue (KEIQLVIKV-FI489A), was able to reduce p53 ubiquitination in different celllines as comparedwithuntreatedor solvent (0,1%DMSO) treatedcells (Fig. 2A and Supplementary Fig. S1E). In comparison, acontrol peptide in which the I489 and the F488 aminoacids weresubstituted by E489 and A488, respectively (Pep3M, KEIQLVIK-VAEA) did not affect levels of ubiquitinated p53 (Fig. 2A andSupplementary Fig. S1D and S1E). A peptide containing onlysubstitution of I489 retained partial inhibitory activity towardsMDM2 (Supplementary Fig. S1E).
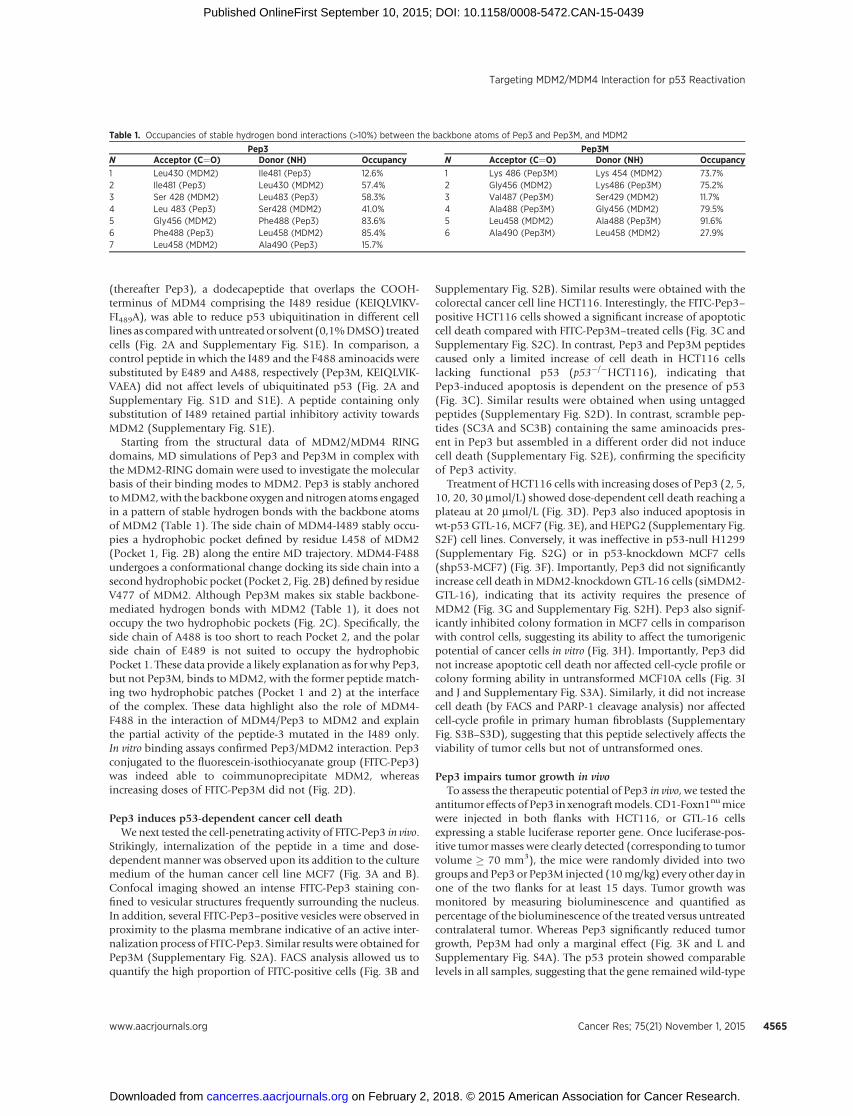
Starting from the structural data of MDM2/MDM4 RINGdomains, MD simulations of Pep3 and Pep3M in complex withthe MDM2-RING domain were used to investigate the molecularbasis of their binding modes to MDM2. Pep3 is stably anchoredtoMDM2,with the backbone oxygen andnitrogen atoms engagedin a pattern of stable hydrogen bonds with the backbone atomsof MDM2 (Table 1). The side chain of MDM4-I489 stably occu-pies a hydrophobic pocket defined by residue L458 of MDM2(Pocket 1, Fig. 2B) along the entire MD trajectory. MDM4-F488undergoes a conformational change docking its side chain into asecond hydrophobic pocket (Pocket 2, Fig. 2B) defined by residueV477 of MDM2. Although Pep3M makes six stable backbone-mediated hydrogen bonds with MDM2 (Table 1), it does notoccupy the two hydrophobic pockets (Fig. 2C). Specifically, theside chain of A488 is too short to reach Pocket 2, and the polarside chain of E489 is not suited to occupy the hydrophobicPocket 1. These data provide a likely explanation as for why Pep3,but not Pep3M, binds to MDM2, with the former peptide match-ing two hydrophobic patches (Pocket 1 and 2) at the interfaceof the complex. These data highlight also the role of MDM4-F488 in the interaction of MDM4/Pep3 to MDM2 and explainthe partial activity of the peptide-3 mutated in the I489 only.In vitro binding assays confirmed Pep3/MDM2 interaction. Pep3conjugated to the fluorescein-isothiocyanate group (FITC-Pep3)was indeed able to coimmunoprecipitate MDM2, whereasincreasing doses of FITC-Pep3M did not (Fig. 2D).
Pep3 induces p53-dependent cancer cell deathWe next tested the cell-penetrating activity of FITC-Pep3 in vivo.
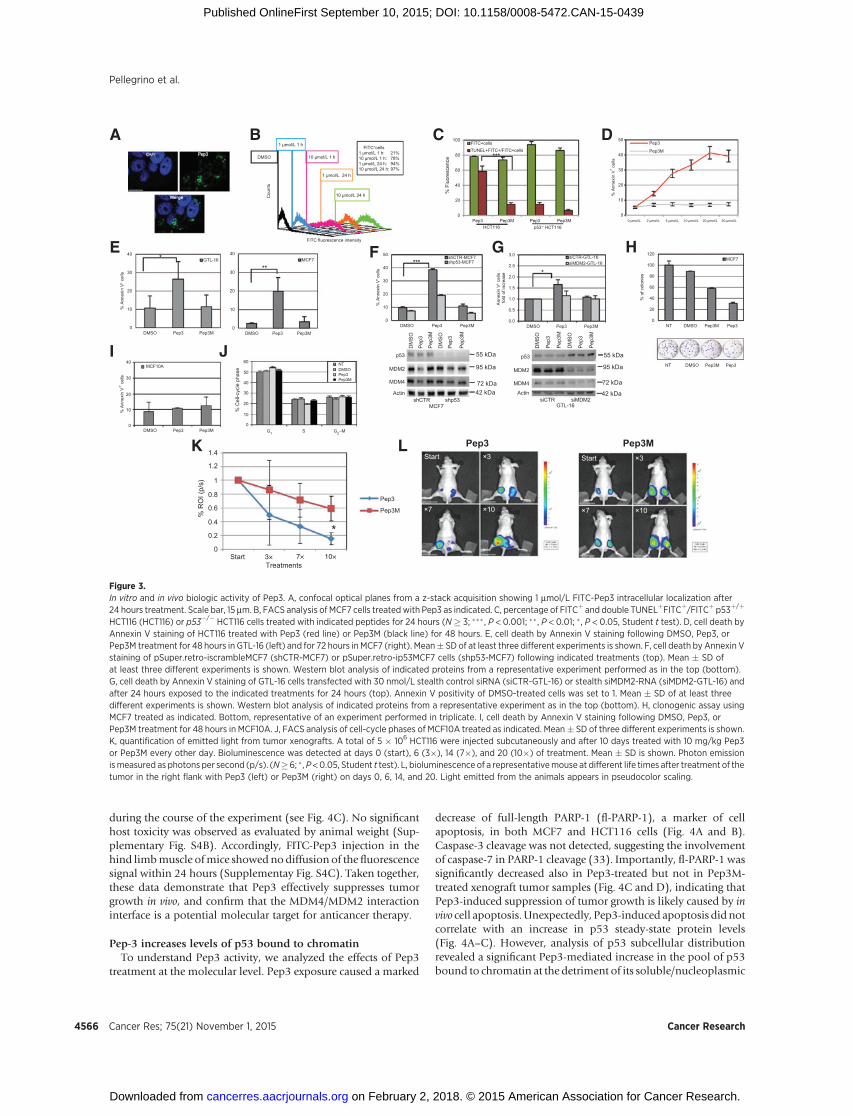
Strikingly, internalization of the peptide in a time and dose-dependent manner was observed upon its addition to the culturemedium of the human cancer cell line MCF7 (Fig. 3A and B).Confocal imaging showed an intense FITC-Pep3 staining con-fined to vesicular structures frequently surrounding the nucleus.In addition, several FITC-Pep3–positive vesicles were observed inproximity to the plasma membrane indicative of an active inter-nalization process of FITC-Pep3. Similar results were obtained forPep3M (Supplementary Fig. S2A). FACS analysis allowed us toquantify the high proportion of FITC-positive cells (Fig. 3B and
Supplementary Fig. S2B). Similar results were obtained with thecolorectal cancer cell line HCT116. Interestingly, the FITC-Pep3–positive HCT116 cells showed a significant increase of apoptoticcell death compared with FITC-Pep3M–treated cells (Fig. 3C andSupplementary Fig. S2C). In contrast, Pep3 and Pep3M peptidescaused only a limited increase of cell death in HCT116 cellslacking functional p53 (p53�/�HCT116), indicating thatPep3-induced apoptosis is dependent on the presence of p53(Fig. 3C). Similar results were obtained when using untaggedpeptides (Supplementary Fig. S2D). In contrast, scramble pep-tides (SC3A and SC3B) containing the same aminoacids pres-ent in Pep3 but assembled in a different order did not inducecell death (Supplementary Fig. S2E), confirming the specificityof Pep3 activity.
Treatment of HCT116 cells with increasing doses of Pep3 (2, 5,10, 20, 30 mmol/L) showed dose-dependent cell death reaching aplateau at 20 mmol/L (Fig. 3D). Pep3 also induced apoptosis inwt-p53GTL-16,MCF7 (Fig. 3E), andHEPG2 (Supplementary Fig.S2F) cell lines. Conversely, it was ineffective in p53-null H1299(Supplementary Fig. S2G) or in p53-knockdown MCF7 cells(shp53-MCF7) (Fig. 3F). Importantly, Pep3 did not significantlyincrease cell death inMDM2-knockdown GTL-16 cells (siMDM2-GTL-16), indicating that its activity requires the presence ofMDM2 (Fig. 3G and Supplementary Fig. S2H). Pep3 also signif-icantly inhibited colony formation in MCF7 cells in comparisonwith control cells, suggesting its ability to affect the tumorigenicpotential of cancer cells in vitro (Fig. 3H). Importantly, Pep3 didnot increase apoptotic cell death nor affected cell-cycle profile orcolony forming ability in untransformed MCF10A cells (Fig. 3Iand J and Supplementary Fig. S3A). Similarly, it did not increasecell death (by FACS and PARP-1 cleavage analysis) nor affectedcell-cycle profile in primary human fibroblasts (SupplementaryFig. S3B–S3D), suggesting that this peptide selectively affects theviability of tumor cells but not of untransformed ones.
Pep3 impairs tumor growth in vivoTo assess the therapeutic potential of Pep3 in vivo, we tested the
antitumor effects of Pep3 in xenograftmodels. CD1-Foxn1numicewere injected in both flanks with HCT116, or GTL-16 cellsexpressing a stable luciferase reporter gene. Once luciferase-pos-itive tumormasses were clearly detected (corresponding to tumorvolume � 70 mm3), the mice were randomly divided into twogroups and Pep3 or Pep3M injected (10mg/kg) every other day inone of the two flanks for at least 15 days. Tumor growth wasmonitored by measuring bioluminescence and quantified aspercentage of the bioluminescence of the treated versus untreatedcontralateral tumor. Whereas Pep3 significantly reduced tumorgrowth, Pep3M had only a marginal effect (Fig. 3K and L andSupplementary Fig. S4A). The p53 protein showed comparablelevels in all samples, suggesting that the gene remained wild-type
Table 1. Occupancies of stable hydrogen bond interactions (>10%) between the backbone atoms of Pep3 and Pep3M, and MDM2
Pep3 Pep3MN Acceptor (C¼O) Donor (NH) Occupancy N Acceptor (C¼O) Donor (NH) Occupancy
1 Leu430 (MDM2) Ile481 (Pep3) 12.6% 1 Lys 486 (Pep3M) Lys 454 (MDM2) 73.7%2 Ile481 (Pep3) Leu430 (MDM2) 57.4% 2 Gly456 (MDM2) Lys486 (Pep3M) 75.2%3 Ser 428 (MDM2) Leu483 (Pep3) 58.3% 3 Val487 (Pep3M) Ser429 (MDM2) 11.7%4 Leu 483 (Pep3) Ser428 (MDM2) 41.0% 4 Ala488 (Pep3M) Gly456 (MDM2) 79.5%5 Gly456 (MDM2) Phe488 (Pep3) 83.6% 5 Leu458 (MDM2) Ala488 (Pep3M) 91.6%6 Phe488 (Pep3) Leu458 (MDM2) 85.4% 6 Ala490 (Pep3M) Leu458 (MDM2) 27.9%7 Leu458 (MDM2) Ala490 (Pep3) 15.7%
Targeting MDM2/MDM4 Interaction for p53 Reactivation
www.aacrjournals.org Cancer Res; 75(21) November 1, 2015 4565
on February 2, 2018. © 2015 American Association for Cancer Research. cancerres.aacrjournals.org Downloaded from
Published OnlineFirst September 10, 2015; DOI: 10.1158/0008-5472.CAN-15-0439
during the course of the experiment (see Fig. 4C). No significanthost toxicity was observed as evaluated by animal weight (Sup-plementary Fig. S4B). Accordingly, FITC-Pep3 injection in thehind limbmuscle ofmice showed nodiffusion of thefluorescencesignal within 24 hours (Supplementay Fig. S4C). Taken together,these data demonstrate that Pep3 effectively suppresses tumorgrowth in vivo, and confirm that the MDM4/MDM2 interactioninterface is a potential molecular target for anticancer therapy.
Pep-3 increases levels of p53 bound to chromatinTo understand Pep3 activity, we analyzed the effects of Pep3
treatment at the molecular level. Pep3 exposure caused a marked
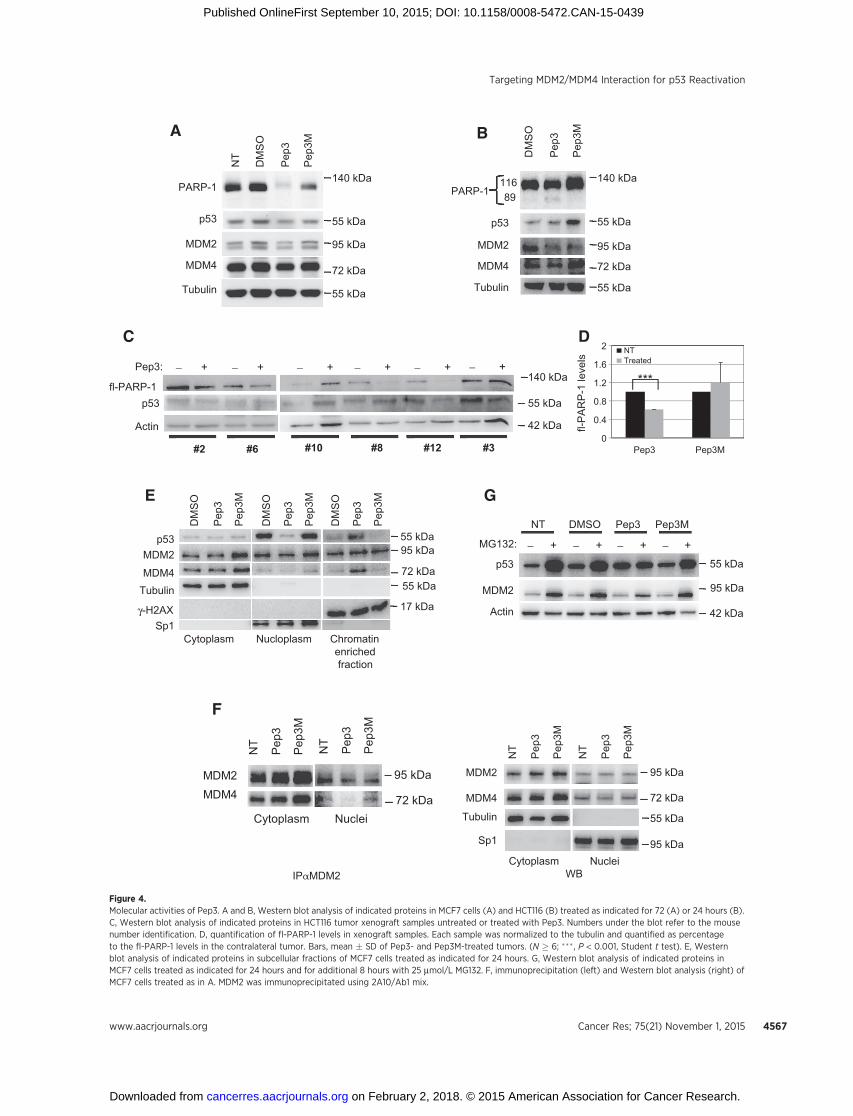
decrease of full-length PARP-1 (fl-PARP-1), a marker of cellapoptosis, in both MCF7 and HCT116 cells (Fig. 4A and B).Caspase-3 cleavage was not detected, suggesting the involvementof caspase-7 in PARP-1 cleavage (33). Importantly, fl-PARP-1 wassignificantly decreased also in Pep3-treated but not in Pep3M-treated xenograft tumor samples (Fig. 4C and D), indicating thatPep3-induced suppression of tumor growth is likely caused by invivo cell apoptosis. Unexpectedly, Pep3-induced apoptosis didnotcorrelate with an increase in p53 steady-state protein levels(Fig. 4A–C). However, analysis of p53 subcellular distributionrevealed a significant Pep3-mediated increase in the pool of p53bound to chromatin at the detriment of its soluble/nucleoplasmic
0
10
20
30
40
50
DMSO Pep3 Pep3M
% A
nnex
in V
+ ce
lls
shCTR-MCF7shp53-MCF7
0
10
20
30
40
DMSO Pep3 Pep3M
MCF7
0
10
20
30
40
DMSO
% A
nnex
in V
+ cel
ls
DMSO
Pep3
Pep3
Pep3
Pep3
Pep3M
Pep3M
Pep3M
Pep3M
% A
nnex
in V
+ cel
ls
GTL-16
0
10
20
30
40
50
0 μmol/L 2 μmol/L 5 μmol/L 10 μmol/L 20 μmol/L 30 μmol/L
% A
nnex
in V
+ cel
ls
Pep3
Pep3M
A B
HCT116 p53-/- HCT116
NT DMSO Pep3M Pep3
C D
E F H *
G *
**
FITC fluorescence intensity
Cou
nts
DMSO
FITC+cells 1 μmol/L 1 h: 21% 10 μmol/L 1 h: 78% 1 μmol/L 24 h: 94% 10 μmol/L 24 h: 97%
1 μmol/L 1 h
10 μmol/L 1 h
1 μmol/L 24 h
10 μmol/L 24 h
DM
SO
Pep
3
Pep3
M
shCTR
DM
SO
Pep
3
Pep3
M
shp53
p53
MDM2
MDM4
Actin
MCF7
55 kDa
95 kDa
72 kDa 42 kDa
DM
SO
Pep
3
Pep
3M
DM
SO
Pep
3
Pep3
M
siCTR siMDM2 GTL-16
Actin
MDM2
MDM4
p53
95 kDa
72 kDa
55 kDa
42 kDa
Merge
*
% R
OI (
p/s)
Treatments
0
20
40
60
80
100
120
NT DMSO Pep3M Pep3
% o
f col
onie
s
MCF7
0
20
40
60
80
100
Pep3 Pep3M Pep3 Pep3M
% F
luor
esce
nce
FITC+cellsTUNEL+FITC+/FITC+cells
***
0.0
0.5
1.0
1.5
2.0
2.5
3.0
DMSO Pep3 Pep3M
Ann
exin
V+ c
ells
:
fold
of i
ncre
ase
siCTR-GTL-16siMDM2-GTL-16
I J
% C
ell-c
ycle
pha
se
Start ×3
×7 ×10
Start ×3
×7 ×10
L K
***
0
10
20
30
40MCF10A
0
0Start 3× 7× 10×
0.2
0.4
0.6
0.8
1
1.2
1.4
G1 G2–MS
10
20
30
40
50
60 NTDMSOPep3Pep3M
Figure 3.In vitro and in vivo biologic activity of Pep3. A, confocal optical planes from a z-stack acquisition showing 1 mmol/L FITC-Pep3 intracellular localization after24 hours treatment. Scale bar, 15 mm. B, FACS analysis of MCF7 cells treated with Pep3 as indicated. C, percentage of FITCþ and double TUNELþFITCþ/FITCþ p53þ/þ
HCT116 (HCT116) or p53�/� HCT116 cells treated with indicated peptides for 24 hours (N � 3; ��� , P < 0.001; �� , P < 0.01; � , P < 0.05, Student t test). D, cell death byAnnexin V staining of HCT116 treated with Pep3 (red line) or Pep3M (black line) for 48 hours. E, cell death by Annexin V staining following DMSO, Pep3, orPep3M treatment for 48 hours in GTL-16 (left) and for 72 hours in MCF7 (right). Mean� SD of at least three different experiments is shown. F, cell death by Annexin Vstaining of pSuper.retro-iscrambleMCF7 (shCTR-MCF7) or pSuper.retro-ip53MCF7 cells (shp53-MCF7) following indicated treatments (top). Mean � SD ofat least three different experiments is shown. Western blot analysis of indicated proteins from a representative experiment performed as in the top (bottom).G, cell death by Annexin V staining of GTL-16 cells transfected with 30 nmol/L stealth control siRNA (siCTR-GTL-16) or stealth siMDM2-RNA (siMDM2-GTL-16) andafter 24 hours exposed to the indicated treatments for 24 hours (top). Annexin V positivity of DMSO-treated cells was set to 1. Mean � SD of at least threedifferent experiments is shown. Western blot analysis of indicated proteins from a representative experiment as in the top (bottom). H, clonogenic assay usingMCF7 treated as indicated. Bottom, representative of an experiment performed in triplicate. I, cell death by Annexin V staining following DMSO, Pep3, orPep3M treatment for 48 hours in MCF10A. J, FACS analysis of cell-cycle phases of MCF10A treated as indicated. Mean� SD of three different experiments is shown.K, quantification of emitted light from tumor xenografts. A total of 5 � 106 HCT116 were injected subcutaneously and after 10 days treated with 10 mg/kg Pep3or Pep3M every other day. Bioluminescence was detected at days 0 (start), 6 (3�), 14 (7�), and 20 (10�) of treatment. Mean � SD is shown. Photon emissionismeasured as photons per second (p/s). (N�6; � ,P <0.05, Student t test). L, bioluminescence of a representativemouse at different life times after treatment of thetumor in the right flank with Pep3 (left) or Pep3M (right) on days 0, 6, 14, and 20. Light emitted from the animals appears in pseudocolor scaling.
Pellegrino et al.
Cancer Res; 75(21) November 1, 2015 Cancer Research4566
on February 2, 2018. © 2015 American Association for Cancer Research. cancerres.aacrjournals.org Downloaded from
Published OnlineFirst September 10, 2015; DOI: 10.1158/0008-5472.CAN-15-0439
A
MDM2
Actin
p53 55 kDa
95 kDa
42 kDa
MG132:
NT DMSO Pep3 Pep3M
γ-H2AX
p53
MDM4
MDM2
Tubulin
Pep
3M
Pep
3
DM
SO
Pep
3M
Pep
3
DM
SO
Pep
3M
Pep
3
DM
SO
Chromatin Nucloplasm Cytoplasm enriched fraction
72 kDa
55 kDa95 kDa
55 kDa
17 kDa
Sp1
PARP-1
MDM2
MDM4
p53
TubulinP
ep3M
Pep
3
DM
SO
NT
72 kDa
95 kDa
55 kDa
55 kDa
140 kDa
p53fl-PARP-1
Actin
Pep3: − +
− + − + − + − +
− + − + − + − + − +
#6#2 #12#8#10 #3
C
GE
0
0.4
0.8
1.2
1.6
2 NTTreated
Pep3 Pep3M
***
fl-P
AR
P-1
leve
ls
D
F
Cytoplasm
72 kDa
95 kDa
NT
Pep
3
Pep
3M
Nuclei
55 kDa
95 kDa
NT
Pep
3
Pep
3M
MDM4
MDM2
Tubulin
Sp1
MDM4MDM2
NT
Pep
3
Pep
3M
NT
Pep
3
Pep
3M
Cytoplasm Nuclei 72 kDa
95 kDa
WBIPαMDM2
140 kDa
55 kDa
42 kDa
MDM2
MDM4
p53
Tubulin
B
Pep
3M
Pep
3
DM
SO
72 kDa
95 kDa
55 kDa
55 kDa
140 kDaPARP-1
11689
Figure 4.Molecular activities of Pep3. A and B, Western blot analysis of indicated proteins in MCF7 cells (A) and HCT116 (B) treated as indicated for 72 (A) or 24 hours (B).C, Western blot analysis of indicated proteins in HCT116 tumor xenograft samples untreated or treated with Pep3. Numbers under the blot refer to the mousenumber identification. D, quantification of fl-PARP-1 levels in xenograft samples. Each sample was normalized to the tubulin and quantified as percentageto the fl-PARP-1 levels in the contralateral tumor. Bars, mean � SD of Pep3- and Pep3M-treated tumors. (N � 6; ��� , P < 0.001, Student t test). E, Westernblot analysis of indicated proteins in subcellular fractions of MCF7 cells treated as indicated for 24 hours. G, Western blot analysis of indicated proteins inMCF7 cells treated as indicated for 24 hours and for additional 8 hours with 25 mmol/L MG132. F, immunoprecipitation (left) and Western blot analysis (right) ofMCF7 cells treated as in A. MDM2 was immunoprecipitated using 2A10/Ab1 mix.
Targeting MDM2/MDM4 Interaction for p53 Reactivation
www.aacrjournals.org Cancer Res; 75(21) November 1, 2015 4567
on February 2, 2018. © 2015 American Association for Cancer Research. cancerres.aacrjournals.org Downloaded from
Published OnlineFirst September 10, 2015; DOI: 10.1158/0008-5472.CAN-15-0439
fraction (Fig. 4E). The MDM4 protein was redistributed similarlyto p53, whereas MDM2 subcellular distribution was not affectedby Pep3 (Fig. 4E). These data are consistent with an alteration ofthe MDM2/MDM4 nuclear complexes upon Pep3 addition. Infact, associationbetweenMDM4andMDM2was reducedbyPep3in the nuclear fraction but not in cytoplasmic extract (Fig. 4F andSupplementary Fig. S5A). Treatment with the proteasome inhib-itor MG132 did not exacerbate the Pep3-dependent increase inp53 protein levels, including the chromatin bound fraction(Fig. 4G), confirming that Pep3 interferes with p53 degradation.
The levels of phosphorylated histone H2AX (g-H2AX), a mark-er of DNA damage did not increase upon Pep3 exposure (Fig. 4E),indicating that recruitment of p53 to the chromatin is not asso-ciated with activation of the DNA damage response. Accordingly,phosphorylation of p53 at Ser46 or Ser15, two features of stress-mediated p53 activation were not observed (Supplementary Fig.S5B and S5C).
Pep3 induces p53-dependent transcriptional activation ofproapoptotic/oxidant targets
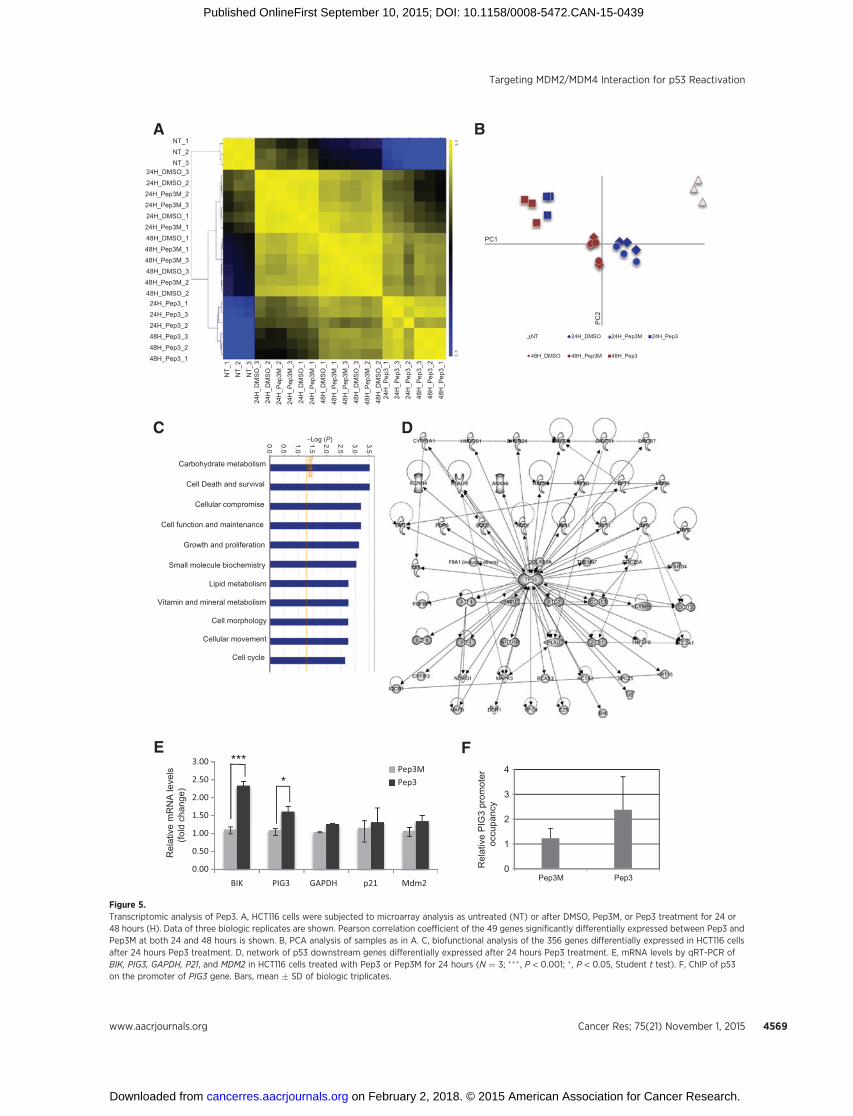
Transcriptionally active p53 can induce apoptosis throughdifferent target genes (34). Genome-wide transcriptomic analysisof Pep3-treatedHCT116 cells comparedwith untreated,DMSOorPep3M-treated cells, identified 347 and 198 genes that weresignificantly deregulated 24 and 48 hours after treatment respec-tively (Supplementary Tables S1 and S2). Overlapping of the twogroups of genes deregulated at 24 and 48 hours revealed asignificant alteration of a common subgroup of 49 genes (Fig.5A and Supplementary Fig. S6). Clusters corresponding to thedifferent treatments were clearly apparent on a principal compo-nent analysis (PCA; Fig. 5B).
Ingenuity Pathways Analysis revealed that most of the 347mRNAs deregulated by Pep3 encode for proteins involved in celldeath and survival (Fig. 5C and Supplementary Fig. S6E). Of note,p53 was identified as one of the top putative upstream regulatorsof these genes confirming that Pep3 induces p53 activity (Fig. 5D).
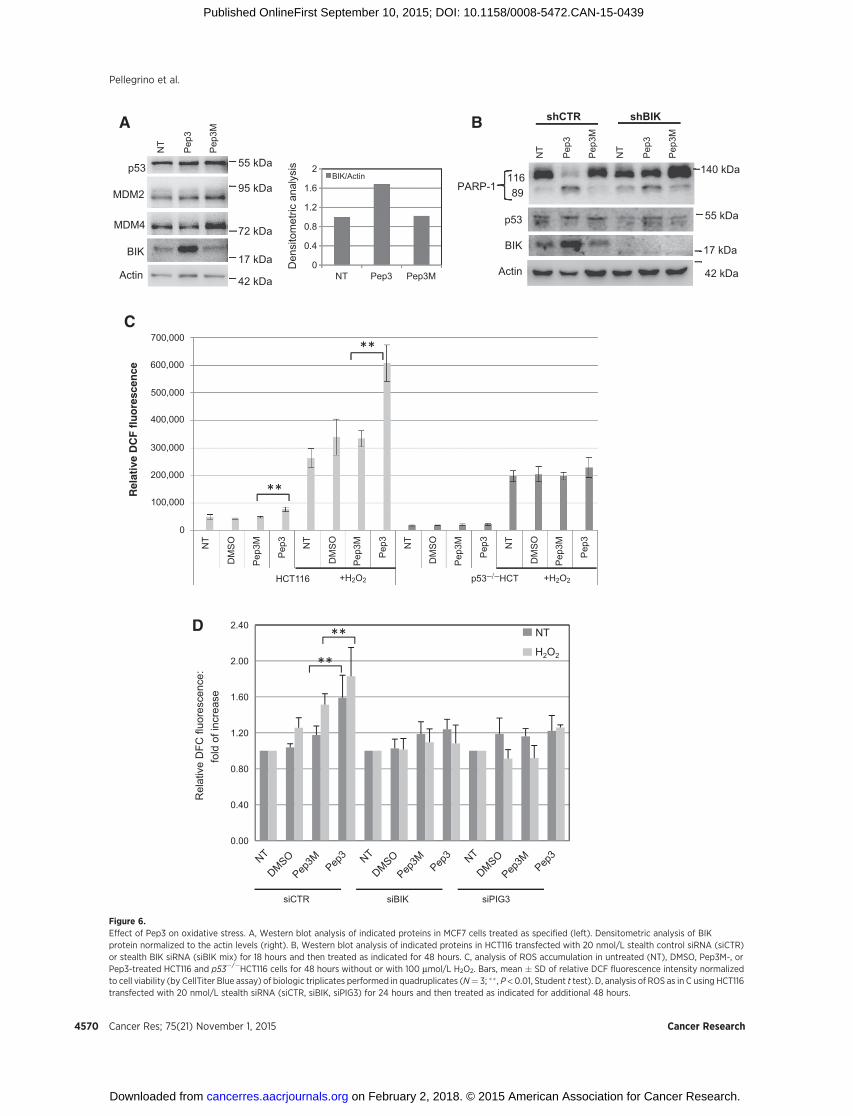
Among the well-established p53 target genes induced by Pep3are two genes encoding for proapoptotic and pro-oxidant factors:BCL2 interacting killer, BIK/BP4/NBK/BIP1 (35), and tumor pro-tein p53-inducible protein-3, PIG3/TP53I3 (Fig. 5D; ref. 36). qRT-PCR confirmed the significant induction of these mRNAs at 24(Fig. 5E) and 48 hours (Supplementary Fig. S6F), whereas, incomparison, p21/WAF1 and MDM2, two p53 target genes,involved mainly in growth arrest, were not induced by Pep3.Chromatin immunoprecipitation (ChIP) confirmed the increasedrecruitment of p53 at the promoter of PIG3 in cells exposed toPep3 (Fig. 5F). In contrast, no increased recruitment of p53 at theMDM2 promoter in the same experimental conditions wasobserved (Supplementary Fig. S7A). Consistent with these find-ings, BIK protein levels were highly increased uponPep3 exposureboth in MCF7 and HCT116 cells (Fig. 6A and B and Supplemen-tary Fig. S7B). Of importance, siBIK by single oligos or their mix(Supplementary Fig. S8A) resulted in decreased PARP-1 cleavage(Fig. 6B) and Pep3-induced cell apoptosis (Supplementary Fig.S9A), confirming the role played by this gene in Pep3-mediatedactivity. Given the involvement of BIK and PIG3 in p53-mediatedoxidative stress response (36, 37), we quantified reactive oxygenspecies (ROS) levels using the fluorogenic probe DCF uponH2O2
stimulation. This analysis revealed a significant increase of intra-cellular ROS levels following Pep3 exposure both in HCT116 andMCF7 cells (Fig. 6C and Supplementary Fig. S9B), confirming that
Pep3 counteracts the antioxidant potential of the cell. The Pep3-dependent increase of ROS levels in HCT116 cells was detectableeven in the absence of H2O2 stimulation (Fig. 6C). Importantly,ROS levels were not induced by Pep3 in p53�/�HCT116 cells (Fig.6C), confirming the crucial role played by p53 in this Pep3-induced response. Finally, siBIK or siPIG3 (Supplementary Fig.S8) rescued the increase of ROS levelsmediatedbyPep3 treatment(Fig. 6D), confirming the role played by these genes in thisresponse.
DiscussionMost of the pharmacologic approaches aiming at reactivating
p53 in cancer cells have focused to date on the interactioninterface between p53 andMDM2orMDM4.Here, we developedan alternative strategy that aims at inhibiting the activity of theMDM2/MDM4 complexes by interfering with their hetero-dimerization. Our study demonstrates that the binding of apeptidemimicking theMDM4C-terminus tail toMDM2, impairsMDM2-mediated p53 ubiquitination and activates p53-depen-dent transcription and oncosuppressive activities.
Interestingly, our data indicate that Pep3 may be mainlyeffective towards a specific subcellular pool of MDM2/MDM4/p53 as evidenced by the alteration of the nuclear complexes butnot of the cytoplasmic fraction. Consistently, the p53 transcrip-tional program activated by Pep3 is restricted to some p53 targetgenes involved in the oxidative stress response, suggesting aspecific control of this function by theMDM2/MDM4 complexes.In fact, MDM2 and MDM4 act as cotranscriptional inhibitors atthe p53-responsive elements on the promoter of PIG3, but not ofMDM2 or RCHY1/PIRH2 genes (21). In addition, MDM2 med-iates histone ubiquitylation and transcriptional repression (38).At present, it is not known whether subcellular MDM2/MDM4complexes present different features. The conformation assumedby the complexes consequent toDNAbindingmight contribute tothe selective sensitivity of the nuclear heterodimers to Pep3.Alternatively, additional partners and/or post-translational mod-ifications may distinguish the subcellular complexes.
In contrast to the majority of the approaches that target theinteraction between p53 and MDM2, our method causes p53-dependent cell death of various cancer cells, supporting therequirement of the heterodimer for efficient control of p53function. The observation that the preferred response elicited byPep3 is apoptosis is also in agreement with recent data from ourand other labs that reported impairment of MDM4/MDM2 het-erodimer function during apoptosis (22, 39–41). Importantly,this observation highlights the potential therapeutic value oftargeting the MDM2/MDM4 heterodimers.
Cancer cells are subjected to increased and persistent oxidativestress and accumulating evidence indicates that increasing ROSlevels represents an effective approach to induce cancer cell–specific apoptosis (42–44). Accordingly, the p53-reactivatingmolecule RITA appears to function by ROS-activatingmechanismas Pep3 (45). Our data, indicating that Pep3 reduces the anti-oxidative potential of the cell and enhances ROS levels, furthersupport the targeting of MDM2/MDM4 complexes as a cancercell–specific efficient therapeutic strategy. The absence of Pep3activity in untransformed cell line MCF10A and in human fibro-blasts is consistent with this hypothesis.
Compared with the current p53-reactivating approaches, theability of Pep3 to activate the chromatin-enriched fraction of p53
Pellegrino et al.
Cancer Res; 75(21) November 1, 2015 Cancer Research4568
on February 2, 2018. © 2015 American Association for Cancer Research. cancerres.aacrjournals.org Downloaded from
Published OnlineFirst September 10, 2015; DOI: 10.1158/0008-5472.CAN-15-0439
0.00
0.50
1.00
1.50
2.00
2.50
3.00
Mdm2p21GAPDHPIG3BIK
Pep3MPep3
NT 24H_DMSO 24H_Pep3M 24H_Pep3
48H_DMSO 48H_Pep3M 48H_Pep3
PC1
PC
2
C D
E
BA
24H
_DM
SO
_3
24H
_DM
SO
_2
24H
_Pep
3M_2
24H
_Pep
3M_3
24H
_DM
SO
_1
24H
_Pep
3M_1
48H
_DM
SO
_1
48H
_Pep
3M_1
48H
_Pep
3M_3
48H
_DM
SO
_3
48H
_Pep
3M_2
48H
_DM
SO
_2
NT_
1
NT_
2
NT_
3
24H
_Pep
3_1
24H
_Pep
3_3
24H
_Pep
3_2
48H
_Pep
3_3
48H
_Pep
3_2
48H
_Pep
3_1
24H_DMSO_3
24H_DMSO_2
24H_Pep3M_2
24H_Pep3M_3
24H_DMSO_1
24H_Pep3M_1
48H_DMSO_1
48H_Pep3M_1
48H_Pep3M_3
48H_DMSO_3
48H_Pep3M_2
48H_DMSO_2
NT_1
NT_2
NT_3
24H_Pep3_1
24H_Pep3_3
24H_Pep3_2
48H_Pep3_3
48H_Pep3_2
48H_Pep3_1
Carbohydrate metabolism
Cell Death and survival
Cellular compromise
Cell function and maintenance
Growth and proliferation
Small molecule biochemistry
Lipid metabolism
Vitamin and mineral metabolism
Cell morphology
Cellular movement
Cell cycle
Rel
ativ
e m
RN
A le
vels
(fold
cha
nge)
***
*
F
0
1
2
3
4
Pep3Pep3M
Rel
ativ
e P
IG3
prom
oter
oc
cupa
ncy
−Log (P) 3.5
3.0
2.5
2.0
1.5
1.0
0.5
0.0
Figure 5.Transcriptomic analysis of Pep3. A, HCT116 cells were subjected to microarray analysis as untreated (NT) or after DMSO, Pep3M, or Pep3 treatment for 24 or48 hours (H). Data of three biologic replicates are shown. Pearson correlation coefficient of the 49 genes significantly differentially expressed between Pep3 andPep3M at both 24 and 48 hours is shown. B, PCA analysis of samples as in A. C, biofunctional analysis of the 356 genes differentially expressed in HCT116 cellsafter 24 hours Pep3 treatment. D, network of p53 downstream genes differentially expressed after 24 hours Pep3 treatment. E, mRNA levels by qRT-PCR ofBIK, PIG3, GAPDH, P21, and MDM2 in HCT116 cells treated with Pep3 or Pep3M for 24 hours (N ¼ 3; ��� , P < 0.001; � , P < 0.05, Student t test). F, ChIP of p53on the promoter of PIG3 gene. Bars, mean � SD of biologic triplicates.
www.aacrjournals.org Cancer Res; 75(21) November 1, 2015 4569
Targeting MDM2/MDM4 Interaction for p53 Reactivation
on February 2, 2018. © 2015 American Association for Cancer Research. cancerres.aacrjournals.org Downloaded from
Published OnlineFirst September 10, 2015; DOI: 10.1158/0008-5472.CAN-15-0439
A B
NT
Pep
3
Pep
3M
p53
MDM2
Actin
MDM4
BIK
55 kDa
95 kDa
72 kDa
42 kDa
17 kDa
**
**
PARP-1
NT
Pep
3
Pep
3M
NT
Pep
3
Pep
3M
shBIK shCTR
11689
BIK
p53
Actin
C
D
0.00
0.40
0.80
1.20
1.60
2.00
2.40
Rel
ativ
e D
FC fl
uore
scen
ce:
fold
of i
ncre
ase
siPIG3siBIKsiCTR
42 kDa
55 kDa
17 kDa
140 kDa
** H2O2
NT**
0
0.4
0.8
1.2
1.6
2
Pep3MPep3NTD
ensi
tom
etric
ana
lysi
s
BIK/Actin
Rel
ativ
e D
CF
flu
ore
scen
ce
700,000
600,000
500,000
400,000
300,000
200,000
100,000
0
NT
DM
SO
Pep
3M
Pep
3M
Pep
3M
Pep
3M
Pep
3
Pep
3
Pep
3
Pep
3
NT
NT
NT
DM
SO
DM
SO
DM
SO
HCT116 +H2O2 +H2O2p53−/−HCT
Figure 6.Effect of Pep3 on oxidative stress. A, Western blot analysis of indicated proteins in MCF7 cells treated as specified (left). Densitometric analysis of BIKprotein normalized to the actin levels (right). B, Western blot analysis of indicated proteins in HCT116 transfected with 20 nmol/L stealth control siRNA (siCTR)or stealth BIK siRNA (siBIK mix) for 18 hours and then treated as indicated for 48 hours. C, analysis of ROS accumulation in untreated (NT), DMSO, Pep3M-, orPep3-treated HCT116 and p53�/�HCT116 cells for 48 hours without or with 100 mmol/L H2O2. Bars, mean � SD of relative DCF fluorescence intensity normalizedto cell viability (by CellTiter Blue assay) of biologic triplicates performed in quadruplicates (N¼ 3; �� , P < 0.01, Student t test). D, analysis of ROS as in C using HCT116transfected with 20 nmol/L stealth siRNA (siCTR, siBIK, siPIG3) for 24 hours and then treated as indicated for additional 48 hours.
Pellegrino et al.
Cancer Res; 75(21) November 1, 2015 Cancer Research4570
on February 2, 2018. © 2015 American Association for Cancer Research. cancerres.aacrjournals.org Downloaded from
Published OnlineFirst September 10, 2015; DOI: 10.1158/0008-5472.CAN-15-0439
might endow this strategy of reduced toxicity. In fact, in a recentexploratory clinical trial, the p53-activating molecule RG7112, amember of Nutlin family, has shown treatment-related seriousadverse events (46), all of which related to haematologic toxicity(47) caused probably by the treatment-derived high levels of p53.Similarly, highly levels of p53 have been observed following thetreatment with the unique double MDM2/MDM4 inhibitordeveloped so far (17).
In addition, given the increased specificity of anticancer pep-tides in the recognition of their targets (48), Pep3 may overcomeside effects and toxicities of other cancer therapies. In fact, small-molecule inhibitors of MDM2-mediated ubiquitinating activity,have shown unintended activities towards other RING finger E3ligases (49, 50).
On the basis of these data, targeting the MDM2/MDM4 inter-action interface appears a promising therapeutic strategy fordeveloping new anticancer lead compounds with high specificityand effectiveness.
Disclosure of Potential Conflicts of InterestNo potential conflicts of interest were disclosed.
Authors' ContributionsConception and design: M. Pellegrino, A. Macchiarulo, F. MorettiDevelopment of methodology:M. Pellegrino, F. Mancini, R. Luc�a, N. Giacch�e,I. Manni, E. Teveroni, M. Buttarelli, L. Fici, T. Bruno
Acquisition of data (provided animals, acquired and managed patients,provided facilities, etc.): F. Florenzano, R. Brandi, M. Fanciulli, M. D'Onofrio,G. Piaggio, R. PellicciariAnalysis and interpretation of data (e.g., statistical analysis, biostatistics,computational analysis): M. Pellegrino, R. Luc�a, A. Coletti, I. Arisi, F. Flor-enzano, M. Buttarelli, J.C. Marine, A. Macchiarulo, F. MorettiWriting, review, and/or revision of the manuscript: M. Pellegrino, R. Luc�a,A. Pontecorvi, J.C. Marine, A. Macchiarulo, F. MorettiAdministrative, technical, or material support (i.e., reporting or organizingdata, constructing databases): M. Pellegrino, R. Luc�aStudy supervision: F. Moretti
AcknowledgmentsThe authors thank Dr. F. Maina for GTL-16 cells, Dr. Cinzia Rinaldo for the
pSuper.retro-ip53 plasmid, and Ada Sacchi for her support.
Grant SupportThis work was supported by grants from Associazione Italiana Ricerca
sul Cancro (AIRC; IG-8825, IG-12767; F. Moretti), Project "FaReBio diQualita" from Italian Ministry of Economy and Finance to the CNR,FIRB RBAP1153LS_007 (A. Pontecorvi), and FIRB B81J10001870008_RBAP10L8TY_003-MD, FP7 European-Grant PAINCAGE, grant: 603191(M. D'Onofrio).
The costs of publication of this articlewere defrayed inpart by the payment ofpage charges. This article must therefore be hereby marked advertisement inaccordance with 18 U.S.C. Section 1734 solely to indicate this fact.
Received February 16, 2015; revised July 10, 2015; accepted July 14, 2015;published OnlineFirst September 10, 2015.
References1. Selivanova G. Wild type p53 reactivation: from lab bench to clinic. FEBS
Lett 2014;588:2628–38.2. Khoo KH, Verma CS, Lane DP. Drugging the p53 pathway: understanding
the route to clinical efficacy. Nat Rev Drug Discov 2014;13:217–36.3. Montes de Oca Luna R, Wagner DS, Lozano G. Rescue of early embryonic
lethality in mdm2-deficient mice by deletion of p53. Nature 1995;378:203–6.
4. Momand J, Zambetti GP, Olson DC, George D, Levine AJ. The mdm-2oncogene product forms a complex with the p53 protein and inhibits p53-mediated transactivation. Cell 1992;69:1237–45.
5. Vassilev LT, Vu BT, Graves B, Carvajal D, Podlaski F, Filipovic Z, et al. In vivoactivation of the p53 pathway by small-molecule antagonists of MDM2.Science 2004;303:844–8.
6. Gudkov AV. Cancer drug discovery: the wisdom of imprecision. Nat Med2004;10:1298–9.
7. Issaeva N, Bozko P, EngeM, ProtopopovaM, Verhoef LG, Masucci M, et al.Small molecule RITA binds to p53, blocks p53-HDM-2 interaction andactivates p53 function in tumors. Nat Med 2004;10:1321–8.
8. Tovar C, Rosinski J, Filipovic Z, Higgins B, Kolinsky K, Hilton H, et al.Small-molecule MDM2 antagonists reveal aberrant p53 signaling incancer: implications for therapy. Proc Natl Acad Sci U S A 2006;103:1888–93.
9. Shvarts A, Steegenga WT, Riteco N, van Laar T, Dekker P, Bazuine M, et al.MDMX: a novel p53-binding protein with some functional properties ofMDM2. EMBO J 1996;15:5349–57.
10. Patton JT, Mayo LD, Singhi AD, Gudkov AV, Stark GR, JacksonMW. Levelsof HdmX expression dictate the sensitivity of normal and transformed cellsto Nutlin-3. Cancer Res 2006;66:3169–76.
11. Wade M, Wong ET, Tang M, Stommel JM, Wahl GM. Hdmxmodulates theoutcome of p53 activation in human tumor cells. J Biol Chem 2006;281:33036–44.
12. Gembarska A, Luciani F, Fedele C, Russell EA, Dewaele M, Villar S, et al.MDM4 is a key therapeutic target in cutaneous melanoma. Nat Med2012;18:1239–47.
13. Popowicz GM, Czarna A, Holak TA. Structure of the humanMdmx proteinbound to the p53 tumor suppressor transactivation domain. Cell Cycle2008;7:2441–3.
14. Macchiarulo A, Giacche N, Carotti A, Baroni M, Cruciani G, Pellicciari R.Targeting the conformational transitions of MDM2 and MDMX: insightsinto dissimilarities and similarities of p53 recognition. J Chem Inf Model2008;48:1999–2009.
15. Joseph TL, Madhumalar A, Brown CJ, Lane DP, Verma CS. Differentialbinding of p53 and nutlin to MDM2 and MDMX: computational studies.Cell Cycle 2010;9:1167–81.
16. Marine JC, Francoz S, Maetens M, Wahl G, Toledo F, Lozano G. Keepingp53 in check: essential and synergistic functions ofMdm2 andMdm4. CellDeath Differ 2006;13:927–34.
17. ChangYS,Graves B,Guerlavais V, TovarC, PackmanK, ToKH, et al. Stapledalpha-helical peptide drug development: a potent dual inhibitor ofMDM2and MDMX for p53-dependent cancer therapy. Proc Natl Acad Sci U S A2013;110:E3445–54.
18. Kawai H, Lopez-Pajares V, Kim MM, Wiederschain D, Yuan ZM. RINGdomain-mediated interaction is a requirement for MDM2's E3 ligaseactivity. Cancer Res 2007;67:6026–30.
19. Linke K, Mace PD, Smith CA, Vaux DL, Silke J, Day CL. Structure of theMDM2/MDMX RING domain heterodimer reveals dimerization isrequired for their ubiquitylation in trans. Cell Death Differ 2008;15:841–8.
20. Tollini LA, Jin A, Park J, Zhang Y. Regulation of p53 by Mdm2 E3 ligasefunction is dispensable in embryogenesis and development, but essentialin response to DNA damage. Cancer Cell 2014;26:235–47.
21. Tang Y, Zhao W, Chen Y, Zhao Y, Gu W. Acetylation is indispensable forp53 activation. Cell 2008;133:612–26.
22. Pant V, Xiong S, Iwakuma T, Quintas-Cardama A, Lozano G. Heterodi-merizationofMdm2andMdm4 is critical for regulating p53activity duringembryogenesis but dispensable for p53 and Mdm2 stability. Proc NatlAcad Sci U S A 2011;108:11995–2000.
23. Huang L, Yan Z, Liao X, Li Y, Yang J, Wang ZG, et al. The p53 inhibitorsMDM2/MDMX complex is required for control of p53 activity in vivo. ProcNatl Acad Sci U S A 2011;108:12001–6.
24. Poyurovsky MV, Priest C, Kentsis A, Borden KL, Pan ZQ, Pavletich N,et al. The Mdm2 RING domain C-terminus is required for supra-molecular assembly and ubiquitin ligase activity. EMBO J 2007;26:90–101.
Targeting MDM2/MDM4 Interaction for p53 Reactivation
www.aacrjournals.org Cancer Res; 75(21) November 1, 2015 4571
on February 2, 2018. © 2015 American Association for Cancer Research. cancerres.aacrjournals.org Downloaded from
Published OnlineFirst September 10, 2015; DOI: 10.1158/0008-5472.CAN-15-0439
25. Uldrijan S, Pannekoek WJ, Vousden KH. An essential function of theextreme C-terminus of MDM2 can be provided by MDMX. EMBO J 2007;26:102–12.
26. Kr€autler V, van Gunsteren WF, H€unenberger PH. A fast SHAKE algorithmto solve distance constraint equations for small molecules in moleculardynamics simulations. J Comput Chem 2001;22:501–08.
27. 2015 Home - Ingenuity. <http://www.ingenuity.com/>.28. Tanimura S, Ohtsuka S, Mitsui K, Shirouzu K, Yoshimura A, Ohtsubo M.
MDM2 interacts with MDMX through their RING finger domains. FEBSLett 1999;447:5–9.
29. Singh RK, Iyappan S, Scheffner M. Hetero-oligomerization with MdmXrescues the ubiquitin/Nedd8 ligase activity of RING finger mutants ofMdm2. J Biol Chem 2007;282:10901–7.
30. Wade M, Li YC, Matani AS, Braun SM, Milanesi F, Rodewald LW, et al.Functional analysis and consequences of Mdm2 E3 ligase inhibition inhuman tumor cells. Oncogene 2012;31:4789–97.
31. Egorova O, Sheng Y. A site-directed mutagenesis study of the MdmX RINGdomain. Biochem Biophys Res Commun 2014;447:696–701.
32. Lijnzaad P, Argos P. Hydrophobic patches on protein subunit interfaces:characteristics and prediction. Proteins 1997;28:333–43.
33. Walsh JG, Cullen SP, Sheridan C, Luthi AU, Gerner C, Martin SJ. Execu-tioner caspase-3 and caspase-7 are functionally distinct proteases. ProcNatlAcad Sci U S A 2008;105:12815–9.
34. Menendez D, Inga A, Resnick MA. The expanding universe of p53 targets.Nat Rev Cancer 2009;9:724–37.
35. Hur J, Bell DW, Dean KL, Coser KR, Hilario PC, Okimoto RA, et al.Regulation of expression of BIK proapoptotic protein in human breastcancer cells: p53-dependent induction of BIK mRNA by fulvestrantand proteasomal degradation of BIK protein. Cancer Res 2006;66:10153–61.
36. Polyak K, Xia Y, Zweier JL, Kinzler KW, Vogelstein B. A model for p53-induced apoptosis. Nature 1997;389:300–5.
37. Bodet L, Menoret E, Descamps G, Pellat-Deceunynck C, Bataille R, LeGouill S, et al. BH3-only protein Bik is involved in both apoptosisinduction and sensitivity to oxidative stress in multiple myeloma. Br JCancer 2010;103:1808–14.
38. Minsky N, Oren M. The RING domain of Mdm2 mediates histone ubi-quitylation and transcriptional repression. Mol Cell 2004;16:631–9.
39. Zhu Y, Regunath K, Jacq X, Prives C. Cisplatin causes cell death via TAB1regulation of p53/MDM2/MDMX circuitry. Genes Dev 2013;27:1739–51.
40. Mancini F,Moretti F.MitochondrialMDM4(MDMX)Anunpredicted role inthe p53-mediated intrinsic apoptotic pathway. Cell Cycle 2009;8:3854–59.
41. Mancini F, Pieroni L, Monteleone V, Luc�a R, Fici L, Luca E, et al. MDM4/HIPK2/p53 cytoplasmic assembly uncovers coordinated repression ofmolecules with anti-apoptotic activity during early DNA damage response.Oncogene 2015 May 11. [Epub ahead of print].
42. ShiY,NikulenkovF, Zawacka-Pankau J, LiH,GabdoullineR,Xu J, et al. ROS-dependent activation of JNK converts p53 into an efficient inhibitor ofoncogenes leading to robust apoptosis. Cell Death Differ 2014;21:612–23.
43. Green DR, Galluzzi L, Kroemer G. Cell biology. Metabolic control of celldeath. Science 2014;345:1250256.
44. Trachootham D, Alexandre J, Huang P. Targeting cancer cells by ROS-mediated mechanisms: a radical therapeutic approach? Nat Rev DrugDiscov 2009;8:579–91.
45. Hedstrom E, Eriksson S, Zawacka-Pankau J, Arner ES, Selivanova G. p53-dependent inhibition of TrxR1 contributes to the tumor-specific inductionof apoptosis by RITA. Cell Cycle 2009;8:3584–91.
46. Ray-Coquard I, Blay JY, Italiano A, Le Cesne A, Penel N, Zhi J, et al. Effect ofthe MDM2 antagonist RG7112 on the P53 pathway in patients withMDM2-amplified, well-differentiated or dedifferentiated liposarcoma: anexploratory proof-of-mechanism study. Lancet Oncol 2012;13:1133–40.
47. Iancu-Rubin C, Mosoyan G, Glenn K, Gordon RE, Nichols GL, Hoffman R.Activation of p53 by the MDM2 inhibitor RG7112 impairs thrombopoi-esis. Exp Hematol 2014;42:137–45.
48. Wu D, Gao Y, Qi Y, Chen L, Ma Y, Li Y. Peptide-based cancer therapy:opportunity and challenge. Cancer Lett 2014;351:13–22.
49. Yang Y, Ludwig RL, Jensen JP, Pierre SA, Medaglia MV, Davydov IV, et al.Small molecule inhibitors of HDM2 ubiquitin ligase activity stabilize andactivate p53 in cells. Cancer Cell 2005;7:547–59.
50. Herman AG, Hayano M, Poyurovsky MV, Shimada K, Skouta R, Prives C,et al. Discovery of Mdm2-MdmX E3 ligase inhibitors using a cell-basedubiquitination assay. Cancer Discov 2011;1:312–25.
Cancer Res; 75(21) November 1, 2015 Cancer Research4572
Pellegrino et al.
on February 2, 2018. © 2015 American Association for Cancer Research. cancerres.aacrjournals.org Downloaded from
Published OnlineFirst September 10, 2015; DOI: 10.1158/0008-5472.CAN-15-0439
2015;75:4560-4572. Published OnlineFirst September 10, 2015.Cancer Res Marsha Pellegrino, Francesca Mancini, Rossella Lucà, et al. Approach for p53 Reactivation TherapyTargeting the MDM2/MDM4 Interaction Interface as a Promising
Updated version
10.1158/0008-5472.CAN-15-0439doi:
Access the most recent version of this article at:
Material
Supplementary
http://cancerres.aacrjournals.org/content/suppl/2015/09/10/0008-5472.CAN-15-0439.DC1
Access the most recent supplemental material at:
Cited articles
http://cancerres.aacrjournals.org/content/75/21/4560.full#ref-list-1
This article cites 48 articles, 16 of which you can access for free at:
Citing articles
http://cancerres.aacrjournals.org/content/75/21/4560.full#related-urls
This article has been cited by 1 HighWire-hosted articles. Access the articles at:
E-mail alerts related to this article or journal.Sign up to receive free email-alerts
Subscriptions
Reprints and
To order reprints of this article or to subscribe to the journal, contact the AACR Publications Department at
Permissions
Rightslink site. Click on "Request Permissions" which will take you to the Copyright Clearance Center's (CCC)
.http://cancerres.aacrjournals.org/content/75/21/4560To request permission to re-use all or part of this article, use this link
on February 2, 2018. © 2015 American Association for Cancer Research. cancerres.aacrjournals.org Downloaded from
Published OnlineFirst September 10, 2015; DOI: 10.1158/0008-5472.CAN-15-0439


![Evolution of the p53-MDM2 pathway1158898/FULLTEXT01.pdf · ation [9]. In vertebrates, MDM2 belongs to a family with two members, MDM2 and MDM4. To date, members of the p53/p63/p73](https://img.pdfslide.us/doc/110x75/5e6a22570899fb6605504c19/evolution-of-the-p53-mdm2-1158898fulltext01pdf-ation-9-in-vertebrates-mdm2.jpg)