Embed Size (px)
Citation preview
TargetingTax Credit
Outreach
Tax Credit Train-the-Trainer SeminarCenter on Budget and Policy Priorities
Steve Holt, HoltSolutionsSeptember 24, 2013
HoltSolutions 2
Three Outreach Goals
1)Battling the high cost of getting a refund
2)Maximizing take-up of the EITC
3)Facilitating universal health insurance coverage
9/24/13
HoltSolutions 3
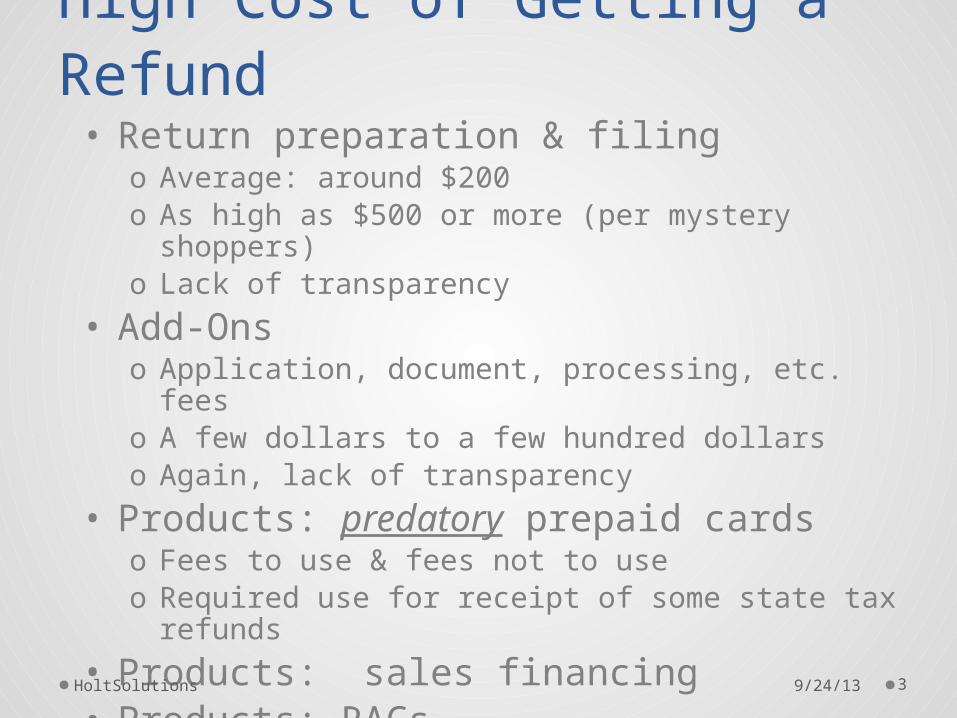
High Cost of Getting a Refund
• Return preparation & filingo Average: around $200o As high as $500 or more (per mystery shoppers)o Lack of transparency
• Add-Onso Application, document, processing, etc. feeso A few dollars to a few hundred dollarso Again, lack of transparency
• Products: predatory prepaid cardso Fees to use & fees not to useo Required use for receipt of some state tax refunds
• Products: sales financing• Products: RACs
9/24/13
HoltSolutions 4
Refund Anticipation Checks (RAC)
• One-time bank account for receipt of refund & issuance of check
• No faster than direct deposit
• BUT provide way to pay for return preparation without upfront cash
• SO a high-cost, short-term preparation fee loan
• ~$30 each, but $438M total in 2010
• Now the default commercial product
9/24/13
HoltSolutions 5
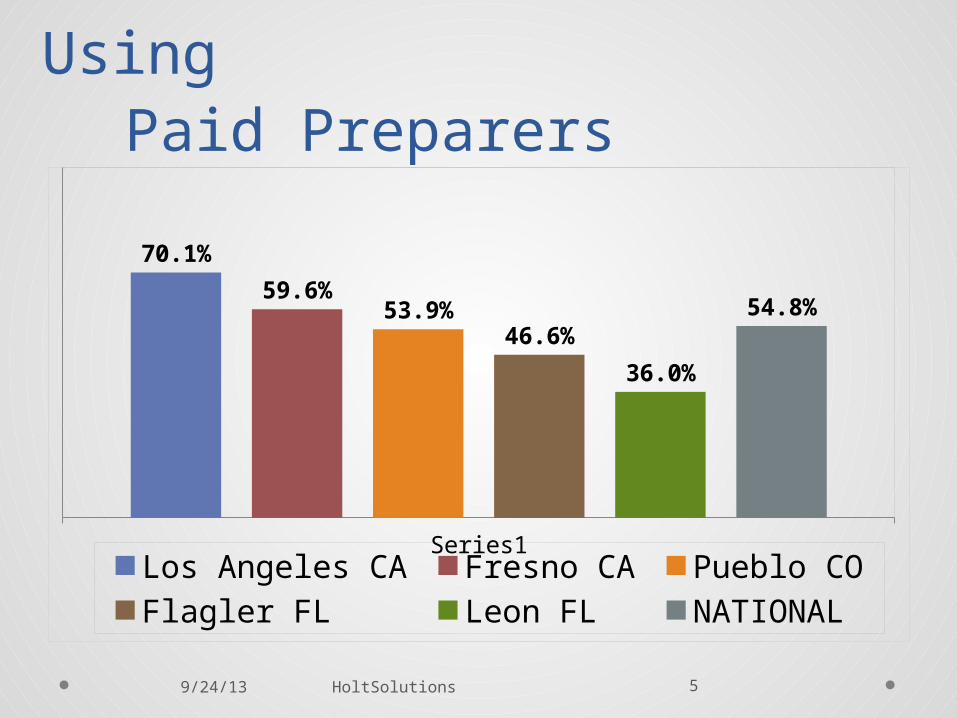
Share of All Tax Filers Using Paid Preparers
Series1
70.1%
59.6%53.9%
46.6%
36.0%
54.8%
Los Angeles CA Fresno CA Pueblo COFlagler FL Leon FL NATIONAL
9/24/13
HoltSolutions 6
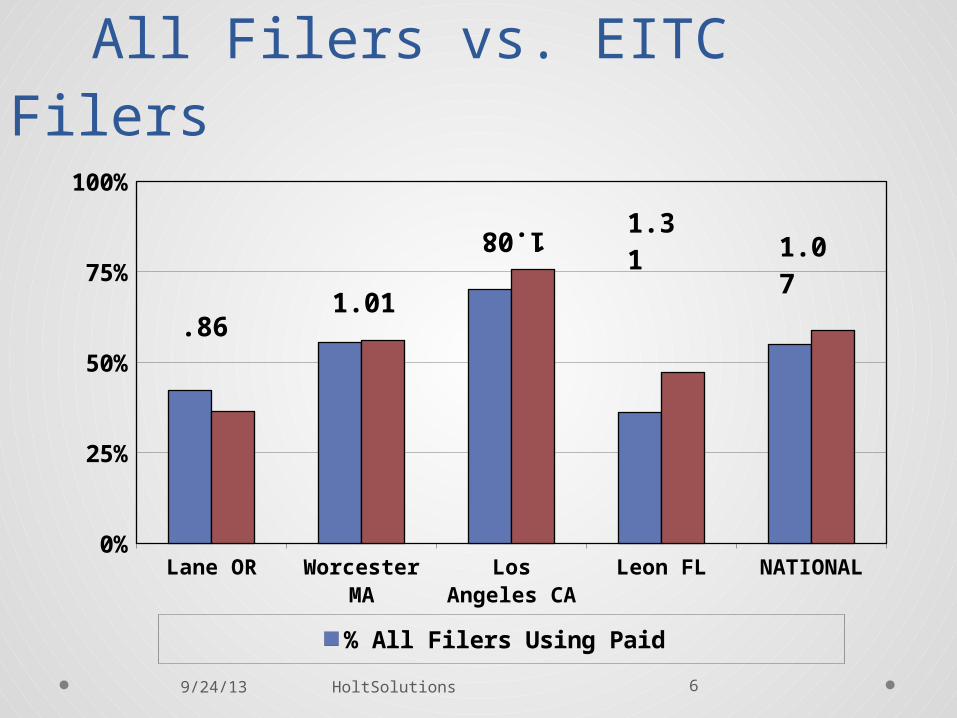
Use of Paid Preparers – All Filers vs. EITC Filers
Lane OR Worcester MA Los Angeles CA
Leon FL NATIONAL0%
25%
50%
75%
100%
% All Filers Using Paid % EITC Filers Users Paid
.861.01
1.08 1.311.07
9/24/13
HoltSolutions 7
Getting Your Refund – The Outreach Message
• Returns prepared free at VITA sites
• Self-preparation alternatives
• Direct deposit (including split refunds)
• Be a smart consumero Shop around
oAsk questions
o Insist on responsible behavior9/24/13
HoltSolutions 8
Maximizing EITC Take-Up: Tools
1) Understanding the EITC population
2) Participation rates & who’s not claiming
3) Outreach focus & targeting
4) Data & benchmarking
5) Setting incremental campaign targets
9/24/13
HoltSolutions 9
Basic EITC Statistics
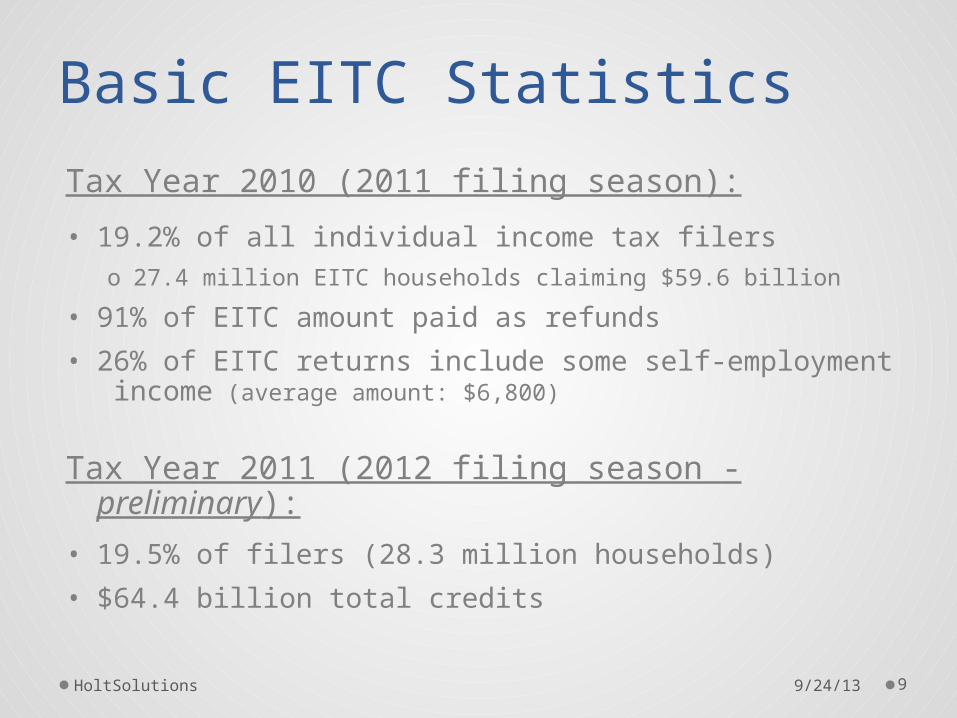
Tax Year 2010 (2011 filing season):
• 19.2% of all individual income tax filerso 27.4 million EITC households claiming $59.6 billion
• 91% of EITC amount paid as refunds
• 26% of EITC returns include some self-employment income (average amount: $6,800)
Tax Year 2011 (2012 filing season - preliminary):
• 19.5% of filers (28.3 million households)
• $64.4 billion total credits
9/24/13
HoltSolutions 10
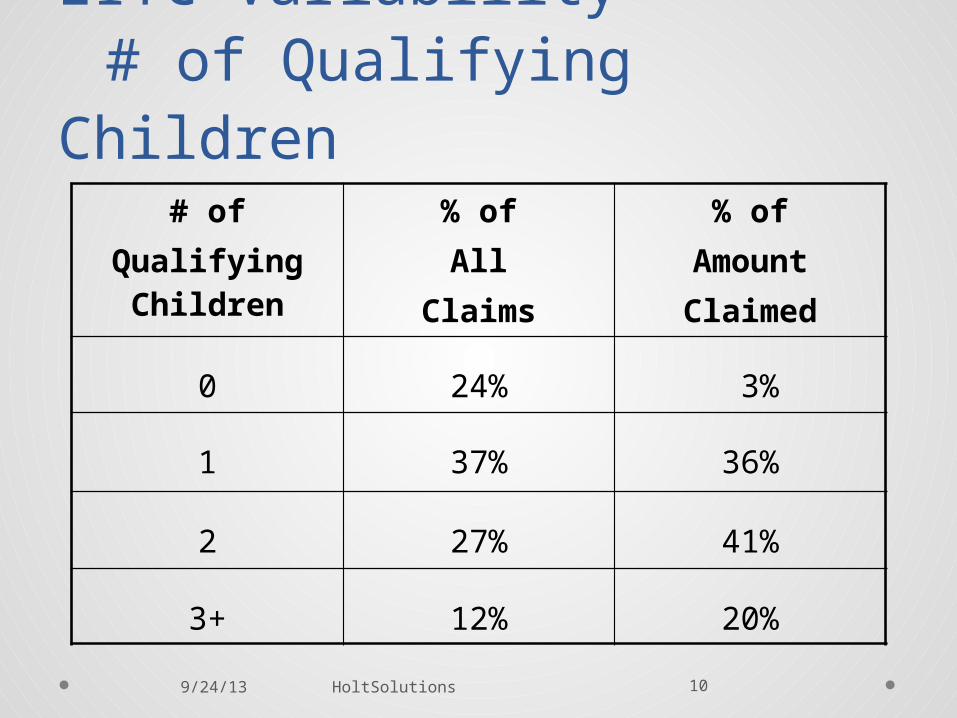
EITC Variability – # of Qualifying
Children# of
Qualifying Children
% ofAll
Claims
% ofAmountClaimed
0 24% 3%
1 37% 36%
2 27% 41%
3+ 12% 20%
9/24/13
HoltSolutions 11
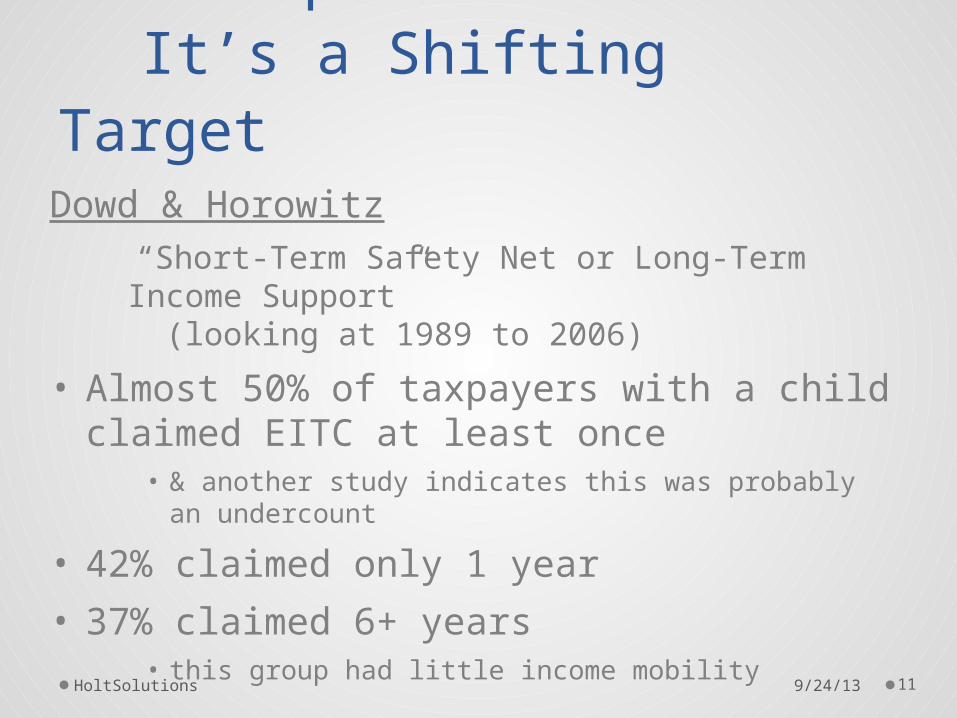
EITC Population – It’s a Shifting Target
Dowd & Horowitz “Short-Term Safety Net or Long-Term Income
Support” (looking at 1989 to 2006)
• Almost 50% of taxpayers with a child claimed EITC at least once
• & another study indicates this was probably an undercount
• 42% claimed only 1 year
• 37% claimed 6+ years• this group had little income mobility
9/24/13
HoltSolutions 12
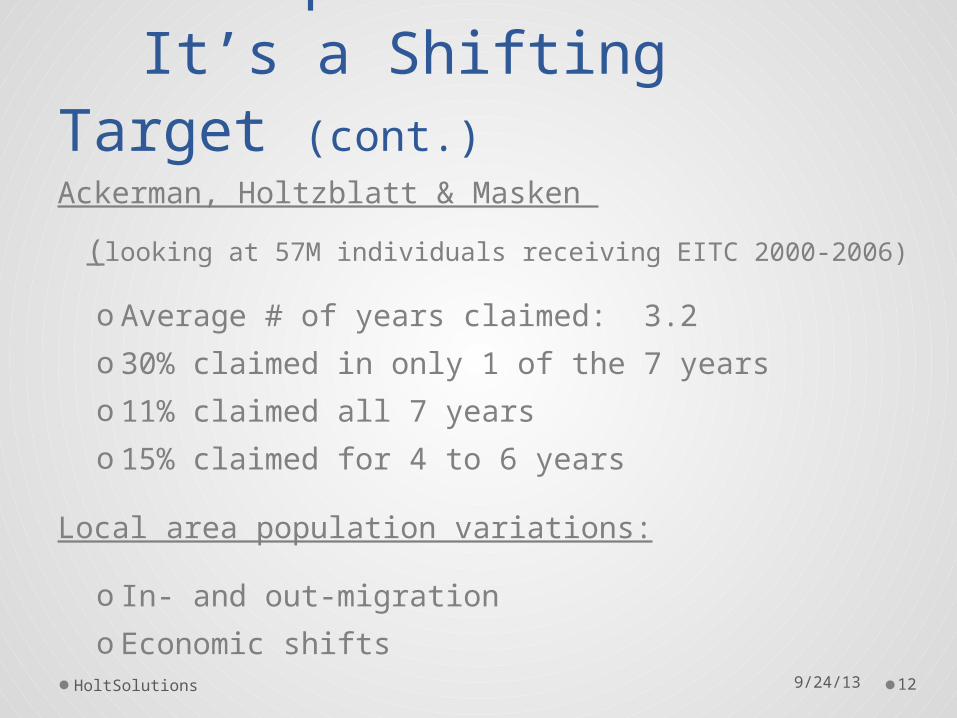
EITC Population – It’s a Shifting Target
(cont.)Ackerman, Holtzblatt & Masken
(looking at 57M individuals receiving EITC 2000-2006)
o Average # of years claimed: 3.2o 30% claimed in only 1 of the 7 yearso 11% claimed all 7 yearso 15% claimed for 4 to 6 years
Local area population variations:
o In- and out-migrationo Economic shifts
9/24/13
HoltSolutions 13
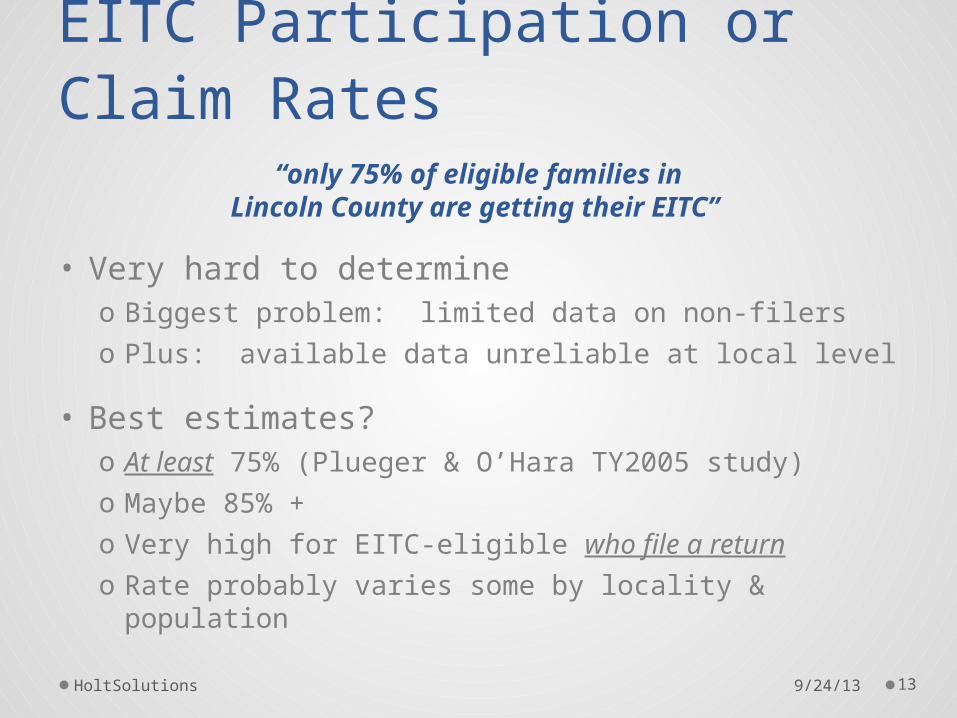
EITC Participation or Claim Rates
“only 75% of eligible families inLincoln County are getting their EITC”
• Very hard to determineo Biggest problem: limited data on non-filerso Plus: available data unreliable at local level
• Best estimates?o At least 75% (Plueger & O’Hara TY2005 study)o Maybe 85% +o Very high for EITC-eligible who file a returno Rate probably varies some by locality & population
9/24/13
HoltSolutions 14
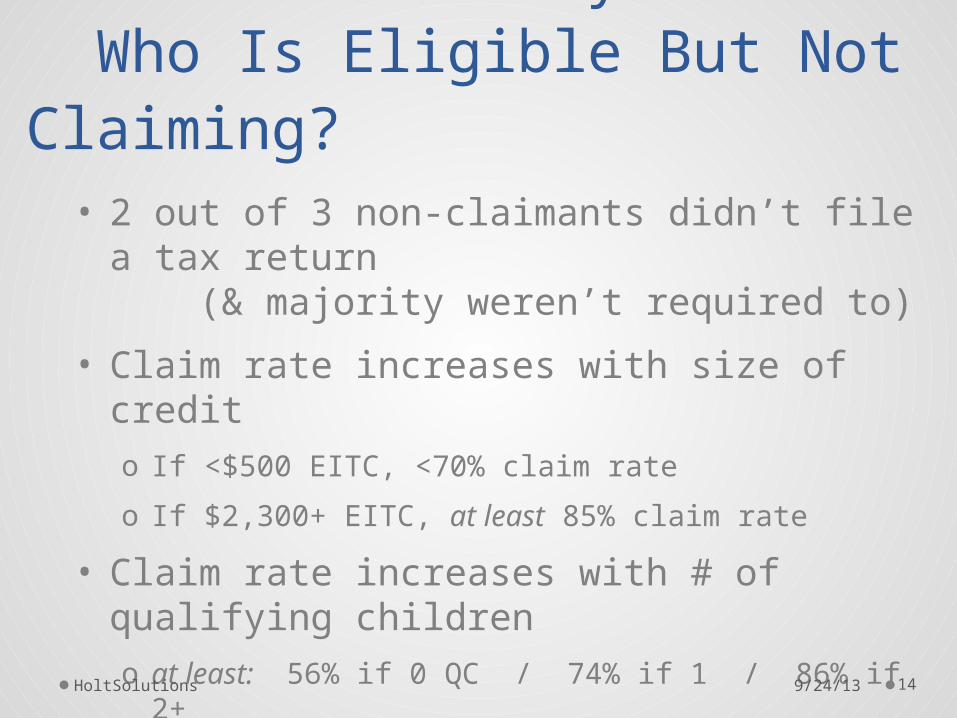
EITC TY2005 Study – Who Is Eligible But Not Claiming?
• 2 out of 3 non-claimants didn’t file a tax return (& majority weren’t required to)
• Claim rate increases with size of credito If <$500 EITC, <70% claim rate
o If $2,300+ EITC, at least 85% claim rate
• Claim rate increases with # of qualifying childreno at least: 56% if 0 QC / 74% if 1 / 86% if 2+
• Lower claim rate in states without income tax ?
9/24/13
HoltSolutions 15
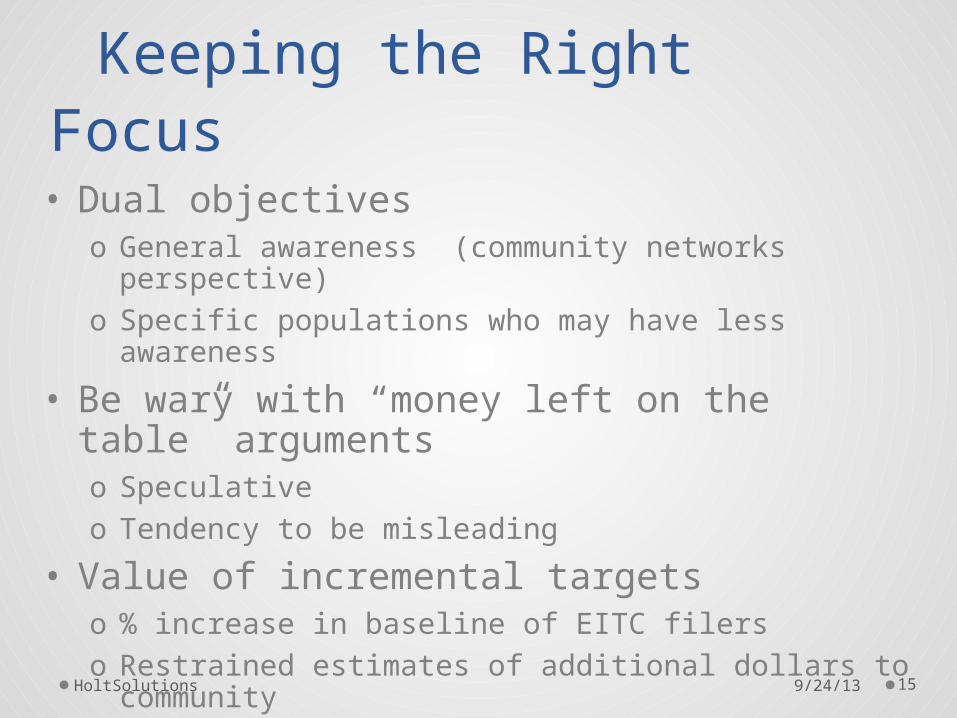
EITC Outreach – Keeping the Right Focus
• Dual objectiveso General awareness (community networks
perspective)o Specific populations who may have less awareness
• Be wary with “money left on the table” argumentso Speculativeo Tendency to be misleading
• Value of incremental targetso % increase in baseline of EITC filerso Restrained estimates of additional dollars to
communityo Underscore variability in population
9/24/13
HoltSolutions 16
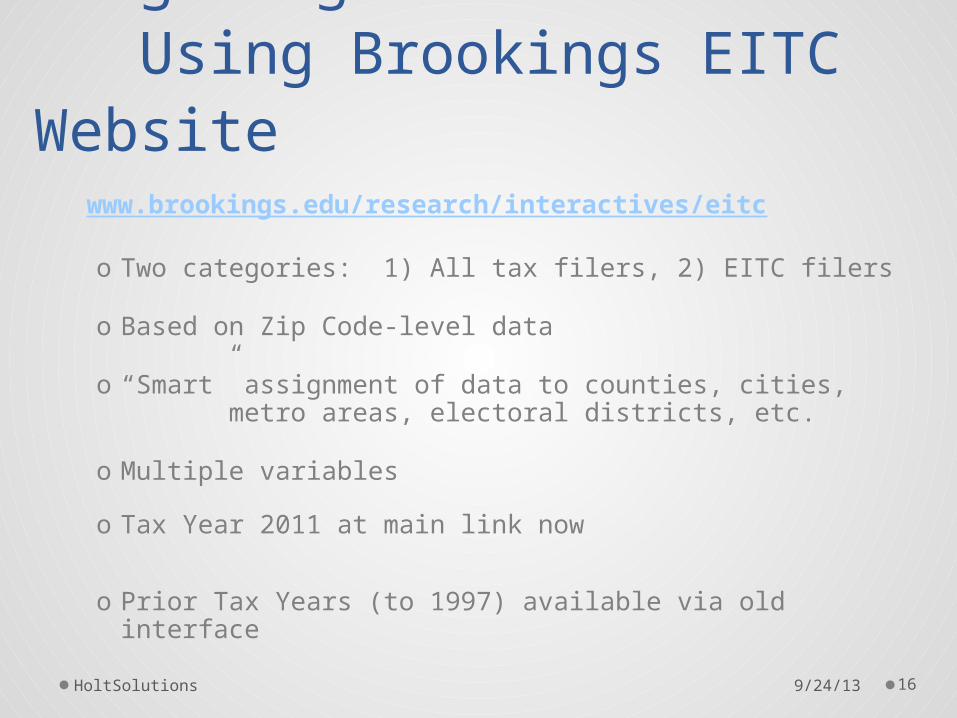
EITC Benchmarking & Targeting – Using Brookings EITC Website
www.brookings.edu/research/interactives/eitc
o Two categories: 1) All tax filers, 2) EITC filers
o Based on Zip Code-level data
o “Smart” assignment of data to counties, cities, metro areas, electoral districts, etc.
o Multiple variables
o Tax Year 2011 at main link now
o Prior Tax Years (to 1997) available via old interface 9/24/13
HoltSolutions 17
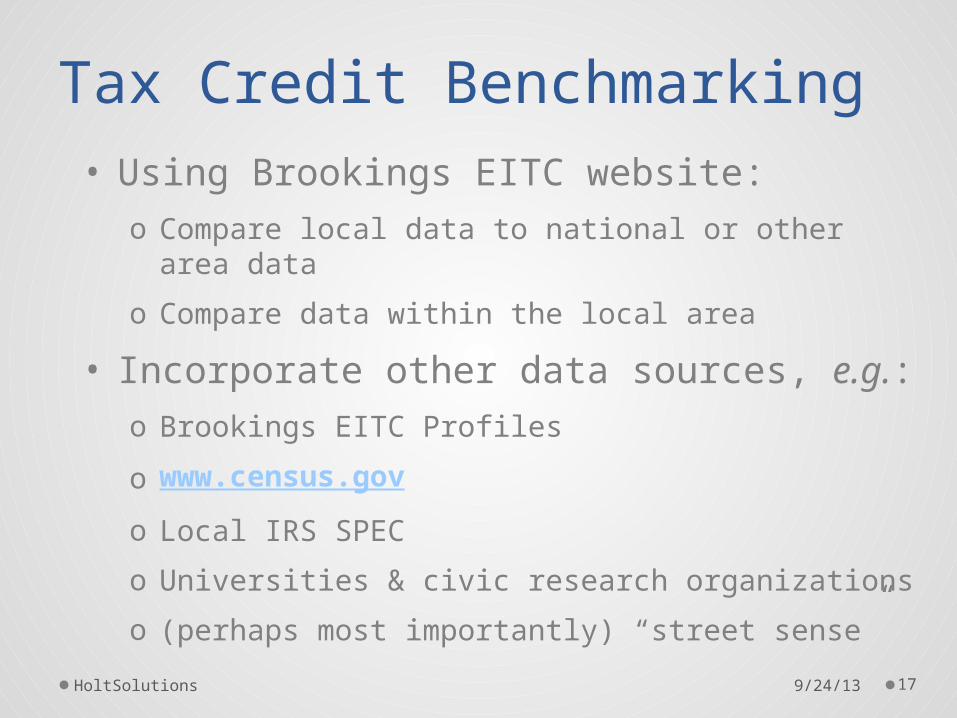
Tax Credit Benchmarking• Using Brookings EITC website:
o Compare local data to national or other area data
o Compare data within the local area
• Incorporate other data sources, e.g.:o Brookings EITC Profiles
o www.census.gov
o Local IRS SPEC
o Universities & civic research organizations
o (perhaps most importantly) “street sense”
9/24/13
HoltSolutions 18
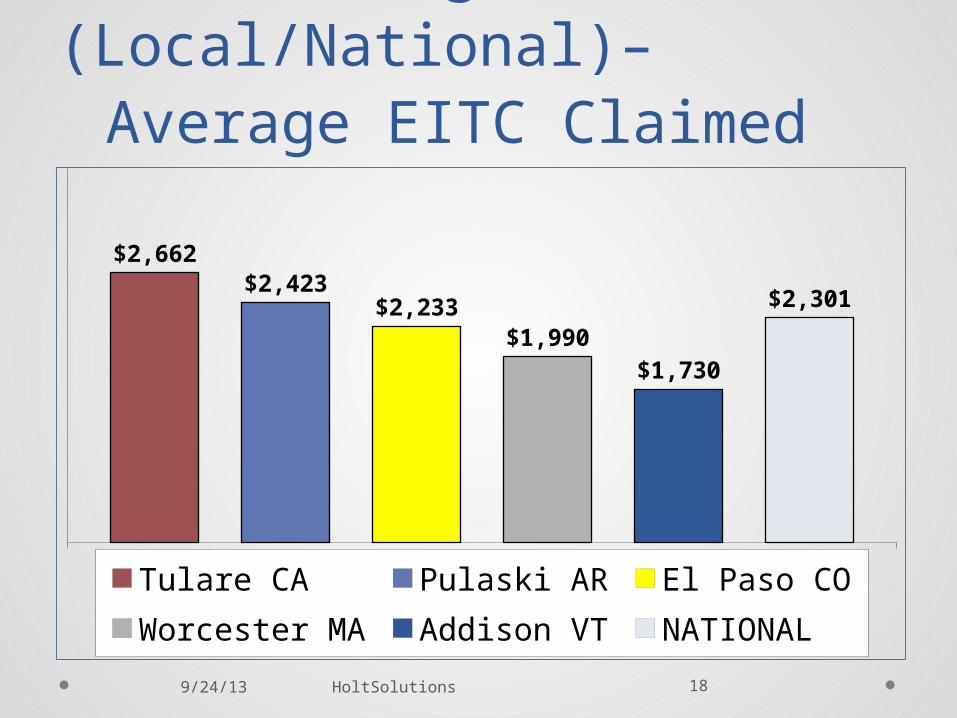
Benchmarking (Local/National)–
Average EITC Claimed
Series1
$2,662$2,423
$2,233$1,990
$1,730
$2,301
Tulare CA Pulaski AR El Paso CO
Worcester MA Addison VT NATIONAL
9/24/13
HoltSolutions 19
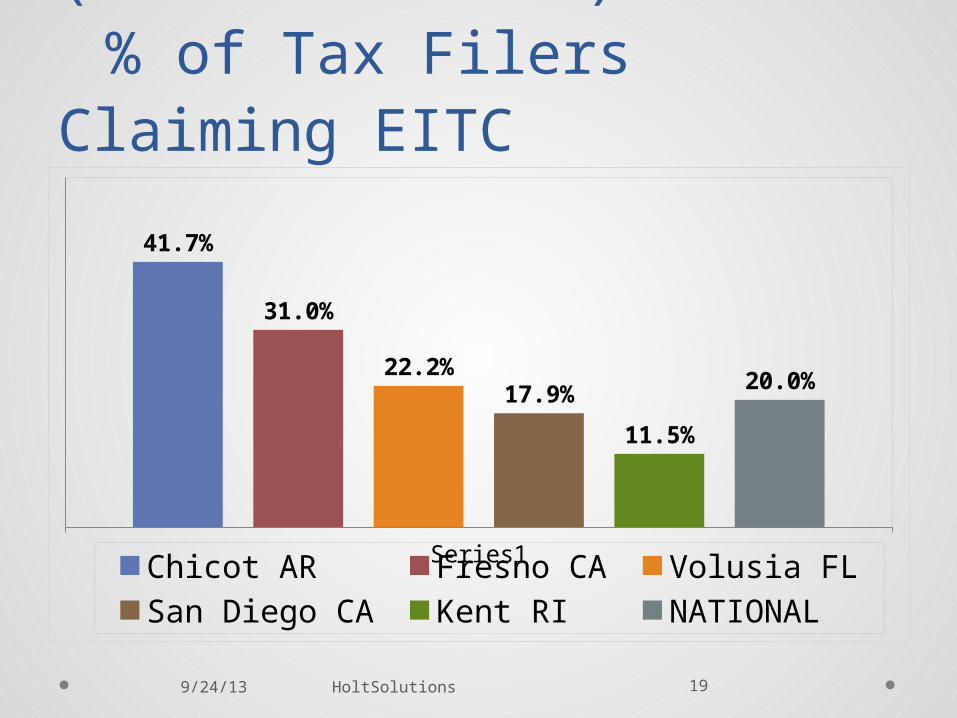
Benchmarking (Local/National)–
% of Tax Filers Claiming EITC
Series1
41.7%
31.0%
22.2%17.9%
11.5%
20.0%
Chicot AR Fresno CA Volusia FLSan Diego CA Kent RI NATIONAL
9/24/13
HoltSolutions 20
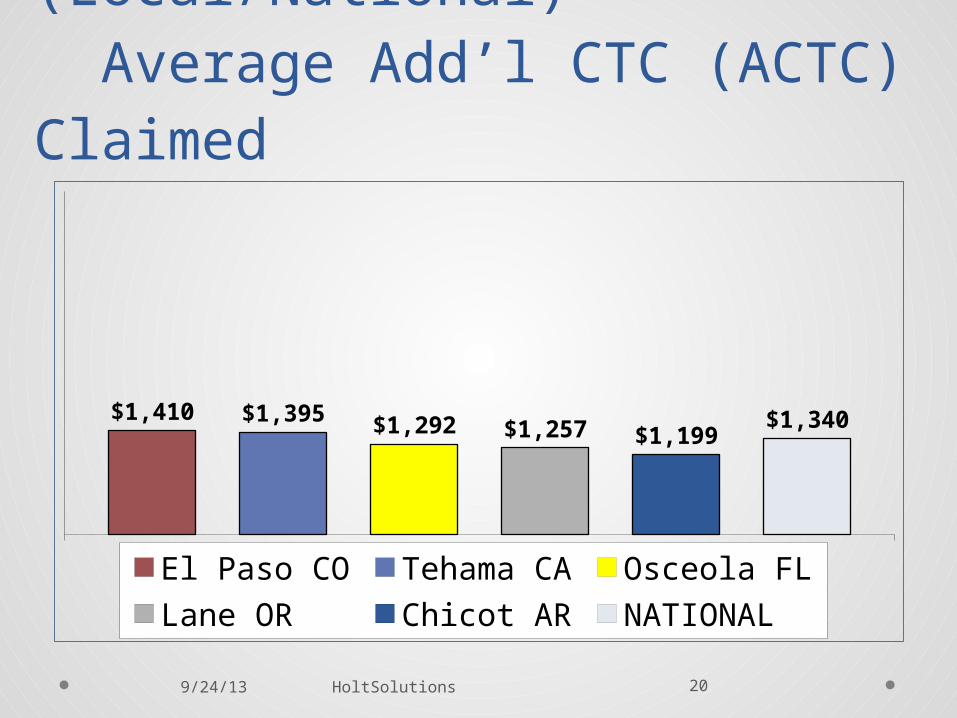
Benchmarking (Local/National)–
Average Add’l CTC (ACTC) Claimed
Series1
$1,410 $1,395 $1,292 $1,257 $1,199$1,340
El Paso CO Tehama CA Osceola FLLane OR Chicot AR NATIONAL
9/24/13
HoltSolutions 21
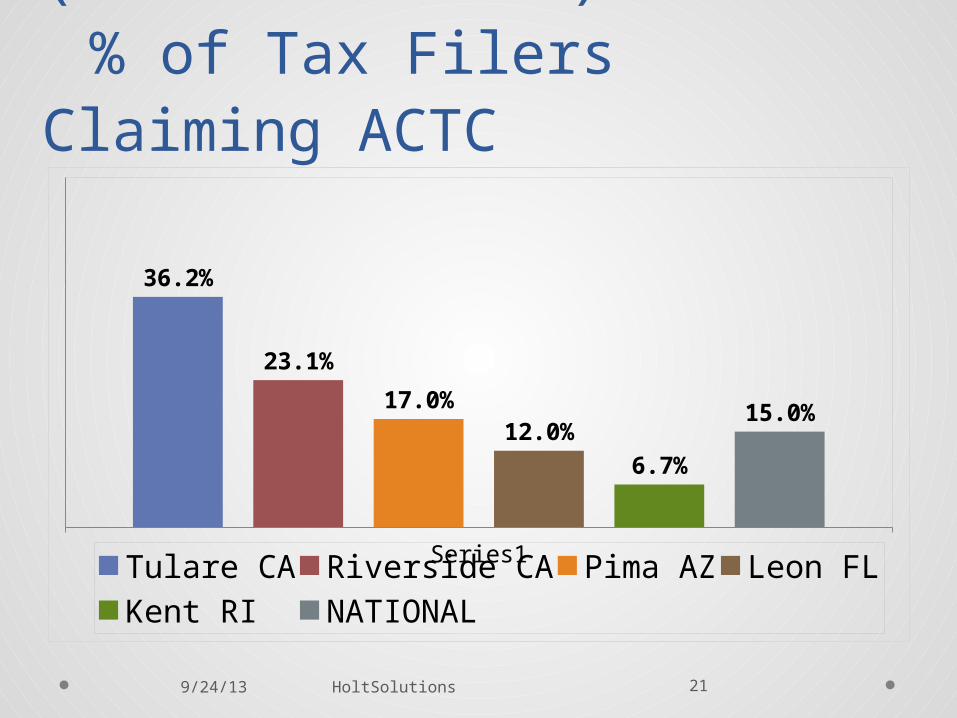
Benchmarking (Local/National)–
% of Tax Filers Claiming ACTC
Series1
36.2%
23.1%
17.0%12.0%
6.7%
15.0%
Tulare CA Riverside CA Pima AZ Leon FLKent RI NATIONAL
9/24/13
HoltSolutions 22
Benchmarking Tool – A Proxy for Participation Rates• Brookings website data includes AGI groupings
o # of taxpayers in $5,000 increments
• $0 - $5,000, $5,000 - $10,000, etc.
o Can use to show size of low-income filing population
• Determine filing % below $30,000 (low-income)
• Compare to % claiming EITC
• Calculate ratio of EITC % to low-income %
• Use for possible insights into participation
9/24/13
HoltSolutions 23
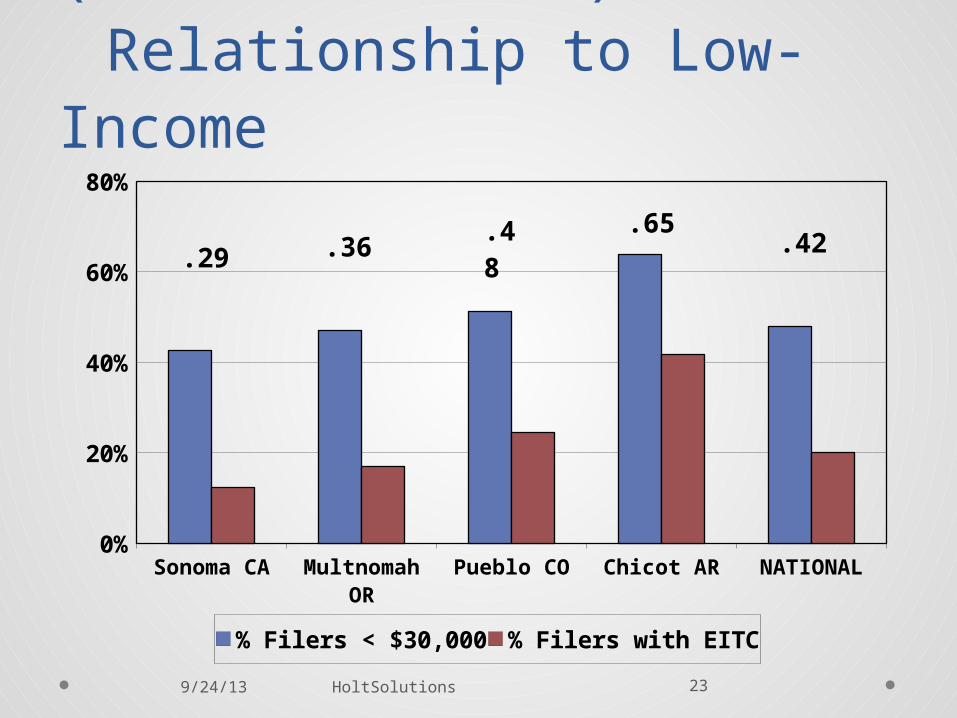
Benchmarking (Local/National) –
Relationship to Low-Income
Sonoma CA Multnomah OR
Pueblo CO Chicot AR NATIONAL0%
20%
40%
60%
80%
% Filers < $30,000 % Filers with EITC
.29 .36.48 .65
.42
9/24/13
HoltSolutions 24
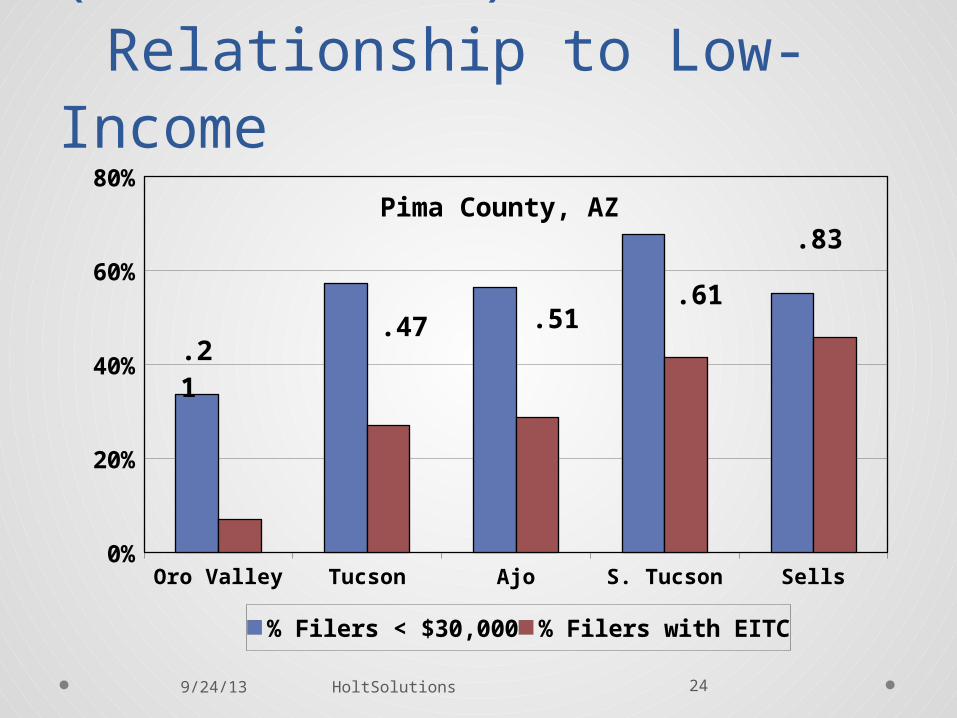
Benchmarking (Local/Local) –
Relationship to Low-Income
Oro Valley Tucson Ajo S. Tucson Sells0%
20%
40%
60%
80%
% Filers < $30,000 % Filers with EITC
.21.47 .51
.83Pima County, AZ
.61
9/24/13
HoltSolutions 25
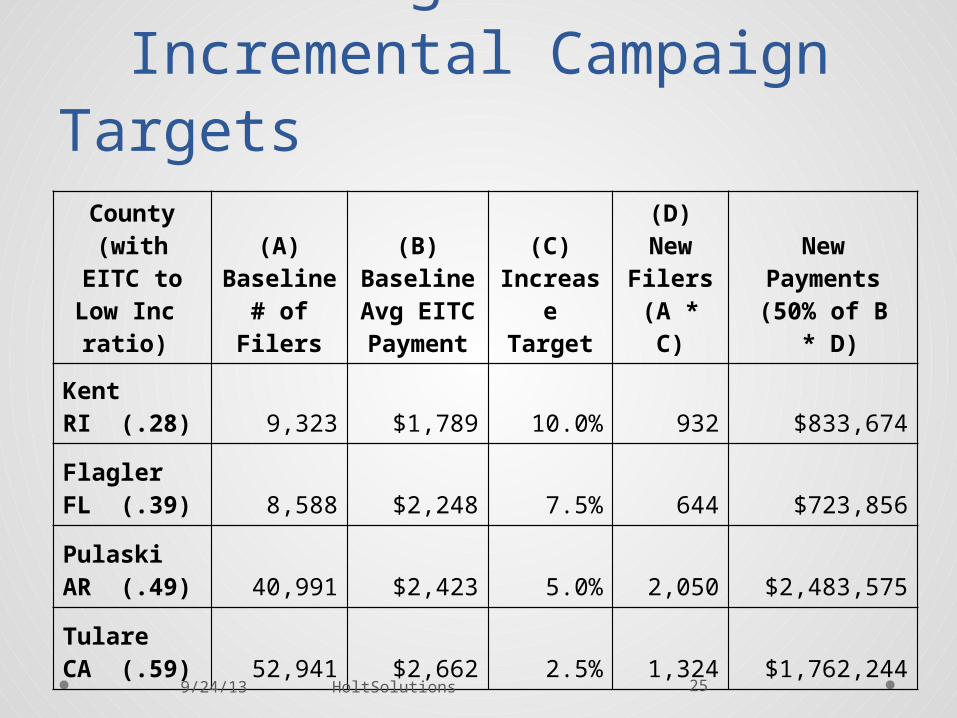
EITC – Examples of Calculating Incremental Campaign Targets
County (with EITC to Low Inc
ratio)
(A)Baseline
# of Filers
(B)Baseline Avg EITC Payment
(C)Increas
e Target
(D)New Filers(A * C)
NewPayments(50% of B
* D)
KentRI (.28) 9,323 $1,789 10.0% 932 $833,674
FlaglerFL (.39) 8,588 $2,248 7.5% 644 $723,856
PulaskiAR (.49) 40,991 $2,423 5.0% 2,050 $2,483,575
TulareCA (.59) 52,941 $2,662 2.5% 1,324 $1,762,244
9/24/13
HoltSolutions 26
Health Insurance Coverage –the Affordable Care Act
(ACA)• Employer coverage
• Medicaid / CHIPo Expansion states
o Non-expansion states
• Marketplaces (state-by-state)o State-run
o Federally-facilitated
o Federal/state partnership
9/24/13
HoltSolutions 27
Key Considerations for ACA Categories of Coverage
• Employer coverageo Adequate
o Affordable
• Medicaido 133% (138%) of federal poverty line (FPL)
o Patchwork eligibility in non-expansion states
• Marketplaceso Premium Tax Credit (100% to 400% of FPL)
o Cost-sharing subsidies
o Bronze, Silver, Gold, Platinum insurance plans9/24/13
HoltSolutions 28
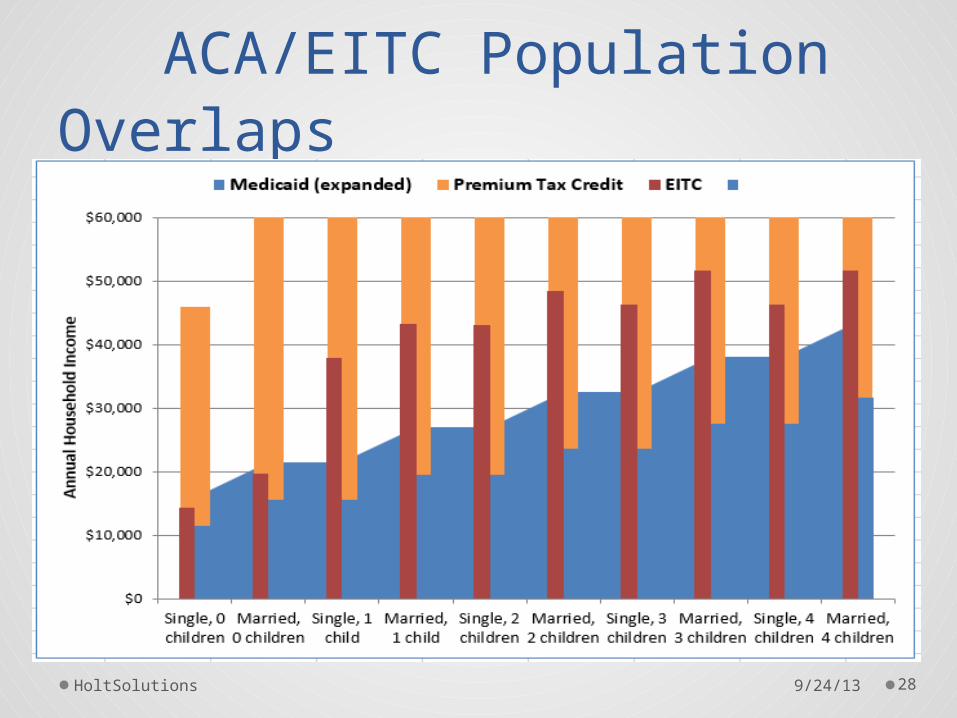
Tax Credit Outreach – ACA/EITC Population Overlaps
9/24/13
HoltSolutions 29
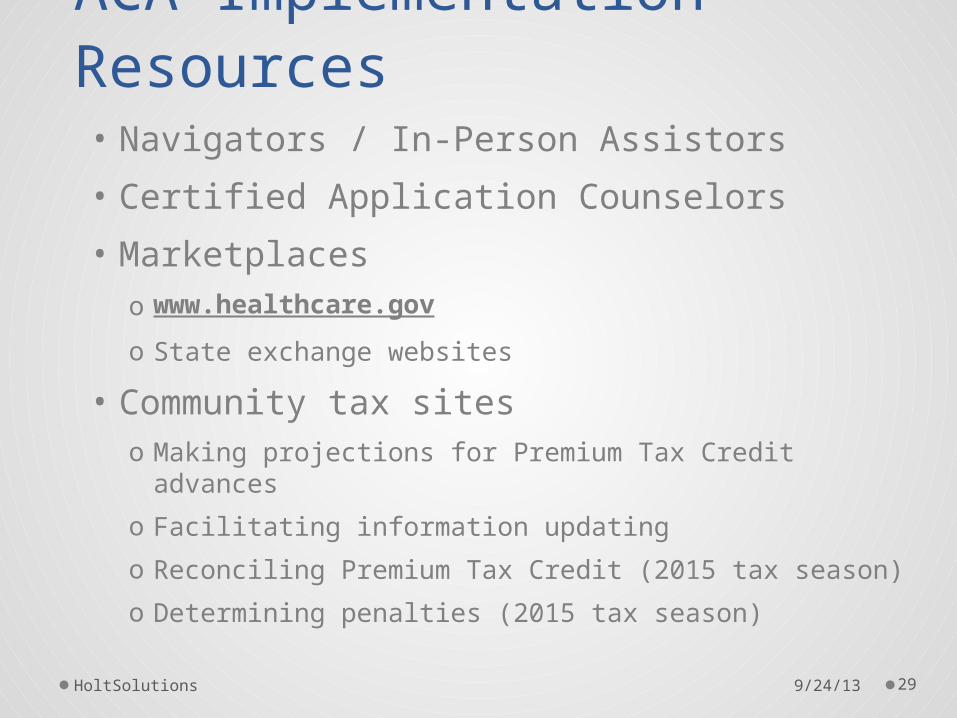
ACA Implementation Resources• Navigators / In-Person Assistors
• Certified Application Counselors
• Marketplaceso www.healthcare.gov
o State exchange websites
• Community tax siteso Making projections for Premium Tax Credit
advances
o Facilitating information updating
o Reconciling Premium Tax Credit (2015 tax season)
o Determining penalties (2015 tax season)9/24/13
HoltSolutions 30
Targeting Tax Credit Outreach
Contact information:
Steve HoltHoltSolutions3415 North 55th StreetMilwaukee, WI 53216(414) [email protected]
9/24/13