Embed Size (px)
Citation preview
NREL is a national laboratory of the U.S. Department of Energy, Office of Energy Efficiency and Renewable Energy, operated by the Alliance for Sustainable Energy, LLC.
Targeting Net Zero Energy for Military Installations
Venue: WREF 2012
Presenter: Kari Burman
Date: May 14, 2012

2
Overview
• A net zero energy installation (NZEI) is one that produces as much energy from on-site renewable sources as it consumes
• NZEI assessment provides a systematic approach to energy projects
• Analysis includes efficiency, renewables, transportation, and grid
• Goal of analysis is to lead to project implementation
• Full Report for MCBH-Kaneohe Bay: Targeting Net Zero Energy at Marine Corps Base Kaneohe Bay, Hawaii: Assessment
and Recommendations http://www.nrel.gov/docs/fy12osti/52897.pdf

3
Assessment Outline
• Baseline o Current energy consumption
• Energy Efficiency Measures o Retrofit improvement potential o New construction design
improvement and optimization
• Renewable Energy o Deployment of renewable energy
• Transportation o Reduce and replace fossil fuel use
• Electrical Systems o Interconnection and microgrid
• Implementation o Savings & Utility Contracts o Enhanced Use Lease
Typical
Community
Option 0Energy Efficiency
and Energy
Demand Reduction
En
erg
y L
oa
d (
$ o
r b
tu o
r C
O2)
buildings
vehicles
industry
Maximize
efficiency,
minimize
demand
Renewable
Option 1
Renewable
Option 2
Renewable
Option 3
Some combination
of options 1, 2 & 3
meet remaining load

Marine Corps Base Hawaii-Kaneohe Bay
Targeting Net Zero Energy at Marine Corps Base Kaneohe Bay, Hawaii: Assessment and Recommendations
http://www.nrel.gov/docs/fy12osti/52897.pdf (PDF 4.6 MB)
5
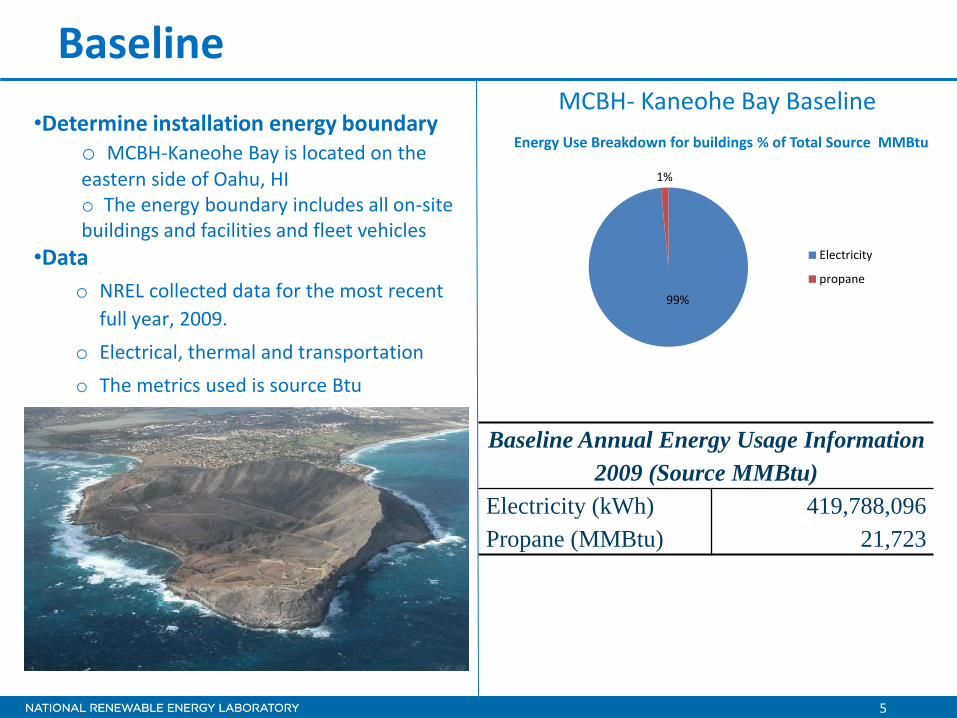
Baseline
•Determine installation energy boundary o MCBH-Kaneohe Bay is located on the eastern side of Oahu, HI o The energy boundary includes all on-site buildings and facilities and fleet vehicles
•Data
o NREL collected data for the most recent
full year, 2009.
o Electrical, thermal and transportation
o The metrics used is source Btu
Energy Use Breakdown for buildings % of Total Source MMBtu
MCBH- Kaneohe Bay Baseline
99%
1%
Electricity
propane
Baseline Annual Energy Usage Information
2009 (Source MMBtu)
Electricity (kWh) 419,788,096
Propane (MMBtu) 21,723

6
Baseline
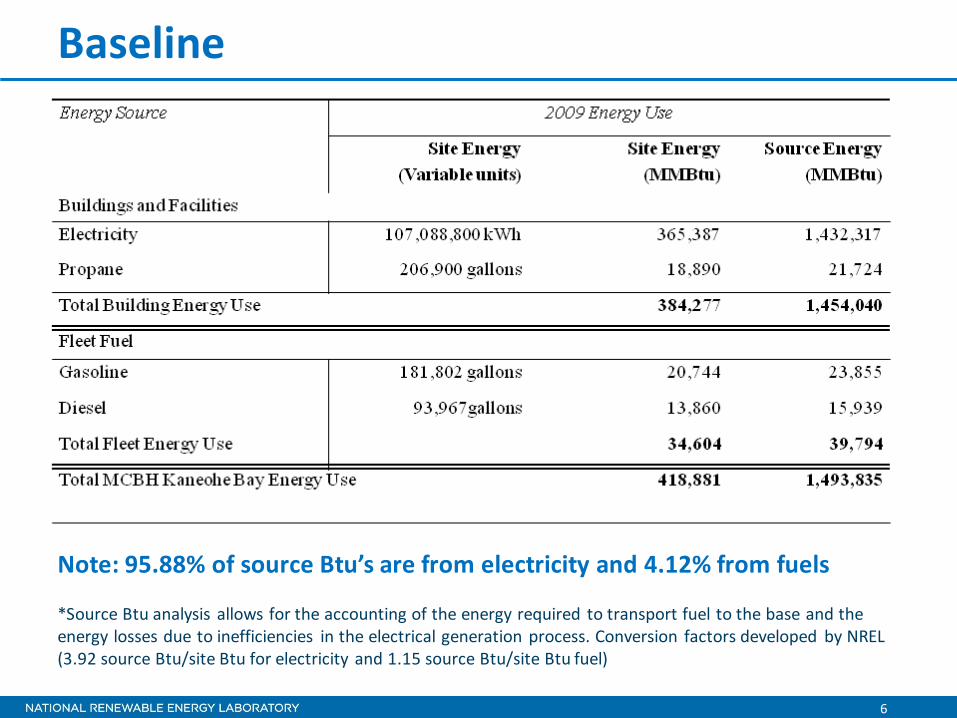
Note: 95.88% of source Btu’s are from electricity and 4.12% from fuels *Source Btu analysis allows for the accounting of the energy required to transport fuel to the base and the energy losses due to inefficiencies in the electrical generation process. Conversion factors developed by NREL (3.92 source Btu/site Btu for electricity and 1.15 source Btu/site Btu fuel)
7
Energy Efficiency
7
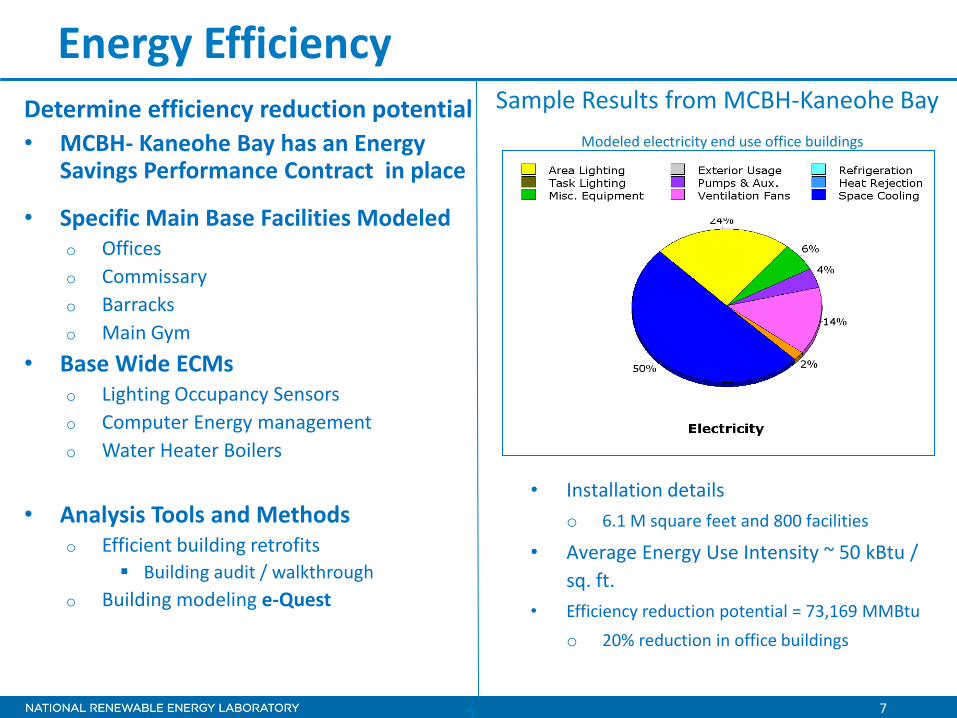
Determine efficiency reduction potential
• MCBH- Kaneohe Bay has an Energy Savings Performance Contract in place
• Specific Main Base Facilities Modeled o Offices
o Commissary
o Barracks
o Main Gym
• Base Wide ECMs o Lighting Occupancy Sensors
o Computer Energy management
o Water Heater Boilers
• Analysis Tools and Methods o Efficient building retrofits
Building audit / walkthrough
o Building modeling e-Quest
Modeled electricity end use office buildings
• Installation details
o 6.1 M square feet and 800 facilities
• Average Energy Use Intensity ~ 50 kBtu /
sq. ft.
• Efficiency reduction potential = 73,169 MMBtu
o 20% reduction in office buildings
Sample Results from MCBH-Kaneohe Bay
8
Energy Efficiency Measure Savings (% of fuel type) MMBtu
Equivalent
Savings
% Total Site
Savings
Specific Base Facilities
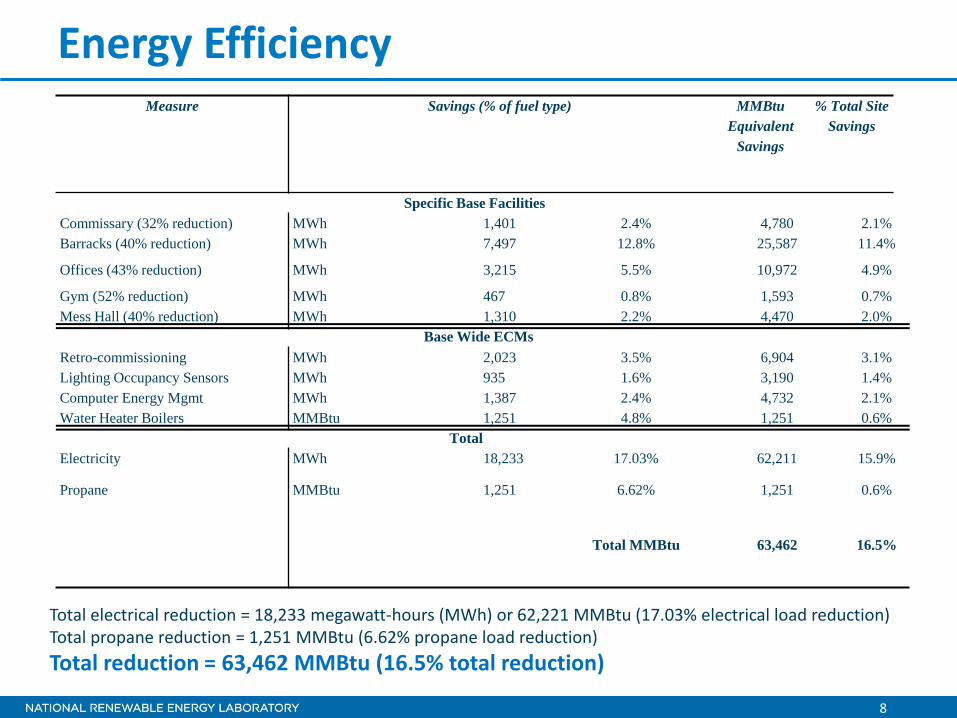
Commissary (32% reduction) MWh 1,401 2.4% 4,780 2.1%
Barracks (40% reduction) MWh 7,497 12.8% 25,587 11.4%
Offices (43% reduction) MWh 3,215 5.5% 10,972 4.9%
Gym (52% reduction) MWh 467 0.8% 1,593 0.7%
Mess Hall (40% reduction) MWh 1,310 2.2% 4,470 2.0%
Base Wide ECMs
Retro-commissioning MWh 2,023 3.5% 6,904 3.1%
Lighting Occupancy Sensors MWh 935 1.6% 3,190 1.4%
Computer Energy Mgmt MWh 1,387 2.4% 4,732 2.1%
Water Heater Boilers MMBtu 1,251 4.8% 1,251 0.6%
Total
Electricity MWh 18,233 17.03% 62,211 15.9%
Propane MMBtu 1,251 6.62% 1,251 0.6%
Total MMBtu 63,462 16.5%
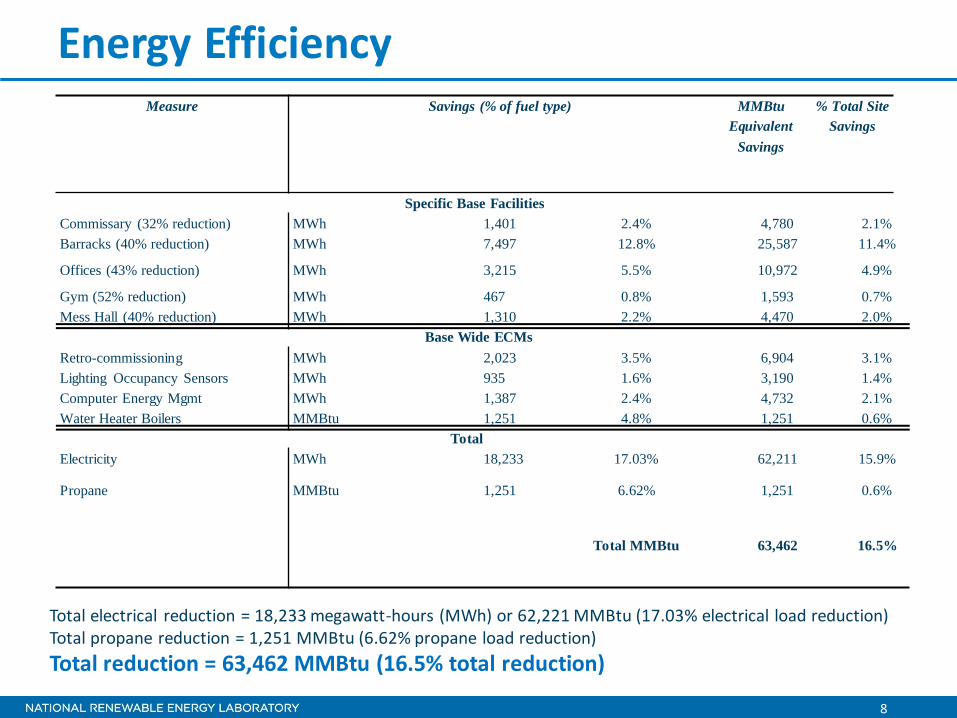
Total electrical reduction = 18,233 megawatt-hours (MWh) or 62,221 MMBtu (17.03% electrical load reduction) Total propane reduction = 1,251 MMBtu (6.62% propane load reduction)
Total reduction = 63,462 MMBtu (16.5% total reduction)

9
Renewable Energy
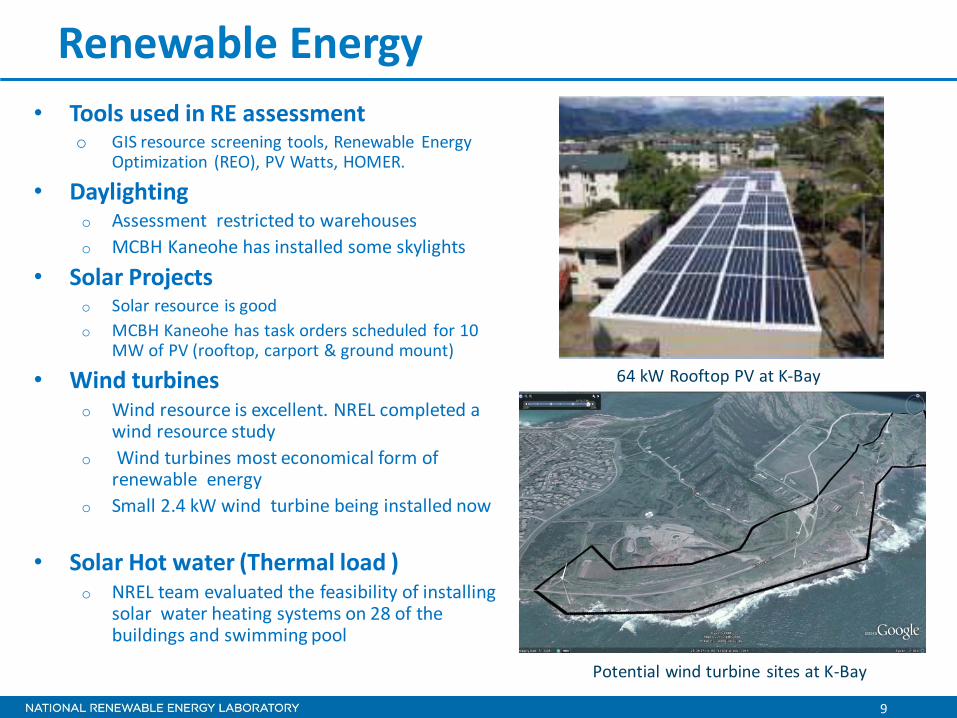
• Tools used in RE assessment o GIS resource screening tools, Renewable Energy
Optimization (REO), PV Watts, HOMER.
• Daylighting o Assessment restricted to warehouses
o MCBH Kaneohe has installed some skylights
• Solar Projects o Solar resource is good
o MCBH Kaneohe has task orders scheduled for 10 MW of PV (rooftop, carport & ground mount)
• Wind turbines o Wind resource is excellent. NREL completed a
wind resource study
o Wind turbines most economical form of renewable energy
o Small 2.4 kW wind turbine being installed now
• Solar Hot water (Thermal load ) o NREL team evaluated the feasibility of installing
solar water heating systems on 28 of the buildings and swimming pool
64 kW Rooftop PV at K-Bay
Potential wind turbine sites at K-Bay

10
Renewable Energy
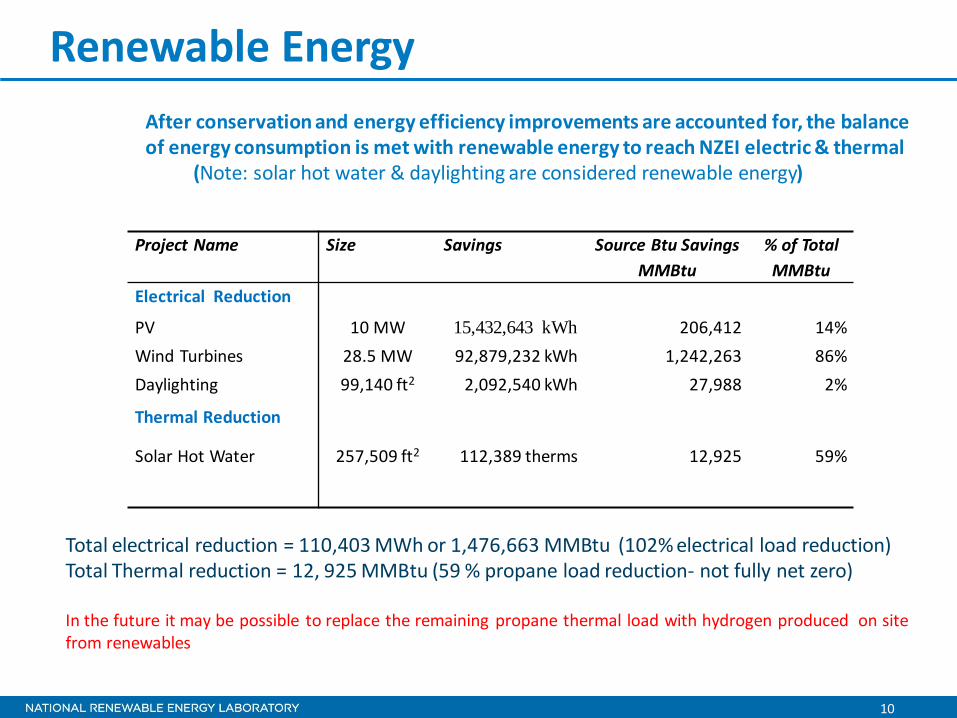
Project Name Size Savings Source Btu Savings
MMBtu
% of Total
MMBtu
Electrical Reduction
PV 10 MW 15,432,643 kWh 206,412 14%
Wind Turbines 28.5 MW 92,879,232 kWh 1,242,263 86%
Daylighting 99,140 ft2 2,092,540 kWh 27,988 2%
Thermal Reduction
Solar Hot Water
257,509 ft2
112,389 therms
12,925
59%
After conservation and energy efficiency improvements are accounted for, the balance of energy consumption is met with renewable energy to reach NZEI electric & thermal (Note: solar hot water & daylighting are considered renewable energy)
Total electrical reduction = 110,403 MWh or 1,476,663 MMBtu (102% electrical load reduction) Total Thermal reduction = 12, 925 MMBtu (59 % propane load reduction- not fully net zero) In the future it may be possible to replace the remaining propane thermal load with hydrogen produced on site from renewables
11
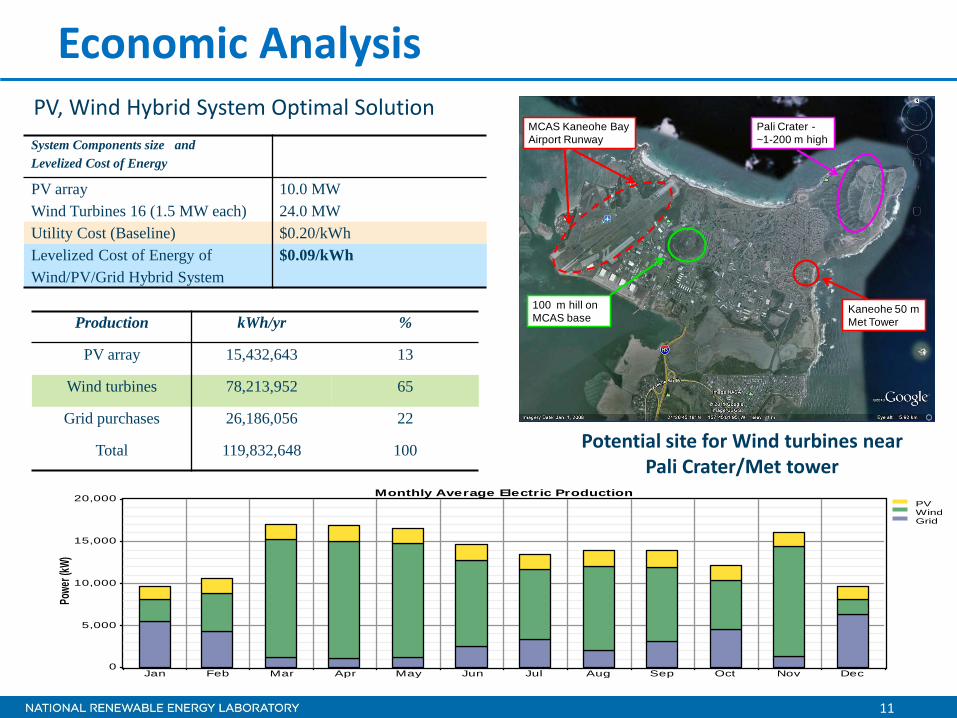
Economic Analysis
MCAS Kaneohe Bay
Airport Runway
Kaneohe 50 m
Met Tower
100 m hill on
MCAS base
Pali Crater -
~1-200 m high
Jan Feb Mar Apr May Jun Jul Aug Sep Oct Nov Dec0
5,000
10,000
15,000
20,000
Pow
er (k
W)
Monthly Average Electric ProductionPVWindGrid
Production kWh/yr %
PV array 15,432,643 13
Wind turbines 78,213,952 65
Grid purchases 26,186,056 22
Total 119,832,648 100
System Components size and
Levelized Cost of Energy
PV array 10.0 MW
Wind Turbines 16 (1.5 MW each) 24.0 MW
Utility Cost (Baseline) $0.20/kWh
Levelized Cost of Energy of
Wind/PV/Grid Hybrid System
$0.09/kWh
PV, Wind Hybrid System Optimal Solution
Potential site for Wind turbines near Pali Crater/Met tower

12
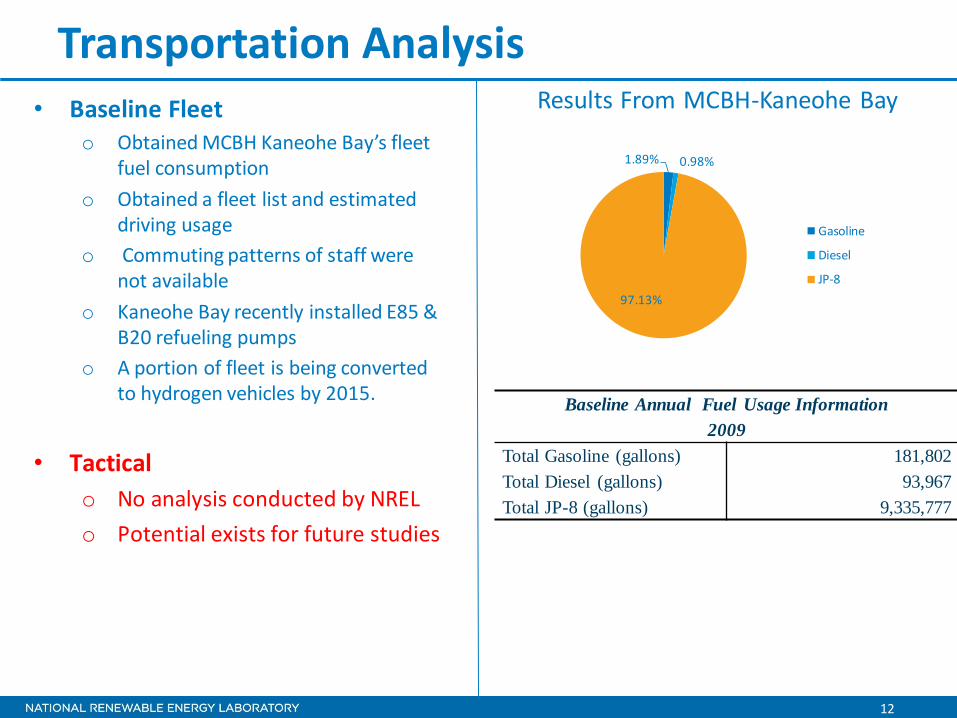
Transportation Analysis • Baseline Fleet
o Obtained MCBH Kaneohe Bay’s fleet fuel consumption
o Obtained a fleet list and estimated driving usage
o Commuting patterns of staff were not available
o Kaneohe Bay recently installed E85 & B20 refueling pumps
o A portion of fleet is being converted to hydrogen vehicles by 2015.
• Tactical
o No analysis conducted by NREL
o Potential exists for future studies
Results From MCBH-Kaneohe Bay
1.89% 0.98%
97.13%
Gasoline
Diesel
JP-8
Baseline Annual Fuel Usage Information
2009
Total Gasoline (gallons) 181,802
Total Diesel (gallons) 93,967
Total JP-8 (gallons) 9,335,777
13
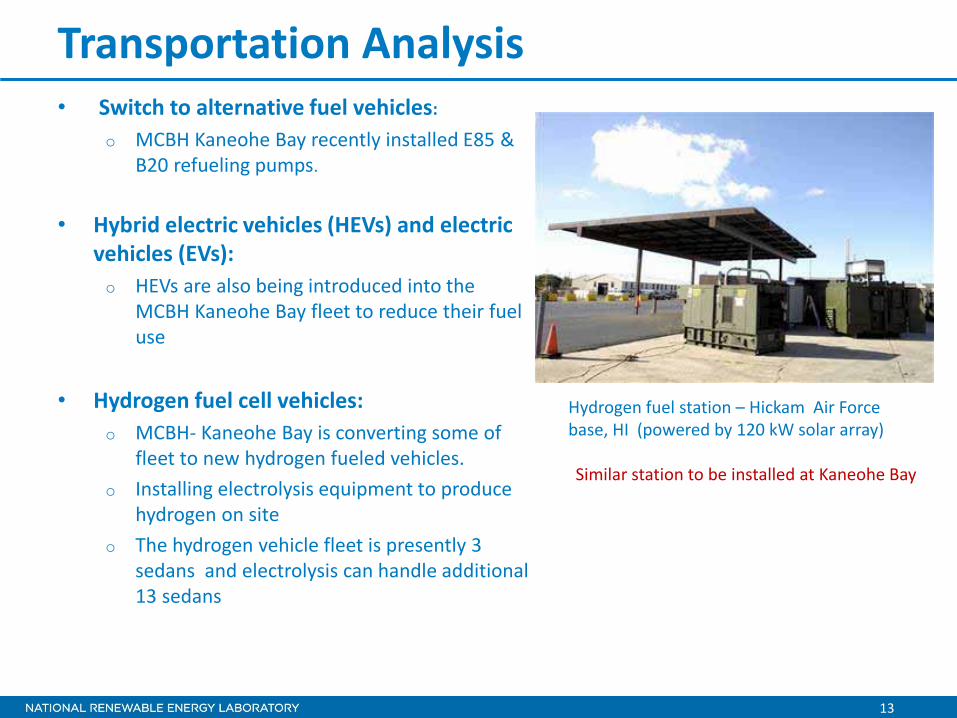
Transportation Analysis
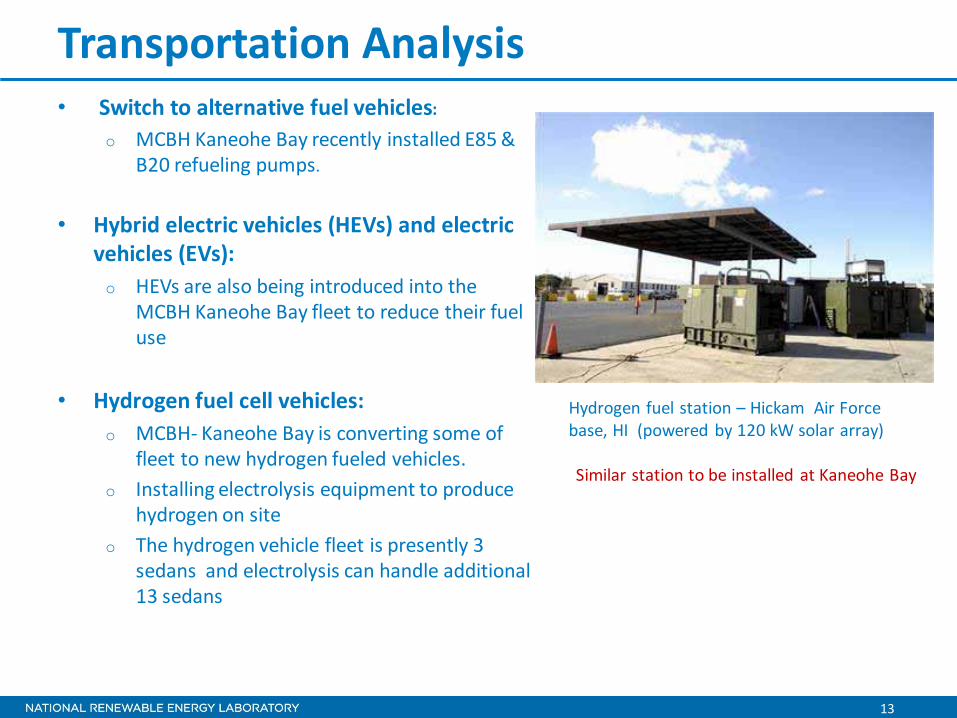
Hydrogen fuel station – Hickam Air Force base, HI (powered by 120 kW solar array)
Similar station to be installed at Kaneohe Bay
• Switch to alternative fuel vehicles:
o MCBH Kaneohe Bay recently installed E85 & B20 refueling pumps.
• Hybrid electric vehicles (HEVs) and electric vehicles (EVs):
o HEVs are also being introduced into the MCBH Kaneohe Bay fleet to reduce their fuel use
• Hydrogen fuel cell vehicles:
o MCBH- Kaneohe Bay is converting some of fleet to new hydrogen fueled vehicles.
o Installing electrolysis equipment to produce hydrogen on site
o The hydrogen vehicle fleet is presently 3 sedans and electrolysis can handle additional 13 sedans

14
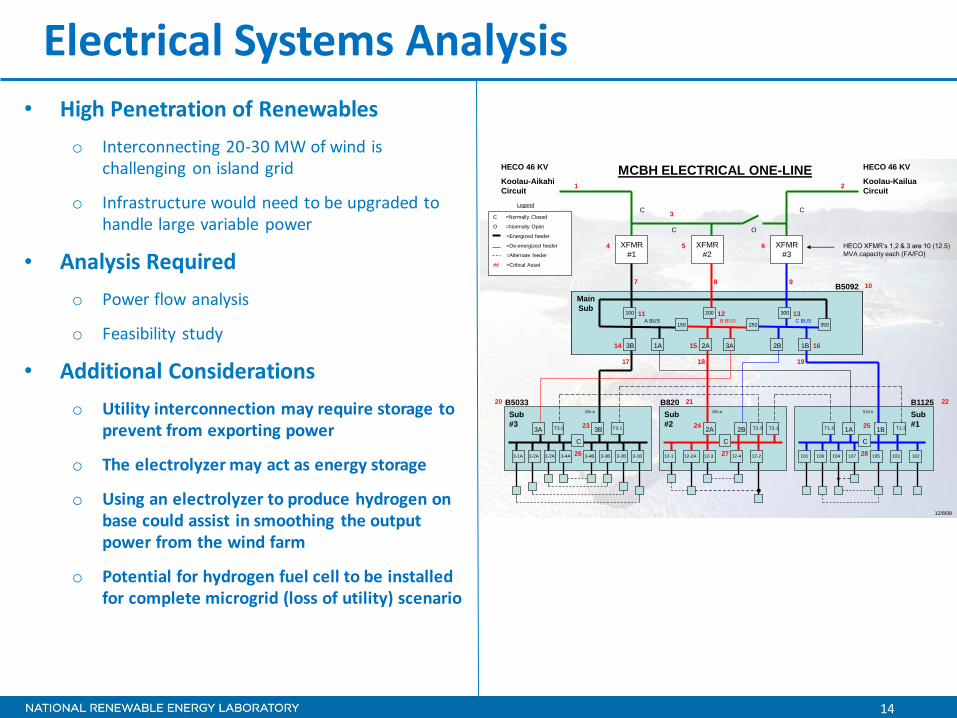
Electrical Systems Analysis
• High Penetration of Renewables
o Interconnecting 20-30 MW of wind is challenging on island grid
o Infrastructure would need to be upgraded to handle large variable power
• Analysis Required
o Power flow analysis
o Feasibility study
• Additional Considerations
o Utility interconnection may require storage to prevent from exporting power
o The electrolyzer may act as energy storage
o Using an electrolyzer to produce hydrogen on base could assist in smoothing the output power from the wind farm
o Potential for hydrogen fuel cell to be installed for complete microgrid (loss of utility) scenario
C
O O O
CC
C
O
C C
C
C
XFMR
#1
XFMR
#2
XFMR
#3
B5033
HECO XFMR’s 1,2 & 3 are 10 (12.5)
MVA capacity each (FA/FO)
HECO 46 KV
Koolau-Aikahi
Circuit
HECO 46 KV
Koolau-Kailua
Circuit
C
C
CC =Normally Closed
O =Normally Open
=Energized feeder
=De-energized feeder
=Alternate feeder
## =Critical Asset
12/8/08
O
MCBH ELECTRICAL ONE-LINE
A BUS B BUS C BUS
Legend
C
150 250
350
510 A200 A
1B
100 200 300
1B 3B 1A 2B
B5092
A BUS B BUS C BUS150 250 350
100 200 300
3-4B 3-3B 3-2B 3-1B3-1A 3-2A 3-2A 3-4A 12-1 12-2A 12-3 12-4 12-2 101 106 104 107 105 103 102
3A T3-2 3B T3-1 2A 2B T2-3 T2-1 T1-2 1A 1B T1-3
290 A
3A2A
Sub
#1
Sub
#2
Sub
#3
Main
Sub
B1125B820
1
1211
10987
654
3
2
20
191817
161514
13
282726
252423
21 22
15
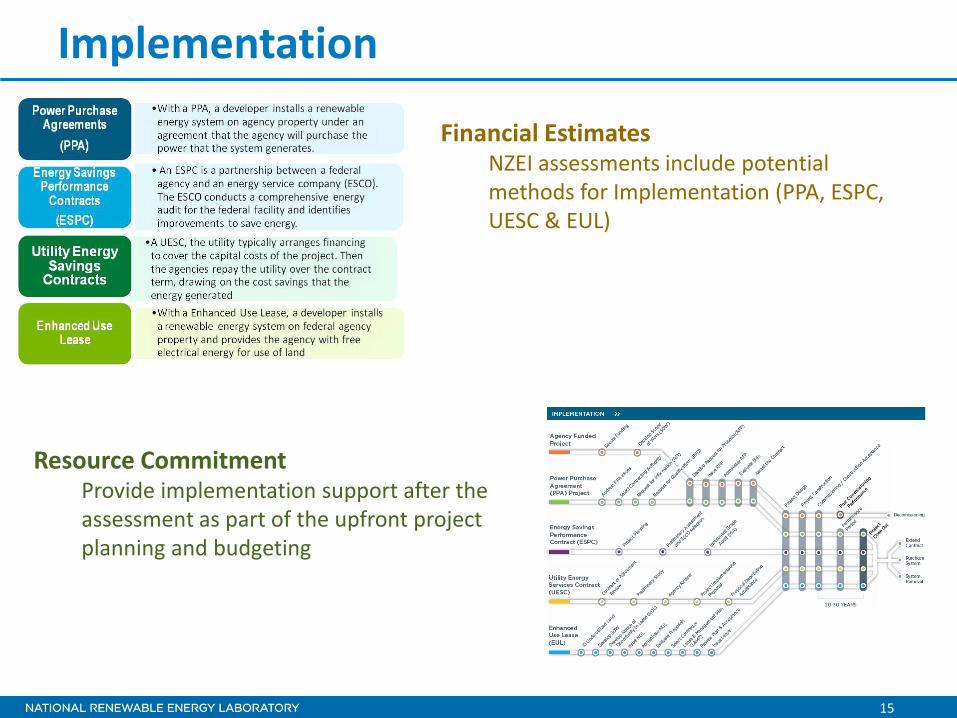
Implementation
Financial Estimates NZEI assessments include potential methods for Implementation (PPA, ESPC, UESC & EUL)
Resource Commitment Provide implementation support after the assessment as part of the upfront project planning and budgeting
Mahalo- Thank you
NREL is a national laboratory of the U.S. Department of Energy, Office of Energy Efficiency and Renewable Energy, operated by the Alliance for Sustainable Energy, LLC.
Islands and Our Renewable Energy Future
WREF 2012 Conference
May 16, 2012 Denver, CO
2
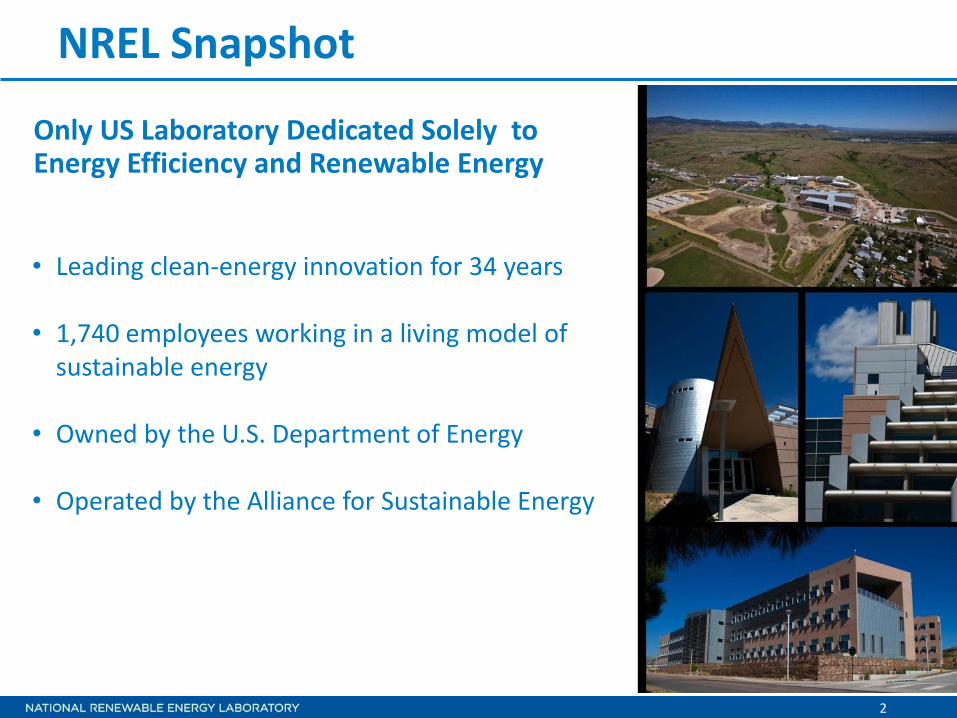
NREL Snapshot
• Leading clean-energy innovation for 34 years
• 1,740 employees working in a living model of
sustainable energy
• Owned by the U.S. Department of Energy
• Operated by the Alliance for Sustainable Energy
Only US Laboratory Dedicated Solely to Energy Efficiency and Renewable Energy

3
Why Islands? Motivation
“Islanders” “Continentals”
• High and variable energy
costs
• Excellent access to
renewables
• Visible externalities
• Vulnerability to climate
change
• Demonstration of high-
penetration renewables
• Development of next-
generation technologies
• Proof that energy
transformation is possible

4
NREL’s Island Work
4
image courtesy NASA
5
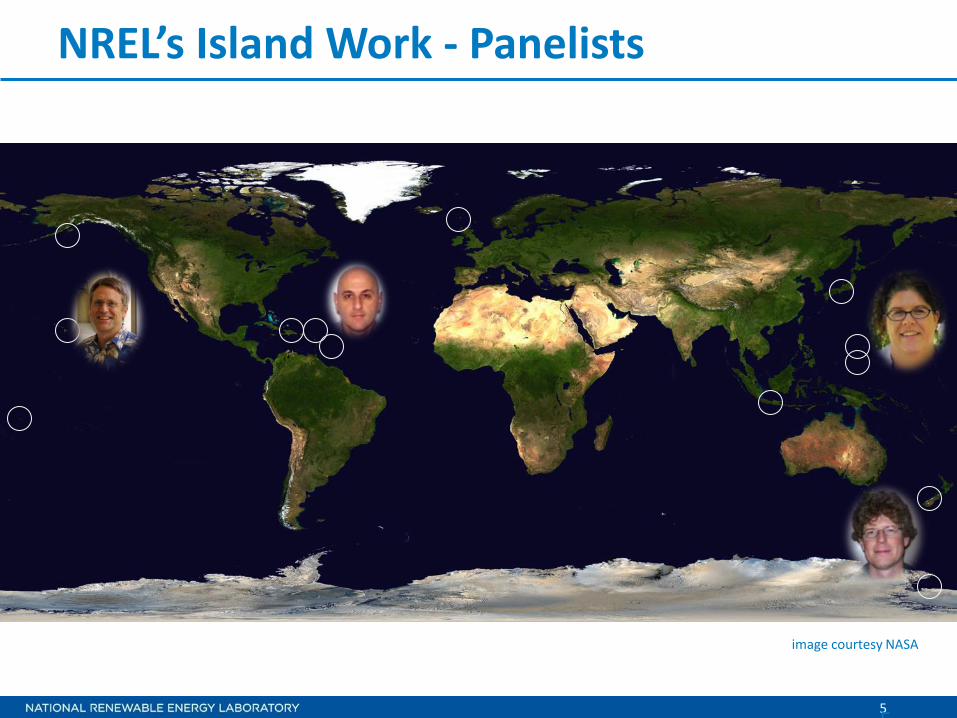
NREL’s Island Work - Panelists
5
image courtesy NASA

NREL is a national laboratory of the U.S. Department of Energy, Office of Energy Efficiency and Renewable Energy, operated by the Alliance for Sustainable Energy, LLC.
Marketing Strategies for High Contribution Renewables in Islanded Power Systems
WREF 2012 Conference
May 16, 2012 Denver, CO
E. Ian Baring-Gould, NREL

7
Wide Range of Power System Options
Renewable power system can be used to cover a wide range of needs, including:
• Dedicated Use: Power being used at point sources without regulation
• Small or Simple Systems: Power systems for individual buildings and dispersed generation where high level of reliability is not required
• Community Power Systems: Utility provided power to larger communities or group of buildings with larger loads.
• Wind-Diesel Systems: Large communities or facilities with large loads.
• Integrated Systems: Large islanded systems incorporating conventional and large scale renewable generation.
Photo
Cre
dit: K
ent
Bulla
rd
8
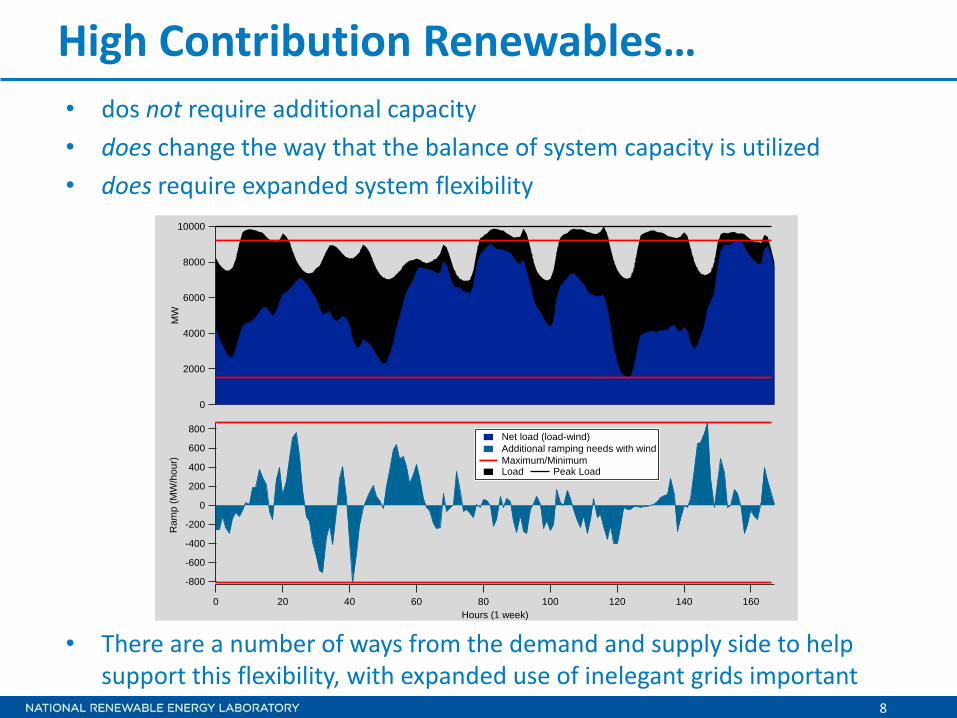
High Contribution Renewables…
• dos not require additional capacity
• does change the way that the balance of system capacity is utilized
• does require expanded system flexibility
10000
8000
6000
4000
2000
0
MW
160140120100806040200
Hours (1 week)
800
600
400
200
0
-200
-400
-600
-800
Ra
mp
(M
W/h
ou
r)
Net load (load-wind)
Additional ramping needs with wind
Maximum/Minimum Load Peak Load
• There are a number of ways from the demand and supply side to help support this flexibility, with expanded use of inelegant grids important
9
Current Status of High Contribution Renewable Tech
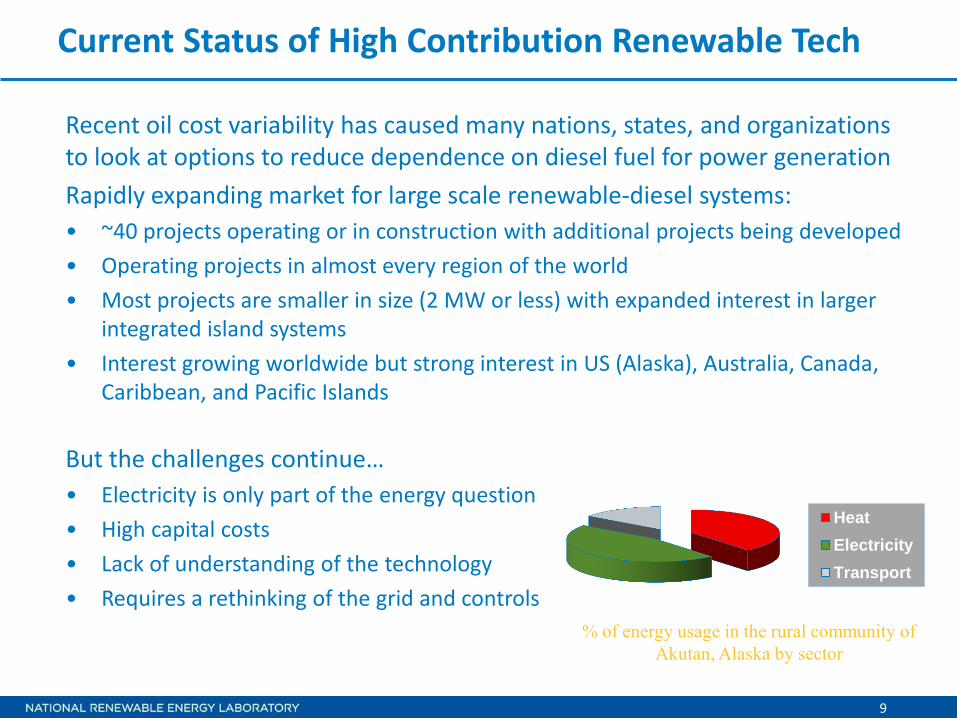
Recent oil cost variability has caused many nations, states, and organizations to look at options to reduce dependence on diesel fuel for power generation
Rapidly expanding market for large scale renewable-diesel systems:
• ~40 projects operating or in construction with additional projects being developed
• Operating projects in almost every region of the world
• Most projects are smaller in size (2 MW or less) with expanded interest in larger integrated island systems
• Interest growing worldwide but strong interest in US (Alaska), Australia, Canada, Caribbean, and Pacific Islands
Heat
Electricity
Transport
% of energy usage in the rural community of
Akutan, Alaska by sector
But the challenges continue…
• Electricity is only part of the energy question
• High capital costs
• Lack of understanding of the technology
• Requires a rethinking of the grid and controls
10
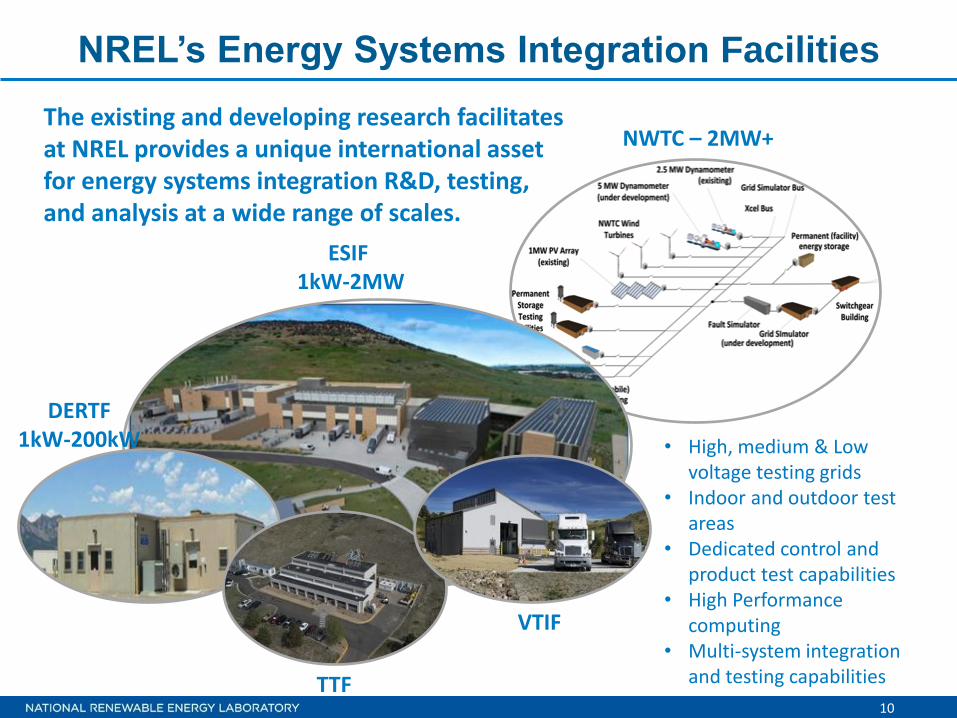
NWTC – 2MW+
NREL’s Energy Systems Integration Facilities
ESIF 1kW-2MW
DERTF 1kW-200kW
The existing and developing research facilitates at NREL provides a unique international asset for energy systems integration R&D, testing, and analysis at a wide range of scales.
TTF
VTIF
• High, medium & Low voltage testing grids
• Indoor and outdoor test areas
• Dedicated control and product test capabilities
• High Performance computing
• Multi-system integration and testing capabilities
11
For More Information:
Energy Systems Integration Facility
http://www.nrel.gov/eis/facilities_esif.html
Wind / Diesel Overview
http://apps1.eere.energy.gov/tribalenergy/pdfs/wind_akwd04_basics.pdf
NREL is a national laboratory of the U.S. Department of Energy, Office of Energy Efficiency and Renewable Energy, operated by the Alliance for Sustainable Energy, LLC.
Inter-Island Transmission and Interconnection
WREF 2012 Conference
May 16, 2012 Denver, CO
Vahan Gevorgian, NREL

13
Benefits of Island Interconnections
• Deliver lower cost power from one island to another
• Transmit renewable generated energy to an island that otherwise does not have access to less expensive renewable power
• Increased reliability, better power quality, better hurricane resilience
• Reduced spinning reserve requirements, sharing frequency regulation without adding new generation, lower operating costs
• Integrated fiber-optic cables

14
Examples of Case Studies
• OWITS (DOE/HECO/DBEDT)
• Caribbean Grid (World Bank)
• Puerto Rico – USVI - BVI (DOE)
• Nevis – USVI – Puerto Rico (U.S. Dept. of State / OAS)
• Puerto Rico – Dominican Republic (World Bank)
15
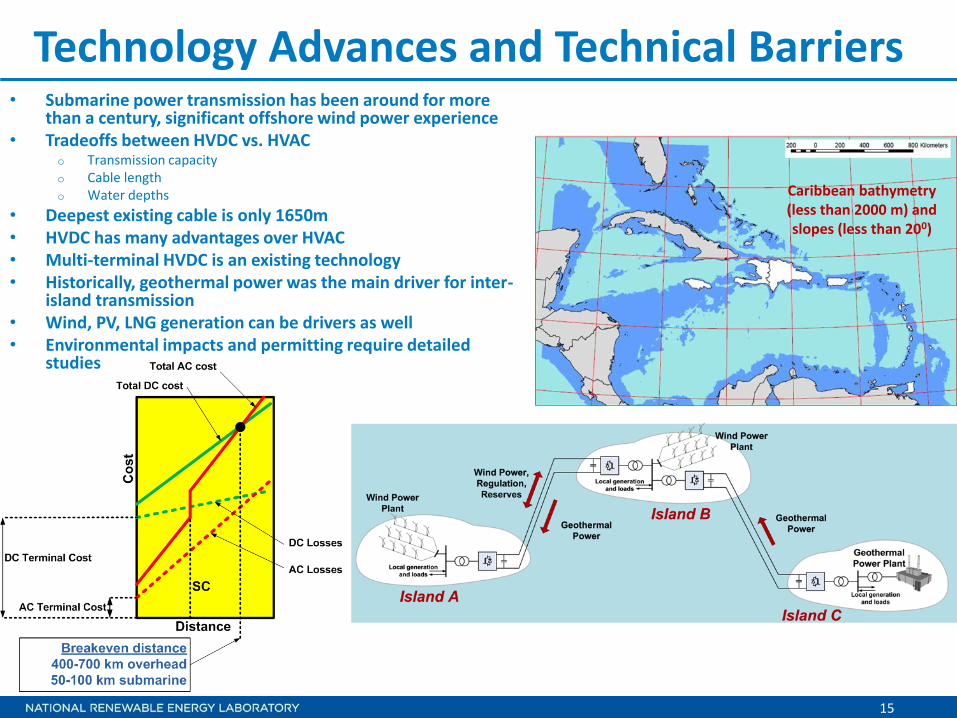
Technology Advances and Technical Barriers • Submarine power transmission has been around for more
than a century, significant offshore wind power experience • Tradeoffs between HVDC vs. HVAC
o Transmission capacity o Cable length o Water depths
• Deepest existing cable is only 1650m • HVDC has many advantages over HVAC • Multi-terminal HVDC is an existing technology • Historically, geothermal power was the main driver for inter-
island transmission • Wind, PV, LNG generation can be drivers as well • Environmental impacts and permitting require detailed
studies
Caribbean bathymetry (less than 2000 m) and slopes (less than 200)
16
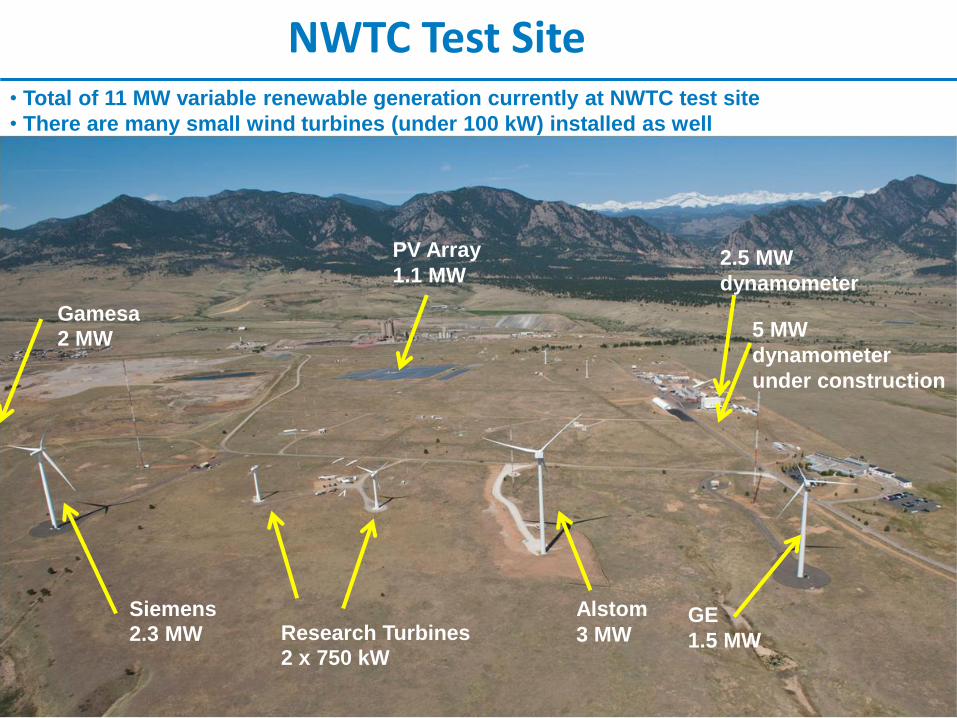
NWTC Test Site
Siemens
2.3 MW Alstom
3 MW GE
1.5 MW
Gamesa
2 MW
Research Turbines
2 x 750 kW
PV Array
1.1 MW 2.5 MW
dynamometer
• Total of 11 MW variable renewable generation currently at NWTC test site
• There are many small wind turbines (under 100 kW) installed as well
5 MW
dynamometer
under construction
17
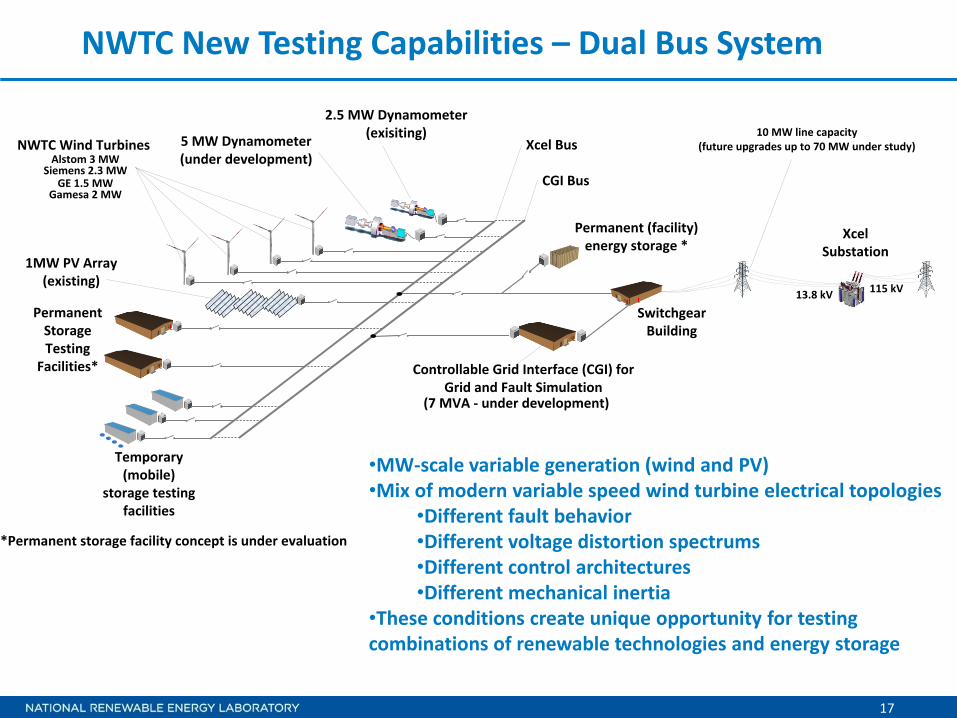
NWTC New Testing Capabilities – Dual Bus System
2.5 MW Dynamometer(exisiting)
5 MW Dynamometer(under development)
NWTC Wind Turbines
1MW PV Array(existing)
Permanent Storage Testing
Facilities* Controllable Grid Interface (CGI) for Grid and Fault Simulation
Switchgear Building
XcelSubstation
Permanent (facility)energy storage *
Temporary (mobile)
storage testing facilities
CGI Bus
Xcel Bus
(7 MVA - under development)
*Permanent storage facility concept is under evaluation
13.8 kV115 kV
10 MW line capacity(future upgrades up to 70 MW under study)
GE 1.5 MWSiemens 2.3 MW
Alstom 3 MW
Gamesa 2 MW
•MW-scale variable generation (wind and PV) •Mix of modern variable speed wind turbine electrical topologies
•Different fault behavior •Different voltage distortion spectrums •Different control architectures •Different mechanical inertia
•These conditions create unique opportunity for testing combinations of renewable technologies and energy storage
18
For More Information:
National Wind Technology Center (NWTC)
http://www.nrel.gov/wind/
Oahu Wind Integration and Transmission Study
http://www.uwig.org/owits_summary_report.pdf
Puerto Rico / USVI Transmission
http://www.edinenergy.org/pdfs/51294.pdf
http://www.viwapa.vi/AboutUs/Projects/ProjectDetails/11-08-02/USVI-BVI-Puerto_Rico_Interconnection.aspx

NREL is a national laboratory of the U.S. Department of Energy, Office of Energy Efficiency and Renewable Energy, operated by the Alliance for Sustainable Energy, LLC.
Hawaii Electric Vehicles
WREF 2012 Conference
May 16, 2012 Denver, CO
Ken Kelly, NREL

20
Hawaii Clean Energy Initiative - Regional-focused Energy Strategies
0
200
400
600
800
1000
1200
1400
1600
1800
20
09
Fu
el U
se, M
illio
n G
allo
ns
Transportation: Jet fuel
Transportation: Gasoline & Ethanol
Transportation: Diesel & Biodiesel
Electricity: Diesel & Biodiesel
Electricity: Fuel Oil & Naphtha
32%
33%
35%
32%
33%
35%

21
Plug-in Electric Vehicles on Islands
21
Opportunities
Climate & driving limits
Transportation fuel diversification
Connection to smart grid and high-penetration
renewables
– Load demand management
– Grid integration – peak shaving, energy storage
Vehicle performance and efficiency
Synergies with tourism industry
Potential challenges
Market penetration – cost, availability, and vehicle
turnover
Establishing EVSE – home and public charging
Grid impacts, control systems
Education and outreach
Range limitations (pure EV)
22
Hawaii’s EV Programs
22
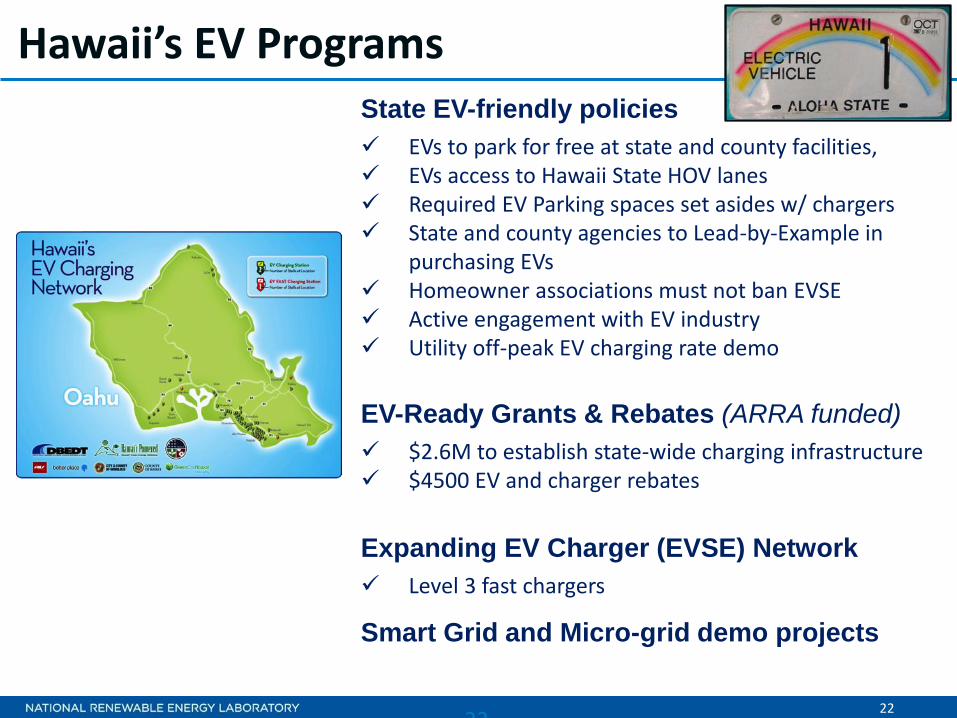
State EV-friendly policies
EVs to park for free at state and county facilities, EVs access to Hawaii State HOV lanes Required EV Parking spaces set asides w/ chargers State and county agencies to Lead-by-Example in
purchasing EVs Homeowner associations must not ban EVSE Active engagement with EV industry Utility off-peak EV charging rate demo
EV-Ready Grants & Rebates (ARRA funded)
$2.6M to establish state-wide charging infrastructure $4500 EV and charger rebates
Expanding EV Charger (EVSE) Network
Level 3 fast chargers
Smart Grid and Micro-grid demo projects
23
Hawaii’s EV Grid Integration
23
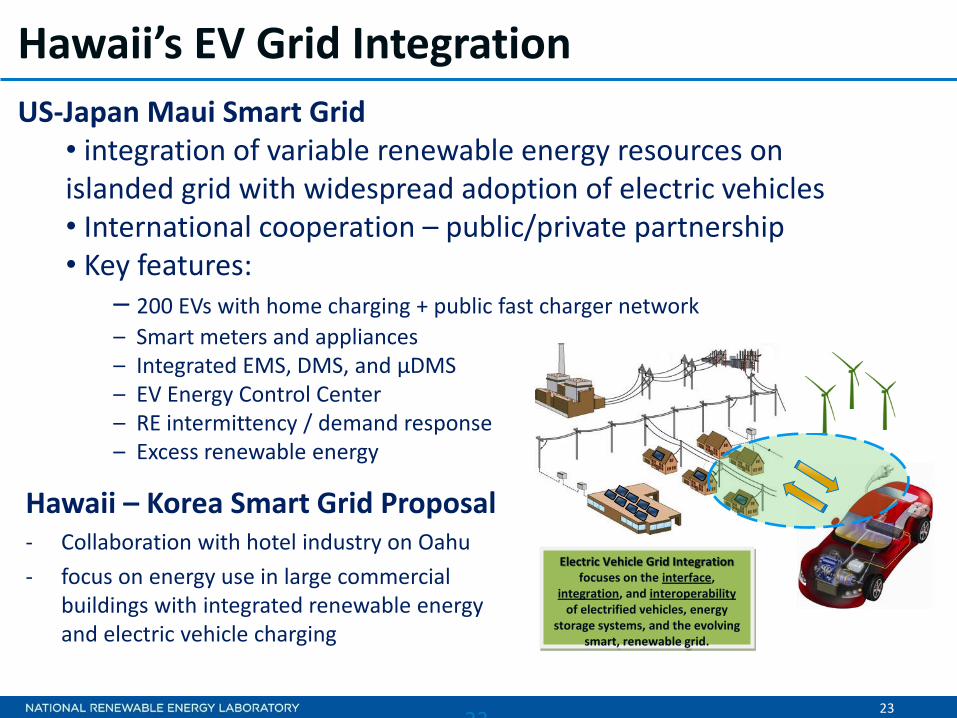
US-Japan Maui Smart Grid • integration of variable renewable energy resources on islanded grid with widespread adoption of electric vehicles • International cooperation – public/private partnership • Key features:
– 200 EVs with home charging + public fast charger network
– Smart meters and appliances – Integrated EMS, DMS, and μDMS – EV Energy Control Center – RE intermittency / demand response – Excess renewable energy
Electric Vehicle Grid Integration focuses on the interface,
integration, and interoperability of electrified vehicles, energy
storage systems, and the evolving smart, renewable grid.
Hawaii – Korea Smart Grid Proposal - Collaboration with hotel industry on Oahu
- focus on energy use in large commercial buildings with integrated renewable energy and electric vehicle charging
24
2010
24
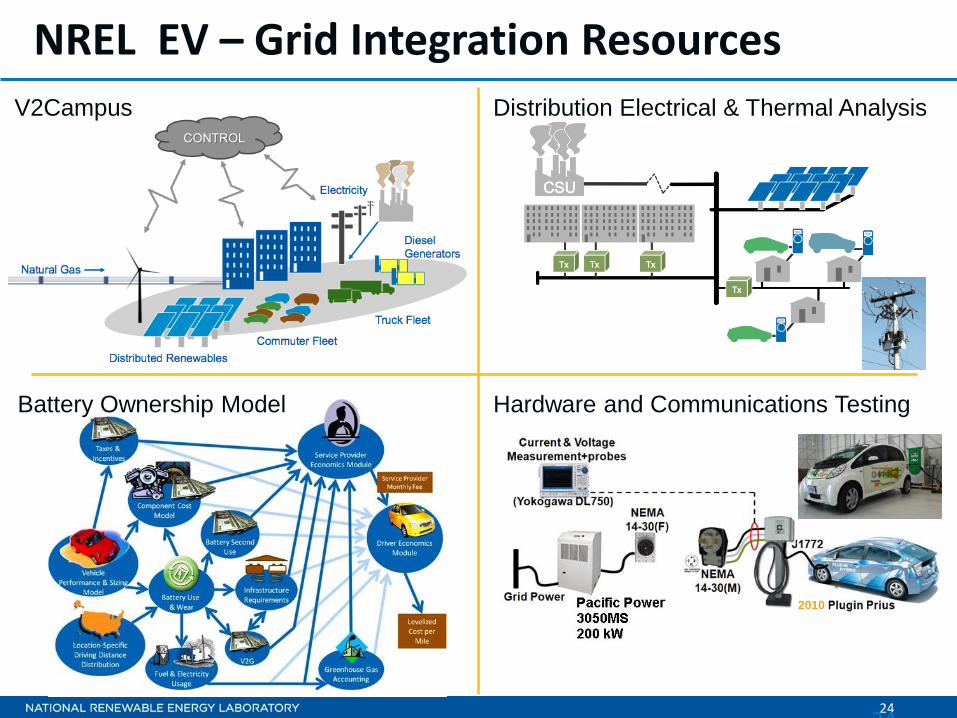
V2Campus Distribution Electrical & Thermal Analysis
Hardware and Communications Testing Battery Ownership Model
NREL EV – Grid Integration Resources

25
A
Mahalo nui loa!
25
Personal mobility
Bicycling…
Daunting challenge…
But very hopeful – new generation, commitment and hard work
Pulling together
Artist: Jean Charlot, Chief’s Canoe (1956), Hawaii Convention Center
26
For More Information:
Hawaii Clean Energy Initiative
http://www.hawaiicleanenergyinitiative.org/
NREL Advanced Vehicles and Fuels
http://www.nrel.gov/vehiclesandfuels/
NREL is a national laboratory of the U.S. Department of Energy, Office of Energy Efficiency and Renewable Energy, operated by the Alliance for Sustainable Energy, LLC.
Integrated deployment
WREF 2012 Conference
May 16, 2012 Denver, CO
Misty Conrad
28
Clean Energy Transformational Change
28
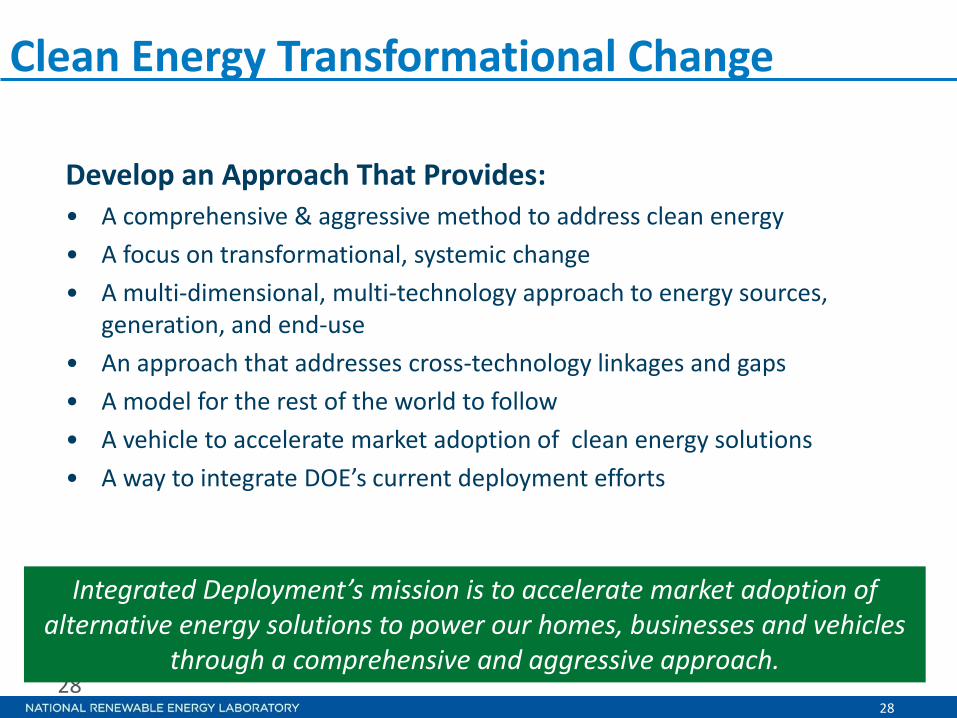
Develop an Approach That Provides: • A comprehensive & aggressive method to address clean energy
• A focus on transformational, systemic change
• A multi-dimensional, multi-technology approach to energy sources, generation, and end-use
• An approach that addresses cross-technology linkages and gaps
• A model for the rest of the world to follow
• A vehicle to accelerate market adoption of clean energy solutions
• A way to integrate DOE’s current deployment efforts
Integrated Deployment’s mission is to accelerate market adoption of alternative energy solutions to power our homes, businesses and vehicles
through a comprehensive and aggressive approach.
29
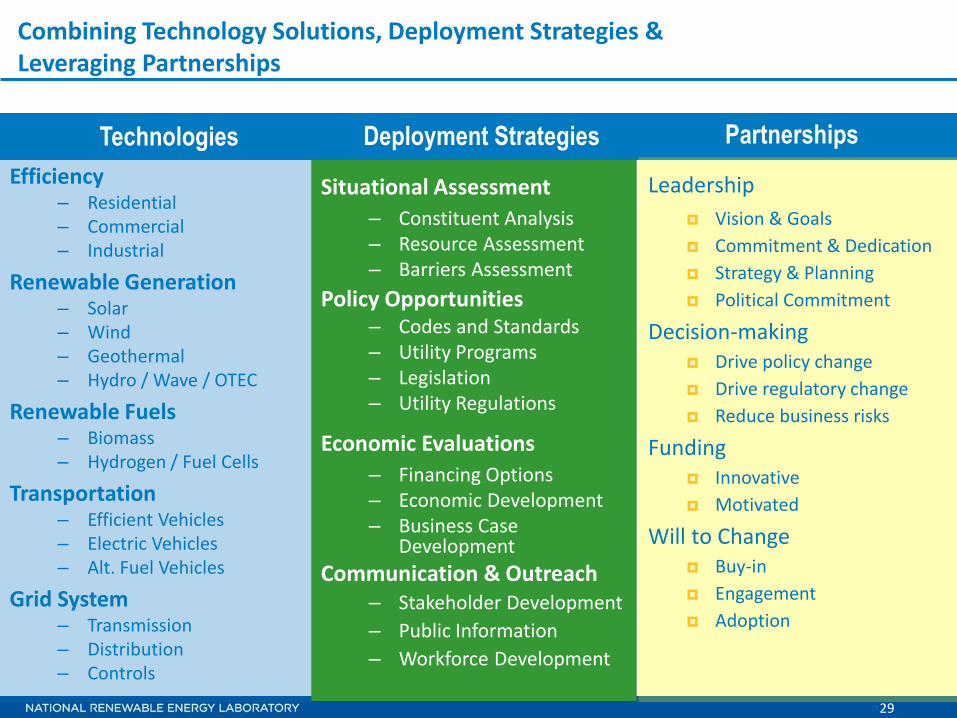
Situational Assessment
– Constituent Analysis – Resource Assessment – Barriers Assessment
Policy Opportunities – Codes and Standards – Utility Programs – Legislation – Utility Regulations
Economic Evaluations
– Financing Options – Economic Development – Business Case
Development
Communication & Outreach – Stakeholder Development
– Public Information
– Workforce Development
Combining Technology Solutions, Deployment Strategies & Leveraging Partnerships
29
Technologies Deployment Strategies Partnerships
Leadership
Vision & Goals
Commitment & Dedication
Strategy & Planning
Political Commitment
Decision-making Drive policy change
Drive regulatory change
Reduce business risks
Funding Innovative
Motivated
Will to Change Buy-in
Engagement
Adoption
Efficiency – Residential – Commercial – Industrial
Renewable Generation – Solar – Wind – Geothermal – Hydro / Wave / OTEC
Renewable Fuels – Biomass – Hydrogen / Fuel Cells
Transportation – Efficient Vehicles – Electric Vehicles – Alt. Fuel Vehicles
Grid System – Transmission – Distribution – Controls

30
Power Developers
Fuel Developers
Utilities
Education Organizations
Consumer Interests
Transportation Providers / End
Users
Federal Agencies
State & Local Government
Builders / Energy End Users
Financiers / Investors
Electricity Generation &
Delivery
Fuel Sources
& Delivery
Transportation End Use
Building& Industry End Use
Po
licy
& A
nal
ysis
Planning & Management
Partnership Building & Communication
Pro
ject D
evelo
pm
en
t & Fin
ance
Land Owners / Developers
Building & Vehicle Owners
Integrated Deployment Model
31
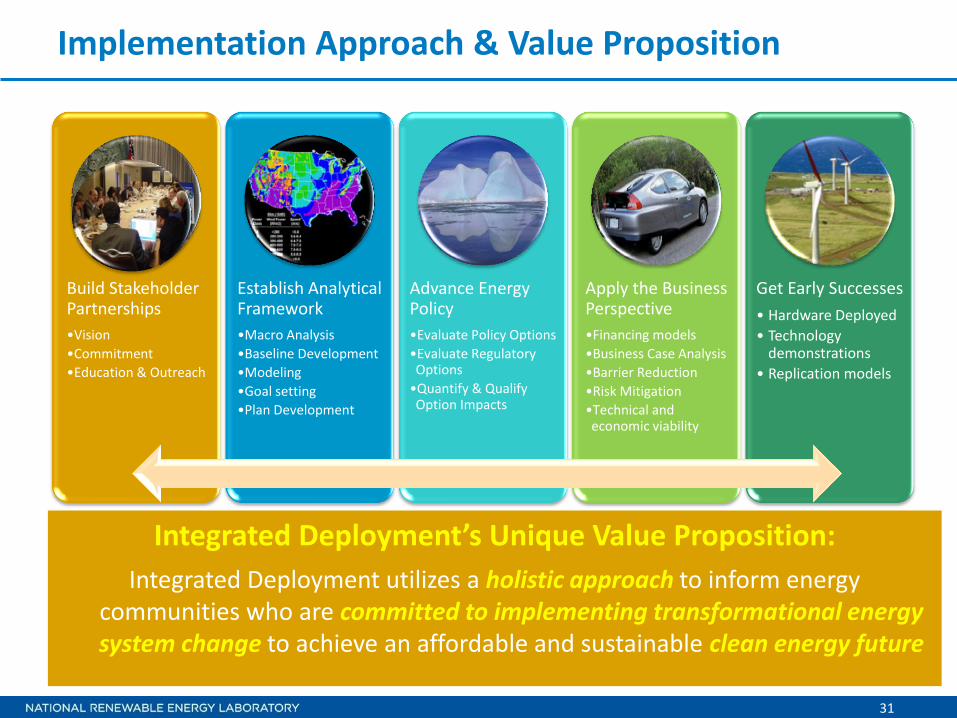
Implementation Approach & Value Proposition
Build Stakeholder Partnerships
•Vision
•Commitment
•Education & Outreach
Establish Analytical Framework
•Macro Analysis
•Baseline Development
•Modeling
•Goal setting
•Plan Development
Advance Energy Policy
•Evaluate Policy Options
•Evaluate Regulatory Options
•Quantify & Qualify Option Impacts
Apply the Business Perspective
•Financing models
•Business Case Analysis
•Barrier Reduction
•Risk Mitigation
•Technical and economic viability
Get Early Successes
• Hardware Deployed
• Technology demonstrations
• Replication models
Integrated Deployment’s Unique Value Proposition:
Integrated Deployment utilizes a holistic approach to inform energy communities who are committed to implementing transformational energy system change to achieve an affordable and sustainable clean energy future

32
An Aggressive Deployment Approach Can be Taken at various scales
Community/City
NREL is leading DOE support
in rebuilding New Orleans
and Greensburg, KS in the
most energy efficient and
renewable way possible
State
NREL is leading DOE efforts
in Hawaii and Alaska in their
pursuit for efficient and
renewable solutions to reduce
dependence on fossil fuel
Nation
NREL is leading DOE efforts in
support of the international
partnership through Energy
Development in Island Nations,
providing comprehensive energy
solutions to island nations.
Federal site
NREL is leading DOE support to
the Department of Defense and
National Science Foundation to
pursue comprehensive solutions to
energy independence on military
installations and reduced
emissions in our polar regions.
33
For More Information:
Integrated Deployment Model Paper
http://www.nrel.gov/docs/fy11osti/49230.pdf
EERE’s Deployment Website
http://www1.eere.energy.gov/commercialization/deployment.html

34
Thank you
Questions / Discussion

NREL is a national laboratory of the U.S. Department of Energy, Office of Energy Efficiency and Renewable Energy, operated by the Alliance for Sustainable Energy, LLC.
Indian Solar Cities Programme: An Overview of Major Activities and Accomplishments
WREF 2012
Alicen Kandt
May 17, 2012
2
Presentation Overview
• Background
• India Solar Cities Programme Overview
• Master Plans
• Sample Master Plan: Agra
• Solar America Cities
• Synergies with Solar America Cities
3
India’s Energy Use
• India’s energy consumption has been increasing at one of the fastest rates in the world
• Existing energy supply-demand imbalance
• Over half of the citizens have no access to energy (Government of India’s Ministry of New and Renewable Energy, ‘Annual Report 2010-2011’, page 1)

4
India’s RE Goals
• India’s government is aiming for 14,000 MW of RE installation from 2007-2012 (‘Guidebook for Developing Solar City’, ICLEI-South Asia, 2010, page 9)
• National Solar Mission (Government of India’s Ministry of New and Renewable Energy, ‘Annual Report 2010-2011’, page 57)
o 20,000 MW of grid-connected solar by 2022
o 2,000 MW of off-grid solar
• Created Solar Cities Programme
MNRE = Ministry for New and Renewable Energy
5
Solar Cities Programme
• Supports 60 Indian cities in the development of EE and RE projects
• Aims to reduce conventional energy demand by 10% by 2013, compared to a baseline year of 2008
• Support provided to municipal corporations for preparing and implementing a master plan
6
Solar Cities Programme Objectives
• To enable/empower urban local governments to address energy challenges at a city-level;
• To provide a framework and support to prepare a Master Plan including assessment of current energy situation, future demand and action plans;
• To build capacity at the urban local bodies and create awareness among all sections of civil society;
• To involve various stakeholders in the planning process; and
• To oversee the implementation of sustainable energy projects through public-private partnerships.
7
Solar Cities Programme Support
• Setting up a solar cell in the city
• Organizing promotional activities
• Preparing and implementing master plans
8
Master Plans
• Provide an overview of the city o Location, population, growth, renewable resource,
energy use
• Outline total and sector-wide baseline data for 2008 o Energy use and GHG emissions
– Electricity, petrol, diesel, kerosene, and liquefied petroleum gas (LPG)
o Residential, industrial, commercial, municipal
• Project energy demand and supply for future 5- and 10-year periods

9
Master Plans (cont)
• Outline annual targets for: o Energy conservation
o RE addition
o GHG abatement and action plan
• Outlines potential sources of funding
Reductions must equate to at least a 10% reduction in projected total demand of conventional energy at the end of five years (end of 2013) o A minimum of 5% of this reduction goal must be RE
10
Sample Master Plan: Agra City
City Overview:
• Home to the Taj Mahal
• Population of 4,380,793 (2011) o Represents a 20.96% growth from the 2001 census.
http://censusindia.gov.in/2011-prov-results/data_files/up/Census2011Data%20Sheet-UP.pdf
• Good average annual solar resource
• Wind resource data is not readily available
• Biomass resource data for the city is not available
11
Sample Master Plan: Agra City
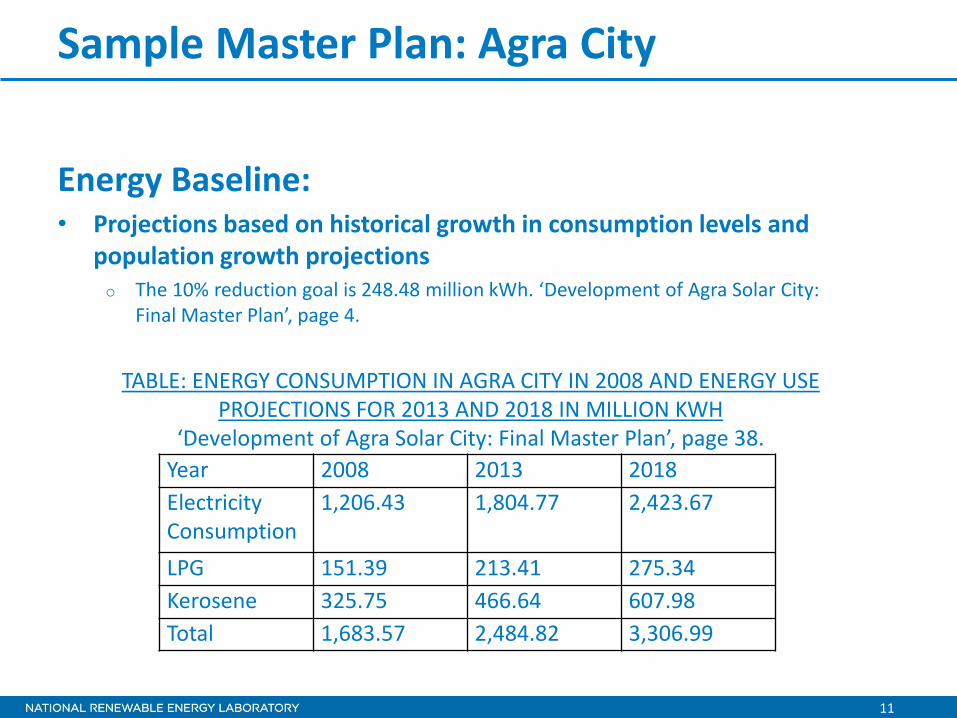
Energy Baseline: • Projections based on historical growth in consumption levels and
population growth projections o The 10% reduction goal is 248.48 million kWh. ‘Development of Agra Solar City:
Final Master Plan’, page 4.
Year 2008 2013 2018
Electricity Consumption
1,206.43 1,804.77 2,423.67
LPG 151.39 213.41 275.34
Kerosene 325.75 466.64 607.98
Total 1,683.57 2,484.82 3,306.99
TABLE: ENERGY CONSUMPTION IN AGRA CITY IN 2008 AND ENERGY USE PROJECTIONS FOR 2013 AND 2018 IN MILLION KWH
‘Development of Agra Solar City: Final Master Plan’, page 38.
12
Sample Master Plan: Agra City
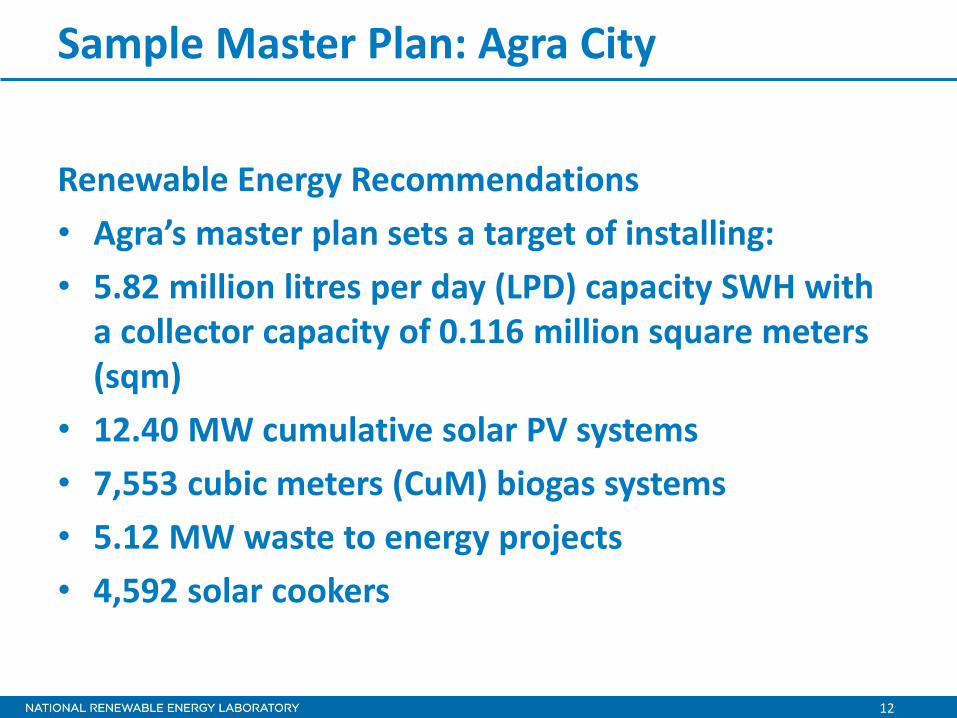
Renewable Energy Recommendations
• Agra’s master plan sets a target of installing:
• 5.82 million litres per day (LPD) capacity SWH with a collector capacity of 0.116 million square meters (sqm)
• 12.40 MW cumulative solar PV systems
• 7,553 cubic meters (CuM) biogas systems
• 5.12 MW waste to energy projects
• 4,592 solar cookers
13
Sample Master Plan: Agra City
Energy Efficiency Recommendations
• Lighting retrofits
• Replacing conventional ceiling fans, AC, refrigerators, water pumps, motors with efficient ones
• Variable speed drives
• Daylight sensors for street lights
14
Sample Master Plan: Agra City
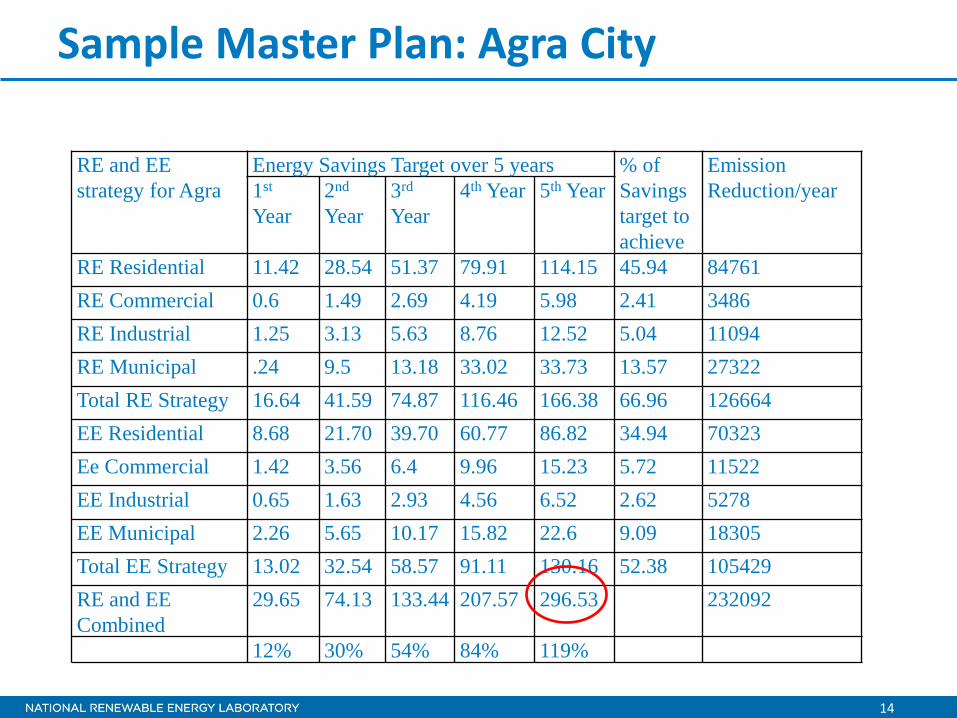
RE and EE
strategy for Agra
Energy Savings Target over 5 years % of
Savings
target to
achieve
Emission
Reduction/year 1st
Year
2nd
Year
3rd
Year
4th Year 5th Year
RE Residential 11.42 28.54 51.37 79.91 114.15 45.94 84761
RE Commercial 0.6 1.49 2.69 4.19 5.98 2.41 3486
RE Industrial 1.25 3.13 5.63 8.76 12.52 5.04 11094
RE Municipal .24 9.5 13.18 33.02 33.73 13.57 27322
Total RE Strategy 16.64 41.59 74.87 116.46 166.38 66.96 126664
EE Residential 8.68 21.70 39.70 60.77 86.82 34.94 70323
Ee Commercial 1.42 3.56 6.4 9.96 15.23 5.72 11522
EE Industrial 0.65 1.63 2.93 4.56 6.52 2.62 5278
EE Municipal 2.26 5.65 10.17 15.82 22.6 9.09 18305
Total EE Strategy 13.02 32.54 58.57 91.11 130.16 52.38 105429
RE and EE
Combined
29.65 74.13 133.44 207.57 296.53 232092
12% 30% 54% 84% 119%
15
Solar America Cities
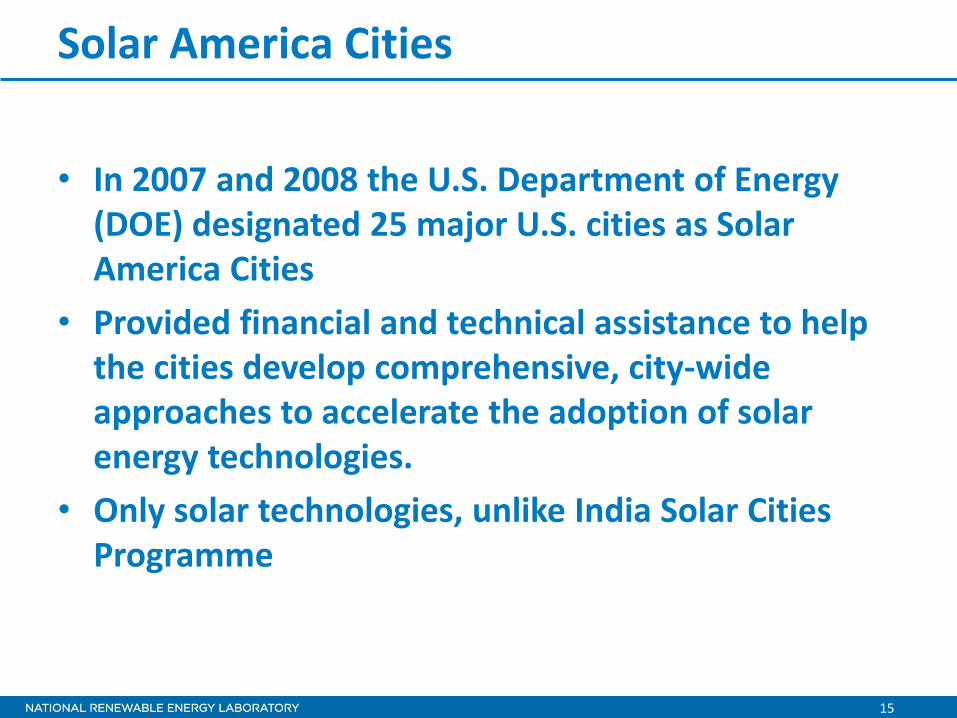
• In 2007 and 2008 the U.S. Department of Energy (DOE) designated 25 major U.S. cities as Solar America Cities
• Provided financial and technical assistance to help the cities develop comprehensive, city-wide approaches to accelerate the adoption of solar energy technologies.
• Only solar technologies, unlike India Solar Cities Programme
16
Solar America Cities Technical Support
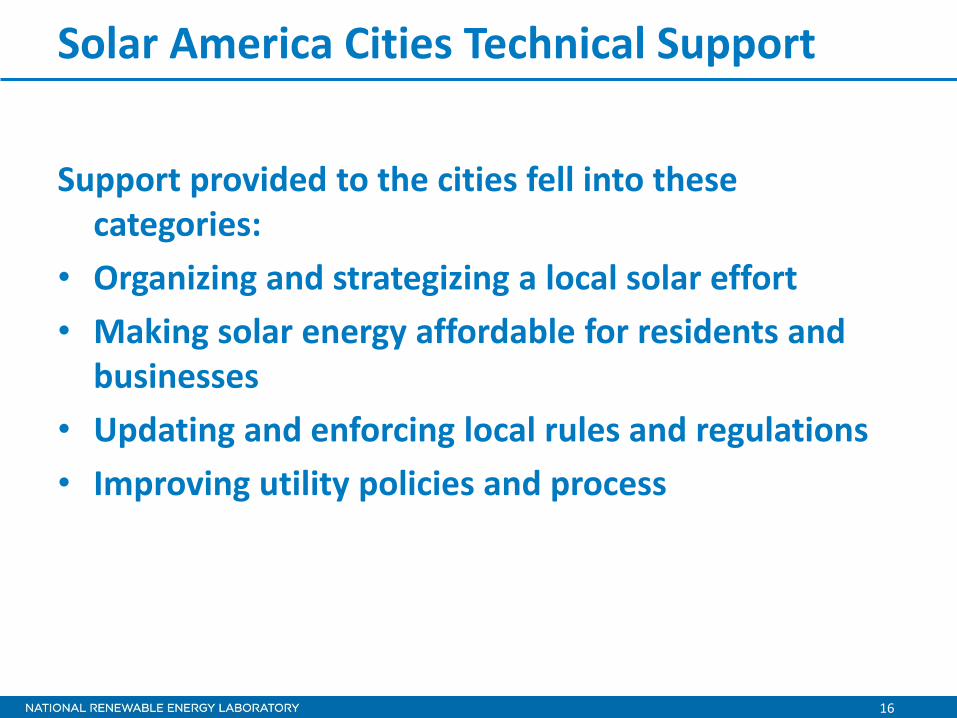
Support provided to the cities fell into these categories:
• Organizing and strategizing a local solar effort
• Making solar energy affordable for residents and businesses
• Updating and enforcing local rules and regulations
• Improving utility policies and process
17
Solar America Cities Technical Support
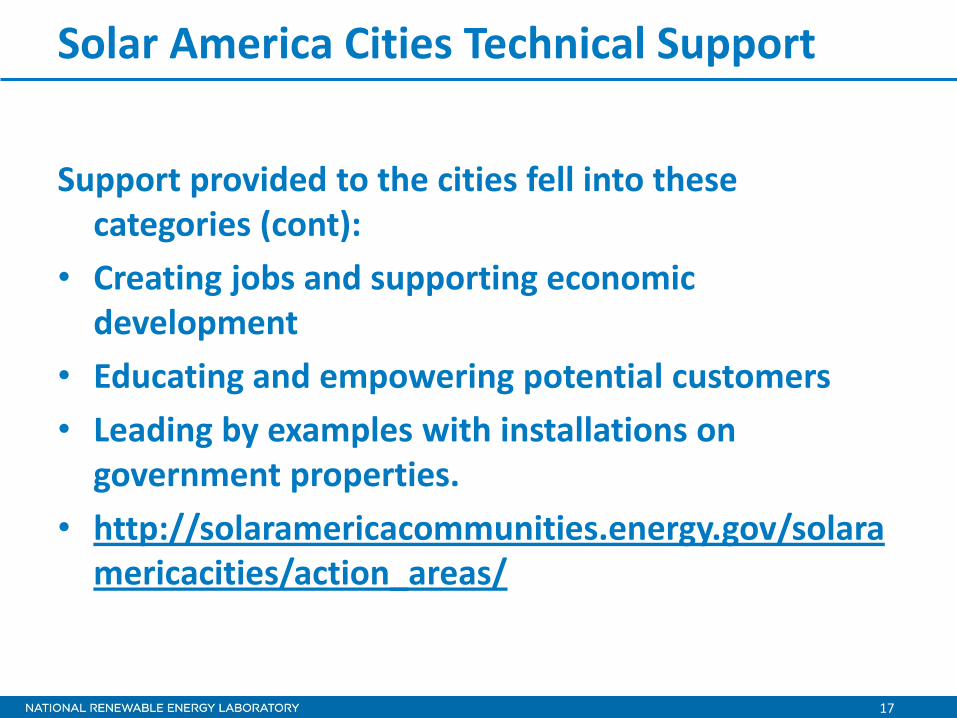
Support provided to the cities fell into these categories (cont):
• Creating jobs and supporting economic development
• Educating and empowering potential customers
• Leading by examples with installations on government properties.
• http://solaramericacommunities.energy.gov/solaramericacities/action_areas/
18
Synergies Between the Two Programs
• Draw upon experiences of Solar America Cities
o Share lessons learned and best practices
o Facilitate dialogue between American and Indian cities
19
Synergies Between the Two Programs
• Provide support in:
o Developing city plans
o Implementation support for overall program development
o Capacity building and training activities in the following areas:
– Technology-Focused
– Policy-Focused
– Financing-Focused
– Curriculum Development


NREL is a national laboratory of the U.S. Department of Energy, Office of Energy Efficiency and Renewable Energy, operated by the Alliance for Sustainable Energy, LLC.
Targeting Net Zero Energy for Military Installations
Venue: WREF 2012
Presenter: Kari Burman
Date: May 14, 2012
2
Overview
• A net zero energy installation (NZEI) is one that produces as much energy from on-site renewable sources as it consumes
• NZEI assessment provides a systematic approach to energy projects
• Analysis includes efficiency, renewables, transportation, and grid
• Goal of analysis is to lead to project implementation
• Full Report for MCBH-Kaneohe Bay: Targeting Net Zero Energy at Marine Corps Base Kaneohe Bay, Hawaii: Assessment
and Recommendations http://www.nrel.gov/docs/fy12osti/52897.pdf

3
Assessment Outline
• Baseline o Current energy consumption
• Energy Efficiency Measures o Retrofit improvement potential o New construction design
improvement and optimization
• Renewable Energy o Deployment of renewable energy
• Transportation o Reduce and replace fossil fuel use
• Electrical Systems o Interconnection and microgrid
• Implementation o Savings & Utility Contracts o Enhanced Use Lease
Typical
Community
Option 0Energy Efficiency
and Energy
Demand Reduction
En
erg
y L
oa
d (
$ o
r b
tu o
r C
O2)
buildings
vehicles
industry
Maximize
efficiency,
minimize
demand
Renewable
Option 1
Renewable
Option 2
Renewable
Option 3
Some combination
of options 1, 2 & 3
meet remaining load

Marine Corps Base Hawaii-Kaneohe Bay
Targeting Net Zero Energy at Marine Corps Base Kaneohe Bay, Hawaii: Assessment and Recommendations
http://www.nrel.gov/docs/fy12osti/52897.pdf (PDF 4.6 MB)

5
Baseline
•Determine installation energy boundary o MCBH-Kaneohe Bay is located on the eastern side of Oahu, HI o The energy boundary includes all on-site buildings and facilities and fleet vehicles
•Data
o NREL collected data for the most recent
full year, 2009.
o Electrical, thermal and transportation
o The metrics used is source Btu
Energy Use Breakdown for buildings % of Total Source MMBtu
MCBH- Kaneohe Bay Baseline
99%
1%
Electricity
propane
Baseline Annual Energy Usage Information
2009 (Source MMBtu)
Electricity (kWh) 419,788,096
Propane (MMBtu) 21,723
6
Baseline
Note: 95.88% of source Btu’s are from electricity and 4.12% from fuels *Source Btu analysis allows for the accounting of the energy required to transport fuel to the base and the energy losses due to inefficiencies in the electrical generation process. Conversion factors developed by NREL (3.92 source Btu/site Btu for electricity and 1.15 source Btu/site Btu fuel)

7
Energy Efficiency
7
Determine efficiency reduction potential
• MCBH- Kaneohe Bay has an Energy Savings Performance Contract in place
• Specific Main Base Facilities Modeled o Offices
o Commissary
o Barracks
o Main Gym
• Base Wide ECMs o Lighting Occupancy Sensors
o Computer Energy management
o Water Heater Boilers
• Analysis Tools and Methods o Efficient building retrofits
Building audit / walkthrough
o Building modeling e-Quest
Modeled electricity end use office buildings
• Installation details
o 6.1 M square feet and 800 facilities
• Average Energy Use Intensity ~ 50 kBtu /
sq. ft.
• Efficiency reduction potential = 73,169 MMBtu
o 20% reduction in office buildings
Sample Results from MCBH-Kaneohe Bay
8
Energy Efficiency Measure Savings (% of fuel type) MMBtu
Equivalent
Savings
% Total Site
Savings
Specific Base Facilities
Commissary (32% reduction) MWh 1,401 2.4% 4,780 2.1%
Barracks (40% reduction) MWh 7,497 12.8% 25,587 11.4%
Offices (43% reduction) MWh 3,215 5.5% 10,972 4.9%
Gym (52% reduction) MWh 467 0.8% 1,593 0.7%
Mess Hall (40% reduction) MWh 1,310 2.2% 4,470 2.0%
Base Wide ECMs
Retro-commissioning MWh 2,023 3.5% 6,904 3.1%
Lighting Occupancy Sensors MWh 935 1.6% 3,190 1.4%
Computer Energy Mgmt MWh 1,387 2.4% 4,732 2.1%
Water Heater Boilers MMBtu 1,251 4.8% 1,251 0.6%
Total
Electricity MWh 18,233 17.03% 62,211 15.9%
Propane MMBtu 1,251 6.62% 1,251 0.6%
Total MMBtu 63,462 16.5%
Total electrical reduction = 18,233 megawatt-hours (MWh) or 62,221 MMBtu (17.03% electrical load reduction) Total propane reduction = 1,251 MMBtu (6.62% propane load reduction)
Total reduction = 63,462 MMBtu (16.5% total reduction)
9
Renewable Energy
• Tools used in RE assessment o GIS resource screening tools, Renewable Energy
Optimization (REO), PV Watts, HOMER.
• Daylighting o Assessment restricted to warehouses
o MCBH Kaneohe has installed some skylights
• Solar Projects o Solar resource is good
o MCBH Kaneohe has task orders scheduled for 10 MW of PV (rooftop, carport & ground mount)
• Wind turbines o Wind resource is excellent. NREL completed a
wind resource study
o Wind turbines most economical form of renewable energy
o Small 2.4 kW wind turbine being installed now
• Solar Hot water (Thermal load ) o NREL team evaluated the feasibility of installing
solar water heating systems on 28 of the buildings and swimming pool
64 kW Rooftop PV at K-Bay
Potential wind turbine sites at K-Bay
10
Renewable Energy
Project Name Size Savings Source Btu Savings
MMBtu
% of Total
MMBtu
Electrical Reduction
PV 10 MW 15,432,643 kWh 206,412 14%
Wind Turbines 28.5 MW 92,879,232 kWh 1,242,263 86%
Daylighting 99,140 ft2 2,092,540 kWh 27,988 2%
Thermal Reduction
Solar Hot Water
257,509 ft2
112,389 therms
12,925
59%
After conservation and energy efficiency improvements are accounted for, the balance of energy consumption is met with renewable energy to reach NZEI electric & thermal (Note: solar hot water & daylighting are considered renewable energy)
Total electrical reduction = 110,403 MWh or 1,476,663 MMBtu (102% electrical load reduction) Total Thermal reduction = 12, 925 MMBtu (59 % propane load reduction- not fully net zero) In the future it may be possible to replace the remaining propane thermal load with hydrogen produced on site from renewables

11
Economic Analysis
MCAS Kaneohe Bay
Airport Runway
Kaneohe 50 m
Met Tower
100 m hill on
MCAS base
Pali Crater -
~1-200 m high
Jan Feb Mar Apr May Jun Jul Aug Sep Oct Nov Dec0
5,000
10,000
15,000
20,000
Pow
er (k
W)
Monthly Average Electric ProductionPVWindGrid
Production kWh/yr %
PV array 15,432,643 13
Wind turbines 78,213,952 65
Grid purchases 26,186,056 22
Total 119,832,648 100
System Components size and
Levelized Cost of Energy
PV array 10.0 MW
Wind Turbines 16 (1.5 MW each) 24.0 MW
Utility Cost (Baseline) $0.20/kWh
Levelized Cost of Energy of
Wind/PV/Grid Hybrid System
$0.09/kWh
PV, Wind Hybrid System Optimal Solution
Potential site for Wind turbines near Pali Crater/Met tower
12
Transportation Analysis • Baseline Fleet
o Obtained MCBH Kaneohe Bay’s fleet fuel consumption
o Obtained a fleet list and estimated driving usage
o Commuting patterns of staff were not available
o Kaneohe Bay recently installed E85 & B20 refueling pumps
o A portion of fleet is being converted to hydrogen vehicles by 2015.
• Tactical
o No analysis conducted by NREL
o Potential exists for future studies
Results From MCBH-Kaneohe Bay
1.89% 0.98%
97.13%
Gasoline
Diesel
JP-8
Baseline Annual Fuel Usage Information
2009
Total Gasoline (gallons) 181,802
Total Diesel (gallons) 93,967
Total JP-8 (gallons) 9,335,777
13
Transportation Analysis
Hydrogen fuel station – Hickam Air Force base, HI (powered by 120 kW solar array)
Similar station to be installed at Kaneohe Bay
• Switch to alternative fuel vehicles:
o MCBH Kaneohe Bay recently installed E85 & B20 refueling pumps.
• Hybrid electric vehicles (HEVs) and electric vehicles (EVs):
o HEVs are also being introduced into the MCBH Kaneohe Bay fleet to reduce their fuel use
• Hydrogen fuel cell vehicles:
o MCBH- Kaneohe Bay is converting some of fleet to new hydrogen fueled vehicles.
o Installing electrolysis equipment to produce hydrogen on site
o The hydrogen vehicle fleet is presently 3 sedans and electrolysis can handle additional 13 sedans
14
Electrical Systems Analysis
• High Penetration of Renewables
o Interconnecting 20-30 MW of wind is challenging on island grid
o Infrastructure would need to be upgraded to handle large variable power
• Analysis Required
o Power flow analysis
o Feasibility study
• Additional Considerations
o Utility interconnection may require storage to prevent from exporting power
o The electrolyzer may act as energy storage
o Using an electrolyzer to produce hydrogen on base could assist in smoothing the output power from the wind farm
o Potential for hydrogen fuel cell to be installed for complete microgrid (loss of utility) scenario
C
O O O
CC
C
O
C C
C
C
XFMR
#1
XFMR
#2
XFMR
#3
B5033
HECO XFMR’s 1,2 & 3 are 10 (12.5)
MVA capacity each (FA/FO)
HECO 46 KV
Koolau-Aikahi
Circuit
HECO 46 KV
Koolau-Kailua
Circuit
C
C
CC =Normally Closed
O =Normally Open
=Energized feeder
=De-energized feeder
=Alternate feeder
## =Critical Asset
12/8/08
O
MCBH ELECTRICAL ONE-LINE
A BUS B BUS C BUS
Legend
C
150 250
350
510 A200 A
1B
100 200 300
1B 3B 1A 2B
B5092
A BUS B BUS C BUS150 250 350
100 200 300
3-4B 3-3B 3-2B 3-1B3-1A 3-2A 3-2A 3-4A 12-1 12-2A 12-3 12-4 12-2 101 106 104 107 105 103 102
3A T3-2 3B T3-1 2A 2B T2-3 T2-1 T1-2 1A 1B T1-3
290 A
3A2A
Sub
#1
Sub
#2
Sub
#3
Main
Sub
B1125B820
1
1211
10987
654
3
2
20
191817
161514
13
282726
252423
21 22

15
Implementation
Financial Estimates NZEI assessments include potential methods for Implementation (PPA, ESPC, UESC & EUL)
Resource Commitment Provide implementation support after the assessment as part of the upfront project planning and budgeting

Mahalo- Thank you