Embed Size (px)
Citation preview

See important disclosures, including any required research certifications, beginning on page 19
China Consumer Discretionary
What's new: We are downgrading our rating on Guangzhou Automobile
(GAC) by 2 notches to Sell (5) and revising our earnings forecasts for
2016-17. We are doing this as we believe the current share price has
factored in the market’s expectations of strong earnings over this period but
fails to reflect the impact of a likely slowdown (vs. 1H16) in GAC’s Japan
JV sales volume growth and margin erosion for GAC Motor’s main growth
driver, its popular GS4 SUV, in 2H16.
What's the impact: Japan JV sales volume growth likely to slow in
2H16E. Unlike other analysts, we assume GAC Toyota’s sales volume
growth will be limited by its capacity constraints until 2018, when it adds
220,000 units, and that it is also facing the impact of a high base effect.
Similarly, we expect this high base to have a negative effect on GAC
Honda, slowing its sales volume growth for 2H16 (-0.1% YoY), vs. a 2%
YoY actual decline for 2Q16 and 27% YoY growth for 1Q16.
GAC Motor also facing high base and slowing margin improvement.
GAC Motor’s sales volume growth is now mostly driven by its Trumpchi
GS4, launched in May 2015. However, given tough competition from
domestic SUV OEMs, and corresponding ASP cuts by peers (Haval 6 and
CS75), we expect its sales growth to slow to around 26% YoY for 2H16E,
from 170% YoY for 1H16. Likewise, we don’t expect GAC Motor’s 2H16E
gross margin to perform as well as it did for 1Q16 (up 5pp YoY, PRC
GAAP), with expansion of only 2.5pp YoY for full-year 2016E.
Despite these headwinds, we raise our overall GAC 2016-18E revenue by
2-7% and core EPS by 1-3% on our overall higher sales volume
assumptions. Accordingly, our 12-month TP rises to HKD8.50, from
HKD8.30, on unchanged target PER of 8x on the average of our 2016-17E
EPS (previously 2016E).
What we recommend: We think the current share price reflects the
market’s expectations of strong 1H16 results, and thus recommend
investors take profit now before investor sentiment turns weak in 2H16. The
current share price implies 2016-17E PERs of 9-10x, which we see as
unattractive, particularly if we factor in the declining popularity of Japanese
brands in China. The key upside risk: stronger-than-expected PV sales.
How we differ: Our target price is lower than the consensus view
(HKD10.5), due mainly to our revised 2016-18E EPS being 9-13% lower
and our target multiple (8x) being lower (consensus: 8.6x). This reflects our
concern that sentiment on the stock would turn weaker in 2H16 on its
slower sales volume growth.
20 July 2016
Guangzhou Automobile Group
Downgrading: time to take profit
Unlike the market, we see lower 2H16 sales growth from Japan JVs
Gross margin for its popular GS4 likely to come under pressure in 2H16
Downgrading our rating on the stock to Sell (5) from Hold (3)
Source: Daiwa forecasts
Source: FactSet, Daiwa forecasts
Guangzhou Automobile Group (2238 HK)
Target price: HKD8.50 (from HKD8.30)
Share price (19 Jul): HKD10.38 | Up/downside: -18.1%
Kelvin Lau(852) 2848 4467
Brian Lam(852) 2532 4341
Forecast revisions (%)
Year to 31 Dec 16E 17E 18E
Revenue change 1.7 7.1 7.0
Net profit change 0.7 1.8 3.4
Core EPS (FD) change 0.7 1.8 3.4
80
109
138
166
195
4
6
7
9
11
Jul-15 Oct-15 Jan-16 Apr-16
Share price performance
Gzhou Auto (LHS) Relative to HSI (RHS)
(HKD) (%)
12-month range 4.88-10.42
Market cap (USDbn) 8.61
3m avg daily turnover (USDm) 15.41
Shares outstanding (m) 6,435
Major shareholder GZ Auto Industry Grp (57.6%)
Financial summary (CNY)
Year to 31 Dec 16E 17E 18E
Revenue (m) 47,350 52,559 55,456
Operating profit (m) 1,083 1,210 1,292
Net profit (m) 5,625 6,123 6,750
Core EPS (fully-diluted) 0.874 0.951 1.049
EPS change (%) 34.2 8.8 10.2
Daiwa vs Cons. EPS (%) (9.4) (13.3) (11.6)
PER (x) 10.2 9.4 8.5
Dividend yield (%) 3.1 3.4 3.8
DPS 0.282 0.307 0.338
PBR (x) 1.3 1.2 1.1
EV/EBITDA (x) 13.3 10.9 9.1
ROE (%) 13.8 13.6 13.6

2
Guangzhou Automobile Group (2238 HK): 20 July 2016
Table of contents
Time to change direction ......................................................................................... 6
Valuation no longer cheap .................................................................................................6
Japan OEMs sales volume unlikely to surprise ..................................................................7
GAC Motor may see more margin pressure in 2H16 ..........................................................9
GAC Fiat may break even this year, but its earnings contribution is likely to be limited .... 10
Our counter-consensus view ............................................................................................ 12
Valuation and recommendation .............................................................................14
New 12-month target price of HKD8.50 ........................................................................... 14
Risks to our view .............................................................................................................. 14
Appendix ..................................................................................................................16

3
Guangzhou Automobile Group (2238 HK): 20 July 2016
How do we justify our view?
Growth outlook Valuation Earnings revisions
Growth outlook GAC: adjusted net profit and growth
We look for GAC’s net profit to rise by 34% YoY to
CNY5.6bn for 2016, on the back of Japanese JV sale
volume growth of 5-7% (but lower than 1H16). We expect
GAC Motor’s sales in 2016 to be driven by its GS4 model,
boosting GAC Motor’s gross margin by 2-3pp. Meanwhile,
we expect GAC Fiat to turn from a net loss of CNY500m
for 2015 to breaking even on the strong performance of the
Cherokee, but still unlikely to record a net profit due to the
recent additional capacity coming online at its factory in
Guangzhou. For 2017 and 2018, we forecast net profit
growth of 9% YoY and 10% YoY, respectively, mainly
driven by GAC Motor’s growing sales and GAC Fiat’s
improved margin.
Source: Company, Daiwa forecasts
Valuation GAC: 12-month forward PER (x)
We raise our 12-month TP to HKD8.5 (from HKD8.30),
based on an unchanged target PER of 8x on the average
of our 2016-17E EPS, which is at the low end of the target
PER range of 7-11x that we apply to the auto OEMs in our
universe.
We think GAC’s Japanese JV sales volume will be limited
by capacity constraints in 2H16 and affected by the fierce
competition from both the European brands in the tier-1
cities and domestic brands in the lower-tier cities.
Meanwhile, we don’t expect GAC’s domestic brand to be
able to sustain the fat gross margin of 1Q16 as we expect
more promotions due to the competition.
Source: Bloomberg, Daiwa forecasts
Earnings revisions GAC: consensus 2016-17E EPS revisions
We have been seeing the Bloomberg consensus make
upward earnings revisions for the stock since April 2016
due to GAC Motor’s improved gross margin and its
satisfactory 4Q15-1Q16 earnings. However, we think the
current share price now reflects the market’s expectations
for 2016 and 2017. Our EPS forecasts for 2016-17E are
now 9-13% below consensus, as we assume weaker PV
sales volume growth for GAC Honda and GAC Toyota on
the capacity constraints and high base effect, and
because we see limited margin expansion for GAC Motor
due to the severe competition in the domestic SUV market.
Source: Bloomberg
(80%)
(30%)
20%
70%
120%
170%
0
1,000
2,000
3,000
4,000
5,000
6,000
7,000
8,000
2011 2012 2013 2014 2015E 2016E 2017E 2018E
Net profit (LHS) YoY Growth (RHS)
(CNYm)
5
7
9
11
13
15
Jul-1
3
Sep
-13
Nov
-13
Jan-
14
Mar
-14
May
-14
Jul-1
4
Sep
-14
Nov
-14
Jan-
15
Mar
-15
May
-15
Jul-1
5
Sep
-15
Nov
-15
Jan-
16
Mar
-16
May
-16
Jul-1
6
PER +1 SD Average PER -1 SD
(PER)
0.35
0.45
0.55
0.65
0.75
0.85
0.95
1.05
1.15
Jan-
15
Feb
-15
Mar
-15
Apr
-15
May
-15
Jun-
15
Jul-1
5
Aug
-15
Sep
-15
Oct
-15
Nov
-15
Dec
-15
Jan-
16
Feb
-16
Mar
-16
Apr
-16
May
-16
Jun-
16
Jul-1
6
(CNY)
2016E 2017E

4
Guangzhou Automobile Group (2238 HK): 20 July 2016
Financial summary
Key assumptions
Profit and loss (CNYm)
Cash flow (CNYm)
Source: FactSet, Daiwa forecasts
Year to 31 Dec 2011 2012 2013 2014 2015 2016E 2017E 2018E
Volume - GAC Honda (unit) 362,000 316,000 435,000 480,000 580,000 620,000 634,000 646,000
Volume - GAC Toyota (unit) 274,000 250,000 303,000 374,000 403,000 418,000 430,000 450,000
Volume - GAC Motor (unit) 31,000 59,000 109,000 135,000 195,000 328,000 373,000 384,000
Volume Growth - GAC Honda (%) (6.2) (12.7) 37.7 10.3 20.8 6.9 2.3 1.9
Volume Growth - GAC Toyota (%) 1.9 (8.8) 21.2 23.4 7.8 3.7 2.9 4.7
Volume Growth - GAC Motor (%) (20.5) 90.3 84.7 23.9 44.4 68.2 13.7 2.9
Year to 31 Dec 2011 2012 2013 2014 2015 2016E 2017E 2018E
Vehcicle-related operations 10,719 12,713 18,124 21,560 28,285 45,877 50,791 53,335
Other revenue 266 251 700 823 1,133 1,473 1,767 2,121
Other Revenue 0 0 0 0 0 0 0 0
Total Revenue 10,984 12,964 18,824 22,383 29,418 47,350 52,559 55,456
Other income 836 8 117 357 412 663 736 776
COGS (10,560) (12,274) (16,830) (19,831) (25,975) (40,633) (45,094) (47,565)
SG&A (1,806) (2,147) (2,784) (3,724) (3,904) (6,298) (6,990) (7,376)
Other op.expenses 0 0 0 0 0 0 0 0
Operating profit (545) (1,449) (672) (814) (48) 1,083 1,210 1,292
Net-interest inc./(exp.) (41) (193) (169) (307) (310) (166) (168) (156)
Assoc/forex/extraord./others 4,643 2,641 3,470 4,187 4,744 5,152 5,563 6,146
Pre-tax profit 4,057 1,000 2,629 3,066 4,386 6,068 6,605 7,283
Tax 110 65 (101) (131) (400) (759) (826) (910)
Min. int./pref. div./others 105 69 124 259 226 316 343 379
Net profit (reported) 4,272 1,134 2,653 3,194 4,212 5,625 6,123 6,749
Net profit (adjusted) 4,272 1,134 2,653 3,194 4,212 5,625 6,123 6,750
EPS (reported)(CNY) 0.695 0.178 0.412 0.496 0.654 0.874 0.951 1.049
EPS (adjusted)(CNY) 0.695 0.178 0.412 0.496 0.654 0.874 0.951 1.049
EPS (adjusted fully-diluted)(CNY) 0.695 0.178 0.412 0.496 0.652 0.874 0.951 1.049
DPS (CNY) 0.209 0.091 0.160 0.160 0.200 0.282 0.307 0.338
EBIT (545) (1,449) (672) (814) (48) 1,083 1,210 1,293
EBITDA (55) (781) 279 402 1,600 2,934 3,411 3,856
Year to 31 Dec 2011 2012 2013 2014 2015 2016E 2017E 2018E
Profit before tax 4,057 1,000 2,629 3,066 4,386 6,068 6,605 7,283
Depreciation and amortisation 490 668 951 1,216 1,648 1,851 2,201 2,564
Tax paid (81) (117) (172) (85) (91) (759) (826) (910)
Change in working capital (422) 1,555 566 614 3,115 243 433 235
Other operational CF items (4,677) (2,621) (3,426) (4,463) (5,167) (4,415) (4,727) (5,239)
Cash flow from operations (633) 485 548 348 3,891 2,989 3,686 3,933
Capex (2,244) (2,948) (1,904) (3,513) (4,322) (5,025) (5,206) (5,396)
Net (acquisitions)/disposals (1,079) (1,307) (1,077) (89) (1,938) 0 0 0
Other investing CF items 3,056 6,585 3,689 348 7,002 3,776 4,121 4,451
Cash flow from investing (267) 2,329 708 (3,254) 742 (1,249) (1,085) (945)
Change in debt 429 38 4,041 28 (2,469) 2,000 1,500 1,000
Net share issues/(repurchases) 0 0 0 0 0 0 0 1
Dividends paid (686) (1,757) (538) (1,172) (1,068) (1,287) (1,813) (1,974)
Other financing CF items 56 (31) 9 242 165 (487) (587) (659)
Cash flow from financing (201) (1,749) 3,512 (902) (3,372) 226 (900) (1,631)
Forex effect/others 0 0 0 0 0 0 0 1
Change in cash (1,102) 1,065 4,767 (3,807) 1,260 1,966 1,701 1,357
Free cash flow (2,877) (2,463) (1,356) (3,164) (431) (2,036) (1,520) (1,463)

5
Guangzhou Automobile Group (2238 HK): 20 July 2016
Financial summary continued …
Balance sheet (CNYm)
Key ratios (%)
Source: FactSet, Daiwa forecasts
As at 31 Dec 2011 2012 2013 2014 2015 2016E 2017E 2018E
Cash & short-term investment 8,239 9,316 14,083 10,274 11,548 13,514 15,216 16,573
Inventory 1,537 1,397 2,036 2,661 1,927 3,386 3,758 3,964
Accounts receivable 2,980 3,303 4,725 5,516 8,727 15,152 16,819 17,746
Other current assets 8,903 6,258 5,669 8,434 5,696 5,696 5,696 5,696
Total current assets 21,659 20,274 26,514 26,886 27,898 37,748 41,488 43,978
Fixed assets 4,309 5,927 7,366 8,544 10,581 13,247 15,864 18,430
Goodwill & intangibles 3,257 4,141 4,234 5,547 6,647 7,155 7,543 7,811
Other non-current assets 15,388 19,091 19,729 21,486 22,094 23,469 24,912 26,606
Total assets 44,612 49,434 57,843 62,463 67,220 81,620 89,807 96,825
Short-term debt 2,100 2,515 9,397 9,541 4,279 3,279 2,779 2,779
Accounts payable 4,069 6,376 8,637 10,651 14,077 22,021 24,438 25,777
Other current liabilities 37 139 25 41 300 484 537 566
Total current liabilities 6,206 9,030 18,059 20,232 18,656 25,783 27,754 29,123
Long-term debt 7,737 7,776 4,775 4,769 7,649 10,649 12,649 13,649
Other non-current liabilities 483 564 893 1,212 1,424 1,424 1,424 1,424
Total liabilities 14,426 17,370 23,727 26,214 27,728 37,855 41,826 44,195
Share capital 6,148 6,435 6,435 6,435 6,435 6,435 6,435 6,436
Reserves/R.E./others 23,062 24,707 26,876 29,018 32,211 36,550 40,859 45,637
Shareholders' equity 29,210 31,142 33,311 35,453 38,647 42,985 47,294 52,073
Minority interests 976 922 805 796 845 779 686 557
Total equity & liabilities 44,612 49,434 57,843 62,463 67,220 81,620 89,807 96,825
EV 45,809 42,632 40,086 43,756 40,363 38,957 37,219 35,040
Net debt/(cash) 1,598 975 89 4,036 379 413 212 (145)
BVPS (CNY) 4.751 4.894 5.177 5.509 6.006 6.680 7.350 8.092
Year to 31 Dec 2011 2012 2013 2014 2015 2016E 2017E 2018E
Sales (YoY) 25.6 18.0 45.2 18.9 31.4 61.0 11.0 5.5
EBITDA (YoY) n.a. n.a. n.a. 44.0 298.2 83.3 16.3 13.0
Operating profit (YoY) n.a. n.a. n.a. n.a. n.a. n.a. 11.7 6.9
Net profit (YoY) (0.5) (73.5) 133.9 20.4 31.9 33.6 8.8 10.2
Core EPS (fully-diluted) (YoY) (24.4) (74.4) 131.3 20.4 31.3 34.2 8.8 10.2
Gross-profit margin 3.9 5.3 10.6 11.4 11.7 14.2 14.2 14.2
EBITDA margin n.a. n.a. 1.5 1.8 5.4 6.2 6.5 7.0
Operating-profit margin n.a. n.a. n.a. n.a. n.a. 2.3 2.3 2.3
Net profit margin 38.9 8.7 14.1 14.3 14.3 11.9 11.6 12.2
ROAE 15.6 3.8 8.2 9.3 11.4 13.8 13.6 13.6
ROAA 10.3 2.4 4.9 5.3 6.5 7.6 7.1 7.2
ROCE n.a. n.a. n.a. n.a. n.a. 2.0 2.0 2.0
ROIC (1.9) (4.5) (1.9) (2.1) (0.1) 2.3 2.3 2.2
Net debt to equity 5.5 3.1 0.3 11.4 1.0 1.0 0.4 net cash
Effective tax rate n.a. n.a. 3.8 4.3 9.1 12.5 12.5 12.5
Accounts receivable (days) 96.8 88.4 77.8 83.5 88.4 92.0 111.0 113.7
Current ratio (x) 3.5 2.2 1.5 1.3 1.5 1.5 1.5 1.5
Net interest cover (x) n.a. n.a. n.a. n.a. n.a. 6.5 7.2 8.3
Net dividend payout 30.1 51.1 38.8 32.2 30.6 32.2 32.2 32.2
Free cash flow yield n.a. n.a. n.a. n.a. n.a. n.a. n.a. n.a.
Company profile
GAC is engaged in the manufacturing of vehicles and parts, as well as automobile finance and
insurance and related services. It sells passenger vehicles under the Trumpchi marque, passenger
and commercial vehicles under Gonow, SUVs under Changfeng Motor, and buses under GAC Bus.
GAC has also formed JVs with a number of foreign brands, including Honda, Toyota, Mitsubishi and
Fiat to sell passenger vehicles. It sells commercial vehicles through its GAC Bus and GAC Hino
businesses.

6
Guangzhou Automobile Group (2238 HK): 20 July 2016
Time to take profit
Valuation no longer cheap
Time to take a more rational view
The stock is now trading at 2016-17 PERs of 9-10x on our forecasts, which is at the high
end of the range for the conventional auto OEMs (7-11x), and higher than its past-3-year
average 12-month-forward PER of 9x. This includes the 2H13 period, when its PER was at
a high premium to peers due to what see as overly optimistic sentiment on GAC’s earnings
growth for 2013 and 2014.
GAC’s PER reverted to its normal level after 2H13, breaking the 10x level only in 1H15
when the Hang Seng Index rallied strongly on the back of positive sentiment on China’s
stock market due to the launch of the Shanghai-Hong Kong Stock Connect. Thus, we think
the stock’s current valuation is now demanding, especially considering its slowing sales
volume growth and likely lower magnitude of margin improvement in 2H16E vs. 1H16 for
its key brands GAC Honda, GAC Toyota and GAC Motor.
GAC: 12-month forward PER bands (x)
Source: Bloomberg, Daiwa Forecasts
5
6
7
8
9
10
11
12
13
14
15
Jul-1
3
Aug
-13
Sep
-13
Oct
-13
Nov
-13
Dec
-13
Jan-
14
Feb
-14
Mar
-14
Apr
-14
May
-14
Jun-
14
Jul-1
4
Aug
-14
Sep
-14
Oct
-14
Nov
-14
Dec
-14
Jan-
15
Feb
-15
Mar
-15
Apr
-15
May
-15
Jun-
15
Jul-1
5
Aug
-15
Sep
-15
Oct
-15
Nov
-15
Dec
-15
Jan-
16
Feb
-16
Mar
-16
Apr
-16
May
-16
Jun-
16
Jul-1
6
PER +1 SD Average PER -1 SD
(PER)
The stock is now trading
at a higher valuation
than its peers and above
its past-3-year average

7
Guangzhou Automobile Group (2238 HK): 20 July 2016
Global automotive OEMs: valuation comparison
Name Bloomberg Trading Share price Rating PER (x) PBR (x) EV/EBITDA(x) Div yield (%) ROE (%)
Code Currency 19-Jul-16 FY16E FY17E FY16E FY17E FY16E FY17E FY16E FY17E FY16E FY17E
China H-share listed
Geely Automobile Holdings Lt * 175 HK HKD 4.83 Buy 10.9 9.3 1.6 1.4 4.6 3.5 1.1 1.3 16.0 16.2
BAIC Motor Corp Ltd-H * 1958 HK HKD 6.18 Sell 10.7 9.8 1.1 1.0 4.7 3.8 3.2 3.5 10.4 10.5
BYD Co Ltd-H * 1211 HK HKD 52.55 Buy 23.4 19.6 2.4 2.1 10.4 9.1 n.a. n.a. 11.9 10.9
Great Wall Motor Company-H * 2333 HK HKD 7.05 Hold 7.7 7.5 1.3 1.2 5.1 4.9 4.0 4.1 17.6 16.1
Guangzhou Automobile Group-H * 2238 HK HKD 10.38 Sell 10.2 9.4 1.3 1.2 13.3 10.9 3.1 3.4 13.8 13.6
Dongfeng Motor Grp Co Ltd-H * 489 HK HKD 8.78 Outperform 5.5 5.2 0.7 0.6 7.7 5.8 2.8 2.9 13.3 12.5
Brilliance China Automotive * 1114 HK HKD 8.84 Buy 11.1 8.9 1.7 1.4 n.a. n.a. 1.1 1.4 16.2 17.4
China A-share listed
Byd Co Ltd -A 002594 CH CNY 62.80 NR 33.1 28.4 4.0 3.5 16.4 14.3 0.0 0.0 13.0 13.6
Guangzhou Automobile Group-A 601238 CH CNY 23.50 NR 24.0 19.9 3.4 3.0 37.8 33.3 0.0 0.0 14.9 16.0
Great Wall Motor Co Ltd-A 601633 CH CNY 9.89 NR 10.7 9.6 2.0 1.8 6.4 6.1 0.0 0.0 20.6 19.4
Saic Motor Corp Ltd-A 600104 CH CNY 21.72 NR 7.7 7.3 1.3 1.2 10.7 9.1 0.1 0.1 17.1 16.8
Chongqing Changan Automobi-B 200625 CH HKD 12.10 NR 4.3 4.0 1.1 1.0 24.8 10.8 0.1 0.1 29.1 25.9
Faw Car Company Limited-A 000800 CH CNY 10.82 NR 318.2 470.4 2.0 1.9 17.0 14.9 n.a. n.a. 6.9 6.8
Anhui Jianghuai Auto Co-A 600418 CH CNY 12.60 NR 15.5 12.7 1.8 1.6 7.6 8.4 0.0 0.0 12.4 13.8
Jiangsu Yueda Investment C-A 600805 CH CNY 9.65 NR n.a. n.a. n.a. n.a. n.a. n.a. n.a. n.a. n.a. n.a.
Tianjin Faw Xiali Automobi-A 000927 CH CNY 5.24 NR n.a. n.a. n.a. n.a. n.a. n.a. n.a. n.a. n.a. n.a.
Lifan Industry Group Co Lt-A 601777 CH CNY 11.68 NR 21.6 16.7 n.a. n.a. n.a. n.a. n.a. n.a. n.a. n.a.
Haima Automobile Group Co-A 000572 CH CNY 5.31 NR n.a. n.a. n.a. n.a. n.a. n.a. n.a. n.a. n.a. n.a.
Shenyang Jinbei Automotive-A 600609 CH CNY 4.88 NR n.a. n.a. n.a. n.a. n.a. n.a. n.a. n.a. n.a. n.a.
US
Tesla Motors Inc TSLA US USD 225.26 NR 819.1 89.3 17.5 14.6 47.1 24.6 n.a. n.a. n.a 12.3
Ford Motor Co * F US USD 13.65 Hold 6.6 6.6 1.6 1.4 3.0 3.0 0.0 0.0 29.5 22.9
General Motors Co * GM US USD 31.25 Outperform 5.5 5.4 1.1 0.9 2.5 2.5 0.0 0.1 22.2 18.8
Europe
Daimler Ag-Registered Shares DAI GR EUR 57.43 NR 7.3 6.9 1.1 1.0 2.2 2.1 0.1 0.1 15.7 15.0
Bayerische Motoren Werke AG BMW GR EUR 73.16 NR 7.6 7.5 1.0 1.0 6.2 6.1 0.0 0.0 14.1 13.2
Volkswagen AG VoW GR EUR 126.75 NR 6.9 6.0 0.7 0.6 1.4 1.3 0.0 0.0 9.9 10.2
Fiat Chrysler Automobiles NV FCA IM EUR 5.99 NR 4.4 3.5 0.5 0.5 1.5 1.4 0.0 0.0 12.3 14.2
Peugeot SA UG FP EUR 11.84 NR 7.4 6.5 0.9 0.8 1.4 1.4 0.0 0.0 12.8 13.6
Renault SA RNO FP EUR 74.22 NR 6.3 5.6 0.7 0.6 3.4 3.2 0.0 0.0 11.5 12.0
Japan
Honda Motor Co Ltd *, ** 7267 JP JPY 2824.50 Hold 9.3 10.4 0.7 0.7 6.9 7.4 0.0 0.0 7.7 7.1
Nissan Motor Co Ltd *, ** 7201 JP JPY 1043.00 Hold 7.8 7.8 0.9 0.8 2.6 2.7 0.0 0.0 11.2 10.7
Toyota Motor Corp *, ** 7203 JP JPY 5784.00 Outperform 7.7 10.6 1.0 1.0 8.4 10.7 0.0 0.0 13.4 9.9
Korea
Hyundai Motor Co * 005380 KS KRW 130000.00 Buy 5.4 5.2 0.4 0.4 4.2 3.8 3.5 4.0 9.7 9.4
Kia Motors Corp * 000270 KS KRW 41700.00 Outperform 5.9 5.6 0.6 0.6 3.4 3.0 2.9 3.1 11.2 10.7
India
Tata Motors Ltd ** TTMT IN INR 499.25 NR 14.2 10.7 2.2 1.8 4.9 4.1 0.0 0.0 16.4 17.8
Mahindra & Mahindra Ltd ** MM IN INR 1456.60 NR 25.4 20.0 3.2 2.9 14.6 11.8 0.0 0.0 12.4 14.2
Total Weighted average 39.9 13.4 1.8 1.6 8.2 7.3 0.4 0.4 14.1 13.1
High 819.1 470.4 17.5 14.6 47.1 33.3 4.0 4.1 29.5 25.9
Low 4.3 3.5 0.4 0.4 1.4 1.3 0.0 0.0 6.9 6.8
Median 7.8 8.9 1.2 1.1 6.2 5.8 0.0 0.0 13.3 13.6
Source: Bloomberg, *Daiwa forecasts Note: **Mar year-end Pricing as at 19 July 2016
Japan OEMs sales volume unlikely to surprise
Capacity constraints put the brakes on GAC Toyota
According to our discussion with management this week, GAC Toyota hasn't changed its
plans to expand annual capacity by 220,000 units, and this will come online by end-2017
or January 2018. For 1H16, GAC Toyota reported 8% YoY sales volume growth to 209,000
units (approximately 35,000 units a month), mainly due to an increase in the sales of its
Levin sedan (launched in August 2014, its new hybrid launched in March 2016) and its new
version of the Highlander, launched in March 2015.
This is close to its current monthly capacity of close to 32,000 units per month (or 380,000
units a year). However, in our view, 2H16 will be partly affected by the high base in 2H15
(especially for the Highlander) and the likely weak performance of the Camry, whose sales
volume declined by 26.9% YoY in 1H16. We estimate that GAC Toyota would report sales
volume growth of 5% for 2016 and 1% YoY for 2017, with a utilisation rate of 112% and
113%, respectively.
Will likely reach capacity
bottleneck in 2016
8
Guangzhou Automobile Group (2238 HK): 20 July 2016
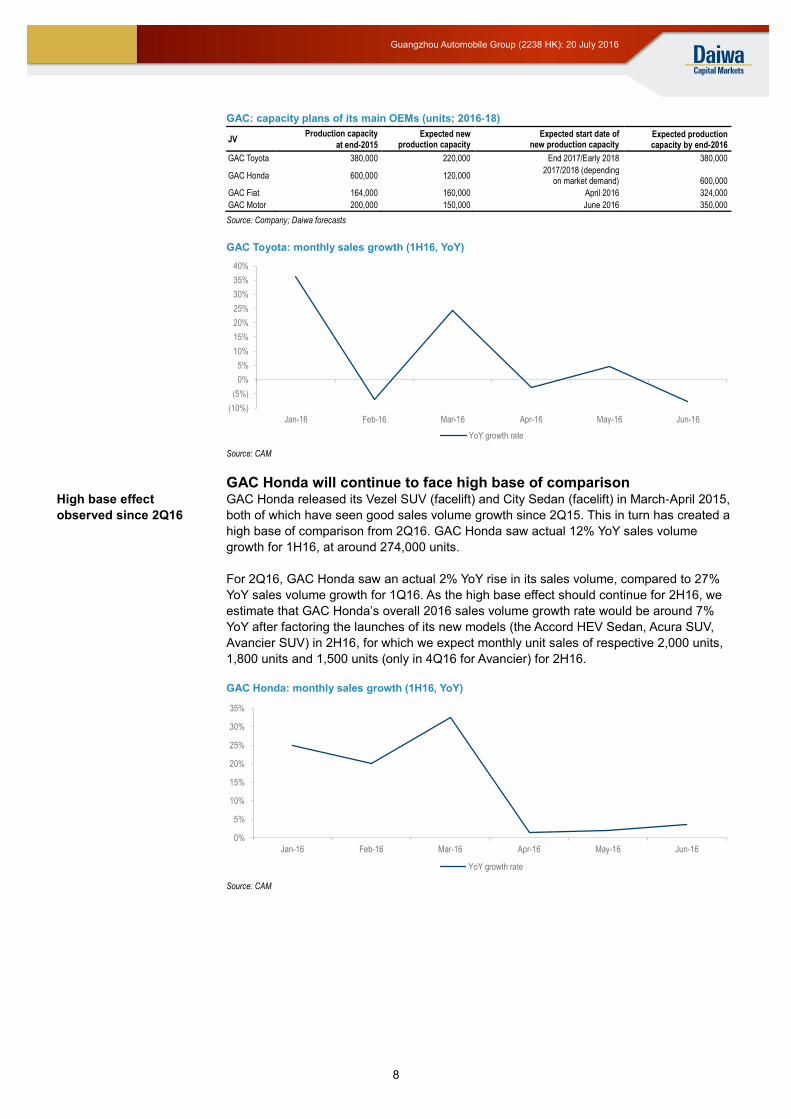
GAC: capacity plans of its main OEMs (units; 2016-18)
JV Production capacity
at end-2015
Expected new production capacity
Expected start date of new production capacity
Expected production capacity by end-2016
GAC Toyota 380,000 220,000 End 2017/Early 2018 380,000
GAC Honda 600,000 120,000 2017/2018 (depending
on market demand) 600,000
GAC Fiat 164,000 160,000 April 2016 324,000
GAC Motor 200,000 150,000 June 2016 350,000
Source: Company; Daiwa forecasts
GAC Toyota: monthly sales growth (1H16, YoY)
Source: CAM
GAC Honda will continue to face high base of comparison GAC Honda released its Vezel SUV (facelift) and City Sedan (facelift) in March-April 2015,
both of which have seen good sales volume growth since 2Q15. This in turn has created a
high base of comparison from 2Q16. GAC Honda saw actual 12% YoY sales volume
growth for 1H16, at around 274,000 units.
For 2Q16, GAC Honda saw an actual 2% YoY rise in its sales volume, compared to 27%
YoY sales volume growth for 1Q16. As the high base effect should continue for 2H16, we
estimate that GAC Honda’s overall 2016 sales volume growth rate would be around 7%
YoY after factoring the launches of its new models (the Accord HEV Sedan, Acura SUV,
Avancier SUV) in 2H16, for which we expect monthly unit sales of respective 2,000 units,
1,800 units and 1,500 units (only in 4Q16 for Avancier) for 2H16.
GAC Honda: monthly sales growth (1H16, YoY)
Source: CAM
(10%)
(5%)
0%
5%
10%
15%
20%
25%
30%
35%
40%
Jan-16 Feb-16 Mar-16 Apr-16 May-16 Jun-16
YoY growth rate
0%
5%
10%
15%
20%
25%
30%
35%
Jan-16 Feb-16 Mar-16 Apr-16 May-16 Jun-16
YoY growth rate
High base effect
observed since 2Q16

9
Guangzhou Automobile Group (2238 HK): 20 July 2016
GAC Honda: the Acura GAC Honda: the Avancier
Source: Hexun media Source: Autohome
GAC Motor may see more margin pressure in 2H16
High base likely to weigh on GAC Motor’s sales volume growth
GAC Motor achieved actual sales volume growth of 170% YoY for 1H16 due to strong
sales of its Trumpchi GS4, which was launched in May 2015. However, we believe the high
base in 2H15 will cap the 2H16 YoY sales growth rate at 26%, after factoring in the
contribution from several of its new models (GS8, GS4EV, GS3S PHEV) to be launched in
2H16, resulting in 73% YoY sales growth for 2016, on our estimates.
GAC Motor: monthly sales volume breakdown for 2015 and 1H16
Source: CAM
Improved gross margin for Trumpchi GS4 may not be sustainable in 2H16
GAC Motor’s gross margin rose significantly in 1Q16 (around a 5pp improvement from the
12% for 2015), mainly on the back of economies of scale for the GS4 SUV. But we do not
think such a strong margin can be sustained due to the tougher competition. The increase
in peers’ promotions and more competition from models such as GWM’s Haval H6 and
Changan’s CS75 is likely to have an impact on the selling price of the GS4 in 2H16, which
will be reflected in its gross margin for 2016, in our view. Also, we think GAC Motor’s
150,000 unit new capacity additions, due to start operations in 3Q16, will further weigh on
the business’s gross margin.
China autos OEMs: official price cuts by the main domestic SUVs makers
Automobile OEMs Models Selling price range
currently (CNY’000) Official price cut
(CNY’000) Official price
cut date Avg sales units
per month in 1H16
GAC Trumpchi GS4 100-154 n.a n.a 25,133
Changan CS75 93-158 4-10 Mar-16 16,143
Greatwall Haval H6 88-163 5-30 Mar-16 40,042
Geely Boyue (NL3) 100-158 n.a n.a 4,803
Source: CAM, Autohome,
0
5,000
10,000
15,000
20,000
25,000
30,000
35,000
Jan-
15
Feb
-15
Mar
-15
Apr
-15
May
-15
Jun-
15
Jul-1
5
Aug
-15
Sep
-15
Oct
-15
Nov
-15
Dec
-15
Jan-
16
Feb
-16
Mar
-16
Apr
-16
May
-16
Jun-
16
(units)
GS4 GS5 Others
Margin pressure
expected due to likely
ASP declines and new
capacity

10
Guangzhou Automobile Group (2238 HK): 20 July 2016
China autos OEMs: main domestic SUV monthly sales in 1H16
Source: CAM
Apart from the Trumpchi GS4 models, we do not expect GAC Motor to launch any other
models that will be as popular in the near term. All of its models, except for the GS4,
recorded actual negative sales growth for 1H16. For example, the recently launched
version of the GS5, the GS5 Super, has not been well received by consumers.
For 2H16, GAC Motor will launch 3 new models — the GS8 SUV, GA3S PHEV Sedan and
GS4 EV SUV — but we don’t expect any of these to become flagship models for GAC
Motor. The GS8 SUV (to be launched in September/October 2016), positioned at the same
price point as the Haval H8/H9, is likely to be threatened by a number of foreign JV SUVs.
Meanwhile, we estimate that GAC Motor’s NEV models would account for only around
1,000 units a month once they are launched in 3Q16, as the market is still small and GAC
Motor is also fairly new.
GAC Motor: the Trumpchi GS8
Source: Autohome
GAC Fiat may break even this year, but its earnings contribution is likely to be limited
Ramp-up of Cherokee should be a sales driver for GAC Fiat
GAC Fiat launched its Cherokee model in November 2015, and quickly ramped up
production soon afterwards. The Cherokee SUV recorded monthly sales of 8,500-9,200
units for March 2016 to June 2016, and we believe its sales volume will hold steady at this
level for the remainder of 2016.
0
10,000
20,000
30,000
40,000
50,000
Jan-16 Feb-16 Mar-16 Apr-16 May-16 Jun-16
(units)
Trumpchi CS4 Changan CS75 GWM Haval H6 Geely Boyue (NL3)
GS5 cannot extend the
momentum from GS4
Cherokee and Renegade
are key models for GAC
Fiat

11
Guangzhou Automobile Group (2238 HK): 20 July 2016
GAC Fiat: monthly sales volume breakdown since Cherokee launch
Source: CAM
We see the Cherokee and the recently launched Renegade SUV being the main drivers of
our forecast 254% YoY sales volume growth for GAC Fiat to 146,000 units in 2016.
However, sales volumes for GAC Fiat’s Ottimo and Viaggio sedans were down 26% YoY
and 56% YoY for 1H16, respectively, and we expect its sedan sales to continue to weaken
in 2016 amid tough competition.
New capacity in Guangzhou likely to weigh on profits from Changsha
The Cherokee racked up total sales of 50,000 units in 1H16, during which time GAC Fiat’s
sedan sales totalled 9,000 units, almost fully utilising GAC Fiat’s Changsha plant’s annual
capacity (140K units). However, we believe the sales volume of the new Renegade won’t
come close to reaching the annual capacity of the Guangzhou factory (160k units) this
year, which suggests to us that GAC Motor will face further margin pressure in 2H16.
GAC Fiat: sales volume estimates and utilisation-rate analysis
Source: Company, Daiwa estimates
Launched in June, the Renegade faces intense competition in China and as a result is
unlikely to be a strong sales performer this year, in our view. Unlike the Cherokee, one of
Fiat’s best-selling models globally, the Renegade (launched globally at end-2014) does not
yet seem to be well recognised by customers in China. Priced at between CNY140,000
and CNY210,000, the Renegade faces competition from domestic SUVs such as the GWM
Haval H6, Changan CS75, Geely Boyue and foreign SUVs such as the Honda CR-V,
Toyota RAV4 and Nissan X-Trail, in our view. Renegade’s current order book of around
6,000 units is not an exciting number, in our opinion.
Hence, we believe the subdued performance of the Renegade is likely to result in loss-
making operations for the Guangzhou plant this year, which would wipe out profits earned
from the Cherokee in 2016. Nevertheless, on our forecasts, GAC Fiat would reach break-
even in 2016, moving into the black from a net loss of CNY500m for 2015.
0
2,000
4,000
6,000
8,000
10,000
12,000
14,000
Nov-15 Dec-15 Jan-16 Feb-16 Mar-16 Apr-16 May-16 Jun-16
Cherokee Renegade Ottimo Viaggio
0%
10%
20%
30%
40%
50%
60%
70%
0
50,000
100,000
150,000
200,000
250,000
300,000
350,000
2013 2014 2015 2016E 2017E
(units)
Capacity (LHS) Sales volume (LHS) Utilisation rate (RHS)
We believe the
Renegade faces fierce
competition that will lead
to low utilisation of the
new Guangzhou plant

12
Guangzhou Automobile Group (2238 HK): 20 July 2016
China auto OEMs: comparison of key SUV models
Automotive OEM Model Retail Price
(CNY k) Launch date Launch date of latest facelift Avg sales units per month in 1H16
GAC Fiat Renegade 140-210 Jun-16 Jun-16 n.a
Greatwall Haval 6 88-163 Oct-12 Apr-16 40,042
Changan CS75 93-158 Apr-14 Mar-16 16,143
Geely Boyue (NL3) 100-158 Mar-16 Mar-16 4,803
DF Honda CR-V 180-250 Feb-12 Apr-15 14,247
FAW Toyota RAV4 184-273 Aug-09 Dec-15 8,714
DF Nissan X-rail 182-270 Feb-14 Mar-16 13,493
Changan Mazda CX5 170-250 Aug-13 Jun-15 3,722
Source: CAM, Autohome
GAC Fiat: Cherokee GAC Fiat: Renegade
Source: Sina Source: Sina
Our counter-consensus view
Compared with the market, we are more concerned about the gross profit contribution from the Japan JVs and GAC Motor’s gross margin
We believe the main reason for the 9-13% variance between our 2016-18E earnings
forecasts and those of the Bloomberg consensus is the assumed investment income
contributed by GAC Toyota and GAC Honda. GAC Honda and GAC Toyota would
collectively contribute 70-80% of the implied investment income in 2016 and 2017, on our
forecasts. However, due to the low base effect and capacity constraints, we believe GAC’s
2 Japan JVs will see limited sales growth starting from 2H16, leading to less implied
investment income than the street currently expects. Hence, we believe the market is
overly optimistic on the sales growth of GAC Toyota and GAC Honda for 2H16.
For GAC Motor, we forecast the domestic brand to generate higher sales volume (relative
to our prior forecasts), backed by its forthcoming models for 2H16 (GS8 SUV, GA3S PHEV
Sedan and GS4 EV SUV), which results in a higher revenue forecast than the Bloomberg
consensus expects for 2016. As it stands, we believe that not all analysts have fully
factored in the impact of the forthcoming models.
However, we highlight our non-consensus view on GAC Motor’s gross margin, which we
believe is a more sensitive factor than revenue as far as determining GAC Motor’s net
earnings is concerned. Our 2016-17E gross-margin forecasts for GAC Motor are lower
than the market’s given our expectation of a continuation of tough competition in the
domestic SUV segment, which we think will result in the net profit contribution from the
domestic brand falling short of the market’s expectations.
In contrast to the market’s average 12-month target price of HKD10.5, which implies PERs
of 9.2x for 2016, 8.1x for 2017E and 8.6x on average 2016E-17E EPS (all based on the
Bloomberg consensus), our target price of HKD8.5 is set at 8x the average of our 2016E-
17E EPS forecasts (equivalent to 8.3x PER for 2016E and 7.6x PER for 2017E). Our lower
absolute target price is a function of our more conservative EPS forecasts, as well as our
lower target multiple, which we believe is justified by our expectation of weaker investor
sentiment in 2H16 given slower sales growth.
We are more bearish
than the street on sales
volume growth for GAC
Toyota and GAC Honda
in 2H16E…
…and more cautious on
GAC Motor’s gross
margin
We think investor
sentiment is likely to
cool in the face of slower
sales growth

13
Guangzhou Automobile Group (2238 HK): 20 July 2016
GAC: Daiwa forecasts vs. Bloomberg consensus on key financial metrics
Revenue (CNY m)
Gross profit (CNY m)
Operating profit (CNY m)
Implied Investment Income (CNY m) Net Profit (CNY m)
2016E 2017E 2016E 2017E 2016E 2017E 2016E 2017E 2016E 2017E
Daiwa forecasts 47,350 52,559 6,716 7,465 1,083 1,210 4,986 5,395 5,625 6,123
Bloomberg consensus 40,439 44,521 6,389 6,545 1,644 1,820 5,136 5,850 6,227 7,082
Gross margin Operating margin
Daiwa forecasts
14.2% 14.2% 2.3% 2.3%
Bloomberg consensus
15.8% 14.7% 4.1% 4.1%
Source: Daiwa forecast, Bloomberg Note :Implied investment income refers to the difference between pretax income and operating income as disclosed by Bloomberg, which is the
approximate value of investment income. For consistency, we use the same method to get the implied investment income for Daiwa forecasts
GAC: Daiwa forecasts vs. Bloomberg consensus on target price/valuation
12-month target price (HKD)
Estimated EPS (CNY) Implied target PER
2016E 2017E 2016E-17E
average 2016E 2017E 2016E-17E
average
Daiwa forecasts 8.5 0.87 0.95 0.91 8.3 7.6 8.0
Bloomberg consensus 10.5 0.97 1.10 1.04 9.2 8.1 8.6
Exchange rate, 1HK$ = x CNY 0.85
Source: Bloomberg, Daiwa forecasts
GAC: sales volume/gross margin sensitivity analysis
Assuming a 5% change in the sales volume and the impact on the 2016E net profit (%)
GAC
0.8%
Assuming a 1pp change in the gross margin and the impact on the 2016E net profit (%)
GAC
7.6%
Source: Daiwa estimates

14
Guangzhou Automobile Group (2238 HK): 20 July 2016
Valuation and recommendation
New 12-month target price of HKD8.50
We downgrade our rating on GAC to Sell (5) from Hold (3), and raise our 12-month target
price to HKD8.5 from HKD8.3, on an unchanged 8x PER applied to the average of 2016E-
17E EPS (previously: 2016E only). Our new target price implies 18% potential downside.
We foresee the sales growth of GAC Honda and GAC Toyota being limited in 2016 and
2017 by capacity constraints and harsh competition from European brands in tier-1 cities
and domestic brands in lower-tier cities. On the other hand, we believe GAC Motor will not
sustain the strong margin it recorded in 1Q16, as we expect it to step up promotional
activity in response to the intense competition in the domestic SUV market in 2H16.
Although GAC Honda, GAC Toyota and GAC Motor saw significant YoY sales growth in
1H16, we believe the high-base effect starting from 2H16 will weigh on their overall YoY
sales growth in full-year 2016.
GAC: PER bands (x)
Source: Bloomberg, Daiwa forecasts
GAC: PER-based valuation
2016-17 EPS Average (CNY) 0.91
PE (X) 8.0 x
Exchange rate, 1HK$ = x CNY 0.85
Equity value/share (HKD/share) 8.50
Current price (HKD) (19 July 2016) 10.38
Potential share price upside/downside (%) -18%
Implied target 17E PER 7.6
Source: Daiwa forecasts
Risks to our view
Stronger-than-expected sales for GAC Honda and GAC Toyota
The main risk to our Sell (5) call on GAC is the performance of its Japanese JVs. Although
we believe the capacity constraints and the extent of market competition will limit its sales
growth in 2016 and 2017, GAC Honda’s new SUV models (Acura, Avancier) could perform
better sales-wise than we expect. Also, GAC Toyota could benefit more from its HEV
models than we currently expect.
Weaker-than-expected competition for Trumpchi GS4
Though official price cuts for Trumpchi GS4’s competitors (Greatwall Haval H6, Changan
CS75) underline the extent of competition in the market, there is a possibility that Trumpchi
will maintain its high 4Q15-1Q16 gross margin due to scale economies, presenting an
upside risk to our earnings forecasts.
5
6
7
8
9
10
11
12
13
14
15
Jul-1
3
Aug
-13
Sep
-13
Oct
-13
Nov
-13
Dec
-13
Jan-
14
Feb
-14
Mar
-14
Apr
-14
May
-14
Jun-
14
Jul-1
4
Aug
-14
Sep
-14
Oct
-14
Nov
-14
Dec
-14
Jan-
15
Feb
-15
Mar
-15
Apr
-15
May
-15
Jun-
15
Jul-1
5
Aug
-15
Sep
-15
Oct
-15
Nov
-15
Dec
-15
Jan-
16
Feb
-16
Mar
-16
Apr
-16
May
-16
Jun-
16
Jul-1
6
PER +1 SD Average PER -1 SD
(PER)
We downgrade our
rating given our
concerns over the sales
growth of the Japanese
JVs and the margin of
GAC Motor

15
Guangzhou Automobile Group (2238 HK): 20 July 2016
Other company-specific risks include a better-than-expected net margin for GAV Fiat on its
strong SUV performance, and unexpectedly aggressive sales growth for the domestic GAC
Motor brand’s new models to be launched in 2H16.

16
Guangzhou Automobile Group (2238 HK): 20 July 2016
Appendix
GAC: monthly sales for major GAC OEMs in the past 12 months
3Q15 3Q15 3Q15 4Q15 4Q15 4Q15 1Q16 1Q16 1Q16 2Q16 2Q16 2Q16
Sales volume (units) Jul-15 Aug-15 Sep-15 Oct-15 Nov-15 Dec-15 Jan-16 Feb-16 Mar-16 Apr-16 May-16 Jun-16
GAC Honda in total 41,984 43,202 50,006 47,423 53,306 99,598 43,008 26,298 53,238 49,012 52,333 50,096
Fit 10,051 8,185 3,372 2,840 8,747 13,147 9,326 6,814 11,455 8,882 8,978 9,629
City 3,471 3,005 6,332 7,632 4,976 8,462 5,370 3,375 4,643 5,145 5,389 5,494
S1 281 278 279 272 6 500 0 1,023 150 234 1,967 780
Crider 6,057 8,930 11,572 11,295 7,819 21,075 7,738 4,261 9,627 5,515 6,002 4,824
Accord 7,927 8,128 11,619 10,102 13,203 27,362 4,779 2,089 10,081 11,402 12,121 11,668
Crosstour 709 883 1,030 942 914 2,032 613 467 615 879 590 632
Vezel 10,085 9,928 11,721 10,790 13,587 18,329 11,998 6,489 14,163 14,193 14,398 14,124
Odyssey 3,403 3,865 4,081 3,550 4,054 8,691 3,184 1,780 2,504 2,762 2,888 2,945
GAC Toyota in total 34,026 31,045 33,014 38,012 37,757 35,782 45,009 18,530 35,524 35,052 38,819 35,818
Yaris 5,830 5,440 4,603 4,476 5,842 3,669 8,544 3,545 4,738 4,949 5,197 3,941
Levin 9,583 8,460 10,357 13,068 11,652 13,569 14,447 6,190 13,994 13,820 15,073 14,592
Camry 9,517 8,500 9,779 10,659 11,212 9,562 13,209 4,119 8,091 7,416 9,346 8,179
Highlander 8,014 7,697 7,907 9,125 8,296 8,795 8,010 4,276 8,393 8,494 8,513 8,413
EZ 1,082 948 368 684 755 187 799 400 308 373 690 693
GAC Motor in total 13,642 16,005 21,867 24,523 28,091 24,500 33,150 16,235 30,053 28,017 30,102 28,560
GA3 510 521 1,170 1,311 1,005 335 688 100 406 758 1,354 396
GA5 61 101 15 183 61 364 206 124 200 320 571 154
GA5 EV 111 142 163 0 0 0 0 0 0 0 0 0
GA6 305 395 619 634 405 408 213 138 650 1,020 1,082 1,088
GA8 0 0 0 0 0 0 0 0 0 0 215 509
GS5 517 529 1,000 1,343 1,970 608 1,531 853 746 846 861 293
GS4 12,138 14,317 18,900 21,052 24,650 22,785 30,512 15,020 28,051 25,073 26,019 26,120
GAC Fiat in total 2,603 2,112 2,100 2,521 4,622 8,357 10,366 7,160 10,742 11,467 9,811 11,232
Ottimo 872 697 829 840 961 1,026 804 448 723 826 411 382
Viaggio 1,731 1,415 1,271 1,681 1,490 1,497 1,255 799 1,015 1,440 496 470
Cherokee 0 0 0 0 2,171 5,834 8,307 5,913 9,004 9,201 8,904 8,702
Renegade 0 0 0 0 0 0 0 0 0 0 0 1,678
YoY growth
GAC Honda in total 54.3% 38.3% 21.9% 5.3% 5.6% -3.8% 25.0% 20.0% 32.4% 1.4% 2.1% 3.5%
Fit 6.1% -2.9% -64.6% -74.0% -33.0% -17.1% 26.4% 48.7% 55.3% -6.2% -16.9% -3.8%
City 23.6% -4.5% 180.3% 340.9% 136.8% 19.4% 291.7% 119.7% 5.5% 28.6% 74.1% 172.0%
S1 170.2% 169.9% 365.0% -13.1% -97.6% 65.0% -100.0% 568.6% -42.5% -19.3% 634.0% 156.6%
Crider -16.5% 4.5% -15.3% -0.4% -5.4% -20.1% 3.5% 24.9% 45.3% -46.6% -49.8% -52.8%
Accord 59.4% 32.4% 24.2% -19.7% 25.6% -6.2% -8.2% -51.2% 30.5% 11.1% 9.3% 3.9%
Crosstour -29.1% -35.2% -34.6% -11.5% -41.3% -48.6% 2.3% -51.8% -65.0% -39.9% -46.8% -31.6%
Vezel n.a n.a n.a 792.5% 40.1% 57.5% 26.8% 24.4% 57.3% 57.4% 49.1% 40.6%
Odyssey 113.0% 10.4% -11.0% -39.2% -19.1% -4.9% 39.2% 1.2% -18.5% -21.6% -12.0% -19.6%
GAC Toyota in total 27.4% 7.0% -6.5% 11.9% 8.5% -5.9% 36.3% -7.1% 24.4% -2.8% 4.7% -7.7%
Yaris -18.3% 22.5% -1.6% 2.6% -7.6% -43.7% 17.1% -9.3% 2.6% -13.9% -21.3% -41.2%
Levin n.a 28.4% 3.7% 18.6% 10.8% 23.3% 58.0% 25.1% 58.1% 9.1% 36.8% 17.8%
Camry -13.7% -24.8% -25.2% -15.7% 19.7% -12.4% -2.5% -55.3% -42.4% -28.0% -10.2% -27.7%
Highlander 19.6% 31.5% 24.9% 93.4% 20.3% 6.3% 408.9% 279.8% 9022.8% 28.1% 4.8% 7.5%
EZ -41.0% 15.8% -70.1% -44.0% -55.4% -85.8% -45.2% -46.4% -68.0% -47.3% -25.2% 17.3%
GAC Motor in total 143.4% 117.5% 111.1% 112.3% 129.2% 34.0% 200.8% 115.5% 179.1% 226.6% 181.9% 121.1%
GA3 15.4% -80.9% -73.9% -73.8% -81.9% -96.1% -86.5% -97.0% -88.6% -62.1% -2.7% -26.7%
GA5 -59.9% 11.0% -92.4% -35.6% -12.9% 147.6% 119.1% 55.0% 334.8% 814.3% 4658.3% -69.3%
GA5 EV n.a n.a n.a -100.0% -100.0% -100.0% -100.0% -100.0% -100.0% -100.0% -100.0% -100.0%
GA6 n.a n.a n.a n.a n.a 385.7% -82.7% -86.3% -68.3% -32.4% 52.2% 234.8%
GA8 n.a n.a n.a n.a n.a n.a n.a n.a n.a n.a n.a n.a
GS5 -89.7% -88.3% -82.4% -78.5% -70.2% -93.5% -65.5% -72.0% -85.1% -83.1% -58.8% -61.9%
GS4 n.a n.a n.a n.a n.a n.a n.a n.a n.a n.a 303.3% 143.6%
GAC Fiat in total -17.7% -34.7% -68.1% -58.1% -38.5% -2.0% 191.7% 263.3% 178.9% 235.4% 238.8% 658.9%
Ottimo -21.7% -51.2% -63.9% -60.6% -53.7% -63.8% 9.1% -10.6% -36.2% -21.6% -54.4% -27.9%
Viaggio -15.5% -21.7% -70.4% -56.8% -72.6% -73.7% -55.4% -45.6% -62.6% -39.1% -75.1% -50.5%
Cherokee n.a n.a n.a n.a n.a n.a n.a n.a n.a n.a n.a n.a
Renegade n.a n.a n.a n.a n.a n.a n.a n.a n.a n.a n.a n.a
17
Guangzhou Automobile Group (2238 HK): 20 July 2016
Source: CAMDaiwa’s Asia Pacific Research Directory
HONG KONG
Takashi FUJIKURA (852) 2848 4051 [email protected]
Regional Research Head
John HETHERINGTON (852) 2773 8787 [email protected]
Regional Deputy Head of Asia Pacific Research
Rohan DALZIELL (852) 2848 4938 [email protected]
Regional Head of Asia Pacific Product Management
Kevin LAI (852) 2848 4926 [email protected]
Chief Economist for Asia ex-Japan; Macro Economics (Regional)
Jonas KAN (852) 2848 4439 [email protected]
Head of Hong Kong and China Property
Cynthia CHAN (852) 2773 8243 [email protected]
Property (China)
Leon QI (852) 2532 4381 [email protected]
Banking (Hong Kong/China); Broker (China); Insurance (China)
Yan LI (852) 2773 8822 [email protected]
Banking (China)
Anson CHAN (852) 2532 4350 [email protected]
Consumer (Hong Kong/China)
Adrian CHAN (852) 2848 4427 [email protected]
Consumer (Hong Kong/China)
Jamie SOO (852) 2773 8529 [email protected]
Gaming and Leisure (Hong Kong/China)
Dennis IP (852) 2848 4068 [email protected]
Power; Utilities; Renewables and Environment (Hong Kong/China)
John CHOI (852) 2773 8730 [email protected]
Head of Hong Kong and China Internet; Regional Head of Small/Mid Cap
Kelvin LAU (852) 2848 4467 [email protected]
Head of Automobiles; Transportation and Industrial (Hong Kong/China)
Brian LAM (852) 2532 4341 [email protected]
Transportation – Railway; Construction and Engineering (China)
Thomas HO (852) 2773 8716 [email protected]
Custom Products Group
PHILIPPINES
Patricia Tamase (63) 2 797 3024 [email protected]
Banking
SOUTH KOREA
Sung Yop CHUNG (82) 2 787 9157 [email protected]
Pan-Asia Co-head/Regional Head of Automobiles and Components; Automobiles; Shipbuilding; Steel
Mike OH (82) 2 787 9179 [email protected]
Banking; Capital Goods (Construction and Machinery)
Iris PARK (82) 2 787 9165 [email protected]
Consumer/Retail
SK KIM (82) 2 787 9173 [email protected]
IT/Electronics – Semiconductor/Display and Tech Hardware
Thomas Y KWON (82) 2 787 9181 [email protected]
Pan-Asia Head of Internet & Telecommunications; Software – Internet/On-line Game
Kevin JIN (82) 2 787 9168 [email protected]
Small/Mid Cap
TAIWAN
Rick HSU (886) 2 8758 6261 [email protected]
Head of Regional Technology; Head of Taiwan Research; Semiconductor/IC Design (Regional)
Christie CHIEN (886) 2 8758 6257 [email protected]
Banking; Insurance (Taiwan); Macro Economics (Regional)
Steven TSENG (886) 2 8758 6252 [email protected]
IT/Technology Hardware (PC Hardware)
Christine WANG (886) 2 8758 6249 [email protected]
IT/Technology Hardware (Automation); Pharmaceuticals and Healthcare; Consumer
Kylie HUANG (886) 2 8758 6248 [email protected]
IT/Technology Hardware (Handsets and Components)
Helen CHIEN (886) 2 8758 6254 [email protected]
Small/Mid Cap
INDIA
Punit SRIVASTAVA (91) 22 6622 1013 [email protected]
Head of India Research; Strategy; Banking/Finance
Saurabh MEHTA (91) 22 6622 1009 [email protected]
Capital Goods; Utilities
SINGAPORE
Ramakrishna MARUVADA (65) 6499 6543 [email protected]
Head of Singapore Research; Telecommunications (China/ASEAN/India)
Royston TAN (65) 6321 3086 [email protected]
Oil and Gas; Capital Goods
David LUM (65) 6329 2102 [email protected]
Banking; Property and REITs
Shane GOH (65) 64996546 [email protected]
Property and REITs; Small/Mid Cap (Singapore)
Jame OSMAN (65) 6321 3092 [email protected]
Transportation – Road and Rail; Pharmaceuticals and Healthcare; Consumer (Singapore)

18
Guangzhou Automobile Group (2238 HK): 20 July 2016
Daiwa’s Offices
Office / Branch / Affiliate Address Tel Fax
DAIWA SECURITIES GROUP INC
HEAD OFFICE Gran Tokyo North Tower, 1-9-1, Marunouchi, Chiyoda-ku, Tokyo, 100-6753 (81) 3 5555 3111 (81) 3 5555 0661
Daiwa Securities Trust Company One Evertrust Plaza, Jersey City, NJ 07302, U.S.A. (1) 201 333 7300 (1) 201 333 7726
Daiwa Securities Trust and Banking (Europe) PLC (Head Office) 5 King William Street, London EC4N 7JB, United Kingdom (44) 207 320 8000 (44) 207 410 0129
Daiwa Europe Trustees (Ireland) Ltd Level 3, Block 5, Harcourt Centre, Harcourt Road, Dublin 2, Ireland (353) 1 603 9900 (353) 1 478 3469
Daiwa Capital Markets America Inc. New York Head Office Financial Square, 32 Old Slip, New York, NY10005, U.S.A. (1) 212 612 7000 (1) 212 612 7100
Daiwa Capital Markets America Inc. San Francisco Branch 555 California Street, Suite 3360, San Francisco, CA 94104, U.S.A. (1) 415 955 8100 (1) 415 956 1935
Daiwa Capital Markets Europe Limited, London Head Office 5 King William Street, London EC4N 7AX, United Kingdom (44) 20 7597 8000 (44) 20 7597 8600
Daiwa Capital Markets Europe Limited, Frankfurt Branch Neue Mainzer Str. 1, 60311 Frankfurt/Main, Germany (49) 69 717 080 (49) 69 723 340
Daiwa Capital Markets Europe Limited, Paris Representative Office 17, rue de Surène 75008 Paris, France (33) 1 56 262 200 (33) 1 47 550 808
Daiwa Capital Markets Europe Limited, Geneva Branch 50 rue du Rhône, P.O.Box 3198, 1211 Geneva 3, Switzerland (41) 22 818 7400 (41) 22 818 7441
Daiwa Capital Markets Europe Limited, Moscow Representative Office
Midland Plaza 7th Floor, 10 Arbat Street, Moscow 119002, Russian Federation
(7) 495 641 3416 (7) 495 775 6238
Daiwa Capital Markets Europe Limited, Bahrain Branch 7th Floor, The Tower, Bahrain Commercial Complex, P.O. Box 30069, Manama, Bahrain
(973) 17 534 452 (973) 17 535 113
Daiwa Capital Markets Hong Kong Limited Level 28, One Pacific Place, 88 Queensway, Hong Kong (852) 2525 0121 (852) 2845 1621
Daiwa Capital Markets Singapore Limited 6 Shenton Way #26-08, OUE Downtown 2, Singapore 068809, Republic of Singapore
(65) 6220 3666 (65) 6223 6198
Daiwa Capital Markets Australia Limited Level 34, Rialto North Tower, 525 Collins Street, Melbourne, Victoria 3000, Australia
(61) 3 9916 1300 (61) 3 9916 1330
DBP-Daiwa Capital Markets Philippines, Inc 18th Floor, Citibank Tower, 8741 Paseo de Roxas, Salcedo Village, Makati City, Republic of the Philippines
(632) 813 7344 (632) 848 0105
Daiwa-Cathay Capital Markets Co Ltd 14/F, 200, Keelung Road, Sec 1, Taipei, Taiwan, R.O.C. (886) 2 2723 9698 (886) 2 2345 3638
Daiwa Securities Capital Markets Korea Co., Ltd. 20 Fl.& 21Fl. One IFC, 10 Gukjegeumyung-Ro, Yeongdeungpo-gu, Seoul, Korea
(82) 2 787 9100 (82) 2 787 9191
Daiwa Securities Co. Ltd., Beijing Representative Office Room 301/302,Kerry Center,1 Guanghua Road,Chaoyang District,
Beijing 100020, People’s Republic of China
(86) 10 6500 6688 (86) 10 6500 3594
Daiwa (Shanghai) Corporate Strategic Advisory Co. Ltd. 44/F, Hang Seng Bank Tower, 1000 Lujiazui Ring Road, Pudong, Shanghai China 200120 , People’s Republic of China
(86) 21 3858 2000 (86) 21 3858 2111
Daiwa Securities Co. Ltd., Bangkok Representative Office 18th Floor, M Thai Tower, All Seasons Place, 87 Wireless Road,
Lumpini, Pathumwan, Bangkok 10330, Thailand (66) 2 252 5650 (66) 2 252 5665
Daiwa Capital Markets India Private Ltd 10th Floor, 3 North Avenue, Maker Maxity, Bandra Kurla Complex, Bandra East, Mumbai – 400051, India
(91) 22 6622 1000 (91) 22 6622 1019
Daiwa Securities Co. Ltd., Hanoi Representative Office Suite 405, Pacific Palace Building, 83B, Ly Thuong Kiet Street, Hoan Kiem Dist. Hanoi, Vietnam
(84) 4 3946 0460 (84) 4 3946 0461
DAIWA INSTITUTE OF RESEARCH LTD
HEAD OFFICE 15-6, Fuyuki, Koto-ku, Tokyo, 135-8460, Japan (81) 3 5620 5100 (81) 3 5620 5603
MARUNOUCHI OFFICE Gran Tokyo North Tower, 1-9-1, Marunouchi, Chiyoda-ku, Tokyo, 100-6756 (81) 3 5555 7011 (81) 3 5202 2021
New York Research Center 11th Floor, Financial Square, 32 Old Slip, NY, NY 10005-3504, U.S.A. (1) 212 612 6100 (1) 212 612 8417
London Research Centre 3/F, 5 King William Street, London, EC4N 7AX, United Kingdom (44) 207 597 8000 (44) 207 597 8550

19
Guangzhou Automobile Group (2238 HK): 20 July 2016
Important Disclosures and Disclaimer
This publication is produced by Daiwa Securities Group Inc. and/or its non-U.S. affiliates, and distributed by Daiwa Securities Group Inc. and/or its non-U.S. affiliates, except to the extent expressly provided herein. This publication and the contents hereof are intended for information purposes only, and may be subject to change without further notice. Any use, disclosure, distribution, dissemination, copying, printing or reliance on this publication for any other purpose without our prior consent or approval is strictly prohibited. Neither Daiwa Securities Group Inc. nor any of its respective parent, holding, subsidiaries or affiliates, nor any of its respective directors, officers, servants and employees, represent nor warrant the accuracy or completeness of the information contained herein or as to the existence of other facts which might be significant, and will not accept any responsibility or liability whatsoever for any use of or reliance upon this publication or any of the contents hereof. Neither this publication, nor any content hereof, constitute, or are to be construed as, an offer or solicitation of an offer to buy or sell any of the securities or investments mentioned herein in any country or jurisdiction nor, unless expressly provided, any recommendation or investment opinion or advice. Any view, recommendation, opinion or advice expressed in this publication may not necessarily reflect those of Daiwa Securities Group Inc., and/or its affiliates nor any of its respective directors, officers, servants and employees except where the publication states otherwise. This research report is not to be relied upon by any person in making any investment decision or otherwise advising with respect to, or dealing in, the securities mentioned, as it does not take into account the specific investment objectives, financial situation and particular needs of any person. Daiwa Securities Group Inc., its subsidiaries or affiliates, or its or their respective directors, officers and employees from time to time have trades as principals, or have positions in, or have other interests in the securities of the company under research including market making activities, derivatives in respect of such securities or may have also performed investment banking and other services for the issuer of such securities. The following are additional disclosures.
Ownership of Securities
For “Ownership of Securities” information, please visit BlueMatrix disclosure link at https://daiwa3.bluematrix.com/sellside/Disclosures.action.
Investment Banking Relationship
For “Investment Banking Relationship”, please visit BlueMatrix disclosure link at https://daiwa3.bluematrix.com/sellside/Disclosures.action.
Japan
Daiwa Securities Co. Ltd. and Daiwa Securities Group Inc.
Daiwa Securities Co. Ltd. is a subsidiary of Daiwa Securities Group Inc.
Investment Banking Relationship
Within the preceding 12 months, the subsidiaries and/or affiliates of Daiwa Securities Group Inc. * has lead-managed public offerings and/or secondary offerings (excluding straight bonds) of the securities of the following companies: Mirae Asset Life Insurance Co Ltd (085620 KS); China Reinsurance Group Corporation (1508 HK).
*Subsidiaries of Daiwa Securities Group Inc. for the purposes of this section shall mean any one or more of: Daiwa Capital Markets Hong Kong Limited (大和資本市場香港有限公司), Daiwa
Capital Markets Singapore Limited, Daiwa Capital Markets Australia Limited, Daiwa Capital Markets India Private Limited, Daiwa-Cathay Capital Markets Co., Ltd., Daiwa Securities Capital Markets Korea Co., Ltd.
Hong Kong
This research is distributed in Hong Kong by Daiwa Capital Markets Hong Kong Limited (大和資本市場香港有限公司) (“DHK”) which is regulated by the Hong Kong Securities and Futures
Commission. Recipients of this research in Hong Kong may contact DHK in respect of any matter arising from or in connection with this research. Relevant Relationship (DHK)
DHK may from time to time have an individual employed by or associated with it serves as an officer of any of the companies under its research coverage.
Singapore
This research is distributed in Singapore by Daiwa Capital Markets Singapore Limited and it may only be distributed in Singapore to accredited investors, expert investors and institutional investors as defined in the Financial Advisers Regulations and the Securities and Futures Act (Chapter 289), as amended from time to time. By virtue of distribution to these category of investors, Daiwa Capital Markets Singapore Limited and its representatives are not required to comply with Section 36 of the Financial Advisers Act (Chapter 110) (Section 36 relates to disclosure of Daiwa Capital Markets Singapore Limited’s interest and/or its representative’s interest in securities). Recipients of this research in Singapore may contact Daiwa Capital Markets Singapore Limited in respect of any matter arising from or in connection with the research.
Australia
This research is distributed in Australia by Daiwa Capital Markets Australia Limited and it may only be distributed in Australia to wholesale investors within the meaning of the Corporations Act. Recipients of this research in Australia may contact Daiwa Capital Markets Stockbroking Limited in respect of any matter arising from or in connection with the research.
India
This research is distributed in India to Institutional Clients only by Daiwa Capital Markets India Private Limited (Daiwa India) which is an intermediary registered with Securities & Exchange Board of India as a Stock Broker, Merchant Bank and Research Analyst. Daiwa India, its Research Analyst and their family members and its associates do not have any financial interest save as disclosed or other undisclosed material conflict of interest in the securities or derivatives of any companies under coverage. Daiwa India and its associates may have received compensation for any products other than Investment Banking (as disclosed) or brokerage services from the subject company in this report during the past 12 months. Unless otherwise stated in BlueMatrix disclosure link at https://daiwa3.bluematrix.com/sellside/Disclosures.action, Daiwa India and its associates do not hold more than 1% of any companies covered in this research report. There is no material disciplinary action against Daiwa India by any regulatory authority impacting equity research analysis activities as of the date of this report.
Taiwan
This research is distributed in Taiwan by Daiwa-Cathay Capital Markets Co., Ltd and it may only be distributed in Taiwan to institutional investors or specific investors who have signed recommendation contracts with Daiwa-Cathay Capital Markets Co., Ltd in accordance with the Operational Regulations Governing Securities Firms Recommending Trades in Securities to Customers. Recipients of this research in Taiwan may contact Daiwa-Cathay Capital Markets Co., Ltd in respect of any matter arising from or in connection with the research.
Philippines
This research is distributed in the Philippines by DBP-Daiwa Capital Markets Philippines, Inc. which is regulated by the Philippines Securities and Exchange Commission and the Philippines Stock Exchange, Inc. Recipients of this research in the Philippines may contact DBP-Daiwa Capital Markets Philippines, Inc. in respect of any matter arising from or in connection with the research. DBP-Daiwa Capital Markets Philippines, Inc. recommends that investors independently assess, with a professional advisor, the specific financial risks as well as the legal, regulatory, tax, accounting, and other consequences of a proposed transaction. DBP-Daiwa Capital Markets Philippines, Inc. may have positions or may be materially interested in the securities in any of the markets mentioned in the publication or may have performed other services for the issuers of such securities.
For relevant securities and trading rules please visit SEC and PSE links at http://www.sec.gov.ph/irr/AmendedIRRfinalversion.pdf and http://www.pse.com.ph/ respectively.
Thailand
This research is distributed to only institutional investors in Thailand primarily by Thanachart Securities Public Company Limited (“TNS”).
This report is prepared by analysts who are employed by Daiwa Securities Group Inc. and/or its non-U.S. affiliates. This report is provided to you for informational purposes only and it is not, and is not to be construed as, an offer or an invitation to make an offer to sell or buy any securities. Neither Thanachart Securities Public Company Limited, Daiwa Securities Group Inc. nor any of their respective parent, holding, subsidiaries or affiliates, nor any of their respective directors, officers, servants and employees accept any liability whatsoever for any direct or consequential loss arising from any use of this research or its contents.
The information and opinions contained herein have been compiled or arrived at from sources believed to be reliable. However, Thanachart Securities Public Company Limited, Daiwa Securities Group Inc. nor any of their respective parent, holding, subsidiaries or affiliates, nor any of their respective directors, officers, servants and employees make no representation or warranty, express or implied, as to their accuracy or completeness. Expressions of opinion herein are subject to change without notice. The use of any information, forecasts and opinions contained in this report shall be at the sole discretion and risk of the user.
Daiwa Securities Group Inc. and/or its non-U.S. affiliates perform and seek to perform business with companies covered in this research. Thanachart Securities Public Company Limited, Daiwa Securities Group Inc., their respective parent, holding, subsidiaries or affiliates, their respective directors, officers, servants and employees may have positions and financial interest in securities mentioned in this research. Thanachart Securities Public Company Limited, Daiwa Securities Group Inc., their respective parent, holding, subsidiaries or affiliates may from time to time perform investment banking or other services for, or solicit investment banking or other business from, any entity mentioned in this research. Therefore, investors should be aware of conflict of interest that may affect the objectivity of this research.
United Kingdom
This research report is produced by Daiwa Securities Co. Ltd. and/or its affiliates and is distributed in the European Union, Iceland, Liechtenstein, Norway and Switzerland. Daiwa Capital Markets Europe Limited is authorised and regulated by The Financial Conduct Authority (“FCA”) and is a member of the London Stock Exchange and Eurex. This publication is intended for investors who are not Retail Clients in the United Kingdom within the meaning of the Rules of the FCA and should not therefore be distributed to such Retail Clients in the United Kingdom. Should you enter into investment business with Daiwa Capital Markets Europe’s affiliates outside the United Kingdom, we are obliged to advise that the protection afforded by the United Kingdom regulatory system may not apply; in particular, the benefits of the Financial Services Compensation Scheme may not be available. Daiwa Capital Markets Europe Limited has in place organisational arrangements for the prevention and avoidance of conflicts of interest. Our conflict management policy is available at

20
Guangzhou Automobile Group (2238 HK): 20 July 2016
http://www.uk.daiwacm.com/about-us/corporate-governance-regulatory.
Germany
This document is distributed in Germany by Daiwa Capital Markets Europe Limited, Niederlassung Frankfurt which is regulated by BaFin (Bundesanstalt fuer Finanzdienstleistungsaufsicht) for the conduct of business in Germany.
Bahrain
This research material is distributed in Bahrain by Daiwa Capital Markets Europe Limited, Bahrain Branch, regulated by The Central Bank of Bahrain and holds Investment Business Firm – Category 2 license and having its official place of business at the Bahrain World Trade Centre, South Tower, 7th floor, P.O. Box 30069, Manama, Kingdom of Bahrain. Tel No. +973 17534452 Fax No. +973 535113
United States
This report is distributed in the U.S. by Daiwa Capital Markets America Inc. (DCMA). It may not be accurate or complete and should not be relied upon as such. It reflects the preparer’s views at the time of its preparation, but may not reflect events occurring after its preparation; nor does it reflect DCMA’s views at any time. Neither DCMA nor the preparer has any obligation to update this report or to continue to prepare research on this subject. This report is not an offer to sell or the solicitation of any offer to buy securities. Unless this report says otherwise, any recommendation it makes is risky and appropriate only for sophisticated speculative investors able to incur significant losses. Readers should consult their financial advisors to determine whether any such recommendation is consistent with their own investment objectives, financial situation and needs. This report does not recommend to U.S. recipients the use of any of DCMA’s non-U.S. affiliates to effect trades in any security and is not supplied with any understanding that U.S. recipients of this report will direct commission business to such non-U.S. entities. Unless applicable law permits otherwise, non-U.S. customers wishing to effect a transaction in any securities referenced in this material should contact a Daiwa entity in their local jurisdiction. Most countries throughout the world have their own laws regulating the types of securities and other investment products which may be offered to their residents, as well as a process for doing so. As a result, the securities discussed in this report may not be eligible for sales in some jurisdictions. Customers wishing to obtain further information about this report should contact DCMA: Daiwa Capital Markets America Inc., Financial Square, 32 Old Slip, New York, New York 10005 (Tel no. 212-612-7000).
Ownership of Securities
For “Ownership of Securities” information please visit BlueMatrix disclosure link at https://daiwa3.bluematrix.com/sellside/Disclosures.action.
Investment Banking Relationships
For “Investment Banking Relationships” please visit BlueMatrix disclosure link at https://daiwa3.bluematrix.com/sellside/Disclosures.action. DCMA Market Making
For “DCMA Market Making” please visit BlueMatrix disclosure link at https://daiwa3.bluematrix.com/sellside/Disclosures.action.
Research Analyst Conflicts
For updates on “Research Analyst Conflicts” please visit BlueMatrix disclosure link at https://daiwa3.bluematrix.com/sellside/Disclosures.action. The principal research analysts who prepared this report have no financial interest in securities of the issuers covered in the report, are not (nor are any members of their household) an officer, director or advisory board member of the issuer(s) covered in the report, and are not aware of any material relevant conflict of interest involving the analyst or DCMA, and did not receive any compensation from the issuer during the past 12 months except as noted: no exceptions.
Research Analyst Certification
For updates on “Research Analyst Certification” and “Rating System” please visit BlueMatrix disclosure link at https://daiwa3.bluematrix.com/sellside/Disclosures.action. The views about any and all of the subject securities and issuers expressed in this Research Report accurately reflect the personal views of the research analyst(s) primarily responsible for this report (or the views of the firm producing the report if no individual analysts[s] is named on the report); and no part of the compensation of such analyst(s) (or no part of the compensation of the firm if no individual analyst[s)] is named on the report) was, is, or will be directly or indirectly related to the specific recommendations or views contained in this Research Report.
The following explains the rating system in the report as compared to relevant local indices, unless otherwise stated, based on the beliefs of the author of the report.
"1": the security could outperform the local index by more than 15% over the next 12 months. "2": the security is expected to outperform the local index by 5-15% over the next 12 months. "3": the security is expected to perform within 5% of the local index (better or worse) over the next 12 months. "4": the security is expected to underperform the local index by 5-15% over the next 12 months. "5": the security could underperform the local index by more than 15% over the next 12 months. Disclosure of investment ratings
Rating Percentage of total
Buy* 65.8%
Hold** 21.8%
Sell*** 12.4%
Source: Daiwa
Notes: data is for single-branded Daiwa research in Asia (ex Japan) and correct as of 30 June 2016. * comprised of Daiwa’s Buy and Outperform ratings. ** comprised of Daiwa’s Hold ratings. *** comprised of Daiwa’s Underperform and Sell ratings. Additional information may be available upon request.
Japan - additional notification items pursuant to Article 37 of the Financial Instruments and Exchange Law (This Notification is only applicable where report is distributed by Daiwa Securities Co. Ltd.)
If you decide to enter into a business arrangement with us based on the information described in materials presented along with this document, we ask you to pay close attention to the following items.
In addition to the purchase price of a financial instrument, we will collect a trading commission* for each transaction as agreed beforehand with you. Since commissions may be included in the purchase price or may not be charged for certain transactions, we recommend that you confirm the commission for each transaction.
In some cases, we may also charge a maximum of ¥ 2 million (including tax) per year as a standing proxy fee for our deposit of your securities, if you are a non-resident of Japan.
For derivative and margin transactions etc., we may require collateral or margin requirements in accordance with an agreement made beforehand with you. Ordinarily in such cases, the amount of the transaction will be in excess of the required collateral or margin requirements.
There is a risk that you will incur losses on your transactions due to changes in the market price of financial instruments based on fluctuations in interest rates, exchange rates, stock prices, real estate prices, commodity prices, and others. In addition, depending on the content of the transaction, the loss could exceed the amount of the collateral or margin requirements.
There may be a difference between bid price etc. and ask price etc. of OTC derivatives handled by us.
Before engaging in any trading, please thoroughly confirm accounting and tax treatments regarding your trading in financial instruments with such experts as certified public accountants. *The amount of the trading commission cannot be stated here in advance because it will be determined between our company and you based on current market conditions and the content of each transaction etc.
When making an actual transaction, please be sure to carefully read the materials presented to you prior to the execution of agreement, and to take responsibility for your own decisions regarding the signing of the agreement with us.
Corporate Name: Daiwa Securities Co. Ltd. Financial instruments firm: chief of Kanto Local Finance Bureau (Kin-sho) No.108 Memberships: Japan Securities Dealers Association, The Financial Futures Association of Japan Japan Securities Investment Advisers Association Type II Financial Instruments Firms Association