Embed Size (px)
Citation preview
Tar Sands
Feeding U.S. Refinery Expansions with
Dirty Fuel
Photo by David Dodge, The Pembina Institute www.OilSandsWatch.org
June 2008
2
Tar Sands
Feeding U.S. Refinery Expansions with
Dirty Fuel The Environmental Integrity Project 1920 L Street, N.W., Suite 800 Washington, D.C. 20036 (202) 296-8800 (telephone) (202) 296-8822 (facsimile) June, 2008 Principal Author: Benjamin J. Wakefield, Senior Attorney, Environmental Integrity
Project (www.environmentalintegrity.org) Contributing Author: Matt Price, Project Manager (Alberta / BC Energy and Climate),
Environmental Defence Canada (www.environmentaldefence.ca) Acknowledgements: This project was completed under the direction of the Environmental Integrity Project’s Executive Director, Eric Schaeffer. Environmental Integrity Project Intern, Jeanette Dennis, contributed to this report. This project received funding support from the Richard and Rhoda Goldman Fund. Such support does not indicate endorsement by the Goldman Fund of the contents of this report. Thanks also to everyone who commented (and continues to comment) on EIP’s Refinery Permit Database – your comments and suggestions greatly strengthened (and continue to update) the database. The Environmental Integrity Project is a nonpartisan, nonprofit organization established in March of 2002 by former EPA enforcement attorneys to advocate for effective enforcement of environmental laws. EIP has three goals: 1) to provide objective analyses of how the failure to enforce or implement environmental laws increases pollution and affects public health; 2) to hold federal and state agencies, as well as individual corporations, accountable for failing to enforce or comply with environmental laws; and 3) to help local communities obtain the protection of environmental laws. An electronic copy of this report can be downloaded free of charge from the EIP website at www.environmentalintegrity.org.
Introduction Over two thirds of currently planned expansions of U.S. oil refining capacity are designed and intended to accommodate heavier, dirtier crude oil from Canadian “tar sands,”1 according to data on U.S. oil refinery permitting activity under the Clean Air Act (“CAA”) recently compiled and analyzed by the Environmental Integrity Project (“EIP”). This data suggests that U.S. refineries are placing a major bet on a fuel source which is dirtier to mine, process and refine, and the extraction of which releases three times more greenhouse gas as conventional crude oil. EIP’s database of refinery permitting activity is available at http://www.environmentalintegrity.org/pub500.cfm. As the rising price of oil has made extraction from Canadian2 tar sands profitable, U.S. oil refinery expansions to process the extra heavy sour crude from tar sands have come to dominate the refinery landscape. Although a new refinery has not been built in the United States for over 30 years, five new refineries are currently under consideration, three of which would process tar sand oil, and one of which would process oil from U.S. oil shale deposits (which may be as destructive to mine and as dirty to refine as tar sand oil). Out of the approximately 1.6 million barrels per day (“bpd”) of increased refining capacity currently in the pipeline, about 1.1 million bpd will be devoted to refining tar sand oil. In addition, more than 800,000 bpd of existing conventional crude capacity is planned to be modified to process oil from tar sands, so that the total increase in tar sands capacity is over 1.9 million bpd, while conventional crude capacity is undergoing a net decrease of over 300,000 bpd. In order to put these numbers into perspective, consider that the average capacity of an oil refinery in the United States is 116,395 bpd, based on the U.S. Department of Energy, Energy Information Administration’s (“EIA’s”) report, “Refinery Capacity
1 Tar sands consist of about 85% sand, clay, and silt; 5% water; and 10% crude bitumen (the “tar” that can be converted to oil). Ann Bordetsky, et al., “Driving It Home: Choosing the Right Path for Fueling North America’s Transportation Future” at 5 (Natural Resources Defense Council, the Pembina Institute, and Western Resource Advocates, June 2007), available at http://www.nrdc.org/energy/drivingithome/contents.asp (hereinafter “Driving It Home”). The bitumen is so viscous that it does not flow at room temperature. Elizabeth Kolbert, “Unconventional Crude – Canada’s Synthetic-fuels Boom,” The New Yorker, Nov. 12, 2007, at 46, abstract available at http://www.newyorker.com/reporting/2007/11/12/071112fa_fact_kolbert (hereinafter “Unconventional Crude”).
2 Although the rush to extract tar sands has so far been confined to Canada, the United States also has tar sands deposits. For example, the U.S. Department of the Interior’s Bureau of Land Management (“BLM”) has recently purported to act on numerous old applications for oil and gas leases, in order to allow exploitation of tar sands in Utah (including areas of the Grand Staircase-Escalante National Monument, the Glen Canyon National Recreation Area, and the Fiddler Butte and French Spring-Happy Canyon Wilderness Study Areas). This action is currently being challenged by a coalition of environmental organizations in Southern Utah Wilderness Alliance v. Sierra, Case No. 2:07cv199 (DAK), D. Utah, filed Apr. 2, 2007. See Redrock Wilderness – The Newsletter of the Southern Utah Wilderness Alliance, “BLM Plans to Resurrect Expired Tar Sands Leases,” vol. 24, number 2 (Summer 2007) at 18-19, available at http://www.suwa.org/site/DocServer/Summer2007Newsletter_WebVersion.pdf?docID=1802.
2
2007,” which is currently the most up-to-date information available.3 Thus, 1.9 million bpd of increased tar sand capacity is equivalent to constructing more than sixteen new refineries dedicated to tar sands. The environmental costs of tar sand development are staggering. Refining the extra heavy sour crude oil extracted from tar sands will result in higher air emissions of harmful pollutants such as sulfur dioxide (SO2), hydrogen sulfide (H2S), sulfuric acid mist, and nitrogen oxides (NOX), as well as toxic metals such as lead and nickel compounds. The more intensive refining of tar sand oil may also produce more greenhouse gas simply because it is more difficult to refine and therefore requires a greater amount of energy. The consequences of tar sand oil extraction (as opposed to refinement) include the clear-cutting and strip-mining of huge portions of intact boreal forest ecosystem, the creation of vast un-reclaimable toxic lakes of wastewater, the consumption of enormous amounts of water and energy, and the production of three
times more greenhouse gas as extracting conventional crude oil.4 Finally, the exploitation of oil shale deposits in the United States may be poised to follow tar sand development in Canada,5 and the mining and refining of shale may entail the same environmental consequences as tar sand extraction and refinement, since shale development similarly entails strip mining huge areas of land and using vast amounts of water and intense heat (and therefore large amounts of energy) to mine and process the material. Although shale is more expensive to mine and process than tar sands, with the price of oil currently well over $100 per barrel, shale may also now be profitable, and the refineries currently being built or adapted to process tar sand oil may need little or no additional modification to process shale oil. Nevertheless, the U.S. government does not lack the power to address greenhouse gas emissions,6 and measures can be taken – a few of which are already in motion – to address the environmental consequences of tar sand and oil shale development. First, the United States must reduce its consumption of oil by improving energy efficiency
3 The 2007 Report’s “Table of Operable Petroleum Refineries by State as of January 1, 2007” is available at http://www.eia.doe.gov/pub/oil_gas/petroleum/data_publications/refinery_capacity_data/current/table3.pdf.
4 This report focuses on the trend of U.S. refinery expansions toward tar sand oil refining capacity. For a more thorough discussion of extraction issues, see Driving It Home, supra note 1. See also, numerous documents and reports regarding tar sands from the Pembina Institute, available at http://www.oilsandswatch.org/, including Dan Woynillowicz, “Oil Sands Fever – the Environmental Implications of Canada’s Oil Sands Rush” (The Pembina Institute, Nov. 2005), available at http://pubs.pembina.org/reports/OilSands72.pdf (hereinafter “Oil Sands Fever”). See also, Christopher Hatch and Matt Price, “Canada’s Toxic Tar Sands – The Most Destructive Project on Earth” (Environmental Defence Canada, Feb. 2008), available at http://www.environmentaldefence.ca/reports/pdf/TarSands_TheReport.pdf (hereinafter “Canada’s Toxic Tar Sands”).
5 In addition to large deposits of oil shale, tar sands deposits also exist in the United States, and the U.S. Department of the Interior’s Bureau of Land Management (“BLM”) is already taking steps to approve the mining of tar sands, as noted supra, at note 2.
6 See, e.g., Massachusetts v. Environmental Protection Agency, 549 U.S. __, 127 S.Ct. 1438 (2007).
3
standards applicable to automobile manufacturers and implementing lifecycle carbon content fuel initiatives.7 Further, the U.S. EPA should regulate greenhouse gas emissions from oil refineries pursuant to the “New Source Performance Standards” (“NSPS”) applicable to newly modified or constructed oil refineries, and should limit greenhouse gas emissions and consider alternatives to tar sand oil feedstock in its “best available control technology” (“BACT”) and “lowest achievable emission rate” (“LAER”) determinations under the “new source review” (“NSR”) provisions of the Clean Air Act when issuing construction permits for refinery expansions or new refineries. The EPA should also account for the increased air emissions of SO2, H2S, sulfuric acid mist, NOX, and toxic metals produced as a result of processing tar sand feedstock when issuing construction permits under NSR. In addition, when permitting the pipelines to carry tar sand crude to U.S. refineries, the responsible U.S. environmental and public lands agencies should consider the cumulative effects on air quality and global warming of all U.S. refineries which process tar sand oil, as well as the global warming impacts of extraction of tar sand crude in Canada on the United States. Finally, the United States and Canada must work together to protect human health and the environment when regulating the extraction, transportation, and refinement of oil from tar sands and oil shale.8
Tar Sand Oil Refining Capacity Increases and Investment
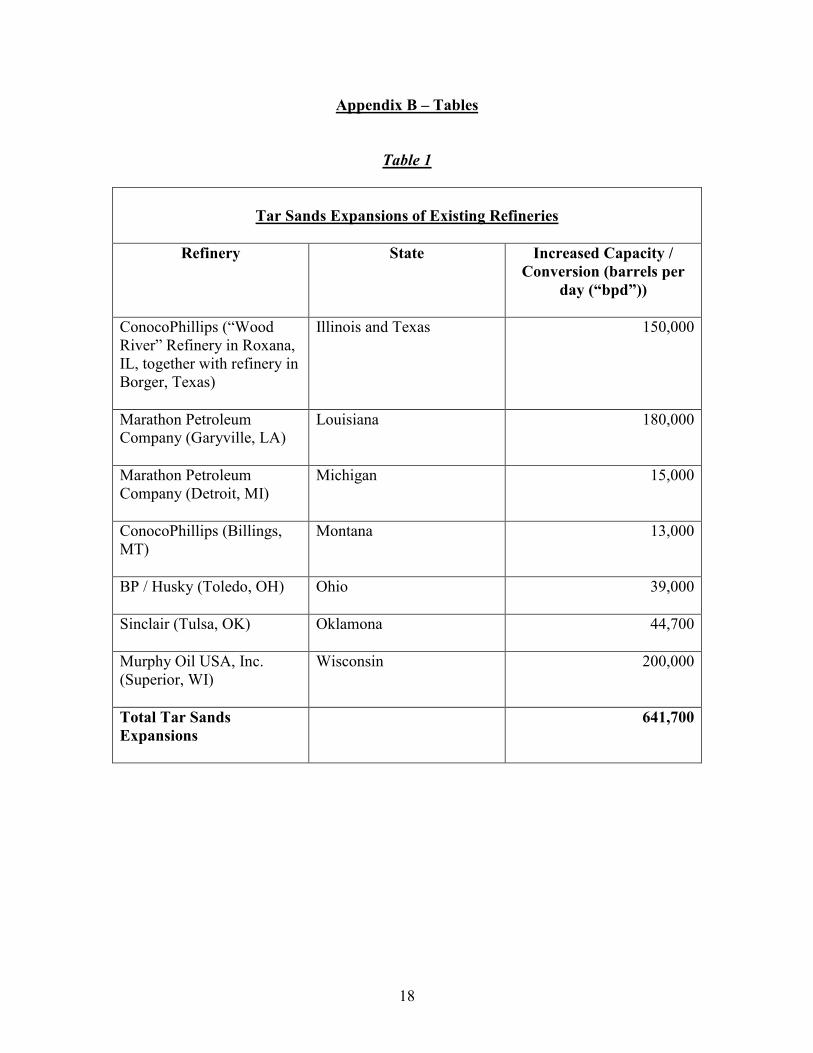
EIP has identified 17 refinery expansions and 5 brand new refineries under consideration or construction, totaling an increase in production capacity of at least 1,591,700 bpd. See http://www.environmentalintegrity.org/pub500.cfm. Out of that increase, 1,106,700 bpd will be for Canadian tar sand oil, and only 485,000 bpd will be for conventional crude. That is, 70% of current refinery capacity expansion is dedicated to tar sand oil. In addition, 827,120 bpd of existing capacity is planned to be modified to process oil from tar sands. Thus, the conversions of existing conventional crude capacity to tar sand capacity completely wipe out increases in conventional capacity, and the total increase in tar sand oil refining capacity is 1,933,820 bpd, while conventional crude refining capacity is undergoing a net decrease of 342,120 bpd. As noted above, this is the equivalent of constructing more than sixteen new refineries dedicated to tar sands. The tables attached as Appendix B to this report summarize this data, listing the specific refineries, states, and increased capacity or conversion at each refinery, such that
7 In this regard, California’s low carbon fuel standard should be implemented and allowed to become a baseline for other states, as well as for a federal standard. Also, section 526 of the Energy Security and Independence Act of 2007, which prohibits federal agencies from buying unconventional or synthetic fuels that have higher lifecycle greenhouse gas emissions than conventional fuels (such as oil from shale or tar sands), should be preserved.
8 In this regard, the Canadian judiciary may be pointing the way toward some protections of the environment. In March 2008, the Federal Court of Canada found that a report prepared pursuant to the Canadian Environmental Assessment Act failed to adequately consider the greenhouse gas emissions of a major tar sands project, causing the Department of Fisheries and Oceans to withdraw approval of the project, such that the project could not proceed. Also, in May 2008, one Canadian Native Tribe brought suit alleging that tar sands operations violate treaty rights by infringing on traditional hunting and fishing grounds.
4
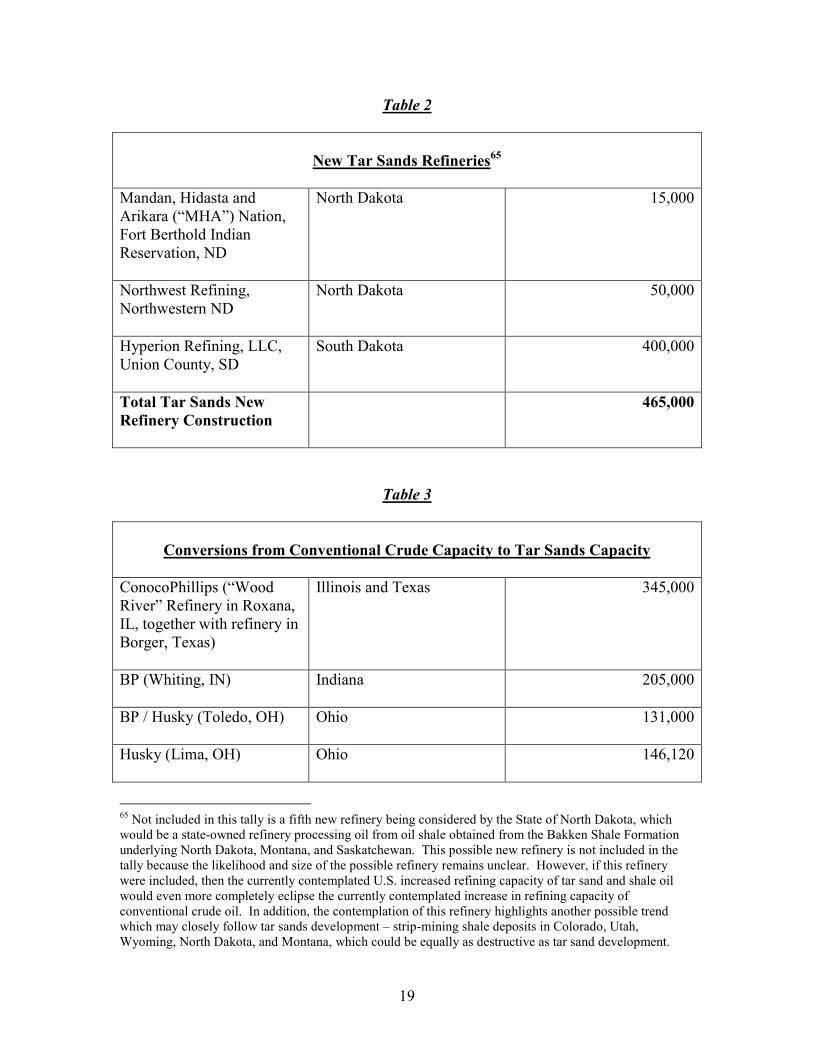
the total “net” tar sands capacity increase [expansions (table 1) + new refineries (table 2) + conversions from conventional to tar sand capacity (table 3)] equals 1,933,820 bpd, and the total “net” conventional capacity change [expansions (table 4) + new refineries (table 5) - conversions from conventional to tar sand capacity (table 3)] equals negative 342,120 bpd. By rough estimate, the refining industry has already invested $53 billion in U.S. tar sand oil refining capacity,9 not to mention un-told billions of dollars in Canadian extraction.10 This enormous investment represents an entrenched commitment to perpetuating U.S. reliance on oil as our primary source of energy into the next generation and beyond, and to ensuring that this reliance will be based on Canadian tar sands (and perhaps U.S. oil shale) – even dirtier and more destructive sources of oil than conventional crude oil.
Environmental Consequences of Tar Sands Development
Refining Tar Sand Crude
Refining the extra heavy sour crude oil extracted from tar sands will result in higher air emissions of harmful pollutants such as sulfur dioxide (SO2), hydrogen sulfide (H2S), sulfuric acid mist, and nitrogen oxides (NOX), as well as toxic metals such as lead and nickel compounds, because the crude feedstock contains more sulfur, nitrogen, and toxic metals.11 The U.S. Department of Energy’s Energy Information Administration (“EIA”) has observed that “[b]itumen, the ‘oil’ in tar sands, … can contain undesirable quantities of nitrogen, sulfur, and heavy metals,”12 and one tar sands company has stated
9 Hyperion’s brand new 400,000 bpd refinery in South Dakota will cost $10,000,000,000, which is $25,000 per barrel. Murphy’s 200,000 bpd expansion in Wisconsin will cost $6,000,000,000, which is $30,000 per barrel. The average of $25,000 and $30,000 is $27,500/bpd. Total tar sand refining capacity expansion is 1,933,820 bpd. ($27,500/bpd) x (1,933,820 bpd) = $53,180,050,000.
10 In November of 2007, The New Yorker reported that “[over] the next five years, investment in [Canadian tar sands development] is expected to amount to more than seventy-five billion dollars.” Unconventional Crude, supra note 1. See also, Russell Gold, “As Prices Surge, Oil Giants Turn Sludge Into Gold,” Wall Street Journal, Mar. 27, 2006, at A1 (hereinafter “Sludge Into Gold”). “Synthetic crude” production from tar sands already “tops a million barrels a day,” and is expected to double by 2010 and triple by 2015. Unconventional Crude, supra note 1.
11 Regardless of feedstock, U.S. refineries remain subject to the emission limitations mandated by the CAA and its implementing regulations, applicable permits (such as “operating permits” under Title V of the CAA and “construction permits” issued under the “new source review” (“NRS”) provisions of the CAA), and applicable consent decrees (see http://www.epa.gov/compliance/resources/cases/civil/caa/oil/). However, loopholes in the law exempt from such limits “startup, shutdown, maintenance, and malfunctions” (“SSMM,” sometimes called “upsets”), during which emissions are commonly sent to flares or released directly into the air. “Upset emissions” are a major source of pollution from refineries, at times exceeding their total “routine” emissions of some pollutants.
12 U.S. Department of Energy, Energy Information Administration, “Annual Energy Outlook Analysis 2006 – Nonconventional Liquid Fuels,” 2006, available at http://www.eia.doe.gov/oiaf/aeo/otheranalysis/aeo_2006analysispapers/nlf.html (hereinafter “EIA 2006 Analysis”). The term “sour” refers to high sulfur content.
5
that “[t]he bitumen in the Canadian oil sands contains Vanadium, Nickel, and other metals in significantly larger quantities than occur in most other oils.”13 In fact, the U.S. Department of the Interior’s U.S. Geological Survey (“USGS”) found in 2007 that “natural bitumen” contains 11 times more sulfur, six times more nitrogen, 11 times more nickel, and 5 times more lead than conventional oil.14 Both SO2 and nitrogen dioxide (NO2) are “criteria pollutants” under the federal Clean Air Act (“CAA”), meaning that they are known hazards to human health and the environment.15 Lead is a highly toxic pollutant, considered by the U.S. Environmental Protection Agency (“EPA”) to be an “OSHA carcinogen,”16 and listed under the CAA as both a “criteria pollutant” and a “hazardous air pollutant” (“HAP”).17 Nickel, too, is both a HAP and an OSHA carcinogen. The human health effects caused by SO2, H2S, NOX, and toxic air pollutants such as lead and nickel include premature death; cancer; permanent lung damage; reproductive, neurological, developmental, respiratory, and immunological problems; cardiovascular and central nervous system problems; bio-mutations; respiratory illness (including bronchitis and pneumonia); and aggravation of heart conditions and asthma.18 Regarding lead alone, the U.S. EPA has stated that:
Lead is a very toxic element, causing a variety of effects at low dose levels. Brain damage, kidney damage, and gastrointestinal distress are seen from acute (short-term) exposure to high levels of lead in humans. Chronic (long-term) exposure to lead in humans results in effects on the blood, central nervous system (CNS), blood pressure, kidneys, and Vitamin D metabolism. Children are particularly sensitive to the chronic effects of lead, with slowed cognitive development, reduced growth and other effects reported. Reproductive effects, such as decreased sperm
13 Rettger, P., Arnold, J., Brandenburg, B. and Felch, C. 2006. “THE LONG LAKE INTEGRATED UPGRADING PROJECT: STATUS REPORT and DISCUSSION OF SOOT PROCESSING,” Gasification Technologies, (Washington, D.C., Oct. 1 - 4, 2006), available at
http://www.gasification.org/Docs/2006_Papers/29RETT-Paper.pdf (emphasis added).
14 Meyer, R.F., Attanasi, E.D., and Freeman, P.A., 2007, “Heavy Oil and Natural Bitumen Resources in Geological Basins of the World: U.S. Geological Survey Open-File Report 2007-1084,” USGS, 2007, at page 14, Table 1, available at http://pubs.usgs.gov/of/2007/1084/OF2007-1084v1.pdf. The USGS also found that natural bitumen contains 17,992 times more aluminum; 1,706 times more titanium; 666 times more iron; 102 times more copper; and 21 times more vanadium than conventional oil. Id.
15 See Clean Air Act § 108, 42 U.S.C. § 7408. See also, http://www.epa.gov/air/oaqps/greenbk/o3co.html.
16 “OSHA carcinogens” are “[U.S. EPA Toxics Release inventory (‘TRI’)] chemicals that are classified as carcinogens under the requirements of the Occupation Safety and Health Administration (OSHA)….” See http://www.epa.gov/tri/chemical/.
17 HAPs are pollutants “which are known to be, or may reasonably be anticipated to be, carcinogenic, mutagenic, teratogenic, neurotoxic, which cause reproductive dysfunction, or which are acutely or chronically toxic … or [which cause] adverse environmental effects whether through ambient concentrations, bioaccumulation, deposition, or otherwise….” Clean Air Act § 112(b)(2), 42 U.S.C. § 7412(b)(2).
18 EPA Office of the Inspector General, “EPA Needs to Improve Tracking of National Petroleum Refinery Program Progress and Impacts” (June 22, 2004), Appendix D, available at http://www.epa.gov/oig/reports/2004/20040622-2004-P-00021.pdf (hereinafter “EPA OIG Report”). See
also, U.S. EPA, Criteria Pollutants, available at http://www.epa.gov/air/oaqps/greenbk/o3co.html.
6
count in men and spontaneous abortions in women, have been associated with high lead exposure. The developing fetus is at particular risk from maternal lead exposure, with low birth weight and slowed postnatal neurobehavioral development noted.
See U.S. EPA, Technology Transfer Network, Air Toxics Website, available at http://www.epa.gov/ttn/atw/hlthef/lead.html#ref1.19 Environmental damage caused by these pollutants includes acid rain; concentration of toxic chemicals up the food chain; the creation of ground-level ozone and smog; visible impairments that migrate to sensitive areas such as National Parks; and depletion of soil nutrients.20 Finally, the more intensive refining of tar sand oil (as opposed to its extraction) likely produces more greenhouse gas than does refining conventional crude because the extra heavy crude is more difficult to refine and therefore requires a greater amount of energy.
Extracting Tar Sand Crude
Beneath the boreal forest of Alberta, Canada21 lies an area the size of Florida containing tar sands. Since the rising price of oil has rendered these reserves commercially viable to extract, Canada is now second only to Saudi Arabia in oil reserves, with more reserves than Kuwait, Norway, and Russia combined.22 With some
19 Recognizing the “broad array of effects” from low dose “environmentally relevant” levels of lead exposure from air emissions, the EPA recently stated: “Both epidemiological and toxicologic studies have shown that environmentally relevant levels of [lead (Pb)] affect many different organ systems. With regard to the most important such effects observed in children and adults, the Criteria Document states that ‘neurotoxic effects in children and cardiovascular effects in adults are among those best substantiated as occurring at blood-Pb concentrations as low as 5 to 10 [micrograms per deciliter (µg/dL) (or possibly lower) [a microgram is one one-millionth of a gram, and a deciliter is one-tenth of a liter]; and these categories of effects are currently clearly of greatest public health concern. Other newly demonstrated immune and renal system effects among general population groups are also emerging as low-level Pb exposure effects of potential public health concern.’ … Pb exposure is associated with a variety of neurological effects in children, notably intellectual attainment and school performance. Both qualitative and quantitative evidence, with further support from animal research, indicates a robust and consistent effect of Pb exposure on neurocognitive ability at mean concurrent blood Pb levels in the range of 5 to 10 µg/dL. Specific epidemiological analyses have further indicated association with neurocognitive effects in analyses restricted to children with individual blood Pb levels below 5 – 10 µg/dL, and for which group mean levels are lower. Further, ‘[s]ome newly available analyses appear to show Pb effects on the intellectual attainment of preschool and school age children at population mean concurrent blood-Pb levels ranging down to as low as 2 to 8 µg/dL.’” Proposed �ational Ambient Air Quality Standards for Lead, U.S. Environmental Protection Agency, 73 Fed. Reg. 29184, 29206 (May 20, 2008) (citations omitted) (emphasis added).
20 EPA OIG Report, supra note 18, at Appendix D. See also, U.S. EPA, Criteria Pollutants, available at http://www.epa.gov/air/oaqps/greenbk/o3co.html.
21 Tar sands deposits also exist in the United States, and the U.S. Department of the Interior’s Bureau of Land Management (“BLM”) is already taking steps to approve the mining of tar sands, as noted supra, at note 2.
22 Unconventional Crude, supra note 1.
7
experts predicting the “peaking” of conventional oil production in the near future, and given the political stability of Canada relative to the Middle East, the petroleum industry is increasingly eyeing Alberta as the next Saudi Arabia. However, the environmental consequences of mining and refining tar sands are frankly catastrophic.23 Mining the deposits lying relatively close to the surface means clear-cutting and strip-mining huge portions of intact boreal forest ecosystem, turning it into enormous open-pit mines as large as three miles wide and 200 feet deep.24 In fact, “[i]n any given load of sands, only about 10 percent is bitumen … [so] [f]or every barrel of synthetic crude …, forty-five hundred pounds [two tons] of tar sands have to be dug up and separated.”25 To obtain deeper reserves, a water and energy-intensive process of steam-injection, called “steam assisted gravity drainage” (“SAGD,” pronounced “sag-dee”) is used.
Each barrel of oil from tar sands requires 2.5 – 4 times as much water to produce as does conventional oil,26 and much of this water ends up in vast toxic lakes (which the oil industry euphemistically calls “tailings ponds”). The Canadian National Energy Board (a Canadian federal regulatory body) has explained that “[t]here is currently no demonstrated means to reclaim fluid fine tailings.”27 In 2005, these “tailings ponds” comprised about 20 square miles of non-reclaimable toxic lakes of mining waste, making them “some of the largest manmade structures on the planet,”28 so vast that they can be
23 As noted above, this report documents the trend of U.S. refinery expansions toward tar sand oil refining
capacity, and does not attempt a full analysis of tar sand oil extraction, beyond noting a few of the alarming environmental consequences of obtaining oil from tar sands. For a more thorough discussion of extraction issues, see Driving It Home, supra note 1; numerous documents and reports regarding tar sands from the Pembina Institute, available at http://www.oilsandswatch.org/, including “Oil Sands Fever,” supra note 4; and “Canada’s Toxic Tar Sands,” supra note 4.
24 Driving it Home, supra note 1, at 5. See also, Unconventional Crude, supra note 1: “Before mining begins, everything above the feed – trees, bushes, grass, soil, rocks, wildlife – gets scooped up and carted away. (The material is delicately referred to as ‘overburden.’) … [Suncor official Darin] Zandee said, ‘We try to move a million tons a day.’” (Emphasis added).
25 Unconventional Crude, supra note 1 (emphasis added).
26 Dan Woynillowicz and Chris Severson-Baker, “Down to the Last Drop – the Athabasca River and Oil Sands – Oil Sands Issue Paper No. 1” (The Pembina Institute, Mar. 2006) at ii, available at http://pubs.pembina.org/reports/LastDrop_Mar1606c.pdf (hereinafter “Down to the Last Drop”). The Pembina Institute elaborated in 2006: “Approved and operating oil sands operations are allowed to withdraw 349 million cubic metres (m3) of water per year – that’s enough water to meet the needs of a city of two million people, a population twice the size of the City of Calgary. Planned oil sands projects will increase water withdrawals more than 50% higher to 529 million m3 per year – more water than is used by the City of Toronto in a year.” Id.
27 Sludge Into Gold, supra note 10, at A1. See also, Unconventional Crude, supra note 1: “Suncor [alone] has nine such ponds, which collectively cover an area of eleven square miles.”
28 Bruce Peachey, “Strategic Needs for Energy Related Water Use Technologies - Water and the EnergyINet” (New Paradigm Engineering Ltd., Feb. 2005) at 34, available at http://www.aeri.ab.ca/sec/new_res/docs/EnergyINET_and_water_Feb2005.pdf (hereinafter “Strategic Needs”).
8
seen with the naked eye from space, where once was pristine forest.29 Birds which land on the “ponds” die (out of a flock of 500 migrating mallards that recently landed on a “tailings pond,” only 5 birds survived);30 toxic chemicals leak into groundwater and river systems, poisoning wildlife and drinking water;31 the open-air “ponds” emit thousands of tons of volatile organic compounds (“VOCs”) into the air, including benzene, a known human carcinogen;32 and Professor David Schindler of the University of Alberta, Edmonton, a noted ecologist, has observed that “[i]f any of those tailings ponds were ever to breach and discharge into the [Athabasca River], the world would forever forget about the Exxon Valdez.”33 Tar sand oil extraction also requires an enormous amount of energy – in fact, “[s]o much heat is required to separate the oil from the tar that Total [Petrochemicals] briefly floated the idea of building a nuclear-power plant [in Northern Canada],”34 and “for every three barrels extracted via SAGD, one has, in effect, been consumed.”35 Currently, natural gas is used to generate such heat. The New Yorker reported in November of 2007 that “[i]t is estimated that by 2012 tar-sands operations will consume two billion cubic feet of natural gas a day, or enough to heat all the homes in Canada.”36 Thus, some observers have labeled SAGD “reverse alchemy” (turning gold into lead), because it uses vast amounts of clean burning natural gas to obtain dirty, greenhouse gas-producing oil.37 Perhaps most importantly, due to the huge amounts of energy needed to extract oil from tar sands, the process releases approximately three times as much global-warming causing “greenhouse gas” as does conventional crude oil production.38
29 See Driving it Home, supra note 1, at 8, citing Oil Sands Fever, supra note 4, at 30. See also, Canada’s Toxic Tar Sands, supra note 4, at 7, citing Strategic Needs, supra note 28, at 34.
30 See, e.g., “Canada Probes Deaths of Hundreds of Ducks,” Associated Press, May 1, 2008, available via Cable News Network at http://www.cnn.com/2008/WORLD/americas/05/01/canada.ducks.ap/index.html. See also, Canada’s Toxic Tar Sands, supra note 4, at 7.
31 Canada’s Toxic Tar Sands, supra note 4, at 7. For example, Environmental Defence Canada reports that “Suncor admitted in 1997 that its Tar Island Pond leaks approximately 1,600 cubic metres of toxic fluid into the Athabasca River every day.” Id. (emphases added) (citation omitted).
32 Id. at 10.
33 Id. at 9 (citation omitted).
34 Sludge Into Gold, supra note 10, at A1. The Energy Alberta Corporation may currently be seeking to build two nuclear reactors in Alberta. Unconventional Crude, supra note 1.
35 Unconventional Crude, supra note 1.
36 Id. (emphasis added).
37 See, e.g., Canada’s Toxic Tar Sands, supra note 4, at 16.
38 Driving it Home, supra note 1, at 7, citing Oil Sands Fever, supra note 4, at 22.
9
Possible U.S. Oil Shale Development
The rush to exploit the tar sands of Canada may be a harbinger of things to come in the United States. Although oil shale39 is more expensive to mine and process than tar sands, with the price of oil currently well over $100 per barrel, shale may also now be profitable, and the refineries currently being built or adapted to process tar sand oil may need little or no additional modification to process shale oil. The U.S. Department of Energy’s Energy Information Administration (“EIA”) reported in 2006:
The global resource of oil shale base is huge …, including 750 billion barrels in the United States, mostly in Utah, Wyoming, and Colorado…. [T]he U.S. resource, if fully developed, could supply more than 100 years of U.S. oil consumption at current demand levels.40
The EIA went on to state that:
A 2005 industry study prepared for the National Energy Technology Laboratory estimates that crude oil prices [West Texas Intermediate (“WTI”) basis] would need to be in the range of $70 to $95 per barrel for a first-of-kind shale oil operation to be profitable[,] but could drop to between $35 and $48 per barrel within a dozen years as a result of experience-based learning (“learning-by-doing”).41
Reuters reported on May 21, 2008 that oil had reached $130 per barrel.42 Therefore, exploitation of the vast oil shale deposits in the United States now appears to be commercially viable.43
39 The U.S. Department of Energy’s Energy Information Administration (“EIA”) has explained: “The term ‘oil shale’ is something of a misnomer. First, the rock involved is not a shale; it is a calcareous mudstone known as marlstone. Second, the marlstone does not contain crude oil but instead contains an organic material, kerogen, that is a primitive precursor of crude oil. When oil shale is heated at moderate to high temperatures for a sufficient period of time, kerogen can be cracked to smaller organic molecules like those typically found in crude oils and then converted to a vapor phase that can be separated by boiling point and processed into a variety of liquid fuels in a distillation process. The synthetic liquid distilled from oil shale is commonly known as shale oil.” EIA 2006 Analysis, supra note 12. The oil from shale is also sometimes called “synthetic crude” or “syncrude.”
40 EIA 2006 Analysis, supra note 12 (citations omitted).
41 Id. (citations omitted).
42 See http://www.reuters.com/article/newsOne/idUSSYD3274320080521. For updated oil prices, see http://www.bloomberg.com/markets/commodities/energyprices.html.
43 In addition to oil shale, tar sands exist in the United States, and the U.S. Department of the Interior’s Bureau of Land Management (“BLM”) is already taking steps to approve the mining of tar sands, as noted supra, at note 2.
10
The mining and refining of shale may entail the same environmental consequences as tar sand extraction and refinement, since shale development similarly entails strip mining huge areas and using vast amounts of water and intense heat (and therefore large amounts of energy) to mine and process the material. Again, the EIA explains:
Underground mining, followed by surface retorting, is the primary approach used by petroleum companies in demonstration plants built in the mid to late 1970s. In this approach, oil shale is mined from the ground and then transferred to a processing facility, where the kerogen is heated in a retort (a large, cylindrical furnace) to around 900 degrees Fahrenheit and enriched with hydrogen to release hydrocarbon vapors that are then condensed to a liquid.44
Further,
A 1 million barrel per day shale oil industry based on underground mining/surface retorting would require mining and remediation of more than 500 million tons of oil shale rock per year – about one-half of the annual tonnage of domestic coal production. The process would also consume approximately 3 million barrels of water per day. 45
Since there are 42 gallons in a “barrel,” the process would consume 126 million gallons of water per day, or almost 46 billion gallons per year. Further, the EIA notes that “[d]eposits that yield greater than 25 gallons per ton are the most likely to be economically viable.”46 Thus, since there are 2,240 pounds in a ton, and 42 gallons in a barrel, for every barrel of synthetic crude, over thirty-seven hundred pounds (1.7 tons) of shale have to be dug up processed. The State of North Dakota is already considering the construction of a brand new refinery to process synthetic crude from oil shale.47 Left unchecked, the economic imperative will inexorably drive oil companies to exploit U.S. oil shale deposits, perhaps closely on the heels of the tar sands “boom.” Not only could such exploitation bring the catastrophic environmental consequences currently flowing from the Canadian tar sands experience, but it will perpetuate a global reliance on ever-dirtier oil well beyond the point at which many observers believe that we must roll back fossil fuel dependence in order to avoid the potentially devastating consequences of global climate change.
44 EIA 2006 Analysis, supra note 12 (citations omitted).
45 Id. (emphasis added) (citations omitted).
46 Id. (citation omitted).
47 See, e.g., http://www.reuters.com/article/oilRpt/idUSN2364316120080123.
11
Conclusions
An analysis of current Clean Air Act permitting activity regarding U.S. oil refineries reveals that, as the world comes to grips with the reality of climate change and the necessity of moving away from fossil fuels, the U.S. oil industry has already made a deep financial commitment to ensuring that bottom-of-the-barrel tar sand oil – the extraction of which releases three times more greenhouse gas as does extraction of conventional crude – drives U.S. energy policy well into the foreseeable future. The combination of high gasoline prices and increasing demand for oil has resulted in record profits for oil companies. We can expect refiners to capitalize on this lucrative market by exploiting now-profitable resources like Canadian tar sands and U.S. oil shale, while attempting to minimize or avoid the costs of protecting human health and the environment.48 Since demand is, at best, constant, and supply can only go down, basic economic theory suggests that this situation is not likely to improve as global oil reserves are further depleted. But, as the U.S. Supreme Court recently observed in Massachusetts v. Environmental Protection Agency, 549 U.S. __, 127 S.Ct. 1438 (2007), the U.S. government does not lack the power to address these problems. The following are a few of the steps that the United States should take – some of which are already in motion – to address the environmentally harmful consequences of tar sands development.
● The United States must reduce its consumption of oil. As part of this effort, the transportation and energy policies of the United States should improve energy efficiency standards applicable to automobile manufacturers, and should include lifecycle carbon content fuel initiatives. For example:
► In 2007, the State of California sought to implement legislation to
limit tailpipe emissions by requiring automakers to meet fuel efficiency standards of approximately 36 miles per gallon (“mpg”) for new vehicles sold in California by 2016 (a 30% increase in efficiency).49 Thirteen other states50 are ready to adopt the California standard, but California needs a waiver from the U.S. EPA under the Clean Air Act to implement standards more
48 See, e.g., Unconventional Crude, supra note 1, at 49: “If the price of oil remains above ninety dollars … then [coal-to-liquid and oil shale, as well as tar sands] … can also be developed at a profit, and, all other things being equal, they will be.”
49 See, e.g., Ylan Q. Mui, “Muzzling the Guzzle – Government Unveils Timetable for Fuel Economy Standards,” Washington Post at D-1 (April 23, 2008), available at http://www.washingtonpost.com/wp-dyn/content/article/2008/04/21/AR2008042102390.html.
50 Arizona, Connecticut, Maine, Maryland, Massachusetts, New Mexico, New Jersey, New York, Oregon, Pennsylvania, Rhode Island, Vermont and Washington. See, e.g., Erica Werner, “Senate Penal Votes to Overturn EPA on Calif. Waiver,” Associated Press (2008), available at http://ap.google.com/article/ALeqM5i1diL5VGSRQ13KR_LUECyF8ligGAD90Q4I2G0.
12
stringent than the federal standards.51 However, in December 2007, the EPA denied California’s waiver request.52 The federal government should mandate national fuel standards at least as stringent as the California standard. At the very least, California (and any other state which decides to do so) should be permitted to implement the California standard.
► California’s Low Carbon Fuel Standard (“LCFS”) (Executive
Order S-1-07, Jan. 18, 2007), calls for a reduction of at least 10% in the carbon intensity of California’s transportation fuels by 2020.53 The California Office of the Governor has explained: “The LCFS will require fuel providers in California to ensure that the mix of fuel they sell into the California market meet, on average, a declining standard for [greenhouse gas (GHG)] emissions…. The standard will be measured on a lifecycle basis in order to include all emissions from fuel consumption and production…. [T]he LCFS will ... allow providers to choose how they reduce emissions while responding to consumer demand.”54 “Lifecycle” emissions are sometimes called “well to wheels” or “full fuel cycle” emissions because they include emissions from both extraction and combustion of the fuel. The federal government should adopt a lifecycle carbon content fuel standard, which should be at least as stringent as the California standard.
► Section 526 of the Energy Security and Independence Act of 2007
(the 2007 energy bill) prohibits federal agencies from buying unconventional or synthetic fuels that have higher lifecycle greenhouse gas emissions than conventional fuels (such as oil from shale or tar sands).55 Section 526 includes very significant fuel
51 Reuters reported on April 22, 2008, that the U.S. Department of Transportation had proposed that “[c]ombined car and light truck targets would rise from an estimated 25 miles per gallon now, to 27.8 mpg in 2011; 29.2 mpg in 2012; 30.5 mpg in 2013; 31 mpg in 2014 and 31.6 mpg in 2015.” “UPDATE 1 – US DOT Wants Autos to Average Nearly 32 mpg by 2015” (Reuters, Apr. 22, 2008), available at http://www.reuters.com/article/governmentFilingsNews/idUSN2230233720080422?pageNumber=3&virtualBrandChannel=0. Notice of Proposed Rulemaking available at http://www.r744.com/files/news/cafe_proposal_apr2008.pdf. This proposed rule would implement the 2007 energy bill, setting an average standard of 35 mpg by 2020.
52 See, e.g., Erica Werner, “Senate Penal Votes to Overturn EPA on Calif. Waiver,” Associated Press (2008), available at http://ap.google.com/article/ALeqM5i1diL5VGSRQ13KR_LUECyF8ligGAD90Q4I2G0.
53 See, e.g., http://www.arb.ca.gov/fuels/lcfs/lcfs.htm.
54 Office of the Governor, State of California, White Paper – “The Role of a Low Carbon Fuel Standard in Reducing Greenhouse Gas Emissions and Protecting Our Economy” (David Crane and Brian Prusnek) (Jan. 8, 2007), available at http://gov.ca.gov/index.php?/fact-sheet/5155/.
55 See, e.g., Letter from Rep. Henry Waxman to Sen. Carl Levin and Sen. John McCain (May 2, 2008), available at http://oversight.house.gov/documents/20080502110331.pdf.
13
consumers such as the U.S. Department of Defense, and, again, “lifecycle” emissions include both extraction and combustion emissions. Currently, tar sand producers and the Canadian government are lobbying to repeal section 526 or curtail its application.56 In fact, on May 22, 2008, the U.S. House of Representatives passed a $601.4 billion fiscal 2009 defense authorization bill which includes an amendment of Section 526. That amendment “clarifies” that Section 526 does not prohibit a federal agency from purchasing a “generally available fuel” which is not “predominantly produced from a non-conventional petroleum source.”57 The precise impact of this amendment, as well as the ultimate fate of the House defense bill, remains unclear. In any case, Section 526 should be preserved without curtailment and applied to all federal agencies, including the Defense Department.
● The U.S. EPA should regulate greenhouse gas emissions from oil
refineries pursuant to the “New Source Performance Standards” (“NSPS”) applicable to newly modified or constructed oil refineries.
● The EPA should limit greenhouse gas emissions and consider alternatives
to tar sand oil feedstock in its “best available control technology” (“BACT”) and “lowest achievable emission rate” (“LAER”) determinations under the “new source review” (“NSR”) provisions of the Clean Air Act when issuing construction permits for refinery expansions or new refineries.
● In addition to increased greenhouse gas emissions, construction permits
issued under the NSR provisions should account for the increased air emissions of sulfur dioxide (SO2), hydrogen sulfide (H2S), sulfuric acid mist, nitrogen oxides (NOX), and toxic metals such as lead and nickel compounds produced as a result of processing tar sand crude feedstock.
● When permitting the pipelines which must carry tar sand crude to U.S.
refineries, the responsible U.S. environmental and public lands agencies should consider the cumulative effects on air quality and global warming of all U.S. refineries which process tar sand oil.
56 See, e.g., Will Harrington, “Inhofe Seen Eyeing Defense Bill as Vehicle to Repeal GHG Fuel Ban” (EnergyWashington Week, Apr. 16, 2008), available at http://www.tradeobservatory.org/headlines.cfm?refID=102360.
57 Amendment to H.R. 5658, As Reported – Offered by Mr. Boren of Oklahoma (May 20, 2008) (emphasis added), available at http://www.rules.house.gov/110/amendments/hr5658/boren113.pdf. See also, “House OKs Defense Bill Despite Veto Threat,” Reuters (May 23, 2008), available at http://www.reuters.com/article/politicsNews/idUSN2235721020080523.
14
● When permitting pipelines to transport tar sand oil, the responsible U.S. agencies should consider the global warming impacts of extraction of tar sand crude in Canada on the United States.
● The United States and Canada must work together to protect human health
and the environment in permitting the exploitation of tar sands in Canada, as well as the transporting and refining of tar sands oil in the United States. In this regard, the Canadian judiciary may be pointing the way toward some protections of the environment.
► On March 5, 2008, the Federal Court of Canada found that a report
prepared by a joint government panel pursuant to the Canadian Environmental Assessment Act failed to adequately consider the greenhouse gas emissions of a major tar sands project,58 causing the Canadian Department of Fisheries and Oceans (“DFO”) to withdraw approval of the project, such that the project could not proceed.59 On May 14, 2008, the same Court rejected a challenge by the oil company to the DFO’s refusal to grant authorization even after the panel “reconsidered” the environmental assessment report following the Court’s March 5th ruling.60 These cases signal the Canadian Federal Court’s willingness to scrutinize the approval processes of tar sands projects to ensure that total greenhouse gas emissions are adequately considered.
► On May 14, 2008, the Beaver Lake Cree Nation, a Canadian
Native Tribe,61 brought suit alleging that tar sands operations violate their treaty rights by infringing on traditional hunting and fishing grounds.62 Additional “First Nation” lawsuits may follow, and some observers believe that current regulation of tar sand exploitation is vulnerable to First Nations litigation.63
58 Kearl Oil Sands (“Kearl Project”), operated by Imperial Oil Resources Ventures Limited (majority shareholder ExxonMobil).
59 Pembina Institute for Appropriate Development, et al. v. Attorney General of Canada, et al., 2008 FC 302, Docket No. T-535-07 (Federal Court of Canada, Mar. 5, 2008), available at http://www.ecojustice.ca/media-centre/media-release-files/kearl.court.decision--mar2008.pdf.
60 Imperial Oil Resources Ventures Limited, et al. v. Minister of Fisheries and Oceans, et al., 2008 FC 598, Docket No. T-460-08 (Federal Court of Canada, May 14, 2008), available at http://cas-ncr-nter03.cas-satj.gc.ca/rss/T-460-08%20Decision.pdf.
61 Native Tribes in Canada are often referred to as “First Nations.”
62 Karen Kleiss, “Cree Sue Alberta, Ottawa Over Oil and Gas Projects,” Canwest News Service (May 14, 2008),
available at http://www.financialpost.com/story.html?id=515152.
63 See, e.g., Monique M. Passelac-Ross and Verónica Potes, “Crown Consultation with Aboriginal Peoples in Oil Sands Development: Is It Adequate, Is it Legal?,” Canadian Institute of Resources Law, University of Calgary, May 2007, available at http://www.cirl.ca/pdf/AboriginalOilsandsOP19.pdf.

15
Finally, when the “oil rush” currently visited upon the tar sands of Alberta comes to the oil shales of Colorado, Utah, Wyoming, North Dakota, and Montana, (as well as to the tar sands of Utah), the U.S. government must act to protect the United States from the staggering destruction already wrought in the pursuit of Canadian tar sands.
16
Appendix A – Methodology and Limitations In order to survey U.S. oil refinery permitting activity under the Clean Air Act, EIP first identified the 151 oil refineries in the United States, Puerto Rico, and the U.S. Virgin Islands, as listed in the U.S. Department of Energy, Energy Information Administration’s (“EIA’s”) report, “Refinery Capacity 2007,” which is currently the most up-to-date information available.64 Next, we identified the permitting authority under the CAA (often the state or regional environmental protection agency) for major stationary sources of pollution. In order to determine which of the 151 refineries are undergoing “modification” (expansion or new construction), we searched the websites of the permitting authorities, the U.S. EPA, and the oil companies themselves, and well as conducting global internet searches, including news outlets such as Reuters and the Associated Press. We also spoke directly with many of the state permitting authorities. Finally, we subjected our data compilation to peer review and sought input from the national community of attorneys and activists working in the areas of clean air and oil refinery pollution. EIP’s database of refinery permitting activity, including citations to permit applications, draft permits, and news articles or other documentation of identified refinery modifications is available at http://www.environmentalintegrity.org/pub500.cfm. EIP identified 17 refinery expansions and 5 brand new refineries under consideration or construction, totaling an increase in production capacity of at least 1,591,700 bpd, out of which 1,106,700 bpd is for tar sand expansions and 485,000 bpd is for conventional crude expansions. In addition, we identified 827,120 bpd of conversion from existing conventional capacity to tar sand capacity, for a net increase in tar sand capacity of 1,933,820. This tally includes only the expansions and new construction for which we were able to ascertain with reasonable certainty the amount of increased throughput capacity. Included in the “17 identified expansions and 5 new refineries,” but not included in the barrels per day totals, are the following permitting/construction actions, for which the amount of increased throughput was not ascertainable:
● Chevron (Richmond, CA) (probable tar sand expansion, but amount unknown);
● ExxonMobil (Joliet, IL) (possible tar sand expansion, but amount
unknown); ● Murphy Oil USA, Inc. (Mereaux, LA) (construction of five new tanks to
“replace” tanks damaged/destroyed by Hurricane Katrina – increased throughput capacity, if any, unknown);
64 The 2007 Report’s “Table of Operable Petroleum Refineries by State as of January 1, 2007” is available at http://www.eia.doe.gov/pub/oil_gas/petroleum/data_publications/refinery_capacity_data/current/table3.pdf.
17
● Chevron (Pascagoula, MS) (“continuous catalyst regeneration project” – increased throughput capacity, if any, unknown);
● Premcor/Valero (Port Arthur, TX) (“coker expansion project” – increased
throughput capacity, if any, unknown); ● Total Petrochemicals (Port Arthur, TX) (modification and continued
operation of the Gas Oil Hydrodesulfurization Unit and the Motor Gasoline Blending Unit – increased throughput capacity, if any, unknown); and
● One entirely new state-owned refinery under consideration by the State of
North Dakota (new refinery to process oil from shale, but size unknown). Further, not included in the “17 identified expansions and 5 new refineries” are the following permitting actions, regarding which “expansion” is unknown or not a factor:
● Marathon (St. Paul Park, MN) (possible tar sands expansion, but unclear); ● ExxonMobil (Billings, MT) (Title V Permit renewal); ● ConocoPhillips “Bayway” Refinery (Linden, NJ) (construction of asphalt
crushing machine, but no increased production capacity); ● Valero (Ardmore, OK) (Title V Permit renewal); ● Citgo (Corpus Christi, TX) (Title V significant revision); ● ExxonMobil (Baumont, TX) (Permit renewal); ● Flint Hills (Corpus Christi, TX) (PSD Permit amendment); ● Trigeant (Corpus Christi, TX) (Title V Permit renewal and revision); and ● Valero (Houston, TX) (Title V Permit issuance to operate an “ultra low
sulfur diesel” area).
18
Appendix B – Tables
Table 1
Tar Sands Expansions of Existing Refineries
Refinery State Increased Capacity /
Conversion (barrels per
day (“bpd”))
ConocoPhillips (“Wood River” Refinery in Roxana, IL, together with refinery in Borger, Texas)
Illinois and Texas 150,000
Marathon Petroleum Company (Garyville, LA)
Louisiana 180,000
Marathon Petroleum Company (Detroit, MI)
Michigan 15,000
ConocoPhillips (Billings, MT)
Montana 13,000
BP / Husky (Toledo, OH) Ohio 39,000
Sinclair (Tulsa, OK) Oklamona 44,700
Murphy Oil USA, Inc. (Superior, WI)
Wisconsin 200,000
Total Tar Sands
Expansions
641,700
19
Table 2
5ew Tar Sands Refineries65
Mandan, Hidasta and Arikara (“MHA”) Nation, Fort Berthold Indian Reservation, ND
North Dakota 15,000
Northwest Refining, Northwestern ND
North Dakota 50,000
Hyperion Refining, LLC, Union County, SD
South Dakota 400,000
Total Tar Sands 5ew
Refinery Construction
465,000
Table 3
Conversions from Conventional Crude Capacity to Tar Sands Capacity
ConocoPhillips (“Wood River” Refinery in Roxana, IL, together with refinery in Borger, Texas)
Illinois and Texas 345,000
BP (Whiting, IN) Indiana 205,000
BP / Husky (Toledo, OH) Ohio 131,000
Husky (Lima, OH)
Ohio 146,120
65 Not included in this tally is a fifth new refinery being considered by the State of North Dakota, which would be a state-owned refinery processing oil from oil shale obtained from the Bakken Shale Formation underlying North Dakota, Montana, and Saskatchewan. This possible new refinery is not included in the tally because the likelihood and size of the possible refinery remains unclear. However, if this refinery were included, then the currently contemplated U.S. increased refining capacity of tar sand and shale oil would even more completely eclipse the currently contemplated increase in refining capacity of conventional crude oil. In addition, the contemplation of this refinery highlights another possible trend which may closely follow tar sands development – strip-mining shale deposits in Colorado, Utah, Wyoming, North Dakota, and Montana, which could be equally as destructive as tar sand development.

20
Total Conversion to Tar
Sands Capacity
827,120
Table 4
Conventional Crude Expansions
ConocoPhillips (Rodeo, CA)
California 20,000
Motiva Enterprises, LLC (Port Arthur, TX)
Texas 315,000
Total Conventional Crude
Expansions
335,000
Table 5
5ew Conventional Refineries
Arizona Clean Fuels Yuma (“ACFU”) (Yuma, AZ)
Arizona 150,000
Total Conventional 5ew
Refinery Construction
150,000


![TAR SANDS: WORTH THE ENERGY? AN ANALYSIS OF THE FUTURE OF UTAH'S TAR SANDS · 2015-01-15 · 2007] TAR SANDS: WORTH THE ENERGY? 325 Middle East. I2 The largest tar sand resources](https://img.pdfslide.us/doc/110x75/5f8587e1cd7dc20fb530642f/tar-sands-worth-the-energy-an-analysis-of-the-future-of-utahs-tar-sands-2015-01-15.jpg)