Embed Size (px)
Citation preview

Master Thesis in Science Communication
Author: Josée M.L. Lebel
Supervisor: Lars Broman
Tapping into Floor Staff: Using the knowledge of floor staff to conduct
formative evaluations of exhibits in a Canadian science centre

2
3
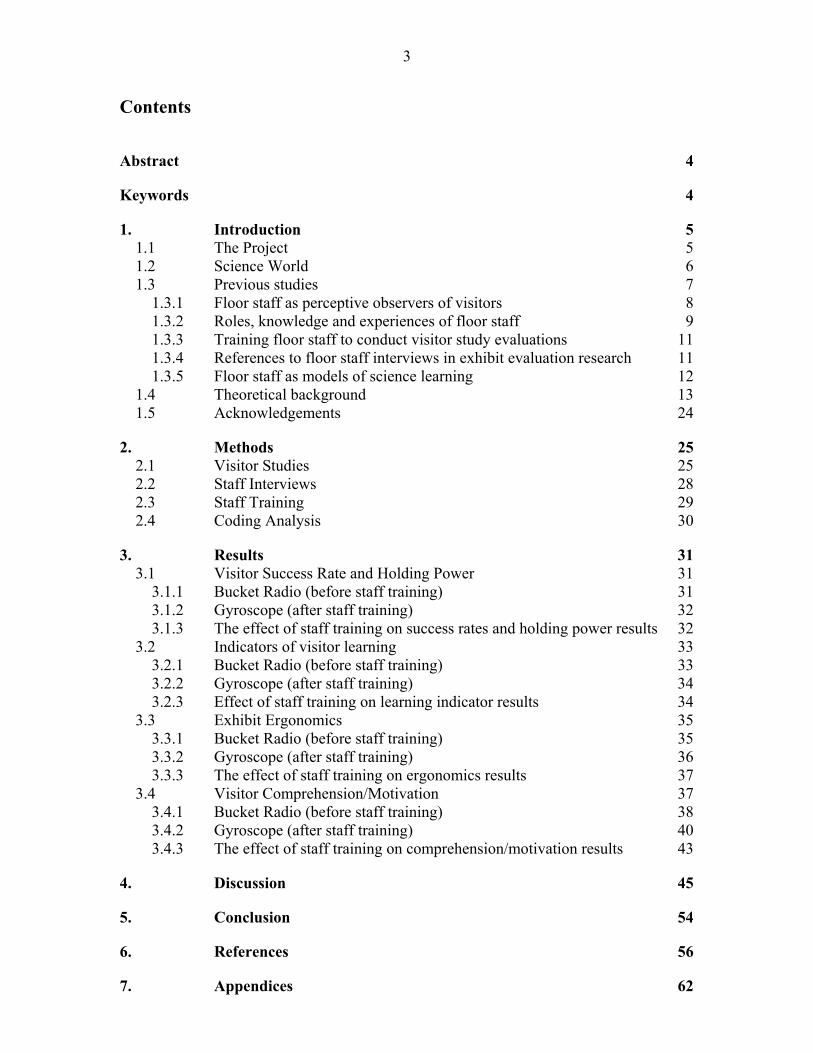
Contents
Abstract 4
Keywords 4
1. Introduction 5 1.1 The Project 5 1.2 Science World 6 1.3 Previous studies 7
1.3.1 Floor staff as perceptive observers of visitors 8 1.3.2 Roles, knowledge and experiences of floor staff 9 1.3.3 Training floor staff to conduct visitor study evaluations 11 1.3.4 References to floor staff interviews in exhibit evaluation research 11 1.3.5 Floor staff as models of science learning 12
1.4 Theoretical background 13 1.5 Acknowledgements 24
2. Methods 25 2.1 Visitor Studies 25 2.2 Staff Interviews 28 2.3 Staff Training 29 2.4 Coding Analysis 30
3. Results 31 3.1 Visitor Success Rate and Holding Power 31
3.1.1 Bucket Radio (before staff training) 31 3.1.2 Gyroscope (after staff training) 32 3.1.3 The effect of staff training on success rates and holding power results 32
3.2 Indicators of visitor learning 33 3.2.1 Bucket Radio (before staff training) 33 3.2.2 Gyroscope (after staff training) 34 3.2.3 Effect of staff training on learning indicator results 34
3.3 Exhibit Ergonomics 35 3.3.1 Bucket Radio (before staff training) 35 3.3.2 Gyroscope (after staff training) 36 3.3.3 The effect of staff training on ergonomics results 37
3.4 Visitor Comprehension/Motivation 37 3.4.1 Bucket Radio (before staff training) 38 3.4.2 Gyroscope (after staff training) 40 3.4.3 The effect of staff training on comprehension/motivation results 43
4. Discussion 45
5. Conclusion 54
6. References 56
7. Appendices 62

4
Abstract Most science centres in Canada employ science-educated floor staff to motivate visitors to have fun while enhancing the educational reach of the exhibits. Although bright and sensitive to visitors’ needs, floor staff are rarely consulted in the planning, implementation, and modification phases of an exhibit. Instead, many development teams rely on costly third-party evaluations or skip the front-end and formative evaluations all together, leading to costly errors that could have been avoided. This study will seek to reveal a correlation between floor staff’s perception of visitors’ interactions with an exhibit and visitors’ actual experiences. If a correlation exists, a recommendation could be made to encourage planning teams to include floor staff in the formative and summative evaluations of an exhibit. This is especially relevant to science centres with limited budgets and for whom a divide exists between floor staff and management.
In this study, a formative evaluation of one exhibit was conducted, measuring both floor staff’s perceptions of the visitor experience and visitors’ own perceptions of the exhibit. Floor staff were then trained on visitor evaluation methods. A week later, floor staff and visitors were surveyed a second time on a different exhibit to determine whether an increase in accuracy existed.
The training session increased the specificity of the motivation and comprehension responses and the enthusiasm of the staff, but not their ability to predict observed behaviours with respect to ergonomics, learning indicators, holding power, and success rates. The results revealed that although floor staff underestimated visitors’ success rates at the exhibits, staff accurately predicted visitors’ behaviours with respect to holding power, ergonomics, learning indicators, motivation and comprehension, both before and after the staff training.
Keywords: science centre, science center, Science World, formative evaluation, floor staff, science facilitator, interpreter, demonstrator, evaluator, professional development, training

5
1. Introduction
1.1 The Project
Context
In most science centres across Canada, floor staff are hired to help vulgarize complex scientific principals into a language understandable to visitors who wish to have a fun but educational experience. These staff, also known as demonstrators, visitor services staff, facilitators or explainers, are usually expected to have some postsecondary education in a science field combined with the ability to capture visitors’ attention and motivate them to learn more. Since these positions are usually very competitive, floor staff tend to be bright, enthusiastic, and sensitive to visitors’ needs.
However, floor staff rarely figure into the planning process of an exhibit (Tran and King 2008, Uzelmeier 2006, Fraser 1997). Exhibit developers, curators, and educators are hired by the centres to develop exhibits and educational programs. Having worked in four Canadian science centres, it has been my experience that consultation rarely takes place between floor staff and teams responsible for exhibit design. Instead, costly consultants are invited to conduct front-end, formative, and summative evaluations to legitimize the existence of the exhibit. An impartial consultant’s observations and recommendations are usually used to seek funding from government and private enterprises for the proposed exhibit, or to make changes to an existing one. Hudson (1993) points out that boards and funders tend to trust consultants more than staff, even if they come to the same conclusion. Although hiring consultants may be an automatic requirement for large exhibits, many exhibits and programs are relatively smaller in scale and cannot afford to conduct costly third-party evaluations. For smaller science centres, the cost can be particularly prohibitive.
Ideally, the exhibit development team would take time to conduct proper in-house front-end, formative, and summative evaluations for all exhibitions. In reality, many will assume what visitors know and want and will start designing without consulting floor staff. I have often heard floor staff complain about modifications to an exhibit or the creation of a new one as not being in line with visitors’ needs. This creates animosity between floor staff and “management,” since the floor staff feel that their contribution potential is being ignored.
Although some staff may be perceptive enough to successfully relay visitor responses to the planning team without prior training, attending a short training session on visitor studies should enhance their perception skills. Training staff to conduct informal visitor studies a few months after being hired could greatly benefit both the science centre and the staff in terms of professional development.

6
Aim
Rennie and McClafferty (1999) note that floor staff are a resource rarely used to measure visitor experience outcomes. In a study conducted by Johnston and Rennie (1995), it was found that floor staff’s perceptions of visitors’ purposes and outcomes matched those identified in a formal visitor study. In my proposed study, I would like to investigate whether or not a correlation exists between floor staff’s view of an exhibit’s ability to achieve its purpose and visitors’ experience with an exhibit, in the form of a formative evaluation. If a correlation exists between floor staff and visitors’ perceptions, a recommendation would be made to incorporate floor staff in the front-end, formative, and summative stages of exhibit development.
This recommendation could be of great interest to small-scale museums and science centres that cannot afford costly third-party evaluations. For larger institutions, this study could legitimize employing floor staff to conduct evaluations for official purposes. It would also provide floor-staff with development experience and foster a sense of respect and communication between management and front-line employees.
1.2 Science World
The study took place in August 2006 at Science World in Vancouver, Canada. Science World first opened as the Arts, Sciences &Technology Center in downtown Vancouver with a small exhibit space that received over 600 000 visitors in six years and an outreach team that traveled throughout the province exposing over 400 000 people to hands-on science exhibits. With private, regional, provincial, and federal funding support, Science World opened in 1989 in the geodesic dome of the Expo ’86 site.
Science World houses an OMNIMAX Theatre and high definition Science Theatre, as well as a temporary space for traveling exhibitions, a Centre Stage for live science demonstrations, a gift shop, a restaurant, and administrative offices. It is also home to five permanent galleries in 10 500 square metres of exhibit space. The Sara Stern Search Gallery exposes visitors to the natural world through hands-on exhibits, interactive quizzes and games, as well as featuring small animals such as snakes, spiders, and insects. Toddlers 2 to 6 years of age are invited to wander and play in the Kidspace Gallery without the worry of bumping into the “big” kids. The Our World Gallery invites visitors to ponder sustainability principles and their ecological footprint while the Illusions Gallery tricks the brain with its optical illusions and puzzles. Eureka, the main permanent exhibit area built in 2005 and the location of the exhibits used in this study, boasts over 30 exhibits aimed at children between the ages of 8 and 13. It tempts children and adults to experiment with physics concepts such as light, air, forces and sound.
Science World honours its roots in a variety of successful outreach programs such as Science Celebrations, SW On the Road, a satellite location at Aberdeen Shopping Centre

7
in Richmond, Engaging Science (professional development for teachers), Scientists and Innovators in the Classroom, and an after-school Super Science Club.
With over 36 000 members and 830 000 children and adults visiting the dome during 2006-2007, Science World is an icon in British Columbia. Its huge success is due in no small part to its devoted team of 120 full-time staff. Among these are 13 full-time and 30 part-time Science Facilitators, the front-line floor staff targeted in this study.
According to Science World’s job description, Science Facilitators are expected to:
• Provide our customers with a fun, awesome, wow, memorable, "out of home" experience
• Provide our customers with friendly, responsive service
• Positively influence attitudes towards science, technology, and creative tours, exhibit interpretation and admission procedures
• Ensure a safe, clean, secure environment for our customers
• Present science shows, demonstrations and school programs
• Perform In-Charge responsibilities including scheduling, management of staff’s daily activities, setting-up of evening events and hourly walkabouts to check maintenance of exhibits
• Participate in community extension programs outside of TELUS World of Science
• Ensure that galleries are well maintained and operational and provide feedback on customer interaction
• Participate in the development and running of shows, demonstrations, programs and programs such as Curiosity Club, Summer Camps and Super Science Club
• Plan, organize and facilitate make-and-take activities
• Participate in Science World committees, such as Occupational Health and Safety (OHS) and Program’s and Exhibit’s Team (PET)
• Assist in the smooth operation of all ancillary services. Host OMNIMAX and Science Theatre shows
1.3 Previous studies
Several researchers note that although the presence of floor staff tends to be highly rated by visitors, very little attention has been given to studying floor staff directly (Hein 1998; Stocklmayer, 2002; Johnston and Rennie, 1995; Falk and Dierking, 2002). In this section, I attempt to give an overview of the studies I found in my litterature search that pertain directly to floor staff.

8
1.3.1 Floor staff as perceptive observers of visitors
My study springboards from a 1995 study conducted by David J. Johnston and Leonie J. Rennie entitled Education: Perceptions of Visitors' Learning at an Interactive Science and Technology Centre in Australia appearing in the Museum Management and Curatorship Journal. In their study, Johnston and Rennie sought to measure the degree of congruency between visitors’ perceptions of a visit to the Interactive Science and Technology Centre in Australia and Explainers’ (floor-staff) views of the visitor experience. Data was collected by conducting four focus group sessions with two groups of explainers and two groups of visitors. Statements were analyzed and categorized into six general statements about the visitor experience. Johnston and Rennie found that ”explainers provided a rich source of qualitative data, and their discussion groups provided a unique insight into the explainers' perceptions of visitors' experiences.” They were impressed by the depth of explainers’ reflections and found that all had had similar memorable experiences with visitors. The following six statements were found to be congruent between staff and visitors:
Perception 1: Members of the visiting public have fun at the centre.
Perception 2: Learning is not the main purpose of the visit.
Perception 3: The role of an explainer is to facilitate understanding of the exhibits, not to teach.
Perception 4: Learning occurs when visitors relate experiences at the centre to experiences in the outside world.
Perception 5: Analogies facilitate understanding.
Perception 6: Incidental learning, unrelated to the intention of an exhibit, often occurs.
The aforementioned study was repeated in a museum of history in Rennie and Johnston’s (1996) paper entitled A Different Perspective on Visitor Learning. The researchers found that, short of the museum staff’s statement that there was a difference between local and tourist visitors, the congruency results between floor staff and visitors were the same. Recommendations were made to conduct focus groups with floor staff to provide valuable visitor information and to bring in a mediator not employed with the institution to discuss sensitive topics.
The search for a relationship between floor staff and visitor perceptions was also found in Schauble et al.’s Supporting Science Learning in Museums (2002). The researchers interviewed floor staff and parents to compare staff observations of how parents think they should assist kids and parents’ own views. Most parents perceived that their main role was to “explain” the exhibit to their children. It was found that staff accurately observed that parents simply “explained” the exhibit to their children rather than to

9
scaffold their children’s efforts to draw conclusions based on their own explorations. Indeed, staff had been able to accurately report the behaviour of most caregivers. Staff felt that this approach thwarted their efforts to foster inquiry-based learning. The researchers concluded that parents and caregivers should be taught how to support their children in the pursuit of learning at science centres.
1.3.2 Roles, knowledge and experiences of floor staff
A few studies were found to explore the knowledge and experiences held by floor staff. In general, although floor staff have excellent customer service, presentation, and science content skills, they lack formal knowledge in learning theories and practices. In Tran’s The roles and goals of educators teaching science in non-formal settings (2002), she interviewed and observed 8 educators from non-formal learning institutions (nature centres, zoos, aquaria) to determine their perceptions of science learning in informal settings and describe their teaching practices. The following seven findings emerged:
• Prompt assessment of learners’ prior knowledge is a critical skill for teaching in non-formal settings.
• Lesson plan repetition was an inherent advantage.
• Variability in job duties generated opportunities for collaboration among colleagues.
• Physical participation was used to create lasting memories.
• Programs and teaching practices were teacher-centered in nature.
• Classes at informal settings shared characteristics of science labs in formal classrooms.
• Apprenticeship-style teacher education is the norm for non-formal educators.
Tran’s main recommendations included providing pre-service and in-service training for informal educators, given that most learn their teaching strategies “on the job.” She suggests that educators could benefit from recent pedagogical methods in order to integrate inquiry-based learning and exploration in their workshops.
Similarly, Bailey’s Researching Museum Educators’ Perceptions of their Roles, Identity, and Practice (2006) focuses on how museum educators view themselves, their roles within the museum as well as the skills and knowledge based required for their work. Bailey chose to interview 15 respondents from science museums within the Massachusetts region who actively worked as museum educators and who had at least five years experience in this role. Although the range of duties differentiated based on the size of the museum, staff reported that they participated in the creation of programs

10
and exhibits, interacted with visitors, sought funding for museum programs and exhibits, shared responsibility in administrative duties, took part in evaluation and research, cooperated with staff from the museum and from other institutions, and hunted for professional development opportunities. Interestingly, although knowledge on teaching, learning, and program/exhibit development was reported to be important for their position, evaluation know-how did not figure on their list of required knowledge and skills. Staff commented that although they felt confident in their science content knowledge, they had very little formal training in learning and teaching theory, mirroring Tran’s (2002) results.
Although the focus is on exhibit development staff, the subject of learning theory knowledge held by science museum staff is addressed in Davidsson and Jakobsson’s (2007) Staff Members' Ideas about Visitors' Learning at Science and Technology Centres. The researchers telephone interviewed over 17 exhibit development staff from 11 nordic science and technology centres, to determine the source and nature of their knowledge of how visitors learn and interact with exhibits. They were also asked about the source and nature of their knowledge of how to build content for an exhibit. Most staff responded that their source of knowledge of how visitors learn was based on personal experiences and a few based on informal observations of visitors at their centres. Most had never sought professional development (formal or informal) in the field of informal learning. These results were in stark contrast to their sources of knowledge for exhibit science content, which pointed towards specific examples in the science community as well as researchers’ work in the field. Davidsson and Jakobsson were concerned about the staff’s separation between learning and fun, suggesting that exhibit developers could benefit from further training in the realm of informal learning.
At least one study recorded the attempt to integrate recent learning and teaching theories among floor staff and volunteers. Gyllenhaal (1998) researched the implementation of a relatively new approach to pedagogy called inquiry-based learning in Traveling Experiment Gallery: Final Evaluation Report. Gyllenhaal uses observations and in-depth interviews to survey floor staff’s perceptions of and experiences with the Traveling Experiment Gallery at various venues throughout the United States. Gallery staff and volunteers were trained on using the open-ended inquiry-based learning model in their approach towards visitors. Gyllenhaal found that to be successful, staff had to “accept it emotionally, understand it intellectually, and practice it as a skill.” They organized staff and volunteers’ efforts into a hierarchy: the lower levels included traditional docent actions such as explaining the exhibit; the middle level skills involved asking guiding questions to have visitors come to an appropriate conclusion; and the higher level skills concerned facilitating the creation of visitor’s own questions and helping them analyze their assumptions. Gyllenhaal found that some staff and volunteers worked at the higher level and went back to lower levels when appropriate, whereas others found it very difficult to change their traditional interpretative approaches. The exhibit designers hoped that involvement with this traveling exhibit would influence changes in the way that science centres approach hands-on learning.

11
1.3.3 Training floor staff to conduct visitor study evaluations
Graham and Gammon (1999) propose using visitor evaluation methodology to shed some light on how people learn in museum settings. In their study Putting learning at the heart of exhibition development, Graham and Gammon (1999) contended that one step in developing a plan for learning about the exhibit development process was to give senior and junior staff “visitor awareness training” both in the cognitive and affective domains. They wanted staff to better understand the knowledge-building that takes place in a museum, to appreciate the importance of evaluation as well as developing a sense of the visitor requirements. They initiated staff from various departments to various visitor studies techniques, including shadowing, unobtrusive observation, interviewing, involving them in visitor-centered focus groups. They concluded that visitor awareness training increased the understanding of the use of evaluation in exhibit development and helped staff connect to the clientele they are employed to serve.
Several studies trained and used floor staff and volunteers to conduct visitor surveys, although this action was not the focus of their study (McClafferty and Rennie, 1996). Stocklmayer (2002) explains in detail her choice of using floor staff in the evaluation process in Interactive Exhibits: What are visitors really doing? She used explainers at Questacon, the National Science and Technology Centre in Australia, to evaluate adult visitors’ experiences and to determine whether or not a science centre visit enhances the public’s understanding of science. She states that the “wealth of expertise explainers possess is often unrecognized and seldom reported in research into informal learning.” One reason for using explainers in her study was to eliminate the sometimes confrontational attitudes that arise from bringing in external evaluators. A benefit to participating explainers was that the experience enhanced their understanding of the visitor experience and ameliorated their explainer abilities. Stocklmayer admitted that it could be difficult for an explainer to go from ‘explaining’ concepts to the public to conducting an unobtrusive interview where she cannot address visitor misconceptions. An arrangement was reached: following the interview, the explainer could address some of the concepts brought up during the interview. Although this would affect the follow-up interviews with visitors, the researcher accepted this negotiation in the name of professional ethos. As a result of the evaluation, the data collected by the evaluators was able to shed some light on how the science centre experience affected the visitors’ understanding of science. It was clear that they constructed new associations with science based on prior experiences. Much valuable information was gleaned about how visitors use and view the exhibits with respect to designer intentions, which would be an excellent application of exhibit evaluation.
1.3.4 References to floor staff interviews in exhibit evaluation research
Several researchers (Fraser, 1997; Lundberg, 2005) refer to consulting floor staff in their exhibit evaluations and report excellent suggestions for improvement from this source, although this method was not the focus of their investigations. For example, as part of

12
her front-end evaluation of the Sportastic Exhibition at At-Bristol in the UK, Seitei (2004) observed visitors, asked visitors to fill out exit questionnaires and had unstructured dialogue with Explainers to determine whether or not the exhibit’s goals were reached and to glean some insight into visitors’ interactions with the exhibit. Explainers provided constructive feedback on a variety of issues for each exhibit: relative popularity, attraction, and holding power, staff favourites, maintenance issues, safety issues (“need phone on floor to enable ease of communication with first aides in case of accidents”), confusing aspects for visitors, ergonomics (“some visitors score the ball with their hands instead of kicking it”), and visitor flow through the exhibition (“allows visitors to rest and explore”). Valuable suggestions to improve the reach and scope of the exhibits were also made, such as “the choice of food within Sportastic contradicts the notion of encouraging visitors to lead active and healthy lifestyles” and “since injuries are mostly associated with sports, information on minimizing injuries in each sporting event is necessary.” In all, over 190 comments and suggestions were made by explainers, contributing significantly to the evaluation’s results.
1.3.5 Floor staff as models of science learning
Finally, the learning of science by floor staff was the focus of a study to propose a framework for teaching science in the classroom. Nyhof-Young (1996) used semi-structured interviews to investigate the effects of working as a Host (exhibit interpreter) at the Ontario Science Centre in her research entitled Learning Science in an Alternative Context: The Effects on a Selected Group of Young Science Educators. The variety of training media offered to Hosts, such as social interactions, playing with exhibits, and reading, were deemed invaluable to develop their cognitive, psychomotor, and affective skills towards learning about science. It was determined that Hosts like to introduce the public to science concepts by using the same strategies that enabled them to grasp the theory. In terms of the implications for general classroom science teaching and learning, Nyhof-Young suggests that a constructivist approach similar to how Hosts learn at the Science Centre should be taken with students, even if this means deviating from the curriculum. She concludes that relating science concepts to real-world applications and to the students’ environment is crucial to make long-term connections to science. Although the Ontario Science Centre provides ongoing professional development in science content and presentation skills, the researcher does not mention if they are trained in visitor studies.

13
1.4 Theoretical background
History of the Modern Science Centre
The science centre movement has a rich and colourful past worth exploring to contextualize the aim and role of the modern science centre. McManus (1992) provides an excellent synopsis below by outlining the evolution from a first-generation science museum to a third-generation science centre. The first-generation science museum dates back to the openings of London’s Natural Science Museum in 1881, Paris’ Musée Nationale d’Histoire Naturelle in 1793, and Philadelphia’s Acadamy of Natural Sciences in 1812, dedicated to showcasing the wonders of the natural world. Although public education was deemed to be important, their mission was mainly research-based: to further the knowledge of the natural world and to showcase their discoveries. In fact, these museums were so closely linked to universities that curators with professor status were employed to further the mission of the museum. Curators selected the items to be showcased, wrote the text, and designed the exhibitions, often resulting in dioramas and “open storage” exhibits. Museum educators were hired to guide the public through the collections, although were not consulted in the exhibit development process due to their inferior status. Today’s first-generation museums, rising in the late 60s and 70s, still employ curators as content experts but have a stronger focus on transmitting scientific knowledge to the public, thus creating the need to have exhibits designed by science interpreters well-versed in learning principals and moderated by museum evaluators.
Second-generation science museums sprouted from the popularity of exhibition fairs between the mid-nineteenth century and the mid-twentieth century. These fairs used entertaining demonstrations to showcase the advances in science and technology. The rising importance of access to education for all in the mid-nineteenth century combined with the emergence of centres built to train future technology sector workers resulted in the creation of the modern science and technology museum. These museums provide interactive, hands-on platforms through which the public could manipulate objects while learning the importance of the “progress” of science and technology in society. An example of such a museum is the Canada Science and Technology Museum in Ottawa where one can hop onto a grounded steam engine locomotive or pretend to drive a replica of an early nineteenth century automobile while perusing their impressive collection of real models. In the second-generation science museum, labels are still a main focus of exhibits and there tends to be a logical “route” for visitors to take as they move through the exhibition.
Third-generation science centres dropped the goals of research, object-based information, and history to concentrate on the communication of scientific ideas and concepts to the broad public, hoping to generate an appreciation and enthusiasm for science. Typically, large, thematic exhibits are replaced by exploration stations that encourage visitors to

14
experiment and make their own discoveries based on what they observe and experience. In other words, their exhibit designers seek to create both a “hands-on” and “minds-on” experience for visitors. Third-generation science centres are characterized by galleries with stand-alone interactive exhibits under a general thematic umbrellas such as “Physics,” “The Human Body,” or “Astronomy.” These stations must be robust enough to withstand the manipulation by hundred and thousands of visitors each year of all ages. A proliferation of such centres was seen in the 1970s and 1980s in North America, eventually leading to their establishment throughout the world. The Exploratorium in San Francisco (est. 1969), Science North in Sudbury (est. 1984) and Science World in Vancouver (est. 1989) are excellent models of the modern third-generation science centre, created by teams of content specialists, educators, and designers. Visitors to these science centres are greeted by “science specialist” floor staff who help them demystify science concepts and ensure that the day-to-day operations run smoothly.
Recently, some science centres have expanded their reputation for not only creating an entertaining experience but also for bringing sociopolitical issues to the public. Science World hosts “Girls in Science” evenings where professional women scientists act as mentors to young women. It has also been focusing many resources on issues pertaining to sustainability, as evidenced in the “Our World” gallery and the games offered on their website. The Vancouver Aquarium now concentrates its efforts in promoting conservation through education and community initiatives such as salmon tracking, marine mammal rescue, and shoreline cleanups. Science North (Sudbury, ON) created a traveling object theatre that deals with climate change issues.
Interpretation and Floor Staff
Traditionally undervalued
Traditionally, museum educators had relatively low status in the museum hierarchy and were very rarely consulted by curators (Lord, 2007). Simmons (1996) notes that in the past, floor staff fulfilled a primarily security role in the museum, trained to enforce museum rules answer visitor’s questions rather than engaging visitors in discussions and modeling new approaches to exhibit inquiry.
Several researchers point out that in many museums, job titles changed from “warders” and “security guards” to “stewards” and “visitor services,” (Hooper-Greenhill, 1994; Macdonald, 2002; Caulton, 1993). Macdonald (2002) remarks that although their titles have changed, the difference often goes unnoticed by other museum staff. Black (2005) argues that “many museum and heritage managers have continued to view the idea of quality in museums and heritage sites strictly in terms of the site, collections, and programs,” rather than the voices hired to interpret these collections to the general public. He asserts that most visitors encounter floor staff rather than management and, although hired for sensitivity to visitor needs, floor staff “are the worst paid, least well-trained and most poorly supported of all museum personnel” (Black, 2005). Ironically, Caulton (1998) reports that in most science centres and museums, more than 50% of the annual budget goes to paying salaries of front-of-house staff, which is usually the largest allocation of funds to any one area.

15
Other researchers agree that museum educators are the nucleus of the learning experience due to the constant exchanges with the visitors and warn that unless more care is taken to support floor staff, the museum may miss important opportunities to foster deeper science learning (Lord, 2007; Schauble et al., 2002; Tran and King, 2008). Lord (2007) suggests that their importance should be reflected in the museum’s organizational structure and that they be compensated accordingly.
Definition
So why enter the field of museum education? Storrs (1992) eloquently describes the attraction:
Museum education is a thinking person’s career. Most of us were drawn into it because we not only love objects but also possess a flare for ideas. Mental work and mental play are at the heart of what we do. We use them constantly, often unconsciously, to design creative interpretive programs, to teach, and to understand our role within the larger order of things. Above all, by exercising our minds energetically, we model the benefits of an engaged, thoughtful relationship to the world
Explainers, science facilitators, visitor services, demonstrators, educators, guest services, blue coats, and interpreters are among the titles held by floor staff in science museums and centres. Cunningham (2004) found that more than 12 000 educational sites such as parks, science centres, museums and aquaria have interpreters in the United States alone. Although their job descriptions may vary, Cunningham (2004) created a definition of interpretation that can be used in several educational settings:
Interpretation is conversation, guided interaction, or any communication that enriches the visitor experience by making meaningful connections between the messages and collections of our institutions and the intellectual and emotional world of the visitor.
When attempting to describe the role of floor staff in third-generation science centres, researchers remind their audience that staff no longer passively dispense information in the manner of a tour or lecture. Instead, floor staff are expected to help visitors connect conceptually and physically to the exhibits by making them feel at ease in this highly exploratory environment. They are present to discuss the exhibits and to assist visitors in drawing their own links to the collections (Tran, 2002; Nyhof-Young, 1996). To these ends, the personality of the interpreter is of the utmost importance. Caulton (1998) claims that the “basic requirement for being an explainer [at the Exploratorium] was the ability to establish immediate rapport with children and adults.” In this sense, floor staff could be seen as “visitor experts” with similar contributional status as design experts and content experts.
Falk and Dierking (2000) assert that while not much research has been conducted on the role of interpreters in museum settings, several studies state visitors’ claim that floor-staff positively influenced their visits.

16
Secondary to their hosting duties, floor staff are expected to lead group programs and workshops, describe visitor-exhibit interactions with education staff, participate in special events, provide security to visitors and galleries, and report exhibit deficiencies to the design staff (sometimes repairing the exhibits themselves). In some centres, floor staff are asked to participate in the creation and development of new programs, initiatives, and exhibitions.
Floor Staff Aptitudes/Knowledge
In most third-generation science centres, floor staff are expected to have a degree in Science or Education or be in the process of obtaining their credentials. They usually have a minimum of 2 years of customer service experience and have well-developed public-speaking and interpersonal skills (pers. observation).
Although training programs are available at local, regional and national levels, Tran and King (2008) point out that no professional accrediting agency (such as that for teachers) exists for museum educators. They contend that a gap remains between research on learning in a museum setting and the application of the research in a real-world setting. Six areas of knowledge required by museum educators are recommended:
• context (how setting affects learning)
• choice and motivation (educators should scaffold visitors’ own learning experiences rather than lead them on their own learning agendas)
• objects (nature of object knowledge and how to make it tangible for visitors)
• content (content itself, history, sources of information)
• learning theories (constructivism, sociocultural theory)
• talk (presentation skills)
Learning Theories
Since this study rests on the validity of visitor studies evaluations, it is important to review the literature leading to modern learning theories and how people learn in informal environments.
Modern learning theorists have long criticized the behaviourist learning model in which people learn by being exposed to a system of rewards and punishments (Arnett 2001). As a part of comparing behaviourist and naturalist research, Hein (1998) surmises that the behaviourist approach seeks to categorize visitor behaviours in order to draw statistical inferences. The naturalist approach seeks to understand individual visitor experiences in specific situations. Drawing statistical inferences on behaviours, especially if it is based on nationality, gender, or social class can be dangerous for generalizing how certain “groups” react to various exhibits. The naturalist approach embraces the fact that all visitors have different backgrounds and will probably conclude that the ideal exhibit should address the needs and interests of a variety of learners.

17
Theory of Cognitive Development
Jean Piaget (1896-1980), a swiss cognitive scientist, became internationally renowned for his highly influential Theory of Cognitive Development in the mid 20th century (Arnett 2001). He directly contradicted behaviourists by arguing that learning takes place in stages and that an individual must reach a certain stage to be able to learn certain things. This theory of maturation implied that an individual’s environment could not speed up her access to the next stage – it depended on time and thus, on age. Learning starts in the sensorimotor stage up to age of two, in which children coordinate sensory input with motor activities. For example, they try and aim a spoon they see and feel to their mouth. The preoperational stage follows between the ages two and seven, in which children are not able to think abstractly – they need concrete experiences. In this stage, a child will be able to imagine a fairytale being told to her but will have a difficult time accepting that this scenario is not taking place somewhere concrete. Between the ages of 7 and 11 an individual enters the concrete operations stage, whereby she is able to reason abstractly as long as the subject is based on her accumulation of physical experiences. For example, a child of this age is able to replace objects by numbers when doing an arithmetic problem. Finally, between the ages of 11 and 20, an individual crosses the threshold of the formal operations stage. She is able to think logically and abstractly and is able to hypothesize. She is capable of metacognition, the ability to think about how they think. Piaget suggested that children look for stimuli that match their maturation stage. His theory has influenced the way science centres approach exhibit design for children – it must lead to a hands-on, practical experience that can springboard off their previous skills and knowledge, while keeping in mind their cognitive limits.
Theory on Multiple Intelligences
Howard Gardner’s recent Theory on Multiple Intelligences has already become part of the curriculum in teacher education programs. Gardner hypothesizes that various types of intelligences exist and are used to different degrees based on the uniqueness of the individual (Arnett, 2001). Hein (1998) describes Gardner’s seven intelligences as a basis for the unique nature of learning: linguistic, musical, logical-mathematical, spatial, body-kinesthetic, interpersonal and intrapersonal. Although most formal education institutions design programs largely based on linguistic and logical-mathematical intelligences, several researchers argue that this theory should be considered when designing an exhibit to make it accessible to a wider audience (Hein, 1998; Rennie and McClafferty, 1999).
Sociocultural Roots of Learning
Vygotsky, a peer of Piaget’s, proposed that learning is primarily a sociological process and that to understand learning, one must look at the individual’s surroundings and sociocultural context rather than studying an individual as an isolated entity (Falk and Dierking, 2000). Vygotsky argued that individuals required social interactions in order to develop the tools for learning and processing information, which is largely based on the culture in which they were raised. At first, a child turns to an adult to help learn how to do things and how to solve problems. Eventually, the child is able to use these learned tools to solve their own problems and process new information. In short, without being

18
surrounded by society, higher learning processes would not occur (Falk and Dierking, 2000).
Allan (2004) alludes to Vygotsky’s theory when advocating the need for “immediate apprehendability” of exhibits: that exhibits should be straightforward, easy to figure out and have relevant information easily accessible to the user. He illustrates the sociocultural approach by describing the adult’s role when accompanying a child to the science centre:
Adults wanting to support their children must make sense of each novel device, decipher the instructions, guide their children toward the key experience, interpret this experience for themselves, translate the significance of it for their children, assess the result, and make on-the-fly adjustments as needed to optimize their children’s learning. Over and over, every few minutes, adults coach their children in technical and cognitive skill-building without previous training. (Allan, 2004)
Constructivism
Constructivism, a philosophy of learning that embodies many of the previous theories, describes learning as a highly individual activity based on previous knowledge and experiences. In this sense, an individual uses his previous experience as a springboard to reorganize his understanding, acquire new ideas and concepts, and abandon ideas that do not correspond to his new view of the world around him (Leinhardt and Knutson, 2004). The science centre model is a unique opportunity for individuals to choose their own learning opportunities and to make their own meaning.
Contextual Model of Learning
Falk and Dierking (2000) draw on the learning theories above to provide an approach to studying how people learn, specifically suited to science centres and museums: the Contextual Model of Learning (CML). In this model, the authors describe learning as the interplay of the individual and her social and physical environments, resulting in a highly unique learning experience.
The Personal Context includes the motivation of the individual to learn and her ability to choose her learning opportunities freely, both rooted in her previous knowledge and experiences. Thus, what a person wants and chooses to learn is highly personal – it is difficult to predict the myriad of ways an individual will feel about, interact with, and learn from an exhibit.
The importance of society and culture in learning as purported by Vygotsky is the main focus in the authors’ description of the Sociocultural Context. Shared learning opportunities, interests, and motivations create clusters called “communities of learners” or groups of individuals who share a common set of experiences and knowledge. It is by interacting with the people, cues, and objects that surround them that individuals learn. Research has provided evidence that the social interactions that take part in a group strongly influence the quality and degree of the learning experience (Roberts, 1997;

19
Gleeson, 1997; Griffin, 1999; Hooper-Greenhill 1994). Studies have also revealed that interacting with staff can increase the time spent at an exhibit by as much as 22 minutes (Falk and Dierking, 2000). Falk and Dierking (2000) remind the readers that all actors benefit from the social interaction: “They [the staff] are also transformed by the interactions they have with visitors, in the same way that visitors are transformed and affected by interactions with them.”
The Physical Context, including orientation, comfort, ergonomics, and safety has been reported to be crucial to a successful museum experience (Hein, 1998; Rennie and Johnston, 2004; Barriault, 1999). When one recalls a story, it is usually placed in the physical milieu in which the event took place. Falk and Dierking (2000) claim that “Humans automatically form long-term, emotion-laden memories of events and places without deliberately attempting to memorize them.” The search for familiar, recognizable scenarios in new experiences has important implications on the approach to museum and exhibit orientation and design. Furthermore, learning cannot be measured solely by looking at what has taken place inside the museum. Long-term storage of knowledge depends on subsequent events that recall or reinforce the learning that took place in the museum, linking it to the visitor’s world (Falk and Dierking, 2000, Rennie and Johnston, 2004). Observations and experiences may not come up on a questionnaire but could be recalled days, months, or years later when a person is trying to make sense of his environment.
Although the Contextual Model of Learning is an excellent framework to highlight the myriad of considerations when looking at learning, it does not make the job of assessing learning seem virtually impossible. Several researchers discuss the difficulties in addressing the individuality of learners when designing an exhibit and trying to evaluate the learning that has taken place (Weil, 2007; Griffin, 1999; Leinhardt and Knutson, 2004; Rennie and McClafferty, 1999). In the next section, a discussion of evaluation tools and research help give some insight on how to tackle these issues.
Evaluation
History
In the early 20th century, evaluations in museums looked mainly at ergonomics – how visitors interacted with exhibits as well as exhibit design challenges (Kelly, 2005). In the 20s and 30s, researchers started focusing on how people learned in museums, a result of the “accessible museums for all” movement, regardless of class or education (Hein, 1998; Kelly, 2005). The studies were mainly quantitative in nature and looked at behavioural and cognitive outcomes, often based on the curator or exhibit designer’s goals for the exhibit.
Between 1970 and 1990, an explosion of research surfaced, mainly based on questionnaires, surveys, visitor tracking, as well as behaviour and learning objectives (Kelly, 2005; Bitgood, 2002; Hein, 1998). It also saw visitor studies leave the exclusive domain of outside professional evaluators (Melton, Robinson, Screven, and Shettel) to be conducted internally by museum employees (Bitgood, 2002). In the late 70s, a

20
“naturalistic evaluation” of visitors and their interactions with exhibits was developed, making a case for the use of qualitative data in visitor studies (Bitgood, 2002). The constructivist philosophy changed ways in which educators viewed learning (as being constructed upon an individual’s prior knowledge and experiences) and thus led to a change in how learning should be measured. Oppenheimer, the creative genius behind the Exploratorium in San Francisco on which most third-generation science centres are modeled, provocatively suggested that the fact that learning had occurred was important, not what was actually learned (Bitgood, 2002).
Over the past 20 years, the importance of the individual experience, storytelling, and learning behaviours has moved to the forefront of innovative evaluation techniques (Roberts, 1997; Kelly, 2005; Hein, 1994; Hooper-Greenhill, 1994; Leinhardt and Knutson, 2004).
Purpose
The drive to change traditional museum practices to meet the needs of visitors to compete in the current economy has pushed museums and science centres to incorporate the latest findings in visitor research. The rise in museum evaluations is largely due to the economic crisis that forced institutions to fight for government and private funds, most of which require proof of reaching educational goals (Hein, 1994; Kelly, 2005; Weil, 2007). Cuts to school budgets that force teachers to discriminately seek museum services and the professionalization of the museum educator field put the pressure on museums to question how people learn and how best to serve their communities (Hein, 1994).
Friedman (1993) gives several examples on how an initial investment in formative evaluation will practically guarantee effective exhibits. Hein (1998) invokes the physical context of learning when he observes that “in many instances visitors’ interaction with individual exhibitions has been improved by changing the physical conditions, providing more opportunities for visitors to engage, feel rewarded, or be motivated.” McLean (1993) describes the Disney approach to evaluation, in which everyone, from the staff to the board of directors, explore the exhibitions as visitors do. “The ultimate goal of all evaluation is to find out how well we are doing and to get to know our visitor better” (McLean, 1993).
Although evaluation is deemed crucial by several museum researchers for the production of stellar exhibit, very few museums involve systematic evaluation in their day-to-day operations, even though large sums are involved in developing exhibitions (Hooper-Greenhill, 1994; Hein, 1998; McLean, 1993; Economou, 1999). Indeed, in a research of the Australian cultural heritage sector institutions, Reussner (2003) reported that only one third commissioned or carried out visitor studies. Several researchers found that the main barriers to conducting visitor studies was money, time, and human resources (Reussner, 2003; Hike 1993; Miles 1993). Exhibits are often on a short timeline and take up all available staff, meaning that the argument for prototyping often fall on deaf ears. Lack of interest or belief in its benefits, a lack of understanding, and an uneasiness on how to take on evaluation were additionally found to be barriers to undertaking audience research (Reussner, 2003).

21
Methods
Traditionally, a cognitive approach to visitor studies was used. Serrell (1993) describes the industry standard for a “good” exhibit:
A ”good” exhibit was one in which visitors moved through the exhibition at less than 300 square feet per minute, attended at least 51% of exhibits and could correctly quote or recall specific facts, ideas, attitudes or concepts related to the exhibition elements and objectives. (Serrell, 1993)
As more researchers embraced the constructivist approach to learning, defining and assessing learning in museums became more complex than previously believed. For this reason, many researchers advocate looking at the variety of ways visitors make meaning during their visits, rather that at a predetermined list of learning outcomes, which can deviate greatly from the designer’s intention (Griffin, 1999; Rennie and McClafferty, 1999; Gleeson, 1997).
Questionnaires and interviews are not always sufficient to highlight what visitors are learning, since learning is personal, contextualized, and takes time. Many proponents of naturalistic research (Rennie and Johnston, 2004; Kelly, 2005; Leinhardt and Knutson, 2004; Roberts, 1997) recommend unobtrusively audio and video taping visitors to gather insight into personal meaning-making that takes place in museums. This methodology can also give a glimpse into the reasons why visitors choose to stay at certain exhibits while ignoring others.
We learned that what a group talks about, it thinks about; that talking is a tool for socially constructed thought, not just evidence of it; and that talk supports the gradual alteration and development of goals during the course of a visit. (Leinhardt and Knutson, 2004)
Meylan (1995) points out, however, that interviews and coding long transcripts are extremely time consuming and often require a large monetary and human investment. While these methods most accurately represent the individual visitor experience, much work needs to be done to develop its systematic and cost-effective implementation. Meylan (1995) still believes that there are benefits to traditional tracking, timing, behavioural mapping, and interviewing visitors. The first three are unobtrusive and are easy to train observers. Interviews require intensive in-house staff training and is a relatively intrusive method, but can help explain the observations recorded with less obtrusive methods (McDonald, 1993).
Unobtrusive methods, such as tracking and observing visitor behaviour, has been criticized for leaving out affective and emotional aspects uncovered by interviewing techniques. Over the past decade, however, innovative researchers such as Griffin (1999) and Barriault (1999) have come up with a list of learning indicators, revealing various levels of learning. Barriault (1999), in particular, devised a visitor-based framework to observe learning, dividing the visitor experience into three categories of behaviours: Initiation, Transition, and Breakthrough. In the Initiation category, she describes the

22
importance of behaviours such as watching others, doing the activity, and receiving information from staff as building the confidence and motivation required to invest oneself. In the Transition category, behaviours such as repeating the activity or having outbursts of emotional responses mean that the visitor has decided to engage himself. Finally, in the Breakthrough category, the visitor may be observed talking or teaching someone else, seeking information from others or from the signage, relating the exhibit to past experiences, or testing variables. She argues that reaching this phase enables true learning to occur.
Questionnaires, interviews, focus groups, and observations are used in varying combinations depending on the purpose of the evaluation. Most museum and science centre investigators categorize evaluations into three main categories: front-end, formative, and summative studies. The summaries below synthesize the descriptions found in museum studies literature (Economou, 1999; Kelly, 2002; Miles, 1993; McClean, 1993; Hein, 1998; Scriven, 1991; Graham and Gammon, 1999; Hooper-Greenhill, 1994).
Front-end studies seek to uncover visitors’ feelings, knowledge, and interest on a subject, before the research, writing, and production of the exhibit begins. The results of a front-end study could mean the cancellation of a proposed exhibit, saving the institution valuable time and money. Focus groups, market research, questionnaires, and deep interview techniques can also lead to the refining of an exhibit, increasing its relevance to the audience.
Formative studies can also be called prototyping, taking place before the exhibit goes into production mode. The assumptions made by the exhibit design staff are tested to assess the ergonomics of the exhibit. The labels, maneuverability, and usage of the exhibit are evaluated to ensure that the exhibit can be successfully used by the majority of visitors. In this phase, small samples of visitors can be used – it is the variety of responses that are important, not the frequency (Rennie and McClafferty, 1996; Screven, 1991). In other words, how many ways can visitors approach and use this exhibit? How many meanings can be gleaned from its usage? Open-ended questions and visitor observations are often used in this phase. The evaluator will make small changes to the exhibit (often to the labels) to note whether or not a change occurs in the visitor’s interaction with the exhibit. Other than ergonomics, formative evaluation can also help uncover the visitor’s interpretation of the exhibit, to see whether or not the purpose of the exhibit was met.
A summative evaluation usually takes place after the exhibit is opened to the public. Its goal is to expose the actual usage, effectiveness, strengths and weaknesses of an exhibit or exhibition, usually to report back to community and financial supporters. The results of a summative evaluation can also contribute to the institution’s “best practices” arsenal – it will affect future approaches to programs and exhibits. Most funding agencies require a summative evaluation when an exhibit goes public to demonstrate that its goals have been reached.
Kelly (2002) provides an excellent summary of the aims of front-end, formative, and summative evaluations:

23
Type of evaluation Aims
Front-end
• help identify the project brief • gain an understanding of the potential audiences' prior knowledge
and interests, particularly relating to concepts • test theories about visitor behaviour and learning • find out audience needs and how can these be met • collect relevant information about audiences and any proposed ideas
to help decision making.
Formative • seek feedback related to how well the proposed program
communicates the messages • produce the optimum program within the limits of what's possible • provide insight into learning and communication processes.
Summative
• give feedback about achievement of objectives • provide information on how a program is working overall, how
people use it, what they learn from it, or how they are changed • provide reports, plan for future projects, suggest research, identify
problems with visitor usage, interest and learning, identify successful strategies, layouts, etc
• identify the relationship between the program costs and outcomes through a cost/benefit analysis.
Team approach to exhibit design and evaluation
Some literature was found pertaining to the benefits of involving all levels of staff in exhibit design and evaluation. St-John and Perry (1993) claim that the success of an exhibit relies on the relationship between the designer and the visitor. The designer must have a strong knowledge of the subject, the ability to communicate to the visitor, and to see the subject from the visitor’s perspective. They describe this as the “triangle model” between designer, visitor, and content. A weak side of the triangle results in a weak exhibit. A solution can be obtained by teaming up a design specialist, a content specialist, and a visitor specialist in the development phases of the exhibit. The bridge between visitor and content can be gapped by having floor staff evaluating exhibits – they can provide insight on visitor’s perspectives, assumptions, use, and conclusions.
Uzelmeier (2006) supports this approach by pointing out that only by teaming up a designer and an educator can the requisite skills for building an interactive exhibit be complete. When differences arise between their points of view, evaluation is key in solving the dilemma. By involving visitors in the on-going improvement of exhibits, they too feel like they’ve helped create the museum (Friedman, 1993).
Economou (1999) recommends involving all members of curatorial, management, and public services staff in visitor evaluation procedures. Strategies to increase visitor awareness include “Day at the Museum” where staff join a group of visitors as visitors;

24
“Have a bad day” where staff invite friends and family who do not have a desire to visit the museum to find out how they interact with the exhibits; and “Insect visitors” whereby staff observe visitors in different locations and at different times to be able to describe their behaviour. These strategies have been adopted by Disney, where they have everyone, from staff to the board of directors, explore as visitors do.
Kelly (2005) promotes communities of practice as way to use evaluation and research data. “Communities of practice” and “best practices” symposia are a means to gather educators, marketers, directors, and other actors together to share their best ideas with others, leading to higher standards across the industry.
1.5 Acknowledgements
I would like to give my thanks to:
Lars Broman (Dalarna University supervisor) for his guidance and motivation, Pauline Finn (Director of Community Engagment at Science World) for being my role model and inspiration, Sandy Eix (Curator and Eureka Gallery Designer at Science World) for her help in organizing the onsite study and for her unbridled enthusiasm that gives hope to the profession, the Science World Science Facilitators, who impressed me with their professionalism and enthusiasm, Chantal Barriault for her insightful comments and brilliant work that inspired me to pursue a Master’s degree, Blaire Chisholm whose experience in writing her own Master’s thesis helped get me through an intensive period of writer’s block, Vancouver’s Britannia Library for having a space with wireless internet to spend my long days,
and, above all,
Anthony Schneider, my favourite stay at home dad whose support and encouragement led to the completion of this thesis.

25
2. Methods
In this thesis, I am evaluating the accuracy of staff predictions of how visitors perceive and interact with exhibits. Both staff and visitors were interviewed on the Bucket Radio exhibit and, after the evaluation training session with staff, both staff and visitors were interviewed on the Gyroscope exhibit. I chose to use a different exhibit before and after the training to ensure that staff were provided with an opportunity to evaluate a new exhibit, free of biases that may have formed during the initial interview.
Two exhibits from the Eureka gallery, entitled “Bucket Radio” and “Gyroscope,” were chosen by the exhibit development staff at Science World. Both had been earmarked previously as problematic for visitors and funding had been secured for their renovation. Neither had undergone a formative evaluation in the past. Their descriptions can be found in Appendix A.
Although both quantitative questionnaires and qualitative visitor interviews were employed, the study is of a predominantly qualitative nature since it involves formative evaluation. The evaluation seeks to reveal the variety of ways in which visitors interact with the exhibits rather than the frequency of these events
2.1 Visitor Studies
The study concentrated on youth aged between 8 and 13 years of age, the audience targeted by the Eureka gallery. Subjects were chosen at random every ten minutes by approaching the child engaging with the exhibit. “Engaging” was defined as either reading the signage, using the exhibit, or watching another visitor. Visitors who casually glanced at the exhibit or who ignored the exhibit were not approached. Tokens such as 2-for-1 passes and rulers were given to children as an incentive to participate in the interviews. Floor staff were asked not to tend to the exhibits being evaluated to avoid biasing the results.
Graham and Gammon (1999) suggest a number of 30-40 visitors is sufficient to measure a wide range of visitor responses to an exhibit whereas Kelly (2005) suggests a minimum of 15-20 visitors for a formative evaluation. Screven (1991) asserts that even a very small sample size can yield a wealth of knowledge when prototyping an exhibit. Although no new information surfaced after approximately 15 visitors were surveyed, a sample size of 30 was reached to increase the validity of the study.
Although a formative evaluation is usually supposed to take place during the development phase of an exhibit (Hein, 1998), results found in a completed exhibit’s

26
evaluation can lend valuable information about the exhibit. Indeed, Hooper-Greenhill (1994) has found that “some designers would see the whole life of the exhibit as being one long process of formative evaluation.” The formative evaluation is meant to measure the range of problems related to an exhibit rather than the frequency of occurrences (Rennie and McClafferty, 1999). Since the exhibits selected were to undergo a renovation process, the exhibits could be said to be in the prototype phase of exhibit development.
The evaluations focused on the topics suggested by Graham and Gammon (1999) when conducting a formative evaluation:
Ergonomics: Can visitors operate the exhibit effectively?
Motivation: How successfully does the exhibit attract and hold visitors’ attention?
Comprehension: Can they identify the key messages intended by the project team?
Ergonomics
The ergonomics were evaluated by unobtrusively observing and recording visitor behaviour with the exhibit. McClafferty and Rennie (1996) suggest that although visitors may use the exhibit in ways not intended by the exhibit developers or may draw their own conclusions and thus construct their own meaning, there is an intended way for the exhibit to work. In this study, the sequence in which visitors manipulated the exhibit was recorded, as well as whether or not they had “successfully” completed the task required by the exhibit.
“Successful use” of the exhibits was defined to staff as the following:
Bucket Radio: the visitor touches the outside bottom of the bowl to the peg, puts down his hear to the bowl and hears the music.
Gyroscope: the visitor cranks the flywheel, uses the disc to gently turn the apparatus, which causes the platform he is standing on to turn.
Motivation
Visitor motivation was evaluated by traditional museum evaluation tools such as holding and attraction power. Miles and Tout (1993) point out that although holding power does not acknowledge individual visitor uniqueness nor the fact that some exhibits take longer to complete, people will not stay at an exhibit if not motivated by interest. They report that data does not confirm suggestions that visitors fall into two classes: those who investigate exhibits in depth and those who do not. Their research does comment on “museum fatigue,” a phenomenon whereby visitors are more likely to interact with exhibits within the first 30 minutes of their visit – after this time they will stay at exhibits less time and visit less of them. In this study, holding power is evaluated to determine whether or not staff are able to predict the average amount of time visitors are willing to

27
devote to the exhibit. Visitors’ time at the exhibit was unobtrusively tracked and recorded.
Attraction power can be evaluated by keeping track of how many visitors walk by an exhibit relative to how many stop to engage with the exhibit. Critics argue that the reasons for ignoring an exhibit cannot be assessed using this unobtrusive method (Hooper-Greenhill, 1994; Hein, 1998). Visitors may have already attended the exhibit in the past or may be planning to return at a later time. Some researchers interview visitors who have ignored an exhibit to find out their motivations for doing so. In this study, I have chosen to ask visitors “what attracted you to this exhibit” in an open-interview format rather than tracking visitor attendance.
Open-ended questions were chosen to give insight into the elements that attracted, rewarded, and confused visitors, resulting in a longer or shorter holding power. The questions I included in the open-ended portion of this study were modified from those suggested by Meylan (1995). Below are the questions related to motivation asked to visitors and staff.
Visitor: What made you notice this exhibit?
Staff: What do you think attracts visitors to the exhibit?
Visitor: Did you find part of it confusing or frustrating?
Staff: Which part(s) would you say are confusing or frustrating to the visitors?
Visitor: Is there something you really liked about it (your favourite part)?
Staff: Which part(s) do you think the visitors especially enjoy (their favourite part)?
Visitor: The evaluator explains the purpose of the exhibit. What could we change to make it better?
Staff: How could we change the exhibit to make it more understandable to visitors? Include cues you typically have to provide visitors for them to figure out the exhibit.
As suggested by Rennie and McClafferty (1996), the researcher should be ready to rephrase question when interviewing children. This rule was observed in interviewing the targeted age group. Responses were recorded on interview forms.
Comprehension
Diamond (1999) suggests that open-ended interviews in which the evaluator asks set questions but does not have pre-set answers (as in multiple choice) are excellent for prototype evaluations since it more accurately measures the range of ways visitors interact with an exhibit. McClafferty and Rennie (1996) point out that the only way to evaluate cognitive and affective indicators is to interview visitors. In this study, the questions gave insight into the visitor’s perceptions of what they thought was confusing, particularly enjoyable, and the purpose intended by the exhibit designers. Visitors were

28
asked “What do you think the exhibit designer was trying to teach people with this exhibit?” rather than “What do you think this exhibit is about?” so that the child would not feel that she was being tested. Responses were recorded on interview forms.
Evidence of Learning
Although not typically a part of the formative evaluation process, I felt that it would be interesting to determine whether or not floor staff would be able to gauge whether or not meaningful learning too place by observing behaviours that indicate learning.
Many education researchers have argued that visitors construct their own meaning when interacting with exhibits based on past experiences. Barriault (1999) developed an innovative visitor-observation framework that records visitor initiation, transition and breakthrough behaviours as evidence of learning and meaning making. This approach to visitor evaluation truly answers the question “is the visitor learning something?” and warns against basing evaluation tools solely on learning outcomes set out by the exhibit developer. To these ends, I included a section on learning indicators, based on Taylor and Serrell’s (1991) Try It! Improving Exhibits through Formative Evaluation guide.
Evidence of learning behaviours included: watching, talking, demonstrating, manipulating, and reading.
Other usage statistics
In exchange for supporting my thesis research, I offered to collect further visitor usage statistics such as visitor group composition, group cooperation, and whether approach was initiated by the parent or child. These statistics were not reported in this study.
The Visitor Exhibit Use Schedule, which was used to record visitor responses, can be found in Appendix B.
2.2 Staff Interviews
Five floor staff were asked questions about visitor use, visitor behaviour, and visitor perceptions regarding the two exhibits. This number was chosen since floor staff are often restricted to certain areas of the science centre and are not all familiar with all exhibits. In general, at least 5 floor staff know an exhibit relatively well.
Although Johnston and Rennie (1995) chose to conduct staff interviews in a focus group setting, removing 5 staff from the floor negatively affects the daily operations of the centre. Therefore, I chose to conduct individual interviews and instructed the staff not to talk about their interview with other staff until the end of the day. Although I explained to the selected staff that they were not being “tested,” I wanted to avoid their colleagues from gathering information about the exhibit before their interview, biasing the results.

29
The selection of staff was made using “snowball sampling,” whereby a contact is used to recruit participants for a study (Henn, Weinstein, & Foard, 2006). In this case, Sandy Eix, curator of the Eureka! Gallery and Centre Stage at Science World, was asked to choose the five floor staff who would be participating in the study. Although staff’s experience and backgrounds varied, they all work 40 hours per week. Only full-time staff working 40 hours per week were chosen since they were most likely to have worked in all galleries with ample time to observe visitors. They were all available to be interviewed on the same day.
Staff were interviewed on the Bucket Radio exhibit on August 15th 2006 and interviewed on the Gyroscope Exhibit on August 28th, one week after the evaluation training session. Notes were taken on interview forms.
The staff were asked to answer the questions from the visitor’s point of view based on their past observations of visitor-exhibit interactions. For example, the question “What do you think the visitors think the exhibit is trying to teach them (in their own words)?” makes it clear that the opinion of the visitor is saught, not the facilitator’s.
Successful use of the exhibits was defined to staff as the following:
Bucket Radio: the visitor touches the outside bottom of the bowl to the peg, puts down his hear to the bowl and hears the music.
Gyroscope: the visitor cranks the flywheel, uses the disc to gently turn the flywheel casing, which causes the platform he is standing on to rotate.
To engage with the exhibit was defined to staff as the following:
Visitor stops to read the signage, use the exhibit, or watch another visitor (more than a glance).
The Staff Assessment Schedule, which was used to record responses from the Science Facilitators, can be found in Appendix C.
2.3 Staff Training
I initially started this project with the National Museum of Science and Technology in Ottawa and realized that most of their visitor services staff concentrate their day-to-day efforts on enforcing museum rules (no running, climbing, etc.) rather than engaging visitors with the exhibits. When I conducted the interviews, it was obvious that most of the interviewed staff had not given much attention to how visitors interacted with the exhibits. It occurred to me that visitor services staff could greatly benefit from visitor studies training to bring more meaning and interest to their shifts and potentially lead some to a new career path. From this study’s perspective, it was beneficial to give some training to maximize staff observations of visitor behaviour.
30
This decision was supported in a study conducted by Rennie and McClafferty (1996), whereby explainers were trained to conduct formative evaluations. Staff member collected, analyzed, and produced recommendations for the design team. The researchers felt that training is important to ensure consistency and to discuss the goals of exhibit, including the goals of the evaluation. Although they recommended that a whole day be reserved to go over the purpose, instruments, familiarization of exhibit, using the instrument and debriefing, the floor requirement of staff restricted our training to two hours.
A 2-hour training session on visitor studies was held for the above-mentioned staff on August 17, 2006. Topics included the purpose of various types of visitor studies, museum learning indicators, evaluator impartiality, and the advantages/disadvantages of popular evaluation tools. A small visitor observation exercise was conducted to provide a hands-on component to the training. A copy of the presentation and hand-out can be found in the Appendix D.
At the end of the training session, the staff was asked to observe visitor behaviour and use of the Gyroscope exhibit during their work shifts and told that they would be interviewed seven days later. Although the staff was given a visitor survey as an example during the training, they were not required to record their observations on paper.
A week was chosen between the training and the interview on the Gyroscope exhibit to ensure that they all had at least 2 full workdays on the floor since their training session. This gave them the chance to observe visitors armed with their new visitor studies training.
2.4 Coding Analysis
The open-ended interviews of both staff and visitors were analyzed using the “constant comparative method” (Henn et al. 2006) whereby themes that recur throughout the data are categorized into generalized statements. A direct comparison between staff and visitor comments was then possible.
The categories generated by visitors and staff were compared. If staff generated a category that mirrored the visitors’, a “match” was made. The ability of visitors to match staff is irrelevant, since the purpose is to determine whether or not staff are able to predict responses generated by visitors, not the opposite. As is the practice for a formative evaluation, the variety of responses is more important than the frequency of the responses. The frequency of both visitor and staff comments were included in Appendix E for the interest of the reader.
Visitor responses such as “I don’t know” and “nothing” were not included in the categories.

31
3. Results
30 visitors between the ages of 8 and 13 were interviewed for each the Bucket Radio and Gyroscope exhibits. All engaged with the exhibit to some extent (read, manipulated, watched).
3.1 Visitor Success Rate and Holding Power
3.1.1 Bucket Radio (before staff training)
“Successful use” of the Bucket Radio exhibit was defined to staff as the following: “The visitor touches the outside bottom of the bowl to the peg, puts down his hear to the bowl and hears the music.”
Successful use of the exhibit
Actual Observations Staff Responses
17 successful (57%) 10 engage only (43%)
19% of children are successful at this exhibit
Floor staff’s estimation of children’s success rate at the Bucket Radio exhibit was greatly underestimated. Children were over twice as successful (56%) as what was thought by floor staff (19%).
Average time spent at the exhibit
Actual Observations Staff Responses
Average 27 seconds Range: 10 – 58 seconds
Average 29 seconds Range: 10 – 60 seconds
Floor staff were able to successfully estimate the average amount of time visitors spend at the Bucket Radio exhibit.

32
3.1.2 Gyroscope (after staff training)
The term “successful” was defined to staff as the following: “The visitor cranks the flywheel, uses the disc to gently turn the apparatus, which causes the platform he is standing on to turn.”
Successful use of the exhibit
Actual observations Staff Responses
17 successful (57%) 13 engaged only (43%)
18% of children are successful
Floor staff’s estimation of children’s success rate at the Gyroscope exhibit was greatly underestimated. Children were over twice as successful (57%) as what was thought by floor staff (18%).
Average time spent at the exhibit
Actual Observations Staff Responses
Average 69 seconds Range: 20 – 180 seconds
Average 62.5 seconds Range: 30 – 120 seconds
Staff were successful in predicting the amount of time visitors spent on average at the Gyroscope exhibit.
3.1.3 The effect of staff training on success rates and holding power results
Staff training did not appear to produce an increase in accuracy in estimating the success rate of the children using the exhibits. In both cases, staff greatly underestimated the success rates of the visitors. Staff training did not appear to produce an increase in accuracy in estimating the average amount of time spent spent at the exhibits. In both cases, staff were quite accurate in their estimations.
It is an interesting coincidence that the success rate at both exhibits was the exact same: 17 successful visitors to 13 unsuccessful ones, denoting a 56% success rate.

33
3.2 Indicators of visitor learning
Some questions asked staff whether or not “most” children displayed a certain learning indicator or behaviour. Staff were deemed correct or incorrect if the percentages of observed children fell in the following categories:
0-40% most children did not exhibit this behaviour
41-59% gray area – neither correct nor incorrect
60%-100% most children did exhibit this behaviour
3.2.1 Bucket Radio (before staff training)
Actual observations Learning indicator Children who
engaged with the exhibit
(successful and unsuccessful)
/30
% of total
Staff responses Most staff correct or incorrect
Watched 7 22% 1/5 believe that most children watch others Correct
Talked 8 26% 0/5 believe that most children talk to others Correct
Read 13 43% 1/5 believe that most children read signage Neither correct nor correct
Manipulated 29 96% 4/5 believe that most children manipulate exhibit
Correct
Demonstrated 4 13% 0/5 believe that most children demonstrate to others
Correct
The Science Facilitators were asked to consider how ”most children” interact with the exhibit. Upon analyzing the results, it became clear that the staff should have been asked to estimate the percentages of children that displayed each learning indicator (e.g. in your opinion, what percentage of children watch others playing with this exhibit?). The term ”most” misrepresents the learning behaviours that do occur, often in significant amounts (e.g. children watching and talking to others represented ¼ of observations whereas almost half of children read the signage).
In phrasing the question as we did, most of the staff (4/5) surveyed correctly predicted that most children simply manipulate the exhibit, without watching, talking, or demonstrating to others, and without reading the signage. One staff person believed that

34
most children would watch others, read the signage, but not attempt to manipulate the exhibit.
3.2.2 Gyroscope (after staff training)
Actual observations Learning
Indicator Children who engaged with
the exhibit (successful and unsuccessful)
/30
% of total
Staff Responses Majority of staff
correct or incorrect
Manipulated 30 100% 5/5 say that most children manipulate Correct
Watched 23 75% 3/5 say that most children watch others Correct
Talked 11 38% 2/5 say that most children talk to others Correct
Read 4 13% 0/5 say that most children read the label Correct
Demonstrated 8 25% 2/5 say that most children demonstrate to others Correct
As in section 3.2.1, the Science Facilitators were asked to consider how ”most children” interact with the exhibit. Upon analyzing the results, it became clear that the staff should have been asked to estimate the percentages of children that displayed each learning indicator (e.g. in your opinion, what percentage of children watch others playing with this exhibit?). The term ”most” misrepresents the learning behaviours that do occur, often in significant amounts (e.g. children talking to others represented 38% of the observations whereas almost ¼ of children demonstrated to others).
In phrasing the question as we did, most staff were correct with their prediction of visitor behaviour. Most children watch others (75%) and manipulate the exhibit (100%) without reading the signage (13%). 2 of 5 staff, however, claimed that most children would also talk and demonstrate to others. Although not a majority of children displayed these indicators, a fair amount did.
3.2.3 Effect of staff training on learning indicator results
Staff training did not appear to produce an increase in accuracy in predicting the learning indicators exhibited by the children using the exhibits.

35
3.3 Exhibit Ergonomics
Some questions asked staff whether or not “most” children displayed a certain learning indicator or behaviour. Staff were deemed correct or incorrect if the percentages of observed children fell in the following categories:
0-40% most children did not exhibit this behaviour
41-59% gray area – neither correct nor incorrect
60%-100% most children did exhibit this behaviour
In this section, rather than selecting options from a questionnaire, the question was open-ended so that staff could describe their recollections more precisely. They were asked “What steps does a typical child take with the exhibit?”
3.3.1 Bucket Radio (before staff training)
Actual observations Behaviour
Success (17)
Engage only (13)
Total (30)
% of total
Staff Results Majority of staff
correct or incorrect
Immediately put bowl correct way 9 0 9 30%
Eventually put bowl correct way 8 0 8 27%
Never put bowl correct way 0 13 13 43%
5/5 say that most children put bowl incorrectly first Correct
Brought ear to bowl 17 12 29 97% 5/5 say that most children will bring their ear to bowl Correct
Switched bowls 13 4 17 57% 2/5 say that most children will switch to the other bowl
Neither correct nor incorrect
In this case, Science Facilitators were unanimous in claiming that most children who engage with this exhibit will immediately put the bowl incorrectly (upside down) against the peg. Only 30% of the children immediately placed the bowl correctly, reflecting staff predictions. 70% of the children either eventually or never placed the bowl correctly against the peg. “Correctly” placing the bowl meant that the bowl would be touching the vibrating peg.
Science Facilitators all predicted that most children would bring their ear to the bowl, which was reflected in my observations. 97% of children brought their ear to the bowl. The one child that did not bring his ear to the bowl never made it past the reading stage.

36
Only 2/5 science facilitators predicted that most children would switch to the other bowl. Observations showed that 57% of the children did switch bowls. Since roughly ½ of the children did switch bowls, it is difficult to conclude whether or not most staff were correct or incorrect in their predictions.
3.3.2 Gyroscope (after staff training)
Actual observations
Behaviour Success (17)
Engage only (13)
Total (30)
% of total
Staff Results
Majority of staff
correct or incorrect
Stands correctly on turntable 17 11 28 94%
4/5 say that most children stand in the designated spot on turntable
Correct
Child reads signage 4 0 4 12% 5/5 say that most children do not read signage Correct
Adult reads signage 2 4 6 20% Invalid*
Adult explains to child 4 4 8 27% 1/5 say that most children play then adult reads then child plays Invalid*
Holds flywheel vertically 9 6 15 50% 1/5 say that most children will
hold flywheel vertically
Neither correct nor incorrect
Holds flywheel horizontally 8 2 10 33% 1/5 say that most children will
hold flywheel horizontally Correct
Used handle to spin flywheel 17 9 26 87% 2/5 say that most children use
handle to spin flywheel Incorrect
Turned steering disc 17 13 30 100% 5/5 say that most children turn steering disc Correct
Trouble with gate 3 3 6 19% 3/5 say that kids have trouble with gate Incorrect
Used foot to propel turntable all say that most kids use foot to
propel Invalid**
*Invalid since not all children approached with parents.
**Invalid since this behaviour was not on evaluator’s observation grid.
The Science Facilitators were correct in predicting that most children would not read the signage (88%), would stand correctly on designated turntable (94%), would not hold the flywheel horizontally (67%) and would turn the steering disc (100%).
They underestimated the amount of children who used the handle to spin the flywheel (87%), probably due to their observation that many of the children cannot reach the handle (see section 3.8 – Gyroscope Comprehension and Motivation).

37
They overestimated that most children would have trouble with the gate, when in reality only 19% had trouble with the gate (although any children having difficulty accessing the exhibit should be considered in the renovation process).
3.3.3 The effect of staff training on ergonomics results
It appears that staff’s accuracy in predicting exhibit ergonomics decreased slightly following staff training. Staff correctly predicted 2/3 (67%) of the behaviours displayed by children with the Bucket Radio exhibit and 4/7 (57%) of the behaviours displayed at the Gyroscope exhibit. This could be in part due to the fact that the Gyroscope exhibit is more complex than the Bucket Radio exhibit, and thus has more steps. In a future study, it would be useful to evaluate staff responses on the same exhibit, before and after training.
If one looks at the ensemble of staff responses, some staff (2/5) did report that most children would use the handle to spin the flywheel and some staff (2/5) reported that children would not have difficulty with opening the gate. In a formative evaluation, we are looking for the variety of ways visitors interact with an exhibit, not necessarily the frequency. Therefore, the behaviours exhibited by children were identified when looking at the ensemble of staff responses.
One of the science facilitators, Emily, handed over a typed report of her observations. Although not required by the researcher, Emily took the handout that was provided during the staff training session and used it to conduct her observations. Her observations very closely reflected my observations of children’s behaviour at the Gyroscope exhibit (Appendix F)
3.4 Visitor Comprehension/Motivation
The following represents the results of open-ended questions that were coded into categories. The categories generated by visitors and staff were compared. If staff generated a category that mirrored the visitors’, a “match” was made. The ability of visitors to match staff is irrelevant. As is the practice for a formative evaluation, the variety of responses is more important than the frequency of the responses. The variation in some of the responses were indicated below the category as coming from the visitor (V) or staff (S). The frequency of both visitor and staff comments were included in Appendix E for the interest of the reader.
Visitor responses such as “I don’t know” and “nothing” were not included in the categories.

38
3.4.1 Bucket Radio (before staff training)
Visitor: What made you notice this exhibit? Staff: What do you think attracts visitors to the exhibit?
Response Categories Visitor Staff
1. Check out each exhibit as walk by/New experience
2. Bowls
3. Signage – “Bucket Radio” piqued curiosity
4. Looked easy to use
Matched: 2/3 Percent accuracy in predicting visitor responses: 67%
Visitor: Did you find part of it confusing or frustrating? Staff: Which part(s) would you say are confusing or frustrating for the visitors?
Response Categories Visitor Staff
1. Radio not heard V: didn’t hear radio; thought it was broken S: music not clear
2. Not sure how to use S: method not obvious; how do visitors put the bowls? wear pattern around peg confuses people (looks like it should be upside down)
3. Can’t tell difference between bowl sizes
4. Didn’t realize peg vibrates
Matched: 2/2 Percent accuracy in predicting visitor responses: 100%
Visitor: Is there something you really liked about it (your favourite part)? Staff: Which part(s) do you think the visitors especially enjoy (their favourite part)?
Response Categories Visitor Staff
1. Hearing radio/music
2. Trying to figure out how it works
3. Feeling vibrations
Visitor responses matched: 2/3 Percent accuracy in predicting visitor responses: 67%
Visitor: What do you think the exhibit designer was trying to teach people with this exhibit? Staff: What do you think the visitors think exhibit is trying to teach them (in their own words)?
Response Categories Visitor Staff
1. Sound waves
2. Magnification/Amplification
3. How music/radio works
4. Vibrations

39
5. How sound travels
Visitor responses matched: 4/5 Percent accuracy in predicting visitor responses: 80%
Visitor: This exhibit shows you how vibrations can be made bigger (amplified) to make sounds louder. What could we change to make it better?
Staff: In short, vibration makes sound. On its own, the peg vibrates only a bit of air which is why we can’t hear it. The bowl, when touched to the peg, vibrates even more air, causing a louder sound. The bigger the bowl, the more air vibrates, the louder the sound. It acts as a speaker. How could we change it to make it more understandable to visitors? Include cues you typically have to provide visitors for them to figure out the exhibit.
Response Categories Visitor Staff
1. Have other bowls/objects to try S: Extensions – trading bowls, using elbow/finger; more differentiation between small and large bowls; various types of containers to try out.
2. Have bowl right side up permanently S: Make obvious that bowl fits a certain way/arrows/sticker that says “this side to peg”
3. Make bigger for more people
4. Make radio more clear (too much static)
5. Change size of peg S: giant centre tower raised from table
6. Relate to tin can on signage
7. Simplify explanation S: “air vibrates and is being transferred to bowl”
Visitor responses matched: 2/3 Percent accuracy in predicting visitor responses: 67%
Average percent accuracy in predicting visitor responses: 75% Total number of categories proposed by visitor: 16 Total number of categories proposed by staff: 19
Staff were able to predict approximately 75% of the responses made by visitors.
Staff were correct in predicting that visitors are attracted to the exhibit in their quest to try out each exhibit in the gallery. The bowls, perhaps due to their simplicity, seemed to be a reason for stopping. Staff underestimated the importance of the signage itself as attracting children – the title “bucket radio” coupled with a couple of bowls seemed to pique their curiosity.
Interestingly, although staff predicted that some children would think that the purpose of the exhibit would be to demonstrate sound waves, vibrations, how sound travels and the amplification of sound, none seemed to predict the connection children would make with how a radio works, even though the title is “Bucket Radio.”
Importantly, staff were able to identify correctly the sources of confusion and frustration of the visitors, namely the fact that the music could not be heard (especially in a highly noisy environment) and that the layout of the exhibit induced misleading cues (ex. wear

40
pattern around peg was the shape of the bowl, suggesting that the bowl should be placed upside down to cover the peg, rather than touching it).
In the improvements section, both visitors and staff wanted to have some way of indicating the correct orientation of the bowl (ex. “this side to peg”). Both visitors and staff felt that extensions to the activity could enrich it, by having a variety of other objects to try. Staff felt that the signage could be improved by providing a very simple explanation (ex. “air vibrates and is being transferred to bowl) and to relate it in words to the graphic of the tin-can telephone on the signage. Staff also indicated that by increasing the vibrations of the peg, the music could be heard more clearly above the din of the room. This section saw the majority of responses made by staff.
In total, staff generated 19 response categories with respect to this exhibit whereas visitors generated 16 response categories.
3.4.2 Gyroscope (after staff training)
Visitor: What made you notice this exhibit? Staff: What do you think attracts visitors to the exhibit?
Response Categories Visitor Staff
1. Cage
2. Spins around
3. Other people were using it
4. Looked like fun
5. In middle of space
6. Size of exhibit
Matched: 2/4 Percent accuracy in predicting visitor responses: 50%
Visitor: Did you find part of it confusing or frustrating? Which part(s) would you say are confusing or frustrating for the visitors?
Response Categories Visitor Staff
1. Unclear signage V: How fast or slow should the flywheel spin? Didn’t see handle. Did not know what to do. S: Confused how to turn handle. Do not know how to gently tilt gyro.
2. Unclear purpose V: What’s the point/purpose? S: No (mental) connection between disc and platform
3. Flywheel too heavy V: Hard to get it (flywheel) to go fast S: Flywheel too heavy
4. Handle unreachable

41
V: Difficult to reach handle and keep steady S: Can’t reach handle
5. No safety mechanism to stop disc
Matched: 4/4 Percent accuracy in predicting visitor responses: 100%
Visitor: Is there something you really liked about it (your favourite part)? Staff: Which part(s) do you think the visitors especially enjoy (their favourite part)?
Response Categories Visitor Staff
1. Body spinning
2. Flywheel spinning
3. Turning the disc
4. Using foot to propel the turntable.
Visitor responses matched: 3/3 Percent accuracy in predicting visitor responses: 100%
Visitor: What do you think the exhibit designer was trying to teach people with this exhibit? Staff: What do you think the visitors think exhibit is trying to teach them (in their own words)?
Response Categories Visitor Staff
1. Turning/spinning objects
2. Turn one object makes other turn too
3. Wind/transportation
4. Need energy to move things
Visitor responses matched: 2/3 Percent accuracy in predicting visitor responses: 67%
Visitor: This exhibit shows you how changing the tilt of a spinning wheel causes you to spin. What could we change to make it better?
Staff: This exhibit shows you how changing the tilt of a spinning wheel causes you to spin. How could we change it to make it more understandable to visitors? Include cues you typically have to provide visitors for them to figure out the exhibit.
Response Categories Visitor Staff
1. Staff/volunteer facilitation V: Staff/volunteer explaining what to do S: Staff holds wheelcase while child turns handle
2. Signage within the cage V: “tilt more on one side to feel movement”; Terms “wheel” and “disc” are confusing; S: Signage making it obvious to not turn disc all the way; “Do not use foot to propel”; “Keep feet on footprints – crank wheel, tilt gently”; Signage inside exhibit; Plain signage on inside; Signage on wheel “wrong side up”
3. Mechanism to stop disc from turning all the way V: Use lever that can stop instead of wheel
4. Explain purpose V: Graphic confusing – thought it was about planes/ships S: Make a [mental] connection between child/wheel/tilt; “Forces are stubborn – if you force it to go in one direction, it pushes you in the other direction”;

42
5. Handle to spin flywheel too far/difficult V: Move/remove handle – too far/hard S: Minimum height could be changed – many children have difficulties reaching handle or supporting weight of flywheel
6. Explanatory/complex signage outside the cage
7. Safety signage affixed outside the cage S: Minimum height sign affixed (currently moves)
Visitor responses matched: 5/5 Percent accuracy in predicting visitor responses: 100%
Average percent accuracy in predicting visitor responses: 84% Total number of categories proposed by visitor: 19 Total number of categories proposed by staff: 23
The science facilitators interviewed were able to collectively predict 84% of the visitor responses to the questions on motivation and comprehension.
Staff pointed to the physical features of the exhibit as being the prime attraction to children (cage, a spinning apparatus, large size, premium location). Although children also found that the cage and spinning were attractive, staff underestimated the power of watching others using the exhibit as being a prime motivator for engagement (e.g. “other people were using it,” and “it looked like fun”).
Staff correctly identified the sources of confusion and frustration to the visitor: unclear signage, unclear purpose, the flywheel being too heavy, and the handle of the flywheel unreachable. Indeed, the signage was located outside the exhibit which made figuring out what to do very difficult unless one had read it before entering the exhibit. The fear of losing one’s place in line could deter the child from exiting the exhibit to read the instructions. Staff also mentioned the lack of safety mechanism to stop the disc (or “wheel”) from turning. This omission invites children to spin the disc (and thus the flywheel) very quickly, resulting in the platform on which the child is standing not to turn.
Staff correctly identified visitors’ favourite parts of the exhibit, including feeling their bodies spin, spinning the flywheel, and turning the disc. Although staff noted that children seemed to greatly enjoy using their foot to propel the turntable, this was not specifically mentioned by children. Children may have meant to have included this “body spinning,” or may have thought they would get into trouble for using their foot.
In general, staff were able to predict what visitors thought the exhibit was about, including “turning, spinning objects” and “turning one object makes the other turn.” Staff did not predict that some visitors would think that the exhibit was about wind or transportation – visitors told me that their response was due to the picture of a train conductor on the signage (see Appendix A).
In terms of improvements to the exhibit, the science facilitators correctly predicted the suggestions made by visitors. These included having a staff or volunteer facilitate the

43
experience, installing signage within the cage, having a mechanism to stop the disc from turning all the way (and thus eliminate the “spinning” of the flywheel case), explaining the purpose of the exhibit, and adjusting or redesigning the handle of the flywheel to make it easier to turn. Staff felt that the explanatory or more in-depth explanation of the science behind the exhibit could be kept outside the cage, with a simple explanation within (e.g. “Forces are stubborn – if you force it to go in one direction, it pushes you in the other direction”). They also felt that the safety signage should be affixed outside the cage and made very obvious (it is currently on a post that people move out of the way).
In total, staff generated 23 response categories with respect to this exhibit whereas visitors generated 19 response categories.
3.4.3 The effect of staff training on comprehension/motivation results
Responses from staff were richer, more specific, and more varied than previous to the training.
Examples of Bucket Radio responses:
The peg should be a giant centre tower raised from the table. It should be obvious that bowl fits a certain way. A relation should be made to tin cans. There should be a picture of “how to.”
There should be a piece of tape saying “this side on peg.” There is nothing we can do about the signage – it’s already been printed.
A sticker on bottom of bowl should read “touch me.” Steps should be written out. A simple explanation like “Air vibrates and is being transferred.”
Top lid should have a sign that says “listen here” and the bottom should say “flip for sound. The radio could be more clear. There should be more differentiation between the small and large bowl.
There should be better graphics to give a better description. The exhibit itself should have more arrows. Make sure that the bowl is in the correct orientation. “Try trading bowls” or “put hand on knob and put ear to handle” – give alternate approaches.
Examples of Gyroscope responses:
Sign indicating minimum height should be fixed permanently and made more obvious because it is a safety issue. The signage should be duplicated because it blends in and visitors don’t notice it. Plus, the signage moves throughout the day. Visitors shouldn’t have to stand in one specific spot to read it, especially since it’s a circular exhibit. The graphic should be more obvious that the visitors must tilt the flywheel case gently and not turn it all the way or the shop could fix it so that it can’t turn all the way. Inside the

44
cage, a large sign should read: 1) keep feet on footprints 2) Crank the wheel with the handle 3) Tilt the flywheel case gently with the steering wheel.
Perhaps the staff could hold the flywheel case while the child cranks the handle or a sign could read “tilt flywheel case gently.” A simplified explanation could be used, like “forces are ‘stubborn’ – you force it to go in one direction and it pushes you in the other direction.” Sometimes the platform moves so slowly it’s almost disappointing. Not enough kids follow the height requirement – the sign should be pushed closer [to the entrance of the cage].
Signage should let kids know that spinning by kicking the feet is dangerous. There should be more connection made between the tilt of the spinning flywheel and turning yourself, like the exhibit in Seattle. Science World’s exhibit doesn’t make the connection between them, the flywheel, and tilting. The machine is too fancy – holding onto a plain turning wheel is easier. Some kind of post should be added to stop the flywheel case from turning 360º.
Put the instructions on the door [to the cage] because as it is, people don’t notice it. The instructions aren’t clear – parent tells child to “tilt” but child tilts it too much. There should be some way of indicating to tilt it gently. The steering wheel could stop on an angle or be slower moving. The signage on the wheel is usually upside down – there should be a sign that says “wrong side up.”
The signage should be bigger: 1) make flywheel spin 2) tilt slowly (with pictures). There should be locking devices so that the steering wheel cannot be turned all the way, or more resistance on the wheel. There should be signage on the inside of the gate where a person can see it. Big pictures and big words: “Here is angular momentum.” If a visitor is keen, can read the full explanation on the outside signage.
Staff responses provided several suggestions on how to improve the signage after the training. Before the training, one staff member felt that the signage could not be changed since it had already been to the graphics department (“There is nothing we can do about the signage – it’s already been printed”). Following the training, the staff felt that their suggestions could improve the signage.
The interviews lasted much longer after the training (9 minutes vs. 15 minutes) and staff were much more enthusiastic about providing their feedback.
The comparative total in response categories generated by staff and visitors varied very little before (19:16) and after the training (23:19).
The open-ended nature of the questions gave staff with the opportunity to provide several answers for each question. The lack of hesitation in their answers, both before and after the training, could be an indication that they had been thinking of the issues for quite some time.

45
4. Discussion
The validity of the study
According to Hein (1998), validity ”refers to the extent to which information gathered is about the phenomena in question.” In this case, can the results of this study be transferred to other informal science education facilities?
The results of this study indicated that there was no significant amount of accuracy in predicting visitor success rate, holding power, visitor learning indicators, and visitor behaviour before and after the staff training. This contradicted my initial findings at the Canada Museum of Science and Technology (CMST) in Ottawa the year before, whereby staff interviewed had very little insight into visitors’ experiences with exhibits, short of the museum rules being infracted. This was the main reason I decided that staff could benefit from a training session in visitor studies.
In trying to explain the discrepancy, I took a closer look at the nature of the two institutions. Although both are popular venues for children, their histories and approaches are very different, especially in the nature of their exhibits, organizational structures, and hiring processes.
The CMST is above all a science museum, containing an impressive collection of science and technology artifacts spanning the past two centuries. Although it has some interactive exhibits that mirror Science World’s (e.g. optical illusions gallery), most of the hands-on exhibits are replicas of real artifacts, such as a space shuttle console, an early nineteenth century automobile and a train caboose). Understandably, there is much emphasis on the security of the collections, which falls under the responsibility of the visitor services staff who roam the galleries. Science World was born a third-generation science centre, whose existence revolves around providing high use hands-on and minds-on exploration stations (McManus, 1992). Their exhibits are meant to be played with and physically explored. Their security needs, from a collections perspective, are dramatically different. At Science World, simply having floor staff present ensure the safety of visitors and reduce the vandalism to exhibits.
At the CMST, the content and look of the galleries are decided by professional curators with input from education specialists on the interactive and program components. The floor staff complement is divided into three groups: the educators, the demonstrators, and the visitor services staff. Having worked at the CMST, I observed that a hierarchal divide exists between the three groups, making it very difficult for visitor services staff to “move up” the ranks. The educators are university educated in either education or science and deliver school programs in the museum classroom. The demonstrators tend to have experience in oral speaking and often have university-level education. Both the educators and demonstrators report to the education department. The visitor services staff, on the other hand, are hired on the basis of their customer service experience and

46
are expected to enforce the museum rules, roam the galleries to attend to visitors, and rotate through the roles of cashier and information desk attendant. Visitor services staff replaced security personnel approximately 15 years ago and went through growing pains trying to change the public perception from being fearful of them to being approachable. Several researchers (MacDonald, 2002; Caulton, 1993; Simmons, 1996; Hooper-Greenhill, 1994) have described the difficulty in accepting the transition from “warders” and “security guard” to “visitor services” in the minds of several museum staff. Simmons (1996) describes the expectation of visitor services staff in several museums:
The tendency is to expect staff to be reactive and answer visitor queries, rather than proactive, entering into discussions with visitors and encouraging new approaches to exhibits.
At Science World, although Science Facilitators report to the Guest Services division (as are admissions cashiers and membership clerks), a strong relationship exists with the Experience Development division (school programs, public programs, and gallery experience). Science Facilitators are hired to interact with guests, present shows, and deliver educational programs while ensuring a safe and secure environment for staff and visitors. Science World seeks individuals who have completed a university degree, preferably in science or education, as well as the ability to present in front of small and large audiences. The expectation and qualification standards set by Science World result in staff that are able to connect with visitors, leading to meaningful engagement. It is not surprising, therefore, to note a lack of difference in accuracy before and after the staff training. Staff are trained to read visitors, to decide when to approach them, and to determine the best manner in which to enrich their gallery experience.
In short, CMST floor staff are hired to interact with visitors and enforce museum rules. They are given a tour of the galleries spiked with tidbits of information, but are not expected to interpret or model science learning in the galleries. Science World floor staff are trained to deliver shows and school program, and to help visitors deepen their exploration of exhibits, requiring constant professional development and a solid understanding of the exhibits. It is not surprising, therefore, that the floor staff hired at the CMST might be less able to assess visitor learning, success, and motivation indicators than staff at Science World. Therefore, the validity of this study is highly dependent on the nature, organizational structure, and hiring practices of the facility in question.
Questionnaire vs. Open-ended questions
For the success rate, holding power, learning indicators, and visitor behaviour, a questionnaire approach was used. This limited me to recording information that fell into certain categories, which, to a certain extent, negates the purpose of the formative evaluation. In a formative evaluation, it is the variety of answers that is of interest, not the frequency of answers in each category. MacDonald (1993) argues that while statistics may have more meaning to managers, it is the qualitative data that gets people thinking about visitor-exhibit interaction. I found that the details provided in the open-ended questions in the comprehension/motivation section gave a more precise picture of visitor interactions. For the questionnaire, I asked how “most” children interact with the

47
exhibit and how long “most children” stay at the exhibit. This does not provide any information on what staff believed were the factors that inhibited or enhanced the experience, thus discouraging or encouraging children to stay longer at the exhibit. Indeed, several researchers (Hooper-Greenhill, 1994; Weil, 2007; Kelly, 2005; Serrell, 1993; Rennie and Johnston, 2004) fault the questionnaire for not taking into account the individual, contextualized experience of the visitor. The open-ended questions used for the comprehension/motivation section helped fill in the gaps to give a more representative picture of the visitor experience.
By allowing subjects more freedom to talk as they wish, using the entire responses in analyses, and reporting representative samples as part of research findings, naturalistic researchers employ an alternative approach that capitalizes on the unique quality of human experience. (Hein, 1998)
In the learning indicators section, the Science Facilitators were asked to consider how ”most children” interact with the exhibit. Upon analyzing the results, it became clear that the staff should have been asked to estimate the percentages of children that displayed each learning indicator (e.g. in your opinion, what percentage of children watch others playing with this exhibit?). The term ”most” misrepresents the learning behaviours that do occur, often in significant amounts (e.g. in the Gyroscope exhibit, children talking to others represented 38% of the observations whereas almost ¼ of children demonstrated to others).
From a science facilitator’s perspective, the difference between the questionnaire versus the interview could be seen as the difference between observing and interacting with visitors. Their poor accuracy in predicting the success rate of visitors (57% actual success rate for both the Bucket Radio and Gyroscope exhibits versus the prediction of 19% and 18% from staff) could be explained by the fact that staff tend to intervene when visitors are having trouble with an exhibit, especially if they are in tune with the visitors’ needs and expectations. The low success rates reported by staff reflect a view that the exhibit is not communicating its message to the visitor. This view is supported by Rennie and McClafferty (1996) who deem that for an exhibit to be considered “successful,” at least 90% of engaged visitors should be able to use the exhibit in the way that was intended by its designer. This does not negate the constructivist view that each visitor will interact with and draw conclusions from the exhibit in his or her own way. Rather, that there is a purpose behind spending the time and energy in building the exhibit in the first place.
One of the science facilitator used the evaluation handout from the training session to evaluate visitors. She remitted her results typed and confided in me that she had learned a lot about how visitors interacted with the exhibit by using the assessment tool. This lead me to think that in a future study, it might be a good idea to ask staff to record their observations on paper, not simply in their memories.
Finally, the use of a focus group to determine staff perceptions, as used by Johnston and Rennie (1995), would probably be a more appropriate method to interview staff. In a formative evaluation, the evaluator wants to explore the range of responses produced by

48
visitors. It is safe to assume that not all staff have had the exact same interactions with visitors since visitors approach exhibits in different ways. Therefore, a focus group would be a perfect forum in which staff could comment on their individual experiences with visitors and exhibits. The results could then be collected and analyzed as an ensemble rather than reporting the individual views of staff members (e.g. 1/5 staff reported that most children read and watch). Although managers are sometimes reluctant to release staff for these types of activities, they could be interviewed before or after their work day.
The effect of professional development on science facilitators
Although the effect of staff training did not produce much increase in the congruency between staff and visitor responses in the questionnaire portion (success rate, holding power, learning indicators and behaviour), the results did indicate a slight increase in accuracy (from 75% to 84%) in the open-ended motivation/comprehension questions. I also noticed that the responses were richer and more specific than before the training. Finally, the enthusiasm of interviewed facilitators increased, reflected partly by the post-training interviews lasting an average of 6 minutes longer (from 9 minutes to 15 minutes).
During the staff training session, the five science facilitators were keen to participate and grateful, to some extent, to have a break from the floor. Caulton (1993) observed that there is often a problem with burnout of floor staff. It is difficult to be in a noisy, high energy environment, always in the view of visitors. To help reduce burnout, Caulton’s (1993) suggestions included changing exhibits, encouraging promotion or exchange between science centres, having staff make suggestions on exhibit improvement, or encouraging staff to apply their skills to different fields. By providing staff with training in visitor studies, a new way of interacting with visitors was created, thus rekindling their enthusiasm.
Librero, director of the Explainer Program at the Exploratorium in San Francisco, feels that providing floor-staff with non-explainer tasks such as project management can decrease burnout and increase commitment.
Having an opportunity to participate in critical operational and program-planning discussions connects floor staff to the museum’s creative process and, in turn, allows for a more dynamic exchange between Explainers and visitors. (Librero, 2003)
DeDivitiis (2003) described how the management at the Scientific Center of Kuwait decided to consult Explainers, who had been starting to show signs of burnout, on the logistics of the museum activities, its programs, and its exhibits. As a result, a new staff hierarchy was created to expand the roles of Explainers to program development, demonstrations, staff training and special events. She points out that since former and current Explainers occupy varying posts in the science centre hierarchy, “explainers know that their ideas will be heard, understood, and respected, even if they are not necessarily implemented.”

49
One of the facilitators reflected a common perspective from the floor when he claimed that “there is nothing we can do about the signage – it’s already been printed” before the training session. This indicated that his suggestions would fall on deaf ears, leading to no improvement of the exhibit. The lack of hesitation in their answers, both before and after the training, could be an indication that they had been thinking of the issues for quite some time. Following the training, all staff made several specific suggestions on how to improve the signage, including succinct explanations and quick how-to instructions. It appeared that the professional development increased their feelings of self-worth and importance in the organization.
This points to the value of including floor staff in all aspects of the visitor experience, including evaluation and problem-solving. When describing the philosophy behind the Disney approach, McLean (1993) suggests to “wear your guests’ shoes” whereby everyone, from visitor services staff to the board of directors, should explore as visitors do. Her “equal relationship among specialists” approach values the contribution of floor staff by having a content specialist, a design specialist, and a visitor specialist on exhibit teams to reduce the competitive aspect that often blossoms from a departmental approach.
Evaluation, coupled with training in how people learn, is one of the best ways to learn more about the audience floor staff strive to serve. Hein (1998) cites research that reveals that “staff who have the experience of interviewing (formally or informally but systematically) visitors often significantly change the way they carry out their roles as interpreters.” Groff et al. (2005) found that informal on-the-job learning and formal professional development opportunities had a positive effect in terms of knowledge, behaviour and attitudes on the floor staff at Disney’s Animal Kingdom. Lord (2007) supports these findings and adds that floor staff should be trained in informal learning processes to complement their technical knowledge.
A more direct application of the importance of training in informal learning and evaluation can be found in the results of this study. Some of the science facilitators’ suggestions revolved around visitors getting the “reward” as soon as possible, such as “a sticker on the bottom of the bowl should read ‘touch me’” so that the visitor gets to hear the music right away in the Bucket Radio exhibit. In their attempt to increase the success rate of visitors, little room is left for discovery learning. Roberts (1997) and Massey (1993) advocate using a constructivism approach when dealing with evaluation and exhibit design since visitors approach and use exhibits in ways that are significant to them, not necessarily as deemed important by the designer. Massey described a study where the exhibit (and staff) provided various suggestions on how to conduct mini-experiments rather than a push-button reward approach. The holding power of the exhibit increased and enticed children to make their own experiments, resulting in making their own conclusions of the phenomena taking place before them.
The answers given by visitors can help staff predict how children interact with the exhibit, depending on their age. For example, “feeling vibrations” was one of the highlights mentioned by children at the Bucket Radio exhibit. Staff know the exhibit and

50
understand its purpose – they can sometimes forget about the small observations and “rewards” felt by children.
Professional development does not always have to take place in a formal setting nor does it necessitate an outside trainer. At Science North in Sudbury, staff scientists participate in bi-monthly in-house seminars on recent developments in visitor evaluation (C. Barriault, personal communication, April 29, 2008). London Science Museum complements its formal “Inside the Visitor’s Head training program with informal chat meetings on developments in exhibit development and visitor awareness research (Economou, 1999). Even participating in focus groups can help stimulate discussion among people and bring to the surface responses that otherwise might lay dormant (Henn et al., 2006).
Good professional development respects past experiences, meets felt needs, encourages collaboration, challenges assumptions, promotes dialogue, models best practices, fosters collegiality, builds skills, inspires confidence, requires institutional support. (Sutterfield and Middlebrooks, 2000)
A study conducted by the Museums Association of New York found that only 9% of its museums had a succession plan to replace the large proportion of babyboomers employed in leadership positions (Baldwin and Ackerson, 2006). In an environment where there tends to be a revolving door of new faces, science centres could be at risk for finding the appropriate talent to replace the aging leaders. By providing staff with professional development opportunities, the informal science education sector inspires new leaders to specialize in areas of interest to them, including evaluation.
Good human resource management continues after recruitement and selection with staff induction, job-specific training, appraisal, and continued training and development. (Caulton, 1993)
The arguments for using floor staff as evaluators
Overall, the results of this study validate the use of floor staff as evaluators. The science facilitators succeeded in reflecting the variety of ways visitors interact with exhibits, including their challenges, motivations, meaning-making. The study could have taken the formative evaluation platform a step further by providing staff with the opportunity to implement their suggestions with temporary measures such as hand-made signage and props. Their appreciation for the complexity of the exhibit design and refining process would thus have been increased.
Provides an opportunity to use the most recent evaluation methodology
New research into the strength of naturalistic observation methods such as listening in on conversations in the museum (Rennie and Johnston, 2004; Kelly, 2005; Leinhardt and Knutson, 2004; Hohenstein, 2006) and recording the narrative view of the visitor experience (Roberts, 1997) has garnered much attention in recent years. Leinhardt and Knutson (2004) felt that by listening in on museum conversations, they could hear learning, rhythms of connections, memories, misconceptions, and lives, all connected to

51
the exhibit at hand. The methods used to conduct this type of research include sophisticated tracking devices and the use of microphones (Rennie and Johnston, 2004). These methods, however, consume an enormous amount of time and money and thus might be better suited to academic research rather than to systematic in-house evaluations.
Uzelmeier (2006) argues that an educator on the floor will naturally observe visitors interacting with exhibits and be privy to conversations among them. By learning more about how visitors learn and behave, educators are able to contribute significantly to the exhibit development process by reporting their observations. Rennie and Johnston (1996) believe that since floor staff interact with visitors on a daily basis, it is “hard to find a more powerful data source for exhibit evaluation than prolonged observation of visitors using the museum and interacting with exhibits.”
Since the new methods described above are contingent upon the conversation of at least two people, using science facilitators as evaluation agents could reach the solitary visitor, where social group interaction is not available.
The internal validity of naturalistic studies may increase, since the effect of knowing that one is being studied could be decreased. When asked open-ended questions, children (and adults) sometimes say “I don’t know” or “I don’t remember” rather than giving an answer for fear of being wrong (Rennie and McClafferty, 1999). Others will shy from giving negative criticism of an exhibit out of politeness. Hein (1998) admits that some researchers have turned to observation-only analysis due to the perceived inability of visitors to express themselves. He gives the example that when asked what an exhibit was about, people would answer ”interesting”. The presence of floor staff, on the other hand, is expected by visitors. They are not usually perceived as being threatening or judgemental but as available to mediate their experience. This attribute could provide a naturalistic forum in which floor staff could glean insights into visitor expectations, perceptions, and interactions.
Although donors and funders want proof of reaching educational goals, the current evaluation techniques, such as questionnaires and surveys, fail to relate the diverse ways in which visitors interact. Weil (2007) feels that museum evaluation should be anecdotal and qualitative in nature rather than statistical. He advocates that
the museum field will need to develop a vast arsenal of richer and more persuasive ways to document and/or demonstrate the myriad and beneficial outcomes that may occur for their individual visitors. (Weil, 2007)
The implementation of evaluation results
As previously noted, evaluations are often commissioned by funders and government agencies to prove that a meaningful learning experience has taken place. However, external evaluators can sometimes be seen as threatening to design and floor staff, leading to feelings of being kept out of the loop (Hein, 1994; Hjorth, 1993). Hein (1994) argues that it is crucial to have an initial meeting with programme staff prior to starting a

52
formal evaluation process. Involving staff in the evaluation process, including collecting data, keeps the dealings transparent with no large surprises in the summary. Indeed, McLean (1993) observed that using museum evaluators are more likely to make suggestions than to judge, and will be more direct about it rather than embedding it in fluff. Economou (1999) reminds management if an external evaluator is chosen, his willingness to work closely with staff should be a selection criterion.
When floor staff are involved in the evaluation process, an interest in the results develops, often leading to an improvement of their practice. Hein (1998) makes a case for the wider use of “practical inquiry” whereby action research is carried out by practitioners. He cites researchers who have found that the results of naturalistic studies carried out by teachers have been used to improve their teaching practices. He suggests that future studies about learning and meaning-making in museums may tend toward these naturalistic research practices rather than experiment-based studies.
Economou (1999) and Hjorth (1993) reflect this vested interest by noting that by using floor staff as evaluators, one increases the probability that evaluation efforts will continue and that the data will be used in-house, producing tangible results.
Cost, time, and human resources
The resistance to carry out formative evaluations of exhibits, or prototyping, is usually due to issues related to money, time, and human resources (Reussner, 2003; Hike 1993; Miles 1993). Several researchers insist that evaluation does not have to be daunting – even small samples of visitors can yield a wealth of information. Screven (1991) and Caulton (1998) propose that having a professional evaluator train staff or formulate the questions while staff and volunteers conduct the data collection could be a cost-effective compromise. Caulton (1998) suggests that “evaluation is such an integral part of exhibit development that it is desirable for the museum to develop in-house skills to oversee the process.”
Hein (1994) believes that the evaluation process should be embedded in the programme to encourage staff to reflect on their practice and thus improve upon it as well as to minimize the amount of time required to collect data after a programme is over. He also find it helpful to produce a matrix of programme outcomes and data sources so as to distribute tasks to programme staff and evaluators.
Economou (1999) recommends another approach to evaluation: combining both external and internal surveys by conducting smaller-scale, regular evaluations in-house with large-scale external evaluations every 4-5 years.
At the very least, floor staff should be interviewed for their constructive feedback of exhibits and visitor meaning-making. This source of rich data should be recognized as an important and valid approach to studying visitors. Several researchers (Fraser, 1997; Lundberg, 2005; Seitei, 2004) refer to consulting floor staff as part of the studies. It is hoped that this study will have increased the confidence of using this data source in remitting evaluation reports to funders and boards of directors.

53
Friedman (1993) gives several concrete examples on how an initial investment in formative evaluation will practically guarantee effective exhibits. The alternative is a gallery full of exhibits under repair. McClean (1993) states that “broken exhibits are worse than no exhibits at all” in the minds of visitors. If the money is going to be spent on producing exhibits, excellence should be an expectation. Excellence can only be met by prototyping the exhibits first.
Carroll, Huntwork, and St. John (2005) gathered characteristics of at-risk exhibits as seen by a multi-disciplinary group of museum staff:
• science content that is missing or that people cannot understand, • being worn out or broken, • safety issues, • incorrect media for the phenomenon, • lack of invitation – where visitors can’t figure out what to do, • unclear navigation or an exhibit that is 100% linear, • too complex, • no opportunity for inquiry, • being lectured to, being talked down to, and • a design that does not promote social interaction or causes conflict
between goals and activities.
It is clear that floor staff could be employed to observe each of these categories, flagging deficiencies to design staff. Awaiting the arrival of the official summative evaluation, usually conducted at the end of an exhibit’s showing, could cost the facility valuable reputation points.
A word of warning is warranted: among the hardships reported by staff was the amount of responsibilities thrust upon them, a phenomenon typical of science museums in which exhibits and programs have a quick turn-around time due to funding and organizational constraints (Bailey 2006). In the context of my study, this reality should be considered before involving staff in further projects such as visitor studies, which could potentially add to their overburdened workload.
Better representation of audience served
In poring over the literature on visitor evaluations, it was found that several researchers, such as Leinhardt and Knutson (2004), excluded surveying visitors who did not speak English due to the obvious language barrier. The multi-ethnic diversity present in science centres brings new perspectives on how culture affects the contextual learning model. Sandell (2007) advises that a multi-ethnic diversity increases a museum’s performance in reaching its goal of serving members of the community and tourists alike. If science centre management is committed to having its front-line staff represent the cultural diversity of its visitors, an entirely new evaluation venue could ensue. The ability to

54
conduct evaluations in several languages could help target strengths and weaknesses of exhibits from the perspective of those who cannot read the accompanying signage.
Bridging the gap between floor staff and management
One of the proposed applications of this study was to help bridge the gap between floor staff and management. Traditionally undervalued in the role at science centres and museums, floor staff are not usually involved in the exhibit development and decision-making processes, nor do they have many opportunities to share within a larger knowledge base environment (Tran and King, 2008).
Several researchers (Black, 2005; Simmons, 1996; Kelly and Sullivan, 1999) hail the benefits of involving all levels of staff in exhibit research and development since staff views can often differ greatly from management views. Science North in Sudbury exemplifies the cross-over approach by having their staff scientists as part of the floor staff complement and conducting the visitor research themselves. Not only does this structure permit them to make informed decisions on existing and future exhibits, it “empowers them to use this form of data collection to better understand the impact that their exhibits are (or are not) having on visitors” (C. Barriault, personal communication, April 29, 2008).
Models of learning cultures reject rigidly hierarchical structures of control and authority. Instead they encourage wide participation and teamwork where people working closest to customers have significant levels of delegated responsibility and power to act on information they learn from doing their jobs. Why? Because it is there where the contact with customers is most intense, where the external environment meets the organisation…It’s where the most useful information finds a conduit into the organisation. (Kelly and Sullivan, 1999)
5. Conclusion
In summary, the results of this study can be used to encourage management to use the experience and knowledge of science centre floor staff to improve the visit to their facilities. This study can be used to make a case to funders that feedback from floor staff accurately represents that of the visitors. Training floor staff in visitor evaluation and learning theories can help improve their practice, provide an opportunity to use the most recent evaluation methodology, ensure that evaluation results will be implemented, reduce the cost, time, and human resource requirements of exhibit evaluation, provide a better representation of the audience being served, and bridge the gap between floor staff and management.

55
Further Studies
Further studies pertaining to this research could involve assessing the accuracy of visitor response prediction by exhibit exhibit development teams and management; conducting studies with patrons whose first language is not English; using the narrative/conversation framework to conduct studies; assessing the efficacy of using floor staff for front-end and summative evaluations; and studying the effect of pairing design, education, content and visitor services staff.

56
6. References
Arnett, J.J. (2001). Adolescence and Emerging Adulthood: A Cultural Approach. New Jersey: Prentice-Hall.
Bailey, E.B. (2006). Researching Museum Educators’ Perceptions of their Roles, Identity, and Practice. Journal of Museum Education, 31(3), 175-198.
Baldwin, J.H., & Ackerson, A.W. (2006). Who's next? Research predicts museum leadership gap. Museum Management and Curatorship, 21(4), 349-352.
Barriault, C. (1999, March/April). The science center learning experience: A visitor-based framework. The Informal Learning Review, 35, 14-16. http://www.informallearning.com/archive/1999-0304-c.htm
Bitgood, S. (2002). Environmental psychology in museums, zoos, and other exhibition centers. In R. Bechtel & A. Churchman (Eds.) Handbook of Environmental Psychology, New York: John Wiley & Sons (pp. 461-480).
Black, G. (2005). The Engaging Museum: Developing Museums for Visitor Involvement. New York: Routledge.
Carroll, B., Huntwork, D., & St. John, M. (2005). Traveling Exhibits At Museums of Science (TEAMS): A Summative Evaluation Report. California: Inverness Research Associates.
Caulton, T. (1998). Hands-On Exhibitions: Managing Interactive Museums and Science Centres. London/New York: Routledge.
Cunningham, M.K. (2004). The Interpreters Training Manual for Museums. Washington:American Association of Museums.
Davidsson, E., & Jakobsson, A. (2007). Staff Members' Ideas about Visitors' Learning at Science and Technology Centres. International Journal of Science Education. doi: 10.1080/09500690701649588
DeDivitiis, L. (2003, Jan/Feb) Timely Transition: Floor Staff as Agents of Institutional Growth. ASTC Dimensions, 13-14.
Diamond, J. (1999). Practical Evaluation Guide – Tools for Museums and other informal educational settings. London: AltaMira Press.
Economou, M. (1999). Evaluation Strategy for the re-development of the displays and visitor facilities at the Museum and Art Gallery, Kelvingrove. Humanities Advanced Technology and Information Institute (HATII), University of Glasgow.

57
Falk, J. H., & Dierking, L.D. (1992). The Museum Experience. Washington: Whalesback Books.
Falk, J. H., & Dierking, L.D. (2000) Learning from Museums: Visitor Experiences and the Making of Meaning. Walnut Creek: AltaMira Press.
Fraser, J. (1997). Learning by Design. International Journal of Art & Design Education, 16(1), 55-60.
Friedman, A.J. (1993). Convincing the Director. In Bicknell, S., & Farmelo, G. (Eds.) Museum visitor studies in the 90s (pp. 43-46). London: Science Museum.
Gleeson, J. (1997). Narratives, Evaluation and Power. Proceedings of the Power and Empowerment Conferenc. Sydney: Museums Australia. .
Graham, J., & Gammon, B. (1999). Putting learning at the heart of exhibition development. In Scanlon, E., Whitelegg, E., & Yates, S. (Eds.) Communicating Science: Contexts and Channels (pp. 94-109). New York: Routledge.
Griffin, J. (1999). Finding evidence of learning in museum settings. In Scanlon, E., Whitelegg, E., & Yates, S. (Eds.) Communicating Science: Contexts and Channels (pp. 110-119). New York: Routledge.
Groff, A., Lockhart, D., Ogden, J., & Dierking, L. (2005, July). An exploratory investigation of the effect of working in an environmentally themed facility on the conservation: related knowledge, attitudes and behavior of staff. Environmental Education Research, 11(3), 371-387.
Gyllenhaal, E.D. (1998). Traveling Experiment Gallery: Final Evaluation Report. Chicago: Selinda Research Associates.
Hein, G.E. (1994). Evaluation of museum programmes and exhibits. In Hooper-Greenhill, E. (Ed.) The Educational Role of the Museum (pp. 306-312). London:Routledge.
Hein, George E. (1998) Learning in the Museum. London/NewYork: Routledge.
Henn, M., Weinstein, M., & Foard, N. (2006). A Short Introduction to Social Research. Great Britain: Sage Publications.
Hike, D.D. (1993). Quest for the perfect methodology: a tragi-comedy in four acts in Museum visitor studies. In Bicknell, S., & Farmelo, G. (Eds.) Museum visitor studies in the 90s (pp. 67-74). London: Science Museum.
Hjorth, Jan (1993) What happens when the evaluation is over In Bicknell, S., & Farmelo, G. (Eds.) Museum visitor studies in the 90s (pp. 51-53). London: Science Museum.

58
Hohenstein, Jill (2006). Discussing the role of conversation in learning at informal science institutions (Roundtable). San Francisco: The Center for Informal Learning and Schools/The Exploratorium.
Hooper-Greenhill, E. (1994). Museums and their visitors. NY: Routledge.
Hudson, Kenneth (1993). Visitor studies: luxuries, placebos, or useful tools In Bicknell, S., & Farmelo, G. (Eds.) Museum visitor studies in the 90s (pp. 34-40). London: Science Museum.
Johnston, D.J. and Rennie, L.J. (1995). Education: Perceptions of Visitors' Learning at an Interactive Science and Technology Centre in Australia. Museum Management and Curatorship, (14)3, 317-325.
Kelly, L. (2002). Exhibition Evaluation. Sydney: Australian Museum Audience Research Centre.
Kelly, L. (2005, March). Evaluation, Research and Communities of Practice: Program Evaluation in Museums. Journal Archival Science, (4)1-2, 45-69.
Kelly, L., & Sullivan, T. (1999). Museums and Organisational Learning: The Role of Visitor Studies. Paper presented Visitor Studies Association Conference. Available at http://amol/org.au/evrsig/evrlib.html (Accessed March, 2008)
Leinhardt, G., & Knutson, K. (2004). Listening in on Museum Conversations. Maryland: AltaMira Press.
Librero, D. (2003, Jan/Feb). Playful Attention: the Role of the Explainer. ASTC Dimensions, 6-7.
Lord, B. (2007) The Centrality of Museum Educators: Organizing and Budgeting for Museum Learning. In Lord, B. (Ed.) The Manual of Museum Learning (pp. 141-148). Lanham: AltaMira Press.
Lundberg, K. (2005). Citizens and Contemporary Science: Ways to Dialogue in Science Centre Contexts (Master Thesis, Dalarna University, 2005). Available at http://www.sciencecommunication.se/master_theses/Master-Thesis_09_Lundberg.pdf (Accessed March, 2008).
MacDonald, S. (1993). The enigma of the visitor sphinx. In Bicknell, S., & Farmelo, G. (Eds.) Museum visitor studies in the 90s (pp. 77-81). London: Science Museum.
Macdonald, S. (2002). Behind the Scenes at the Science Museum. Oxford:Berg.
Massey, C. (1993). How Cognitive Scientists View Science Learning. In Association of Science and Technology Centers (Ed.) What Research Says About Learning in Science Museums: Volume 2 (pp.7-11). Washington: ASTC.

59
McClafferty, T., & Rennie, L. (1996, November). Easy to use instruments for formative evaluation. Proceedings of the Museums Australia Conference: Evaluation and Visitor Research in Museums Special Interest Group Meeting. Sydney: Museums Australia.
McLean, K. (1993). Planning for People in Museum Exhibitions. Washington: Association of Science and Technology Centers.
McManus, P.M. (1992). Topics in Museums and Science Education. Studies in Science Education, 20(1), 157-182.
Meylan, R. (1995). Development of a comprehensive evaluation strategy for displays at Department of Conservation visitor centres. Wellington,NZ: Department of Conservation.
Miles, R. (1993). Grasping the Greased Pig In Bicknell, S., & Farmelo, G. (Eds.) Museum visitor studies in the 90s (pp. 24-33). London: Science Museum.
Miles, R., & Tout, A. (1993). Holding Power: to Choose Time is to Save Time. In Association of Science and Technology Centers (Ed.) What Research Says About Learning in Science Museums: Volume 2 (pp.17-20). Washington: ASTC.
Nyhof-Young, J. (1996). Learning Science in an Alternative Context: The Effects on a Selected Group of Young Science Educators. Journal of Science Education and Technology, 5(1), 69-75.
Rennie, L. and McClafferty, T. (1996). Handbook for Formative Evaluation of Interactive Exhibits. Perth: Commonwealth of Australia.
Rennie, L., & McClafferty, T. (1999). Science centres and science learning. In Scanlon, E., Whitelegg, E., & Yates, S. (Eds.) Communicating Science: Contexts and Channels (pp. 62-94). London/New York: Routledge.
Rennie, Leonie J. and Johnston, D.J. (2004). The Nature of Learning and Its Implications for Research on Learning from Museums. Science Education, 88(S1), S4-S16.
Rennie, Leonie J., & Johnston, D.J. (1996, November). A different perspective on visitor learning. Paper presented Museums Australia Conference: Evaluation and Visitor Research in Museums Special Interest Group Meeting, Sydney:Museums Australia.
Reussner, E. (2003) Audience Research in the Australian Cultural Heritage Sector. A study commissioned by Museums Australia, Evaluation and Visitor Research Special Interest Group. (http://archive.amol.org.au/evrsig/pdf/Audres-report.pdf, accessed 30 March 2008)
Roberts, L.C. (1997). From knowledge to narrative: educators and the changing museum. USA:Smithsonian Institution Press.

60
Sandell, R. (2007). The Strategic Significance of Workforce Diversity. In Sandell, R. and Janes, R.R. (Eds.) Museums in Museum Management and Marketing (pp. 205-221). NY:Routledge.
Schauble, L., & Gleason, M., Lehrer, R., Bartlett, K., Petrosino, A., Allen, A., et al. (2002). Supporting Science Learning in Museums. In Leinhardt, G., Crowley, K., & Knutsen, K. Learning Conversations in Museums (pp. 425-452). New Jersey: Lawrence Erlbaum Associates.
Screven, C. (1991). What is Formative Evaluation? In Taylor, S., & Serrell, B. (Eds.) Try It! Improving Exhibits through Formative Evaluation (pp. 9-13). Washington:Association of Science and Technology Centers and NY:Hall of Science.
Seitei, G.T. (2004). Front End Evaluation of “Tester” Exhibition to be Developed into a Travelling Sports Exhibition (Master’s Thesis, Dalarna University, 2004). Available at http://www.sciencecommunication.se/master_theses/Master-Thesis_09_Lundberg.pdf (Accessed March, 2008).
Serrell, B. (1993). Using behaviour to define the effectiveness of exhibitions. In Bicknell, S., & Farmelo, G. (Eds.) Museum visitor studies in the 90s (pp. 140-144). London: Science Museum.
Simmons, I. (1996). A Conflict of Cultures: Hands-on Science Centres in UK Museums. In Pearce, S. (Ed.) Exploring Science in Museums (pp.79-94). New Jersey: Athlone Press.
St. John, M., & Perry, D. (1993). A framework for evaluation and research: science, infrastructure and relationships. In Bicknell, S., & Farmelo, G. (Eds.) Museum visitor studies in the 90s (pp. 59-66). London: Science Museum.
Stocklmayer, S.M. (2002). Interactive Exhibits: What are visitors really doing? Australia: The National Centre for the Public Awareness of Science/The Australian National University.
Storrs, A.V. F. (1992, Fall). Professionalism and Research in Museum Education. Journal of Museum Education, 17(3), 20.
Sutterfield, C., & Middlebrooks, S. (2000, Mar/Apr). A Culture of Cooperation: Planning Professional Development for Science Centers. ASTC Dimensions. 3-10.
Taylor, S. (1991). Try It! Improving Exhibits through Formative Evaluation. Washington:Association of Science and Technology Centers and NY: Hall of Science.
Tran, L.U. (2002). The roles and goals of educators teaching science in non-formal settings (Master’s Thesis, North Carolina State University, 2002).
Tran, L.U., & King, H. (2007). The Professionalization of Museum Educators: The Case in Science Museums. Museum Management and Curatorship, 22(2), 131-149.

61
Uzelmeier, C. (2006, Fall). Learning to Listen to the Visitor. Journal of Museum Education, 31(3), 207-214.
Uzzell, D. (1993) Contrasting psychological perspectives on exhibition evaluation. In Bicknell, S., & Farmelo, G. (Eds.) Museum visitor studies in the 90s (pp. 125-129). London: Science Museum.
Weil, S.E. (2007). Beyond Big and Awesome: Outcome-based evaluation. In Sandell, R. & Janes, R.R. (Eds.) Museum Management and Marketing (pp. 195-204). NY: Routledge.
Zhang, J. (2001). BC Science World. Retrieved April 25, 2008 from http://members.tripod.com/jerry_zhang_van/scworld.htm

62
7. Appendices
Appendix A: Description of the Bucket Radio and Gyroscope Exhibits...........................63
Appendix B: Visitor Exhibit Use Schedules .....................................................................65
Appendix C: Staff Assessment Schedules .........................................................................67
Appendix D: Staff Training Presentation and Handout.....................................................69
Appendix E: Comprehension and Motivation Results: Frequency of visitor and staff responses .......................................................................................................84
Appendix F: Emily’s (Science Facilitator) visitor observation results..............................86

63
Appendix A. Descriptions of Bucket Radio and Gyroscope Exhibits Bucket Radio Exhibit Description Exhibit Label
Hold a bowl or bucket against the peg on the table. Listen to the radio. What happens if you use a different bowl? All sounds start with a vibration. Touch the peg to feel it vibrate. You can't hear it because the small peg doesn't move much air. When the bowl touches the peg, it vibrates and pushes a lot of air back and forth. Your ears pick up the vibrations in the air, and you can hear the radio. Each bowl vibrates differently, depending on how big it is and what it's made of. Stiff materials transfer vibrations better than flexible ones. Big bowls move more air than small ones.
Exhibit components
Facilitator Secrets: If you put a bucket on each peg and sit in the middle, you'll hear the sound in stereo. Will you notice? I don't know, but give it a try. Try putting your head (or your ear) on the peg to hear the sound. Put your right elbow on the peg, keep your wrist straight, and use your right index finger to plug your ear. What do you hear?
large metal bowl
small metal bowl vibrating peg
exhibit label
vibrating peg

64
Gyroscope Motion Exhibit Description Exhibit Labels (both located outside the cage containing the exhibit, not in visitor’s view)
1. Use this handle to spin the wheel. 2. Tilt the wheel. What happens if you tilt the wheel the other way? What happens if you tilt the wheel when it's not spinning? A heavy spinning wheel tends to stay pointed in exactly the same direction. This property is called angular momentum. When you force the wheel to tilt, it pushes back on you and makes you spin. Spinning wheels (called gyroscopes) are sometimes used on ships and airplanes to show direction. If you spin a gyroscope so it faces north, angular momentum keeps it facing north as the ship or airplane moves around.
Exhibit Components Facilitator Secrets: If you start with the platform stationary and the wheel oriented vertically, you'll get the greatest range of motion in both directions. Experiment with other combinations. Small children will not be able to do this. Toy tops, yo-yos, and other spinning toys behave as gyroscopes. Their angular momentum keeps them from tipping. Gyroscopes are used in navigation on ships, planes, and even the Space Station.
steering “disc” or “wheel”
flywheel “handle” or “crank”
flywheel surrounded by flywheel case
cage surrounding exhibit
rotating “platform” or “turntable”

65
Appendix B. Visitor Exhibit Use Schedules
Visitor Exhibit Use Schedule (Bucket Radio)
Exhibit Module: Bucket Radio Interviewer: Date: Time:
Composition of Visitor Group: (circle person interviewed)
Key: M=Adult male F=Adult female B= teen Boy G=teen Girl b=boy g=girl
Behaviour: Ignore Attend Engage Use Successfully (circle as observed)
Child approaches exhibit on own Child approaches exhibit on urging of adult
Behaviour Comments:
Cooperation in Group: Yes No Comment:
Interaction: Watch Talk Read Manipulate Demonstrate (circle as observed)
Ergonomics Indicate in chronological order:
Child reads signage
Adult reads signage
Adult explains to child
Correctly places 1st bowl against peg
Incorrectly places 1st bowl upside down
Ear to 1st bowl
Switches to 2nd bowl
Correctly places 2nd bowl against peg
Incorrectly places 2nd bowl upside down
Ear to the 2nd bowl
Listens to peg with no bowl
Puts one bowl on each peg and listens in the middle (in stereo)
Time spent interacting with exhibit?
Age: Is this your first visit to Science World? Yes No If yes, have you tried this exhibit before? Yes No 1. What made you notice this exhibit?
2. Did you find part of it confusing or frustrating?
3. Is there something you really liked about it (your favourite part)?
4. What do you think the exhibit designer was trying to teach people with this exhibit?
5. Explain the purpose of the exhibit. This exhibit shows you how vibrations can be made bigger (amplified) to make sounds louder.
What could we change to make it better?

66
Visitor Exhibit Use Schedule (Gyroscope)
Exhibit Module: Gyroscope Interviewer: Date: Time:
Composition of Visitor Group: (circle person interviewed)
Key: M=Adult male F=Adult female B= teen Boy G=teen Girl b=boy g=girl
Behaviour: Ignore Attend Engage Use Successfully (circle as observed)
Child approaches exhibit on own Child approaches exhibit on urging of adult
Behaviour Comments:
Cooperation in Group: Yes No Comment:
Interaction: Watch Talk Read Manipulate Demonstrate (circle as observed)
Ergonomics Indicate in chronological order:
Stands in the designated spot (on turntable)
Does not stand in designated spot
Child reads signage
Adult reads signage
Adult explains to child
Holds flywheel vertically
Holds flywheel horizontally
Uses handle to spin flywheel How long do they spin? Holds steering disc
Turns steering disc
Notices that tilting the flywheel causes the turntable to turn
Trouble with gate
Time spent interacting with exhibit?
Age: Is this your first visit to Science World? Yes No If yes, have you tried this exhibit before? Yes No 6. What made you notice this exhibit?
7. Did you find part of it confusing or frustrating?
8. Is there something you really liked about it (your favourite part)?
9. What do you think the exhibit designer was trying to teach people with this exhibit?
10. Explain the purpose of the exhibit. This exhibit shows you how changing the tilt of a spinning wheel causes you to spin. What
could we change to make it better?

67
Appendix C. Staff Assessment Schedules
Staff #: Date: Time: Exhibit Module: Bucket Radio Age: 15-18 19-21 22-25 25-29 30-35 35-40 40-45 45-50 Sex: M F How long have you been working at Science World? How many hours per week? Have you worked at any other science centre or museum in the past? Do you have a background in: psychology education museum studies science
Attractive Power What proportion of (8 – 13 year old) children stop to look at the exhibit (without the urging of an adult)? % What proportion of children stop upon the urging of an adult? %
Learning Indicator Behaviour How do most (8 – 13 year old) children behave around the exhibit?
Watch Read Talk Manipulate Demonstrate
Ergonomics What percentage of (8 – 13 year old) children successfully complete the task? % Describe how most children interact with an exhibit (the steps they take) How much time does a visitor typically spend interacting with the exhibit?
Comprehension and Motivation When considering these questions, think about 8-13 year olds. 1. What do you think attracts visitors to the exhibit?
2. What could we do to make it more attractive/interesting to visitors?
3. Which part(s) would you say are confusing or frustrating for the visitors?
4. Which part(s) do you think the visitors especially enjoy (their favourite part)?
5. What do you think the visitors think exhibit is trying to teach them (in their own words)?
6. Purpose of the exhibit: In short, vibration makes sound. On its own, the peg vibrates only a bit of air which is why we can’t hear it. The bowl, when touched to the peg, vibrates even more air, causing a louder sound. The bigger the bowl, the more air vibrates, the louder the sound. It acts as a speaker. How could we change it to make it more understandable to visitors? Include cues you typically have to provide visitors for them to figure out the exhibit.

68
Staff #: Date: Time: Exhibit Module: Gyroscope Motion Age: 15-18 19-21 22-25 25-29 30-35 35-40 40-45 45-50 Sex: M F How long have you been working at Science World? How many hours per week? Have you worked at any other science centre or museum in the past? Do you have a background in: psychology education museum studies science
Attractive Power What proportion of children stop to look at the exhibit (without the urging of an adult)? % What proportion of children stop upon the urging of an adult? %
Learning Indicator Behaviour How do most children behave around the exhibit?
Watch Read Manipulate Talk Demonstrate
Ergonomics What percentage of children successfully complete the task? Describe how most children interact with an exhibit (the steps they take) How much time does a visitor typically spend interacting with the exhibit?
Comprehension and Motivation When considering these questions, think about 8-13 year olds. 7. What do you think attracts visitors to the exhibit?
8. What could we do to make it more attractive/interesting to visitors
9. Which part(s) would you say are confusing or frustrating for the visitors?
10. Which part(s) do you think the visitors especially enjoy (their favourite part)?
11. What do you think the visitors think exhibit is trying to teach them (in their own words)?
12. Explain the purpose of the exhibit. This exhibit shows you how changing the tilt of a spinning wheel causes you to spin. How could we change it to make it more understandable to visitors? Include cues you typically have to provide visitors for them to figure out the exhibit.

1
Tapping into Floor Staff: Using the knowledge of floor staff to conduct formative evaluations of exhibits in a Canadian science centre
Masters in Communicating ScienceDalarna University, Sweden
Josée Lebel

2
Why evaluate?
• Accountability to stakeholders
• Guiding best practices for exhibit and program development
• Understanding our impact on visitors
Science North ECSITE Presentation, Science World, 2005

3
“Interactive Museum Experience”
Perry (1992) lists 6 factors that lead to a successful museum experience:
Surprise and intrigueCuriosityFeels competentConfidenceSomething to work towardsChallengeSelf-determinationControlExperiences enjoymentPlayMeaningful social interactionCommunication
What is your favourite exhibit in Eureka? How does it compare to the list of 6 factors?

4
Visitor “Types”
• Commuter: merely uses the hall as a vehicle to get from the entry point to the exit point.
• Nomad: The casual visitor.
• Cafeteria type: peruses the entire gallery looking for exhibits of interest before coming back to interact with those exhibits.
• VIP: very interested personWorlf and Tymitz (1978)

5
Three Main Types of Visitor Studies
• Front-End
• Formative
• Summative

6
Front End Evaluation• seeks to gauge a target audience’s
comprehension on a topic and/or what topic(s) are relevant to them.
• Takes place before an exhibit is built
Front-end evaluations help narrow the scope of a topic when limited by space, time, and budget.
What are visitors’ understandings about the topic? What do visitors know about Gravity? What do non-science centre visitors think a visit to Science World is like? What attitudes and beliefs do they bring with them? What are the developers’understandings and assumptions about their visitors? Are they overestimating their abilities or knowledge? Are they underestimating?
Example: 20 years ago, if you were to construct an exhibit on DNA for 15 year olds, what would you include? What would you include today? What has influenced this change?
How the information is used is still a negotiating process. Unfortunately, in several science centres, many of the planners are off the floor and not savvy to visitors’level of knowledge.

7
Formative Evaluation
• May predict relative popularity of exhibit
• Highlights design-related issues while still in prototype form
• Ergonomics, signage, attraction, enjoyment, and comprehension
Rule of thumb: if you’re using a tried and tested formula, such as a debate, you don’t need to worry about doing a formative evaluation. If, however, you’re not sure how your audience is going to react to an exhibit or activity, test it out first.

8
Summative Evaluation
• Evaluate whether or not the goals of the exhibit were met
• Always conducted after the exhibit is opened to the public
• Strengths and weaknesses in both design process and production

9
“Success” of an exhibit
• Visitor can complete the task• Relate it to a process or principle of
science• VERY difficult to measure “learning”
Newspaper report of an exhibition at Boston’s Museum of Science:
This is what the display is designed to do: recreate Galileo’s famous experiment of dropping different weights from the top of the Leaning Tower of Pisa, proving that objects of different weights fall at the same speed.
Here’s what the kid was doing instead: Figuring out the mechanism that stopped the buckets from rising whenever he opened the little doors that let users put weights in buckets. Having figured that out, he was testing his reaction time by seeing if he could open the door fast enough, after the weghts started falling, to catch them before they hit the bottom.
Has the child “successfully” handled the exhibit? Has the child learned something?Do you have any examples from working at SW or elsewhere?

10
Traditional Learning Indicators: Pre and Post Test
• Ask child questions before and after exposure to the exhibit.
• Criticism from pedagogy experts
Child may not have made the link between the exhibit and the knowledge transfer on the spot. He could have related to something he had learned before or make the connection once he returns to the classroom.

11
Modern Learning Indicators
Chantal Barriault, Science North ECSITE Presentation, 2005
8. Engagement/involvement
7. Seeking/sharing information Breakthrough!6. Acknowledging relevance
5. Positive emotional response
Transition4. Repeating the activity
3. Support or assistance by staff or other
visitors
2. Observing others or observing the exhibit Initiation1. Doing the activity
1. Initiation behaviors:• Testing out the activity • Spending time watching others engaging in the activity • Information and assistance offered by staff or other visitorsAbove all else, visitors need to "feel safe" about committing themselves to engagement with an
activity, especially in a public setting. Initiation behaviors enable them to "test the waters" with minimum personal risk and can be seen as the first step in learning.
2. Transition behaviors: • Repeating the activity • Expressing positive emotional responses in reaction to engaging in the activitySmiles and outbursts of enjoyment along with repetition indicate that a level of comfort has been
achieved and that visitors are comfortable ... and even eager ... to engage themselves more thoroughly in the activity. Regardless of whether the activity is repeated in order to better understand it, to master the functions or to observe different outcomes, the net outcome is a more committed and motivated learning behavior.
3. Breakthrough behaviors:• Referring to past experiences while engaging in the activity• Seeking and sharing information• Engaged and involved: testing variables, making comparisons and using information gained from
the activityEach of these behaviors acknowledges the relevance of the activity, and the learning gained from the
activity, to the individual's everyday life. A personal level of comfort has been established that encourages a free flow of ideas and exchanges, and enables real learning to occur.

12
Attraction
Ergonomics
Learning Processes
Floor staff can evaluate…
Signage
If more than one third (ie more than 10 out of 30) ignore the exhibit, it is not attractive.
Ideally everyone attends, but realistically and depending on the time of day, any exhibit will be ignored by some people. Some factors that could deter people: lineups, location (corner, next to exit), lighting, colour scheme, purpose not obvious.
• More than two thirds should at least attend to the exhibit. Ideally everyone who attends would engage with and use the exhibit successfully.
• At least 90% of those who engage should be able to use the exhibit successfully.
• The exhibit may be attractive but unsuccessful (less than half those operating the exhibit used it as intended).

13
CAUTION: Are you Impartial?
• Are there any exhibits that visitors love but you loathe?
• Why do you loathe them?
• How will this affect your neutrality?
• What will you communicate to the exhibit designer?
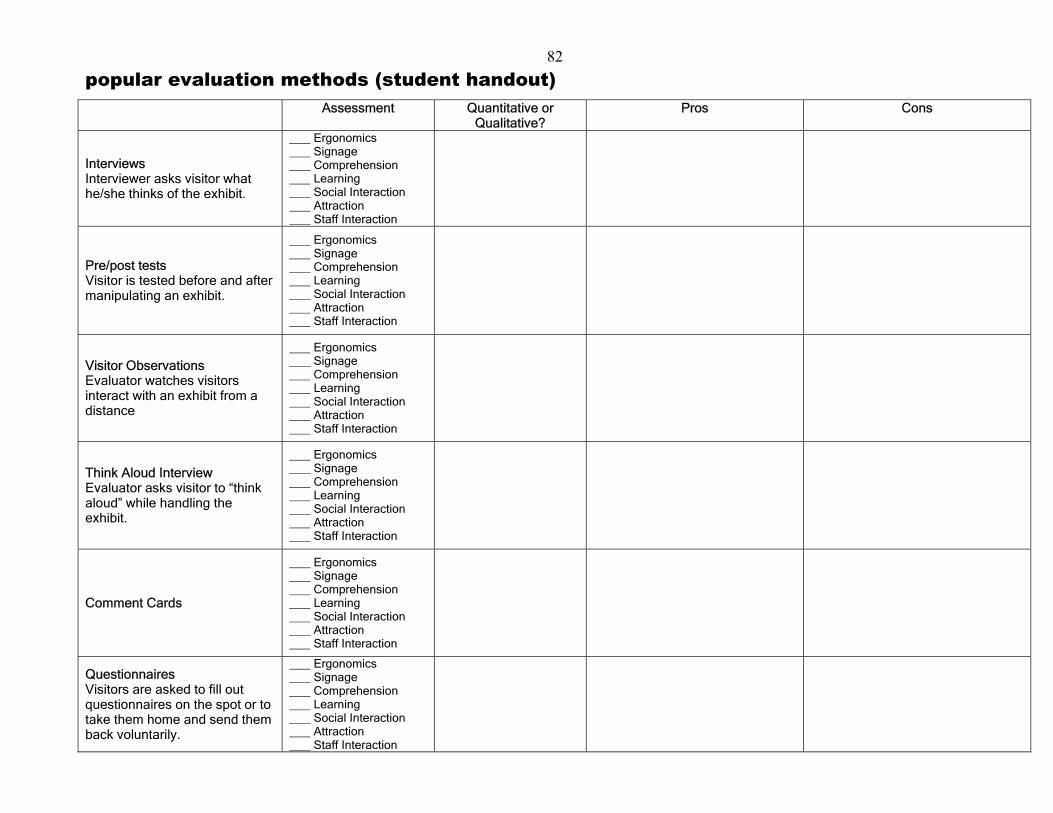
82 popular evaluation methods (student handout)
Assessment Quantitative or Qualitative?
Pros Cons
Interviews Interviewer asks visitor what he/she thinks of the exhibit.
Ergonomics Signage Comprehension Learning Social Interaction Attraction Staff Interaction
Pre/post tests Visitor is tested before and after manipulating an exhibit.
Ergonomics Signage Comprehension Learning Social Interaction Attraction Staff Interaction
Visitor Observations Evaluator watches visitors interact with an exhibit from a distance
Ergonomics Signage Comprehension Learning Social Interaction Attraction Staff Interaction
Think Aloud Interview Evaluator asks visitor to “think aloud” while handling the exhibit.
Ergonomics Signage Comprehension Learning Social Interaction Attraction Staff Interaction
Comment Cards
Ergonomics Signage Comprehension Learning Social Interaction Attraction Staff Interaction
Questionnaires Visitors are asked to fill out questionnaires on the spot or to take them home and send them back voluntarily.
Ergonomics Signage Comprehension Learning Social Interaction Attraction Staff Interaction

83 popular evaluation methods (trainer copy)
Assessment Quantitative or Qualitative?
Pros Cons
Interviews Interviewer asks visitor what he/she thinks of the exhibit.
x Ergonomics x Signage x Comprehension x Learning Social Interaction x Attraction Staff Interaction
qualitative - Possibility of clarification - Body language - Rich information
- visitor may be trying to please - visitor may get the sensation
he/she is being tested
Pre/post tests Visitor is tested before and after manipulating an exhibit.
Ergonomics Signage x Comprehension Learning Social Interaction Attraction Staff Interaction
quantitative - traditional - reflect “true” learning?
Visitor Observations Evaluator watches visitors interact with an exhibit from a distance
x Ergonomics x Signage Comprehension x Learning x Social Interaction x Attraction x Staff Interaction
Quantitative/qualitative
- unobtrusive - medium time consumption - language spoken by visitor
not important
- cannot hear what visitors are saying
- visitor’s reasons for attending/ignoring not known
Think Aloud Interview Evaluator asks visitor to “think aloud” while handling the exhibit.
x Ergonomics x Signage Comprehension Learning Social Interaction Attraction Staff Interaction
qualitative
- evaluator can follow visitor’s thought processes
- unveils reasons why visitors lose interest or are frustrated
- visitor may get the sensation he/she is being tested, making them nervous
Comment Cards
x Ergonomics x Signage Comprehension Learning Social Interaction x Attraction x Staff Interaction
Qualitative or quantitative if asked to rate
- low staff/time requirement - keep track of day-to-day - highlights a few staff’s
strengths and weaknesses
- visitors usually have to go out of their way to fill out
- flushes out “extreme” responses - evaluator cannot probe visitor - can be vague
Questionnaires Visitors are asked to fill out questionnaires on the spot or to take them home and send them back voluntarily.
x Ergonomics x Signage x Comprehension Learning Social Interaction x Attraction x Staff Interaction
Quantitative if asked to rate or qualitative
- low staff/time requirement - time consuming for visitor - low return rate (if mailed)

84
Appendix E. Comprehension and Motivation Results: Frequency of visitor and staff responses
Bucket Radio – Visitor Comments Bucket Radio – Staff Comments What made you notice this exhibit? What do you think attracts visitors to the exhibit? Walking by/new experience 13 Check out each exhibit/on the way 2 Bowls 4 Curious about the bowls 3 Signage - “Bucket radio” what’s that about? 2 I don’t know/nothing* 11 Looked easy to use 1 Did you find part of it confusing or frustrating?
Which part(s) would you say are confusing or frustrating for the visitors?
Didn’t hear radio/thought it was broken 9 Music not clear 1 Not sure how to use 5 Not obvious how to use
How to put the bowls; Wear pattern around peg confuses people
5
Can’t tell difference between bowl sizes 1 Didn’t realize peg vibrates 1 Is there something you really liked about it (your favourite part)?
Which part(s) do you think the visitors especially enjoy (their favourite part)?
Hearing radio/music 11 To hear something/music 3 Trying to figure out how it works 2 To know how it works/discovery aspect 2 Feeling vibrations 2 I don’t know/No* 15 Children will not be that excited 1 What do you think the exhibit designer was trying to teach people with this exhibit?
What do you think the visitors think exhibit is trying to teach them (in their own words)?
Sound waves 4 How sound works (hearing sound) 4 Magnification/Amplification 4 Sound amplification (quiet and loud) 2 How music/radio works 8 Vibrations travelling 1 Vibrations and sound 2 How sound travels 2 Sound travels 2 I don’t know/No* 11 Explain the purpose of the exhibit. This exhibit shows you how vibrations can be made bigger (amplified) to make sounds louder. What could we change to make it better?
Purpose of the exhibit: In short, vibration makes sound. On its own, the peg vibrates only a bit of air which is why we can’t hear it. The bowl, when touched to the peg, vibrates even more air, causing a louder sound. The bigger the bowl, the more air vibrates, the louder the sound. It acts as a speaker. How could we change it to make it more understandable to visitors? Include cues you typically have to provide visitors for them to figure out the exhibit.
Have other bowls/objects to try 4 Extensions – trading bowls, using elbow/fingers, more differentiation between small and large bowls, various types of containers to try out
2
Have bowl right side up permanently 4 Make obvious that bowl fits a certain way/arrows/sticker that says “this side to peg”
6
Make bigger for more people 4 I don’t know/Nothing* 18 Radio more clear 1 Peg – giant centre tower raised from table 1 Relate to tin can on signage 1 Simple explanation – air vibrates and is being transferred 1 One staff says “nothing we can do about signage”

85
Gyroscope – Visitor Comments Visitor Staff Gyro – Staff Comments What made you notice this exhibit? What do you think attracts visitors to the exhibit? Cage 2 4 Spins around 10 1 Other people were using it 6 0 Looked like fun 2 0 In middle of space 1 Size of exhibit 1 I don’t know/Nothing* 10 Did you find part of it confusing or frustrating?
Which part(s) would you say are confusing or frustrating for the visitors?
Didn’t know what to do How fast or slow should the flywheel spin? Didn’t see handle.
6 6 Unclear signage Confused how to turn handle; Do not know how to gently tilt gyro
What’s the point/purpose? 2 1 No (mental) connection between disc and platform Hard to get it (flywheel) to go fast 2 1 Flywheel too heavy Difficult to reach handle and keep steady 5 3 Can’t reach handle Nothing (although 3 weren’t successful) 15 1 No safety mechanism Is there something you really liked about it (your favourite part)?
Which part(s) do you think the visitors especially enjoy (their favourite part)?
Body spins around 12 5 Spinning Flywheel span faster and faster 4 1 Cranking the handle Steering the wheel 2 1 Turning the disc 2 Using foot to propel I don’t know/Nothing 12 What do you think the exhibit designer was trying to teach people with this exhibit?
What do you think the visitors think exhibit is trying to teach them (in their own words)?
Turning/spinning objects 8 4 Spinning Turn one object makes other turn too 8 3 Turn wheel, makes me spin Wind/transportation 4 Don’t know 10 1 Need energy to move things Explain the purpose of the exhibit. This exhibit shows you how changing the tilt of a spinning wheel causes you to spin. What could we change to make it better?
Explain the purpose of the exhibit. This exhibit shows you how changing the tilt of a spinning wheel causes you to spin. How could we change it to make it more understandable to visitors? Include cues you typically have to provide visitors for them to figure out the exhibit.
Staff/volunteer explaining what to do 2 1 Staff holds wheelcase while child turns handle Sign on inside “tilt more on one side to feel movement”; Terms “wheel” and “disc” are confusing.
14 12 Obvious, simple, safety signage within the cage Signage making it obvious to not turn disc all the way 3; Do not use foot to propel 1; “Keep feet on footprints – crank wheel, tilt gently” 1; “Forces are stubborn – force it to go in one direction, it pushes you in the other direction” 1; Signage inside exhibit 4; Plain signage on inside 1; Signage on wheel “wrong side up” 1
Use lever that can stop instead of wheel 2 3 Mechanism to stop disc from turning all the way Graphic confusing – thought it was about planes/ships
2 1 [Mental] Connection between child/wheel/tilt
Move/remove handle – too far/hard 6 2 Minimum height could be changed – many children have difficulties reaching handle or supporting weight of flywheel
No change 8 1 Explanatory/complex signage outside the cage 3 Safety signage affixed outside the cage
Minimum height sign fixed

86
Appendix F. Emily’s (Science Facilitator) visitor observation results

87


![SHU Blogs | Sheffield Hallam University - HPO Floor … · Web viewHPO Floor Plan - Staff List Third Floor Room 16301 [Fashion Studio] Room 16302 - Fashion Store Lisa Batty Nicole](https://img.pdfslide.us/doc/110x75/5e736c51eafeb602306a1b44/shu-blogs-sheffield-hallam-university-hpo-floor-web-view-hpo-floor-plan-staff.jpg)