Embed Size (px)
Citation preview


1
TABLE OF CONTENTS
VOLUME I
Signature Page ................................................................................................................................6 Summary Page ...............................................................................................................................7 I. Introduction ........................................................................................................................8 A. Project Overview .....................................................................................................8
B. Relevant Correspondence ........................................................................................9 C. Project Deviations Summary .................................................................................22
II. Test Administration .........................................................................................................24 A. Sponsor ..................................................................................................................24 B. Testing Facilities ....................................................................................................24 C. Dates of Experiment ..............................................................................................24 D. Study Participants ..................................................................................................24
III. Materials and Methods ....................................................................................................25 A. Sampling ................................................................................................................25 B. Homogenizing and Compositing ...........................................................................26 C. Chemical Analyses ................................................................................................26 D. Physical Analysis and Total Organic Carbon ........................................................26 E. Solid Phase Testing ................................................................................................27 F. Suspended Particulate Phase Testing .....................................................................28 G. Bioaccumulation Testing .......................................................................................29
IV. Results and Discussion .....................................................................................................30 A. Solid Phase Testing ................................................................................................30 B. Suspended Particulate Phase Testing .....................................................................31 C. Bioaccumulation Testing .......................................................................................33
V. References .........................................................................................................................34
FIGURES AND TABLES
Figure 1 Sample Locations .......................................................................................35 Figure 2 Sample Locations .......................................................................................36 Table 1a Sample Identification and Compositing .....................................................37 Table 2 DGPS Coordinates, Core Locations ..........................................................39 Table 3 Test Performance Summary (% Survival) .................................................41 Table 4a Particle Size Distribution, Percent Moisture and TOC Values of
HARS Samples ..........................................................................................42 Table 4b Particle Size Distribution, Percent Moisture and TOC Values of
Reference and Control Sediments ..............................................................44 Table 5 Specific Gravity, Bulk Density, Atterberg Limits and Total
Suspended Solids .......................................................................................45 Table 6 Sampling Summary and Holding Times ....................................................46

2
Water Quality Parameter Tables Solid Phase A. abdita Static Renewal Bioassay
Table 7 Live Count .................................................................................................48 Table 8 Temperature ...............................................................................................49 Table 9 Salinity .......................................................................................................50 Table 10 D.O. ............................................................................................................51 Table 11 pH ...............................................................................................................52 Table 12 Total Ammonia ..........................................................................................53
Solid Phase A. bahia Static Non-Renewal Bioassay Table 13 Live Count ................................................................................................54 Table 14 Temperature ..............................................................................................55 Table 15 Salinity ......................................................................................................56 Table 16 D.O . ...........................................................................................................57 Table 17 pH ..............................................................................................................58 Table 18 Total Ammonia ..........................................................................................59 Table 19 Unionized Ammonia ..................................................................................60
Solid Phase A. bahia Static Renewal Bioassay
Table 20 Live Count ................................................................................................61 Table 21 Temperature ..............................................................................................62 Table 22 Salinity ......................................................................................................63 Table 23 D.O . ...........................................................................................................64 Table 24 pH ..............................................................................................................65 Table 25 Total Ammonia ..........................................................................................66
Suspended Particulate Phase M. beryllina Bioassay
Table 26 Live Count .................................................................................................67 Table 27 Temperature ...............................................................................................69 Table 28 Salinity .......................................................................................................71 Table 29 D.O .............................................................................................................73 Table 30 pH ...............................................................................................................75 Table 31 Total Ammonia ..........................................................................................77
Suspended Particulate Phase A. bahia Bioassay
Table 32 Live Count .................................................................................................79 Table 33 Temperature ...............................................................................................81 Table 34 Salinity .......................................................................................................83 Table 35 D.O .............................................................................................................85 Table 36 pH ...............................................................................................................87 Table 37 Total Ammonia ..........................................................................................89
Suspended Particulate Phase M. edulis Bioassay
Table 38 LC50 for Survival, Reach Area 1A .............................................................91 Table 39 EC50 for Development, Reach Area 1A .....................................................92

3
Table 40 LC50 for Survival, Reach Area 1B .............................................................93 Table 41 EC50 for Development, Reach Area 1B .....................................................94 Table 42 LC50 for Survival, Reach Area 1C .............................................................95 Table 43 EC50 for Development, Reach Area 1C .....................................................96 Table 44 LC50 for Survival, Reach Area 2 ................................................................97 Table 45 EC50 for Development, Reach Area 2 ........................................................98
Bioaccumulation M. nasuta Bioassay Table 46 Live Count .................................................................................................99 Table 47 Temperature .............................................................................................100 Table 48 Salinity .....................................................................................................102 Table 49 D.O. ..........................................................................................................104 Table 50 pH .............................................................................................................106 Table 51 Total Ammonia ........................................................................................108
Bioaccumulation N. virens Bioassay Table 52 Live Count ...............................................................................................110 Table 53 Temperature .............................................................................................111 Table 54 Salinity .....................................................................................................113 Table 55 D.O. ..........................................................................................................115 Table 56 pH .............................................................................................................117 Table 57 Total Ammonia ........................................................................................119
VOLUME II
APPENDICES A - H Sediment Core Logs .................................................................................................................... A-1 Photographs..................................................................................................................................B-1 Chains of Custody ........................................................................................................................C-1 Sample Use Forms ...................................................................................................................... D-1 Sea Water Sample Receiving Forms & Chemical Analyses ....................................................... E-1 Percent Moisture & Grain Size Distribution Raw Data ............................................................... F-1 Bulk Density, Specific Gravity, Atterberg Limits, and Total Suspended Solids Raw Data ....... G-1 Total Organic Carbon Raw Data and SRM Control Chart ......................................................... H-1
VOLUME III
APPENDICES I – O
Solid Phase A. abdita Bioassays Bench sheets...................................................................................................................... I-1 Control Chart .................................................................................................................. I-32 Standard Reference Toxicant Data ................................................................................. I-33

4
Organism Transportation Sheets ..................................................................................... I-49 Continuous Temperature Recorder ................................................................................. I-54
Solid Phase A. bahia Bioassays
Bench sheets, Static Non-renewal ..................................................................................... J-1 Bench sheets, Static Renewal ......................................................................................... J-34 Control Chart .................................................................................................................. J-59 Standard Reference Toxicant Data ................................................................................. J-60 Organism Transportation Sheets ..................................................................................... J-70 Continuous Temperature Recorder ................................................................................. J-82
Suspended Particulate Phase M. beryllina Bioassay Bench sheets.................................................................................................................... K-1 Control Chart ................................................................................................................ K-31 Standard Reference Toxicant Data ............................................................................... K-32 Organism Transportation Sheets ................................................................................... K-42 Continuous Temperature Recorder ............................................................................... K-47
Suspended Particulate Phase A. bahia Bioassay Bench sheets..................................................................................................................... L-1 Control Chart ................................................................................................................. L-31 Standard Reference Toxicant Data ............................................................................... L-32 Organism Transportation Sheets .................................................................................... L-42 Continuous Temperature Recorder ................................................................................ L-47
Suspended Particulate Phase M. edulis Bioassay Bench sheets ................................................................................................................... M-1 Control Chart ................................................................................................................ M-25 Standard Reference Toxicant Data ............................................................................... M-26 Organism Transportation Sheets ................................................................................... M-35 Continuous Temperature Recorder ............................................................................... M-38
Bioaccumulation Raw Data, M. nasuta Bench sheets.................................................................................................................... N-1 Control Chart ................................................................................................................ N-69 Standard Reference Toxicant Data ............................................................................... N-70 Organism Transportation Sheets ................................................................................... N-80 Continuous Temperature Recorder ............................................................................... N-84
Bioaccumulation Raw Data, N. virens
Bench sheets.................................................................................................................... O-1 Control Chart ................................................................................................................ O-69 Standard Reference Toxicant Data ............................................................................... O-70 Organism Transportation Sheets ................................................................................... O-80 Continuous Temperature Recorder ............................................................................... O-85

5
VOLUME IV
Public Notice Tables Area 1A, Area 1B, Area 1C, Area 2
Table 1 Chemical Analysis of Site Water and Elutriate Table 2 Toxicity Test Results Table 3 Chemical Analysis of Tissue Supermemo
VOLUME V
Statistical Analysis of Tissue Samples: M. nasuta
VOLUME VI
Statistical Analysis of Tissue Samples: N. virens


7
Summary Page
Technical Report on the Sampling and Testing of Material from the Tappan Zee Hudson River Crossing Proposed for Dredging and HARS Placement
Study Initiation Date
January 30, 2012
Study Completion Date
May 23, 2012
Performing Laboratory
Aqua Survey, Inc. 469 Point Breeze Road
Flemington, New Jersey 08822
Sponsor
AKRF, Inc. 440 Park Avenue South
7th Floor New York, NY 10016
Laboratory Project ID
32-012

8
I. INTRODUCTION
A. Project Overview
The objective of this study was to perform sampling, compositing, physical characterization and biological testing of sediment proposed for dredging from the Hudson River, near the Tappan Zee Bridge. Testing was performed in accordance with USEPA and USACOE, 1991 Green Book, Evaluation of Dredged Material Proposed for Ocean Disposal – Testing Manual, EPA-503/8-91/001; and USACOE New York District, Guidance for Performing Tests on Dredged Material Proposed for Ocean Disposal, December 1992 [USEPA/USACE, 1991; USEPA/NYACE, 1992]. Aqua Survey, Inc. (ASI) performed all sampling, biological testing and physical analyses (grain size, percent moisture, TOC, bulk density, specific gravity and Atterberg Limits).
Whole sediment toxicity was assessed through 10-day exposures with the mysid shrimp, Americamysis bahia, and the amphipod, Ampelisca abdita in solid phase tests.
Toxicity of elutriate prepared from the composite was assessed through 96-hour suspended particulate phase toxicity bioassays with the inland silverside, Menidia beryllina and the mysid shrimp, Americamysis bahia. A 48-hour embryo development test was performed using the blue mussel, Mytilus edulis.
Bioaccumulation of metals, pesticides, PCB congeners, semivolatiles (1,4 dichlorobenzene), PAHs, and dioxin/furans was assessed using 28-day exposures of the clam, Macoma nasuta and the sand worm, Nereis virens to the four composite sediment samples.

9
B. Relevant Correspondence


22
C. Project Deviations Summary

23
1. Due to the low salinity of the interstitial water in each test sediment, the salinity fell
below the 28 ppt minimum requirement for much of the 10-day A. bahia static solid phase bioassay. Please refer to Table 15 for a summary of the 10-day salinities.
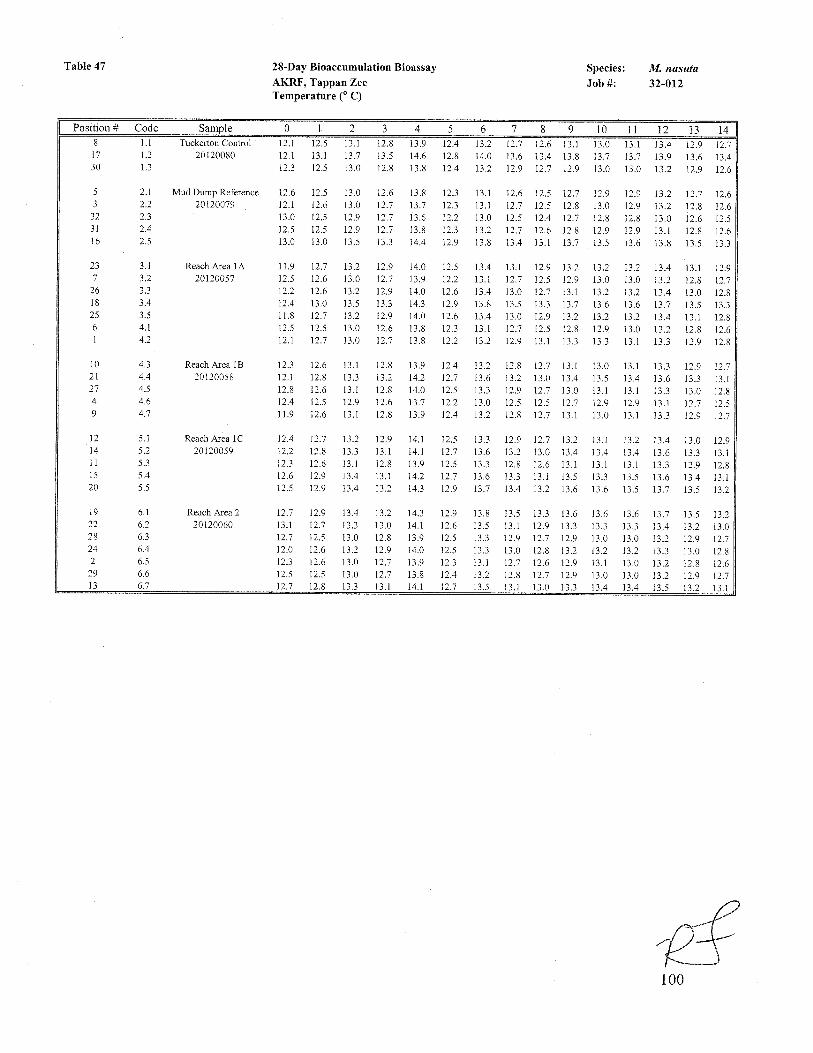
2. There were minor temperature excursions in the 28 day M. nasuta bioassay. Please refer
to Table 47 for the summary of the 28-day temperatures.
24
II. TEST ADMINISTRATION
A. Sponsor AKRF, Inc. 440 Park Avenue South 7th Floor New York, NY 10016
B. Testing Facilities
Aqua Survey, Inc. 469 Point Breeze Road Flemington, NJ 08822 Battelle Applied Coastal and Environmental Services (ACES) 397 Washington Road Duxbury, MA 02332-4505
Battelle Marine Sciences Laboratory 1529 West Sequim Bay Road Sequim, WA 98382-9099 Battelle 505 King Avenue Columbus, OH 43201-2693
C. Dates of Experiment Date of Study Initiation: January 30, 2012 Date of Study Completion: May 23, 2012
D. Study Participants
Jon Doi, Ph.D. Executive Vice President and Project Manager Thomas Dolce Field Operations Manager Robert Fristrom Quality Assurance Officer Elizabeth Horn Staff Scientist G. Stephen Hornberger Senior Scientist Mark Padover Field Operations Specialist York Terrell Staff Scientist Michelle Thomas Laboratory Manager

25
III. MATERIALS AND METHODS
All sampling and testing was performed according to the sediment sampling and testing plan on file with the NYD/USACE.
A. Sampling
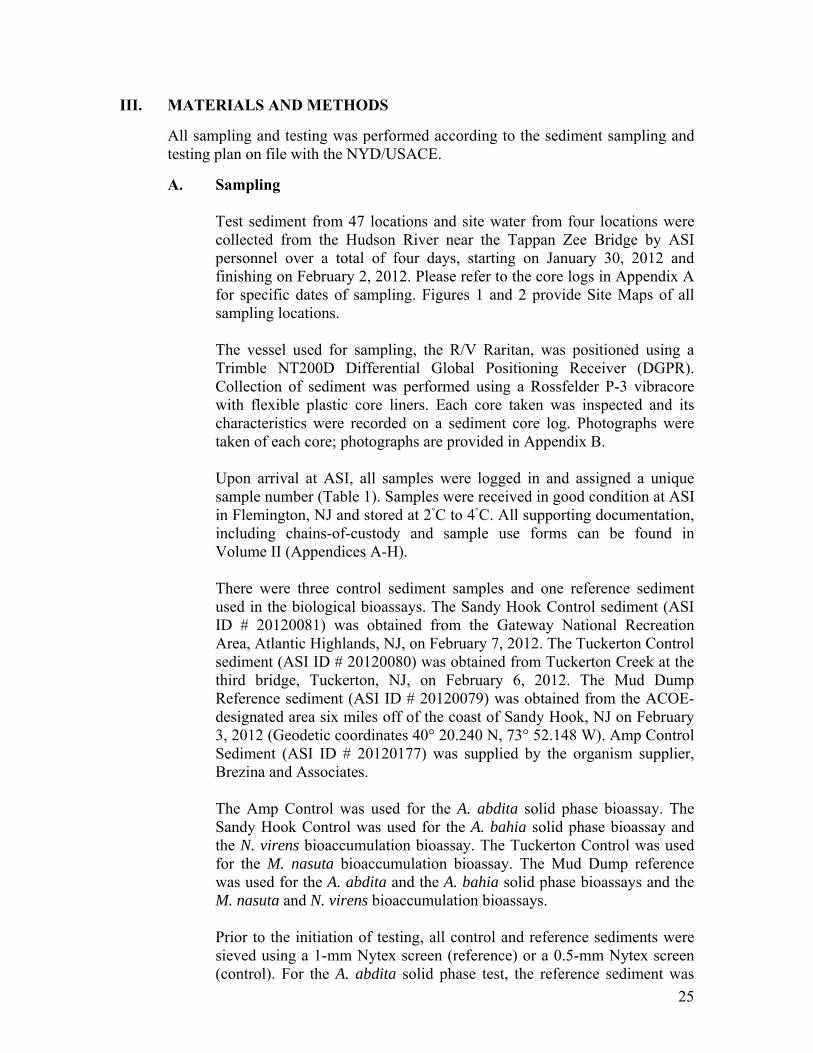
Test sediment from 47 locations and site water from four locations were collected from the Hudson River near the Tappan Zee Bridge by ASI personnel over a total of four days, starting on January 30, 2012 and finishing on February 2, 2012. Please refer to the core logs in Appendix A for specific dates of sampling. Figures 1 and 2 provide Site Maps of all sampling locations. The vessel used for sampling, the R/V Raritan, was positioned using a Trimble NT200D Differential Global Positioning Receiver (DGPR). Collection of sediment was performed using a Rossfelder P-3 vibracore with flexible plastic core liners. Each core taken was inspected and its characteristics were recorded on a sediment core log. Photographs were taken of each core; photographs are provided in Appendix B. Upon arrival at ASI, all samples were logged in and assigned a unique sample number (Table 1). Samples were received in good condition at ASI in Flemington, NJ and stored at 2◦C to 4◦C. All supporting documentation, including chains-of-custody and sample use forms can be found in Volume II (Appendices A-H). There were three control sediment samples and one reference sediment used in the biological bioassays. The Sandy Hook Control sediment (ASI ID # 20120081) was obtained from the Gateway National Recreation Area, Atlantic Highlands, NJ, on February 7, 2012. The Tuckerton Control sediment (ASI ID # 20120080) was obtained from Tuckerton Creek at the third bridge, Tuckerton, NJ, on February 6, 2012. The Mud Dump Reference sediment (ASI ID # 20120079) was obtained from the ACOE-designated area six miles off of the coast of Sandy Hook, NJ on February 3, 2012 (Geodetic coordinates 40° 20.240 N, 73° 52.148 W). Amp Control Sediment (ASI ID # 20120177) was supplied by the organism supplier, Brezina and Associates. The Amp Control was used for the A. abdita solid phase bioassay. The Sandy Hook Control was used for the A. bahia solid phase bioassay and the N. virens bioaccumulation bioassay. The Tuckerton Control was used for the M. nasuta bioaccumulation bioassay. The Mud Dump reference was used for the A. abdita and the A. bahia solid phase bioassays and the M. nasuta and N. virens bioaccumulation bioassays.
Prior to the initiation of testing, all control and reference sediments were sieved using a 1-mm Nytex screen (reference) or a 0.5-mm Nytex screen (control). For the A. abdita solid phase test, the reference sediment was

26
first sieved through a 1-mm Nytex screen and then press-sieved through a 0.5 Nytex screen to be certain no indigenous organisms were present. Test sediment was used unaltered. Manasquan water, obtained from Manasquan Inlet, NJ, was used as the overlay water and dilution water for all testing. This water was tested according to ASTM guidelines to ensure purity. The results of the latest water analysis and Sample Receiving Logs for both are included in Volume II (Appendix E).
B. Homogenizing and Compositing
Each sediment sample was carefully homogenized using a stainless steel mixer following specific guidelines found on pages 9-11 and Appendix A of the Dredging Manual and according to ASI’s standard operating procedure SOP/PRP/008. Samples were mixed until uniform in color and texture. These homogenized core samples were then combined using the same methodology to form the HARS composite samples. Sample identification numbers and the compositing scheme for the composites are provided in Table 1.
C. Chemical Analyses A subsample of each of the composites were shipped to Battelle, Duxbury, MA, and Battelle Marine Sciences Laboratory, Sequim, WA, along with the site water sample for chemical analysis as required by the NYD/USACE. Following chain-of-custody procedures, samples were placed in glass jars and shipped by overnight courier in coolers with ice packs.
D. Physical Analysis and Total Organic Carbon
Sub-samples of all sediments were analyzed by ASI personnel for physical analyses. These sediments include the following: each homogenized core, the HARS composite samples, the Sandy Hook, Tuckerton, and Brezina Controls, and the Mud Dump Reference sediments. Percent moisture and grain size distribution analyses were performed in accordance with the Standard Test Method for Particle-Size Analysis of Soils, Designation: D422-63, Re-approved 2002 [ASTM, 2002].
Total Organic Carbon (TOC) was determined based on the guidance from EPA Office of Solids Waste and Emergency Response SW-846 Method No. 9060 (Volume IC, Chapter 5, Revision 0, 9/86) [EPA, 1986]. The instrument used for this analysis was the Dohrmann TOC Boat Sampler, Model 183 (serial number 98202003), which was connected to the Dohrmann Apollo 9000 TOC Analyzer.

27
Additionally, ASI analyzed the composite samples for Bulk Density [Blake, 1986], Specific Gravity [APHA, 1995] and Atterberg Limits (plastic and liquid limits) [ASTM, 1995]. The elutriate used in the A. bahia and M. beryllina suspended particulate phase bioassays was analyzed for total suspended solids (Table 5). Results of the percent moisture, grain size distribution and TOC analyses are provided in Tables 4a and 4b. Results of the bulk density, specific gravity, Atterberg limits and total suspended solids are provided in Table 5.
E. Solid Phase Testing
Whole sediment toxicity of the composite sediments was assessed through 10-day exposures with the amphipod, A. abdita and Mysid shrimp, A. bahia in solid phase bioassays [ASTM, 1999].
After ten days of exposure to the composite, live count data from the solid phase tests for both species were entered into a spreadsheet, sorted and tabulated. Water quality and physical parameters were also monitored. Final live counts and water quality parameter tables can be found at the end of this report. Standard reference toxicant tests were performed for both A. bahia and A. abdita and reference toxicant data were entered into a program based on currently accepted methods for calculating an LC50. The LC50 for each species fell within the 95% confidence limits of their respective control charts. Control charts can be found in Volume III (Biological Raw Data) along with SRT raw data. Ampelisca abdita The A. abdita used in testing were obtained from Brezina and Associates, Inc. Dillon Beach,California. Organisms were held for 8 days prior to testing; during this time they were acclimated to test temperature and salinity. The initial pore water ammonia readings for the composites was 33.6 mg/L for the Area 1A composite, 29.7 mg/L for Area 1B composite, 28.5 for Area 1C composite and 35.3 for the Area 2 composite. These values exceed the 20.0 mg/L threshold established by Davies et al, [Davies, 1993]. The exposure chambers for all four composites underwent pretest purging for eight days to reduce the total ammonia in the pore water to 19.3 mg/L for Area 1A, 18.0 for Reach 1B, 16.9 for Area 1C and 17.1 for Area 2.

28
Americamysis bahia
The A. bahia used in testing were 5-day-old juveniles, and were obtained from Aquatic Research Organisms, Hampton, NH. The unionized ammonia values in the overlay water of the composites were calculated for day 0 of the 10-day solid phase tests with A. bahia. The average initial unionized ammonia in the overlay water was 0.06 mg/L (Area 1A), 0.04 mg/L (Area 1B), 0.04 mg/L (Area 1C), and 0.05 mg/L (Area 2). None of these values exceeded the 0.6 mg/L threshold established by the USEPA for a pH of 7.9-8.0, and 0.3 mg/L for a pH of 7.5 [Southerland, 1994]. A static renewal toxicity test was also set up and run at the same time as the static test.
F. Suspended Particulate Phase Testing
Menidia beryllina, Americamysis bahia and Mytilus edulis
Toxicity of elutriates prepared from the composites were assessed through 48- and 96-hour suspended particulate phase toxicity tests using three test species, the inland silverside, M. beryllina, the Mysid shrimp, A. bahia, and the blue mussel, M. edulis.
The M. beryllina used for testing were 14 days old, and were obtained from Aquatic Research Organisms, Hampton, NH. The A. bahia used for testing were 5-day-old juveniles obtained from Aquatic Research Organisms, Hampton, NH. The M. edulis used for testing were fertile adults of various ages, and were obtained from Carlsbad Aquafarm, Carlsbad, CA.
All four area composite elutriates needed to be centrifuged in order to observe organisms in solution. Before determining centrifuging was necessary, the mixed elutriate was allowed to settle for greater than 60 minutes. For further detail please see the mix out specifics as well as photo documentation to support this decision in Appendix K.
After 96 hours of exposure to elutriate concentrates, final live count data were transferred into a spreadsheet, sorted and tabulated for M. beryllina and A. bahia. After 48 hours of exposure to elutriate concentrations, final live count and embryo development data for M. edulis were transferred into a spreadsheet and tabulated. LC50 and EC50 values were calculated using ToxCalc™ software or visual inspection of the data, as appropriate.

29
Standard reference toxicant tests were performed for M. beryllina, A. bahia, and M. edulis as cited in the work plan. Reference toxicant data were entered into ToxCalc™ and an LC50 was calculated. Control charts for each species as well as all supporting bioassay documentation can be found in Volume III (Biological Raw Data).
G. Bioaccumulation Testing
Macoma nasuta, Nereis virens The bioaccumulation of metals, pesticides, PCB congeners, semi volatiles, (1-4 dichlorobenzene), PAHs and dioxin/furans from the composites were assessed using 28-day exposures of the clam, M. nasuta and the sand worm, N. virens. Bioaccumulation testing was performed in accordance with the work plan. The M. nasuta used in testing were adults of various ages and were obtained from J & G Gunstone Clams, Inc., Port Townsend, WA. The N. virens used for testing were adults of various sizes, and were obtained from Aquatic Research Organisms, Hampton, NH. After 28-days of exposure to the composites, organisms were depurated overnight in clean Manasquan water. Tissue from each exposure chamber was placed in individual glass jars, weighed and frozen before sending to Battelle by overnight courier for chemical analysis. Tissue samples were archived by Battelle. Standard reference toxicant tests were performed for both species as cited in the work plan. Water quality and physical parameters were also monitored as per the work plan. The LC50 for both species fell within the 95% confidence limits of their respective control charts. A control chart for each species, as well as all supporting bioassay documentation data can be found in Volume III (Biological Raw Data).

30
IV. RESULTS AND DISCUSSION
Test results of all the bioassays as well as water quality parameters are summarized in the tables at the end of this volume. Raw data for physical characteristics are presented in Volume II and raw data for biological effects and water quality parameters are presented in Volume III. A. Solid Phase Testing
Ampelisca abdita
After 10 days, survival of A. abdita organisms exposed to the composites was as follows:
A. abdita Survival
Control Reference Area 1A Area 1B Area 1C Area 2
91% 91% 84% 87% 90% 95% In accordance with the 1991 Federal Guidance [USEPA, 1991], samples are considered toxic if survival of animals exposed to test sediment are at least 20% less than the survival observed in the reference sediment and this difference is statistically significant (p = 0.05) after a ten-day test period.
These results indicate that the composites are not acutely toxic to A. abdita.
Americamysis bahia
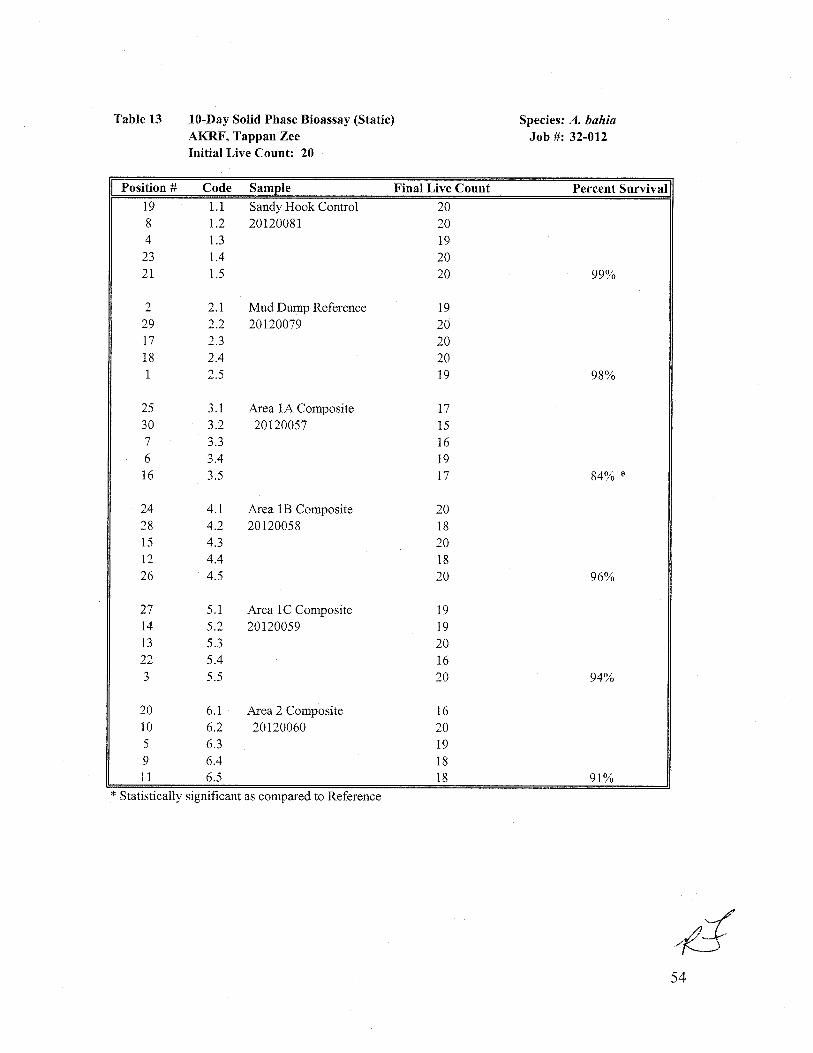
Static Non-renewal Bioassay After the 10-day static test, the survival of organisms exposed to Area 1A showed a statistically significant reduction in survival when compared to the organisms in the reference sediment. The unionized ammonias reached a high of 0.6 mg/L in the static test, therefore the static-renewal results are reported and thus do not show a statistically significant reduction in survival when compared to the organisms in the reference sediment.

31
After 10 days, survival of A. bahia organisms exposed to the composites was as follows: Static Non-renewal Bioassay
A. bahia Survival
Control Reference Area 1A Area 1B Area 1C Area 2
99% 98% 84% * 96% 94% 91% Static Renewal Bioassay
A. bahia Survival
Control Reference Area 1A Area 1B Area 1C Area 2
99% 96% 97% 99% 96% 96% In accordance with the 1991 Federal Guidance [USEPA, 1991], samples are considered toxic if survival of animals exposed to test sediment are at least 10% less than the survival observed in the reference sediment and this difference is statistically significant (p = 0.05) after a ten-day test period. These results indicate that the composites are not acutely toxic to A. bahia.
B. Suspended Particulate Phase Testing Our technical people made the determination to centrifuge all the elutriate samples because it was clear that the solids were not going to settle out during the test and therefore would remain suspended in the water column making observation of the test organisms impossible. The pictures in Appendices K and L support our beliefs.
Menidia beryllina After 96 hours, M. beryllina exposed to the suspended particulate phase elutriates resulted in the following survival and LC50 results:
M. beryllina Survival Concentration Area 1A Area 1B Area 1C Area 2
Control 90% 10 % 92% 91% 94% 93% 50 % 86% 92% 88% 96% 100 % 86% 82% 93% 88% LC50 >100% >100% >100% >100%
32
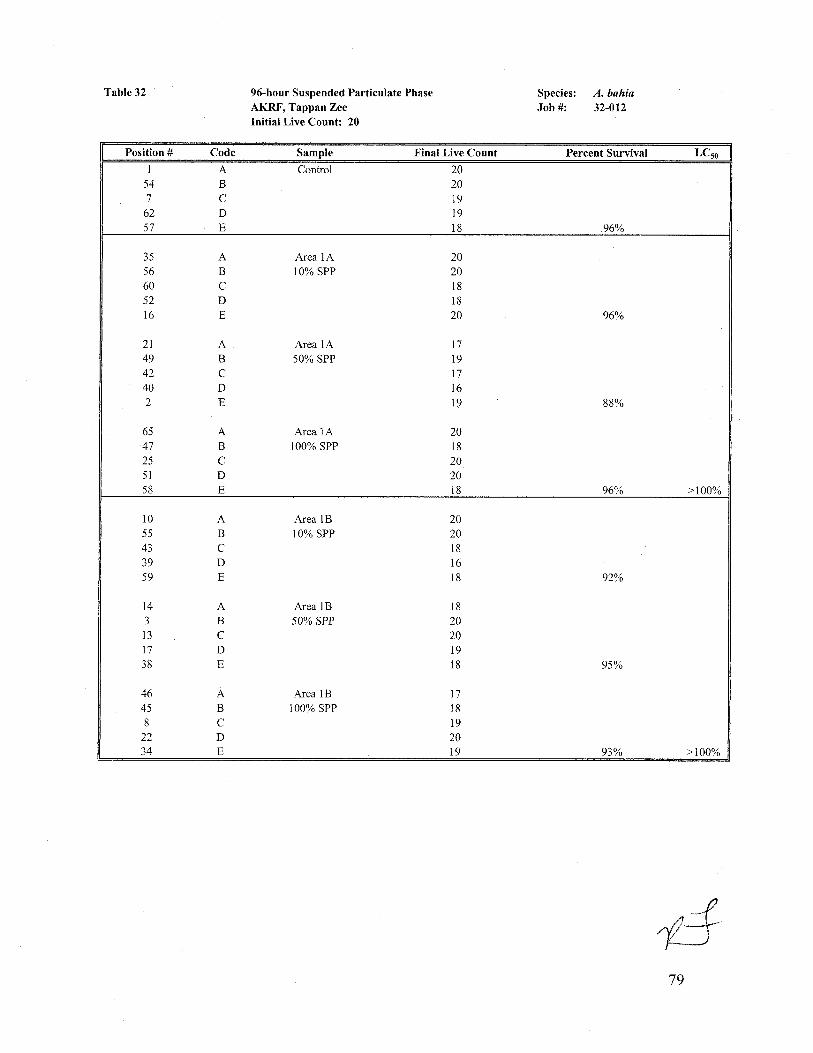
Americamysis bahia After 96 hours, A. bahia exposed to the suspended particulate phase elutriates resulted in the following survival and LC50 results:
A. bahia Survival Concentration Area 1A Area 1B Area 1C Area 2
Control 96% 10 % 96% 92% 89% 94% 50 % 88% 95% 93% 96% 100 % 96% 93% 93% 97% LC50 >100% >100% >100% >100%
Mytilus edulis The LC50 for survival and EC50 for development for the composites are as follows:
M. edulis Survival
Concentration Area 1A Area 1B Area 1C Area 2
Control 93.13% 10 % 92.94% 93.73% 95.12% 97.91% 50 % 86.07% 98.41% 89.25% 89.55% 100 % 69.25% 76.52% 70.95% 77.71%
LC50 (survival) >100% >100% >100% >100% EC50 (development) 57.3% 70.7% 70.1% 68.2%
Control survival was 90% or greater for both M. beryllina and A. bahia. The number of M. edulis control embryos that resulted in live larvae with completely developed shells at the end of the test was greater than 70%. Therefore, the SPP tests for all three organisms passed the criteria for control survival.

33
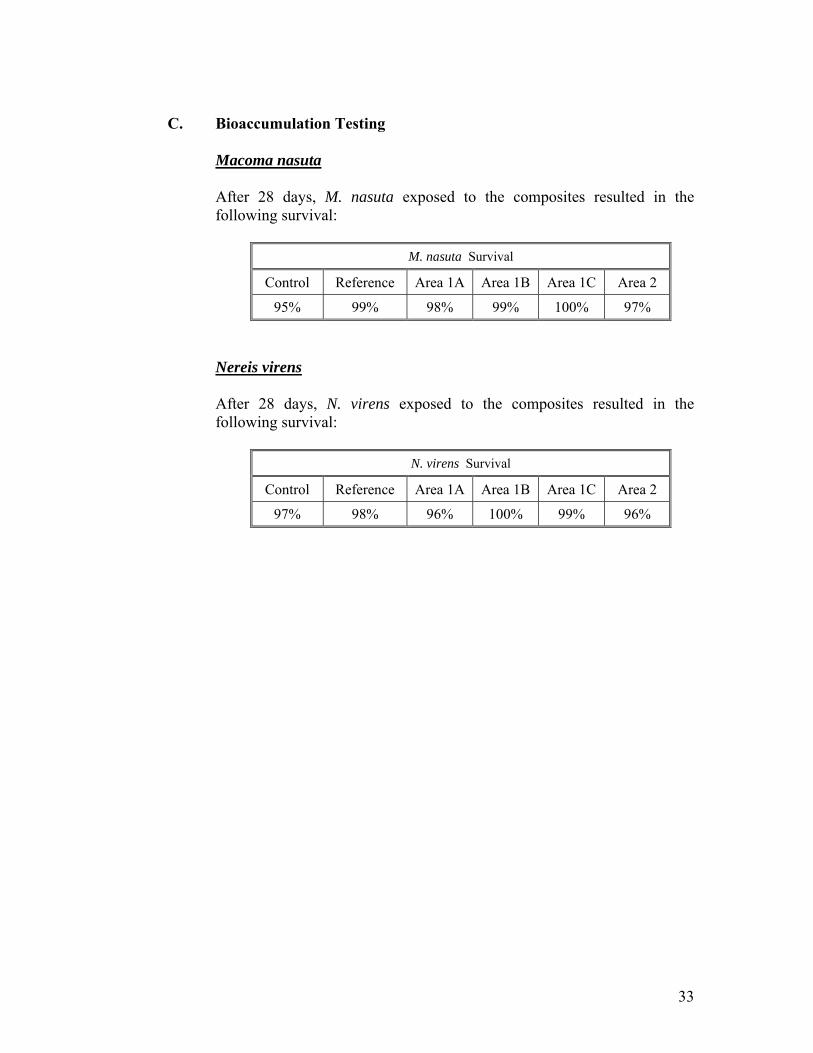
C. Bioaccumulation Testing
Macoma nasuta After 28 days, M. nasuta exposed to the composites resulted in the following survival:
M. nasuta Survival
Control Reference Area 1A Area 1B Area 1C Area 2
95% 99% 98% 99% 100% 97% Nereis virens After 28 days, N. virens exposed to the composites resulted in the following survival:
N. virens Survival
Control Reference Area 1A Area 1B Area 1C Area 2
97% 98% 96% 100% 99% 96%

34
V. REFERENCES
1. USEPA/USACE, 1991. Evaluation of Dredged Material Proposed for Ocean Disposal, USEPA/ACOE, Washington, DC. EPA-503/8-91/001.
2. USEPA/NYACE, 1992. Draft Guidance for Performing Tests on Dredged
Material Proposed for Ocean Disposal. EPA Region II/ACOE New York District (Water Quality Compliance Section), New York, NY.
3. ASTM D422-63, Standard Test Method for Particle-Size Analysis of Soils, ASTM
1963, (reapproved 2002).
4. EPA Office of Solid Wastes & Emergency Response SW-846 Method No. 9060, Volume IC, Chapter 5, Revision 0, 9/86.
5. Blake G.R. and K. H. Hartge. 1986. ΑBulk Density≅. In Klute, A. (ed) 1986.
Methods of Soil Analysis Part I. Physical and Mineralogical Methods Bulk Density. 2nd ed. American Society of Agronomy, pp 363-375.
6. APHA, 1995. Standard Methods for the Examination of Water and Wastewater, APHA/AWWA/WPCF. Method 2710 F. Specific Gravity. pp 2-80.
7. ASTM D4318-00, Standard Test Methods for Liquid Limit, Plastic Limit, and
Plasticity Index of Soils, 2000.
8. ASTM, 1999. Standard Guide for Conducting 10-Day Sediment Toxicity Tests with Marine and Estuarine Amphipods, E1367-99. American Society of Testing and Materials, Philadelphia, PA.
9. T. Davies, D. Davis, and J. Elmore to EPA Regional Ocean Dumping
Coordinators, EPA Regional Wetland Coordinators, and Corps of Engineers Regulatory and Civil Works Elements, 1993. “Technical Panel Recommendations Concerning Use of Acute Amphipod Tests in Evaluation of Dredged Material”. Draft Letter. [Photocopy]. New York District, Army Corps of Engineers, New York, NY.
10. Southerland, Elizabeth to Mario P. Del Vicario, June 14, 1994.
“Recommendations for Conducting Sediment Toxicity Test with Mysidopsis bahia when Ammonia may be Present at Toxic Levels”. [Photocopy]. New York, NY.
.

35
Figure 1 Site Map

36
Figure 2 Site Map