Embed Size (px)
Citation preview
CONTENTS
INTRODUCTION
CHAPTER 1 NATIVE STARCH INDUSTRY IN THAILAND 1-1
1.1 BACKGROUND INFORMATION 1-1 1.2 MANAGEMENT OF ENVIRONMENTAL IMPACTS FROM
NATIVE STARCH INDUSTRY 1-5 1.3 BUSINESS PERSPECTIVES IN NATIVE STARCH INDUSTRY
IN THAILAND 1-7
CHAPTER 2 NATIVE STARCH PRODUCTION PROCESS
& MATERIAL FLOWS 2-1
2.1 NATIVE STARCH PRODUCTION PROCESS 2-1 2.2 MATERIAL FLOW 2-6
CHAPTER 3 INTRODUCTION TO MIS APPLICATION 3-1
3.1 BACKGROUND 3-1 3.2 OBJECTIVES OF MIS APPLICATION 3-1 3.3 BENEFITS OF MIS APPLICATION 3-2 3.4 MIS PRINCIPLES 3-2
CHAPTER 4 APPLYING MIS PROCESS TO NATIVE STARCH
INDUSTRY 4-1
4.1 PRODUCTION PROCESS MODEL 4-1 4.2 DATA COLLECTION AND CONSOLIDATION 4-2 4.3 DATA PROCESSING 4-18 4.4 INFORMATION REPORTING & ANALYSIS 4-24
LIST OF TABLES
Table 1.1a Plantation Area, Production, Yield, Farm Price and
Farm Value of Tapioca in Thailand (1996-2005) 1-1 Table 1.1b Plantation Area of Tapioca in Each Province (2002 – 2005) 1-1 Table 1.1c Native Starch Factories in Thailand 1-3 Table 1.2a Examples of Eco-efficiency Improvement 1-5 Table 3.4a Suggested Tools for MIS Implementation with
their Pros and Cons 3-14 Table 4.2a Proposed Data Collection Scheme for Material
Preparation Section (Section#1) of
Native Starch Production 4-6 Table 4.2b Proposed Data Collection Scheme for Extraction and
Drying Section (Section#2) of Native Starch Production 4-9 Table 4.2c Proposed Data Collection Scheme for Wastewater
Treatment and Biogas System Section (Section#3)
of Native Starch Production 4-12 Table 4.2d Proposed Data Collection Scheme for Utility Section
(Section# 4) of Native Starch Production 4-15 Table 4.3a Management Information derived from
Data Processing 4-19 Table 4.4a Summary of Management Information 4-27
LIST OF FIGURES
Figure 1.1a Native Starch Factory Distribution 1-3 Figure 1.1b Location of Native Starch Factories in Thailand 1-4 Figure 2.1a Standard Native Starch Production Process 2-2 Figure 2.2a Material Flow of Native Starch 2-7 Figure 2.2b Material Flow of Water 2-8 Figure 2.2c Material Flow of Energy 2-9 Figure 3.4a General MIS Information Flow Diagram 3-8 Figure 3.4b Examples of Tools Used for MIS Process 3-13 Figure 4.1a Production Process Model for Native Starch Industry 4-4 Figure 4.2a Locations of Data Collection in Material Preparation (Section#1) 4-5 Figure 4.2b Locations of Data Collection in Extraction and
Drying Section (Section#2) 4-8 Figure 4.2c Locations of Data Collection in Wastewater Treatment
and Biogas System Section (Section#3) 4-11 Figure 4.2d Location of Data Collection in Utility Section (Section#4) 4-14
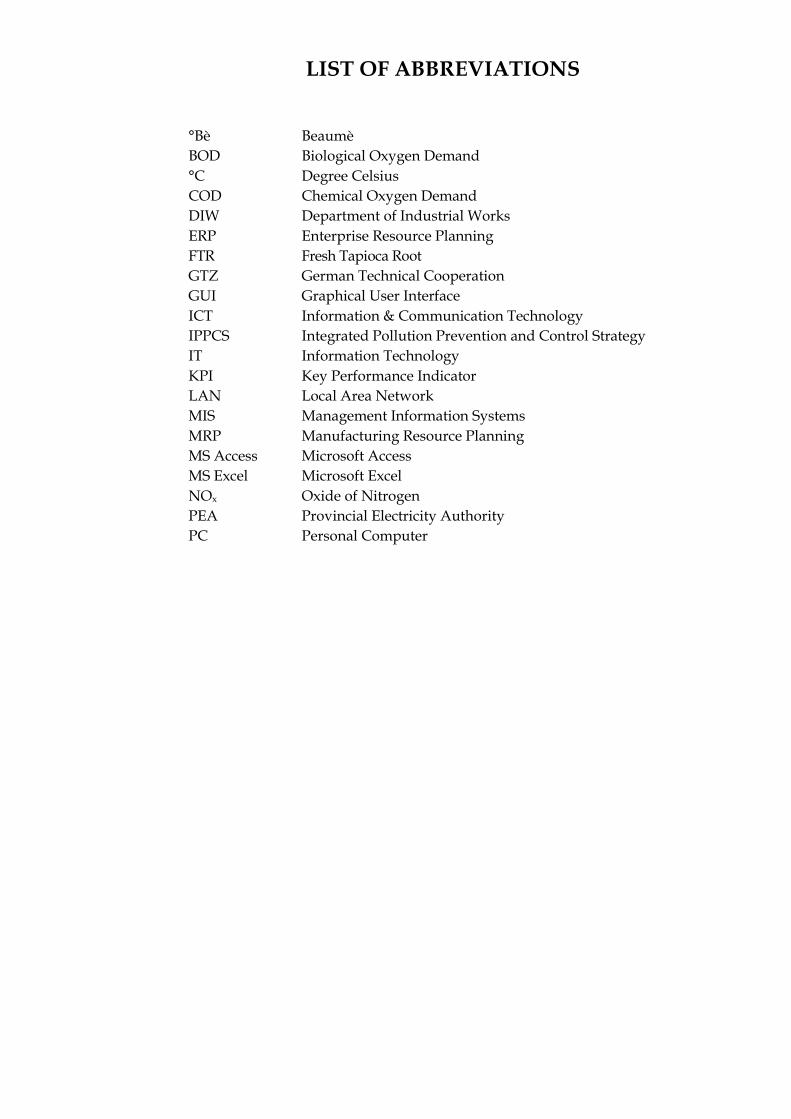
LIST OF ABBREVIATIONS
°Bè Beaumè
BOD Biological Oxygen Demand
°C Degree Celsius
COD Chemical Oxygen Demand
DIW Department of Industrial Works
ERP Enterprise Resource Planning
FTR Fresh Tapioca Root
GTZ German Technical Cooperation
GUI Graphical User Interface
ICT Information & Communication Technology
IPPCS Integrated Pollution Prevention and Control Strategy
IT Information Technology
KPI Key Performance Indicator
LAN Local Area Network
MIS Management Information Systems
MRP Manufacturing Resource Planning
MS Access Microsoft Access
MS Excel Microsoft Excel
NOx Oxide of Nitrogen
PEA Provincial Electricity Authority
PC Personal Computer
Department of Industrial Works MIS Guideline for Eco-efficiency Improvement
INTRODUCTION
The Department of Industrial Works (DIW) is implementing the project on
Management Information Systems (MIS) for Industrial Pollution Prevention
and Control Project, supported by German Technical Cooperation (GTZ).
Main objectives of the MIS Project are to establish environmental information
database at the DIW, to introduce an MIS for improving eco-efficiency of
selected industries, to make consultancy services available to industries
locally, and to establish public information centre on industrial pollution.
As part of the MIS Project, ERM-Siam has been commissioned to undertake
a study on “Elaboration of User Requirements and Capacity Assessment of
Palm Oil and Native Starch Industries”. The study results provide necessary
inputs for the design and development of MIS for enhancing competitiveness
and eco-efficiency for these two industries. One element of the study tasks by
ERM-Siam is to establish MIS guideline for improving eco-efficiency for palm
oil and native starch industries.
Scope of this guideline addresses the application of MIS for eco-efficiency
improvement for native starch industry. The principal objectives of this
guideline are:
• To allow management representatives of native starch factories to realise
the importance, principles and benefits of using MIS for improving
eco-efficiency and enhancing business competitiveness;
• To encourage native starch factories for collecting and analysing
eco-efficiency data, and making use of information to aide decision-
making of the management; and
• To provide introductory guidance for applying MIS for improving
eco-efficiency in native starch industry.
Contents of this MIS guideline comprise background information on native
starch industry in Thailand, standard production process and material flows,
MIS introduction, MIS principles and MIS application for native starch
industry.
Aim of the guideline is to support the development and implementation of
a meaningful MIS for improving environmental performance and
eco-efficiency in native starch industry.
For further information, please feel free to contact the Bureau of Water
Technology and Industrial Pollution Management of the Department of
Industrial Works, Ministry of Industry.

Chapter 1
Native Starch Industry
in Thailand
Department of Industrial Works MIS Guideline for Eco-efficiency Improvement
1-1
1 NATIVE STARCH INDUSTRY IN THAILAND
1.1 BACKGROUND INFORMATION
Tapioca starch production is recognised as one of the most important agro-
industries to the Thai economy. Tapioca starch is extracted from the root of
the cassava plant, which has an ability to grow in low-nutrient soils where
other crops do not grow well. Also, the cassava plant can tolerate drought.
Cassava roots can be stored in the ground for up to 24 months, and some
varieties for up to 36 months, thus harvest may be delayed until market,
processing, or other conditions are favourable.
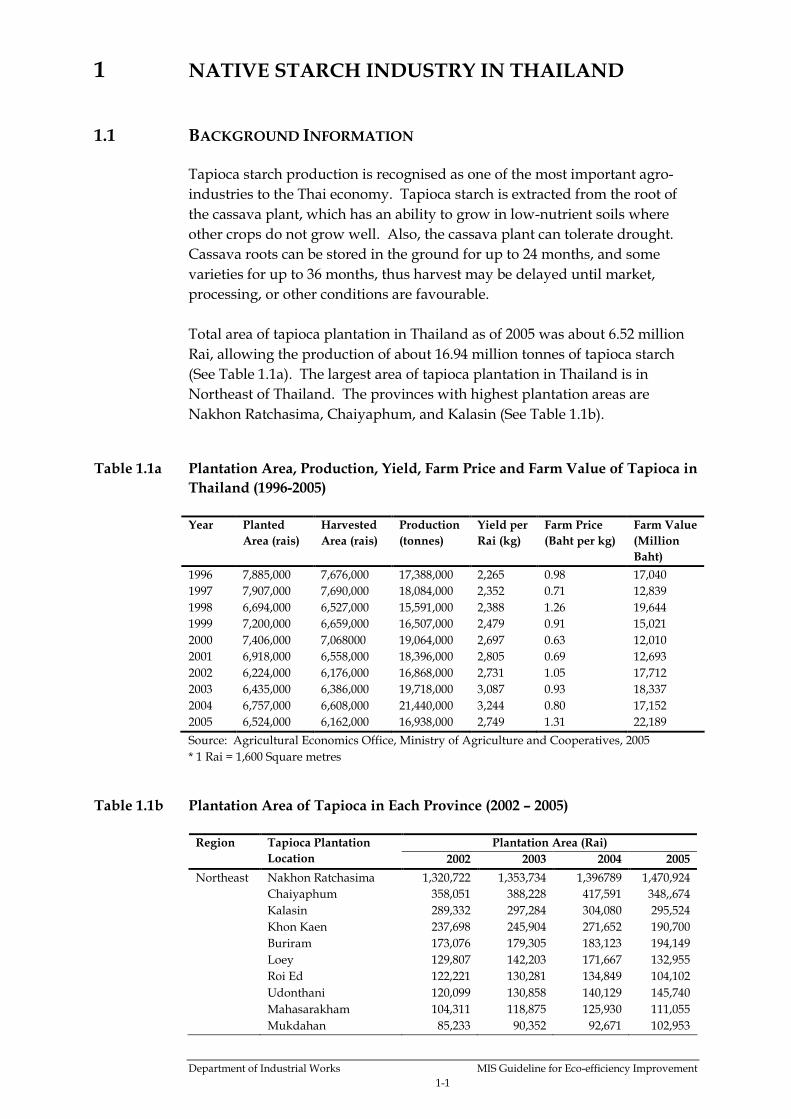
Total area of tapioca plantation in Thailand as of 2005 was about 6.52 million
Rai, allowing the production of about 16.94 million tonnes of tapioca starch
(See Table 1.1a). The largest area of tapioca plantation in Thailand is in
Northeast of Thailand. The provinces with highest plantation areas are
Nakhon Ratchasima, Chaiyaphum, and Kalasin (See Table 1.1b).
Table 1.1a Plantation Area, Production, Yield, Farm Price and Farm Value of Tapioca in
Thailand (1996-2005)
Year Planted
Area (rais)
Harvested
Area (rais)
Production
(tonnes)
Yield per
Rai (kg)
Farm Price
(Baht per kg)
Farm Value
(Million
Baht)
1996 7,885,000 7,676,000 17,388,000 2,265 0.98 17,040
1997 7,907,000 7,690,000 18,084,000 2,352 0.71 12,839
1998 6,694,000 6,527,000 15,591,000 2,388 1.26 19,644
1999 7,200,000 6,659,000 16,507,000 2,479 0.91 15,021
2000 7,406,000 7,068000 19,064,000 2,697 0.63 12,010
2001 6,918,000 6,558,000 18,396,000 2,805 0.69 12,693
2002 6,224,000 6,176,000 16,868,000 2,731 1.05 17,712
2003 6,435,000 6,386,000 19,718,000 3,087 0.93 18,337
2004 6,757,000 6,608,000 21,440,000 3,244 0.80 17,152
2005 6,524,000 6,162,000 16,938,000 2,749 1.31 22,189
Source: Agricultural Economics Office, Ministry of Agriculture and Cooperatives, 2005 * 1 Rai = 1,600 Square metres
Table 1.1b Plantation Area of Tapioca in Each Province (2002 – 2005)
Region Plantation Area (Rai)
Tapioca Plantation
Location 2002 2003 2004 2005
Northeast Nakhon Ratchasima 1,320,722 1,353,734 1,396789 1,470,924
Chaiyaphum 358,051 388,228 417,591 348,,674
Kalasin 289,332 297,284 304,080 295,524
Khon Kaen 237,698 245,904 271,652 190,700
Buriram 173,076 179,305 183,123 194,149
Loey 129,807 142,203 171,667 132,955
Roi Ed 122,221 130,281 134,849 104,102
Udonthani 120,099 130,858 140,129 145,740
Mahasarakham 104,311 118,875 125,930 111,055
Mukdahan 85,233 90,352 92,671 102,953
Department of Industrial Works MIS Guideline for Eco-efficiency Improvement
1-2
Region Plantation Area (Rai)
Tapioca Plantation
Location 2002 2003 2004 2005
Ubon Ratchathani 70,954 75,067 79,803 68,765
Sakon Nakhon 63,529 65,093 70,498 66,689
Nongkhai 55,180 58,958 65,787 44,417
Sri Saket 43,566 47,711 51,379 53,344
Surin 42,381 43,137 45,981 36,757
Yasothorn 39,711 41,699 42,383 43,634
Nhongbualamphoo 36,121 38,629 51,481 38,566
Amnaj Chareon 31,289 30,558 34,619 31,411
Nakhon Phanom 16,465 16,570 18,649 12,270
East Chacheonsao 362,537 365,636 366,332 314,540
Chonburi 297,705 303,117 312,969 275,620
Chanthaburi 229,813 229,779 238,937 223,213
Rayong 209,628 215,918 213,540 227,046
Trad 7,212 4,128 3,676 -
Central Srakaew 339,090 345,873 362,728 356,914
Kanchanaburi 202,548 209,472 230,613 248,796
Uthaithani 150,217 161,622 171,827 179,084
Prachinburi 107,569 112,499 117,917 147,909
Ratchaburi 92,717 99,213 102,829 90,805
Chainath 63,571 66,498 74,394 68,993
Lopburi 55,956 63,328 78,108 89,828
Suphanburi 17,963 23,578 27,141 26,181
Saraburi 8,277 9,439 10,682 20,304
Petchburi 3,811 4,373 4,685 3,204
North Kampangpetch 348,648 323,531 330,985 371,145
Pisanuloke 185,341 186,705 183,599 147,337
Nakhon Sawan 146,614 154,807 164,506 188,277
Petchabul 22,695 25,253 26,884 21,482
Chiangrai 16,190 18,108 19,013 4,596
Uttaradith 4,798 5,181 5,553 11,102
Pichit 4,108 4,544 3,312 3,507
Nan 4,082 4,336 4,410 5,985
Prae 998 1,062 1,230 1,515
Tak 853 1,113 1,119 1,894
Sukhothai 560 622 624 823
Payao 383 434 460 538
Lampang 234 283 280 630
Source: Agricultural Economics Office, Ministry of Agriculture and Cooperatives, 2005
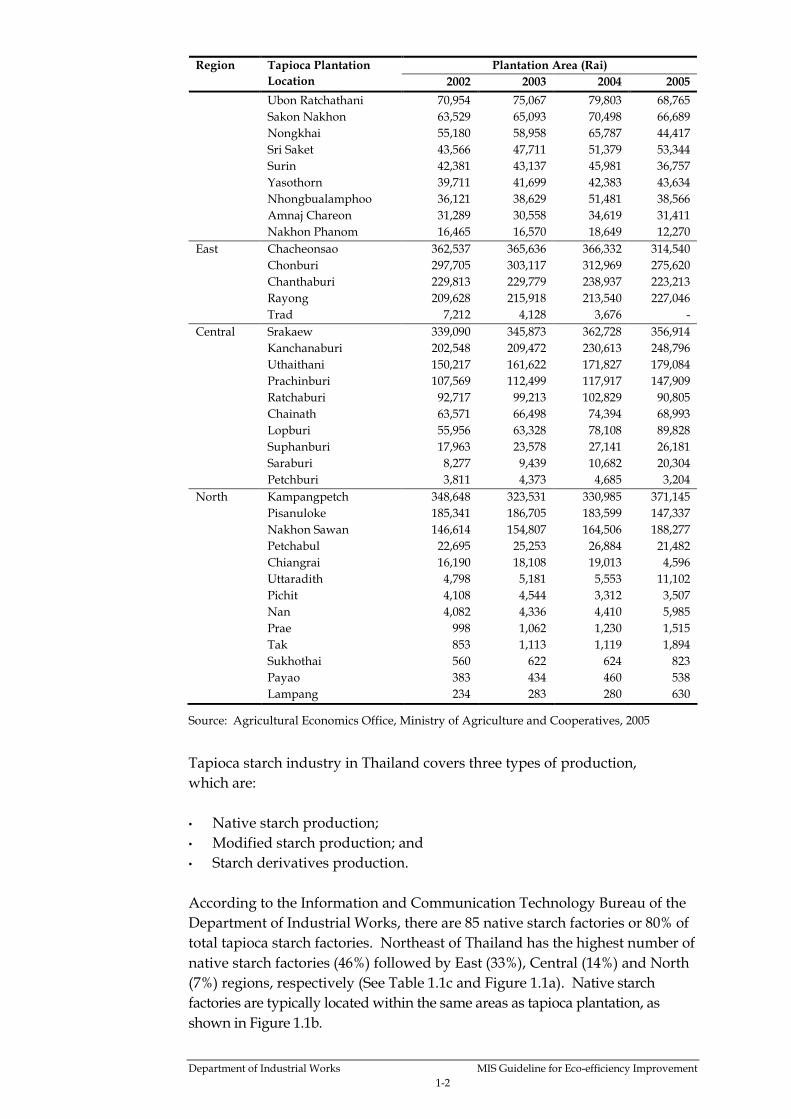
Tapioca starch industry in Thailand covers three types of production,
which are:
• Native starch production;
• Modified starch production; and
• Starch derivatives production.
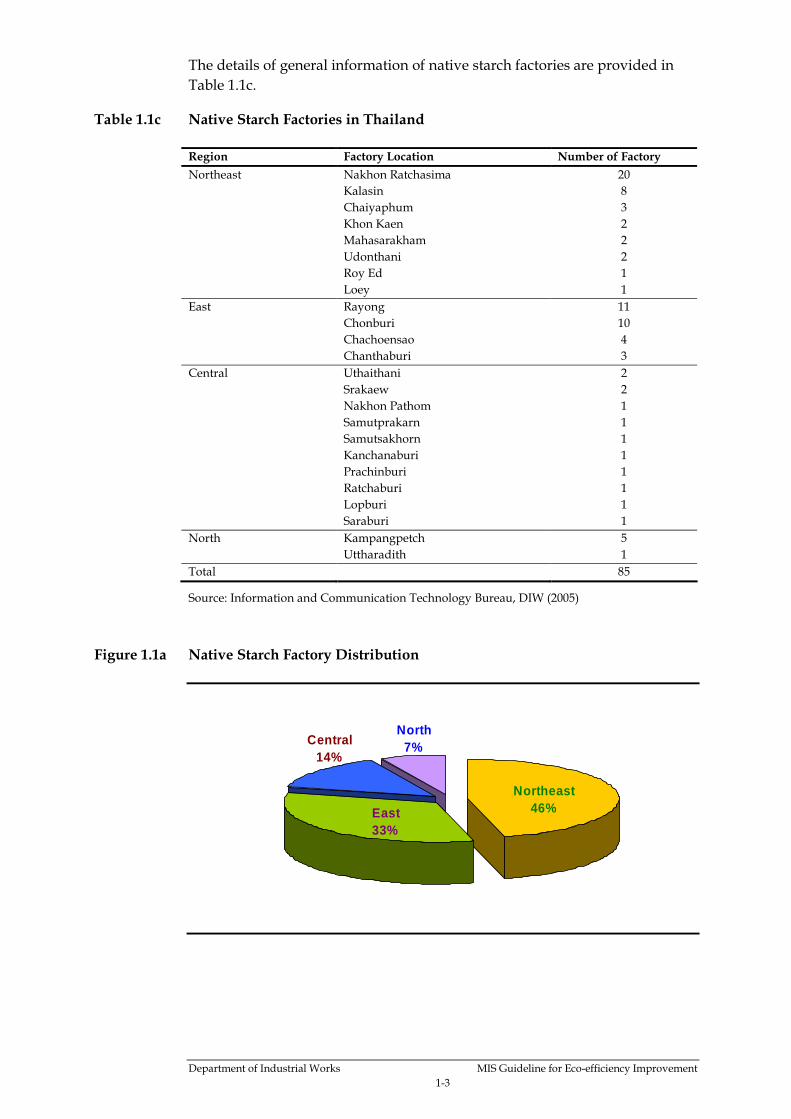
According to the Information and Communication Technology Bureau of the
Department of Industrial Works, there are 85 native starch factories or 80% of
total tapioca starch factories. Northeast of Thailand has the highest number of
native starch factories (46%) followed by East (33%), Central (14%) and North
(7%) regions, respectively (See Table 1.1c and Figure 1.1a). Native starch
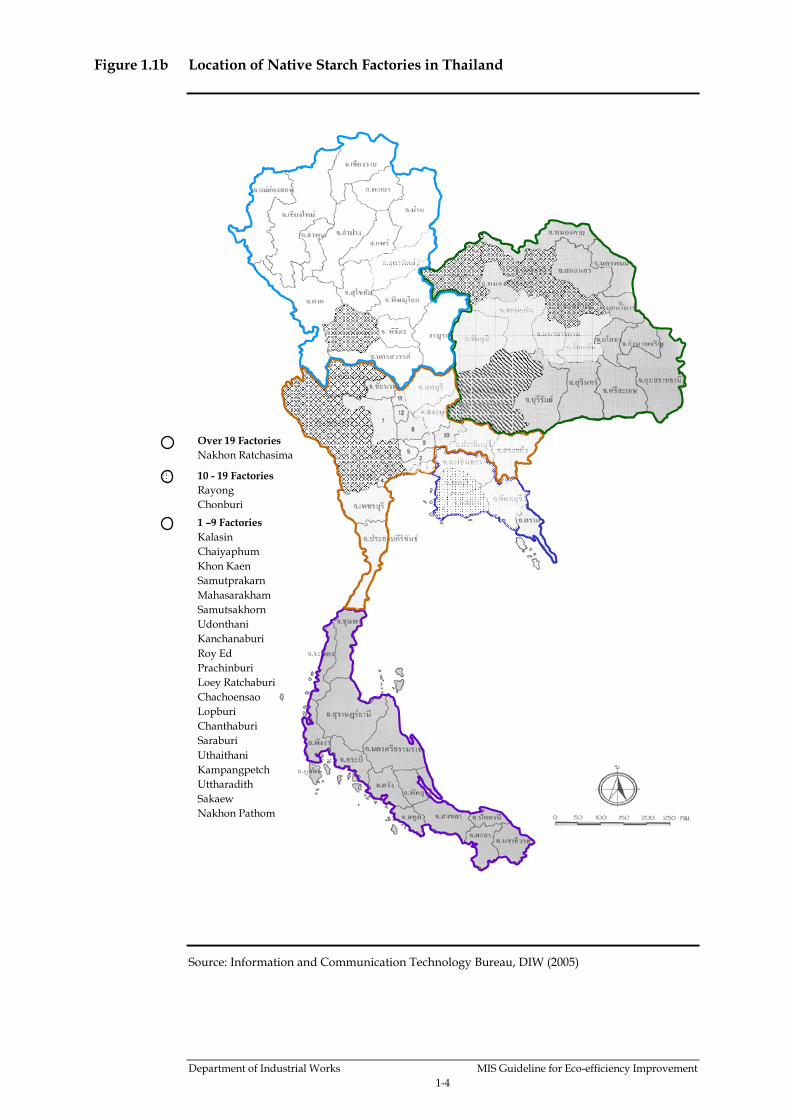
factories are typically located within the same areas as tapioca plantation, as
shown in Figure 1.1b.
Department of Industrial Works MIS Guideline for Eco-efficiency Improvement
1-3
The details of general information of native starch factories are provided in
Table 1.1c.
Table 1.1c Native Starch Factories in Thailand
Region Factory Location Number of Factory
Northeast Nakhon Ratchasima 20
Kalasin 8
Chaiyaphum 3
Khon Kaen 2
Mahasarakham 2
Udonthani 2
Roy Ed 1
Loey 1
East Rayong 11
Chonburi 10
Chachoensao 4
Chanthaburi 3
Central Uthaithani 2
Srakaew 2
Nakhon Pathom 1
Samutprakarn 1
Samutsakhorn 1
Kanchanaburi 1
Prachinburi 1
Ratchaburi 1
Lopburi 1
Saraburi 1
North Kampangpetch 5
Uttharadith 1
Total 85
Source: Information and Communication Technology Bureau, DIW (2005)
Figure 1.1a Native Starch Factory Distribution
East33%
Central14%
North7%
Northeast46%
Department of Industrial Works MIS Guideline for Eco-efficiency Improvement
1-4
Figure 1.1b Location of Native Starch Factories in Thailand
Source: Information and Communication Technology Bureau, DIW (2005)
Over 19 Factories
Nakhon Ratchasima
10 - 19 Factories
Rayong
Chonburi
1 –9 Factories
Kalasin
Chaiyaphum
Khon Kaen
Samutprakarn
Mahasarakham
Samutsakhorn
Udonthani
Kanchanaburi
Roy Ed
Prachinburi
Loey Ratchaburi
Chachoensao
Lopburi
Chanthaburi
Saraburi
Uthaithani
Kampangpetch
Uttharadith
Sakaew
Nakhon Pathom
Department of Industrial Works MIS Guideline for Eco-efficiency Improvement
1-5
1.2 MANAGEMENT OF ENVIRONMENTAL IMPACTS FROM NATIVE
STARCH INDUSTRY
Native starch production is characterised by its generation of substantial
amount of by-products. In regard to the manufacturing of tapioca starch,
associated environmental impacts occur due to material preparation through
washing, peeling, and starch extraction. Typically, a ton of starch production
generates approximately 10 to 20 cubic metres of wastewater with high
organic loading (BOD load ≅ 55 - 200 kg, COD ≅ 130 - 400 kg, SS ≅ 40 - 140 kg,
total Phosphorus ≅ 0.2 - 0.6 kg and total Nitrogen ≅ 3 - 10 kg). Solid wastes,
i.e. peel, tails, stalks and pulp, are also are generated from the production
process.
Good environmental management is necessary to ensure sustainability of
the native starch industry. To achieve reduced environmental impacts from
native starch production, the environmental management practice has to be
integrated in the production process management system and include efficient
use of natural resources.
1.2.1 Considerations for Improvements of Production Process
Losses in the production process can be avoided by, for example controlling
the performance of refiner and pulper during starch refining and pulp
pressing to minimise starch loss in process wastewater and pulp, respectively.
Using inefficient types of equipment, insufficient machinery and plan
maintenance (incl. leakages/spillages) are major sources of starch loss in
the native starch factories. This can be improved by the introduction of
preventive maintenance schemes ensuring that all equipment and machinery
is in good condition at all times.
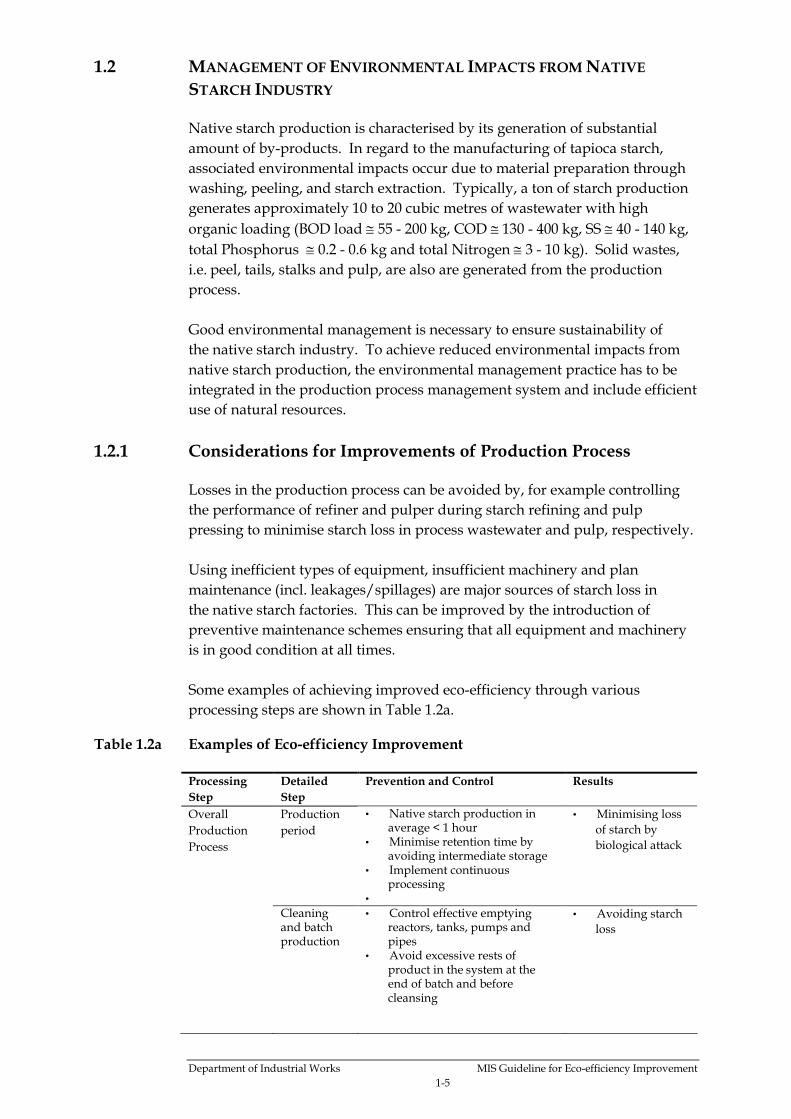
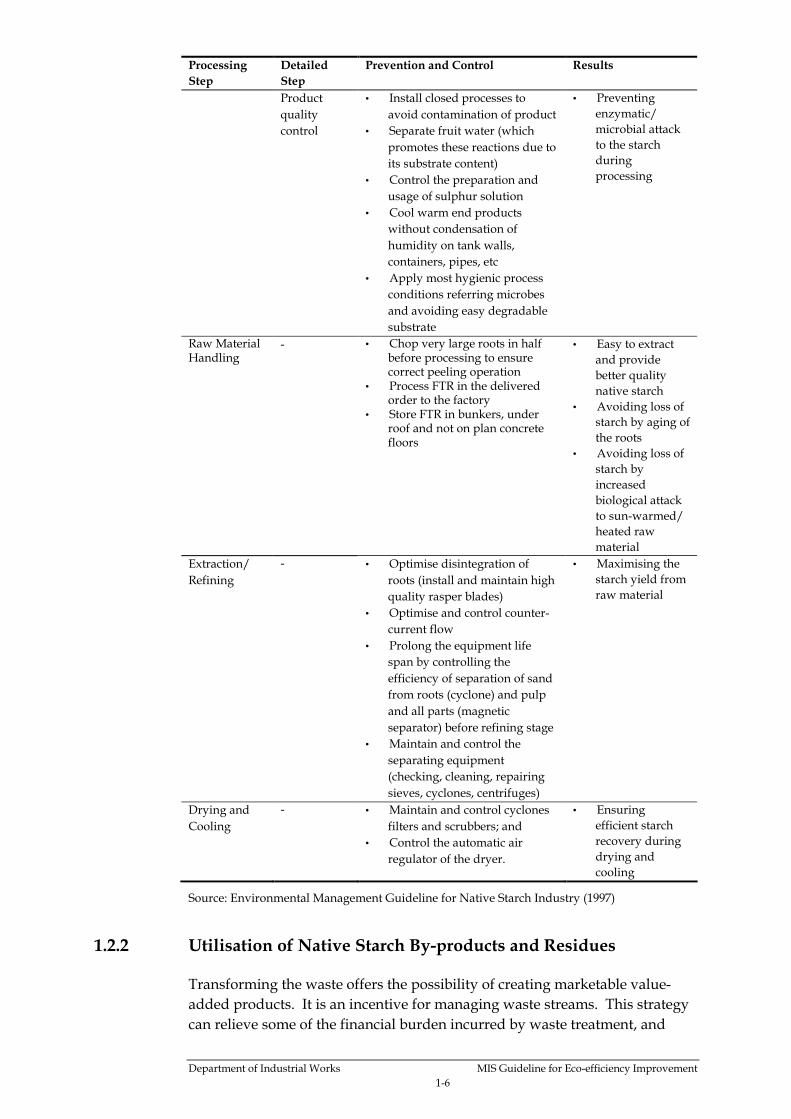
Some examples of achieving improved eco-efficiency through various
processing steps are shown in Table 1.2a.
Table 1.2a Examples of Eco-efficiency Improvement
Processing
Step
Detailed
Step
Prevention and Control Results
Overall
Production
Process
Production
period
• Native starch production in average < 1 hour
• Minimise retention time by avoiding intermediate storage
• Implement continuous processing
•
• Minimising loss
of starch by
biological attack
Cleaning and batch production
• Control effective emptying reactors, tanks, pumps and pipes
• Avoid excessive rests of product in the system at the end of batch and before cleansing
• Avoiding starch
loss
Department of Industrial Works MIS Guideline for Eco-efficiency Improvement
1-6
Processing
Step
Detailed
Step
Prevention and Control Results
Product
quality
control
• Install closed processes to
avoid contamination of product
• Separate fruit water (which
promotes these reactions due to
its substrate content)
• Control the preparation and
usage of sulphur solution
• Cool warm end products
without condensation of
humidity on tank walls,
containers, pipes, etc
• Apply most hygienic process
conditions referring microbes
and avoiding easy degradable
substrate
• Preventing
enzymatic/
microbial attack
to the starch
during
processing
Raw Material Handling
- • Chop very large roots in half before processing to ensure correct peeling operation
• Process FTR in the delivered order to the factory
• Store FTR in bunkers, under roof and not on plan concrete floors
• Easy to extract
and provide
better quality
native starch
• Avoiding loss of
starch by aging of
the roots
• Avoiding loss of
starch by
increased
biological attack
to sun-warmed/
heated raw
material
Extraction/
Refining
- • Optimise disintegration of
roots (install and maintain high
quality rasper blades)
• Optimise and control counter-
current flow
• Prolong the equipment life
span by controlling the
efficiency of separation of sand
from roots (cyclone) and pulp
and all parts (magnetic
separator) before refining stage
• Maintain and control the
separating equipment
(checking, cleaning, repairing
sieves, cyclones, centrifuges)
• Maximising the
starch yield from
raw material
Drying and
Cooling
- • Maintain and control cyclones
filters and scrubbers; and
• Control the automatic air
regulator of the dryer.
• Ensuring
efficient starch
recovery during
drying and
cooling
Source: Environmental Management Guideline for Native Starch Industry (1997)
1.2.2 Utilisation of Native Starch By-products and Residues
Transforming the waste offers the possibility of creating marketable value-
added products. It is an incentive for managing waste streams. This strategy
can relieve some of the financial burden incurred by waste treatment, and
Department of Industrial Works MIS Guideline for Eco-efficiency Improvement
1-7
simultaneously reduce pollution burden to the environment. Typically, in
native starch production, solid residues consist of sand, tails, stalks, peel, and
pulp. Liquid residue is wastewater generated from native starch production.
Generated sand is typically disposed onto the cultivate land or is disposed
offsite. Tails and stalks can be sold and used as organic fertiliser and soil
conditioner, as it maintains humidity of the soil.
Peel and pulp are generally sold to animal feed mills or to local farmers as
these materials can be utilised as media for mushroom cultivation.
In addition, the peel and pulp can be used as organic fertiliser and soil
conditioner as they help to maintain the humidity of the soil.
Details of the integrated environmental management approach in native
starch production including the “Integrated Pollution Prevention and Control
Strategy” (IPPCS) are provided in the Environmental Management Guideline for
Native Starch Industry – Department of Industrial Works (1997).
1.3 BUSINESS PERSPECTIVES IN NATIVE STARCH INDUSTRY IN
THAILAND
Thailand is recognised as the largest exporter of tapioca starch in the world (1).
Annual production capacity has increased from originally hundreds of
thousand to three million tonnes, and is expected to reach four million tonnes
in the near future. The export volume has reached one million and eight
hundred thousand tonnes per year. The significant export markets of
Thailand are China, Taiwan, Japan, Malaysia, Singapore, Philippines and
Indonesia. Some countries in Latin America also showed more interest in
tapioca starch from Thailand.
Over the past decades, the number of starch factories has increased to respond to
customers’ demands, and consequently native starch industry is becoming more
competitive. To stay competitive, native starch factories are required to assure
product quality, to offer competitive product pricing, as well as to be productive.
In recent years several governmental agencies has provided supports to native
starch industry to relief this pressure; for instance, thru an active technical and
financial promotion of biogas system application, and introduction of cleaner
technologies.
1.3.1 Introduction of Biogas System
A biogas system has been recently introduced to most native starch factories,
as its application is proven to be economically viable. Process wastewater
from the starch production process is used as input to a system to generate
biogases mainly methane. Biogases are then used as fuel to burner generating
(1) http://www.thaitapiocastarch.org [Accessed on 25th November 2005]
Department of Industrial Works MIS Guideline for Eco-efficiency Improvement
1-8
hot air, which is used for starch drying process. By using a biogas system,
consumption of bunker oil decreases, and wastewater loads to the existing
wastewater treatment plant also declines. The application of biogas system
can contribute in significant cost savings to the factory and help conserve
the natural resources.
1.3.2 Eco-efficiency Improvement
Eco-efficiency improvement is one of the industry initiatives that can help
native starch industry to stay competitive. Factories can gain benefits from
eco-efficiency improvement concerning profitability, cost reduction, better
management of environmental risks and liability, and meeting requirements
by customers and government agencies. However, at present most native
starch factories pay more attention to management of raw material and
product than eco-efficiency improvement, as the importance and benefits of
data collection and analysis for eco-efficiency improvement has not much
been realised by the industry
Chapter 2
Native Starch Production
Process & Material Flows
Department of Industrial Works MIS Guideline for Eco-efficiency Improvement
2-1
2 NATIVE STARCH PRODUCTION PROCESS &
MATERIAL FLOWS
2.1 NATIVE STARCH PRODUCTION PROCESS
The principle of native starch production process consists of extraction of
starch from root cell using water as an extractor (which finally is separated
and/or evaporated); and utilisation of high-speed centrifugal separator or
other appropriate equipment to separate protein and other matters from
starch. Starch quality is dependent upon extraction of high purity starch.
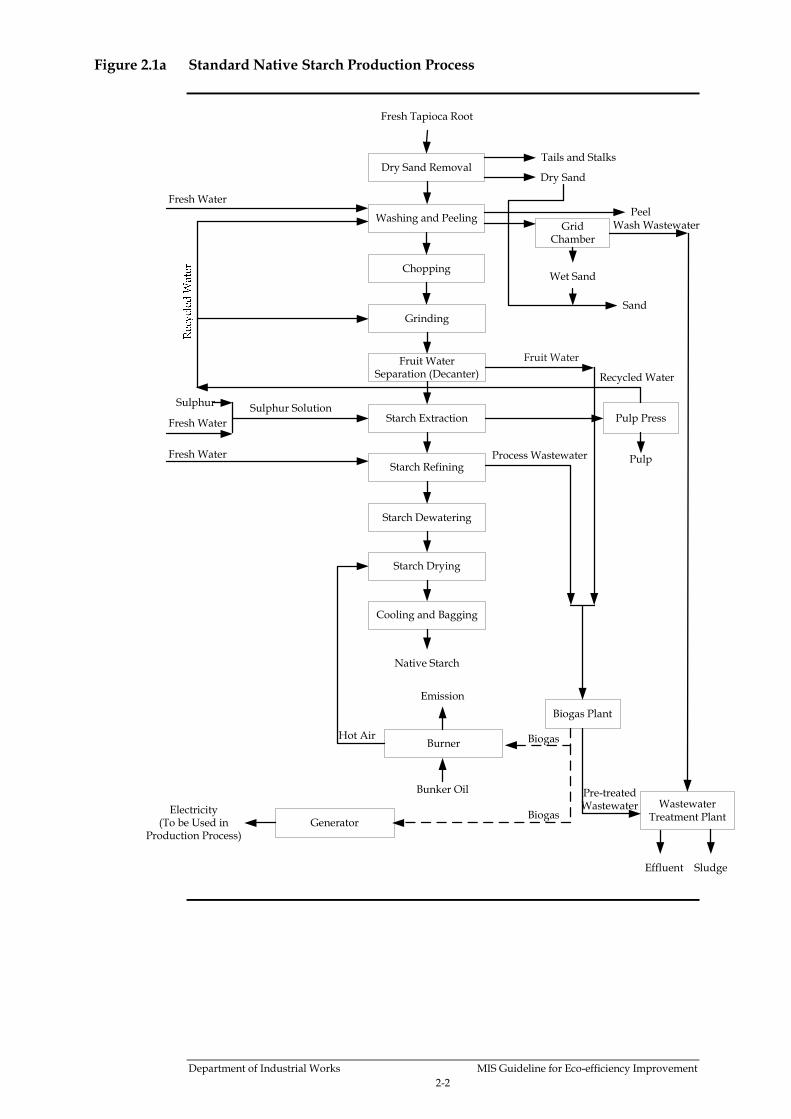
A schematic flow diagram of the standard native starch production process is
shown in Figure 2.1a. The details of the production process are described in
following sections.
2.1.1 Reception and Storage of Tapioca Root
Tapioca roots are weighted and tested for starch content using the buoyancy
principle (under water weight). The test of root is conducted to assess
the starch content and estimate the price. The roots are normally processed
within 24 hours to avoid loss of starch content due to fast enzymatic and
microbiological attack.
2.1.2 Preparation of Tapioca Root
Dry Sand Removal
Tapioca roots enter the dry sand removal drum to remove sand, soil and outer
peel. The residue from this process is solely solid. The generated amount
depends on the conditions of weather and location. Typically, average
residue is 20 kg/ton of root. In practice, the dry sand removal process does
not completely eliminate all stalks and tails. Therefore, average amount 10 kg
of stalks and tails per ton of root are being removed at starch factory.
These residues are typically disposed offsite.
Peeling and Washing
Tapioca roots are conveyed through belts or lifters from the sand removal
drum to peeling and washing units. In the peeling process, fast rotating
propeller elevator segregates peels and other contaminants (i.e. residual sands,
stones and metals) from the roots. Water spray cleans roots. The removed
peels consist of the outer skin or corky layer. The peels are generally sold to
animal feed mills or sold as media for mushroom cultivation.
Department of Industrial Works MIS Guideline for Eco-efficiency Improvement
2-2
Figure 2.1a Standard Native Starch Production Process
Dry Sand Removal
Washing and Peeling
Chopping
Grinding
Fruit Water Separation (Decanter)
Starch Extraction
Starch Refining
Starch Dewatering
Starch Drying
Cooling and Bagging
Grid Chamber
Pulp Press
Biogas Plant
Wastewater Treatment Plant
Burner
Generator
Fresh Tapioca Root
Tails and Stalks
PeelWash Wastewater
Wet Sand
Fruit Water
Pulp
Sulphur Solution
Process Wastewater
Electricity (To be Used in
Production Process)
Bunker Oil
Emission
Hot Air
Native Starch
Biogas
Effluent
Pre-treated Wastewater
Biogas
Sulphur
Fresh Water
Fresh Water
Fresh Water
Recycled Water
Dry Sand
Sand
Sludge
Department of Industrial Works MIS Guideline for Eco-efficiency Improvement
2-3
2.1.3 Degrading (Root Disintegration)
Chopping and Grinding
Clean roots are passed onto the chopper through a chain conveyor or a rasp
bucket conveyor. At this stage, the roots are cut into small pieces of
approximately 1-2 inches to aid energy saving in the next stage of processing.
The chopped roots are then processed in a root rasper, in which the roots are
grinded into fine particles (mash of pulp, starch, fruit water etc.). Thus
chopping and grinding process help form a basis of starch extraction, in which
tuber cells are opened to release the starch granules and to obtain a high
starch yield.
Also, at this stage cyanic acid is dissolved along with fruit water from the
roots. The mechanical equipment therefore has to be made from high-grade
stainless steel to avoid formation of ferrocyanides (bluish colour formation in
starch).
Fruit Water Separation by Decanter (Optional)
After grinding, fruit water is separated from starch and pump using decanter
(this process is optional to the starch production). The tapioca root has water
content of around 60 to 70 % by weight. This liquid phase is called “fruit
water”. The fruit water contains water-soluble substances such as salts
(potassium), compounds of nitrogen and phosphorous, sugars etc.
Microorganisms and its enzymes degrade these substances in fruit water
resulting into new substances such as alcohols, organic acids.
These biochemical reactions exert a negative influence on the product quality
if these substances are not separated from starch and pulp.
To avoid generations of undesirable substances such as organic acids and
alcohols, some factories use decanter centrifuges to initially separate fruit
water from starch and pulp. The fruit water is partly separated, depending on
the type of equipment in use. Additional water is added at this stage to dilute
the fruit water.
2.1.4 Starch Extraction
In the extraction stage, the starch is separated from the cellulose (fibres/pulp)
in multi-stage extractors. The multi-stage extractors consist of three to four
extracting units directly connected to each other without any intermediate
tanks. The extractors are made of rotating centrifugal sieve cones with 60 to
80 mesh sieves in the first coarse extraction stage; and a 90-mesh filter cloth in
the subsequent fine extraction stage. The extractor units are entirely built with
stainless steel.
The starch pulp slurry is fed into a conical rotating screen, where jets of wash
water are sprayed onto the pulp to separate the starch and fibres.
Department of Industrial Works MIS Guideline for Eco-efficiency Improvement
2-4
The washing is undertaken in counter-current. This wash water is taken from
the effluent of the starch-refining section.
Sulphur solution is added in this stage to inhibit microbiological reaction, and
consequently to prevent formation of lactic acid.
The washed fibres (pulp) leaving the last unit of extractor contain 90 to 95 % of
water and a low-starch content. The pulps are then dewatered by pressing
and are left dried on concrete floor. Dry pulps are to be further sold to animal
feed mills or used as media for mushroom cultivation.
The crude starch milk leaving the fine screen has a concentration of about 3
Beaumè (°Bè) (54 kg dry starch per m³), consisting of soluble contaminations,
such as proteins, fatty material, sugars (rests of fruit water), and insoluble
contamination such as small cellulose particles from the rasping operation
(rests of pulp). This portion of insoluble contamination will be removed
during the subsequent refining stage.
2.1.5 Starch Refining
The processing of tapioca roots has to be completed within the shortest
possible time to avoid reduction of starch quality and content due to fast
enzymatic and chemical reaction. A continuous refining system without
detention tanks is normally used at this stage, where the refining of the starch
is carried out for a few minutes via separation, washing and concentration.
The pulp containing starch is pumped through a safety strainer and a sand
cyclone in order to protect the subsequent aggregates and the product quality.
Thereafter the slurry enters the separation equipment arranged as centrifuges
or hydrocyclones.
Most factories use separators for starch refining. To ensure a high quality
starch, separators in series are installed. The heavy phase leaving the
separators is the starch with the concentration around 20 to 22 ° Bè, whereas
the light phase is the resulting wastewater.
The concentrated starch then goes to the next step “drying process", and
the wastewater typically enters the wastewater treatment plant. In certain
factories where a biogas system is installed, this wastewater goes to the biogas
system.
2.1.6 Starch Dewatering, Drying, Cooling and Bagging
The refined starch slurry is dewatered and then continuously fed to the dryer
through screw transporters. The dryer is a pneumatic flash dryer, in which
the evaporation takes place by the exposure of the moist material to 200°C hot
air. Drying is completed in a very short time to ensure that no grains are
Department of Industrial Works MIS Guideline for Eco-efficiency Improvement
2-5
formed and that degrading or modifying of the starch does not taking place.
The hot starch is separated by cyclones.
It is crucial to cool starch immediately after being dried, thus the flash dryer is
equipped with special cooling cyclones. The hot cyclones and the cooling
cyclones shall be designed to allow drying efficiency of 99.95%. An automatic
air regulator keeps the moisture content of the final starch within the limit
about 12 to13 %.
Then, the starch is bagged for further distribution, whereas the exhausts from
the dryer and cooler enters a starch recovery unit before the exhausts are
emitted to the atmosphere.
2.1.7 Utilities
The main utility system for native starch factories includes water treatment
plant, burner, generator, wastewater treatment plant, and biogas system
where applicable.
Water Treatment Plant
Water is utilised in various sub-processes of native starch production
(i.e. washing and peeling, starch extraction, and starch refining). Raw water is
treated in a water treatment plant for coagulating and chlorination prior to use
in such sub-processes.
Burner
Burner is used to generate hot air. Hot air serves as one of the main energy
sources for native starch production process. In normal operation,
a considerable amount of bunker oil is used as burner fuel. However, bunker
oil can be substituted by biogas generated from biogas system, which is being
applied at some of the native starch factories.
Wastewater Management
Wastewater generated from native starch factory contains high organic
contents, therefore, can be used as liquid fertiliser. However, level of organic
content should be pre-adjusted to attain a suitable fertilising condition,
through addition of wastewater treatment.
To assure the quality of wastewater effluents meeting the industrial effluent
standard, further treatment of process wastewater is required. Environmental
Management Guideline for Native Starch Industry (1997) has provided a review of
suitable wastewater treatment technologies for native starch industry,
including primary wastewater treatment, secondary wastewater treatment
and nitrogen removal.
Department of Industrial Works MIS Guideline for Eco-efficiency Improvement
2-6
Biogas System
Due to high organic loading of wastewater generated from native starch
production, therefore it is possible to apply anaerobic digestion technologies
to recover and convert organic wastewater into biogas. In the past, the most
widely adopted wastewater treatment plant was pond treatment system,
which comprised of anaerobic ponds, facultative pond, and polishing pond.
Biogas generated from anaerobic ponds was neither captured nor utilised.
In recent years, a biogas system has been introduced to starch industry in
order to reduce the energy cost and also minimise the impact on water
pollution. Typically, native starch production generates wastewater with
the COD content of approximately 20,000-25,000 mg/l. Therefore, one (1) m3
of native starch wastewater could produce 8-10 m3 of biogas at 80% efficiency
of biogas system. Approximately, one (1) m3 of biogas may substitute
approximately 0.6 litre of bunker oil.
2.2 MATERIAL FLOW
Performance of the native starch production process can be determined by
considering the materials flows of production process. The materials include
inputs to the process (i.e. raw materials and energy) and outputs from
the process (i.e. products, wastes and emissions). A concept of material flows
is employed to identify, quantify and improve characteristics of products,
technical processes and eco-efficiency. Through this concept, analysis of
inventory based on balancing of material and energy flows, and balance
evaluation are applied.
Assessment of production performance is made possible by material flows.
Thus material flow incorporates itself as a key decisive making factor in
production process. An example of how material flow is inclusive in decision-
making includes decision on response plans or tasks to be employed in order
to improve or solve any particular problems of production process.
In a typical native starch factory, key materials influencing the eco-efficiency
performance are native starch, water, and energy. These key materials can
reflect the causes of under-performing production. Material flows associated
with native starch, water and energy are shown in Figure 2.2a - 2.2c.
Department of Industrial Works MIS Guideline for Eco-efficiency Improvement
2-7
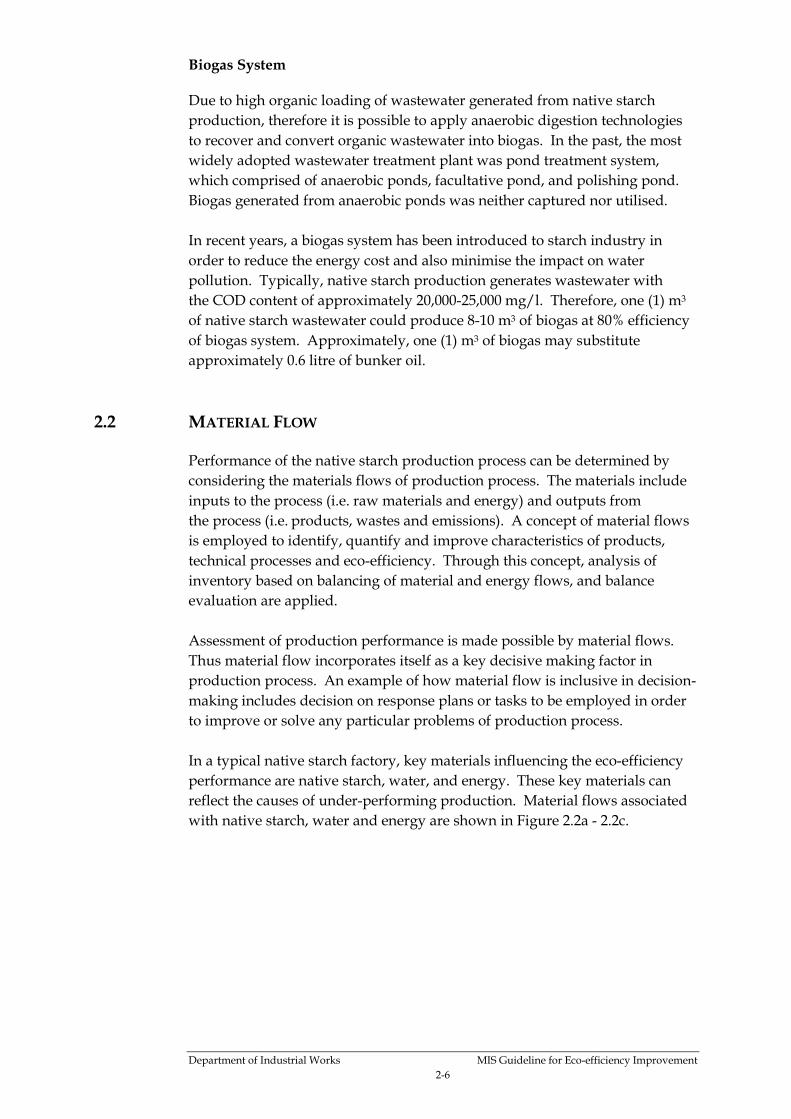
Figure 2.2a Material Flow of Native Starch
Thru native starch production since entering fresh tapioca root (FTR) into
production process, losses of starch occur in various sub-processes. Losses are
via discarded peel, pulp, dryer exhaust and wastewater stream. According to
Environmental Management Guideline for Native Starch Industry (1997), starch
loss during production process is approximately 40 kg/ton of native starch
produced.
Dry Sand Removal
Washing and Peeling
Chopping
Grinding
Fruit Water Separation (Decanter)
Starch Extraction
Starch Refining
Starch Dewatering
Starch Drying
Cooling and Bagging
Grid Chamber
Pulp Press
Fresh Tapioca Root
Recovered Starch
Starch Loss with Process Wastewater
Starch Losswith Pulp
Starch Loss with Peel
Starch Loss with Air Emission
Native Starch & Recovery
Department of Industrial Works MIS Guideline for Eco-efficiency Improvement2-
2-8
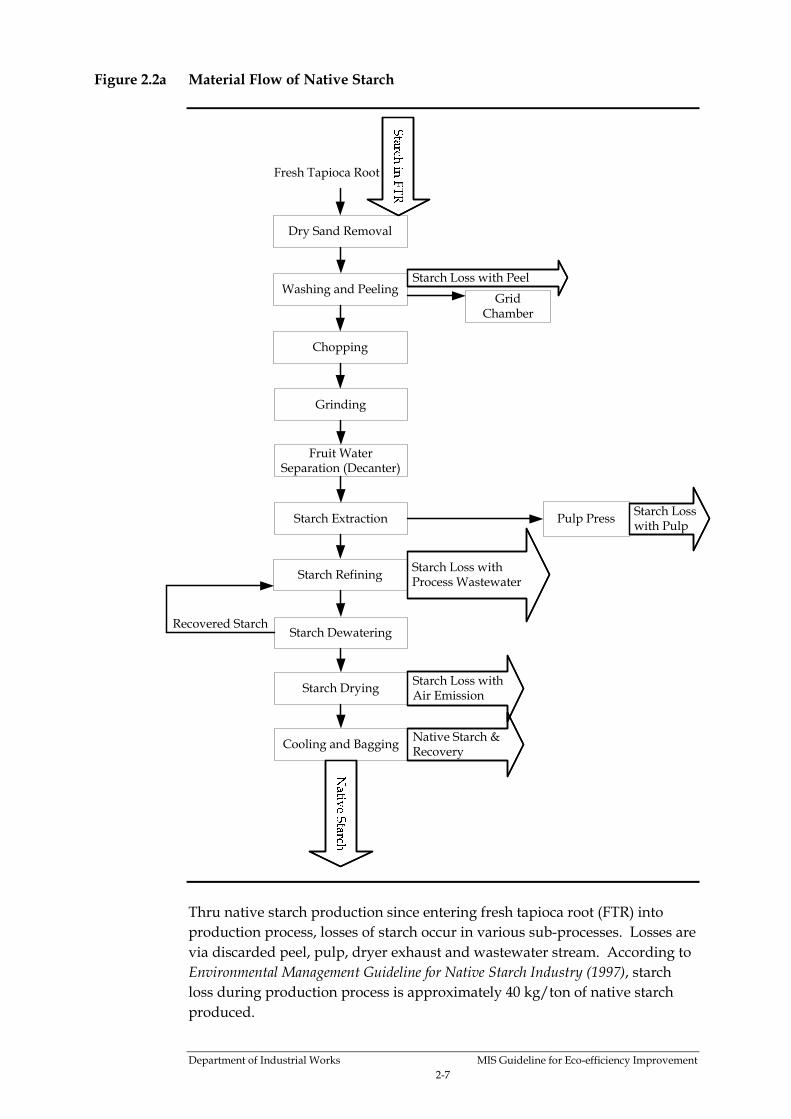
Figure 2.2b Material Flow of Water
Fresh water is pre-treated by passing through water treatment plant.
Fresh water is mainly used in washing, peeling, and starch refining stages,
and also is partly used to produce sulphur solution for starch extraction
process. Used water from pulp press and refining stage is recycled and
supplied to other stages as present in above figure and finally leaving as
effluent from the wastewater treatment plant.
Efflu
ent
Department of Industrial Works MIS Guideline for Eco-efficiency Improvement
2-9
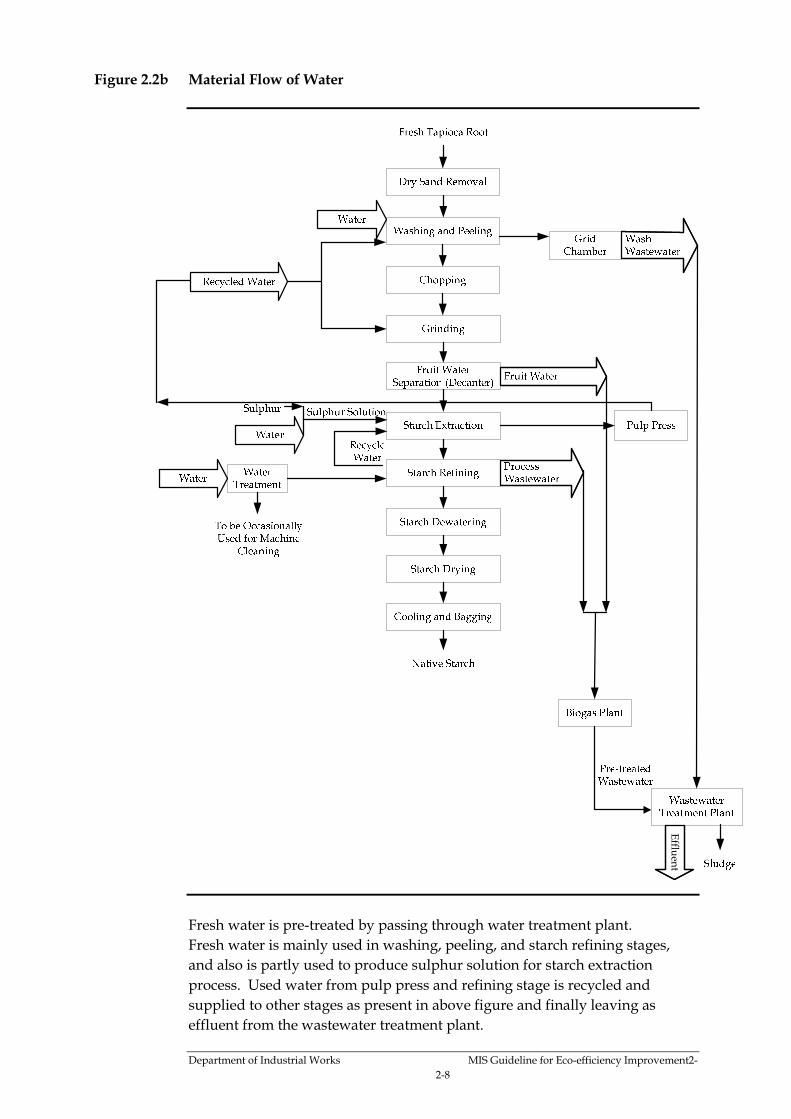
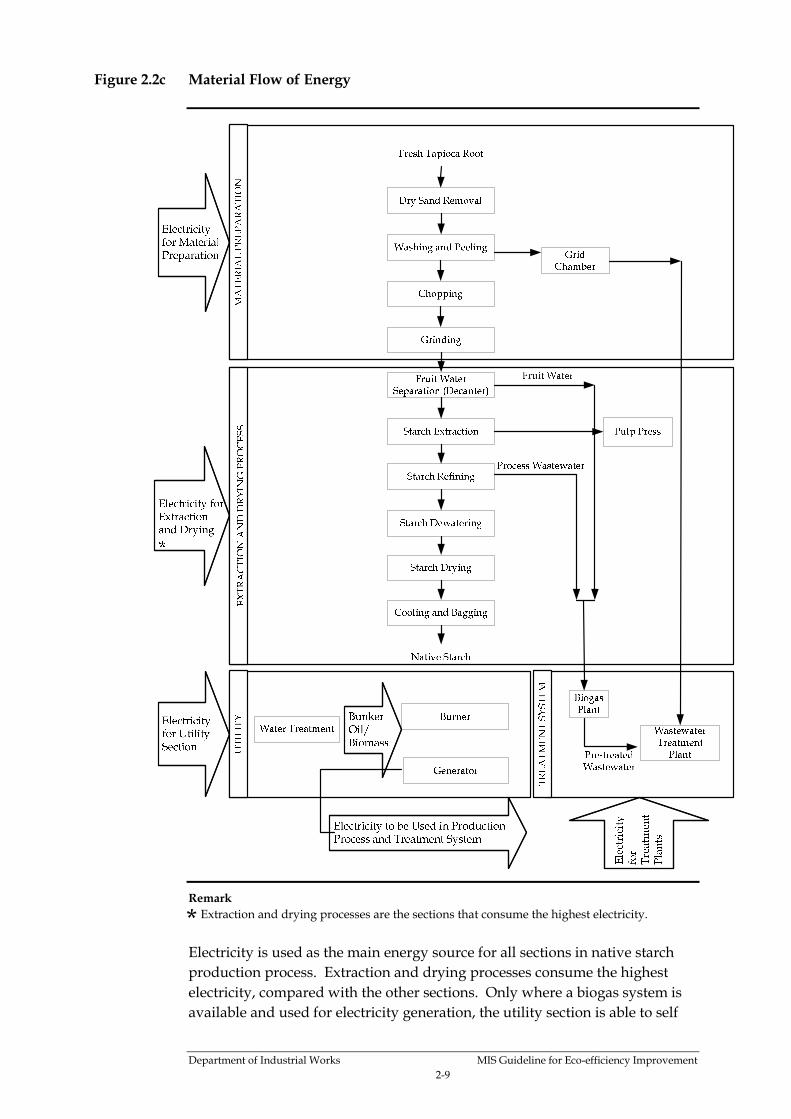
Figure 2.2c Material Flow of Energy
Remark
Extraction and drying processes are the sections that consume the highest electricity.
Electricity is used as the main energy source for all sections in native starch
production process. Extraction and drying processes consume the highest
electricity, compared with the other sections. Only where a biogas system is
available and used for electricity generation, the utility section is able to self
*
Department of Industrial Works MIS Guideline for Eco-efficiency Improvement
2-10
generates the electricity, which can be supplied into the production process
and wastewater treatment system.
To improve eco-efficiency, materials flows need to be established and
employed in order to understand the inputs and outputs of the production
process. The result is the identification of improvement opportunities within
the process. The material balancing flows function as pointer of where the
data should be collected and behave as balancing evaluation of material
inventory. For instance, through material balancing flow, starch loss within
the production process could be identified including where the loss is
occurring.
However, data and information on eco-efficiency in native starch industry
are currently limited. At present, actual information on material balance of
water and energy usage is rarely available. As a consequence, most
information regarding eco-efficiency are not fully utilised by management
to aid decision-making.
Theoretically, analysis of material inventory and balance could be
successfully undertaken, when eco-efficiency data have been continuously
collected. Therefore, the development of data collection, verification,
evaluation and information reporting is of particular concern, and is
a starting point for management information process to support decision-
making.
In this Guideline, Management Information System (MIS) is introduced for
improving eco-efficiency in native starch production. The following sections
of the Guideline will describe MIS concept, principles and how MIS could be
applied to native starch production.
Chapter 3
Introduction to
MIS Application
Department of Industrial Works MIS Guideline for Eco-efficiency Improvement2-
3-1
3 INTRODUCTION TO MIS APPLICATION
3.1 BACKGROUND
Management Information System (MIS) is defined as a system or process that
manages the collection, analysis and presentation of information to assist
decision-making and to enhance business competitiveness. MIS is typically
used as a tool by management to assess and monitor business performance
and to help compare or identify possible business alternatives, i.e.
introduction of new activities and process modification in industries.
Basic functions of MIS are to systematically capture data from operations; to
analyse data and transform into meaningful information; and to report and
make use of information such as monitoring performance and improving any
given process or activities.
3.2 OBJECTIVES OF MIS APPLICATION
Since businesses have to face higher competition, Information Technology (IT)
has proven to be a crucial part of business decision making to obtain a leading
edge. Moreover, IT is also applied to other parts of the business such as
marketing, human resources, production process and eco-efficiency.
Specific objectives of MIS application depend on individual organisation’s
strategy. In this guideline, the main objective of MIS application in native
starch industry is to improve eco-efficiency and competitiveness.
A number of internal and external drivers encourage organisations to focus on
eco-efficiency practices.
These internal drivers include:
• Cost reduction;
• Increasing quality of products and services;
• Increasing innovations and employee motivation;
• Responsibility to community;
• Profitability;
• Managing environmental risks and liability; and
• Maintaining or increasing market share.
External drivers include:
• Customer demands for more “environmental-friendly” products;
• Competitive advantage by setting the trend or following market leader;
• Shareholders demanding accountability and transparency;
• Thai government regulations;
Department of Industrial Works MIS Guideline for Eco-efficiency Improvement2-
3-2
• Public pressure for cleaner production; and
• Government regulations and directives where products are exported to
overseas such as European Countries;
Market globalisation has influenced companies to greatly improve the quality
and environmental soundness of products and services they provide while at
the same time to produce goods at the lowest possible cost. In such a context,
eco-efficiency improvement by promoting the creation of products while
optimising resource use and reducing wastes and pollution, can answer
the increasing business needs together with enhancing the business
competitiveness.
In this perspective, the introduction of MIS can provide valuable support for
successful decision-making at the management level in native starch industry.
With such a tool, eco-efficiency improvement can be achieved while at
the same time, competitiveness can be enhanced.
3.3 BENEFITS OF MIS APPLICATION
It is important to understand how MIS technology can support decision-
making and help to improve business competitiveness. However MIS can also
lead to a number of practical benefits for improving eco-efficiency.
These benefits include:
• Encouraging native starch industry to collect, analyse and transform
eco-efficiency data into meaningful information for the management in
a timely and systematic manner supporting order to support their
decision-making;
• Allowing the management of native starch factories to identify gaps for
improvement, to monitoring performance (either for their own internal
benchmarking or industry benchmarking), and also to compare various
alternatives such as process modification and installation;
• Increasing native starch productivity and maximising return on
investment;
• Cost reduction measures (and increasing revenue) through more efficient
use of materials, resources and energy;
• Reducing risks and liabilities with appropriate environmental
management planning and avoiding the use of toxic substances;
• Enhancing brand image through efforts on marketing and communication;
and
• Improving environmental performance and reducing toxic emissions by
reusing and recycling unused materials
3.4 MIS PRINCIPLES
Basic requirements for MIS application and implementation are categorised
into three (3) main elements comprising “People”, “Implementation Process”,
Department of Industrial Works MIS Guideline for Eco-efficiency Improvement2-
3-3
and “Tools” (hardware and software). Principles and relationship between
these elements are elaborated in this section.
3.4.1 People
The most important element in MIS is the people involved since all objectives
and benefits will be addressed by understanding personnel who will also
oversee MIS process, information and tools.
An MIS operation comprises of several tasks; therefore, it is necessary to
group such tasks, based on relevance, and assign roles and responsibilities to
fulfil them. By doing so will not only clearly define roles and responsibilities
to perform MIS processes but also assist plant owners to be able to select and
recruit suitable personnel.
It should be noted that the amount of MIS personnel is based on plant owner
consideration. Typical roles and responsibilities in MIS implementation are
described as follows.
Roles, Responsibilities and Qualifications:
In general, there are three (3) levels of roles and responsibilities for personnel
involved in MIS implementation, comprising management role, supervision
role, and operation role.
Management Role
Every successful MIS requires management support and involvement.
Without management, all data collection and analysis for decision making will
not be meaningful. The main role of management is to bind MIS and other
operation together to implement the decision made from MIS reports and/or
decision-making process. Also, management needs to take an active role in
facilitating the followings:
• Use and interpret information from MIS reports for decision-making;
• Align MIS strategy and policy with business strategy;
• Guide MIS supervisors on objectives and benefits of implementing an MIS;
• Provide and manage MIS budget and personnel;
• Communicate the importance of MIS to all employees including
MIS personnel and all other department personnel; and
• Provide support in further development and improvement of MIS in
the future.
Supervision Role
Personnel in charge of MIS supervision can be someone who posses an overall
understanding on how to reach the objectives and realise the benefits, while
manage and supervise MIS operation. Thus MIS supervisor is not necessarily
Information & Communication (ICT) trained or certified personnel.
Department of Industrial Works MIS Guideline for Eco-efficiency Improvement2-
3-4
Typically, the supervision role is undertaken by a plant manager, production
manager, or dedicated MIS supervisor. However, it will be beneficial if MIS
supervisor is comfortable with computer technology.
Supervision roles and responsibilities include:
• Oversee all MIS processes, information and tools, are implemented in
a correct and good manner with clear understanding of realising the
objectives and benefits;
• Introduce the MIS procedures and its objectives to MIS operation
personnel;
• Analyse data and create useful information;
• Report information findings and recommendations to management for
decision making; and
• Organise maintenance, troubleshoot, and upgrade all MIS hardware and
software (optional).
Operation Role
Operation role can be assigned to any plant staff, who is involved in any
particular process that needs data collection. Typically, the plant personnel
taking the operational role come from different departments such as
production staff and laboratory staff. Understanding that data collection and
MIS procedure implementation are different tasks from regular operation
tasks, selecting personnel for this role requires those who understand and able
to perform MIS tasks with comprehension and care.
At the plant floor, implementing MIS procedures are secondary to operational
tasks unless acquire dedicated MIS personnel. MIS supervisors need to make
sure that MIS operation personnel are trustworthy and honest to their
responsibilities. Otherwise, MIS procedures and data collected will be skewed
and not present actual findings, which will lead to poor analysis, poor
reporting and poor decision making. Above all, it will not assist in realising
the objectives and benefits set out to implement MIS in the first place; hence,
careful selection and monitoring of MIS operation personnel is vital.
Operational roles and responsibilities include:
• Implement MIS procedures and tasks at any particular process required;
• Collect and enter data into provided system (i.e., software) accurately and
honestly; and
• Organise maintenance and troubleshoot, and upgrade all MIS hardware
and software (optional);
It should be noted that dedicated MIS team/personnel is recommended to
supervise, monitor and implement MIS procedures, tasks and tools.
Nevertheless, this would depend on the plant owner insights, budget and
operations.
Department of Industrial Works MIS Guideline for Eco-efficiency Improvement2-
3-5
3.4.2 MIS Implementation Process
People, as described in the previous section (Section 3.4.1), will need to adopt
MIS processes and understand the information flow to implement MIS, and
successfully meet its objectives and benefits. A methodology for applying
an MIS needs to be selected for MIS implementation.
Every industry is different and so are their processes, information flow and
methodology. Conversely, the MIS processes could be applied to the native
starch industry. This section describes typical MIS processes, information
flow and methodologies for applying an MIS.
Typical MIS Processes
Preparation Stage
At this stage, people roles need to be assigned, tools need to be selected and
acquired; processes will need to be set and communicated to relevant
personnel and departments. Training is often required for personnel of
related process. Management shall take on the role in identifying the needs
for MIS implementation, setting the strategy, objectives, and the foundation
and its cooperation between internal departments and management, which in
turn determines the achievement of MIS commencement.
Personnel involved: Management, MIS, and Related Department Heads
Data Collection and Consolidation
Data collection and consolidation is a crucial process as it gathers actual data
from plant level. In most cases, this process is undertaken by existing plant
staff and not specifically dedicated MIS personnel; therefore, training and
reminders are often provided. To ensure the quality of data, a data audit
process shall be conducted from time to time.
After collection, data need to be consolidated and stored such as entering data
into software(1) to be systematically structured for further analysis.
This process is sensitive and is regarded as the most human error process in
MIS. Entering incorrect data, into the system would lead to poor analysis.
To prevent human error, data verification process based on each plant’s MIS
policy may need to be implemented. See section “ Software-enabled method”.
Personnel involved: MIS Supervisor and Assigned Operator
(1) Software-enabled method
Department of Industrial Works MIS Guideline for Eco-efficiency Improvement2-
3-6
Data Cleansing & Verification or Data Auditing
This process is optional depending on each plant’s MIS policy. This process
varies from industry to industry but is required for financial application
processing such as credit card or loan. For native starch industry, it varies
from plant to plant whether data collection and consolidation is adequate and
reliable. If not, MIS supervisors will need to allocate additional resources to
verify data collected. Consequently, this process will not be emphasized in
this guideline.
Data Processing
Processing of entered data will create sets of information that will allow
management to support decision-making. Each set of information will then be
compared and analysed to measure each production processes’ efficiency,
illustrated by key performance indicators (KPI), creating plant and industry
benchmarks. Data processing is generally carried out by software.
This process is viewed as the most vital process in MIS processes since data
processing will provide key information such as how efficient each process is,
how each data collected can help improve efficiencies, and how to initially
adjust each process for better throughput according to data analysis.
Personnel involved: MIS Supervisor and Management
Information Reporting and Analysis
Following analysis, set of information will need to be arranged in
a presentable format for reporting. The purpose is to formalise sets of
information in a simple visual format so that high-level executives or
management can easily review it.
In regards to time constraint on management to review the information, it is
critical to standardise reports so that management has little-to-no learning
curve understanding the information. MIS needs to design this displaying
information process into formatted reports while incorporating minimum
time usage as possible; automate such process will be ideal. Recent researches
indicate that significant MIS time and resources are allocated to report
creation rather than necessary processes.
Since different management require different information based on their
interests; therefore, MIS reports should be designed to provide necessary
information for decision-making in the viewpoint of their interests.
Decision-making
This process is mainly management’s responsibility. MIS takes a supportive
role. Undeniably, this process is the pinnacle of MIS processes as it
summarises all MIS effort and allows MIS to make recommendations to
management based on analysed information.
Department of Industrial Works MIS Guideline for Eco-efficiency Improvement2-
3-7
Despite the outcome, implementing management’s decision is an assigned
departments’ responsibility which may need MIS support to fulfil such
implementation.
Information Flow
Relationship between MIS process and MIS roles and responsibilities is
summarised and shown by a typical information flow diagram in
Figure 3.4a as follows.
Methodologies
To capture and enter data through analyse and present information, all MIS
processes need to apply a methodology to centralise and store such data while
enable the information flow. Methodologies can be categorised as such:
Manual Method
This is the most labour intensive approach to carry out any process.
It requires involved personnel to utilise basic tools such as paper forms and
a calculator to perform process’ tasks. Filing of gathered or even analysed
information is at the heart of each method. The manual method requires
paper-based filing (storing) as actual working documents while act as back-up
copies at the same time.
This manual method requires the most resources when compare to the next
two methods but may present the most cost-effective approach due to low
investment in tools and low maintenance. However, this method presents
frequent human errors.
Unavoidably, as information technology becomes more sophisticated and
more economical, businesses grow to rely heavily on them; hence, the need of
continuity plan is becoming more important. It has been proven time and
time again, that when unforeseeable event occurs, technology cannot aid the
continuity of business processes. Although primitive technology-wise, this
method became the standard continuity process for MIS practice.

Department of Industrial Works MIS Guideline for Eco-efficiency Improvement
3-8
Figure 3.4a General MIS Information Flow Diagram
Data collection
& consolidation
Decision
making
Data calculation
Data
verification
Information
reporting &
analysis
Data storage
MIS Operation
MIS Supervisor
Management
Production Control
Process Modification
Department of Industrial Works MIS Guideline for Eco-efficiency Improvement
3-9
Software-enabled Method
This method requires an interaction with software on a personal computer
(PC). A minimum set of a PC is at the base of this method.
As discussed in the section “Data Collection and Consolidation”, to
systematically structure entered data, the software interface (screen) is
extremely important. This part in software design is called Graphical User
Interface or GUI. GUI is not only formatting fields on a computer screen but it
is a psychological behaviour pattern that is interpreted into a screen layout so
that users can understand how to use it at best.
Decent GUI allows users to engage and interact with data whether entering,
formatting, calculating or so on with a low learning curve. However, good
GUI design also depends on the software functionality. If it serves simple and
straightforward functions such as data entry, it shall be designed to
accommodate the sequence of data to be entered for such industry specific
process.
No matter how well designed-software GUI is, error occurs at the interaction
of human and PC since human performs data input. In addition, data
auditing and process monitoring are viable options to assure better data
quality and lower human errors.
Calculation and analysis including other MIS processes except decision-
making can adopt software usage in two approaches: “file-based” and
“purchase”.
File-based is where MIS personnel create or adopt file associated to each MIS
processes and deploy them on role usage basis. For instance, data entry at
extraction process may have one PC with a file to enter data for such
particular processes involved. This approach, although widely practice,
presents problems of storage, analysis and reporting since data are scattered
in files on multiple PCs. To solve this problem, MIS can customise
productivity software such as Microsoft Excel and Access to service the
information flow. Such approach is an in-house software design, which
requires time, tools (network, cable wiring, database, server and so forth) and
resources and is not standard but highly customised to that particular
business. Consideration to take this approach depends on MIS know-how
and skill.
A viable and standard alternative is to use purchased software, which is
created by reputable companies who have deep knowledge in industry
processes. Supporting information flow for a native starch plant may require
software that interconnects from each production process to process.
This particular type of software is called Manufacturing Resource Planning or
MRP. MRP is industry standard software but needs to be customised to fit
each plant’s production process, financial and accounting, and required
Department of Industrial Works MIS Guideline for Eco-efficiency Improvement
3-10
information in other departments. It may be costly, but it is proven to be
the most productive tool to enable efficiency boosting.
Automated Method
A sophisticated approach, which entails investments beyond computer
hardware and software, requires control over each process using hardware
and electronics that are able to capture data, alert on out-of-setting events and
interconnect to a computer network. This method is generally controlled via
a network of electronic controls and computers. Details of this method vary
highly from process to process; therefore, will not be discussed in this
guideline.
3.4.3 Tools
This section introduces MIS tools from paper-based to sophisticated tool, and
their attributes to consider its suitability to adopt.
Paper, Pencil/Pen and Calculator
Paper, pencil/pen and calculator are the most basic tools for any business
operation, and also the fundamental tools for MIS. No matter how
sophisticated MIS implementation can be, these tools would always be
required in business, as they are extremely familiar to any level of business
operation and are mostly adopted. Thus, application of these basic tools in
MIS process is straightforward. The advantage of these tools is that they
require almost no explanation in usage. The manual methodology requires
these sets of tools as mentioned previously for business continuity planning
and support.
For MIS, these tools can be applied specifically to data collection and
calculation processes. Unavoidably, as manual it is, prone to errors it
becomes. Repetition and verification of each process may be required to
guarantee its correctness.
Personal Computer (PC) and Productivity Software
In the late 1970s and early 1980s the personal computer (PC) has made its way
into every business. The reason is because it can support several tasks in one
machine lending a lot of equipment obsolete such as the typewriter.
However, it is the software inside the PC that makes all the difference.
Software are computer programs designed to serve specific tasks. The most
widely adopted next to operating system (programs to make PC function) is
productivity software such as Microsoft Office.
In a package of productivity software combines a word processor,
spreadsheet, presentation, communication, small database version of software
for users to work on.
Department of Industrial Works MIS Guideline for Eco-efficiency Improvement
3-11
The success of Microsoft Office made the standard productivity tools
synonymous with its brand name such as Microsoft Word, Microsoft Excel,
Microsoft PowerPoint, Microsoft Outlook and Microsoft Access respectively.
These software normally substitute any manual process due to its ease of use,
functionalities, and versatility; hence, it is standard for any business operation
to deploy PCs with productive software as it can serve any business.
File Cabinet and Database
The common purpose of these two is storage of data; the difference is in its
form. A file cabinet files paper-based documents, but database files digital
information in a digitally structured file cabinet.
A database is crucial to store data for data input such as entering data for data
collection and data output such as displaying data consolidation to perform
calculation or even as a report. Database is an electronic centralised place for
data storage. Normally the access of data is from many PCs; therefore,
a database is usually placed in a server on a network of PCs to access.
Before or after storing data electronically, the actual paper is used for writing
down data collection from any production process to print outs of data forms
to perform calculation or reports. All need a physical location to store, which
is the file cabinet.
File cabinets act as a backup location for database’s data printouts whether in
forms of raw data, data tables or reports. File cabinets are proven inadequate
to serve data input and output like databases. Hence, in business practice,
both coexist due to dependability. Procedures to guarantee the safety of
business data are also critically required; backup procedures are commonly
adopted.
Server and Local Area Network (LAN)
A server is a regular PC but dedicated as a public PC to allow other PCs to
access information on it such as a database.
A Local Area Network (LAN) comprises of multiple PCs, servers and network
equipment (i.e., hub, router, switch, etc.) to enable communication with other
PCs. The purpose of communication is to exchange information whether
being email, documents, data, and any forms of electronic information.
There are two (2) types of networks, which are wired/cable and wireless.
Wired/Cable Network
Wired/Cable network will use a physical network cable to physically connect
each PC. The advantage of using cable is that data transmission is reliable,
fast and cost-effective.
Department of Industrial Works MIS Guideline for Eco-efficiency Improvement
3-12
Wireless Network
Wireless Network will use radio emission as media to carry the data over the
air between each PC. The advantage of wireless is the flexibility of location if
within radio emission reach, but it will sacrifice speed. When compare similar
size of networks, wireless networks are more expensive than wired.
MRP and ERP
MRP stands for Manufacturing Resource Planning; similarly ERP stands for
Enterprise Resource Planning. Both are software designed to connect
business processes and facilitate information flow using PCs, servers, and
network.
Each industry has its own specific MRP/ERP as processes are different.
For a given industry, MRP/ERP attempts to consolidate most processes by
using MIS. Currently, the average business that implements MRP/ERP can
bind 20% of the overall operation. This is due to the complexity of each
department and the interconnectivity to facilitate information flow.
Each department has its own sets of processes, which can create a complex
flow of information within the department. Implementing MRP/ERP requires
the management to to emphasize to all departments for cooperation. Over the
past two decades, Key Performance Indicator seems to be the driving force for
department cooperation.
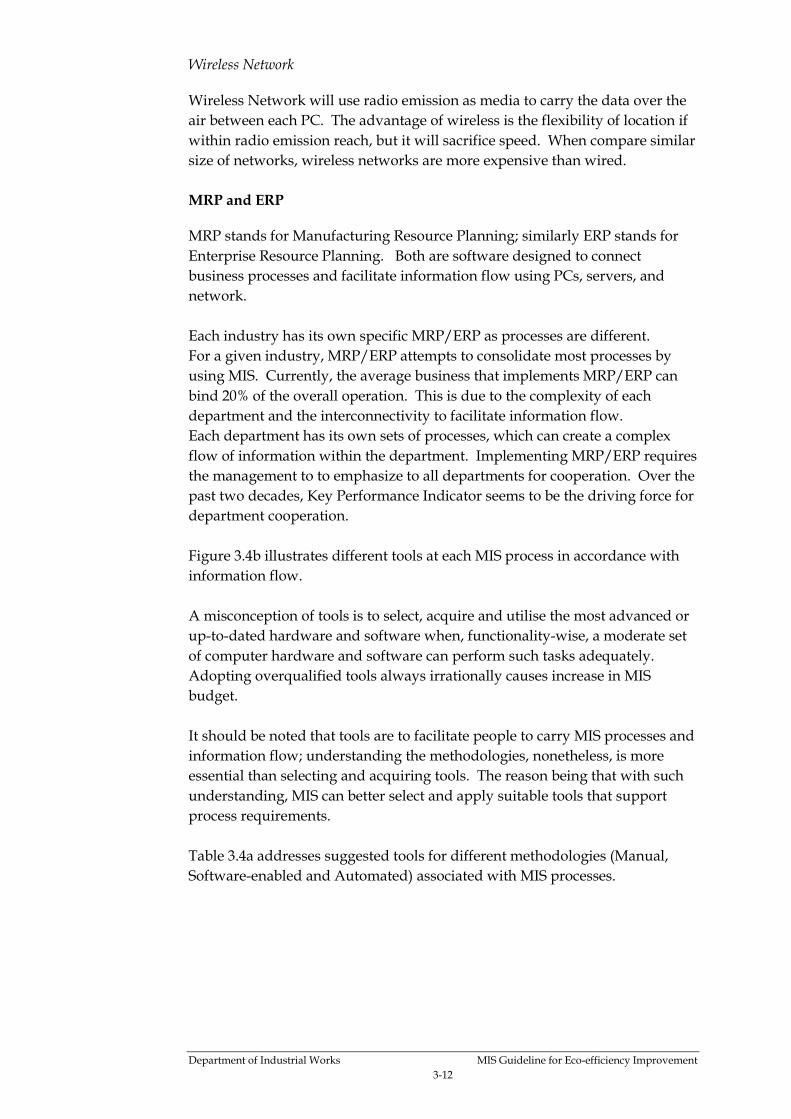
Figure 3.4b illustrates different tools at each MIS process in accordance with
information flow.
A misconception of tools is to select, acquire and utilise the most advanced or
up-to-dated hardware and software when, functionality-wise, a moderate set
of computer hardware and software can perform such tasks adequately.
Adopting overqualified tools always irrationally causes increase in MIS
budget.
It should be noted that tools are to facilitate people to carry MIS processes and
information flow; understanding the methodologies, nonetheless, is more
essential than selecting and acquiring tools. The reason being that with such
understanding, MIS can better select and apply suitable tools that support
process requirements.
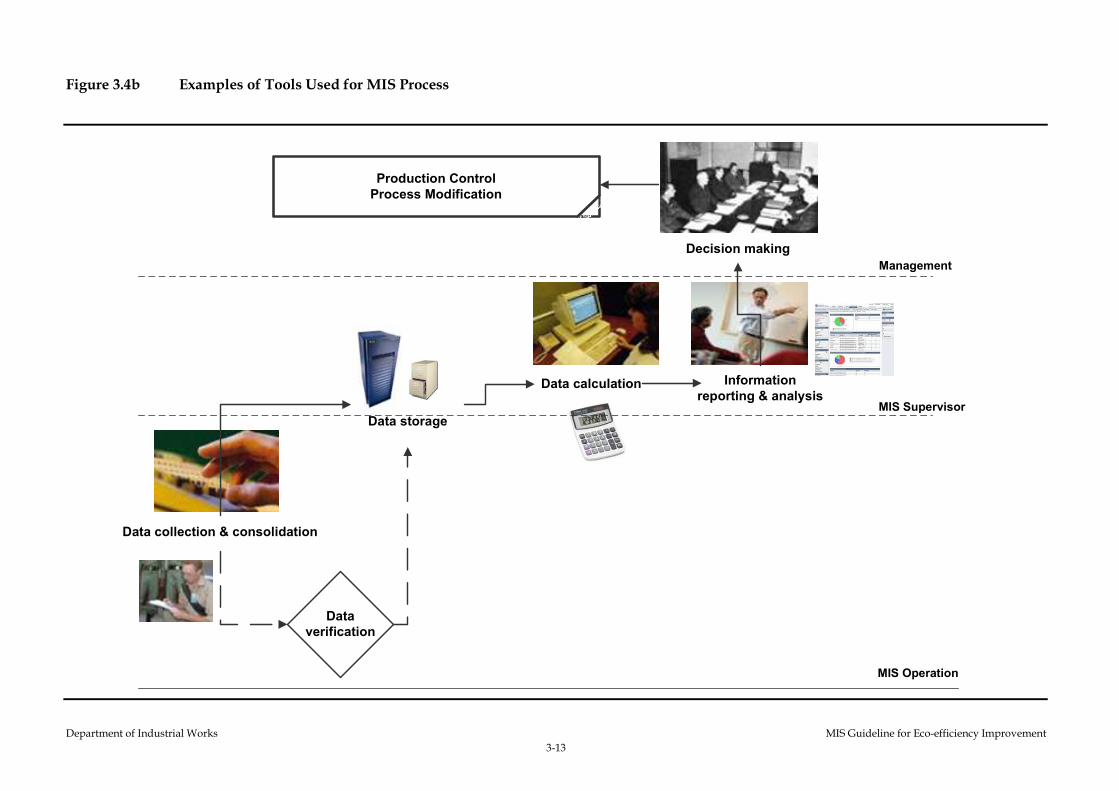
Table 3.4a addresses suggested tools for different methodologies (Manual,
Software-enabled and Automated) associated with MIS processes.
Department of Industrial Works MIS Guideline for Eco-efficiency Improvement
3-13
Figure 3.4b Examples of Tools Used for MIS Process
Data
verification
Data calculation
Decision making
Data storage
Information
reporting & analysis
Production Control
Process Modification
Management
MIS Supervisor
MIS Operation
Data collection & consolidation
Department of Industrial Works MIS Guideline for Eco-efficiency Improvement
3-14
Table 3.4a Suggested Tools for MIS Implementation with their Pros and Cons
Methodologies MIS
Process Manual Software-enabled Automated
Data
Collection
Pen/paper form Pen/paper form Pen/paper form
Data Entry Pen/paper form Excel/Access Packaged
software/MRP
Combination of
hardware and
software to
control
production
process
equipment
Data
Calculation
Form/calculator Excel/Access Packaged
software/MRP
Analytical
software or
business
intelligence
Information
Analysis &
Reporting
Paper report Access/paper report Packaged software/
paper report
Automated
report creation
and distribution
Pros/ Cons Most basic/ low-to-
no investment
Widely adopted/
low investment
Currently best
practice/significant
investment
Highly effective/
high investment
Hard evidence
data/ high error rate
Ease of access to
MIS/Decentralised
data & storage
Ease of use and
access to all roles
with centralised
data storage/
customised on
Accurate data/
sensitive system
Labour intensive Computer literate
personnel required
Training required to
use software
Free up
resources/ rely
on solution
vendor
As shown in Table 3.4a above, a wide range of tools can be adopted
depending on the methodology selected. However, in the real practice, a mix
of methodologies is applied.
Whether noting down data on a piece of paper then enter into a database form
or key-in collected data into a software on the plant floor and printout to store
in a file cabinet, a mixture of tools are often used based on each plant’s
operation, familiarity and budget. Therefore, a pre-defined set of tools is often
mistaken.
In summary, each methodology (Manual, Software-enabled or Automated)
will evidently require different types of hardware. For example, Software-
enabled, file-based method, requires MIS personnel to design program
productivity software such as Microsoft Excel and Access, to create forms
(in MS Access), to interface with data entry formula sheets (in MS Excel) to
calculate such data and so forth.
Whereas, the automated method requires more complex and sophisticated PC
to communicate and enable the automation of data capturing via other
hardware such as steam gauge censor. This method minimally requires
a local area network (LAN) to facilitate the information flow.

Department of Industrial Works MIS Guideline for Eco-efficiency Improvement
3-15
In conclusion, plant owners can select a methodology with comprehension
while being empowered with tool knowledge to be able to select suitable
software and hardware accordingly.

Chapter 4
Applying MIS Process
to Native Starch Industry

Department of Industrial Works MIS Guideline for Eco-efficiency Improvement
4-1
4 APPLYING MIS PROCESS TO NATIVE STARCH
INDUSTRY
This section describes how an MIS process is applied to native starch industry
in order to improve eco-efficiency. A production process model that facilitates
the MIS application for native starch industry is hereby addressed. Also, the
MIS process for typical native starch industry starting from data collection and
consolidation, data processing and to information reporting, is described.
4.1 PRODUCTION PROCESS MODEL
In order to facilitate data collection as part of the MIS process for improving
eco-efficiency, there is the need for establishing a representative “Production
Process Model” for a typical native starch factory. As a consequence, a typical
production process of native starch factory (shown in Figure 2.1a) can be
arranged or sub-divided into four (4) sections comprising: Material
Preparation Process; Extraction and Drying Process; Wastewater & Biogas;
and Utility.
4.1.1 Material Preparation (Section 1)
Material preparation section involves mainly with the conversion process of
tapioca root to crude starch milk by the following production steps:
• Dry Sand Removal;
• Washing and Peeling;
• Chopping; and
• Grinding.
4.1.2 Extraction and Drying Process (Section 2)
Once crude starch milk comes out from grinding step, it will enter to the
extraction and drying process part. The main task of this section is to extract
the tapioca starch and to improve the physical property of native starch.
This section comprises following main equipment:
• Fruit water separation using decanter - this depends on individual factories;
• Starch extraction;
• Starch refining;
• Starch dewatering;
• Starch drying; and
• Cooling and bagging.
This section also produces significant amount of wastewater and pulp.
Resulting wastewater goes to either wastewater treatment plant or biogas
Department of Industrial Works MIS Guideline for Eco-efficiency Improvement
4-2
system (depending on the availability of biogas system), whereas pulp can be
sold as raw material for animal feed mills.
4.1.3 Wastewater Treatment and Biogas System (Section 3)
This section mainly deals with the wastewater coming out from washing and
peeling, fruit water separation and starch dewatering steps in pre-production
process and other production stages. Biogas system is also included in this
section. Wastewater from fruit water separation and starch refining are used
as input to the system to generate biogases mainly methane which are used as
fuel for hot air burner.
4.1.4 Utility (Section 4)
Electricity, hot air and fresh water are used to support the native starch
production process. This section comprises water treatment unit, hot air
burner and electricity generator where applicable.
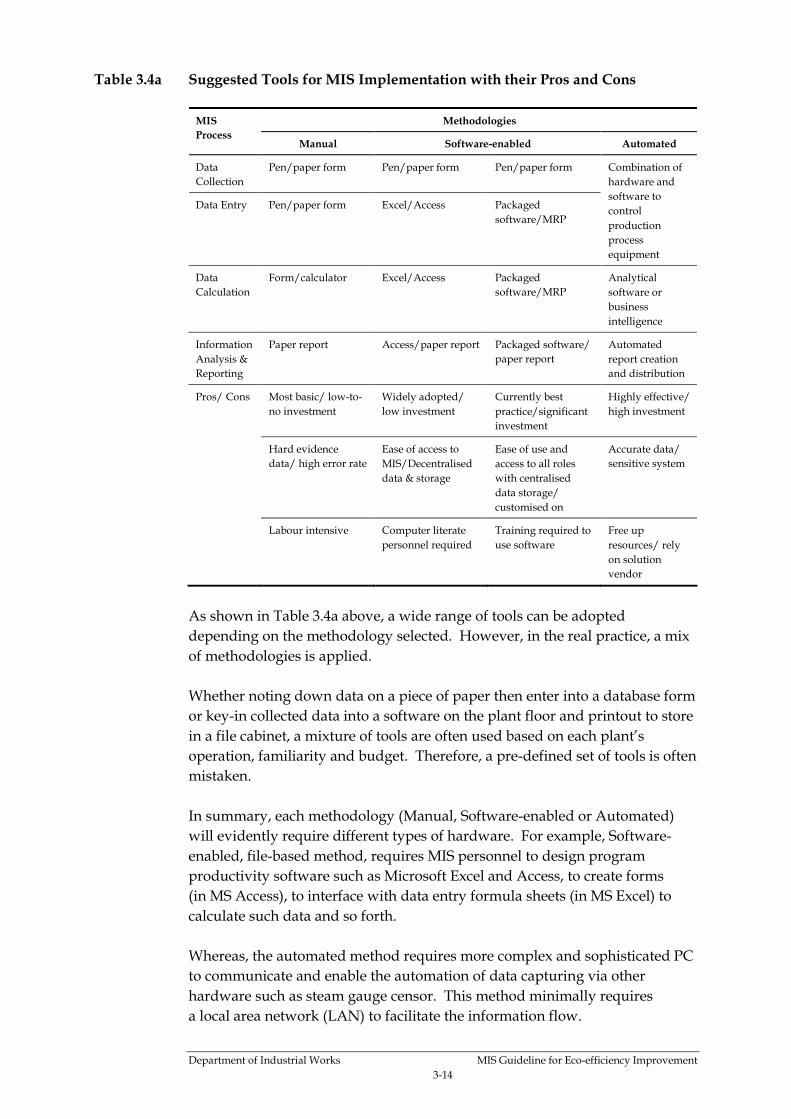
A representative “Production Process Model“ for MIS application for
improving eco-efficiency in native starch industry is shown in Figure 4.1a.
4.2 DATA COLLECTION AND CONSOLIDATION
In order to apply MIS, a set of data will continuously need to be acquired for
further usage. The first step as described in MIS principal process will be the
data collection and entry of each section in MIS production process model
(Figure 4.2a–4.2d). After collecting of data from each section, MIS will need to
consolidate all data into one centralised place whether on paper or in
a computerised format such as an excel file or a database. This is to help
facilitate the information flow for further processes.
As a result of a baseline study, users’ requirement identification and capacity
assessment of representatives of native starch factories, a set of proposed data
to be collected has been established based on their current data collection,
analysis and information usage, and their needs for applying MIS to enhance
business competitiveness and eco-efficiency. Table 4.2a–4.2e illustrate
the proposed data collection scheme for each simplified production process
model/ section of native starch industry.
The data collection scheme addresses proposed data, measurement unit,
priority of data collection, objectives, collection frequency, responsibility, and
measurement methods. It should be noted that the proposed data set has been
prioritised into “Priority 1” and “Priority 2” based on the main purpose of
enhancing the native starch factories to implement a meaningful MIS.
Criteria for data prioritisation are given below:
• Priority 1 – Data that are directly related to native starch productivity and
the use of main raw materials as well as the management of value-added
Department of Industrial Works MIS Guideline for Eco-efficiency Improvement
4-3
unused materials where economically viable to native starch factories.
In addition, environmental data required to be reported to the government
are also included (Examples of data include the use of fresh tapioca root,
the use of water, electricity and effluent quality); and
• Priority 2 – Data that are indirectly related to productivity of the native
starch factories including pollution outputs from the production process,
and also those data that play a key role in the production process however
are hardly or costly measured at present (Examples of data include
saleable peel and pulp and burner stack emissions).
“Priority 1” data are the minimum data requirements for applying meaningful
MIS for increasing business competitiveness and enhancing eco-efficiency for
a typical native starch factory. In addition, these data will be further
processed into information or performance indicators to allow the
management to use and make decisions.
A set of management information is addressed in Table 4.4a of this Guideline.
Locations of data to be collected are illustrated in Figure 4.2a-4.2d.
The collecting locations addressed in Figure 4.2a-4.2d are indicated by
code consisting of a letter with numbering.
Abbreviations of these numerical codes are provided as follows:
• P = Products and By-products (Valuable Unused Materials)
• S = Sales
• L = Efficiency and Losses
• C = Purchases
• I = Input Materials
• E = Energy and Fuel
• W = Waste and Emissions
Whereas, “Priority 2” data are optional data requirements that are useful and
help business competitiveness and eco-efficiency however these data are
considered as the second priority for the native starch factories (with less
concern than “Priority 1” data). Thus, these data will not be transformed to
the information or performance indicators in this Guideline (but these data
could be additionally included according to the specific needs of individual
native starch factory).
In general, the collected data are first stored in a database and processed in
MIS software, and then key performance indicators (KPI) are created and
these information are reported to management for decision-making.
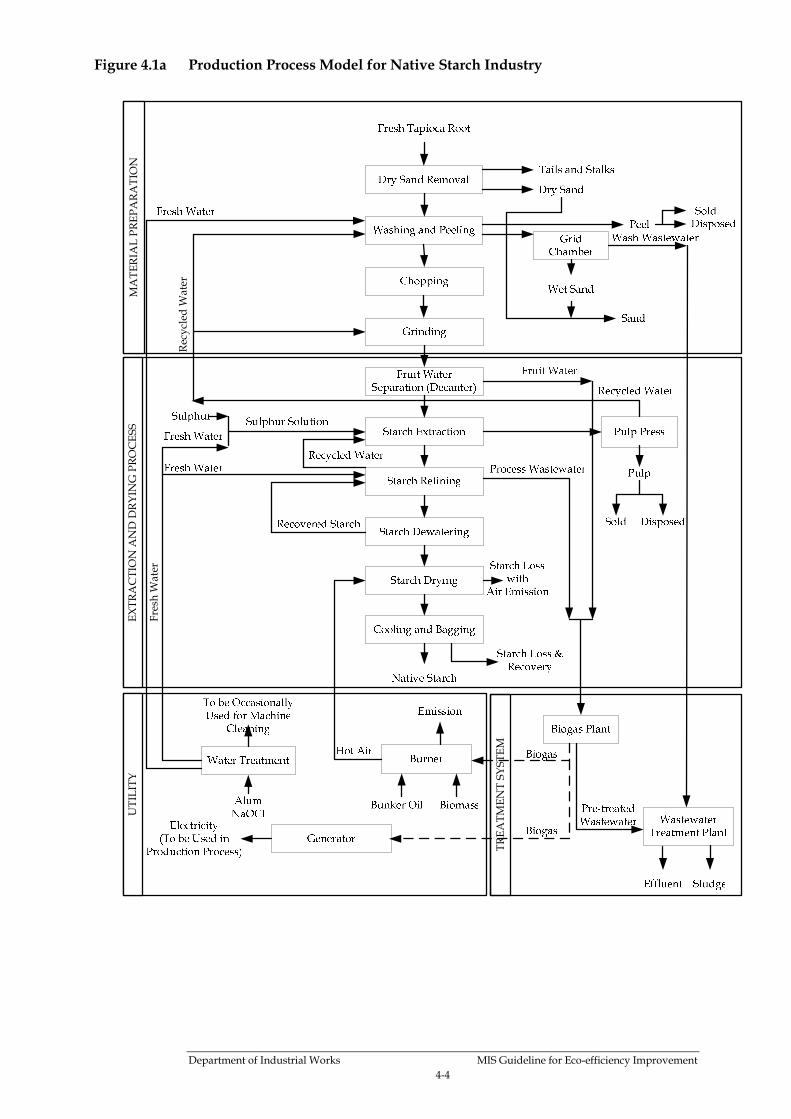
Department of Industrial Works MIS Guideline for Eco-efficiency Improvement
4-4
Figure 4.1a Production Process Model for Native Starch Industry
Recycled W
ater
Fresh W
ater
MATERIAL PREPARATION
EXTRACTION AND DRYING PROCESS
UTILITY
TREATMENT SYSTEM
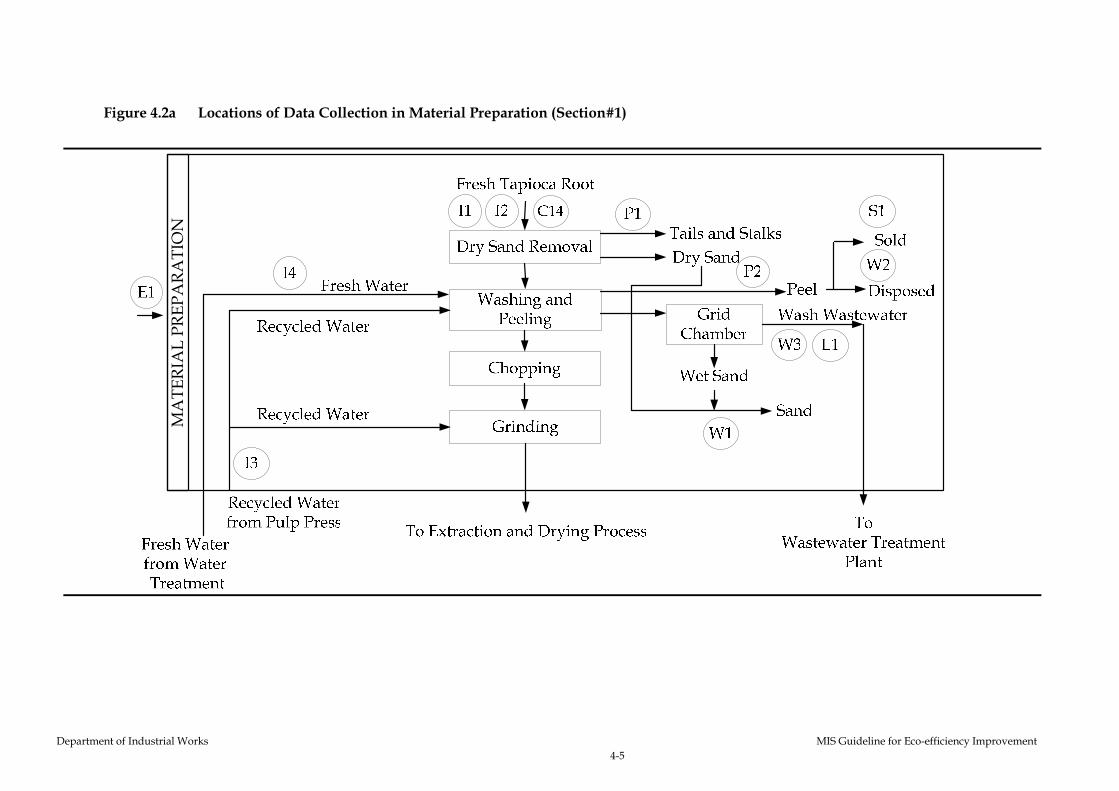
Department of Industrial Works MIS Guideline for Eco-efficiency Improvement
4-5
Figure 4.2a Locations of Data Collection in Material Preparation (Section#1)
MATERIAL PREPARATION
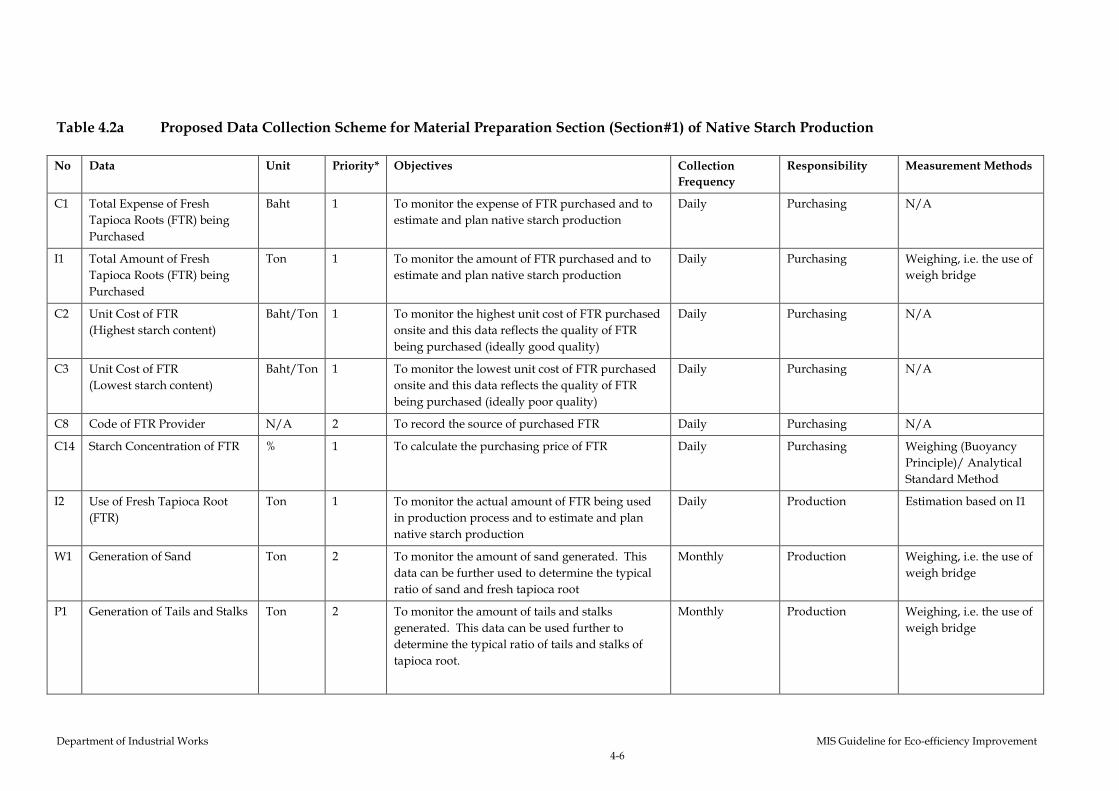
Department of Industrial Works MIS Guideline for Eco-efficiency Improvement
4-6
Table 4.2a Proposed Data Collection Scheme for Material Preparation Section (Section#1) of Native Starch Production
No Data Unit Priority* Objectives Collection
Frequency
Responsibility Measurement Methods
C1 Total Expense of Fresh
Tapioca Roots (FTR) being
Purchased
Baht 1 To monitor the expense of FTR purchased and to
estimate and plan native starch production
Daily Purchasing N/A
I1 Total Amount of Fresh
Tapioca Roots (FTR) being
Purchased
Ton 1 To monitor the amount of FTR purchased and to
estimate and plan native starch production
Daily Purchasing Weighing, i.e. the use of
weigh bridge
C2 Unit Cost of FTR
(Highest starch content)
Baht/Ton 1 To monitor the highest unit cost of FTR purchased
onsite and this data reflects the quality of FTR
being purchased (ideally good quality)
Daily Purchasing N/A
C3 Unit Cost of FTR
(Lowest starch content)
Baht/Ton 1 To monitor the lowest unit cost of FTR purchased
onsite and this data reflects the quality of FTR
being purchased (ideally poor quality)
Daily Purchasing N/A
C8 Code of FTR Provider N/A 2 To record the source of purchased FTR Daily Purchasing N/A
C14 Starch Concentration of FTR % 1 To calculate the purchasing price of FTR Daily Purchasing Weighing (Buoyancy
Principle)/ Analytical
Standard Method
I2 Use of Fresh Tapioca Root
(FTR)
Ton 1 To monitor the actual amount of FTR being used
in production process and to estimate and plan
native starch production
Daily Production Estimation based on I1
W1 Generation of Sand Ton 2 To monitor the amount of sand generated. This
data can be further used to determine the typical
ratio of sand and fresh tapioca root
Monthly Production Weighing, i.e. the use of
weigh bridge
P1 Generation of Tails and Stalks Ton 2 To monitor the amount of tails and stalks
generated. This data can be used further to
determine the typical ratio of tails and stalks of
tapioca root.
Monthly Production Weighing, i.e. the use of
weigh bridge
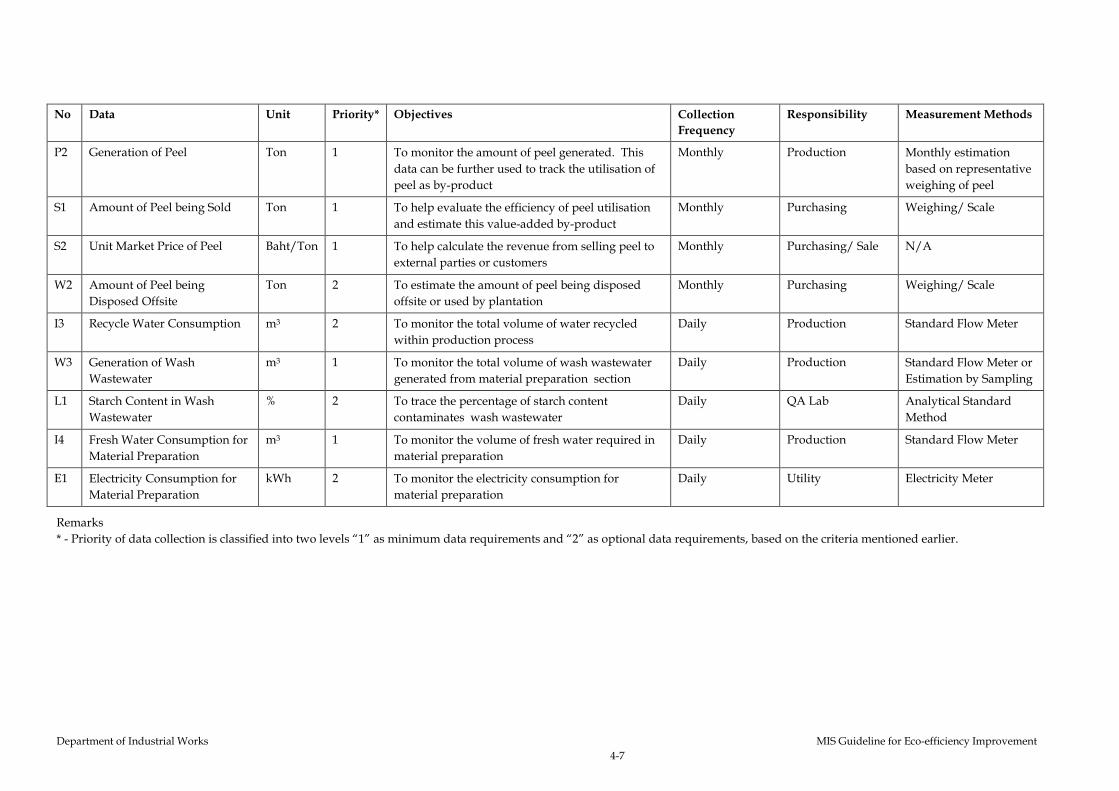
Department of Industrial Works MIS Guideline for Eco-efficiency Improvement
4-7
No Data Unit Priority* Objectives Collection
Frequency
Responsibility Measurement Methods
P2 Generation of Peel Ton 1 To monitor the amount of peel generated. This
data can be further used to track the utilisation of
peel as by-product
Monthly Production Monthly estimation
based on representative
weighing of peel
S1 Amount of Peel being Sold Ton 1 To help evaluate the efficiency of peel utilisation
and estimate this value-added by-product
Monthly Purchasing Weighing/ Scale
S2 Unit Market Price of Peel Baht/Ton 1 To help calculate the revenue from selling peel to
external parties or customers
Monthly Purchasing/ Sale N/A
W2 Amount of Peel being
Disposed Offsite
Ton 2 To estimate the amount of peel being disposed
offsite or used by plantation
Monthly Purchasing Weighing/ Scale
I3 Recycle Water Consumption m3 2 To monitor the total volume of water recycled
within production process
Daily Production Standard Flow Meter
W3 Generation of Wash
Wastewater
m3 1 To monitor the total volume of wash wastewater
generated from material preparation section
Daily Production Standard Flow Meter or
Estimation by Sampling
L1 Starch Content in Wash
Wastewater
% 2 To trace the percentage of starch content
contaminates wash wastewater
Daily QA Lab Analytical Standard
Method
I4 Fresh Water Consumption for
Material Preparation
m3 1 To monitor the volume of fresh water required in
material preparation
Daily Production Standard Flow Meter
E1 Electricity Consumption for
Material Preparation
kWh 2 To monitor the electricity consumption for
material preparation
Daily Utility Electricity Meter
Remarks
* - Priority of data collection is classified into two levels “1” as minimum data requirements and “2” as optional data requirements, based on the criteria mentioned earlier.
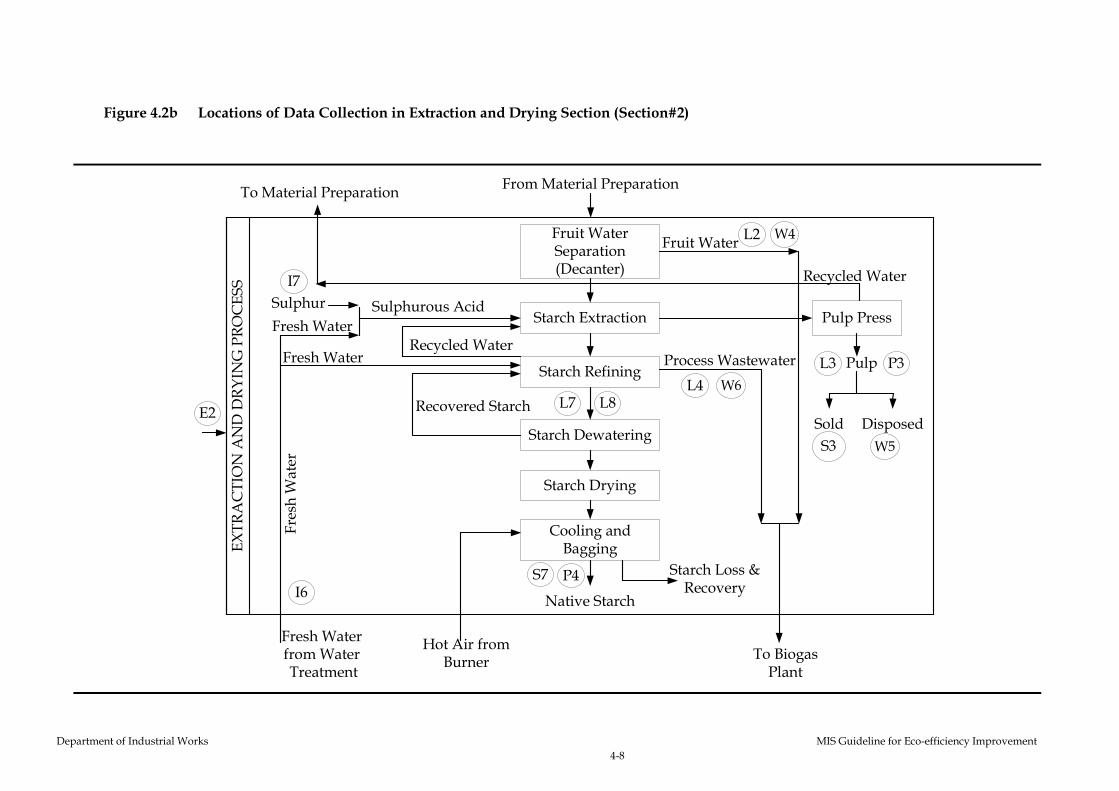
Department of Industrial Works MIS Guideline for Eco-efficiency Improvement
4-8
Figure 4.2b Locations of Data Collection in Extraction and Drying Section (Section#2)
Fruit Water Separation (Decanter)
Starch Extraction
Starch Refining
Starch Dewatering
Starch Drying
Pulp Press
Fruit Water
Pulp
Sulphurous Acid
Recovered Starch
Process Wastewater
Hot Air from Burner
Fresh W
ater
Native Starch
Recycled Water
Sold Disposed
Sulphur
Starch Loss & Recovery
Fresh Water
Fresh Water
Recycled Water
E2
I7
L2
L4
L3 P3
P4
EXTRACTION AND DRYING PROCESS
W5
W6
W4
Cooling and Bagging
Fresh Waterfrom Water Treatment
From Material PreparationTo Material Preparation
To Biogas Plant
I6
S3
L8L7
S7
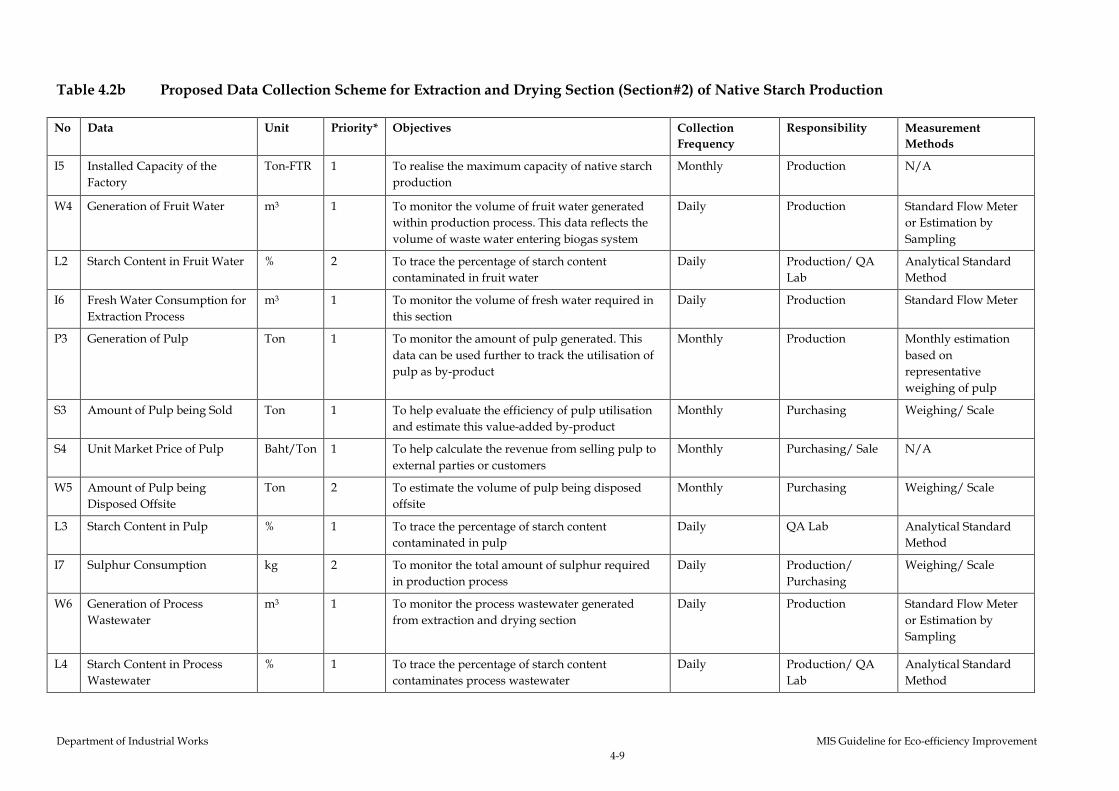
Department of Industrial Works MIS Guideline for Eco-efficiency Improvement
4-9
Table 4.2b Proposed Data Collection Scheme for Extraction and Drying Section (Section#2) of Native Starch Production
No Data Unit Priority* Objectives Collection
Frequency
Responsibility Measurement
Methods
I5 Installed Capacity of the
Factory
Ton-FTR 1 To realise the maximum capacity of native starch
production
Monthly Production N/A
W4 Generation of Fruit Water m3 1 To monitor the volume of fruit water generated
within production process. This data reflects the
volume of waste water entering biogas system
Daily Production Standard Flow Meter
or Estimation by
Sampling
L2 Starch Content in Fruit Water % 2 To trace the percentage of starch content
contaminated in fruit water
Daily Production/ QA
Lab
Analytical Standard
Method
I6 Fresh Water Consumption for
Extraction Process
m3 1 To monitor the volume of fresh water required in
this section
Daily Production Standard Flow Meter
P3 Generation of Pulp Ton 1 To monitor the amount of pulp generated. This
data can be used further to track the utilisation of
pulp as by-product
Monthly Production Monthly estimation
based on
representative
weighing of pulp
S3 Amount of Pulp being Sold Ton 1 To help evaluate the efficiency of pulp utilisation
and estimate this value-added by-product
Monthly Purchasing Weighing/ Scale
S4 Unit Market Price of Pulp Baht/Ton 1 To help calculate the revenue from selling pulp to
external parties or customers
Monthly Purchasing/ Sale N/A
W5 Amount of Pulp being
Disposed Offsite
Ton 2 To estimate the volume of pulp being disposed
offsite
Monthly Purchasing Weighing/ Scale
L3 Starch Content in Pulp % 1 To trace the percentage of starch content
contaminated in pulp
Daily QA Lab Analytical Standard
Method
I7 Sulphur Consumption kg 2 To monitor the total amount of sulphur required
in production process
Daily Production/
Purchasing
Weighing/ Scale
W6 Generation of Process
Wastewater
m3 1 To monitor the process wastewater generated
from extraction and drying section
Daily Production Standard Flow Meter
or Estimation by
Sampling
L4 Starch Content in Process
Wastewater
% 1 To trace the percentage of starch content
contaminates process wastewater
Daily Production/ QA
Lab
Analytical Standard
Method
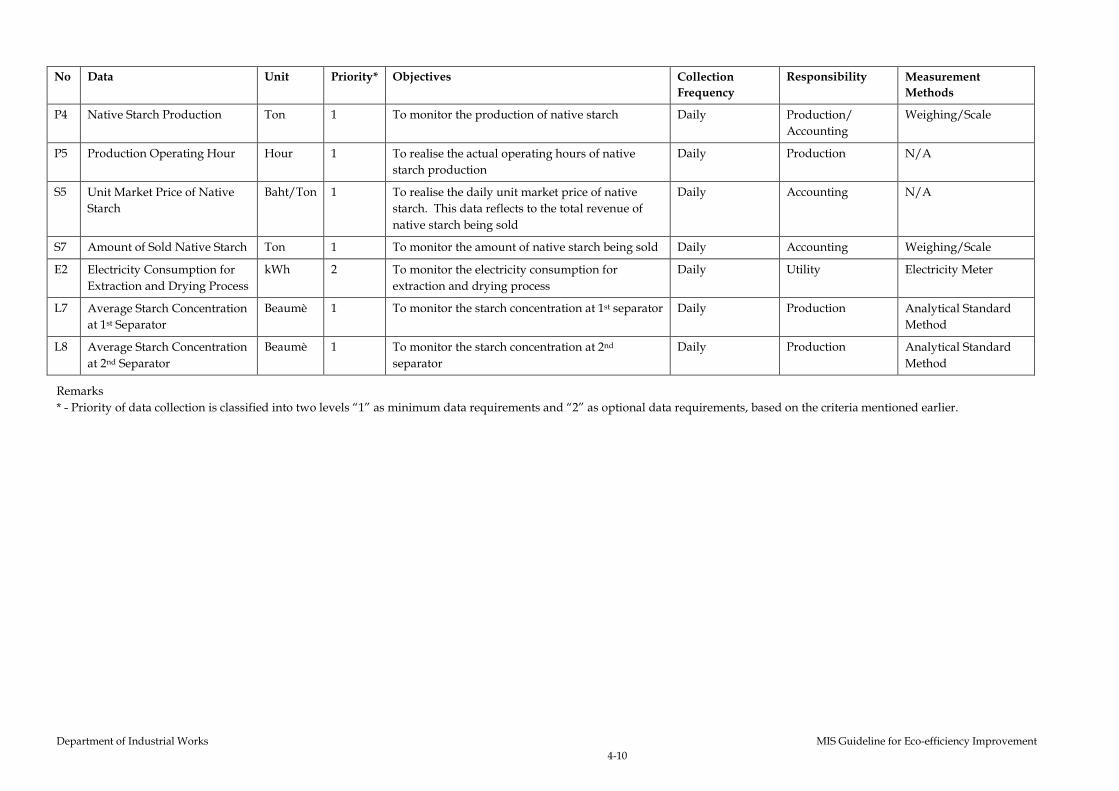
Department of Industrial Works MIS Guideline for Eco-efficiency Improvement
4-10
No Data Unit Priority* Objectives Collection
Frequency
Responsibility Measurement
Methods
P4 Native Starch Production Ton 1 To monitor the production of native starch Daily Production/
Accounting
Weighing/Scale
P5 Production Operating Hour Hour 1 To realise the actual operating hours of native
starch production
Daily Production N/A
S5 Unit Market Price of Native
Starch
Baht/Ton 1 To realise the daily unit market price of native
starch. This data reflects to the total revenue of
native starch being sold
Daily Accounting N/A
S7 Amount of Sold Native Starch Ton 1 To monitor the amount of native starch being sold Daily Accounting Weighing/Scale
E2 Electricity Consumption for
Extraction and Drying Process
kWh 2 To monitor the electricity consumption for
extraction and drying process
Daily Utility Electricity Meter
L7 Average Starch Concentration
at 1st Separator
Beaumè 1 To monitor the starch concentration at 1st separator Daily Production Analytical Standard
Method
L8 Average Starch Concentration
at 2nd Separator
Beaumè 1 To monitor the starch concentration at 2nd
separator
Daily Production Analytical Standard
Method
Remarks
* - Priority of data collection is classified into two levels “1” as minimum data requirements and “2” as optional data requirements, based on the criteria mentioned earlier.
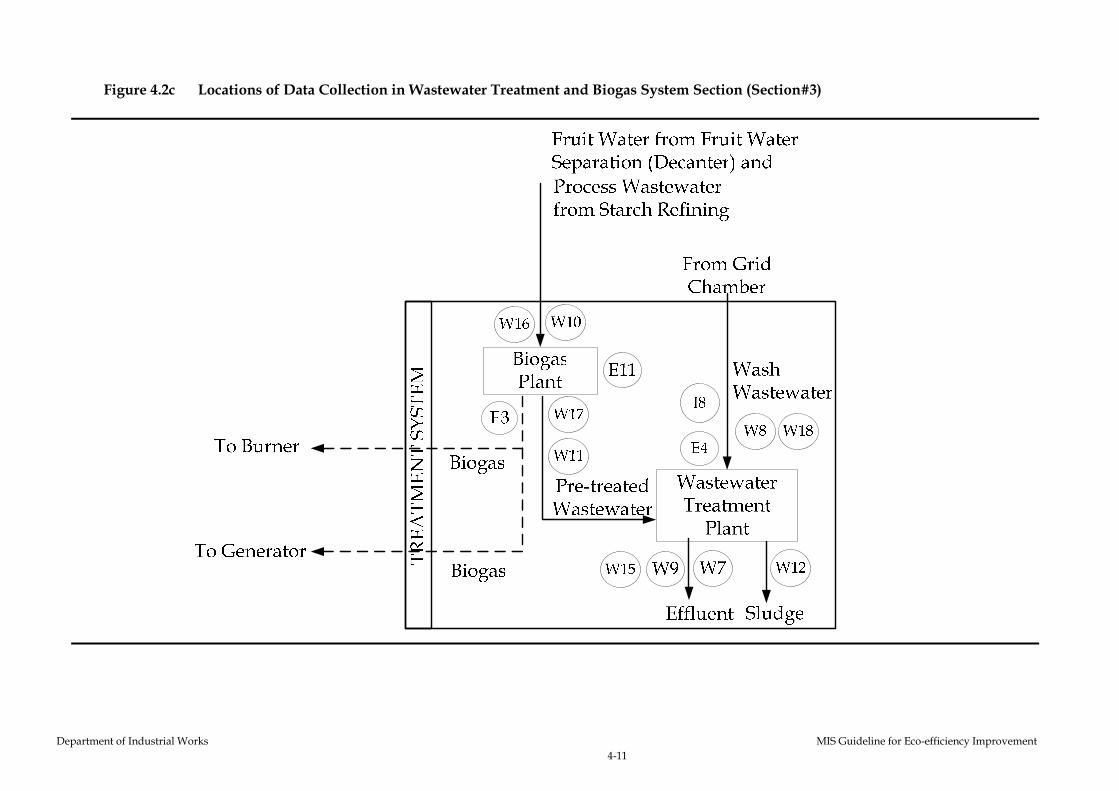
Department of Industrial Works MIS Guideline for Eco-efficiency Improvement
4-11
Figure 4.2c Locations of Data Collection in Wastewater Treatment and Biogas System Section (Section#3)

Department of Industrial Works MIS Guideline for Eco-efficiency Improvement
4-12
Table 4.2c Proposed Data Collection Scheme for Wastewater Treatment and Biogas System Section (Section#3) of Native Starch Production
No Data Unit Priority* Objectives Collection
Frequency
Responsibility Measurement Methods
W7 Total Generation of
Wastewater
m3 1 To monitor the total wastewater generated from
all production processes. This data is reported to
DIW according to regulation
Daily Production Standard Flow Meter or
Estimation by Sampling
or Calculation
W8 Influent Wash Wastewater
Characteristics (BOD) prior to
being sent to the wastewater
treatment system
mg/l 1 To provide information on influent quality (BOD)
and help the estimation of wastewater loading
prior to entering the treatment system, in order to
allow the in-charge operator to properly control
and maintain the treatment efficiency
Monthly QA Lab Analytical Standard
Method
W18 Influent Wash Wastewater
Characteristics (COD) prior to
being sent to the wastewater
treatment system
mg/l 1 To provide information on influent quality (COD)
and help the estimation of wastewater loading
prior to entering the treatment system, in order to
allow the in-charge operator to properly control
and maintain the treatment efficiency
Monthly QA Lab Analytical Standard
Method
W9 Treated Wastewater
Characteristics (BOD) at the
final pond of the treatment
system
mg/l 1 To provide information on compliance status of
treated effluent (BOD)
Monthly QA Lab Analytical Standard
Method
W15 Treated Wastewater
Characteristics (COD) at the
final pond of the treatment
system
mg/l 1 To provide information on compliance status of
treated effluent (COD)
Monthly QA Lab Analytical Standard
Method
W10 Influent Wastewater
Characteristics (BOD) prior to
being sent to Biogas System
mg/l 1 To provide information on influent quality (BOD)
and help the estimation of wastewater loading
prior to entering the biogas system, in order to
allow the in-charge operator to properly control
and maintain the biogas system efficiency
Weekly QA Lab Analytical Standard
Method
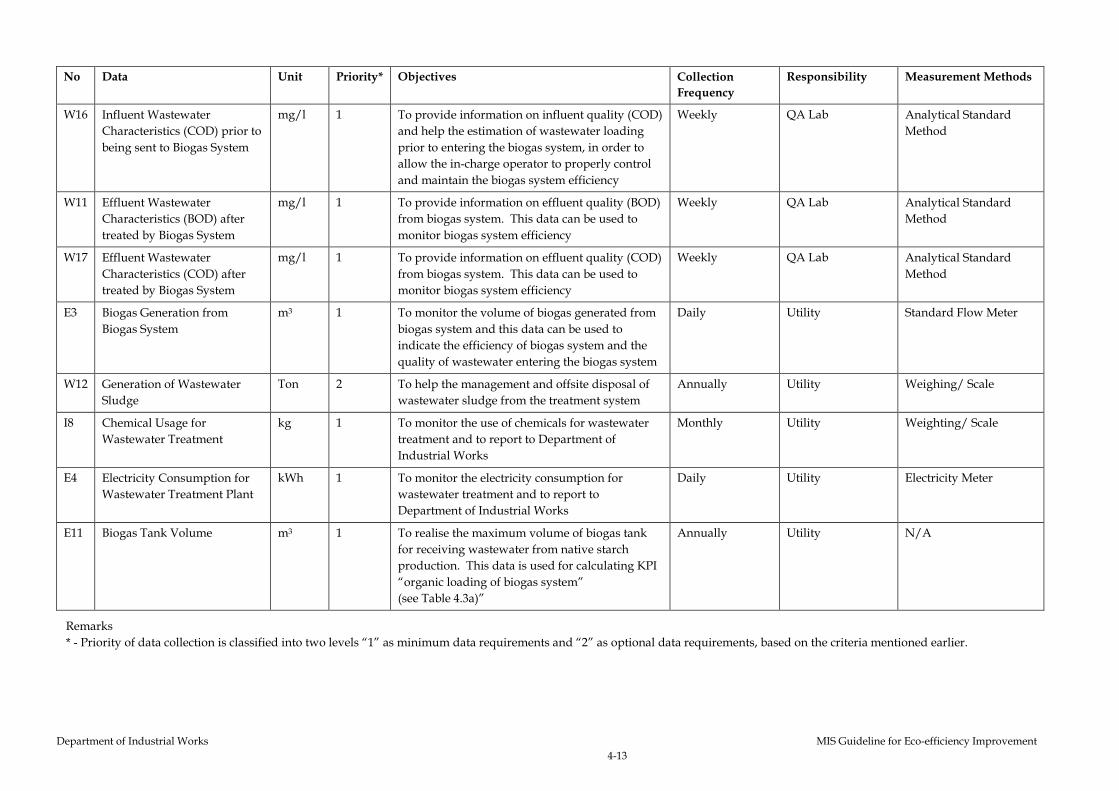
Department of Industrial Works MIS Guideline for Eco-efficiency Improvement
4-13
No Data Unit Priority* Objectives Collection
Frequency
Responsibility Measurement Methods
W16 Influent Wastewater
Characteristics (COD) prior to
being sent to Biogas System
mg/l 1 To provide information on influent quality (COD)
and help the estimation of wastewater loading
prior to entering the biogas system, in order to
allow the in-charge operator to properly control
and maintain the biogas system efficiency
Weekly QA Lab Analytical Standard
Method
W11 Effluent Wastewater
Characteristics (BOD) after
treated by Biogas System
mg/l 1 To provide information on effluent quality (BOD)
from biogas system. This data can be used to
monitor biogas system efficiency
Weekly QA Lab Analytical Standard
Method
W17 Effluent Wastewater
Characteristics (COD) after
treated by Biogas System
mg/l 1 To provide information on effluent quality (COD)
from biogas system. This data can be used to
monitor biogas system efficiency
Weekly QA Lab Analytical Standard
Method
E3 Biogas Generation from
Biogas System
m3 1 To monitor the volume of biogas generated from
biogas system and this data can be used to
indicate the efficiency of biogas system and the
quality of wastewater entering the biogas system
Daily Utility Standard Flow Meter
W12 Generation of Wastewater
Sludge
Ton 2 To help the management and offsite disposal of
wastewater sludge from the treatment system
Annually Utility Weighing/ Scale
I8 Chemical Usage for
Wastewater Treatment
kg 1 To monitor the use of chemicals for wastewater
treatment and to report to Department of
Industrial Works
Monthly Utility Weighting/ Scale
E4 Electricity Consumption for
Wastewater Treatment Plant
kWh 1 To monitor the electricity consumption for
wastewater treatment and to report to
Department of Industrial Works
Daily Utility Electricity Meter
E11 Biogas Tank Volume m3 1 To realise the maximum volume of biogas tank
for receiving wastewater from native starch
production. This data is used for calculating KPI
“organic loading of biogas system”
(see Table 4.3a)”
Annually Utility N/A
Remarks
* - Priority of data collection is classified into two levels “1” as minimum data requirements and “2” as optional data requirements, based on the criteria mentioned earlier.
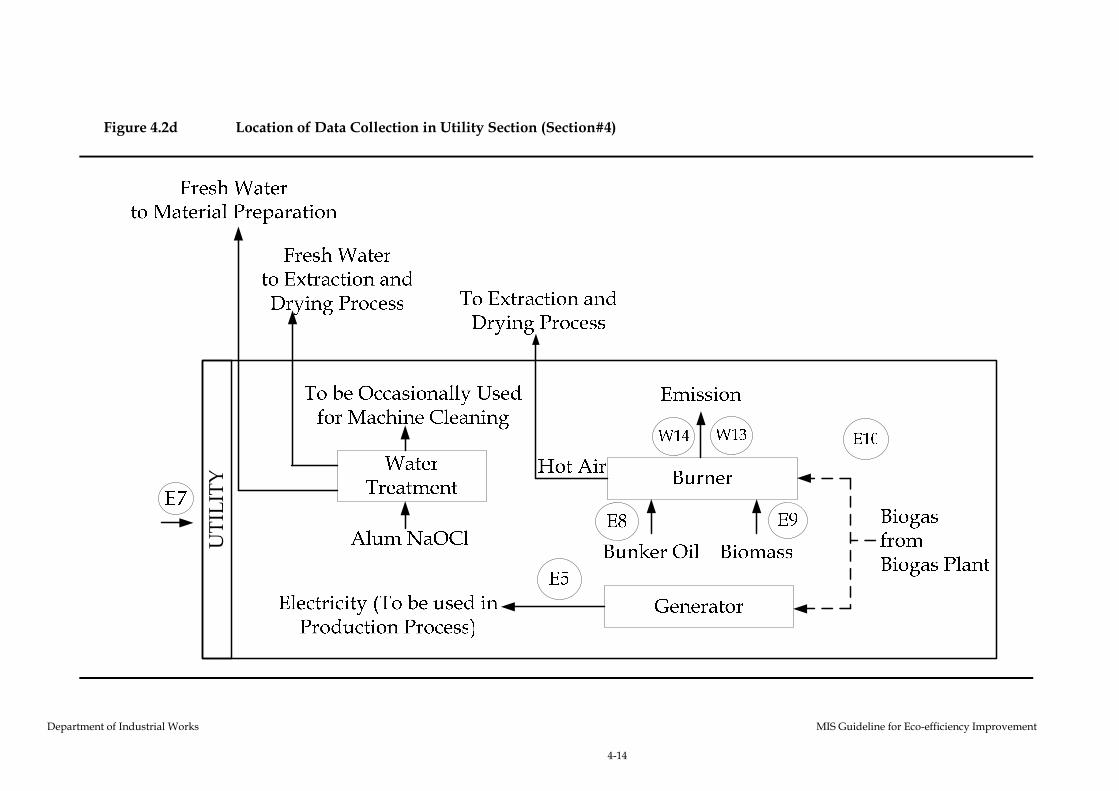
Department of Industrial Works MIS Guideline for Eco-efficiency Improvement
4-14
Figure 4.2d Location of Data Collection in Utility Section (Section#4)
UTILITY
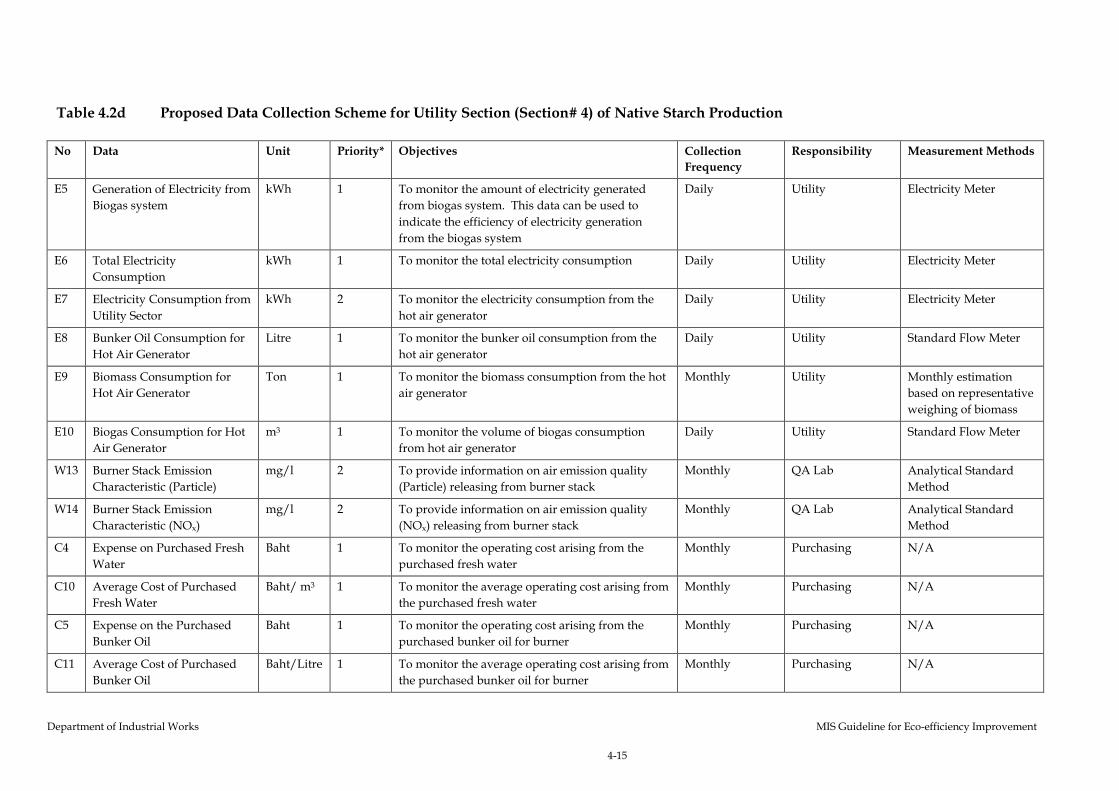
Department of Industrial Works MIS Guideline for Eco-efficiency Improvement
4-15
Table 4.2d Proposed Data Collection Scheme for Utility Section (Section# 4) of Native Starch Production
No Data Unit Priority* Objectives Collection
Frequency
Responsibility Measurement Methods
E5 Generation of Electricity from
Biogas system
kWh 1 To monitor the amount of electricity generated
from biogas system. This data can be used to
indicate the efficiency of electricity generation
from the biogas system
Daily Utility Electricity Meter
E6 Total Electricity
Consumption
kWh 1 To monitor the total electricity consumption Daily Utility Electricity Meter
E7 Electricity Consumption from
Utility Sector
kWh 2 To monitor the electricity consumption from the
hot air generator
Daily Utility Electricity Meter
E8 Bunker Oil Consumption for
Hot Air Generator
Litre 1 To monitor the bunker oil consumption from the
hot air generator
Daily Utility Standard Flow Meter
E9 Biomass Consumption for
Hot Air Generator
Ton 1 To monitor the biomass consumption from the hot
air generator
Monthly Utility Monthly estimation
based on representative
weighing of biomass
E10 Biogas Consumption for Hot
Air Generator
m3 1 To monitor the volume of biogas consumption
from hot air generator
Daily Utility Standard Flow Meter
W13 Burner Stack Emission
Characteristic (Particle)
mg/l 2 To provide information on air emission quality
(Particle) releasing from burner stack
Monthly QA Lab Analytical Standard
Method
W14 Burner Stack Emission
Characteristic (NOx)
mg/l 2 To provide information on air emission quality
(NOx) releasing from burner stack
Monthly QA Lab Analytical Standard
Method
C4 Expense on Purchased Fresh
Water
Baht 1 To monitor the operating cost arising from the
purchased fresh water
Monthly Purchasing N/A
C10 Average Cost of Purchased
Fresh Water
Baht/ m3 1 To monitor the average operating cost arising from
the purchased fresh water
Monthly Purchasing N/A
C5 Expense on the Purchased
Bunker Oil
Baht 1 To monitor the operating cost arising from the
purchased bunker oil for burner
Monthly Purchasing N/A
C11 Average Cost of Purchased
Bunker Oil
Baht/Litre 1 To monitor the average operating cost arising from
the purchased bunker oil for burner
Monthly Purchasing N/A
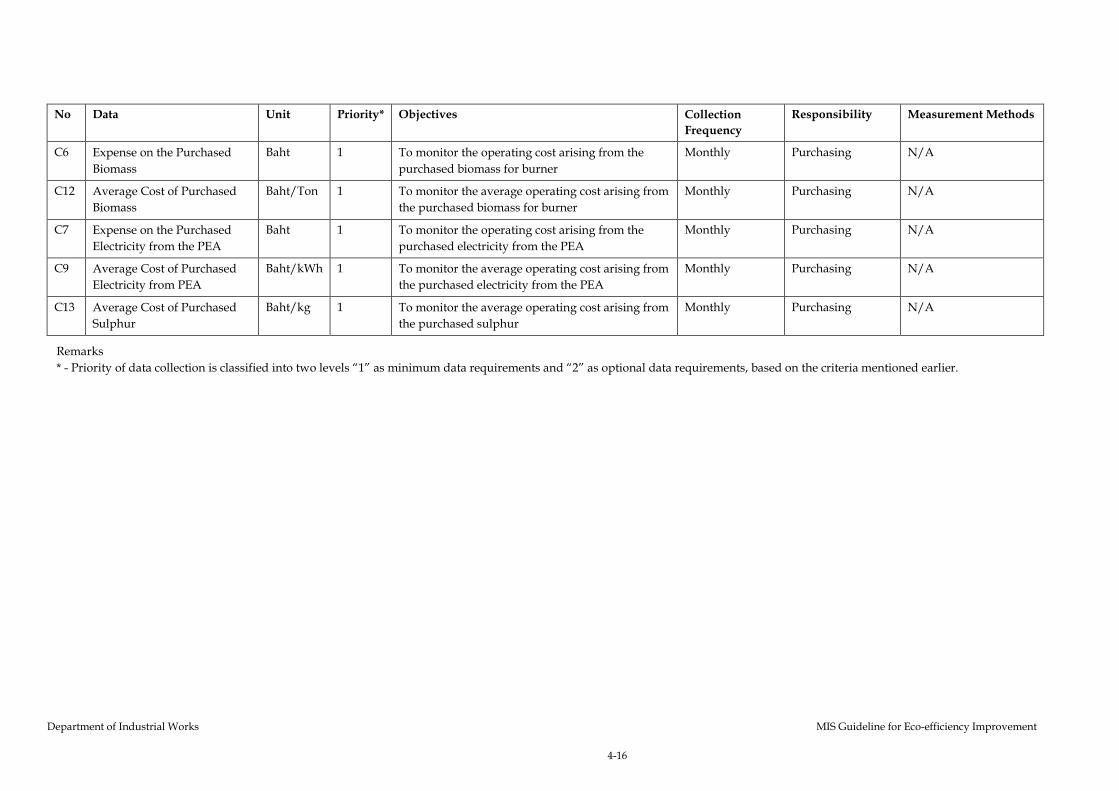
Department of Industrial Works MIS Guideline for Eco-efficiency Improvement
4-16
No Data Unit Priority* Objectives Collection
Frequency
Responsibility Measurement Methods
C6 Expense on the Purchased
Biomass
Baht 1 To monitor the operating cost arising from the
purchased biomass for burner
Monthly Purchasing N/A
C12 Average Cost of Purchased
Biomass
Baht/Ton 1 To monitor the average operating cost arising from
the purchased biomass for burner
Monthly Purchasing N/A
C7 Expense on the Purchased
Electricity from the PEA
Baht 1 To monitor the operating cost arising from the
purchased electricity from the PEA
Monthly Purchasing N/A
C9 Average Cost of Purchased
Electricity from PEA
Baht/kWh 1 To monitor the average operating cost arising from
the purchased electricity from the PEA
Monthly Purchasing N/A
C13 Average Cost of Purchased
Sulphur
Baht/kg 1 To monitor the average operating cost arising from
the purchased sulphur
Monthly Purchasing N/A
Remarks
* - Priority of data collection is classified into two levels “1” as minimum data requirements and “2” as optional data requirements, based on the criteria mentioned earlier.
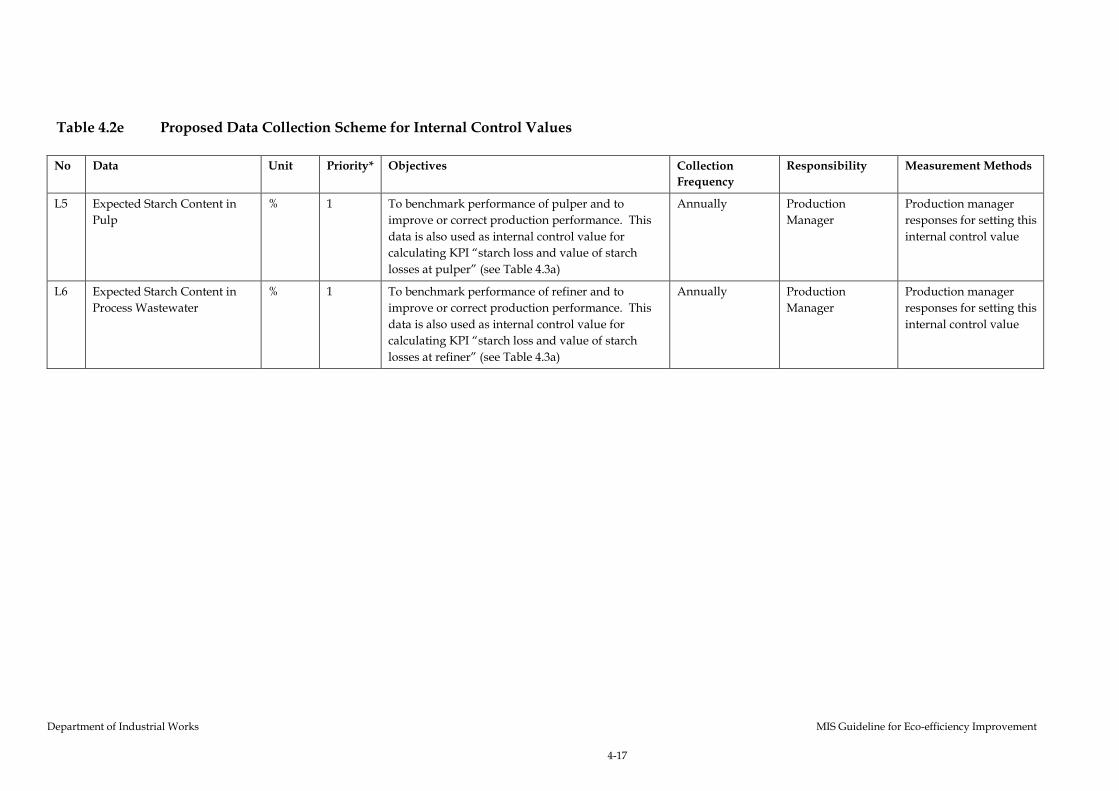
Department of Industrial Works MIS Guideline for Eco-efficiency Improvement
4-17
Table 4.2e Proposed Data Collection Scheme for Internal Control Values
No Data Unit Priority* Objectives Collection
Frequency
Responsibility Measurement Methods
L5 Expected Starch Content in
Pulp
% 1 To benchmark performance of pulper and to
improve or correct production performance. This
data is also used as internal control value for
calculating KPI “starch loss and value of starch
losses at pulper” (see Table 4.3a)
Annually Production
Manager
Production manager
responses for setting this
internal control value
L6 Expected Starch Content in
Process Wastewater
% 1 To benchmark performance of refiner and to
improve or correct production performance. This
data is also used as internal control value for
calculating KPI “starch loss and value of starch
losses at refiner” (see Table 4.3a)
Annually Production
Manager
Production manager
responses for setting this
internal control value
Department of Industrial Works MIS Guideline for Eco-efficiency Improvement
4-18
4.3 DATA PROCESSING
In order to enhance business advantage and eco-efficiency of the native starch
factory, “Priority 1” data listed in the previous section are required to be
processed and transformed into information or key performance indicators
using MIS software that can allow the management of native starch factories
to use such information for their own analysis and making decision.
Table 4.3a illustrates these management information (or key performance
indicators), data calculation formula, and their definitions, whereas Table 4.4a
in the next section suggests on whom the management information are
reported to, and also the reporting frequency.
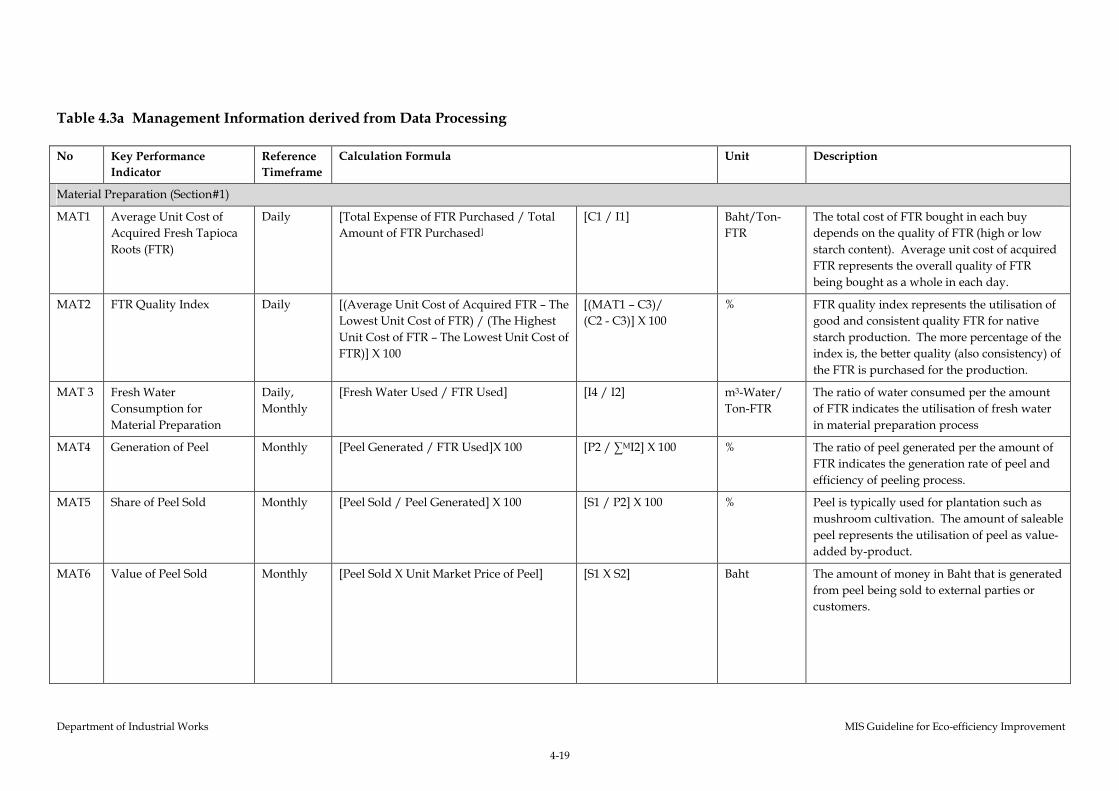
Department of Industrial Works MIS Guideline for Eco-efficiency Improvement
4-19
Table 4.3a Management Information derived from Data Processing
No Key Performance
Indicator
Reference
Timeframe
Calculation Formula Unit Description
Material Preparation (Section#1)
MAT1 Average Unit Cost of
Acquired Fresh Tapioca
Roots (FTR)
Daily [Total Expense of FTR Purchased / Total
Amount of FTR Purchased] [C1 / I1] Baht/Ton-
FTR
The total cost of FTR bought in each buy
depends on the quality of FTR (high or low
starch content). Average unit cost of acquired
FTR represents the overall quality of FTR
being bought as a whole in each day.
MAT2 FTR Quality Index Daily [(Average Unit Cost of Acquired FTR – The
Lowest Unit Cost of FTR) / (The Highest
Unit Cost of FTR – The Lowest Unit Cost of
FTR)] X 100
[(MAT1 – C3)/
(C2 - C3)] X 100
% FTR quality index represents the utilisation of
good and consistent quality FTR for native
starch production. The more percentage of the
index is, the better quality (also consistency) of
the FTR is purchased for the production.
MAT 3 Fresh Water
Consumption for
Material Preparation
Daily,
Monthly
[Fresh Water Used / FTR Used] [I4 / I2] m3-Water/
Ton-FTR
The ratio of water consumed per the amount
of FTR indicates the utilisation of fresh water
in material preparation process
MAT4 Generation of Peel Monthly [Peel Generated / FTR Used]X 100 [P2 / ∑MI2] X 100 % The ratio of peel generated per the amount of
FTR indicates the generation rate of peel and
efficiency of peeling process.
MAT5 Share of Peel Sold Monthly [Peel Sold / Peel Generated] X 100 [S1 / P2] X 100 % Peel is typically used for plantation such as
mushroom cultivation. The amount of saleable
peel represents the utilisation of peel as value-
added by-product.
MAT6 Value of Peel Sold Monthly [Peel Sold X Unit Market Price of Peel] [S1 X S2] Baht The amount of money in Baht that is generated
from peel being sold to external parties or
customers.
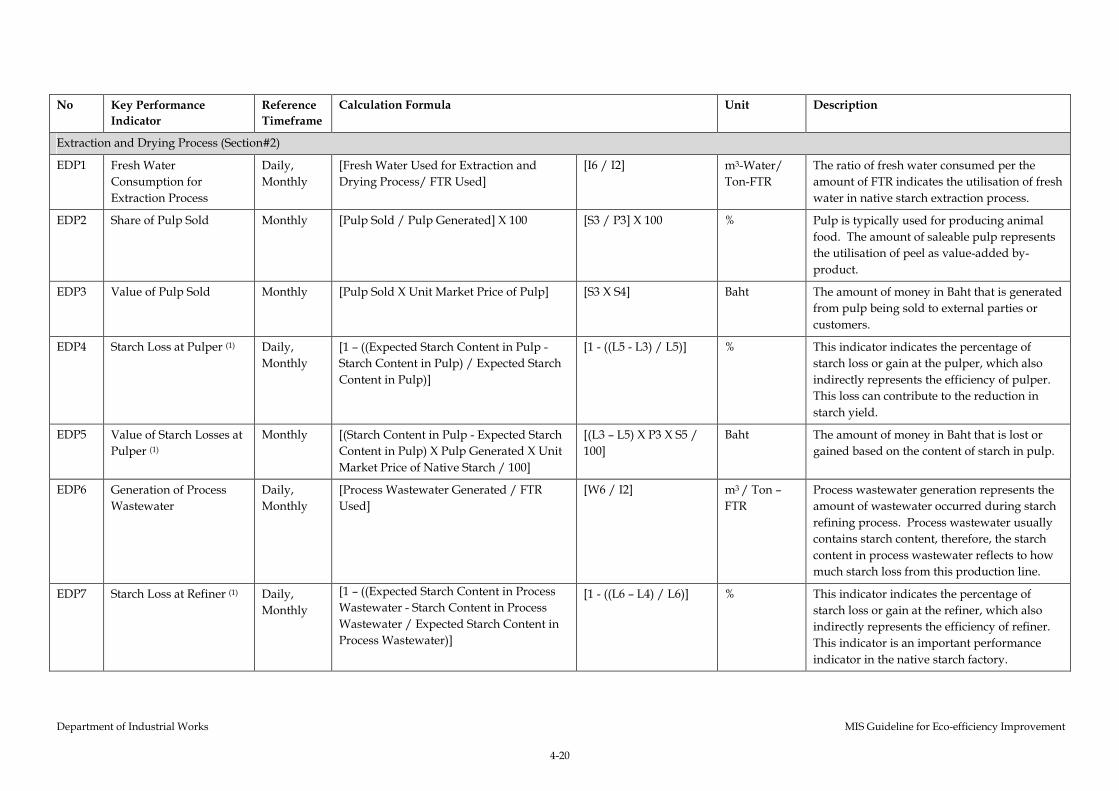
Department of Industrial Works MIS Guideline for Eco-efficiency Improvement
4-20
No Key Performance
Indicator
Reference
Timeframe
Calculation Formula Unit Description
Extraction and Drying Process (Section#2)
EDP1 Fresh Water
Consumption for
Extraction Process
Daily,
Monthly
[Fresh Water Used for Extraction and
Drying Process/ FTR Used]
[I6 / I2] m3-Water/
Ton-FTR
The ratio of fresh water consumed per the
amount of FTR indicates the utilisation of fresh
water in native starch extraction process.
EDP2 Share of Pulp Sold Monthly [Pulp Sold / Pulp Generated] X 100 [S3 / P3] X 100 % Pulp is typically used for producing animal
food. The amount of saleable pulp represents
the utilisation of peel as value-added by-
product.
EDP3 Value of Pulp Sold Monthly [Pulp Sold X Unit Market Price of Pulp] [S3 X S4] Baht The amount of money in Baht that is generated
from pulp being sold to external parties or
customers.
EDP4 Starch Loss at Pulper (1) Daily,
Monthly
[1 – ((Expected Starch Content in Pulp -
Starch Content in Pulp) / Expected Starch
Content in Pulp)]
[1 - ((L5 - L3) / L5)] % This indicator indicates the percentage of
starch loss or gain at the pulper, which also
indirectly represents the efficiency of pulper.
This loss can contribute to the reduction in
starch yield.
EDP5 Value of Starch Losses at
Pulper (1)
Monthly [(Starch Content in Pulp - Expected Starch
Content in Pulp) X Pulp Generated X Unit
Market Price of Native Starch / 100]
[(L3 – L5) X P3 X S5 /
100]
Baht The amount of money in Baht that is lost or
gained based on the content of starch in pulp.
EDP6 Generation of Process
Wastewater
Daily,
Monthly
[Process Wastewater Generated / FTR
Used]
[W6 / I2] m3 / Ton –
FTR
Process wastewater generation represents the
amount of wastewater occurred during starch
refining process. Process wastewater usually
contains starch content, therefore, the starch
content in process wastewater reflects to how
much starch loss from this production line.
EDP7 Starch Loss at Refiner (1) Daily,
Monthly
[1 – ((Expected Starch Content in Process
Wastewater - Starch Content in Process
Wastewater / Expected Starch Content in
Process Wastewater)]
[1 - ((L6 – L4) / L6)] % This indicator indicates the percentage of
starch loss or gain at the refiner, which also
indirectly represents the efficiency of refiner.
This indicator is an important performance
indicator in the native starch factory.
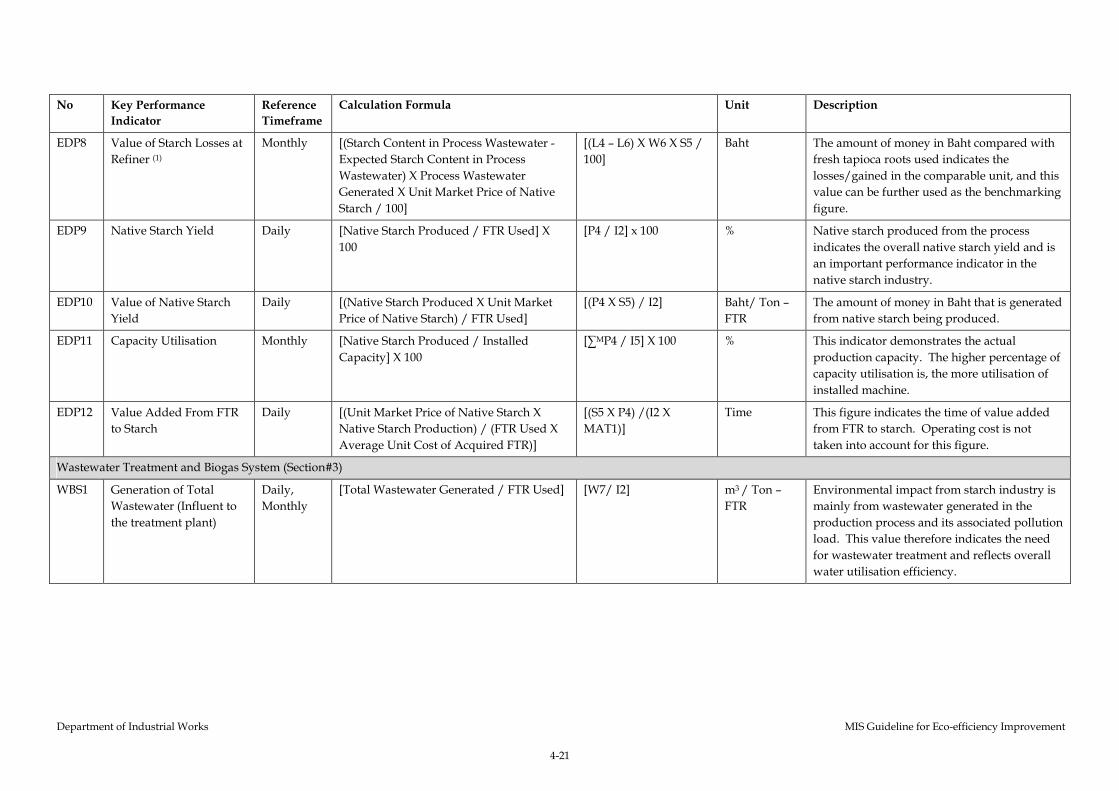
Department of Industrial Works MIS Guideline for Eco-efficiency Improvement
4-21
No Key Performance
Indicator
Reference
Timeframe
Calculation Formula Unit Description
EDP8 Value of Starch Losses at
Refiner (1)
Monthly [(Starch Content in Process Wastewater -
Expected Starch Content in Process
Wastewater) X Process Wastewater
Generated X Unit Market Price of Native
Starch / 100]
[(L4 – L6) X W6 X S5 /
100]
Baht The amount of money in Baht compared with
fresh tapioca roots used indicates the
losses/gained in the comparable unit, and this
value can be further used as the benchmarking
figure.
EDP9 Native Starch Yield Daily [Native Starch Produced / FTR Used] X
100
[P4 / I2] x 100 % Native starch produced from the process
indicates the overall native starch yield and is
an important performance indicator in the
native starch industry.
EDP10 Value of Native Starch
Yield
Daily [(Native Starch Produced X Unit Market
Price of Native Starch) / FTR Used]
[(P4 X S5) / I2] Baht/ Ton –
FTR
The amount of money in Baht that is generated
from native starch being produced.
EDP11 Capacity Utilisation Monthly [Native Starch Produced / Installed
Capacity] X 100
[∑MP4 / I5] X 100 % This indicator demonstrates the actual
production capacity. The higher percentage of
capacity utilisation is, the more utilisation of
installed machine.
EDP12 Value Added From FTR
to Starch
Daily [(Unit Market Price of Native Starch X
Native Starch Production) / (FTR Used X
Average Unit Cost of Acquired FTR)]
[(S5 X P4) /(I2 X
MAT1)]
Time This figure indicates the time of value added
from FTR to starch. Operating cost is not
taken into account for this figure.
Wastewater Treatment and Biogas System (Section#3)
WBS1 Generation of Total
Wastewater (Influent to
the treatment plant)
Daily,
Monthly
[Total Wastewater Generated / FTR Used] [W7/ I2] m3 / Ton –
FTR
Environmental impact from starch industry is
mainly from wastewater generated in the
production process and its associated pollution
load. This value therefore indicates the need
for wastewater treatment and reflects overall
water utilisation efficiency.
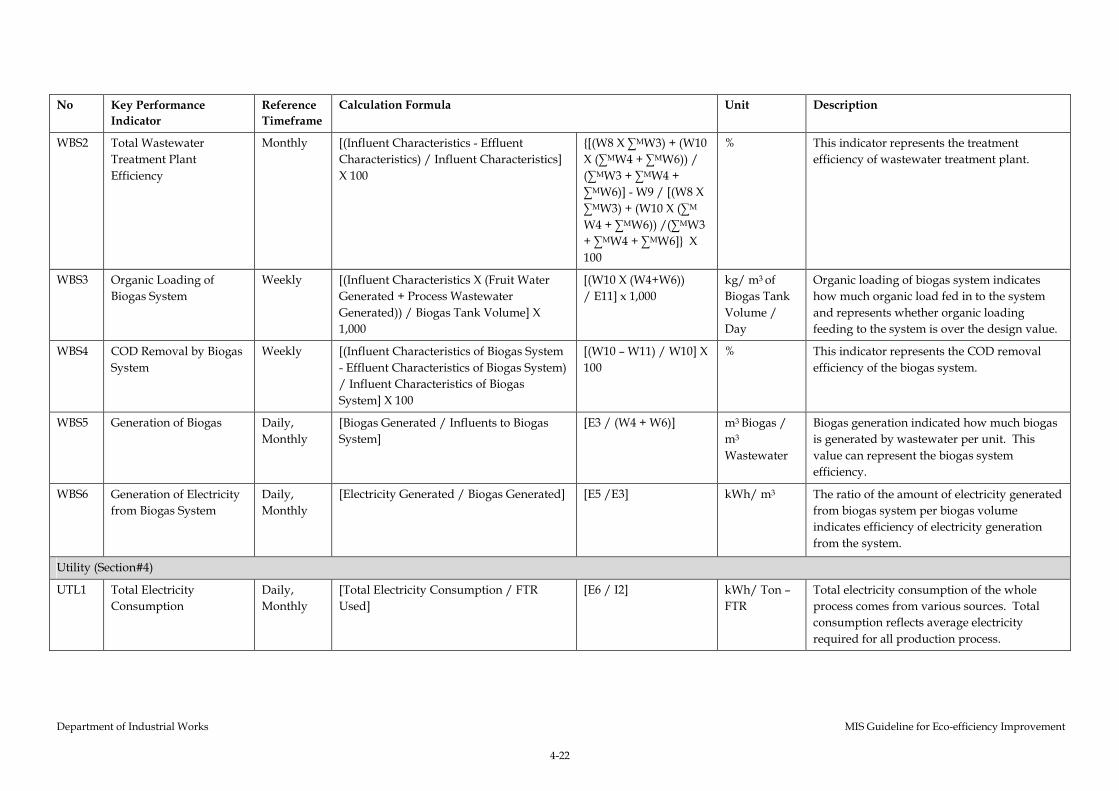
Department of Industrial Works MIS Guideline for Eco-efficiency Improvement
4-22
No Key Performance
Indicator
Reference
Timeframe
Calculation Formula Unit Description
WBS2 Total Wastewater
Treatment Plant
Efficiency
Monthly [(Influent Characteristics - Effluent
Characteristics) / Influent Characteristics]
X 100
{[(W8 X ∑MW3) + (W10
X (∑MW4 + ∑MW6)) /
(∑MW3 + ∑MW4 +
∑MW6)] - W9 / [(W8 X
∑MW3) + (W10 X (∑M
W4 + ∑MW6)) /(∑MW3
+ ∑MW4 + ∑MW6]} X
100
% This indicator represents the treatment
efficiency of wastewater treatment plant.
WBS3 Organic Loading of
Biogas System
Weekly [(Influent Characteristics X (Fruit Water
Generated + Process Wastewater
Generated)) / Biogas Tank Volume] X
1,000
[(W10 X (W4+W6))
/ E11] x 1,000
kg/ m3 of
Biogas Tank
Volume /
Day
Organic loading of biogas system indicates
how much organic load fed in to the system
and represents whether organic loading
feeding to the system is over the design value.
WBS4 COD Removal by Biogas
System
Weekly [(Influent Characteristics of Biogas System
- Effluent Characteristics of Biogas System)
/ Influent Characteristics of Biogas
System] X 100
[(W10 – W11) / W10] X
100
% This indicator represents the COD removal
efficiency of the biogas system.
WBS5 Generation of Biogas Daily,
Monthly
[Biogas Generated / Influents to Biogas
System]
[E3 / (W4 + W6)] m3 Biogas /
m3
Wastewater
Biogas generation indicated how much biogas
is generated by wastewater per unit. This
value can represent the biogas system
efficiency.
WBS6 Generation of Electricity
from Biogas System
Daily,
Monthly
[Electricity Generated / Biogas Generated] [E5 /E3] kWh/ m3 The ratio of the amount of electricity generated
from biogas system per biogas volume
indicates efficiency of electricity generation
from the system.
Utility (Section#4)
UTL1 Total Electricity
Consumption
Daily,
Monthly
[Total Electricity Consumption / FTR
Used]
[E6 / I2] kWh/ Ton –
FTR
Total electricity consumption of the whole
process comes from various sources. Total
consumption reflects average electricity
required for all production process.
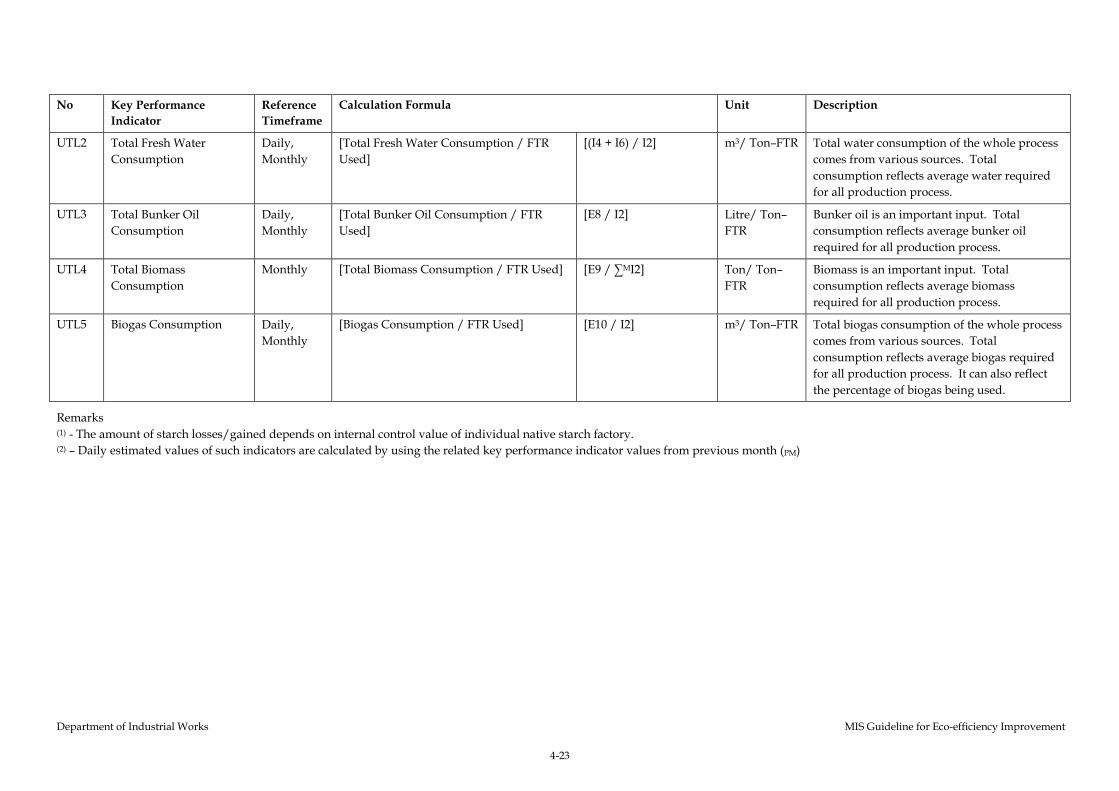
Department of Industrial Works MIS Guideline for Eco-efficiency Improvement
4-23
No Key Performance
Indicator
Reference
Timeframe
Calculation Formula Unit Description
UTL2 Total Fresh Water
Consumption
Daily,
Monthly
[Total Fresh Water Consumption / FTR
Used]
[(I4 + I6) / I2] m3/ Ton–FTR Total water consumption of the whole process
comes from various sources. Total
consumption reflects average water required
for all production process.
UTL3 Total Bunker Oil
Consumption
Daily,
Monthly
[Total Bunker Oil Consumption / FTR
Used]
[E8 / I2] Litre/ Ton–
FTR
Bunker oil is an important input. Total
consumption reflects average bunker oil
required for all production process.
UTL4 Total Biomass
Consumption
Monthly [Total Biomass Consumption / FTR Used] [E9 / ∑MI2] Ton/ Ton–
FTR
Biomass is an important input. Total
consumption reflects average biomass
required for all production process.
UTL5 Biogas Consumption Daily,
Monthly
[Biogas Consumption / FTR Used] [E10 / I2] m3/ Ton–FTR Total biogas consumption of the whole process
comes from various sources. Total
consumption reflects average biogas required
for all production process. It can also reflect
the percentage of biogas being used.
Remarks (1) - The amount of starch losses/gained depends on internal control value of individual native starch factory. (2) – Daily estimated values of such indicators are calculated by using the related key performance indicator values from previous month (PM)
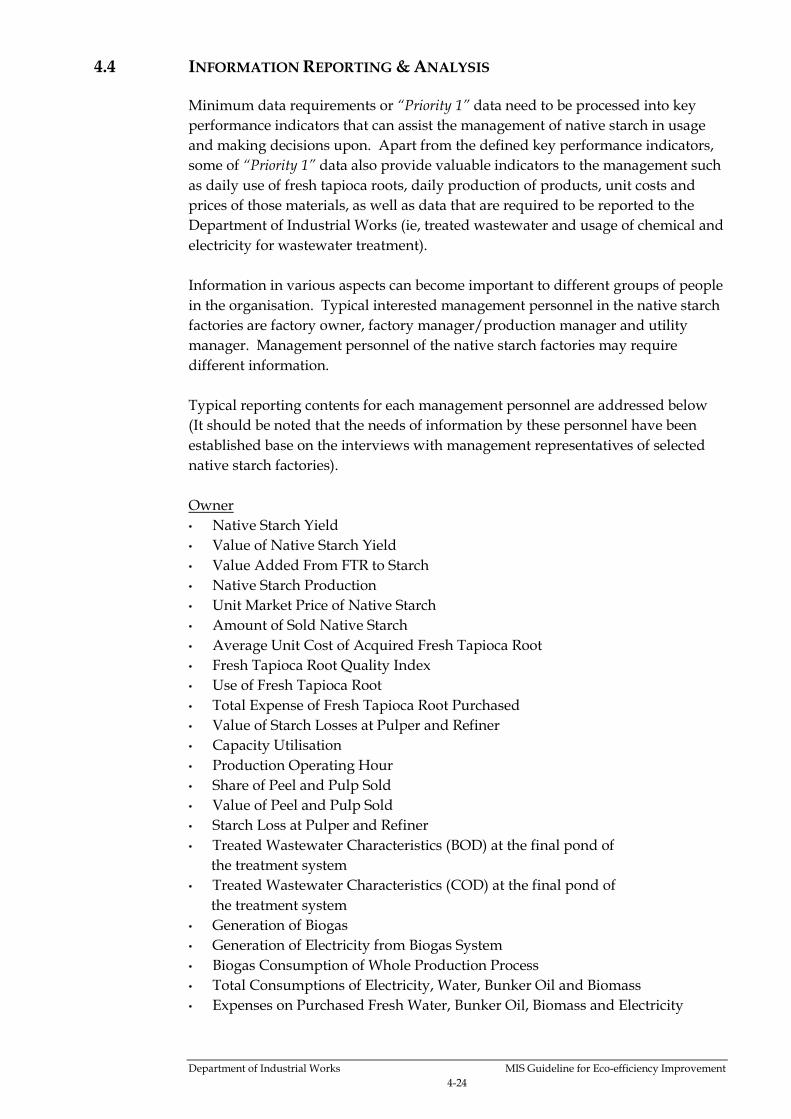
Department of Industrial Works MIS Guideline for Eco-efficiency Improvement
4-24
4.4 INFORMATION REPORTING & ANALYSIS
Minimum data requirements or “Priority 1” data need to be processed into key
performance indicators that can assist the management of native starch in usage
and making decisions upon. Apart from the defined key performance indicators,
some of “Priority 1” data also provide valuable indicators to the management such
as daily use of fresh tapioca roots, daily production of products, unit costs and
prices of those materials, as well as data that are required to be reported to the
Department of Industrial Works (ie, treated wastewater and usage of chemical and
electricity for wastewater treatment).
Information in various aspects can become important to different groups of people
in the organisation. Typical interested management personnel in the native starch
factories are factory owner, factory manager/production manager and utility
manager. Management personnel of the native starch factories may require
different information.
Typical reporting contents for each management personnel are addressed below
(It should be noted that the needs of information by these personnel have been
established base on the interviews with management representatives of selected
native starch factories).
Owner
• Native Starch Yield
• Value of Native Starch Yield
• Value Added From FTR to Starch
• Native Starch Production
• Unit Market Price of Native Starch
• Amount of Sold Native Starch
• Average Unit Cost of Acquired Fresh Tapioca Root
• Fresh Tapioca Root Quality Index
• Use of Fresh Tapioca Root
• Total Expense of Fresh Tapioca Root Purchased
• Value of Starch Losses at Pulper and Refiner
• Capacity Utilisation
• Production Operating Hour
• Share of Peel and Pulp Sold
• Value of Peel and Pulp Sold
• Starch Loss at Pulper and Refiner
• Treated Wastewater Characteristics (BOD) at the final pond of
the treatment system
• Treated Wastewater Characteristics (COD) at the final pond of
the treatment system
• Generation of Biogas
• Generation of Electricity from Biogas System
• Biogas Consumption of Whole Production Process
• Total Consumptions of Electricity, Water, Bunker Oil and Biomass
• Expenses on Purchased Fresh Water, Bunker Oil, Biomass and Electricity
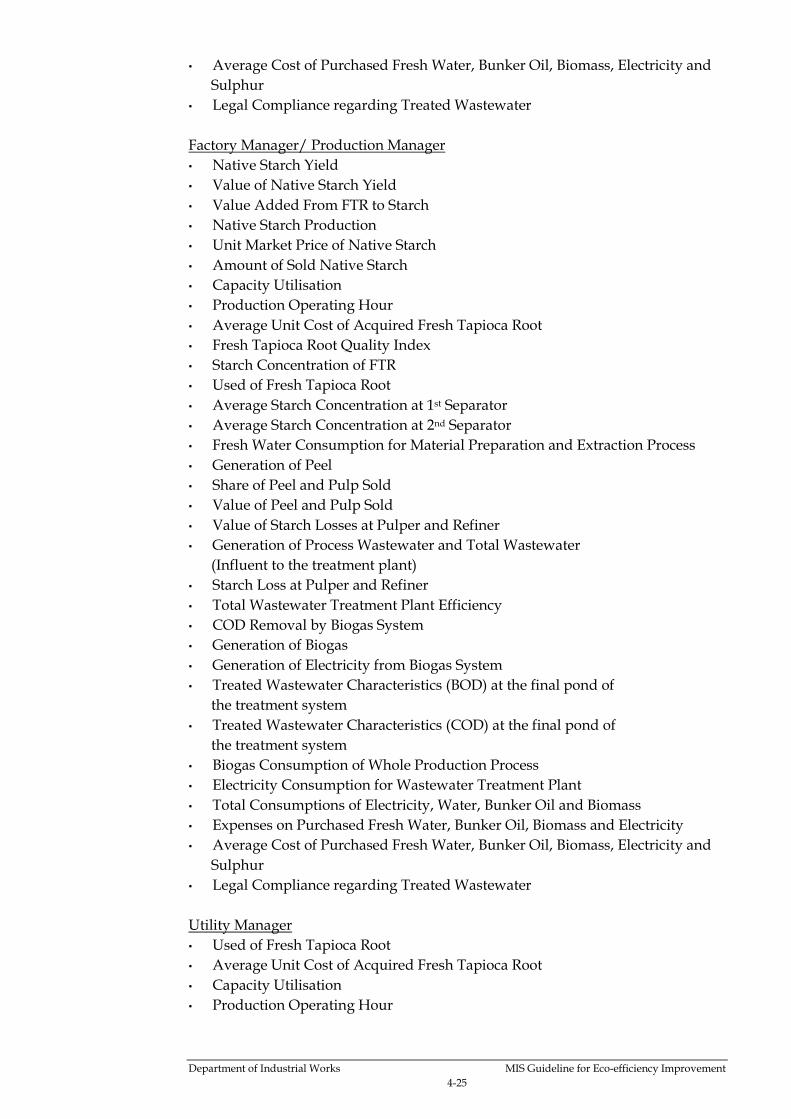
Department of Industrial Works MIS Guideline for Eco-efficiency Improvement
4-25
• Average Cost of Purchased Fresh Water, Bunker Oil, Biomass, Electricity and
Sulphur
• Legal Compliance regarding Treated Wastewater
Factory Manager/ Production Manager
• Native Starch Yield
• Value of Native Starch Yield
• Value Added From FTR to Starch
• Native Starch Production
• Unit Market Price of Native Starch
• Amount of Sold Native Starch
• Capacity Utilisation
• Production Operating Hour
• Average Unit Cost of Acquired Fresh Tapioca Root
• Fresh Tapioca Root Quality Index
• Starch Concentration of FTR
• Used of Fresh Tapioca Root
• Average Starch Concentration at 1st Separator
• Average Starch Concentration at 2nd Separator
• Fresh Water Consumption for Material Preparation and Extraction Process
• Generation of Peel
• Share of Peel and Pulp Sold
• Value of Peel and Pulp Sold
• Value of Starch Losses at Pulper and Refiner
• Generation of Process Wastewater and Total Wastewater
(Influent to the treatment plant)
• Starch Loss at Pulper and Refiner
• Total Wastewater Treatment Plant Efficiency
• COD Removal by Biogas System
• Generation of Biogas
• Generation of Electricity from Biogas System
• Treated Wastewater Characteristics (BOD) at the final pond of
the treatment system
• Treated Wastewater Characteristics (COD) at the final pond of
the treatment system
• Biogas Consumption of Whole Production Process
• Electricity Consumption for Wastewater Treatment Plant
• Total Consumptions of Electricity, Water, Bunker Oil and Biomass
• Expenses on Purchased Fresh Water, Bunker Oil, Biomass and Electricity
• Average Cost of Purchased Fresh Water, Bunker Oil, Biomass, Electricity and
Sulphur
• Legal Compliance regarding Treated Wastewater
Utility Manager
• Used of Fresh Tapioca Root
• Average Unit Cost of Acquired Fresh Tapioca Root
• Capacity Utilisation
• Production Operating Hour
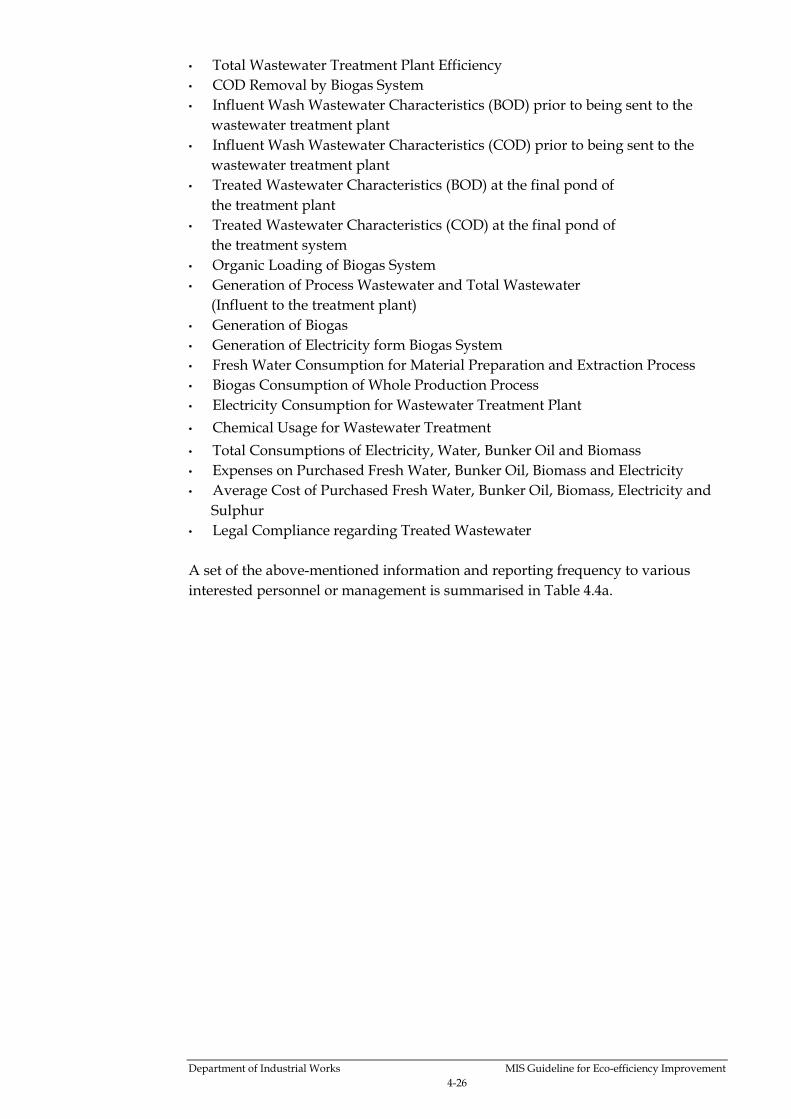
Department of Industrial Works MIS Guideline for Eco-efficiency Improvement
4-26
• Total Wastewater Treatment Plant Efficiency
• COD Removal by Biogas System
• Influent Wash Wastewater Characteristics (BOD) prior to being sent to the
wastewater treatment plant
• Influent Wash Wastewater Characteristics (COD) prior to being sent to the
wastewater treatment plant
• Treated Wastewater Characteristics (BOD) at the final pond of
the treatment plant
• Treated Wastewater Characteristics (COD) at the final pond of
the treatment system
• Organic Loading of Biogas System
• Generation of Process Wastewater and Total Wastewater
(Influent to the treatment plant)
• Generation of Biogas
• Generation of Electricity form Biogas System
• Fresh Water Consumption for Material Preparation and Extraction Process
• Biogas Consumption of Whole Production Process
• Electricity Consumption for Wastewater Treatment Plant
• Chemical Usage for Wastewater Treatment
• Total Consumptions of Electricity, Water, Bunker Oil and Biomass
• Expenses on Purchased Fresh Water, Bunker Oil, Biomass and Electricity
• Average Cost of Purchased Fresh Water, Bunker Oil, Biomass, Electricity and
Sulphur
• Legal Compliance regarding Treated Wastewater
A set of the above-mentioned information and reporting frequency to various
interested personnel or management is summarised in Table 4.4a.
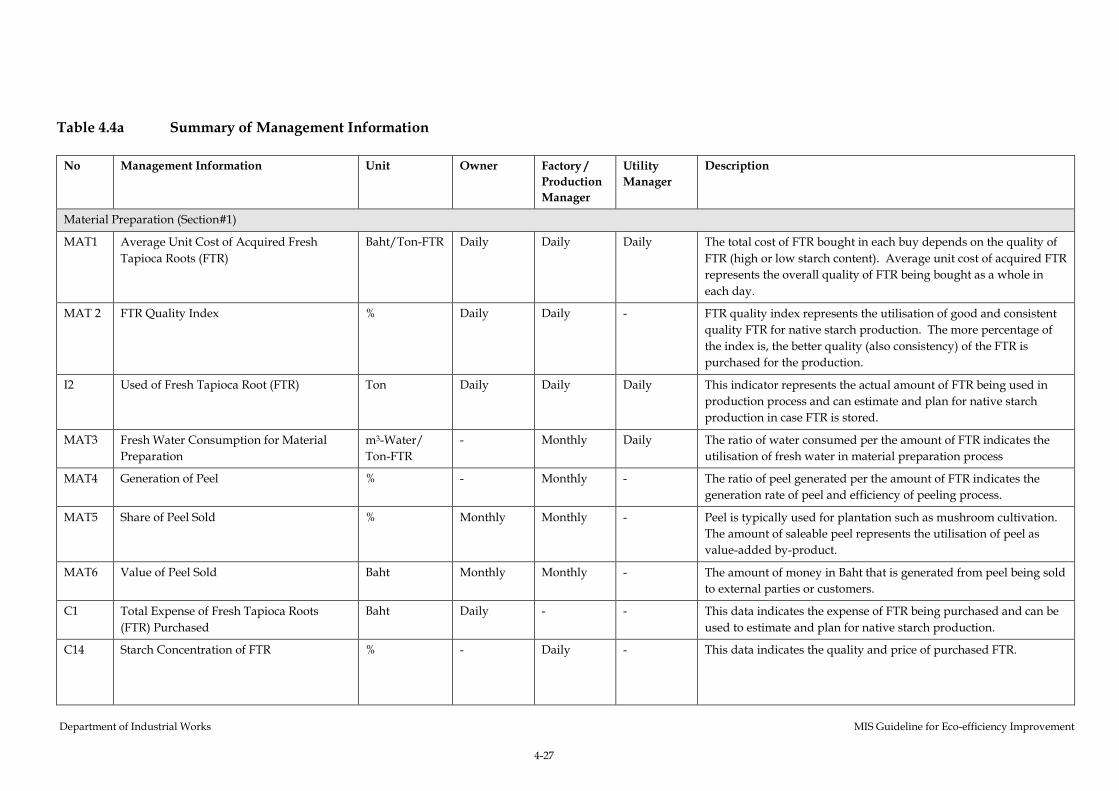
Department of Industrial Works MIS Guideline for Eco-efficiency Improvement
4-27
Table 4.4a Summary of Management Information
No Management Information Unit Owner Factory /
Production
Manager
Utility
Manager
Description
Material Preparation (Section#1)
MAT1 Average Unit Cost of Acquired Fresh
Tapioca Roots (FTR)
Baht/Ton-FTR Daily Daily Daily The total cost of FTR bought in each buy depends on the quality of
FTR (high or low starch content). Average unit cost of acquired FTR
represents the overall quality of FTR being bought as a whole in
each day.
MAT 2 FTR Quality Index % Daily Daily - FTR quality index represents the utilisation of good and consistent
quality FTR for native starch production. The more percentage of
the index is, the better quality (also consistency) of the FTR is
purchased for the production.
I2 Used of Fresh Tapioca Root (FTR) Ton Daily Daily Daily This indicator represents the actual amount of FTR being used in
production process and can estimate and plan for native starch
production in case FTR is stored.
MAT3 Fresh Water Consumption for Material
Preparation
m3-Water/
Ton-FTR
- Monthly Daily The ratio of water consumed per the amount of FTR indicates the
utilisation of fresh water in material preparation process
MAT4 Generation of Peel % - Monthly - The ratio of peel generated per the amount of FTR indicates the
generation rate of peel and efficiency of peeling process.
MAT5 Share of Peel Sold % Monthly Monthly - Peel is typically used for plantation such as mushroom cultivation.
The amount of saleable peel represents the utilisation of peel as
value-added by-product.
MAT6 Value of Peel Sold Baht Monthly Monthly - The amount of money in Baht that is generated from peel being sold
to external parties or customers.
C1 Total Expense of Fresh Tapioca Roots
(FTR) Purchased
Baht Daily - - This data indicates the expense of FTR being purchased and can be
used to estimate and plan for native starch production.
C14 Starch Concentration of FTR % - Daily - This data indicates the quality and price of purchased FTR.
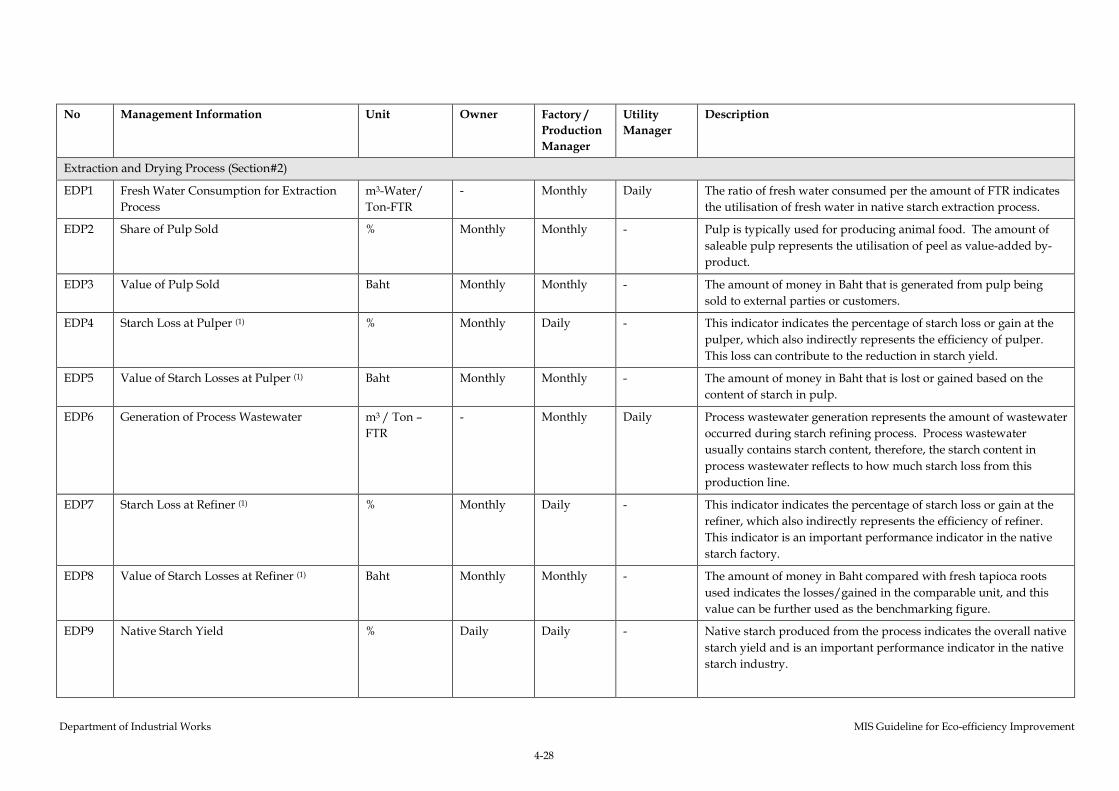
Department of Industrial Works MIS Guideline for Eco-efficiency Improvement
4-28
No Management Information Unit Owner Factory /
Production
Manager
Utility
Manager
Description
Extraction and Drying Process (Section#2)
EDP1 Fresh Water Consumption for Extraction
Process
m3-Water/
Ton-FTR
- Monthly Daily The ratio of fresh water consumed per the amount of FTR indicates
the utilisation of fresh water in native starch extraction process.
EDP2 Share of Pulp Sold % Monthly Monthly - Pulp is typically used for producing animal food. The amount of
saleable pulp represents the utilisation of peel as value-added by-
product.
EDP3 Value of Pulp Sold Baht Monthly Monthly - The amount of money in Baht that is generated from pulp being
sold to external parties or customers.
EDP4 Starch Loss at Pulper (1) % Monthly Daily - This indicator indicates the percentage of starch loss or gain at the
pulper, which also indirectly represents the efficiency of pulper.
This loss can contribute to the reduction in starch yield.
EDP5 Value of Starch Losses at Pulper (1) Baht Monthly Monthly - The amount of money in Baht that is lost or gained based on the
content of starch in pulp.
EDP6 Generation of Process Wastewater m3 / Ton –
FTR
- Monthly Daily Process wastewater generation represents the amount of wastewater
occurred during starch refining process. Process wastewater
usually contains starch content, therefore, the starch content in
process wastewater reflects to how much starch loss from this
production line.
EDP7 Starch Loss at Refiner (1) % Monthly Daily - This indicator indicates the percentage of starch loss or gain at the
refiner, which also indirectly represents the efficiency of refiner.
This indicator is an important performance indicator in the native
starch factory.
EDP8 Value of Starch Losses at Refiner (1) Baht Monthly Monthly - The amount of money in Baht compared with fresh tapioca roots
used indicates the losses/gained in the comparable unit, and this
value can be further used as the benchmarking figure.
EDP9 Native Starch Yield % Daily Daily - Native starch produced from the process indicates the overall native
starch yield and is an important performance indicator in the native
starch industry.
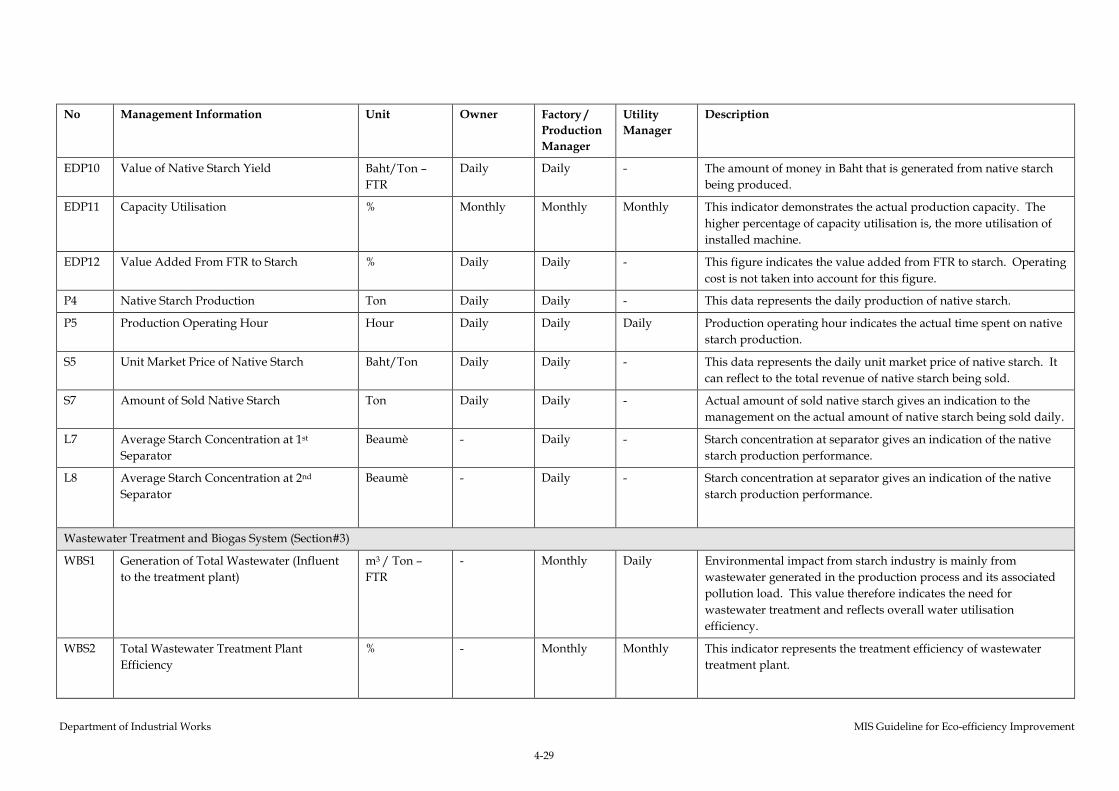
Department of Industrial Works MIS Guideline for Eco-efficiency Improvement
4-29
No Management Information Unit Owner Factory /
Production
Manager
Utility
Manager
Description
EDP10 Value of Native Starch Yield Baht/Ton –
FTR
Daily Daily - The amount of money in Baht that is generated from native starch
being produced.
EDP11 Capacity Utilisation % Monthly Monthly Monthly This indicator demonstrates the actual production capacity. The
higher percentage of capacity utilisation is, the more utilisation of
installed machine.
EDP12 Value Added From FTR to Starch % Daily Daily - This figure indicates the value added from FTR to starch. Operating
cost is not taken into account for this figure.
P4 Native Starch Production Ton Daily Daily - This data represents the daily production of native starch.
P5 Production Operating Hour Hour Daily Daily Daily Production operating hour indicates the actual time spent on native
starch production.
S5 Unit Market Price of Native Starch Baht/Ton Daily Daily - This data represents the daily unit market price of native starch. It
can reflect to the total revenue of native starch being sold.
S7 Amount of Sold Native Starch Ton Daily Daily - Actual amount of sold native starch gives an indication to the
management on the actual amount of native starch being sold daily.
L7 Average Starch Concentration at 1st
Separator
Beaumè - Daily - Starch concentration at separator gives an indication of the native
starch production performance.
L8 Average Starch Concentration at 2nd
Separator
Beaumè - Daily - Starch concentration at separator gives an indication of the native
starch production performance.
Wastewater Treatment and Biogas System (Section#3)
WBS1 Generation of Total Wastewater (Influent
to the treatment plant)
m3 / Ton –
FTR
- Monthly Daily Environmental impact from starch industry is mainly from
wastewater generated in the production process and its associated
pollution load. This value therefore indicates the need for
wastewater treatment and reflects overall water utilisation
efficiency.
WBS2 Total Wastewater Treatment Plant
Efficiency
% - Monthly Monthly This indicator represents the treatment efficiency of wastewater
treatment plant.
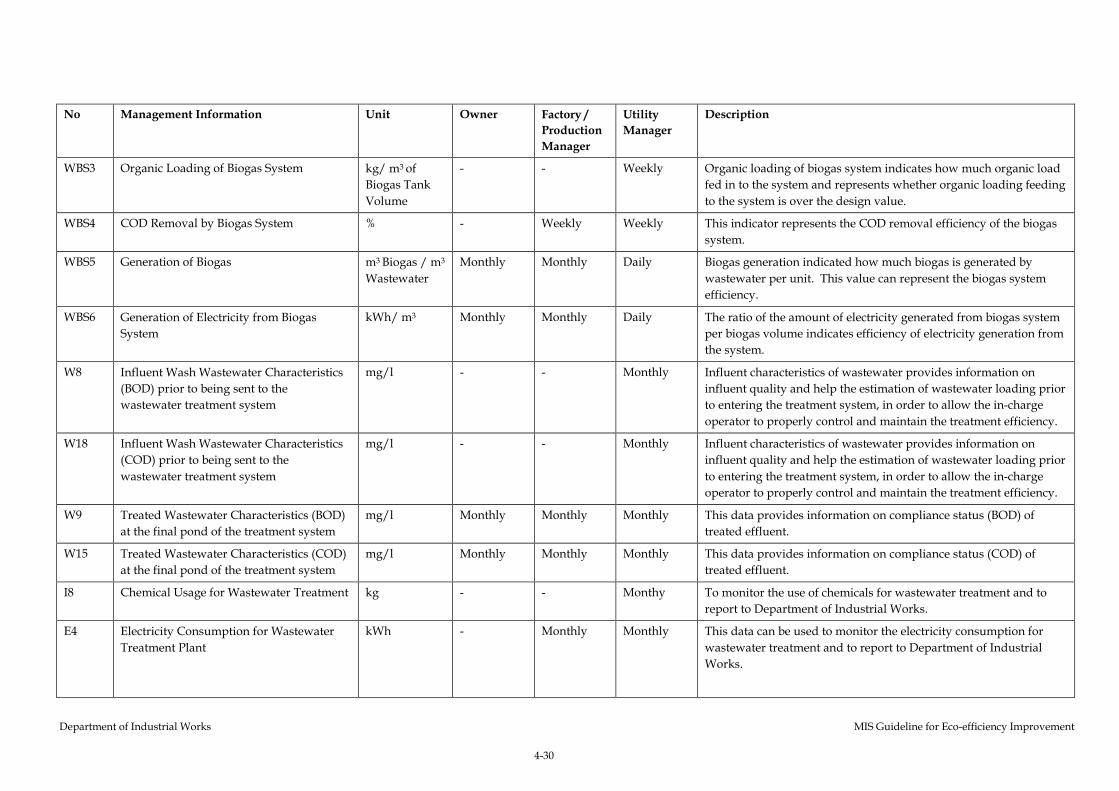
Department of Industrial Works MIS Guideline for Eco-efficiency Improvement
4-30
No Management Information Unit Owner Factory /
Production
Manager
Utility
Manager
Description
WBS3 Organic Loading of Biogas System kg/ m3 of
Biogas Tank
Volume
- - Weekly Organic loading of biogas system indicates how much organic load
fed in to the system and represents whether organic loading feeding
to the system is over the design value.
WBS4 COD Removal by Biogas System % - Weekly Weekly This indicator represents the COD removal efficiency of the biogas
system.
WBS5 Generation of Biogas m3 Biogas / m3
Wastewater
Monthly Monthly Daily Biogas generation indicated how much biogas is generated by
wastewater per unit. This value can represent the biogas system
efficiency.
WBS6 Generation of Electricity from Biogas
System
kWh/ m3 Monthly Monthly Daily The ratio of the amount of electricity generated from biogas system
per biogas volume indicates efficiency of electricity generation from
the system.
W8 Influent Wash Wastewater Characteristics
(BOD) prior to being sent to the
wastewater treatment system
mg/l - - Monthly Influent characteristics of wastewater provides information on
influent quality and help the estimation of wastewater loading prior
to entering the treatment system, in order to allow the in-charge
operator to properly control and maintain the treatment efficiency.
W18 Influent Wash Wastewater Characteristics
(COD) prior to being sent to the
wastewater treatment system
mg/l - - Monthly Influent characteristics of wastewater provides information on
influent quality and help the estimation of wastewater loading prior
to entering the treatment system, in order to allow the in-charge
operator to properly control and maintain the treatment efficiency.
W9 Treated Wastewater Characteristics (BOD)
at the final pond of the treatment system
mg/l Monthly Monthly Monthly This data provides information on compliance status (BOD) of
treated effluent.
W15 Treated Wastewater Characteristics (COD)
at the final pond of the treatment system
mg/l Monthly Monthly Monthly This data provides information on compliance status (COD) of
treated effluent.
I8 Chemical Usage for Wastewater Treatment kg - - Monthy To monitor the use of chemicals for wastewater treatment and to
report to Department of Industrial Works.
E4 Electricity Consumption for Wastewater
Treatment Plant
kWh - Monthly Monthly This data can be used to monitor the electricity consumption for
wastewater treatment and to report to Department of Industrial
Works.
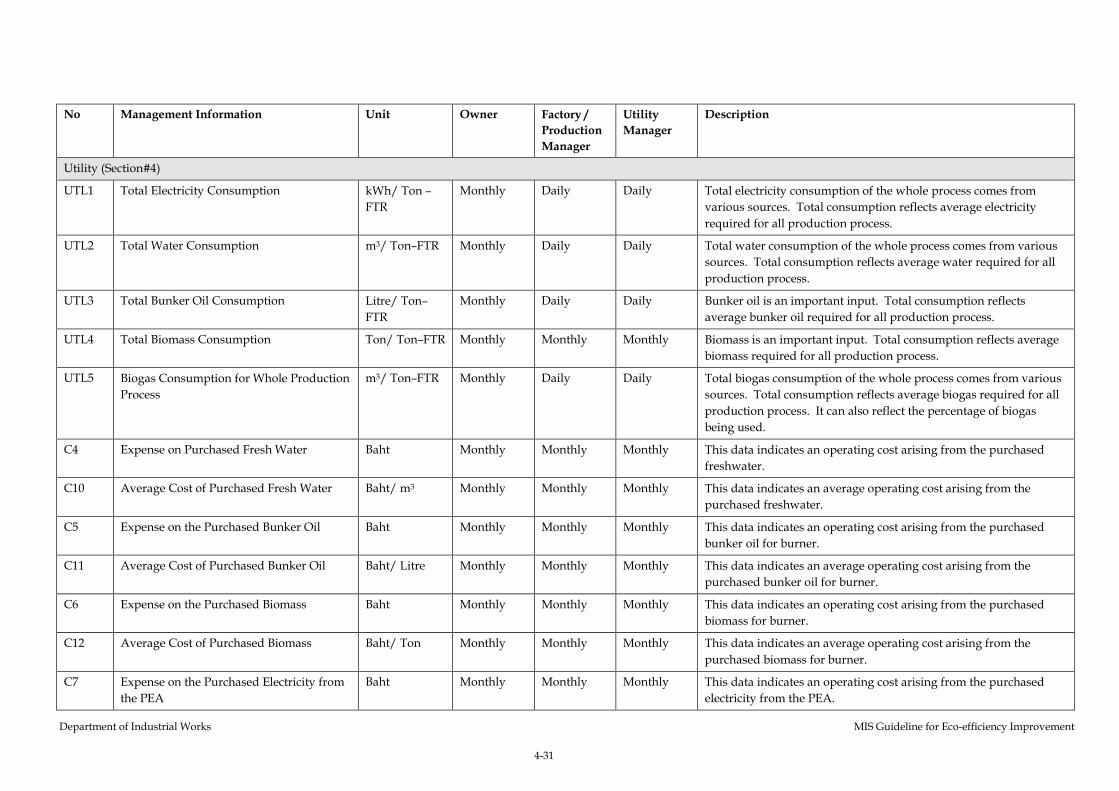
Department of Industrial Works MIS Guideline for Eco-efficiency Improvement
4-31
No Management Information Unit Owner Factory /
Production
Manager
Utility
Manager
Description
Utility (Section#4)
UTL1 Total Electricity Consumption kWh/ Ton –
FTR
Monthly Daily Daily Total electricity consumption of the whole process comes from
various sources. Total consumption reflects average electricity
required for all production process.
UTL2 Total Water Consumption m3/ Ton–FTR Monthly Daily Daily Total water consumption of the whole process comes from various
sources. Total consumption reflects average water required for all
production process.
UTL3 Total Bunker Oil Consumption Litre/ Ton–
FTR
Monthly Daily Daily Bunker oil is an important input. Total consumption reflects
average bunker oil required for all production process.
UTL4 Total Biomass Consumption Ton/ Ton–FTR Monthly Monthly Monthly Biomass is an important input. Total consumption reflects average
biomass required for all production process.
UTL5 Biogas Consumption for Whole Production
Process
m3/ Ton–FTR Monthly Daily Daily Total biogas consumption of the whole process comes from various
sources. Total consumption reflects average biogas required for all
production process. It can also reflect the percentage of biogas
being used.
C4 Expense on Purchased Fresh Water Baht Monthly Monthly Monthly This data indicates an operating cost arising from the purchased
freshwater.
C10 Average Cost of Purchased Fresh Water Baht/ m3 Monthly Monthly Monthly This data indicates an average operating cost arising from the
purchased freshwater.
C5 Expense on the Purchased Bunker Oil Baht Monthly Monthly Monthly This data indicates an operating cost arising from the purchased
bunker oil for burner.
C11 Average Cost of Purchased Bunker Oil Baht/ Litre Monthly Monthly Monthly This data indicates an average operating cost arising from the
purchased bunker oil for burner.
C6 Expense on the Purchased Biomass Baht Monthly Monthly Monthly This data indicates an operating cost arising from the purchased
biomass for burner.
C12 Average Cost of Purchased Biomass Baht/ Ton Monthly Monthly Monthly This data indicates an average operating cost arising from the
purchased biomass for burner.
C7 Expense on the Purchased Electricity from
the PEA
Baht Monthly Monthly Monthly This data indicates an operating cost arising from the purchased
electricity from the PEA.
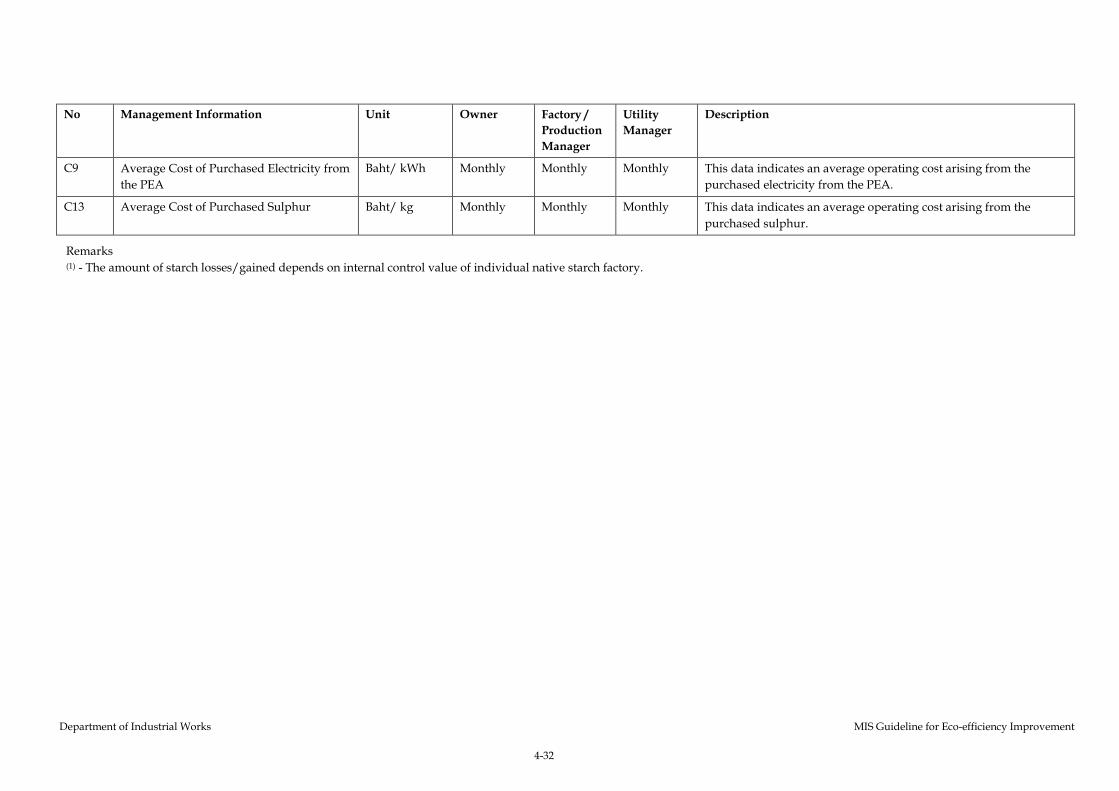
Department of Industrial Works MIS Guideline for Eco-efficiency Improvement
4-32
No Management Information Unit Owner Factory /
Production
Manager
Utility
Manager
Description
C9 Average Cost of Purchased Electricity from
the PEA
Baht/ kWh Monthly Monthly Monthly This data indicates an average operating cost arising from the
purchased electricity from the PEA.
C13 Average Cost of Purchased Sulphur Baht/ kg Monthly Monthly Monthly This data indicates an average operating cost arising from the
purchased sulphur.
Remarks (1) - The amount of starch losses/gained depends on internal control value of individual native starch factory.

References
REFERENCES
Agricultural Economic Office, Ministry of Agriculture (2005) 2004 Agricultural
Statistics of Thailand http://www.oae.go.th/statistic/yearbook47/ [Accessed
on 25 October 2005]
Cecelja, Franjo (2001) Manufacturing Information and Data Systems, First Edition :
Analysis, Design and Practice (Manufacturing Engineering Series)
Department of Industrial Works (DIW) and German Gesellschaft für
Technische Zusammenarbeit (GTZ) GmbH (1997) Environmental Management
Guideline for Native Starch Industry
Information and Communication Technology Bureau, Dapartmentof
Industrial Works (2005) Industrial Database http://sql.diw.go.th/result1.asp
[Accessed on 25 October 2005]
Laudon, Kenneth C. (2005) Management Information Systems : Managing the
Digital Firm (9th Edition), Prentice Hall
Schwalbe, Kathy (2005) Information Technology Project Management, Fourth
Edition
General Information of Native Starch
Factories from DIW’s Database
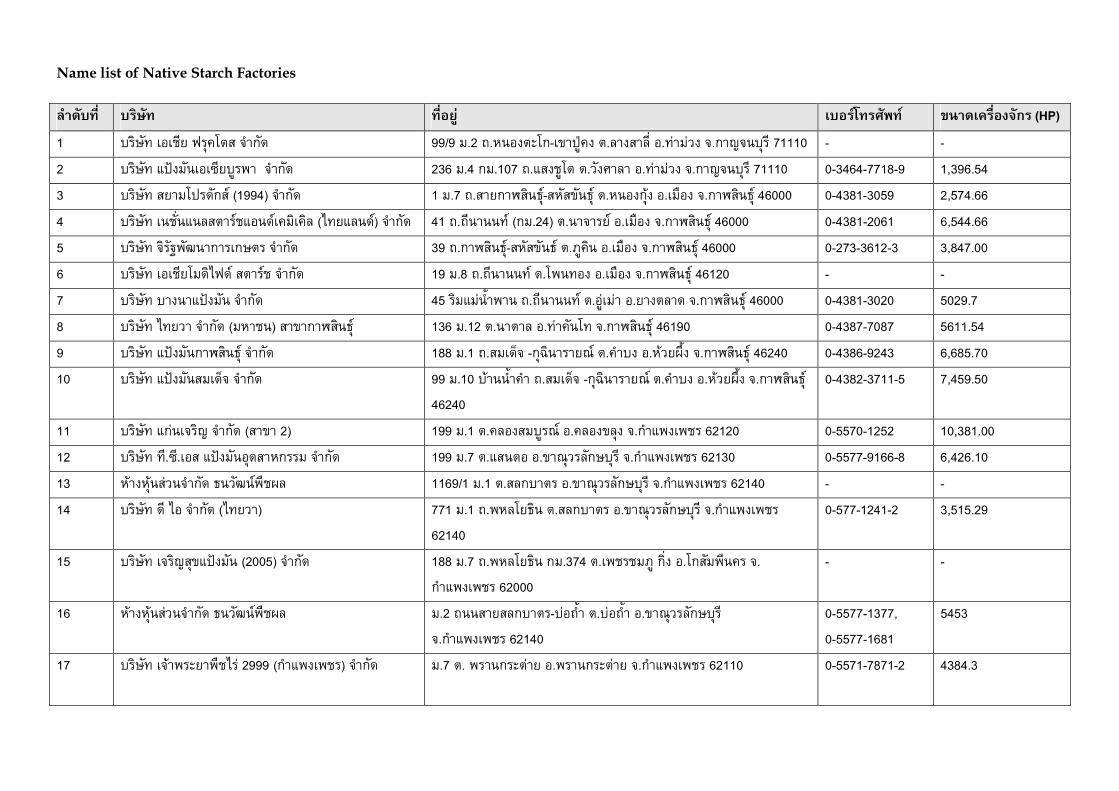
Name list of Native Starch Factories
������� ��� �� ����� ������������� ������������ก� (HP)
1 ������ �� ������� ���ก�� 99/9 �.2 �.� !�"�ก-$�%&'�! �.(�!��(�) .�*��*+! �.ก�,� ���� 71110 - - 2 ������ /%0!�� 1� �&�2� ���ก�� 236 �.4 ก�.107 �./�!�&�� �.+�!6�(� .�*��*+! �.ก�,� ���� 71110 0-3464-7718-9 1,396.54 3 ������ � ���%���ก�: (1994) ���ก�� 1 �.7 �.�� ก�=�� >�:-����$� >�: �.� !ก�?! .�@! �.ก�=�� >�: 46000 0-4381-3059 2,574.66 4 ������ ��) / (����:�/ �:�����( (A� /( �:) ���ก�� 41 �.�� � �: (ก�.24) �. ���� : .�@! �.ก�=�� >�: 46000 0-4381-2061 6,544.66 5 ������ ����B2�C �ก��ก��� ���ก�� 39 �.ก�=�� >�:-����$� >: �.D&�� .�@! �.ก�=�� >�: 46000 0-273-3612-3 3,847.00 6 ������ �� ����A��: ����:� ���ก�� 19 �.8 �.�� � �: �.�2 �! .�@! �.ก�=�� >�: 46120 - - 7 ������ ��! �/%0!�� ���ก�� 45 ���/�* E��2� �.�� � �: �.&*�*� . �!�(�� �.ก�=�� >�: 46000 0-4381-3020 5029.7 8 ������ A� +� ���ก�� (���� ) ��$�ก�=�� >�: 136 �.12 �. ���( .�*��� �� �.ก�=�� >�: 46190 0-4387-7087 5611.54 9 ������ /%0!�� ก�=�� >�: ���ก�� 188 �.1 �.���F� -ก�G� ��� H: �.����! .�?+ IJE! �.ก�=�� >�: 46240 0-4386-9243 6,685.70 10 ������ /%0!�� ���F� ���ก�� 99 �.10 �?� E����� �.���F� -ก�G� ��� H: �.����! .�?+ IJE! �.ก�=�� >�:
46240 0-4382-3711-5 7,459.50
11 ������ /ก* ���, ���ก�� (��$� 2) 199 �.1 �.�(!���&�H: .�(!$(�! �.ก��/2!2�� 62120 0-5570-1252 10,381.00 12 ������ ��.1�.� /%0!�� �����ก��� ���ก�� 199 �.7 �./� � .$�H�+�(�ก����� �.ก��/2!2�� 62130 0-5577-9166-8 6,426.10 13 �?�!��? �*+ ���ก�� > +�C :2@�I( 1169/1 �.1 �.�(ก���� .$�H�+�(�ก����� �.ก��/2!2�� 62140 - - 14 ������ �� A ���ก�� (A� +�) 771 �.1 �.2�(� >� �.�(ก���� .$�H�+�(�ก����� �.ก��/2!2��
62140 0-577-1241-2 3,515.29
15 ������ ���,��$/%0!�� (2005) ���ก�� 188 �.7 �.2�(� >� ก�.374 �.2����D& ก�)! .�ก���2� �� �.ก��/2!2�� 62000
- -
16 �?�!��? �*+ ���ก�� > +�C :2@�I( �.2 � �� �(ก����-�*�E�� �.�*�E�� .$�H�+�(�ก����� �.ก��/2!2�� 62140
0-5577-1377, 0-5577-1681
5453
17 ������ �?�2�" �2@�A�* 2999 (ก��/2!2��) ���ก�� �.7 �. 2�� ก�"�*� .2�� ก�"�*� �.ก��/2!2�� 62110
0-5571-7871-2 4384.3
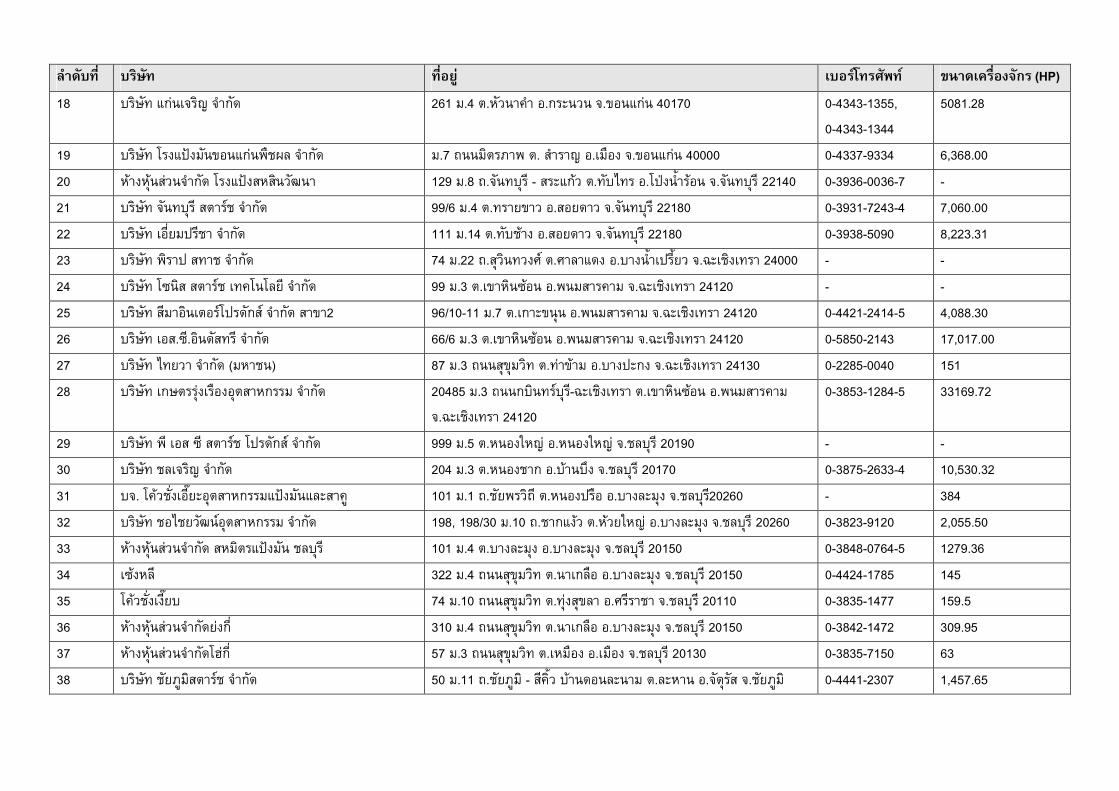
������� ��� �� ����� ������������� ������������ก� (HP)
18 ������ /ก* ���, ���ก�� 261 �.4 �.��+ ���� .ก�" + �.$ /ก* 40170 0-4343-1355, 0-4343-1344
5081.28
19 ������ ��!/%0!�� $ /ก* 2@�I( ���ก�� �.7 � ����D�2 �. �����, .�@! �.$ /ก* 40000 0-4337-9334 6,368.00 20 �?�!��? �*+ ���ก�� ��!/%0!���� +�C � 129 �.8 �.�� ����� - ��"/ก?+ �.���A�� .�%'! E���? �.�� ����� 22140 0-3936-0036-7 - 21 ������ �� ����� ����:� ���ก�� 99/6 �.4 �.��� $�+ .� ��+ �.�� ����� 22180 0-3931-7243-4 7,060.00 22 ������ �) �%���� ���ก�� 111 �.14 �.����?�! .� ��+ �.�� ����� 22180 0-3938-5090 8,223.31 23 ������ 2���% ���� ���ก�� 74 �.22 �.��+� �+!6: �.6�(�/�! .��! E��%��E + �.G"��!��� 24000 - - 24 ������ �1 �� ����:� ��� �( � ���ก�� 99 �.3 �.$��� 1? .2 ������� �.G"��!��� 24120 - - 25 ������ ����� ��:�%���ก�: ���ก�� ��$�2 96/10-11 �.7 �.ก�"$ � .2 ������� �.G"��!��� 24120 0-4421-2414-5 4,088.30 26 ������ �.1�.� ������ ���ก�� 66/6 �.3 �.$��� 1? .2 ������� �.G"��!��� 24120 0-5850-2143 17,017.00 27 ������ A� +� ���ก�� (���� ) 87 �.3 � ��$��+�� �.�*�$?�� .��!%"ก! �.G"��!��� 24130 0-2285-0040 151 28 ������ ก�����*!�@!�����ก��� ���ก�� 20485 �.3 � ก�� ��:����-G"��!��� �.$��� 1? .2 �������
�.G"��!��� 24120 0-3853-1284-5 33169.72
29 ������ 2� � 1� ����:� �%���ก�: ���ก�� 999 �.5 �.� !K�,* .� !K�,* �.�(���� 20190 - - 30 ������ �(���, ���ก�� 204 �.3 �.� !��ก .�?� �J! �.�(���� 20170 0-3875-2633-4 10,530.32 31 ��. ��?+��)!�L "�����ก���/%0!�� /("���& 101 �.1 �.�� 2�+��� �.� !%�@ .��!("��! �.�(����20260 - 384 32 ������ �A� +�C :�����ก��� ���ก�� 198, 198/30 �.10 �.��ก/!?+ �.�?+ K�,* .��!("��! �.�(���� 20260 0-3823-9120 2,055.50 33 �?�!��? �*+ ���ก�� ������/%0!�� �(���� 101 �.4 �.��!("��! .��!("��! �.�(���� 20150 0-3848-0764-5 1279.36 34 1?!�(� 322 �.4 � ��$��+�� �. �ก(@ .��!("��! �.�(���� 20150 0-4424-1785 145 35 ��?+��)!!�L � 74 �.10 � ��$��+�� �.��*!��$(� .6������ �.�(���� 20110 0-3835-1477 159.5 36 �?�!��? �*+ ���ก�� *!ก�) 310 �.4 � ��$��+�� �. �ก(@ .��!("��! �.�(���� 20150 0-3842-1472 309.95 37 �?�!��? �*+ ���ก���M*ก�) 57 �.3 � ��$��+�� �.��@! .�@! �.�(���� 20130 0-3835-7150 63 38 ������ �� D&������:� ���ก�� 50 �.11 �.�� D&�� - ����E+ �?� � (" �� �.("�� .������� �.�� D&�� 0-4441-2307 1,457.65
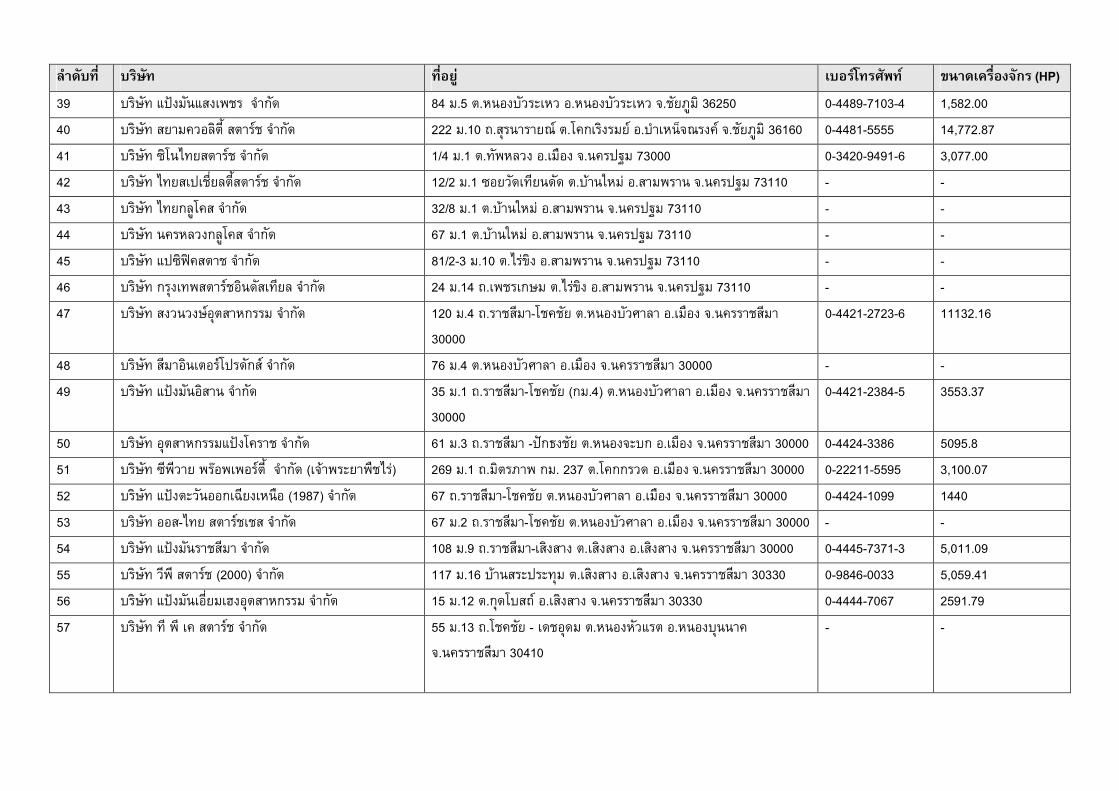
������� ��� �� ����� ������������� ������������ก� (HP)
39 ������ /%0!�� /�!2�� ���ก�� 84 �.5 �.� !��+�"�+ .� !��+�"�+ �.�� D&�� 36250 0-4489-7103-4 1,582.00 40 ������ � ���+(���E ����:� ���ก�� 222 �.10 �.��� ��� H: �.��ก��!�� : .���� F�H�!�: �.�� D&�� 36160 0-4481-5555 14,772.87 41 ������ 1�� A� ����:� ���ก�� 1/4 �.1 �.��2�(+! .�@! �. ��%B� 73000 0-3420-9491-6 3,077.00 42 ������ A� �%��) (��E����:� ���ก�� 12/2 �.1 1 +���� ��� �.�?� K��* .���2�� �. ��%B� 73110 - - 43 ������ A� ก(&��� ���ก�� 32/8 �.1 �.�?� K��* .���2�� �. ��%B� 73110 - - 44 ������ ���(+!ก(&��� ���ก�� 67 �.1 �.�?� K��* .���2�� �. ��%B� 73110 - - 45 ������ /%1��N����� ���ก�� 81/2-3 �.10 �.A�*$�! .���2�� �. ��%B� 73110 - - 46 ������ ก��!�2����:�� ����� ( ���ก�� 24 �.14 �.2��ก�� �.A�*$�! .���2�� �. ��%B� 73110 - - 47 ������ �!+ +!�:�����ก��� ���ก�� 120 �.4 �.�������-����� �.� !��+6�(� .�@! �. ���������
30000 0-4421-2723-6 11132.16
48 ������ ����� ��:�%���ก�: ���ก�� 76 �.4 �.� !��+6�(� .�@! �. ��������� 30000 - - 49 ������ /%0!�� ��� ���ก�� 35 �.1 �.�������-����� (ก�.4) �.� !��+6�(� .�@! �. ���������
30000 0-4421-2384-5 3553.37
50 ������ �����ก���/%0!����� ���ก�� 61 �.3 �.������� -%Oก>!�� �.� !�"�ก .�@! �. ��������� 30000 0-4424-3386 5095.8 51 ������ 1�2�+� 2�P22�:��E ���ก�� (�?�2�" �2@�A�*) 269 �.1 �.����D�2 ก�. 237 �.��กก�+� .�@! �. ��������� 30000 0-22211-5595 3,100.07 52 ������ /%0!�"+� กG� !� @ (1987) ���ก�� 67 �.�������-����� �.� !��+6�(� .�@! �. ��������� 30000 0-4424-1099 1440 53 ������ �-A� ����:��� ���ก�� 67 �.2 �.�������-����� �.� !��+6�(� .�@! �. ��������� 30000 - - 54 ������ /%0!�� ������� ���ก�� 108 �.9 �.�������-��!��! �.��!��! .��!��! �. ��������� 30000 0-4445-7371-3 5,011.09 55 ������ +�2� ����:� (2000) ���ก�� 117 �.16 �?� ��"%�"��� �.��!��! .��!��! �. ��������� 30330 0-9846-0033 5,059.41 56 ������ /%0!�� �) �M!�����ก��� ���ก�� 15 �.12 �.ก������: .��!��! �. ��������� 30330 0-4444-7067 2591.79 57 ������ �� 2� � ����:� ���ก�� 55 �.13 �.����� - ����� �.� !��+/�� .� !�� ��
�. ��������� 30410
- -
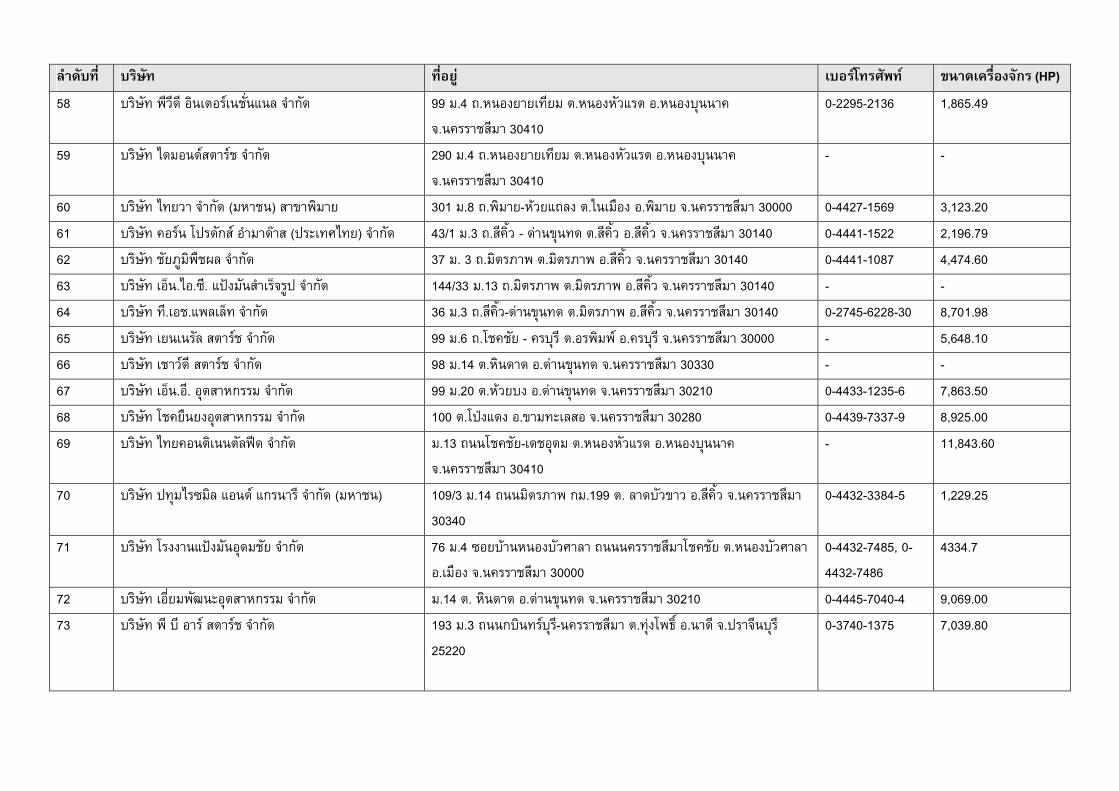
������� ��� �� ����� ������������� ������������ก� (HP)
58 ������ 2�+��� � ��: ��) / ( ���ก�� 99 �.4 �.� ! � �� � �.� !��+/�� .� !�� �� �. ��������� 30410
0-2295-2136 1,865.49
59 ������ A�� �:����:� ���ก�� 290 �.4 �.� ! � �� � �.� !��+/�� .� !�� �� �. ��������� 30410
- -
60 ������ A� +� ���ก�� (���� ) ��$�2��� 301 �.8 �.2��� -�?+ /�(! �.K �@! .2��� �. ��������� 30000 0-4427-1569 3,123.20 61 ������ ��: �%���ก�: �����P�� (%�"�6A� ) ���ก�� 43/1 �.3 �.����E+ - �*� $� �� �.����E+ .����E+ �. ��������� 30140 0-4441-1522 2,196.79 62 ������ �� D&��2@�I( ���ก�� 37 �. 3 �.����D�2 �.����D�2 .����E+ �. ��������� 30140 0-4441-1087 4,474.60 63 ������ F .A.1�. /%0!�� ����F��&% ���ก�� 144/33 �.13 �.����D�2 �.����D�2 .����E+ �. ��������� 30140 - - 64 ������ ��.�./2((F� ���ก�� 36 �.3 �.����E+-�*� $� �� �.����D�2 .����E+ �. ��������� 30140 0-2745-6228-30 8,701.98 65 ������ ��( ����:� ���ก�� 99 �.6 �.����� - ������ �.�2��2: .������ �. ��������� 30000 - 5,648.10 66 ������ ��+:�� ����:� ���ก�� 98 �.14 �.�� ��� .�*� $� �� �. ��������� 30330 - - 67 ������ F .�. �����ก��� ���ก�� 99 �.20 �.�?+ �! .�*� $� �� �. ��������� 30210 0-4433-1235-6 7,863.50 68 ������ ��� @ !�����ก��� ���ก�� 100 �.�%'!/�! .$���"(� �. ��������� 30280 0-4439-7337-9 8,925.00 69 ������ A� � �� ��(�Q� ���ก�� �.13 � ����� -����� �.� !��+/�� .� !�� ��
�. ��������� 30410 - 11,843.60
70 ������ %���A�1��( / �: /ก� ��� ���ก�� (���� ) 109/3 �.14 � ����D�2 ก�.199 �. (����+$�+ .����E+ �. ��������� 30340
0-4432-3384-5 1,229.25
71 ������ ��!!� /%0!�� ����� ���ก�� 76 �.4 1 �?� � !��+6�(� � �������������� �.� !��+6�(� .�@! �. ��������� 30000
0-4432-7485, 0-4432-7486
4334.7
72 ������ �) �2�C "�����ก��� ���ก�� �.14 �. �� ��� .�*� $� �� �. ��������� 30210 0-4445-7040-4 9,069.00 73 ������ 2� �� ��: ����:� ���ก�� 193 �.3 � ก�� ��:����- ��������� �.��*!�2>�R . ��� �.%���� ����
25220
0-3740-1375 7,039.80
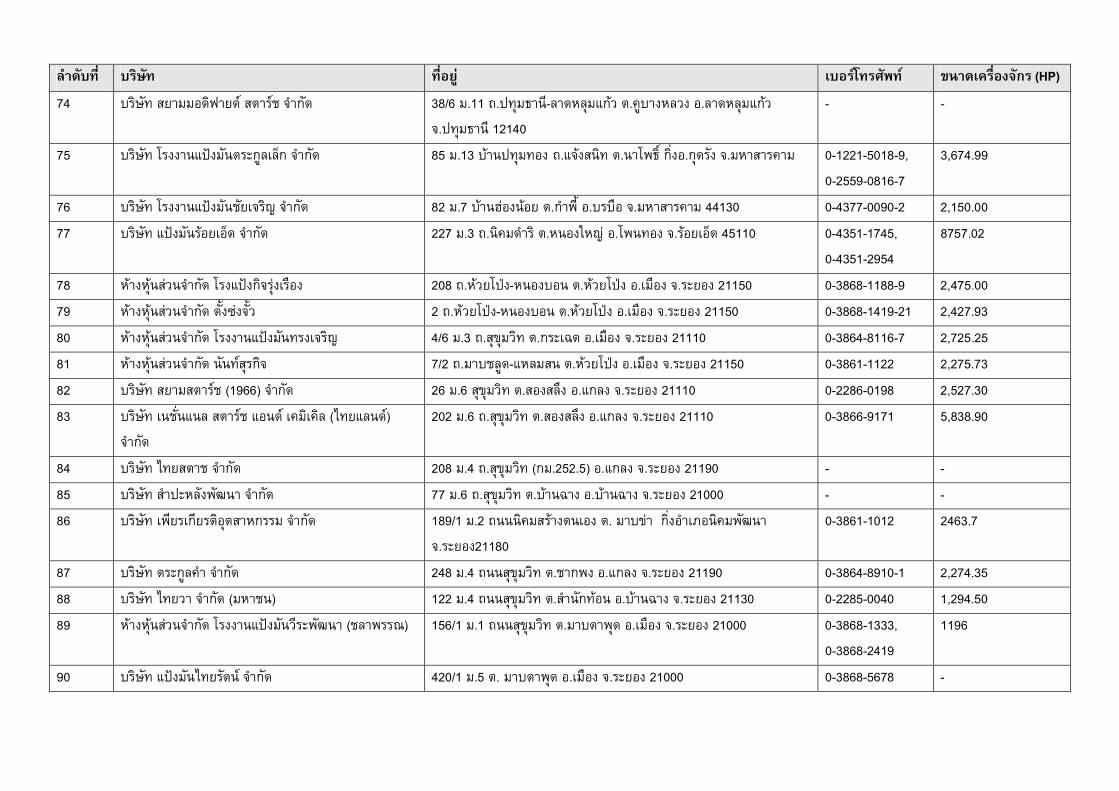
������� ��� �� ����� ������������� ������������ก� (HP)
74 ������ � ������� �: ����:� ���ก�� 38/6 �.11 �.%���>� �-(���(��/ก?+ �.�&��!�(+! .(���(��/ก?+ �.%���>� � 12140
- -
75 ������ ��!!� /%0!�� ��"ก&((Fก ���ก�� 85 �.13 �?� %����! �./�?!� �� �. ��2>�R ก�)!.ก����! �.��������� 0-1221-5018-9, 0-2559-0816-7
3,674.99
76 ������ ��!!� /%0!�� �� ���, ���ก�� 82 �.7 �?� M*! ? �.ก��2�E .���@ �.��������� 44130 0-4377-0090-2 2,150.00 77 ������ /%0!�� �? F� ���ก�� 227 �.3 �. �������� �.� !K�,* .�2 �! �.�? F� 45110 0-4351-1745,
0-4351-2954 8757.02
78 �?�!��? �*+ ���ก�� ��!/%0!ก����*!�@! 208 �.�?+ �%'!-� !� �.�?+ �%'! .�@! �.�" ! 21150 0-3868-1188-9 2,475.00 79 �?�!��? �*+ ���ก�� ��E!1*!��E+ 2 �.�?+ �%'!-� !� �.�?+ �%'! .�@! �.�" ! 21150 0-3868-1419-21 2,427.93 80 �?�!��? �*+ ���ก�� ��!!� /%0!�� ��!���, 4/6 �.3 �.��$��+�� �.ก�"G� .�@! �.�" ! 21110 0-3864-8116-7 2,725.25 81 �?�!��? �*+ ���ก�� � �:���ก�� 7/2 �.����(&�-/�(�� �.�?+ �%'! .�@! �.�" ! 21150 0-3861-1122 2,275.73 82 ������ � ������:� (1966) ���ก�� 26 �.6 ��$��+�� �.�!�(J! ./ก(! �.�" ! 21110 0-2286-0198 2,527.30 83 ������ ��) / ( ����:� / �: �����( (A� /( �:)
���ก�� 202 �.6 �.��$��+�� �.�!�(J! ./ก(! �.�" ! 21110 0-3866-9171 5,838.90
84 ������ A� ���� ���ก�� 208 �.4 �.��$��+�� (ก�.252.5) ./ก(! �.�" ! 21190 - - 85 ������ ���%"�(�!2�C � ���ก�� 77 �.6 �.��$��+�� �.�?� G�! .�?� G�! �.�" ! 21000 - - 86 ������ 2� �ก� ��������ก��� ���ก�� 189/1 �.2 � �����?�!� ! �. ���$*� ก�)!��D ���2�C �
�.�" !21180 0-3861-1012 2463.7
87 ������ ��"ก&(��� ���ก�� 248 �.4 � ��$��+�� �.��ก2! ./ก(! �.�" ! 21190 0-3864-8910-1 2,274.35 88 ������ A� +� ���ก�� (���� ) 122 �.4 � ��$��+�� �.��� �ก�? .�?� G�! �.�" ! 21130 0-2285-0040 1,294.50 89 �?�!��? �*+ ���ก�� ��!!� /%0!�� +��"2�C � (�(�2��H) 156/1 �.1 � ��$��+�� �.�����2�� .�@! �.�" ! 21000 0-3868-1333,
0-3868-2419 1196
90 ������ /%0!�� A� ��� : ���ก�� 420/1 �.5 �. �����2�� .�@! �.�" ! 21000 0-3868-5678 -
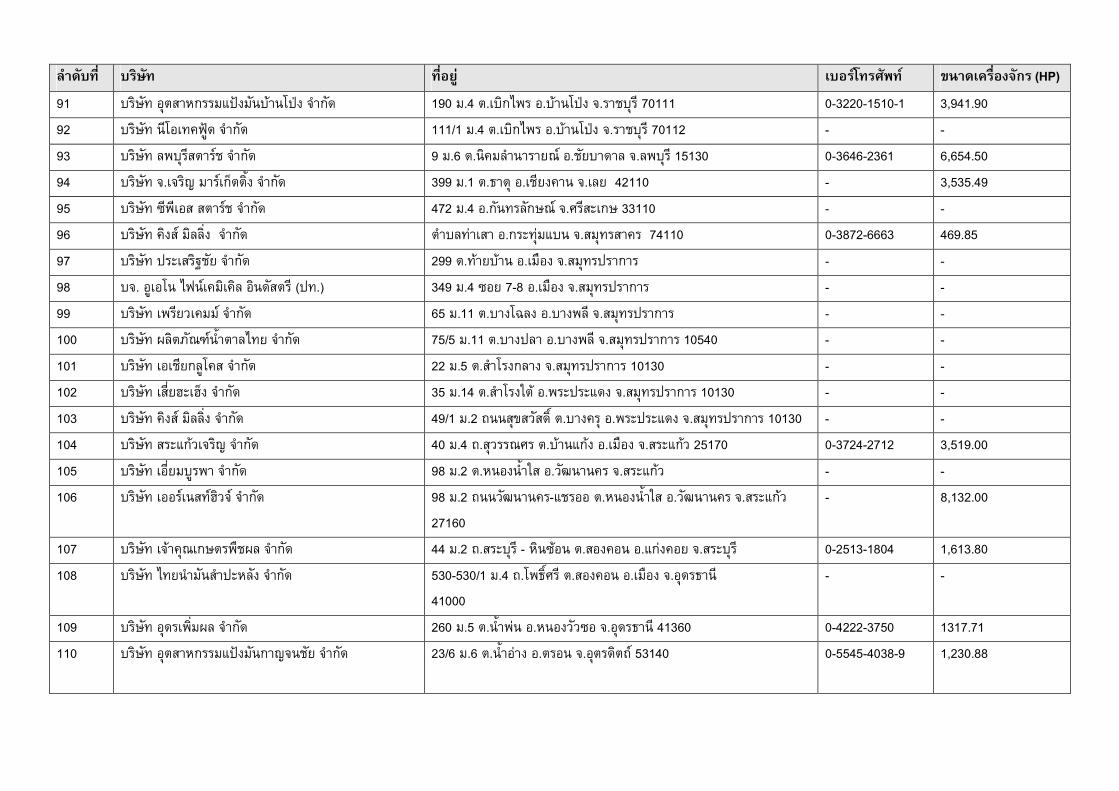
������� ��� �� ����� ������������� ������������ก� (HP)
91 ������ �����ก���/%0!�� �?� �%'! ���ก�� 190 �.4 �.��กA2� .�?� �%'! �.������� 70111 0-3220-1510-1 3,941.90 92 ������ �����&0� ���ก�� 111/1 �.4 �.��กA2� .�?� �%'! �.������� 70112 - - 93 ������ (2��������:� ���ก�� 9 �.6 �. ���(�� ��� H: .�� ����( �.(2���� 15130 0-3646-2361 6,654.50 94 ������ �.���, ���:กF���E! ���ก�� 399 �.1 �.>��� .�� !�� �.( 42110 - 3,535.49 95 ������ 1�2�� ����:� ���ก�� 472 �.4 .ก� ��(�ก�H: �.6���"ก� 33110 - - 96 ������ ��!�: ��((�)! ���ก�� ����(�*��� .ก�"��*�/� �.��������� 74110 0-3872-6663 469.85 97 ������ %�"���B�� ���ก�� 299 �.�?� �?� .�@! �.�����%��ก�� - - 98 ��. &� A� :�����( � ������ (%�.) 349 �.4 1 7-8 .�@! �.�����%��ก�� - - 99 ������ 2�� +���: ���ก�� 65 �.11 �.��!�G(! .��!2(� �.�����%��ก�� - - 100 ������ I(��D�HS: E����(A� ���ก�� 75/5 �.11 �.��!%(� .��!2(� �.�����%��ก�� 10540 - - 101 ������ �� ก(&��� ���ก�� 22 �.5 �.�����!ก(�! �.�����%��ก�� 10130 - - 102 ������ ��) M"MF! ���ก�� 35 �.14 �.�����!K�? .2�"%�"/�! �.�����%��ก�� 10130 - - 103 ������ ��!�: ��((�)! ���ก�� 49/1 �.2 � ��$�+����R �.��!��� .2�"%�"/�! �.�����%��ก�� 10130 - - 104 ������ ��"/ก?+���, ���ก�� 40 �.4 �.��+��H6� �.�?� /ก?! .�@! �.��"/ก?+ 25170 0-3724-2712 3,519.00 105 ������ �) ��&�2� ���ก�� 98 �.2 �.� ! E��K� .+�C � �� �.��"/ก?+ - - 106 ������ �: ��:M�+�: ���ก�� 98 �.2 � +�C � ��-/�� �.� ! E��K� .+�C � �� �.��"/ก?+
27160 - 8,132.00
107 ������ �?���Hก���2@�I( ���ก�� 44 �.2 �.��"���� - �� 1? �.�!� ./ก*!� �.��"���� 0-2513-1804 1,613.80 108 ������ A� ���� ���%"�(�! ���ก�� 530-530/1 �.4 �.�2>�R6�� �.�!� .�@! �.���>� �
41000 - -
109 ������ ���2�)�I( ���ก�� 260 �.5 �. E��2* .� !+�+1 �.���>� � 41360 0-4222-3750 1317.71 110 ������ �����ก���/%0!�� ก�,� �� ���ก�� 23/6 �.6 �. E��*�! .�� �.�������: 53140
0-5545-4038-9 1,230.88
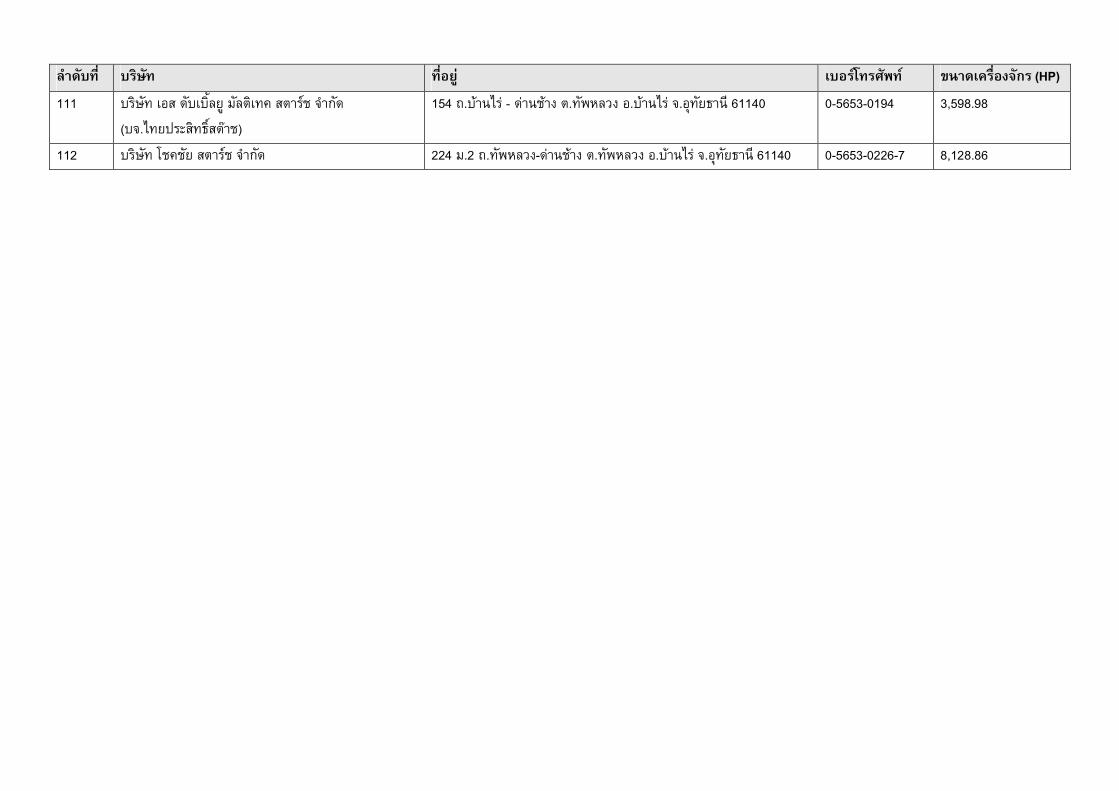
������� ��� �� ����� ������������� ������������ก� (HP)
111 ������ � �����E( & ��(���� ����:� ���ก�� (��.A� %�"���>�R��P��)
154 �.�?� A�* - �*� �?�! �.��2�(+! .�?� A�* �.��� >� � 61140 0-5653-0194 3,598.98
112 ������ ����� ����:� ���ก�� 224 �.2 �.��2�(+!-�*� �?�! �.��2�(+! .�?� A�* �.��� >� � 61140 0-5653-0226-7 8,128.86


![Fabrication of Natural Tapioca Starch Fibers by a … of Natural Tapioca Starch Fibers by a Modified Electrospinning Technique Krit Sutjarittangtham [a], Patthanakorn Jaiturong [b],](https://img.pdfslide.us/doc/110x75/5ac42ff97f8b9a5c558ca1c7/fabrication-of-natural-tapioca-starch-fibers-by-a-of-natural-tapioca-starch.jpg)