Embed Size (px)
Citation preview
WP/05/35
Tanzania’s Growth Process and Success in Reducing Poverty
Volker Treichel
© 2005 International Monetary Fund WP/05/35
IMF Working Paper
African Department
Tanzania’s Growth Process and Success in Reducing Poverty
Prepared by Volker Treichel1
Authorized for distribution by Robert Sharer
February 2005
Abstract
This Working Paper should not be reported as representing the views of the IMF. The views expressed in this Working Paper are those of the author(s) and do not necessarily represent those of the IMF or IMF policy. Working Papers describe research in progress by the author(s) and are published to elicit comments and to further debate.
Since 1995, Tanzania has made major progress in economic reform and macroeconomic stabilization, resulting in strong growth and low inflation. This paper reviews Tanzania’s growth performance and prospects and assesses the impact of growth on poverty. It finds that growth has been increasingly driven by higher factor productivity and that a continuation of recent policies should allow Tanzania to grow above 5 percent a year over the medium term. Furthermore, it finds that growth since 1995 has resulted in a significant decline of poverty and that prospects are favorable for Tanzania to attain its objectives for reducing income poverty by 2015. JEL Classification Numbers: O10, O23, O40, O55 Keywords: Growth, poverty, macroeconomic policies in developing countries Author(s) E-Mail Address: [email protected]
1 The author is grateful for comments from Peter Dohlman, David Nellor, Catherine Pattillo, Robert Sharer, Helga Treichel, and Jeromin Zettelmeyer.
- -
2
Contents Page
I. Introduction ...................................................................................................................3
II. Tanzania’s Recent Economic Policies and Growth Performance..................................3
III. Growth and Poverty Reduction....................................................................................17
IV. Conclusions..................................................................................................................23 References..........................................................................................................................24 Tables 1. Growth and Inflation, 1990–2003....................................................................................4 2. Production of Selected Manufactured Commodities, 1990–2003 ...................................6 3. Sources of Economic Growth ........................................................................................14 4. Constraints on Private Sector Activities ........................................................................16 5. Selected Income Poverty and Social Indicators in 1991/92 and 2000/01..........................................................................................................17 6. Poverty Indicators and Millennium Development Goals, 1990-2015 ...........................18 7. Average Real Growth Rates, 1990–2000.......................................................................19 Figures 1. Real Effective Exchange Rate and Real Exchange Rate, 1990–2003 .............................8 2. Main Crop Production and Exports .................................................................................9 3. Fiscal Performance and Inflation, 1991/92–2001/02.....................................................11 4. Simulated Changes in Poverty Using National Growth Rates.......................................20 5. Simulated Changes in Poverty Using Separate Urban and Rural Growth Rates......................................................................................21 6. Poverty Incidence and the MDG Goals .........................................................................22
- 3 -
I. INTRODUCTION
Over the past 10 years Tanzania has made major strides in improving its economic performance. Pursuing an ambitious program of economic reform and supported by substantial donor aid, Tanzania’s growth has increased noticeably, and macroeconomic stabilization and debt sustainability were reached. Yet, a recent Household Budget Survey shows only a modest decline in aggregate poverty over the past decade, raising the question of whether positive macroeconomic performance has had any significant effect on reducing poverty.
To answer this question, the paper first reviews the main features of Tanzania’s strong growth performance since 1995 with a view to assessing the impact of reform-oriented policies, the pattern of the sources of growth, and Tanzania’s growth prospects. Noting that economic policies had a substantial positive impact on growth and enhanced the contribution of total factor productivity (TFP), the paper concludes that a continuation of these policies should allow Tanzania to grow by 5 to 6 percent annually over the next decade. Subsequently, the paper reviews the evidence for the impact that growth has had on poverty. Showing that poverty reduction was broadly in line with growth of per capita income in urban and rural areas, the paper concludes that a continuation of recent growth in urban areas and a slight acceleration of growth in rural areas should allow Tanzania to achieve its objectives for reducing income poverty by 2015.2
II. TANZANIA’S RECENT ECONOMIC POLICIES AND GROWTH PERFORMANCE
By the late 1970s, Tanzania, unlike many other African countries, was a highly state- controlled economy engaged in the pursuit of socialist objectives. As a result, it had an inflexible economic system that was characterized by monopolistic and heavily regulated production structures in all sectors of the economy. Tanzania’s rigid economic system of state-interventionist policies, the Kagera war with Uganda, and external shocks during the late 1970s resulted in major macroeconomic imbalances, economic stagnation, and a decline in per capita income that lasted over 15 years. As GDP shrank, shortages of basic consumer goods appeared, and agricultural exports collapsed.
In the early 1990s, Tanzania gradually liberalized its economy and began pursuing market-oriented reforms. In 1996, these reforms were intensified, resulting in major progress in macroeconomic stabilization and an acceleration of growth (Table 1). Annual real growth
2 This paper does not address the question of which measures would be required to achieve the Millennium Development Goals, other than that of reducing income poverty, and, in particular, the question to which extent the available resource envelope would need to be expanded to achieve that objective.
- 4 -
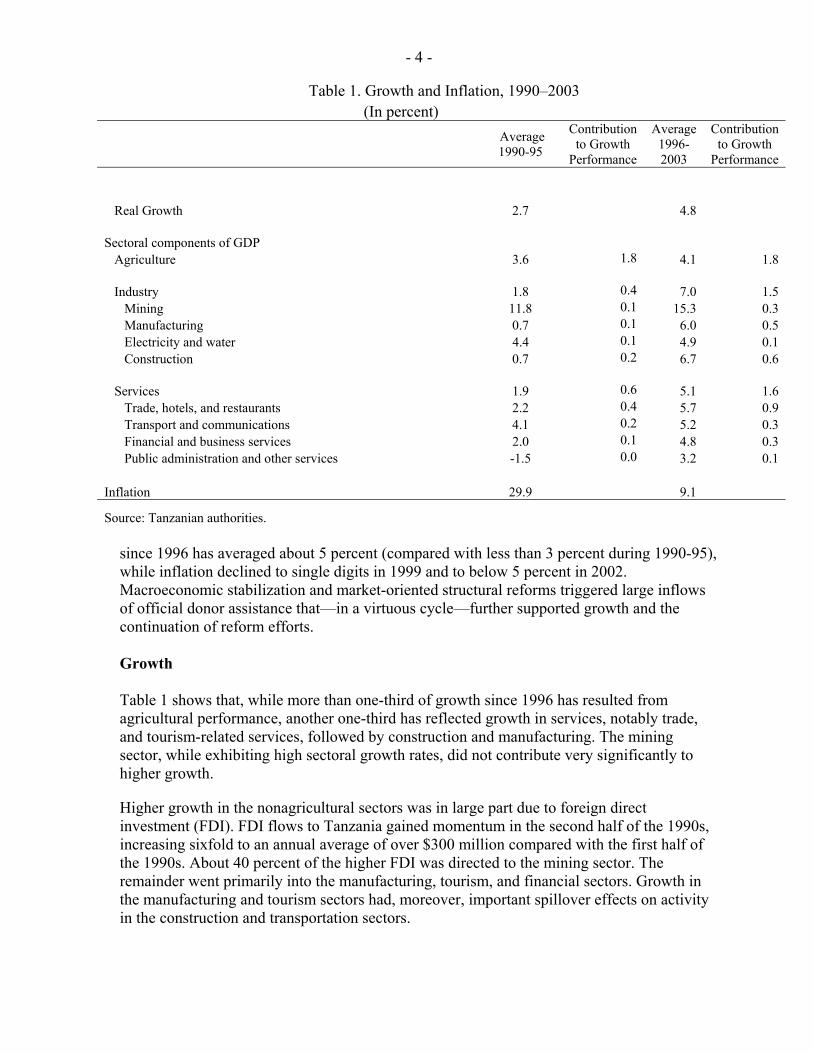
since 1996 has averaged about 5 percent (compared with less than 3 percent during 1990-95), while inflation declined to single digits in 1999 and to below 5 percent in 2002. Macroeconomic stabilization and market-oriented structural reforms triggered large inflows of official donor assistance that—in a virtuous cycle—further supported growth and the continuation of reform efforts. Growth Table 1 shows that, while more than one-third of growth since 1996 has resulted from agricultural performance, another one-third has reflected growth in services, notably trade, and tourism-related services, followed by construction and manufacturing. The mining sector, while exhibiting high sectoral growth rates, did not contribute very significantly to higher growth.
Higher growth in the nonagricultural sectors was in large part due to foreign direct investment (FDI). FDI flows to Tanzania gained momentum in the second half of the 1990s, increasing sixfold to an annual average of over $300 million compared with the first half of the 1990s. About 40 percent of the higher FDI was directed to the mining sector. The remainder went primarily into the manufacturing, tourism, and financial sectors. Growth in the manufacturing and tourism sectors had, moreover, important spillover effects on activity in the construction and transportation sectors.
Table 1. Growth and Inflation, 1990–2003 (In percent)
Average 1990-95
Contribution to Growth
Performance
Average1996-2003
Contribution to Growth
Performance Real Growth 2.7 4.8 Sectoral components of GDP Agriculture 3.6 1.8 4.1 1.8 Industry 1.8 0.4 7.0 1.5 Mining 11.8 0.1 15.3 0.3 Manufacturing 0.7 0.1 6.0 0.5 Electricity and water 4.4 0.1 4.9 0.1 Construction 0.7 0.2 6.7 0.6 Services 1.9 0.6 5.1 1.6 Trade, hotels, and restaurants 2.2 0.4 5.7 0.9 Transport and communications 4.1 0.2 5.2 0.3 Financial and business services 2.0 0.1 4.8 0.3 Public administration and other services -1.5 0.0 3.2 0.1 Inflation 29.9 9.1
Source: Tanzanian authorities.
- 5 -
Tanzania’s relative success in attracting FDI reflected the implementation of a critical mass of macroeconomic and structural reforms, as well as the presence of political stability in the context of multiparty democracy. In addition, Tanzania offered fiscal incentives—in particular for the mining sector—that included generous depreciation allowances, indefinite loss carryforward, exemptions from import duties and the value-added tax, and some income tax holidays. Mining companies suggest that the availability of this type of fiscal regime has been important in attracting and maintaining their operations in Tanzania. The following have been pillars of Tanzania’s reform-oriented policies since 1996 :
• Large-scale privatization. Since 1992, virtually all state-owned enterprises have been privatized.
• Liberalization. Since 1990, current account transactions, the exchange market, agricultural prices, and marketing boards have been gradually liberalized, as the state increasingly retreated from dominating economic activities.
• Macroeconomic stabilization. Tight fiscal and monetary policies have resulted in a rapid decline of inflation.
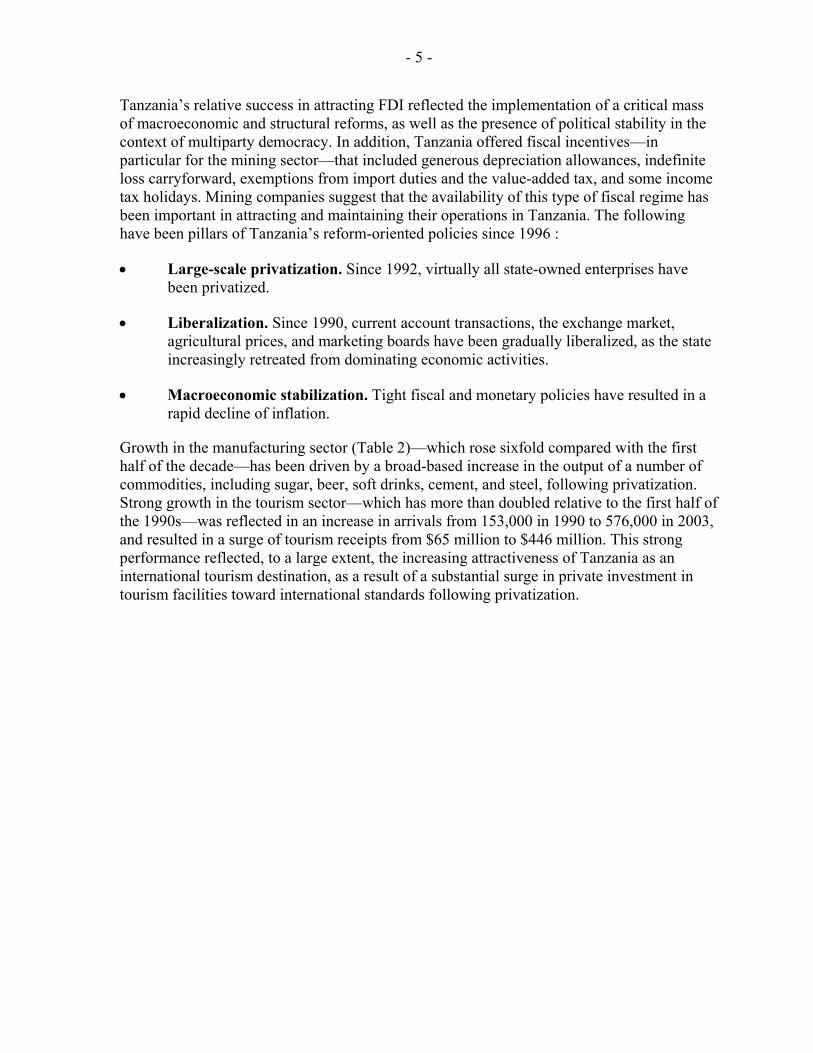
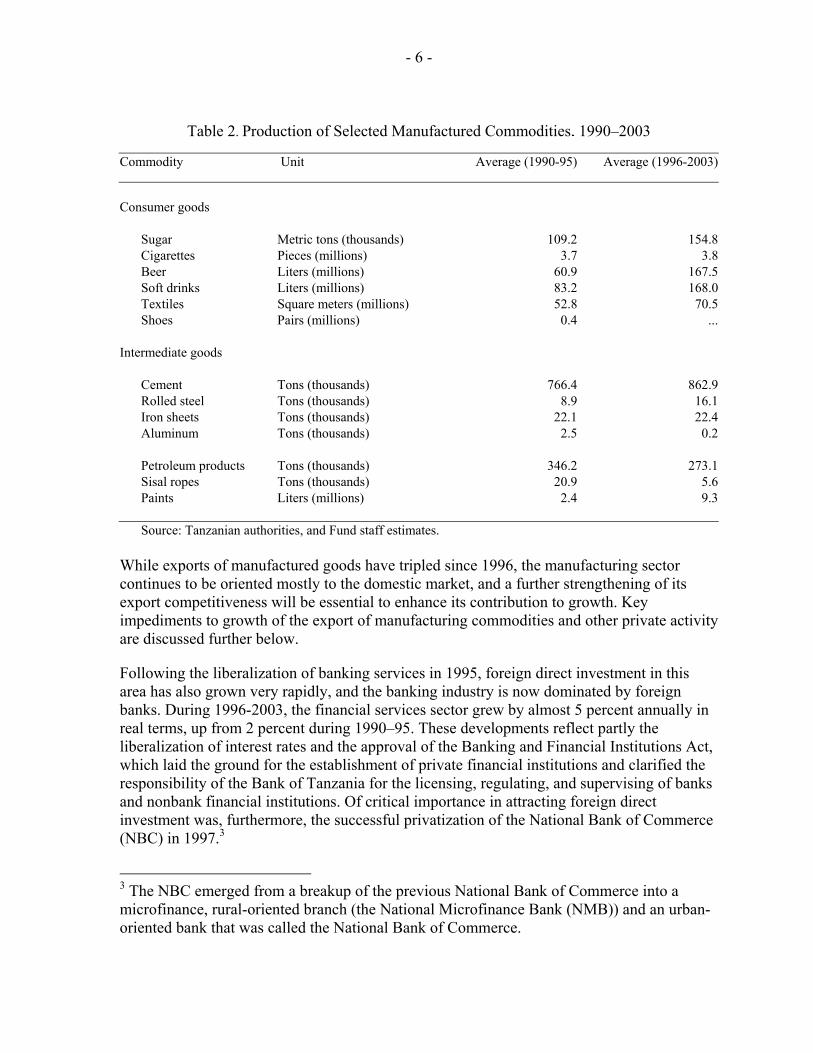
Growth in the manufacturing sector (Table 2)—which rose sixfold compared with the first half of the decade—has been driven by a broad-based increase in the output of a number of commodities, including sugar, beer, soft drinks, cement, and steel, following privatization. Strong growth in the tourism sector—which has more than doubled relative to the first half of the 1990s—was reflected in an increase in arrivals from 153,000 in 1990 to 576,000 in 2003, and resulted in a surge of tourism receipts from $65 million to $446 million. This strong performance reflected, to a large extent, the increasing attractiveness of Tanzania as an international tourism destination, as a result of a substantial surge in private investment in tourism facilities toward international standards following privatization.
- 6 -
Table 2. Production of Selected Manufactured Commodities, 1990–2003
Commodity Unit Average (1990-95) Average (1996-2003)
Consumer goods
Sugar Metric tons (thousands) 109.2 154.8Cigarettes Pieces (millions) 3.7 3.8Beer Liters (millions) 60.9 167.5Soft drinks Liters (millions) 83.2 168.0Textiles Square meters (millions) 52.8 70.5Shoes Pairs (millions) 0.4 ...
Intermediate goods
Cement Tons (thousands) 766.4 862.9Rolled steel Tons (thousands) 8.9 16.1Iron sheets Tons (thousands) 22.1 22.4Aluminum Tons (thousands) 2.5 0.2 Petroleum products Tons (thousands) 346.2 273.1Sisal ropes Tons (thousands) 20.9 5.6Paints Liters (millions) 2.4 9.3
Source: Tanzanian authorities, and Fund staff estimates.
While exports of manufactured goods have tripled since 1996, the manufacturing sector continues to be oriented mostly to the domestic market, and a further strengthening of its export competitiveness will be essential to enhance its contribution to growth. Key impediments to growth of the export of manufacturing commodities and other private activity are discussed further below.
Following the liberalization of banking services in 1995, foreign direct investment in this area has also grown very rapidly, and the banking industry is now dominated by foreign banks. During 1996-2003, the financial services sector grew by almost 5 percent annually in real terms, up from 2 percent during 1990–95. These developments reflect partly the liberalization of interest rates and the approval of the Banking and Financial Institutions Act, which laid the ground for the establishment of private financial institutions and clarified the responsibility of the Bank of Tanzania for the licensing, regulating, and supervising of banks and nonbank financial institutions. Of critical importance in attracting foreign direct investment was, furthermore, the successful privatization of the National Bank of Commerce (NBC) in 1997.3
3 The NBC emerged from a breakup of the previous National Bank of Commerce into a microfinance, rural-oriented branch (the National Microfinance Bank (NMB)) and an urban-oriented bank that was called the National Bank of Commerce.
- 7 -
The effectiveness of financial sector reform is reflected in the substantial increase in credit to the private sector, which has grown on average by 35-40 percent a year in recent years. This increase has been generally broad-based across sectors, although there has been some increase in concentration in agriculture (including for exports), manufacturing and mining (gold), and building and construction. Furthermore, the loan concentration has been relatively high: the top 5 systemwide borrowers account for 20 percent; and the top 200 borrowers account for virtually all loans. The sharp growth in credit to the private sector notwithstanding, banking soundness indicators have continuously improved, partly reflecting better banking supervision.
Key factors driving higher lending to the private sector are (1) more lower-risk lending opportunities to international companies that increasingly borrow locally—including South African, Kenyan, and Ugandan firms—reflecting a desire to reduce exchange rate risk and benefit from better domestic rates; (2) lower perceived risks of lending to the private sector due to factors such as the establishment in 2002 of a commercial court for foreclosure procedures, and direct paycheck deductions; and (3) reduced lending opportunities to parastatals due to privatization.
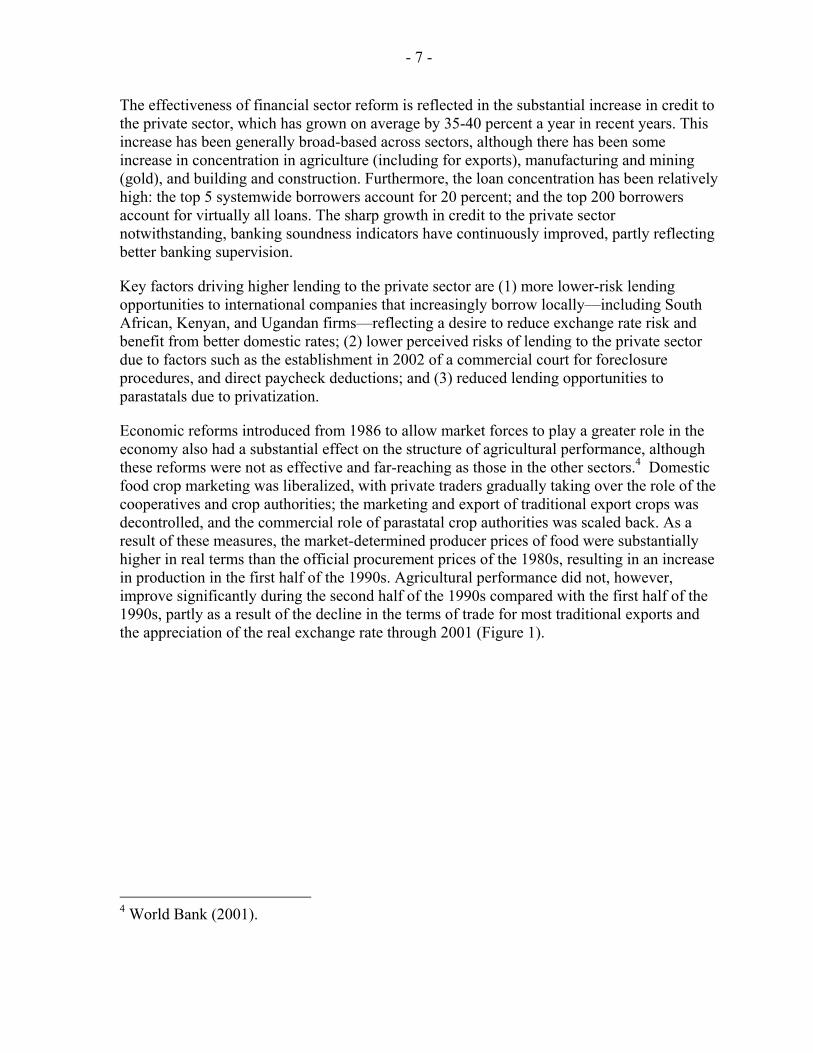
Economic reforms introduced from 1986 to allow market forces to play a greater role in the economy also had a substantial effect on the structure of agricultural performance, although these reforms were not as effective and far-reaching as those in the other sectors.4 Domestic food crop marketing was liberalized, with private traders gradually taking over the role of the cooperatives and crop authorities; the marketing and export of traditional export crops was decontrolled, and the commercial role of parastatal crop authorities was scaled back. As a result of these measures, the market-determined producer prices of food were substantially higher in real terms than the official procurement prices of the 1980s, resulting in an increase in production in the first half of the 1990s. Agricultural performance did not, however, improve significantly during the second half of the 1990s compared with the first half of the 1990s, partly as a result of the decline in the terms of trade for most traditional exports and the appreciation of the real exchange rate through 2001 (Figure 1).
4 World Bank (2001).
- 8 -
Source: IMF staff estimates.
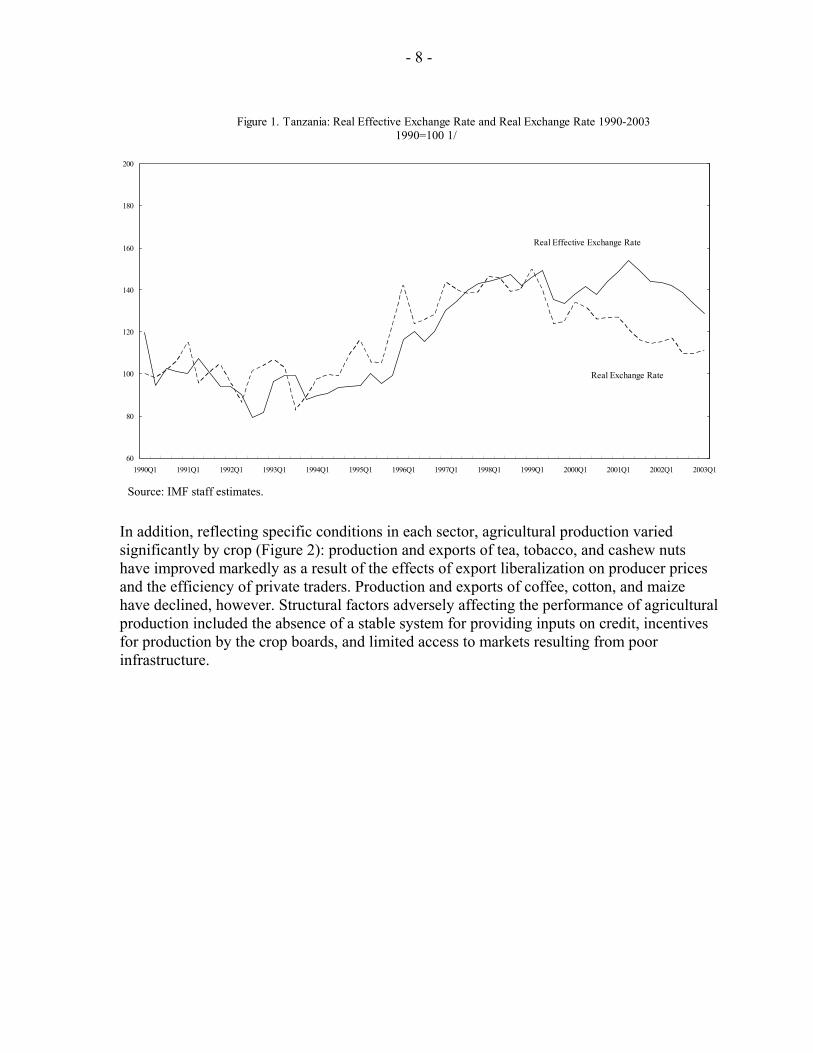
In addition, reflecting specific conditions in each sector, agricultural production varied significantly by crop (Figure 2): production and exports of tea, tobacco, and cashew nuts have improved markedly as a result of the effects of export liberalization on producer prices and the efficiency of private traders. Production and exports of coffee, cotton, and maize have declined, however. Structural factors adversely affecting the performance of agricultural production included the absence of a stable system for providing inputs on credit, incentives for production by the crop boards, and limited access to markets resulting from poor infrastructure.
60
80
100
120
140
160
180
200
1990Q1 1991Q1 1992Q1 1993Q1 1994Q1 1995Q1 1996Q1 1997Q1 1998Q1 1999Q1 2000Q1 2001Q1 2002Q1 2003Q1
Real Exchange Rate
Real Effective Exchange Rate
Figure 1. Tanzania: Real Effective Exchange Rate and Real Exchange Rate 1990-2003 1990=100 1/
- 9 -
Production in metric tons
(left-hand scale)
Exports in metric tons (left-hand scale)
Exports in US$ billions
(right-hand scale)
Figure 2. Tanzania: Main Crop Production and Exports, 1980-2001
Source: Food and Agriculture Organization.
Cotton Production and Exports
0
50 ,000
100 ,000
150 ,000
200 ,000
250 ,000
300 ,000
1980 1985 199 0 1995 2000 20010 .00
0 .02
0 .04
0 .06
0 .08
0 .10
0 .12
0 .14
Cashew Nuts Production and Exports
0
20 ,000
40 ,000
60 ,000
80 ,000
100 ,000
120 ,000
140 ,000
1980 1985 19 90 1995 2000 20010 .00
0 .02
0 .04
0 .06
0 .08
0 .10
0 .12
Coffee Production and Exports
0
10 ,000
20 ,000
30 ,000
40 ,000
50 ,000
60 ,000
70 ,000
1980 198 5 199 0 1995 20 00 20010 .00
0 .02
0 .04
0 .06
0 .08
0 .10
0 .12
0 .14
0 .16
Tea Production and Exports
0
5,000
10 ,000
15,000
20 ,000
25,000
30 ,000
1980 1985 1990 1995 2000 20010 .00
0 .01
0 .01
0 .02
0 .02
0 .03
0 .03
0 .04
0 .04
0 .05
Tobacco Production and Exports
0
5,000
10 ,000
15,000
20 ,000
25,000
30 ,000
35,000
1980 1985 1990 1995 2000 20010 .00
0 .01
0 .02
0 .03
0 .04
0 .05
0 .06
- 10 -
The liberalization of the economy also helped the promotion of other exports, notably processed food, fish, and horticulture. Over the decade ending 2003, nontraditional non-mineral exports increased threefold. This increase in exports, notwithstanding the appreciation of the real exchange rate from 1993 to 2001, suggests that the sharp decline in traditional exports is the result of crop-specific structural impediments, and—to a lesser extent—of the appreciation of the exchange rate and of the terms of trade shock. The importance of structural impediments for the performance of Tanzania’s traditional exports is also underscored by the results of a recent study by the IMF. The study concludes that the manufacturing sector has been very responsive to movements in the real equilibrium exchange rate (REER), while the traditional sector has been less responsive.5
Exports of goods and nonfactor services have played an important role in contributing to the overall growth of the economy since 1990. Exports contributed 2.2 percent of the 3.8 percent annual average growth during 1990–2003 (that is, nearly 60 percent of GDP growth during the period came from exports). The importance of exports in contributing to the overall growth of the economy over the last decade is also underlined by the fact that sectors with the highest growth had significant overlap with those showing the strongest export growth, that is, tourism and manufacturing, as mentioned above.
The gradual increase in exports since the beginning of the 1990s has allowed a steady relaxation in the foreign exchange constraint and facilitated the liberalization of imports. The trade regime was liberalized by lowering the maximum tariff and reducing the number of tariffs from six to the current three. As a result, Tanzania’s standing on the trade restrictiveness index declined from 7 in 1996 to 5 in 2002. In parallel, Tanzania pursued regional integration in the context of the East African Community (EAC). Import surcharges imposed in 2001 on imports from other East African countries were gradually reduced or eliminated. Also, in March 2004, a trade protocol was signed, foreseeing the establishment of a customs union among the three East African countries, with a maximum external tariff of 25 percent, which implies a small liberalization of trade compared with the previous regime.
Macroeconomic stabilization
Inflation was brought down to single digits in 1999 and declined further to below 5 percent in 2002, reflecting a sharp decline in the growth of broad money from an annual average of over 35 percent in 1990–95 to 16 percent over 1996–2003. Earlier high rates of monetary expansion, stemming in part from imprudent credit policies, were curtailed by tighter supervision of state-owned banks and the privatization of the National Bank of Commerce. Improved monetary management by the Bank of Tanzania was also supported by the adoption of a cash-management system, which limited expenditure to available revenue, as well as by the steady inflow of donor support, which virtually eliminated the budget’s domestic financing requirements—a major source of inflationary pressures in the past.
5 International Monetary Fund (2004). According to the estimation, traditional exports have decreased by 4 percent for each percent depreciation in the REER, while manufacturing exports have increased by 14 percent for each percent depreciation of the REER.
- 11 -
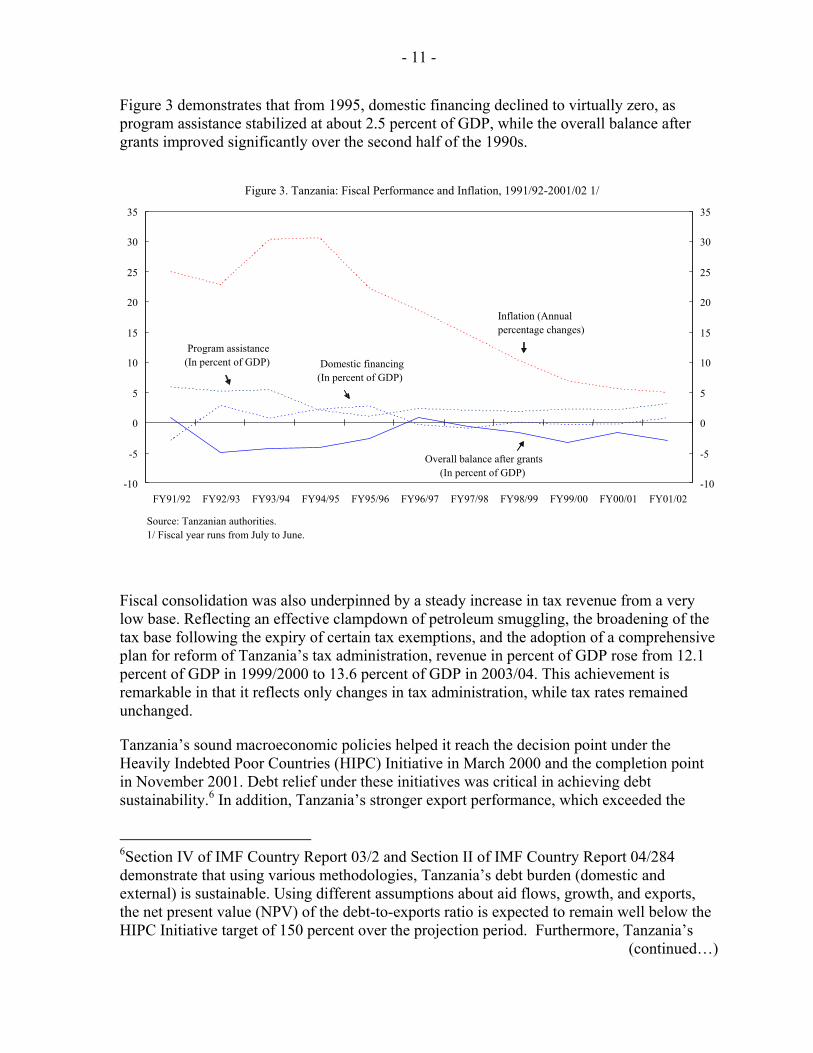
Figure 3 demonstrates that from 1995, domestic financing declined to virtually zero, as program assistance stabilized at about 2.5 percent of GDP, while the overall balance after grants improved significantly over the second half of the 1990s.
Fiscal consolidation was also underpinned by a steady increase in tax revenue from a very low base. Reflecting an effective clampdown of petroleum smuggling, the broadening of the tax base following the expiry of certain tax exemptions, and the adoption of a comprehensive plan for reform of Tanzania’s tax administration, revenue in percent of GDP rose from 12.1 percent of GDP in 1999/2000 to 13.6 percent of GDP in 2003/04. This achievement is remarkable in that it reflects only changes in tax administration, while tax rates remained unchanged.
Tanzania’s sound macroeconomic policies helped it reach the decision point under the Heavily Indebted Poor Countries (HIPC) Initiative in March 2000 and the completion point in November 2001. Debt relief under these initiatives was critical in achieving debt sustainability.6 In addition, Tanzania’s stronger export performance, which exceeded the
6Section IV of IMF Country Report 03/2 and Section II of IMF Country Report 04/284 demonstrate that using various methodologies, Tanzania’s debt burden (domestic and external) is sustainable. Using different assumptions about aid flows, growth, and exports, the net present value (NPV) of the debt-to-exports ratio is expected to remain well below the HIPC Initiative target of 150 percent over the projection period. Furthermore, Tanzania’s
(continued…)
-10
-5
0
5
10
15
20
25
30
35
FY91/92 FY92/93 FY93/94 FY94/95 FY95/96 FY96/97 FY97/98 FY98/99 FY99/00 FY00/01 FY01/02-10
-5
0
5
10
15
20
25
30
35
Inflation (Annual percentage changes)
Overall balance after grants(In percent of GDP)
Source: Tanzanian authorities. 1/ Fiscal year runs from July to June.
Domestic financing(In percent of GDP)
Figure 3. Tanzania: Fiscal Performance and Inflation, 1991/92-2001/02 1/
Program assistance (In percent of GDP)
- 12 -
projections at the time of the completion point on account of higher exports of gold and better performance of the tourism sector, helped debt sustainability. Furthermore, Tanzania’s debt burden (as net present value of debt-to-exports ratio) was projected to average 230 percent only over 2001/02–2010/11, significantly below the debt burden of many other HIPC-eligible countries, prior to the receipt of any debt relief. Tanzania also benefited from additional debt forgiveness by bilateral donors.
Sources of growth
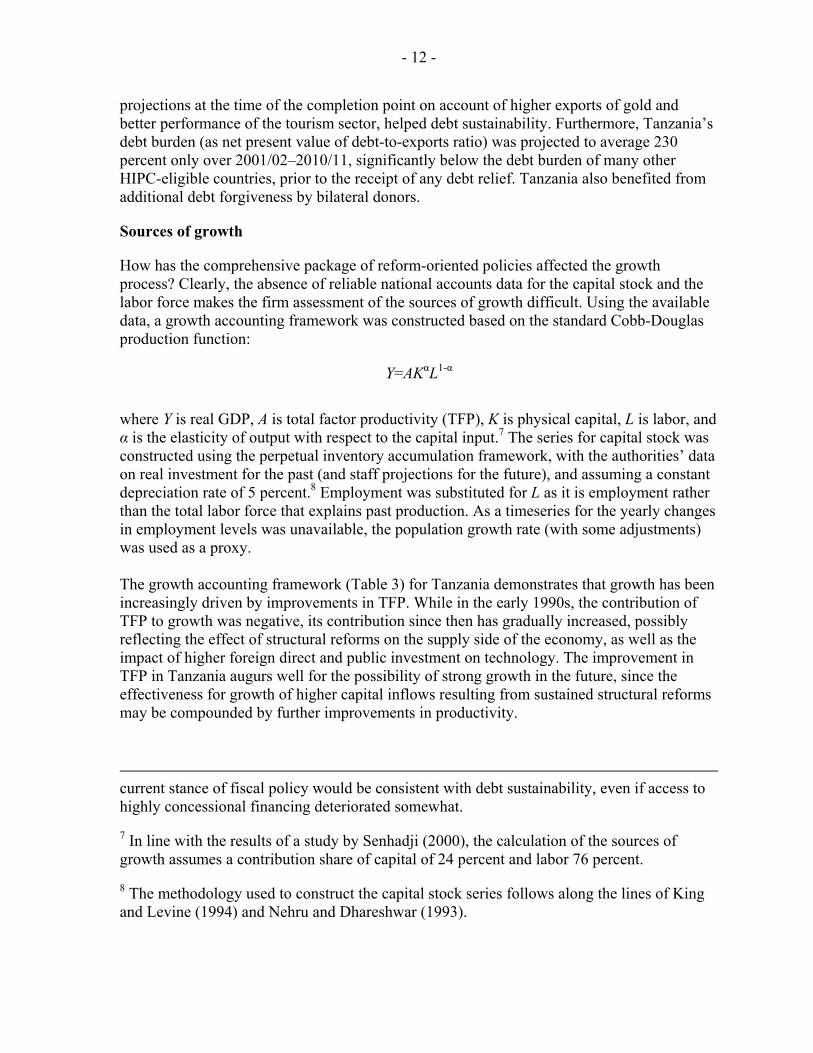
How has the comprehensive package of reform-oriented policies affected the growth process? Clearly, the absence of reliable national accounts data for the capital stock and the labor force makes the firm assessment of the sources of growth difficult. Using the available data, a growth accounting framework was constructed based on the standard Cobb-Douglas production function:
Y=AKαL1-α
where Y is real GDP, A is total factor productivity (TFP), K is physical capital, L is labor, and α is the elasticity of output with respect to the capital input.7 The series for capital stock was constructed using the perpetual inventory accumulation framework, with the authorities’ data on real investment for the past (and staff projections for the future), and assuming a constant depreciation rate of 5 percent.8 Employment was substituted for L as it is employment rather than the total labor force that explains past production. As a timeseries for the yearly changes in employment levels was unavailable, the population growth rate (with some adjustments) was used as a proxy. The growth accounting framework (Table 3) for Tanzania demonstrates that growth has been increasingly driven by improvements in TFP. While in the early 1990s, the contribution of TFP to growth was negative, its contribution since then has gradually increased, possibly reflecting the effect of structural reforms on the supply side of the economy, as well as the impact of higher foreign direct and public investment on technology. The improvement in TFP in Tanzania augurs well for the possibility of strong growth in the future, since the effectiveness for growth of higher capital inflows resulting from sustained structural reforms may be compounded by further improvements in productivity.
current stance of fiscal policy would be consistent with debt sustainability, even if access to highly concessional financing deteriorated somewhat.
7 In line with the results of a study by Senhadji (2000), the calculation of the sources of growth assumes a contribution share of capital of 24 percent and labor 76 percent.
8 The methodology used to construct the capital stock series follows along the lines of King and Levine (1994) and Nehru and Dhareshwar (1993).
- 13 -
The results of this analysis of the sources of growth correspond also to those of the recent study by Tahari and others (2004), which showed that the recent pickup in growth during 1997–2002 was driven primarily by an improvement in the growth of TFP, namely in countries whose programs with the Fund were judged to be on track.
Given sustained high levels of aid flows, the question arises of whether and to what extent Tanzania’s strong growth performance and improvement in TFP was the direct result of the substantial financial support of the donor community. Large-scale external assistance has had the greatest impact on priority sector expenditures, which has risen from 4.8 percent in 1998/99 to the 11.9 percent of GDP projected for 2004/05. This increase in assistance was broad-based across the main priority sector areas, including education, health, and roads. While access to education has recently improved quite significantly, these improvements have been reflected mostly in higher enrollment in primary education and will likely result in higher literacy over time. It is, however, unlikely that improved education has already led to higher growth. Higher expenditures on health have yet to result in improved health indicators (see next section) and have hence not yet resulted in higher growth. The rise in expenditure on roads, however, has likely had strong positive effects on growth and factor productivity.
Aid may have furthermore affected growth by boosting aggregate demand. In the absence of large-scale donor assistance, government expenditure would have been significantly lower, which would have reduced both consumption and investment. At the same time, the discussion of growth above suggests that the most important factors explaining higher growth performance were foreign direct investment in key export-oriented sectors of the economy in response to market-oriented reforms in an environment of political stability.
Hence, while higher demand for goods and services by the government and government employees may have had an important impact on growth, it is hard to see how the substantial acceleration of growth since the mid-1990s could have occurred in the absence of the key macroeconomic and structural policies described above. This is also supported by the fact that average expenditures in percent of GDP over 1996–2002 did not rise by more than 1 percent of GDP a year relative to the first half of the 1990s.
- 14 -
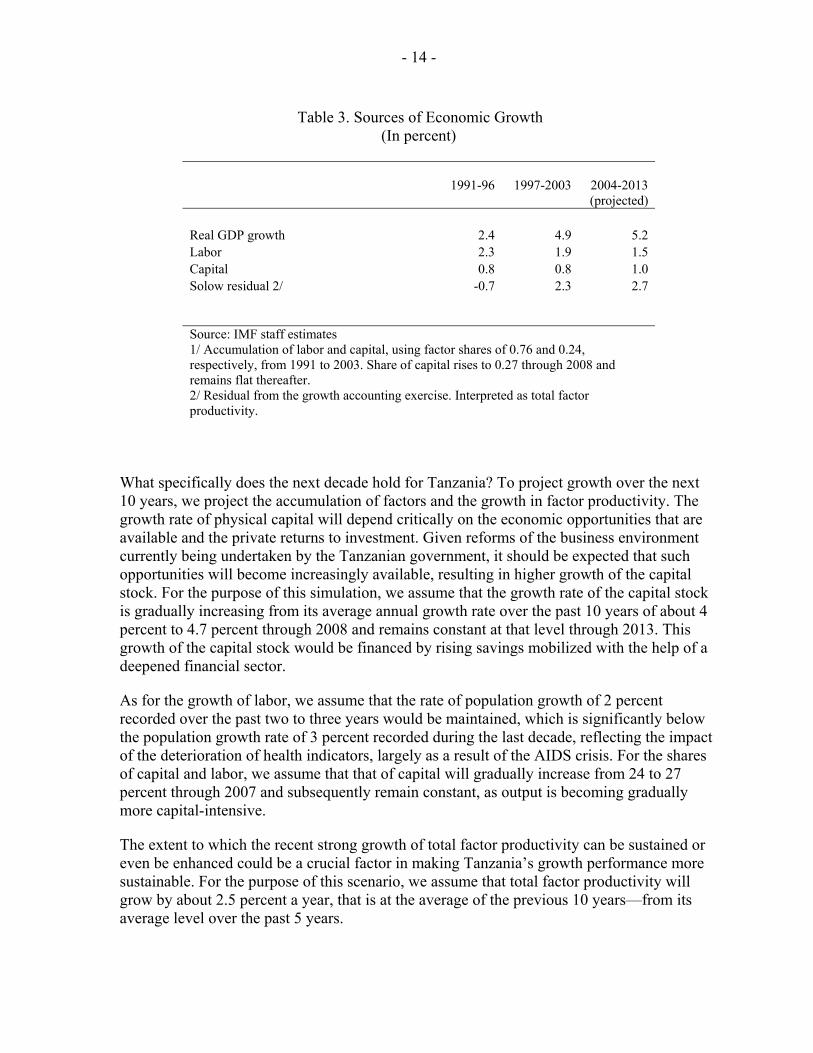
What specifically does the next decade hold for Tanzania? To project growth over the next 10 years, we project the accumulation of factors and the growth in factor productivity. The growth rate of physical capital will depend critically on the economic opportunities that are available and the private returns to investment. Given reforms of the business environment currently being undertaken by the Tanzanian government, it should be expected that such opportunities will become increasingly available, resulting in higher growth of the capital stock. For the purpose of this simulation, we assume that the growth rate of the capital stock is gradually increasing from its average annual growth rate over the past 10 years of about 4 percent to 4.7 percent through 2008 and remains constant at that level through 2013. This growth of the capital stock would be financed by rising savings mobilized with the help of a deepened financial sector.
As for the growth of labor, we assume that the rate of population growth of 2 percent recorded over the past two to three years would be maintained, which is significantly below the population growth rate of 3 percent recorded during the last decade, reflecting the impact of the deterioration of health indicators, largely as a result of the AIDS crisis. For the shares of capital and labor, we assume that that of capital will gradually increase from 24 to 27 percent through 2007 and subsequently remain constant, as output is becoming gradually more capital-intensive.
The extent to which the recent strong growth of total factor productivity can be sustained or even be enhanced could be a crucial factor in making Tanzania’s growth performance more sustainable. For the purpose of this scenario, we assume that total factor productivity will grow by about 2.5 percent a year, that is at the average of the previous 10 years—from its average level over the past 5 years.
Table 3. Sources of Economic Growth (In percent)
1991-96 1997-2003
2004-2013 (projected)
Real GDP growth 2.4 4.9 5.2 Labor 2.3 1.9 1.5 Capital 0.8 0.8 1.0 Solow residual 2/ -0.7 2.3 2.7 Source: IMF staff estimates 1/ Accumulation of labor and capital, using factor shares of 0.76 and 0.24, respectively, from 1991 to 2003. Share of capital rises to 0.27 through 2008 and remains flat thereafter. 2/ Residual from the growth accounting exercise. Interpreted as total factor productivity.
- 15 -
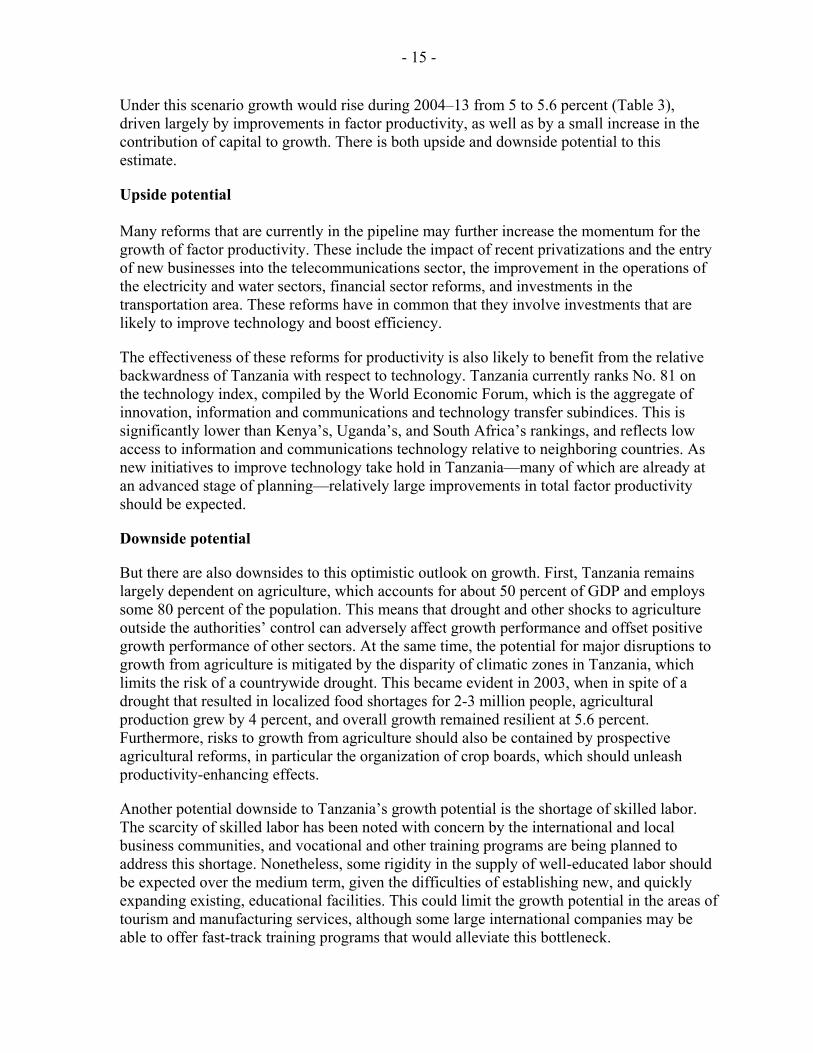
Under this scenario growth would rise during 2004–13 from 5 to 5.6 percent (Table 3), driven largely by improvements in factor productivity, as well as by a small increase in the contribution of capital to growth. There is both upside and downside potential to this estimate.
Upside potential Many reforms that are currently in the pipeline may further increase the momentum for the growth of factor productivity. These include the impact of recent privatizations and the entry of new businesses into the telecommunications sector, the improvement in the operations of the electricity and water sectors, financial sector reforms, and investments in the transportation area. These reforms have in common that they involve investments that are likely to improve technology and boost efficiency.
The effectiveness of these reforms for productivity is also likely to benefit from the relative backwardness of Tanzania with respect to technology. Tanzania currently ranks No. 81 on the technology index, compiled by the World Economic Forum, which is the aggregate of innovation, information and communications and technology transfer subindices. This is significantly lower than Kenya’s, Uganda’s, and South Africa’s rankings, and reflects low access to information and communications technology relative to neighboring countries. As new initiatives to improve technology take hold in Tanzania—many of which are already at an advanced stage of planning—relatively large improvements in total factor productivity should be expected.
Downside potential
But there are also downsides to this optimistic outlook on growth. First, Tanzania remains largely dependent on agriculture, which accounts for about 50 percent of GDP and employs some 80 percent of the population. This means that drought and other shocks to agriculture outside the authorities’ control can adversely affect growth performance and offset positive growth performance of other sectors. At the same time, the potential for major disruptions to growth from agriculture is mitigated by the disparity of climatic zones in Tanzania, which limits the risk of a countrywide drought. This became evident in 2003, when in spite of a drought that resulted in localized food shortages for 2-3 million people, agricultural production grew by 4 percent, and overall growth remained resilient at 5.6 percent. Furthermore, risks to growth from agriculture should also be contained by prospective agricultural reforms, in particular the organization of crop boards, which should unleash productivity-enhancing effects.
Another potential downside to Tanzania’s growth potential is the shortage of skilled labor. The scarcity of skilled labor has been noted with concern by the international and local business communities, and vocational and other training programs are being planned to address this shortage. Nonetheless, some rigidity in the supply of well-educated labor should be expected over the medium term, given the difficulties of establishing new, and quickly expanding existing, educational facilities. This could limit the growth potential in the areas of tourism and manufacturing services, although some large international companies may be able to offer fast-track training programs that would alleviate this bottleneck.
- 16 -
An additional downside risk relates to the business environment. On the one hand, recent surveys of investors’ assessments of conditions in Tanzania, using a backward-looking improvement index and a forward-looking optimism index, show that the business community is aware of the government’s efforts at improving the business environment and is increasingly confident that further substantial improvements will take place in the near future.9 On the other hand, numerous shortcomings in the business environment remain, including (i) the quality of governance; (ii) taxation; (iii) financial sector reform, in particular the framework for bank lending; and (iv) the availability and quality of infrastructure and energy resources. This underscores the importance of further improving the business environment to strengthen private investment. The continued commitment of the Tanzanian government to the dialogue with the business community in the context of the Investors’ Roundtable could facilitate, however, the resolution of these pending issues. Results of recent consultations in these fora include an agreement on the amendment of the Land Act that would be conducive to facilitating bank lending, the simplification of business licensing requirements, and the elimination of a number of nuisance taxes.
A further downside risk relates to the possible impact on productivity of the strong prevalence of AIDS/HIV and other diseases. Currently, about 15 percent of the adult population is estimated to be infected with HIV. Unless medication is made widely available (which would be very costly and require substantial donor resources), the high incidence of AIDS could substantially affect productivity, in particular as AIDS infection tends to be concentrated among the urban and professional population, which often contributes substantially to growth.
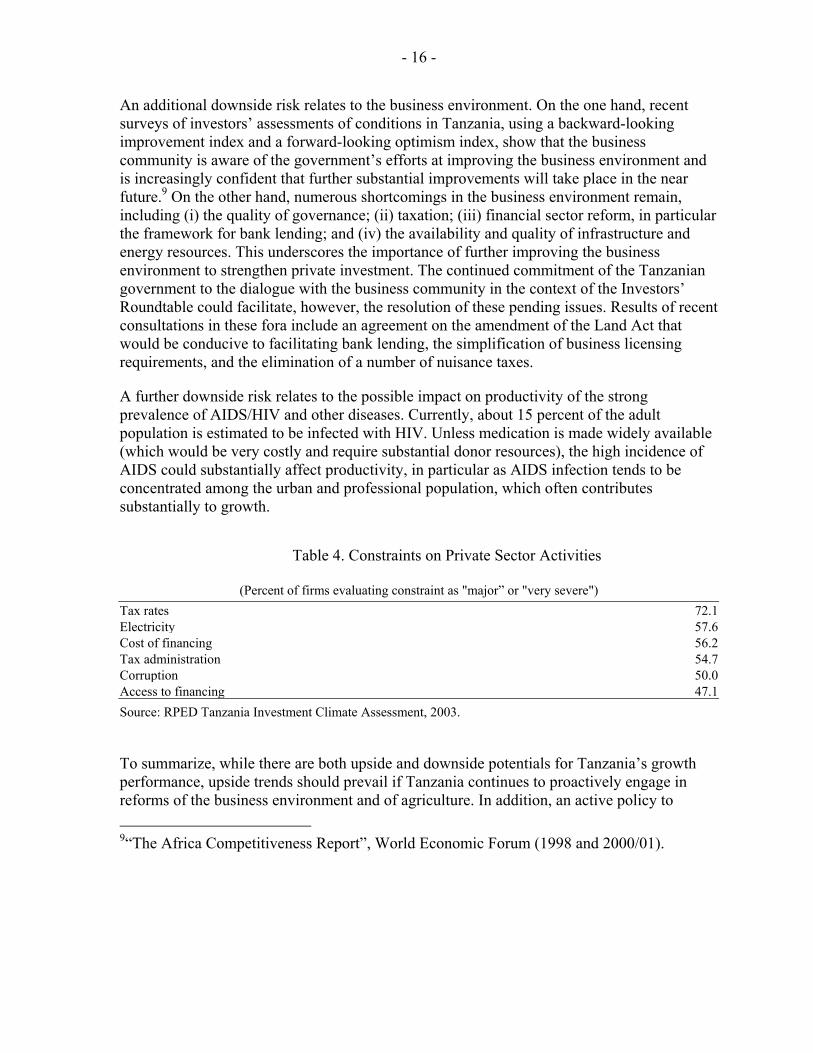
Table 4. Constraints on Private Sector Activities
(Percent of firms evaluating constraint as "major” or "very severe") Tax rates 72.1Electricity 57.6Cost of financing 56.2Tax administration 54.7Corruption 50.0Access to financing 47.1Source: RPED Tanzania Investment Climate Assessment, 2003.
To summarize, while there are both upside and downside potentials for Tanzania’s growth performance, upside trends should prevail if Tanzania continues to proactively engage in reforms of the business environment and of agriculture. In addition, an active policy to 9“The Africa Competitiveness Report”, World Economic Forum (1998 and 2000/01).
- 17 -
contain the spread of AIDS and increase the availability of AIDS medication will be critical to sustain the growth momentum.
III. GROWTH AND POVERTY REDUCTION
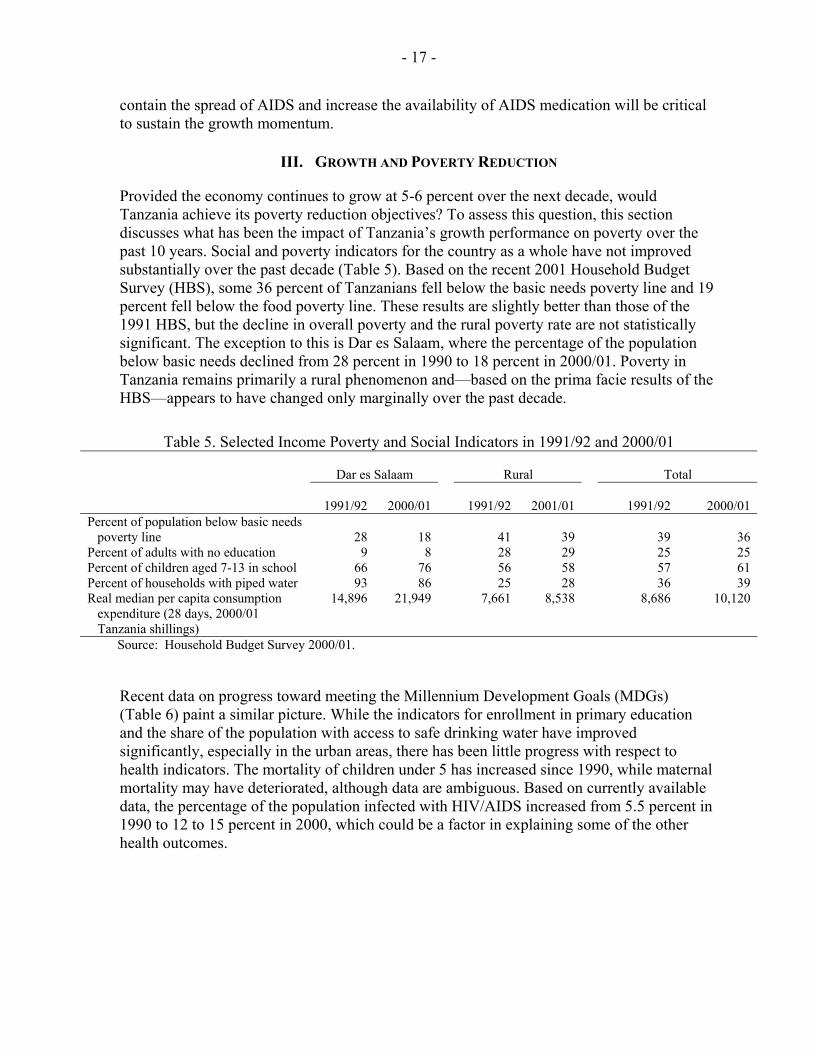
Provided the economy continues to grow at 5-6 percent over the next decade, would Tanzania achieve its poverty reduction objectives? To assess this question, this section discusses what has been the impact of Tanzania’s growth performance on poverty over the past 10 years. Social and poverty indicators for the country as a whole have not improved substantially over the past decade (Table 5). Based on the recent 2001 Household Budget Survey (HBS), some 36 percent of Tanzanians fell below the basic needs poverty line and 19 percent fell below the food poverty line. These results are slightly better than those of the 1991 HBS, but the decline in overall poverty and the rural poverty rate are not statistically significant. The exception to this is Dar es Salaam, where the percentage of the population below basic needs declined from 28 percent in 1990 to 18 percent in 2000/01. Poverty in Tanzania remains primarily a rural phenomenon and—based on the prima facie results of the HBS—appears to have changed only marginally over the past decade.
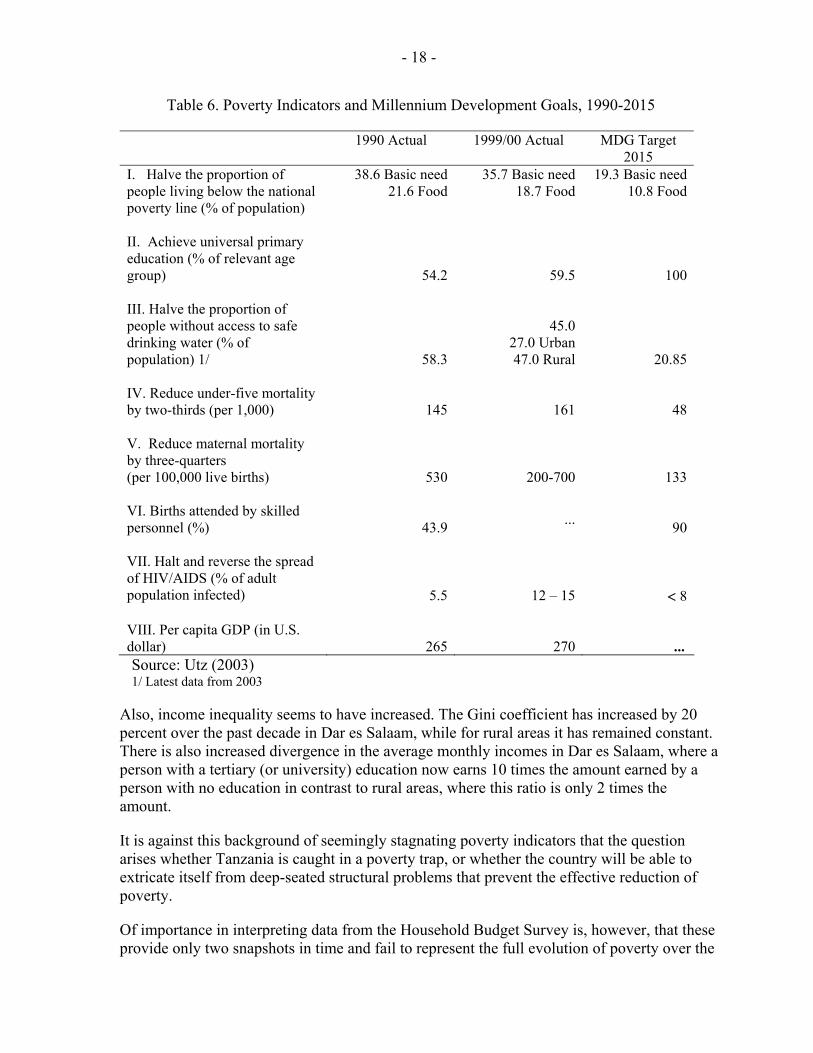
Recent data on progress toward meeting the Millennium Development Goals (MDGs) (Table 6) paint a similar picture. While the indicators for enrollment in primary education and the share of the population with access to safe drinking water have improved significantly, especially in the urban areas, there has been little progress with respect to health indicators. The mortality of children under 5 has increased since 1990, while maternal mortality may have deteriorated, although data are ambiguous. Based on currently available data, the percentage of the population infected with HIV/AIDS increased from 5.5 percent in 1990 to 12 to 15 percent in 2000, which could be a factor in explaining some of the other health outcomes.
Table 5. Selected Income Poverty and Social Indicators in 1991/92 and 2000/01
Dar es Salaam
Rural
Total
1991/92
2000/01
1991/92
2001/01
1991/92
2000/01 Percent of population below basic needs poverty line
28
18
41
39
39
36
Percent of adults with no education 9 8 28 29 25 25 Percent of children aged 7-13 in school 66 76 56 58 57 61 Percent of households with piped water 93 86 25 28 36 39 Real median per capita consumption expenditure (28 days, 2000/01 Tanzania shillings)
14,896 21,949 7,661 8,538 8,686 10,120
Source: Household Budget Survey 2000/01.
- 18 -
Table 6. Poverty Indicators and Millennium Development Goals, 1990-2015
1990 Actual 1999/00 Actual MDG Target 2015
I. Halve the proportion of people living below the national poverty line (% of population)
38.6 Basic need 21.6 Food
35.7 Basic need 18.7 Food
19.3 Basic need 10.8 Food
II. Achieve universal primary education (% of relevant age group)
54.2
59.5
100 III. Halve the proportion of people without access to safe drinking water (% of population) 1/
58.3
45.0
27.0 Urban 47.0 Rural
20.85 IV. Reduce under-five mortality by two-thirds (per 1,000)
145
161
48
V. Reduce maternal mortality by three-quarters (per 100,000 live births)
530
200-700
133 VI. Births attended by skilled personnel (%)
43.9 ...
90 VII. Halt and reverse the spread of HIV/AIDS (% of adult population infected)
5.5
12 – 15 < 8 VIII. Per capita GDP (in U.S. dollar)
265
270 ...
Source: Utz (2003) 1/ Latest data from 2003
Also, income inequality seems to have increased. The Gini coefficient has increased by 20 percent over the past decade in Dar es Salaam, while for rural areas it has remained constant. There is also increased divergence in the average monthly incomes in Dar es Salaam, where a person with a tertiary (or university) education now earns 10 times the amount earned by a person with no education in contrast to rural areas, where this ratio is only 2 times the amount.
It is against this background of seemingly stagnating poverty indicators that the question arises whether Tanzania is caught in a poverty trap, or whether the country will be able to extricate itself from deep-seated structural problems that prevent the effective reduction of poverty.
Of importance in interpreting data from the Household Budget Survey is, however, that these provide only two snapshots in time and fail to represent the full evolution of poverty over the
- 19 -
course of the intervening nine years. Considering very moderate real growth of per capita income of only 0.6 percent annually over the past decade, the rather modest decrease in poverty does not appear surprising: in fact, the poverty elasticity of growth in Tanzania was approximately 1.3, which places Tanzania in the highest group among 43 developing countries in Latin America, Asia, and Africa surveyed by the World Bank in the context of the Global Monitoring Report 2004.
This low average growth rate conceals important economic developments during the decade. During the first half of the 1990s, per capita income actually declined, mainly as a result of poor economic management. Once Tanzania started to implement economic reforms in the mid-1990s, economic growth began to accelerate and reached 4.2 percent over 1996–2000 (Table 7). However, because of the contraction during the first half of the 1990s, per capita income in 2000 was broadly the same as in 1990.
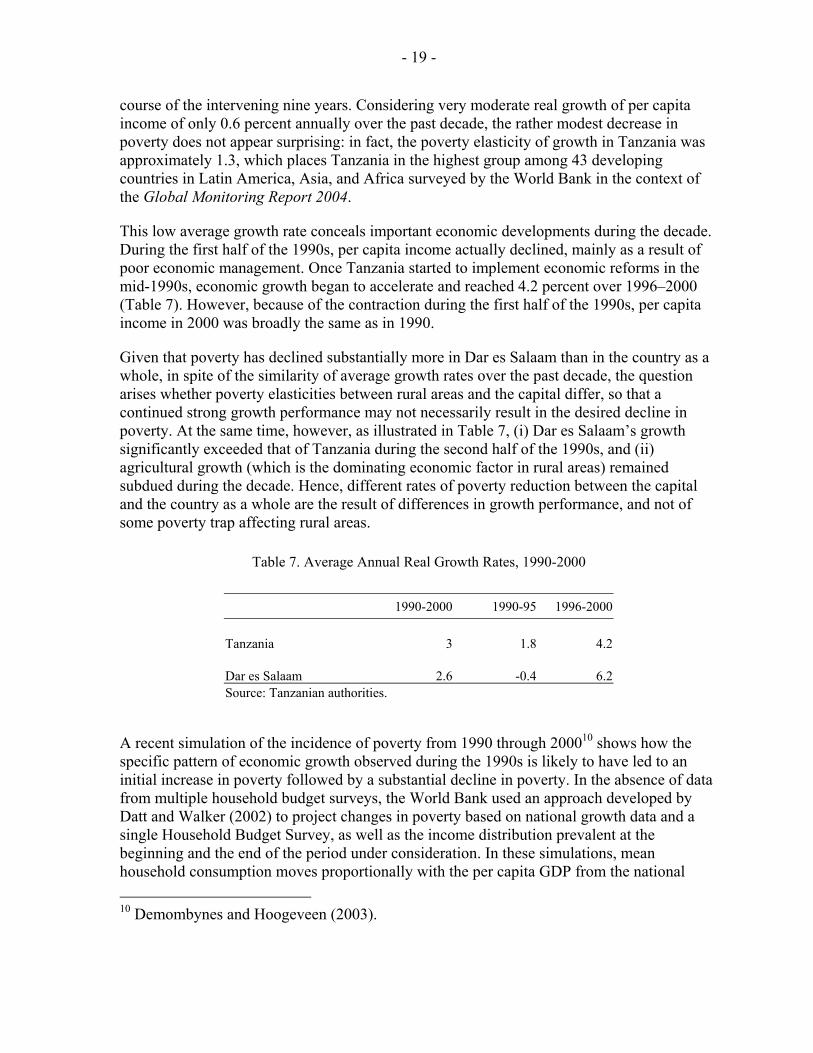
Given that poverty has declined substantially more in Dar es Salaam than in the country as a whole, in spite of the similarity of average growth rates over the past decade, the question arises whether poverty elasticities between rural areas and the capital differ, so that a continued strong growth performance may not necessarily result in the desired decline in poverty. At the same time, however, as illustrated in Table 7, (i) Dar es Salaam’s growth significantly exceeded that of Tanzania during the second half of the 1990s, and (ii) agricultural growth (which is the dominating economic factor in rural areas) remained subdued during the decade. Hence, different rates of poverty reduction between the capital and the country as a whole are the result of differences in growth performance, and not of some poverty trap affecting rural areas.
Table 7. Average Annual Real Growth Rates, 1990-2000
1990-2000 1990-95 1996-2000 Tanzania 3 1.8 4.2 Dar es Salaam 2.6 -0.4 6.2 Source: Tanzanian authorities.
A recent simulation of the incidence of poverty from 1990 through 200010 shows how the specific pattern of economic growth observed during the 1990s is likely to have led to an initial increase in poverty followed by a substantial decline in poverty. In the absence of data from multiple household budget surveys, the World Bank used an approach developed by Datt and Walker (2002) to project changes in poverty based on national growth data and a single Household Budget Survey, as well as the income distribution prevalent at the beginning and the end of the period under consideration. In these simulations, mean household consumption moves proportionally with the per capita GDP from the national 10 Demombynes and Hoogeveen (2003).
- 20 -
accounts. As a result, per capita GDP growth rates from the national accounts data can be applied to household budget survey data to simulate changes in household per capita consumption. Since the incidence of poverty is defined as the proportion of people below a certain consumption level, the derived path of per capita consumption allows to derive annual data for the incidence of poverty.
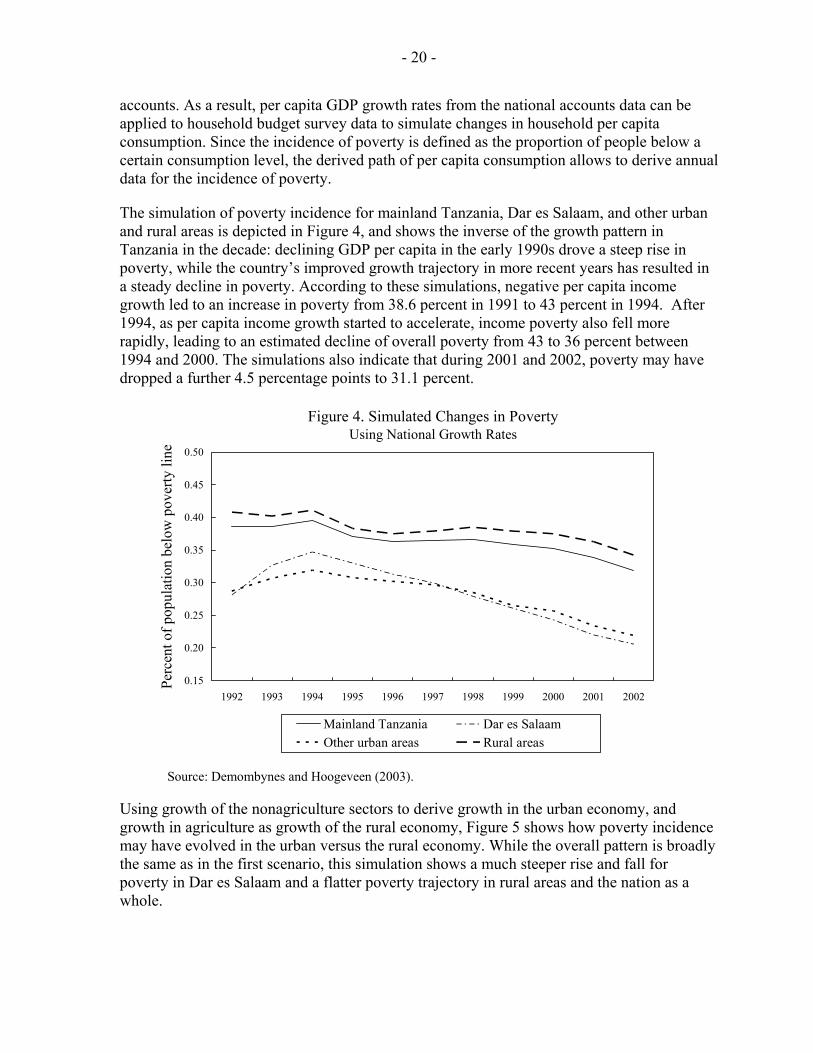
The simulation of poverty incidence for mainland Tanzania, Dar es Salaam, and other urban and rural areas is depicted in Figure 4, and shows the inverse of the growth pattern in Tanzania in the decade: declining GDP per capita in the early 1990s drove a steep rise in poverty, while the country’s improved growth trajectory in more recent years has resulted in a steady decline in poverty. According to these simulations, negative per capita income growth led to an increase in poverty from 38.6 percent in 1991 to 43 percent in 1994. After 1994, as per capita income growth started to accelerate, income poverty also fell more rapidly, leading to an estimated decline of overall poverty from 43 to 36 percent between 1994 and 2000. The simulations also indicate that during 2001 and 2002, poverty may have dropped a further 4.5 percentage points to 31.1 percent.
0.15
0.20
0.25
0.30
0.35
0.40
0.45
0.50
1992 1993 1994 1995 1996 1997 1998 1999 2000 2001 2002
Mainland Tanzania Dar es SalaamOther urban areas Rural areas
Figure 4. Simulated Changes in Poverty Using National Growth Rates
Perc
ent o
f pop
ulat
ion
belo
w p
over
ty li
ne
Source: Demombynes and Hoogeveen (2003).
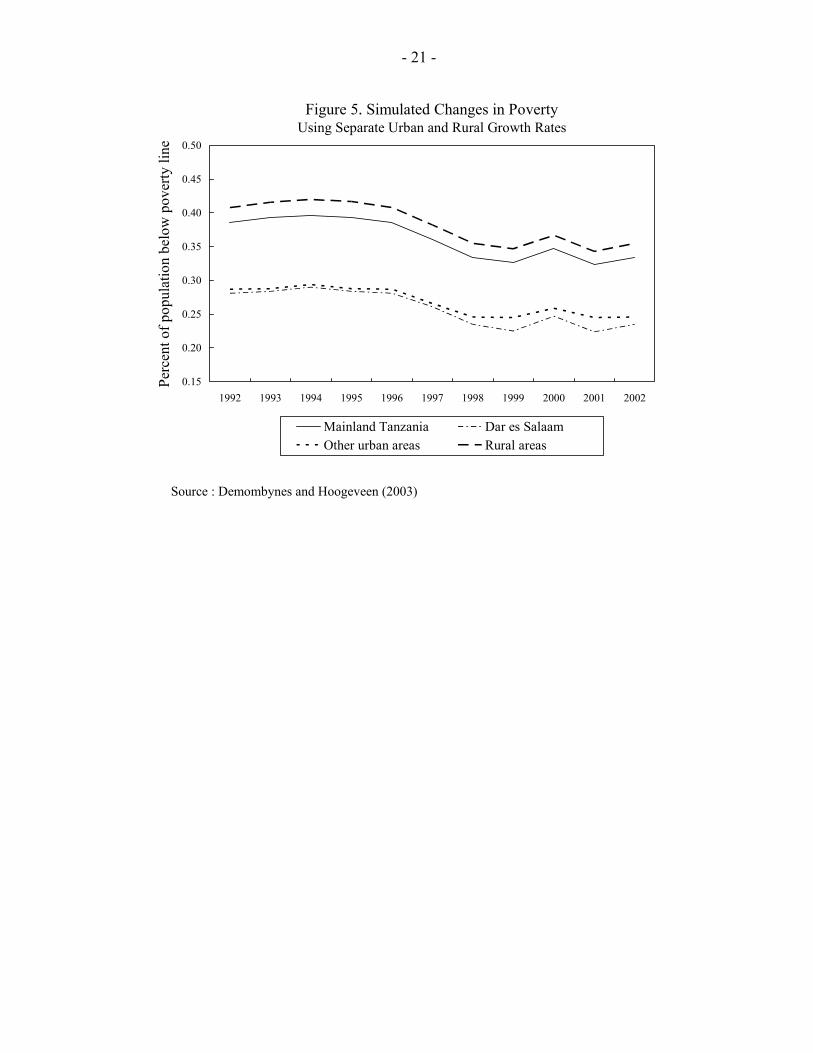
Using growth of the nonagriculture sectors to derive growth in the urban economy, and growth in agriculture as growth of the rural economy, Figure 5 shows how poverty incidence may have evolved in the urban versus the rural economy. While the overall pattern is broadly the same as in the first scenario, this simulation shows a much steeper rise and fall for poverty in Dar es Salaam and a flatter poverty trajectory in rural areas and the nation as a whole.
- 21 -
0.15
0.20
0.25
0.30
0.35
0.40
0.45
0.50
1992 1993 1994 1995 1996 1997 1998 1999 2000 2001 2002
Mainland Tanzania Dar es SalaamOther urban areas Rural areas
Figure 5. Simulated Changes in Poverty Using Separate Urban and Rural Growth Rates
Perc
ent o
f pop
ulat
ion
belo
w p
over
ty li
ne
Source : Demombynes and Hoogeveen (2003)
- 22 -
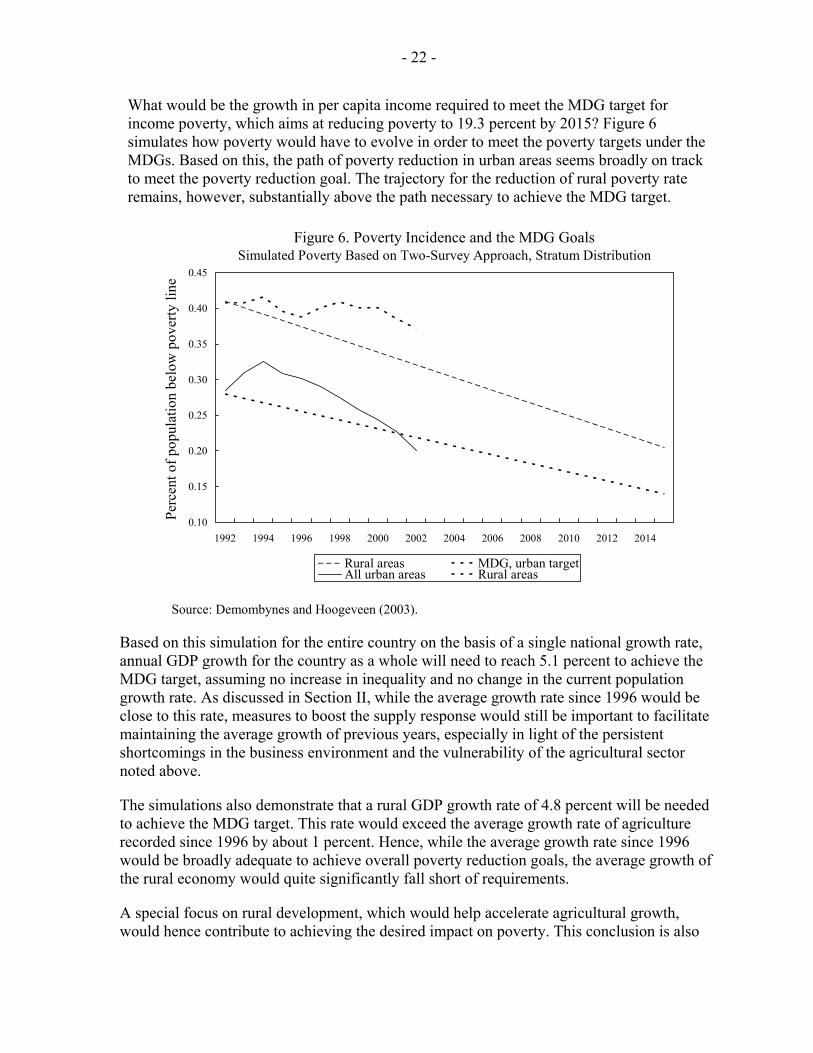
What would be the growth in per capita income required to meet the MDG target for income poverty, which aims at reducing poverty to 19.3 percent by 2015? Figure 6 simulates how poverty would have to evolve in order to meet the poverty targets under the MDGs. Based on this, the path of poverty reduction in urban areas seems broadly on track to meet the poverty reduction goal. The trajectory for the reduction of rural poverty rate remains, however, substantially above the path necessary to achieve the MDG target.
0.10
0.15
0.20
0.25
0.30
0.35
0.40
0.45
1992 1994 1996 1998 2000 2002 2004 2006 2008 2010 2012 2014
Rural areas MDG, urban targetAll urban areas Rural areas
Figure 6. Poverty Incidence and the MDG GoalsSimulated Poverty Based on Two-Survey Approach, Stratum Distribution
Perc
ent o
f pop
ulat
ion
belo
w p
over
ty li
ne
Source: Demombynes and Hoogeveen (2003).
Based on this simulation for the entire country on the basis of a single national growth rate, annual GDP growth for the country as a whole will need to reach 5.1 percent to achieve the MDG target, assuming no increase in inequality and no change in the current population growth rate. As discussed in Section II, while the average growth rate since 1996 would be close to this rate, measures to boost the supply response would still be important to facilitate maintaining the average growth of previous years, especially in light of the persistent shortcomings in the business environment and the vulnerability of the agricultural sector noted above.
The simulations also demonstrate that a rural GDP growth rate of 4.8 percent will be needed to achieve the MDG target. This rate would exceed the average growth rate of agriculture recorded since 1996 by about 1 percent. Hence, while the average growth rate since 1996 would be broadly adequate to achieve overall poverty reduction goals, the average growth of the rural economy would quite significantly fall short of requirements.
A special focus on rural development, which would help accelerate agricultural growth, would hence contribute to achieving the desired impact on poverty. This conclusion is also
- 23 -
supported by the bulk of research on pro-poor growth. Ravallion and Datt (1996) find that approximately 85 percent of poverty reduction in India during the period they studied was due to growth in agriculture. Similarly, Timmer (1997) finds that agricultural growth has a stronger and more robust elasticity with respect to poverty reduction than does manufacturing growth. The importance of agricultural growth seems to derive from two factors: (i) most poor people in developing countries live in the rural areas, and (ii) improvements in agricultural productivity have a direct impact on poverty through higher demand for labor, which increases wage earnings and lowers food prices.
To summarize the findings: past evidence of the growth-poverty nexus in Tanzania suggests that reaching the Millennium Development Goal target of halving poverty by 2015 would require an overall annual growth rate of about 5 percent, and of about 4.8 percent in the rural economy. While the overall growth rate is broadly in line with the growth recorded in Tanzania since 1996, growth in the rural economy falls short of what is required. What could be main pillars of such a strategy? Available evidence suggests two main priorities: first, improving the business environment and, second, fostering the rural economy.
IV. CONCLUSIONS
Supported by substantial donor assistance, Tanzania has, over the past 10 years, made impressive progress in most areas of economic reform. Reform-oriented policies have boosted growth prospects, and also, had a noticeable impact on poverty. Tanzania appears now to be on the right track to meet the MDG targets for reducing income poverty, provided reform-oriented policies are continued and, in the case of the rural economy, are intensified. Of particular importance in this respect are further reforms of the business environment with a view to attracting investment, and additional efforts to reform the agricultural economy as an essential ingredient for poverty reduction.
- 24 -
References
Collins, S., and B. Bosworth, 1996, “Economic Growth in East Asia: Accumulation versus Assimilation,” Brookings Papers on Economic Activity 2: 135-91.
Datt, G. and T. Walker, 2002, Povstat 2.12, A Poverty Projection Toolkit, User’s Manual, The World Bank, October 14, 2002, mimeo.
Demombynes, G. and J. Hoogeveen, 2003, “Growth, Inequality and Simulated Poverty Paths for Tanzania, 1992-2002,” World Bank.
International Monetary Fund, 2003, “Tanzania : Selected Issues and Statistical Appendix,“ IMF Country Report No.03/2 (Washington: International Monetary Fund).
International Monetary Fund, 2004, “Tanzania : Selected Issues and Statistical Appendix,“ IMF Country Report No.04/284 (Washington: International Monetary Fund).
King, Robert G., and R. Levine, 1994, “Capital Fundamentalism, Economic Development and Economic Growth.” Carnegie-Rochester Conference Series on Public Policy 40: 259-92
National Bureau of Statistics Tanzania, 2001, Household Budget Survey.
Nehru, V., and A. Dhareshwar, 1993, “A New Database on Physical Capital Stocks, Sources, Methodology, and Results.” Revista de Análisis Económico 8(1): 37-60.
Prati, A., Ratna Sahay, and Thierry Tressel, 2003, “Is There a Case for Sterilizing Foreign Aid Inflows?” IMF Seminar Series No. 2003–88 (Washington, IMF).
Ravallion, M. and Datt, G. 1996, “When is Growth Pro-Poor? Evidence from the Diverse Experience of India’s States.” World Bank.
Ravallion, M., and Datt, G., 2001, “Why Has Economic Growth Been More Pro-poor in Some States of India than in Others?” Journal of Development Economics, Vol. 68 (August), pp. 381-400.
Senhadji, A., 2000, “Sources of Economic Growth: An Extensive Growth Accounting Exercise,” IMF Staff Papers, Vol. 47, No.1, pp. 129-157.
Tahari, Amor, Dhaneshwar Ghura, Bernardin Akitoby, and Emmanuel Brouka, 2004, “Sources of Growth in Sub-Saharan Africa,“ IMF Working Paper No. 04/176 (Washington: International Monetary Fund).
Timmer, P., 1997, “How Well Do the Poor Connect to the Growth Process?” (unpublished; Cambridge, Massachusetts: Harvard University).

- 25 -
Utz, R., 2003, “Aid Requirements to Accelerate Progress Towards the MDGs” (unpublished; Washington: World Bank).
World Bank, 2001, “Agriculture in Tanzania since 1986 -- Follower or Leader of Growth ?” World Economic Forum, “The Africa Competitiveness Report”, various issues (Geneva,
Switzerland: World Economic Forum).