Embed Size (px)
Citation preview

8/8/2019 Tanzania SPR Layout Final English
http://slidepdf.com/reader/full/tanzania-spr-layout-final-english 1/47
Tanzania ICT
Sector Performance Review
2009/2010
Mary Materu-Behitsa and Bitrina D. Diyamett
Towards Evidence-based ICT Policy and Regulation
Volume Two , Policy Paper 11, 2010

8/8/2019 Tanzania SPR Layout Final English
http://slidepdf.com/reader/full/tanzania-spr-layout-final-english 2/47
Research ICT Africa
Research ICT Africa fills a strategic gap in the development of a sustainable information society and
network knowledge economy by building the ICT policy and regulatory research capacity needed to
inform effective ICT governance in Africa. The network was launched with seed funding from the IDRC
and seeks to extend its activities through national, regional and continental partnerships. The
establishment of the Research ICT Africa (RIA) network emanates from the growing demand for dataand analysis necessary for the appropriate and visionary policy required to catapult the continent into
the information age. Through network development RIA seeks to build an African knowledge base in
support of ICT policy and regulatory design processes, and to monitor and review policy and
regulatory developments on the continent. The research arising from a public interest agenda is made
available in the public domain, and individuals and entities from the public and private sector and civil
society are encouraged to use it for teaching, further research or to enable them to participate more
effectively in national, regional and global ICT policy formulation and governance. This research is
made possible by the significant funding received from the International Development Research
Centre (IDRC) Ottawa, Canada. The network members express their gratitude to the IDRC for its
support. The network is under the directorship of Dr. Alison Gillwald.
BiographyBitrina Diyamett is an Executive Director of ATPS-Tanzania, which is an NGO charged with
independent policy research in science, technology and innovation (STI). She previously worked
with the Tanzania Commission for Science and Technology (COSTECH) as programme officer for the
coordination of social science research, including policy research in science, technology and
innovation, in the country. Bitrina holds a Masters degree in Science and Technology Policy from
Research Policy Institute (RPI) Lund University, Sweden, and a PhD in Development Studies from the
University of Dar es Salaam, Tanzania. Bitrina has earned a fair share of consultancies and
publications in the area of science, technology and innovation policy. Much of her past and current
research work and publications - including PhD thesis - has focused on systems of innovation in the
context of least developed countries.
AcknowledgementsProduction of this report in its present form would not have been possible without the assistance
and contributions of diff erent persons and organizations. As authors of this report we would like to
take this opportunity to extend very special thanks to our research assistants: Mwemezi Rwiza,
Hezron Makundi and Lanta Diyamett, who worked tirelessly in search of necessary information.
We would also like to thank individuals who responded to questionnaires, either in their individual
capacity as stakeholders in the sector or as representatives of their institutions.
Our heartfelt gratitude goes to the Tanzania Communications Regulatory Authority (TCRA) for
providing all necessary support in the course of the field work.
Last but not least we thank ATPS-Tanzania for logistic support and Research ICT Africa for financial
support.
Africa Technology Policy Studies Network, Tanzania Chapter (ATPS-Tanzania)

8/8/2019 Tanzania SPR Layout Final English
http://slidepdf.com/reader/full/tanzania-spr-layout-final-english 3/47
Executive Summary 1
Social and Economic Background 2
Country Profile 2
Economic Status 2
The Status of Telecommunication Sector Development 3
Policy and Regulatory Development 5
Overview 5
Regulatory Issues 6
Regulatory Environment and Instruments 6
SIM Card Registration 8Local Loop Unbundling 8
Number Portability 8
Market Structure 9
Human Resource 9
Telecom, Internet and Broadcasting Market Analysis 11
Overview of the Contribution of the Telecommunications Sector tothe Development in Tanzania 11
Fixed-Line Coverage 13
Mobile Coverage 13
Internet Coverage 13Internet Service Providers Market 15
Broadband Market and Coverage 15
The National Fiber Backbone 16
Broadcasting Market and Coverage 16
Network Subscribers 19
Fixed-Line Subscribers 19
Mobile Subscribers and Trend 20
Internet Subscribers 21
Broadband subscribers 22
Communications Service Pricing 24
Fixed-Line Pricing 24
Mobile Pricing 25
Broadband Pricing 27
Interconnection Facilities Leasing and Costing Model 28
E- & M- Applications 30
E-Money and M-Banking 30
E-Government 30
The Telecommunications Regulatory EnvironmentSurvey 31
Introduction 31
Weighting of Respondents 31Results 32
Conclusion 36
Conclusions and Recommendations 37
References 38
Appendices 39
List of Abbreviations and Acronyms 43
Table of Contents

8/8/2019 Tanzania SPR Layout Final English
http://slidepdf.com/reader/full/tanzania-spr-layout-final-english 4/47
Executive Summary
Tanzania’s telecommunications sector was the fastest growing sector of the economy in 2009,
recording 21.9% growth, up from 20.5% in 2008. The sector contributed 2.1 % to the GDP in 2009,
up from 2.5% in 2008 (Tanzania Budget Speech 2010/11).
The Communication Act of 1993 paved the way for the liberalization of the telecommunication sector,while the National Telecommunication Policy (NTP) of 1997 provided the framework for further reforms
and private-sector engagement in the sector. A milestone in telecom liberalization was achieved by the
establishment of the Telecommunications Regulatory Authority (TCRA) in 2003 as an independent
agency for the regulating and licensing of postal, broadcast and communication industries. The TCRA is
mandated to promote competition and economic efficiency, protect consumer interests, grant licenses
and enforce license conditions, regulate tariffs, and monitor performance.
Under the TCRA, the number of licensed telecommunications operators increased from 5 in 2003 to 62
in 2009. Most of these were issued under the Convergence Licensing Framework (CLF), which the TCRA
effected in 2006. Voice subscribers (mobile and fixed-line) increased from about 1.5 million in 2003 to 17
million in 2009, while tele-density increased from 4% to 43% during the same period. Private sector
engagement, which was facilitated by the liberalisation of the sector, increased competition, improving
services and reducing tariffs. For example, pre-paid telephone tariffs dropped on average by about 40%
from Tshs 359 (US$0.3) per minute in 2003 to Tshs 216 (US$ 0.2) per minute in 2009.
The line ministry, the Ministry of Communications, Science and Technology, provides a policy guide.
Policy guides include the National ICT Policy of 2003, and the National Telecommunications Policy
of 1997. The legal framework is provided by the Tanzania Communications Act of 1993, the Tanzania
Broadcasting Services Act of 1993, the Tanzania Communications Regulatory Authority Act of 2003,
and the Universal Communications Service Access Act of 2006.
Given the dynamic nature of the telecommunications sector, these policies, legal provisions and
regulations require regular review to accommodate new services and a changing business
environment. For example, the Tanzania ICT Policy lacks provisions for electronic money
transactions and electronic transactions in government business. In terms of the regulatory
environment, the sector has regulations for broadband, consumer protection, content licensing
importation and distribution, installation and maintenance, interconnections, numbering and
electronic address, radio communication, spectrum, tariff s and quality of service.
In terms of market structure, the telecommunication market comprises licenses for network carrier
infrastructure development, network services for fixed and mobile operations and network
applications services.
The fixed-line subscriber base has been eroded by the mobile market. While fixed-line subscriber
numbers increased from 154,420 in 2005 to 172,922 in 2009, the number of mobile SIM cards sold
increased from 3.5 million to 17.5 million. There are two fixed-line operators (T TCL and Zantel),
while there are seven mobile operators. In terms of tariff s, the minimum mobile telephone voice
pricing is 1 shilling per second within the same network. Generally, on-net tariff s are lower than off -
net tariff s. Internet penetration is about 1.3%, and the number of internet users is estimated to be
520,000. There are 23 registered internet service providers.
Human resource development for the sector is not adequate, although engineering and ICT
training institutions have increased enrolments. For example, university enrolments in engineering,
science and ICT rose from 3,334 in 2001 to 6,404 in 2005.
Tanzania is implementing a national backbone project. The roll-out for a national backbone is
underway and expected to be ready by 2011. The terrestrial backbone will be critical to a country
sharing planned undersea cables, the first of which, SEACOM, reached Dar es Salaam in July 2009.
Preparations for its deployment were inadequate. To date there is still debate on its management,
distribution and utilization, with only a few ISPs connected.
Broadcasting is largely analogue, with the wider population using free-to-air transmission, although
preparations for the switch over to digital broadcasting are taking place. Radio broadcasting is by
far the most popular media in rural and semi-urban areas.
There are three e-money schemes: M-pesa (Vodacom), ZAP (Zain) and Z-Pesa (Zantel) and three banks
offer mobile banking services. Although the government has embraced e-government as a major
driving force behind efficient and effective transactions in government departments, there are bigchallenges posed by the demand for requisite infrastructure, policies, capacity development, ICT
applications and content development in the national language, Kiswahili.
Towards Evidence-based ICT Policy and Regulation
1
A milestone in telecomliberalization was
achieved by the
establishment of the
Telecommunications
Regulatory Authority
(TCRA) in 2003
The fixed-line
subscriber base has
been eroded by the
mobile market
Broadcasting is largely
analogue, with the
wider population
using free-to-air
transmission

8/8/2019 Tanzania SPR Layout Final English
http://slidepdf.com/reader/full/tanzania-spr-layout-final-english 5/47
Social and Economic Background
Country Profile
Tanzania has an area of 945,000 sq km (365,000 sq miles) and a population of about 40 million.
Dodoma is the official capital and the seat of the parliament, while Dar es Salaam is the commercialcapital and home to many government institutions and diplomatic missions. There are about 120
ethnic groups on the mainland, although none exceeds 10% of the population, as well as minority
Asian and expatriate communities. The national and official language is Kiswahili, which is most
widely spoken. English is used for international communication and as a medium of instruction for
secondary and higher education. Tanzania adopted a multi-party political system in 1992 and has
been a relatively stable country, having held peaceful elections every five years since 1995.1 2 3
Table 1: Tanzania Demographic and Economiic Status1
Indicator Data
Area 945,000 sq km (365,000 sq miles)
Population 43,187,823 (NBS projection for 2010)
Urban population 11,378,015 (NBS projection for 2010)
Rural population 31,809,808 (NBS projection for 2010)
Population growth 2.9% (2002 estimate)
Years for compulsory schooling 7
Literacy rate 80.2% (2005 estimate)
Gross Domestic Product (GDP) US$12.1 billion (2005)2
GDP - Per Capita US$316 (2005)
Inflation rate 12.7 (2008), 12.5 (2009)
Currency and Exchange rate Tanzanian Shillings (TZS): 1US$ = 1,317.5 TZS (2009)
Labour force 20.8 Million
Contribution of Communication Sector
to the GDP20.1% (2007)3
Life expectancy 46 years
Infant mortality rate 85.8 deaths/1000 live births (2007 estimate)
Economic Status
Tanzania's economy relies heavily on agriculture, which accounts for nearly half of GDP and
employs 80% of the workforce. Tourism is growing in importance and ranks as the second highest
foreign exchange earner. Mineral production has grown significantly in the last decade andprovides over 3% of GDP and accounts for half of Tanzania's exports.
Long-term economic growth through to 2005 featured a pickup in industrial production and a
substantial increase in minerals output. Banking reforms in the second half of the decade helped
increase private-sector growth and investment. Continued donor assistance and macroeconomic
policies supported this positive growth rate, despite the world recession. According to the Ministry of
Finance and Economic Affairs (2009), Tanzania recorded good economic performance in 2009. In 2008,
the GDP grew by 7.4% compared to 7.1% in 2007, which is within the projected target of 6 to 8 percent
by 2010. The thrust of government policy during the year 2008/09 was to consolidate achievements and
promote growth through strengthening operational efficiency and enhancement of strategic resource
allocation for infrastructure development and projects with a multiplier effect on the economy.
Tanzania ICT Sector Performance Review 2009/2010
2
1 Unless otherwise stated, source of data is National Bureau of Statistics (NBS)2 URT (2008) Statistics Handbook on Communications, Science and Technology 2007/20083 URT (2008) Statistics Handbook on Communications, Science and Technology 2007/2008
There are about 120
ethnic groups on the
mainland, although
none exceeds 10% of
the population, as well
as minority Asian and
expatriate
communities
Banking reforms in the
second half of the
decade helped
increase private-sector
growth and
investment

8/8/2019 Tanzania SPR Layout Final English
http://slidepdf.com/reader/full/tanzania-spr-layout-final-english 6/47
Table 2: Real GDP Growth Rate 2001-2 08
2001 2002 2003 2004 2005 2006 2007 2008
6 7.2 6.9 7.8 7.4 6.7 7.1 7.4
Source: Natio al Economic Survey (2009)
The Status of Telecommunication Sector Development
Before the liberalization of the telecommunication sector, the telephone communication service
was the monopoly of the TTCL, a state-owned company under the Tanzania Posts and
Telecommunications Corporation (TPTC). The TTCL held a monopoly in the provision of
communication and was also responsible for the regulation of the telecommunication sector. In the
context of a wider economic liberalization policy in the country, the Communications Act of 1993
paved the way for the government's move to liberalize the communications sector. This led to the
split of the TPTC into the Tanzania Posts Corporation (TPC), the Tanzania Telecommunications
Company Limited (T TCL) and the Tanzania Communication Commission (TCC). The National
Telecommunications Policy (NTP), launched in 1997, pushed for further reforms in the sector. Today,
telecommunications is one of the most liberalised sectors of the economy in Tanzania. Due to
convergence of information and communication technologies and respective services, regulationof Tanzania Communication Commission and the Tanzania Broadcasting Commission (TBC)
activities were subsumed under one agency, the Tanzania Communications Regulatory Authority
(TCRA). The TCRA is an autonomous government agency established by the TCRA Act no. 12 of
2003 as an independent authority for the regulation and licensing of postal, broadcasting and
electronic communications industries in the United Republic of Tanzania.
The establishment of the TCRA marked a new era for the communications sector in Tanzania that
has been characterized by growth in investments and operations including penetration. The TCRA
eff ected a Converged Licensing Framework (CLF) in 2005. Under CLF, TCRA has issued licenses
under Network Facility (NF), Network Service (NS), Application Service (AS), and Content Services
(CS) categories. In a phasing out arrangement, licenses are also issued under the old regime in the
areas of Public Data Operators Licenses, Internet Service Providers, Private Dedicated Data
Communications, and Postal and Courier Operators.
The number of ISP and data operators increased from 22 in 2003 to 62 in 2009 (Table 3), voice
subscribers (both fixed and mobile) increased from 1,445,006 to 17,642,408 (Table 4), and prepaid
voice (telecommunication) per minute tariffs decreased by about 40% over the same period (Table 5).
Table 3: Licensed Telecomm nication perators
Number/Year 2003 2004 2005 2006 2007 2008 2009
Voice Mobile Operators 5 5 5 6 6 6 7
ISP/Data Operators 22 23 23 25 34 60 62
Source: TCRA
Table 4: Voice Subscriptions
Number/Year 2003 2004 2005 2006 2007 2008 2009
Fixed Network
Subscriptions147,006 148,360 154,420 151,644 163,269 123,809 172,922
Mobile Network
Subscriptions1,298,000 1,942,000 2,963,737 5,614,922 8,322,857 13,006,793 17,469,486
Total
Subscriptions1,445,006 2,090,360 3,118,157 5,766,566 8,486,126 13,130,602 17,642,408
Teledensity
(Penetrations)4% 6% 10% 15% 21% 32% 43%*
Source: TCRA 2010*Percentage of the population a ainst SIM car s sold
Towards Evidence-based ICT Policy and Regulation
3
the Communications
Act of 1993 paved the
way for the
government's move to
liberalize the
communications
sector
The number of ISP and
data operators
increased from 22 in
2003 to 62 in 2009

8/8/2019 Tanzania SPR Layout Final English
http://slidepdf.com/reader/full/tanzania-spr-layout-final-english 7/47
Table 5: Prepaid Voice Telec m Tariff s per Minute (T.Shs)
Year 2003 2004 2005 2006 2007 2008 2009
On-net Calls 270 247 256 251 233 244 199
Off -net Calls 375 337 356 326 330 340 352
East Africa Calls 569 437 449 356 342 338 355
International Calls 1,940 1,526 1,651 551 499 500 501
Average Tariff 359 312 328 267 256 264 216
Source: http//www.tcra.go.tz
Tanzania ICT Sector Performance Review 2009/2010
4

8/8/2019 Tanzania SPR Layout Final English
http://slidepdf.com/reader/full/tanzania-spr-layout-final-english 8/47
Policy and Regulatory Development
Overview
The main policies guiding developments in the telecommunications sector are the National
Telecommunications Policy (1997), the National ICT Policy (2003), The National Postal Services Policy(2003) and the National Information and Broadcasting Policy (2003).
The National Telecommunications Policy of 1997 is the basic document and provides vision to 2020.
The policy aims at ensuring accelerated development of telecommunications infrastructure and
services so as to accelerate access to telecommunication services by all sectors of the national
economy as part of the national development strategy.
Tanzania’s ICT Policy was approved by parliament in 2005 to provide Government guidance on
ICT issues.
Lack of an overall ICT Policy and poor harmonization of initiatives had previously led to the
random adoption of different systems and standards, unnecessary duplication of effort and waste
of scarce national resources on the one hand, and lack of strategies for the utilization of ICT as a
driving force for national development on the other. The policy articulates ten main focus areas
in harnessing ICT in Tanzania: strategic ICT leadership, ICT infrastructure, ICT industry, humancapital, legal and regulatory framework, productive sectors, service sectors, public service, local
content and universal access.
While the ICT policy is well articulated, its implementation strategy is not. For instance, an ICT
Benchmarking Report for the EAC (2009) revealed the following challenges: the implementation
process lacked ownership, the institutional and governance structure was not articulated, and there
was lack of capacity for coordination at the respective ministry, while competition for resources
among ministries, departments and agencies was stiff . Thus the need for ICT policy review to
address the observed weaknesses was evident. Such a review should also build on synergies of East
African regional cooperation in ICT policies, which will foster a consistent regional policy framework
to achieve economies of scale and promote regional integration.
Broadband connectivity within the region and the development of a single market in East
Africa makes stronger the case for Tanzania to update its national ICT policy to reflect regionaland global perspectives. The East Africa Community (EAC) ICT policy harmonization framework
has ident ified eight (8) prior ity areas including broadband communication, affordable
universal access, human resources development, regulatory harmonization, ICT application,
job creation, entrepreneurship and international cooperation as the major areas of regional
policy focus.
Tanzania developed a National Information and Broadcasting Policy in 2003 which aims to provide
an enabling environment for the development and growth of the sector throughout the country,
encourage media houses to off er professional and impartial services, and encourage the setting of
standards for work and professional code of conduct. The policy encourages private and
government investments in all areas, especially those not attractive to business. However, to date
there is still no law that enforces the national ICT Policy of Tanzania. This makes both the policy itself
and the regulatory body (TCRA) somewhat ineff ective, as the TCRA needs a legal framework to
enforce what is stipulated by the policy.
For example, the TCRA universal access strategy draws its mandate from the Tanzania
Development Master Plan (Tanzania Development Vision 2025) and the Rural Development
Strategy (RDS) of 2001. According to the Government master plan, each village should be
provided with telecommucation facilities by 2020. In the same vein, the ICT Development Policy
requires every licensed telecommunication service provider to extend services to cover rural
areas. The RDS promotes the introduction of information and communication technology in rural
areas through the creation of tele-centres that offer a wide variety of public and private
information-based goods and services, and which support local economic or social
development. Such services might include basic communication by telephone, fax, e-mail,
internet access, etc.; public and semi-public sector services such as tele-medicine, distance
education, municipal governance services, etc.; and private sector services like news distribution,
telecommuting services, training, access to information on markets, crops and weather
conditions etc. The Universal Communications Services Act of 2006 provides for specialconcessions to service providers in this sector.
Towards Evidence-based ICT Policy and Regulation
5
Tanzania’s ICT Policy
was approved by
parliament in 2005 to
provide Government
guidance on ICT issues
the need for ICT policy
review to address the
observed weaknesses
was evident
the ICT Development
Policy requires every
licensed
telecommunication
service provider to
extend services to
cover rural areas

8/8/2019 Tanzania SPR Layout Final English
http://slidepdf.com/reader/full/tanzania-spr-layout-final-english 9/47
Regulatory Issues
The laws that are directly applicable to the sector include the Tanzania Broadcasting Services Act
No 6 of 1993, Tanzania Communications Act No 18 of 1993; Tanzania Communications Regulatory
Authority Act No 12 of 2003; and Universal Communications Service Access Act of 2006. These
legislations have been harmonized and replaced by the Electronic and Postal Communications Act
(EPOCA) in 2010 (URT, 2010). The main challenge in the regulatory environment is building capacity to maintain a proactive legal
framework that can keep pace with the rapidly changing telecommunication technology and e-
business environment. The areas that need attention include data access rights, privacy protection,
computer frauds & crimes, security and privacy of e-transactions, establishment of rules governing
e-transactions, and delivery of e-opportunities to the wider population. TCRA has been
instrumental in the development of the Electronic and Postal Communications Bill, which has
provisions for these.
Regulatory Environment and Instruments
The Tanzanian telecommunications regulatory environment is currently based on the “converged”
licensing framework, and is not restrictive regarding entry requirements. The non-restrictive
regulatory environment has introduced competition in the telecommunications sector, which hasfacilitated much of the growth and success in mobile telephony. As mentioned earlier, the
regulating body is the Tanzania Communications Regulatory Authority (TCRA), established by the
Tanzania Communications Regulatory Authority Act No 12 of 2003 as an independent government
agency. The parent ministry is the Ministry for Communications, Science and Technology.
The objective of the TCRA is to regulate telecommunications, broadcasting and postal matters in
Tanzania, as well as to improve the regulatory framework by promoting eff ective competition and
economic efficiency, protecting the interests of consumers, regulating rates and tariff s, and
monitoring the performance of the sector. The TCRA is mandated to oversee the restructuring and
liberalization of the sector in line with the government’s wider move to liberalize the economy
through restructuring and engagement of the private sector.
The Authority is responsible for ensuring that the communications sector enhances the welfare of
Tanzanians through:
• promotion of eff ective competition and economic efficiency
• protecting the interests of consumers
• promoting the availability of regulated services
• licensing and enforcing license conditions of broadcasting, postal and Telecommunications
operators
• establishing standards for regulated goods and services
• regulating rates and charges (tariff s)
• managing the radio frequency spectrum
• monitoring the performance of the regulated sectors
• monitoring the implementation of ICT applications
(Source: TCRA Website http//www.tcra.go.tz)
The TCRA has powers to obtain information, documents, and evidence; to hold inquiries, and to
regulate tariff s in the sector. According to the TCRA, activities in the sector are guided by a number
of regulations:
• The Tanzania Communications (Broadband Service) Regulations 2005;
• The Tanzania Communications (Consumer Protection) Regulations 2005;
• The Tanzania Broadcasting Services (Content) Regulations 2005;
• The Tanzania Communications (Licensing) Regulations 2005;
• The Tanzania Communications (Importation and Distribution) Regulations 2005;
Tanzania ICT Sector Performance Review 2009/2010
6
The main challenge in
the regulatory
environment is
building capacity to
maintain a proactive
legal framework
The TCRA is mandated
to oversee the
restructuring and
liberalization of the
sector in line with the
government’s wider
move to liberalize theeconomy

8/8/2019 Tanzania SPR Layout Final English
http://slidepdf.com/reader/full/tanzania-spr-layout-final-english 10/47
• The Tanzania Communications (Installations and Maintenance) Regulations 2005;
• The Tanzania Communications (Interconnection) Regulations 2005;
• The Tanzania Communications (Telecommunication Numbering and Electronic Address)
Regulations 2005;
• The Tanzania Postal Regulations 2005;
• The Tanzania Communications (Radio Communications and Frequency Spectrum)
Regulations 2005;
• The Tanzania Communications (Tariff ) Regulations 2005;
• The Tanzania Communications (Type Approval of Electronic Communications Equipment)
Regulations 2005;
• The Tanzania Communications (Quality of Service) Regulations 2005; and
• The Tanzania Communications (Access and Facilities) Regulations 2005.
The policy and regulatory functions of the Ministry and the regulatory agency are clearly delineated
in the Act establishing the TCRA. As provided by this Act, the Fair Competition Commission (FCC) is
an independent government body established under the Fair Competition Act, 2003 (No. 8 of 2003)
to promote and protect eff ective competition in trade and commerce, and to protect consumersfrom unfair and misleading market conduct. It has been mandated to make necessary interventions
that ensure competition to regulate the market and that prevent significant market dominance,
price fixing and extortion of monopoly to the detriment of the consumer and market stability. The
FCC is a government agency under the Ministry of Industry, Trade and Marketing.
The FCC Act co-exists with sector-specific regulatory frameworks. It therefore co-exists with the
Communications Regulatory Act. The Act establishing the TCRA gives it the authority to deal with
all competition issues which may arise in the course of discharge of operator functions, and to
make appropriate recommendations to the FCC or any other relevant authority on issues
concerning (a) any contravention of the Fair Competition Act, 2003 Bureau of Standards Act, or any
other written law; (b) actual or potential competition in any market for regulated services or
additional costs in the market that are likely to be detrimental to the public.
Convergence of technology in the telecommunications sector has necessitated the adoptionof a technology- and service-neutral licensing regime, the Converged Licensing Framework
(CLF). The CLF was introduced in February 2006 and constitutes four license clusters: Network
Facilities License (NFL), Network Services License (NSL), Applications Service License (ASL) and
Contents Services License (CSL). These licenses cover international, national, regional and
district market segments.
Under the NFL category, a licensee is authorized to install, own, control and provide access to
electronic communications facilities, such as fixed links, radio communications transmitters, satellite
stations, submarine cable, fiber/copper cable, towers, switches, etc., to other licensed operators on
a commercial bases. The NSL category allows a licensee to operate and maintain public electronic
communication networks with various technologies (like CDMA, GSM WCDMA, WLL, ADSL) that
involve intelligent network platform signaling control, traffic distribution switching translation and
quality of services control. Examples of network services include mobile services, fixed-line services,
bandwidth services and broadcasting distribution services. The ASL covers the provision of electronic communications services to end-users. Access to these
services can be through the establishment of private facilities and networks, or through
procurement and reselling of services from licensed facilities or/and network service providers e.g.
Internet Service Providers, virtual mobile providers, payphone services, or fixed/mobile services. The
CSL covers provision of content services such as satellite broadcasting, broadcasting terrestrial free-
to-air TV, terrestrial radio broadcasting, subscription TV and other broadcasting services.
Under the CLF, the TCRA has issued 14 Network Facility Licences, of which eight are national, seven
both national and international, and one international. Of these, six were issued between June 2008
and September 2009. During the same time, 13 Network Services Licences were issued, of which five
are national, six national and international, and one international. Of these, five were issued between
June 2008 and September 2009. Sixty-one Application Services Licenses were issued, of which 43 are
national, 12 national and international, and one international. One licence for a district and five for
regions (within the country) were also issued. Of these, 20 were issued between June 2008 and July2009. The number of operational licensees is not easy to determine, as business operation goes
Towards Evidence-based ICT Policy and Regulation
7
The policy and
regulatory functions of
the Ministry and theregulatory agency are
clearly delineated in
the Act establishing
the TCRA
Convergence of technology in the
telecommunications
sector has necessitated
the adoption of a
technology- and
service-neutral
licensing regime
Under the CLF, the
TCRA has issued 14
Network Facility
Licences, of which
eight are national,
seven both national
and international, and one international
8/8/2019 Tanzania SPR Layout Final English
http://slidepdf.com/reader/full/tanzania-spr-layout-final-english 11/47
through different stages of development before it starts offering services. The TCRA as an organization
issues licences after being satisfied that the applicant meets the requirements. A survey needs to be
done to determine the different levels of operation for the different licensees.
The proposed Electronic and Postal Communication Act 2009 was passed by Parliament in 2010
after a consultative process involving the Parliamentary Committee for Infrastructure, the Minister
for Communications, Science and Technology, Tanzania Communications and Regulatory Authority
officials, mobile phone operators, civil society groups, representatives from security markets andother stakeholders to discuss the Bill. The Bill, among other things, had clauses that required mobile
operators to float shares on the Dar es Salaam stock market, re-distribute frequencies in the
aftermath of digital broadcasting, share network resources and infrastructure at a time of stiff
competition due to many new operators waiting to enter the market, and register SIM-cards.
SIM Card Registration
The Electronic and Postal Communications Act (EPOCA) of 2010 makes SIM-card registration
mandatory for every person owning or desiring to own and use a SIM-card. TCRA has published
an order requiring all SIM-cards to be registered by their holders by 30th June 2010. The reasons
given include:
• protecting consumers from misuse of communication services• enabling consumers to be identified as they use value-added services such as mobile
banking, mobile money transfer, electronic payments for services such as water, electricity,
pay-TV etc
• enhancing national security
• enabling network operators to “know their customers”
Although public response was slow at the beginning, the exercise has picked up momentum.
Several challenges were met, particularly regarding registration of costumers in rural areas, lack of
individual identification documents, and electric power interruptions among others. While the
current number of SIM-card holders is estimated at 14,903,024, by end of December 2009, only
6,378,643 SIM-cards had been entered in the registration databases, which was less than 50% of the
target. This compelled TCRA to extend SIM-card registration 30th June 2010.
Local Loop Unbundling
According to Arbore, local loop unbundling (LLU) is a regulatory process of allowing multiple
telecommunications operators to use a physical connection (local loop) between a customer and
incumbent local exchange carrier. The local loop is unbundled so that the beneficiary does not
have to pay for network elements or facilities which are not necessary for the supply of its services.
Unbundled access is a form of regulation during liberalization, where new entrants to the market
(challengers) are off ered access to facilities established by the incumbent that are hard to duplicate
(for technical or business reasons). According to the ITU, in some developed economies broadband
has been facilitated by regulating local loop unbundling in developed markets with an extensive
and well-developed incumbent fixed network. This allows new entrant operators access to end-
users without having to invest heavily into network deployment, thus encouraging service-based
competition. However, most developing countries, like Tanzania, are faced with a fundamentallydiff erent situation, where network deployment and growth still needs to be encouraged, and
operators still need to recover their investment costs. Unbundled service costs would therefore be
higher and a less attractive approach to encouraging service competition. Operators in Tanzania are
off ered incentives for network deployment, network-based competition, and incentives for cost-
sharing in backbone network deployment. There is a Bill to this eff ect, and discussions with
stakeholders are underway before it is presented to parliament.
Number Portability
Service Provider Number Portability is a service that gives a mobile subscriber the option of
retaining his/her mobile phone number even after switching to a diff erent network, providing
customers with the flexibility to migrate with their numbers to any network. Number portability has
been available in Tanzania since 2008, and has been popularized by new operators in the market. Tanzania does not off er carrier pre-selection services. Most people appreciate the number
Tanzania ICT Sector Performance Review 2009/2010
8
The Electronic and
Postal
Communications Act
(EPOCA) of 2010
makes SIM-card registration
mandatory
new entrants to the
market (challengers)
are off ered access to
facilities established by
the incumbent
Number portability
has been available in
Tanzania since 2008
8/8/2019 Tanzania SPR Layout Final English
http://slidepdf.com/reader/full/tanzania-spr-layout-final-english 12/47
portability service. In Tanzania, it is usually introduced by new entrants in the market as an incentive
that is associated with promotions. Operator sales staff move from place to place off ering to
subscribe new customers with numbers similar to those they already have. It is, however, difficult to
assess success rates as no statistics are available. VoIP service is authorized and available in Tanzania,
though not very popular. Datel (Alink) is one of the VoIP service providers.
Market Structure The existing market structure comprises basic telephone service i.e. local, national long distance
and international; radio mobile services; and value added services (including data). There are four
market segments.
The first market cluster is Network Carrier Infrastructure, dealing with construction and provision of
carriage facilities for transmission, such as earth satellite, VSAT, submarine cable, fiber-optic cable
and microwave links and harnessing of excess capacity of companies/organizations which currently
own communications facilities for their operations.
The Switching and Connectivity Facility Licence covers the construction and provision of
connectivity facilities such as exchanges, nodes, servers and routes while the Support Facility
Licence authorizes the construction and provision of support facilities like towers and ducts. This
segment is competitive as there are 15 licensed operators in the market. It is a dynamic marketrequiring innovation, given that most equipment is not locally manufactured.
The second market segment deals with network services for fixed and mobile telephone operations.
Fixed telephone service licenses will authorize the operation of networks and provision of voice and
data services. Markets are split geographically into international, national, regional and district
segments. There is only one type of license for operating and providing cellular mobile services
nation-wide.
The third market segment is provision of network applications services, which include the Internet,
payphones, e-applications, Internet telephony, tracking services, mobile virtual network services,
trunk radio services and value added services.
The fourth market segment is Content Service Provision, which includes segments based on activity,
geographical segmentation and community factors for terrestrial television broadcasting, free-to-air
terrestrial sound broadcasting, free-to-air terrestrial television and terrestrial television subscriptionbroadcasting. Others segments in the cluster include cable television, satellite television,
subscription broadcasting and satellite-free sound broadcasting.
Competition in all market segments is high. The main challenge is the lack of market research that a
newcomer can rely upon for investment purposes.
Human Resource
Human resource capacity to support general ICT deployment is weak. However, since 2005, with
the support of external development partners, several initiatives have been put in place to address
the problem:
• The Tanzania eSchools initiative
• Information and Communication Technology (ICT) Policy for Basic Education (July 2007),
which will, among other things, structure the adoption of ICT within the education sector.
The Information and Communication Technology (ICT) Policy for Basic Education envisages
integration of ICTs in pre-primary, primar y, secondary and teacher education, as well as non-formal
and adult education. Three other policy documents that govern the education sector development
in Tanzania, namely; the Education and Training Policy of 1995, the Primary Education and
Development Plan (PEDP) 2002-2006, and the Secondary Education Development Plan (SEDP)
2004-2009, emphasize the need for access to and improved quality of education for all, and
prioritize ICT-based information management at all levels and the introduction of computer
courses into primary and secondary education. Higher education institutions off er electronics and
computer and telecommunication engineering courses. The Dar es Salaam Institute of Technology
and the University of Dar es Salaam have such courses, for instance. Enrollment has been increasing
at technical schools and university colleges. Additionally, private institutions off ering computer
training at lower levels are on the increase, as shown in Table 8 below.
Towards Evidence-based ICT Policy and Regulation
9
It is a dynamic market
requiring innovation,
given that most
equipment is not
locally manufactured
Human resource
capacity to support
general ICT
deployment is weak
private institutions
off ering computer
training at lower levels
are on the increase

8/8/2019 Tanzania SPR Layout Final English
http://slidepdf.com/reader/full/tanzania-spr-layout-final-english 13/47
Table 6: Human Resource base for the ICT Sector
Institutes of Technology4 University Enrolments5
Total Enrolments Graduates per year Engineering Science & ICT
2001 - - 1385 1949
2002 - - 2502 2174
2003 - - 1619 3369
2004 1682 - 1565 3347
2005 1633 364 1597 4807
2006 1884 589 - -
2007 2244 554 - -
45
Tanzania ICT Sector Performance Review 2009/2010
10
4 Source: URT (2008) Statistics Handbook on Communications, Science and Technology5 Tanzania Commission for Universities: http://www.tcu.go.tz/

8/8/2019 Tanzania SPR Layout Final English
http://slidepdf.com/reader/full/tanzania-spr-layout-final-english 14/47
Telecom, Internet and Broadcasting Market Analysis
Overview of the Contribution of the Telecommunications Sector to the
Development in Tanzania
Tanzania has a fully competitive telecommunications sector. There are two fixed-line operators and
seven operational mobile networks, with four additional players licensed. The national fixed
telephone operators are the TTCL and Zantel. They also off er national and international mobile
telephone services. The TTCL fixed-line network has been digital since 2004. However, teledensity
for fixed-line has remained extremely low, with only around 300,000 lines installed and many out of
service. The TTCL off ers Integrated Services Digital Network (ISDN) with Basic Rate Interface, Primary
Rate Interface as well as ADSL broadband services.
Until July 2009, the TTCL operated a countrywide IP network for local and international connectivity
to the internet, using a 140Mb/s digital microwave backbone to extend internet links and CDMA
wireless to reach fixed services. The Ministry of Finance and Economic Aff airs reported the
contribution of the communications sector to the GDP in 2007 to be as high as 20.1%. In addition,
according to TCRA, tele-density – a measure of access to telephony and other ICT services of 100
people occupying a specific area or region – has been increasing. In the year 2000 for example, Tanzania’s tele-density was a mere 1%, but as of June 2008 it had risen to 25%. It was 43% by the
end of 2009. Tanzania has one of the fastest growing ICT markets in Africa. This enormous growth
can, however, be elusive, and should be interpreted with caution as it mainly depends on the
number of subscribers as provided by operators. Caution in interpreting telephony statistics is
needed due to the following reasons:
• In Tanzania most subscribers have more than one mobile phone line, and it is not
uncommon to find individuals with multiple SIM-cards, often from up to four operators.
• Most phone line owners are urban dwellers, so if the calculation of tele-density takes into
account land area as a factor, the above figures will be highly reduced.
• One phone may serve a household or be shared by several people in a work setting.
•Some operators may inflate their subscription numbers to attract more customers.
Table 7: Voice Tellecommunications Penetration (Teledensity)6
Years Subscriptions Population Teledensity(%)
2005 3,544,207 37,267,530 10
2006 5,766,566 38,523,907 15
2007 8,486,126 39,816,363 21
2008 13,130,602 41,146,284 32
2009 17,642,408 43,187,8237 43
Since the connection of the country to the international fibre-optic cable (SEACOM), new services
and products have been introduced. Currently, the TTCL off ers voice services which include Bongo
Phone, Prepaid Services, Prepaid Calling Card, Post Paid Services, Rafiki Public Phone, and TTCL
Mobile. Data communication services include broadband, wireless broadband, Mobile Internet,
Virtual Private Network (VPN) providing dedicated end-to-end connectivity to multiple sites in
diff erent geographical locations with scalable and guaranteed bandwidths of 64Kbps to 100Mbps,
and leased digital and analogue circuits. Zantel is based in Zanzibar, but with the liberalization of
the market got license coverage to the mainland. It has a fixed-line and mobile telephone network.
Zantel is fast penetrating the mainland, off ering lowest rates in fixed, broadband and mobile
telephony. Zantel off ers mobile banking branded Z-Pesa.
The mobile telephone market is the fastest growing sector, with more than 17 million subscribers in
a population of about 43 million (see Table 6). The major operators are Vodacom, Zain, TiGO and
TTCL-mobile, Zantel-mobile and Sasatel. The penetration level is only around 30%, implying that
there is still room for growth.
Towards Evidence-based ICT Policy and Regulation
11
Tanzania has one of
the fastest growing ICT
markets in Africa
Since the connection
of the country to the
international fibre-
optic cable (SEACOM),
new services and
products have been
introduced

8/8/2019 Tanzania SPR Layout Final English
http://slidepdf.com/reader/full/tanzania-spr-layout-final-english 15/47
VoIP Internet telephony is authorised and liberalised. 3G mobile and wireless broadband service has
gained ground. The landing of the marine fibre cable in Dar es Salaam in July 2009 has been the
major booster of the Internet sector, which had been hampered by the low level of development of
the traditional fixed-line network.
The broadband market in Tanzania is still unexploited. Many years of bandwidth starvation forced
business to adopt low-bandwidth survival techniques that relied mainly on satellite services, which
will gradually change. Power interruptions, a weak infrastructure base (especially the lack of computers available to access networks), low ICT literacy among the general public and low
purchasing power are also key factors. The average revenue per user (ARPU) continues to fall. For
example, Vodacom reported the following about Tanzania for the year 2009: ‘ARPU in local currency
declined in most of the international operations due to the growth in lower-usage customers,
shrinking disposable income due to economic conditions, and aggressive competitive pressure on
tariff s in the form of discounted airtime and free on-net call promotions by competitors. Besides the
pricing pressure, which is being exacerbated by worsening economic conditions, new licences are
being awarded, raising the competitive stakes in all our markets considerably’ (Vodacom Report,
2009). The declining ARPU for Zain and Vodacom is shown below.
Table 8: ARPU for Zain and Vodacom (2006-2009)
Year Zain (US$)* Vodacom (US$)**
2006 12 8.10
2007 11 7.0
2008 9 5.9
2009 6 4.2
Source: *Zain Annual Re ort, **Vodacom Annual Report
Access is not just about availability. Cost aff ects usage. The high cost of communication is still a
barrier. While competition has brought down prices, the cost of access is still too high to have a
transformatory impact. More needs to be done to bring down call tariff s and educate people on
how to exploit and use broadband for economic development. Computer hardware in use in
Tanzania is imported, making high computer prices a barrier to access. E-business andtelecommunication infrastructure is incomplete without aff ordable computing facilities. Like
telephone and Internet costs, computer prices have been falling, but not to the extent of being
aff ordable to most people. Many individuals, not just businesses, need to have access to reasonably
priced computers for education, recreation, business and other activities.
Poor electricity supply is a major problem. Efficient power supply is only guaranteed by power
generators. This increases costs as fuel is very expensive, constituting a barrier to growth and
development of e-services. While availability has grown, this has not been matched by quality of
service. Fair and honest marketing and competition, and transparency in revenues and costs is
important.
The need for ICT expertise in the telecom sector has not been matched with a human resource
development plan to build the expert capacity for its maintenance and further development. More
eff orts should be invested in encouraging the development of IT and telecoms expertise in
Tanzania. There is a need to develop human capacity in areas such as technical, management,
research and development, security, strategic planning, e-business and e-governance.
Human resource development in ICT can be encouraged through increased awareness amongst
students and the wider public of opportunities and capabilities in ICT. The environment should
encourage ICT education and provide incentives, especially for those investing in research,
development, training, software and other creative eff orts. Acquiring infrastructure is great, but it is
serious investment in education that will bridge the digital divide and enhance the quality of
infrastructure, the quality of access, the quality of usage, and the quality of growth.
The major telephone companies (TTCL, Zantel, Vodacom, Zain, Tigo) directly employ more than
5,000 people. Many more are employed in communication-related services like reselling airtime,
servicing and repair of mobile phones, maintenance of base stations and masts, etc. This
notwithstanding, it is difficult to get employment statistics for the sector given the lack of a national
database for such statistics.
Tanzania ICT Sector Performance Review 2009/2010
12
Many years of
bandwidth starvation
forced business to
adopt low-bandwidth
survival techniques
More needs to be done
to bring down call
tari ff s and educate
people on how to
exploit and use
broadband for
economic
development
it is serious investment
in education that will
bridge the digital
divide and enhance
the quality of
infrastructure

8/8/2019 Tanzania SPR Layout Final English
http://slidepdf.com/reader/full/tanzania-spr-layout-final-english 16/47
The provision of plentiful, reliable, inexpensive international bandwidth is being credited with
ushering in a new era of broadband connectivity. However, the improvements that it can bring are
unlikely to be felt immediately, as there are many other developments that need to take place in
order for any kind of broadband revolution to take place. As well as international bandwidth,
Tanzania needs to keep developing its national backbone infrastructure in order to facilitate the
expansion and improvement of broadband access to more of the population and utilization of this
potential in government operations.
Fixed-Line Coverage
Until early 2006, the fixed-line telephone service in mainland Tanzania was the monopoly of TTCL
and Zantel in Zanzibar. In 2006 Zantel received a national licence to off er telecommunication
services on the mainland. Before the introduction of mobile telephone services in Tanzania in 1995,
basic telecom services were provided by the TTCL through a Public Switched Telephone Network
(PSTN) using Integrated Services Digital Network(ISDN) with Basic Rate Interface (BRI) and Primary
Rate Interface (PRI) and ADSL broadband services. The TTCL fixed network has national coverage.
Zantel is also expanding its network on the mainland.
Mobile Coverage
Mobile telephone service has been liberalized since its introduction in Tanzania. There are seven
active operators: TTCL, Zantel, Vodacom, Zain, Tigo, BoL and Sasatel, and two new applicants. The
arrival of the Seacom submarine cable in Dar es Salaam has stimulated new interest and mobile
operators are ready to invest in infrastructure to facilitate speedy exploitation of the availed
broadband. It is evident that Tanzania had not made adequate plans and preparation for the rollout
of the marine cable to the rest of the country. Zain, for example, was ready to invest in laying down
the national backbone or lease it from the government to speed up the process. It is now clear that
the government is laying down the national backbone in collaboration with telephone operators.
Several mobile company operators, employing the CDMA technology licensed under CLF since
2007, are now becoming operational after setting up requisite infrastructure, administrative and
other supportive requirements.
Execellentcom, set out in June 2008 plans for the rollout of a nationwide network within one and
half years with an initial capacity of two million subscribers. It plans to invest US$500 million overfive years into voice and data services, and create about 500 jobs in the process. Dovetel Limited
received a network facilities, network services and application services licence in June 2008, and
launched services in Dar es Salaam in 2009 under the name Sasatel. Egotel and MyCell were
licensed in November 2008. Smile Communications Tanzania received a network facilities and
network services licence in July 2009. Operators are encouraged to share infrastructure, including
base stations.
The cost of mobile services has fallen considerably, although interconnection fees, taxes and levies
add to the cost of the services. Telecom equipment is subject to 20% import duty and 20% VAT, and
7% excise tax on mobile airtime. Following the launch of mobile data and 3G broadband services,
mobile operators are set to become leading players in the Internet sector as well.
Internet Coverage Tanzania’s Internet sector had remained underdeveloped due to the limited reach of the traditional
fixed-line network and the lack of international fiber connections. Until the arrival of the first
international submarine fiber cable in July 2009, the country relied entirely on satellite links for its
international Internet bandwidth, which resulted in high retail prices that were unaff ordable to the
majority of the population. Internet cafes have contributed to some degree of Internet usage, but
in terms of Internet penetration Tanzania still lags behind other countries in the region with similar
GDP per capita and literacy levels.
Mobile network operators are well positioned to become key players in Internet service provision
with their extensive national infrastructure, following the introduction of mobile data and 3G
broadband services.
Towards Evidence-based ICT Policy and Regulation
13
Tanzania needs to
keep developing its
national backboneinfrastructure in order
to facilitate the
expansion and
improvement of
broadband access
the government is
laying down the
national backbone in
collaboration with
telephone operators
Until the arrival of the
first international
submarine fiber cable
in July 2009, the
country relied entirely
on satellite links

8/8/2019 Tanzania SPR Layout Final English
http://slidepdf.com/reader/full/tanzania-spr-layout-final-english 17/47
Table 9: Internet users
Year Users (thousands) Penetration (%)
2003 250 0.7%
2004 333 0.9%
2005 384 1.0%
2006 390 1.0%
2007 400 1.0%
2008 520 1.3%
Source: BuddeComm (O
Note: Internet users are
household or business
subscribers. Internet subs
just one subscription but
tober 2009) based on ITU and industry data
those accessing the Internet from school, u
accounts. Hence, the number of Internet u
cribers are individuals who pay for Internet ac
can have many users within that one subscrip
iversity or work, as well as from individual
ers is always greater than the number of
ess accounts. For example, a work account is
tion (BuddeComm).
The Internet market in Tanzania is likely to be driven by businesses that can use a combination of Internet and mobile telephone technology to off er enhanced but aff ordable services. Potential
areas include payment of utility bills, accessing news, radio, mobile banking, election campaigns,
and education. The landing of the Seacom submarine cable in Dar es Salaam has already impacted
on cost. Eff ective October 2009, the TTCL reduced its Internet prices by more than 50% (see Table
15 for comparison of old and new prices for broadband). According to the TTCL, high volume
Internet users like banks, large businesses and corporations, government agencies and educational
institutions are the main direct beneficiaries thusfar. For small and medium businesses like cyber
cafés, the TTCL reduced prices by 50 per cent. Whereas $200 initially bought 5GB, for the same cost
one can now buy 10GB. The TTCL off ers unlimited access for the monthly price of Tsh45,000 ($43),
with a speed of up to 256Kbps for non-commercial clients (see appendix for comparison of old and
new prices).
In 2009, Tanzania received $100millon in credit through the World Bank International Development
Association under the Regional Communications Infrastructure Programme (RCIP3) to promoteaff ordable communications services in the country. The RCIP3 grant is planned to enable Tanzania
to leverage developments in the telecommunications sector and overcome associated challenges
through a combination of sound policy and regulatory frameworks, competitive market structures,
and catalytic investments into public-private partnerships to accelerate the rollout of infrastructure
networks that are aimed at enhancing universal access. Building the national backbone and the
establishment of the Universal access fund are such developments. Despite considerable
developments in the ICT sector, Tanzania has only 1.3 percent telephone and Internet user
penetration as compared to 6.7 for Africa.
Free Internet service to students has been off ered mainly through educational institutions, while
paid access to the general public is mainly provided by the private sector in Internet cafes.
Availability of personal computers is still very low in Tanzania: less than 1%6 . Multipurpose
Community Telecentres (MCTs), off ering basic telecom services like telephone, fax, Internet, e-mail
and computer facilities designed to serve both individuals and businesses, and to provide trainingand distance learning services, are few and far between.
Tanzania’s first MCT was established in 2000 by the Tanzanian Commission for Science and
Technology (COSTECH) in partnership with the Canadian International Development Research
Centre, UNESCO, the Danish International Development Agency and TTCL. Evaluation of these
centers may reveal important information about the best way to expand the service. In the
period under review, Vodacom established Internet cafes in three towns: Dar es Salaam, Dodoma
and Arusha, using its 3G mobile network under the ‘Wireless Reach’ initiative. In collaboration
with the GSMA Development Fund and Qualcomm, the initiative encourages the cafes to be run
by local entrepreneurs.
In November 2009, Convergence Wireless Networks (Convergence Wireless), a joint venture
between Convergence Partners and Comsol Wireless Solutions (Comsol), acquired a 35% stake in
the WIA Company Limited (WIA), a Tanzanian wireless connectivity provider focused on the
Tanzania ICT Sector Performance Review 2009/2010
14
6 Rural Poverty Portal: http://www.ruralpovertyportal.org/web/guest/country/statistics/tags/tanzania
In 2009, Tanzania
received $100millon incredit through the
World Bank
International
Development
Association
Free Internet service to
students has been
off ered

8/8/2019 Tanzania SPR Layout Final English
http://slidepdf.com/reader/full/tanzania-spr-layout-final-english 18/47
enterprise market segment. Convergence Wireless will provide high-level support at strategic and
operational levels and facilitate access to resources across the wider convergence partners’ network.
WIA’s growth strategy focuses on upgrading its core network around Dar es Salaam, deployment of
a new national WiMAX access network covering key business centers, as well as the broadening of
its value-added solutions to include virtual private networks, managed network services and
applications hosting for large enterprises across the country.
According to the International Telecommunication Union (ITU), there were 520,000 Internet users asof June 2009, which is 1.3% of the population, and 6,400 broadband Internet subscribers as of
December 2009.
Table 10: Internet Usage and Population
Year Usage Population Penetration
2000 50,000 14,712,000 0.3 %
2002 500,000 13,874,610 3.6 %
2005 820,000 12,247,589 6.7 %
2009 520,000 41,048,532 1.3 %
Source: World Int
http://www.inter
rnet Stats: Usage and Population
etworldstats.com/af/tz.htm
Statistics (2009)
While bandwidth may have been a problem, there are many other factors that contribute to
Tanzania’s low Internet penetration and use. This situation may call for research based information
and home-grown solutions to sustainable use of the Internet for development.
With regard to Internet access and use, Tanzania lacks comprehensive data giving details of Internet
users across the country. The data available is mainly aggregated from Internet café surveys and this
does not depict the real situation of Internet usage. The number of people who use their handsets
to access the Internet is not documented, for example. There were approximately 520,000 Internet
users in Tanzania in 2009 (Table 10).
Internet Service Providers MarketAccording to the Tanzania Internet Service Providers Association, there are 23 registered Internet
Service Providers (ISPs)7.
Mobile phone providers, namely Vodacom, Zain and Sasatel, have since 2008 introduced mobile
Internet services. There are two Internet exchange points in Tanzania: Tanzania Internet Exchange
Point based in Dar es Salaam, and Arusha Internet Exchange Point. There are plans to establish
exchange points in Dodoma and Mwanza. The ISP market is growing, as the potential for Internet-
based services is still high. The Tanzania Internet Exchange (TIX) point in 2009 received a copy of
the "K" DNS root server that is being operated by the regional Internet registry in Europe, known as
RIPE NCC, through the AfriNIC-led Internet infrastructure project, which is intended to improve the
resilience to distributed denial of service attacks by setting up copies of root servers. The root server
in Tanzania is expected to improve scalability and resilience of DDoS attacks, reduce the overall
delay in the data transfer between clients and servers and improve the overall stability of theInternet in the country.
Broadband Market and Coverage
Until mid-2009, low bandwidth was a major setback in the development, penetration and use of
Internet in Tanzania. Low bandwidth was responsible for high Internet access rates in public
Internet cafés, high costs from ISPs and outright frustration from users. In educational institutions
like universities, ‘bandwidth hungry’ Internet-based emails were blocked from access on campus,
while bandwidth management policies proposed bandwidth rationing.
A new digital era unfolded with the landing in Dar es Salaam in July 2009 of the much-awaited
Seacom fiber-optic cable. With over $600 million invested in it, it took about two years to build. The
Towards Evidence-based ICT Policy and Regulation
15
7 Tanzania Internet Service Providers Association - TISPA - Members
Source: http://www.tix.or.tz/tispa/members.html
Convergence Wireless
will provide high-level
support at strategic
and operational levels
Tanzania lacks
comprehensive data
giving details of
Internet users across
the country
In educational
institutions like
universities,
‘bandwidth hungry’
Internet-based emails
were blocked from
access on campus

8/8/2019 Tanzania SPR Layout Final English
http://slidepdf.com/reader/full/tanzania-spr-layout-final-english 19/47
cable is expected to fundamentally change the underlying economics of the communications
business in the country. The incumbent fixed and mobile operator, the TTCL, slashed costs by 50%
after connecting its network. Further competition for international capacity and pricing is expected
when the TEAMS and the EASSy cables arrive.
The most important aspect of these developments is the enhancement of access and lowering of
the cost of transferring data, thus facilitating multimedia data transfer. Prior to this, Tanzania used
satellite communication to connect to the Internet. SEACOM is expected to lower the connectivitycost from about $300 per megabyte per second to $100, reducing Internet charges considerably8 .
Financial institutions, mobile telephone operators, non-governmental organizations, television
stations, educational and research institutions are the main beneficiaries, although full exploitation
of the availed broadband will depend on the level of preparedness on the ground.
The National Fiber Backbone
The national fiber backbone is now being built through government partnership with the private
sector, particularly major mobile operators. The backbone will network all regional headquarters
within the country and connect Tanzania with its eight neighbors: Kenya, Uganda, Rwanda,
Burundi, Democratic Republic of Congo, Zambia, Malawi, and Mozambique. The work contract was
signed in February 2009, and the project is expected to be completed by the end of 2010. The
project is financed by a soft loan from China. The national fiber backbone will be owned by thegovernment under the operational management of the TTCL.
Investment in 3G network development is evident, especially from the main mobile phone
operators, Vodacom, Zain, Tigo, the TTCL and Zantel. In 2009, Zain Tanzania Ltd. secured US$270m
from a mix of local and international lenders to support its continuing network expansion. In total,
by the end of 2009, Zain had invested over US$500m in network infrastructure development.
Vodacom secured a syndicated loan of US$90m to finance its company capital expenditure9 .
A dormant project, initiated with support from the Ericsson Group and UNEP, to establish bio-fuel
powered radio base stations in two regions in Tanzania was activated in 2009. Undertaking the
feasibility, Diligent Energy Systems BV noted that if Ericsson would get the backing of one or two
major mobile phone operators, the project would be commercially viable. The project aims at
bringing reliable but environmentally safe mobile phone services to rural people in Mtwara and
Lindi. There is concern about the operational safety of the increasing number of base stations,antennas and other facilities that support mobile phone transmission.
Broadcasting Market and Coverage
Broadcasting Market
Radio and television broadcasting in Tanzania is predominantly free-to-air. It is largely analogue-
transmitted terrestrially. It is characterized by three modes of transmission, each requiring viewers
to have suitable receiving equipment:
• Terrestrial transmission (requiring a suitable domestic antennae or dish);
• Satellite transmission (requiring a satellite dish); and
• Cable transmission (requiring a physical cable link to the receiving equipment).
The wider population use free-to-air transmission because it does not require a subscription to view
or listen to radio or television programmes. Radio broadcasting is, compared to television, by far the
most accessed service. Some radio broadcasts cover the whole country, while others cover
segments only. Television covers major urban areas.
Subscription broadcasting, especially cable television services, have gradually developed over the
years. There are 28 TV license holders. Of these, three off er nationwide Satellite Content Services by
subscription. These are Multichoice Tanzania Limited, GTV (Tanzania) Limited, and Mussa Television
Network. There are 53 radio license holders and 869 satellite customers.
Tanzania ICT Sector Performance Review 2009/2010
16
8 Source: The Citizen Daily, 23.07.20099 Vodacom Group has Faith in Tanzania Telecoms
http://www.tanzaniainvest.com/tanzania-telecoms/news/323-vodacom-group-has-faith-in-tanzania-telecoms
The backbone will
network all regional
headquarters within
the country and
connect Tanzania withits eight neighbors
The project aims at
bringing reliable but
environmentally safe
mobile phone services
to rural people
8/8/2019 Tanzania SPR Layout Final English
http://slidepdf.com/reader/full/tanzania-spr-layout-final-english 20/47
Service Coverage
Most FM bandwidth radio and TV stations are urban-based. A relatively small number of radio
stations on FM bandwidth cover the rural areas. AM/MW bandwidth radio stations, on the other
hand, cover both urban and rural areas. Depending on coverage, radio and TV stations in Tanzania
can be categorized into three groups: National, Regional and District. National broadcasters are
those which cover all the regions of the country in both rural and urban settings. Only four radio
stations and three TV stations boast a countrywide coverage:
Tanzania Broadcasting Corporation (TBC). This is a state/government-run radio and television
service. Through AM and Medium Wave (MW) bandwidths, TBC boasts a country-wide signal
coverage in Tanzania. TBC signal reaches rural and urban areas of the country on both the mainland
and Zanzibar islands. TBC1 (television station) signal also covers the entire country and is also
available by satellite.
Radio One/ITV. This is a privately-owned broadcaster run by the IPP group of companies. Radio One
broadcasts over AM and FM bandwidths and covers almost the entire country. In some remote rural
areas, however, Radio One signal strength is weak. Likewise, ITV covers almost all regions of
Tanzania with a relatively weaker signal in rural areas.
Radio Free Africa/Star TV is a private media group. Radio Free Africa (RFA) broadcasts via both
the FM and AM/MW ranges. RFA and Star TV signal coverage is also countrywide. These radio
and TV stations can also be accessed via satell ite. Signal strength and availabili ty in rural areas
may be limited.
Radio Maria. This is a church-run radio service with countrywide coverage. It is owned by the
Catholic Church and broadcasts via the FM range and also via satellite. Until January 2010, and
probably to date, it was the only Tanzania-based radio accessible on the Internet. Radio Maria
boasts good signal strength in rural areas.
There are also radio and TV stations with regional or district coverage. Most of these radio and TV
stations operate with smaller capital investment and are privately owned. Again, these are mainly
based in urban centres. Lack of electricity and poor accessibility are the major hindrances to radio
and TV signal penetration in rural areas.
Digital Switchover
The future of the subscription broadcasting market lies in the fact that there is going to be much
more specialization in content creation, distribution, transmission, delivery and provision of support
services for subscription management. The digitalization of content has allowed content to be
off ered on any device, network or platform. Very recently, in June 2006, the ITU approved planning
for introduction of terrestrial digital broadcasting (specifically frequency bands 174-230 MHz and
470-862 MHz) using the Digital Video Broadcast (DVB) family of standards. This has made it possible
for DVB to be available on many platforms, namely: satellite (DVB-S and DVB-S2); cable (DVB-C);
terrestrial television (DVB-T) and terrestrial television for hand held (DVB-H). Digitalization of content
has paved the way to convergence of technology. The convergence of technology has made it
possible for viewers to access a wider range of services delivered via television sets.
Tanzania, along with countries in the Southern Africa Development Cooperation (SADC) region, is
preparing for the conversion to digital broadcasting to meet the 2015 deadline set by the
International Telecommunications Union (ITU). SADC has set the deadline for member countries toDecember 2013. Member countries (including Tanzania) have agreed to adopt a unified approach
to digital television migration to help converters and operators develop harmonious policies and
regulations, and to share experiences.
Subscription broadcasting service providers currently on analogue platforms have to make efforts to
migrate to a digital platform in a phased approach to meet the national target of switching off all
analogue services by 2015. New entrants to subscription broadcasting services have to adopt a digital
platform, and the TCRA will not license new entrants who opt to use analogue technology.
The main challenge has been to align policy and legislation to ease the migration to digital
broadcasting in terms of investments in technology, and consumer awareness. Subsequent to
these developments, the responsible ministry, stakeholders and the TCRA held a forum to discuss
challenges; among them the standardization of the conversion process, measures to reduce costs
to the consumer and service providers, e.g. reducing tax on ‘set-top boxes’, and gradually phasingthe process. Accordingly, the National Broadcasting Corporation (TBC) will start trial transmission in
four regions in December 2009, and expand to six more regions by January 2010.
Towards Evidence-based ICT Policy and Regulation
17
radio and TV stations
in Tanzania can be
categorized into three
groups: National,
Regional and District
Lack of electricity and
poor accessibility are
the major hindrances
to radio and TV signal
penetration in rural
areas
Tanzania is preparing
for the conversion to
digital broadcasting to
meet the 2015
deadline set by the
International
Telecommunications
Union

8/8/2019 Tanzania SPR Layout Final English
http://slidepdf.com/reader/full/tanzania-spr-layout-final-english 21/47
Star Media Tanzania and Basic Transmission Ltd. (operators) have been licenced to set the necessary
infrastructure to spearhead the move. Major challenges are emerging around appropriate use and/
or re-distribution of released analogue spectrum, and how to help individuals without the capacity
(knowledge, skills or financial resources) to upgrade their TV sets.
Content in the Broadcasting Market Segment
Content is divided into two categories: foreign-content programmes created and broadcast from
outside the country through satellite networks, and locally created content which is produced and
broadcast locally. Local content providers may use cable television operator networks, MUX
networks, 3G operator networks or IPTV networks. The MUX network connects multiple CTX 9400
and 9000 DSi systems and multiple CTX Operator Workstations into a single network. IPTV is a
system through which digital television service is delivered using the architecture and networking
methods of the Internet Protocol Suite over a packet-switched network infrastructure, e.g., the
Internet and broadband Internet access networks, instead of being delivered through traditional
radio frequency broadcast, satellite signal, and cable television. Market segments for local content
services are National, Regional, District and Community.
Ownership
Foreigners may not run media institutions, and foreign investment in any media outlet may notexceed 49%. Furthermore, foreigners may be employed only as technical experts and, even then,
only where such expertise is not available locally.
Tanzania ICT Sector Performance Review 2009/2010
18
foreigners may beemployed only as
technical experts and,
even then, only where
such expertise is not
available locally

8/8/2019 Tanzania SPR Layout Final English
http://slidepdf.com/reader/full/tanzania-spr-layout-final-english 22/47
Network Subscribers
Fixed-Line Subscribers
The fixed network subscriber base has been eroded by the mobile market. The total number of
telephone subscribers is claimed to approach 15 million. In 2009, there were 444,471 TTCL fixed-linesubscribers compared to 5,921,265; 4,435,462 and 3,264,565 mobile phone subscribers for
Vodacom, Zain and Tigo respectively.
Figure 1: Trends of Mobile and Fixed Lines Subscriptions 2000-2009
Source: TCRA website www.trcra.go.tz
It is difficult, however, to get exact number of subscribers per network as many people subscribe to
more than one network. Rural-based subscribers and students remain the main source of new
subscribers for the traditional voice and text messaging services. Broadband-based services may
however attract new and retain urban-based and corporate customers.
Table 11: Number of fixed lines as a percentage of the population
Country 2006 2007 2008
Tunisia 12,65 12,18 12,45
South Africa 9,22 8,91 8,62
Botswana 7,24 7,41 7,4
Namibia 6,61 6,57 6,54
Senegal 2,26 1,95 2,22
Kenya 1,23 1,67 1,67
Cameroon 1,01 1,34 1,66
Benin 1,32 1,19 1,42
Cote d'Ivoire 1,23 1,73 1,34
Ghana 1,65 0,62 1,12
Ethiopia 1,12 1,11 1,1
Burkina Faso 0,83 0,95 1,06
Nigeria 1,07 0,86 0,92
Uganda 0,54 0,53 0,71
Zambia 0,75 0,72 0,7
Tanzania 0,4 0,29 0,4
Mozambique 0,36 0,35 0,36
Rwanda 0,24 0,17 0,33
Source: ITU
Towards Evidence-based ICT Policy and Regulation
19
Rural-based
subscribers and
students remain the
main source of new
subscribers for thetraditional voice and
text messaging
services
0
4
8
12
16
20
2000 2001 2002 2003 2004 2005 2006 2007 2008 2009
M i l l i o n s
Mobile
Fixed

8/8/2019 Tanzania SPR Layout Final English
http://slidepdf.com/reader/full/tanzania-spr-layout-final-english 23/47
It is evident in Table 11 that in 2008 there was a decline in the number of fixed-line subscribers as a
percentage of the population, not only in Tanzania but in all countries with the exception of
Botswana, Burkina Faso, Cote d’Ivoire, Cameroon and Kenya. In 2009 there was an increasing trend
in the number of fixed-line subscribers as a percentage of the population across all the countries
with the exception of Botswana, Cote d’Ivoire, Ethiopia, Namibia and South Africa.
Table 12: Subscri ers Per Op rator
Year BENSON CELTEL TIGOTTCL
Fixed
TTCL
MOBILE
VODA
COM
ZANTEL
MOBILE
ZANTEL
FIXEDTOTAL
2005 - 882,693 422,500 154,420 - 1,562,435 96,109 - 3,118,157
2006 - 1,516,832 760,874 150,897 6 390 2,975,580 355,246 747 5,766,566
2007 3 300 2 505 546 1 191 678 157 816 72 729 3 870 843 678 761 5 453 8 486 126
2008 3 000 3,862,371 2 569 527 116 265 105 804 5 408 439 1 057 652 7 544 13 130 602
2009 3,101 4,910,359 4,178,089 157,321 115,681 6,883,661 1,378,595 15,601 17,642,408
TCRA:
Sourc
elecommun
: http://ww
ications Stat
.tcra.go.tz/p
istics as at Se
ublications/t
ptember 2
elecomSta
09
tsSept09.ht
ml
Table 13: Voice Telecommunication Subscribers Market Share (2005 - 2 09)
Year 2005 2006 2007 2008 2009
Fixed Lines 154,420 151,644 163,269 123,809 172,922
Mobile 3,389,787 5,614,922 8,322,857 13,006,793 17,469,486
Total 3,544,207 5,766,566 8,486,126 13,130,602 17,642,408
Mobile Share 96% 97% 98% 99% 99.9%
Source: Fieldwork, Octo er to December 2 09
Mobile Subscribers and Trend
Tanzania has a fairly vibrant mobile market, and it is growing well. As indicated in Table 4, the mobile
sector contributed to 99% of all voice subscription in 2009. Although Vodacom is still by far the largest
mobile operator, maintaining a market share of more than 39%, Zain and Tigo are fast-growing. In
2009 Zain had a 28% market share, and Tigo had made greater gains, leaping to 24% from 17.7% in
2008. This means that the three operators control more than 87% of Tanzania's mobile market. The
figure below shows the trend in voice operator subscriptions from 2000-2009.
Figure 2: Mobile subscriber trend 2000-2009
Source: TCRA website www.trcra.go.tz
Tanzania ICT Sector Performance Review 2009/2010
20
in 2008 there was a
decline in the number
of fixed-line subscribers
as a percentage of the
population
0
1
2
3
4
5
6
7
8
2000 2001 2002 2003 2004 2005 2006 2007 2008 2009
M i l l i o n s S u b s c r i p t i o n s
Vodacom
Celtel
Tigo
Zantel
TTCL
Vodacom is still by far
the largest mobile
operator, maintaining
a market share of
more than 39%
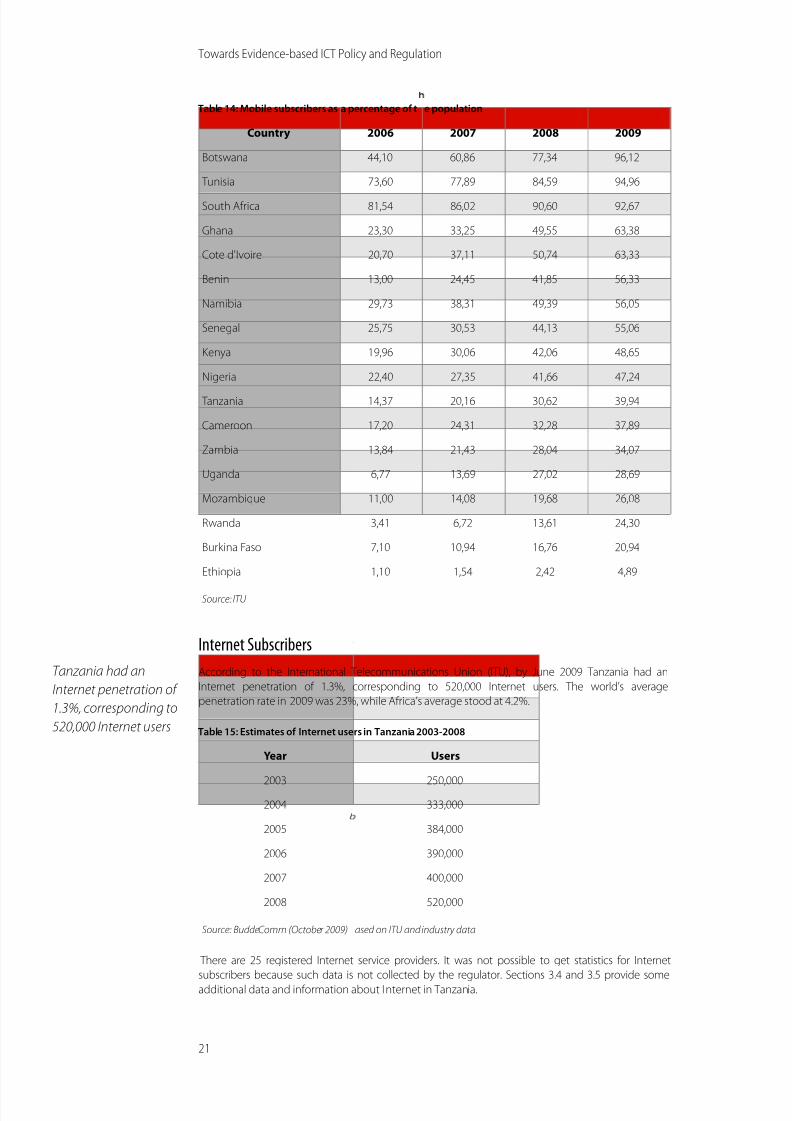
8/8/2019 Tanzania SPR Layout Final English
http://slidepdf.com/reader/full/tanzania-spr-layout-final-english 24/47
Table 14: Mobile subscribers as a percentage of t e population
Country 2006 2007 2008 2009
Botswana 44,10 60,86 77,34 96,12
Tunisia 73,60 77,89 84,59 94,96
South Africa 81,54 86,02 90,60 92,67
Ghana 23,30 33,25 49,55 63,38
Cote d'Ivoire 20,70 37,11 50,74 63,33
Benin 13,00 24,45 41,85 56,33
Namibia 29,73 38,31 49,39 56,05
Senegal 25,75 30,53 44,13 55,06
Kenya 19,96 30,06 42,06 48,65
Nigeria 22,40 27,35 41,66 47,24
Tanzania 14,37 20,16 30,62 39,94
Cameroon 17,20 24,31 32,28 37,89
Zambia 13,84 21,43 28,04 34,07
Uganda 6,77 13,69 27,02 28,69
Mozambique 11,00 14,08 19,68 26,08
Rwanda 3,41 6,72 13,61 24,30
Burkina Faso 7,10 10,94 16,76 20,94
Ethiopia 1,10 1,54 2,42 4,89
Source: ITU
Internet Subscribers
According to the International Telecommunications Union (ITU), by June 2009 Tanzania had an
Internet penetration of 1.3%, corresponding to 520,000 Internet users. The world’s average
penetration rate in 2009 was 23%, while Africa’s average stood at 4.2%.
Table 15: Estimates of Internet users in Tanzania 2003-2008
Year Users
2003 250,0002004 333,000
2005 384,000
2006 390,000
2007 400,000
2008 520,000
Source: BuddeComm (October 2009) ased on ITU and industry data
There are 25 registered Internet service providers. It was not possible to get statistics for Internet
subscribers because such data is not collected by the regulator. Sections 3.4 and 3.5 provide some
additional data and information about Internet in Tanzania.
Towards Evidence-based ICT Policy and Regulation
21
Tanzania had an
Internet penetration of
1.3%, corresponding to
520,000 Internet users
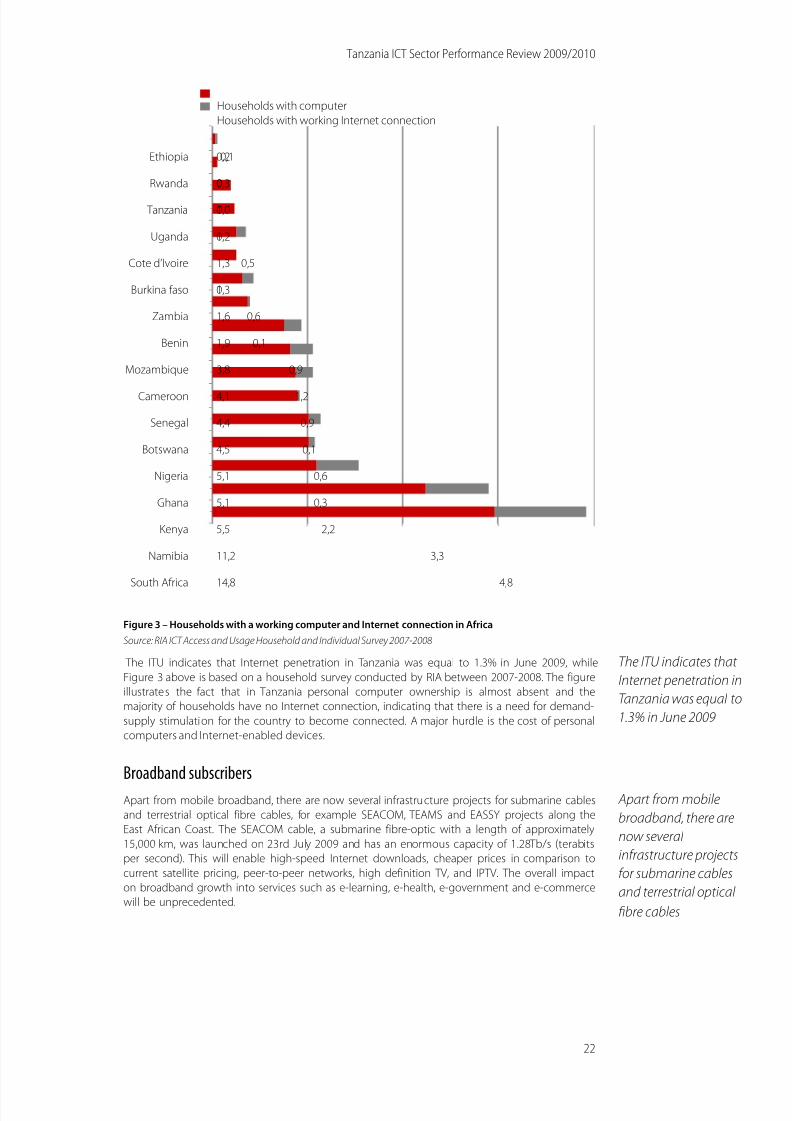
8/8/2019 Tanzania SPR Layout Final English
http://slidepdf.com/reader/full/tanzania-spr-layout-final-english 25/47
Figure 3 – Households with a working computer and Internet connection in Africa
Source: RIA ICT Access and Usage Household and Individual Survey 2007-2008
The ITU indicates that Internet penetration in Tanzania was equal to 1.3% in June 2009, while
Figure 3 above is based on a household survey conducted by RIA between 2007-2008. The figure
illustrates the fact that in Tanzania personal computer ownership is almost absent and the
majority of households have no Internet connection, indicating that there is a need for demand-
supply stimulation for the country to become connected. A major hurdle is the cost of personal
computers and Internet-enabled devices.
Broadband subscribers
Apart from mobile broadband, there are now several infrastructure projects for submarine cables
and terrestrial optical fibre cables, for example SEACOM, TEAMS and EASSY projects along the
East African Coast. The SEACOM cable, a submarine fibre-optic with a length of approximately
15,000 km, was launched on 23rd July 2009 and has an enormous capacity of 1.28Tb/s (terabits
per second). This will enable high-speed Internet downloads, cheaper prices in comparison to
current satellite pricing, peer-to-peer networks, high definition TV, and IPTV. The overall impact
on broadband growth into services such as e-learning, e-health, e-government and e-commerce
will be unprecedented.
Tanzania ICT Sector Performance Review 2009/2010
22
The ITU indicates that
Internet penetration in
Tanzania was equal to
1.3% in June 2009
Ethiopia
Rwanda
Tanzania
Uganda
Cote d’Ivoire
Burkina faso
Zambia
Benin
Mozambique
Cameroon
Senegal
Botswana
Nigeria
Ghana
Kenya
Namibia
South Africa 4,8
3,3
2,2
0,3
0,6
0,1
0,9
1,2
0,9
0,1
0,6
0
0,5
0
0
0
0,1
14,8
11,2
5,5
5,1
5,1
4,5
4,4
4,1
3,8
1,9
1,6
1,3
1,3
1,2
1,0
0,3
0,2
Households with computer
Households with working Internet connection
Apart from mobile
broadband, there are
now several
infrastructure projects
for submarine cables
and terrestrial optical
fibre cables

8/8/2019 Tanzania SPR Layout Final English
http://slidepdf.com/reader/full/tanzania-spr-layout-final-english 26/47
Table 14: Mobile subscribers as a percentage of the opulation
Internet users
in 2009 per
Fixed broadb
subscripti
and Internet
ns in 2009
Mobile cellula
with broadba
r subscriptions
d access 2009
100
inhabitantsper 100
populationTotal
per 100
populationTotal
Tunisia 34, 07 3,63 372 818
South Africa 8, 82 0,96 481 000 10,52 5 271 825
Botswana 6, 15 0,77 15 000 2,97 58 000
Senegal 7, 36 0,47 58 720
Ghana 5, 44 0,11 27 399 0,24 58 007
Rwanda 4, 50 0,08 8 388 0,15 15 177
Zambia 6, 31 0,06 8 000 0,03 4 314
Mozambique 2, 68 0,05 12 502 0,40 92 468
Nigeria 28, 43 0,05 81 958 4,89 7 565 435
Cote d'Ivoire 4, 59 0,05 10 000
Burkina Faso 1, 13 0,04 6 000
Kenya 10, 04 0,02 8 349 4,98 1 981 048
Benin 2, 24 0,02 1 791
Namibia 5, 87 0,02 430** 1,48 32 211
Uganda 9, 78 0,02 6 000 1,10 360 000
Tanzania 1, 55 0.02* 6,439* 1,37 601 324
Cameroon 3, 84 0,00 900 0,49 96 600
Ethiopia 0, 54 0,00 3 498 0,10 84 773
Tanzania ITU data
* Telecom Namibi
for 2008
had 6000 ADSL subscribers in Novemb r 2009
Tanzania has one of the lowest rates of penetration of Internet users in comparison with other
African countries. The table above shows that only Ethiopia and Burkina Faso in 2009 had fewer
Internet users per 100 inhabitants than Tanzania. Since only 0.02 percent of broadband Internet
subscriptions are fixed-line based, almost all users of broadband services are connected through
wireless technologies. The percentage of mobile subscriptions with broadband access in 2009 is
equal to 1.37%. Even though the penetration rate of mobile broadband is remarkably low, this
percentage is slightly higher than the African average, suggesting that the mobile broadband
services market is growing faster than in other African countries.
Towards Evidence-based ICT Policy and Regulation
23
only 0.02 percent of
broadband Internet
subscriptions are fixed-
line based

8/8/2019 Tanzania SPR Layout Final English
http://slidepdf.com/reader/full/tanzania-spr-layout-final-english 27/47
Communications Service Pricing
Fixed-Line Pricing
Fixed-line telephones are preferred for businesses with fixed office locations, as they portray some
sort of permanency. Fixed-line tariff s are aff ordable, provided communication is between the samefixed network lines. However, they are unpopular due to inadequate maintenance causing long
down-times. Off -peak rates for a TTCL fixed-line local call within the same network are 60 shillings
per minute and 1.5 shillings per second. Off -off -peak rates for TTCL fixed-line calls are 120 shillings
per minute and 3.0 shillings per second. It is 230 shillings per minute flat rate with all other
operators locally and 330 shillings for East Africa, and 400 shillings for Burundi, Rwanda, Malawi,
Egypt, Zambia, Mozambique, SA, India, Europe, North America, Pakistan and Lebanon, and 550
shillings for the rest of the world.
Table 17: TT L Voice per Minute Tariff s
rigination Termination
O n Network Other Op rators
Daily TTCL Fixed TTCL
Local STD
Mobile
TTCL Prepaid 120 150 150 230 330 400*/550**
6:01 am
-
Fixed Post paid 110 150 150 230 330 400*/550**-
6:00 pm TTCL Prepaid* **
Mobile Post paid
TTCL Prepaid
* **6:01 am
-
Fixed Post paid-
6:00 pm TTCL Prepaid* **
Mobile Post paid
Source: Field ork, Octob r to December 2009
Table 18: TTCL oice per Sec nd Tariff s
Origin tion Ter ination
Own Network Other Op rators
TTCL Fixed TTCL
Local STD
Mobile
TTCL
6:01 am-6:00 pm
2.5 3.0 3.0
* **Fixed 6:01 pm-6:00 am
1.5 1.5 1.5. . . .
TTCL
6:01 am-6:00 pm
3.5 3.5 3.5
* **Mobile 6:01 pm
-6:00 am
3.0 3.0 3.0
. . . .
* Zone ABurundi, Rw
America, Pa
anda, Mala
istan and
wi, Egypt,
ebanon
ambia, Mo ambique, S , India, Europe, North
** Zone B Rest of the orld
Source: Fieldwor k, October to D cember 2009
Tanzania ICT Sector Performance Review 2009/2010
24
Fixed-line tari ff s are
aff ordable, provided
communication is
between the same
fixed network lines

8/8/2019 Tanzania SPR Layout Final English
http://slidepdf.com/reader/full/tanzania-spr-layout-final-english 28/47
Mobile Pricing
The fixed wireless and mobile phone minimum tariff is 1 shilling per second, off ered within the
same network locally. On-net technology off ers lower tariff s when compared to off -net tariff s across
all operators, whether using GSM or CDMA. The highest local tariff s are charged for cell/mobile to
fixed-line calls or vice versa, ranging from 100 to 380 shillings per minute. Off -net and on-net short
message service (sms) costs are the same, although the cost varies from 20 to 45 shillings permessage according to network. Each operator off ers lower tariff s or special rates for wholesale and
bundled pre-paid services. Average pre-paid tariff s per operators as at June 2009 (shillings per
minute) are as shown in Table 19 below.
Table 19: Average pre- aid tariff s as at June 2009
Tariff VODACOM ZAIN TIGO ZANTEL TTCL BENSON
On Net Calls 251 255 60 218 120 50
Off Net Calls 383 340 360 253 230 150
East Africa Calls 350 343 409 356 330 250
International Calls 507 507 500 482 475 290
SMS National 45 47 37 44 NA 20
SMS International 100 106 65 83 NA NA
Source: Fieldwork, October to December 20 9
Figure 4: Total Cost of Ownership in US$
Source: Nokia 2007
In a global pricing study, Nokia has calculated the monthly total-cost-of-ownership (TCO) for
mobile phones for a series of countries. On this price index, Tanzania comes in just below the
$44.18 dollar average. With a TCO of US$43.42, the country is followed by Nigeria, South Africa, Ivory
Coast and Cameroon, which all come in just above the global average cost.
Towards Evidence-based ICT Policy and Regulation
25
On-net technology
off ers lower tari ff s
when compared to off -
net tari ff
s across all operators
Mauritius
Ghana
Ethiopia
Kenya
Uganda
Tunisia
Namibia
Zambia
Botswana
Senegal
Tanzania
Nigeria
South AfricaCote d’Ivoire
Cameroon
Average 44,18
71,86
58,7458,38
45,43
43,42
42,89
41,85
41,70
39,71
37,68
34,97
25,30
23,48
20,15
15,33

8/8/2019 Tanzania SPR Layout Final English
http://slidepdf.com/reader/full/tanzania-spr-layout-final-english 29/47
Figure 5: Share of mobile subscribers that were prepaid users in 2007/8
Source: RIA household survey
The figure above depicts the fact that almost all mobile subscribers were prepaid users in 2007/2008
(Gillwald & Stork, 2008), confirming the overall African trend of pre-paid subscribers of SIM-cards. The
choice of a pre-paid mobile service is linked to irregular and low-income patterns across the majority
of the population, who prefer the pre-paid solution as it allows for greater flexibility in expenditure.
Table 20: Cheadominant ope
pest prrators f
epaid prodor OECD us
uct inage ba
counskets (
ry compar2006 defini
d witition) f
chear 18
pest pIA cou
repaid pntries
roduct rom
Che
p
co
apest prep
oduct in th
untry in U
aid
e
D
Che
p
dom
apest pre
roduct fro
inant oper
aid
tors
(% = diff
Diff e
rence /
ence
domin nt pri
e)
Low Medium High Low Medium High Low User Mediu User High User
User
User
User
User
User
User % USD % USD % USD
Botswana 5,04 10,28 20,67 5,04 10,28 20,67 0% 0,00 0% 0,00 0% 0,00
Ethiopia* 3,74 7,59 14,98 3,74 7,59 14,98 0% 0,00 0% 0,00 0% 0,00
Mozambique 7,45 15,07 29,88 7,45 15,07 29,88 0% 0,00 0% 0,00 0% 0,00
Senegal 6,12 12,31 24,25 6,12 12,31 24,25 0% 0,00 0% 0,00 0% 0,00
South Africa 7,64 15,38 29,63 7,64 16,12 33,13 0% 0,00 5% 0,74 11% 3,50
Tunisia 5,06 10,24 20,19 5,06 10,24 20,19 0% 0,00 0% 0,00 0% 0,00
Zambia 6,57 13,28 25,99 6,60 13,54 26,37 0% 0,03 2% 0,26 1% 0,38
Cameroon 8,59 16,42 30,45 9,30 17,91 33,22 8% 0,71 8% 1,49 8% 2,77
Uganda 6,33 12,90 24,05 6,95 13,90 26,85 9% 0,62 7% 1,00 10% 2,80
Burkina Faso 11,04 22,65 45,19 12,54 25,98 52,52 12% 1,50 13% 3,33 14% 7,33
Côte d’Ivoire 7,00 14,34 28,88 8,15 16,34 31,59 14% 1,15 12% 2,00 9% 2,71
Ghana 2,29 4,36 8,01 3,04 6,10 12,16 25% 0,75 29% 1,74 34% 4,15
Benin 4,92 11,05 24,75 7,50 14,74 27,84 34% 2,58 25% 3,69 11% 3,09
Kenya 3,35 6,37 11,42 5,93 11,82 22,78 44% 2,58 46% 5,45 50% 11,36
Namibia 5,06 10,74 22,19 8,96 18,27 36,19 44% 3,90 41% 7,53 39% 14,00
Rwanda 3,74 7,94 16,59 6,87 13,63 26,45 46% 3,13 42% 5,69 37% 9,86
Nigeria 3,63 7,58 15,48 7,76 15,85 32,13 53% 4,13 52% 8,27 52% 16,65
Tanzania 2,93 6,06 12,24 7,26 15,24 31,84 60% 4,33 60% 9,18 62% 19,60
* Ethiopia only has one operator
Tanzania ICT Sector Performance Review 2009/2010
26
almost all mobile
subscribers were
prepaid users in
2007/2008
South Africa
Cameroon
Ethiopia
Namibia
Cote d’Ivoire
Rwanda
Benin
Burkina Faso
Tanzania
Uganda
Mozambique
Kenya
Botswana
Nigeria
Senegal
Zambia
Ghana 99,83
99,70
99,70
99,33
99,28
98,89
98,89
97,84
96,95
96,69
95,96
94,77
91,77
89,95
88,31
88,04
78,64

8/8/2019 Tanzania SPR Layout Final English
http://slidepdf.com/reader/full/tanzania-spr-layout-final-english 30/47
Figure 6: OECD Low Usage Basket PPP for cheapest product of dominant operators
Source: www.researchictafrica-data.net
Adjusted for purchasing power, Tanzania remains one the highest in terms of mobile prices (OECD
low usage basket PPP), followed by another poor country, Burkina Faso, despite their relatively good
performance before the adjustment. The excellent regulatory eff ort in Tanzania to reduce prices is
undermined, however, by the special taxes on communications equipment and services. As
highlighted above, telecom equipment in Tanzania is subject to 20% import duty and 20% VAT and
there is a 7% special tax on mobile airtime.
Broadband Pricing
Broadband service costs have dropped drastically since the landing of the SEACOM cable in Dar es
Salaam. The TTCL, for example, is off ering a cost reduction between 20% and 50% as shown in the
table below:
Table 21: Comparison o old and new broadband prices
TTCL Residential/personal Broadband Services
Service Old Price per MB (TZS) New Price per MB (TZS) Price Advantage (%)
Broadband Standard 95.00 75.00 -20%
New Service Price (TZS)Speed (up/down) –
SharedCharging
Broadband Unlimited 45 000,00 256/256 Monthly (rolling)
Small and medium e
(The prices have bee
terprises Broadband
reduced by 50–62%
ervices
s seen in the last colu n)
Old Usage (GB) New Usage (GB) Old Price (TZS) Price Advantage (%)
0.44 1 30,000.00 -55%
1 2 60,000.00 -49%
2 4 100,000.00 -49%
5 10 200,000.00 -49%
10 20 360,000.00 -49%
20 40 450,000.00 -49%
50 100 1,000,000.00 -49%
Unlimited Package 54,000.00 New Package
Towards Evidence-based ICT Policy and Regulation
27
The excellent
regulatory eff ort in
Tanzania to reduce
prices is undermined
by the special taxes on
communications
equipment and
services
Ghana
Zambia
Senegal
Ethiopia
Tunisia
Botswana
Kenya
Cote d’Ivoire
Namibia
South Africa
Benin
Rwanda
Nigeria
Mozambique
Cameroon
Uganda
Tanzania
Burkina Faso 27,09
18,56
17,42
16,77
15,39
15,22
14,52
14,15
11,94
11,79
11,79
11,65
10,56
10,53
10,34
9,97
8,92
7,57

8/8/2019 Tanzania SPR Layout Final English
http://slidepdf.com/reader/full/tanzania-spr-layout-final-english 31/47
The Retail Price for Broadband Standard (Non-package) is Tsh 75 per MB
NOTE:
• For packages, if in-package usage is not finished within a month it expires (no carry forward)
• If package usage is finished before the month ends, customer is charged on a flow basis at
Tshs75 per MB until the month ends
• For any additional top-ups carried out above the package, when the month ends, remaining
balance shall be carried forward into the next month
• At the beginning of each month, all package accounts must be topped-up with balance
equivalent to the monthly package; otherwise service will not be made available
• A broadband account that is not topped up expires after 30 days since it was created
• For any top-up performed, account validity is increased by 30 days for each Tshs10,000.00
• When account validity expires, the account is deleted from a system
• To restore a deleted account, the customer has to pay installation charges as a new
subscriber
Dedicated B oadband Tariff s
Monthly
Service
Old Price
(TZS)
VAT Exclusive
Old Price
(TZS)
VAT Inclusive
New Price
(TZS)
VAT Exclusive
New Price
(TZS)
VAT inclusive
Change
(%)
Ded 64K 762,711.86 900 000,00 381,355.93 450 000,00 -50%
Ded 128K 1,525,423.73 1,800,000.00 1,525,423.73 860 000,00 -52%
Ded 256K 2,711,864.41 3 200 000,00 1,254,237.29 1 480 000,00 -54%
Ded 512K 4,745,762.71 5,600,000.00 1,881,355.93 2 220 000,00 -60%
Ded 1024K 7,796,610.17 9,200,000.00 2,661,016.95 3 140 000,00 -66%
Ded 2048K 10,508,474.58 12 400 000,00 3,966,101.69 4 680 000,00 -62%
TTCL tari ff s
Source: http://w
w.ttcl.co.tz/tari ff s_o
erview_Eng.asp
Zantel charges 1 shilling per second within its network and 5.5 shillings to all other operators.
Zantel International Tariff s10 are divided into 4 zones as follows:
• Zone 1, costing 5.5 shillings per second, for United States of America, Canada, France,
Norway, Spain, Germany, Ireland, India, Italy, Pakistan, United Kingdom, Sweden, and
Denmark;
• Zone 2, costing 6.0 per second, for Congo DR, UAE, Sudan, Israel, Comoros, Lebanon, Yemen,
China, and Oman;
•Zone 3, costing 5.5 shillings per second, for Mozambique, Zambia, Rwanda, Zimbabwe,
Kenya, Malawi, Uganda, South Africa, and Burundi; and
• Zone 4, costing 10 shillings per second, for the rest of the world.
Interconnection Facilities Leasing and Costing Model
In order to reduce mobile termination rates towards the cost of an efficient operator, Tanzania
conducted a cost study. As a result, Tanzania interconnection is based on a Forward Looking Long
Run Incremental Cost (FL-LRIC) model. It is referred to as ‘Determination No.2 of 2007 on cost-based
Interconnection Rates for voice call termination in the United Republic of Tanzania’. Based on this,
interconnection rates applicable to telecommunication network operators in the United Republic
of Tanzania from 1st January 2008 to 31st December 2012 are shown below:
Tanzania ICT Sector Performance Review 2009/2010
28
10 Zantel Tariff s
Source: http://www.zantel.co.tz/tariff .html
Tanzania
interconnection is
based on a Forward
Looking Long Run
Incremental Cost
(FL-LRIC) model

8/8/2019 Tanzania SPR Layout Final English
http://slidepdf.com/reader/full/tanzania-spr-layout-final-english 32/47
Table 22: Applicable Interconnection Termination Rates for 2008-2012
1st Jan.
2008
1st Jan.
2009
1st Jan.
2010
1st Jan.
2011
1st Jan.
2012
Voice call
termination
rates (US$ cents)
7.83
(=TSH97.00)7,65 7,49 7,32 7,16
Source: TCRA
Figure 7: Mobile termination rates in US cents (FX = average September 2010)
Source: RIA comparative analysis 2009/2010
Outgoing international calls are not subject to regulation because an international gateway
operator must pay an international carrier to terminate a call in a foreign country based on charges
arrived at by commercial negotiations.
Incoming international calls, irrespective of their origin, transiting through the international
gateways within Tanzania pay a cost for terminating calls on the national network in accordance
with applicable interconnection regulations.
Towards Evidence-based ICT Policy and Regulation
29
Senegal
Kenya
Ghana
Namibia
Tunisia
Zambia
Rwanda
Mozambique
Tanzania
Nigeria
Uganda
Cote d’Ivoire
Botswana
Burkina Faso
South Africa
Benin
Cameroon 16,00
11,70
11,65
9,43
8,65
8,49
8,07
7,53
7,49
7,02
7,00
5,90
5,82
5,61
3,49
2,73
2,14
an international
gateway operator
must pay an
international carrier to
terminate a call in a
foreign country
8/8/2019 Tanzania SPR Layout Final English
http://slidepdf.com/reader/full/tanzania-spr-layout-final-english 33/47
E- & M- Applications
E-Money and M-Banking
Currently there are two E-money schemes in Tanzania, namely, TemboCard and FedhaCard, which
are operated by two diff erent commercial banks. Three banks currently off er mobile bankingservices. Customers are able to receive information such as salary alerts and account balances
through their mobile phones.
Mobile payment services are off ered by major mobile phone companies whereby their customers
are able to send, spend and receive money without having a bank account. Zantel off ers Z-Pesa,
Vodacom has M-Pesa, and Zain off ers Zap.
Mobile banking and payment services are initiated by a customer who fills out an application form
and hands it over to registered agents. Upon direct cash deposit or link up with a customer’s bank,
the customer gets a mobile wallet, which allows them to use their mobile phone in much the same
way as a bank account debit card, and manage their money through their handset. Currently,
airtime re-charge, water and electricity bills, and major stores accept such payments.
E-Government
E-Government is about a government using computer technology, software and the Internet to
manage and deliver services in three overlapping focal points: external interaction, connecting
citizens and process improvement. E-Government strategies typically aim to generate
improvements in one or a combination of these focal points.
Few Tanzanians are connected to the Internet. The focus of e-Government in Tanzania is unlikely to
be the same as in parts of the developed world where over 50% of the population is connected.
Given this fundamental constraint, the Connected Citizens focal point, comprising initiatives such as
online voting, online tax remittance, electronic payment of fees and fines and online application for
documents and licences, is likely to be untenable.
The Process Improvement and External Interaction focal points, on the other hand, would appear to be
far more promising. Given the large amounts that the government spends on internationalprocurement and the high levels of corruption that pervade public institutions, the potential to lower
transaction costs whilst increasing transparency is undoubtedly high and desirable. The government
faces considerable difficulties in delivering quality services internally (financial management and
control, human resources and payroll management, providing policy information, standardising
procedures, and so forth), and opportunities exist in initiatives to enhance process efficiencies.
This means that improvements towards more efficient, eff ective, reliable, and transparent
procurement (over the Internet) will have a very significant impact. Tanzania has launched
integrated HR and Payroll systems covering about 280,000 public servants, reducing ghost workers
and improving control and accuracy.
The government has embraced e-governance as a major driving force behind efficient and
eff ective business transactions in government departments, particularly in financial procedures and
making the government machinery more transparent to the public.
Pointing at government financial auditing, the Chief Secretary said: "We are creating an e-
government that will be operational soon and it will drastically change the way we do things and
manage our resources." He was addressing the annual auditors’ meeting attended by auditors from
government ministries, departments and related institutions audited by the Controller and Auditor
General. The National Audit Office has adopted TeamMate software and Audit Command Language
and will be rolled out in all ministries and regional headquarters. The process is expected to be
complete by the end of 2012.
However, given the high demands placed by e-government on a multitude of foundational
pillars (which include prerequisites of infrastructure, appropriate policies, capacity development,
ICT applications, and relevant content that need to be in place to fully implement e-government
services) progress is slow. For example, the language of Internet content poses a significant
challenge, underscoring the importance of having Internet content in languages that one’s
citizens can read. An e-Government portal in Tanzania must be in Kiswahili with an Englishlanguage option.
Tanzania ICT Sector Performance Review 2009/2010
30
Three banks currently
off er mobile banking
services
the potential to lower
transaction costswhilst increasing
transparency is
undoubtedly high and
desirable
the language of
Internet content poses
a significant challenge,
underscoring the
importance of having
Internet content in
languages that one’s
citizens can read

8/8/2019 Tanzania SPR Layout Final English
http://slidepdf.com/reader/full/tanzania-spr-layout-final-english 34/47
The Telecommunications Regulatory Environment
Survey
Introduction The telecommunications regulatory environment survey was conduced with a view to gaining a
sense of the general perceptions of sector stakeholders on the regulation of the operations of the
sector. The survey was based on a methodology and a set of questionnaires. On a 1-5 scale, where 1
represented Highly Ineff ective and 5 represented Highly Eff ective, perceptions were sought on
seven dimensions about the fixed sector, the mobile sector and the broadband
telecommunications sector: Market Entry, Access to Scarce Resources, Interconnection, Tariff
Regulation, Regulation of Anti Competitive Practices, Universal Service Obligation (USO) and Quality
of Service (QoS). As guided by the methodology, three categories of respondents were purposely
identified:
Category 1:
Stakeholders directly aff ected by telecom sector regulation (e.g. Operators, Industry
associations, Equipment suppliers, Investors)
Category 2:
Stakeholders who analyse the sector with broader interests (e.g. Financial institutions,
Equity Research Analysts, Credit Rating Agencies, Telecom consultants, Law firms)
Category 3:
Stakeholders with an interest in improving the sector to help the public (e.g. Academics,
Research organisations, Journalists, Telecom user groups, Civil society, Former members
of regulatory and other government agencies, Donors, Current government employees
from organizations related to the telecom sector EXCLUDING those in the telecom
regulatory & policy hierarchy i.e. excludes anyone from the regulatory agency, policy-
making body [often Ministry of Post and Telecom or similar], the Minister in charge of
Telecommunications etc.)
Based on the criteria, a list of potential respondents was prepared by the survey team. A total of 67
potential respondents belonging to the three sectors were selected for the survey and a
questionnaire sent to them either in hard copy or electronic depending on respondents’
preference. Data was collected from Dar es Salaam, Arusha and Moshi between November and
December 2009. 54 responses were received.
Weighting of Respondents
There were 54 responses, representing the three categories as indicated in Table 17. Weighting for
the categories was necessar y to achieve a balanced representation of each category so that all
three categories contribute equally to the final score as required by the methodology.
Table 23: Resp ndent Categories and Weighting
Category Description Responses Weighting
1. Stakeholders directly aff ected by telecom sector
regulation : Operators, Industry associations,
Equipment suppliers, Investors etc.24 0.75
2. Stakeholders who analyze the sector with broader
interests: Financial institutions, Equity Research
Analysts, Credit Rating Agencies, Telecom
consultants, Law firms etc.
13 1.38
3. Stakeholders with an interest in improving the
sector to help the public: Academics, Research
organizations, Journalists, Telecom user groups,Civil society etc.
17 0.06
Towards Evidence-based ICT Policy and Regulation
31
The
telecommunications
regulatory
environment survey
was conduced with a
view to gaining a
sense of the general
perceptions of sector
stakeholders
Data was collected
from Dar es Salaam,
Arusha and Moshi
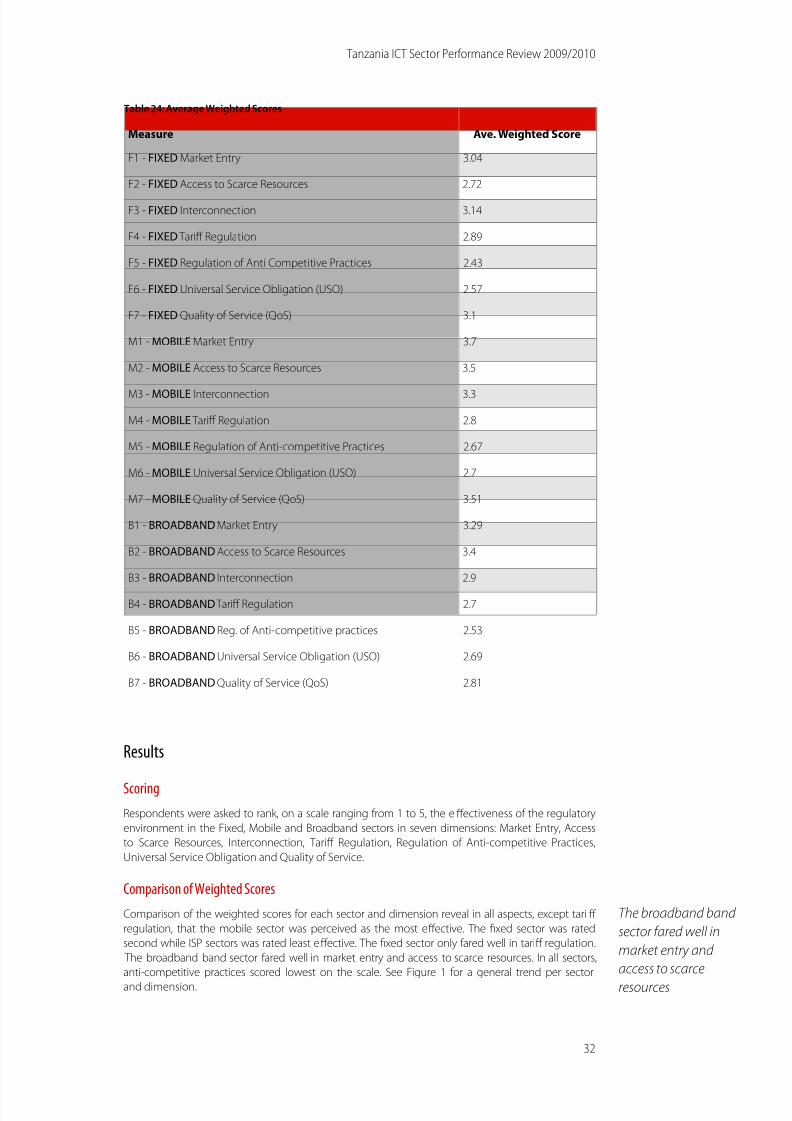
8/8/2019 Tanzania SPR Layout Final English
http://slidepdf.com/reader/full/tanzania-spr-layout-final-english 35/47
Table 24: Average Weighted Scores
Measure Ave. Weighted Score
F1 - FIXED Market Entry 3.04
F2 - FIXED Access to Scarce Resources 2.72
F3 - FIXED Interconnection 3.14
F4 - FIXED Tariff Regulation 2.89
F5 - FIXED Regulation of Anti Competitive Practices 2.43
F6 - FIXED Universal Service Obligation (USO) 2.57
F7 - FIXED Quality of Service (QoS) 3.1
M1 - MOBILE Market Entry 3.7
M2 - MOBILE Access to Scarce Resources 3.5
M3 - MOBILE Interconnection 3.3
M4 - MOBILE Tariff Regulation 2.8
M5 - MOBILE Regulation of Anti-competitive Practices 2.67
M6 - MOBILE Universal Service Obligation (USO) 2.7
M7 - MOBILE Quality of Service (QoS) 3.51
B1 - BROADBAND Market Entry 3.29
B2 - BROADBAND Access to Scarce Resources 3.4
B3 - BROADBAND Interconnection 2.9
B4 - BROADBAND Tariff Regulation 2.7
B5 - BROADBAND Reg. of Anti-competitive practices 2.53
B6 - BROADBAND Universal Service Obligation (USO) 2.69
B7 - BROADBAND Quality of Service (QoS) 2.81
Results
Scoring
Respondents were asked to rank, on a scale ranging from 1 to 5, the eff ectiveness of the regulatory
environment in the Fixed, Mobile and Broadband sectors in seven dimensions: Market Entry, Access
to Scarce Resources, Interconnection, Tariff Regulation, Regulation of Anti-competitive Practices,
Universal Service Obligation and Quality of Service.
Comparison of Weighted Scores
Comparison of the weighted scores for each sector and dimension reveal in all aspects, except tari ff
regulation, that the mobile sector was perceived as the most eff ective. The fixed sector was rated
second while ISP sectors was rated least eff ective. The fixed sector only fared well in tariff regulation.
The broadband band sector fared well in market entry and access to scarce resources. In all sectors,
anti-competitive practices scored lowest on the scale. See Figure 1 for a general trend per sector
and dimension.
Tanzania ICT Sector Performance Review 2009/2010
32
The broadband band
sector fared well in
market entry and
access to scarce
resources
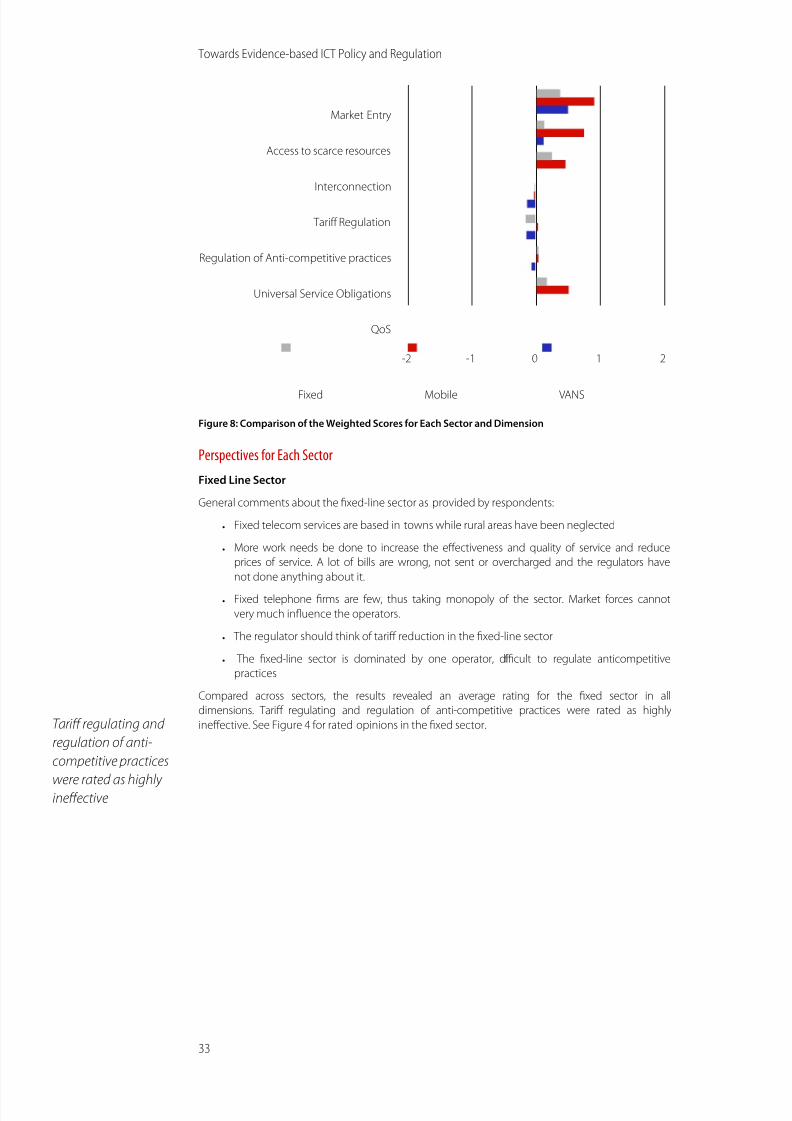
8/8/2019 Tanzania SPR Layout Final English
http://slidepdf.com/reader/full/tanzania-spr-layout-final-english 36/47
Figure 8: Comparison of the Weighted Scores for Each Sector and Dimension
Perspectives for Each Sector
Fixed Line Sector
General comments about the fixed-line sector as provided by respondents:
• Fixed telecom services are based in towns while rural areas have been neglected
• More work needs be done to increase the eff ectiveness and quality of service and reduce
prices of service. A lot of bills are wrong, not sent or overcharged and the regulators have
not done anything about it.
• Fixed telephone firms are few, thus taking monopoly of the sector. Market forces cannot
very much influence the operators.
• The regulator should think of tariff reduction in the fixed-line sector
• The fixed-line sector is dominated by one operator, difficult to regulate anticompetitive
practices
Compared across sectors, the results revealed an average rating for the fixed sector in all
dimensions. Tariff regulating and regulation of anti-competitive practices were rated as highly
ineff ective. See Figure 4 for rated opinions in the fixed sector.
Market Entry
Access to scarce resources
Interconnection
Tariff Regulation
Regulation of Anti-competitive practices
Universal Service Obligations
QoS
-2 -1 0 1 2
Fixed Mobile VANS
Towards Evidence-based ICT Policy and Regulation
33
Tari ff regulating and
regulation of anti-
competitive practices
were rated as highly ineff ective

8/8/2019 Tanzania SPR Layout Final English
http://slidepdf.com/reader/full/tanzania-spr-layout-final-english 37/47
Figure 9: Fixed Line Sector – Perspectives in percentage responses per dimension
Mobile Sector Perspectives
General comments about the mobile sector by respondents
• Mobile sector has moved strongly into providing data services
• Airtime costs are not friendly to users from all service providing mobile companies
• In general, there is a NEED to reduce cost of service to consumers
• No consortium available and no willingness in making any as available companies fear of
competition
• The price for calling is very expensive. It is cheaper to call America from the Internet than
call a local mobile number. It is cheaper to use Internet to call a local mobile and other
network than to use your mobile phone.
• Internet usage through mobile network operator (MNOs) modems still expensive
• Regulator must now start to ensure the quality of mobile handset products
• Interconnection and regulation on anti-competitive practices may be an issue for the
mobile sector
• The mobile sector has grown fast and has a wide geographical coverage, becoming
successful. Regulation is up to date.
Ratings
Compared across sectors, the mobile sector was rated higher in all dimensions. Market entry, access
to resources and interconnection were also rated eff ective. The Universal Service Obligation was
rated less eff ective in this sector. See Figure 10 below for rated opinions in the mobile sector.
Can't say Highly eff ective Eff ective
Average Ineff ective Highly ineff ective
[F7] Quality of Service (QoS)
[F6] Universal Service Obligation (USO)
[F5] Regulation of Anti-competitive Practices
[F4] Tariff Regulation
F3] Interconnection
[F2] Access to Scarce Resources
[F1] Market Entry
0 5 10 15 20 25 30 35 40
Percentage (%)
Tanzania ICT Sector Performance Review 2009/2010
34

8/8/2019 Tanzania SPR Layout Final English
http://slidepdf.com/reader/full/tanzania-spr-layout-final-english 38/47
Figure 10: Mobile Sector Perspectives in percentage responses per dimension
Broadband Sector Perspectives
General comments regarding the broadband sector
• It is not possible to share broadband information between service providers
• Broadband service is mostly based in towns. Rural areas have been neglected.
• TCRA in general is doing well to regulate but there is discrepancy in delivering procured
bandwidth to regions is ineff ective, as we do not have the infrastructure in place and where
is in place it is expensive costing more than bringing bandwidth from outside
• The cost is low, price and quality is very good, but speed of implementation is too slow. The
benefit of the fiber optic is not transformed to customer on unlimited packages
• Broadband service is almost non-existent. Internet connection in Tanzania is incredibly slow
and therefore, unreliable. Additionally, the cost of Internet in Tanzania is way too much. It's
not unusual to walk out of the Internet café without achieving whatever you wanted.
Downloading a very small file can take ages. Now that fiber optic cables are well in place, I
expect to see improvements in speed and cost decline.
• Increase supervision and controlling of price for broadband
• Reliability of broadband sector is still a problem
• The broadband sector is new and still slowly adopted due to lack of electricity especially in
rural areas. Regulatory measures in the broadband sector should be enhanced.
Ratings
Market entry for the broadband sector was rated as eff ective. However, this may be based on what
the regulation provides for in documentation, but have little to do practical experience because the
sector is new.
Towards Evidence-based ICT Policy and Regulation
35
Market entry for the
broadband sector was
rated as eff ective
[F7] Quality of Service (QoS)
[F6] Universal Service Obligation (USO)
[F5] Regulation of Anti-competitive Practices
[F4] Tariff Regulation
F3] Interconnection
[F2] Access to Scarce Resources
[F1] Market Entry
0 5 10 15 20 25 30 35 40 45 50
Percentage (%)
Can't say Highly eff ective Eff ective
Average Ineff ective Highly ineff ective

8/8/2019 Tanzania SPR Layout Final English
http://slidepdf.com/reader/full/tanzania-spr-layout-final-english 39/47
Figure 11: Broadband Sector Perspectives in percentage responses per dimension
Conclusion
Market Entry: There were concerns about the transparency of licensing. It was felt that applicants
should know the terms, conditions, criteria and length of time needed to reach a decision on their
application. There were also concerns about licence conditions and exclusivity issues.
Access to Scarce Resources: Some respondents wanted timely, transparent and non-discriminatory
access to spectrum allocation. Assignment of telecommunication numbers (numbering resources)
and rights of way was also an issue of concern. Frequency allocation, telephone number allocation
and tower/mast locations and safety were also issues of concern.
Inter-connection: Interconnection with a major operator should be ensured at any technically
feasible point in the network. The quality of interconnection needed to be similar to services
off ered by a provider’s own network, and it was felt rates for interconnection needed to be even
more reasonable. Sharing of incoming and outgoing International Direct Dialling (IDD) revenue was
requested. Payment for cost of interconnection links and switch interface was considered too high.
There should be penalties for technical disruption of interconnection.
Regulation of Anti-competitive Practices: Respondents alleged that there were anti-competitive
practices in cross subsidisation in the market, using information obtained from competitors withanti-competitive results. Some respondents claimed that network operators were not making
technical information about essential facilities and commercially relevant information available to
competitors on a timely basis. Claims of excessive prices, discrimination and predatory low pricing
were also made. Technical disruption of interconnection by competitors was also noted.
Universal Service Obligations (USO): Respondents were of the opinion that USO was a good
move, but cautioned that its administration of the service should be transparent, non-
discriminatory and competitively neutral. A need to educate targeted beneficiaries of the service
was expressed.
Quality of Service: Respondents noted a discrepancy between actual performance of service
compared to what is promised. For example, while there is a lot of advertisement on new services
and how to subscribe, there is little information on how to unsubscribe, causing a lot of frustration
to customers. Voice transmission quality (for mobile and fixed telephones), connection speeds or
throughput (for broadband) were also areas of concern.
Tanzania ICT Sector Performance Review 2009/2010
36
Frequency allocation,
telephone number
allocation and tower/
mast locations and
safety were also issues
of concern
There should be
penalties for technical
disruption of interconnection
[F7] Quality of Service (QoS)
[F6] Universal Service Obligation (USO)
[F5] Regulation of Anti-competitive Practices
[F4] Tariff Regulation
F3] Interconnection
[F2] Access to Scarce Resources
[F1] Market Entry
0 5 10 15 20 25 30 35 40 45
Percentage (%)
Can't say Highly eff ective Eff ective
Average Ineff ective Highly ineff ective

8/8/2019 Tanzania SPR Layout Final English
http://slidepdf.com/reader/full/tanzania-spr-layout-final-english 40/47
Conclusions and Recommendations
1. It appears that the general public lacks awareness on developments in the
telecommunication sector and its potential contribution to national development.
There is a need to provide education about developments in the telecommunications
sector, particularly on availability of broadband communication facilities, and how
these developments can be used to harness and enhance economic development.Investors in the sector need to foresee these in the long run as economic gains
reflected in growing ARPU.
2. Research and Development (R&D) activities in the sector are limited, while
telecommunications usage data and statistics are not regularly collected. This makes it
very difficult to establish or predict trends in the sector without carr ying out extensive
research. Stakeholders (both government and private), could take an interest in
research and development activities as a basis for sustained growth and development
of the sector.
3. Customer service was rated low by respondents of the survey. This calls for improved
quality of customer support, especially help desk services and customer support.
4. Respondents complained about the poor quality of handsets. Sub-standard and
imitation brand handsets are abundant in the local market, posing danger to users.
Mobile phone operators can help ensure quality control through the sale of low-cost
quality handsets.
5. Respondents observed haphazard installation of telephone masts and towers. We
therefore recommend that regulation on installation of masts and towers be enforced.
6. Time-based Internet access charge models may be limited in a broadband
environment. Internet and data service providers may need to be helped to review their
Internet access charge models. For example, time-based Internet access charging
models may need to be replaced by data (file size) charging models.
Towards Evidence-based ICT Policy and Regulation
37
Stakeholders (both
government and
private), could take an
interest in research
and development
activities as a basis for
sustained growth and
development
We recommend that
regulation on
installation of masts
and towers be
enforced

8/8/2019 Tanzania SPR Layout Final English
http://slidepdf.com/reader/full/tanzania-spr-layout-final-english 41/47
References
• Arbore Alessandro (Bocconi University, Italy) Local Loop Unbundling - Essence, Introduction
and Definitions, Background, the Policy Measures http://encyclopedia.jrank.org/articles/pages/
6657/Local-Loop-Unbundling.html#ixzz13jhqRQPR
• East African Community (2009). Regional Information and Communication TechnologiesSupport Programme (RICTSP). ICT Policy Review in the EAC Partner States: Benchmarking Report
for Tanzania.
• Governor Bank of Tanzania (2009). Monetary Policy Statement. June 2009.
• Lange, Peter (2009). Tanzania Telecoms, Mobi le and Broadband . Bucketty NSW Paul Budde
Communication Pty Ltd.
• Mfungahema, R.C. (2006). Policy and Regulatory Approach on the Next Generation Networks:
The Case of Tanzania. ITU-Regional Workshop on the Next Generation Networks (NGN) 3rd–
5thOctober 2006 at Markham Suite Hotel, Dar es Salaam.
• National Bureau of Statistics Website: http://www.nbs.go.tz/.
• Statistics Tanzania. Rural Poverty Portal:
http://www.ruralpovertyportal.org/web/guest/country/statistics/tags/tanzania
• Tanzania Commission for Universities (TCU). http://www.tcu.go.tz/.
• Tanzania Communications Regulatory Authority: www.tcra.go.tz.
• Tanzania Internet Service Providers Association(TISPA):
http://www.tix.or.tz/tispa/members.html.
• Tanzania Telecommunications Company ( TTCL):
Website http://www.ttcl.co.tz/tariff s_overview_Eng.asp.
• TCRA (2006). Public Consultation Document on Subscription Broadcasting Services in Tanzania
• TCRA (2010). http://www.tcra.go.tz/headlines.
• The Citizen Daily, Thursday, 23 July 2009: Tanzania: Dawn of new era for telecom sector .
• United Republic of Tanzania (2010). Ministry of Communi cation, Science and Technology. Budget
Speech.
• United Republic of Tanzania, Ministry of Education and Vocational Training (MoEVT) (2007).
Information & Communication Technology (ICT) Policy for Basic Education
• United Republic of Tanzania (2003). National Infor mation and Communication Policy.
• United Republic of Tanzania (2003). The Fair Competition Act, 2003
• United Republic of Tanzania (2006). The Universal Communications Services Act , 2006. Dar es
Salaam
• United Republic of Tanzania (2007). Determination on Review of Telecommunication Rates in
the United Republic of Tanzania(URT)- TCRA, Dar es Salaam.
• United Republic of Tanzania (URT) (2008). Statistics Handbook on Communications, Science
and Technology for 2007/2008
• World Internet Stats: Usage and Population Statistics (2009)
http://www.Internetworldstats.com/af/tz.htm
• Zanzibar Telecom Limited (Zantel).
http://www.zantel.co.tz/tariff .html
Tanzania ICT Sector Performance Review 2009/2010
38

8/8/2019 Tanzania SPR Layout Final English
http://slidepdf.com/reader/full/tanzania-spr-layout-final-english 42/47
Appendices
Appendix 1 : TTCL Tariff s
Source: http://www.ttcl.co.tz/tariff s_overview_Eng.asp
TTCL Residential/Personal Broadband Services
ServiceOld Price per MB
(TZS)
New Price per MB
(TZS)
Price Advantage
(%)
Broadband Standard 95.00 75.00 -20%
New ServicePrice
(TZS)
Speed (up/down) –
SharedCharging
Broadband Unlimited 45 000,00 256/256 Monthly (rolling)
Small and Medium Enterpr
(The prices have been redu
ise Broadband Services
ced by 50–62% as seen in the last column)
Old Usage
(GB)
New Usage
(GB)
Old Price
(TZS)
Price Advantage
(%)
0.44 1 30,000.00 -55%
1 2 60,000.00 -49%
2 4 100,000.00 -49%
5 10 200,000.00 -49%
10 20 360,000.00 -49%
20 40 450,000.00 -49%
50 100 1,000,000.00 -49%
Unlimited Package 54,000.00 New Package
The Retail Price for Broadband Standard (Non-package) is Tsh 75 per MB
NOTE:
• For packages, if in-package usage is not finished within a month it expires (no carry forward)
• If package usage is finished before the month ends, customer is charged on a flow basis at
Tshs75 per MB until the month ends
• For any additional top-ups carried out above the package, when the month ends, remaining
balance shall be carried forward into the next month
• At the beginning of each month, all package accounts must be topped-up with balance
equivalent to the monthly package; otherwise service will not be made available
• A broadband account that is not topped up expires after 30 days since it was created
• For any top-up performed, account validity is increased by 30 days for each Tshs10,000.00
• When account validity expires, the account is deleted from a system
• To restore a deleted account, the customer has to pay installation charges as a new
subscriber
Towards Evidence-based ICT Policy and Regulation
39

8/8/2019 Tanzania SPR Layout Final English
http://slidepdf.com/reader/full/tanzania-spr-layout-final-english 43/47
Dedicated Broa band Tariff s
Monthly
Service
Old Price
(TZS)
VAT Exclusive
Old Price
(TZS)
VAT Inclusive
New Price
(TZS)
VAT Exclusive
New Price
(TZS)
VAT inclusive
Change
(%)
Ded 64K 762,711.86 900 000,00 381,355.93 450 000,00 -50%
Ded 128K 1,525,423.73 1,800,000.00 1,525,423.73 860 000,00 -52%
Ded 256K 2,711,864.41 3 200 000,00 1,254,237.29 1 480 000,00 -54%
Ded 512K 4,745,762.71 5,600,000.00 1,881,355.93 2 220 000,00 -60%
Ded 1024K 7,796,610.17 9,200,000.00 2,661,016.95 3 140 000,00 -66%
Ded 2048K 10,508,474.58 12 400 000,00 3,966,101.69 4 680 000,00 -62%
MPLS VPN Tariff s
MPLS VPN Service Speed (Kbps) Monthly Price (USD)
64Kbps - Symetrical 128 300,00
128Kbps - Symetrical 256 500,00
256Kbps - Symetrical 512 800,00
512Kbps - Symetrical 1024 1 050,00
1024Kbps - Symetrical 2048 2 040,00
1536Kbps - Symetrical 3072 3 500,00
2048Kbps - Symetrical 4096 4 100,00
For MPLS VPN capacity more than 2Mbps symmetrical (4Mbps) the price is USD 730.00 per Mbps.All prices above are VAT exclusive
Tanzania ICT Sector Performance Review 2009/2010
40
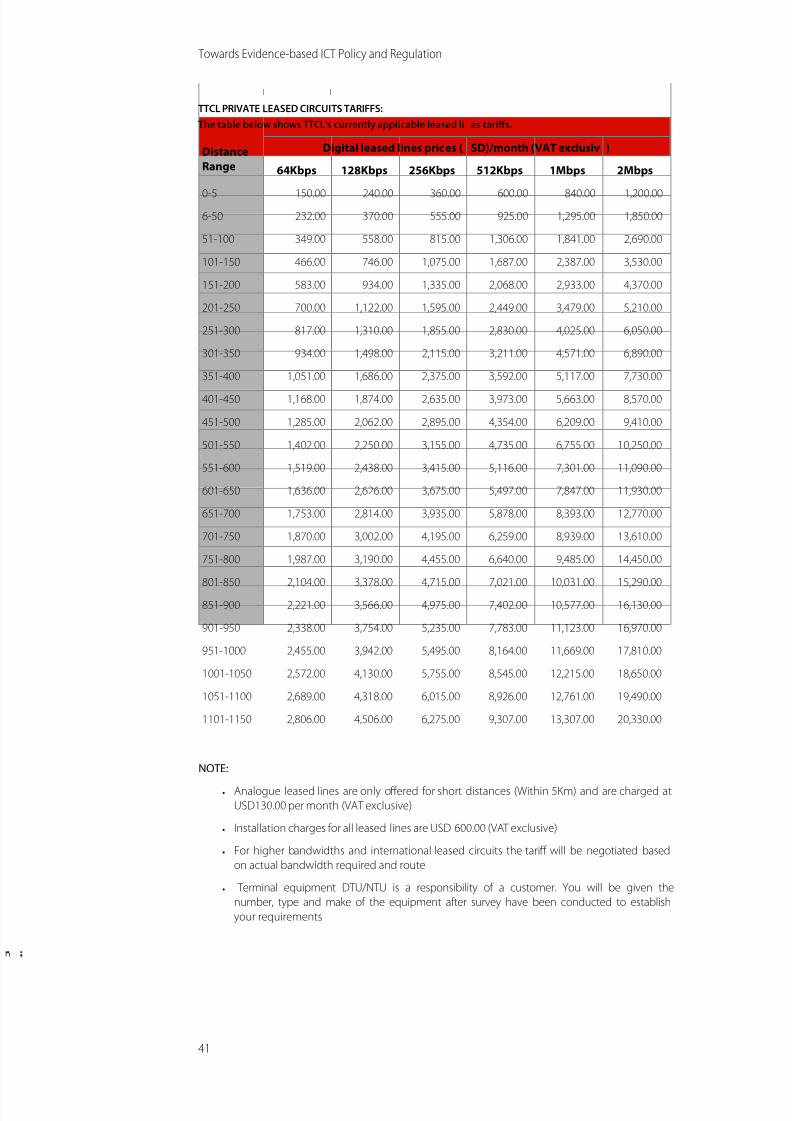
8/8/2019 Tanzania SPR Layout Final English
http://slidepdf.com/reader/full/tanzania-spr-layout-final-english 44/47
TTCL PRIVATE
The table belo
LEASED CIRCUI
w shows TTCL's
TS TARIFFS:
currently applicable leased li es tariff s.
Distance Digital leased lines prices ( SD)/month (VAT exclusiv )
Range 64Kbps 128Kbps 256Kbps 512Kbps 1Mbps 2Mbps
0-5 150.00 240.00 360.00 600.00 840.00 1,200.00
6-50 232.00 370.00 555.00 925.00 1,295.00 1,850.00
51-100 349.00 558.00 815.00 1,306.00 1,841.00 2,690.00
101-150 466.00 746.00 1,075.00 1,687.00 2,387.00 3,530.00
151-200 583.00 934.00 1,335.00 2,068.00 2,933.00 4,370.00
201-250 700.00 1,122.00 1,595.00 2,449.00 3,479.00 5,210.00
251-300 817.00 1,310.00 1,855.00 2,830.00 4,025.00 6,050.00
301-350 934.00 1,498.00 2,115.00 3,211.00 4,571.00 6,890.00
351-400 1,051.00 1,686.00 2,375.00 3,592.00 5,117.00 7,730.00
401-450 1,168.00 1,874.00 2,635.00 3,973.00 5,663.00 8,570.00
451-500 1,285.00 2,062.00 2,895.00 4,354.00 6,209.00 9,410.00
501-550 1,402.00 2,250.00 3,155.00 4,735.00 6,755.00 10,250.00
551-600 1,519.00 2,438.00 3,415.00 5,116.00 7,301.00 11,090.00
601-650 1,636.00 2,626.00 3,675.00 5,497.00 7,847.00 11,930.00
651-700 1,753.00 2,814.00 3,935.00 5,878.00 8,393.00 12,770.00
701-750 1,870.00 3,002.00 4,195.00 6,259.00 8,939.00 13,610.00
751-800 1,987.00 3,190.00 4,455.00 6,640.00 9,485.00 14,450.00
801-850 2,104.00 3,378.00 4,715.00 7,021.00 10,031.00 15,290.00
851-900 2,221.00 3,566.00 4,975.00 7,402.00 10,577.00 16,130.00
901-950 2,338.00 3,754.00 5,235.00 7,783.00 11,123.00 16,970.00
951-1000 2,455.00 3,942.00 5,495.00 8,164.00 11,669.00 17,810.00
1001-1050 2,572.00 4,130.00 5,755.00 8,545.00 12,215.00 18,650.00
1051-1100 2,689.00 4,318.00 6,015.00 8,926.00 12,761.00 19,490.00
1101-1150 2,806.00 4,506.00 6,275.00 9,307.00 13,307.00 20,330.00
NOTE:
• Analogue leased lines are only off ered for short distances (Within 5Km) and are charged at
USD130.00 per month (VAT exclusive)
• Installation charges for all leased lines are USD 600.00 (VAT exclusive)
• For higher bandwidths and international leased circuits the tariff will be negotiated based
on actual bandwidth required and route
• Terminal equipment DTU/NTU is a responsibility of a customer. You will be given the
number, type and make of the equipment after survey have been conducted to establish
your requirements
Towards Evidence-based ICT Policy and Regulation
41

8/8/2019 Tanzania SPR Layout Final English
http://slidepdf.com/reader/full/tanzania-spr-layout-final-english 45/47
Appendix 2
List of Internet Service Providers
• AfricaOnline
• Afsat Comm. (T) Ltd.
• Alink (T) Ltd.
• Benson Informatics Ltd. (BOL)
• Cats-Net
• Costech
• Satcom Networks
• SimbaNet
• Star Tel (T) Ltd.
• TTCL
• University Computing Centre
• Vizada Network
• Vodacom (T) Ltd.
• WiA Co. Ltd.
• Zee Communications Ltd
• Zanzibar Telecom Ltd.-Zantel
• MIC (T) Ltd.
• Selcom Broadband Ltd
• Arusha Node Marie (ANM)
• Arusha Art Ltd (CyberNet)
• Alldean Satellite Networks (T) Ltd
• Frank Habicht
• Tembo World Ltd.
Tanzania ICT Sector Performance Review 2009/2010
42
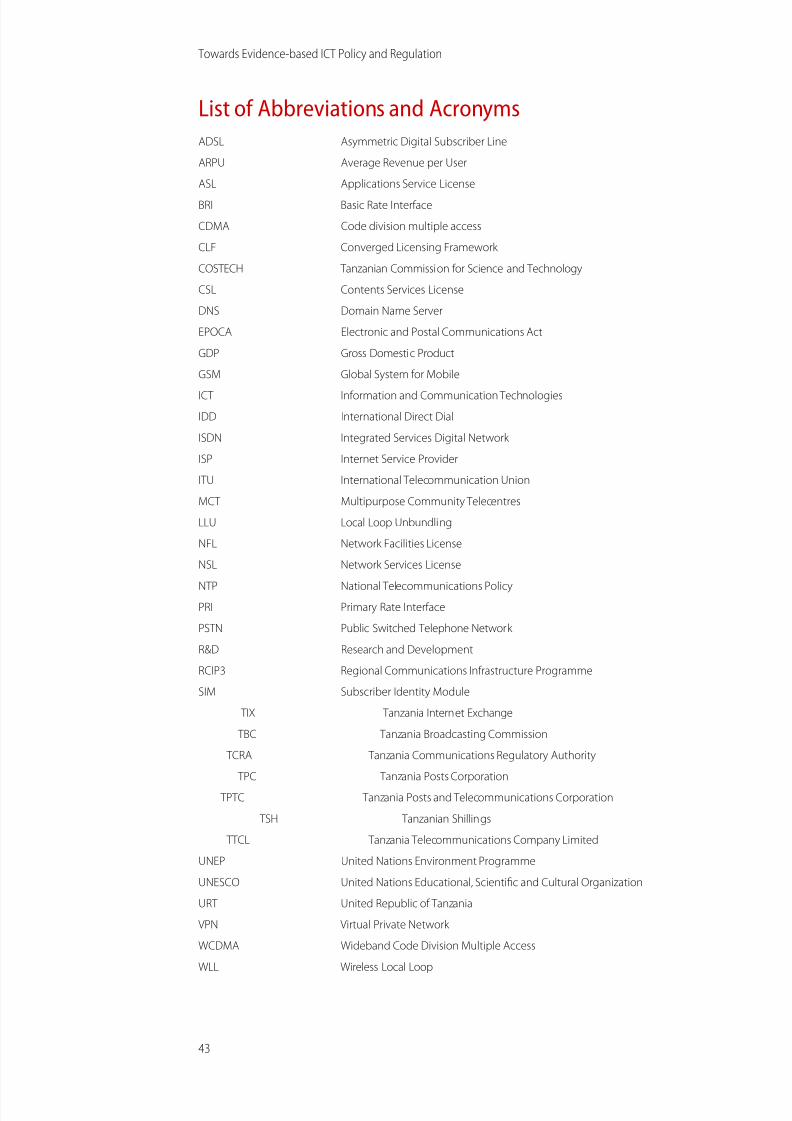
8/8/2019 Tanzania SPR Layout Final English
http://slidepdf.com/reader/full/tanzania-spr-layout-final-english 46/47
List of Abbreviations and Acronyms
ADSL Asymmetric Digital Subscriber Line
ARPU Average Revenue per User
ASL Applications Service License
BRI Basic Rate Interface
CDMA Code division multiple access
CLF Converged Licensing Framework
COSTECH Tanzanian Commission for Science and Technology
CSL Contents Services License
DNS Domain Name Server
EPOCA Electronic and Postal Communications Act
GDP Gross Domestic Product
GSM Global System for Mobile
ICT Information and Communication Technologies
IDD International Direct Dial
ISDN Integrated Services Digital Network
ISP Internet Service Provider
ITU International Telecommunication Union
MCT Multipurpose Community Telecentres
LLU Local Loop Unbundling
NFL Network Facilities License
NSL Network Services License
NTP National Telecommunications PolicyPRI Primary Rate Interface
PSTN Public Switched Telephone Network
R&D Research and Development
RCIP3 Regional Communications Infrastructure Programme
SIM Subscriber Identity Module
TIX Tanzania Internet Exchange
TBC Tanzania Broadcasting Commission
TCRA Tanzania Communications Regulatory Authority
TPC Tanzania Posts Corporation
TPTC Tanzania Posts and Telecommunications Corporation
TSH Tanzanian Shillings
TTCL Tanzania Telecommunications Company Limited
UNEP United Nations Environment Programme
UNESCO United Nations Educational, Scientific and Cultural Organization
URT United Republic of Tanzania
VPN Virtual Private Network
WCDMA Wideband Code Division Multiple Access
WLL Wireless Local Loop
Towards Evidence-based ICT Policy and Regulation
43

8/8/2019 Tanzania SPR Layout Final English
http://slidepdf.com/reader/full/tanzania-spr-layout-final-english 47/47