Embed Size (px)
Citation preview

a
ANNUAL INSURANCE MARKET PERFORMANCE REPORT For The Year Ended 31st December 2011
TANZANIA INSURANCE REGULATORY AUTHORITY
ANNUAL INSURANCE MARKETPERFORMANCE REPORT
For The Year Ended 31st December 2011
TANZANIA INSURANCE REGULATORY AUTHORITY HEADQUARTERS
TIRA BUILDINGBLOCK 33, PLOT NO. 85/2115
MTENDENI STREETP.O. BOX 9892
DAR ES SALAAM - TANZANIATel. No. 2132537, 2116120, 2116131
Telefax No. 2132539
Website: www.tira.go.tzEmail: [email protected]
TIRA 2011 ANNUAL REPORT.indd aTIRA 2011 ANNUAL REPORT.indd a 1/18/13 9:47:39 AM1/18/13 9:47:39 AM

b
ANNUAL INSURANCE MARKET PERFORMANCE REPORT For The Year Ended 31st December 2011
TIRA 2011 ANNUAL REPORT.indd bTIRA 2011 ANNUAL REPORT.indd b 1/18/13 9:47:39 AM1/18/13 9:47:39 AM

i
ANNUAL INSURANCE MARKET PERFORMANCE REPORT For The Year Ended 31st December 2011
TABLE OF CONTENTS
Content Description Page No.Mission Statement of the Tanzania Insurance Regulatory Authority ........................... viList of Acronyms .......................................................................................................... viiGlossary ...................................................................................................................... ixLetter of Transmittal .................................................................................................... 1Acknowledgement ....................................................................................................... 2Members of the National Insurance Board .................................................................. 3Management of the Tanzania Insurance Regulatory Authority ..................................... 4PREAMBLE ............................................................................................................... 6STATEMENT OF THE CHAIRMAN OF THE NATIONAL INSURANCE BOARD ................................................................................................ 9REPORT OF THE COMMISSIONER OF INSURANCE FOR THE YEAR ENDING 31 DEC 2011 .................................................................................. 11
1. INSURANCE BUSINESS ................................................................................ 11
2. OBJECTIVES PERCEIVED UNDER LIBERALIZATION OF INSURANCE BUSINESS ........................................................................... 11
3. ECONOMIC IMPACT OF THE INSURANCE INDUSTRY ........................ 12 3.1 GDP Growth ............................................................................................ 12 3.2 GDP per Capita ........................................................................................ 13 3.3 Insurance Market Growth .......................................................................... 13 3.4 Insurance Penetration ................................................................................. 14 3.5 Insurance Density ...................................................................................... 15 3.6 Other Macro Economic Developments ...................................................... 15 3.7 Assessment of Economic Impact of the Insurance Industry ....................... 16
4. CHALLENGES FACING THE INSURANCE INDUSTRY ............................ 17
5. REGISTRATIONS DURING 2011 ................................................................... 18 5.1 Insurance Companies Registration ............................................................ 18 5.2 Insurance Intermediaries and Other Service Providers ................................ 19
6. GENERAL & LONG TERM ASSURANCE BUSINESS PERFORMANCE HIGHLIGHTS .................................................................... 19
7. GENERAL INSURANCE MARKET PERFORMANCE OVERVIEW ............ 21 7.1 General Insurance Business Growth ........................................................... 21 7.2 General Insurance Underwriting Results .................................................... 22 7.3 General Insurance Financial Highlights & Ratio Analysis .......................... 23 7.4 General Insurance Underwriting Trends ..................................................... 24 7.5 General Insurance Claims Experience ....................................................... 24 7.6 General Insurance Management Expenses ................................................. 25 7.7 General Insurance Net Income .................................................................. 25 7.8 General Insurance Portfolio Mix ................................................................ 25
8. LONG TERM ASSURANCE MARKET PERFORMANCE OVERVIEW ...................................................................................................... 26
TIRA 2011 ANNUAL REPORT.indd Sec1:iTIRA 2011 ANNUAL REPORT.indd Sec1:i 1/18/13 9:47:39 AM1/18/13 9:47:39 AM
ii
ANNUAL INSURANCE MARKET PERFORMANCE REPORT For The Year Ended 31st December 2011
8.1 Long Term Assurance Business Analysis ................................................... 26 8.2 Long Term Assurance Underwriting Trends ............................................ 28 8.3 Long Term Assurance Claims & Benefi ts Payments ................................. 28 8.4 Long Term Assurance Management Expenses ............................................. 28 8.5 Long Term Assurance Funds Position ........................................................ 28 8.6 Long Term Assurance Portfolio Mix ......................................................... 28
9. OPERATIONAL RESULTS OF TAN-RE .......................................................... 29
10. BROKERS PARTICIPATION IN INSURANCE UNDERWRITING............... 30 10.1 General Insurance Broking .................................................................... 31 10.2 Long Term Assurance Broking ................................................................ 32
11. REGULATION OF INSURANCE ACTIVITIES ............................................. 32 11.1 Supervision ............................................................................................... 32 11.2 Off-site Examination & On-site Inspection of Insurers ............................. 33 11.3 Oversight of AML/CFT Requirements in the Insurance Industry .............. 33 11.4 Consumer Complaints Handling .............................................................. 35
12. INSURANCE MARKET DEVELOPMENT INITIATIVES ........................... 35 12.1 Insurance Week Celebrations ................................................................... 35 12.2 Capacity Building for Industry Members ................................................... 37 12.3 Establishment of TIRA Zonal Offi ces ....................................................... 38 12.4 Consumer Education ................................................................................. 39
13. INSURANCE MARKET RESEARCH INITIATIVES ...................................... 41 13.1 Implemented Research Activities ............................................................... 41 13.2 On-going Research Activities ..................................................................... 42 13.3 Planned Research Activities ........................................................................ 42
14. ACTIVITIES OF THE NATIONAL INSURANCE BOARD .......................... 42
15. INSURANCE ACT AND ITS REGULATIONS ............................................. 44
16. ADMINISTRATIVE ISSUES & FINANCIAL RESULTS OF THE AUTHORITY ........................................................................................... 44 16.1 Human Resources ..................................................................................... 44 16.2 Information Communication Technology (ICT) ....................................... 45 16.3 Financial Results of the Authority .............................................................. 47
17. RELATIONS WITH INTERNATIONAL ORGANISATIONS ....................... 48 17.1 Membership to International Organizations ............................................. 48 17.2 Contribution to Development of International Insurance Bodies .............. 48 17.3 Contribution to Development of Regional Insurance Bodies ..................... 48 17.4 Participation in Actvities of CISNA ........................................................... 49 17.5 Participation in Actvities of EAISA ............................................................ 51
1. AUDIT REPORT AND FINANCIAL STATEMENTS OF TIRA FOR YEAR 2010/2011 ....................................................................................... 551.1 Audit Report of the Controller & Auditor General ............................................. 551.2 Statement of Responsibility on the Financial Statements for the year ended 30th June, 2011 .......................................................................................... 57
TIRA 2011 ANNUAL REPORT.indd Sec1:iiTIRA 2011 ANNUAL REPORT.indd Sec1:ii 1/18/13 9:47:39 AM1/18/13 9:47:39 AM

iii
ANNUAL INSURANCE MARKET PERFORMANCE REPORT For The Year Ended 31st December 2011
TIRA Consolidated Statement of Financial Position as at 30th June 2011 ................... 58TIRA Consolidated Statement of Comprehensive Income as at 30th June 2011 .............. 59TIRA Consolidated Cash Flow Statement as at 30th June 2011 ..................................... 60TIRA Consolidated Statement of Changes in Equity as at 30th June 2011 .................... 61Notes to the Financial Statements ................................................................................ 62STATISTICAL TABLES & CHARTS ......................................................................... 74
LIST OF EXHIBITS, STATISTICAL TABLES, AND CHARTS
LIST OF EXHIBITSExhibit No.
Exhibit Description Page No.
1 Selected Recent Historical Performance Indicators 83.1 Real & Nominal GDP Growth Rates for National and Finance
Intermediation Sector, 2007-201112
3.2 Real & Nominal GDP per Capita, 2006-2010 133.3 Insurance Market Growth Rate compared to GDP Growth, 2007-2011 143.4 Contribution of Insurance to GDP Growth, 2007-2011 143.5 Insurance Premium per Capita, 2007-2011 155.1 Summary of Insurance Companies Registration Position as at
31 December 201118
5.2 Summary of Insurance Intermediaries Registration Position as at 31 December 2011
19
6.1 General and Long Term Assurance Business as at 31 December 2011 206.2 Insurers Total Investment Assets Portfolio Distribution as at
31 December 201120
6.3 General and Long Term Assurance Investment Composition 207.1 General Insurance Business Class by Class Growth Rates 217.2 General Insurers Condensed Income Statement 227.3 General Insurance Financial Highlights 2007-2011 237.4 General Insurance – Trends of GPW, NP, and RP ceded to Reinsurers,
2007-201124
7.8 General Insurance Product Portfolio Mix 268.1.1 Long Term Assurance Business Class by Class Growth Rates 268.1.2 Long Term Assurance Condensed Income Statement 278.2 Long Term Assurance – Trend of Gross Premium Written, 2007-2011 288.6 Long Term Assurance Product Portfolio Mix 299.1 Tan-Re Condensed Balance Sheet and Income Statement as at
31 December 201129
9.2 Tan-Re Financial Highlights 2007-2011 3010 Brokers’ Participation in Insurance Underwriting in 2011 3010.1 Brokers’ Contribution in Each Class of General Insurance Business 3110.2 Brokers’ Contribution in Each Class of Life Assurance Business 32
TIRA 2011 ANNUAL REPORT.indd Sec1:iiiTIRA 2011 ANNUAL REPORT.indd Sec1:iii 1/18/13 9:47:39 AM1/18/13 9:47:39 AM

iv
ANNUAL INSURANCE MARKET PERFORMANCE REPORT For The Year Ended 31st December 2011
14 Relational Organogram of the Tanzania Insurance Regulatory Authority 4416.1 Organizational Structure of the Tanzania Insurance Regulatory Authority 46
LIST OF STATISTICAL TABLES
Table No.
Table Description Page No.
1 Registered Insurance Companies in Tanzania as at 31 December 2011 752A Registered Insurance Brokers in Tanzania as at 31 December 2011 762B Registered & Active Insurance Brokers in Tanzania as at 31 December 2011 803A Registered Insurance Agents in Tanzania as at 31 December 2011 843B Registered & Active Insurance Agents in Tanzania as at 31 December 2011 994A Registered Loss Assessors & Adjusters in Tanzania as at 31 December 2011 1064B Registered & Active Loss Assessors & Adjusters in Tanzania as at
31 December 2011108
5A General Insurance Gross Premiums Written by Insurance Companies in Tanzania as at 31 December 2011
110
5B Long Term Assurance Gross Premiums Written by Insurance Companies in Tanzania as at 31 December 2011
112
5C General Insurance Net Premiums Written by Insurance Companies in Tanzania as at 31 December 2011
113
6A General Insurance Companies’ Income Statement the Year Ended 31 December 2011
115
6B Life Assurance Companies’ Income Statement the Year Ended 31 December 2011
119
6C Insurer-by-Insurer General Insurance Financial Highlights and Ratio Analysis as at 31 December 2011
121
6D Class-by-Class General Insurance Financial Highlights and Ratio Analysis as at 31 December 2011
124
7A General Insurers’ Balance Sheet as at 31 December 2011 1257B Life Insurers’ Balance Sheet as at 31 December 2011 1277C Life and Non-Life Insurers’ Balance Sheet as at 31 December 2011 1298A General Insurance Business Through Brokers as at 31 December 2011 1318B Long Term Assurance Business Through Brokers as at 31 December 2011 135
LIST OF STATISTICAL CHARTSChart No.
Chart Description Page
1.1 2003-2011 Trends of Non-Life Insurance Gross Premiums Written by Tanzania Insurers by Class of Business
136
1.2 2003-2011 Trends of Volumes of Life and Non-Life Insurance Gross Premiums Written by Tanzania Insurers
137
TIRA 2011 ANNUAL REPORT.indd Sec1:ivTIRA 2011 ANNUAL REPORT.indd Sec1:iv 1/18/13 9:47:39 AM1/18/13 9:47:39 AM

v
ANNUAL INSURANCE MARKET PERFORMANCE REPORT For The Year Ended 31st December 2011
2 2007-2011 Trends of (General) Non-Life Insurance Portfolio Mix in the Tanzania Insurance Industry
138
3 2003-2011 Trends of General Insurance Net Premiums Earned & Net Claims Incurred by Tanzania Insurers
139
4 2003-2011 Development of Life Premiums and Claims 1405.1 2001-2011 State and Private Sectors Trend of Participation in
General Insurance Business141
5.2 2001-2011 State and Private Sectors Trend of Participation in Long Term Assurance Business
142
5.3 2001-2011 State and Private Sectors Consolidated Trend of Participation in General & Long Term Insurance Business
143
6.1 2009-2011 Trends of Tanzania General Insurers’ Assets, Liabilities, Net Worth & Technical Reserves
144
6.2 2009-2011 Trends of Tanzania Life Insurers’ Assets, Liabilities, Net Worth & Technical Reserves
145
7.1 2012-2014 Projection of General Insurance Gross Market Premiums Written in Tanzania
146
7.2 2012-2014 Projection of Long Term Assurance Gross Market Premiums Written in Tanzania
147
7.3 2012-2014 Projection of Consolidated Gross Market Premiums Written in Tanzania
148
TIRA 2011 ANNUAL REPORT.indd Sec1:vTIRA 2011 ANNUAL REPORT.indd Sec1:v 1/18/13 9:47:39 AM1/18/13 9:47:39 AM

vi
ANNUAL INSURANCE MARKET PERFORMANCE REPORT For The Year Ended 31st December 2011
MISSION STATEMENT
“To develop, promote and maintain an effi cient, fair, safe and stable insurance market for the benefi t and protection
of policy holders”.
TIRA 2011 ANNUAL REPORT.indd Sec1:viTIRA 2011 ANNUAL REPORT.indd Sec1:vi 1/18/13 9:47:39 AM1/18/13 9:47:39 AM

vii
ANNUAL INSURANCE MARKET PERFORMANCE REPORT For The Year Ended 31st December 2011
LIST OF ACRONYMS
AAISA : Association of African Insurance Supervisory AuthoritiesAAR : AAR Insurance Company LtdAfrican Life : African Life Assurance Company LtdAIO : African Insurance OrganizationAISADC : Association of Insurance Supervisory Authorities of Developing CountriesAIRDC : Association of Insurers and Reinsurers of Developing CountriesAlliance : Alliance Insurance Corporation LtdAML/CFT : Anti-Money Laundering and Combating the Financing of TerrorismATI : Association of Tanzania InsurersATIA : African Trade Insurance AgencyBoT : Bank of TanzaniaBumaco : Bumaco Insurance Company (T) LtdCARAMELS : Capital adequacy, Assets quality, Reinsurance, Actuarial provisions,
Management & Corporate governance, Earnings, Liquidity, and Subsidiaries (related parties)
CDD : Customer Due DiligenceCentury : Century Insurance Company LtdCISNA : Committee for Insurance, Securities, and Non-Bank Supervisory
AuthoritiesCoP : Certifi cate of Profi ciencyDSE : Dar Es Salaam Stock ExchangeEAISA : East Africa Insurance Supervisors AssociationFIDP II : Financial Institutions Development Programme Phase IIFirst : First Assurance Company LtdFIU : Financial Intelligence UnitFSP : Financial Sector Support ProjectGolden : Golden Crescent Insurance Company (T) LtdHeritage : Heritage AII Insurance Company (T) LtdIAIS : International Association of Insurance SupervisorsICT : Information Communication TechnologyIFM : Institute of Finance ManagementIGT : Insurance Group of TanzaniaLAN : Local Area NetworkTIRA : Tanzania Insurance Regulatory AuthorityJubilee : Jubilee Insurance Company Tanzania LtdKYC : Know Your CustomerLion : Lion of Tanzania Insurance Company LtdM1 (Narrow Money)
: Currency in circulation outside banks plus demand deposits of theTanzanian residents with deposit money banks
M2 (Broad Money)
: Narrow money (M1) plus time and savings deposits of the Tanzanian residents with deposit money banks
TIRA 2011 ANNUAL REPORT.indd Sec1:viiTIRA 2011 ANNUAL REPORT.indd Sec1:vii 1/18/13 9:47:39 AM1/18/13 9:47:39 AM

viii
ANNUAL INSURANCE MARKET PERFORMANCE REPORT For The Year Ended 31st December 2011
M3(Extended Broad Money)
: Broad money (M2) plus foreign currency deposits of the Tanzanian residents with deposit money banks
Maxinsure : Maxinsure Tanzania LtdMgen : Mgen Tanzania Insurance Company LtdMilembe : Milembe Insurance Company LtdMomentum : Momemntum Tanzania Insurance Co. LtdNBAA : National Board of Auditors and Accountants NIB : National Insurance BoardNIC : National Insurance Corporation of Tanzania LtdNIKO : NIKO Insurance Company LtdPABX : Private Automated Branch ExchangePhoenix : Phoenix of Tanzania Assurance Company LtdProsperity : Prosperity Assurance Company (T) LtdReliance : Reliance Insurance Company (T) LtdReal : Real Insurance Tanzania LtdStar : Star General Insurance Tanzania LtdStrategis : Strategis Insurance Tanzania LtdTan Re : Tanzania National Reinsurance Corporation LtdTanzindia : Tanzindia Insurance Company LtdTZS : Tanzanian ShillingsUPS : Uninterruptible Power SupplyUSAID : United States Agency for Internatinal DevelopmentVoIP : Voice over Internet ProtocalZIC : Zanzibar Insurance Corporation Ltd
TIRA 2011 ANNUAL REPORT.indd Sec1:viiiTIRA 2011 ANNUAL REPORT.indd Sec1:viii 1/18/13 9:47:39 AM1/18/13 9:47:39 AM

ix
ANNUAL INSURANCE MARKET PERFORMANCE REPORT For The Year Ended 31st December 2011
GLOSSARY
The following defi nitions have been extracted from Section 3 of the Insurance Act, 2009.
“actuary” means a person who is a member or fellow of an institute, faculty, society or association of actuaries approved by the Commissioner for the purposes of the Act;
“agent” means the same as “insurance agent” described in this Act;“agent for broker” means a person who transacts insurance business on behalf of a registered
insurance broker;“agent for insurer” means a person who transacts insurance business on behalf of a registered insurer
and shall have the same meaning as “insurance agent”“approved securities” means securities issued by the Government and the Bank of Tanzania and
any other securities or investments which the Commissioner may approve:“Bank of Tanzania” means the bank established under the Bank of Tanzania Act;“bankruptcy” and “insolvency” has the meaning assigned to it by the bankruptcy Act of the relevant
law applicable in Tanzania Zanzibar;“broker” means the same as “insurance broker” described in this Act;“chairman” in relation to an association of persons, includes the individual presiding over the board of
directors or other governing body of this association;“commissioner” means the Commissioner of Insurance appointed under Section 7;“companies Act” includes the companies decree of Zanzibar;contingent obligation dependent on a human life” meansan obligation to pay to a particular person certain sum of money or to provide for a particular
person certain other benefi ts on the occurrence of death of a particular person or the birth of a child to aparticular person any any time or within a specifi ed period or in the event of a particular person continuing to live throughout a specifi ed period; or an obligation assumed – until the death of a particular person; or during a specifi ed period or until the occurrence of the death of a particular person before the expiration of that period
“controller” in relation to an applicant for registration as an insurer of broker means -a Managing Director or Chief Executive of the applicant or of a body corporate of which the
applicant is a subsidiary; ora person in accordance with whose directions or instructions the directors of the applicant or of a
body corporate of which the applicant is a subsidiary are accustomed to act; ora person who either alone or with an associate or associates is entitled to exercise, or control the
exercise of one third or more of the votes any general meeting of the application or of any body corporate of which the applicant is a subsidiary;
“deposit” means a deposit of money or anything having a monetary value which by virtue of the regulations made under this Act may be accepted as a deposit;
“deposit administration policies” means a contract whereby –(a) an insurer maintains a fund to which -is credited all amounts paid by the insured to the fund, andis debited all amounts withdrawn from the fund to provide benefi ts in terms of the rules of the fund
and any administrative and other expenses agreed upon between the insured and the insurer from time to time; and
any investment income and capital profi ts or losses when are agreed upon between the insured and the insurer as being for the account of the fund; and
(b) the liability of the insurer to the insured, at any given time, as limited to the amount standing
TIRA 2011 ANNUAL REPORT.indd Sec1:ixTIRA 2011 ANNUAL REPORT.indd Sec1:ix 1/18/13 9:47:40 AM1/18/13 9:47:40 AM

x
ANNUAL INSURANCE MARKET PERFORMANCE REPORT For The Year Ended 31st December 2011
to the credit of the fund;“director” includes an individual occupying the position of director or alternate director of an association
or persons or a member or alternate member of a committee of management or of any other governing body of an association of person, by whatever name he may be called;
“fi nancial institution” means an entity engaged in the business of banking but limited to as to size, location served or permitted as prescribed by the bank or required by the terms and conditions of its license;
“fi nancial year” in relation to an insurer means each period of twelve months at the end of which the balance of the accounts is struck, and includes any lesser or greater periods which the Commissioner shall approve;
“general business” comprises the following classes: accident, sickness, land vehicles, railway rolling, aircraft, ships, goods in transit, fi re and natural forces, damage of property, motor vehicle liability, aircraft liability, liability for ships, general liability, credit, suretyship, miscellaneous, legal expenses, and assistance (as per Part B of the Second Schedule of the Insurance Act 2009);
“gross profi ts” means the chargeable income of the insurer as ascertained under Part II of the Income Tax Act;
“insurance agent” means a person who solicits applications for insurance, collects moneys by way of premium and acting in accordance with his agency agreement and may fi nd the registered insurer for who he acts in the issue of insurance cover and the term “agent” shall be prescribed accordingly;
“insurance broker” means a person, who acting with complete freedom as to their choice of undertaking and for commission or other compensation and not being an agent of the insurer, bring together, with a view to the insurance or reinsurance of risks, persons seeking insurance or reinsurance undertaking, carry out work preparatory to the conclusion of contracts of insurance or reinsurance, and, where appropriate, assist in the administration and performance of the contracts, in particular in the event of a claim;
“insurance business” means the business of assuming the obligation of an insurer in any class of insurance whether defi ned in this section or not, which is not declared to be exempt from the provisions of this Act in terms of section 2 and includes assurance and reinsurance and reassurance;
“insurance registrant” means a person registered to conduct insurance business under the Insurance Act;
“insurer” means a person carrying on an insurance business otherwise than as a broker or agent, and includes an association of underwriters who is not exempt from the provision of this Act in terms of Section 2;
“life insurance business” means the business of assuming the obligation of an insurer classifi ed under Section 51 as transacting long term business;
“life insurance fund” means the fund established under Section 90 to which the receipts of an insurer in respect of his life insurance business are carried;
“life policy” means any contract of insurance made or agreed to be made by an insurer classifi ed under long term business;
“long term business” is defi ned as meaning life and annuity business, marriage and birth business, linked long term business, and permanent health insurance business (as per Part A of the Second Schedule of the Insurance Act 2009);
“loss adjuster” means a natural person who possesses knowledge and skill to assess the accident and adjust compensation to the injured persons;
“loss assessors means a natural person who assesses accidents on behalf of the insurer;“management expenses” means expenses incurred in the administration of an insurer which are not
commission payable and, in the case of general insurance business, are not incurred in claims paid,
TIRA 2011 ANNUAL REPORT.indd Sec1:xTIRA 2011 ANNUAL REPORT.indd Sec1:x 1/18/13 9:47:40 AM1/18/13 9:47:40 AM

xi
ANNUAL INSURANCE MARKET PERFORMANCE REPORT For The Year Ended 31st December 2011
claims outstanding, expenses for settling claims and expenses for settling claims outstanding;“manager” in relation to an application for registration as an insurer or broker includes an employee
of the applicant (other than a controller), who, under the immediate authority of a director or chief executive of the applicant exercise managerial functions or is responsible for maintaining accounts or other records of the applicant not exclusively related to business conducted from a place of business outside Tanzania;
“minister” means the Minister responsible for Finance; “policy” includes every writing whereby any contract of insurance is made or agreed to be made;“prescribed” means by regulations made in accordance with the provisions of the Act;“principal offi cer” means the person responsible for the daily management of the principal offi ce in
Tanzania of the insurer or broker;“reinsurance” means the effecting of insurance business as between insurers;“stock insurance company” means an insurance company with permanent share capital owned and
controlled by its shareholders and includes a statutory corporation carrying on insurance business;“Tanzanian insurer” means an insurer incorporated and registered to transact business in Tanzania;‘the insured” means a person effecting a contract of insurance with an insurer;“trustee” in relation to an estate in insolvency, includes an assignee or, as the case may be, a trustee in a
deed of arrangement of the person having the conduct of an order of composition;“underwriter” includes any person named in a policy or other contract of insurance as liable to pay or
contribute towards the payment of the sum secured by the policy or contract;“underwriter’s liabilities” in relation to a member of association of underwriters, means the liabilities
of the insurance business of the member calculated in accordance with formulae fi xed by the responsible body vested with the administration of the relevant insurance law.
TIRA 2011 ANNUAL REPORT.indd Sec1:xiTIRA 2011 ANNUAL REPORT.indd Sec1:xi 1/18/13 9:47:40 AM1/18/13 9:47:40 AM

xii
ANNUAL INSURANCE MARKET PERFORMANCE REPORT For The Year Ended 31st December 2011
TIRA 2011 ANNUAL REPORT.indd Sec1:xiiTIRA 2011 ANNUAL REPORT.indd Sec1:xii 1/18/13 9:47:40 AM1/18/13 9:47:40 AM

1
ANNUAL INSURANCE MARKET PERFORMANCE REPORT For The Year Ended 31st December 2011
LETTER OF TRANSMITTAL
Tanzania Insurance Regulatory Authority TIRA Building Block 33, Plot No. 85/2115 Mtendeni Street P. O. Box 9892 Dar es Salaam Tanzania 31st August 2012
Honourable Dr. William A. Mgimwa (MP)Minister for Finance P. O. Box 9111Dar es Salaam
Dear Sir,
I have the honour to submit the 14th Annual Insurance Market Performance Report for the year ended 31st December 2011.
I trust you will fi nd this report satisfactory and useful.
Yours faithfully
Israel L. KamuzoraCommissioner of Insurance
TIRA 2011 ANNUAL REPORT.indd Sec2:1TIRA 2011 ANNUAL REPORT.indd Sec2:1 1/18/13 9:47:40 AM1/18/13 9:47:40 AM

2
ANNUAL INSURANCE MARKET PERFORMANCE REPORT For The Year Ended 31st December 2011
ACKNOWLEDGEMENT
I wish to record my appreciation to the National Insurance Board for the guidance it accorded to the Tanzania Insurance Regulatory Authority (TIRA). The cooperation received by the Authority from insurers, brokers, agents and Insurance Institute of Tanzania in particular and the Ministry of Finance in general, is highly appreciated. I am pleased, therefore, to introduce the Tanzania Insurance Market Performance Report for the year 2011.
Israel L. KamuzoraCommissioner of Insurance
TIRA 2011 ANNUAL REPORT.indd Sec2:2TIRA 2011 ANNUAL REPORT.indd Sec2:2 1/18/13 9:47:40 AM1/18/13 9:47:40 AM

3
ANNUAL INSURANCE MARKET PERFORMANCE REPORT For The Year Ended 31st December 2011
MEMBERS OF THE NATIONAL INSURANCE BOARD
Prof. G. M. FimboChairman
Dr. R. S. MlingaVice Chairman
Hon. Z.M. Mhita (MP)Member
Mr H. Masebu Member
Mr P. A. Ilomo Member
Hon. M. A. Msomi (MP)Member
Mr O. H. OmarMember
TIRA 2011 ANNUAL REPORT.indd Sec2:3TIRA 2011 ANNUAL REPORT.indd Sec2:3 1/18/13 9:47:40 AM1/18/13 9:47:40 AM

4
ANNUAL INSURANCE MARKET PERFORMANCE REPORT For The Year Ended 31st December 2011
MANAGEMENT OF THE TANZANIA INSURANCE REGULATORY AUTHORITY
Mr I. L. KamuzoraCommissioner of Insurance
Mr J. J. MakameDeputy Commissioner of Insurance
Mr P. NgwembeDirector – Legal Services/ Secretary NIB
Ms A. MuganyiziDirector
Market Development
Mrs M. IkongoActing Director
Technical Services
Mr S. E. MwiruDirector – Surveillance & Research
Ms M. RobertDirector – Finance & Administration
TIRA 2011 ANNUAL REPORT.indd Sec2:4TIRA 2011 ANNUAL REPORT.indd Sec2:4 1/18/13 9:47:42 AM1/18/13 9:47:42 AM

5
ANNUAL INSURANCE MARKET PERFORMANCE REPORT For The Year Ended 31st December 2011
PART 1:
The Annual Insurance Market Performance Reportfor the Year Ended 31st December 2011
TIRA 2011 ANNUAL REPORT.indd Sec2:5TIRA 2011 ANNUAL REPORT.indd Sec2:5 1/18/13 9:47:43 AM1/18/13 9:47:43 AM

6
ANNUAL INSURANCE MARKET PERFORMANCE REPORT For The Year Ended 31st December 2011
PREAMBLE
During the year ended 31st December 2011, the Tanzania insurance industry continued to play its strategic role within the national economy by providing the national underwriting capacity and contributing towards mobilization of fi nancial resources for sustainable economic development of the country.
This report outlines the performance of the industry during the calendar year ended 31st December 2011 and fi nancial results of TIRA for the fi scal year ended 30th June 2011. The report is organized into a number of parts, as follows –
(i) Statement of the Chairman of the National Insurance Board: presents a summary of key industry performance indicators during the year under review.
(ii) Report of the Commissioner of Insurance for the year ended 31st December 2011: provides detailed information on the performance of the industry, and covers seventeen (17) Sections as outlined hereunder:
(a) Section 1: gives the offi cial defi nition of insurance business as stipulated in the Insurance Act 2009.
(b) Section 2: provides historical review on the objectives of the Government’s decision to
liberalize the insurance market in the country.
(c) Section 3: presents an overview on the impact of the economy to the insurance industry during the year under review including insurance penetration and insurance density.
(d) Section 4: outlines the various challenges which the industry faced in 2011 and efforts that were made to address them.
(e) Section 5: summarizes the status of registration of insurance players during the year under review.
(f ) Section 6: presents the performance of the General and Life insurance businesses in terms of sales (premiums underwritten), net worth (assets & liabilities), and investment placements.
(g) Section 7: presents an overview on the performance of the General insurance business
during the year under review in terms of underwriting, claims experience, management expenses, and product portfolio mix.
(h) Section 8: presents an overview on the performance of the Long Term Assurance business in 2011 in terms of underwriting, claims/ benefi ts payments, management expenses, fund position, and product portfolio mix.
(i) Section 9: presents an overview on the performance of Tan Re during the year under review;
TIRA 2011 ANNUAL REPORT.indd Sec2:6TIRA 2011 ANNUAL REPORT.indd Sec2:6 1/18/13 9:47:43 AM1/18/13 9:47:43 AM
7
ANNUAL INSURANCE MARKET PERFORMANCE REPORT For The Year Ended 31st December 2011
(j) Section 10: presents an overview on the performance of insurance brokers in terms of volumes of business transacted with insurance companies.
(k) Section 11: outlines key insurance industry regulatory activities performed during the year under review including: insurance legislation review; off-site and on-site inspections of insurance companies; and consumer complaints handling.
(l) Section 12: outlines the status of implementation of selected insurance industry development initiatives in 2011 including establishment of TIRA zonal offi ces, consumer education and capacity building initiatives.
(m) Section 13: reports on implemented research activities during the year under review as well as the planned ones.
(n) Section 14: summarizes the operations of the National Insurance Board during the year under review.
(o) Section 15: reports on matters related to enactment of the Insurance Legislation in force.
(p) Section 16: reports on matters relating to organization and fi nancial results of TIRA for the fi nancial year ended 30th June 2011.
(q) Section 17: outlines the status of offi cial relationship between TIRA and other related international organizations, in terms of membership to such organizations and the extent to which TIRA contributed to development of those organizations during 2011.
Detailed information is provided in the main report. Exhibit 1 below provides a summary of selected historical industry performance indicators for the last fi ve years.
From an underwriting perspective, general insurers’ profi tability showed a deteriorating trend during the last fi ve years suggesting a need for a review of underwriting practices in the market. However, the overall profi tability (incorporating investment returns) has consistently improved during the period under review, suggesting presence of adequate investment opportunities for insurers in the market. On the long term assurance side, the industry has recorded satisfactory growth in business volume and life fund during the last fi ve years.
TIRA 2011 ANNUAL REPORT.indd Sec2:7TIRA 2011 ANNUAL REPORT.indd Sec2:7 1/18/13 9:47:43 AM1/18/13 9:47:43 AM

8
ANNUAL INSURANCE MARKET PERFORMANCE REPORT For The Year Ended 31st December 2011
Exhibit 1: Selected Recent Historical Performance Indicators
General Insurance
2007 2008 2009 2010 2011
Underwriting Result (TZS M) 2,748 1,582 1,265 (2,043) (8,348)
Net Profi t After Tax (TZS M) 177 9,857 10,173 6,962 14,075
Premium Growth 29% 21% 27% 22% 21%
Loss Ratio (Net) 51% 52% 55% 59% 58%
Expense Ratio (Net) 44% 46% 44% 43% 48%
Combined Ratio 95% 98% 99% 102% 106%
Long Term Assurance
2007 2008 2009 2010 2011
Life Fund Growth 8% 35% 4% 4% 11%
Premium Growth 81% 81% -18% 44% 16%
Claims/Benefi ts Ratio 61% 29% 52% 52% 41%
Expense Ratio 28% 28% 28% 28% 31%
Year End Funds Position (TZS M) 33,993.3 55,358.9 57,333.1 59,552.0 65,989.0
TIRA 2011 ANNUAL REPORT.indd Sec2:8TIRA 2011 ANNUAL REPORT.indd Sec2:8 1/18/13 9:47:43 AM1/18/13 9:47:43 AM

9
ANNUAL INSURANCE MARKET PERFORMANCE REPORT For The Year Ended 31st December 2011
STATEMENT OF THE CHAIRMAN OF THE NATIONAL INSURANCE BOARD
On behalf of the National Insurance Board, I am pleased to give a brief overview of the performance of the Tanzania insurance market during the year ending 31 December 2011. The market performed satisfactorily with regard to market growth, profi tability, assets portfolio, investments, and product mix. The Tanzania insurance sector remained resilient in 2011 despite the challenges experienced in the global and local economy.
During the year under review, the Tanzania insurance industry had a total of 26 insurance companies (including 1 reinsurance company), 89 insurance brokers, 572 insurance agents and 47 loss assessors & adjusters.
The market grew by 20 percent in gross premiums written compared to the previous year’s performance. The market growth was higher than the growth of the national nominal GDP and higher than the growth of the nominal fi nancial intermediation sector GDP during the period under review. This performance is in excess of the set target of 18 percent annual premium growth for the industry. However, in the same period, real GDP growth was 6.8 percent. The industry’s contribution to the national GDP was 0.89 percent, compared to a contribution of 0.86 percent in 2010.
General insurance business showed a growth of 21 percent in gross premium income from TZS 256 billion during 2010 to TZS 308 billion during the year under review. The growth in General insurance business was mainly driven by signifi cant growths recorded in the “Other General” and Accident classes of business which grew by 58 percent and 40 percent, respectively, during the year under review.
General Insurance Net Loss Ratio slightly improved to 58 percent compared to 59 percent during previous year. Gross claims paid increased by 4 percent to TZS 125.5 billion during 2011, compared to claims of TZS 120.3 billion paid in 2010. After including reinsurance claims recoveries, net claims paid by local insurers amounted to TZS 74.4 billion being 15 percent higher compared to net claims of TZS 64.9 billion paid in previous year.
The general insurance underwriting result deteriorated to an underwriting loss of TZS 8.3 billion compared to previous year’s loss of TZS 2.0 billion. Health class of business had the poorest underwriting result having incurred a loss of TZS 4.4 billion, followed by Motor (TZS 4.1 billion), Aviation (TZS 1.8 billion), Fire (TZS 0.6 billion), Other General (TZS 0.5 billion), and Marine (TZS 0.2 billion). Engineering and Accident classes of business recorded underwriting profi ts at TZS 2.5 billion and TZS 0.7 billion, respectively. However, on incorporation of income from investments and deducting appropriate taxes, the insurers ended up with a positive Net Income after Tax totaling TZS 14.1 billion, having improved by 102 percent compared to a Net Income after Tax of TZS 7.0 billion recorded previous year.
As at the end of the underwriting year 2011, total assets of insurers had increased by 17 percent to TZS 416.1 billion from TZS 355.7 billion of the previous year. Total insurers’ investments increased by 15 percent from TZS 254.7 billion in 2010 to TZS 291.9 billion in 2011. The largest share of insurers’ investment assets comprised Bank Deposits (44.0 percent), followed by Real Estate investments (22.5 percent), Government Securities (13.1 percent), Investments in Related Parties (9.1 percent), Shares (8.1%), and Other Financial Investments (3.2 percent), in that order.
TIRA 2011 ANNUAL REPORT.indd Sec2:9TIRA 2011 ANNUAL REPORT.indd Sec2:9 1/18/13 9:47:43 AM1/18/13 9:47:43 AM

10
ANNUAL INSURANCE MARKET PERFORMANCE REPORT For The Year Ended 31st December 2011
General Insurance product mix in the year 2011 shows a stable share of Motor insurance business at 31 percent. This is followed by Fire 18 percent, Health 18 percent and Accident 15 percent. Other classes shared less than 6 percent each of total General insurance business.
The ratio of Management Expenses to Gross Premiums slightly increased to 20 percent in 2011 compared to 19 percent of previous year, being within the internationally recommendable norm of 20 percent. Meanwhile, the ratio of Management Expenses to Net Premiums deteriorated to 42 percent in 2011 compared to 40 percent in 2010. The ratio was on the high side compared to 30 percent which is recommended.
The ratio of reinsurance premiums ceded to gross premiums written remained at 51 percent during the last three years. The country continued to experience unfavourable Net Reinsurance Infl ows during the year under review. Net Reinsurance Outfl ows represented 24 percent of gross premiums written in 2011 compared to the ratio of 19 percent of previous year
Life assurance business volume increased by 16.2 percent from TZS 31.2 billion during 2010 to TZS 36.3 billion during 2011. Three (3) out of the fi ve (5) insurers which transacted life assurance business in 2011 experienced expansion of business portfolio. These were namely; African Life Assurance Company Ltd, Alliance Life Insurance Corporation Ltd, and Jubilee Insurance Company (T) Limited. On a class-by-class basis, the most signifi cant growth driver of life business was Group Life assurance which increased by 35 percent during the period under review.
The industry Life funds increased by 10.8 percent to TZS 66.0 billion at end of 2011 compared to TZS 59.6 billion as at end of prior year.
Out of the total insurance premiums written during 2011 in respect of both long – term and general insurance businesses (TZS 344.7 billion), 62.0 percent of this amount was transacted through brokers.
TIRA will continue allocating substantial resources to supervision of the broking industry to enhance compliance, as well as to facilitate strategies for further development of brokers into a more vibrant and effi cient intermediary force.
I wish to record my appreciation to the Minister for Finance for the support TIRA continues to enjoy from the Ministry in our efforts of building a sound insurance regulatory environment in Tanzania. TIRA confi dently looks forward to further enhancing the supervision and regulation of the Tanzania insurance industry.
I would like to acknowledge the commitment of TIRA management, staff and members of the National Insurance Board in pursuing the objectives of Insurance liberalization and their readiness to meet the signifi cant challenges that lie ahead. I also wish to thank the Boards of Directors, Management, and Staff of all insurance companies, intermediaries, and service providers for their cooperation and continued support extended to TIRA in its role of supervision and regulation of the Tanzania insurance industry.
________________________Professor Gamaliel Mgongo FimboChairman National Insurance Board
TIRA 2011 ANNUAL REPORT.indd Sec2:10TIRA 2011 ANNUAL REPORT.indd Sec2:10 1/18/13 9:47:43 AM1/18/13 9:47:43 AM

11
ANNUAL INSURANCE MARKET PERFORMANCE REPORT For The Year Ended 31st December 2011
REPORT OF THE COMMISSIONER OF INSURANCEFOR THE YEAR ENDING 31ST DECEMBER 2011
This report presents a review of performance of Tanzania’s insurance industry for the year ended 31st December 2011.
1. INSURANCE BUSINESS
Insurance business is defi ned under the Insurance Act 2009 as the business of assuming the obligation of an insurer in any class of insurance whether defi ned in the Act or not, which is not declared to be exempt from the provisions of the Act in terms of Section 2 and includes assurance and reinsurance and reassurance.
Insurance business is divided into two main classes, namely:i. General Insurance Business
ii. Long Term Assurance Business
General Insurance business comprises the following classes: accident, sickness, land vehicles, railway rolling, aircraft, ships, goods in transit, fi re and natural forces, damage of property, motor vehicle liability, aircraft liability, liability for ships, general liability, credit, suretyship, miscellaneous, legal expenses, and assistance (as per Part B of the Second Schedule of the Insurance Act 2009).
Long Term Assurance business is defi ned as meaning life and annuity business, marriage and birth business, linked long term business, and permanent health insurance business (as per Part A of the Second Schedule of the Insurance Act 2009).
2. OBJECTIVES OF LIBERALIZATION OF INSURANCE BUSINESS
Tanzania’s insurance industry has completed its thirteenth year of operations under liberalized environment. Liberalization of the insurance industry seeks to achieve a number of objectives:
i. Transforming the insurance industry into a sound and competitive agent for national savings mobilization and development investment channeling.
ii. Promoting insurance sector as an effective catalyst for enhanced economic growth
iii. Strengthening and promoting the industry health and orderly growth through establishment of operating performance standards and prescriptions.
iv. Exempting the industry from undue interferences.
v. Developing effi cient, cost effective, comprehensive and customer driven insurance services.
TIRA 2011 ANNUAL REPORT.indd Sec2:11TIRA 2011 ANNUAL REPORT.indd Sec2:11 1/18/13 9:47:43 AM1/18/13 9:47:43 AM

12
ANNUAL INSURANCE MARKET PERFORMANCE REPORT For The Year Ended 31st December 2011
3. ECONOMIC IMPACT ON THE INSURANCE INDUSTRY
Tanzania’s economy during the year under review was characterized by a number of factors, including changes in GDP growth, per capita income, money supply, interest rates trends, fi nancial markets performance, commercial banks lending, and government fi nance. These factors affected all sectors of the economy, insurance inclusive.
3.1 GDP Growth
The national GDP in real terms grew at a rate of 6.8 percent to TZS 18,325 billion in 2011 from TZS 17,214 billion in 2010. This compares to a growth of 7.0 percent realized in 2010.
However, the GDP at current prices (nominal GDP) grew by 16.5 percent to TZS 38,731 billion in 2011 compared to TZS 33,242 billion in 2010.
Meanwhile, the Financial Intermediation Sector GDP in real terms grew by 10.6 percent to TZS 381 billion in 2011 from TZS 345 billion in 2010. On nominal terms, the Sector GDP at current prices grew by 17.4 percent to TZS 690 billion in 2010 compared to TZS 588 billion in 2010. Exhibit 3.1 below highlights on real and nominal GDP growth rates recorded in the country in respect of its national economy as well as the fi nance intermediation sector (to which insurance industry belongs) during the years 2007-2011.
Source: BoT Quarterly Economic Bulletins 2007-2011 & TIRA computations.
TIRA 2011 ANNUAL REPORT.indd Sec2:12TIRA 2011 ANNUAL REPORT.indd Sec2:12 1/18/13 9:47:43 AM1/18/13 9:47:43 AM

13
ANNUAL INSURANCE MARKET PERFORMANCE REPORT For The Year Ended 31st December 2011
3.2 GDP Per Capita The national GDP per capita in real terms grew by 3.2 percent to TZS 412,257 in 2011 from TZS 399,292 in 2010. However, the nominal GDP per capita grew by 13.0 percent to TZS 871,340 in 2011 compared to TZS 771,101 in 2010.
Exhibit 3.2 below presents trends of real and nominal GDP per capita recorded in Tanzania during the years 2007-2011.
Source: BoT Quarterly Economic Bulletins, 2007-2011, & TIRA computations.
3.3 Insurance Market Growth
The Tanzania insurance industry grew by 20.0 percent to TZS 344.7 billion in 2011 from TZS 287.0 billion in 2010. Meanwhile, the national GDP and the fi nance intermediation sector GDP in nominal terms grew by 15.9 percent and 17.5 percent, respectively, between 2010 and 2011.
The insurance industry has continued to attain a higher growth rate than the national and the fi nance intermediation sector GDP over the period under review.
Exhibit 3.3 below shows how growth of the Tanzania insurance market compares to growths of national GDP and fi nance intermediation sector growth rates during the years 2007-2011.
TIRA 2011 ANNUAL REPORT.indd Sec2:13TIRA 2011 ANNUAL REPORT.indd Sec2:13 1/18/13 9:47:43 AM1/18/13 9:47:43 AM

14
ANNUAL INSURANCE MARKET PERFORMANCE REPORT For The Year Ended 31st December 2011
Source: Insurers’ Audited Annual Returns; BoT Quarterly Economic Bulletins, 2007-2011; TIRA computations.
3.4 Insurance Penetration
Tanzania insurance penetration (premiums as a percentage of GDP) increased from 0.86 percent in 2010 to 0.89 percent in 2011.
Exhibit 3.4 below shows contribution of insurance to national GDP over fi ve years’ period, 2006-2011.
Source: Insurers’ Audited Annual Returns; BoT Quarterly Economic Bulletins, 2006-2011; TIRA computations.
TIRA 2011 ANNUAL REPORT.indd Sec2:14TIRA 2011 ANNUAL REPORT.indd Sec2:14 1/18/13 9:47:44 AM1/18/13 9:47:44 AM
15
ANNUAL INSURANCE MARKET PERFORMANCE REPORT For The Year Ended 31st December 2011
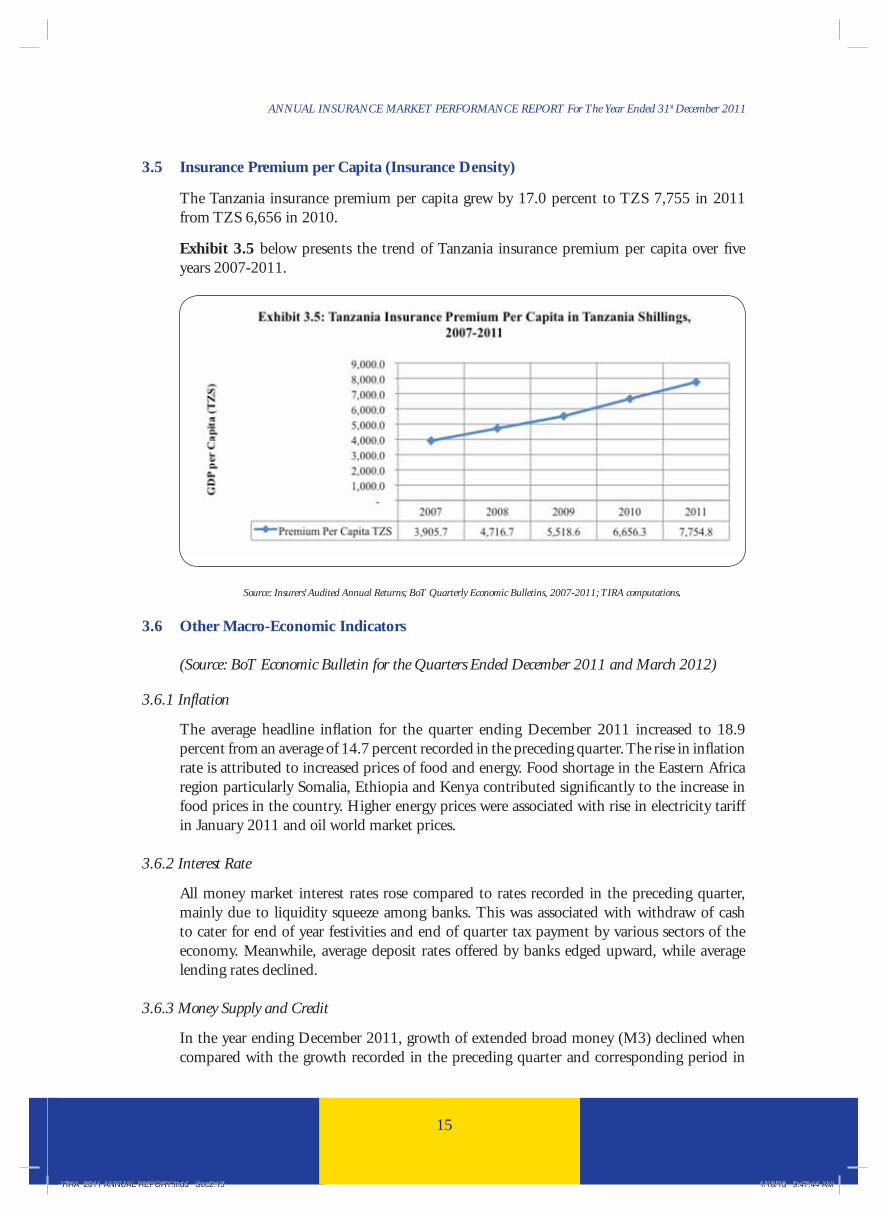
3.5 Insurance Premium per Capita (Insurance Density)
The Tanzania insurance premium per capita grew by 17.0 percent to TZS 7,755 in 2011 from TZS 6,656 in 2010.
Exhibit 3.5 below presents the trend of Tanzania insurance premium per capita over fi ve years 2007-2011.
Source: Insurers’ Audited Annual Returns; BoT Quarterly Economic Bulletins, 2007-2011; TIRA computations.
3.6 Other Macro-Economic Indicators
(Source: BoT Economic Bulletin for the Quarters Ended December 2011 and March 2012)
3.6.1 Infl ation
The average headline infl ation for the quarter ending December 2011 increased to 18.9 percent from an average of 14.7 percent recorded in the preceding quarter. The rise in infl ation rate is attributed to increased prices of food and energy. Food shortage in the Eastern Africa region particularly Somalia, Ethiopia and Kenya contributed signifi cantly to the increase in food prices in the country. Higher energy prices were associated with rise in electricity tariff in January 2011 and oil world market prices.
3.6.2 Interest Rate
All money market interest rates rose compared to rates recorded in the preceding quarter, mainly due to liquidity squeeze among banks. This was associated with withdraw of cash to cater for end of year festivities and end of quarter tax payment by various sectors of the economy. Meanwhile, average deposit rates offered by banks edged upward, while average lending rates declined.
3.6.3 Money Supply and Credit
In the year ending December 2011, growth of extended broad money (M3) declined when compared with the growth recorded in the preceding quarter and corresponding period in
TIRA 2011 ANNUAL REPORT.indd Sec2:15TIRA 2011 ANNUAL REPORT.indd Sec2:15 1/18/13 9:47:44 AM1/18/13 9:47:44 AM

16
ANNUAL INSURANCE MARKET PERFORMANCE REPORT For The Year Ended 31st December 2011
2010. This development was mainly due to deceleration in the growth of net foreign assets (NFA) and net government borrowing from the banking system. Likewise, annual growth of credit to the private sector declined to 27.2 percent compared to 29.4 percent recorded in September 2011.
Credit to building and construction, trade and personal activities recorded the fastest growth in December 2011, whilst credit to manufacturing, agriculture, and transport and communication activities declined.
Meanwhile, personal loans continued to dominate accounting for 20.8 percent of total credit to the private sector, followed by trade, manufacturing, and agriculture activities. In terms of composition of money, foreign currency deposit (FCD) and non-transferable deposits had the largest percentage share to M3.
3.6.4 Public Finance
During the quarter ending December 2011, total government revenue amounted to TZS 2,565.3 billion, out of which TZS 1,737.7 billion was domestic revenue, which was in line with the target. Good performance was recorded in all tax categories, while non-tax was 37.0 percent below the target.
The performance in tax collection was attributed to improvement in overall tax administration through sensitization of tax payers, close monitoring of block management system and the use of electronic fi scal devices. Grants disbursed amounted to TZS 827.6 billion against the projection of TZS 1,139.1 billion, primarily due to delays in disbursement of project funds
3.6.5 Exchange Rate
Tanzanian shilling depreciated to a weighted average of TZS 1,646.4 per USD during the quarter ending December 2011 from TZS 1,613.4 per USD recorded in the quarter ending September 2011.
3.7 An Assessment of Economic Impact on the Insurance Industry during 2011 and Future Prospects for Growth
The country’s GDP has continued to record a satisfactory growth level in 2011. Real GDP growth in 2011 was 6.8 percent. The 2011 growth was slightly lower than prior year’s growth of 7.0 percent. The satisfactory economic growth levels continue to create economic opportunities for businesses and households leading to higher demand for insurance products. The insurance market grew by 20.0 percent in 2011, which is higher than the growth of the national economy and that of the fi nancial intermediation sector. The industry’s contribution to GDP and insurance premium per capita has also shown consistent growth over the past fi ve years.
Movements in infl ation rates affect insurance business in a number of ways. High infl ation rate tends to decrease the real value of benefi ts that accrue to policyholders. The fall in the real value of benefi ts arising from infl ation pressure will dissuade existing and potential insurance clients from purchasing life assurance covers, thus affecting life assurance sales. Also, during
TIRA 2011 ANNUAL REPORT.indd Sec2:16TIRA 2011 ANNUAL REPORT.indd Sec2:16 1/18/13 9:47:45 AM1/18/13 9:47:45 AM

17
ANNUAL INSURANCE MARKET PERFORMANCE REPORT For The Year Ended 31st December 2011
high infl ation periods, management expenses together with claim values tend to be infl ated thus pushing high a combined ratio of the market. Therefore, the lower the infl ation rates, the more conducive the environment for insurance business to thrive. The country’s infl ation rate appeared to have deteriorated during the year under review compared to the prior year. Some improvement in the infl ation rate is anticipated in 2012/2013 thus contributing to a further growth of the insurance business.
Interest rates movements are a major determinant of the profi tability of insurance companies operations. Insurance funds that are amassed by insurers as insurance premiums must be invested in profi table ventures including in money markets to obtain a fi nancial return that is suffi cient to support the business operations of insurance companies and provide a return to shareholders. Healthy interest rates are vital for profi table business operations and general sustainability of insurance business in the country.
The industry is projected to grow at a rate of 19 percent in the next year (see Appended Chart 7.3).
4. CHALLENGES FACING THE INDUSTRY AND MEASURES BEING TAKEN BY THE AUTHORITY TO ADDRESS THEM
Challenges were faced at the levels of the industry and the regulatory authority during the year under review. Industry-level challenges included:
i. Inadequate paid up capital due to continued weakening of the Tanzania shilling against strong currencies;
ii. Delay in adopting new distribution methods such as banc assurance due to challenges yet to be addressed by cross-sectoral fi nancial institution regulators;
iii. Lack of facilities in the country for training professionals in the fi elds that have direct bearing to the development of the industry denies Tanzanians an opportunity of managing insurance business;
iv. Government’s delay in adopting a policy on insurance of its properties.
Meanwhile, challenges faced at the level of the regulatory authority included:
i. Acute shortage of skilled staff required for regulation and supervision of the insurance industry; and
ii. Lack of an insurance supervision software required for streamlining of certain insurance supervisory processes.
The Authority continues to take measures to address these challenges, as well as other matters of strategic importance to the industry. Some of these measures are as follows:i. Continuing with implementation of an internationally recommended approach to
supervision namely, Risk Based Supervision (RBS) monitoring framework in place of the old compliance-based supervision system;
TIRA 2011 ANNUAL REPORT.indd Sec2:17TIRA 2011 ANNUAL REPORT.indd Sec2:17 1/18/13 9:47:45 AM1/18/13 9:47:45 AM
18
ANNUAL INSURANCE MARKET PERFORMANCE REPORT For The Year Ended 31st December 2011
ii. Collaborating with Bank of Tanzania with a view to formulating regulations for conducting Banc assurance;
iii. Continuing with a campaign of awareness creation to sensitize the general public (including the Government) on the need to insure property and life against risks;
iv. Consolidating collaborative efforts with key stakeholders to secure availability of training facilities for training of professionals in the fi elds that have direct bearing to the development of the insurance industry;
v. Embarking on a process for identifi cation and acquisition of an appropriate insurance supervision software.
REGISTRATION DURING 2011
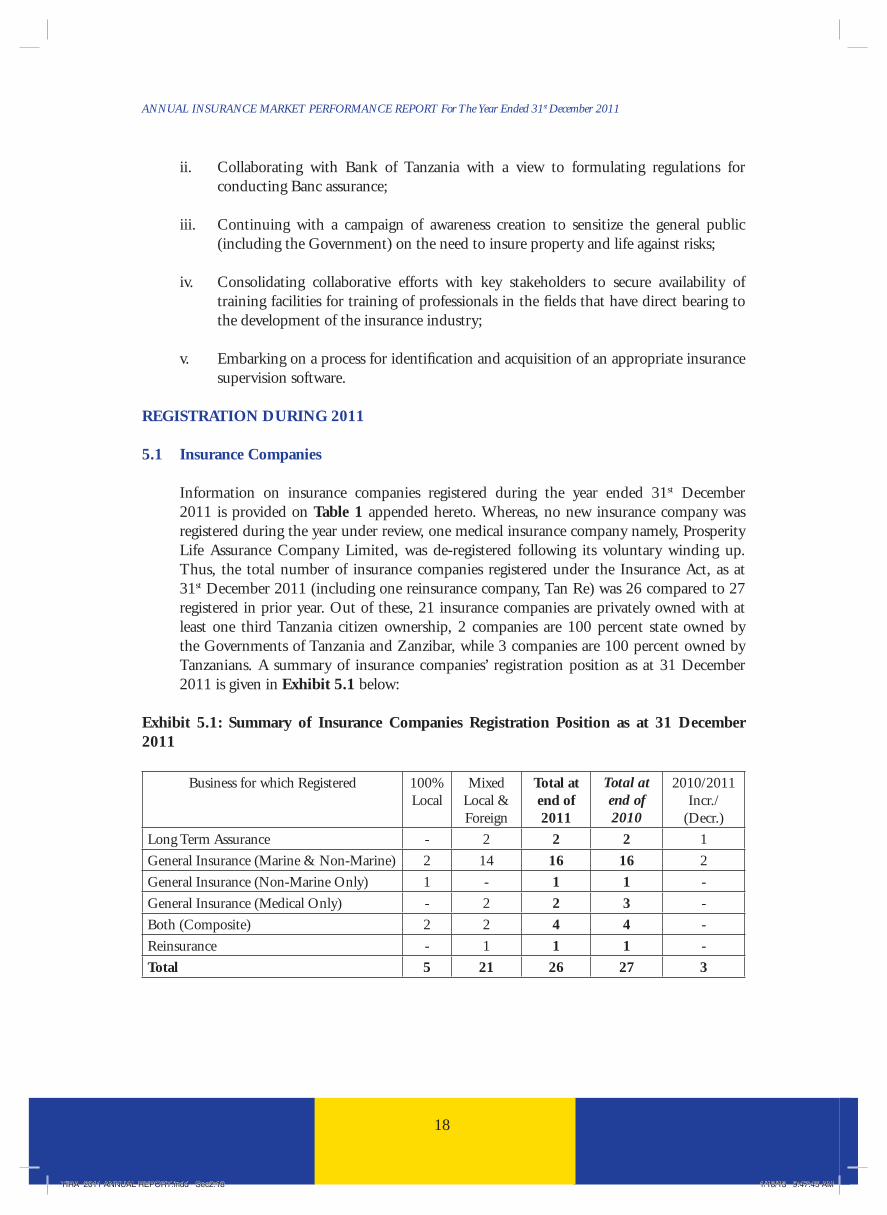
5.1 Insurance Companies
Information on insurance companies registered during the year ended 31st December 2011 is provided on Table 1 appended hereto. Whereas, no new insurance company was registered during the year under review, one medical insurance company namely, Prosperity Life Assurance Company Limited, was de-registered following its voluntary winding up. Thus, the total number of insurance companies registered under the Insurance Act, as at 31st December 2011 (including one reinsurance company, Tan Re) was 26 compared to 27 registered in prior year. Out of these, 21 insurance companies are privately owned with at least one third Tanzania citizen ownership, 2 companies are 100 percent state owned by the Governments of Tanzania and Zanzibar, while 3 companies are 100 percent owned by Tanzanians. A summary of insurance companies’ registration position as at 31 December 2011 is given in Exhibit 5.1 below:
Exhibit 5.1: Summary of Insurance Companies Registration Position as at 31 December 2011
Business for which Registered 100% Local
Mixed Local & Foreign
Total at end of 2011
Total at end of 2010
2010/2011 Incr./
(Decr.)
Long Term Assurance - 2 2 2 1
General Insurance (Marine & Non-Marine) 2 14 16 16 2
General Insurance (Non-Marine Only) 1 - 1 1 -
General Insurance (Medical Only) - 2 2 3 -
Both (Composite) 2 2 4 4 -
Reinsurance - 1 1 1 -
Total 5 21 26 27 3
TIRA 2011 ANNUAL REPORT.indd Sec2:18TIRA 2011 ANNUAL REPORT.indd Sec2:18 1/18/13 9:47:45 AM1/18/13 9:47:45 AM

19
ANNUAL INSURANCE MARKET PERFORMANCE REPORT For The Year Ended 31st December 2011
5.2 Insurance Intermediaries and Other Service Providers
Insurance BrokersThe total number of registered brokers as at 31st December 2011 was 89 compared to 75 as at end of previous year (see Table 2A – appended). A total of 86 brokers were active during the year in terms of having renewed their licenses for year 2011 (see Table 2B – appended), while, a total of 14 new brokers were registered during 2011.
Insurance AgentsFifty two (52) new agents were registered during the year 2011, bringing the total insurance agency force as at 31 December 2011 to 572 compared to 520 as at end of previous year (see Table 3A – appended). However, only 254 agents were active during the year under review in terms of having renewed their licenses for year 2011 (see Table 3B – appended).
Loss Adjusters/ AssessorsThe number of registered Loss Adjusters/Assessors as at 31st December 2011 was 47 compared to 43 registered as by end of 2010 (see Table 4A – appended). Forty (40) Loss Assessors/Adjusters were active during the year under review in terms of having renewed their licenses for year 2011 (see Table 4B – appended).
Exhibit 5.2 below gives a summary on the number of Insurance Agents, Insurance Brokers and Loss Adjusters/Assessors registered under the Act as at 31st December 2011.
Exhibit 5.2: Summary of Insurance Intermediaries Registration Position as at 31 Dec 2011
Type of Intermediary/ Service Provider
Active* in 2011
Inactive in 2011
Total Reg. in 2011
Total Reg. in 2010
2010/2011 Incr./ (Decr.)
Insurance Agents 254 318 572 520 52 Insurance Brokers 86 3 89 75 14 Loss Adjusters/ Assessors 40 7 47 43 4 Total 381 327 708 638 70 *Active means those which renewed registration license for year under review
6. GENERAL & LONG TERM BUSINESS PERFORMANCE HIGHLIGHTS
Total volume of business, in terms of Gross Premiums Written for both General and Life Assurance businesses, increased by 20 percent from TZS 287.0 billion in 2010 to TZS 344.7 billion in 2011. This increase is consistent with the industry’s projected growth of 20 percent. Meanwhile, Insurers’ net worth increased by 18 percent to TZS 126.9 billion at end of 2011 compared to TZS 107.9 billion at end of prior year. Insurers’ consolidated assets increased by 17 percent while liabilities also increased by 17 percent between the periods (see Table 7C – appended).
Exhibit 6.1 below highlights on the performance of the General and Long Term businesses on consolidated basis, in terms of Gross Premiums Written, Assets, Liabilities, Net Worth, and Invest-ments as at 31st December 2011:
TIRA 2011 ANNUAL REPORT.indd Sec2:19TIRA 2011 ANNUAL REPORT.indd Sec2:19 1/18/13 9:47:45 AM1/18/13 9:47:45 AM

20
ANNUAL INSURANCE MARKET PERFORMANCE REPORT For The Year Ended 31st December 2011
Exhibit 6.1: General & Long Term Assurance Business as at 31 Dec 2011 (In TZS Million)
PARTICULARS
2007
2008
2009
2010
2011
2010/11% Incr/(Decr.)
Total Gross Premiums Written 154,040 190,885 231,238 286,953 344,703 20%
Total Assets 212,458 289,456 320,611 355,710 416,121 17%
Total Liabilities 133,081 202,238 219,022 247,789 289,254 17%
Total Net Worth 79,377 87,218 101,589 107,921 126,867 18%
Total Investments 143,050 193,800 204,776 254,690 291,886 15%
Total insurers’ investments increased by 15 percent from TZS 254.7 billion in 2010 to TZS 291.9 billion in 2011. The largest share of insurers’ investment assets comprised Bank Deposits (44.0 percent), followed by Real Estate investments (22.5 percent), Government Securities (13.1 percent), Investments in Related Parties (9.1 percent), Shares (8.1%), and Other Financial Investments (3.2 percent), in that order.
Exhibit 6.2 below presents insurers’ total investment assets portfolio distribution during the year under review.
Exhibit 6.3 below gives the distribution of General & Long Term Insurers’ investments by type for the last fi ve years (2007-2011).
TIRA 2011 ANNUAL REPORT.indd Sec2:20TIRA 2011 ANNUAL REPORT.indd Sec2:20 1/18/13 9:47:45 AM1/18/13 9:47:45 AM

21
ANNUAL INSURANCE MARKET PERFORMANCE REPORT For The Year Ended 31st December 2011
7 GENERAL INSURANCE - MARKET PERFORMANCE OVERVIEW
7.1 General Insurance Business Growth
General insurance business showed a growth of 21 percent in gross premium income from TZS 256 billion during 2010 to TZS 308 billion during the year under review (see Table 5A – appended). This growth was slightly lower than a growth of 22 percent observed between 2009 and 2010, and slightly above the projected industry average growth rate of 18 percent. The increase is attributed to a number of factors, including the following:
• A generally greater observance of insurance principles by most players in the market, including timely payment of genuine claims.
• Compliance by the public, with the statutory requirement which provides that all insurances for locally based risks must be placed with Tanzanian insurers, except by prior written approval of the Commissioner of Insurance.
• Conducive business environment in the country due to Government’s efforts in creating wealth and thereby enabling people to acquire more disposable income with which they can purchase insurance covers.
On a class-by-class basis, the growth in General insurance business was mainly driven by signifi cant growths recorded in the “Other General” class of business which grew by 83 percent during the year under review, followed by (with percent growth rates in brackets) Accident (34 percent), Aviation (30 percent), Marine (25 percent), Health (23 percent), Motor (19 percent), and Fire (9 percent), in that order. Engineering class experienced a 6 percent decrease in premium volume during the year under review.
Exhibit 7.1 below presents General insurance business class-by-class growth rates during the year under review. The quantitative class-by-class pattern over the last nine years is shown on Appended Chart 1.
TIRA 2011 ANNUAL REPORT.indd Sec2:21TIRA 2011 ANNUAL REPORT.indd Sec2:21 1/18/13 9:47:45 AM1/18/13 9:47:45 AM
22
ANNUAL INSURANCE MARKET PERFORMANCE REPORT For The Year Ended 31st December 2011
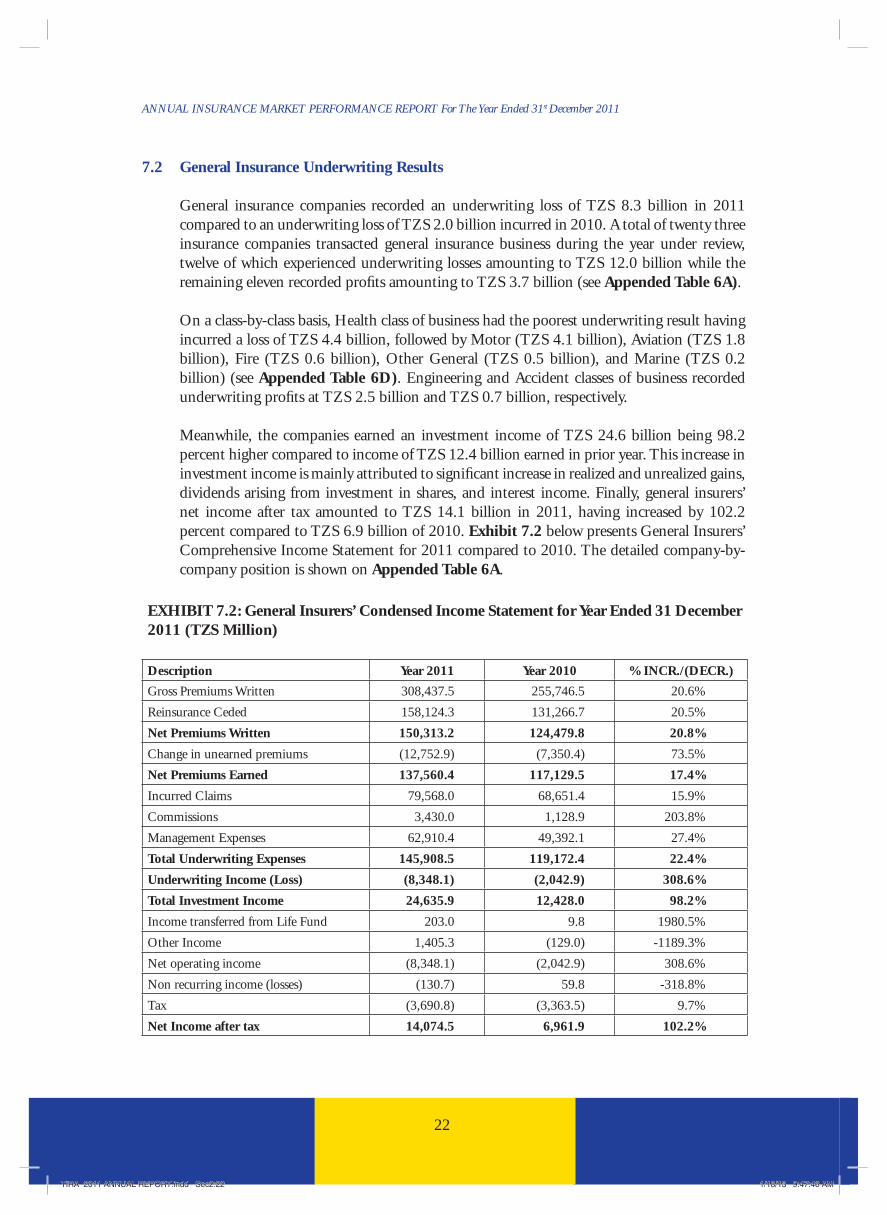
7.2 General Insurance Underwriting Results
General insurance companies recorded an underwriting loss of TZS 8.3 billion in 2011 compared to an underwriting loss of TZS 2.0 billion incurred in 2010. A total of twenty three insurance companies transacted general insurance business during the year under review, twelve of which experienced underwriting losses amounting to TZS 12.0 billion while the remaining eleven recorded profi ts amounting to TZS 3.7 billion (see Appended Table 6A).
On a class-by-class basis, Health class of business had the poorest underwriting result having incurred a loss of TZS 4.4 billion, followed by Motor (TZS 4.1 billion), Aviation (TZS 1.8 billion), Fire (TZS 0.6 billion), Other General (TZS 0.5 billion), and Marine (TZS 0.2 billion) (see Appended Table 6D). Engineering and Accident classes of business recorded underwriting profi ts at TZS 2.5 billion and TZS 0.7 billion, respectively.
Meanwhile, the companies earned an investment income of TZS 24.6 billion being 98.2 percent higher compared to income of TZS 12.4 billion earned in prior year. This increase in investment income is mainly attributed to signifi cant increase in realized and unrealized gains, dividends arising from investment in shares, and interest income. Finally, general insurers’ net income after tax amounted to TZS 14.1 billion in 2011, having increased by 102.2 percent compared to TZS 6.9 billion of 2010. Exhibit 7.2 below presents General Insurers’ Comprehensive Income Statement for 2011 compared to 2010. The detailed company-by-company position is shown on Appended Table 6A.
EXHIBIT 7.2: General Insurers’ Condensed Income Statement for Year Ended 31 December 2011 (TZS Million)
Description Year 2011 Year 2010 % INCR./(DECR.)
Gross Premiums Written 308,437.5 255,746.5 20.6%
Reinsurance Ceded 158,124.3 131,266.7 20.5%
Net Premiums Written 150,313.2 124,479.8 20.8%
Change in unearned premiums (12,752.9) (7,350.4) 73.5%
Net Premiums Earned 137,560.4 117,129.5 17.4%
Incurred Claims 79,568.0 68,651.4 15.9%
Commissions 3,430.0 1,128.9 203.8%
Management Expenses 62,910.4 49,392.1 27.4%
Total Underwriting Expenses 145,908.5 119,172.4 22.4%
Underwriting Income (Loss) (8,348.1) (2,042.9) 308.6%
Total Investment Income 24,635.9 12,428.0 98.2%
Income transferred from Life Fund 203.0 9.8 1980.5%
Other Income 1,405.3 (129.0) -1189.3%
Net operating income (8,348.1) (2,042.9) 308.6%
Non recurring income (losses) (130.7) 59.8 -318.8%
Tax (3,690.8) (3,363.5) 9.7%
Net Income after tax 14,074.5 6,961.9 102.2%
TIRA 2011 ANNUAL REPORT.indd Sec2:22TIRA 2011 ANNUAL REPORT.indd Sec2:22 1/18/13 9:47:46 AM1/18/13 9:47:46 AM

23
ANNUAL INSURANCE MARKET PERFORMANCE REPORT For The Year Ended 31st December 2011
7.3 General Insurance – Financial Highlights and Ratio Analysis
Exhibit 7.3 below gives a summary of fi nancial highlights as well as ratio analysis in respect of some key general insurance business performance indicators for the last fi ve (5) years 2007-2011.
Exhibit 7.3: General Insurance Financial Highlights 2007-2011 (In TZS Million)
PARTICULARS
2007 (TZS)
2008 (TZS)
2009 (TZS)
2010 (TZS)
2011 (TZS)
2010/11%Incr/(Decr.)
Gross Premiums 135,891 164,952 209,559 255,746 308,438 21%
Premims Ceded (Reinsurance Outwards) 71,649 82,622 107,398 131,267 158,124 20%
Net Premiums 64,242 82,330 102,161 124,480 150,313 21%
Earned Premiums (Net) 58,993 74,615 91,753 117,129 137,560 17%
Gross Claims Paid 44,235 76,612 89,409 120,276 125,537 4%
Reinsurance Recoverable on Losses 15,386 41,055 41,202 55,366 51,129 -8%
Net Claims Paid 28,849 35,557 48,207 64,910 74,407 15%
Net Claims Incurred 29,952 38,627 50,091 68,651 79,568 16%
Underwriting Gains/(Loss) 2,748 1,582 1,265 (2,043) (8,347) 309%
Investment Income 5,253 8,982 10,349 12,428 25,032 101%
Commissions Earned (Received) 6,433 10,889 21,860 26,724 32,434 21%
Commissions Expenses (Comm. Paid) 6,348 12,013 22,865 27,853 35,841 29%
Net Reinsurance Infl ows (49,830) (30,678) (44,336) (49,177) (74,561) 52%
Management Expenses 26,208 32,671 38,577 49,392 62,910 27%
Net Expenses (Management & Commission) 26,123 33,795 39,582 50,521 66,318 31%
Ratio Analysis (in %)
2007 2008 2009 2010 2011 2010/11
Ratio Ratio Ratio Ratio Ratio %Incr/(Decr.)
Premiums Ceded to Gross Premiums 53% 50% 51% 51% 51% 0%
Net Reinsurance Infl ows to Gross Premiums -37% -19% -21% -19% -24% 26%
Net Earned Premiums to Gross Premiums 43% 45% 44% 46% 45% -3%
Gross Claims to Gross Premiums 33% 46% 43% 47% 41% -13%
Net Claims Incur. to Net Earned Prem. (Loss Ratio) 51% 52% 55% 59% 58% -1%
Underwriting Gains/(Loss) to Earned Premiums 4.7% 2.1% 1.4% -1.7% -6.1% 248%
Commissions Earned to Premiums Ceded 9% 13% 20% 20% 21% 1%
Commissions Expenses to Gross Premiums 5% 7% 11% 11% 12% 7%
Management Expenses to Gross Premiums 19% 20% 18% 19% 20% 6%
Management Expenses to Net Premiums 41% 40% 38% 40% 42% 5%
Management Expenses to Net Earned Premiums 44% 44% 42% 42% 46% 8%
Net Exp. to Net Earned Prem. (Expense Ratio) 44% 45% 43% 43% 48% 12%
Combined Ratio (Expense Ratio + Loss Ratio) 95% 97% 98% 102% 106% 4%
TIRA 2011 ANNUAL REPORT.indd Sec2:23TIRA 2011 ANNUAL REPORT.indd Sec2:23 1/18/13 9:47:46 AM1/18/13 9:47:46 AM

24
ANNUAL INSURANCE MARKET PERFORMANCE REPORT For The Year Ended 31st December 2011
7.4 General Insurance – Underwriting Trends
The ratio of reinsurance premiums ceded to gross premiums written remained at 51 percent during the last three years. On insurer-by-insurer basis, the highest reinsurance dependence ratio is seen with Heritage Insurance Company (T) Ltd at 73 percent, followed by Golden Crescent Insurance Company Ltd (71 percent), Jubilee Insurance Company (T) Ltd (70 percent), Lion of Tanzania Insurance Company Ltd (68 percent), and Tanzindia Assurance Company Ltd (65 percent), in that order (see Table 6C – appended). Meanwhile, the insurer with the lowest reinsurance dependence ratio was AAR Insurance Company Ltd at 4 percent.
The country continued to experience unfavourable Net Reinsurance Infl ows during the year under review. Net Reinsurance Outfl ows represented 24 percent of gross premiums written in 2011 compared to the ratio of 19 percent of previous year.
Exhibit 7.4 below presents trends of General Insurance Gross Premiums Written (GPW), Net Premiums Retained (NP), and Reinsurance Premiums Payable (RP) for the period 2007 to 2011.
7.5 General Insurance – Claims Experience
General Insurance Net Loss Ratio slightly improved to 58 percent compared to 59 percent during previous year. Gross claims paid increased by 4 percent to TZS 125.5 billion during 2011, compared to claims of TZS 120.3 billion paid in 2010. After including reinsurance claims recoveries, net claims paid by local insurers amounted to TZS 74.4 billion being 15 percent higher compared to net claims of TZS 64.9 billion paid in previous year. On insurer-by-insurer basis, the highest Loss ratio was experienced by Strategis Insurance Tanzania
TIRA 2011 ANNUAL REPORT.indd Sec2:24TIRA 2011 ANNUAL REPORT.indd Sec2:24 1/18/13 9:47:46 AM1/18/13 9:47:46 AM

25
ANNUAL INSURANCE MARKET PERFORMANCE REPORT For The Year Ended 31st December 2011
Limited at 101 percent, followed by Century Insurance Company Ltd (71 percent), Milembe Insurance Company Limited (69 percent), Star General Insurance Company Tanzania Ltd (68 percent), and Reliance Insurance Company Tanzania Ltd (67 percent), in that order (see Table 6C – appended).
7.6 General Insurance – Management Expenses
The ratio of Management Expenses to Gross Premiums slightly increased to 20 percent in 2011 compared to 19 percent of previous year, being within the internationally recommendable norm of 20 percent. Meanwhile, the ratio of Management Expenses to Net Premiums deteriorated to 42 percent in 2011 compared to 40 percent in 2010. The ratio was on the high side compared to 30 percent which is recommended.
7.7 General Insurance – Net Income
The general insurance underwriting result deteriorated to an underwriting loss of TZS 8,348 million compared to previous year’s loss of TZS 2,043 million. However, on incorporation of income from investments and deducting appropriate taxes, the insurers ended up with a positive Net Income after Tax totaling TZS 14,075 million, having improved by 102 percent compared to a Net Income after Tax of TZS 6,962 million recorded previous year.
From an underwriting perspective, 11 out of 23 insurers which transacted general insurance business during the year under review recorded underwriting profi ts, as evidenced by respective combined ratios that were less than 100 percent. Companies which had the highest levels of underwriting profi ts were Phoenix (TZS 1,133 million), Jubilee (TZS 802 million), ZIC (TZS 340 million), Alliance (TZ 331 million), and Momentum (TZ 328 million), in that order (see Table 6A - appended). Meanwhile, companies which had the highest levels of underwriting losses were Strategis (loss of TZS 3,447 million), NIC (loss of TZS 2,531 million), Reliance (loss of TZS 1,485 million), and Century (loss of TZS 926 million).
On net income after tax basis, 15 out of 23 insurers which transacted general insurance business during the year under review recorded profi ts. Companies which had the highest levels of net profi t after taxes were Phoenix (TZS 5,501million), NIC (TZS 4,358 million), Alliance (TZS 2,035 million), Jubilee (TZS 1,535 million), and Heritage (TZ 1,521 million), in that order.
7.8 General Insurance - Portfolio Mix
General Insurance product mix in the year 2011 shows a stable share of Motor insurance business at 31 percent. This is followed by Fire 18 percent, Health 18 percent and Accident 15 percent. Other classes shared less than 6 percent each of total General insurance business.
Note: previously, Health, Accident, and Other General classes were categorized under “Miscellaneous Accident” class of business. Following adoption of new fi ling requirements effective year ended 31st December 2009, the “Miscellaneous Accident” class has been dissolved into three (3) smaller classes of business thus bringing the number of General insurance classes to a total of eight (8) from the previous six (6).
TIRA 2011 ANNUAL REPORT.indd Sec2:25TIRA 2011 ANNUAL REPORT.indd Sec2:25 1/18/13 9:47:47 AM1/18/13 9:47:47 AM

26
ANNUAL INSURANCE MARKET PERFORMANCE REPORT For The Year Ended 31st December 2011
Exhibit 7.8 below shows the composition of General Insurance gross premiums per class of business during 2011.
8 LONG TERM ASSURANCE - MARKET PERFORMANCE OVERVIEW
8.1 Long Term Assurance Business Analysis
Life assurance business volume increased by 16.2 percent from TZS 31.2 billion during 2010 to TZS 31.2 billion during 2011. Three (3) out of the fi ve (5) insurers which transacted life assurance business in 2011 experienced expansion of business portfolio. These were namely; African Life Assurance Company Ltd, Alliance Life Insurance Corporation Ltd, and Jubilee Insurance Company (T) Limited (see Table 5B – appended). On a class-by-class basis, the most signifi cant growth driver of life business was Group Life assurance (with premium value of TZS 23.5 billion) which increased by 35 percent during the period under review (see Exhibit 8.1.1 below). Meanwhile, “Other Life” class (with premium value of TZS 1.6 billion) decreased by 58 percent.
TIRA 2011 ANNUAL REPORT.indd Sec2:26TIRA 2011 ANNUAL REPORT.indd Sec2:26 1/18/13 9:47:47 AM1/18/13 9:47:47 AM

27
ANNUAL INSURANCE MARKET PERFORMANCE REPORT For The Year Ended 31st December 2011
Exhibit 8.1.2 below gives a Condensed Income Statement for Life Assurance Business for 2011 compared to 2010. Detailed position on a company-by-company is shown on Appended Tables 6B.
Exhibit 8.1.2: Life Insurance Companies’ Condensed Income Statement for the Year Ended 31st December 2011 (TZS Million)
Description Year 2011 Year 2010 % Incr./(Decr.)
Gross premiums written 36,265.1 31,207.0 16.2%
Reinsurance ceded (5,090.1) (3,962.0) 28.5%
Net premiums written 31,175.0 27,245.0 14.4%
Total Investment Income 9,553.7 3,740.0 155.4%
Fee & Other Income 342.8 212.0 61.7%
Total Income 41,071.5 31,197.0 31.7%
Total Policyholder benefi ts 14,884.8 16,101.0 -7.6%
Commissions 6,335.9 4,261.0 48.7%
Management Expenses 11,419.3 8,745.0 30.6%
Total Expenses 32,640.0 29,107.0 12.1%
Net Operating Income 8,431.5 2,090.0 303.4%
Non recurring Income (Expenses) (153.2) (109.0) 40.6%
Total Income 8,278.3 1,981.0 317.9%
Income transfer to shareholders (1,842.1) 239.0 -870.8%
Life Fund at start of year 59,552.9 57,333.1 3.9%
Life Fund at end of year 65,989.0 59,552.9 10.8%
Selected Ratios Analysis (%)
Life Claims Ratio 41.0% 51.6% -10.5%
Commission Ratio 17.5% 13.7% 3.8%
Management Ratio 31.5% 28.0% 3.5%
Life assurance companies earned an investment income of TZS 9.6 billion in 2011 being 155.4 percent higher compared to income of TZS 3.7 billion earned in prior year. The companies recorded a total income (including net premium written, investment income, and other income) of TZS 41.1 billion, in 2011 being higher by 31.7 percent compared to income of TZS 31.2 billion in 2010. Meanwhile, total policyholders’ benefi ts amounted to TZS 14.9 billion in 2011 being lower by 7.6 percent compared to TZS 16.1 billion payable in 2010. Finally, life insurers’ total income after deducting policyholders’ benefi ts and operational expenses amounted to TZS 8.4 billion in 2011, being higher by 317.9 percent compared to income of TZS 2.1 billion recorded in 2010. Meanwhile, the insurers’ total life fund increased by 10.8 percent from TZS 59.6 billion at end of 2010 to TZS 66.0 billion at end of 2011.
TIRA 2011 ANNUAL REPORT.indd Sec2:27TIRA 2011 ANNUAL REPORT.indd Sec2:27 1/18/13 9:47:48 AM1/18/13 9:47:48 AM

28
ANNUAL INSURANCE MARKET PERFORMANCE REPORT For The Year Ended 31st December 2011
8.2 Long Term Assurance - Underwriting Trends
Long-term assurance business gross premium income has grown at an average annual rate of 40.3 percent over the last fi ve years from TZS 18.1 billion in 2007 to TZS 36.3 billion in 2011.
Exhibit 8.2 below shows the trend of Long Term Assurance Gross Premiums Written (GPW) for the period 2007 to 2011.
8.3 Long Term Assurance - Claims & Benefi ts Payments
Claims/benefi ts payable under Long-term assurance business slightly decreased by 7.6 percent from TZS 16.1 billion in 2010 to TZS 14.9 billion in 2011. Accordingly, claims ratio for the business decreased from 51.6 percent in 2010 to 41.0 percent in 2011.
8.4 Long Term Assurance - Management Expenses
The Management Expense Ratio slightly increased from 28.0 percent in 2010 to 31.5 percent in 2011, and was still higher than the industry’s target of 20 percent.
8.5 Long Term Assurance – Funds Position
The industry Life funds increased by 10.8 percent to TZS 66.0 billion at end of 2011 compared to TZS 59.6 billion as at end of prior year.
8.6 Long Term Assurance Portfolio Mix
Exhibit 8.6 below shows the distribution of Long Term Assurance gross premiums per class of business during 2011.
TIRA 2011 ANNUAL REPORT.indd Sec2:28TIRA 2011 ANNUAL REPORT.indd Sec2:28 1/18/13 9:47:48 AM1/18/13 9:47:48 AM

29
ANNUAL INSURANCE MARKET PERFORMANCE REPORT For The Year Ended 31st December 2011
9. OPERATIONAL RESULTS OF THE TANZANIA NATIONAL REINSURANCE CORPORATION LTD (TAN-RE)
Tan-Re posted an underwriting profi t of TZS 6,011.3 million in 2011 compared to a profi t of TZS 4,712.4 million during previous year. After taking into account investment income and other income, the result improved to a pre-tax profi t of TZS 7,818.0 million compared to a pre-tax profi t of TZS 6,330.6 million in previous year. Meanwhile, the reinsurer’s net assets increased to TZS 28,468.3 million at end of 2011 compared to TZS 18,153.1 million at previous year’s end.
Exhibit 9.1 below presents, in a summary form, Tan-Re’s fi nancial performance results during 2010 as compared to the previous year.
Exhibit 9.1: Tanzania National Reinsurance Corporation Ltd (TAN-RE)Condensed Balanced Sheet and Income Statement as at December 31, 2011 (TZS Million) 2011 2010 2011 2010Fixed Assets 1,469.2 1,285.1 Gross Premiums Written 53,947.4 42,726.2
Investments 31,481.4 21,353.7 Net Premiums Earned 45,960.0 35,217.1
Receivables 18,084.7 15,506.2 Claims Incurred 23,850.2 17,636.8
Other Assets 1,169.3 3,120.3 Operating & Comm. Expenses 16,098.5 12,867.9
Total Assets 52,204.5 41,265.3 Underwriting Profi t/(Loss) 6,011.3 4,712.4
Actuarial Liabilities 22,531.7 20,064.4 Investment Income 1,806.7 1,468.1
Other Liabilities 1,204.5 3,047.7 Other Income/(Expenses) - 150.1
Total Liabilities 23,736.2 23,112.1 Pre-TaxIncome/(Loss) 7,818.0 6,330.6
Net Assets 28,468.3 18,153.1 Post-Tax Income/(Loss) 5,082.2 3,600.4
From an underwriting perspective, Tan Re experienced a year-to-year improvement in its underwriting performance. This is evidenced by consistent growths in its premium earnings in relation to gross premium underwritten whose ratio increased from 72 percent in 2007 to 85 percent in 2011 and improvements in underwriting result from a profi t of TZS 919 million in 2007 to a profi t of TZS
TIRA 2011 ANNUAL REPORT.indd Sec2:29TIRA 2011 ANNUAL REPORT.indd Sec2:29 1/18/13 9:47:49 AM1/18/13 9:47:49 AM

30
ANNUAL INSURANCE MARKET PERFORMANCE REPORT For The Year Ended 31st December 2011
6,011 million in 2011. The company’s combined ratio also improved from 94 percent in 2007 to 87 percent in 2011.
Exhibit 9.2 below presents an analysis of selected ratios for Tan-Re during the last fi ve years.
Exhibit 9.2: Tan Re - General Insurance Financial Highlights 2007-2011 (In TZS Million)PARTICULARS
2007 (TZS)
2008 (TZS)
2009 (TZS)
2010 (TZS)
2011 (TZS)
2010/11%Incr/(Decr.)
Gross Premiums 21,748 29,515 36,717 42,726 53,947 26%
Earned Premiums (Net) 15,573 21,847 29,086 35,217 45,960 31%
Net Claims Incurred 6,069 9,652 14,186 17,637 23,850 35%
Underwriting Gains/(Loss) 919 2,878 3,347 4,712 6,011 28%
Gross Investment Income 668 1,326 1,158 1,618 1,807 12%
Operational Expenses 8,586 9,316 11,553 12,868 16,099 25%
Ratio Analysis (in %)
2007 Ratio
2008 Ratio
2009 Ratio
2010 Ratio
2011 Ratio
2010/11%Incr/(Decr.)
Net Earned Premiums to Gross Premiums 72% 74% 79% 82% 85% 3%
Net Claims Incur. to Net Earned Prem. (Loss Ratio) 39% 44% 49% 50% 52% 4%
Underwriting Gains/(Loss) to Earned Premiums 5.9% 13.2% 11.5% 13.4% 13.1% -2%
Management Expenses to Gross Premiums 39% 32% 31% 30% 30% -1%
Management Expenses to Net Earned Premiums 55% 43% 40% 37% 35% -4%
Combined Ratio (Expense Ratio + Loss Ratio) 94% 87% 88% 87% 87% 0%
10. BROKERS PARTICIPATION IN INSURANCE UNDERWRITING
Out of the total insurance premiums written during 2011 in respect of both long – term and general insurance businesses (TZS 344.7 billion), 62.0 percent of this amount was transacted through brokers. The trend of brokers’ share of the market for the period of 2007 to 2011 is as per Exhibit 10 below.
TIRA 2011 ANNUAL REPORT.indd Sec2:30TIRA 2011 ANNUAL REPORT.indd Sec2:30 1/18/13 9:47:49 AM1/18/13 9:47:49 AM

31
ANNUAL INSURANCE MARKET PERFORMANCE REPORT For The Year Ended 31st December 2011
The Authority will continue allocating substantial resources to supervision of the broking industry to enhance compliance, as well as to facilitate strategies for further development of brokers into a more vibrant and effi cient intermediary force.
10.1 General insurance Broking
During the year ended 31st December 2011 a total of 77 brokers participated in transacting general insurance business, compared to 67 brokers in 2010. A total of TZS 204.2 billion in general insurance premium were collected through brokers compared to TZS 165.1 billion in the previous year, suggesting an increase of 24.0 percent (see Table 8A – appended).
Class-by-Class Contribution – General InsuranceOn a class-by-class basis, it is noted that the level of involvement of brokers in underwriting of General insurance business differed from one class to another. The highest brokers’ involvement is observed in Fire class of business whereby almost the entire premium volume (99 percent) was transacted through brokers. This was followed by (with percent share in brackets) Accident (92 percent); Engineering (66 percent); Other General (64 percent); Marine (63 percent); Aviation (58 percent); Motor (55 percent); and Health (34 percent). Exhibit 10.1 below shows levels of contribution of insurance brokers in each class of General insurance business during 2011.
Market ShareThe largest share of general insurance business 22.7% was held by Alexander Forbes (T) Ltd followed by AON Tanzania Ltd, 18.0%, and MIC Global, 13.8%, in that order. These three brokers handled about 54.5% of the entire general insurance broking industry business, while the rest transacted the remaining 44.5% . Of the latter segment, 8 brokers handled above average market share (i.e. above 1.3%). These were Eagle Africa (5.6%); Impex 5.5%
TIRA 2011 ANNUAL REPORT.indd Sec2:31TIRA 2011 ANNUAL REPORT.indd Sec2:31 1/18/13 9:47:50 AM1/18/13 9:47:50 AM

32
ANNUAL INSURANCE MARKET PERFORMANCE REPORT For The Year Ended 31st December 2011
; Astra 4.5%; Milmar 2.7%; Eastern 2.6%; B.R. Puri 2.2%; Busara 1.8%; and Outassurance 1.4%.
10.2 Long Term Assurance Broking
As at end of 2011, 22 brokers transacted long-term assurance business. Total premium collected by brokers in respect of 2011 long-term assurance business amounted to TZS 10.4 billion having decreased by 9.0 percent compared to TZS 11.4 billion collected during similar period of previous year. (See Table 8B – appended).
Class-by-Class Contribution – Life AssuranceOn a class-by-class basis, the highest brokers’ involvement in transacting life assurance products is observed in “Other life” business whereby 63 percent of the entire premium volume was transacted through brokers. This was followed by (with percent share in brackets) Group Life (39 percent); and Individual Life (1 percent). Exhibit 10.2 below shows levels of contribution of insurance brokers in each class of Life assurance business during 2011.
11. REGULATION OF INSURANCE ACTIVITIES
11.1 Supervision
The Insurance Act 2009 confers upon the Commissioner of Insurance powers to ensure compliance with its provisions by registered insurers and insurance intermediaries, which inter alia, require that business be conducted on the basis of sound insurance principles. Thus supervision not only requires a detailed scrutiny of the statutory returns but also other aspects of insurers’ business including maintenance of the statutory deposits at the level prescribed in
TIRA 2011 ANNUAL REPORT.indd Sec2:32TIRA 2011 ANNUAL REPORT.indd Sec2:32 1/18/13 9:47:51 AM1/18/13 9:47:51 AM

33
ANNUAL INSURANCE MARKET PERFORMANCE REPORT For The Year Ended 31st December 2011
the Act, the constitution and maintenance of the statutory technical reserves, investment in securities prescribed by law, adequate reinsurance arrangements, maintenance of margins of solvency, and presence of fi t and proper persons to run the industry. Further, the Insurance Act requires the auditor and directors of an insurance company to certify the solvency position of the insurer. The actuary appointed by the company is, on the other hand, required to certify the solvency of the insurer in case long term insurance business is carried on, i.e. for life insurance, pensions, and permanent health insurance business. All twenty six (26) insurance companies (including Tan Re) were audited during the year under review.
11.2 Off-Site Examination & On Site Inspection of Insurers
During the year under review, the Authority has continued to implement its insurers’ Risk Based Supervision (RBS) model of choice namely, CARAMELS (note: CARAMELS is an acronym for Capital Adequacy, Assets Quality, Reinsurance, Actuarial provisions, Management and corporate governance, Earnings, Liquidity, and Subsidiaries and related parties). The essential mode of operation of the RBS approach consists of conducting both off-site examinations and risk assessment of insurance companies and on-site examinations on riskier companies.
Risk profi le for each insurance company operating in Tanzania has been updated based on latest information available. Among other things, the assessment determined a few insurers which failed to meet the solvency margin requirements. These were provided with provisional business licenses and were required to implement a number of remedial measures within a specifi ed time frame. Beyond the time of this report, some progress was being made by relevant insurers in addressing appropriate operational and fi nancial shortfalls.
During year 2012, TIRA intends to continue with the exercise of carrying out on-site inspection of insurers, for purposes of ascertaining their regulatory and professional soundness. The inspections enable TIRA to determine the fi nal risk rating status of the insurers against each of the CARAMELS components and take appropriate measures as deserved. Each insurer’s risk rating will be reviewed on a continuous basis basing on the most up-to-date information available to TIRA.
11.3 Oversight of Implementation of Anti-Money Laundering and Combating the Financing of Terrorism (AML/CFT) Requirements in the Insurance Industry
During the year under review, the Authority carried out certain activities aimed at enhancing the insurance industry’s stance for combating money laundering and terrorist fi nancing. Activities implemented by the Authority in this regard were in two main categories as outlined below:
i. Collaborating with the Financial Intelligence Unit (FIU) and issuing several Guidelines as follows –
a. AML/CFT Guidelines for Insurers;
b. Guidelines for the Verifi cation of Customers’ Identities;
c. Suspicious Transactions Reporting (STR) forms.
TIRA 2011 ANNUAL REPORT.indd Sec2:33TIRA 2011 ANNUAL REPORT.indd Sec2:33 1/18/13 9:47:52 AM1/18/13 9:47:52 AM

34
ANNUAL INSURANCE MARKET PERFORMANCE REPORT For The Year Ended 31st December 2011
ii. Carrying out special on-site inspections on all Tanzania insurers to establish each insurer’s status of compliance with appropriate AML/CFT requirements. The main areas covered by the inspection included –
a. Formulation of company policy on AML/CFT
The AML/CFT Guidelines to Insurers requires an insurer to develop internal policies, procedures, and controls to help prevent money laundering and terrorist fi nancing and communicate them to its employees and agents.
b. Responsibility for coordination of company AML/CFT efforts
The AML/CFT Guidelines to Insurers requires an insurer to develop appropriate compliance management arrangements, including, at least, the appointment of a management level offi cer as the AML/CFT offi cer. Further, the insurer is required to ensure that the AML/CFT offi cer, as well as any other persons appointed to assist him, has timely access to all customer records and other relevant information which they require to discharge their functions.
c. Training of Staff on AML/CFT Matters
The AML/CFT Guidelines to Insurers requires an insurer to take all appropriate steps to ensure that its staff and agents (whether in Tanzania or overseas) are regularly trained on –- AML/CFT laws and regulations, and in particular, Customer Due Diligence
(CDD) measures, detecting and reporting suspicious transactions;
- Prevailing techniques, methods and trends in money laundering and terrorist fi nancing; and
- The insurer’s internal policies, procedures and controls on AML/CFT and the roles and responsibilities of staff and agents in combating money laundering and terrorist fi nancing.
d. Implementation of Know Your Customer (KYC) Requirements
The Guidelines for the Verifi cation of Customers’ Identities requires reporting persons to take reasonable steps, concerning verifi cation of customers’ identities in respect to existing business relationship, to maintain the correctness of particulars that are susceptible to change. The Guidelines also requires reporting persons to consider, among other things, applying KYC procedures to existing customers on the basis of materiality and risk and conduct due diligence reviews of such existing relationships as appropriate.
e. Reporting of Suspicious Transactions
AML/CFT Guidelines to Insurers requires insurers to report to competent au-thorities all transactions suspected of being connected with money launder-ing or terrorist fi nancing, and implement appropriate internal policies, proce-dures and controls for meeting its obligations under the law.
TIRA 2011 ANNUAL REPORT.indd Sec2:34TIRA 2011 ANNUAL REPORT.indd Sec2:34 1/18/13 9:47:52 AM1/18/13 9:47:52 AM
35
ANNUAL INSURANCE MARKET PERFORMANCE REPORT For The Year Ended 31st December 2011
Insurers that had shortfalls in relevant areas were required to implement appropriate remedial measures within a specifi ed time frame. Beyond the time of this report, some progress was being made by relevant insurers in addressing appropriate shortfalls.
TIRA will continue with oversight of insurance registrants status of implementing AML/CFT requirements, including carrying out follow-up on-site inspection of on relevant aspects.
11.4 Consumer Complaints Handling
During the year ending 31st December 2011, a total of 248 complaints were handled by TIRA, from policyholders and third parties against certain insurance companies, compared to 136 complaints handled in 2010. Most of the complaints handled by TIRA were on delay to settle claims by insurers. The increased number of complaints is due to increased awareness on the existence of TIRA and its complaints handling function by policy holders and other third parties following establishment of zonal offi ces and participation in various public awareness events where complaints’ handling is being mentioned as one of TIRA’s daily functions.
12. MARKET DEVELOPMENT INITIATIVES
In line with its Corporate Plan for a fi ve year period of 1st July 2009 – 30th June 2014, TIRA has continued to implement varius market development initiatives during the period under review. Main areas addressed in this regard include supervision of the Authority’s zonal offi ces operations, public relations, product development, skills development, and consumer education.
12.1 Insurance Week Celebrations
The Tanzania insurance industry had an opportunity to refl ect upon the progress made in the industry and chart the way forward during the week of 24th – 28th September 2012. The week reached its climax on 28th September 2012 (the 17th Insurance Day) at an event that was offi ciated by Hon. Dr. William Mgimwa, the Minister of Finance, as Guest of Honour.
In his key note address to mark the offi cial opening of the 17th Insurance Day, the Guest of Honour, commended the industry for achieving milestones in a number of areas and for the theme of the occasion which was “New frontiers for Tanzania Insurance Industry”.
TIRA 2011 ANNUAL REPORT.indd Sec2:35TIRA 2011 ANNUAL REPORT.indd Sec2:35 1/18/13 9:47:52 AM1/18/13 9:47:52 AM

36
ANNUAL INSURANCE MARKET PERFORMANCE REPORT For The Year Ended 31st December 2011
The Minister of Finance, Honourable Dr. Willima Mgimwa (MP) addressing Tanzania insurance industry stakeholders during the 17th Annual Insurance Day held on 28th September 2012 at Grand Hyatt Hotel, Dar Es Salaam
The Guest of Honour highlighted certain issues which need to be addressed. These include the following:
i. Contribution of Insurance to the Economy: Noted that as the country’s poverty levels continue to decline, insurance is expected to be among the fastest growing sectors in the economy. Noted further that the current insurance premium as a percentage of Gross Domestic Product of 1% is an indicator that not more people in this country are aware of insurance benefi ts and this calls for the industry to take a holistic view of the entire process of insurance business in Tanzania. Urged the insurers to exercise utmost care in building up their distribution channels while resisting to be driven by their business targets exclusively, all the time.
ii. Role of insurance brokers: Expressed concern that the brokers’ channel of insurance distribution in Tanzania does not play a crucial role in the entire value chain of insurance. Underscored the fact that effi cient service delivery will be a success factor for the broking industry in Tanzania.
iii. Micro-Insurance: Noted that the industry has potential to grow in micro-insurance segment. According to recent studies on Financial Market Inclusion by FINSCOPE, tapping this segment can be both profi table and worthwhile for the market.
iii. Life Insurance Sector: Expressed concern that life insurance has always been the last priority for insurers despite that Tanzania has always been with the right mix of economic and demographic ingredients which offers huge potential to investors in life business. Urged insurers to improve the appeal of life products by making them simple to understand, make them available at a fair price, and back them up with effi cient
TIRA 2011 ANNUAL REPORT.indd Sec2:36TIRA 2011 ANNUAL REPORT.indd Sec2:36 1/18/13 9:47:52 AM1/18/13 9:47:52 AM

37
ANNUAL INSURANCE MARKET PERFORMANCE REPORT For The Year Ended 31st December 2011
service and honest advice. Underscored the need for an additional channel in the distribution of life insurance in Tanzania, in particular, bancassurance
Minister of Finance, Honourable Dr. William Mgimwa (MP) (seated centre) in a group photo with participants of the 17th Annual Insurance Day held on 28th September 2012 at Grand Hyatt Hotel, Dar Es Salaam. To his right is Prof. Gamaliel Mgongo Fimbo (National Insurance Board Chairman), while to his left is Mr. Israel Kamuzora (Commissioner of Insurance).
(iv) Medical Insurance: Noted with concern the fact that medical insurance sector does not have the product range and spread at its optimal level spanning only from sickness benefi t plans to medical benefi ts on indemnity and reimbursement basis. Noted further that the range does not include any critical illness benefi ts. Moreover, the current products are offered at a short term period of one year, subject to renewal. Urged the industry to migrate from medical Insurance to permanent Health Insurance.
12.2 Capacity Building for Industry Members
Certifi cate of Profi ciency in InsuranceTIRA through its Zanzibar offi ce entered into a collaborative arrangement with the Institute of Finance Management (IFM) based in Dar Es Salaam to offer insurance certifi cate training to persons interested in pursuing the programme. A group of thirty nine (39) graduands completed their training and were awarded a Certifi cate of Profi ciency (COP) in Insurance.
Training on Agriculture InsuranceTIRA in collaboration with IFM, College of Insurance of Kenya, and USAID conducted a training course on Agriculture Insurance in Dar Es Salaam. A group of forty four (44) industry practitioners participated at the training course.
Training on Banc assuranceTIRA in collaboration with IFM and the Bank of Tanzania conducted a training course on Banc assurance in Dar Es Salaam. A group of twenty one (21) industry practitioners participated at the course.
TIRA 2011 ANNUAL REPORT.indd Sec2:37TIRA 2011 ANNUAL REPORT.indd Sec2:37 1/18/13 9:47:52 AM1/18/13 9:47:52 AM

38
ANNUAL INSURANCE MARKET PERFORMANCE REPORT For The Year Ended 31st December 2011
12.3 Establishment of TIRA Zonal Offi ces
One of the objectives of TIRA Corporate Plan 2009-2014 is to extend insurance regulatory services closer to the public. In June 2012, one more TIRA zonal offi ce was established to extend the Authority’s operations in the Southern Highlands zone of the country. This brings the number of TIRA zonal offi ces to three, with the other two being for the Lake zone and the Northern zone.
Information relating to offi ce physical location and areas of oversight for each of the zonal offi ces is outlined as follows:
Name of TIRA Zonal Offi ce Offi ce Physical Address Oversight Area
TIRA Lake Zone Offi ce 5th Floor, PPF House, Kenyatta Road, Mwanza
Mwanza, Musoma, Kagera, Kigoma, Shinyanga and Geita
TIRA Northern Zone Offi ce PPF Olorien Commercial Centre, Plot 153/KK, Njiro area, Arusha
Arusha, Kilimanjaro, Manyara, and Tanga
TIRA Southern Highlands Zone Offi ce
Ground Floor, NIC Building, Karume Road, Mbeya
Mbeya, Ruvuma, Iringa, Njombe, Katavi, and Rukwa
Commissioner of Insurance, Mr. Israel Kamuzora (left), presenting a certifi cate Ms. Stua Mohamed Ameir, one of 39 students who accomplished a Certifi cate of Profi ciency in Insurance (COP) conducted in Zanzibar.
The main activities of the zonal offi ces include –
i. Processing applications for registration within zonal area;
TIRA 2011 ANNUAL REPORT.indd Sec2:38TIRA 2011 ANNUAL REPORT.indd Sec2:38 1/18/13 9:47:53 AM1/18/13 9:47:53 AM

39
ANNUAL INSURANCE MARKET PERFORMANCE REPORT For The Year Ended 31st December 2011
ii. Carrying out inspection within zonal area;
iii. Carrying out public education/market sensitization campaigns within a zone; and
iv. Handling complaints from insurance clients and the general public.
The Authority plans to open another zonal offi ce in Dodoma to co-ordinate its operations in the Central regions of the country during 2013/2014 Financial Year.
12.4 Consumer Education
During the period under review, the Authority has implemented a number of initiatives related to insurance consumer education as outlined below.
12.4.1 Participating in national fi nancial literacy initiativesVarious fi nancial industry stakeholders including regulators of banks and non-bank fi nancial industries in the countries have embarked on some initiatives that are aimed at promoting fi nancial literacy in the country. TIRA has continued to actively participate in such initiatives during the period under review.
Participants of Agriculture Insurance Training in a group photo at Giraffe Hotel in Dar es Salaam. This was a one-week training course conducted by College of Insurance, Nairobi, in collaboration with TIRA and the Institute of Finance Management (IFM). The Commissioner of Insurance, Mr. Israel Kamuzora, offi ciated at the event.
12.4.2 Trade Shows
TIRA continues to engage itself in various consumer education events. The Authority participated in insurance services awareness campaigns during the country’s 50-Year
TIRA 2011 ANNUAL REPORT.indd Sec2:39TIRA 2011 ANNUAL REPORT.indd Sec2:39 1/18/13 9:47:53 AM1/18/13 9:47:53 AM

40
ANNUAL INSURANCE MARKET PERFORMANCE REPORT For The Year Ended 31st December 2011
Independence Anniversary celebrations held in Dar Es Salaam in December 2011. The Authority also participated in insurance awareness campaigns at the Dar Es Salaam International Trade Fair in July 2012 (“Saba Saba”), and Farmers’ Exhibitions in August 2012 (“Nane Nane”). Meanwhile, TIRA zonal offi ces based in Mwanza and Arusha participated in Farmers’ Exhibitions conducted at respective regions. TIRA Lake Zone offi ce participated in East African Trade Fair in September 2012. All these events received wide media coverage.
TIRA’s Director of Market Development Ms. Adelaida Muganyizi discussing an insurance issue with visitors at TIRA stand during 36th Dar es Salaam International Trade Fair.
12.4.3 Website
TIRA has continued to update its website content during the period under review for purpose of availing appropriate information to existing and potential consumers of insurance services. The website www.tira.go.tz also provides an online form for fi ling of complaints with the Authority. This feature will be further enhanced to ensure that complaints being fi led with TIRA can simultaneously be routed to insurance companies in respect of whom complaints are being made.
TIRA 2011 ANNUAL REPORT.indd Sec2:40TIRA 2011 ANNUAL REPORT.indd Sec2:40 1/18/13 9:47:54 AM1/18/13 9:47:54 AM

41
ANNUAL INSURANCE MARKET PERFORMANCE REPORT For The Year Ended 31st December 2011
13. INSURANCE MARKET RESEARCH INITIATIVES
13.1 Implemented Research Activities
Research is an important aspect of any development-orientated organization. TIRA has, by date of issuing of this report, carried and completed a Study on Viability of Introduction of Islamic Insurance (Takaful) Products and Associated Regulatory Framework: This study was carried out in collaboration with the Association of Tanzania Insurers (ATI).
TIRA’s Senior Public Relations Offi cer Mr. Elieza Rweikiza insisting a point on Insurance matters during 36th Dar es Salaam International Trade Fair to the citizens who visited the Authority’s pavilion.
Key objectives of the study included the following- i. Carrying out assessment of existing and potential demand for and supply of Takaful
insurance products in Tanzania;
ii. Carrying out a comparative study of Takaful insurance regulatory frameworks of selected jurisdictions where both Takaful and Conventional Insurance operations are regulated, with the view to identifying regulatory models that may be feasible for Tanzania;
iii. Identifying legislative and operational gaps as far as introduction of Takaful Insurance and associated regulatory framework in Tanzania is concerned;
iv. Proposing legal and regulatory initiatives to eliminate the gaps to be identifi ed; and
v. Making recommendations on the proposed “Takaful Insurance Regulatory Framework” in Tanzania.
TIRA 2011 ANNUAL REPORT.indd Sec2:41TIRA 2011 ANNUAL REPORT.indd Sec2:41 1/18/13 9:47:54 AM1/18/13 9:47:54 AM

42
ANNUAL INSURANCE MARKET PERFORMANCE REPORT For The Year Ended 31st December 2011
The study fi ndings and recommendations were discussed at a meeting of stakeholders in Zanzibar as well as at a meeting of the National Insurance Board. Deliberations relating to the study are receiving the appropriate attention.
13.2 On-going Research Activities
On-going research activities by date of issuing of this report included the Study on Awareness, Perception, and Use of Insurance Services by Investors and Business Entities in Zanzibar: This study is being co-ordinated by TIRA Zanzibar Offi ce and is done in collaboration with Offi ce of the President of the Revolutionary Government of Zanzibar – Finance & Economic Affairs. Key objectives of the study include the following-
i. Carrying out assessment of the status of awareness, perception, and use of insurance services by investors and business entities in Zanzibar with the view to determining gaps in use of the services by relevant parties; and
ii. Recommending strategies for improvement of awareness, perception, and use of insurance services by the investors and business entities in Zanzibar.
By date of this report, the above-stated study was at an analysis stage and a study report is envisaged in early 2013.
13.3 Planned Research Activities
Beginning 2013, the Authority plans to initiate surveys on “Public Perception on Insurance Services” and “The Impact of Tanzania Insurance Regulatory Authority in the Market”. The key purpose of these surveys is to benchmark and monitor the status of the perception of the public on insurance services offered by insurance companies in Tanzania, as well as insurance regulatory services administered by TIRA, with the view to determining shortfalls and areas for improvement.
14. ACTIVITIES OF THE NATIONAL INSURANCE BOARD
Board CompositionThe National Insurance Board as at 31st December 2011 consisted of the following members:
i. Professor Gamaliel Mgongo Fimbo (Professor of Law - Retired), University of Dar es Salaam – Chairman;
ii. Dr Ramadhan S. Mlinga (Chief Executive Offi cer, Public Procurement Regulatory Authority) – Vice Chairman;
iii. Mr Peter A. Ilomo (Director of Policy and Planning) - State House;
iv. Mr Omar Hassan Omar (Accountant General, Revolutionary Government of Zanzibar) – Member;
TIRA 2011 ANNUAL REPORT.indd Sec2:42TIRA 2011 ANNUAL REPORT.indd Sec2:42 1/18/13 9:47:55 AM1/18/13 9:47:55 AM

43
ANNUAL INSURANCE MARKET PERFORMANCE REPORT For The Year Ended 31st December 2011
v. Mr Haruna Masebu (Director General - Energy, Water, and Utilities Regulatory Authority) – Member;
vi. Hon. Mwinchoum Abdulrahman Iddi Msomi (former Member of Parliament of Tanzania) – Member; and,
vii. Hon. Zabein Muhaji Mhita (Member of Parliament of Tanzania) – Member. Board Meetings
The Board held four (4) ordinary meetings and one (1) extra-ordinary meeting in 2011. A summary of issues transacted by the Board in these meetings included:
a. TIRA Progress Reports;
b. TIRA Plan and Budget for Financial year 2011/2012;
c. TIRA Financial Reports;
d. Reports on Risk Assessments of Insurance Companies;
e. Registration of new players;
f. Renewal of registration of insurers and brokers;
g. Adoption of TIRA Audited Accounts for the year ending 30/06/2011;
h. Approval of TIRA Staff Loans Policy; and
i. Insurance Regulations (Ombudsman Regulations, Micro-Insurance Regulations, and Insurance Appeals Tribunal Regulations).
OrganogramThe National Insurance Board (NIB) has three main committees namely, the NIB Finance & Human Resources Committee (FHRC), NIB Audit Committee (AC), and NIB Technical Committee (TC). Each of these Committees has specifi c mandates, and report to the full Board from time to time. The relationship between the NIB, its Committees, and internal Committees of TIRA is as presented on Exhibit 14 below.
TIRA 2011 ANNUAL REPORT.indd Sec2:43TIRA 2011 ANNUAL REPORT.indd Sec2:43 1/18/13 9:47:55 AM1/18/13 9:47:55 AM

44
ANNUAL INSURANCE MARKET PERFORMANCE REPORT For The Year Ended 31st December 2011
Exhibit 14: Organogram of the Tanzania Insurance Regulatory Authority as at 31st December 2011
Training to Board Members
In March 2011, Board Members attended a three day workshop in Kampala, Uganda. The Workshop was organized and conducted by UK-based Commonwealth Secretariat in collaboration with Insurance Regulatory Authority of Uganda. The primary objective of this workshop was to provide participants with a detailed practical understanding of Insurance Regulatory Boards’ responsibilities and Corporate Governance principles.
15. INSURANCE ACT 2009 AND ITS REGULATIONS
Following enactment of the Insurance Act 2009 and its Regulations, TIRA organized training programmes for various industry stakeholders on the new Act and its Regulations during the year under review. The exercise will be completed in 2011.
Section 13(2) of the Insurance Act (on the composition of the National Insurance Board) was amended to exclude from board membership persons who are active in the affairs of the insurance industry. Inclusion of these persons would raise confl ict of interest situations and defeat adherence to good corporate governance principles.
16. ADMINISTRATIVE ISSUES & FINANCIAL RESULTS OF TIRA
16.1 Human Resources
During year 2011, the Authority continued with the exercise of capacity building in terms of staff training for purposes of acquiring knowledge and skills required in supervision and regulation of the insurance industry. TIRA staff attended training programs both within and outside the country. TIRA wishes to extend its highest appreciation to all institutions which accepted to host and train TIRA staff in the appropriate study areas.
TIRA 2011 ANNUAL REPORT.indd Sec2:44TIRA 2011 ANNUAL REPORT.indd Sec2:44 1/18/13 9:47:55 AM1/18/13 9:47:55 AM

45
ANNUAL INSURANCE MARKET PERFORMANCE REPORT For The Year Ended 31st December 2011
Six (6) members of staff were promoted to higher posts while three (3) new staff members were recruited. During the year 2012, TIRA plans to recruit ten (10) new staff members to improve its operational capacity. The planned recruitments are in line with the Authority’s established staff requirements.
The approved organizational structure of TIRA as at end of 2011 is as presented on the Exhibit 16.1 below.
16.2 Information Communication Technology
The Authority’s Corporate Plan (2009-2014) has one of its strategic objectives stated as “To ensure modernization of the insurance market through computerization of the business in order to enhance effi ciency between players and the authority”. During the year under review, the Authority has implemented several initiatives with the view to address ICT-related strategic objectives. These are outlined below.
Establishment of ICT Committee
The Authority has established its ICT Committee whose mandate include to formulate and propose an ICT Policy for the Authority; to coordinate the establishment and continuous review of TIRA’s ICT Policy and Strategy; to ensure that the ICT strategy is aligned with TIRA’s business Corporate Plans; to advise Management in making considered decisions about the focus of ICT resources; to review all ICT services and applications including the Authority’s website and infrastructure with the view to advising the Authority on required improvements and ensuring that the risks associated with ICT are managed appropriately.
TIRA 2011 ANNUAL REPORT.indd Sec2:45TIRA 2011 ANNUAL REPORT.indd Sec2:45 1/18/13 9:47:55 AM1/18/13 9:47:55 AM

46
ANNUAL INSURANCE MARKET PERFORMANCE REPORT For The Year Ended 31st December 2011
Exhibit 16.1: Functional Organizational Structure of the Tanzania Insurance Regulatory Authority as at 31st December 2011
TIRA 2011 ANNUAL REPORT.indd Sec2:46TIRA 2011 ANNUAL REPORT.indd Sec2:46 1/18/13 9:47:55 AM1/18/13 9:47:55 AM

47
ANNUAL INSURANCE MARKET PERFORMANCE REPORT For The Year Ended 31st December 2011
Formulation of an Information and Communication Technology (ICT) PolicyTIRA has formulated its ICT Policy which lays down general guidelines and framework for the use and management of the Authority’s IT resources. The primary objective of this Policy is to ensure that all IT resources and systems of the Authority are implemented and operated in a manner that does not compromise security, integrity, confi dentiality and continual availability of systems, information or data. The Policy also outlines the duties and responsibilities of various stakeholders (including users) of the Authority’s IT resources.In order to ensure that the Policy remains effective and relevant to the Authority and its stakeholders, the Policy will be reviewed and updated after every two years or at shorter intervals as circumstances may dictate. Users of the Authority’s IT resources are called upon to familiarize themselves and fully comply with the requirements of this Policy.
The Authority has developed guidelines to assist the implementation of this policy. These include guidelines on Maintenance and Outsourcing, Disk and Data Sanitation, and Risk Mitigation.
Electronic Document Management System
During the year under review, TIRA acquired a records and document management system that provides a uniform, centralized and electronic methods to store, manage, query and locate documents and manage paper as well as electronic documents across its various offi ces. The system has the ability to store vast amounts of additional metadata to describe documents making them easier to classify and fi nd. The system is accessed over local area network (LAN), the internet and TIRA intranet with multi-level security framework that allows control of access of the electronic fi les at the system, database, fi eld, record and document levels.
Future Plans
By date of writing, TIRA in collaboration with Bank of Tanzania was at an advanced stage of procuring the services of an expert fi rm that will supply and install an appropriate software and hardware that will facilitate electronic supervision of the insurance industry. This activity was being undertaken under the auspices of the Financial Sector Support Project (FSP) funded by the World Bank. When fully installed, the software will provide vital data and information collection and processing thus delivering timely and accurate data and information needs of the Authority and its various stakeholders.
16.3 Financial Results of the Authority for the year ended 30th June 2011
The Controller & Auditor General audited the Authority’s Accounts for the fi nancial year 2010/2011 which ended on 30th June 2011 and a clean certifi cate of audit was issued in respect of same Accounts. A copy of the certifi cate and relevant consolidated fi nancial statements are presented on Part 2 to this report.
TIRA 2011 ANNUAL REPORT.indd Sec2:47TIRA 2011 ANNUAL REPORT.indd Sec2:47 1/18/13 9:47:56 AM1/18/13 9:47:56 AM

48
ANNUAL INSURANCE MARKET PERFORMANCE REPORT For The Year Ended 31st December 2011
17. RELATIONS WITH INTERNATIONAL ORGANISATIONS
17.1 Membership to International Organizations
TIRA is a member of the Association of the African Insurance Supervisory Authorities (AAISA). The AAISA has as its main objectives, the promotion of cooperation and exchange of information among insurance regulatory authorities throughout Africa with the aim of protecting policyholders and securing effi cient insurance markets. TIRA is a Member of International Association of Insurance Supervisors (IAIS) based in Basle, Switzerland. TIRA is also a member of the African Insurance Organisation (AIO); Association of Insurance Supervisory Authorities of Developing Countries (AISADC); The Committee of Insurance Securities and Non-Banking Financial Authorities (CISNA) for SADC; The Association of Insurers and Reinsurers of Developing Countries (AIRDC); and East African Insurance Supervisors Association (EAISA).
17.2 Contribution to Development of International Insurance Bodies
TIRA has continued to offer support toward developments of international insurance-industry-related bodies, during the year under review. The specifi c contributions made by the Authority include as outlined below:
• Mr Kamuzora serves as Chairman of Board of Directors of the African Trade Insurance Agency (ATIA) based in Nairobi, Kenya;
• Mr Kamuzora is current Chairman of the African Association of Insurance Supervisors (AAIS);
• Mr Kamuzora serves as Chairman of the Committee for Insurance, Securities, and Non-Bank Financial Regulatory Authorities (CISNA). CISNA is a Committee of SADC Secretariat;
• Mr S. Mwiru (Director of Surveillance & Research, TIRA) serves as Chairman of Technical Committee for Insurance Regulatory Practices Harmonization Initiatives for CISNA since February 2009;
• Mr Mwiru serves as a member of CISNA Strategic Planning Task Force;
• Mr Mwiru assists with preparation of SADC Insurance Market Performance Indicators Report based on annual statistical surveys conducted on each SADC member country;
• Mr Mwiru serves as Chairman of Technical Committee of East African Insurance Supervisors Association (EAISA).
17.3 Contribution to Development of Regional Insurance Regulatory Authorities
TIRA extended support to the development of other insurance regulatory authorities in the region during the year under review. The Authority conducted training to two staff members
TIRA 2011 ANNUAL REPORT.indd Sec2:48TIRA 2011 ANNUAL REPORT.indd Sec2:48 1/18/13 9:47:56 AM1/18/13 9:47:56 AM

49
ANNUAL INSURANCE MARKET PERFORMANCE REPORT For The Year Ended 31st December 2011
from Insurance Regulatory Authority of Uganda on matters related to on-site inspections of insurance companies and preparation of risk assessment reports which incorporate both off-site analysis and on-site inspection fi ndings. The Authority also conducted training to four staff members from Insurance Regulatory Authority of Kenya on matters related to analysis of fi nancial information submitted by insurance companies and brokers and compilation of industry performance reports.
17.4 Participation in Activities of the Committee of Insurance, Securities, and Non-Banking Financial Authorities in the SADC Region (CISNA)
The Committee of Insurance, Securities and Non-banking fi nancial Authorities (CISNA) was established by the Insurance, Securities and Non-Banking Financial Authorities in the Southern African Development Community (SADC) in June 1998. CISNA’s membership consists of authorities responsible for supervision of insurance, securities, micro-fi nance, privately administered medical aid schemes, fi nancial cooperatives, collective investment schemes, retirement fund and fi nancial advisory and intermediary services in the jurisdiction of Member States of SADC.
The principal objects of CISNA are to —
• enhance communication and exchange of information;
• facilitate information sharing;
• encourage request for information and assistance;
• promote compliance with international standards;
• promote relationship with international bodies;
• promote development of fi nancial products and services;
• to promote harmonization of regulatory regimes;
• enhance capacity building, through training and education of staff;
• encourage cross-border cooperation among authorities;
• promote consumer awareness;
• enhance cooperation with regards to anti-money laundering issues amongst authorities;
• promote sound corporate governance of non-banking fi nancial institutions
TIRA 2011 ANNUAL REPORT.indd Sec2:49TIRA 2011 ANNUAL REPORT.indd Sec2:49 1/18/13 9:47:56 AM1/18/13 9:47:56 AM

50
ANNUAL INSURANCE MARKET PERFORMANCE REPORT For The Year Ended 31st December 2011
Representatives of SADC member states’ non-bank fi nancial institutions regulatory authorities in a group photograph during a bi-annual meeting of CISNA held in Luanda Angola in April 2012.
Mr. Israel Kamuzora (Commissioner of Insurance) served as CISNA chairperson during the period under review. CISNA continued to implement its Five-Year Strategic Plan (2011-2015) during the period under review.
The CISNA Strategic Plan seeks to address ten (10) strategic goals as outlined below:
a. To harmonise and enhance the effectiveness of regional fi nancial regulatory frameworks;
b. To ensure regional adoption and adherence to applicable global non-bank fi nancial institutions regulatory principles, standards, and best practices;
c. To build the internal capacity to ensure that CISNA is able to successfully executive on its mandate;
d. To foster liaison, cooperation, and exchange of information between regional and international bodies and agencies;
e. To facilitate the development of competent and professional regulatory capacity;
f. To facilitate wider access to non-banking fi nancial products and services;
g. To facilitate the development of well informed investors and consumers;
h. To proactively identify and mitigate regional systemic risks;
i. To promote and facilitate the free fl ow of non-banking fi nancial services; and
j. To promote adherence to rigorous best practice corporate governance.
TIRA 2011 ANNUAL REPORT.indd Sec2:50TIRA 2011 ANNUAL REPORT.indd Sec2:50 1/18/13 9:47:56 AM1/18/13 9:47:56 AM

51
ANNUAL INSURANCE MARKET PERFORMANCE REPORT For The Year Ended 31st December 2011
Members of Strategic Planning & Performance Review Committee of CISNA in a group photograph outside the offi ces of Financial Services Board (FSB) of South Africa. The Committee held its meeting at FSB offi ces in August 2012 to formulate a Monitoring & Evaluation Framework for the CISNA Strategic Plan. From right to left are Mr. Samwel Mwiru (Tanzania), Dr. Lufeyo Banda (SADC Secretariat), Dr. Wala Chabala (Zambia), Ms Annah Manganyi (South Africa), Mr Constantine Hara (Zambia), Ms Thembi Langa (SADC Secretariat), Ms Melonie Van Zyl (South Africa) and Mr. Patrick Mhango (Malawi)
CISNA has put in place an Action Plan to ensure that the above-stated strategic goals are effectively pursued with the view to realizing them by 2015. In addition, CISNA has formulated a Monitoring and Evaluation Framework which assesses and informs on the status of implementation of the various activities set out under each goal.
17.5 Participation in Activities of the East African Insurance Supervisors Association (EAISA)
The East African Insurance Supervisors Association (EAISA) was established by the insurance supervisory authorities in the East African Community (EAC) in December 2008.
The main objectives of EAISA are to —• Provide mutual cooperation and exchange of information for supervisory purposes;
• Maintain and promote a stable, effi cient, fair and safe insurance market in the region with a view to contributing to fi nancial stability; and
• Promote adequate protection of policyholders and to ensure conducive regulatory environment for stakeholders.
EAISA has fi ve members namely, the Agence de Regulation et de Controle des Assurances (ARCA), Burundi; the Insurance Regulatory Authority (IRA), Kenya; the National Bank of Rwanda (NBR); the Tanzania Insurance Regulatory Authority (TIRA); and the Insurance Regulatory Authority (IRA), Uganda. Alhaji Ibrahim Kaddunabbi Lubega (Chief Executive – IRA Uganda) served as EAISA chairperson during the period under review.
TIRA 2011 ANNUAL REPORT.indd Sec2:51TIRA 2011 ANNUAL REPORT.indd Sec2:51 1/18/13 9:47:56 AM1/18/13 9:47:56 AM

52
ANNUAL INSURANCE MARKET PERFORMANCE REPORT For The Year Ended 31st December 2011
Chief Executive Offi cers of EAC member states’ insurance regulatory authorities holding a copy of a Report on Peer Reviews of the Insurance Regulatory and Legal Frameworks of East African Insurance Supervisory Authorities as at 31st December 2011 before submission of same to EAC Secretariat in Arusha in April 2012. From right to left are Mr. Audace Nsabimana (Burundi), Mr. Israel Kamuzora (Tanzania), Alhaji Kaddunabi Ibrahim Lubega (Uganda), Mr. Sammy Makove (Kenya) and Mr. Kagabba Sangano (Rwanda)
EAISA members have signed a Memorandum of Understanding (MOU) which establishes a framework for mutual assistance in the following areas:
• Continuous monitoring, auditing, inspection and examination of Registered Persons for compliance with prudential and supervisory requirements;
• Identifi cation of potential risks that may affect insurance supervision and developing common mitigation strategy;
• Detection and reporting to the respective organs of fraudulent practices and money laundering in the insurance market;
• Capacity building on insurance and insurance supervision;
• Consumers education and public awareness on insurance;
• Harmonization of the legal and regulatory framework to ensure consistency and adherence to best international standards with the aim of alleviating regulatory arbitrage;
• Adherence to sound corporate governance practices in the insurance market;
• Research and development in the fi eld of insurance;
TIRA 2011 ANNUAL REPORT.indd Sec2:52TIRA 2011 ANNUAL REPORT.indd Sec2:52 1/18/13 9:47:57 AM1/18/13 9:47:57 AM

53
ANNUAL INSURANCE MARKET PERFORMANCE REPORT For The Year Ended 31st December 2011
• Developing a consolidated strategy to infl uence policy making and
• Other areas of mutual interest.
EAISA envisages formulating its fi rst Strategic Plan in early 2013. Meanwhile, the association has implemented several activities in line with its strategic mandate including the following:
• Carrying out a peer review of member states’ status of legal and regulatory compliance with insurance core principles of the International Association of Insurance Supervisors (IAIS);
• Formulating a mechanism for oversight of cross border insurance operations amongst EAC member states.
TIRA 2011 ANNUAL REPORT.indd Sec2:53TIRA 2011 ANNUAL REPORT.indd Sec2:53 1/18/13 9:47:57 AM1/18/13 9:47:57 AM

54
ANNUAL INSURANCE MARKET PERFORMANCE REPORT For The Year Ended 31st December 2011
PART 2: Audit Report and Financial Statements
of the Tanzania Insurance Regulatory Authority for the Year Ended 30th June 2011
TIRA 2011 ANNUAL REPORT.indd Sec2:54TIRA 2011 ANNUAL REPORT.indd Sec2:54 1/18/13 9:47:57 AM1/18/13 9:47:57 AM

55
ANNUAL INSURANCE MARKET PERFORMANCE REPORT For The Year Ended 31st December 2011
1.0 AUDIT REPORT AND FINANCIAL STATEMENTS
1.1 AUDIT REPORT
To: Prof. Gamaliel Mgongo Fimbo,The Chairman,National Insurance Board,P.O. Box 9892,DAR ES SALAAM
REPORT OF THE CONTROLLER AND AUDITOR GENERAL ON THE FINANCIAL STATEMENTS OF THE TANZANIA INSURANCE REGULATORY AUTHORITY FOR THE YEAR ENDED 30TH JUNE 2011
IntroductionI have audited the accompanying fi nancial statements of the Tanzania Insurance Regulatory Authority which comprises the statement of fi nancial position as at 30th June 2011, statement of comprehensive income, statement of changes in equity and statement of cash fl ows for the year then ended and a summary of signifi cant accounting policies and other explanatory notes set out on pages 12 to 36 of this report.
Directors’ responsibility for the fi nancial statementsThe Board of Directors of the Tanzania Insurance Regulatory Authority is responsible for the preparation and fair presentation of these fi nancial statements in accordance with the International Financial Reporting Standards. This responsibility includes designing, implementing and maintaining internal control relevant to the preparation and fair presentation of fi nancial statements that are free from material misstatements, whether due to fraud or error, selecting and applying appropriate accounting policies and making accounting estimates that are reasonable in the circumstances.
Responsibility of the Controller and Auditor GeneralMy responsibility as auditor is to express an independent opinion on the fi nancial statements based on the audit. The audit was conducted in accordance with the International Standards on Auditing (ISA), the International Standards of Supreme Audit Institutions (ISSAI) and such other audit procedures I considered necessary in the circumstances. These standards require that I comply with ethical requirements and plan and perform the audit to obtain reasonable assurance about whether the fi nancial statements are free from material misstatements.
An audit involves performing procedures to obtain audit evidence about the amounts and disclosures in the fi nancial statements. The procedures selected depend on the auditor’s judgment, including the assessment of the risks of material misstatements of the fi nancial statements, whether due to fraud or error. In making those risk assessments, the auditor considers internal control relevant to the Authority’s preparation and fair presentation of the fi nancial statements in order to design audit procedures that are appropriate in the circumstances, but not for the purpose of expressing an opinion on the effectiveness of the Authority’s internal control. An audit also includes evaluating the appropriateness of the accounting policies used and the reasonableness of the accounting estimates made by management, as well as evaluating the overall presentation of the fi nancial statements.
TIRA 2011 ANNUAL REPORT.indd Sec2:55TIRA 2011 ANNUAL REPORT.indd Sec2:55 1/18/13 9:47:57 AM1/18/13 9:47:57 AM

56
ANNUAL INSURANCE MARKET PERFORMANCE REPORT For The Year Ended 31st December 2011
In addition, Section 10(2) of the PAA of 2008 requires me to satisfy myself that the accounts have been prepared in accordance with appropriate accounting standards and that; reasonable precautions have been taken to safeguard the collection of revenue, receipt, custody, disposal, issue and proper use of public property, and that the law, directions and instructions applicable thereto have been duly observed and expenditures of public monies have been properly authorized.
Furthermore, Section 44(2) of the Public Procurement Act No. 21 of 2004 and Regulation 31 of the Public Procurement (Goods, Works, Non-Consultant Services and Disposal of Public Assets by Tender) Regulations, 2005 requires me to state in my annual audit report whether or not the auditee has complied with the provisions of the Law and its Regulations.
I believe that the audit evidence I have obtained is suffi cient and appropriate to provide a basis for my audit opinion.
Unqualifi ed OpinionIn my opinion, the fi nancial statements present fairly, in all material respects, the fi nancial position of the Tanzania Insurance Regulatory Authority as at 30th June 2011 and its fi nancial performance and its cash fl ows for the year then ended in accordance with the International Financial Reporting Standards.
Report on Other Legal and Regulatory Requirements In view of my responsibility on the procurement legislation, and taking into consideration the procurement transactions and processes, I have reviewed as part of this audit, I state that the Tanzania Insurance Regulatory Authority procurement has generally complied with the Public Procurement Act 2004 and its regulations of 2005.
Ludovick S.L. UtouhCONTROLLER AND AUDITOR GENERAL
Offi ce of the Controller and Auditor General,National Audit Offi ce,Dar es Salaam, Tanzania
23rd March, 2012
TIRA 2011 ANNUAL REPORT.indd Sec2:56TIRA 2011 ANNUAL REPORT.indd Sec2:56 1/18/13 9:47:57 AM1/18/13 9:47:57 AM

57
ANNUAL INSURANCE MARKET PERFORMANCE REPORT For The Year Ended 31st December 2011
1.2 Statement of Responsibility on the Financial Statements for the year ended 30th June, 2011
These fi nancial statements have been prepared by the management of the Tanzania Insurance Regulatory Authority in accordance with the provisions of Section 25(4) of the Public Finance Act. No 6 of 2001. The fi nancial statements comply with generally accepted accounting practices as required by the said Act and are presented in a manner consistent with the International Financial Reporting Standards (IFRS).
The management of the Tanzania Insurance Regulatory Authority is responsible for establishing and maintaining a system of effective Internal Control designed to provide reasonable assurance that the transactions recorded in the accounts are within the statutory authority and that they contain the receipt and use of all public fi nancial resources by the Tanzania Insurance Regulatory Authority
To the best of my knowledge, the system of Internal Control has operated adequately throughout the reporting period and that the Accounts and underlying records provide a reasonable basis for the preparation of the Financial Statements for the 2010/2011 fi nancial year.
I accept responsibility for the integrity of the Financial Statements, the information it contains, and its compliance with the Public Finance Act No. 6 of 2001(revised 2004) and the instructions issued by the Treasury in respect of the year under review.
Signed by Accounting Offi cer
Date 30th March, 2012
TIRA 2011 ANNUAL REPORT.indd Sec2:57TIRA 2011 ANNUAL REPORT.indd Sec2:57 1/18/13 9:47:58 AM1/18/13 9:47:58 AM

58
ANNUAL INSURANCE MARKET PERFORMANCE REPORT For The Year Ended 31st December 2011
Audited Financial Statements and Notes
TANZANIA INSURANCE REGULATORY AUTHORITY CONSOLIDATED STATEMENT OF FINANCIAL POSITION
AS AT 30TH JUNE 2011
ASSETS NOTES 2011 2010
(Shs) (Shs)
Non-Current Assets
Property, Plant & Equipment 2 1,774,419,695.29 1,877,838,114.90
Intangible assets 2 35,420,732.16 18,370,064.73
Assets held for Sale 2 22,886,047.45 25,702,199.70
Investment - Fixed deposit 3 5,480,946,684.22 3,728,569,254.56
Total Non-Current assets 7,313,673,159.12 5,650,479,633.89
Current Assets
Inventories 4 56,798,493.00 37,825,683.40
Trade & Other Receivables 5 1,254,375,153.21 1,490,675,153.11
Security Deposit 6 8,679,118.80 -
Prepaid expenses 7 19,758,768.98 5,883,700.00
Cash and Cash equivalents 8 841,078,255.81 927,129,537.55
Total Current assets 2,180,689,789.80 2,461,514,074.06
TOTAL ASSETS 9,494,362,948.92 8,111,993,707.95
EQUITY AND LIABILITIES
Capital and Reserves
Capital Fund 603,403,404.31 603,403,404.31
Revaluation reserve 67,487,471.35 67,487,471.35
Accumulated reserves 9 8,538,989,651.27 6,939,380,292.84
Total Capital and Reserves 9,209,880,526.93 7,610,271,168.50
Current Liabilities
Trade & Other Payables 10 203,232,027.59 309,207,537.00
Provisions for liabilities and charges 10 81,250,394.40 192,515,002.45
Total Current Liabilities 284,482,421.99 501,722,539.45
TOTAL EQUITY AND LIABILITIES 9,494,362,948.92 8,111,993,707.95
NOTES 1 TO 18 FORM PART OF THESE ACCOUNTS
......................................... ................................. ........................................... Chairperson NIB Director NIB Commissioner of Insurance
TIRA 2011 ANNUAL REPORT.indd Sec2:58TIRA 2011 ANNUAL REPORT.indd Sec2:58 1/18/13 9:47:58 AM1/18/13 9:47:58 AM

59
ANNUAL INSURANCE MARKET PERFORMANCE REPORT For The Year Ended 31st December 2011
TANZANIA INSURANCE REGULATORY AUTHORITY CONSOLIDATED STATEMENT OF COMPREHENSIVE INCOME
FOR THE YEAR ENDED ON 30TH JUNE 2011
NOTES 2011 2010INCOME (Shs) (Shs)Administration 11 4,917,604,125.74 4,076,340,922.44 Fidelity 11 356,300,870.20 291,914,707.13
Total Income 5,273,904,995.94 4,368,255,629.57
LESS:
EXPENSES Administrative expenses 12 2,954,302,433.02 2,013,807,687.98
Board Expenses 13 133,885,052.00 139,383,445.75
Inspection expenses 14 26,464,736.00 19,993,159.36
Finance Charges 15 7,333,741.85 4,837,443.17 Markert Research , ICT & Education 16 162,851,855.90 223,149,531.50
Other Expenses 17 389,457,818.74 294,307,594.17
Total Expenses 3,674,295,637.51 2,695,478,861.93 Surplus for the year 1,599,609,358.43 1,672,776,767.64
NOTES 1 TO 18 FORM PART OF THESE ACCOUNTS
........................................ ................................. ........................................... Chairperson NIB Director NIB Commissioner of Insurance
TIRA 2011 ANNUAL REPORT.indd Sec2:59TIRA 2011 ANNUAL REPORT.indd Sec2:59 1/18/13 9:47:58 AM1/18/13 9:47:58 AM

60
ANNUAL INSURANCE MARKET PERFORMANCE REPORT For The Year Ended 31st December 2011
TANZANIA INSURANCE REGULATORY AUTHORITYCONSOLIDATED STATEMENT OF CASHFLOW
FOR YEAR ENDED 30TH JUNE 2011
NOTES 2011 2010
(Shs) (Shs)Cash fl ow from operating ActivitiesSurplus for the year 9 1,599,609,358.43 1,672,776,767.64 Adjustment for: Depreciation charges 2 221,545,915.04 137,394,380.29 (Increase)/ Decrease in Inventories 4 (18,972,809.60) 2,403,566.00 Profi t on Disposal of Fixed Assets (1,630,000.00) (11,381,272.90)
(Increase)/ Decrease in Trade & Other Receivables 5,6 &7 213,745,812.12 (542,806,877.76)
Increase/ (Decrease) in Trade & Other Payables 10
(105,975,509.41) 81,887,092.73
Increase/ (Decrease) in Provision 10 (111,264,608.05) 143,365,704.82
Net Cash Flow From Operating Activities 1,797,058,158.53 1,483,639,360.82 Cash Flows From Investing Activities Increase In Fixed Assets 2 (132,362,010.61) (264,691,076.90)Proceeds from sale of Fixed assets 1,630,000.00 4,500,000.00 Increase in Investments-Fixed deposits 3 (1,752,377,429.66) (824,113,896.20)
Net Cash fl ow from Investing Activities
(1,883,109,440.27) (1,084,304,973.10)
Net Increase/ (Decrease) in Cash and Cash equivalents (86,051,281.74) 399,334,387.72
Cash and Cash equivalents balance at the beginning of the year 927,129,537.55 527,795,149.83
Cash and Cash equivalents balance at the end of the year 841,078,255.81 927,129,537.55
NOTES 1 TO 18 FORM PART OF THESE ACCOUNTS
....................................... ................................. ........................................... Chairperson NIB Director NIB Commissioner of Insurance
TIRA 2011 ANNUAL REPORT.indd Sec2:60TIRA 2011 ANNUAL REPORT.indd Sec2:60 1/18/13 9:47:58 AM1/18/13 9:47:58 AM
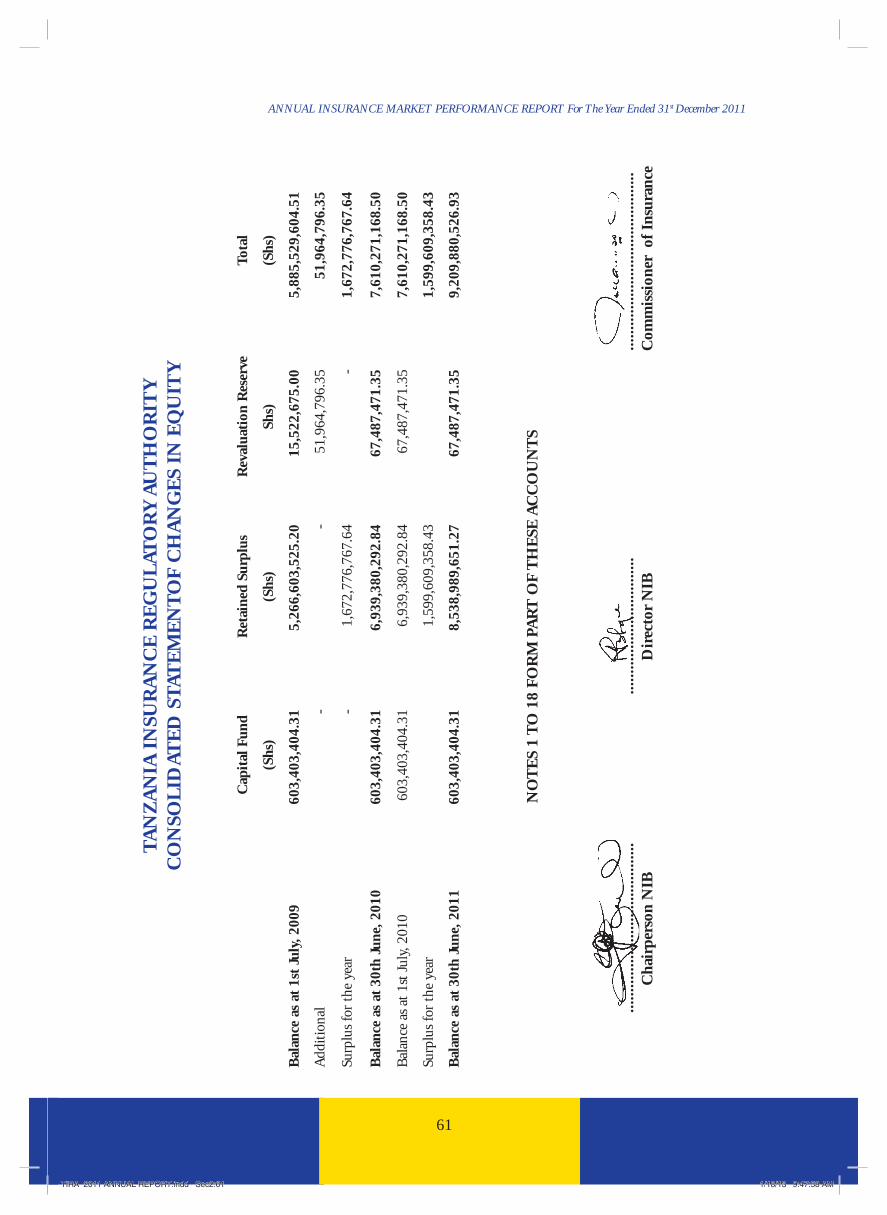
61
ANNUAL INSURANCE MARKET PERFORMANCE REPORT For The Year Ended 31st December 2011
TA
NZ
AN
IA I
NSU
RA
NC
E R
EG
UL
ATO
RY
AU
TH
OR
ITY
CO
NSO
LID
ATE
D S
TAT
EM
EN
TO
F C
HA
NG
ES
IN E
QU
ITY
Cap
ital
Fun
dR
etai
ned
Surp
lus
Rev
alua
tion
Res
erve
Tota
l
(Shs
)(S
hs)
Shs)
(Shs
)
Bal
ance
as
at 1
st J
uly,
200
960
3,40
3,40
4.31
5,26
6,60
3,52
5.20
15,5
22,6
75.0
05,
885,
529,
604.
51
Add
itio
nal
-
-
51,9
64,7
96.3
5 51
,964
,796
.35
Surp
lus
for
the
year
-
1,67
2,77
6,76
7.64
-
1,67
2,77
6,76
7.64
Bal
ance
as
at 3
0th
June
, 201
060
3,40
3,40
4.31
6,93
9,38
0,29
2.84
67,4
87,4
71.3
5 7,
610,
271,
168.
50
Bal
ance
as
at 1
st Ju
ly, 2
010
603,
403,
404.
31
6,93
9,38
0,29
2.84
67,4
87,4
71.3
5 7,
610,
271,
168.
50
Surp
lus
for
the
year
1,59
9,60
9,35
8.43
1,59
9,60
9,35
8.43
Bal
ance
as
at 3
0th
June
, 201
160
3,40
3,40
4.31
8,53
8,98
9,65
1.27
67,4
87,4
71.3
5 9,
209,
880,
526.
93
NO
TE
S 1
TO
18
FOR
M P
AR
T O
F T
HE
SE A
CC
OU
NT
S
...
......
......
......
......
......
......
.. ...
......
......
......
......
......
...
......
......
......
......
......
......
....
C
hair
pers
on N
IB
Dir
ecto
r N
IB
C
omm
issi
oner
of
Insu
ranc
e
TIRA 2011 ANNUAL REPORT.indd Sec2:61TIRA 2011 ANNUAL REPORT.indd Sec2:61 1/18/13 9:47:58 AM1/18/13 9:47:58 AM

62
ANNUAL INSURANCE MARKET PERFORMANCE REPORT For The Year Ended 31st December 2011
1.4 NOTES TO THE FINANCIAL STATEMENTS
NOTE 1 ACCOUNTING POLICIES
The fi nancial statements are prepared under the historical cost conventions as modifi ed to include revaluation of assets in accordance with International fi nancial Reporting Standards. The principal accounting policies adopted are consistent with those applied in previous years.
TIRA has adopted the International Financial Reporting Standards (IFRS) as pronounced by National Board of Accountants and auditors (NBAA).
The preparation of fi nancial statements in conformity with IFRS requires the use of accounting estimates in some circumstances. It also requires management to exercise its judgment in the process of applying TIRA’s accounting policies. The areas involving higher degree of complex judgments or assumptions and signifi cant estimates to the fi nancial statements are separately disclosed in notes to accounts.
Revenue recognitionRevenue is recognized to the extent that it is probable that the economic benefi ts will fl ow to TIRA and the revenue can be reliably measured. The following specifi c recognition criteria must be met before revenue is recognized:
Premium Levy
Premium levy is charged from the insurance business generated by insurance companies. TIRA recognizes premium levy as revenue when companies underwrite business.
Insurance stickersRevenue from insurance stickers is recognized when stickers are delivered to the client.
Fines & PenaltiesFines and penalties are recognized as income when demand notes are issued.
Interest IncomeInterest income is recorded at the effective interest rate, which is the rate that exactly discounts estimated future cash receipts through the expected life of the fi nancial instrument.
Offi ce Partitions, Machinery and Equipment
Offi ce Partitions, machinery and equipment are initially recorded at cost. Offi ce partitions, machinery and equipment are reported at cost/valuation less provisions for impairment (loss in value for the benefi ts derived from the use of such asset). The cost of assets owned by TIRA includes expenditure that is directly attributable to the acquisition of the item (s). All repairs and maintenance relating to the item(s) are charged to the income and expenditure account during the fi nancial year in which they relate.
TIRA 2011 ANNUAL REPORT.indd Sec2:62TIRA 2011 ANNUAL REPORT.indd Sec2:62 1/18/13 9:47:58 AM1/18/13 9:47:58 AM

63
ANNUAL INSURANCE MARKET PERFORMANCE REPORT For The Year Ended 31st December 2011
Increases in amounts arising from valuation of assets are credited to the valuation reserve in the shareholder’s Fund. Decreases that offset previous increases of the same assets are charged against revaluation reserve, while others are charged to the income and expenditure statement.
Depreciation on assets is calculated using the straight-line method to allocate their costs or revalued amounts to their residual values over their estimated useful lives using the following rates which have been applied consistently:
Asset Depreciation Rate
Motor Vehicles 25%
Furniture & Fittings 12.5%
Offi ce Equipment 12.5%
Computers 33.33%
Offi ce Buildings (Partition) 4%
Standby Generator 25%
Offi ce Building 4%
Computer software 33.33%
Depreciation is charged on fi xed assets acquired during the year, for the period of use of such asset in the year of acquisition. Depreciation will be charged in the year of disposal of an asset for the period of use.
TaxationTIRA is an autonomous Government Authority, which is non-profi t making. TIRA depends on levies from the registered insurance companies as its main source of income. The Authority just like all other Government institutions pays consumption taxes.
InvestmentsInvestments with fi xed maturity dates are classifi ed as held to maturity and are carried at amortized cost, i.e. cost plus accrued income using the effective market interest rate. Fair value gains (loss) arising on investments held by TIRA is credited /debited) to the profi t and loss account when realized.
Interest income is recognized in the income statement on an accrual basis taking into account the effective yield on the asset.
Foreign Currencies TranslationItems included in the fi nancial statements of TIRA are measured using Tanzania Shilling (TShs), which is the currency in which TIRA operates.
Foreign currency transactions are translated into TShs using the exchange rate prevailing at the date of transaction. Gain/(loss) resulting from the settlement of such transactions at month end are recognized in the income statement.
TIRA 2011 ANNUAL REPORT.indd Sec2:63TIRA 2011 ANNUAL REPORT.indd Sec2:63 1/18/13 9:47:58 AM1/18/13 9:47:58 AM

64
ANNUAL INSURANCE MARKET PERFORMANCE REPORT For The Year Ended 31st December 2011
InventoriesTIRA inventories are assets in the form of materials or supplies to be consumed in the rendering of services.Inventories are valued at latest purchase prices less provision for any obsolete/damaged inventories. The costs of inventories are assigned by using the fi rst in fi rst out method.
ReceivablesReceivables are carried out at anticipated realizable value. Provision for impairment (failure to pay) is made based on specifi c receivables considered being doubtful of recovery.
Cash and Cash EquivalentsCash and cash equivalents includes cash in hand, deposits held with banks, other highly liquid investments with original maturities of three months or less net of bank overdraft.
ProvisionsProvision are recognized when TIRA has constructive obligation as a result of past events, when it is probable that an outfl ow of resources embodying economic benefi ts will be required to settle the obligation and/or a reliable estimate of obligation can be made.
Employee Retirement Benefi tsTIRA operates a defi ned contribution plan through Parastatal Pension Fund (PPF), National Social Security Fund (NSSF), Zanzibar Social Security Fund (ZSSF) and Public Service Pension Fund (PSPF). The Pension plan is normally funded by contributions from both the Authority (15%) and employee (5%). TIRA contributions are charged to income statement in the year in which it relates. TIRA also pays insurance premiums to cover its staff against Personal accident and employer’s workmen’s compensation benefi ts.
Balance (Surplus) arising from Income and Expenditure AccountAccumulated Balance arising from Income and Expenditure account will be utilized for future development activities as follows:-
• Investment in information and communication technology (ICT) including among others, E-Supervision.
• Setting up of TIRA zonal contact offi ces in high activity insurance zones.
• Offi ce expansion due to increase in staff and TIRA activities, and
• Creation of special funds to take care of crisis which may arise from failure of insurance companies.
Comparative fi guresComparative fi gures are adjusted whenever necessary to conform to changes in presentation in the current year.
Revaluation of AssetsRevaluation of Assets shall be made once in every three years or when the need to revalue assets arises.
TIRA 2011 ANNUAL REPORT.indd Sec2:64TIRA 2011 ANNUAL REPORT.indd Sec2:64 1/18/13 9:47:58 AM1/18/13 9:47:58 AM

65
ANNUAL INSURANCE MARKET PERFORMANCE REPORT For The Year Ended 31st December 2011
NO
TE
2: S
CH
ED
UL
E O
F P
RO
PE
RT
Y, P
LA
NT
AN
D E
QU
IPM
EN
T
FIX
ED
ASS
ET
SM
otor
V
ehic
leO
ffi ce
B
uild
ing
Lan
dSt
andb
y G
ener
ator
Offi
ce
Furn
itur
eO
ffi c
e E
quip
men
tsO
ffi c
e P
arti
onin
gC
ompu
ters
Soft
war
eTo
tal
Cos
t as
at
1st J
uly
2010
32
6,48
1,44
6
957,
612,
629
567,
733,
500
110,
572,
044
117,
015,
170
45
,122
,908
27
,324
,646
28
4,48
6,68
8
18
,370
,065
2,
454,
719,
096
Add
itio
ns/
Ded
ucti
on
(8
,897
,077
)
28
,223
,755
-
-
21,9
23,9
96
16,6
47,5
00
26,0
11,2
78
25
,279
,149
23
,173
,410
132,
362,
011
Dis
posa
ls-
-
-
-
(5
,511
,000
)(1
1,05
5,79
8)
-
(16,
505,
268)
- (3
3,07
2,06
6)
Cos
ts a
s at
30
th Ju
ne 2
010
317,
584,
369
98
5,83
6,38
4
56
7,73
3,50
0
11
0,57
2,04
4
13
3,42
8,16
6
50
,714
,610
53
,335
,923
29
3,26
0,56
9
41,5
43,4
75
2,55
4,00
9,04
1
Acc
umul
ated
D
epre
citi
on a
s at
1s
t Jul
y 20
10
147,
370,
826
10
6,69
5,77
8
-
71,2
20,0
00
37
,099
,610
19
,086
,448
6,95
2,19
5
14
4,38
3,86
0
53
2,80
8,71
7
Adj
ustm
ent o
n A
cc.
Dep
deci
atio
n
(5,5
11,0
00)
(11,
055,
798)
(16,
505,
268)
(33,
072,
066)
Adj
ustm
ent o
n D
epre
ciat
ion
(4,4
48,5
39)
(4,4
48,5
39)
Dep
reci
atio
n ch
arge
s fo
r ye
ar 2
0010
/11
77,2
35,7
42
38,9
46,7
42
-
9,
838,
011
14
,679
,146
4,
273,
826
1,
581,
185
73
,317
,059
6,
122,
743
22
5,99
4,45
4
Tota
l Dep
reci
atio
n ch
arge
s fo
r ye
ar
2001
0/12
72
,787
,203
38,9
46,7
42
-
9,
838,
011
14,6
79,1
46
4,27
3,82
6
1,
581,
185
73,3
17,0
59
6,12
2,74
3
221,
545,
915
Acc
umul
ated
D
epre
citi
on a
s at
30
th Ju
ne 2
011
220,
158,
029
14
5,64
2,52
0
-
81
,058
,011
46
,267
,756
12,3
04,4
76
8,53
3,38
0
20
1,19
5,65
1
6,
122,
743
72
1,28
2,56
6
Sub-
tota
l88
,784
,939
84
0,19
3,86
5 56
7,73
3,50
0 29
,514
,033
87
,160
,410
38,4
10,1
34
44,8
02,5
43
92,0
64,9
17
35,4
20,7
32
1,82
4,08
5,07
3
Ass
ets
held
for
sale
s8,
641,
402
-
-
-
-
-
-
-
- 8,
641,
402
Net
Boo
k va
lue
as a
t 30
June
201
1
97,4
26,3
40
84
0,19
3,86
5
56
7,73
3,50
0
29
,514
,033
87
,160
,410
38
,410
,134
44
,802
,543
92
,064
,917
35,4
20,7
32
1,83
2,72
6,47
5
Net
Boo
k va
lue
as a
t 30
June
201
0
17
9,11
0,62
1
850,
916,
852
567,
733,
500
39,3
52,0
44
79,9
15,5
60
26,0
36,4
60
20,3
72,4
50
140,
102,
828
18
,370
,065
1,
921,
910,
379
TIRA 2011 ANNUAL REPORT.indd Sec2:65TIRA 2011 ANNUAL REPORT.indd Sec2:65 1/18/13 9:47:58 AM1/18/13 9:47:58 AM

66
ANNUAL INSURANCE MARKET PERFORMANCE REPORT For The Year Ended 31st December 2011
30th June 2011 30th June 20103 Investments Tshs Tshs Administration Fund Account 3,916,254,540.33 2,634,855,579.59 Fidelity Fund Account 1,520,612,999.37 1,093,713,674.97 Total 5,436,867,539.70 3,728,569,254.56 4 Inventories Tshs Tshs Motor Insurance stickers 22,190,000.00 6,886,250.00 Stationery - Dar Offi ce 33,096,240.00 29,362,828.40 stationery - Zanzibar Offi ce 959,853.00 1,576,605.00 stationery - Mwanza Offi ce 552,400.00 - Total 56,798,493.00 37,825,683.40 5 Trade and Other Receivables Trade Reveivables 844,906,155.37 1,023,249,498.12 Staff Receivables Tshs Tshs Staff Education loans 55,651,714.16 40,880,709.39 Staff Salary Advance 35,260,257.10 37,773,667.16 Staff Medical 1,493,511.65 2,379,466.77 Staff Car maint. loans 64,170,668.27 27,763,118.31 Staff Car loan 20,102,075.40 31,774,815.40 Staff Safari imprest 1,004,148.00 5,013,915.00 Staff Eid, Easter Loan 4,149,169.00 521,711.36 181,831,543.58 146,107,403.39 Other Receivables Tshs Tshs BOT 54,556,926.65 121,806,012.11 SUMATRA - - TCAA - 5,980,000.00 Receivables on sale of M/vehicle - 525,000.00 Other Receivables- AIO Confer.
Organ. Committ 679,712.00 679,712.00 55,236,638.65 128,990,724.11 Interest Receivable Tshs Tshs Interest receivable
-Administration 84,927,017.04 77,718,329.95 84,927,017.04 77,718,329.95
Sub Total - Administration 1,166,901,354.64 1,376,065,955.57
TIRA 2011 ANNUAL REPORT.indd Sec2:66TIRA 2011 ANNUAL REPORT.indd Sec2:66 1/18/13 9:47:58 AM1/18/13 9:47:58 AM
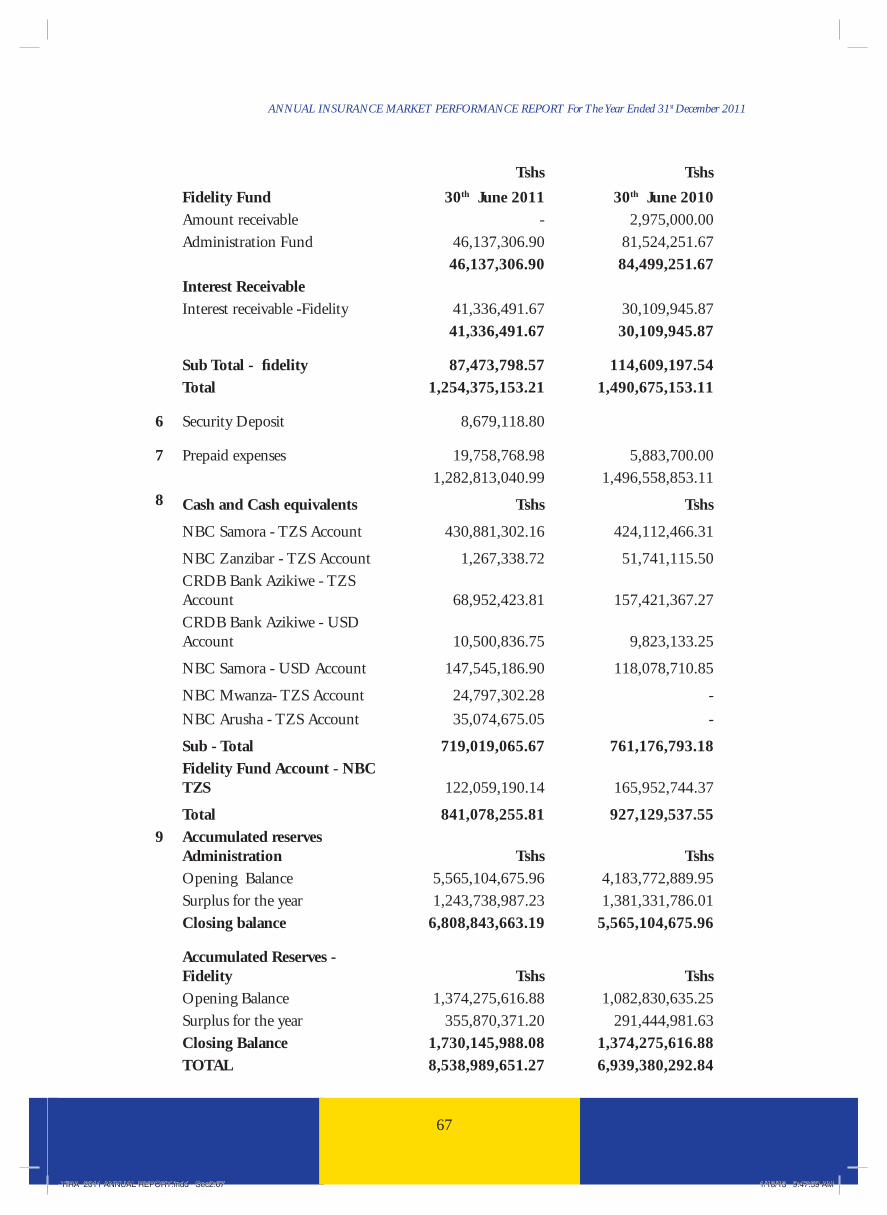
67
ANNUAL INSURANCE MARKET PERFORMANCE REPORT For The Year Ended 31st December 2011
Tshs Tshs Fidelity Fund 30th June 2011 30th June 2010 Amount receivable - 2,975,000.00 Administration Fund 46,137,306.90 81,524,251.67 46,137,306.90 84,499,251.67 Interest Receivable Interest receivable -Fidelity 41,336,491.67 30,109,945.87 41,336,491.67 30,109,945.87 Sub Total - fi delity 87,473,798.57 114,609,197.54 Total 1,254,375,153.21 1,490,675,153.11 6 Security Deposit 8,679,118.80 7 Prepaid expenses 19,758,768.98 5,883,700.00 1,282,813,040.99 1,496,558,853.118 Cash and Cash equivalents Tshs Tshs NBC Samora - TZS Account 430,881,302.16 424,112,466.31 NBC Zanzibar - TZS Account 1,267,338.72 51,741,115.50 CRDB Bank Azikiwe - TZS
Account 68,952,423.81 157,421,367.27 CRDB Bank Azikiwe - USD
Account 10,500,836.75 9,823,133.25 NBC Samora - USD Account 147,545,186.90 118,078,710.85 NBC Mwanza- TZS Account 24,797,302.28 - NBC Arusha - TZS Account 35,074,675.05 - Sub - Total 719,019,065.67 761,176,793.18 Fidelity Fund Account - NBC
TZS 122,059,190.14 165,952,744.37 Total 841,078,255.81 927,129,537.55 9 Accumulated reserves
Administration Tshs Tshs Opening Balance 5,565,104,675.96 4,183,772,889.95 Surplus for the year 1,243,738,987.23 1,381,331,786.01 Closing balance 6,808,843,663.19 5,565,104,675.96 Accumulated Reserves -
Fidelity Tshs Tshs Opening Balance 1,374,275,616.88 1,082,830,635.25 Surplus for the year 355,870,371.20 291,444,981.63 Closing Balance 1,730,145,988.08 1,374,275,616.88 TOTAL 8,538,989,651.27 6,939,380,292.84
TIRA 2011 ANNUAL REPORT.indd Sec2:67TIRA 2011 ANNUAL REPORT.indd Sec2:67 1/18/13 9:47:59 AM1/18/13 9:47:59 AM
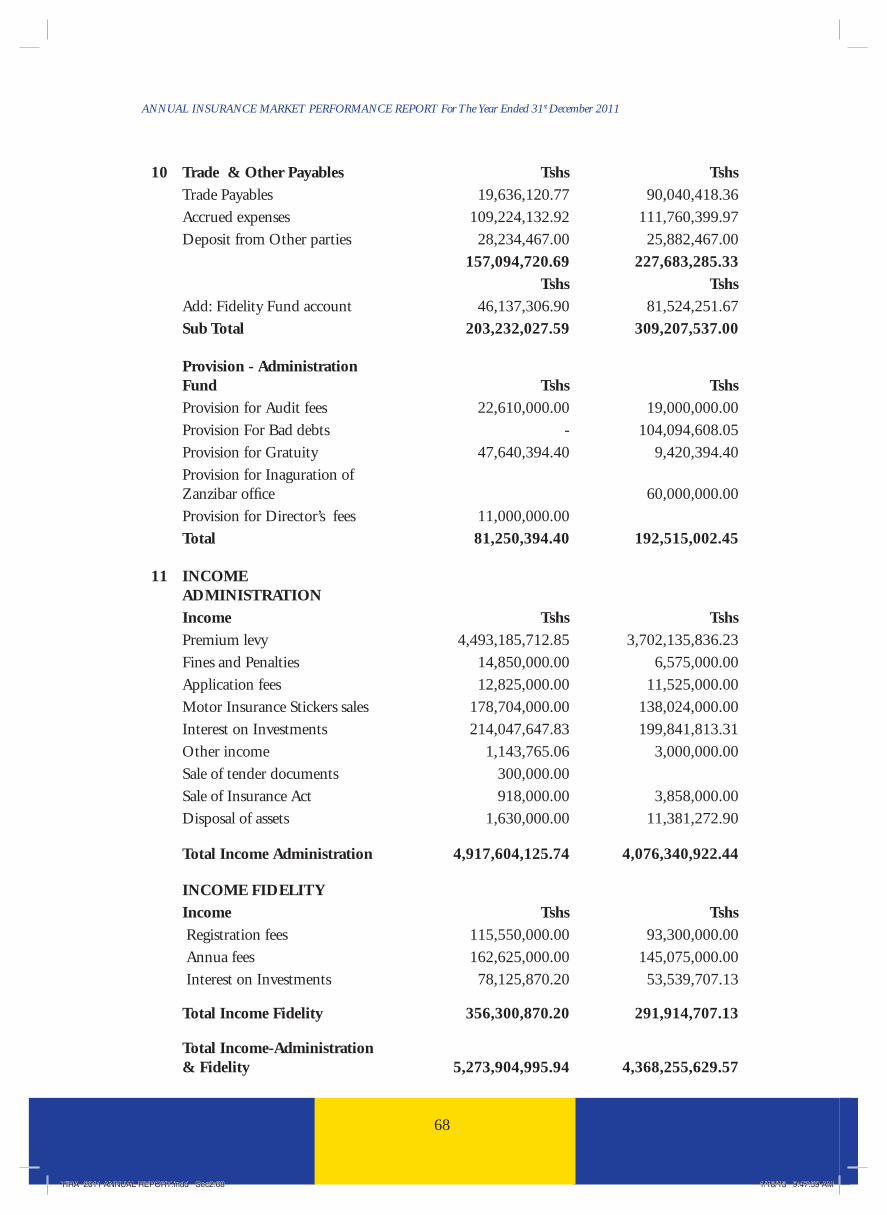
68
ANNUAL INSURANCE MARKET PERFORMANCE REPORT For The Year Ended 31st December 2011
10 Trade & Other Payables Tshs Tshs Trade Payables 19,636,120.77 90,040,418.36 Accrued expenses 109,224,132.92 111,760,399.97 Deposit from Other parties 28,234,467.00 25,882,467.00 157,094,720.69 227,683,285.33 Tshs Tshs Add: Fidelity Fund account 46,137,306.90 81,524,251.67 Sub Total 203,232,027.59 309,207,537.00 Provision - Administration
Fund Tshs Tshs Provision for Audit fees 22,610,000.00 19,000,000.00 Provision For Bad debts - 104,094,608.05 Provision for Gratuity 47,640,394.40 9,420,394.40 Provision for Inaguration of
Zanzibar offi ce 60,000,000.00 Provision for Director’s fees 11,000,000.00 Total 81,250,394.40 192,515,002.45 11 INCOME
ADMINISTRATION Income Tshs Tshs Premium levy 4,493,185,712.85 3,702,135,836.23 Fines and Penalties 14,850,000.00 6,575,000.00 Application fees 12,825,000.00 11,525,000.00 Motor Insurance Stickers sales 178,704,000.00 138,024,000.00 Interest on Investments 214,047,647.83 199,841,813.31
Other income 1,143,765.06 3,000,000.00 Sale of tender documents 300,000.00 Sale of Insurance Act 918,000.00 3,858,000.00 Disposal of assets 1,630,000.00 11,381,272.90 Total Income Administration 4,917,604,125.74 4,076,340,922.44 INCOME FIDELITY Income Tshs Tshs Registration fees 115,550,000.00 93,300,000.00 Annua fees 162,625,000.00 145,075,000.00 Interest on Investments 78,125,870.20 53,539,707.13 Total Income Fidelity 356,300,870.20 291,914,707.13 Total Income-Administration
& Fidelity 5,273,904,995.94 4,368,255,629.57
TIRA 2011 ANNUAL REPORT.indd Sec2:68TIRA 2011 ANNUAL REPORT.indd Sec2:68 1/18/13 9:47:59 AM1/18/13 9:47:59 AM

69
ANNUAL INSURANCE MARKET PERFORMANCE REPORT For The Year Ended 31st December 2011
12 ADMINISTRATIVE EXPENSES 30th June 2011 30th June 2010
Personnel costs Tshs Tshs Salaries and Wages 1,130,189,279.38 723,791,296.86 Utility Allowances 71,355,989.50 60,660,000.00 Contribution to Pension
Schemes 138,994,432.45 91,053,979.55 Gratuity to Contract Employees 38,220,000.00 27,300,000.00 Acting Allowance 9,458,214.54 21,273,476.28 Staff leave Expenses 79,495,185.62 51,700,524.71 Medical Expenses 40,312,959.32 22,936,336.20 Staff Welfare Expenses 3,250,000.00 4,635,000.00 Recruitment Expenses 50,810,625.50 15,480,900.00 Workman Compensation
&Insurance 20,853,555.00 19,424,275.00 Furniture Allowances 21,650,148.00 House Maintenance Allowance 129,574,517.21 73,294,577.78 Extra Duty Allowance 10,312,000.00 8,968,000.00 Special Monthly Allowance 23,405,895.82 8,966,100.00 Sub-Total 1,746,232,654.34 1,151,134,614.38 Transport and
Travelling expenses Tshs Tshs Fare 84,882,946.30 62,451,453.50 Subsistance Allowance 135,533,472.61 135,170,396.15 Registration and Participation 2,868,025.00 4,183,670.35 Visa Fees 799,406.30 Outfi t allowance 1,389,426.00 2,034,399.00 Transfer cost to zonal offi ces 76,073,933.50 - Sub-Total 301,547,209.71 203,839,919.00 Workshop Seminar and
Training costs Tshs Tshs Fare - Training 30,407,558.00 26,719,306.04 Registration/ Participation fees 75,155,384.63 67,519,364.29 Book and Stationery Allowance 385,000.00 - Subsistance Allowance 150,003,462.04 136,323,069.61 Outfi t Allowance 5,076,225.00 4,544,724.00 Passport and Visa fee 2,550,755.00 1,107,500.00 Research & Field Allowance 889,620.86 183,000.00 Training master Evening
Programmes 943,641.64 Sub-Total 264,478,005.53 237,340,605.58 Offi ce Rent Offi ce Rent -Zonal offi ces 38,916,243.22 -
TIRA 2011 ANNUAL REPORT.indd Sec2:69TIRA 2011 ANNUAL REPORT.indd Sec2:69 1/18/13 9:47:59 AM1/18/13 9:47:59 AM

70
ANNUAL INSURANCE MARKET PERFORMANCE REPORT For The Year Ended 31st December 2011
Property expenses 30th June 2011 30th June 2010 Tshs Tshs Electricity Expenses 24,754,961.70 22,179,946.53 Water Expenses 2,323,257.24 1,010,806.50 Security Guards 13,739,000.00 13,020,000.00 Cleaning Expenses 33,020,176.00 25,188,220.00 Land Rent and Service Charges 13,212,750.00 1,303,101.00 Property Tax 116,000.00 116,000.00 Offi ce Repairs and Maintanance 8,317,560.00 43,074,940.00 Fumigation 1,500,000.00 1,550,000.00 Sub-Total 96,983,704.94 107,443,014.03 Repairs and maintenance costs Repairs & Maint Eqpmt
Furniture 3,375,700.00 5,492,170.83 Repairs Maint Computers
UPS and Printer 3,329,800.00 575,000.00 Sub-Total 6,705,500.00 6,067,170.83 Communication expenses Tshs Tshs Telephone and Faxes 25,445,846.20 20,834,009.64 Mobile Phones 74,180,000.00 7,850,000.00 Internet and E-mails 20,751,538.31 13,527,975.65 Postal Box Rental 177,000.00 118,000.00 Postage Expenses 6,993,415.27 6,265,543.64 Sub-Total 127,547,799.78 48,595,528.93 Offi ce car running and
Transport expenses Tshs Tshs Car Fuel 25,512,393.00 20,834,770.00 Car Repairs and Maintainance 21,437,149.57 12,817,858.31 Mileage Allowance 145,995,184.10 76,938,460.00 Sub-Total 192,944,726.67 110,591,088.31 Printing and Stationeries Tshs Tshs Stationeries Costs 21,049,002.45 18,538,132.10 Printing Costs 10,760,294.00 5,436,767.80 Printing Costs - Motor
Insurance Sticker 65,151,874.00 50,321,250.00 Computer Accessories and
Software 2,290,000.00 7,354,220.00 Costs of Purchasing Insurance Act 2,000,000.00 Sub-Total 101,251,170.45 81,650,369.90
TIRA 2011 ANNUAL REPORT.indd Sec2:70TIRA 2011 ANNUAL REPORT.indd Sec2:70 1/18/13 9:47:59 AM1/18/13 9:47:59 AM

71
ANNUAL INSURANCE MARKET PERFORMANCE REPORT For The Year Ended 31st December 2011
Annual Subscription fees Tshs Tshs Annual Subscription -
Prof Bodies Local & Inter 2,517,535.27 4,337,473.45 Annual&Membership
AIO OESAI IAISA&Others 23,065,289.99 18,528,303.87 Subscription fee Satellite Dish 1,427,793.12 - Sub-Total 27,010,618.38 22,865,777.32 Committee expenses 30th June 2011 30th June 2010
Tshs Tshs Parliamentary Economic &
Finance Committee 9,522,500.00 8,910,000.00 Tender Board 8,734,000.00 22,436,100.00 Appointment/Intergrity/Audit
Committee 6,971,100.00 3,417,500.00 Workers Council - 4,627,408.30 Evaluation Committee 5,375,000.00 ICT Committee 4,718,500.00 Sub-Total 35,321,100.00 39,391,008.30 Generator Running expenses Tshs Tshs Generator Fuel 11,262,100.00 3,884,000.00 Other repair costs 4,101,600.00 1,004,591.40 Sub-Total 15,363,700.00 4,888,591.40 GRAND TOTAL 2,954,302,433.02 2,013,807,687.98 13 NATIONAL INSURANCE
BOARD EXPENSES Tshs Tshs NIB Meeting Expenses 69,370,772.00 64,928,625.75 Directors Fees Expenses 22,000,000.00 24,500,000.00 NIB Finance Audit &
H R Committee 12,370,000.00 20,766,500.00 NIB Technical Committee 11,244,280.00 29,188,320.00 Provisions NIB Sitting
allowances 18,900,000.00 - Total 133,885,052.00 139,383,445.75 14 MARKET PLAYERS
INSPECTION COSTS Tshs Tshs Fare 2,543,500.00 340,000.00 Perdiems & Incidental 19,720,000.00 15,113,159.36 Local Transport & Meal
Allowance 3,951,236.00 1,990,000.00 Printing and Binding expenses 250,000.00 2,550,000.00 Total 26,464,736.00 19,993,159.36
TIRA 2011 ANNUAL REPORT.indd Sec2:71TIRA 2011 ANNUAL REPORT.indd Sec2:71 1/18/13 9:47:59 AM1/18/13 9:47:59 AM

72
ANNUAL INSURANCE MARKET PERFORMANCE REPORT For The Year Ended 31st December 2011
15 FINANCE CHARGES Tshs Tshs Bank Charges 6,903,242.85 4,367,717.67 Sub total 6,903,242.85 4,367,717.67 Fidelity Fund account Bank Charges 430,499.00 469,725.50 Total 7,333,741.85 4,837,443.17 16 MRKT RESEARCH,
INFORMATION COMMUNICATION & EDUCATION 30th June 2011 30th June 2010
Tshs Tshs Advertising Costs 24,778,206.01 5,747,182.50 Insurance Industry Conference
& Seminars 49,634,439.50 36,959,080.00 Promotion Plan/ Awareness
creation 26,962,776.00 83,152,361.50 Market Research Costs 48,142,434.39 20,442,660.00 Support to Risk Management
Institute - 5,000,000.00 Printing costs Annual Market
Performance Report 13,334,000.00 10,610,940.00
TIRA Inauguration Expenses - 61,237,307.50
Total 162,851,855.90 223,149,531.50 17 OTHER OPERATING COSTS Tshs Tshs Hospitality Expenses 498,000.00 Staff Uniforms 9,443,000.00 1,836,000.00 Donations 6,405,000.00 2,950,000.00 Offi ce Tea and Refreshments 19,689,550.00 11,610,940.00 Newspaper,
Gazettes&Periodicals 4,397,640.00 3,342,300.00 Manual/Corporate
Plan/Consultancy 43,297,040.00 83,431,437.88 Loss of Assets 19,523,995.73 - Insurance Act 1996 Review
Expenses 2,445,000.00 4,299,872.00 Remittance to Treasurery 19,083,244.18 30,545,118.45 Long Service Award 12,400,000.00 9,300,000.00 Exchange rate Gain (93,063,918.29) (27,823,254.45) Depreciation Charge 221,545,915.04 137,394,380.29 Audit Fees 22,610,000.00 19,000,000.00
TIRA 2011 ANNUAL REPORT.indd Sec2:72TIRA 2011 ANNUAL REPORT.indd Sec2:72 1/18/13 9:47:59 AM1/18/13 9:47:59 AM

73
ANNUAL INSURANCE MARKET PERFORMANCE REPORT For The Year Ended 31st December 2011
Annual Stocktaking/Audit Expenses 11,839,000.00 18,420,800.00
Litigation Costs Court Cases Expenses 500,000.00
Budget Preparation Expenses 30,203,857.50 - Combating Insurance crime 325,000.00 - Insurance Ombudsman Services
and Insurance Appeals Tribunal 41,950,387.58 - Insurance for TIRA Properties 16,365,107.00 Total 389,457,818.74 294,307,594.17 18 RELATED PARTY
TRANSACTIONS Tshs Tshs Directors fees 22,000,000.00 23,500,000.00 Honorarium - 7,000,000.00 Key Management personnel
remuneration 383,862,896.64 255,934,653.00 Loans/Advance to
Key Management personnel 50,000,000.00 31,600,000.00 455,862,896.64 318,034,653.00
TIRA 2011 ANNUAL REPORT.indd Sec2:73TIRA 2011 ANNUAL REPORT.indd Sec2:73 1/18/13 9:47:59 AM1/18/13 9:47:59 AM

74
ANNUAL INSURANCE MARKET PERFORMANCE REPORT For The Year Ended 31st December 2011
PART 3: Insurance Market Performance
Statistical Tables & Charts
TIRA 2011 ANNUAL REPORT.indd Sec2:74TIRA 2011 ANNUAL REPORT.indd Sec2:74 1/18/13 9:47:59 AM1/18/13 9:47:59 AM

75
ANNUAL INSURANCE MARKET PERFORMANCE REPORT For The Year Ended 31st December 2011
TA
BL
E 1
: RE
GIS
TE
RE
D I
NSU
RE
RS
AS
AT 3
1 D
EC
EM
BE
R 2
011
(in
alph
abet
ical
ord
er)
S/N
Nam
e of
Com
pany
Pri
ncip
al O
ffi c
erC
lass
of
Bus
ines
sPo
stal
Add
ress
Pho
neE
mai
l
1A
AR
Ins
uran
ce C
o. L
tdM
r. A
. Mas
min
iN
on-L
ifeP.
O. B
ox 9
600
Dsm
(255
) 22
270
1120
info
@aa
r.co.
tz
2A
fric
an L
ife A
ssur
ance
Co
Ltd
Mr.
J. M
agab
eLi
feP.
O.B
ox 7
9651
Dsm
(255
) 22
212
7151
/2/3
Rec
epti
on@
afl if
e.co
.tz
3A
llian
ce I
nsur
ance
Cor
p. (
T)
Ltd
Mr.
K.V
. Kri
shna
nLi
fe &
Non
-Life
P.O
.Box
994
2 D
sm(2
55)
22 2
1391
00,/
2139
101
adm
in@
allia
ncet
z.co
m
4A
llian
ce li
fe I
nsur
ance
Co.
Lim
ited
Mr.
A. M
ishr
aLi
feP.
O.B
ox 1
1522
Dsm
(255
) 22
210
3300
/210
3301
life@
allia
ncel
ife.c
o.tz
5B
umac
o In
sura
nce
Com
pany
Lim
ited
Mr.
R. M
ongi
N
on-
Mar
ine
only
P.O
. Box
131
47 D
sm(2
55)
22 2
1302
56ds
mhq
@bu
mac
oins
uran
ce.c
om
6C
entu
ry I
nsur
ance
Com
pany
Lim
ited
Mr.
N. I
tung
aN
on-L
ifeP.
O. B
ox 6
2729
Dsm
(255
) 22
213
7324
/5in
fo@
cent
uryi
nsur
ance
.co.
tz
7Fi
rst A
ssur
ance
Com
pany
Ltd
Ms.
M. M
ugo
Non
-Life
P.O
. Box
579
9 D
sm(2
55)
22 2
1221
30/1
enqu
irie
s@fi r
stas
sura
nce.
co.tz
8G
olde
n C
resc
ent A
ssur
ance
Co
Ltd
Mr.
P. V
arke
yN
on-
Life
P.O
. Box
206
60 D
sm(2
55)
22 2
1272
68/2
1228
43in
fo@
gca.
co.tz
9H
erit
age
Insu
ranc
e C
o.Lt
dM
r. P.
Lew
isN
on-L
ifeP.
O.B
ox 7
390
Dsm
(255
) 22
213
8476
/7/8
, 213
8486
in
fo@
heri
tage
tanz
ania
.com
10In
sura
nce
Gro
up o
f Tan
zani
aM
r. S.
Muh
indi
Non
life
P.O
.Box
160
5 D
sm(2
55)
22 2
1314
81/2
1220
64In
fo@
igt.c
o.tz
11Ju
bile
e In
sura
nce
Co.
(T
) Lt
dM
s. Z
. Mun
gai
Life
& N
on-L
ifeP.
O.B
ox 2
0524
Dsm
(255
) 22
213
5121
/7
enqu
iry@
jubi
leet
anza
nia.
com
12Li
on o
f Tan
zani
a In
sura
nce
Co.
Ltd
Mr.
S. M
anya
gari
rwa
Non
-Life
P.O
.Box
194
8 D
sm(2
55)
22 2
1329
02/5
in
sura
nce@
lion-
tz.c
om
13M
axin
sure
(Ta
nzan
ia)
Lim
ited
Mr.
B. N
air
Non
life
P.O
.Box
1100
07 D
sm(2
55)
22 2
6002
35in
fo@
max
insu
re-t
z.co
m
14M
gen
Tanz
ania
Ins
uran
ce C
o Lt
dM
r. C
. Sum
bwe
Non
- Li
feP.
O. B
ox 7
495
Dsm
(255
) 22
212
7589
info
@m
gent
anza
nia.
com
15M
ilem
be I
nsur
ance
Com
pany
Lim
ited
Mr.
M. T
ibai
juka
Non
-Life
P.O
. Box
145
48 D
sm(2
55)
22 2
1376
99/2
1227
82in
fo@
mile
mbe
insu
ranc
e.co
m
16M
omen
tum
Tan
zani
a In
sura
nce
Co.
Ltd
Mr.
P. S
riva
stav
aN
on-L
ifeP.
O. B
ox 7
7016
Dsm
(255
) 22
219
7601
prad
eeps
@tz
.mom
entu
maf
rica
.com
17N
atio
nal I
nsur
ance
Cor
p. (
T)
Ltd
Mr.
J. M
wan
duLi
fe &
Non
-Life
P.O
.Box
926
4 D
sm(2
55)
22 2
1138
23/9
in
fo-n
ic@
nict
anza
nia.
com
18N
iko
Insu
ranc
e C
ompa
ny (
T)
Ltd
Mr.
M .Z
. Sib
ande
Non
-Mar
ine
P.O
.Box
212
28 D
sm(2
55)
22 2
1201
88/9
in
fo@
niko
insu
ranc
e.co
.uk
19Ph
oeni
x of
Tan
zani
a A
ss. C
o. L
tdM
r S.
C. W
adha
wan
Non
-Life
P.O
.Box
596
1 D
sm(2
55)
22 2
1227
77/2
1227
61
info
@ph
oeni
xtan
zani
a.co
m
20R
eal I
nsur
ance
Tan
zani
a Lt
dM
r. S.
Oku
ndi
Non
-Life
P.O
.Box
754
33 D
sm(2
55)
22 2
1380
58/2
1293
84/7
in
fo@
real
insu
ranc
e.co
.tz
21R
elia
nce
Insu
ranc
e C
o. (
T)
Ltd
Mr.
P. R
ajar
amN
on-L
ifeP.
O.B
ox 9
826
Dsm
(255
) 22
212
0088
/89/
90
insu
re@
relia
nce.
co.tz
22St
ar G
ener
al I
nsur
ance
Tan
zani
a Lt
dM
r. P.
Pat
ilN
on-L
ifeP.
O. B
ox 7
1956
Dsm
(255
) 22
213
969
3/4
star
gene
raltz
@gm
ail.c
om
23St
rate
gis
Insu
ranc
e (T
) Lt
dM
r. F.
A.V
an d
er M
erw
eN
on-L
ifeP.
O.B
ox 7
893
Dsm
(255
) 22
213
6579
/80/
81in
sura
nce@
stra
tegi
stz.
com
24Ta
nzan
ia N
atio
nal R
eins
.Cor
p. L
tdM
r. R
. Kak
usa
Rei
nsur
erP.
O. B
ox 1
505
Dsm
(255
) 22
212
2536
/7m
ail@
tan-
re.c
o.tz
25Ta
nzin
dia
Ass
uran
ce C
ompa
ny L
tdM
r. P.
Bih
ari
Non
-Life
P.O
.Box
700
65 D
sm(2
55)
22 2
1229
14/9
15/9
16bi
ma@
tanz
indi
a.co
.tz
26Z
anzi
bar
Insu
ranc
e C
orpo
rati
onM
r. A
. Abd
ulra
hman
Life
& N
on-L
ifeP.
O.B
ox 4
32 Z
anzi
bar
(255
) 24
223
2676
/223
8667
zi
c@zi
tec.
org
*Thi
s co
mpa
ny n
ewly
reg
iste
red
in 2
011
TIRA 2011 ANNUAL REPORT.indd Sec2:75TIRA 2011 ANNUAL REPORT.indd Sec2:75 1/18/13 9:47:59 AM1/18/13 9:47:59 AM

76
ANNUAL INSURANCE MARKET PERFORMANCE REPORT For The Year Ended 31st December 2011
TA
BL
E 2
A: R
EG
IST
ER
ED
IN
SUR
AN
CE
BR
OK
ER
S A
S AT
31
DE
CE
MB
ER
201
1 (i
n al
phab
etic
al o
rder
)
S/N
Nam
e of
Com
pany
CE
O/P
rinc
ipal
Offi
cer
Cla
ss o
f B
usin
ess
Post
al A
ddre
ssP
hone
Em
ail
1A
BB
L In
sura
nce
Bro
kers
Ltd
Mr.
U. M
kasw
esw
eLi
fe &
Non
- Li
feP.
O. B
ox 7
9310
Dsm
(255
) 77
3 58
3809
/754
278
814
abbl
insu
ranc
e08@
yaho
o.co
m
2A
IS L
imit
edM
r. J.
Dau
diLi
fe &
Non
- Li
feP.
O. B
ox 1
626
Aru
sha
(255
) 27
250
2773
/ 75
4 42
0552
info
@ai
sbro
kers
.com
3A
lexa
nder
For
bes T
anza
nia
Ltd
Mr.
S. R
. Suc
hak
Life
& N
on-
Life
P.O
. Box
584
8 D
sm(2
55)
22 2
6009
02/1
7/ 7
54 9
9996
6in
fo@
afor
bes.
co.tz
/enq
uiry
@af
orbe
s.co
.tz
4A
llder
s In
sura
nce
Bro
kers
& C
onsu
ltant
s Li
mit
edM
r. S.
Mus
aLi
fe &
Non
- Li
feP.
O. B
ox 8
670
Dsm
(255
) 22
212
1697
/ 75
4 85
3657
alld
ersi
nsur
ance
@ho
tmai
l.com
5A
ON
Tan
zani
a Lt
dM
r. K
ham
is A
. Sul
eim
anLi
fe &
Non
- Li
feP.
O. B
ox 9
232
Dsm
(255
) 22
260
2441
/716
333
373
Aon
_Tan
zani
a@ao
n.co
.tz
6A
R L
inka
ge I
nsur
ance
Bro
kers
Ltd
Mr.
A. K
iwan
daLi
fe &
Non
- Li
feP.
O. B
ox 1
1926
Dsm
(255
) 22
266
406/
767/
784
2868
26in
fo@
arlin
kage
.co.
tz
7A
rist
ocra
ts I
nsur
ance
Bro
kers
(T
) Lt
dM
r. Y.
Fit
ina
Life
& N
on-
Life
P.O
. Box
792
11 D
sm(2
55)
22 2
1346
23/
(255
) 74
4 26
7211
arit
ocra
ts@
wan
anch
i.com
8A
ste
Insu
ranc
e B
roke
rs C
o. L
tdM
r. A
. Mw
ita
Life
& N
on-
Life
P.O
. Box
218
92 D
sm(2
55)
754
4672
16as
te@
aste
insu
ranc
e.co
m
9A
stra
Ins
uran
ce B
roke
rs (
T)
Ltd
Mr.
R. M
was
ada
Life
& N
on-
Life
P.O
. Box
234
40 D
sm(2
55)
22 2
1210
91/7
84/7
54 2
8372
1in
fo@
astr
a.co
.tz
10A
tlas
Insu
ranc
e C
onsu
ltant
s Lt
dM
s. S
. A. S
alim
Life
& N
on-
Life
P.O
. Box
829
Mw
anza
(255
) 28
254
1930
/075
4 09
5981
atla
s,in
s,br
oker
s@ya
hoo.
com
11A
frin
sura
nce
Bro
kers
Lim
ited
*M
r.Far
es G
odfr
eyLi
fe&
Non
-Life
P.O
Box
493
5 D
sm(2
55)
754
3039
95, 6
54 3
0399
5af
riin
sura
nceb
roke
rs@
live.
com
12B
. R. P
uri &
Com
pany
Ltd
Mr.
A. K
. Pur
iLi
fe &
Non
- Li
feP.
O. B
ox 1
047
Dsm
(255
) 22
212
4303
/713
320
109
brpu
ri@
ctva
tcom
.net
13B
am I
nsur
ance
Bro
kers
and
Ser
vice
s Lt
dM
r. K
. P. S
.Kili
mba
Life
& N
on-
Life
P.O
. Box
291
34 D
sm(2
55)2
6 23
2288
2/ 7
13 7
7478
1ba
min
sura
nceb
roke
sr@
gmai
l.com
14B
id I
nsur
ance
Bro
kers
(T
) C
o. L
tdM
r. L.
Kis
wiz
ahLi
fe &
Non
- Li
feP.
O. B
ox 7
279
Dsm
(255
) 22
213
4623
/733
631
177
bins
brok
ers@
bol.c
om
15B
lue
Insu
ranc
e Se
rvic
es (
T)
Ltd
Mr.
A. M
ukam
a Li
fe &
Non
- Li
feP.
O. B
ox 2
1799
Dsm
(2
55)
22 2
1231
16/7
13 3
4191
9al
fred
a@bl
ue.c
o.tz
16B
riti
sh T
anz.
Ins
ur. &
Re
Bro
kers
Ltd
Mr.
K. M
akan
iLi
fe &
Non
- Li
feP.
O. B
ox 5
611
Dsm
(255
) 22
218
2544
/713
313
845
brit
isht
anza
niai
nsur
ance
@ya
hoo.
com
17B
usar
a In
sura
nce
Bro
kers
Ltd
Mr.
E. M
. Mal
lya
Life
& N
on-
Life
P.O
. Box
213
0 D
sm(2
55)
22 2
1222
33/2
1167
70bu
sara
@m
edia
post
.co.
tz
18C
hom
bo I
nsur
ance
Bro
kers
Lim
ited
Mr.
J. M
ang’
ana
Life
& N
on-
Life
P.O
. Box
768
56 D
sm
(255
) 75
4 03
5394
19C
itiz
en I
nsur
ance
Con
sulta
nts
(T)
Ltd
Mr.
Oba
dia
Mah
way
aLi
fe &
Non
- Li
feP.
O. B
ox 2
2680
Dsm
(255
) 22
218
3063
/218
2873
citi
zen@
raha
.com
20C
orpo
rate
Ins
uran
ce B
roke
rs L
tdM
r. W
. Nde
sanj
oLi
fe &
Non
- Li
feP.
O. B
ox 3
60 D
sm(2
55)
22 2
1305
11/7
55 3
8295
6ci
b@in
sura
nce.
co.tz
21C
osm
os I
nsur
ance
Bro
kers
(T
) Li
mit
edM
r. A
. Qar
esi
Life
& N
on-
Life
P.O
. Box
854
5 D
sm(2
55)
782
2222
48/7
53 2
5459
5co
smos
insu
ranc
ebro
kers
@ya
hoo.
com
22C
rest
Ins
uran
ce B
roke
rs L
td*
.Mr.F
ranc
is B
ukuk
uLi
fe&
Non
-Life
P.O
BO
X 6
3214
Dsm
(255
)22
2124
805/
715
9977
71cr
esti
nsur
ance
tz@
gmai
l.com
23D
oubl
e “N
” In
sura
nce
Bro
kers
Ltd
Mr.
Z. B
enja
min
Life
& N
on-
Life
P.O
. Box
992
6 D
sm(2
55)2
2 21
8568
8/ 7
54 2
7813
3m
ervy
nsha
we@
dni.c
o.tz
24D
emet
er F
inan
cial
&In
sura
nce
Serv
ices
*M
r.Ada
sh S
harm
aLi
fe&
Non
-Life
P.O
BO
X 3
8346
DSM
(255
) 22
215
0079
/789
886
635
vict
oria
dem
eter
-gro
up.c
om
25D
esir
e In
sura
nce
Bro
kers
Ltd
*M
r.Yus
uph
A.M
keny
enge
Life
&N
on-L
ifeP.
O B
OX
718
48 D
SM(2
55)
786
3873
59/
756
2126
22D
esir
e 20
10@
yaho
o.co
m
*Thi
s co
mpa
ny n
ewly
reg
iste
red
in 2
011
TIRA 2011 ANNUAL REPORT.indd Sec2:76TIRA 2011 ANNUAL REPORT.indd Sec2:76 1/18/13 9:48:00 AM1/18/13 9:48:00 AM

77
ANNUAL INSURANCE MARKET PERFORMANCE REPORT For The Year Ended 31st December 2011
TA
BL
E 2
A: R
EG
IST
ER
ED
IN
SUR
AN
CE
BR
OK
ER
S A
S AT
31
DE
CE
MB
ER
201
1 (i
n al
phab
etic
al o
rder
) C
onti
nued
S/N
Nam
e of
Com
pany
CE
O/P
rinc
ipal
Offi
cer
Cla
ss o
f B
usin
ess
Post
al A
ddre
ssP
hone
Em
ail
26E
agle
Afr
ica
Insu
ranc
e B
roke
rs (
T)
Ltd
Mr.
Edw
ard
. N. M
wan
giLi
fe &
Non
- Li
feP.
O. B
ox 3
4687
Dsm
(255
) 22
277
3461
/(25
5) 7
53 4
3201
1ed
ngan
ga@
gmai
l.com
27E
aste
rn I
nsur
ance
Bro
kers
Ltd
Mr.
Dom
inic
Sha
yoLi
fe &
Non
- Li
feP.
O. B
ox 2
287
Mw
anza
(255
) 28
250
3175
/ (2
55)
784
5200
81ea
ster
n@th
enet
.co.
tz
28E
ndea
vour
Ins
uran
ce C
onsu
ltant
s Lt
dM
s. M
. A. S
ykes
Life
& N
on-
Life
P.O
. Box
161
5 D
sm(2
55)
754
4947
92/6
58 1
1113
3in
fo@
ende
avou
rtz.
com
29E
quit
y In
sura
nce
Bro
kers
Ltd
Mr.O
. Tem
uLi
fe &
Non
- Li
feP.
O. B
ox 3
1932
Dsm
(255
) 75
4 26
4559
info
r@eq
uity
insu
ranc
ebro
kers
.co.
tz
30F&
P In
sura
nce
Bro
kers
Ltd
Mr.
P. L
yaba
ndi
Life
& N
on-
Life
P.O
. Box
256
Dsm
(255
) 22
213
7942
fp@
cats
-net
.com
31FA
M I
nsur
ance
Bro
kers
Ltd
Mr.
A. R
.Maw
lyLi
fe &
Non
- Li
feP.
O. B
ox 7
0661
Dsm
(255
) 71
3 48
646/
754
764
884
fam
brok
er@
yaho
o.co
m
32FB
N I
nsur
ance
Bro
kers
Mr.H
. Mau
kiLi
fe &
Non
- Li
feP.
O. B
ox 1
6228
Dsm
(2
55)
22 2
7617
60/(
255)
687
961
777
info
@fb
n-in
sura
nce.
co.tz
33Fo
rem
ost I
nsur
ance
Bro
kesr
Ltd
Ms.
J. M
. Sen
yaLi
fe &
Non
- Li
feP.
O. B
ox 2
462
Mw
anza
(255
) 75
4 23
6447
imnf
o@fo
rtis
tz.c
om
34Fo
rtis
Ins
uran
ce B
koke
rs L
imit
edM
s. M
arym
u Sh
amo
Life
& N
on-
Life
P.O
. Box
718
21 D
sm(2
55)
22 2
6175
90/
713
4722
00in
fo@
fort
ista
nzan
ia.c
om
35Fu
turi
st I
nsur
ance
Bro
ker
Lim
ited
*M
r.Yon
a M
gasi
Life
&N
on-L
ifeP.
O B
OX
399
9(2
55)7
84 3
3551
0/ 7
15 3
3551
0fu
turi
stbr
oker
@ho
tmai
l.com
36Fr
ed B
lack
Ins
uran
ce B
roke
r Li
mit
ed*
Mr.J
osep
h P.
Sam
ata
Life
&N
on-L
ifeP.
O B
ox 8
973
Dsm
(255
) 22
212
6730
info
@fr
edbl
ack.
net
37G
ati I
nsur
ance
Bro
kers
Ltd
Mr.E
mily
J. M
tauk
aLi
fe &
Non
- Li
feP.
O. B
ox 7
7887
Dsm
(255
) 22
213
6631
/ 71
3 26
5367
gati
insu
ranc
e@ya
hoo.
com
38G
wem
ah I
nsur
ance
Bro
kers
Ltd
Mr.
Seba
stia
n K
ilato
Life
& N
on-
Life
P.O
. Box
232
31 D
sm(2
55)
754
3703
70/(
255)
732
995
940
gwem
ah@
bol.c
o.tz
39G
HM
Ins
uran
ce B
roke
rs L
imit
ed*
Mr.G
eoff
ery
Mun
digi
leLi
fe &
Non
-Life
P.O
BO
X 4
751
(255
)784
839
616/
755
8396
16m
undi
ngile
g@ya
hoo.
com
40H
arm
ony
Insu
ranc
e B
roke
rs L
imit
edM
s. E
. Mor
ingi
Life
& N
on-
Life
P.O
. Box
622
95 D
sm(2
55)
22 2
5561
411/
713
0710
26ha
rmon
ybro
kers
@ho
tmai
l.com
41Im
pex
Insu
ranc
e B
roke
rs L
tdM
r. M
. Som
jiLi
fe &
Non
- Li
feP.
O. B
ox 1
654
Dsm
(255
) 22
213
7296
/ 78
4 22
2246
sadi
ck@
insu
ranc
etz.
com
42In
tert
rade
Exp
ress
Ltd
Mr
.J. P
alla
ngyo
Life
& N
on-
Life
P.O
. Box
132
18 A
rush
a(2
55)
732
9717
59/(
255)
784
414
444
inte
rtra
de@
haba
ri.c
o.tz
43JJ
P In
sura
nce
Bro
kres
Ltd
Mr.
P. L
. Mbu
yaLi
fe &
Non
- Li
feP.
O. B
ox 2
5378
Dsm
(255
) 22
212
3055
/ 71
2 40
9725
jjpin
sura
nceb
roke
rs@
yaho
o.co
m
44Ja
guar
Ins
uran
ce B
roke
rs*
Mr.F
araj
a M
kwiz
uLi
fe&
Non
-Life
P.O
BO
X 8
0355
(255
)789
500
500(
255)
717
5005
00ja
guar
.bro
ker2
011@
gmai
l.com
45J.
W S
eago
n &
Insu
ranc
e B
roke
rs(T
)Ltd
*M
r.Jam
es M
aina
Life
&N
on-L
ifeP.
O B
OX
385
68 D
sm,
(255
) 22
219
6830
info
@jw
seag
on.c
om
46K
ibo
Insu
ranc
e Lt
dM
r. E
dson
T. P
olep
ole
Life
& N
on-
Life
P.O
. Box
246
Aru
sha
(255
) 22
254
4797
kibo
brok
ers@
yaho
o.co
m
47K
irum
i Ins
uran
ce B
roke
rs L
tdM
r. N
. Mis
ongi
kaLi
fe &
Non
- Li
feP.
O. B
ox 1
0966
Mw
anza
(255
) 71
3 13
5452
/(25
5) 7
84 2
7836
0
48K
iwar
ai I
nsur
ance
Bro
kers
Lim
ited
Mr.
M. M
. May
omby
aLi
fe &
Non
- Li
feP.
O. B
ox 1
906
Mor
ogor
o(2
55)
716
2540
00/
714
5261
17bm
kiri
ya@
yaho
o.co
m
49Li
aiso
n In
sura
nce
Bro
kers
(T
) Lt
dM
r. O
koth
Olo
oLi
fe &
Non
- Li
feP.
O. B
ox 1
2729
Dsm
(255
) 71
8 75
9449
/ 76
7 50
0120
ollo
o@tz
.lias
ongr
oup.
net
50LJ
K I
nsur
ance
Bro
kers
(T
) Li
mit
edM
r. E
sthe
r K
azi
Life
& N
on-
Life
P.O
. Box
149
50 D
sm(2
55)
22 2
1243
83/
784
6955
79in
fo@
ljkho
ldin
gs.c
om
*Thi
s co
mpa
ny n
ewly
reg
iste
red
in 2
011
TIRA 2011 ANNUAL REPORT.indd Sec2:77TIRA 2011 ANNUAL REPORT.indd Sec2:77 1/18/13 9:48:00 AM1/18/13 9:48:00 AM

78
ANNUAL INSURANCE MARKET PERFORMANCE REPORT For The Year Ended 31st December 2011
TA
BL
E 2
A: R
EG
IST
ER
ED
IN
SUR
AN
CE
BR
OK
ER
S A
S AT
31
DE
CE
MB
ER
201
1 (i
n al
phab
etic
al o
rder
) C
onti
nued
S/N
Nam
e of
Com
pany
CE
O/P
rinc
ipal
Offi
cer
Cla
ss o
f B
usin
ess
Post
al A
ddre
ssP
hone
Em
ail
51Lu
mum
ba I
nsur
ance
Bro
kers
Ms.
Alv
ina
Mvu
laLi
fe &
Non
- Li
feP.
O. B
ox 1
5742
Dsm
(2
55)
22 1
8323
2/ 6
55 5
5555
7lu
mum
bain
sura
nce@
hotm
ail.c
om
52LF
Ins
uran
ce B
roke
rs L
td*
Mr.A
ndre
w F
.Mos
hiLi
fe&
Non
-Life
P.O
BO
X 7
881
(255
)713
464
894
fred
y.m
sang
i@Ifi
nsu
ranc
e.co
.tz
53M
acre
e In
sura
nce
Bro
kers
(T
) Li
mit
edM
s. L
. Mar
tin
Life
& N
on-
Life
P.O
. Box
651
02 D
sm(2
55)
22 2
1342
83/
754
2824
02m
acre
ebro
kers
@liv
e.co
.uk
54M
atun
da I
nsur
ance
Bro
kers
Lim
ited
Mr.
M. B
.Che
yoLi
fe &
Non
- Li
feP.
O. B
ox 8
0096
Dsm
(255
) 75
4 56
4545
mat
unda
inc@
gmai
l.com
55M
awen
zi I
nsur
ance
Bro
kers
Ltd
Mr.
H. K
ilasa
raLi
fe &
Non
- Li
feP.
O. B
ox 1
73 A
rush
a(2
55)
27 2
5080
17/7
54 2
8239
4m
awen
zins
uran
ce@
tz20
00.c
om
56M
IC G
loba
l Ris
ks (
T)
Ltd
Mr.
S. M
aher
ali
Life
& N
on-
Life
P.O
. Box
701
0 A
rush
a(2
55)
22 2
1204
33/7
54 5
1625
3sm
mah
eral
i@m
icgl
obal
risk
s.co
m
57M
icro
Ens
ure
Tanz
ania
Lim
ited
Ms.
F.M
. Lay
onLi
fe &
Non
- Li
feP.
O. B
ox 3
8605
Dsm
(255
) 22
213
6002
/ 75
8 19
1024
info
@m
icro
ensu
re.c
om
58M
ilmar
Ins
uran
ce C
onsu
ltant
s Lt
dM
r. L.
F. D
emel
loLi
fe &
Non
- Li
feP.
O. B
ox 8
71 D
sm(2
55)
22 2
1264
84/
713
3204
22m
ilmar
@ct
vsat
com
.net
59M
inet
Ins
uran
ce B
roke
rsM
r. B
. Bin
tam
anyi
reLi
fe &
Non
- Li
feP.
O. B
ox 1
1835
Dsm
(255
) 22
212
7774
/(25
5) 6
58 5
0505
1in
fo@
min
et.c
o.tz
60M
air
& Y
oung
s In
sura
nce
Bok
ers
Lim
ited
Mr.T
itus
T.N
yalik
aLi
fe&
Non
-Life
P.O
Box
789
64 D
sm(2
55)
22 2
1804
03,(
255)
767
142
142
inno
cent
@m
airy
oung
sins
uran
ce.c
om
61M
ayo
Insu
ranc
e B
roke
r Li
mit
ed*
Ms.
Zuw
ena
Iddy
Life
&N
on-L
ifeP.
O B
ox 7
7729
Dsm
(255
) 22
245
1637
,(25
5) 7
86 3
7632
8m
ayoi
nsur
ance
ltd@
gmai
l.com
62N
ahir
Ins
uran
ce B
roke
rs &
Com
pany
Lim
ited
Mr.
A. O
. Lik
okol
aLi
fe &
Non
- Li
feP.
O. B
ox 1
1277
Dsm
(255
) 71
3 22
1079
/(25
5) 7
73 5
4821
8ah
mad
.liko
kola
@gm
ail.c
om
63N
danu
Ins
uran
ce B
roke
rs L
tdM
r.Ado
lf U
lom
iLi
fe &
Non
- Li
feP.
O. B
ox 1
4737
Aru
sha
(255
) 27
254
8973
/250
8885
deo@
ndan
uins
uran
ce.c
o.tz
64N
dege
Ins
uran
ce B
roke
rs L
tdM
r. S.
Nda
roLi
fe &
Non
- Li
feP.
O. B
ox 2
1416
Dsm
(255
) 22
213
5924
/784
888
886
info
@nd
egei
nsur
ance
.com
65O
rbit
Ins
uran
ce C
onsu
ltant
s Lt
dM
r. S.
A. S
ham
isLi
fe &
Non
- Li
feP.
O. B
ox 1
3993
Dsm
(255
) 22
212
3518
/786
303
075
info
@or
biti
nsur
ance
.co.
uk
66O
utas
sura
nce
Bro
kers
(T)
Ltd
Ms.
P. K
arob
iaLi
fe &
Non
- Li
feP.
O. B
ox 7
8227
Dsm
(255
) 22
270
1516
/(25
5) 7
69 0
9899
0pk
@ou
tass
uran
cebr
oker
s.co
.tz
67Pa
cifi c
Ins
uran
ce B
roke
rs (
EA
) Lt
dM
r. J.
K.M
buru
guLi
fe &
Non
- Li
feP.
O. B
ox 7
125
Dsm
(255
) 27
7100
0ka
bage
@ra
ha.c
om
68Pa
n O
cean
ic I
nsur
ance
Bro
kers
Ltd
Mr.
F. S
eif
Life
& N
on-
Life
P.O
. Box
391
2 D
sm(2
55)
22 2
1343
71/7
76 6
5473
3pa
noce
anic
@ca
ts-n
et.c
om
69Ph
ares
Ins
uran
ce B
roke
rs L
imit
edM
r. S.
Mna
ndal
aLi
fe &
Non
- Li
feP.
O. B
ox 2
3285
Dsm
(255
) 22
277
1299
/ (2
55)
787
7418
36in
fo@
phar
esin
sura
nce.
com
70Pr
ide
Insu
ranc
e B
roke
rs (
T)
Lim
ited
Mr.
E. K
anyu
ma
Life
& N
on-
Life
P.O
. Box
208
11 D
sm(2
55)
715/
754
4634
09ep
hrai
m.s
imon
@pr
idei
nsur
ance
-tz.
com
71Pr
ize
Insu
ranc
e B
roke
rs L
imit
edM
rs. A
. M. M
wag
alaz
iLi
fe &
Non
- Li
feP.
O. B
ox 5
51 Z
anzi
bar
(255
) 77
7 48
1572
/(25
5) 2
4 22
3878
4/85
priz
e@za
nlin
k.co
m
72R
egal
Ins
uran
ce B
roke
rs L
imit
edM
r. Si
mon
K. E
ston
Life
& N
on-
Life
P.O
. Box
384
92 D
sm(2
55)
22 2
2031
43/4
5/75
4 60
5475
info
@ri
b.co
.tz/s
msa
ki@
rib.
co.tz
73R
eos
Insu
ranc
e B
roke
rs L
tdM
r. E
rnes
t Hau
leLi
fe &
Non
- Li
feP.
O. B
ox 7
0347
Dsm
(255
) 22
212
4929
/784
288
580
reos
allia
nce@
yaho
o.co
m
74R
ova
Serv
ices
Ins
uran
ce B
roke
rs L
tdM
r. J.
Kes
syLi
fe &
Non
- Li
feP.
O. B
ox 1
066
Aru
sha
(255
) 27
275
4465
/275
1263
rova
@eo
lt.co
m
75Sa
mpa
t Ins
uran
ce B
roke
rs L
tdM
r. S.
Mos
esLi
fe &
Non
- Li
feP.
O. B
ox42
37 D
sm(2
55)
22 2
1132
01/(
255)
713
289
289
varo
onsa
mpa
t@gm
ail.c
om
76Si
lver
Ins
uran
ce C
onsu
ltanc
y Lt
dM
r. G
.; M
atik
oLi
fe &
Non
- Li
feP.
O. B
ox 3
6043
Dsm
(255
) 22
212
3766
/(25
5) 7
54 3
7496
9si
lver
insu
ranc
ebro
kers
@ya
hoo.
com
*Thi
s co
mpa
ny n
ewly
reg
iste
red
in 2
011
TIRA 2011 ANNUAL REPORT.indd Sec2:78TIRA 2011 ANNUAL REPORT.indd Sec2:78 1/18/13 9:48:00 AM1/18/13 9:48:00 AM

79
ANNUAL INSURANCE MARKET PERFORMANCE REPORT For The Year Ended 31st December 2011
TA
BL
E 2
A: R
EG
IST
ER
ED
IN
SUR
AN
CE
BR
OK
ER
S A
S AT
31
DE
CE
MB
ER
201
1 (i
n al
phab
etic
al o
rder
) C
onti
nued
S/N
Nam
e of
Com
pany
CE
O/P
rinc
ipal
Offi
cer
Cla
ss o
f B
usin
ess
Post
al A
ddre
ssP
hone
Em
ail
77Sm
artJ
et I
nsur
ance
Bro
kers
(T
) Lt
dM
s.A
. Rut
aihw
aLi
fe &
Non
- Li
feP.
O. B
ox 6
5273
Dsm
(255
) 22
246
1251
/(25
5) 7
84 6
9347
7in
fo@
smar
tjet.c
o.tz
78St
ar I
nves
tmen
t (Z
anzi
bar)
Ltd
Mr.
A. A
. Kay
umbo
Life
& N
on-
Life
P.O
. Box
799
Zan
ziba
r(2
55)
22 2
1831
79/7
73 3
6057
8st
ards
m@
zant
el.c
om
79Sw
is C
are
Insu
ranc
e B
roke
rs L
tdM
r. S.
W. S
haki
tund
uLi
fe &
Non
- Li
feP.
O. B
ox 1
2223
Dsm
(255
)22
2128
907/
784
2216
16sw
isin
sura
nce@
hotm
ail.c
om
80Su
nris
e In
sura
nce
Bro
kers
Ltd
*M
s.U
pend
o M
pyop
yoLi
fe&
Non
-Life
P.O
BO
X 3
8140
DSM
(255
) 22
215
1735
/655
888
808
sibl
td@
hotm
ail.c
om
81Ta
n M
anag
emen
t Ins
uran
ce B
roke
rs L
tdM
r. C
.O. B
wan
aLi
fe &
Non
- Li
feP.
O. B
ox 1
157
Mos
hi(2
55)
27 2
7515
14/7
84 4
5078
6tc
@ki
linet
.co.
tz
82T
horn
Ins
uran
ce B
roke
rs lt
dM
r. S.
A.B
alis
dya
Life
& N
on-
Life
P.O
. Box
101
77 D
sm(2
55)
22 2
1221
21th
orn.
limit
ed@
yaho
o.co
m
83Tr
ans
Afr
ica
Insu
ranc
e B
roke
rs L
tdM
r. A
. J. P
atel
Life
& N
on-
Life
P.O
. Box
165
8 D
sm(2
55)
22 2
6667
89/7
48 5
4582
8an
and@
tibt
z.co
m
84Tr
ust I
nsur
ance
Bro
kers
(T
) lim
ited
Ms.
J. M
arik
iLi
fe &
Non
- Li
feP.
O. B
ox 1
2720
Dsm
(2
55)
22 2
1388
48/
(255
) 75
4 58
7579
apm
asha
lla@
yaho
o.co
m
85T
SM I
nsur
ance
Bro
kers
Ltd
Mr.
R. M
alin
deLi
fe &
Non
- Li
feP.
O. B
ox 1
0631
Dsm
(255
) 22
218
8053
4
86U
nite
d A
fric
a In
sura
nce
Bro
kers
Lim
ited
*M
rs.L
ucy
R.M
wit
taLi
fe&
Non
-Life
P.O
BO
X 3
2511
(255
)22
2761
866/
784
5226
66ja
kisa
mo@
gmai
l.com
87V
enus
Ins
uran
ce B
roke
rs L
td
Ms
G. G
eofr
ey
Life
& N
on-
Life
P.O
. Box
622
71 D
sm
(255
) 75
4 28
7543
venu
sins
uran
ce20
09@
gmai
l.com
88V
inta
ge I
nsur
ance
Bro
kers
Lim
ited
*M
r.Mes
hack
Nda
liLi
fe&
Non
-Life
P.O
BO
X 4
760
Dsm
(255
)22
2775
606
(255
) 76
7 98
1974
Vin
tage
insu
ranc
e1@
gmai
l.com
89W
omi I
nsur
ance
Bro
kres
Lim
ited
Mrs
. G. N
ahum
Life
& N
on-
Life
P.O
. Box
.116
Dsm
(255
) 71
3 24
8685
.715
691
789
ndel
na@
yaho
o.co
m
*Thi
s co
mpa
ny n
ewly
reg
iste
red
in 2
011
TIRA 2011 ANNUAL REPORT.indd Sec2:79TIRA 2011 ANNUAL REPORT.indd Sec2:79 1/18/13 9:48:00 AM1/18/13 9:48:00 AM

80
ANNUAL INSURANCE MARKET PERFORMANCE REPORT For The Year Ended 31st December 2011
TA
BL
E 2
B: R
EG
IST
ER
ED
AN
D A
CT
IVE
IN
SUR
AN
CE
BR
OK
ER
S A
S AT
31
DE
CE
MB
ER
201
1 (i
n al
phab
etic
al o
rder
)
S/N
Nam
e of
Com
pany
CE
O/P
rinc
ipal
Offi
cer
Cla
ss o
f B
usin
ess
Post
al A
ddre
ssP
hone
Em
ail
1A
BB
L In
sura
nce
Bro
kers
Ltd
Mr.
U. M
kasw
esw
eLi
fe &
Non
- Li
feP.
O. B
ox 7
9310
Dsm
(255
) 77
3 58
3809
/(25
5) 7
54 2
7881
4ab
blin
sura
nce0
8@ya
hoo.
com
2A
lexa
nder
For
bes T
anza
nia
Ltd
Mr.
S. R
. Suc
hak
Life
& N
on-
Life
P.O
. Box
584
8 D
sm(2
55)
22 2
6009
02/2
6009
17/0
7549
9996
6in
fo@
afor
bes.
co.u
k/en
quir
y@af
orbe
s.co
.uk
3A
llder
s In
sura
nce
Bro
kers
& C
onsu
ltant
s Li
mit
edM
r. S.
Mus
aLi
fe &
Non
- Li
feP.
O. B
ox 8
670
Dsm
(255
) 22
212
1697
(25
5) 7
54 8
5365
7al
lder
sins
uran
ce@
hotm
ail.c
om
4A
ON
Tan
zani
a Lt
dM
r. A
. Sul
eim
anLi
fe &
Non
- Li
feP.
O. B
ox 9
232
Dsm
(255
) 22
260
2441
/(25
5) 7
16 3
3337
3A
on_T
anza
nia@
aon.
co.tz
5A
R L
inka
ge I
nsur
ance
Bro
kers
Ltd
Mr.
A. K
iwan
daLi
fe &
Non
- Li
feP.
O. B
ox 1
1926
Dsm
(255
) 22
266
4069
/(25
5) 7
67 2
8682
6in
fo@
arlin
kage
.co.
tz
6A
rist
ocra
ts I
nsur
ance
Bro
kers
(T
) Lt
dM
r. Y.
Fit
ina
Life
& N
on-
Life
P.O
. Box
792
11 D
sm(2
55)
22 2
1346
23/(
255)
754
267
211
arit
ocra
ts@
wan
anch
i.com
7A
ste
Insu
ranc
e B
roke
rs C
o. L
tdM
r. A
. Mw
ita
Life
& N
on-
Life
P.O
. Box
218
92 D
sm(2
55)
754
4672
16/(
255)
22
2122
150
aste
@as
tein
sura
nce.
com
8A
tlas
Insu
ranc
e C
onsu
ltant
s Li
mit
edM
s.Sa
lha
Salim
Life
&N
on-L
ifeP.
o B
ox 2
424/
829
Mw
z(2
55)
28 2
5419
30,(
255)
777
4816
81at
las,
ins,
brok
ers@
yaho
o.co
m
9A
stra
Ins
uran
ce B
roke
rs (
T)
Ltd
Mr.
R. M
was
ada
Life
& N
on-
Life
P.O
. Box
751
78 D
sm(2
55)
22 2
1210
91/(
255)
784
283
721
info
@as
tra.
co.tz
10A
frin
sura
nce
Bro
kers
Lim
ited
*M
r.Far
es G
odfr
eyLi
fe&
Non
-Life
P.O
Box
493
5 D
sm(2
55)
754
3039
95,(
255)
654
303
995
afri
insu
ranc
ebro
ker@
live.
co
11B
. R. P
uri &
Com
pany
Ltd
Mr.
A. K
. Pur
iLi
fe &
Non
- Li
feP.
O. B
ox 1
047
Dsm
(255
) 22
212
4303
/(25
5) 7
13 3
2010
9br
puri
@ct
vatc
om.n
et
12B
usar
a In
sura
nce
Bro
kers
Ltd
Mr.
E. M
. Mal
lya
Life
& N
on-
Life
P.O
. Box
213
0 D
sm(2
55)
22 2
1222
33/2
1167
70bu
sara
@m
edia
post
.co.
tz
13B
id I
nsur
ance
Bro
kers
Lim
ited
Mr.L
ucas
Kis
wiz
ahLi
fe &
Non
-Life
P.O
Box
799
22 D
sm(2
55)
22 2
1346
23(2
55)
733
6311
77bi
nsbr
oker
s@bo
l.co.
tz
14B
lue
Insu
ranc
e Se
rvic
es (
T)
Lim
ited
Mr.A
lfred
Muk
ama
Life
&N
on-L
ifeP.
o B
ox 2
1799
Dsm
(255
) 22
21
2311
6,(2
55)
713
3419
19al
fred
a@bl
ue.c
o.tz
.
15B
riti
sh T
anza
nia
Insu
ranc
e &
Rei
nsur
ance
B
roke
rs
Mr.K
idor
a M
akan
iLi
fe&
Non
-Life
P.O
Box
561
1 D
SM(2
55)
22 2
1825
44,(
255)
713
3138
45br
itis
htan
zani
ains
uran
ce@
yaho
o.co
m
16B
am I
nsur
ance
Bro
kers
Ltd
Ser
vice
s Lt
dM
r.B.M
assa
we/
Mr.K
.P.S
Life
&N
on-L
ifeP.
O B
ox 1
683
Dod
oma
(255
)26
2322
882,
(255
)713
774
781
bam
insu
ranc
ebro
kers
@gm
ail.c
om
17C
orpo
rate
Ins
uran
ce B
roke
rs L
tdM
r. J.
A. S
haur
iLi
fe &
Non
- Li
feP.
O. B
ox 3
60 D
sm(2
55)
22 2
1305
11/(
255)
755
382
956
cib@
insu
ranc
e.co
.tz
18C
osm
os I
nsur
ance
Bro
kers
(T
) Li
mit
edM
r. A
. Qar
esi
Life
& N
on-
Life
P.O
. Box
854
5 D
sm(2
55)
782
2222
48/7
53 2
5459
5co
smos
insu
ranc
ebro
ker@
yaho
o.co
m
19C
hom
bo I
nsur
ance
Bro
kers
Lim
ited
Mr.J
osep
h S.
Man
ga’a
naLi
fe&
Non
-Life
P.O
Box
768
56 D
SM(2
55)
754
0353
94
20C
rest
Ins
uran
ce B
roke
r Lt
d*M
r.Fra
ncis
Buk
uku
Life
&N
on-L
ifeP.
O B
OX
632
14 D
sm(2
55)7
15 9
9777
1/25
5 22
212
4805
cres
tins
uran
cetz
@gm
ail.c
om
21C
itiz
en I
nsur
ance
Con
sulta
lt (T
) Li
mit
edM
r.Oba
dia
Mah
way
aLi
fe&
Non
-Life
P.O
Box
226
80 D
Sm(2
55)
22 2
1830
63,(
255)
713
251
608
citi
zen@
raha
.com
22D
esir
e In
sura
nce
Bro
kers
Lim
ited
*M
r.Yus
uph
A.M
keye
nge
Life
&N
on-L
ifeP.
O B
ox 7
1848
DSM
(255
) 7
86 3
8735
9,(2
55)7
56 2
1262
2D
esir
e201
0@ya
hoo.
com
23D
emet
er F
inan
cial
&In
sura
nce
Serv
ices
*M
r.Alb
in M
owo
Life
&N
on -
Life
P.O
BO
X 3
8346
Dsm
(255
)22
2150
079,
(255
)754
461
363
vict
oria
@de
met
ergr
oup.
com
24D
oubl
e “N
”Ins
uran
ce B
roke
r Li
mit
edM
r.Zak
aria
J.B
enja
min
iLi
fe &
Non
-Life
P.O
Box
992
6 D
sm(2
55)
22 2
1856
88,(
255)
713
605
582
mer
vyns
haw
e@dn
i.co.
tz
25E
agle
Afr
ica
Insu
ranc
e B
roke
rs (
T)
Ltd
Mr.
E. M
wan
giLi
fe &
Non
- Li
feP.
O. B
ox 3
4687
Dsm
(255
) 22
277
3461
/(25
5) 2
2 27
7151
8ed
ngan
ga@
gmai
l.com
*Thi
s co
mpa
ny n
ewly
reg
iste
red
in 2
011
TIRA 2011 ANNUAL REPORT.indd Sec2:80TIRA 2011 ANNUAL REPORT.indd Sec2:80 1/18/13 9:48:00 AM1/18/13 9:48:00 AM

81
ANNUAL INSURANCE MARKET PERFORMANCE REPORT For The Year Ended 31st December 2011
TA
BL
E 2
B: R
EG
IST
ER
ED
AN
D A
CT
IVE
IN
SUR
AN
CE
BR
OK
ER
S A
S AT
31
DE
CE
MB
ER
201
1(i
n al
phab
etic
al o
rder
) C
onti
nued
S/N
Nam
e of
Com
pany
CE
O/P
rinc
ipal
Offi
cer
Cla
ss o
f B
usin
ess
Post
al A
ddre
ssP
hone
Em
ail
26E
aste
rn I
nsur
ance
Bro
kers
Ltd
Mr.
Dom
inic
. Sha
yoLi
fe &
Non
- Li
feP.
O. B
ox 2
287
Mw
anza
(255
) 28
250
3175
/ (2
55)
784
5200
81ea
ster
n@th
enet
.co.
tz
27E
ndea
vour
Ins
uran
ce C
onsu
ltant
s Lt
dM
s. M
. A. S
ykes
Life
& N
on-
Life
P.O
. Box
161
5 D
sm(2
55)
658
1111
33/(
255)
754
494
792
info
@en
deav
ourt
z.co
m
28E
quit
y In
sura
nce
Bro
kers
Ltd
Mr.O
. Tem
uLi
fe &
Non
- Li
feP.
O. B
ox 2
900
Dsm
(255
) 75
4 26
4559
info
r@eq
uity
insu
ranc
e br
oker
s .c
o.tz
29F&
P In
sura
nce
Bro
kers
Ltd
Mr.
P. L
yaba
ndi
Life
& N
on-
Life
P.O
. Box
256
Dsm
(255
) 22
213
7942
fp@
cats
-net
.com
30FA
M I
nsur
ance
Bro
kers
Ltd
Mr.
A. R
.Maw
lyLi
fe &
Non
- Li
feP.
O. B
ox 7
0661
Dsm
(255
) 71
3 48
6466
/(25
5) 7
54 7
6488
4fa
mbr
oker
@ya
hoo.
com
31FB
N I
nsur
ance
Bro
kers
Mr.
H .P
. Mau
kiLi
fe &
Non
- Li
feP.
O. B
ox 3
4198
Dsm
(2
55)
22 2
7617
60/(
255)
687
961
777
info
@fb
n-in
sura
nce.
co.tz
32Fo
rem
ost I
nsur
ance
Bro
kesr
Ltd
Ms.
J. M
. Sen
yaLi
fe &
Non
- Li
feP.
O. B
ox 2
462
Mw
anza
(255
) 75
4 23
6447
ondu
chuo
@ya
hoo.
co.u
k
33Fo
rtis
Ins
uran
ce B
koke
rs L
imit
edM
s. M
arym
u Sh
amo
Life
& N
on-
Life
P.O
. Box
718
21 D
sm(2
55)
22 2
6175
90/(
255)
713
472
200
info
@fo
rtis
tanz
ania
.com
34Fr
ed B
lack
Ins
uran
ce B
roke
r (T
) Li
mit
ed*
Mr.J
osep
h P.
Sam
ata
Life
&N
on-L
ifeP.
O B
ox 8
973
Dsm
255
22 2
1267
30in
fo@
fred
balc
k.ne
t
35Fu
turi
st I
nsur
ance
Bro
kers
Lim
ited
*M
r.Yoh
ana
Mga
siLi
fe &
Non
-Life
P. O
Box
399
9 D
sm
(255
)715
335
510/
(255
) 78
4 33
5510
futu
rist
brok
ers@
hotm
ail.c
om
36G
ati I
nsur
ance
Bro
kers
Ltd
Mr.E
mily
J. M
tauk
aLi
fe &
Non
- Li
feP.
O. B
ox 7
7887
Dsm
(255
) 71
3 26
5367
/(25
5) 2
2 21
3663
1ga
ti@
zant
el.c
om
37G
wem
ah I
nsur
ance
Bro
kers
Ltd
Mr.
Seba
stia
n K
ilato
Life
& N
on-
Life
P.O
. Box
232
31 D
sm(2
55)
754
3703
70/(
255)
732
995
940
gwem
ah@
bol.c
o.tz
38G
HM
Ins
uran
ce B
roke
rs*
Mr
Geo
ffer
y M
undi
gile
Life
&N
on-L
ifeP.
O B
ox 4
751
DSm
(255
) 78
4 83
9616
,(25
5)75
5 83
9616
mun
ding
ileg@
yaho
o.co
m
39H
arm
ony
Insu
ranc
e B
roke
rs L
imit
edM
s. E
. Mor
ingi
Life
& N
on-
Life
P.O
. Box
622
95 D
sm(2
55)
22 2
5561
411/
(255
) 7
13 0
7102
6ha
rmon
ybro
kers
@ho
tmai
l.com
40Im
pex
Insu
ranc
e B
roke
rs L
tdM
r. M
. Som
jiLi
fe &
Non
- Li
feP.
O. B
ox 1
654
Dsm
(255
) 22
213
7296
/(25
5) 7
84 2
2224
6sa
dick
@in
sura
ncet
z.co
m
41In
tert
rade
Exp
ress
Ltd
Mr
.J. P
alla
ngyo
Life
& N
on-
Life
P.O
. Box
132
18 A
rush
a(2
55)
732
9717
59/(
255)
784
888
475
inte
rtra
de@
haba
ri.c
o.uk
42JJ
P In
sura
nce
Bro
kres
Ltd
Mr.
P. L
. Mbu
yaLi
fe &
Non
- Li
feP.
O. B
ox 2
5378
Dsm
(255
) 22
212
3055
/(25
5) 7
13 4
0972
5jjp
insu
ranc
ebro
kers
@ya
hoo.
com
43J.
W S
eago
n &
Ins
uran
ce B
roke
rs (
T)
Ltd*
Mr.
Jam
es M
aina
Life
&N
on-L
ifeP.
O B
ox 3
8568
Dsm
+25
5 22
219
6800
info
@jw
seag
on.c
om
44Ja
guar
Ins
uran
ce B
roke
rs L
td*
Mr.F
araj
a M
kwiz
uLi
fe&
Non
-Life
P.O
Box
803
55 D
sm(2
55)
789
5005
00 (
255)
717
5005
00ja
guar
.bro
ker2
011@
gmai
l.com
45K
ibo
Insu
ranc
es L
imit
edM
r.Eds
on T
.Pol
epol
eLi
fe&
Non
-Life
P.O
Box
246
Aru
sha
(255
)254
479
7,(2
55)0
767
6679
93ki
bobr
oker
s@ya
hoo.
com
46K
irum
i Ins
uran
ce B
roke
rs L
tdM
r. N
. Mis
ongi
kaLi
fe &
Non
- Li
feP.
O. B
ox 1
0966
Mw
anza
(255
) 71
3 13
5452
/(25
5) 7
84 2
7836
0
47K
iwar
ai I
nsur
ance
Bro
kers
Lim
ited
Mr.
M. M
. May
omby
aLi
fe &
Non
- Li
feP.
O. B
ox 1
906
Mor
ogor
o(2
55)
716
2540
00/(
255)
714
526
117
b.m
kiri
ya@
yaho
o.co
m
48Li
aiso
n In
sura
nce
Bro
kers
(T
) Lt
dM
r. O
koth
Olo
oLi
fe &
Non
- Li
feP.
O. B
ox 1
2729
Dsm
(255
) 71
8 75
9449
/(25
5) 7
67 5
0012
0ol
loo@
liais
ongr
oup.
net
49LJ
K I
nsur
ance
Bro
kers
(T
) Li
mit
edM
s. E
sthe
r K
azi
Life
& N
on-
Life
P.O
. Box
149
50 D
sm(2
55)
22 2
1243
83/(
255)
784
695
579
info
@ljk
hold
ings
.com
50Lu
mum
ba I
nsur
ance
Bro
kers
Ms.
Alv
ina
Mvu
laLi
fe &
Non
- Li
feP.
O. B
ox 1
5742
Dsm
(2
55)
22 1
8323
2/(2
55)
655
5555
57lu
mum
bain
sura
nce@
hotm
ail.c
om
*Thi
s co
mpa
ny n
ewly
reg
iste
red
in 2
011
TIRA 2011 ANNUAL REPORT.indd Sec2:81TIRA 2011 ANNUAL REPORT.indd Sec2:81 1/18/13 9:48:00 AM1/18/13 9:48:00 AM

82
ANNUAL INSURANCE MARKET PERFORMANCE REPORT For The Year Ended 31st December 2011
TA
BL
E 2
B: R
EG
IST
ER
ED
AN
D A
CT
IVE
IN
SUR
AN
CE
BR
OK
ER
S A
S AT
31
DE
CE
MB
ER
201
1 (i
n al
phab
etic
al o
rder
) C
onti
nued
S/N
Nam
e of
Com
pany
CE
O/P
rinc
ipal
Offi
cer
Cla
ss o
f B
usin
ess
Post
al A
ddre
ssP
hone
Em
ail
51LF
Ins
uran
ce B
roke
rs (
T)
Ltd*
Mr.A
nder
w F
.Mos
hiLi
fe &
Non
-Life
P.O
Box
788
1 D
sm(2
55)
713
4648
94fr
edy.
msa
ngi@
Ifi n
sura
nce.
co.tz
52M
acre
e In
sura
nce
Bro
kers
(T
) Li
mit
edM
s. L
. Mar
tin
Life
& N
on-
Life
P.O
. Box
651
02 D
sm(2
55)
22 2
1342
83/(
255)
754
282
402
mac
reeb
roke
rs@
live.
co.u
k
53M
atun
da I
nsur
ance
Bro
kers
Lim
ited
Mr.
M. B
.Che
yoLi
fe &
Non
- Li
feP.
O. B
ox 8
0096
Dsm
(255
) 75
4 56
4545
mat
unda
inc@
gmai
l.com
54M
awen
zi I
nsur
ance
Bro
kers
Ltd
Mr.
H. K
ilasa
raLi
fe &
Non
- Li
feP.
O. B
ox 1
73 A
rush
a(2
55)
27 2
5080
17/(
255)
754
282
394
maw
enzi
nsur
ance
@tz
2000
.com
55M
IC G
loba
l Ris
ks (
T)
Ltd
Mr.
S. M
aher
ali
Life
& N
on-
Life
P.O
. Box
701
0 A
rush
a(2
55)
22 2
1204
33/(
255)
754
516
253
smm
aher
ali@
mic
glob
alri
sks.
com
56M
icro
Ens
ure
Tanz
ania
Lim
ited
Mr.
Filb
ert M
. Lay
onLi
fe &
Non
- Li
feP.
O. B
ox 3
8605
Dsm
(255
) 22
213
6002
/(25
5) 7
58 1
9102
4in
fo@
mic
roen
sure
.com
57M
ilmar
Ins
uran
ce C
onsu
ltant
s Lt
dM
r. L.
F. D
emel
loLi
fe &
Non
- Li
feP.
O. B
ox 8
71 D
sm(2
55)
22 2
1264
84/(
255)
713
320
422
milm
ar@
ctvs
atco
m.n
et
58M
inet
Ins
uran
ce B
roke
rsM
r. B
. Bin
tam
anyi
reLi
fe &
Non
- Li
feP.
O. B
ox 1
1835
Dsm
(255
) 22
212
7774
/(25
5) 6
58 5
0505
1in
fo@
min
et.c
o.tz
59M
air
&Yo
ung
Insu
ranc
e B
roke
r Li
mit
edM
r.Tit
us T
.Nya
lika
Life
& N
on-L
ifeP.
O B
ox 7
8964
Dsm
(255
) 22
218
0403
,(25
5)76
7 14
2142
inno
cent
@m
airy
oung
sins
uran
ce.c
om
60M
ayo
Insu
ranc
e B
roke
r Li
mit
ed*
Mrs
.Zuw
ena
Iddy
Life
& N
on-L
ifeP.
O B
ox 7
7729
Dsm
(255
) 22
245
1637
,(25
5) 7
86 3
7 63
28m
ayoi
nsur
ance
ltd@
gmai
l.com
61M
illen
ium
Ins
uran
ce B
roke
rs (
T)
Ltd
Mr.A
.Pan
jaLi
fe &
Non
-Life
P.O
Box
219
9 A
rush
a(2
55)2
7 25
0447
6,(2
55)7
54 3
0026
6m
illen
trad
e@tz
2000
.com
62N
ahir
Ins
uran
ce B
roke
rs &
Com
pany
Lim
ited
Mr.
A. O
. Lik
okol
aLi
fe &
Non
- Li
feP.
O. B
ox 1
1277
Dsm
(255
) 71
3 22
1079
/(25
5) 7
73 5
4821
8na
hirc
om@
yaho
o.co
m
63N
danu
Ins
uran
ce B
roke
rs L
tdM
r.ado
lf U
lom
iLi
fe &
Non
- Li
feP.
O. B
ox 1
4737
Aru
sha
(255
) 27
254
8973
/250
8885
deo@
ndan
uins
uran
ce.c
o.tz
64N
dege
Ins
uran
ce B
roke
rs L
tdM
r. S.
Nda
roLi
fe &
Non
- Li
feP.
O. B
ox 2
1416
Dsm
(255
) 78
4 88
8886
/(25
5) 7
84 5
0000
3nd
ege-
insu
ranc
e@co
visi
on20
00.c
om
65O
rbit
Ins
uran
ce C
onsu
ltant
s Lt
dM
r. S.
A. S
ham
isLi
fe &
Non
- Li
feP.
O. B
ox 1
3993
Dsm
(255
) 22
212
3518
/(25
5) 7
86 3
1307
5or
bit@
raha
.com
66O
utas
sura
nce
Bro
kers
(T)
Ltd
Ms.
P. K
arob
iaLi
fe &
Non
- Li
feP.
O. B
ox 7
8227
Dsm
(255
) 22
270
1516
/(25
5) 7
69 0
9899
0pk
@ou
ters
sura
nceb
roke
rs.c
o.tz
67Pa
n O
cean
ic I
nsur
ance
Bro
kers
Ltd
Mr.
F. S
eif
Life
& N
on-
Life
P.O
. Box
391
2 D
sm(2
55)
22 2
1325
40/5
pano
cean
ic@
cats
-net
.com
68Ph
ares
Ins
uran
ce B
roke
rs L
imit
edM
r. S.
Mna
ndal
aLi
fe &
Non
- Li
feP.
O. B
ox 2
3285
Dsm
(255
) 22
277
1299
/ (2
55)
787
7418
36in
fo@
phar
esin
sura
nce.
com
69Pr
ide
Insu
ranc
e B
roke
rs (
T)
Lim
ited
Mr.
E. K
anyu
ma
Life
& N
on-
Life
P.O
. Box
208
11 D
sm(2
55)
715
4634
09/(
255)
754
463
409
ephr
aim
.sim
one@
prid
eins
uran
ce.c
o.tz
70Pr
ize
Insu
ranc
e B
roke
rs L
imit
edM
rs. A
. M. M
wag
alaz
iLi
fe &
Non
- Li
feP.
O. B
ox 5
51 Z
anzi
bar
(255
) 77
7 48
1572
/(25
5) 7
13 3
5525
2pr
ize@
zanl
ink.
com
71Pa
cifi c
Ins
uran
ce B
roke
rs L
imit
edM
r.Jul
ius
Kir
imu
Mbi
rugu
Life
&N
on-L
ifeP.
O B
ox 7
9966
Dsm
(255
) 27
7100
0ka
bage
@ra
ha.c
om
72R
eos
Insu
ranc
e B
roke
rs L
tdM
r.Ern
est H
aule
Life
& N
on-
Life
P.O
. Box
703
47 D
sm(2
55)
22 2
1249
29/(
255)
784
288
580
reos
allia
nce@
yaho
o.co
m
73R
ova
Serv
ices
Mr.J
.Kes
syLi
fe&
Non
-Life
P.O
Box
106
6 A
rush
a(2
55)
27 2
7544
65/(
255)
27
2751
263
rova
@eo
lt.co
m
74Sa
mpa
t Ins
uran
ce B
roke
rs L
tdM
r. S.
Mos
esLi
fe &
Non
- Li
feP.
O. B
ox42
37 D
sm(2
55)
22 2
1132
01/(
255)
713
289
289
varo
onsa
mpa
t@gm
ail.c
om
75Si
lver
Ins
uran
ce C
onsu
ltanc
y Lt
dM
r. G
.; M
atik
oLi
fe &
Non
- Li
feP.
O. B
ox 3
6043
Dsm
(255
) 22
212
3766
/(25
5) 7
54 3
7496
9si
lver
insu
ranc
ebro
kers
@ya
hoo.
com
*Thi
s co
mpa
ny n
ewly
reg
iste
red
in 2
011
TIRA 2011 ANNUAL REPORT.indd Sec2:82TIRA 2011 ANNUAL REPORT.indd Sec2:82 1/18/13 9:48:00 AM1/18/13 9:48:00 AM

83
ANNUAL INSURANCE MARKET PERFORMANCE REPORT For The Year Ended 31st December 2011
TA
BL
E 2
B: R
EG
IST
ER
ED
AN
D A
CT
IVE
IN
SUR
AN
CE
BR
OK
ER
S A
S AT
31
DE
CE
MB
ER
201
1(i
n al
phab
etic
al o
rder
) C
onti
nued
S/N
Nam
e of
Com
pany
CE
O/P
rinc
ipal
Offi
cer
Cla
ss o
f B
usin
ess
Post
al A
ddre
ssP
hone
Em
ail
76St
ar I
nves
tmen
t (Z
anzi
bar)
Ltd
Mr.
Ali.
A. K
ayum
boLi
fe &
Non
- Li
feP.
O. B
ox 7
99 Z
anzi
bar
(255
) 22
218
3179
/(25
5) 7
73 3
6057
8st
ards
m@
zant
el.c
om
77Sw
is C
are
Insu
ranc
e B
roke
rs L
tdM
r. S.
W. S
haki
tund
uLi
fe &
Non
- Li
feP.
O. B
ox 1
2223
Dsm
(255
) 78
4 22
1616
/(25
5) 2
2 21
2890
7sw
isin
sura
nce@
hotm
ail.c
om
78Su
nris
e In
sura
nce
Bro
kers
Ltd
*M
s.U
pend
o M
pyop
yoLi
fe &
Non
Life
P.O
Box
381
40 D
sm(2
55)
22 2
1551
735,
(255
) 65
5 88
8808
sibl
td@
hotm
ail.c
om
79Ta
n M
anag
emen
t Ins
uran
ce B
roke
rs L
tdM
r. C
.O. B
wan
aLi
fe &
Non
- Li
feP.
O. B
ox 1
157
Mos
hi(2
55)
27 2
7515
14/(
255)
784
450
786
tc@
kilin
et.c
o.tz
80Tr
ust I
nsur
ance
Bro
ker
Lim
ited
Ms.
Judi
th M
arik
iLi
fe &
Non
-Life
P.O
Box
127
20 D
sm(2
55)
22 2
1 38
848,
(255
) 75
4 58
7579
apm
ashs
lla@
yaho
o.co
m
81T
horn
Ins
uran
ce B
roke
rs lt
dM
r. S.
A.B
alis
dya
Life
& N
on-
Life
P.O
. Box
101
77 D
sm(2
55)
22 2
1221
21th
orn.
limit
ed@
yaho
o.co
m
82Tr
ans
Afr
ica
Insu
ranc
e B
roke
rs L
tdM
r. A
. J. P
atel
Life
& N
on-
Life
P.O
. Box
165
8 D
sm(2
55)
22 2
6667
89/(
255)
748
545
828
anan
d@ti
btz.
com
83U
nite
d A
fric
a In
sura
nce
Bro
kers
Ltd
*M
rs.L
ucy
R.M
wit
taLi
fe&
Non
-Life
P.O
BO
X 3
2511
Dsm
(255
)22
2761
866/
(255
) 78
4 52
2666
jaki
sam
o@gm
ail.c
om
84V
enus
Ins
uran
ce B
roke
rs L
tdM
s.G
.Geo
gfre
yLi
fe&
Non
-Life
P.O
BO
X 6
2271
DSM
(255
)754
287
543
venu
sins
uran
ce20
09@
gmai
l.com
85V
inta
ge I
nsur
ance
Bro
kers
Ltd
*M
r.Mes
hack
Nda
liLi
fe&
Non
-Life
P.O
box
476
0 D
sm(2
55)
22 2
7756
06,(
255)
767
9819
74V
inta
gein
sura
nce1
@gm
ail.c
om
86W
omi I
nsur
ance
Bro
kers
Lim
ited
Mrs
. G. N
ahum
Life
& N
on-
Life
P.O
. Box
.116
Dsm
(255
) 71
3 24
8685
/(25
5) 7
15 6
9178
9nd
elna
@ya
hoo.
com
*Thi
s co
mpa
ny n
ewly
reg
iste
red
in 2
011
TIRA 2011 ANNUAL REPORT.indd Sec2:83TIRA 2011 ANNUAL REPORT.indd Sec2:83 1/18/13 9:48:01 AM1/18/13 9:48:01 AM

84
ANNUAL INSURANCE MARKET PERFORMANCE REPORT For The Year Ended 31st December 2011
TABLE 3A: REGISTERED INSURANCE AGENTS AS AT 31ST DECEMBER 2011 (in alphabetical order)
S/N Name of Agency Principal Class of Business
1 A and I Associates Alliance Non-Life
2 A. City Insurance Agents Ltd NIC Non- Life
3 A.J. Samatra Co. Ltd Astra Non-Life
4 Abbasi Exports Reliance Non-Life
5 Abu Khami Investments NIC Non-Life
6 Acacia Insurance Agency Jubilee Non-Life
7 ACME Insurance Agency Phoenix Non- Life
8 Aegis Insurance Consultants NIKO Non-Life
9 Africa One Insurance Agency NIC Life
10 Africarriers Ltd NIKO Non-Life
11 Agri-Business Insurance Agency NIC/Alliance Life & Non-Life
12 Agro Science (T) Ltd NIC Non-Life
13 Aja Insurance Agencies NIC Non-Life
14 Akiba Commercial Bank Real Non-Life
15 Al-Amoud General Enterprise ZIC Non-Life
16 Alliance Insurance Agency NIC Non-Life
17 Amani Central Agency Co. Ltd ZIC Non-Life
18 Amin Insurance Agents NIC Life
19 AMS Insurance & Risk Services Ltd Lion Non-Life
20 Anete Insurance Services Ltd NIC Life & Non-Life
21 Angazia Tanzania Ltd Phoenix Non-Life
22 AOK Ltd Real Non-Life
23 Apple Company Ltd ZIC Non-Life
24 Arem Business Agency NIC Life & Non-Life
25 Arusha Insurance Services Jubilee Non-Life
26 Arusha United Insurance Consultants Ltd NIC Non-Life
27 ASK Insurance Agencies NIC Non-Life
28 Aspaya Insurance Consultants Real Non-Life
29 Associated Business Consultants NIC Non-Life
30 Atlas Insurance Consultants ZIC Non-Life
31 Automobile Association Ins. Agency Jubilee Non-Life
32 Avike Ltd NIC Non-Life
33 Axis Consultants Ltd Phoenix Non-Life
34 AGM Insurance Agent Limited* MGen Non-Life
35 Abdesta Insurance Agency* Century Non-Life
36 Amicus Insurance Agency* Alliance Non-Life
37 A&R Insurance Agency* Century Non-Life
38 Aseni Insurance Agency* ZIC Non-Life
39 A.W Mhina Insurance Agency* NIC Life Insurance
40 Bahassany General Supplies ZIC Non-Life
*This company newly registered in 2011
TIRA 2011 ANNUAL REPORT.indd Sec2:84TIRA 2011 ANNUAL REPORT.indd Sec2:84 1/18/13 9:48:01 AM1/18/13 9:48:01 AM
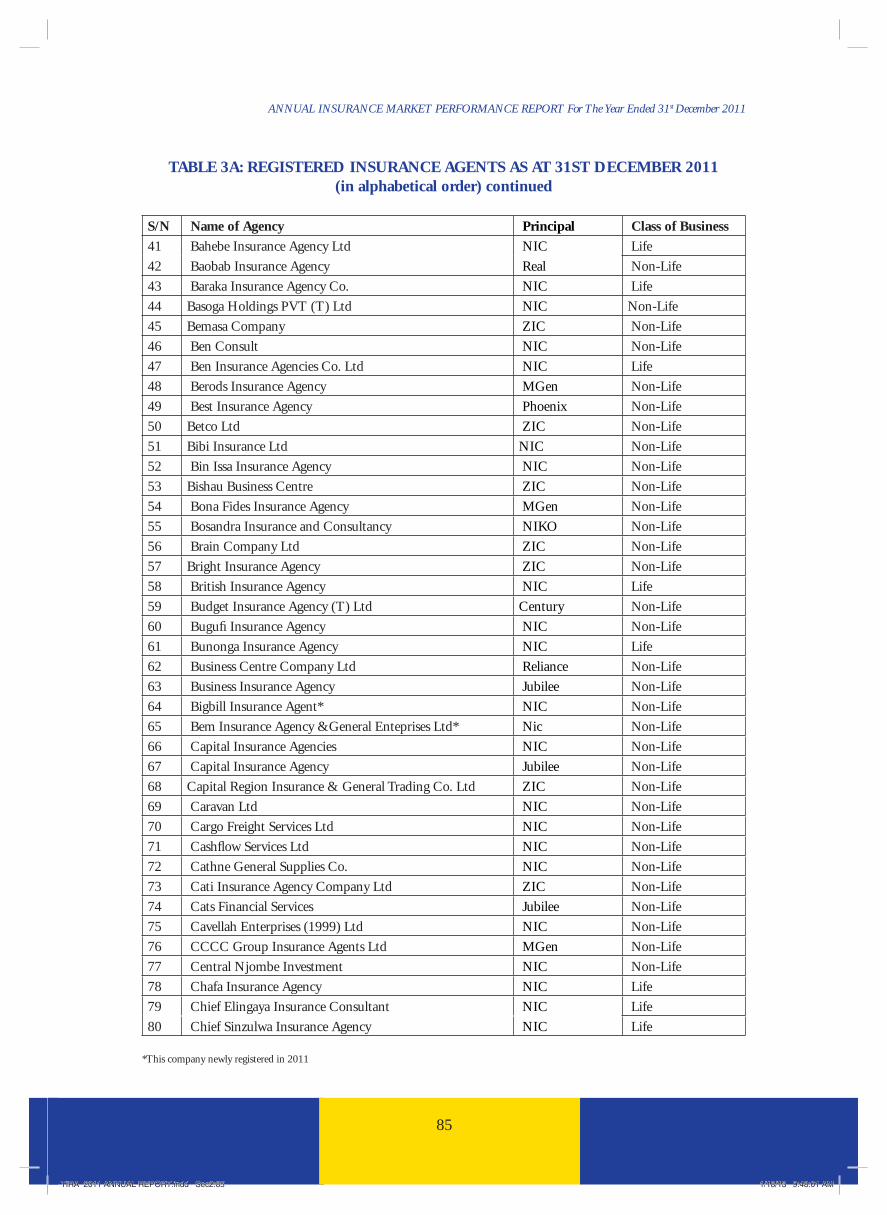
85
ANNUAL INSURANCE MARKET PERFORMANCE REPORT For The Year Ended 31st December 2011
TABLE 3A: REGISTERED INSURANCE AGENTS AS AT 31ST DECEMBER 2011 (in alphabetical order) continued
S/N Name of Agency Principal Class of Business
41 Bahebe Insurance Agency Ltd NIC Life
42 Baobab Insurance Agency Real Non-Life
43 Baraka Insurance Agency Co. NIC Life
44 Basoga Holdings PVT (T) Ltd NIC Non-Life
45 Bemasa Company ZIC Non-Life
46 Ben Consult NIC Non-Life
47 Ben Insurance Agencies Co. Ltd NIC Life
48 Berods Insurance Agency MGen Non-Life
49 Best Insurance Agency Phoenix Non-Life
50 Betco Ltd ZIC Non-Life
51 Bibi Insurance Ltd NIC Non-Life
52 Bin Issa Insurance Agency NIC Non-Life
53 Bishau Business Centre ZIC Non-Life
54 Bona Fides Insurance Agency MGen Non-Life
55 Bosandra Insurance and Consultancy NIKO Non-Life
56 Brain Company Ltd ZIC Non-Life
57 Bright Insurance Agency ZIC Non-Life
58 British Insurance Agency NIC Life
59 Budget Insurance Agency (T) Ltd Century Non-Life
60 Bugufi Insurance Agency NIC Non-Life
61 Bunonga Insurance Agency NIC Life
62 Business Centre Company Ltd Reliance Non-Life
63 Business Insurance Agency Jubilee Non-Life
64 Bigbill Insurance Agent* NIC Non-Life
65 Bem Insurance Agency &General Enteprises Ltd* Nic Non-Life
66 Capital Insurance Agencies NIC Non-Life
67 Capital Insurance Agency Jubilee Non-Life
68 Capital Region Insurance & General Trading Co. Ltd ZIC Non-Life
69 Caravan Ltd NIC Non-Life
70 Cargo Freight Services Ltd NIC Non-Life
71 Cashfl ow Services Ltd NIC Non-Life
72 Cathne General Supplies Co. NIC Non-Life
73 Cati Insurance Agency Company Ltd ZIC Non-Life
74 Cats Financial Services Jubilee Non-Life
75 Cavellah Enterprises (1999) Ltd NIC Non-Life
76 CCCC Group Insurance Agents Ltd MGen Non-Life
77 Central Njombe Investment NIC Non-Life
78 Chafa Insurance Agency NIC Life
79 Chief Elingaya Insurance Consultant NIC Life
80 Chief Sinzulwa Insurance Agency NIC Life
*This company newly registered in 2011
TIRA 2011 ANNUAL REPORT.indd Sec2:85TIRA 2011 ANNUAL REPORT.indd Sec2:85 1/18/13 9:48:01 AM1/18/13 9:48:01 AM

86
ANNUAL INSURANCE MARKET PERFORMANCE REPORT For The Year Ended 31st December 2011
TABLE 3A: REGISTERED INSURANCE AGENTS AS AT 31ST DECEMBER 2011 (in alphabetical order) continued
S/N Name of Agency Principal Class of Business 81 Chilumba Insurance Agency Bumaco Non-Life
82 Chiwosi Insurance Agency Real Non- Life
83 CIC Insurance Ltd NIC Non-Life
84 City Insurance Consultants NIC Non-Life
85 Classic Carriers Company Ltd NIC Non-Life
86 Coast Insurance Agency NIC Life
87 Coffee Tree NIC Non-Life
88 Conas Insurance Consultants NIC Non-Life
89 Consolidated Investments NIC Non-Life
90 Continental General Supplies Ltd NIKO Non-Life
91 Corona Insurance Consultancy Alliance Life
92 Cosaro Investment Company Ltd MGen Non-Life
93 CRDB Bank Ltd Real/African Life Life & Non-Life
94 Crispin Faustin Nyenyembe Ins Ag NIC Life
95 Collau Insurance Agent* Phoenix Non-Life
96 Crown Marketing Intern. Ltd NIC Non-Life
97 Cofi dence Insurance Agent Limited* Real Non-Life
98 Chilamu Insurance Agency* ZIC Non-Life
99 Dase Insurance Consultants Ltd NIC Life & Non-Life
100 Davis Insurance Agency Mgen Non-Life
101 Deliver Insurance Agency Lion Non-Life
102 Delta Insurance Agency NIC Life
103 Desta Enterprises Company NIC Non-Life
104 Duki Investment Phoenix Non-Life
105 Digital Scape Insurance Agency Real Non-Life
106 Dijomo Insurance Agency Ltd NIC Non-Life
107 Dodoma Insurance Agency NIC Life
108 Dolus Insurance Agencies Phoenix Non-Life
109 Dorry Insurance Consultant NIC Non-Life
110 Dove Insurance Agency Momentum Non-Life
111 Duki Investment NIC Non-Life
112 Dullah Insurance Agency* ZIC Non-Life
113 Dennvile Insurance Agency Limited* Jubilee Non-Life
114 E. A. Mwakamyanda Insurance Agency NIC Life
115 E. A. Ngomale insurance Agency NIC Non-Life
116 E. E. Mlay & Sons NIC Life
117 E.G.C. Honolulu Promotion, Gen Business NIC Life & Non-Life
118 Eagle Insurance Agency ZIC Non-Life
119 EAN Insurance Agency and Enterprises NIC Non-Life
120 Ebrahim Kassam & Sons Jubilee Non-Life
*This company newly registered in 2011
TIRA 2011 ANNUAL REPORT.indd Sec2:86TIRA 2011 ANNUAL REPORT.indd Sec2:86 1/18/13 9:48:01 AM1/18/13 9:48:01 AM
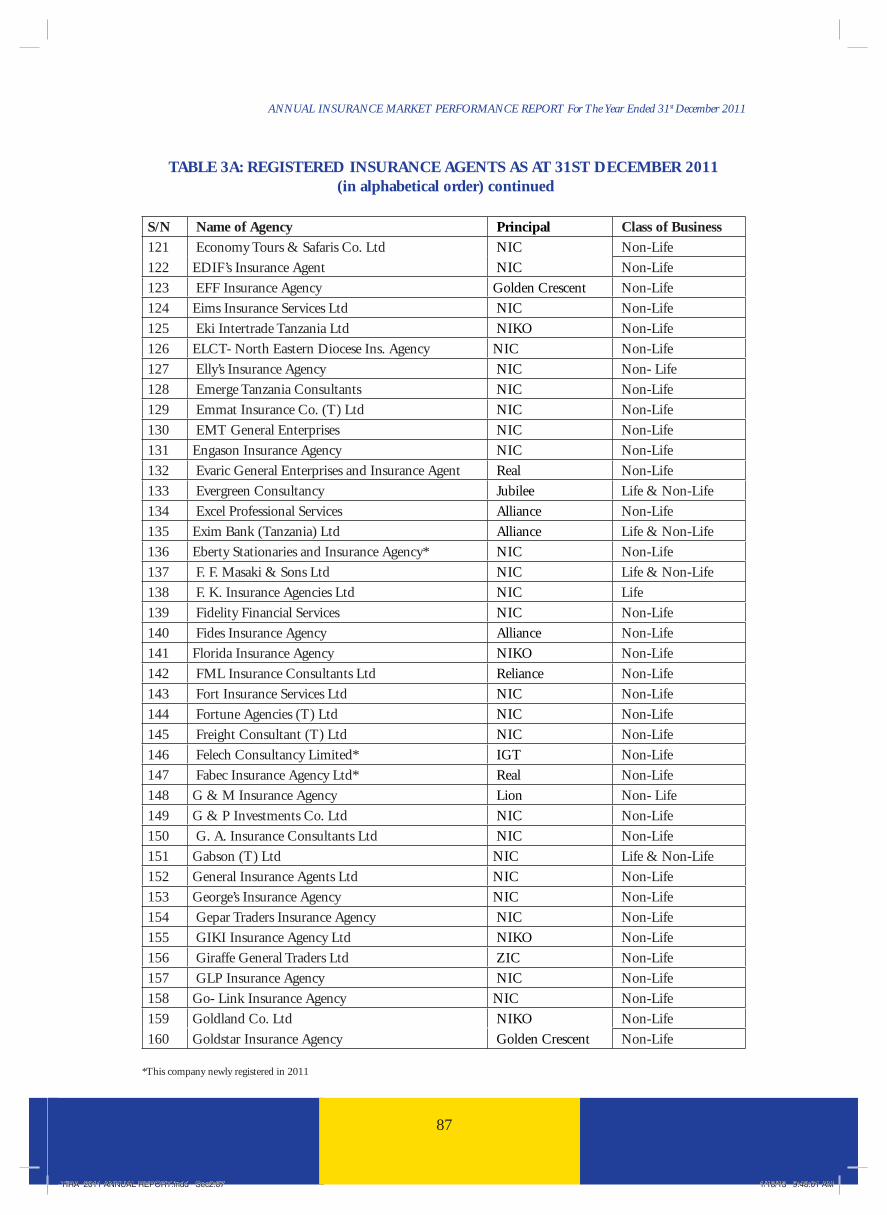
87
ANNUAL INSURANCE MARKET PERFORMANCE REPORT For The Year Ended 31st December 2011
TABLE 3A: REGISTERED INSURANCE AGENTS AS AT 31ST DECEMBER 2011 (in alphabetical order) continued
S/N Name of Agency Principal Class of Business 121 Economy Tours & Safaris Co. Ltd NIC Non-Life
122 EDIF’s Insurance Agent NIC Non-Life
123 EFF Insurance Agency Golden Crescent Non-Life
124 Eims Insurance Services Ltd NIC Non-Life
125 Eki Intertrade Tanzania Ltd NIKO Non-Life
126 ELCT- North Eastern Diocese Ins. Agency NIC Non-Life
127 Elly’s Insurance Agency NIC Non- Life
128 Emerge Tanzania Consultants NIC Non-Life
129 Emmat Insurance Co. (T) Ltd NIC Non-Life
130 EMT General Enterprises NIC Non-Life
131 Engason Insurance Agency NIC Non-Life
132 Evaric General Enterprises and Insurance Agent Real Non-Life
133 Evergreen Consultancy Jubilee Life & Non-Life
134 Excel Professional Services Alliance Non-Life
135 Exim Bank (Tanzania) Ltd Alliance Life & Non-Life
136 Eberty Stationaries and Insurance Agency* NIC Non-Life
137 F. F. Masaki & Sons Ltd NIC Life & Non-Life
138 F. K. Insurance Agencies Ltd NIC Life
139 Fidelity Financial Services NIC Non-Life
140 Fides Insurance Agency Alliance Non-Life
141 Florida Insurance Agency NIKO Non-Life
142 FML Insurance Consultants Ltd Reliance Non-Life
143 Fort Insurance Services Ltd NIC Non-Life
144 Fortune Agencies (T) Ltd NIC Non-Life
145 Freight Consultant (T) Ltd NIC Non-Life
146 Felech Consultancy Limited* IGT Non-Life
147 Fabec Insurance Agency Ltd* Real Non-Life
148 G & M Insurance Agency Lion Non- Life
149 G & P Investments Co. Ltd NIC Non-Life
150 G. A. Insurance Consultants Ltd NIC Non-Life
151 Gabson (T) Ltd NIC Life & Non-Life
152 General Insurance Agents Ltd NIC Non-Life
153 George’s Insurance Agency NIC Non-Life
154 Gepar Traders Insurance Agency NIC Non-Life
155 GIKI Insurance Agency Ltd NIKO Non-Life
156 Giraffe General Traders Ltd ZIC Non-Life
157 GLP Insurance Agency NIC Non-Life
158 Go- Link Insurance Agency NIC Non-Life
159 Goldland Co. Ltd NIKO Non-Life
160 Goldstar Insurance Agency Golden Crescent Non-Life
*This company newly registered in 2011
TIRA 2011 ANNUAL REPORT.indd Sec2:87TIRA 2011 ANNUAL REPORT.indd Sec2:87 1/18/13 9:48:01 AM1/18/13 9:48:01 AM

88
ANNUAL INSURANCE MARKET PERFORMANCE REPORT For The Year Ended 31st December 2011
TABLE 3A: REGISTERED INSURANCE AGENTS AS AT 31ST DECEMBER 2011 (in alphabetical order) continued
S/N Name of Agency Principal Class of Business
161 Greenland Insurance Agency Ltd NIC Non-Life
162 GSF Nuru Insurance Agent NIC Life & Non-Life
163 GTG Insurance Agency NIC Non-Life
164 Guardian & Associates Ltd Reliance Non-Life
165 Gwajumo Kalikene Insurance Agency* NIC/Phoenix Life & Non-Life
166 Gilmac Insurance Agency* Century Non-Life
167 Greenland Insurance Agency Ltd*
168 Greenlife Insurance Agency* Jubilee Non-Life
169 Grapes Insurance Agency* IGT Non-Life
170 H. K. & Davis Insurance Ltd Real Non-Life
171 H.M.N.T. Company NIC Life
172 Hadolin Limited ZIC Non-Life
173 Hakika Insurance Agency Alliance Non-Life
174 Hamdani General Supplies Ltd Alliance Non-Life
175 Hamwa Insurance Agency NIC Non-Life
176 Happy Trust Consultants & Insurance Agency Phoenix/NIC Non-Life
177 Haraka Agencies (T) Ltd Phoenix Non-Life
178 Harry Mwambene Insurance Agency NIC Non-Life
179 Hauzkhas Insurance Agency Phoenix Non-Life
180 Health Solution Insurance Agent AAR Prime Care Non-Life
181 Hema Insurance Agency NIC Non-Life
182 Henfl ora Mtwara Reliance Non-Life
183 Hephziba Associates Co. Limited MGen Non-Life
184 Himo Secretarial Services Reliance Non-Life
185 Himo Secretarial Services Alliance Life
186 Homick Consultants Jubilee Non-Life
187 Honest Insurance Agency NIKO Non-Life
188 Horizon Insurance Agency Jubilee Non-Life
189 Hydery Agency of Insurance NIC Non-Life
190 Hydrocom Limited NIC Non-Life
191 HNV Insurance Agency* Alliance Non-Life
192 Harmony Insurance Agency AAR Non-Life
193 I & R Insurance Agency NIKO Non-Life
194 I.B.S Investment Phoenix Non-Life
195 Imara Consultants Ltd NIC Non-Life
196 Imuka Insurance Agency ZIC Non-Life
197 Incharge Investments Ltd NIKO Non-Life
198 Inju Insurance Agency NIKO Non-Life
199 Inter- Oceanic Industries ltd ZIC Non-Life
200 Internt’l Business & Mgt Consultants Ltd NIC Non-Life
*This company newly registered in 2011
TIRA 2011 ANNUAL REPORT.indd Sec2:88TIRA 2011 ANNUAL REPORT.indd Sec2:88 1/18/13 9:48:01 AM1/18/13 9:48:01 AM
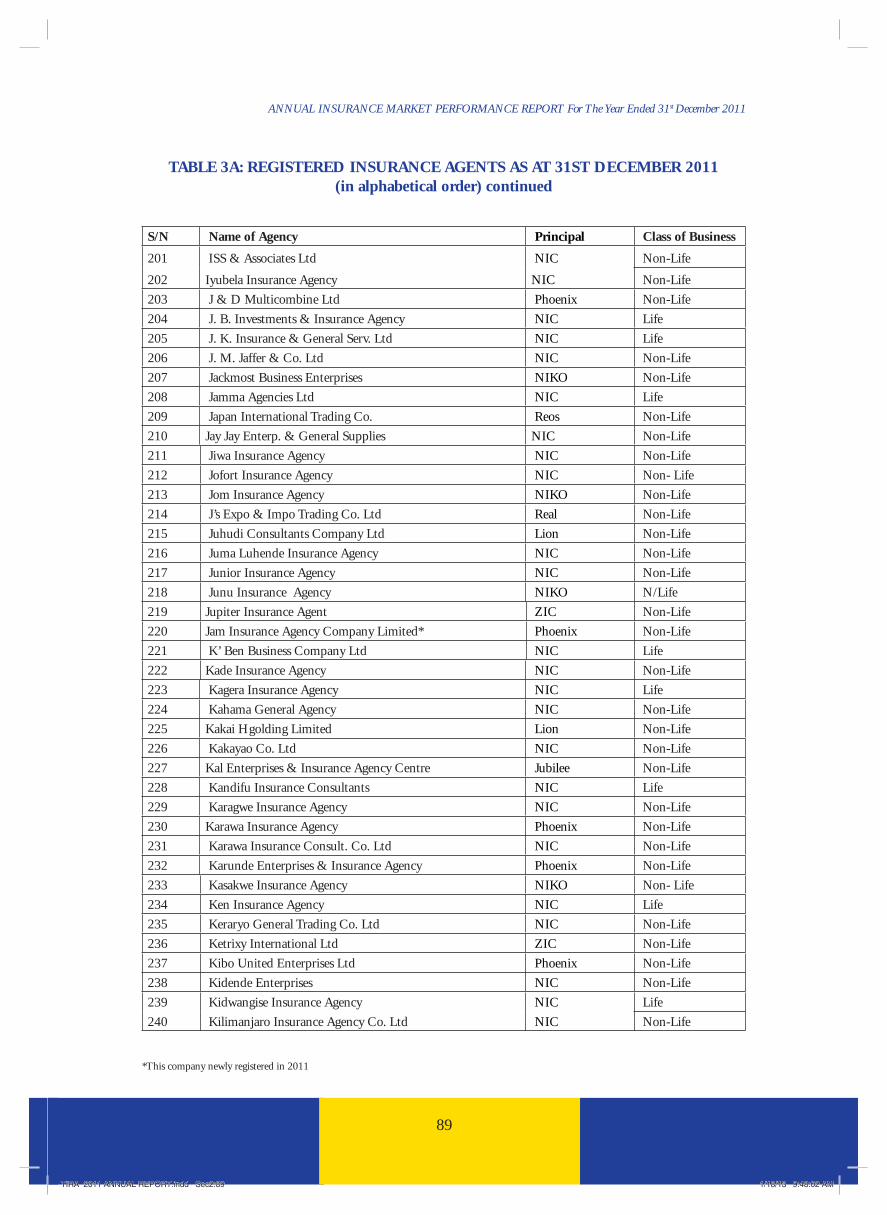
89
ANNUAL INSURANCE MARKET PERFORMANCE REPORT For The Year Ended 31st December 2011
TABLE 3A: REGISTERED INSURANCE AGENTS AS AT 31ST DECEMBER 2011 (in alphabetical order) continued
S/N Name of Agency Principal Class of Business
201 ISS & Associates Ltd NIC Non-Life
202 Iyubela Insurance Agency NIC Non-Life
203 J & D Multicombine Ltd Phoenix Non-Life
204 J. B. Investments & Insurance Agency NIC Life
205 J. K. Insurance & General Serv. Ltd NIC Life
206 J. M. Jaffer & Co. Ltd NIC Non-Life
207 Jackmost Business Enterprises NIKO Non-Life
208 Jamma Agencies Ltd NIC Life
209 Japan International Trading Co. Reos Non-Life
210 Jay Jay Enterp. & General Supplies NIC Non-Life
211 Jiwa Insurance Agency NIC Non-Life
212 Jofort Insurance Agency NIC Non- Life
213 Jom Insurance Agency NIKO Non-Life
214 J’s Expo & Impo Trading Co. Ltd Real Non-Life
215 Juhudi Consultants Company Ltd Lion Non-Life
216 Juma Luhende Insurance Agency NIC Non-Life
217 Junior Insurance Agency NIC Non-Life
218 Junu Insurance Agency NIKO N/Life
219 Jupiter Insurance Agent ZIC Non-Life
220 Jam Insurance Agency Company Limited* Phoenix Non-Life
221 K’ Ben Business Company Ltd NIC Life
222 Kade Insurance Agency NIC Non-Life
223 Kagera Insurance Agency NIC Life
224 Kahama General Agency NIC Non-Life
225 Kakai Hgolding Limited Lion Non-Life
226 Kakayao Co. Ltd NIC Non-Life
227 Kal Enterprises & Insurance Agency Centre Jubilee Non-Life
228 Kandifu Insurance Consultants NIC Life
229 Karagwe Insurance Agency NIC Non-Life
230 Karawa Insurance Agency Phoenix Non-Life
231 Karawa Insurance Consult. Co. Ltd NIC Non-Life
232 Karunde Enterprises & Insurance Agency Phoenix Non-Life
233 Kasakwe Insurance Agency NIKO Non- Life
234 Ken Insurance Agency NIC Life
235 Keraryo General Trading Co. Ltd NIC Non-Life
236 Ketrixy International Ltd ZIC Non-Life
237 Kibo United Enterprises Ltd Phoenix Non-Life
238 Kidende Enterprises NIC Non-Life
239 Kidwangise Insurance Agency NIC Life
240 Kilimanjaro Insurance Agency Co. Ltd NIC Non-Life
*This company newly registered in 2011
TIRA 2011 ANNUAL REPORT.indd Sec2:89TIRA 2011 ANNUAL REPORT.indd Sec2:89 1/18/13 9:48:02 AM1/18/13 9:48:02 AM

90
ANNUAL INSURANCE MARKET PERFORMANCE REPORT For The Year Ended 31st December 2011
TABLE 3A: REGISTERED INSURANCE AGENTS AS AT 31ST DECEMBER 2011 (in alphabetical order) continued
S/N Name of Agency Principal Class of Business
241 Kina Insurance Agency NIC Non-Life
242 Kinga Insurance Consult Ltd NIC Non-Life
243 Kiogwe Insurance & Gen. Consult. Ltd NIC Life
244 Kiria Insurance Agency NIC Non-Life
245 Kiru Insurance Agencies NIC Non-Life
246 Kishen Enterprises Reliance Non-Life
247 Kitota Insurance Agency NIC Life & Non-Life
248 Kiyanga Associates & Co. Ltd NIC Non-Life
249 Komote Insurance Consultants Co. Ltd NIC Non-Life
250 Koru Freight Ltd NIC Non-Life
251 Krispin Faustin Nyenyembe NIC Life
252 Kumbasega Insurance Agent* Real Non-Life
253 Kundi Associates NIC Non-Life
254 Kuyega Insurance Agency NIC Non- Life
255 Kwamakumbu & Co. Ltd NIC Life & Non-Life
256 Kyekue Insurance Agency NIKO Non-Life
257 Kyonya Insurance Agency NIC Non-Life
258 Komote Insurance Agency* NIKO Non-Life
259 Ladislaus Rutananukwa Ins. Agency NIC Non-Life
260 Lake Tanganyika Insurance Agency NIC Non - Life
261 Lake Zone Insurance Consultants Co. Ltd Jubilee Non-Life
262 Lal Garage Relaince Non-Life
263 LAL insurance Agency Phoenix Non-Life
264 Lasso Business & Insurance agency NIC Non-Life
265 Latitude Insurance Agency NIKO Non-Life
266 Leeds Agency NIC Non-Life
267 Lembato Consultancy Co. NIC Life
268 Leopald Insurance Agency NIKO Non-Life
269 Leshete Trading Establishment Ltd NIC Non-Life
270 Lesso insurance Agency NIC Non-Life
271 Lesso Insurance Agency NIC Non-Life
272 Light Coast Co. Ltd NIKO Non-Life
273 Lindi/Mtwara Insurance Agencies Partnership NIC Life
274 Lojex and Yinga’s Traders Ltd NIC Life & Non-Life
275 Loleza Insurance Agency NIKO Non-Life
276 Lord’s Insurance Ltd Reliance Non-Life
277 Losam Insurance Agency Reliance Non-Life
278 Luhamba and Mnkeni Insurance Agency NIC Life
279 Lunchcomu Insurance Agency NIC Non-Life
280 Lenox Insurance Agency Ltd* Milembe Non-Life
*This company newly registered in 2011
TIRA 2011 ANNUAL REPORT.indd Sec2:90TIRA 2011 ANNUAL REPORT.indd Sec2:90 1/18/13 9:48:02 AM1/18/13 9:48:02 AM

91
ANNUAL INSURANCE MARKET PERFORMANCE REPORT For The Year Ended 31st December 2011
TABLE 3A: REGISTERED INSURANCE AGENTS AS AT 31ST DECEMBER 2011 (in alphabetical order) continued
S/N Name of Agency Principal Class of Business
281 M. P. Insurance & Secretarial Services Jubilee Non-Life
282 M. R. Njau Insurance Agency NIC Life
283 M.W. Lenguyana’s Insurance Consultant NIC Non-Life
284 Maarrifa Trading Corp. Ltd NIC Non-Life
285 Mabita Company Ltd NIC Non-Life
286 Machupa General Supplies Ltd NIC Non-Life
287 Madila insurance agency NIC Life
288 Madila insurance agency Real Non-Life
289 Madson Consultant Agency & Company Ltd Phoenix Non-Life
290 Majita Enterprises Co. Ltd NIC Life
291 Makibu Insurance Agency Phoenix Non-Life
292 Makule Associates & Company NIC Life
293 Mali Ins. Consult. & Gen. Enterp. NIC Non-Life
294 Malimba Investments & Insurance Consultancy Ltd NIC Life
295 Mambundim United Traders NIC Life
296 Margareth Elias Insurance Agency NIKO Non-Life
297 Marsha Company Ltd Phoenix Non-Life
298 Maryland Insurance Agency NIC Life & Non-Life
299 Masala Insurance Agency NIC Life
300 Mashare Insurance Agency ZIC Non-Life
301 Mashim Investments Co. Ltd Phoenix Non-Life
302 Maslaa Phoenix Non-Life
303 Master Insurance Agency Phoenix Non-Life
304 MAT & E. Company Ltd NIC Non-Life
305 Matunda Investment Ltd NIC Non-Life
306 Mawanda General Trading Co. NIC Life & Non-Life
307 Maxima Enterprises NIC Life
308 Mazrui Commission Agent Company Ltd Imperial Non-Life
309 Mbapila Enterp. & Insurance Agency NIC Life
310 Mbeya United Insurance Agency Co. Ltd NIC Life
311 Mchacho Insurance Agency Lion Non-Life
312 Mcheka Insurance Agency NIC Non-Life
313 Mchimbi Insurance Agency NIC Life
314 MCM Insurance Agency NIC Non-Life
315 Mediterranean Insurance Serv. Co-op. NIC Life
316 Medka Insurance Agency NIC Non-Life
317 Merliza Insurance Agency MGen Non- Life
318 Midway Assurance Consultancy MGen Non-Life
319 Mikila Insurance Consultants Ltd* NIC Life & Non-Life
320 Milambo Insurance Agent & General Supplies Milembe Non-Life
*This company newly registered in 2011
TIRA 2011 ANNUAL REPORT.indd Sec2:91TIRA 2011 ANNUAL REPORT.indd Sec2:91 1/18/13 9:48:02 AM1/18/13 9:48:02 AM

92
ANNUAL INSURANCE MARKET PERFORMANCE REPORT For The Year Ended 31st December 2011
TABLE 3A: REGISTERED INSURANCE AGENTS AS AT 31ST DECEMBER 2011 (in alphabetical order) continued
S/N Name of Agency Principal Class of Business
321 Mipa Insurance Agency Ltd NIC Non-Life
322 Mission and Services Agency Ltd NIC Non-Life
323 Missionary Spirit Travel Ltd NIC Non-Life
324 Misufi ni Stationery Centre ZIC Non-Life
325 Mlimwa Investment & Insurance Co. ltd NIC Life
326 Mngeta General Dealer ZIC Non- Life
327 Mnyenyelwa Insurance Agency NIC Non-Life
328 Modern Insurance Agency NIKO Non-Life
329 Monami investments Lion Non-Life
330 Moonage Enterprises Ltd Alliance Non-Life
331 Moraf Motors Ltd Reliance Non-Life
332 Moraf Motors Ltd Reliance/Phoenix/Jubilee Non-Life
333 Morogoro Quality Insurance Agency NIC Non-Life
334 Motherland Insurance Agency NIC Non-Life
335 Mount Meru Insurance Agency NIKO Non-Life
336 MSF Insurance Agency NIC Non-Life
337 Mshare Insurance Agent ZIC Non-Life
338 Mtaki Insurance Agency NIC Non-Life
339 Mtandao Insurance Agency NIKO Non- Life
340 Mtewele General Traders and Insurance Agent ZIC Non-Life
341 Mtoni Insurance Agency NIC Life
342 Mtwara Insurance Agency NIC Non-Life
343 Mufi ndi Community Bank Ltd Reliance Non-Life
344 Mufi ndi Insurance Agency Real Non-Life
345 Muganda Insurance Consultants NIC Non-Life
346 Muhigi insurance Consultants NIC Life
347 Muleba Quality Service Enterprise NIC Life
348 Multi Insurance Agencies Ltd Jubilee Non-Life
349 Multicombine Insurance Agency Reliance Non - Life
350 Mungoli Insurance Consultants Lion Non-Life
351 Musoma Insurance Consultants Ltd NIC Life & Non-Life
352 Musoma Service Station Jubilee Non-Life
353 Muzdalifa Enterprises Ltd NIC Life & Non-Life
354 Mwakyoma Abraham Agency NIC Non-Life
355 Mwanga Rural Community Bank Ltd Real Non-Life
356 Mwidunda Invesment & Insurance Agency Ltd NIC Non-Life
357 Mwoleka Hotel Ltd NIC Non-Life
358 Manyara Insurance Agency* NIC Non-Life
359 Manu Insurance Agency* Nico Non-Life
360 Mbinga Community Bank Limited* Reliance
*This company newly registered in 2011
TIRA 2011 ANNUAL REPORT.indd Sec2:92TIRA 2011 ANNUAL REPORT.indd Sec2:92 1/18/13 9:48:02 AM1/18/13 9:48:02 AM

93
ANNUAL INSURANCE MARKET PERFORMANCE REPORT For The Year Ended 31st December 2011
TABLE 3A: REGISTERED INSURANCE AGENTS AS AT 31ST DECEMBER 2011 (in alphabetical order) continued
S/N Name of Agency Principal Class of Business
361 Mambya Insurance Agency Company Limited* Real Non-Life
362 Nafunafu Insurance Agent Lion Non- Life
363 Nancy Enterprises Ltd NIC Non-Life
364 Nangi Insurance Agency Alliance Non-Life
365 Nassa Insurance Agency Ltd NIC Life
366 National Social Security Fund Jubilee Non-Life
367 Navan Insurance Consultants NIKO Non-Life
368 NBC Limited Alexander Forbes Life & Non-Life
369 Ndeng’aro Agencies & Consultants NIC Non-Life
370 Ndiga Insurance Agency NIC Non-Life
371 Neephguide Insurance Agency MGen Non- Life
372 Negoe Traders Company NIC Non-Life
373 Nemak Insurance Agency Phoenix Non-Life
374 Nemamu Insurance Agency NIKO Non- Life
375 Nerm (T) Co. Ltd NIC Non-Life
376 New Millenium Insurance Alliance Non-Life
377 Ney Insurance Consultants NIC Non-Life
378 NIA Njema Insurance Agency ZIC Non- Life
379 Nisi Insurance Agency NIKO Non-Life
380 Nora Insurance Agency Ltd* Golden Crescent Non- Life
381 Northern Insurance Consultants NIC Non-Life
382 Northern Triangle Insurance Agents (T) Ltd Century Non-Life
383 NSM Insurance Agency NIC Non-Life
384 Ntalisa Insurance Consultants NIC Non-Life
385 Nyamagana insurance Agency NIC Life & Non-Life
386 Nyanjale General Trading Co. ZIC Non-Life
387 Nyaulingo Insur. & Consult. & Gen. Trad. NIC Non-Life
388 Nyoni Insurance Agency Real Non-Life
389 Nick Insurance Agency* IGT Non-Life
390 O.M. Insurance Agency NIC Non-Life
391 Omega Insurance Consultants Ltd Jubilee Non-Life
392 Omukyaya (1998) Insurance Agency NIC Life
393 OSK Investment Company Ltd NIC Non-Life
394 Otana Itana Co. Ltd NIC Non-Life
395 Otto Insurance Agency Real Non- Life
396 Old South Insurance Agency Real Non-Life
397 P & P Multicombine Ltd NIC Non-Life
398 Pamoja Insurance Agency Ltd Lion Non-Life
399 Paradise Insurance Consultants ZIC Non-Life
400 Parent Investments Co. ltd NIC Life & Non-Life
*This company newly registered in 2011
TIRA 2011 ANNUAL REPORT.indd Sec2:93TIRA 2011 ANNUAL REPORT.indd Sec2:93 1/18/13 9:48:02 AM1/18/13 9:48:02 AM

94
ANNUAL INSURANCE MARKET PERFORMANCE REPORT For The Year Ended 31st December 2011
TABLE 3A: REGISTERED INSURANCE AGENTS AS AT 31ST DECEMBER 2011 (in alphabetical order) continued
S/N Name of Agency Principal Class of Business
401 Passover Company Ltd NIC Non-Life
402 Peace Insurance Agency NIC Non-Life
403 Peak Investments (T) Ltd NIC Non-Life
404 Pearl Insurance Agency Ltd Jubilee Non-Life
405 Perfect Services Ltd Jubilee Non-Life
406 Pigeon Offi ce General Services Alliance Non-Life
407 Pillers Insurance Agency Alliance Non-Life
408 Pisces Insurance Agency Lion Non- Life
409 PLM Liluluma Company NIC Non-Life
410 Prasi Company Ltd Phoenix Non-Life
411 Precious Insurance Agency NIKO Non-Life
412 Primode Agency NIKO Non-Life
413 Project Care Services NIC Non-Life
414 Property Consultancy & Services Ltd NIC Non-Life
415 Pwani Insurance Agent NIC Non-Life
416 Precious Insurance Agency* NIC Non -Life
417 People Insurance Agency* ZIC Non-Life
418 Pasy Insurance Agent* Real Non-Life
419 Pandu Insurance Agency Ltd NIC Non-Life
420 Prudential Insurance Consultancy Services Ltd* Nic Life&Non-Life
421 R. S. Mwakanosya Insurance Agency NIC Non-Life
422 R.C Insurance Agency Tanzindia Non- Life
423 R.J. Insurance Agency Phoenix Non-Life
424 R.M. Mrindoko Insurance Agency NIC Life
425 RAE Insurance Agency & Co. NIC Life
426 Rafad Insurance Agency NIC Non-Life
427 Raima Limited ZIC Non-Life
428 Ram Insurance Agent Bumaco Non-Life
429 Ready Services Ltd Phoenix Non-Life
430 Real CompanyLtd Real Non-Life
431 Redemtio Insurance Agency Prosperity Non- Life
432 Responsive Enterprises & Insurance Agency NIC Non- Life
433 Reta Insurance Agents ZIC Non-Life
434 Reysons General Merchandise ZIC Non-Life
435 Rido Insurance Agent NIC Life
436 Rift Valley Insurance Agency Phoenix Non-Life
437 Risk Insurance Services Ltd Real Non-Life
438 RME Valekhe Investment NIC Non-Life
439 Robin Insurance Services Ltd Phoenix Non-Life
440 Rockshield Insurance Agency Ltd Alexander Forbes Non-Life
*This company newly registered in 2011
TIRA 2011 ANNUAL REPORT.indd Sec2:94TIRA 2011 ANNUAL REPORT.indd Sec2:94 1/18/13 9:48:02 AM1/18/13 9:48:02 AM

95
ANNUAL INSURANCE MARKET PERFORMANCE REPORT For The Year Ended 31st December 2011
TABLE 3A: REGISTERED INSURANCE AGENTS AS AT 31ST DECEMBER 2011 (in alphabetical order) continued
S/N Name of Agency Principal Class of Business
441 Roma Insurance Agency Real Non-Life
442 Rukwa Insurance Consultants & Co. Ltd NIC Life
443 Ruvuma Insurance Agency NIC Life
444 R.B Kambanga Insurance Agency Company Ltd* NIC Life
445 Rado Insurance Agent (T) Ltd* Century Non-Life
446 S. M. Mwendwa Insurance Consultants NIC Life
447 S. S. International Ltd NIC Non-Life
448 S. T. K. Enterprises Ltd NIC Non-Life
449 Saicom Insurance Agency Momentum Non-Life
450 Sair Insurance Agency NIC Non-Life
451 San Sam Insurance Agency Ltd Alliance Non-Life
452 Sanbel Insurance Agency Phoenix Non-Life
453 Saraiya Insurance Agency Alliance Non-Life
454 Sarawany Investment Ltd NIC Non-Life
455 Savannah Insurance agency NIC Non-Life
456 Sawa Insurance Agency NIC Life
457 Sayari Insurance Agency Ltd NIC Non-Life
458 Scan Insurance & General Services Ltd Phoenix Non-Life
459 Seen Insurance Agency MGen Non-Life
460 Selya Insurance Agency NIC Non-Life
461 Sembeti Insurance and Consultants NIC Non-Life
462 Serecha Investments Ltd NIC Non-Life
463 SGZaksil Insurance Agency Ltd NIC Life
464 Shaiva Company Ltd NIC Non-Life
465 Shash Insurance Agent NIC Non-Life
466 Singida Insur. Consultants & Gen. Enterp. Ltd NIC Life
467 Smart Insurance Agency ZIC Non-Life
468 SMS Company Ltd ZIC Non-Life
469 Somerset Insurance Consultants Lion Non-Life
470 Songolo Insurance Agency Reliance Non-Life
471 South East Insurance Agency Jubilee Non-Life
472 Southern Highlands Insurance Agency NIC Life
473 Southern Insurance Agency Lion Non-Life
474 Speedways Ltd Phoenix Non-Life
475 Spics Intern. Consult. Services (T) Ltd NIC Non-Life
476 Splendid Insurance Agency Reliance Non-Life
477 St Louis Holdings Ltd NIC Non-Life
478 Stacon Investments Co. Ltd NIC Non-Life
479 Standard Group insurance Agency NIC / Phoenix Life & Nonlife
480 Standard Insurance Agency NIC Non-Life
*This company newly registered in 2011
TIRA 2011 ANNUAL REPORT.indd Sec2:95TIRA 2011 ANNUAL REPORT.indd Sec2:95 1/18/13 9:48:02 AM1/18/13 9:48:02 AM

96
ANNUAL INSURANCE MARKET PERFORMANCE REPORT For The Year Ended 31st December 2011
TABLE 3A: REGISTERED INSURANCE AGENTS AS AT 31ST DECEMBER 2011 (in alphabetical order) continued
S/N Name of Agency Principal Class of Business
481 Statewide Express Insurance Agency ZIC Non-Life
482 Sun Rise General Srvices Phoenix Non-Life
483 Sunshine General Insurance Agency NIC Non-Life
484 Super Family express Co. Ltd NIC Non-Life
485 Shaha Insurance Agency* NIC Non-Life
486 Semalunga Insurance * Bumaco Non-Life
487 Sihanga Insurance Agency* Real Non-Life
488 Shelter Insurance Enterprises* NIC Non-Life
489 Sirgeminy Trading and Insurance Agency* Real Non-Life
490 Sparkle Insurance Agency (T) Limited* Century Non-Life
491 Sesemela Insurance Agency* NIC Non-Life
492 Solution Insurance Agency &General services* Phoenix Non-Life
493 T. L. Investment Co. ltd NIC Non-Life
494 T. S. Mdendu & Sons Insurance Agency NIC Life
495 Tahadhari Insurance Agency NIC Non-Life
496 Tajack Insurance Ltd NIC Life & Non-Life
497 Takecare Enterprises & Consultants Ltd NIC Non-Life
498 Tamasa General Enterp. Ltd NIC Non-Life
499 Tamwa Insurance Agent ZIC Non-Life
500 Tan Ame Insurance Consultants Real Non-Life
501 Tanec Insurance Consultants ZIC Life
502 Tanganyika Farmers Association Ltd Jubilee Non-Life
503 TanLond General Insurance Agents NIKO Non-Life
504 Tanzania Episcopal Conference NIC Non-Life
505 Tanzania Federation of Co-ops Ltd NIC Non-Life
506 Tanzania Insurance Agency Lion Non-Life
507 Tanzania Investment Bank Insurance Agency Astra Non-Life
508 Tanzania One Insurance Agency NIC Life
509 Tanzania Post Corporation NIC Non-Life
510 Tanzanian Postal Bank Astra Non-Life
511 Tanzania Assemblies of God* NIC Non-Life
512 Tapse International Supply ZIC Non-Life
513 Tax & Management Consultants Bureau NIC Non-Life
514 TCCIA Kilimanjaro Insurance Agency Real Non-Life
515 Teleconsult Ltd NIC Non-Life
516 The First Micro Insurance Agency Jubilee Non - Life
517 The Hub Limited Strategis Medical
518 The Leopard Agencies Ltd Phoenix Non-Life
519 The Motor Trade Corporation ZIC Non-Life
520 The Real Business Agency NIC Non-Life
*This company newly registered in 2011
TIRA 2011 ANNUAL REPORT.indd Sec2:96TIRA 2011 ANNUAL REPORT.indd Sec2:96 1/18/13 9:48:03 AM1/18/13 9:48:03 AM

97
ANNUAL INSURANCE MARKET PERFORMANCE REPORT For The Year Ended 31st December 2011
TABLE 3A: REGISTERED INSURANCE AGENTS AS AT 31ST DECEMBER 2011 (in alphabetical order) continued
S/N Name of Agency Principal Class of Business
521 The Bull Insurance Agency* Jubilee Non-Life
522 Timamu Insurance & Consulting Agency NIC Non-Life
523 TMN Insurance Agency NIC Non-Life
524 Top Knock Company NIC Non-Life
525 Tortoise Investments NIC Non-Life
526 Trade Waves Investments Co. Ltd NIC Non-Life
527 Trio Insurance Agency NIC Non-Life
528 Tuva Insurance Agency Phoenix Non-Life
529 Twiga Insurance Agent Company ZIC Non-Life
530 Times Insurance Agency* IGT Non-Life
531 Ultimate Insurance Services Ltd Jubilee Non-Life
532 Ulugano Traders Co. Ltd NIC Non-Life
533 Union Finance Tanzania Ltd Jubilee Non-Life
534 United Business & Insurance Agent Jubilee Non- Life
535 United Insurance Agency NIC Non-Life
536 United Interbusiness Glory Jubilee Non-Life
537 United Mwanza Agencies Limited NIC/Phoenix Life & Non-Life
538 Unity Business Consultancy & Insurance Agency Phoenix Non- Life
539 Unity Insurance Agents Ltd NIC Non-Life
540 Universal Insurance Agency MGen Non-Life
541 University of Dar es salaam NIC Non-Life
542 Unyangala Enterp. Ltd NIC Non-Life
543 Upendo Insurance Agency ZIC Non- Life
544 Utamwa and Company Ltd NIC Non-Life
545 V. C. Patel Insurance Agency NIC Non-Life
546 V. K. Investments NIC Non-Life
547 Val Insurance Agents Ltd Tanzindia Non-Life
548 Vangi Insurance Agents Co. Ltd Jubilee Non- Life
549 VMDJ Insurance Agency* Phoenix Non-Life
550 VPN Insurance Agency* Bumaco Non-Life
551 Wahet-MIC Insurance Agency Real Non-Life
552 Walaka General Service Store NIC Non-Life
553 Wastara Insurance Agency ZIC Non-Life
554 Wastara Insurance Agency ZIC/NIKO/Golden Crescent Non-Life
555 Wema Insurance Agency Golden Crescent Non-Life
556 Westmes Business Company Ltd NIC Life
557 WGN Procrafts Ltd Real Non-Life
558 White Insurance Consultants Jubilee Non-Life
559 Wilmas Insurance Agency Phoenix Non-Life
560 Wise Insurance Consultants Niko Non-Life
*This company newly registered in 2011
TIRA 2011 ANNUAL REPORT.indd Sec2:97TIRA 2011 ANNUAL REPORT.indd Sec2:97 1/18/13 9:48:03 AM1/18/13 9:48:03 AM

98
ANNUAL INSURANCE MARKET PERFORMANCE REPORT For The Year Ended 31st December 2011
TABLE 3A: REGISTERED INSURANCE AGENTS AS AT 31ST DECEMBER 2011 (in alphabetical order) continued
S/N Name of Agency Principal Class of Business
561 Woodland Insurance Agency NIC Non-Life
562 Xtreme Insurance agency Jubilee Non- Life
563 Yokama Company Ltd Alliance Non-Life
564 Zurich Insurance Agent Limited* Century Non-Life
565 Zack Traders NIKO Non-Life
566 Zamen Agency ZIC Non-Life
567 Zayko Insurance agency NIKO Non- Life
568 Zebra Entrepreneurs Ltd ZIC Non-Life
569 Zedy Insurance Agency Phoenix Non-Life
570 Zodiac Insurance Agents Momentum Non-Life
571 Zomba Insurance Agency ZIC Non-Life
572 24 Seven Insurance Agency Century Non-Life
*This company newly registered in 2011
TIRA 2011 ANNUAL REPORT.indd Sec2:98TIRA 2011 ANNUAL REPORT.indd Sec2:98 1/18/13 9:48:03 AM1/18/13 9:48:03 AM

99
ANNUAL INSURANCE MARKET PERFORMANCE REPORT For The Year Ended 31st December 2011
TABLE 3B: REGISTERED AND ACTIVE INSURANCE AGENTS AS AT 31ST DECEMBER 2011 (in alphabetical order)
S/N Name of Agency Principal Class of Business
1 Abu Khami Investments NIC Non-Life
2 Acacia Insurance Agency Jubilee Non-Life
3 ACME Insurance Agency Phoenix Non- Life
4 Africa One Insurance Agency NIC Life
5 Agri-Business Insurance Agency NIC/Alliance Life & Non-Life
6 Al-Amoud General Enterprise ZIC Non-Life
7 Amani Central Agency Co. Ltd ZIC Non-Life
8 Amin Insurance Agents NIC Life
9 Anete Insurance Services Ltd NIC Life & Non-Life
10 Aspaya Insurance Consultants Real Non-Life
11 AGM Insurance Agent Limited* Mgen Non- Life
12 Abdesta Insurance Agency* Century Non-Life
13 A.W Mhina Insurance Agency* NIC Life
14 A&R Insurance Agency* Century Non-Life
15 Aseni Insurance Agency* ZIC Non-Life
16 Amicus Insurance Agency Alliance Non-Life
17 Bahassany General Supplies ZIC Non-Life
18 Baraka Insurance Agency Co. NIC LIFE
19 Bibi Insurance Ltd NIC Non-Life
20 Bright Insurance Agency ZIC Non-Life
21 British Insurance Agency NIC Life
22 Budget Insurance Agency (T) Ltd Century Non-Life
23 Busandra Insurance Agency And Consultancy Niko Non-Life
24 Bunonga Insurance Agency NIC Life
25 Business Insurance Agency Jubilee Non-Life
26 Bigbill Insurance Agent* Nic Non-Life
27 Bem Insurance Agency &General Enterprises Ltd* NIC Non-Life
28 Ben Insurance Agencies Company Limited NIC Non-Life
29 Cati Insurance Agency Company Ltd ZIC Non-Life
30 CCCC Group Insurance Agents Ltd MGen Non-Life
31 Conas Insurance Consultants NIC Non-Life
32 Cosaro Investment Company Ltd MGen Non-Life
33 CRDB Bank Ltd Real/African Life Life & Non-Life
34 Chilamu Insurance Agency* ZIC Non-Life
35 Chilumba Insurance Agency Bumaco Non-Life
36 Capital Regional Insurance&General Trading Co.Ltd ZIC Non-Life
37 Chiwosi Insurance Agency Real Non-Life
38 Confi dence Insurance Agent Limited* Real Non-Life
39 Centra Njombe Investment NIC Non-Life
40 Collau Insurance Agent* Phoenix Non-Life
*This company newly registered in 2011
TIRA 2011 ANNUAL REPORT.indd Sec2:99TIRA 2011 ANNUAL REPORT.indd Sec2:99 1/18/13 9:48:03 AM1/18/13 9:48:03 AM

100
ANNUAL INSURANCE MARKET PERFORMANCE REPORT For The Year Ended 31st December 2011
TABLE 3B: REGISTERED AND ACTIVE INSURANCE AGENTS AS AT 31ST DECEMBER 2011 (in alphabetical order) continued
S/N Name of Agency Principal Class of Business
41 Davis Insurance Agency MGen Non-Life
42 Diamond Insurance Group Phoenix Non-Life
43 Dijomo Insurance Agency Ltd NIC Non-Life
44 Dodoma Insurance Agency NIC Life
45 Dolus Insurance Agencies Phoenix Non-Life
46 Dorry Insurance Consultant NIC Non-Life
47 Dove Insurance Agency Momentum Non-Life
48 Dullah Insurance Agency* ZIC NON-Life
49 Dennvile Insurance Agency Limited* Jubilee Non-Life
50 Deliver Insurance Agency Lion Non-Life
51 Eagle Insurance Agency ZIC Non-Life
52 EAN Insurance Agency and Enterprises NIC Non-Life
53 Evergreen Consultancy Jubilee Life & Non-Life
54 Excel Professional Services Alliance Non-Life
55 Exim Bank (Tanzania) Ltd Alliance Life & Non-Life
56 EMT General Enterprises NIC Non-Life
57 Edif ’s Insurance Agent NIC Non-Life
58 Eberty Stationeries and Insurance Agency Nic Non-Life
59 EFF Insurance Agency G.Cresent Non-Life
60 EKI Intertrade Tanzania Ltd NIKO Non-life
61 Felech Consultancy Limited* IGT Non-Life
62 Fabec Insurance Agency Ltd* Real Non-Life
63 Fides Insurance Agency Alliance Life &Non-Life
64 Giraffe General Traders Ltd ZIC Non-Life
65 Greenlife Insurance Agency Jubilee Non-Life
66 Grapes Insurance Agency* IGT Non-Life
67 Gwajumo Kalikene Insurance Agency Phoenix Non-Life
68 Gilmac Insurance Agency* Century Non-Life
69 G&M Insurance Agency Lion Non-Life
70 Greenland Insurance Agency Ltd NIC Non Life
71 Hamdani General Supplies Ltd Alliance Non-Life
72 Happy Trust Consultants & Insurance Agency Phoenix/NIC Non-Life
73 Hauzkhas Insurance Agency Phoenix Non-Life
74 Health Solution Insurance Agent AAR Prime Care Non-Life
75 Hema Insurance Agency NIC Non-Life
76 Henfl ora Mtwara Reliance Non-Life
77 Hephziba Associates Co. Limited Mgen Non-Life
78 Homick Consultants Jubilee Non-Life
79 Horizon Insurance Agency Jubilee Non-Life
80 Hakika Insurance Agency Alliance Non-Life
*This company newly registered in 2011
TIRA 2011 ANNUAL REPORT.indd Sec2:100TIRA 2011 ANNUAL REPORT.indd Sec2:100 1/18/13 9:48:03 AM1/18/13 9:48:03 AM

101
ANNUAL INSURANCE MARKET PERFORMANCE REPORT For The Year Ended 31st December 2011
TABLE 3B: REGISTERED AND ACTIVE INSURANCE AGENTS AS AT 31ST DECEMBER 2011 (in alphabetical order) continued
S/N Name of Agency Principal Class of Business
81 Harmony Insurance Agency AAR Non-Life
82 HNV Insurance Agency* Alliance Non-Life
83 Honest Insurance Agency Niko Non-Life
84 Imara Consultants Ltd NIC Non-Life
85 Imuka Insurance Agency ZIC Non-Life
86 Incharge Investments Ltd NIKO Non-Life
87 Iyubera Insurance Agency NIC Non-Life
88 Jofort Insurance Agency NIC Non-Life
89 Juhudi Consultants Company Ltd Lion Non-Life
90 Jupiter Insurance Agent ZIC Non-Life
91 Jam Insurance Agency Company Limited* Phoenix Non-Life
92 K’ Ben Business Company Ltd NIC Life
93 Kagera Insurance Agency NIC Life
94 Kal Enterprises & Insurance Agency Centre Jubilee Non-Life
95 Ketrixy International Ltd ZIC Non-Life
96 Kilimanjaro Insurance Agency Co. Ltd NIC Non-Life
97 Kitota Insurance Agency NIC Life & Non-Life
98 Kumbasega Insurance Agent Real Non-Life
99 Kundi Associates NIC Non-Life
100 Krispin Faustin Nyenyembe Insurance Agency NIC Life Insurance
101 Korufreight Limited NIC Non-Life
102 Komote Insurance Agency NIKO Non-Life
103 Karunde Enterprises &Insurance Agency Phoenix Non-Life
104 Kina Insurance Agency NIC Non-Life
105 Karawa Insurance Agency Phoenix Non-Life
106 Lal Garage Reliance Non-Life
107 LAL insurance Agency Phoenix Non-Life
108 Lembato Consultancy Co. NIC Life
109 Lindi/Mtwara Insurance Agencies Partnership NIC Life
110 Lenox Insurance Agency Ltd* Milembe Non -Life
111 Luchcom Insurance Agency NIC Non-Life
112 Lojex and Yinga’s Traders Limited Nic Life &Non-Life
113 Leshete Trading Establishment (LTE) NIC Non-LIfe
114 Lesso Insurance Agency NIC Non-Life
115 Luhamba and Mkeni Insurance Agency NIC Life
116 M. R. Njau Insurance Agency NIC Life
117 Madson Consultant Agency & Company Ltd Phoenix Non-Life
118 Malimba Investments & Insurance Consultancy Ltd NIC Life
119 Masala Insurance Agency NIC Life
120 Master Insurance Agency Phoenix Non-Life
*This company newly registered in 2011
TIRA 2011 ANNUAL REPORT.indd Sec2:101TIRA 2011 ANNUAL REPORT.indd Sec2:101 1/18/13 9:48:03 AM1/18/13 9:48:03 AM

102
ANNUAL INSURANCE MARKET PERFORMANCE REPORT For The Year Ended 31st December 2011
TABLE 3B: REGISTERED AND ACTIVE INSURANCE AGENTS AS AT 31ST DECEMBER 2011 (in alphabetical order) continued
S/N Name of Agency Principal Class of Business
121 Matunda Investment Ltd NIC Non-Life
122 Mawanda General Trading Co. NIC Life & Non-Life
123 Mbeya United Insurance Agency Co. Ltd NIC Life
124 Merliza Insurance Agency MGen Non- Life
125 Midway Assurance Consultancy MGen Non-Life
126 Mngeta General Dealer ZIC Non- Life
127 Modern Insurance Agency NIKO Non-Life
128 Moraf Motors Ltd Reliance/Phoenix/Jubilee Non-Life
129 MSF Insurance Agency NIC Non-Life
130 Mtandao Insurance Agency NIKO Non- Life
131 Mtewele General Traders and Insurance Agent ZIC Non-Life
132 Mtwara Insurance Agency NIC Non-Life
133 Mufi ndi Community Bank Ltd Reliance Non-Life
134 Muleba Quality Service Enterprise NIC Life
135 Maxima Enterprises NIC Life
136 Milambo Insurance Agent &General Supplies Milembe Non-Life
137 Multicombine Insurance Agency Reliance Non - Life
138 Manu Insurance Agency* NIC Non-Life
139 Manyara Insurance Agency Nic Non-Life
140 Mwanga rular Community Bank Ltd Real Non-Life
141 Mwidunda Investment Insurance Agency Ltd NIC Non-Life
142 Madila Insurance Agency Company Limited NIC,Real Life &Non-Life
143 Mbinga Community Bank Limited Reliance Non-Life
144 Mambya Insurance Agency Company Limited* Real Non-Life
145 Margaret Elias Insurance Agency NIKO Non-Life
146 Makule Associates & Company NIC Non-Life
147 Machupa General Services Ltd NIC Non-Life
148 Mat and E Co.Ltd N IC Non-Life
149 Mcheka Insurance Agency NIC Non-Life
150 Mchimbi Insurance Agency NIC Life Insurance
151 National Social Security Fund Jubilee Non-Life
152 NBC Limited Alexander Forbes Life & Non-Life
153 Ndeng’aro Agencies & Consultants NIC Non-Life
154 Ndiga Insurance Agency NIC Non-Life
155 NIA Njema Insurance Agency ZIC Non- Life
156 NSM Insurance Agency NIC Non-Life
157 Ntalisa Insurance Consultants NIC Non-Life
158 Nora Insurance Agency Limited* Golden,Milembe,Jubilee Non-Life
159 Nick Insurance Agency* IGT Non-Life
160 Nyanjale General Trading Co. ZIC Non-Life
*This company newly registered in 2011
TIRA 2011 ANNUAL REPORT.indd Sec2:102TIRA 2011 ANNUAL REPORT.indd Sec2:102 1/18/13 9:48:03 AM1/18/13 9:48:03 AM

103
ANNUAL INSURANCE MARKET PERFORMANCE REPORT For The Year Ended 31st December 2011
TABLE 3B: REGISTERED AND ACTIVE INSURANCE AGENTS AS AT 31ST DECEMBER 2011 (in alphabetical order) continued
S/N Name of Agency Principal Class of Business
161 Nyoni Insurance Agency Real Non-Life
162 Northern Triangle Insurance Agents(T) Ltd Century Non-Life
163 Navan Insurance Consultants NIKO Non-Life
164 Nisi Insurance Agency Niko Non-Life
165 O.M. Insurance Agency NIC Non-Life
166 Omukyaya (1998) Insurance Agency NIC Life
167 Old South Insurance Agency Real Non-Life
168 Omega Insurance Consultants Jubilee Non-Life
169 Otto Insurance Agency Real Non-Life
170 Pamoja Insurance Agency Ltd Lion Non-Life
171 Pearl Insurance Agency Ltd Jubilee Non-Life
172 Pillers Insurance Agency Alliance Non-Life
173 Prasi Company Ltd Phoenix Non-Life
174 Primode Agency NIKO Non-Life
175 Peoples Insurance Agency* ZIC Non-Life
176 Pandu Insurance Agenccies Ltd* NIC Non-Life
177 Pasy Insurance Agent* Real Non-Life
178 Property Consultancy & Service Limited NIC Non-Life
179 Precious Insurance Agency * NIC Non-Life
180 Prudential Insurance Consultancy Services Ltd Nic Life&Non-Life
181 R.J Insurance Agent Phoenix Non-Life
182 R.C Insurance Agency Tanzindia Non- Life
183 Ram Insurance Agent Bumaco Non-Life
184 Ready Services Ltd Phoenix Non-Life
185 Rift Valley Insurance Agency Phoenix Non-Life
186 Rado Insurance Agency (T) Ltd* Century Non-Life
187 Roma Insurance Agency Real Non-Life
188 Rido Insurance Agent NIC Non-Life
189 R.B Kambanga Insurance Agency* NIC Life
190 Rutea Insurance Agency IGT Non-Life
191 Responsive Enterprises &Insurance Agency NIC Non-Life
192 Rae Insurance Agency &Company NIC Life
193 Sair Insurance Agency NIC Non-Life
194 Saraiya Insurance Agency Alliance Non-Life
195 Scan Insurance & General Services Ltd Phoenix Non-Life
196 Selya Insurance Agency NIC Non-Life
197 SGZaksil Insurance Agency Ltd NIC Life
198 SMS Company Ltd ZIC Non-Life
199 Songolo Insurance Agency Reliance Non-Life
200 South East Insurance Agency Jubilee Non-Life
*This company newly registered in 2011
TIRA 2011 ANNUAL REPORT.indd Sec2:103TIRA 2011 ANNUAL REPORT.indd Sec2:103 1/18/13 9:48:03 AM1/18/13 9:48:03 AM

104
ANNUAL INSURANCE MARKET PERFORMANCE REPORT For The Year Ended 31st December 2011
TABLE 3B: REGISTERED AND ACTIVE INSURANCE AGENTS AS AT 31ST DECEMBER 2011 (in alphabetical order) continued
S/N Name of Agency Principal Class of Business
201 Splending Insurance Agency NIC Life
202 Southern Insurance Agency Lion Non-Life
203 Speedways Ltd Phoenix Non-Life
204 Standard Group insurance Agency NIC / Phoenix Life / Nonlife
205 Statewide Express Insurance Agency ZIC Non-Life
206 Shaha Insurance Agency* ZIC Non-Life
207 Shash Insurance Agent NIC Non-Life
208 Semalunga Insurance Agency* Bumaco Non-Life
209 Sirgemnity Trading &Insurance Agency* Real Non-Life
210 Sparkle Insurance Agency (T) Limited* Century Non-Life
211 Slending Insurance Agency Reliance Non-Life
212 Sihanga Insurance Agency* Real Non-Life
213 Shelter Insurance Enterprises* NIC Non-Life
214 Soicon Insurance Agency Momentum Non-Life
215 Sembeti Insurance &Consultants NIC Non-Life
216 Seen Insurance Agency Mgen Non-Life
217 Sam Insurance Agency Alliance Non-Life
218 Sesemela Insurance Agency NIC Non-Life
219 Solution Insurance Agency &General Services Phoenix Non-Life
220 Southern Highland Insurance Agency Nic Life
221 Tan Ame Insurance Consultants Real Non-Life
222 Tanzania Post Corporation NIC Non-Life
223 Tanzanian Postal Bank Astra Non-Life
224 Tanzania Assemblies of god* NIC Non-Life
225 Tax & Management Consultants Bureau NIC Non-Life
226 TCCIA Kilimanjaro Insurance Agency Real Non-Life
227 TMN Insurance Agency NIC Non-Life
228 Tuva Insurance Agency Phoenix Non-Life
229 Times Insurance Agency* IGT Non-Life
230 The Leopard Agencies Ltd Phoenix Non-Life
231 Tajack Insurance Limited NIC Life &Non-Life
232 Tanzania Episcorp Conference Insurance Agency NIC Non-Life
233 The Bull Insurance Agency* Jubilee Non-Life
234 Tanzania Investment Bank Insurance Agency Astra Non-Life
235 United Interbusiness Glory Jubilee Non-Life
236 United Insurance Agency Limited Jubilee Non-Life
237 Unity Insurance Agent NIC Non-Life
238 University of Dar es salaam Lion, Real & Nic Non-Life
239 Unity Business Consultants & Insurance Agency Phoenix Non-Life
240 Universal Insurance Agent Limited Mgen Non-Life
*This company newly registered in 2011
TIRA 2011 ANNUAL REPORT.indd Sec2:104TIRA 2011 ANNUAL REPORT.indd Sec2:104 1/18/13 9:48:04 AM1/18/13 9:48:04 AM

105
ANNUAL INSURANCE MARKET PERFORMANCE REPORT For The Year Ended 31st December 2011
TABLE 3B: REGISTERED AND ACTIVE INSURANCE AGENTS AS AT 31ST DECEMBER 2011 (in alphabetical order) continued
S/N Name of Agency Principal Class of Business
241 V.C.Patel Insurance Agency Jubilee Non-Life
242 V. K. Investments NIC Non-Life
243 Val Insurance Agents Ltd Tanzindia Non-Life
244 Vangi Insurance Agents Co. Ltd Jubilee Non- Life
245 VMDJ Insurance Agency* Phoenix Non-Life
246 VPN Insurance Agency* Bumaco Non-Life
247 Wastara Insurance Agency ZIC/NIKO/Golden Crescent Non-Life
248 Wema Insurance Agency Golden Crescent Non-Life
249 Zomba Insurance Agency ZIC Non-Life
250 Westmes Business Company Ltd NIC Life
251 Zurich Insurance Agent Limited* Century Non-Life
252 Zayko Insurance agency NIKO Non- Life
253 Zodiac Insurance Agents Momentum Non-Life
254 24 Seven Insurance Agency Century Non-Life
*This company newly registered in 2011
TIRA 2011 ANNUAL REPORT.indd Sec2:105TIRA 2011 ANNUAL REPORT.indd Sec2:105 1/18/13 9:48:04 AM1/18/13 9:48:04 AM

106
ANNUAL INSURANCE MARKET PERFORMANCE REPORT For The Year Ended 31st December 2011
TA
BL
E 4
A: R
EG
IST
ER
ED
LO
SS A
SSE
SSO
RS
AN
D A
DJU
STE
RS
AS
AT 3
1ST
DE
CE
MB
ER
201
1 (i
n al
phab
etic
al o
rder
)
S/N
N
ame
of L
oss
Ass
esso
r/A
djus
ter
Pri
ncip
al O
ffi c
erPo
stal
Add
ress
Pho
neE
mai
l
1A
bosh
Par
tner
ship
Ltd
M
r. A
. S. K
hati
bP.
O.B
ox 3
479
Zan
ziba
r(2
55)
24 2
3137
2/(2
55)
777
4343
52/4
8662
9az
anik
hati
b@ya
hoo.
com
2 A
lpha
Sur
veyo
rs a
nd L
oss
Ass
esso
rs L
td
Mr.
G. M
inja
P.O
. Box
330
42 D
sm(2
55)
715
3067
15/(
255)
715
919
228
alph
acon
sult5
@ya
hoo.
com
3A
RM
Ins
uran
ce S
urve
yors
Com
pany
Ltd
Mr.
B. J
. Sen
yaP.
O. B
ox 3
070
Mw
anza
(255
) 71
7 04
0370
/(25
5) 7
88 7
2199
1ar
min
sura
nce.
asse
ssor
s@gm
ail.c
om
4A
spir
e In
sura
nce
Surv
eyor
s &
Los
s A
sses
sors
Mr.
N. S
. She
th
P.O
. Box
383
38 D
sm
(255
) 22
212
0541
/(25
5) 7
55/6
55 0
3006
6pr
agne
shvu
@ho
tmai
l.com
5A
ssoc
iate
d C
argo
Ser
vice
s C
o. L
tdM
r. P.
Ole
kash
eP.
O. B
ox 1
1086
Dsm
6A
ri I
nsur
ance
Sur
veyo
rs a
nd L
oss
Ass
esso
rsM
r.Jam
es R
exfo
rdP.
O B
OX
730
7 D
SM07
54 2
6492
9,07
82 2
6492
9jr
kiol
ongw
e@ya
hoo.
com
7B
& M
Ins
uran
ce A
sses
sors
and
Sur
veyo
rsM
r. M
. M. B
usok
aP.
O. B
ox 7
6463
Dsm
(255
) 71
3 81
1009
/715
319
453
Mis
pere
sBus
oka@
yaho
o.co
m
8B
airu
Avi
atio
n Se
rvic
esM
r. I.
Y. B
airu
P.O
. Box
799
04 D
sm(2
55)
757
5997
37ib
airu
@ya
hoo.
com
9 B
enm
ac L
imit
ed
Mr.
E. N
dim
ilaP.
O.B
ox 3
1733
Dsm
(255
) 75
4 65
5540
/ 78
4 38
9090
benm
aclim
ited
@ya
hoo.
com
10B
owin
Sur
very
ors
and
Loss
Ass
esso
rs (
T)
Ltd
Mr.
R.M
. Mha
gam
aP.
O. B
ox 7
5902
Dsm
(255
) 78
6 06
9998
/718
809
288
bmal
ema@
yaho
o.co
m
11B
RD
Ins
uran
ce A
sses
sors
Ltd
Mr.
D. S
. Mm
ari
P.O
. Box
785
43 D
sm
(255
) 78
4/ 7
15 7
4463
7br
d.as
sess
ors@
yaho
o.co
m
12C
onti
nent
al S
urve
yors
(T
) Lt
dM
r. C
. Git
imu
P.O
. Box
769
32 D
sm02
2 21
3502
8co
ntin
enta
l@ra
ha.c
om
13C
oope
rs I
nsur
ance
Ass
esso
rs C
o.M
r. O
. Kup
paP.
O. B
ox 3
3724
Dsm
(255
) 22
240
120/
713
/784
612
164
coop
erst
z@ya
hoo.
com
14 E
agle
Sur
veyo
rs a
nd L
oss
Ass
esso
rs L
td
Mr.
S. M
wam
akul
a P.
O. B
ox 4
2466
Dsm
(255
) 22
286
2519
/718
673
304
eagl
eadj
uste
rs@
gmai
l.com
15E
ast A
fric
an A
sses
sors
Ltd
Mr.
G. T
. Sin
aiP.
O. B
ox 2
232
Dsm
(255
) 22
213
1943
/211
2179
eaal
tz@
eaal
tz.c
om
16 E
MC
Sur
veyo
rs &
Los
s A
sses
sors
Ltd
M
r. W
. Mpa
lang
eP.
O. B
ox 1
7503
Dsm
(255
) 78
4 89
2925
17E
MM
VE
E I
nsur
ance
Sur
veyo
rs &
Los
s A
sses
sors
Co.
Ltd
Mr.
J. K
. Lw
anba
gaza
P.O
. Box
199
69 D
sm
(255
) 71
5/75
4 48
9792
emm
vees
urve
y@ya
hoo.
com
18 E
T &
T’s
Inve
stm
ent
Mr.
E. T
owo
P.O
. Box
311
65 D
sm07
54 2
9910
8
19F.
R.S
. Ass
esso
rsM
r. S.
E. C
haki
P.O
. Box
197
81 D
sm(2
55)
22 2
1124
98/2
1123
62sc
haki
@fr
sass
esso
rs.c
om
20Fa
bcas
t Tec
hnol
ogie
s C
o. L
tdD
r. J.
Run
yoro
P.O
. Box
346
26 D
sm(2
55)
22 2
6174
97/
754
3047
29ow
ekis
ha@
uccm
ail.c
o.tz
21 G
reat
Lak
es A
sses
sors
Ltd
M
r. C
. Mm
band
oP.
O. B
ox 2
322
Mw
anza
(255
) 75
4/78
7 29
4971
chri
stia
nmba
ndo@
yaho
o.co
m
22 G
&B
Ins
uran
ce L
oss
Ass
esso
rs A
nd V
alue
M
r.Bri
an T
iba
P.O
Box
718
0 D
SM07
15 7
0071
1/07
87 7
0071
1gb
ilavi
2@gm
ail.c
om
*Thi
s co
mpa
ny n
ewly
reg
iste
red
in 2
011
TIRA 2011 ANNUAL REPORT.indd Sec2:106TIRA 2011 ANNUAL REPORT.indd Sec2:106 1/18/13 9:48:04 AM1/18/13 9:48:04 AM

107
ANNUAL INSURANCE MARKET PERFORMANCE REPORT For The Year Ended 31st December 2011
TA
BL
E 4
A: R
EG
IST
ER
ED
LO
SS A
SSE
SSO
RS
AN
D A
DJU
STE
RS
AS
AT 3
1ST
DE
CE
MB
ER
201
1 (i
n al
phab
etic
al o
rder
) co
ntin
ued
S/N
N
ame
of L
oss
Ass
esso
r/A
djus
ter
Pri
ncip
al O
ffi c
erPo
stal
Add
ress
Pho
neE
mai
l
23H
ighl
and
Prop
erty
Sur
veyo
rs L
tdM
r. J.
Nda
kiP.
O. B
ox 2
329
Dsm
(255
) 71
3 75
7599
/655
/754
859
733
hpnl
imit
ed@
yaho
o.co
.tz
24In
ters
tate
Sur
veyo
rs &
Los
s A
dj.
Mr.
H. B
. Set
hP.
O. B
ox 3
386
Dsm
(255
) 22
212
2702
/ 78
4 32
3435
inte
rsta
te@
cats
-net
.com
25 J
ogit
h M
otor
Ass
esso
rs L
td
Mr.
N. G
iton
gaP.
O. B
ox 1
4586
Dsm
022
2780
299/
754
/655
385
481
jogi
th20
01@
yaho
o.co
m
26 K
.S R
ober
t Sec
urit
y C
onsu
ltant
M
r.Kaj
anja
Sha
ibu
P.O
BO
X 4
271
DSM
0754
402
444
27La
zom
Hol
ding
(T
) Li
mit
edM
r. D
. Mak
aoP.
O. B
ox 1
1191
Dsm
(2
55)
22 2
1274
34/
784
7844
71la
zom
hold
ings
ltd@
yaho
o.co
m
28 M
ajor
Sur
veyo
rs (
T)
Ltd
Mr.
T. M
akoi
P.O
. Box
721
80
29 M
echm
aste
r (T
) Lt
d M
r. B
. E. I
lingu
liza
P.O
. Box
328
44 D
sm(2
55)
732
9255
84/7
82 4
8004
8m
echm
aste
r06@
yaho
o.co
m
30M
eju
Insu
ranc
e Su
rvey
ors
and
Loss
Ass
esso
rsM
r.Elia
s M
iling
a P.
O B
OX
774
78 D
SM(2
55)
22 2
8072
54/
716
2313
40m
iling
a-ya
bora
@ya
hoo.
com
31M
orog
oro
Insu
ranc
e Su
rvey
ors
& C
o. L
tdM
r. A
. Nye
nga
P. O
. Box
404
Mor
ogor
o07
84 2
7811
3
32N
edo
Adj
uste
rs (
T)
Ltd
Mr.
D. N
yam
boga
P.O
. Box
781
96 D
sm(2
55)
22 2
1356
21/
2 /7
54 6
6504
3ne
doad
j@af
rica
onlin
e.co
.tz
33O
rien
tal S
urve
yors
and
Ass
esso
rs L
tdM
r. L.
Cho
goP.
O. B
ox 8
037
Dsm
(255
) 22
262
7449
/450
/784
541
541
luca
scho
go@
yaho
o.co
m
34Pe
t-C
on C
laim
s C
o. L
tdM
r. D
. Won
gani
kaP.
O. B
ox 1
3993
Dsm
(255
) 71
3 20
0043
/732
999
089
davi
d582
9@ym
ail.c
om
35 P
hilte
c Li
mit
ed
Mr.
P. S
. Min
jaP.
O. B
ox 1
1106
Dsm
(255
) 22
212
5356
/754
292
477
min
japh
il@ho
tmai
l.com
36 P
rize
man
n A
ssoc
iate
s (T
) Lt
d M
r. C
. C. M
ucha
nga
P.O
. Box
217
46 D
sm(2
55)
22 2
7624
33/
787
5729
79pr
izem
ann@
ctvs
atco
m.n
et
37 P
amoj
a A
fric
a Li
mit
ed*
Mr.R
avin
arar
ayan
an K
P.O
BO
X 6
617
DSM
(255
)784
644
100,
(255
)222
7714
27ra
vibs
.dar
@gm
ail.c
om
38 S
.A.C
Ins
uran
ce S
urve
yors
(E
.A)
Ltd
Mr.
U. H
. Om
arP.
O. B
ox 3
8506
Dsm
(255
) 22
218
3818
/ 71
3 53
2000
saco
nsul
t@za
ntel
.com
39Sa
pu S
urve
yors
and
Los
s A
sses
sors
Mr.
C. M
ukom
aP.
O. B
ox 9
926
Dsm
(2
55)
22 2
1214
85/(
255)
748
429
802
muk
oma@
kadc
o.co
.tz
40 S
peed
Sur
veyo
rs a
nd V
alue
rs L
td
Mr.
S. K
. Man
ase
P. O
. Box
701
17 D
sm(2
55)
22 2
1206
44/7
13 2
1842
0
41St
anda
rd S
urve
yors
& L
oss
Ass
esor
s Lt
d M
r. K
. K. K
ilonz
oP.
O. B
ox 1
0602
2 D
sm(2
55)
22 2
1322
04/7
54 3
1600
2ki
lonz
o@st
d-su
rvey
ors.
com
42Ta
n Pr
ivat
e Se
curi
ty C
onsu
ltant
s C
o. L
tdM
r. R
. M. L
ulan
dala
P.O
. Box
102
01 D
sm
(255
) 22
212
563
info
@tp
ia.u
s
43 T
anza
n Lo
ss A
sses
sors
M
r. A
. Muk
ama
P.O
. Box
131
4 D
sm(2
55)
22 2
1121
28/2
1255
97
44T
illit
Sur
veyo
rs &
Los
s A
sses
sors
Ltd
Mr.
S. A
. Kol
gaon
kar
P.O
. Box
201
25 D
sm
(255
) 77
8 05
5219
shuk
ri66
@ho
tmai
l.com
45To
plis
& H
ardi
ng (
T)
Ltd
Mr.
P. N
. Nat
hwan
i P.
O. B
ox 7
99 D
sm(2
55)
22 2
1145
59/7
84 6
0660
2cl
aim
s@to
plis
andh
ardi
ng.c
om
46Tr
ans
Eur
opa
Tanz
ania
Mr.
S. M
. Kal
idas
P.O
. Box
383
57 D
sm(2
55)
22 2
1251
78/7
9/(2
55)
7136
5895
0 pa
ttin
i@tr
anse
urop
a.co
.tz
47U
nite
d Su
rvey
ors
and
Adj
uste
rs L
tdM
r. R
. Sin
aiP.
O. B
ox 2
1990
Dsm
(255
) 75
4 48
9792
/784
601
119
rsin
ai@
hotm
ail.c
om
*Thi
s co
mpa
ny n
ewly
reg
iste
red
in 2
011
TIRA 2011 ANNUAL REPORT.indd Sec2:107TIRA 2011 ANNUAL REPORT.indd Sec2:107 1/18/13 9:48:04 AM1/18/13 9:48:04 AM

108
ANNUAL INSURANCE MARKET PERFORMANCE REPORT For The Year Ended 31st December 2011
TA
BL
E 4
B: R
EG
IST
ER
ED
AN
D A
CT
IVE
LO
SS A
SSE
SSO
RS
AN
D A
DJU
STE
RS
AS
AT 3
1ST
DE
CE
MB
ER
20
11 (
in a
lpha
beti
cal o
rder
)
S/N
N
ame
of L
oss
Ass
esso
r/A
djus
ter
Pri
ncip
al O
ffi c
erPo
stal
Add
ress
Pho
neE
mai
l
1A
bosh
Par
tner
ship
Ltd
M
r. A
. S. K
hati
bP.
O.B
ox 3
479
Zan
ziba
r(2
55)
24 2
3137
2/(2
55)
777
4343
52az
anik
hati
b@ya
hoo.
com
2 A
lpha
Sur
veyo
rs a
nd L
oss
Ass
esso
rs L
td
Mr.
G. M
inja
P.O
. Box
330
42 D
sm(2
55)
715
3067
15/(
255)
715
919
228
alph
acon
sult5
@ya
hoo.
com
3A
RM
Ins
uran
ce S
urve
yors
Com
pany
Ltd
Mr.
B. J
. Sen
yaP.
O. B
ox 3
070
Mw
anza
(255
) 71
7 04
0370
/(25
5) 7
88 7
2199
1ar
min
sura
nce.
asse
ssor
s@gm
ail.c
om
4A
spir
e In
sura
nce
Surv
eyor
s &
Los
s A
sses
sors
Mr.
N. S
. She
th
P.O
. Box
383
38 D
sm
(255
) 22
212
0554
1/2
(255
) 75
5 03
0066
prag
nesh
vu@
hotm
ail.c
om
5A
ri I
nsur
ance
Sur
veyo
rs &
Loss
Ass
esss
ors
Mr.J
ames
rex
ford
P.O
BO
X 7
307
DSM
0754
264
929,
0782
264
929
jrki
olon
gwe@
yaho
o.co
m
6B
& M
Ins
uran
ce A
sses
sors
and
Sur
veyo
rsM
r. M
. M. B
usok
aP.
O. B
ox 7
6463
Dsm
(255
) 71
3 81
1009
/(25
5) 7
15 3
1945
3M
ispe
resB
usok
a@ya
hoo.
com
7B
airu
Avi
atio
n Se
rvic
esM
r. I.
Y. B
airu
P.O
. Box
799
04 D
sm(2
55)
757
5997
37jb
airu
@ya
hoo.
com
8 B
enm
ac L
imit
ed
Mr.
E. N
dim
ilaP.
O.B
ox 3
1733
Dsm
(255
) 75
4 65
5540
/(25
5) 7
84 3
8909
0be
nmac
limit
ed@
yaho
o.co
m
9B
owin
Sur
very
ors
and
Loss
Ass
esso
rs (
T)
Ltd
Mr.
R.M
. Mha
gam
aP.
O. B
ox 7
5902
Dsm
(255
) 78
6 06
9998
/ 07
18 8
0928
8bm
alem
a@ya
hoo.
com
10B
RD
Ins
uran
ce A
sses
sors
Ltd
Mr.
D. S
. Mm
ari
P.O
. Box
785
43 D
sm
(255
) 71
5 74
4637
/784
744
637
brd.
asse
ssor
s@ya
hoo.
com
11C
oope
rs I
nsur
ance
Ass
esso
rs C
o.M
r. O
. Kup
paP.
O. B
ox 3
3724
Dsm
(255
) 22
240
1203
/(25
5) 7
13/7
84 6
1216
4co
oper
stz@
yaho
o.co
m
12 E
agle
Sur
veyo
rs a
nd L
oss
Ass
esso
rs L
td
Mr.
S. M
wam
akul
a P.
O. B
ox 4
2466
Dsm
(255
) 22
286
2519
/(25
5) 7
84 6
1216
4ea
glea
djus
ters
@gm
ail.c
om
13E
ast A
fric
an A
sses
sors
Ltd
Mr.
G. T
. Sin
aiP.
O. B
ox 2
232
Dsm
(255
) 22
213
1943
/211
2179
eaal
tz@
eaal
tz.c
om
14 E
MC
Sur
veyo
rs &
Los
s A
sses
sors
Ltd
M
r. W
. Mpa
lang
eP.
O. B
ox 1
7503
Dsm
(255
) 78
4 89
2925
15E
MM
VE
E I
nsur
ance
Sur
veyo
rs &
Los
s A
sses
sors
Co.
Ltd
Mr.
J. K
. Lw
amba
gaza
P.O
. Box
199
69 D
sm
(255
) 71
5/75
4 48
9792
emm
vees
urve
y@ya
hoo.
com
16F.
R.S
. Ass
esso
rsM
r. S.
E. C
haki
P.O
. Box
197
81 D
sm(2
55)
22 2
1124
98/2
1123
62sc
haki
@fr
sass
esso
rs.c
om
17Fa
bcas
t Tec
hnol
ogie
s C
o. L
tdD
r. J.
Run
yoro
P.O
. Box
346
26 D
sm(2
55)
22 2
6174
97/(
255)
754
304
729
owek
isha
@uc
cmai
l.co.
tz
18 G
reat
Lak
es A
sses
sors
Ltd
M
r. C
. Mm
band
oP.
O. B
ox 2
322
Mw
anza
(255
) 75
4/78
7 29
4971
chri
stia
nmba
ndo@
yaho
o.co
m
19H
ighl
and
Prop
erty
Sur
veyo
rs L
tdM
r. J.
Nda
kiP.
O. B
ox 2
329
Dsm
(255
) 71
3 75
7599
/(25
5) 6
55/7
54 8
5973
3
20In
ters
tate
Sur
veyo
rs &
Los
s A
dj.
Mr.
H. B
. Set
hP.
O. B
ox 3
386
Dsm
(255
) 22
212
2702
/(25
5) 7
84 3
2343
5in
ters
tate
@ca
ts-n
et.c
om
21 J
ogit
h M
otor
Ass
esso
rs L
td
Mr.
N. G
iton
gaP.
O. B
ox 1
4586
Dsm
022
2780
299/
(255
) 75
4/65
5 38
5481
jogi
th20
01@
yaho
o.co
m
22 K
.S R
ober
t Sec
urit
y C
onsu
ltant
M
r.Kaj
anja
Sha
ibu
P.O
Box
427
1 D
SM07
54 4
0244
4
*Thi
s co
mpa
ny n
ewly
reg
iste
red
in 2
011
TIRA 2011 ANNUAL REPORT.indd Sec2:108TIRA 2011 ANNUAL REPORT.indd Sec2:108 1/18/13 9:48:04 AM1/18/13 9:48:04 AM

109
ANNUAL INSURANCE MARKET PERFORMANCE REPORT For The Year Ended 31st December 2011
TA
BL
E 4
B: R
EG
IST
ER
ED
AN
D A
CT
IVE
LO
SS A
SSE
SSO
RS
AN
D A
DJU
STE
RS
AS
AT
31ST
DE
CE
MB
ER
201
1 (i
n al
phab
etic
al o
rder
) co
ntin
ued
S/N
N
ame
of L
oss
Ass
esso
r/A
djus
ter
Pri
ncip
al O
ffi c
erPo
stal
Add
ress
Pho
neE
mai
l
23La
zom
Hol
ding
(T
) Li
mit
edM
r. D
. Mak
aoP.
O. B
ox 1
1191
Dsm
(2
55)
22 2
1274
34/(
255)
784
784
471
lazo
mho
ldin
gsltd
@ya
hoo.
com
24 M
echm
aste
r (T
) Lt
d M
r. B
. E. I
lingu
liza
P.O
. Box
328
44 D
sm(2
55)
732
9255
84/(
255)
782
480
048
mec
hmas
ter0
6@ya
hoo.
com
25M
eju
Insu
ranc
e Su
rvey
ors
and
Loss
Ass
esso
rsM
r. E
. Mill
inga
P.
O. B
ox 7
7478
Dsm
(2
55)
22 2
8072
54/7
16 2
3134
0m
illin
ga-t
abor
a@ya
hoo.
co.u
k
26N
edo
Adj
uste
rs (
T)
Ltd
Mr.
D. N
yam
boga
P.O
. Box
781
96 D
sm(2
55)
22 2
1356
21-2
/ 7
54 6
6504
3ne
doad
j@af
rica
onlin
e.co
.tz
27O
rien
tal S
urve
yors
and
Ass
esso
rs L
tdM
r. L.
Cho
goP.
O. B
ox 8
037
Dsm
(255
) 22
262
7449
/450
/(25
5) 7
84
5415
41lu
casc
hogo
@ya
hoo.
com
28Pe
t-C
on C
laim
s C
o. L
tdM
r. D
. Won
gani
kaP.
O. B
ox 1
3993
Dsm
(255
) 71
3 20
0043
/ 73
2 99
9089
davi
d582
9@ym
ail.c
om
29 P
hilte
c Li
mit
ed
Mr.
P. S
. Min
jaP.
O. B
ox 1
1106
Dsm
(255
) 22
212
5356
/ 75
4 29
2477
min
japh
il@ho
tmai
l.com
30 P
rize
man
n A
ssoc
iate
s (T
) Lt
d M
r. C
. C. M
ucha
nga
P.O
. Box
217
46 D
sm(2
55)
22 2
7624
33/
787
5729
79pr
izem
ann@
ctvs
atco
m.n
et
31 P
amoj
a A
fric
a Li
mit
ed*
Mr.R
avin
aray
anan
KP.
O B
OX
661
7 D
SM(2
55)7
84 6
4410
0,(2
55)2
2277
1417
ravi
bs.d
ar@
gmai
l.com
32 S
.A.C
Ins
uran
ce S
urve
yors
(E
.A)
Ltd
Mr.
U. H
. Om
arP.
O. B
ox 3
8506
Dsm
(255
) 22
218
3818
/(25
5) 7
13 5
3200
0sa
cons
ult@
zant
el.c
om
33Sa
pu S
urve
yors
and
Los
s A
sses
sors
Mr.
C. M
ukom
aP.
O. B
ox 9
926
Dsm
(2
55)
22 2
1214
85/(
255)
748
429
802
muk
oma@
kadc
o.co
.tz
34 S
peed
Sur
veyo
rs a
nd V
alue
rs L
td
Mr.
S. K
. Man
ase
P. O
. Box
701
17 D
sm(2
55)
22 2
1206
44/(
255)
713
218
420
35St
anda
rd S
urve
yors
& L
oss
Ass
esor
s Lt
d M
r. K
. K. K
ilonz
oP.
O. B
ox 1
0602
2 D
sm(2
55)
22 2
1322
04/(
255)
754
316
002
kilo
nzo@
std-
surv
eyor
s.co
m
36Ta
n Pr
ivat
e Se
curi
ty C
onsu
ltant
s C
o. L
tdM
r. R
. M. L
ulan
dala
P.O
. Box
102
01 D
sm
(255
) 22
212
563
info
@tp
ia.u
s
37G
&B
Ins
uran
ce L
oss
Ass
esso
rs a
nd V
alue
Mr.B
rian
Tib
aP.
O B
OX
718
0 D
SM07
15 7
0071
1/07
87 7
0071
1gb
ilavi
2@gm
ail.c
om
38To
plis
& H
ardi
ng (
T)
Ltd
Mr.
P. N
. Nat
hwan
i P.
O. B
ox 7
99 D
sm(2
55)
22 2
1145
59/(
255)
784
602
602
clai
ms@
topl
isan
dhar
ding
.com
39Tr
ans
Eur
opa
Tanz
ania
Mr.
S. M
. Kal
idas
P.O
. Box
383
57 D
sm(2
55)
22 2
1251
78/7
9/(2
55)
713
6589
50pa
ttin
i@tr
anse
urop
a.co
.tz
40U
nite
d Su
rvey
ors
and
Adj
uste
rs L
tdM
r. R
. Sin
aiP.
O B
OX
219
90 D
SM(2
55)
754
4897
92/(
255)
784
601
119
rsin
ai@
hotm
ail.c
om *T
his
com
pany
new
ly r
egis
tere
d in
201
1
TIRA 2011 ANNUAL REPORT.indd Sec2:109TIRA 2011 ANNUAL REPORT.indd Sec2:109 1/18/13 9:48:04 AM1/18/13 9:48:04 AM

110
ANNUAL INSURANCE MARKET PERFORMANCE REPORT For The Year Ended 31st December 2011
TA
BL
E 5
A: G
EN
ER
AL
IN
SUR
AN
CE
GR
OSS
PR
EM
IUM
S W
RIT
TE
N B
Y T
AN
ZA
NIA
IN
SUR
ER
S A
S AT
31
ST D
EC
EM
BE
R 2
011
(TZ
S M
ILL
ION
)
S/N
Nam
e of
Ins
urer
(in
shor
t fo
rm)
G
ross
Pre
miu
ms
Wri
tten
by
Cla
ss o
f B
usin
ess
in T
ZS
Mill
ion
2011
Tota
l20
10To
tal
% I
ncr.
(dec
r.)
Fir
e E
ngin
eeri
ng
Mot
orM
arin
e A
ccid
ent
Avi
atio
n H
ealt
h O
ther
Gen
.
1Ju
bile
e 2,
732
2,57
49,
160
2,21
414
,379
-8,
833
-39
,892
26,7
1449
.3%
2H
erit
age
19,5
162,
243
4,76
81,
388
7,29
596
199
914
837
,318
33,5
0711
.4%
3A
llian
ce6,
164
911
10,1
103,
343
7,58
867
--
28,1
8423
,830
18.3
%
4A
AR
-
--
--
-25
,510
-25
,510
13,3
9190
.5%
5Ph
oeni
x 4,
465
372
7,18
91,
310
1,99
83,
141
--
18,4
7517
,017
8.6%
6M
omen
tum
2,
530
590
3,42
548
51,
701
407,
490
542
16,8
0314
,225
18.1
%
7N
IC1,
433
237,
606
1,66
11,
230
3,21
5-
-15
,167
14,6
073.
8%
8R
elia
nce
2,62
260
47,
686
1,52
811
8-
-2,
312
14,8
7012
,793
16.2
%
9C
entu
ry
1,64
81,
166
8,70
1-
667
--
2,41
014
,592
12,3
5018
.2%
10St
rate
gis
--
--
--
12,6
64-
12,6
6423
,387
-45.
8%
11Ta
nzin
dia
3,02
11,
164
3,27
877
91,
336
2,80
312
,381
10,4
0319
.0%
12R
eal
2,62
71,
293
5,05
513
524
8-
-1,
811
11,1
699,
598
16.4
%
13N
iko
1,78
73,
170
916
425
4,56
5-
--
10,8
6410
,150
7.0%
14Li
on
2,00
61,
680
2,52
838
01,
329
1,27
4-
-9,
197
9,30
0-1
.1%
15M
axin
sure
899
149
5,90
658
555
954
0-
453
9,09
178
410
59.3
%
16Z
IC36
4-
7,97
662
623
--
-9,
026
8,00
712
.7%
17M
gen
2,27
8-
3,29
358
789
--
1,18
37,
600
7,06
37.
6%
18G
olde
n1,
211
160
913
327
--
-1,
452
4,06
33,
532
15.0
%
19Fi
rst
777
388
1,46
719
695
8-
--
3,78
51,
195
216.
6%
20IG
T26
421
2,83
75
107
--
403,
275
347
843.
5%
21B
umac
o10
21
1,64
4-
10-
-32
1,78
81,
565
14.2
%
22St
ar
112
381,
215
4077
--
471,
528
1,18
728
.8%
23M
ilem
be93
4773
631
229
-60
-1,
195
793
50.7
%
To
tal
56,6
5216
,594
96,4
0914
,954
44,4
7110
,573
55,5
5613
,230
308,
437
255,
746
20.6
%
TIRA 2011 ANNUAL REPORT.indd Sec2:110TIRA 2011 ANNUAL REPORT.indd Sec2:110 1/18/13 9:48:04 AM1/18/13 9:48:04 AM

111
ANNUAL INSURANCE MARKET PERFORMANCE REPORT For The Year Ended 31st December 2011
(TA
BL
E 5
A C
ON
T…
) I
nsur
er-w
ise
Mar
ket
Shar
e in
Eac
h C
lass
of
Bus
ines
s in
%
S/N
Nam
e of
Ins
urer
Fire
Eng
inee
ring
Mot
orM
arin
eA
ccid
ent.
Avi
atio
nH
ealt
hO
ther
Gen
.20
11 T
otal
2010
Tot
al%
Poi
nt C
hang
e
1Ju
bile
e 4.
82%
15.5
1%9.
50%
14.8
0%32
.33%
0.00
%15
.90%
0.00
%12
.93%
10.4
5%2.
5%
2H
erit
age
34.4
5%13
.52%
4.95
%9.
29%
16.4
0%9.
09%
1.80
%1.
12%
12.1
0%13
.10%
-1.0
%
3A
llian
ce10
.88%
5.49
%10
.49%
22.3
5%17
.06%
0.63
%0.
00%
0.00
%9.
14%
9.32
%-0
.2%
4A
AR
0.
00%
0.00
%0.
00%
0.00
%0.
00%
0.00
%45
.92%
0.00
%8.
27%
5.24
%3.
0%
5Ph
oeni
x 7.
88%
2.24
%7.
46%
8.76
%4.
49%
29.7
0%0.
00%
0.00
%5.
99%
6.65
%-0
.7%
6M
omen
tum
4.
47%
3.56
%3.
55%
3.24
%3.
82%
0.38
%13
.48%
4.09
%5.
45%
5.56
%-0
.1%
7N
IC2.
53%
0.14
%7.
89%
11.1
1%2.
77%
30.4
0%0.
00%
0.00
%4.
92%
5.71
%-0
.8%
8R
elia
nce
4.63
%3.
64%
7.97
%10
.22%
0.27
%0.
00%
0.00
%17
.47%
4.82
%5.
00%
-0.2
%
9C
entu
ry
2.91
%7.
03%
9.02
%0.
00%
1.50
%0.
00%
0.00
%18
.22%
4.73
%4.
83%
-0.1
%
10St
rate
gis
0.00
%0.
00%
0.00
%0.
00%
0.00
%0.
00%
22.8
0%0.
00%
4.11
%9.
14%
-5.0
%
11Ta
nzin
dia
5.33
%7.
02%
3.40
%5.
21%
0.00
%12
.64%
0.00
%21
.19%
4.01
%4.
07%
-0.1
%
12R
eal
4.64
%7.
79%
5.24
%0.
90%
0.56
%0.
00%
0.00
%13
.69%
3.62
%3.
75%
-0.1
%
13N
iko
3.15
%19
.10%
0.95
%2.
84%
10.2
7%0.
00%
0.00
%0.
00%
3.52
%3.
97%
-0.4
%
14Li
on
3.54
%10
.12%
2.62
%2.
54%
2.99
%12
.05%
0.00
%0.
00%
2.98
%3.
64%
-0.7
%
15M
axin
sure
1.59
%0.
90%
6.13
%3.
91%
1.26
%5.
11%
0.00
%3.
42%
2.95
%0.
31%
2.6%
16Z
IC0.
64%
0.00
%8.
27%
0.42
%1.
40%
0.00
%0.
00%
0.00
%2.
93%
3.13
%-0
.2%
17M
gen
4.02
%0.
00%
3.42
%0.
39%
1.77
%0.
00%
0.00
%8.
94%
2.46
%2.
76%
-0.3
%
18G
olde
n2.
14%
0.96
%0.
95%
2.18
%0.
00%
0.00
%0.
00%
10.9
7%1.
32%
1.38
%-0
.1%
19Fi
rst
1.37
%2.
34%
1.52
%1.
31%
2.15
%0.
00%
0.00
%0.
00%
1.23
%0.
47%
0.8%
20IG
T0.
47%
0.13
%2.
94%
0.04
%0.
24%
0.00
%0.
00%
0.30
%1.
06%
0.14
%0.
9%
21B
umac
o0.
18%
0.00
%1.
70%
0.00
%0.
02%
0.00
%0.
00%
0.24
%0.
58%
0.61
%0.
0%
22St
ar
0.20
%0.
23%
1.26
%0.
27%
0.17
%0.
00%
0.00
%0.
35%
0.50
%0.
46%
0.0%
23M
ilem
be0.
16%
0.28
%0.
76%
0.21
%0.
52%
0.00
%0.
11%
0.00
%0.
39%
0.31
%0.
1%
To
tal
100.
00%
100.
00%
100.
00%
100.
00%
100.
00%
100.
00%
100.
00%
100.
00%
100.
00%
100.
00%
TIRA 2011 ANNUAL REPORT.indd Sec2:111TIRA 2011 ANNUAL REPORT.indd Sec2:111 1/18/13 9:48:05 AM1/18/13 9:48:05 AM

112
ANNUAL INSURANCE MARKET PERFORMANCE REPORT For The Year Ended 31st December 2011
TA
BL
E 5
B: L
ON
G T
ER
M A
SSU
RA
NC
E G
RO
SS P
RE
MIU
MS
WR
ITT
EN
BY
TA
NZ
AN
IA I
NSU
RE
RS
AS
AT
31ST
DE
CE
MB
ER
201
1 (T
ZS
MIL
LIO
N)
S/N
Nam
e of
Ins
urer
(in
shor
t)
Gro
ss P
rem
ium
Wri
tten
by
Cla
ss o
f B
usin
ess
2011
Tota
l20
10
Tota
l%
Inc
r. (
decr
.)In
divi
dual
Lif
eG
roup
Lif
e O
ther
life
1A
fric
an L
ife
2,19
4.9
14,8
68.2
76
.5
17,1
39.6
14
,585
.6
17.5
%
2N
IC8,
554.
5 2,
772.
4 -
11,3
26.9
11
,390
.3
-0.6
%
3A
llian
ce L
ife
55.0
5,
262.
5 -
5,31
7.5
2,34
8 12
6.5%
4Ju
bile
e26
0.1
587.
1 1,
553.
8 2,
401.
0 96
5.2
148.
8%
5Z
IC80
.1
- -
80.1
13
4.3
-40.
3%
6A
llian
ce
n/a
n
/a
n/a
n
/a
1,78
3.7
N/A
To
tal
11,1
44.6
23
,490
.2
1,63
0.3
36,2
65.1
31
,207
.1
16.2
%
Insu
rer-
wis
e M
arke
t Sh
are
in E
ach
Cla
ss o
f B
usin
ess
in %
S/N
Nam
e of
Ins
urer
Indi
vidu
al L
ife
Gro
up L
ife
Oth
er li
fe
2011
Tot
al20
10 T
otal
% P
oint
Cha
nge
1A
fric
an L
ife
19.6
9%63
.30%
4.69
%47
.26%
46.7
4%0.
52%
2N
IC76
.76%
11.8
0%0.
00%
31.2
3%36
.50%
-5.2
7%
3A
llian
ce L
ife
0.49
%22
.40%
0.00
%14
.66%
7.52
%7.
14%
4Ju
bile
e2.
33%
2.50
%95
.31%
6.62
%3.
09%
3.53
%
5Z
IC0.
72%
0.00
%0.
00%
0.22
%0.
43%
-0.2
1%
6A
llian
ce
n/a
n
/a
n/a
n
/a
5.72
%n/
a
To
tal
100.
00%
100.
00%
100.
00%
100.
00%
100.
00%
TIRA 2011 ANNUAL REPORT.indd Sec2:112TIRA 2011 ANNUAL REPORT.indd Sec2:112 1/18/13 9:48:05 AM1/18/13 9:48:05 AM

113
ANNUAL INSURANCE MARKET PERFORMANCE REPORT For The Year Ended 31st December 2011
TA
BL
E 5
C: G
EN
ER
AL
IN
SUR
AN
CE
NE
T P
RE
MIU
MS
WR
ITT
EN
BY
TA
NZ
AN
IA I
NSU
RE
RS
AS
AT
31ST
DE
CE
MB
ER
201
1 (T
ZS
MIL
LIO
N)
S/N
Nam
e of
Ins
urer
(in
shor
t fo
rm)
N
et P
rem
ium
s W
ritt
en b
y C
lass
of
Bus
ines
s in
TZ
S M
illio
n 20
11To
tal
2010
Tota
l%
Inc
r.(d
ecr.
) F
ire
Eng
inee
ring
M
otor
Mar
ine
Acc
iden
t A
viat
ion
Hea
lth
Oth
er G
en.
1A
AR
--
--
--
24,5
21-
24,5
2112
,647
93.9
%
2Ju
bile
e55
998
7,07
929
51,
263
-2,
798
-12
,092
9,34
029
.5%
3A
llian
ce90
717
17,
319
901
1,44
50
--
10,7
439,
263
16.0
%
4H
erit
age
849
244
3,70
228
84,
097
1185
514
810
,192
10,7
75-5
.4%
5M
omen
tum
670
226
2,13
417
757
71
5,87
616
29,
824
6,79
844
.5%
6C
entu
ry30
218
26,
711
-29
2-
-1,
055
8,54
38,
834
-3.3
%
7Ph
oeni
x95
678
5,57
647
31,
168
50-
-8,
302
7,84
95.
8%
8St
rate
gis
--
--
--
7,63
7-
7,63
714
,988
-49.
0%
9R
elia
nce
608
128
4,96
264
356
--
1,22
47,
621
6,12
924
.3%
10N
IC73
723
5,90
053
147
(10)
7,22
87,
334
-1.4
%
11Z
IC69
-6,
334
341
0-
--
6,81
66,
358
7.2%
12R
eal
963
457
3,85
734
96-
-1,
302
6,70
95,
854
14.6
%
13N
iko
366
2,56
833
026
11,
712
--
-5,
236
3,73
340
.3%
14M
axin
sure
310
294,
051
224
142
14-
152
4,92
340
21,
124.
6%
15Ta
nzin
dia
400
154
2,43
315
1-
40-
1,13
14,
309
3,45
724
.6%
16M
gen
742
-2,
458
27(7
)-
-66
43,
884
3,44
812
.6%
17Li
on42
010
91,
610
140
621
0-
-2,
900
2,85
81.
5%
18IG
T13
112
2,49
03
85-
-24
2,74
523
41,
073.
2%
19Fi
rst
174
351,
180
4746
2-
--
1,89
850
127
8.8%
20B
umac
o79
01,
248
-7
--
241,
359
1,19
413
.8%
21G
olde
n17
875
423
88-
--
429
1,19
41,
375
-13.
2%
22St
ar1
096
01
14-
-2
978
692
41.3
%
23M
ilem
be24
1558
910
71-
60(1
09)
659
415
58.9
%
To
tal
9,44
64,
605
71,3
464,
298
12,5
5610
741
,745
6,20
915
0,31
312
4,47
820
.9%
TIRA 2011 ANNUAL REPORT.indd Sec2:113TIRA 2011 ANNUAL REPORT.indd Sec2:113 1/18/13 9:48:05 AM1/18/13 9:48:05 AM

114
ANNUAL INSURANCE MARKET PERFORMANCE REPORT For The Year Ended 31st December 2011
(TA
BL
E 5
C C
ON
T…
) I
nsur
er-w
ise
Mar
ket
Shar
e in
Eac
h C
lass
of
Bus
ines
s in
%
S/N
Nam
e of
Ins
urer
Fire
Eng
inee
ring
Mot
orM
arin
eA
ccid
ent.
Avi
atio
nH
ealt
hO
ther
Gen
.20
11 T
otal
2010
Tot
al%
Poi
nt
Cha
nge
1A
AR
0.
00%
0.00
%0.
00%
0.00
%0.
00%
0.00
%58
.74%
0.00
%16
.31%
10.1
6%6.
2%
2Ju
bile
e 5.
92%
2.13
%9.
92%
6.87
%10
.06%
0.00
%6.
70%
0.00
%8.
04%
7.50
%0.
5%
3A
llian
ce9.
60%
3.71
%10
.26%
20.9
7%11
.51%
0.00
%0.
00%
0.00
%7.
15%
7.44
%-0
.3%
4H
erit
age
8.99
%5.
29%
5.19
%6.
70%
32.6
3%10
.06%
2.05
%2.
38%
6.78
%8.
66%
-1.9
%
5M
omen
tum
7.
10%
4.92
%2.
99%
4.12
%4.
60%
1.33
%14
.07%
2.61
%6.
54%
5.46
%1.
1%
6C
entu
ry
3.19
%3.
96%
9.41
%0.
00%
2.33
%0.
00%
0.00
%17
.00%
5.68
%7.
10%
-1.4
%
7Ph
oeni
x 10
.13%
1.70
%7.
82%
11.0
0%9.
30%
46.5
4%0.
00%
0.00
%5.
52%
6.31
%-0
.8%
8St
rate
gis
0.00
%0.
00%
0.00
%0.
00%
0.00
%0.
00%
18.2
9%0.
00%
5.08
%12
.04%
-7.0
%
9R
elia
nce
6.44
%2.
79%
6.95
%14
.96%
0.45
%0.
00%
0.00
%19
.71%
5.07
%4.
92%
0.1%
10N
IC7.
81%
0.49
%8.
27%
12.3
6%0.
37%
-9.2
7%0.
00%
0.00
%4.
81%
5.89
%-1
.1%
11Z
IC0.
73%
0.00
%8.
88%
0.08
%3.
26%
0.00
%0.
00%
0.00
%4.
53%
5.11
%-0
.6%
12R
eal
10.2
0%9.
92%
5.41
%0.
80%
0.77
%0.
00%
0.00
%20
.96%
4.46
%4.
70%
-0.2
%
13N
iko
3.87
%55
.76%
0.46
%6.
07%
13.6
3%0.
00%
0.00
%0.
00%
3.48
%3.
00%
0.5%
14M
axin
sure
3.28
%0.
64%
5.68
%5.
20%
1.13
%13
.54%
0.00
%2.
45%
3.28
%0.
32%
3.0%
15Ta
nzin
dia
4.23
%3.
34%
3.41
%3.
51%
0.00
%37
.67%
0.00
%18
.21%
2.87
%2.
78%
0.1%
16M
gen
7.85
%0.
00%
3.45
%0.
64%
-0.0
6%0.
00%
0.00
%10
.70%
2.58
%2.
77%
-0.2
%
17Li
on
4.45
%2.
37%
2.26
%3.
26%
4.94
%0.
12%
0.00
%0.
00%
1.93
%2.
30%
-0.4
%
18IG
T1.
39%
0.27
%3.
49%
0.07
%0.
67%
0.00
%0.
00%
0.39
%1.
83%
0.19
%1.
6%
19Fi
rst
1.84
%0.
75%
1.65
%1.
10%
3.68
%0.
00%
0.00
%0.
00%
1.26
%0.
40%
0.9%
20B
umac
o0.
83%
0.01
%1.
75%
0.00
%0.
06%
0.00
%0.
00%
0.39
%0.
90%
0.96
%-0
.1%
21G
olde
n1.
88%
1.63
%0.
59%
2.06
%0.
00%
0.00
%0.
00%
6.91
%0.
79%
1.10
%-0
.3%
22St
ar
0.01
%0.
01%
1.35
%0.
02%
0.11
%0.
00%
0.00
%0.
03%
0.65
%0.
56%
0.1%
23M
ilem
be0.
26%
0.32
%0.
82%
0.22
%0.
57%
0.00
%0.
14%
-1.7
5%0.
44%
0.33
%0.
1%
Tota
l10
0.00
%10
0.00
%10
0.00
%10
0.00
%10
0.00
%10
0.00
%10
0.00
%10
0.00
%10
0.00
%10
0.00
%n/
a
TIRA 2011 ANNUAL REPORT.indd Sec2:114TIRA 2011 ANNUAL REPORT.indd Sec2:114 1/18/13 9:48:05 AM1/18/13 9:48:05 AM

115
ANNUAL INSURANCE MARKET PERFORMANCE REPORT For The Year Ended 31st December 2011
TA
BL
E 6
A: G
EN
ER
AL
IN
SUR
AN
CE
CO
MPA
NIE
S’ I
NC
OM
E S
TAT
EM
EN
T F
OR
TH
E Y
EA
R E
ND
ED
31S
T D
EC
EM
BE
R 2
011
(TZ
S M
ILL
ION
) D
escr
ipti
onJU
BIL
EE
HE
RIT
AG
EA
LL
IAN
CE
AA
RP
HO
EN
IXM
OM
EN
TU
MN
IC
1. G
ross
Pre
miu
ms W
ritt
en39
,031
37
,318
27,
333
2
5,71
8
18,
208
1
6,80
3
15,
167
2. R
eins
uran
ce A
ssum
ed86
1 -
8
51
- 20
7
266
-
-
3. R
eins
uran
ce C
eded
to T
an R
e7,
608
4,53
0
2
,722
990
2
,359
3
,706
2
,559
4. R
eins
uran
ce C
eded
to o
ther
loca
l com
pani
es1,
178
1,27
6
992
-
1
,290
999
-
5. R
eins
uran
ce C
eded
to fo
reig
n co
mpa
nies
19,0
15
21,3
19
1
3,72
8
-
6
,524
2
,274
5
,380
6. N
et P
rem
ium
s W
ritt
en12
,092
10
,192
10,
743
2
4,52
1
8
,302
9
,824
7,
228
7. C
hang
e in
une
arne
d pr
emiu
ms
- 39
5 -
800
-
526
- 5,
444
- 46
2 -
510
- 2
67
8. N
et P
rem
ium
s E
arne
d11
,697
9,
392
1
0,21
7
19,
077
7,8
40
9,3
14
6,96
1
9. I
ncur
red
Cla
ims
6,82
0 5,
468
6,7
50
12,5
98
3,4
30
4,8
36
8
15
10. C
omm
issi
ons
67
- 6
20
1
05
3,0
30
- 58
0
771
-
214
11. M
anag
emen
t Exp
ense
s4,
008
4’45
1
3
,032
3
,717
3
,858
3
,378
8
,892
12. T
otal
Und
erw
riti
ng E
xpen
ses
10,8
95
9,29
8
9
,886
19,
345
6,7
07
8,9
86
9,49
2
13.U
nder
wri
tng
Inco
me
(Los
s)80
2
9
3
331
(
269)
1,1
33
3
28
(2,5
31)
14. I
nter
est
544
1,32
2
1
,094
-
544
240
1
,657
15 D
ivid
ends
107
135
4
07
-
77
23
1
26
16. R
ealiz
ed g
ains
(lo
sses
)-
-
-
-
3
7
-
-
4
,404
17. U
nrea
lized
gai
ns (
loss
es)
- -1
2
-
-
5
,137
19
-
18 F
orei
gn e
xcha
nge
gain
s (l
osse
s)70
8 27
3
389
-
513
230
34
3
19 O
ther
inve
stm
ent i
ncom
e-
389
5
35
3
71
1,4
16
-
586
20. I
nves
tmen
t exp
ense
s-
-18
- 4
40
-
- 98
0
-
-
21 T
otal
Inv
estm
ent
Inco
me
1,35
8 2,
088
1,9
85
3
34
6,7
08
5
12
7,11
6
22.
Inco
me
tran
sfer
red
from
Life
Fun
d-
-
200
-
-
-
-
23. O
ther
inco
me
15
18
-
8
07
6
-
154
24. N
et o
pera
ting
inco
me
802
121
3
31
- 2
69
1,1
33
3
28
-2,5
31
25.
Non
rec
urri
ng in
com
e (l
osse
s)-
- 2
26
-
-
-
1
-
-
26. T
ax-
640
- 4
53
- 48
1 -
325
- 2,
345
- 29
3 -
380
27. N
et I
ncom
e af
ter
tax
1,53
5 1,
521
2,0
35
54
7
5
,501
547
4,
358
TIRA 2011 ANNUAL REPORT.indd Sec2:115TIRA 2011 ANNUAL REPORT.indd Sec2:115 1/18/13 9:48:05 AM1/18/13 9:48:05 AM

116
ANNUAL INSURANCE MARKET PERFORMANCE REPORT For The Year Ended 31st December 2011
TA
BL
E 6
A: G
EN
ER
AL
IN
SUR
AN
CE
CO
MPA
NIE
S’ I
NC
OM
E S
TAT
EM
EN
T F
OR
TH
E Y
EA
R E
ND
ED
31S
T D
EC
EM
BE
R 2
011
(TZ
S M
ILL
ION
)……
.CO
NT
INU
ED
Des
crip
tion
RE
LIA
NC
EC
EN
TU
RY
STR
ATE
GIS
TA
NZ
IND
IAR
EA
LN
IKO
LIO
N
1. G
ross
Pre
miu
ms W
ritt
en
13,
821
14,5
92
1
2,66
4
10,
528
1
0,72
7
9
,755
8
,606
2. R
eins
uran
ce A
ssum
ed
1
,049
-
-
1,8
54
4
43
1,1
09
5
91
3. R
eins
uran
ce C
eded
to T
an R
e
2
,731
2,
777
1,9
94
2,2
39
2,3
69
1,5
41
1,1
56
4. R
eins
uran
ce C
eded
to o
ther
loca
l com
pani
es
1
,208
1,
259
9
99
4
44
2
95
8
44
2,2
44
5. R
eins
uran
ce C
eded
to fo
reig
n co
mpa
nies
3,3
09
2,01
4
2
,034
5
,390
1
,796
3
,243
2
,896
6. N
et P
rem
ium
s W
ritt
en
7
,621
8,
543
7,6
37
4,3
09
6,7
09
5,2
36
2,90
0
7. C
hang
e in
une
arne
d pr
emiu
ms
-
9
39
-1,2
40
2,5
90
-
2
73
-
3
49
1
35
- 17
8. N
et P
rem
ium
s E
arne
d
6
,682
7,
303
1
0,22
7
4
,036
6
,360
5
,371
2,
883
9. I
ncur
red
Cla
ims
4,4
74
5,21
9
10,
339
2,3
03
3,5
95
2,1
21
1,6
30
10. C
omm
issi
ons
5
32
149
-
8
34
- 5
1
126
-
76
- 12
0
11. M
anag
emen
t Exp
ense
s
3
,161
2,
861
4,1
68
1,7
06
2,7
22
3,2
83
1,6
92
12. T
otal
Und
erw
riti
ng E
xpen
ses
8,1
67
8,22
9
13,
674
3,9
58
6,4
43
5,3
28
3,20
2
13.U
nder
wri
tng
Inco
me
(Los
s)
(1,
485)
(926
)
(3,
447)
78
(
83)
43
(319
)
14. I
nter
est
5
98
162
6
36
3
25
2
13
1
79
2
26
15 D
ivid
ends
83
16
40
35
-
34
28
16. R
ealiz
ed g
ains
(lo
sses
)
-
-
-
-
-
-
-
17. U
nrea
lized
gai
ns (
loss
es)
-
-
-
132
-
-
-
18 F
orei
gn e
xcha
nge
gain
s (l
osse
s)
113
-
1
27
2
33
29
61
-
19 O
ther
inve
stm
ent i
ncom
e
6
-
-
-
-
-
-
20. I
nves
tmen
t exp
ense
s
-
-
-
- 2
21
-
-
-
21 T
otal
Inv
estm
ent
Inco
me
8
01
178
8
04
5
05
2
41
2
75
254
22.
Inco
me
tran
sfer
red
from
Life
Fun
d
-
-
-
-
-
-
-
23. O
ther
inco
me
- 7
-
43
19
-
5
1
84
24. N
et o
pera
ting
inco
me
- 1
,485
-
926
-
3,4
47
78
-
83
43
-319
25.
Non
rec
urri
ng in
com
e (l
osse
s)
121
-
-
-
-
-
-
26. T
ax
260
15
9
783
-
186
- 6
5 -
145
4
27. N
et I
ncom
e af
ter
tax
(31
0)(5
89)
(
1,81
7)
416
94
177
12
3
TIRA 2011 ANNUAL REPORT.indd Sec2:116TIRA 2011 ANNUAL REPORT.indd Sec2:116 1/18/13 9:48:05 AM1/18/13 9:48:05 AM

117
ANNUAL INSURANCE MARKET PERFORMANCE REPORT For The Year Ended 31st December 2011
TA
BL
E 6
A: G
EN
ER
AL
IN
SUR
AN
CE
CO
MPA
NIE
S’ I
NC
OM
E S
TAT
EM
EN
T F
OR
TH
E Y
EA
R E
ND
ED
31S
T D
EC
EM
BE
R 2
011
(TZ
S M
ILL
ION
)……
.CO
NT
INU
ED
Des
crip
tion
MA
XIN
SUR
EZ
ICM
GE
NG
OL
DE
NFI
RST
IGT
BU
MA
CO
1. G
ross
Pre
miu
ms W
ritt
en
8
,931
9,
026
7,60
0 3,
358
3,78
5 3,
249
1,7
88
2. R
eins
uran
ce A
ssum
ed
160
-
- 70
5 -
26
-
3. R
eins
uran
ce C
eded
to T
an R
e
1
,851
2,
211
1,51
0 79
4 58
7 40
1
370
4. R
eins
uran
ce C
eded
to o
ther
loca
l com
pani
es
728
-
940
161
148
55
-
5. R
eins
uran
ce C
eded
to fo
reig
n co
mpa
nies
1,5
90
- 1,
266
1,91
4 1,
151
74
59
6. N
et P
rem
ium
s W
ritt
en
4
,923
6,
816
3,88
4 1,
194
1,89
8 2,
745
1,3
59
7. C
hang
e in
une
arne
d pr
emiu
ms
- 2
,323
-
450
-102
-
259
- 54
5 -
280
- 7
3
8. N
et P
rem
ium
s E
arne
d
2
,600
6,
366
3,78
2 93
5 1,
353
2,46
5
1
,285
9. I
ncur
red
Cla
ims
1,4
99
2,00
3 1,
952
510
772
1,05
9
407
10. C
omm
issi
ons
22
658
272
37
- 1
18
217
19
11. M
anag
emen
t Exp
ense
s
2
,361
3,
364
1,75
3 1,
160
642
945
6
45
12. T
otal
Und
erw
riti
ng E
xpen
ses
3,88
2 6,
025
3,97
7 1,
706
1,29
5 2,
221
1,0
72
13.U
nder
wri
tng
Inco
me
(Los
s)
(1,
281)
340
(195
)(7
72)
57
244
2
14
14. I
nter
est
1
01
545
109
143
62
46
89
15 D
ivid
ends
-
- -
25
- 14
-
16. R
ealiz
ed g
ains
(lo
sses
)
-
-
- -
- -
-
17. U
nrea
lized
gai
ns (
loss
es)
-
- -
- 37
-
-
18 F
orei
gn e
xcha
nge
gain
s (l
osse
s)-
0.4
29
- 76
-
-
-
19 O
ther
inve
stm
ent i
ncom
e
-
-
13
- -
-
-
20. I
nves
tmen
t exp
ense
s
-
-
- -
- -
- 3
21 T
otal
Inv
estm
ent
Inco
me
1
01
575
122
244
98
60
85
22.
Inco
me
tran
sfer
red
from
Life
Fun
d
-
-
- 3
- -
-
23. O
ther
inco
me
15
32
- -
- -
84
24. N
et o
pera
ting
inco
me
- 1,
281
340
- 19
5 -
772
57
244
2
14
25.
Non
rec
urri
ng in
com
e (l
osse
s)
-
-
- -
- -
- 24
26. T
ax
320
-
- 1
155
- 55
-
37
- 69
27. N
et I
ncom
e af
ter
tax
(84
6)94
6(7
5)(3
69)
101
267
2
90
TIRA 2011 ANNUAL REPORT.indd Sec2:117TIRA 2011 ANNUAL REPORT.indd Sec2:117 1/18/13 9:48:05 AM1/18/13 9:48:05 AM

118
ANNUAL INSURANCE MARKET PERFORMANCE REPORT For The Year Ended 31st December 2011
TA
BL
E 6
A: G
EN
ER
AL
IN
SUR
AN
CE
CO
MPA
NIE
S’ I
NC
OM
E S
TAT
EM
EN
T F
OR
TH
E Y
EA
R E
ND
ED
31S
T D
EC
EM
BE
R 2
011
(TZ
S M
ILL
ION
)……
.CO
NT
INU
ED
D
escr
ipti
onST
AR
MIL
EM
BE
TO
TA
L 2
011
TO
TA
L 2
010
% I
NC
R./
(DE
CR
.)
1. G
ross
Pre
miu
ms W
ritt
en94
7 1,
195
30
0,15
0
247,
972
21.0
%
2. R
eins
uran
ce A
ssum
ed58
0 -
8,2
88
7,7
75
6.6%
3. R
eins
uran
ce C
eded
to T
an R
e19
0 18
3
47,
376
4
6,26
8 2.
4%
4. R
eins
uran
ce C
eded
to o
ther
loca
l com
pani
es-
-
15,
060
1
3,46
6 11
.8%
5. R
eins
uran
ce C
eded
to fo
reig
n co
mpa
nies
360
353
9
5,68
9
71,
533
33.8
%
6. N
et P
rem
ium
s W
ritt
en97
8 66
0
150,
313
12
4,48
0 20
.8%
7. C
hang
e in
une
arne
d pr
emiu
ms
-109
-1
14
(1
2,75
3)
(7,
350)
73.5
%
8. N
et P
rem
ium
s E
arne
d86
9 54
6
137,
560
11
7,12
9 17
.4%
9. I
ncur
red
Cla
ims
593
376
7
9,56
7
68,
651
15.9
%
10. C
omm
issi
ons
100
- 61
3
,430
1
,129
20
3.8%
11. M
anag
emen
t Exp
ense
s45
6 65
5
62,
910
4
9,39
2 27
.4%
12. T
otal
Und
erw
riti
ng E
xpen
ses
1,14
8 97
0
145,
908
11
9,17
2 22
.4%
13.U
nder
wri
tng
Inco
me
(Los
s)(2
79)
(424
)
(8,
347)
(
2,04
3)30
8.6%
14. I
nter
est
99
37
8,9
72
5,8
10
54.4
%
15 D
ivid
ends
3 -
1,1
53
6
94
66.2
%
16. R
ealiz
ed g
ains
(lo
sses
)-
-
4
,367
1
,029
32
4.4%
17. U
nrea
lized
gai
ns (
loss
es)
- -
5,3
13
1,2
11
338.
6%
18 F
orei
gn e
xcha
nge
gain
s (l
osse
s)51
-
3,1
77
3,4
40
-7.7
%
19 O
ther
inve
stm
ent i
ncom
e-
-
3
,316
1
,859
78
.3%
20. I
nves
tmen
t exp
ense
s-
-
(1,
662)
(
1,61
5)2.
9%
21 T
otal
Inv
estm
ent
Inco
me
154
37
2
4,63
6
12,
428
98.2
%
22.
Inco
me
tran
sfer
red
from
Life
Fun
d-
-
203
10
1,
980.
5%
23. O
ther
inco
me
31
-
1
,405
(
129)
-1,1
86.4
%
24. N
et o
pera
ting
inco
me
-279
-
424
(
8,34
7)
(2,
043)
308.
6%
25.
Non
rec
urri
ng in
com
e (l
osse
s)-
-
(
131)
60
-318
.8%
26. T
ax-
106
(
3,69
1)
(3,
363)
9.7%
27. N
et I
ncom
e af
ter
tax
(95)
(281
)
14,
075
6,9
62
102.
2%
TIRA 2011 ANNUAL REPORT.indd Sec2:118TIRA 2011 ANNUAL REPORT.indd Sec2:118 1/18/13 9:48:06 AM1/18/13 9:48:06 AM

119
ANNUAL INSURANCE MARKET PERFORMANCE REPORT For The Year Ended 31st December 2011
TA
BL
E 6
B: L
IFE
ASS
UR
AN
CE
CO
MPA
NIE
S’ I
NC
OM
E S
TAT
EM
EN
T F
OR
TH
E Y
EA
R E
ND
ED
31S
T D
EC
EM
BE
R 2
011
(TZ
S M
ILL
ION
)
Des
crip
tion
AFR
ICA
N
LIF
EN
ICA
LL
IAN
CE
LIF
EJU
BIL
EE
ZIC
AL
LIA
NC
ET
OT
AL
201
1T
OT
AL
20
10%
IN
CR
./(D
EC
R.)
1. G
ross
pre
miu
ms
wri
tten
17,1
4011
,327
5,31
72,
401
80-
36,2
6531
,207
16.2
%
2. R
eins
uran
ce c
eded
to T
an R
e(1
,864
)(1
,042
)(6
3)-
-(2
,969
)(2
,037
)45
.7%
3. R
eins
uran
ce c
eded
to o
ther
loca
l co
mpa
nies
--
--
--
-0.
0%
4. R
eins
uran
ce c
eded
to fo
reig
n co
mpa
-ni
es(6
93)
(8)
(1,2
67)
(152
)-
-(2
,121
)(1
,925
)10
.2%
5. N
et P
rem
ium
s w
ritt
en14
,582
11,3
183,
008
2,18
680
-31
,175
27,2
4514
.4%
6. I
nter
est
694
345
144
253
2657
1,52
090
567
.9%
7. D
ivid
ends
142
161
--
--
303
170
78.4
%
8. R
ealiz
ed g
ains
(lo
sses
)-
4,47
5-
--
-4,
475
515
0.0%
9. F
orei
gn e
xcha
nge
gain
s (l
osse
s)-
146
(5)
-34
7-
488
3911
58.1
%
10. O
ther
inve
stm
ent i
ncom
e38
52,
538
-37
9-
-3,
302
2,53
830
.1%
11. I
nves
tmen
t exp
ense
s(5
34)
--
--
-(5
34)
(426
)25
.3%
12 T
otal
Inv
estm
ent
Inco
me
688
7,66
413
963
137
357
9,55
43,
740
155.
4%
13.
Fee
Inco
me
--
--
--
--
-
14. O
ther
Inc
ome
-33
01
12-
-34
321
261
.9%
15. T
otal
Inc
ome
15,2
7019
,313
3,14
92,
829
453
5741
,071
31,1
9731
.7%
16. C
laim
s2,
548
5,87
256
159
712
314
09,
841
10,0
31-1
.9%
17. A
nnui
ty P
aym
ents
-1,
429
--
-14
1,44
31,
964
-26.
5%
18. P
olic
y su
rren
ders
653
1,38
2-
32
-2,
040
1,28
458
.9%
19. C
hang
e in
act
uari
al li
abili
ties
366
559
--
-92
62,
823
-67.
2%
20. I
nter
est o
n po
licy
hold
er a
ccou
nts
--
--
--
-0.
0%
21. O
ther
pol
icy
hold
er b
enefi
ts
-63
5-
--
-63
5-
0.0%
22.
Tota
l Pol
icy
Hol
der
bene
fi ts
3,56
89,
318
1,12
159
912
515
414
,885
16,1
01-7
.6%
23. C
omm
issi
ons
4,32
81,
123
774
111
--
6,33
64,
261
48.7
%
24. M
anag
emen
t Exp
ense
s4,
804
4,75
41,
412
396
3915
11,4
198,
745
30.6
%
25. T
otal
exp
ense
s12
,700
15,1
963,
306
1,10
616
416
832
,640
29,1
0712
.1%
TIRA 2011 ANNUAL REPORT.indd Sec2:119TIRA 2011 ANNUAL REPORT.indd Sec2:119 1/18/13 9:48:06 AM1/18/13 9:48:06 AM

120
ANNUAL INSURANCE MARKET PERFORMANCE REPORT For The Year Ended 31st December 2011
TA
BL
E 6
B: L
IFE
ASS
UR
AN
CE
CO
MPA
NIE
S’ I
NC
OM
E S
TAT
EM
EN
T F
OR
TH
E Y
EA
R E
ND
ED
31S
T D
EC
EM
BE
R 2
011
(TZ
S M
ILL
ION
) C
ON
TIN
UE
D…
..
Des
crip
tion
AFR
ICA
N L
IFE
NIC
AL
LIA
NC
E L
IFE
JUB
ILE
EZ
ICA
LL
IAN
CE
TO
TA
L 2
011
TO
TA
L 2
010
% I
NC
R./
(DE
CR
.)
26. N
et O
pera
ting
Inc
ome
2,57
14,
117
(158
)1,
723
290
(111
)8,
431
2,08
930
3.5%
27. N
on r
ecur
ring
Inc
ome
(exp
ense
s)-
10(1
64)
--
(153
)(1
09)
41.2
%
28. T
otal
Inc
ome
2,57
14,
117
(148
)1,
560
290
(111
)8,
278
1,98
131
7.9%
29 I
ncom
e tr
ansf
er to
sha
reho
lder
s(1
,642
)-
--
(200
)(1
,842
)23
9-8
70.5
%
30. L
ife
Fund
at
star
t of
yea
r2,
893
52,7
69(2
01)
2,67
522
71,
190
59,5
5357
,333
3.9%
31. L
ife
Fund
at
end
of y
ear
3,82
156
,886
(349
)4,
235
517
879
65,9
8959
,553
10.8
%
TIRA 2011 ANNUAL REPORT.indd Sec2:120TIRA 2011 ANNUAL REPORT.indd Sec2:120 1/18/13 9:48:06 AM1/18/13 9:48:06 AM

121
ANNUAL INSURANCE MARKET PERFORMANCE REPORT For The Year Ended 31st December 2011
TA
BL
E 6
C: G
EN
ER
AL
IN
SUR
AN
CE
FIN
AN
CIA
L H
IGH
LIG
HT
S A
ND
AN
ALY
SIS
OF
SOM
E R
ATIO
S A
S AT
31S
T D
EC
EM
BE
R 2
011
Insu
rer-
by-I
nsur
er G
ener
al I
nsur
ance
Fin
anci
al H
ighl
ight
s as
at
31st D
ecem
ber
2011
(T
ZS
Mill
ion)
PAR
TIC
UL
AR
SJU
BIL
EE
HE
RIT
AG
EA
LL
IAN
CE
AA
RP
HO
EN
IXM
OM
EN
TU
MN
ICR
EL
IAN
CE
CE
NT
UR
Y
Gro
ss P
rem
ium
s (G
PW)
39,8
92
37,3
18
28,1
84
25,5
10
18,4
75
1
6,80
3 15
,167
14
,870
14
,592
Prem
ium
s C
eded
(R
P)27
,800
27
,126
17
,441
99
0 10
,173
6
,979
7,
939
7,24
8 6,
049
Net
Pre
miu
ms
(NPW
)12
,092
10
,192
10
,743
24
,521
8,
302
9,8
24
7,22
8 7,
621
8,54
3
Ear
ned
Prem
ium
s (N
et)
(NPE
)11
,697
9,
392
10,2
17
19,0
77
7,84
0
9
,314
6,
961
6,68
2 7,
303
Net
Cla
ims
Incu
rred
(N
CI)
6,82
0 5,
468
6,75
0 12
,598
3,
430
4,8
36
815
4,47
4 5,
219
Net
Com
mis
sion
Pai
d (N
et C
omm
.)67
(6
20)
105
3,03
0 (5
80)
7
71
(214
)53
2 14
9
Man
agem
ent E
xpen
ses
(Mgt
Exp
)4,
008
4,45
1 3,
032
3,71
7 3,
858
3,3
78
8,89
2 3,
161
2,86
1
Net
Exp
ense
s (M
gt E
xp &
Net
Com
m)
4,07
5 3,
831
3,13
7 6,
747
3,27
7
4
,149
8,
678
3,69
3 3,
010
Com
bine
Exp
(In
curr
ed, M
gt E
xp &
Com
m)
10,8
95
9,29
8 9,
886
19,3
46
6,70
7
8
,986
9,
492
8,16
7 8,
229
RAT
IO A
NA
LYSI
S (I
N %
)JU
BIL
EE
HE
RIT
AG
EA
LL
IAN
CE
AA
RP
HO
EN
IXM
OM
EN
TU
MN
ICR
EL
IAN
CE
CE
NT
UR
Y
RP
to G
PW R
atio
70%
73%
62%
4%55
%42
%52
%49
%41
%
NPW
to G
PW R
atio
30%
27%
38%
96%
45%
58%
48%
51%
59%
NPE
to G
PW29
%25
%36
%75
%42
%55
%46
%45
%50
%
NC
I to
NPE
(Lo
ss R
atio
)58
%58
%66
%66
%44
%52
%12
%67
%71
%
Mgt
Exp
to G
PW R
atio
10
%12
%11
%15
%21
%20
%59
%21
%20
%
Mgt
Exp
to N
PW R
atio
33
%44
%28
%15
%46
%34
%12
3%41
%33
%
Mgt
Exp
to N
PE R
atio
34
%47
%30
%19
%49
%36
%12
8%47
%39
%
Net
Exp
to N
PE (
Exp
ense
Rat
io)
35%
41%
31%
35%
42%
45%
125%
55%
41%
Com
bine
d R
atio
93%
99%
97%
101%
86%
96%
136%
122%
113%
TIRA 2011 ANNUAL REPORT.indd Sec2:121TIRA 2011 ANNUAL REPORT.indd Sec2:121 1/18/13 9:48:06 AM1/18/13 9:48:06 AM

122
ANNUAL INSURANCE MARKET PERFORMANCE REPORT For The Year Ended 31st December 2011
TA
BL
E 6
C: C
ON
T…
…G
EN
ER
AL
IN
SUR
AN
CE
FIN
AN
CIA
L H
IGH
LIG
HT
S A
ND
AN
ALY
SIS
OF
SOM
E R
ATIO
S A
S AT
31
ST D
EC
EM
BE
R 2
011
Insu
rer-
by-I
nsur
er G
ener
al I
nsur
ance
Fin
anci
al H
ighl
ight
s as
at
31st D
ecem
ber
2011
(T
ZS
Mill
ion)
PAR
TIC
UL
AR
SST
RAT
EG
IST
AN
ZIN
DIA
RE
AL
NIK
OL
ION
MA
XIN
SUR
EZ
ICM
GE
NG
OL
DE
N
Gro
ss P
rem
ium
s (G
PW)
12,6
64
12,3
81
11,1
69
10,8
64
9,19
7 9,
092
9,02
6 7,
600
4,06
3
Prem
ium
s C
eded
(R
P)5,
027
8,07
3 4,
461
5,62
7 6,
297
4,16
9 2,
211
3,71
6 2,
869
Net
Pre
miu
ms
(NPW
)7,
637
4,30
9 6,
709
5,23
6 2,
900
4,92
3 6,
816
3,88
4 1,
194
Ear
ned
Prem
ium
s (N
et)
(NPE
)10
,227
4,
036
6,36
0 5,
371
2,88
3 2,
600
6,36
6 3,
782
935
Net
Cla
ims
Incu
rred
(N
CI)
10,3
39
2,30
3 3,
595
2,12
1 1,
630
1,49
9 2,
004
1,98
7 51
0
Net
Com
mis
sion
Pai
d (N
et C
omm
.)(8
34)
(51)
126
(76)
(120
)22
65
8 27
2 37
Man
agem
ent E
xpen
ses
(Mgt
Exp
)4,
168
1,70
6 2,
722
3,28
3 1,
692
2,36
1 3,
364
1,75
3 1,
160
Net
Exp
ense
s (M
gt E
xp &
Net
Com
m)
3,33
5 1,
655
2,84
8 3,
207
1,57
2 2,
383
4,02
2 2,
025
1,19
7
Com
bine
Exp
(In
curr
ed, M
gt E
xp &
Com
m)
13,6
74
3,95
8 6,
443
5,32
8 3,
202
3,88
2 6,
026
4,01
2 1,
706
RAT
IO A
NA
LYSI
S (I
N %
)ST
RAT
EG
IST
AN
ZIN
DIA
RE
AL
NIK
OL
ION
MA
XIN
SUR
EZ
ICM
GE
NG
OL
DE
N
RP
to G
PW R
atio
40%
65%
40%
52%
68%
46%
24%
49%
71%
NPW
to G
PW R
atio
60%
35%
60%
48%
32%
54%
76%
51%
29%
NPE
to G
PW81
%33
%57
%49
%31
%29
%71
%50
%23
%
NC
I to
NPE
(Lo
ss R
atio
)10
1%57
%57
%39
%57
%58
%31
%53
%55
%
Mgt
Exp
to G
PW R
atio
33
%14
%24
%30
%18
%26
%37
%23
%29
%
Mgt
Exp
to N
PW R
atio
55
%40
%41
%63
%58
%48
%49
%45
%97
%
Mgt
Exp
to N
PE R
atio
41
%42
%43
%61
%59
%91
%53
%46
%12
4%
Net
Exp
to N
PE (
Exp
ense
Rat
io)
33%
41%
45%
60%
55%
92%
63%
54%
128%
Com
bine
d R
atio
134%
98%
101%
99%
111%
149%
95%
106%
183%
TIRA 2011 ANNUAL REPORT.indd Sec2:122TIRA 2011 ANNUAL REPORT.indd Sec2:122 1/18/13 9:48:06 AM1/18/13 9:48:06 AM

123
ANNUAL INSURANCE MARKET PERFORMANCE REPORT For The Year Ended 31st December 2011
TA
BL
E 6
C: C
ON
T…
…G
EN
ER
AL
IN
SUR
AN
CE
FIN
AN
CIA
L H
IGH
LIG
HT
S A
ND
AN
ALY
SIS
OF
SOM
E R
ATIO
S A
S AT
31
ST D
EC
EM
BE
R 2
011
Insu
rer-
by-I
nsur
er G
ener
al I
nsur
ance
Fin
anci
al H
ighl
ight
s as
at
31st D
ecem
ber
2011
(T
ZS
Mill
ion)
PAR
TIC
UL
AR
SFI
RST
IGT
BU
MA
CO
STA
RM
ILE
MB
ET
OT
AL
201
1T
OT
AL
201
0
Gro
ss P
rem
ium
s (G
PW)
3,78
5 3,
275
1,78
8 1,
527
1,1
95
30
8,43
8
255,
746
Prem
ium
s C
eded
(R
P)1,
887
530
429
549
5
36
15
8,12
4
131,
267
Net
Pre
miu
ms
(NPW
)1,
898
2,74
5 1,
359
978
6
60
15
0,31
3
124,
480
Ear
ned
Prem
ium
s (N
et)
(NPE
)1,
353
2,46
5 1,
285
869
5
46
13
7,56
0
117,
129
Net
Cla
ims
Incu
rred
(N
CI)
772
1,19
7 41
7 59
3
376
79,
567
6
8,65
1
Net
Com
mis
sion
Pai
d (N
et C
omm
.)(1
18)
217
19
100
(83)
3,4
30
1,1
29
Man
agem
ent E
xpen
ses
(Mgt
Exp
)64
2 94
5 64
5 45
6
687
62,
910
4
9,39
2
Net
Exp
ense
s (M
gt E
xp &
Net
Com
m)
524
1,16
2 66
5 55
6
604
66,
340
5
0,52
1
Com
bine
Exp
(In
curr
ed, M
gt E
xp &
Com
m)
1,29
5 2,
359
1,08
2 1,
148
9
80
14
5,90
8
119,
172
RAT
IO A
NA
LYSI
S (I
N %
)FI
RST
IGT
BU
MA
CO
STA
RM
ILE
MB
ET
OT
AL
201
1T
OT
AL
201
0
RP
to G
PW R
atio
50%
16%
24%
36%
45%
51%
51%
NPW
to G
PW R
atio
50%
84%
76%
64%
55%
49%
49%
NPE
to G
PW36
%75
%72
%57
%46
%45
%46
%
NC
I to
NPE
(Lo
ss R
atio
)57
%49
%32
%68
%69
%58
%59
%
Mgt
Exp
to G
PW R
atio
17
%29
%36
%30
%57
%20
%19
%
Mgt
Exp
to N
PW R
atio
34
%34
%48
%47
%10
4%42
%40
%
Mgt
Exp
to N
PE R
atio
47
%38
%50
%52
%12
6%46
%42
%
Net
Exp
to N
PE (
Exp
ense
Rat
io)
39%
47%
52%
64%
111%
48%
43%
Com
bine
d R
atio
96%
96%
84%
132%
179%
106%
102%
TIRA 2011 ANNUAL REPORT.indd Sec2:123TIRA 2011 ANNUAL REPORT.indd Sec2:123 1/18/13 9:48:06 AM1/18/13 9:48:06 AM

124
ANNUAL INSURANCE MARKET PERFORMANCE REPORT For The Year Ended 31st December 2011
TA
BL
E 6
D: G
EN
ER
AL
IN
SUR
AN
CE
CL
ASS
ES
OF
BU
SIN
ESS
FIN
AN
CIA
L H
IGH
LIG
HT
S A
ND
AN
ALY
SIS
OF
SOM
E R
ATIO
S A
S AT
31
ST D
EC
201
1 C
lass
-by-
Cla
ss G
ener
al I
nsur
ance
Fin
anci
al H
ighl
ight
s as
at
31st D
ecem
ber
2011
(T
ZS
Mill
ion)
PAR
TIC
UL
AR
SFi
reE
ngin
eeri
ngM
otor
Mar
ine
Acc
iden
tA
viat
ion
Hea
lth
Oth
er G
en.
TO
TA
L
2011
TO
TA
L
2010
Gro
ss P
rem
ium
s (G
PW)
56,6
52
16,
594
96,4
08
14,9
54
44,
471
10,
573
55,
556
13,
230
3
08,4
37
255
746
Prem
ium
s C
eded
(R
P)47
,206
1
1,98
9 25
,061
10
,655
3
1,91
5
1
0,46
6
1
3,81
1
7,02
1
158
,124
13
1 26
7
Net
Pre
miu
ms
(NPW
)9,
446
4,
605
71,3
46
4,29
8
1
2,55
6
10
7
4
1,74
5
6,20
9
150
,313
12
4 48
0
Ear
ned
Prem
ium
s (N
et)
(NPE
)7,
783
4,
843
65,8
12
4,40
8
1
1,79
2
15
4
3
7,21
2
5,55
6
137
,560
11
7 12
9
Net
Cla
ims
Incu
rred
(N
CI)
3,14
1
1,24
4 36
,913
1,
841
5,
957
109
28,
523
1,
839
79,
568
68 6
51
Net
Com
mis
sion
Pai
d (N
et C
omm
.)(2
,462
)
-86
1 5,
794
-209
-77
2
-42
6
2,45
1
-
85
3,
430
1 12
9
Man
agem
ent E
xpen
ses
(Mgt
Exp
)7,
665
1,
972
27,2
43
2,93
0
5,89
0
2,26
5
1
0,60
3
4,34
3
6
2,91
1 49
392
Net
Exp
ense
s (M
gt E
xp &
Net
Com
m)
5,20
3
1,11
1 33
,036
2,
722
5,
118
1,
839
13,
055
4,
257
66,
341
50 5
21
Com
bine
Exp
(In
curr
ed, M
gt E
xp &
Com
m)
8,34
4
2,35
5 69
,950
4,
563
11,
075
1,
948
41,
577
6,
097
1
45,9
08
119
172
Und
erw
riti
ng I
ncom
e(Lo
ss)
(561
)
2,48
8 (4
,138
)(1
54)
717
(1,
794)
(4,
365)
(
541)
(8,
348)
(2,0
43)
RAT
IO A
NA
LYSI
S (I
N %
)Fi
reE
ngin
eeri
ngM
otor
Mar
ine
Acc
iden
tA
viat
ion
Hea
lth
Oth
er G
en.
TO
TA
L
2011
TO
TA
L
2010
RP
to G
PW R
atio
83%
72%
26%
71%
72%
99%
25%
53%
51%
51%
NPW
to G
PW R
atio
17%
28%
74%
29%
28%
1%75
%47
%49
%49
%
NPE
to G
PW14
%29
%68
%29
%27
%1%
67%
42%
45%
46%
NC
I to
NPE
(Lo
ss R
atio
)40
%26
%56
%42
%51
%71
%77
%33
%58
%59
%
Mgt
Exp
to G
PW R
atio
14
%12
%28
%20
%13
%21
%19
%33
%20
%19
%
Mgt
Exp
to N
PW R
atio
81
%43
%38
%68
%47
%21
21%
25%
70%
42%
40%
Mgt
Exp
to N
PE R
atio
98
%41
%41
%66
%50
%14
69%
28%
78%
46%
42%
Net
Exp
to N
PE (
Exp
ense
Rat
io)
67%
23%
50%
62%
43%
1193
%35
%77
%48
%43
%
Com
bine
d R
atio
107%
49%
106%
103%
94%
1264
%11
2%11
0%10
6%10
2%
TIRA 2011 ANNUAL REPORT.indd Sec2:124TIRA 2011 ANNUAL REPORT.indd Sec2:124 1/18/13 9:48:06 AM1/18/13 9:48:06 AM

125
ANNUAL INSURANCE MARKET PERFORMANCE REPORT For The Year Ended 31st December 2011
TABLE 7A: GENERAL INSURERS’ BALANCE SHEET AS AT 31ST DECEMBER 2011 (TZS 000’S)
Description DEC. 2011 DEC. 2010%INCR./(DECR.)
Capital and Reserves
1. Share capital 47,213,113.0 39,816,548.3 18.6%
2. Share Premium Account 3,692,808.3 1,155,147.0 219.7%
3. Capital Reserve 4,933,229.3 3,264,631.0 51.1%
4. Revaluation Reserve 13,373,477.5 12,835,254.0 4.2%
5. Retained Earnings 17,084,147.5 9,624,970.1 77.5%
6. Contingency Reserve - General 22,064,357.4 20,136,095.1 9.6%
7. Contingency Reserve - Life - - N/A
8. Other reserves (please specify) 2,953,825.5 1,656,997.2 78.3%
9. Total Capital and Reserves 111,314,958.5 88,489,642.7 25.8%
Assets
10. Real Estate for own use 12,274,616.2 10,905,422.0 12.6%
11. Other Fixed Assets 7,993,894.4 7,236,747.9 10.5%
12. Total Fixed Assets 20,268,510.6 18,142,169.9 11.7%
Investment Assets
13. Cash and Bank Balances 24,215,859.4 19,304,125.0 25.4%
14. Deposits in fi nancial institutions 80,728,055.9 63,171,769.5 27.8%
15. Tanzanian government securities 35,139,727.7 20,744,694.6 69.4%
16. Other Bonds and debentures 7,589,389.7 7,411,740.0 2.4%
17. Mortgage Loans - - N/A
18. Real estate 26,034,190.0 26,377,257.0 -1.3%
19. Listed shares 8,922,096.6 7,403,911.0 20.5%
20. Other shares 4,878,333.0 3,276,008.0 48.9%
21. Investment in investment pools, mutual funds, unit trusts 665,167.0 1,444,430.0 -53.9%
22. Equity investments in related parties 8,600,619.0 7,229,516.0 19.0%
23. Other related party investments 2,975,026.5 505,180.0 488.9%
24. Policy Loans - 35,769.0 -100.0%
25. Other Investments - 2,091,694.0 -100.0%
26. Total Investment Assets 199,748,464.8 158,996,094.1 25.6%
Receivables
27. Brokers 32,857,697.4 20,279,166.2 62.0%
28. Policy holders 5,534,679.5 4,669,494.4 18.5%
29. Agents 1,014,362.5 2,111,241.1 -52.0%
30. Insurers 8,566,159.6 7,204,479.3 18.9%
31. Reinsurers 9,173,311.3 9,283,250.7 -1.2%
32. Related parties 781,109.1 3,740,094.5 -79.1%
33. Taxes 1,449,446.7 370,492.0 291.2%
34. Interest 634,687.0 382,752.0 65.8%
35. Other 7,236,461.0 5,086,195.9 42.3%
36. Total Receivables 67,247,914.1 53,127,166.1 26.6%
TIRA 2011 ANNUAL REPORT.indd Sec2:125TIRA 2011 ANNUAL REPORT.indd Sec2:125 1/18/13 9:48:07 AM1/18/13 9:48:07 AM

126
ANNUAL INSURANCE MARKET PERFORMANCE REPORT For The Year Ended 31st December 2011
TABLE 7A: GENERAL INSURERS’ BALANCE SHEET AS AT 31ST DECEMBER 2011 (TZS 000’S) CONTINUED
Description DEC. 2011 DEC. 2010 %INCR./(DECR.)
37. Deferred taxes 4,812,874.7 1,589,900.4 202.7%
38. Deferred acquisition costs 6,709,578.0 6,212,789.0 8.0%
39 Accrued Revenue 823,345.0 802,360.7 2.6%
40. Other assets 2,035,205.0 1,286,521.0 58.2%
41. Total Assets 301,645,892.2 240,157,001.2 25.6%
Liabilities
Payables
42. Agents, brokers and policyholders 1,242,095.8 871,978.1 42.4%
43. Reinsurers 30,570,652.2 20,925,054.8 46.1%
44. Insurers 5,664,316.6 3,830,876.7 47.9%
45. Related parties 1,766,742.5 975,247.4 81.2%
46. Other payables 6,943,239.7 5,585,301.5 24.3%
47. Total Payables 46,187,046.7 32,188,458.5 43.5%
Insurance Liabilities
48. Unearned Premiums 64,068,882.9 53,734,022.1 19.2%
49. Outstanding claims 43,949,559.4 42,076,836.0 4.5%
50. Incurred but not reported (IBNR) 8,196,020.4 7,221,991.0 13.5%
51. Unexpired risk - - 0.0%
52. Unearned Commission 260,680.0 258,652.0 0.8%
53. Life Insurance Fund Balance - .0%
54. Total Insurance Liabilities 116,475,142.6 103,291,501.1 12.8%
55. Accrued expenses 1,879,232.2 1,985,557.1 -5.4%
56. Overdrafts and debt 3,977,663.9 1,571,928.0 153.0%
57. Deferred taxes 3,970,128.1 2,225,360.0 78.4%
58. Proposed Dividends 615,000.0 432,381.0 42.2%
59. Other liabilities 17,226,716.4 9,972,173.7 72.7%
60. Total Liabilities 190,330,929.9 151,667,359.4 25.5% Note: For purposes of TIRA fi lings for insurance liabilities in the balance sheet are to be reported net of expected reinsurance recoveries.
TIRA 2011 ANNUAL REPORT.indd Sec2:126TIRA 2011 ANNUAL REPORT.indd Sec2:126 1/18/13 9:48:07 AM1/18/13 9:48:07 AM

127
ANNUAL INSURANCE MARKET PERFORMANCE REPORT For The Year Ended 31st December 2011
TABLE 7B: LIFE INSURERS’ BALANCE SHEET AS AT 31ST DECEMBER 2011 (TZS 000’S)
Description DEC. 2011 DEC. 2010 %INCR./(DECR.)
Capital and Reserves
1. Share capital 7,307,984.0 6,807,910.0 7.3%
2. Share Premium Account (159,094.0) - N/A
3. Capital Reserve 1,488,965.0 1,375,696.0 8.2%
4. Revaluation Reserve 3,989,497.0 10,784,747.0 -63.0%
5. Retained Earnings 1,686,911.0 (173,257.0) -1073.6%
6. Contingency Reserve - General - N/A
7. Contingency Reserve - Life 499,794.0 431,433.0 15.8%
8. Other reserves (please specify) 738,324.0 204,896.0 260.3%
9. Total Capital and Reserves 15,552,381.0 19,431,425.0 -20.0%
Assets
10. Real Estate for own use 13,075,536.0 13,250,190.0 -1.3%
11. Other Fixed Assets 443,676.0 483,284.0 -8.2%
12. Total Fixed Assets 13,519,212.0 13,733,474.0 -1.6%
Investment Assets
13. Cash and Bank Balances 7,935,885.0 4,978,201.0 59.4%
14. Deposits in fi nancial institutions 15,643,006.0 12,838,065.0 21.8%
15. Tanzanian government securities 3,137,482.0 2,401,784.0 30.6%
16. Other Bonds and debentures 200,000.0 203,541.0 0.0%
17. Mortgage Loans - - N/A
18. Real estate 39,528,328.0 53,260,000.0 -25.8%
19. Listed shares 5,374,209.0 3,052,501.0 76.1%
20. Other shares 4,438,611.0 3,145,928.0 41.1%
21. Investment in investment pools, mutual funds, unit trusts 175,756.0 - N/A
22. Equity investments in related parties - - N/A
23. Other related party investments 14,899,847.0 15,275,966.0 -2.5%
24. Policy Loans 804,299.0 537,776.0 49.6%
25. Other Investments - - N/A
26. Total Investment Assets 92,137,423.0 95,693,762.0 -3.7%
Receivables
27. Brokers 1,241,474.0 2,249,388.0 -44.8%
28. Policy holders 32,629.0 130,506.0 -75.0%
29. Agents 496,550.0 709,670.0 -30.0%
30. Insurers - N/A
31. Reinsurers - N/A
32. Related parties 29,490.0 57,712.0 -48.9%
33. Taxes (6,541,487.0) (6,097,618.0) 7.3%
34. Interest 112,794.0 370,499.0 -69.6%
35. Other 2,482,188.0 1,848,753.0 34.3%
36. Total Receivables (2,146,362.0) (731,090.0) 193.6%
TIRA 2011 ANNUAL REPORT.indd Sec2:127TIRA 2011 ANNUAL REPORT.indd Sec2:127 1/18/13 9:48:07 AM1/18/13 9:48:07 AM

128
ANNUAL INSURANCE MARKET PERFORMANCE REPORT For The Year Ended 31st December 2011
TABLE 7B: LIFE INSURERS’ BALANCE SHEET AS AT 31ST DECEMBER 2011 (TZS 000’S) CONTINUED
Description DEC. 2011 DEC. 2010 %INCR./(DECR.)
37. Deferred taxes 75,125.0 74,630.0 0.7%
38. Deferred acquisition costs - - N/A
39 Accrued Revenue 73,949.0 28,381.0 160.6%
40. Other assets 10,815,996.0 6,753,792.0 60.1%
41. Total Assets 114,475,343.0 115,552,949.0 -0.9%
Liabilities -
Payables
42. Agents, brokers and policyholders 391,305.0 148,806.0 163.0%
43. Reinsurers 812,809.0 1,420,448.0 -42.8%
44. Insurers - - N/A
45. Related parties 576,482.0 796,035.0 -27.6%
46. Other payables 5,922,944.0 3,249,838.0 82.3%
47. Total Payables 7,703,540.0 5,615,127.0 37.2%
Insurance Liabilities
48. Unearned Premiums 2,027,996.0 1,671,495.0 21.3%
49. Outstanding claims 14,300,674.0 22,643,625.0 -36.8%
50. Incurred but not reported (IBNR) 342,902.0 350,953.0 -2.3%
51. Unexpired risk 921,003.0 530,979.0 73.5%
52. Unearned Commission - N/A
53. Life Insurance Fund Balance 70,757,543.0 57,914,508.0 22.2%
54. Total Insurance Liabilities 88,350,118.0 83,111,560.0 6.3%
55. Accrued expenses 99,454.0 64,486.0 54.2%
56. Overdrafts and debt - N/A
57. Deferred taxes 786,527.0 3,416,317.0 -77.0%
58. Proposed Dividends - N/A
59. Other liabilities 1,983,323.0 3,914,035.0 -49.3%
60. Total Liabilities 98,922,962.0 96,121,525.0 2.9% Note: For purposes of TIRA fi lings for insurance liabilities in the balance sheet are to be reported net of expected reinsurance recoveries.
TIRA 2011 ANNUAL REPORT.indd Sec2:128TIRA 2011 ANNUAL REPORT.indd Sec2:128 1/18/13 9:48:07 AM1/18/13 9:48:07 AM
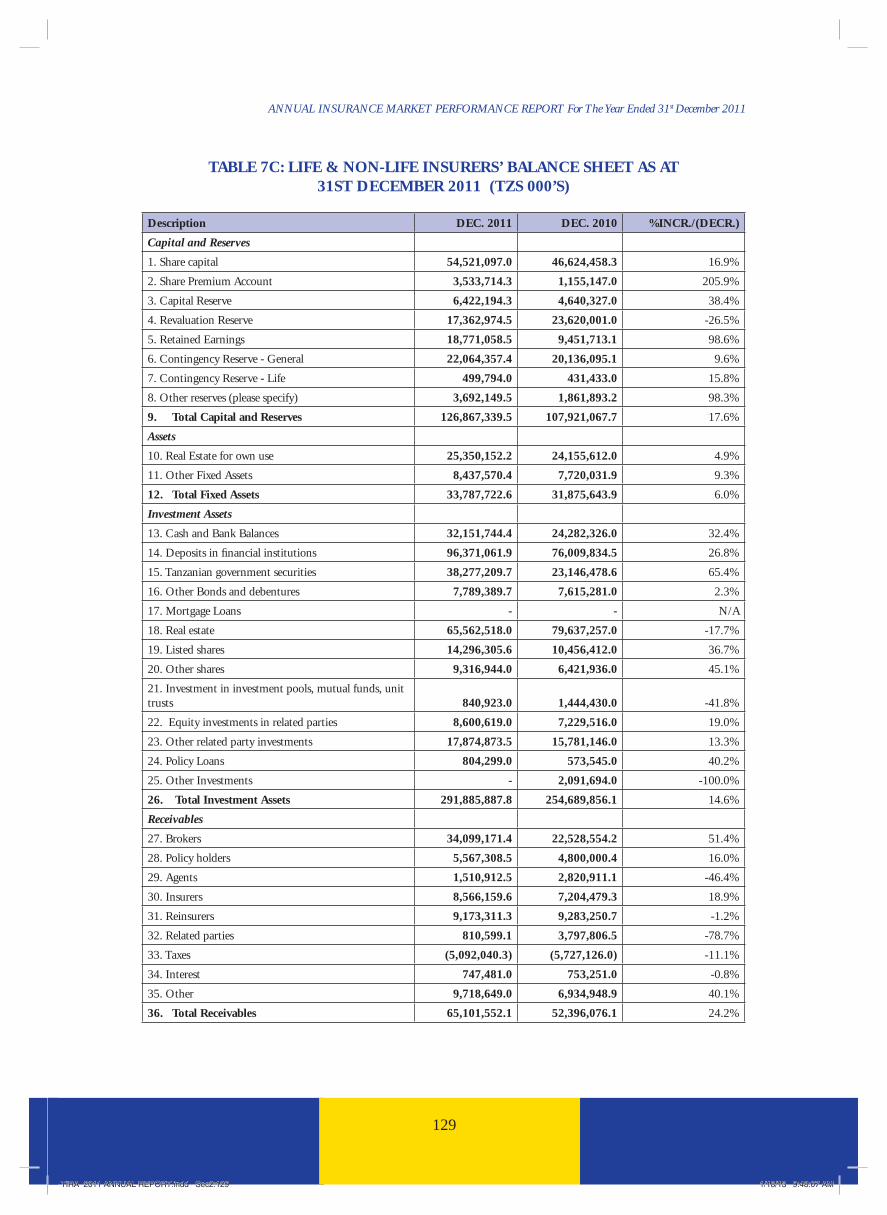
129
ANNUAL INSURANCE MARKET PERFORMANCE REPORT For The Year Ended 31st December 2011
TABLE 7C: LIFE & NON-LIFE INSURERS’ BALANCE SHEET AS AT 31ST DECEMBER 2011 (TZS 000’S)
Description DEC. 2011 DEC. 2010 %INCR./(DECR.)
Capital and Reserves
1. Share capital 54,521,097.0 46,624,458.3 16.9%
2. Share Premium Account 3,533,714.3 1,155,147.0 205.9%
3. Capital Reserve 6,422,194.3 4,640,327.0 38.4%
4. Revaluation Reserve 17,362,974.5 23,620,001.0 -26.5%
5. Retained Earnings 18,771,058.5 9,451,713.1 98.6%
6. Contingency Reserve - General 22,064,357.4 20,136,095.1 9.6%
7. Contingency Reserve - Life 499,794.0 431,433.0 15.8%
8. Other reserves (please specify) 3,692,149.5 1,861,893.2 98.3%
9. Total Capital and Reserves 126,867,339.5 107,921,067.7 17.6%
Assets
10. Real Estate for own use 25,350,152.2 24,155,612.0 4.9%
11. Other Fixed Assets 8,437,570.4 7,720,031.9 9.3%
12. Total Fixed Assets 33,787,722.6 31,875,643.9 6.0%
Investment Assets
13. Cash and Bank Balances 32,151,744.4 24,282,326.0 32.4%
14. Deposits in fi nancial institutions 96,371,061.9 76,009,834.5 26.8%
15. Tanzanian government securities 38,277,209.7 23,146,478.6 65.4%
16. Other Bonds and debentures 7,789,389.7 7,615,281.0 2.3%
17. Mortgage Loans - - N/A
18. Real estate 65,562,518.0 79,637,257.0 -17.7%
19. Listed shares 14,296,305.6 10,456,412.0 36.7%
20. Other shares 9,316,944.0 6,421,936.0 45.1%
21. Investment in investment pools, mutual funds, unit trusts 840,923.0 1,444,430.0 -41.8%
22. Equity investments in related parties 8,600,619.0 7,229,516.0 19.0%
23. Other related party investments 17,874,873.5 15,781,146.0 13.3%
24. Policy Loans 804,299.0 573,545.0 40.2%
25. Other Investments - 2,091,694.0 -100.0%
26. Total Investment Assets 291,885,887.8 254,689,856.1 14.6%
Receivables
27. Brokers 34,099,171.4 22,528,554.2 51.4%
28. Policy holders 5,567,308.5 4,800,000.4 16.0%
29. Agents 1,510,912.5 2,820,911.1 -46.4%
30. Insurers 8,566,159.6 7,204,479.3 18.9%
31. Reinsurers 9,173,311.3 9,283,250.7 -1.2%
32. Related parties 810,599.1 3,797,806.5 -78.7%
33. Taxes (5,092,040.3) (5,727,126.0) -11.1%
34. Interest 747,481.0 753,251.0 -0.8%
35. Other 9,718,649.0 6,934,948.9 40.1%
36. Total Receivables 65,101,552.1 52,396,076.1 24.2%
TIRA 2011 ANNUAL REPORT.indd Sec2:129TIRA 2011 ANNUAL REPORT.indd Sec2:129 1/18/13 9:48:07 AM1/18/13 9:48:07 AM

130
ANNUAL INSURANCE MARKET PERFORMANCE REPORT For The Year Ended 31st December 2011
TABLE 7C: LIFE & NON –LIFE INSURERS’ BALANCE SHEET AS AT 31ST DECEMBER 2011 (TZS 000’S) CONTINUED
Description DEC. 2011 DEC. 2010 % INCR./(DECR.)
37. Deferred taxes 4,887,999.7 1,664,530.4 193.7%
38. Deferred acquisition costs 6,709,578.0 6,212,789.0 8.0%
39 Accrued Revenue 897,294.0 830,741.7 8.0%
40. Other assets 12,851,201.0 8,040,313.0 59.8%
41. Total Assets 416,121,235.2 355,709,950.2 17.0%
Liabilities
Payables
42. Agents, brokers and policyholders 1,633,400.8 1,020,784.1 60.0%
43. Reinsurers 31,383,461.2 22,345,502.8 40.4%
44. Insurers 5,664,316.6 3,830,876.7 47.9%
45. Related parties 2,343,224.5 1,771,282.4 32.3%
46. Other payables 12,866,183.7 8,835,139.5 45.6%
47. Total Payables 53,890,586.7 37,803,585.5 42.6%
Insurance Liabilities
48. Unearned Premiums 66,096,878.9 55,405,517.1 19.3%
49. Outstanding claims 58,250,233.4 64,720,461.0 -10.0%
50. Incurred but not reported (IBNR) 8,538,922.4 7,572,944.0 12.8%
51. Unexpired risk 921,003.0 530,979.0 73.5%
52. Unearned Commission 260,680.0 258,652.0 0.8%
53. Life Insurance Fund Balance 70,757,543.0 57,914,508.0 22.2%
54. Total Insurance Liabilities 204,825,260.6 186,403,061.1 9.9%
55. Accrued expenses 1,978,686.2 2,050,043.1 -3.5%
56. Overdrafts and debt 3,977,663.9 1,571,928.0 153.0%
57. Deferred taxes 4,756,655.1 5,641,677.0 -15.7%
58. Proposed Dividends 615,000.0 432,381.0 42.2%
59. Other liabilities 19,210,039.4 13,886,208.7 38.3%
60. Total Liabilities 289,253,891.9 247,788,884.4 16.7% Note: For purposes of TIRA fi lings for insurance liabilities in the balance sheet are to be reported net of ex-pected reinsurance recoveries.
TIRA 2011 ANNUAL REPORT.indd Sec2:130TIRA 2011 ANNUAL REPORT.indd Sec2:130 1/18/13 9:48:07 AM1/18/13 9:48:07 AM

131
ANNUAL INSURANCE MARKET PERFORMANCE REPORT For The Year Ended 31st December 2011
TA
BL
E 8
A: G
EN
ER
AL
IN
SUR
AN
CE
BU
SIN
ESS
TH
RO
UG
H B
RO
KE
RS
IN T
AN
ZA
NIA
AS
AT 3
1ST
DE
CE
MB
ER
201
1 (T
ZS
MIL
LIO
N)
S/N
Nam
e of
Ins
uran
ce B
roke
r
(in
shor
t fo
rm)
Gro
ss P
rem
ium
s W
ritt
en b
y C
lass
of
Bus
ines
s in
TZ
S M
illio
n 20
11
TO
TA
L20
10
T
OT
AL
%
IN
CR
./
( D
EC
R)
% S
HA
RE
OF
MA
RK
ET
Fire
Eng
M
otor
Mar
ine
Acc
iden
t A
viat
ion
Hea
lth
Oth
er.g
20
1120
10
1A
lexa
nder
For
bes
17,1
69.2
81,
017.
806,
013.
313,
315.
218,
960.
913,
216.
246,
580.
59-
46,2
73.3
342
,572
.19
9%22
.66%
25.7
9%
2A
on10
,383
.46
1,34
0.99
9,15
6.22
1,39
4.62
12,5
99.6
21,
072.
9372
6.78
-36
,674
.62
29,6
96.7
423
%17
.96%
17.9
9%
3M
IC G
loba
l18
,117
.22
499.
8778
9.54
2.81
3,27
3.61
870.
624,
557.
130.
6528
,111
.44
25,5
48.6
110
%13
.77%
15.4
7%
4E
agle
Afr
ica
273.
794,
692.
6258
2.74
53.7
74,
342.
3633
7.54
289.
0186
7.57
11,4
39.3
91,
400.
1771
7%5.
60%
0.85
%
5Im
pex
1,53
4.17
320.
324,
349.
3158
5.02
124.
8713
3.17
125.
804,
050.
2911
,222
.94
8,94
1.87
26%
5.50
%5.
42%
6A
stra
1,72
5.73
537.
131,
736.
892,
064.
731,
485.
5124
5.78
127.
401,
329.
879,
253.
027,
946.
0016
%4.
53%
4.81
%
7M
ilmar
811.
5821
6.15
2,58
9.14
347.
271,
617.
63-
18.7
6-
5,60
0.53
5,21
7.43
7%2.
74%
3.16
%
8E
aste
rn1,
091.
5369
0.84
1,21
2.70
207.
911,
121.
221.
2987
9.48
-5,
204.
973,
545.
4647
%2.
55%
2.15
%
9B
.R. P
uri
540.
82-
2,50
8.64
382.
0599
9.37
--
-4,
430.
893,
695.
8020
%2.
17%
2.24
%
10B
usar
a60
1.17
14.2
01,
663.
8149
.26
1,27
6.35
--
-3,
604.
784,
005.
42-1
0%1.
77%
2.43
%
11O
utas
sura
nce
10.7
518
.14
217.
33-
127.
26-
2,40
4.45
2.66
2,78
0.58
1,38
8.97
100%
1.36
%0.
84%
12E
quit
y13
2.71
16.0
51,
837.
537.
2244
0.83
--
-2,
434.
352,
462.
12-1
%1.
19%
1.49
%
13N
dege
193.
5923
.13
1,59
9.88
2.45
501.
47-
78.6
427
.95
2,42
7.10
2,35
7.31
3%1.
19%
1.43
%
14Tr
ans
Afr
ica
120.
8216
5.93
415.
7686
.84
215.
93-
654.
5070
6.48
2,36
6.25
2,03
3.07
16%
1.16
%1.
23%
15D
oubl
e ‘N
’63
3.19
65.1
361
3.44
24.0
947
7.96
229.
71-
-2,
043.
52-
n/a
1.00
%0.
00%
16M
inet
262.
504.
6090
0.89
224.
3343
7.46
--
44.7
61,
874.
5457
7.38
225%
0.92
%0.
35%
17Lu
mum
ba95
.61
6.82
1,34
8.89
31.9
245
.59
--
214.
371,
743.
201,
526.
3514
%0.
85%
0.92
%
18O
rbit
477.
9310
4.30
671.
6728
.26
70.3
3-
-22
6.05
1,57
8.53
1,53
1.65
3%0.
77%
0.93
%
19F&
P53
.27
9.88
642.
560.
4363
0.84
9.69
175.
36-
1,52
2.03
1,64
0.52
-7%
0.75
%0.
99%
20C
orpo
rate
151.
474.
591,
121.
839.
0312
1.46
--
73.5
41,
481.
921,
337.
9611
%0.
73%
0.81
%
21Fa
m20
.29
-1,
346.
15-
--
0.19
-1,
366.
6292
7.22
47%
0.67
%0.
56%
TIRA 2011 ANNUAL REPORT.indd Sec2:131TIRA 2011 ANNUAL REPORT.indd Sec2:131 1/18/13 9:48:07 AM1/18/13 9:48:07 AM

132
ANNUAL INSURANCE MARKET PERFORMANCE REPORT For The Year Ended 31st December 2011
TA
BL
E 8
A: G
EN
ER
AL
IN
SUR
AN
CE
BU
SIN
ESS
TH
RO
UG
H B
RO
KE
RS
IN T
AN
ZA
NIA
AS
AT 3
1ST
DE
CE
MB
ER
201
1 (T
ZS
MIL
LIO
N)
…..C
ON
TIN
UE
D
S/N
Nam
e of
Ins
uran
ce B
roke
r (i
n sh
ort
form
)
Gro
ss P
rem
ium
s W
ritt
en b
y C
lass
of
Bus
ines
s in
TZ
S M
illio
n 20
11
T
OT
AL
2010
TO
TA
L
% I
NC
R./
(
DE
CR
)
% S
HA
RE
OF
MA
RK
ET
Fire
Eng
M
otor
Mar
ine
Acc
iden
t A
viat
ion
Hea
lth
Oth
er.g
20
1120
10
22Ta
n M
anag
emen
t18
7.86
0.42
844.
173.
9622
8.74
--
100.
011,
365.
161,
113.
6023
%0.
67%
0.67
%
23Li
aiso
n30
.40
-26
9.92
36.7
457
.62
-79
0.88
162.
571,
348.
121,
179.
4814
%0.
66%
0.71
%
24Pa
n O
cean
ic74
.06
1.21
1,02
8.09
119.
2918
.24
--
99.1
71,
340.
051,
780.
02-2
5%0.
66%
1.08
%
25Pr
ide
20.3
229
8.77
611.
88-
114.
87-
33.2
454
.90
1,13
3.98
411.
0017
6%0.
56%
0.25
%
26St
ar94
.34
-52
7.08
97.0
639
9.13
--
0.14
1,11
7.76
922.
3021
%0.
55%
0.56
%
27R
egal
9.54
-47
.31
--
-1,
015.
820.
071,
072.
7340
.99
2517
%0.
53%
0.02
%
28Sw
iss
care
2.85
445.
1043
2.56
58.6
863
.58
-1.
621.
991,
006.
3884
5.11
19%
0.49
%0.
51%
29Sa
mpa
t31
.45
16.2
857
9.25
93.6
814
3.48
-44
.20
-90
8.34
615.
7748
%0.
44%
0.37
%
30Pa
cifi c
17.5
2-
272.
5614
.43
359.
83-
142.
838.
5181
5.69
1,36
5.24
-40%
0.40
%0.
83%
31A
R-L
inka
ge74
.13
25.7
914
3.22
30.0
065
.92
-46
5.34
0.41
804.
8174
6.68
8%0.
39%
0.45
%
32R
eos
29.9
3-
385.
131.
5011
.25
--
274.
3970
2.20
543.
7629
%0.
34%
0.33
%
33M
acre
e25
.89
-51
8.52
1.50
27.2
0-
--
573.
1032
0.71
79%
0.28
%0.
19%
34Fo
rtis
55.4
71.
4944
8.13
2.96
43.2
9-
0.48
14.0
856
5.90
523.
768%
0.28
%0.
32%
35JJ
P10
.41
181.
8634
1.38
1.08
16.7
8-
--
551.
5115
1.14
265%
0.27
%0.
09%
36T
horn
37.5
212
.55
377.
57-
26.6
829
.51
-49
.75
533.
5833
1.03
61%
0.26
%0.
20%
37A
ste
7.74
-47
4.30
8.56
5.03
--
6.20
501.
8242
0.54
19%
0.25
%0.
25%
38Fo
rem
ost
109.
2483
.24
242.
6966
.31
--
--
501.
48-
n/a
0.25
%0.
00%
39N
danu
10.3
4-
453.
59-
8.76
1.16
--
473.
8511
9.07
298%
0.23
%0.
07%
40A
IS39
.35
-35
9.21
-48
.77
-24
.94
-47
2.28
487.
65-3
%0.
23%
0.30
%
41E
ndev
our
39.1
34.
2338
8.47
-35
.73
--
-46
7.55
246.
7889
%0.
23%
0.15
%
42In
tert
rade
54.7
812
.16
333.
70-
10.8
215
.97
1.60
24.5
145
3.54
311.
9745
%0.
22%
0.19
%
TIRA 2011 ANNUAL REPORT.indd Sec2:132TIRA 2011 ANNUAL REPORT.indd Sec2:132 1/18/13 9:48:07 AM1/18/13 9:48:07 AM

133
ANNUAL INSURANCE MARKET PERFORMANCE REPORT For The Year Ended 31st December 2011
TA
BL
E 8
A: G
EN
ER
AL
IN
SUR
AN
CE
BU
SIN
ESS
TH
RO
UG
H B
RO
KE
RS
IN T
AN
ZA
NIA
AS
AT 3
1ST
DE
CE
MB
ER
201
1 (T
ZS
MIL
LIO
N)
……
..CO
NT
INU
ED
S/N
Nam
e of
In
sura
nce
Bro
ker
(in
shor
t fo
rm)
Gro
ss P
rem
ium
s W
ritt
en b
y C
lass
of
Bus
ines
s in
TZ
S M
illio
n 20
11
TO
TA
L20
10
T
OT
AL
%
IN
CR
./
( D
EC
R)
% S
HA
RE
OF
MA
RK
ET
Fire
Eng
M
otor
Mar
ine
Acc
iden
t A
viat
ion
Hea
lth
Oth
er.g
20
1120
10
43N
ahir
--
380.
71-
--
--
380.
7168
0.71
-44%
0.19
%0.
41%
44K
ibo
22.1
71.
8626
3.20
-3.
04-
-4.
6529
4.92
387.
15-2
4%0.
14%
0.23
%
45H
arm
ony
5.42
3.45
231.
29-
1.82
--
41.2
928
3.27
137.
9610
5%0.
14%
0.08
%
46Pr
ize
178.
91-
98.0
6-
--
--
276.
9747
9.59
-42%
0.14
%0.
29%
47M
icro
insu
ranc
e62
.86
--
-18
8.25
--
10.7
526
1.87
37.4
959
8%0.
13%
0.02
%
48M
awen
zi12
.52
-23
0.17
-4.
97-
--
247.
6625
4.48
-3%
0.12
%0.
15%
49FB
N36
.05
29.8
011
9.57
-29
.50
--
4.54
219.
47-
n/a
0.11
%0.
00%
50G
ati
61.1
3-
149.
21-
--
-8.
7821
9.12
204.
607%
0.11
%0.
12%
51A
BB
L32
.67
-14
9.38
--
--
-18
2.05
29.0
952
6%0.
09%
0.02
%
52B
AM
9.81
-13
6.72
-0.
15-
--
146.
6875
.73
94%
0.07
%0.
05%
53M
air
and
Youn
g16
.04
-10
1.93
-3.
10-
-8.
5812
9.64
124.
674%
0.06
%0.
08%
54A
rist
ocra
ts51
.77
-15
.68
19.8
139
.37
--
-12
6.63
77.6
863
%0.
06%
0.05
%
55R
ova
4.95
-10
5.19
-2.
28-
--
112.
4283
.36
35%
0.06
%0.
05%
56C
itiz
en-
-11
2.21
--
--
-11
2.21
-n/
a0.
05%
0.00
%
57LK
J2.
351.
1586
.06
-2.
39-
-14
.28
106.
2311
4.12
-7%
0.05
%0.
07%
58K
iwar
ai-
-88
.01
--
--
-88
.01
51.0
073
%0.
04%
0.03
%
59Ph
ares
7.03
-72
.26
-1.
85-
-5.
8787
.02
35.8
314
3%0.
04%
0.02
%
60Si
lver
--
74.2
91.
50-
--
2.09
77.8
813
5.16
-42%
0.04
%0.
08%
61B
riti
sh32
.86
-44
.61
--
--
-77
.47
-n/
a0.
04%
0.00
%
62V
inta
ge*
5.83
-63
.46
--
-3.
49-
72.7
8-
n/a
0.04
%0.
00%
63C
osm
os-
-69
.01
-1.
93-
-1.
0071
.94
89.5
6-2
0%0.
04%
0.05
%
TIRA 2011 ANNUAL REPORT.indd Sec2:133TIRA 2011 ANNUAL REPORT.indd Sec2:133 1/18/13 9:48:08 AM1/18/13 9:48:08 AM

134
ANNUAL INSURANCE MARKET PERFORMANCE REPORT For The Year Ended 31st December 2011
TA
BL
E 8
A: G
EN
ER
AL
IN
SUR
AN
CE
BU
SIN
ESS
TH
RO
UG
H B
RO
KE
RS
IN T
AN
ZA
NIA
AS
AT 3
1ST
DE
CE
MB
ER
201
1 (T
ZS
MIL
LIO
N)…
……
CO
NT
INU
ED
S/N
Nam
e of
In
sura
nce
Bro
ker
(in
shor
t fo
rm)
Gro
ss P
rem
ium
s W
ritt
en b
y C
lass
of
Bus
ines
s in
TZ
S M
illio
n 20
11
T
OT
AL
2010
T
OT
AL
%
IN
CR
./ (
D
EC
R)
% S
HA
RE
OF
MA
RK
ET
Fire
Eng
M
otor
Mar
ine
Acc
iden
t A
viat
ion
Hea
lth
Oth
er.g
20
1120
10
64U
nite
d A
fric
a*0.
61-
41.1
7-
0.46
-13
.86
11.6
667
.77
-n/
a�����
�����
65LF
*1.
98-
51.7
0-
--
-12
.33
66.0
1-
n/a
�����
�����
66M
ayo*
0.05
0.10
35.1
8-
--
-15
.49
50.8
3-
n/a
�����
�����
67A
llder
s4.
3230
.00
9.24
-6.
08-
1.09
-50
.73
91.1
2n/
a�����
�����
68W
omi
0.39
-39
.46
--
--
-39
.85
33.8
518
%�����
�����
69Tr
ust
--
39.0
0-
--
--
39.0
015
.19
157%
�����
�����
70M
illen
ium
--
33.4
2-
--
--
33.4
212
6.19
-74%
�����
�����
71G
wem
a0.
25-
18.0
1-
9.14
--
-27
.40
46.4
9-4
1%�����
�����
72Fu
turi
sts*
1.50
-6.
65-
--
-13
.65
21.8
0-
n/a
�����
�����
73K
irum
i1.
54-
14.5
8-
0.58
--
-16
.71
17.2
0-3
%�����
�����
74Sm
artje
t0.
23-
16.0
6-
--
--
16.2
812
.15
34%
�����
�����
75M
atun
da-
-15
.11
--
--
-15
.11
-n/
a�����
�����
76G
HM
*0.
81-
12.8
7-
--
--
13.6
8-
n/a
�����
�����
77C
rest
0.36
-0.
62-
-0.
05-
-1.
03-
n/a
�����
�����
78A
tlas
--
--
--
--
-64
9.98
n/a
�����
����
79C
hom
bo-
--
--
--
--
14.7
5n/
a�����
�����
80V
enus
--
--
--
--
-27
0.53
n/a
�����
�����
T
OT
AL
55,9
17.5
410
,897
.93
53,3
21.0
49,
374.
2840
,851
.23
6,16
3.65
19,1
57.4
58,
495.
8620
4,17
8.97
165,
104.
4424
%�������
�������
TIRA 2011 ANNUAL REPORT.indd Sec2:134TIRA 2011 ANNUAL REPORT.indd Sec2:134 1/18/13 9:48:08 AM1/18/13 9:48:08 AM

135
ANNUAL INSURANCE MARKET PERFORMANCE REPORT For The Year Ended 31st December 2011
TA
BL
E 8
B: L
ON
G T
ER
M B
USI
NE
SS B
RO
KE
RS
IN T
AN
ZA
NIA
AS
AT 3
1ST
DE
CE
MB
ER
201
1 (T
ZS
MIL
LIO
N)
S/N
Nam
e of
Ins
uran
ce B
roke
r
(in
shor
t fo
rm)
Gro
ss P
rem
ium
Wri
tten
by
Cla
ss o
f B
usin
ess
2011
2010
% I
NC
R./
%
SH
AR
E O
F M
AR
KE
T
Ind
ivid
ual L
ife
G
roup
Lif
e O
ther
Lif
e
TO
TA
L
TO
TA
L
(D
EC
R.)
20
1120
10
1 A
lexa
nder
For
bes
- 2,
993.
09
- 2,
993.
09
2,70
2.04
11
%28
.88
23.7
8
2 B
usar
a
-
1,55
5.09
-
1,55
5.09
1,
319.
19
18%
15.0
011
.61
3 A
on
- 1,
503.
75
- 1,
503.
75
1,35
0.08
11
%14
.51
11.8
8
4 P
acifi
c
-
1,27
6.16
-
1,27
6.16
1
51.9
5 74
0%12
.31
1.34
5 F
&P
- 12
2.03
96
7.92
1,
089.
96
964
.07
13%
10.5
28.
48
6 I
nter
trad
e E
xpre
ss
67.
30
760.
04
- 82
7.34
4,
309.
89
-81%
7.98
37.9
3
7 M
icro
Ens
ure
Tanz
ania
Lim
ited
-
779.
69
- 77
9.69
2
22.9
2 25
0%7.
521.
96
8 L
iais
on
- 81
.85
- 81
.85
114
.92
-29%
0.79
1.01
9 E
agle
Afr
ica
- 33
.58
- 33
.58
7.68
33
7%0.
320.
07
10 A
stra
-
- 32
.81
32.8
1
81.
12
-60%
0.32
0.71
11 T
rans
Afr
ica
insu
ranc
e br
oker
s
2
6.11
-
5.60
31
.71
1
9.59
62
%0.
310.
17
12 S
wis
s C
are
- 30
.78
- 30
.78
3
8.24
-2
0%0.
300.
34
13 S
ilver
2
5.00
-
- 25
.00
4
5.00
-4
4%0.
240.
40
14 N
dege
-
24.8
3 -
24.8
3
-
n/
a0.
240.
00
15 M
IC G
loba
l
-
21.4
0 -
21.4
0
-
n/
a0.
210.
00
16 A
R-L
inka
ge
- 19
.83
- 19
.83
1.85
97
2%0.
190.
02
17 E
ndea
vour
-
- 12
.92
12.9
2
7.
57
71%
0.12
0.07
18 C
osm
os
- 10
.31
- 10
.31
6.03
71
%0.
100.
05
19 R
ova
Serv
ices
9.1
6
-
- 9.
16
1
2.95
-2
9%0.
090.
11
20 S
ampa
t
-
2.87
-
2.87
4.
51
-36%
0.03
0.04
21 O
utas
sura
nce
- 1.
94
- 1.
94
2.48
-2
2%0.
020.
02
22 V
inta
ge
1
.24
- -
1.24
-
n/
a0.
010.
00
T
OT
AL
12
8.80
9,
217.
24
1,01
9.26
10
,365
.30
1
1,36
2.09
-9
%10
0.00
100.
00
TIRA 2011 ANNUAL REPORT.indd Sec2:135TIRA 2011 ANNUAL REPORT.indd Sec2:135 1/18/13 9:48:08 AM1/18/13 9:48:08 AM

136
ANNUAL INSURANCE MARKET PERFORMANCE REPORT For The Year Ended 31st December 2011
Not
e1: F
ire
busi
ness
indi
cate
d he
re fo
r th
e pe
riod
200
2-20
06 in
clud
es E
ngin
eeri
ng.
Not
e2: A
ccid
ent b
usin
ess
indi
cate
d he
re fo
r th
e pe
riod
200
2-20
08 in
clud
es H
ealth
and
Oth
er G
ener
al
TIRA 2011 ANNUAL REPORT.indd Sec2:136TIRA 2011 ANNUAL REPORT.indd Sec2:136 1/18/13 9:48:08 AM1/18/13 9:48:08 AM

137
ANNUAL INSURANCE MARKET PERFORMANCE REPORT For The Year Ended 31st December 2011
TIRA 2011 ANNUAL REPORT.indd Sec2:137TIRA 2011 ANNUAL REPORT.indd Sec2:137 1/18/13 9:48:10 AM1/18/13 9:48:10 AM

138
ANNUAL INSURANCE MARKET PERFORMANCE REPORT For The Year Ended 31st December 2011
Not
e1: F
ire
busi
ness
indi
cate
d he
re fo
r th
e pe
riod
200
2-20
06 in
clud
es E
ngin
eeri
ng.
Not
e2: A
ccid
ent b
usin
ess
indi
cate
d he
re fo
r th
e pe
riod
200
2-20
08 in
clud
es H
ealth
and
Oth
er G
ener
al
TIRA 2011 ANNUAL REPORT.indd Sec2:138TIRA 2011 ANNUAL REPORT.indd Sec2:138 1/18/13 9:48:11 AM1/18/13 9:48:11 AM

139
ANNUAL INSURANCE MARKET PERFORMANCE REPORT For The Year Ended 31st December 2011
TIRA 2011 ANNUAL REPORT.indd Sec2:139TIRA 2011 ANNUAL REPORT.indd Sec2:139 1/18/13 9:48:13 AM1/18/13 9:48:13 AM

140
ANNUAL INSURANCE MARKET PERFORMANCE REPORT For The Year Ended 31st December 2011
TIRA 2011 ANNUAL REPORT.indd Sec2:140TIRA 2011 ANNUAL REPORT.indd Sec2:140 1/18/13 9:48:14 AM1/18/13 9:48:14 AM

141
ANNUAL INSURANCE MARKET PERFORMANCE REPORT For The Year Ended 31st December 2011
TIRA 2011 ANNUAL REPORT.indd Sec2:141TIRA 2011 ANNUAL REPORT.indd Sec2:141 1/18/13 9:48:15 AM1/18/13 9:48:15 AM

142
ANNUAL INSURANCE MARKET PERFORMANCE REPORT For The Year Ended 31st December 2011
TIRA 2011 ANNUAL REPORT.indd Sec2:142TIRA 2011 ANNUAL REPORT.indd Sec2:142 1/18/13 9:48:18 AM1/18/13 9:48:18 AM

143
ANNUAL INSURANCE MARKET PERFORMANCE REPORT For The Year Ended 31st December 2011
TIRA 2011 ANNUAL REPORT.indd Sec2:143TIRA 2011 ANNUAL REPORT.indd Sec2:143 1/18/13 9:48:21 AM1/18/13 9:48:21 AM

144
ANNUAL INSURANCE MARKET PERFORMANCE REPORT For The Year Ended 31st December 2011
TIRA 2011 ANNUAL REPORT.indd Sec2:144TIRA 2011 ANNUAL REPORT.indd Sec2:144 1/18/13 9:48:21 AM1/18/13 9:48:21 AM

145
ANNUAL INSURANCE MARKET PERFORMANCE REPORT For The Year Ended 31st December 2011
TIRA 2011 ANNUAL REPORT.indd Sec2:145TIRA 2011 ANNUAL REPORT.indd Sec2:145 1/18/13 9:48:22 AM1/18/13 9:48:22 AM
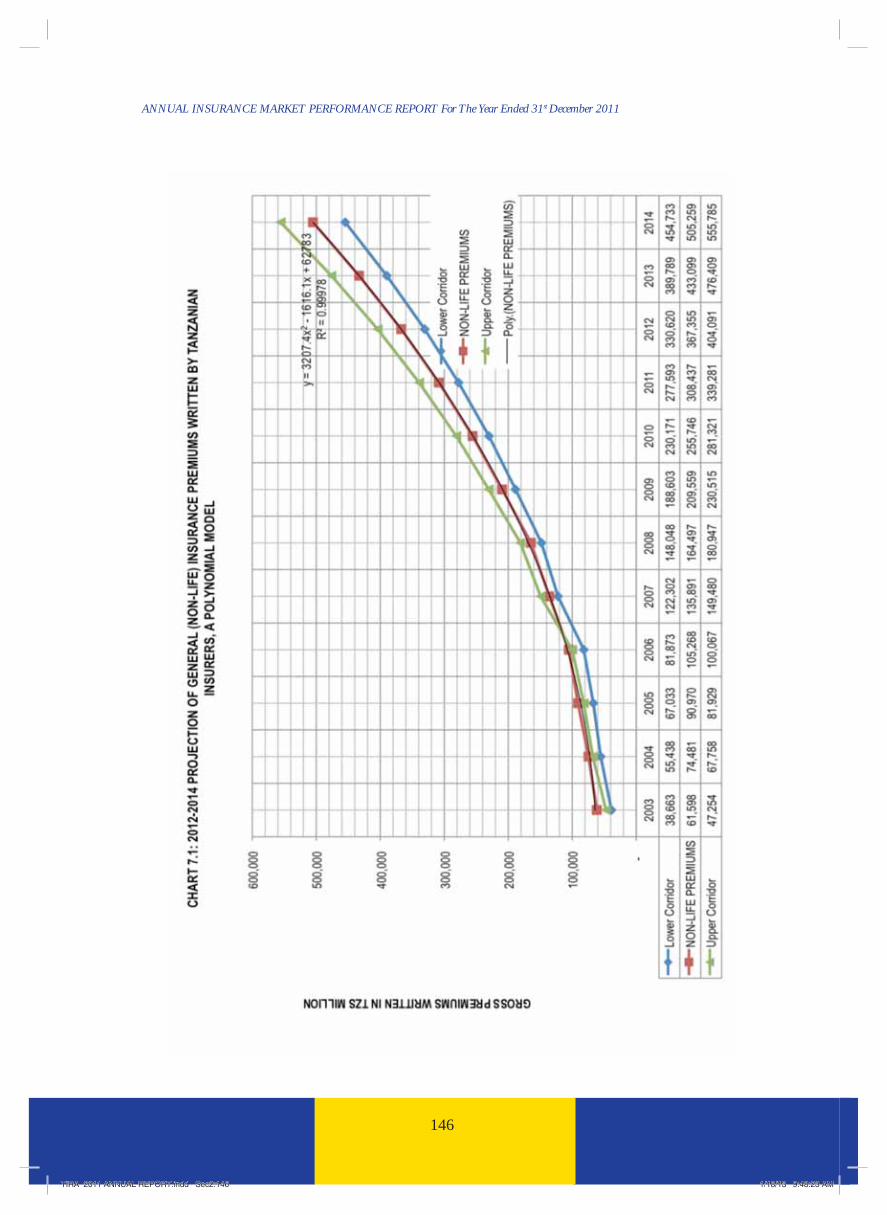
146
ANNUAL INSURANCE MARKET PERFORMANCE REPORT For The Year Ended 31st December 2011
TIRA 2011 ANNUAL REPORT.indd Sec2:146TIRA 2011 ANNUAL REPORT.indd Sec2:146 1/18/13 9:48:23 AM1/18/13 9:48:23 AM

147
ANNUAL INSURANCE MARKET PERFORMANCE REPORT For The Year Ended 31st December 2011
TIRA 2011 ANNUAL REPORT.indd Sec2:147TIRA 2011 ANNUAL REPORT.indd Sec2:147 1/18/13 9:48:24 AM1/18/13 9:48:24 AM

148
ANNUAL INSURANCE MARKET PERFORMANCE REPORT For The Year Ended 31st December 2011
TIRA 2011 ANNUAL REPORT.indd Sec2:148TIRA 2011 ANNUAL REPORT.indd Sec2:148 1/18/13 9:48:25 AM1/18/13 9:48:25 AM

149
ANNUAL INSURANCE MARKET PERFORMANCE REPORT For The Year Ended 31st December 2011
Mr Elia KajibaPrincipal Insurance Offi cer
Mr Hillard MaskiniSenior Insurance
Supervisory Analyst
Mr Joel MwanzaPrincipal Internal Auditor
Mr Salum YungwaSenior Insurance Offi cer
Mr. Edward WamburaSenior Human Resources &
Administrative Offi cer
Mr Egnace MikindoPrincipal Accountant
Mr Aron MlakiSenior Computer Systems
Analyst
Mrs Consolata GaboneSenior Insurance Supervisory
Analyst
Ms Neema LutulaPrincipal Actuarial Offi cer
Mr Rajab GwotaSenior Insurance
Supervisory Analyst
Ms Stella RutaguzaSenior Insurance Offi cer
Mr Mohamed AmeirSenior Insurance Supervisory
Analyst
Mr Haji MakameSenior Human Resources and
Administrative Offi cer
Ms Margareth MngumiPrincipal Legal Offi cer
Mr Ignas NjauSenior Procurement Offi cer
TIRA Staff Members
Ms Aliadina BagumaSenior Accountant
TIRA 2011 ANNUAL REPORT.indd Sec2:149TIRA 2011 ANNUAL REPORT.indd Sec2:149 1/18/13 9:48:26 AM1/18/13 9:48:26 AM

150
ANNUAL INSURANCE MARKET PERFORMANCE REPORT For The Year Ended 31st December 2011
Mr Eliezer RweikizaSenior Public Relations
Offi cer
Ms Anna AbayoLegal Offi cer
Ms Saida AhmedPersonal Secretary
Ms Mary MatthewPrincipal Offi ce Assistant
Mr Hassan AmourPrincipal Driver
Mr Oswald SamkiHuman Resources and Administrative Offi cer
Ms Gloria SindanoInsurance Offi cer
Mr Edda AllyPrincipal Driver
Ms Stella GamaAccounts Offi cer
Ms Mgeni AllyManagement Executive
Assistant
Ms Catherine ShenyagwaReceptionist cum
Telephone Operator
Miss Valeria RwegoshoraOffi ce Assistant
Mr Dominic GoyaiDriver
Mr Athuman KabandaAccounts Offi cer
Mr Revocatus KasesaProcurement Offi cer
Ms Hadija MollelManagement Executive
Assistant
Miss Amina JumaSenior Offi ce Assistant
Mr Soud SadiqDriver
Mr Sharif HamadInsurance Offi cer
Ms Sigfrida ZakariaManagement Executive
Assistant
TIRA Staff Members
TIRA 2011 ANNUAL REPORT.indd Sec2:150TIRA 2011 ANNUAL REPORT.indd Sec2:150 1/18/13 9:48:36 AM1/18/13 9:48:36 AM

151
ANNUAL INSURANCE MARKET PERFORMANCE REPORT For The Year Ended 31st December 2011
TIRA 2011 ANNUAL REPORT.indd Sec2:151TIRA 2011 ANNUAL REPORT.indd Sec2:151 1/18/13 9:48:45 AM1/18/13 9:48:45 AM