Embed Size (px)
Citation preview
1
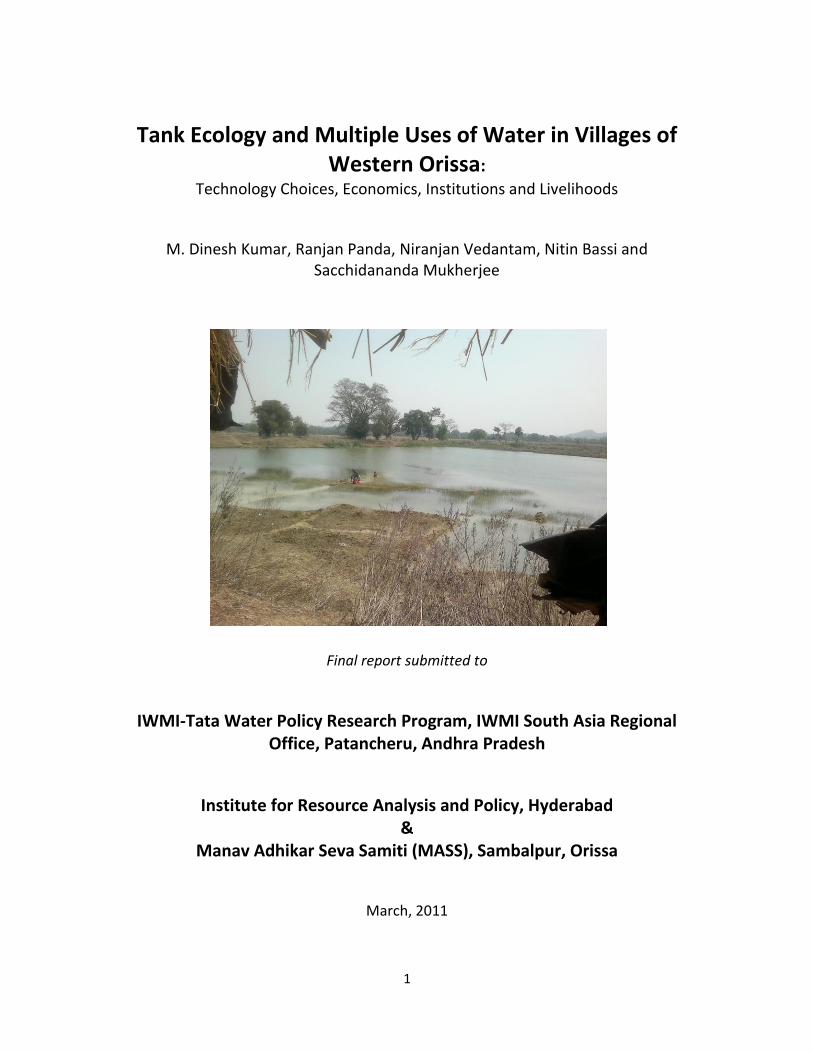
Tank Ecology and Multiple Uses of Water in Villages of Western Orissa:
Technology Choices, Economics, Institutions and Livelihoods
M. Dinesh Kumar, Ranjan Panda, Niranjan Vedantam, Nitin Bassi and Sacchidananda Mukherjee
Final report submitted to
IWMI-Tata Water Policy Research Program, IWMI South Asia Regional Office, Patancheru, Andhra Pradesh
Institute for Resource Analysis and Policy, Hyderabad &
Manav Adhikar Seva Samiti (MASS), Sambalpur, Orissa
March, 2011
2
Tank Ecology and Multiple Uses of Water in Villages of Western Orissa: Technology Choices, Economics, Institutions and Livelihoods
M. Dinesh Kumar, Ranjan Panda, Niranjan Vedantam, Nitin Bassi and Sacchidananda Mukherjee
1. Introduction
The eastern India has the largest concentration of population, also houses largest
number of world’s poor. It suffers not only from economic scarcity of water, but also small holdings, and high degree of land fragmentation (Kumar et al., 2009). Owing to poor rural electrification, well owners in the region use diesel engines for water abstraction and spend large sums for irrigation, whereas the non-well owning farmers buy irrigation water at exorbitant prices. Landlessness is also a major problem. The region’s rural economy is purely agrarian with paddy as the main crop. But, its agriculture suffers from low productivity, owing to low level of adoption of agricultural technologies, high cost of irrigation water, social and ecological problems and poor rural infrastructure.
The region’s landscape is dotted by numerous surface water bodies, which are under the common property regime and governed by the Panchayats as minor irrigation tanks. Government agencies recognize and also operate minor irrigation systems as single use systems. However, these tanks are also used for fishing, as a source of water for domestic needs and nutrient rich soils, fodder grass collection and brick making. These uses have high value in terms of household income, nutrition and health for the poorest of the poor. Owing to this lack of recognition, water from MI tanks gets diverted for irrigating low valued crops.
Recent field based research by Indian Council of Agricultural Research in Bihar and Orissa show that well-designed multiple use systems can enhance the productivity of use of both land and water in eastern India remarkably (Sikka, 2009). This involved integrating fisheries, prawn farming and duck-keeping with paddy irrigation using local secondary reservoirs for the water. Whereas research in South India shows how the revenue maximization can be possible by using the irrigation tanks for multiple uses such as social forestry, brick making, fisheries, silt collection and groundwater recharge (Palanisami et al., 2010).
2. Status of Water Resources in Orissa
The state of Orissa receives an average annual rainfall of about 1,482mm. About 78 per cent of the total annual rainfall occurs during the period from June to September. The rainfall exhibits high spatial variation, ranging from about 1200 mm in southern coastal plain to about 1700 mm in northern plateau. Of the total received annual precipitation of 230.76 billion cubic metres (BCM) in the state, only 47% is utilizable from both surface and groundwater resources.
The average annual availability of surface water from the 11 river basins in the state was estimated to be 120.40 BCM. Out of this, the yield from its own drainage boundary is 82.84 BCM and inflow from neighbouring states is 37.56 BCM. Because of the topographical constraints only 75% of the total available surface water is utilizable. It is projected that by the year 2051 the inflow of surface water from neighbouring states will further be reduced from 37.556 BCM

3
to 25.272 BCM (Source: State Water Plan, Orissa). The net annual ground water availability in the state is 21.011 BCM (CGWB, 2006), out of which only 60% (i.e., 12.61 BCM) is considered safe and usable. As per the official estimates, the annual groundwater draft is only 3.85 BCM (stage of ground water development is 18%), which means there is ample scope for development of dynamic groundwater resources in the State. But, this is far from the reality as there is widespread failure of wells in the state as a result of groundwater depletion (Singh and Kumar, 2008). If we believe that the figures of recharge and abstraction are reliable, this can happen when the groundwater outflows into streams and rivers, which does not get captured in the official estimates, are quite large.
In 2001, the average annual per-capita water availability (both surface and ground) in the state was around 3,359m3, which is expected to reduce to 2,218m3 by the year 2051 with the projected population growth. The water requirement for various uses is expected to increase from 54.99 BCM in 2001 to 84.46 BCM in 2051, an increase of 54% (Source: DoWR, Annual Report 2008-09). The state has so far developed a storage capacity of around 17 BCM through the completion of 2385 major, medium and minor projects. Of this majority (around 98 %) are minor (flow) projects. The net irrigated area from various sources was around 1.3 million hectares (m. ha) in 2003-04. Of this, irrigation by canals was 0.9 m. ha and irrigation by tanks was around 0.102 m. ha (Source: Indiastat). Hence, at the aggregate level, tanks do not play a major role in the state’s irrigation. 2.1 Tank Irrigation in Orissa
There are traditional tank systems in the western and southern parts of Orissa. Nearly 40% of the total minor irrigation (MI) schemes are also located in this region (ADB 2006). The State has about 28,303 tanks with a potential to irrigate about 0.69 m. ha, which is equivalent to about 1/4th of the total irrigation potential created in the state. Of these, 3847 tanks are relatively large with an irrigation capacity of 5.69lac ha. The large tanks have a command area of between 40 ha and 2000 ha and are managed by the Minor Irrigation Department.
The net irrigated area by tanks in Orissa during 1950–1951 was about 5.46lac ha, which was about 54.22% of the total net irrigated area in the state. From 1956 onwards, the tank irrigated area started declining over time in absolute figures and not in terms of proportion to the total net irrigated area (ADB 2006). However by 2003-04, the net area irrigated by tanks in the state came down to 102,000 ha, which was only 7.7% of the total net area irrigated. The major decline took place during 1999-00 when the net irrigated area by tanks came down to 107,000 ha from 305,000 ha in 1998-99 (Source: Indiastat). This decline was mainly due to the poor maintenance and management of the tank systems. Given this state of affairs, it is important to rejuvenate and rehabilitate these systems which for many centuries supported the livelihoods of millions of people.
3. The Rationale Tanks and ponds have been the primary source of water for poor rural households for domestic use, irrigation and fish production in eastern India, including Orissa. Recent research shows that they are being converted into fish ponds by local communities or Panchayats. Generally, when the agency, which is mandated to manage the system such as the minor irrigation department or the Panchayat, has not designed the infrastructure for multiple uses
4
like as domestic use, fisheries, cattle drinking and irrigation, the system by default becomes a multiple use system. While some of the unplanned uses may get absorbed by the system, other uses can damage it (van Koppen et al., 2009). But, these tanks/ponds are important source of drinking water for poor rural households. Thus these water systems are characterized by competing water needs, and are under severe stress. The poor are kept out of their reach in the process. The main reason is that the governance of these common property tanks is either poor or is totally absent. Even when governance system for tanks and ponds exist at the local level, there is a lack of clarity on the legitimate uses of these tanks; the rights owners; who should manage them and what should be the role of local community in the management. Wherever local management institutions exist, they are either not capable of allocating water from these systems to meet multiple demands, or are not mandated to do so. It is also important to recognize that communities often do not realize the costs of using these tanks for certain purposes. For instance, coir and jute retting increase the BOD of water, thereby rendering them unusable for domestic purpose. Likewise, irrigated agriculture surrounding tanks/ponds increase chances of their eutraphication, thereby affecting fish production, potability of water etc. Hence, their institutions are not adapted to dealing with such challenges.
In the absence of good governance, the rights to water from these tanks are often politically contested. The more politically powerful and socially dominating groups often take control of these systems at the cost of the rights of drinking water users, or sometimes the local fishing community. This leads to their sub-optimal performance from social, environmental and even economic angle. Such actions leave minimum incentives for community members to manage them, leading to further degradation. But, creating institutions for governance alone would not be sufficient to make these water systems efficient and effective multiple use systems. The reason is that the physical condition of these systems is also influenced by “negative externalities” such as annual variations in climate, and even catchment/basin management decisions, which are beyond the “sphere of influence” of local tank institutions. For instance, in dry years, the amount of inflows that a tank receives can be extremely low that it won’t be sufficient to meet even the drinking water supply needs of the local communities in semi arid and arid areas. This can influence water allocation decisions. In this case, the community might use the tank bed for fodder cultivation and grazing during that year. This can deteriorate tank water quality due to eutraphication etc. They factors can weaken the performance of the institutions themselves. Hence, the following steps are required. The first one is improvement in the physical system that can ensure enhanced quality and reliability of the water to meet the basic needs. One such measure is integrating these tanks to large water resources systems like large irrigation schemes that are capable of transferring water to distant local water bodies in years of shortfall. But, the conventional civil engineering approach to tank rehabilitation focuses on creating embankments, constructing waste weirs, de-silting and catchment and channel clearance activities, which does nothing to address the problems of reliability of water supplies and quality of water from these systems. It does not encourage integrated planning and operation of tank systems and other water resource systems within the basin. The second is the institutional innovation that ensures hydrological integrity of the local MUS; management of inter-sectoral water demands; and access to water for the poor. One important feature of this innovation would be coordination of local tank management decisions, and basin-level
5
management decisions for large systems. But, lack of proper quantitative understanding of the costs and benefits associated with multiple uses inhibit public investments for their innovations. The questions that need to be addressed are: How reliable are the multiple use systems for provision of water for basic needs and productive uses? How equitable is the distribution of water from these systems across use sectors and caste/classes? How access equity changes with variations in climate? How optimal is the allocation of water from these systems from economic, social and environmental points of view? What physical system improvements are possible for enhancing the overall performance of these systems from economic, environmental and social points of view? What kind institutional innovations are needed for affecting these changes? What will be the cost of doing these, against the benefits? A systematic scientific research can be undertaken on tanks/ponds to assess the physical system improvements and institutional innovations required for them to perform as MUSs. Western Orissa can be the ideal location for such a study. In this region, the rural landscape is dominated by tanks of various sizes. They form a major source of irrigation for the poor small and marginal farmers of the region lacking financial resources to invest in open wells for exploiting groundwater, the only other source for irrigation. The limited groundwater, which is available in the crystalline formations at a depth of nearly 30-40 feet, can be tapped efficiently only through open wells (GOO, 2007). But, the cost of digging a well is very high1, which the poor farmers in the area cannot afford. Because of this reason, very few farmers in the area have open wells. The most common water abstraction devices are Thendas and diesel engines for lifting water from wells, given the difficulty in obtaining power connections for farms. The use of Thenda requires manual labour and the maximum area irrigated by a family using Thenda is only 0.3-0.40 acre. On the other hand, groundwater abstraction using diesel engine is very costly due to the high cost of diesel. All these factors make tanks very important in the livelihoods of poor farmers for sustaining irrigated agriculture in the area.
In Orissa, the state government in collaboration with Govt. of India and with assistance from the World Bank had initiated a project named Orissa Community Tank Management Project (OCTMP) to rehabilitate 900 MI schemes in 29 districts for stabilizing irrigation in 1.20lac hectares. In order to operationalize the project, the Orissa Community Tank Development and Management Society (OCTDMS) had been institutionalized in Water Resources Department as a special purpose vehicle. Forty per cent the total MI projects are located in the western and
southern part of Orissa. Promoting Multiple Use Systems involving crops, fisheries, livestock and horticulture for enhancing the livelihoods of farmers, landless and fisher-folk is an integral part of the project. 3.1 Physiography, Rainfall and Climate of Sambalpur
Sambalpur district of western Orissa lies between 20° 40’ N and 22° 11’ N latitude, 82°
39’ E and 85° 15’ E longitude with a total area of 6,702 sq. km. The district has three distinctive physiographic units such as, hilly terrain of Bamra and Kuchinda in the north, plateau and ridges of Rairakhol in the south-east and valley and plains of Sambalpur sub-division in the south east. Sambalpur district experiences extreme type of climate with 66 rainy days and 1530mm rainfall on an average in a year. Most of the rainfall is confined to the months from June to October
1 An open well of depth 50 feet and a diameter of 10 feet, would cost around Rs. 70,000-Rs.75000,
including liming with granite stones or bricks.
6
visited by south west monsoon. Mercury rises up to 47° Celsius during May with heat wave and falls as low as 11.8° Celsius during December with extreme cold. The rainfall is highly uneven and erratic.
The dominant soil found in the district is light red coloured laterite, which has high clay content. The soil depth ranges from 0-22cm. The soil belongs to the texture class of sandy clay loam (Sahu and Nanda, undated). They have low infiltration rates when thoroughly wetted (0.17 inch per hour or 3.8mm per hour (Source: Texas Council of Government, 2003), and consist chiefly of soils with a layer that impedes downward movement of water and soils with moderately fine to fine structure.
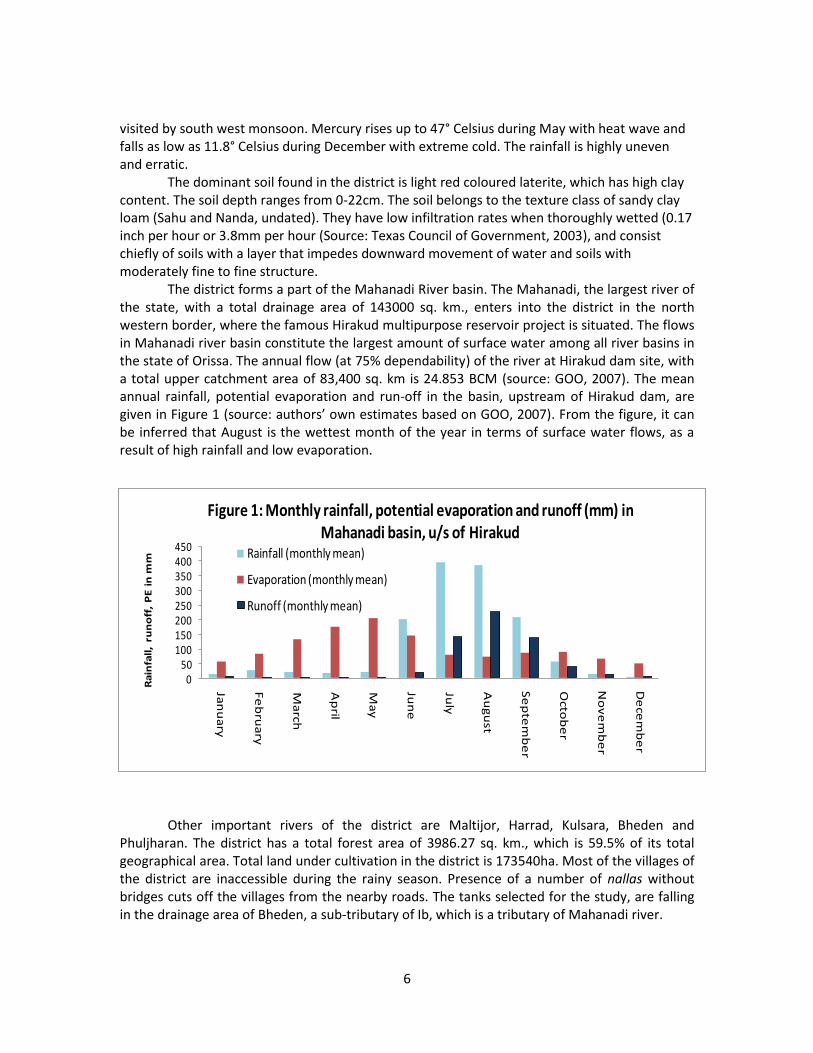
The district forms a part of the Mahanadi River basin. The Mahanadi, the largest river of the state, with a total drainage area of 143000 sq. km., enters into the district in the north western border, where the famous Hirakud multipurpose reservoir project is situated. The flows in Mahanadi river basin constitute the largest amount of surface water among all river basins in the state of Orissa. The annual flow (at 75% dependability) of the river at Hirakud dam site, with a total upper catchment area of 83,400 sq. km is 24.853 BCM (source: GOO, 2007). The mean annual rainfall, potential evaporation and run-off in the basin, upstream of Hirakud dam, are given in Figure 1 (source: authors’ own estimates based on GOO, 2007). From the figure, it can be inferred that August is the wettest month of the year in terms of surface water flows, as a result of high rainfall and low evaporation.
Other important rivers of the district are Maltijor, Harrad, Kulsara, Bheden and
Phuljharan. The district has a total forest area of 3986.27 sq. km., which is 59.5% of its total geographical area. Total land under cultivation in the district is 173540ha. Most of the villages of the district are inaccessible during the rainy season. Presence of a number of nallas without bridges cuts off the villages from the nearby roads. The tanks selected for the study, are falling in the drainage area of Bheden, a sub-tributary of Ib, which is a tributary of Mahanadi river.
050
100150200250300350400450
Jan
ua
ry
Fe
bru
ary
Ma
rch
Ap
ril
Ma
y
Jun
e
July
Au
gu
st
Se
pte
mb
er
Octo
be
r
No
ve
mb
er
De
cem
be
r
Ra
infa
ll,
run
off
, P
E i
n m
m
Figure 1: Monthly rainfall, potential evaporation and runoff (mm) in Mahanadi basin, u/s of Hirakud
Rainfall (monthly mean)
Evaporation (monthly mean)
Runoff (monthly mean)
7
4. Wetland Valuation Making clear distinction between benefits/ values from wetlands and their characteristics is important in wetland valuation. Too often, there seems to be confusion between the benefits/values of wetlands and the characteristics which are indicators of those benefits (Turner et al., 1998). For example, fertility and nutrient characteristics of wetlands would be crucial in providing forestry, fishery and agriculture benefits, but in themselves do not represent benefits (in the anthropocentric sense). Likewise, water rich in micro nutrients in the wetland means there would be lesser requirement of fertilizers when the same water is used for irrigating crops, as compared to using water from another source for irrigation. Likewise, micro nutrients and micro organisms in the reservoir of the wetland could provide feed for fish, reducing the cost of inputs for fish culture. It will be possible to evaluate the economic benefits from these nutrient and micro organisms only if we evaluate the cost of cultivation of the crop irrigated with the wetland water or the fish produced in the wetland, and compare these costs with that of crop irrigated from a conventional source, or fish produced in a fish farm. The incremental net returns in the earlier case would ideally indicate the economic benefits from the micro nutrients or micro nutrients and micro organisms.
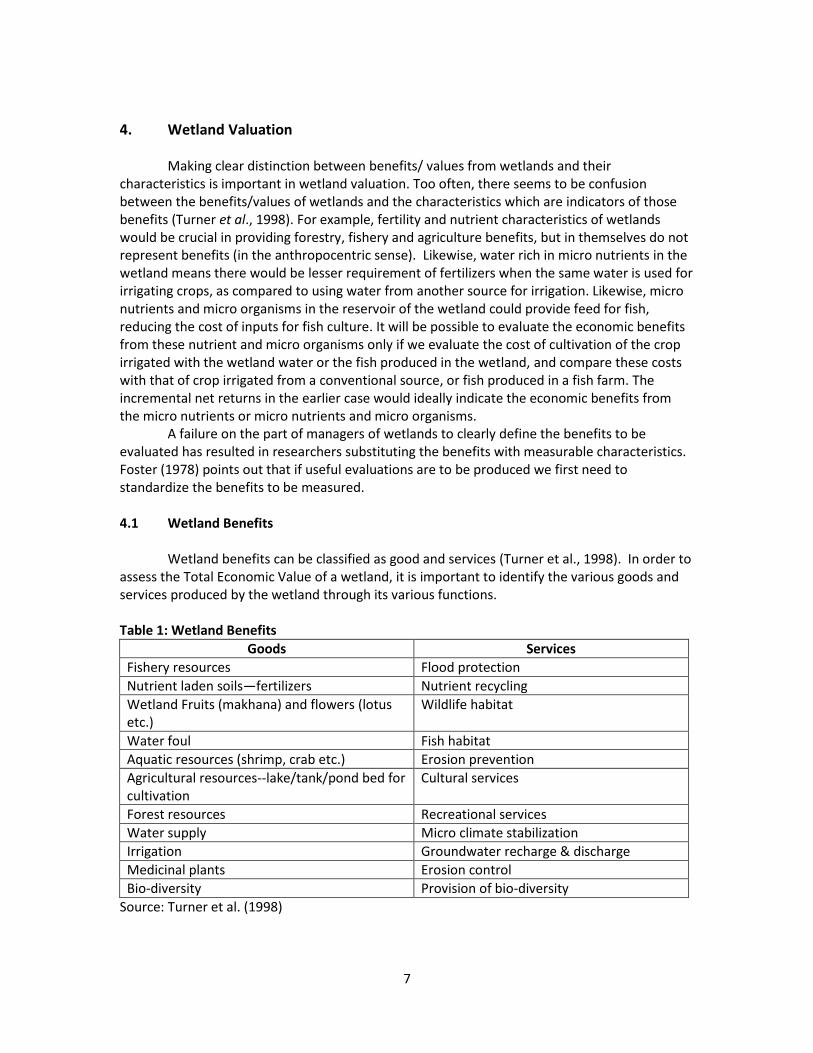
A failure on the part of managers of wetlands to clearly define the benefits to be evaluated has resulted in researchers substituting the benefits with measurable characteristics. Foster (1978) points out that if useful evaluations are to be produced we first need to standardize the benefits to be measured. 4.1 Wetland Benefits Wetland benefits can be classified as good and services (Turner et al., 1998). In order to assess the Total Economic Value of a wetland, it is important to identify the various goods and services produced by the wetland through its various functions. Table 1: Wetland Benefits
Goods Services
Fishery resources Flood protection
Nutrient laden soils—fertilizers Nutrient recycling
Wetland Fruits (makhana) and flowers (lotus etc.)
Wildlife habitat
Water foul Fish habitat
Aquatic resources (shrimp, crab etc.) Erosion prevention
Agricultural resources--lake/tank/pond bed for cultivation
Cultural services
Forest resources Recreational services
Water supply Micro climate stabilization
Irrigation Groundwater recharge & discharge
Medicinal plants Erosion control
Bio-diversity Provision of bio-diversity
Source: Turner et al. (1998)
8
What is important is that some of the above mentioned benefits provide values, through “uses” (both direct and indirect) of goods and services, while some of them provide value through non-uses. Some of the values are generated through direct use of irrigation, water supply, fish catch, collection of fodder, fuel-wood, fruits, nutrient laden soils, recreation, washing & bathing, cultural uses, which are treated as goods; whereas some other values are generated through indirect use of services such as flood protection, micro & macro climate stabilization, soil erosion prevention, groundwater recharge, biodiversity provision. But as Turner et al. (1998) points out, there are strong linkages between some of the goods and services (as Table 1 indicates), and therefore there is a need to ensure against double counting.
Total Economic Value which encompasses these various types of values, is itself regarded as a part of the overall ‘Total Wetland Ecosystem Value’. Recent advances in the development of ecological economic models and theory all seem to stress the importance of the overall system, as against the individual components of that system. These statements point to another dimension of Total Environmental Value, which is the value of the system itself. The economy and the environment are interlinked in a process of co-evolution, with the scale economic activity exerting significant environmental pressure. The dynamics of these systems are characterized by discontinuous change around poorly understood critical threshold values. But under the stress and shock of change, these systems exhibit resilience. This resilience capacity is, however, related more to the overall system configuration and stability properties than it is to the stability of individual resources (Turner et al., 1998). An example is the increasing cultivation of crop in the catchment of tank systems replacing the natural vegetation, which increases the rate of erosion of soil and its deposition in the tank, reducing its water storage capacity, and increases the chances of eutraphication. Here, increased economic activity (i.e., crop cultivation) increases the rate of environmental degradation (soil erosion and eutraphication), thereby impacting on the economic benefits from the tank itself.
Emphasis on a system-wide approach also helps researchers realize the fact that the social value of an ecosystem may not be equivalent to the aggregate private total economic value of that same system’s components; that the system is more than just the aggregation of its individual parts, and it possesses primary value (Gren et al., 1994; Turner, Perrings and Folke, 1997).
4.2 Criteria for Valuation of Wetlands
The outcomes of valuation of wetlands would change with the criteria used. For instance, the values generated from conservation measures would be drastically different from the use values. The reason is conservation of wetlands will be associated with opportunity costs which are the benefits forgone from possible alternative uses of the wetland. On the other hand, going ahead with these alternative activities results in the opportunity costs of foregone benefits that would otherwise be derived from the conserved wetland. If the conservation benefits, once quantified and evaluated, are comparable with the returns derived from alternative uses, it can facilitate improved social decision making in wetland protection versus development conflict situations (Turner et al., 1998). Cost-benefit analysis based on the economic efficiency criterion offers one method to aid decision makers in this context. Here, the economic value of social and environmental costs and benefits shall be included. Sustainability concerns can be introduced as a series of constraints on the cost-benefit analysis and may require the further deployment of multi-criteria decision analysis methods to aid policymakers
9
in policy conflict and goals trade-off situations. The cost-benefit criterion may need to be modified as policy makers introduce, or respond to, concerns other than economic efficiency e.g. equity concerns, employment concerns, and zero-net loss biodiversity conservation concerns.
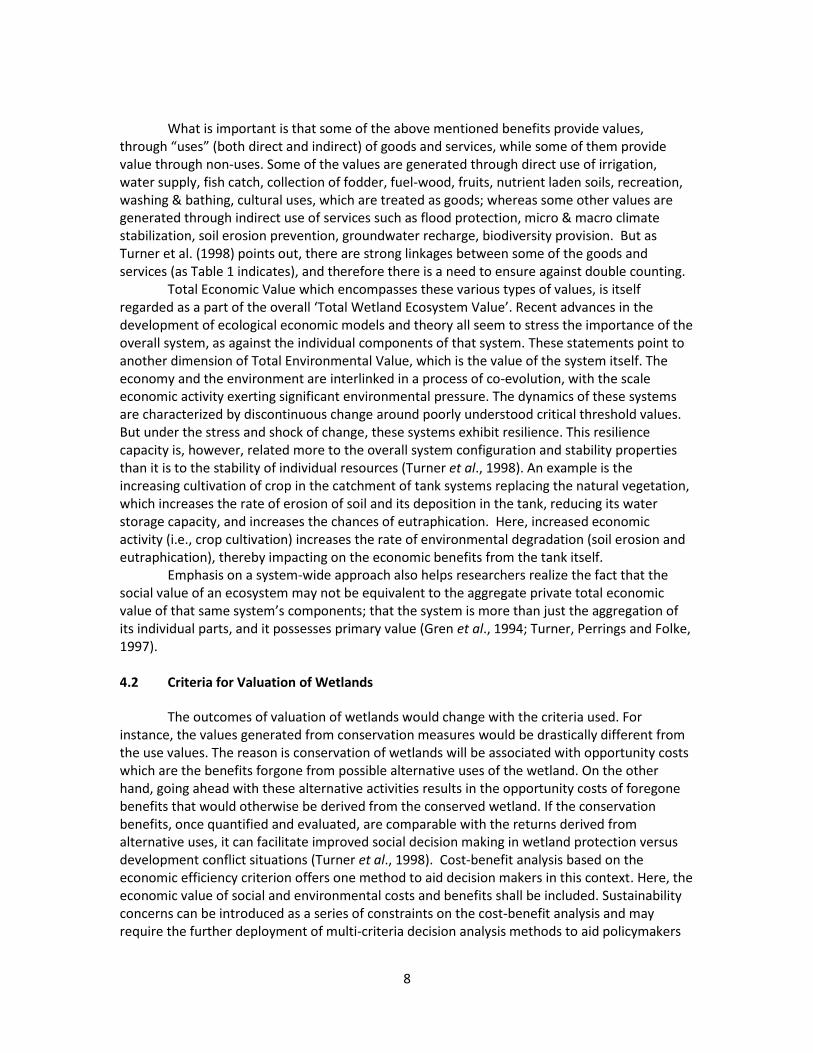
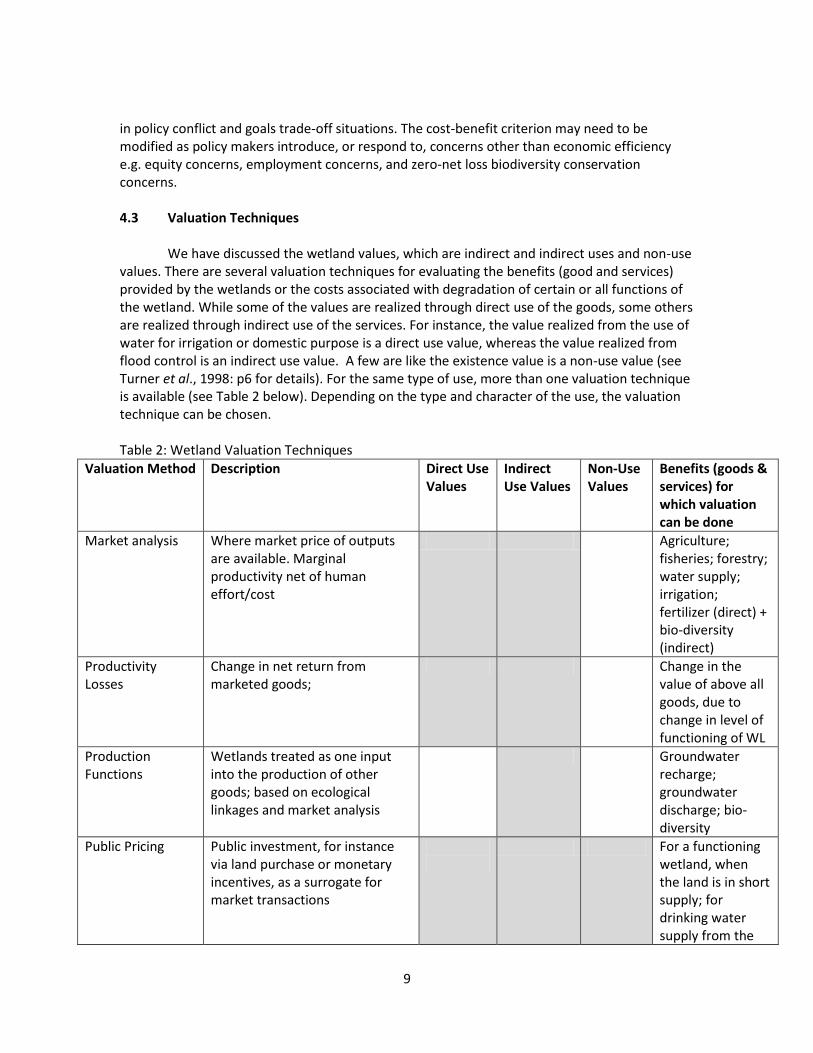
4.3 Valuation Techniques We have discussed the wetland values, which are indirect and indirect uses and non-use values. There are several valuation techniques for evaluating the benefits (good and services) provided by the wetlands or the costs associated with degradation of certain or all functions of the wetland. While some of the values are realized through direct use of the goods, some others are realized through indirect use of the services. For instance, the value realized from the use of water for irrigation or domestic purpose is a direct use value, whereas the value realized from flood control is an indirect use value. A few are like the existence value is a non-use value (see Turner et al., 1998: p6 for details). For the same type of use, more than one valuation technique is available (see Table 2 below). Depending on the type and character of the use, the valuation technique can be chosen. Table 2: Wetland Valuation Techniques
Valuation Method Description Direct Use Values
Indirect Use Values
Non-Use Values
Benefits (goods & services) for which valuation can be done
Market analysis Where market price of outputs are available. Marginal productivity net of human effort/cost
Agriculture; fisheries; forestry; water supply; irrigation; fertilizer (direct) + bio-diversity (indirect)
Productivity Losses
Change in net return from marketed goods;
Change in the value of above all goods, due to change in level of functioning of WL
Production Functions
Wetlands treated as one input into the production of other goods; based on ecological linkages and market analysis
Groundwater recharge; groundwater discharge; bio-diversity
Public Pricing Public investment, for instance via land purchase or monetary incentives, as a surrogate for market transactions
For a functioning wetland, when the land is in short supply; for drinking water supply from the
10
tank
Hedonic Pricing Method
Deriving an implicit price for an environmental good from analysis of goods for which market exist
Recreation; fertilizer; agriculture
Travel Cost Method
Costs incurred in reaching a site as a proxy for the value of recreation
Recreation; bio-diversity
Contingent Valuation Method
Construction of a hypothetical market by direct surveying of a sample of individuals and aggregation for the relevant population
Agriculture; fisheries; forestry; water supply; irrigation; recreation; fertilizer (but currently not used) + wetland as an ecosystem
Damage Costs Avoided
The costs that would be incurred if the wetland functions were not present
Flood control
Defensive Expenditures
Costs incurred in mitigating the effects of reduced environmental quality.
Restoring the wetland water quality for survival of original flora and fauna
Relocation Cost Expenditure involved in relocation of affected agents or facilities
Evaluating the cost of reclaiming the aquifer contaminated by a polluted wetland
Replacement Costs
Potential expenditure incurred in replacing the function that is lost; for instance the use of substitute or “shadow projects”
Water becomes non-potable; or recharge stops; or recreational value is lost
Restoration Cost Costs of returning the degraded wetland to its original state. A total value approach; important ecological temporal and cultural dimensions are captured.
For fully degraded wetland, where all the original functions are fully understood
Source: adapted from Turner et al. (1998)
5. Review of Past Studies on Tanks as Wetlands in India History of modern tank rehabilitation in India is nearly two and a half decades old,
starting with the EEC (European Economic Community) funded tank rehabilitation project which
11
was launched in Tamil Nadu in 1984 (ADB, 2006). This was followed by a series of initiatives from Tamil Nadu and other parts of South India for rehabilitation of tanks and include NABARD Funded Tank Rehabilitation project; World Bank funded Tank Rehabilitation Project; EE Funded Tank Rehabilitation Project in Pondicherry; Orissa Community Tank Management Project (OCTMP); and World Bank Funded Community-Based Tank Rehabilitation Project in Karnataka for JYYS (ADB, 2006: p 16-28). The tank rehabilitation programme is said to have undergone major changes over the years, from a mere focus on agricultural development through irrigation expansion to livelihood improvement and poverty reduction among tank communities, through multiple uses of the tank system comprising tank water, tank bed and tank bunds. Obviously, while the focus in the earlier projects was on land-holding farmers, it has now shifted to landless labourers, fisher-folk and other tank-dependent communities (ADB, 2006: p 34).
ADB (2006) reports about two different types of tank rehabilitation projects. One focuses on agriculture production to benefit mainly the farmers. The other focuses on developing the tank system as a whole and creating livelihood opportunities for different stakeholders, including the landless. Between these two, the latter provides more space and livelihood options to earn a living. 2. In tank rehabilitation work, augmenting tank water and increasing the tank storage has greater impact on the livelihood options of the landless and marginal farmers. The involvement of SHGs in tank rehabilitation and provision of funding for income-generating activities have a marked effect on their livelihood. 4. Since all villagers are members of the TUG, all are benefited in one way or the other. The key outcome of the second type of tank rehabilitation is that these tanks are likely to be more sustainable than those implemented under type one.
Hence, at the theoretical level, there is a greater recognition of the need to involve the larger community of stakeholders such as wage labourers, landless farmers, livestock rearers, fisher-folk in the management planning process for multiple uses (ADB, 2006; Seckwela, 2002). But, at the practical level, there seem to be little understanding of the ways to maximize the benefits that can be accrued from irrigation, and drinking water supplies, fishery production, duck keeping, tank bed cultivation, silt collection and fruit harvesting. While there is clear trade-off between maximizing one type of benefit against the other, the general notion is that capacity enhancement of tanks through de-silting, technical improvements such as construction of waste weir, supply channel improvement and lining of distribution channels would all result in improved water supply, and can ensure multiple benefits, if strong local institutions are created.
The literature on tank rehabilitation hardly mentions about the importance of planning for water allocation for raising the total value of various tank uses. This is extremely important for planning of multiple use and management (Webb, 1997). But, there is over-emphasis on the role of local institutions in improving the efficiency of management of tank systems. One of the reasons for this lack of focus on use planning is the lack of sufficient data on the values that can be produced from the tanks under various possible water allocation scenarios. The resource use benefits and cost can change from year to year and also over time. For instance, in a high rainfall area, the value of tank water for irrigation could be significantly high in a drought year, whereas it could be quite small in a normal year. Planning for use and management of wetland resources should therefore, also be adaptive, responding to such changes, indicating the need to change practices to ensure sustainability (Webb, 1997). The need for such an adaptive strategy is particularly important when we consider the fact that climate and hydrology, which have major influence on the
12
condition of the wetland, (like water spread area, volume of water, the number of days and months for which water remains in the wetland, the nutrient concentration, silt load and the physiochemical processes happening in the wetland) and its ability to perform various functions (supporting aquatic life such as fish, recharging groundwater, flood control etc.), keeps varying. This is particularly important for the semi arid regions of India, which experience extreme variability in rainfall and climate. Hence, the planning of use and management in a multiple use system would be complex. An optimal multiple use and management plan prepared for a tank, which might work wonders for a wet year or a normal year, may not work for a dry year. The water availability situation in a dry year would be too bad that might call for changing the allocation norms entirely, if needs of various users of water, tank bed etc. are to be met. Mukherjee (2008) carried out valuation of a multiple use wetland in West Bengal and found five benefits from the wetland, viz., water for irrigation, water for domestic use (direct consumptive use), jute retting (in-stream use), cultivation in the pond bed (direct use), fisheries (direct use), and ecological services (indirect use of wetland services). But, the study also found that the irrigation benefits far exceeded other benefits. Palanisami et al. (2010) analyzed the changes in economic value of the outputs generated from tank (gross tank product) with the changes in its uses in Tamil Nadu, and found revenue maximization could be possible with tank being used for fishing, brick making, social forestry, tank bed silt collection and groundwater recharge, apart from irrigation. But, there is no analysis examining the changes in values generated by tank resources in their existing uses between typical rainfall years, and how the values could be enhanced through reallocation of tank resources amongst the uses.
6. The Goal and Objectives The goal of the proposed project is to evolve technical and institutional approaches for strengthening the livelihood enhancement and poverty reduction capacity of tanks/ponds in eastern India. The project was undertaken in western Orissa. The main objectives of the research component of this project is to examine: a] how physical factors such as climatic variability influence water allocation priorities of tank users, and its overall performance as a multiple use system; and, b] how far physical systems improvements can increase their multiple user benefits for the poor.
The specific objectives are to: 1. Analyze the various existing demands for water from them for both consumptive and
productive water needs from the individual households and community at large 2. Analyze how various tank uses and degree of equity in access to water change with
drought & floods, and their likely impacts on the livelihoods of the poor 3. Assess the economic value of the various benefits and costs associated with different
tank uses, and how they change in response to climatic variability 4. Analyze the trade-off between maximizing the direct economic outputs, and optimizing
economic, social and environmental benefits, and poverty reduction impacts of MUS systems.
13
5. Assess the physical improvements in the tank system for improving their overall performance as MUSs
6. Identify institutional arrangements for management of tanks as multiple use systems
that ensure sustainable water supplies for the poor, including organizational structures
7. Approach, Methods and Tools 7.1 The Approach First, the total economic value of the wetland in its existing uses was assessed, including the value of the economic, social and environmental benefits from the existing uses (direct & indirect). Then various scenarios for enhancing the direct economic output from the tank were generated (with different degrees of constraint induced from the point of view of social and environmental sustainability) and the value of economic benefits would be compared with and the Total Economic Value of all benefits (social, economic and environmental) produced by the wetland ecosystem under each scenario. This forms an integrated ecological-economic modeling. This model can be characterized by simple theoretical models that aggregate (Costanza et al., 1993). This can provide indications as to what extent the social and environmental values could be compromised for realizing higher economic returns from the use of tanks. Here our basic premise is that there is always a conflict between maximizing the direct economic benefits from the tank uses and meeting the sustainability goals to maintain the social and environmental benefits from the tank ecosystem. For instance, intensive fishery in the tank would reduce make the tank water unusable for drinking purpose due to the use of fish feed and fertilizers. Similarly, allowing animal grazing in the tank bed during dry season would lead to deposition of animal waste and compaction of tank bed reducing rainwater infiltration into the soils and aquifer recharge. Here, it is important that we do not confuse the direct economic benefits from the direct use values. While drinking water supply concerns direct use value, it does not produce direct economic benefit. 7.2 Conceptual Model for Analyzing the Gross Tank Product from Direct Use of Water
from the Tank under Various Scenarios
14
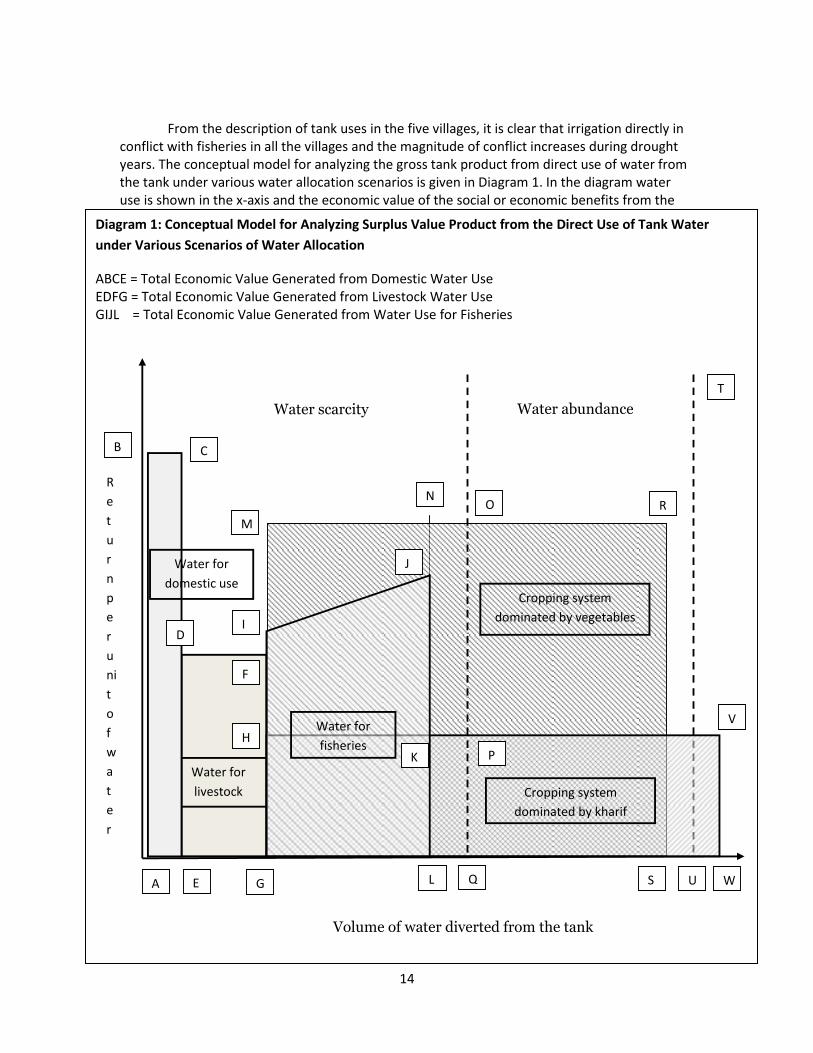
Diagram 1: Conceptual Model for Analyzing Surplus Value Product from the Direct Use of Tank Water
under Various Scenarios of Water Allocation
ABCE = Total Economic Value Generated from Domestic Water Use EDFG = Total Economic Value Generated from Livestock Water Use GIJL = Total Economic Value Generated from Water Use for Fisheries
Water for
livestock
V
U W
Water abundance Water scarcity
B C
D
A E
F
G
I
H
J
M
S L
T
R O
Q
P K
N
Volume of water diverted from the tank
Cropping system
dominated by kharif
paddy
Cropping system
dominated by vegetables
Water for
fisheries
R
e
t
u
r
n
p
e
r
u
ni
t
o
f
w
a
t
e
r
Water for
domestic use
From the description of tank uses in the five villages, it is clear that irrigation directly in conflict with fisheries in all the villages and the magnitude of conflict increases during drought years. The conceptual model for analyzing the gross tank product from direct use of water from the tank under various water allocation scenarios is given in Diagram 1. In the diagram water use is shown in the x-axis and the economic value of the social or economic benefits from the
15
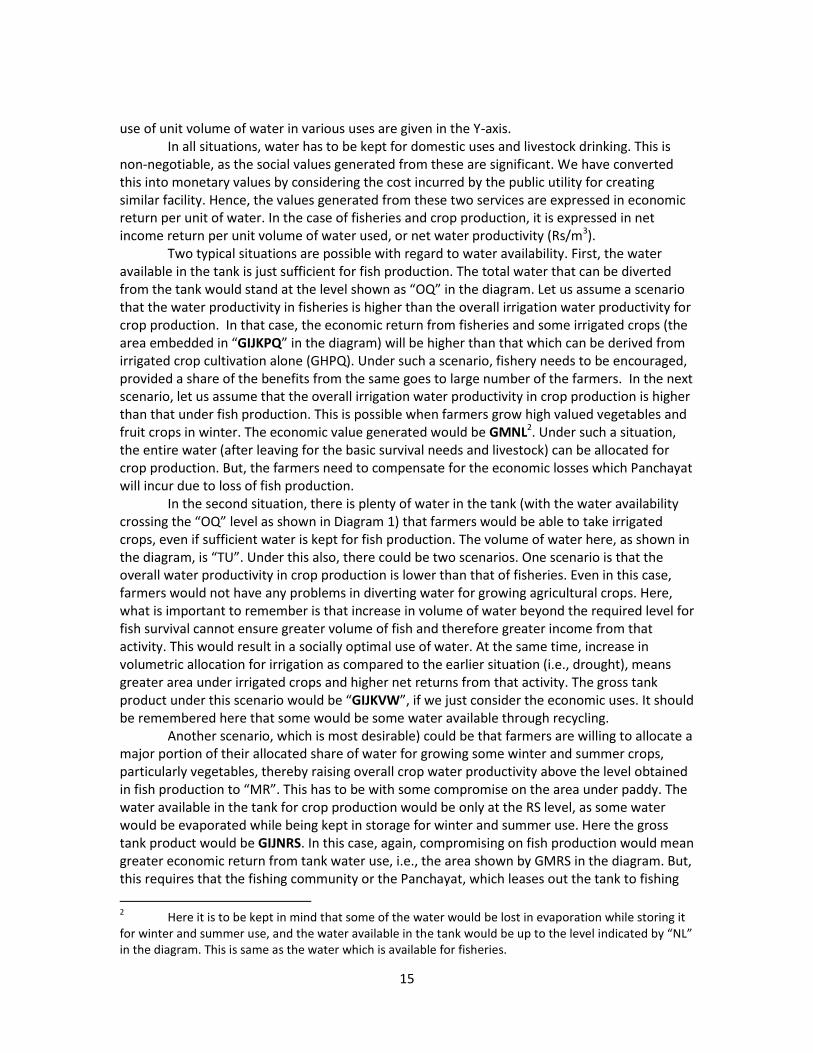
use of unit volume of water in various uses are given in the Y-axis. In all situations, water has to be kept for domestic uses and livestock drinking. This is
non-negotiable, as the social values generated from these are significant. We have converted this into monetary values by considering the cost incurred by the public utility for creating similar facility. Hence, the values generated from these two services are expressed in economic return per unit of water. In the case of fisheries and crop production, it is expressed in net income return per unit volume of water used, or net water productivity (Rs/m3).
Two typical situations are possible with regard to water availability. First, the water available in the tank is just sufficient for fish production. The total water that can be diverted from the tank would stand at the level shown as “OQ” in the diagram. Let us assume a scenario that the water productivity in fisheries is higher than the overall irrigation water productivity for crop production. In that case, the economic return from fisheries and some irrigated crops (the area embedded in “GIJKPQ” in the diagram) will be higher than that which can be derived from irrigated crop cultivation alone (GHPQ). Under such a scenario, fishery needs to be encouraged, provided a share of the benefits from the same goes to large number of the farmers. In the next scenario, let us assume that the overall irrigation water productivity in crop production is higher than that under fish production. This is possible when farmers grow high valued vegetables and fruit crops in winter. The economic value generated would be GMNL2. Under such a situation, the entire water (after leaving for the basic survival needs and livestock) can be allocated for crop production. But, the farmers need to compensate for the economic losses which Panchayat will incur due to loss of fish production.
In the second situation, there is plenty of water in the tank (with the water availability crossing the “OQ” level as shown in Diagram 1) that farmers would be able to take irrigated crops, even if sufficient water is kept for fish production. The volume of water here, as shown in the diagram, is “TU”. Under this also, there could be two scenarios. One scenario is that the overall water productivity in crop production is lower than that of fisheries. Even in this case, farmers would not have any problems in diverting water for growing agricultural crops. Here, what is important to remember is that increase in volume of water beyond the required level for fish survival cannot ensure greater volume of fish and therefore greater income from that activity. This would result in a socially optimal use of water. At the same time, increase in volumetric allocation for irrigation as compared to the earlier situation (i.e., drought), means greater area under irrigated crops and higher net returns from that activity. The gross tank product under this scenario would be “GIJKVW”, if we just consider the economic uses. It should be remembered here that some would be some water available through recycling.
Another scenario, which is most desirable) could be that farmers are willing to allocate a major portion of their allocated share of water for growing some winter and summer crops, particularly vegetables, thereby raising overall crop water productivity above the level obtained in fish production to “MR”. This has to be with some compromise on the area under paddy. The water available in the tank for crop production would be only at the RS level, as some water would be evaporated while being kept in storage for winter and summer use. Here the gross tank product would be GIJNRS. In this case, again, compromising on fish production would mean greater economic return from tank water use, i.e., the area shown by GMRS in the diagram. But, this requires that the fishing community or the Panchayat, which leases out the tank to fishing
2 Here it is to be kept in mind that some of the water would be lost in evaporation while storing it
for winter and summer use, and the water available in the tank would be up to the level indicated by “NL” in the diagram. This is same as the water which is available for fisheries.
16
contractor, is compensated for the revenue losses, i.e., the area under GIJL. But, this would still give greater income to the farmers, to the tune of IMNJ.
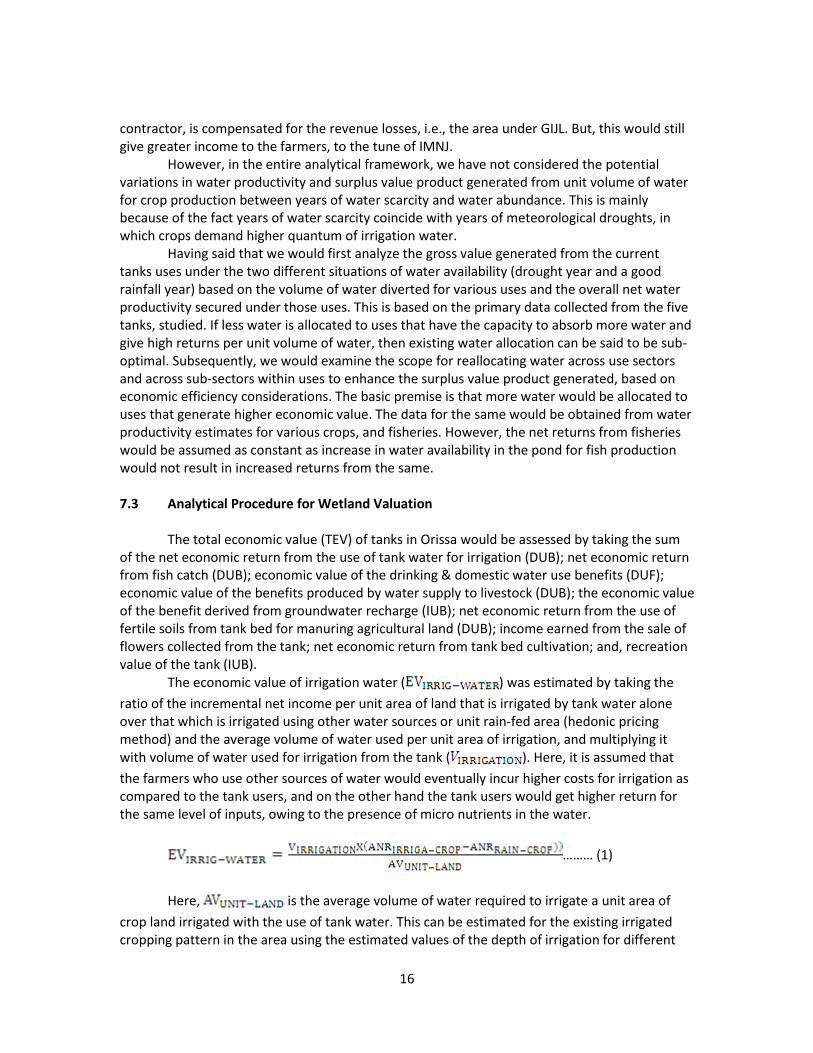
However, in the entire analytical framework, we have not considered the potential variations in water productivity and surplus value product generated from unit volume of water for crop production between years of water scarcity and water abundance. This is mainly because of the fact years of water scarcity coincide with years of meteorological droughts, in which crops demand higher quantum of irrigation water. Having said that we would first analyze the gross value generated from the current tanks uses under the two different situations of water availability (drought year and a good rainfall year) based on the volume of water diverted for various uses and the overall net water productivity secured under those uses. This is based on the primary data collected from the five tanks, studied. If less water is allocated to uses that have the capacity to absorb more water and give high returns per unit volume of water, then existing water allocation can be said to be sub-optimal. Subsequently, we would examine the scope for reallocating water across use sectors and across sub-sectors within uses to enhance the surplus value product generated, based on economic efficiency considerations. The basic premise is that more water would be allocated to uses that generate higher economic value. The data for the same would be obtained from water productivity estimates for various crops, and fisheries. However, the net returns from fisheries would be assumed as constant as increase in water availability in the pond for fish production would not result in increased returns from the same. 7.3 Analytical Procedure for Wetland Valuation The total economic value (TEV) of tanks in Orissa would be assessed by taking the sum of the net economic return from the use of tank water for irrigation (DUB); net economic return from fish catch (DUB); economic value of the drinking & domestic water use benefits (DUF); economic value of the benefits produced by water supply to livestock (DUB); the economic value of the benefit derived from groundwater recharge (IUB); net economic return from the use of fertile soils from tank bed for manuring agricultural land (DUB); income earned from the sale of flowers collected from the tank; net economic return from tank bed cultivation; and, recreation value of the tank (IUB). The economic value of irrigation water ( ) was estimated by taking the
ratio of the incremental net income per unit area of land that is irrigated by tank water alone over that which is irrigated using other water sources or unit rain-fed area (hedonic pricing method) and the average volume of water used per unit area of irrigation, and multiplying it with volume of water used for irrigation from the tank ( ). Here, it is assumed that
the farmers who use other sources of water would eventually incur higher costs for irrigation as compared to the tank users, and on the other hand the tank users would get higher return for the same level of inputs, owing to the presence of micro nutrients in the water.
……… (1)
Here, is the average volume of water required to irrigate a unit area of
crop land irrigated with the use of tank water. This can be estimated for the existing irrigated cropping pattern in the area using the estimated values of the depth of irrigation for different
17
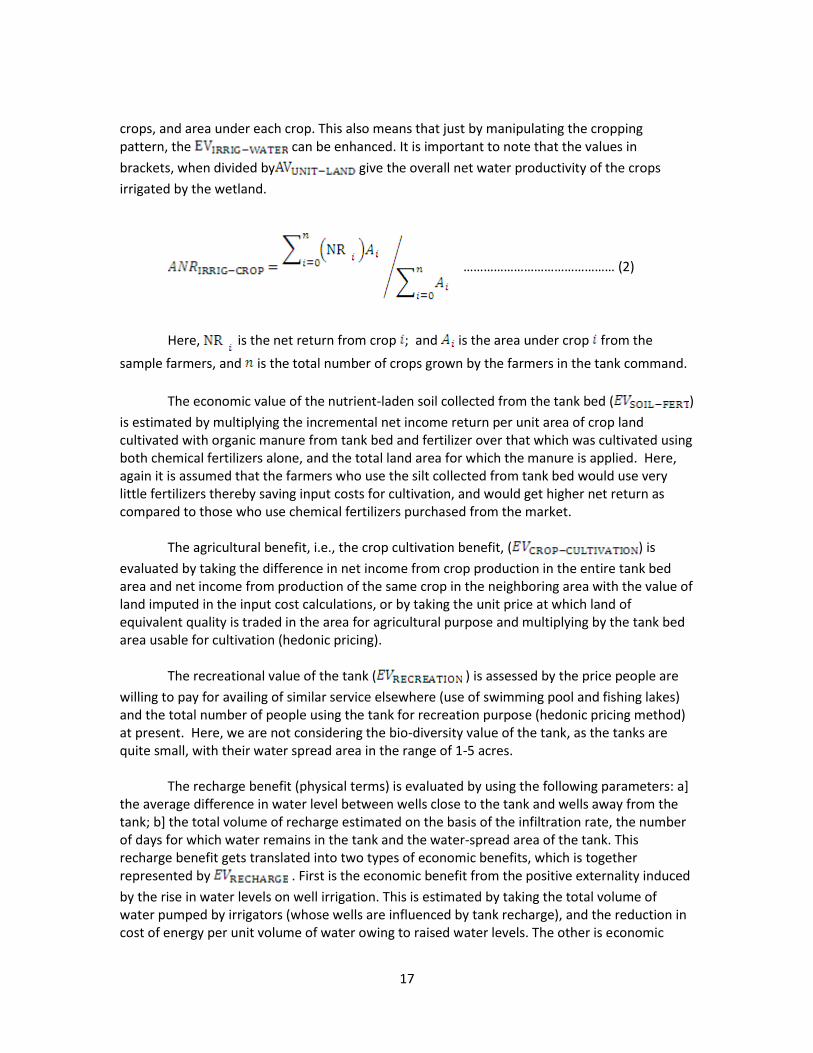
crops, and area under each crop. This also means that just by manipulating the cropping pattern, the can be enhanced. It is important to note that the values in
brackets, when divided by give the overall net water productivity of the crops
irrigated by the wetland.
……………………………………… (2)
Here, is the net return from crop ; and is the area under crop from the
sample farmers, and is the total number of crops grown by the farmers in the tank command.
The economic value of the nutrient-laden soil collected from the tank bed ( )
is estimated by multiplying the incremental net income return per unit area of crop land cultivated with organic manure from tank bed and fertilizer over that which was cultivated using both chemical fertilizers alone, and the total land area for which the manure is applied. Here, again it is assumed that the farmers who use the silt collected from tank bed would use very little fertilizers thereby saving input costs for cultivation, and would get higher net return as compared to those who use chemical fertilizers purchased from the market. The agricultural benefit, i.e., the crop cultivation benefit, ( ) is
evaluated by taking the difference in net income from crop production in the entire tank bed area and net income from production of the same crop in the neighboring area with the value of land imputed in the input cost calculations, or by taking the unit price at which land of equivalent quality is traded in the area for agricultural purpose and multiplying by the tank bed area usable for cultivation (hedonic pricing). The recreational value of the tank ( ) is assessed by the price people are
willing to pay for availing of similar service elsewhere (use of swimming pool and fishing lakes) and the total number of people using the tank for recreation purpose (hedonic pricing method) at present. Here, we are not considering the bio-diversity value of the tank, as the tanks are quite small, with their water spread area in the range of 1-5 acres.
The recharge benefit (physical terms) is evaluated by using the following parameters: a] the average difference in water level between wells close to the tank and wells away from the tank; b] the total volume of recharge estimated on the basis of the infiltration rate, the number of days for which water remains in the tank and the water-spread area of the tank. This recharge benefit gets translated into two types of economic benefits, which is together represented by . First is the economic benefit from the positive externality induced
by the rise in water levels on well irrigation. This is estimated by taking the total volume of water pumped by irrigators (whose wells are influenced by tank recharge), and the reduction in cost of energy per unit volume of water owing to raised water levels. The other is economic
18
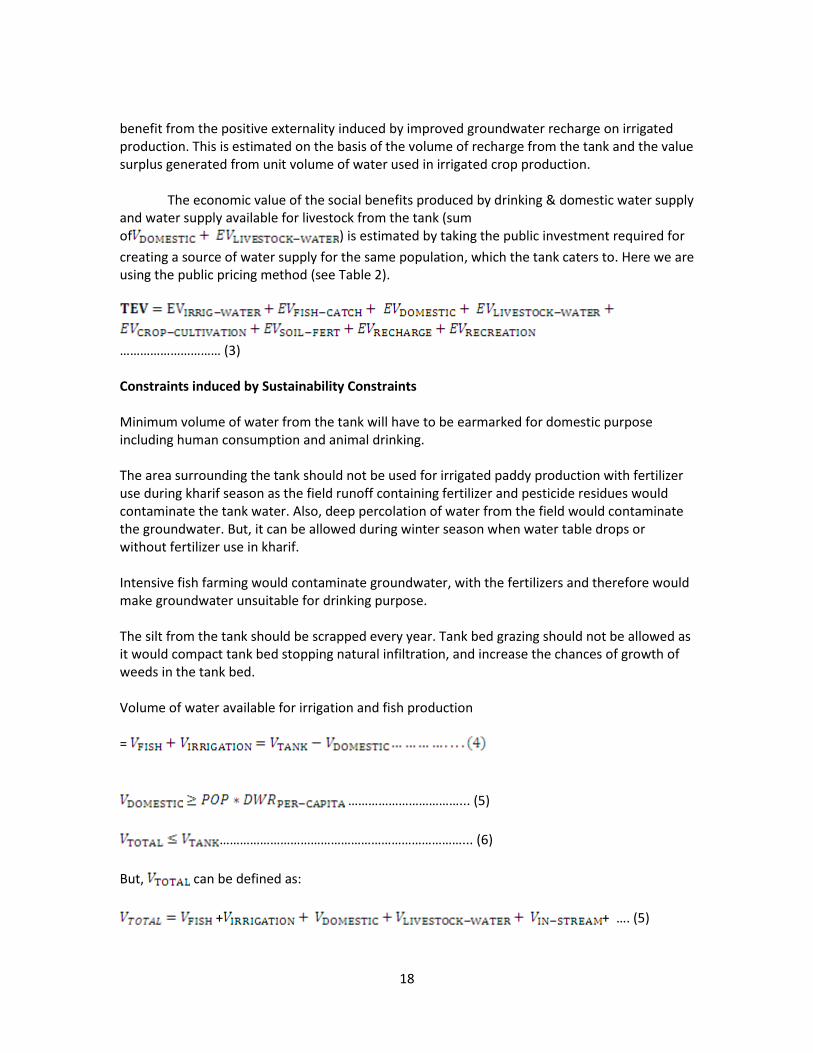
benefit from the positive externality induced by improved groundwater recharge on irrigated production. This is estimated on the basis of the volume of recharge from the tank and the value surplus generated from unit volume of water used in irrigated crop production. The economic value of the social benefits produced by drinking & domestic water supply and water supply available for livestock from the tank (sum of ) is estimated by taking the public investment required for
creating a source of water supply for the same population, which the tank caters to. Here we are using the public pricing method (see Table 2).
………………………… (3) Constraints induced by Sustainability Constraints Minimum volume of water from the tank will have to be earmarked for domestic purpose including human consumption and animal drinking. The area surrounding the tank should not be used for irrigated paddy production with fertilizer use during kharif season as the field runoff containing fertilizer and pesticide residues would contaminate the tank water. Also, deep percolation of water from the field would contaminate the groundwater. But, it can be allowed during winter season when water table drops or without fertilizer use in kharif. Intensive fish farming would contaminate groundwater, with the fertilizers and therefore would make groundwater unsuitable for drinking purpose. The silt from the tank should be scrapped every year. Tank bed grazing should not be allowed as it would compact tank bed stopping natural infiltration, and increase the chances of growth of weeds in the tank bed. Volume of water available for irrigation and fish production =
……………………………... (5)
………………………………………………………………... (6)
But, can be defined as:
+ + …. (5)
19
Hence, + ) …… (6)
Here, is the total consumptive water use for domestic purpose; and
is the total amount of water required to be kept in the tank for in-stream uses such
as washing, bathing and swimming. This would be same as the water required for recreation. 7.4 The Sample Design and Size A total of five tanks located in Sambalpur district of western Orissa were chosen for detailed study. The study included use of primary survey of various tank users (wetland) and the farmers in the upland. A total of 240 HHs from the wetland and 240 HHs from upland were surveyed from the five tank commands. In addition, village level data were collected on the physical characteristics of the wetland (area, depth, area irrigated in normal and drought years, no. of families depending on the tank for various uses etc.). In addition, secondary data on the physical features of the region were also obtained from published and grey literature. The five tanks are Gadloisingh, Jhankarpalli, Laida, Rengloi and Rugudipali.
8. The Existing Tank Benefits 8.1 Village Case Studies Detailed qualitative case studies have been developed to gain insights into the uses of the five wetlands, and how their uses are getting adapted to the changing social and economic pressures and their impacts. Village 1: Gadloisingh
Gadloisingh is the Panchayat Headquarter in a remote forested area of the Jujumura
block in Sambalpur district. It is situated at a distance of about 47 km from the district headquarters and 13 km from the block headquarters. There are only 65 families in the village with a total population of 345. Out of the total families 31 are Below Poverty Line families. The population of the village is dominated by Scheduled Tribes. People from all castes, including Brahmins, Scheduled Castes and Other Backward Castes also stay in the village. Agriculture, collection of Non-Timber Forest Produces and wage labour are the primary occupations of the village people. The village has a post office, the Panchayat office, forest guard office, high school and a few shops. This is the only village in the area where one can hire vehicles such as jeep and car. In fact, the people of neighbouring villages hire vehicles from here during health emergencies and marriages. There are three surface water harvesting structures in the village: two Katas and one pond. The Kata, which was studied, was dug nearly two hundred years ago, by the forefathers of one person named Bhakta Prashad Singh, who belongs to the Gond tribe. The tank in study irrigates (subsistence level) about 100 acres of crop fields during the Kharif. Most of the land at the tank command belongs to the Gauntia (landlord) family, which earlier had 60 acres in the tank command, but has already sold out about 20 acres. The rest of the land in the tank command belongs to the Jagannath Temple, Jhadeswari Temple and very few acres belong to about 7 to 8 families.
20
Cultivation in the village is limited to Kharif crops only. They put approximately 490 acres under paddy, 85 acres under horse gram, 10 acres under green gram, and 40 acres under black gram. A total of 100 acre can only be saved in low intensity drought years. In acute drought years however only about 20 to 30 acres can be provided with protective irrigation. The livelihood of poor farmers, who do not own irrigation wells and who are purely dependent on the tanks, is threatened during the drought years as their crop (paddy) production decline significantly. The villagers have taken on lease all the three water bodies for fishery, but in the name of one individual. They have paid Rs.1970/- for three years for this to the Panchayat. In total they raise 10000 hatchlings in all the ponds and have jointly decided that they will not affect the water for agriculture. So, their fishery operation starts in August and harvesting is done in next January. They get fishes of small size, with weight ranging from 250 gram to half kg only but are happy with that. They earn a profit of about 15000 to 18000 rupees annually. This amount is used in common functions and activities of the village. They raise fish species such as Rohu and Bhakur. The tank under study is used for several other purposes such as livestock drinking and bathing, washing utensils, and bathing by humans. In this village too, farmers face problems in marketing their agriculture produce. While the rich farmers (who are very few in numbers) take their own harvest to the market yard at Jujumura, the poor have to sell their produce to either these rich farmers or the middlemen. As regards the pulses, the villagers take it to local markets or sell to middlemen. The villagers narrated that they had experienced eight droughts in the last ten years and hence agriculture is slowly becoming a loss-making activity. Even though their dependence on chemical fertilizers and pesticides is not very high, it is not too little either. They feel the cost of production is increasing but the price they fetch is not remunerative. The new menace in the crop fields is the increasing attack of pests like swarming caterpillars which ate most of their crops last year. The farmers are yet to get any compensation from the government. This year, under the NREGS, the government decided to do plantation and hence most of the villagers got engaged in that. As a result, they have delayed the farming operations. They fear that, this along with the scanty rainfall will result in at least 60 to 80 per cent loss in revenue from crops. The villagers feel that if the Kata as well as other structures are revived they can protect more crops from drought. The drinking water needs of the villagers are met by three tube wells and one open well. A year and half ago the Swajaldhara scheme was started here but its dysfunctional since long. Village 2: Jhankapali Tank Jhankarpali, a tribal dominated village, is about 35 kilometers from the Sambalpur district headquarters. Traditionally, the villagers have depended on agriculture, beedi making and forest produces. The village has two Katas (Tanks) and two Bandhs (Ponds) and a very few wells and tube wells that cater to the water demands of the villagers. 180 families live in the village which is 20 km from the block headquarters but yet to receive basic amenities. About 250 acres of land is cultivated in the village in which paddy is the major crop in Kharif. In the Rabi season, only about 25 per cent of the total cultivable land is put to agriculture, and is dominated by vegetables, most of which is cultivated by moisture that is still retained after the monsoon. Only a small portion is irrigated.
21
The tank under study, which was perhaps dug by the Thapa3 family a couple of hundred year ago, is being used for all purposes starting from irrigation, bathing of humans and animals, washing utensils and fishery. In fishery, however, there is only one family that benefits because it has taken it on lease from the Gram Panchayat. Fish varieties like Rohu, Mirkali, Bhakur etc. are raised in this tank. The poor people from the village, who do not have alternative sources of irrigation, have raised complaints about this system and the way fishery is being promoted. They allege that fishery demands water at a time when crop too demands, especially in a drought year and hence we see conflicts in the village. Going by the rules, Panchayats lease out the tanks and in many villages only one person/family takes it on lease. While the benefit goes to only one family, irrigation suffers as the tank has to retain a minimum quantity of water to survive the fish. Hence, conflicting situations arise.
As regards the irrigation benefits from the Tank under study, while about 50 to 60 families benefit in a normal monsoon year, it reduces to about 40 to 50 households in a drought year. This can actually reduce to even five to ten acres when there is acute water scarcity. There are a very few families who use the seepage water from the tank to sustain their farming. One thing is however clear that most of the people only use water from the tank to provide protective irrigation to the crops as there is no irrigation channel or common lifting point established in the tank. The tank water thus works as a fillip when, even in monsoon fails or there is an uneven distribution of rainfall. The farmers are complaining of a gradually increasing water scarcity in the last four to five years as the monsoon has been erratic and uneven during this period. They have observed a reduced inflow of water into the tank and hence the dependence on agriculture is no more a certain income source. In most villages of western Orissa, deforestation at catchment has also caused siltation of the tanks resulting in reduced retention capacity of water. Increased cost of agriculture due to use of hybrid paddy varieties that necessitates use of chemical fertilizers and pesticides has not been compensated by the price of the produce. Compared to the cost, paddy price has not gone up. The best quality fetches Rs.10/- a kg but there are several tricks applied by the millers to cheat the farmers and hence the farmers are always a suffering lot. The older generation farmers recall that about thirty year back they started shifting to a modern system of farming which uses more chemicals, external seeds. Machines like tractors are increasingly being used for about a decade. All this has definitely increased the production to some extent but the cost has also escalated. The villagers feel they have become more dependent on external inputs. The livestock has also reduced by about sixty to seventy per cent in about three decades and hence their ability to provide organic fertilizer and manure to the fields is reducing. The average increase in cost of inputs has increased by about 5 per cent each year and this has increased substantially during the last four to five years. Last year, most of the crop fields in the village were damaged by swarming caterpillars. While people are yet to get any compensation, except for a few who got the agriculture input subsidy based subsidized diesel pump sets (which are mostly run by villagers in kerosene and for which they had to spend eight thousand rupees for the set and a few more hundred in bribes), their cost of chemical pesticide has increased; last year as they tried their best to fight the menace and this year because they wanted to prevent it from the beginning. This year, while the caterpillars have not shown up after coming during the initial few days, rain has ditched them completely. People have experienced 50 to 70 per cent deficient rain falls this year and hence apprehend substantial crop loss this time, which may run up to 50 to 70 per cent. 3 Thapa belongs to the OBC. Locally they are called the Goud caste.
22
On an average, a farmer spends about eight thousand rupees and if he gets the best quantity and quality, he would earn about eleven thousand to eleven thousand five hundred rupees. The cost does not include the labour the family members put in which is invariably present irrespective of financial condition and land holding size of the farmers. While poor and marginal farmers put in more family labour and less external inputs like fertilizers, their output also is less. The farmers are a suffering lot in relation to pricing and marketing of the produce as well, as they have complained. At best farmers can get seven fifty rupees for a bag of 75 kg of paddy that too for the best paddy. For this, however, they have to take their bags to the market yard which is about 12 kilometers by hiring vehicles. For the poor, it’s pooling of resources to hire one vehicle and hence more clumsy. Sometimes they have to wait in the market yard for days for their number to come. For other produces, however, the prices are highly volatile. There are only a very few people who are growing millets and pulses; and some grow vegetables. Most of these other crops are grown for home consumption or sale in the village and/or nearby markets. Price wise there is no certainty and no market mechanism. They mostly sell the vegetables in local haats and that too in very little quantity. Collection, consumption and sale of Non-Timber Forest Produces are a substantial life support system for most of the people in the village. Beedi-making is the second highest income generator for them. For the last one decade or so, people have started to migrate out in search of wage earning but till now most of them are going only to nearby areas. The villagers have been demanding assured irrigation facilities. Irrigation facility with proper village level planning can solve some problems both at the short and long run. Village 3: Laida
Laida is perhaps the largest village of the district. It is more a semi-urban area than a village. It has got a mixed population consisting of families belonging to Brahmins, Kulitas, Agarias (two communities known for their agricultural prosperity), Marwaris (known as good traders), Scheduled Tribes and Scheduled Castes. This is the marketing hub and communication link for most of the nearby villages and the occupation structure is quite diversified. While 2200 families live in the village, not many people are totally dependent on agriculture currently. The village has also got piped water supply.
According to villagers there are about 27 surface water bodies of different sizes in the village. Except for one pond, the rest were dug by people themselves. The village had a systematic water management plan in the past and the uses of the tanks and ponds were well defined. Twelve to fifteen tanks and ponds were devoted to agriculture and the rest for other purposes. A few ponds were exclusively being maintained for drinking water; one for washing clothes; a few for livestock and utensil; so on and so forth. However, that system has broken. While most of the ponds are in dilapidated conditions, about seven need urgent revival.
This village is also politically influential and hence people get funds from different schemes. But, the problems related to agriculture including increased cost of cultivation and declining incomes have forced many people to move out of agriculture. That’s the reason we see families opting for petty businesses and services rather than agriculture in this village. Some people feel the taking over of management of the ponds and tanks by the Gram Panchayats post-independence has actually given rise to this problem. In fact, after independence, all the tanks went under the Panchayats. Since the Zamindari and Gountiahi systems had also been
23
abolished and so had been the custom of ‘bethi’ or free labour, individuals could no longer afford to maintain private irrigation structures. The people of this village feel that the Panchayats did not pay good attention to revival of the structures and their investments had gone down over the years. As regards the status of ponds, about 12 to 15 ponds are for agriculture, but are full with weeds and shrubs and their capacity has shrunk. The ground water based piped water supply system is also being seen as another reason of the decay in recent years. People describe that this has alienated the people from the source and they now look to the government to do everything.
About 1981 acres of land is cultivated in the village in which paddy is the major crop in Kharif. A total of about 80 acres can only be irrigated. This is supplementary irrigation to Kharif crop. In the Rabi season, only about 300 acre of the total cultivable land is put to agriculture, for mustard. Most of this is done through moisture that’s still retained from the monsoon period.
The tank under study is said to have been dug by the Kulita landlords but nobody could provide historical antecedents. This tank was being exclusively used for irrigation and the village has seen social tension after the tank was leased out for fishery. There is no irrigation project in the village and the villagers were using a combination of tanks and ponds for irrigation. However, immediately after India’s independence, after the Gram Panchayats took it over and leased them out for fishery the people have faced acute crisis during drought years. In normal rainfall years, when there is water in the tank fishery and irrigation can go simultaneously without much hassles. However, in drought years the crisis increases. The departmental officials of the Panchayat office ask the people to keep at least five feet water column in the tank so that fish can survive. As a result the crops die because their supplementary irrigation demand goes up during drought year, while the tank storage declines drastically.
While the tank in study irrigates about 48 acres of land, the benefit reaches to about the same number of families. In drought years this can reduce significantly. There are a very few families who use the seepage water from the tank to sustain their paddy crops. Since most of other tanks and ponds are full with weeds and have turned dirty the use of this tank for livestock, bathing and washing clothes has increased both from farmers, poor people and passers-by. While in normal years about 400 households use the tank for bathing their livestock, in drought years it reduces to about 150 households. Similarly, while about 500 families use this tank for bathing and washing clothes in normal years, about 150 families use for same purposes during drought years.
Here too, the poor tank irrigators are complaining of a gradually increasing water scarcity in the last four to five years as the monsoon has been erratic and uneven. They have observed a reduced inflow of water into the tank and hence the dependence on agriculture is no more a stable source of income. However, no significant change in land use, which can potentially impact on runoff and tank inflows, was observed by farmers during the last 4-5 years. In most villages of western Orissa, deforestation at catchment has also caused siltation of the tanks resulting in reduced retention capacity of water. Village elder says their village has been wrongly set. They feel that the human habitation is located at a place where the crop fields should have been there.
Laida has adopted modern farming since long as the Agarias, who came and settled there about two hundred years ago, were been known for their modern approach to farming. Compared to nearby Agaria dominated areas however the Agarias of Laida have gone in for more trade than farming in the recent decades. Earlier they used to do paddy and chilly.
24
However, they are not concentrating on paddy only. It’s only the Kulitas who are doing mustard in Rabi. The farmers of Laida however have also raised their worries with regard to increasing cost of farming and decreasing income. Drought is a regular visitor to this village too and last year the caterpillars did a substantial damage to the farms. The compensation status is same as Jhankarpali and Rengloi. However, the Laida farmers have better coping mechanisms as their occupation is diversified. For the poor and marginal land holders however the situation is almost the same and they have not received any compensation.
Laida has a market yard and hence the farmers from Laida do not have to travel much to take the produces to the yard. Road communication to this village is also relatively better and hence traders from outside come to buy mustard. No farmer in the command is growing any high valued crops such as vegetables and fruits. However, with regard to pricing of products the farmers have similar complains as the farmers of Rengloi and Jhankarpali have. Laida has got a very active farmer organization which is part of the Sambalpur Zilla Krushak Surakshya Sangathan (a district level federation of farmer organizations) and hence the farmers have been involved in several agitations during the past half a decade demanding better price; against diversion of water from Hirakud reservoir to industries. Farmers of Rengloi have also joined with them in most of the agitations but they have not been that active for communication problems.
Some farmers of Laida believe that if a medium irrigation project is built on river Bheden that is passing by the village, a permanent solution to water woes can be achieved. However, they complain that the government is giving away Bheden water to industries and not the irrigation. Many farmers also say that the ponds and tanks of Laida need urgent revival and this blended with lifted water from Bheden can solve the agrarian crisis that they are facing now. Village 4: Rengloi Rengloi, similar to Jhankarpali in many ways, is another tribal dominated village, which is about 50 kilometers from the Sambalpur district headquarters. Traditionally, the villagers have depended on agriculture, collection of forest produce and beedi making. However, compared to Jhankarpali, this village has greater proportion of its people engaged in non agricultural activities. The village has one tank, five ponds and around twenty five wells. There are ten tube wells in the village.
134 families live in the village, which is 35 km from the block headquarters. This village too is deprived of basic amenities. About 1646 acres of land is cultivated in the village in which paddy is the major crop, grown in Kharif. In the Rabi season, only about 15 acre of the total cultivable land is put to agricultural use, and wheat is grown. Most of this is done using the residual moisture. Only a small portion of the cultivated land is irrigated.
The tank under study, which is known as Naik Kata, was dug by the Gond landlord about hundred and fifty year ago. Villagers say Bhanugangdev Singh Naik, who is the eldest son of Naik Jamindar (who dug this) is working as a Revenue Inspector at Bhatli in Bargarh district. The landlords of that time dug it mainly for agriculture, bathing and drinking. However, after the Panchayats took over this tank, the tank was used more for fishery purpose by the Panchayat, but the people continue to use it for irrigation and other purposes. For drinking water, the Panchayat dug an exclusive pond in the year 1959.
The tank under study is thus being used at present for irrigation, bathing of humans and animals and fishery, and not for drinking & cooking purpose. In fishery, however, there is only
25
one family that benefits, as it has taken it on lease from the Gram Panchayat. Fish varieties such as Rohu (Indian Major Carp), Mirkali, Bhakur etc., are raised in this tank. In this village too people have raised complaints about this system and the way fishery is being promoted by the Panchayat. The fishery operations start in June each year and end in April the next. They allege that fishery demands water at a time when crop too demands, especially in a drought year. Going by the rules, Panchayats lease out the tanks and in many villages only one person/family takes it on lease. While the benefit goes to only one family, irrigation suffers as the tank has to retain a minimum quantity of water for the fish to survive. The officials suggest that the mandatory minimum depth to be maintained for fishery is four and half to five feet.
As regards irrigation benefits from the tank, while it irrigates about 60 acres of land the benefit goes to 75 families. While the crop fields are irrigated by rain water, when there is no rains on times of requirement, people would take the water from the tank through pumping. In drought years this can reduce further. To reduce the impact of drought on water availability the people have built an earthen embankment cutting the tank into two parts so that the water gets collected in the lower portion, which would eventually retain the water for a longer period of time. There are very few families which use the seepage water from the tank to sustain their farming. However, it is clear that most of the people only use water from the tank to provide protective irrigation to the crops. There are no irrigation channels and common lifting points.
Here too, the poor farmers are complaining of a gradually increasing water scarcity in the last four to five years as the monsoon has been erratic and uneven during this period. They have observed a reduced inflow of water into the tank and hence the dependence on agriculture is no more a certain income source. In most villages of western Orissa, deforestation at catchment has also caused siltation of the tanks resulting in reduced retention capacity of water. Village elder says their village has been wrongly set. They feel that the human habitation is situated at a place where the agricultural land should have been.
Increased cost of agriculture due to use of hybrid paddy varieties that necessitates use of chemical fertilizers and pesticides has not been compensated by the price of the produce. Compared to the cost, paddy price has not gone up. The best quality fetches Rs.10/- a kg but there are several tricks applied by the millers to cheat the farmers and hence the farmers are always a suffering lot. The older generation farmers recall that about thirty year back they started shifting to a modern system of farming which uses more chemicals, external seeds. Machines like tractors are increasingly being used for about a decade. All this has definitely increased the production to some extent but the cost has also escalated. The villagers feel they have become more dependent on external inputs. The livestock has also reduced by about sixty to seventy per cent in about three decades and hence their ability to provide organic fertilizer and manure to the fields is reducing. People describe that due to increased use of machineries the livestock population has decreased.
The average increase in cost of inputs has increased by about 5 per cent each year and this has increased substantially during the last four to five years. Last year, most of the crop fields in the village were damaged by swarming caterpillars. While people are yet to get any compensation, except for a few who got the agriculture input subsidy based subsidized diesel pump sets (which are mostly run by villagers in kerosene and for which they had to spend eight thousand rupees for the set and a few more hundred in bribes), their cost of chemical pesticide has increased; last year as they tried their best to fight the menace and this year because they wanted to prevent it from the beginning. This year, while the caterpillars have not shown up after coming during the initial few days, rain has ditched them completely. People have

26
experienced 50 to 70 per cent deficient rain falls this year and hence apprehend substantial crop loss this time that may run up to 50 to 70 per cent.
On an average, a farmer spends about eight thousand rupees and if he gets the best quantity and quality, he would earn about eleven thousand to eleven thousand five hundred rupees. The cost does not include the labour the family members put in which is invariably present irrespective of financial condition and land holding size of the farmers. While poor and marginal farmers put in more family labour and less external inputs like fertilizers, their output also is less.
The farmers are a suffering lot in relation to pricing and marketing of the produce as well, as they have complained. At best farmers can get seven fifty rupees for a bag of 75 kg of paddy that too for the best paddy. For this, however, they have to take their bags to the market yard which is about 12 kilometers by hiring vehicles. For the poor, it’s pooling of resources to hire one vehicle and hence more clumsy. Sometimes they have to wait in the market yard for days for their number to come. For other produces, however, the prices are highly volatile. There are only a very few people who are growing millets and pulses; and some grow vegetables. For the vegetables the farmers are using the Kata water too. Most of these other crops are grown for home consumption or sale in the village and/or nearby markets. Price wise there is no certainty and no market mechanism. They mostly sell the vegetables in local haats and that too in very little quantity. Collection, consumption and sale of Non-Timber Forest Produces are a substantial life support system for most of the people in the village. Beedi-making is the second highest income generating occupation for them. For the last one decade or so, people have been migrating out in search of wage labour, but till now most of them are going only to nearby areas. The villagers have been demanding assured irrigation facilities. Irrigation facility with proper village level planning can solve some problems both at the short and long run. According to the villagers a check dam at an upper point of the Nalibasa (stream that flow from the Akhdadang reserve forests) whose run off feeds the kata can solve a lot of problems of this as well as three nearby villages. They feel that this can be good irrigation project which will check some water and release the rest to the Kata. Village 5: Rugudipali A remote village in the forests, Rugudipali in Gadloisingh Gram Panchayat is about 45 kilometers from the district headquarters of Sambalpur and 11 kilometers from the block headquarters of Jujumura. The village is inhabited by 66 families and the total population of the village is 345. It’s a Scheduled Tribe dominated village and most of the villagers are marginal farmers or landless people. Besides the tribal communities however the village has people from Scheduled Castes and very few other backward caste people. The main occupations of the village are agriculture, collection and sale of Non-Timber Forest Produces and wage labour. The village is very ill communicated to the mainstream and people are very poor. The Kata under study is at a distance of one and half km from the village habitation. Decades ago, the habitation was near to the Kata as it was dug by the Gountia Mohammed Khan, about a hundred and fifty years ago, for the benefit of the people. However, later on, people resettled at a distance and hence the Kata is now far from them adding to their woes. This village always faces water scarcity as there is no other water structure in the village. The only small pond, which was also dug by the Gountia, is in a dilapidated condition making it
27
thereby difficult for the people to meet their bathing and livestock needs. The villagers depend on a tube well and an open well for their drinking water and bathing needs. Most of the land in this village earlier belonged to the Gauntia and most of his lands are located in the tank command area. The Gountia family sold more than half of their land which was purchased by people who came from Sundergarh and Bihar and settled down in the nearby Mahakur Pali and other villages. The tank irrigates about 100 acres of land in the village, but these settlers are the real beneficiaries of the tank water. People from Rugudipali village revealed that most of them are no longer into agriculture as they have mortgaged their land in small portions to these settlers at times of crisis arising from medical emergency, religious rituals and festivals. The villagers informed that about 50 to 60 acres of land downstream of the tank never faced droughts and believe that proper renovation of this tank and putting in structures for irrigation like gates and channels would help irrigate at least 400 acres. A total of 205 acre land is being put to cultivation in the village, of which about 100 get irrigated from the Kata but the original villagers of Rugudipali get about 30 acres of their land irrigated. By irrigation, the people mean protective (supplementary) irrigation of the crops in the Kharif season. In years of acute drought, while 50 to 60 acres of kharif crops survive, the rest--mostly belonging to the villagers of Rugudipali –does not. While paddy is cultivated on about 145 acres, pulses such as horse gram, green gram and black gram are grown by a few families in about 60 acres that too in Kharif. The village committee had obtained fishing lease of the tank in one individual’s name and they raised species such as Rohu, Bhakur and Mirkali. Due to water scarcity and distance of the tank from village, the committee has not taken interest during the past two years. In fact, accordingly some villagers, as water scarcity is getting worse, the powerful and influential farmers (from outside villages) have put pressure on the village committee not to take up fishery so that their crops can survive. Basic amenities are almost absent in the village. The people complained that they get indebted regularly and have to depend on money lenders due to health problems. While the marginal farmers don’t use much chemical fertilizers and pesticides, the rich ones use at par with nearby by developed areas. The marginal farmers mostly grow paddy for their own consumption and the farmers who grow pulses sell those in local market. The farmers complained about erratic rainfall; marketing problems and pricing. To stick to farming is now a difficult task, as most of them rue. In fact, most of the small and marginal farmers of the village do not go to the market yard – at Jujumura - directly; rather they sell it to the middlemen at lower prices. 8.2 Multiple Water Use Benefits The multiple water use benefits identified from the five tanks studied are irrigation, fish farming, water for domestic use (washing, bathing, cleaning utensils) and water for livestock drinking. In addition, recreational use of water was also found in all the tanks. It was found that irrigated area shrinks during drought years in all the tanks. Contrary to what was found in the case of irrigation, fish production is not compromised in the years of drought. In this section, we have discussed the extent of these benefits, vis-à-vis the area irrigated during normal and drought years, the crops irrigated, the yield of the crops irrigated by tank water and incremental net return from these crops over the upland crops irrigated from other sources;; total value of
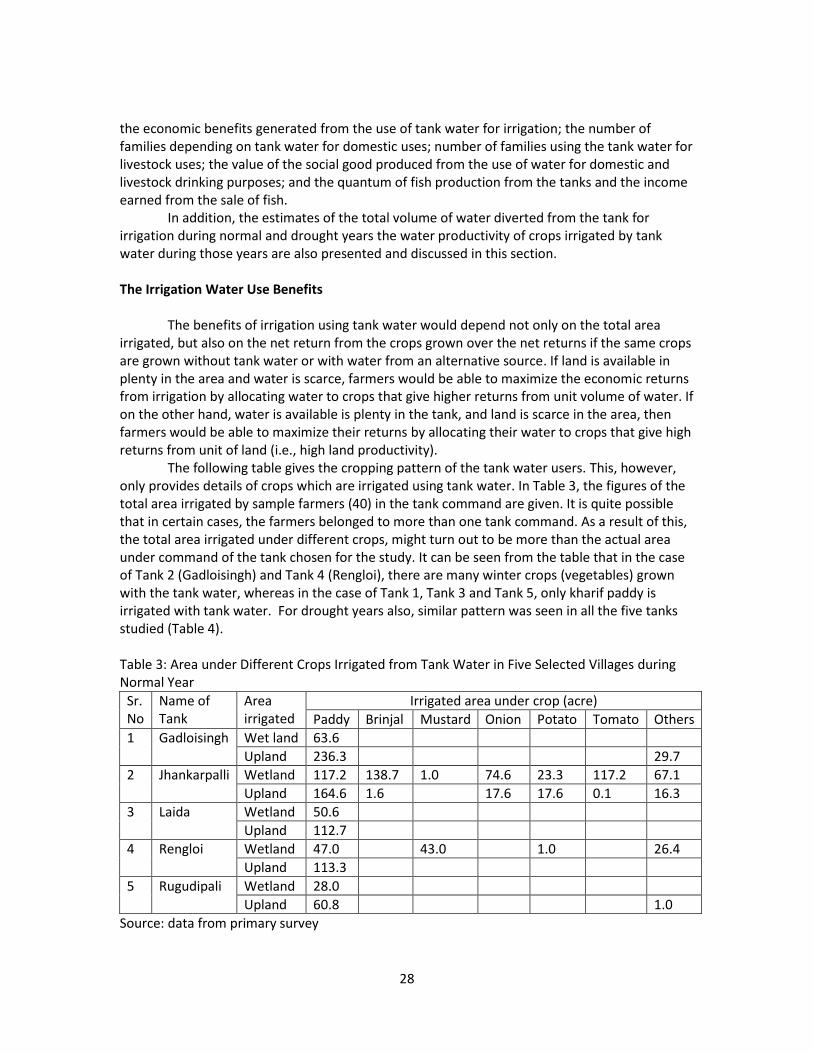
28
the economic benefits generated from the use of tank water for irrigation; the number of families depending on tank water for domestic uses; number of families using the tank water for livestock uses; the value of the social good produced from the use of water for domestic and livestock drinking purposes; and the quantum of fish production from the tanks and the income earned from the sale of fish. In addition, the estimates of the total volume of water diverted from the tank for irrigation during normal and drought years the water productivity of crops irrigated by tank water during those years are also presented and discussed in this section. The Irrigation Water Use Benefits
The benefits of irrigation using tank water would depend not only on the total area irrigated, but also on the net return from the crops grown over the net returns if the same crops are grown without tank water or with water from an alternative source. If land is available in plenty in the area and water is scarce, farmers would be able to maximize the economic returns from irrigation by allocating water to crops that give higher returns from unit volume of water. If on the other hand, water is available is plenty in the tank, and land is scarce in the area, then farmers would be able to maximize their returns by allocating their water to crops that give high returns from unit of land (i.e., high land productivity).
The following table gives the cropping pattern of the tank water users. This, however, only provides details of crops which are irrigated using tank water. In Table 3, the figures of the total area irrigated by sample farmers (40) in the tank command are given. It is quite possible that in certain cases, the farmers belonged to more than one tank command. As a result of this, the total area irrigated under different crops, might turn out to be more than the actual area under command of the tank chosen for the study. It can be seen from the table that in the case of Tank 2 (Gadloisingh) and Tank 4 (Rengloi), there are many winter crops (vegetables) grown with the tank water, whereas in the case of Tank 1, Tank 3 and Tank 5, only kharif paddy is irrigated with tank water. For drought years also, similar pattern was seen in all the five tanks studied (Table 4). Table 3: Area under Different Crops Irrigated from Tank Water in Five Selected Villages during Normal Year
Sr. No
Name of Tank
Area irrigated
Irrigated area under crop (acre)
Paddy Brinjal Mustard Onion Potato Tomato Others
1 Gadloisingh Wet land 63.6
Upland 236.3 29.7
2 Jhankarpalli Wetland 117.2 138.7 1.0 74.6 23.3 117.2 67.1
Upland 164.6 1.6 17.6 17.6 0.1 16.3
3 Laida Wetland 50.6
Upland 112.7
4 Rengloi Wetland 47.0 43.0 1.0 26.4
Upland 113.3
5 Rugudipali Wetland 28.0
Upland 60.8 1.0
Source: data from primary survey
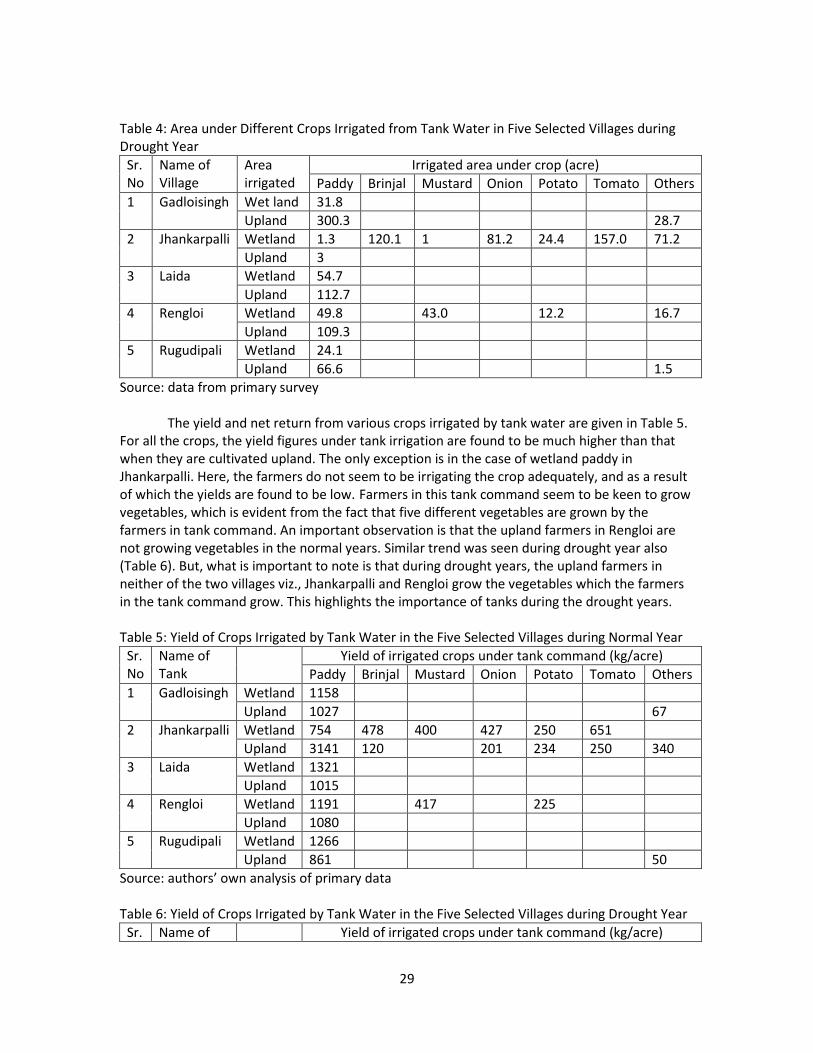
29
Table 4: Area under Different Crops Irrigated from Tank Water in Five Selected Villages during Drought Year
Sr. No
Name of Village
Area irrigated
Irrigated area under crop (acre)
Paddy Brinjal Mustard Onion Potato Tomato Others
1 Gadloisingh Wet land 31.8
Upland 300.3 28.7
2 Jhankarpalli Wetland 1.3 120.1 1 81.2 24.4 157.0 71.2
Upland 3
3 Laida Wetland 54.7
Upland 112.7
4 Rengloi Wetland 49.8 43.0 12.2 16.7
Upland 109.3
5 Rugudipali Wetland 24.1
Upland 66.6 1.5
Source: data from primary survey
The yield and net return from various crops irrigated by tank water are given in Table 5. For all the crops, the yield figures under tank irrigation are found to be much higher than that when they are cultivated upland. The only exception is in the case of wetland paddy in Jhankarpalli. Here, the farmers do not seem to be irrigating the crop adequately, and as a result of which the yields are found to be low. Farmers in this tank command seem to be keen to grow vegetables, which is evident from the fact that five different vegetables are grown by the farmers in tank command. An important observation is that the upland farmers in Rengloi are not growing vegetables in the normal years. Similar trend was seen during drought year also (Table 6). But, what is important to note is that during drought years, the upland farmers in neither of the two villages viz., Jhankarpalli and Rengloi grow the vegetables which the farmers in the tank command grow. This highlights the importance of tanks during the drought years. Table 5: Yield of Crops Irrigated by Tank Water in the Five Selected Villages during Normal Year
Sr. No
Name of Tank
Yield of irrigated crops under tank command (kg/acre)
Paddy Brinjal Mustard Onion Potato Tomato Others
1 Gadloisingh Wetland 1158
Upland 1027 67
2 Jhankarpalli Wetland 754 478 400 427 250 651
Upland 3141 120 201 234 250 340
3 Laida Wetland 1321
Upland 1015
4 Rengloi Wetland 1191 417 225
Upland 1080
5 Rugudipali Wetland 1266
Upland 861 50
Source: authors’ own analysis of primary data Table 6: Yield of Crops Irrigated by Tank Water in the Five Selected Villages during Drought Year
Sr. Name of Yield of irrigated crops under tank command (kg/acre)
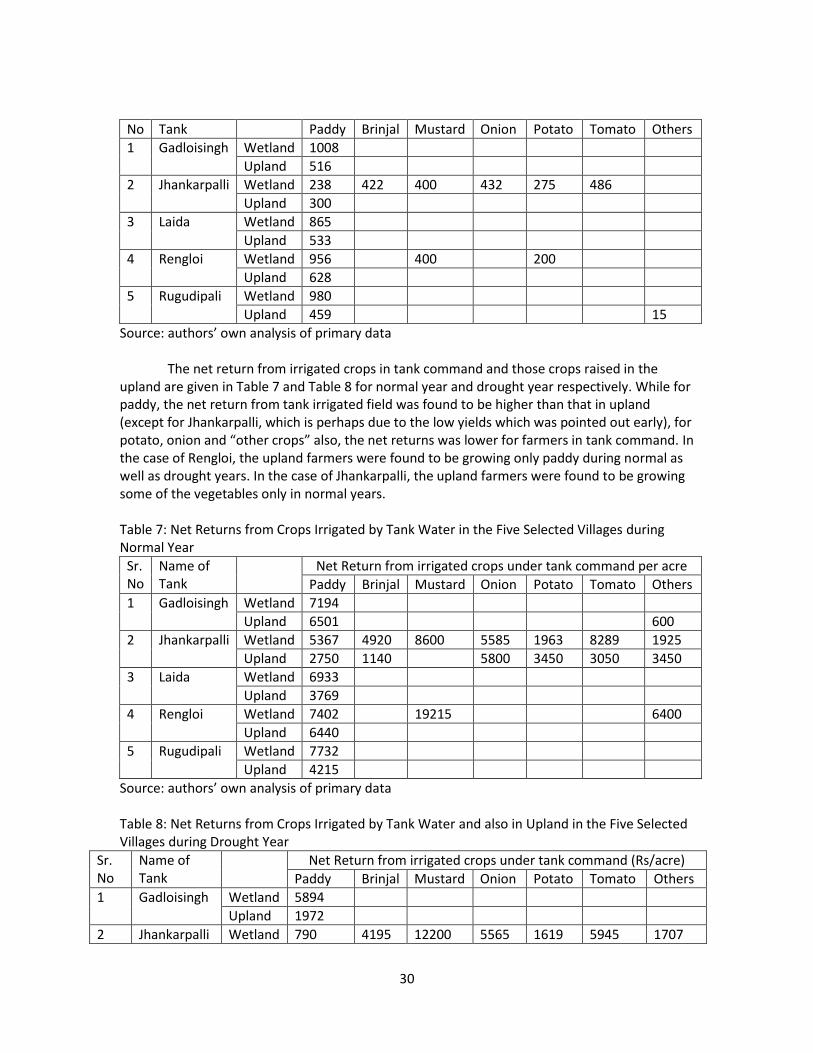
30
No Tank Paddy Brinjal Mustard Onion Potato Tomato Others
1 Gadloisingh Wetland 1008
Upland 516
2 Jhankarpalli Wetland 238 422 400 432 275 486
Upland 300
3 Laida Wetland 865
Upland 533
4 Rengloi Wetland 956 400 200
Upland 628
5 Rugudipali Wetland 980
Upland 459 15
Source: authors’ own analysis of primary data The net return from irrigated crops in tank command and those crops raised in the upland are given in Table 7 and Table 8 for normal year and drought year respectively. While for paddy, the net return from tank irrigated field was found to be higher than that in upland (except for Jhankarpalli, which is perhaps due to the low yields which was pointed out early), for potato, onion and “other crops” also, the net returns was lower for farmers in tank command. In the case of Rengloi, the upland farmers were found to be growing only paddy during normal as well as drought years. In the case of Jhankarpalli, the upland farmers were found to be growing some of the vegetables only in normal years. Table 7: Net Returns from Crops Irrigated by Tank Water in the Five Selected Villages during Normal Year
Sr. No
Name of Tank
Net Return from irrigated crops under tank command per acre
Paddy Brinjal Mustard Onion Potato Tomato Others
1 Gadloisingh Wetland 7194
Upland 6501 600
2 Jhankarpalli Wetland 5367 4920 8600 5585 1963 8289 1925
Upland 2750 1140 5800 3450 3050 3450
3 Laida Wetland 6933
Upland 3769
4 Rengloi Wetland 7402 19215 6400
Upland 6440
5 Rugudipali Wetland 7732
Upland 4215
Source: authors’ own analysis of primary data Table 8: Net Returns from Crops Irrigated by Tank Water and also in Upland in the Five Selected Villages during Drought Year
Sr. No
Name of Tank
Net Return from irrigated crops under tank command (Rs/acre)
Paddy Brinjal Mustard Onion Potato Tomato Others
1 Gadloisingh Wetland 5894
Upland 1972
2 Jhankarpalli Wetland 790 4195 12200 5565 1619 5945 1707
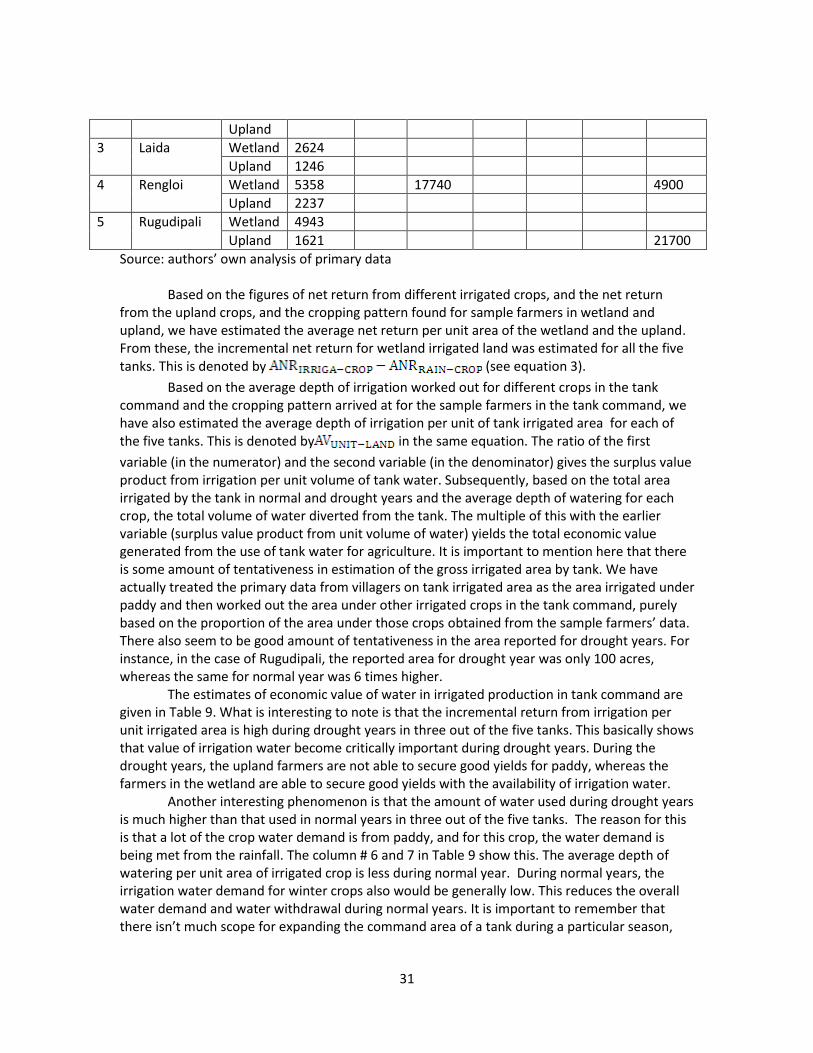
31
Upland
3 Laida Wetland 2624
Upland 1246
4 Rengloi Wetland 5358 17740 4900
Upland 2237
5 Rugudipali Wetland 4943
Upland 1621 21700
Source: authors’ own analysis of primary data Based on the figures of net return from different irrigated crops, and the net return from the upland crops, and the cropping pattern found for sample farmers in wetland and upland, we have estimated the average net return per unit area of the wetland and the upland. From these, the incremental net return for wetland irrigated land was estimated for all the five tanks. This is denoted by (see equation 3).
Based on the average depth of irrigation worked out for different crops in the tank command and the cropping pattern arrived at for the sample farmers in the tank command, we have also estimated the average depth of irrigation per unit of tank irrigated area for each of the five tanks. This is denoted by in the same equation. The ratio of the first
variable (in the numerator) and the second variable (in the denominator) gives the surplus value product from irrigation per unit volume of tank water. Subsequently, based on the total area irrigated by the tank in normal and drought years and the average depth of watering for each crop, the total volume of water diverted from the tank. The multiple of this with the earlier variable (surplus value product from unit volume of water) yields the total economic value generated from the use of tank water for agriculture. It is important to mention here that there is some amount of tentativeness in estimation of the gross irrigated area by tank. We have actually treated the primary data from villagers on tank irrigated area as the area irrigated under paddy and then worked out the area under other irrigated crops in the tank command, purely based on the proportion of the area under those crops obtained from the sample farmers’ data. There also seem to be good amount of tentativeness in the area reported for drought years. For instance, in the case of Rugudipali, the reported area for drought year was only 100 acres, whereas the same for normal year was 6 times higher. The estimates of economic value of water in irrigated production in tank command are given in Table 9. What is interesting to note is that the incremental return from irrigation per unit irrigated area is high during drought years in three out of the five tanks. This basically shows that value of irrigation water become critically important during drought years. During the drought years, the upland farmers are not able to secure good yields for paddy, whereas the farmers in the wetland are able to secure good yields with the availability of irrigation water.
Another interesting phenomenon is that the amount of water used during drought years is much higher than that used in normal years in three out of the five tanks. The reason for this is that a lot of the crop water demand is from paddy, and for this crop, the water demand is being met from the rainfall. The column # 6 and 7 in Table 9 show this. The average depth of watering per unit area of irrigated crop is less during normal year. During normal years, the irrigation water demand for winter crops also would be generally low. This reduces the overall water demand and water withdrawal during normal years. It is important to remember that there isn’t much scope for expanding the command area of a tank during a particular season,
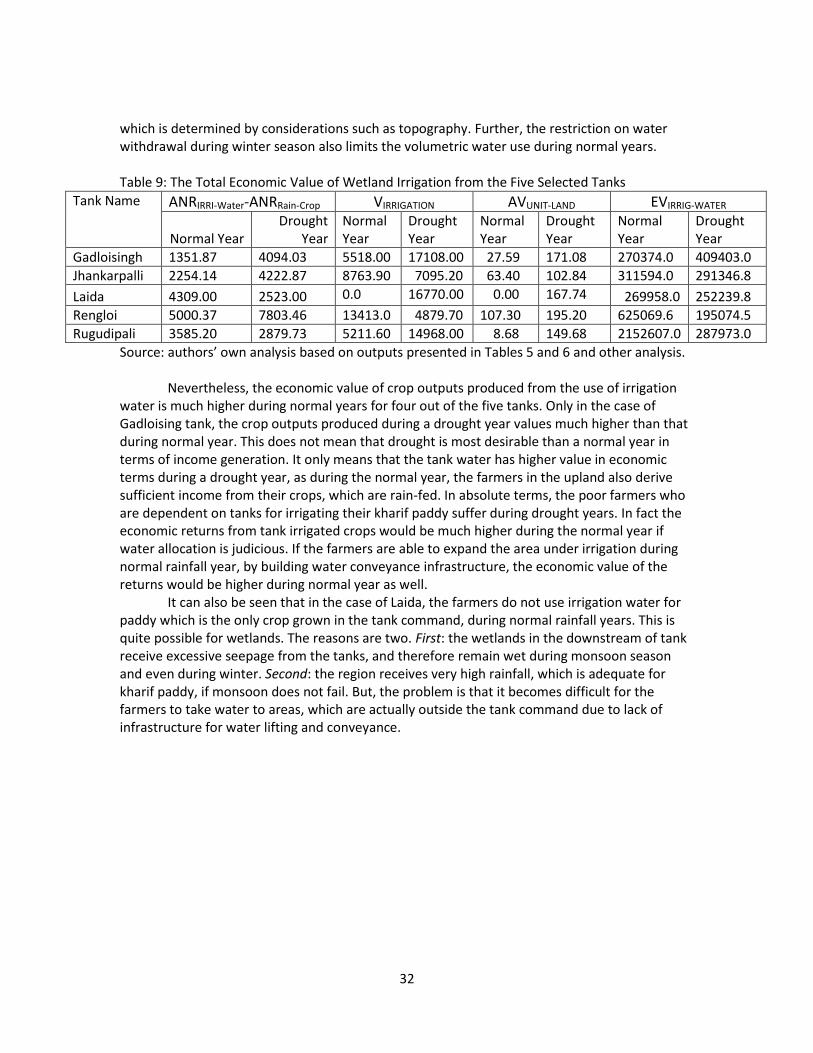
32
which is determined by considerations such as topography. Further, the restriction on water withdrawal during winter season also limits the volumetric water use during normal years. Table 9: The Total Economic Value of Wetland Irrigation from the Five Selected Tanks
Tank Name ANRIRRI-Water-ANRRain-Crop VIRRIGATION AVUNIT-LAND EVIRRIG-WATER
Normal Year Drought
Year Normal Year
Drought Year
Normal Year
Drought Year
Normal Year
Drought Year
Gadloisingh 1351.87 4094.03 5518.00 17108.00 27.59 171.08 270374.0 409403.0
Jhankarpalli 2254.14 4222.87 8763.90 7095.20 63.40 102.84 311594.0 291346.8
Laida 4309.00 2523.00 0.0 16770.00 0.00 167.74 269958.0 252239.8
Rengloi 5000.37 7803.46 13413.0 4879.70 107.30 195.20 625069.6 195074.5
Rugudipali 3585.20 2879.73 5211.60 14968.00 8.68 149.68 2152607.0 287973.0
Source: authors’ own analysis based on outputs presented in Tables 5 and 6 and other analysis. Nevertheless, the economic value of crop outputs produced from the use of irrigation water is much higher during normal years for four out of the five tanks. Only in the case of Gadloising tank, the crop outputs produced during a drought year values much higher than that during normal year. This does not mean that drought is most desirable than a normal year in terms of income generation. It only means that the tank water has higher value in economic terms during a drought year, as during the normal year, the farmers in the upland also derive sufficient income from their crops, which are rain-fed. In absolute terms, the poor farmers who are dependent on tanks for irrigating their kharif paddy suffer during drought years. In fact the economic returns from tank irrigated crops would be much higher during the normal year if water allocation is judicious. If the farmers are able to expand the area under irrigation during normal rainfall year, by building water conveyance infrastructure, the economic value of the returns would be higher during normal year as well. It can also be seen that in the case of Laida, the farmers do not use irrigation water for paddy which is the only crop grown in the tank command, during normal rainfall years. This is quite possible for wetlands. The reasons are two. First: the wetlands in the downstream of tank receive excessive seepage from the tanks, and therefore remain wet during monsoon season and even during winter. Second: the region receives very high rainfall, which is adequate for kharif paddy, if monsoon does not fail. But, the problem is that it becomes difficult for the farmers to take water to areas, which are actually outside the tank command due to lack of infrastructure for water lifting and conveyance.
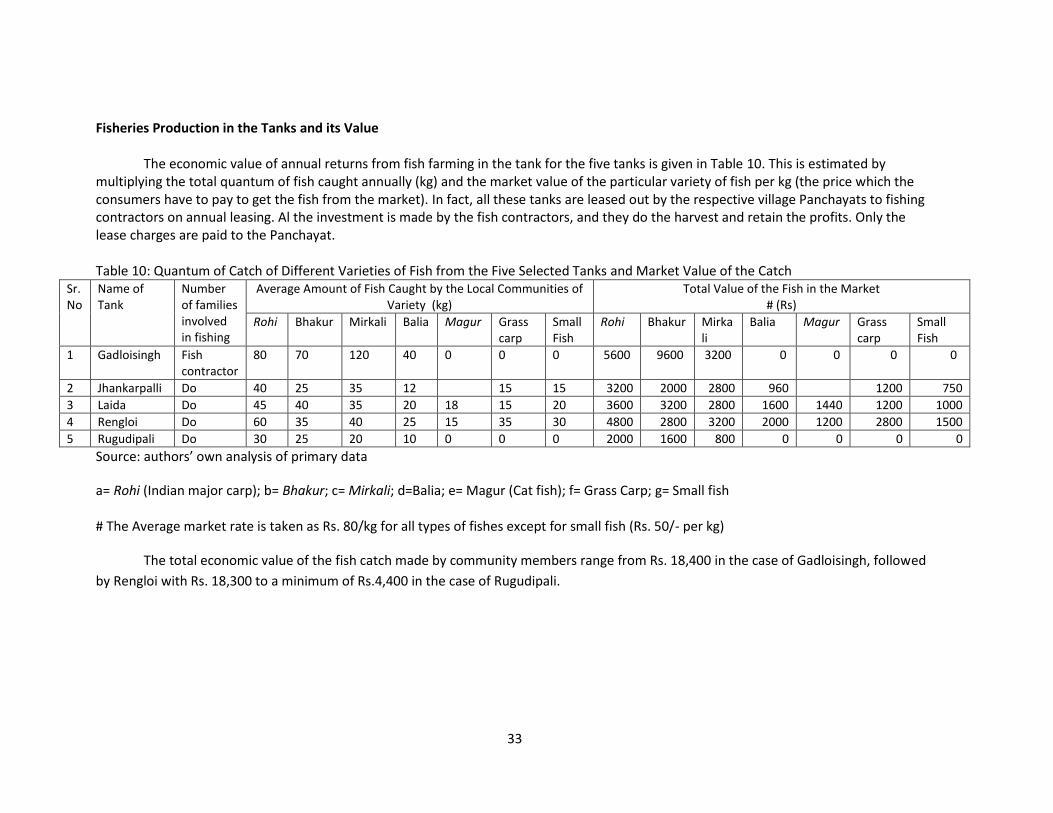
33
Fisheries Production in the Tanks and its Value
The economic value of annual returns from fish farming in the tank for the five tanks is given in Table 10. This is estimated by multiplying the total quantum of fish caught annually (kg) and the market value of the particular variety of fish per kg (the price which the consumers have to pay to get the fish from the market). In fact, all these tanks are leased out by the respective village Panchayats to fishing contractors on annual leasing. Al the investment is made by the fish contractors, and they do the harvest and retain the profits. Only the lease charges are paid to the Panchayat.
Table 10: Quantum of Catch of Different Varieties of Fish from the Five Selected Tanks and Market Value of the Catch
Sr. No
Name of Tank
Number of families involved in fishing
Average Amount of Fish Caught by the Local Communities of Variety (kg)
Total Value of the Fish in the Market # (Rs)
Rohi Bhakur Mirkali Balia Magur Grass carp
Small Fish
Rohi Bhakur Mirkali
Balia Magur Grass carp
Small Fish
1 Gadloisingh Fish contractor
80 70 120 40 0 0 0 5600 9600 3200 0 0 0 0
2 Jhankarpalli Do 40 25 35 12 15 15 3200 2000 2800 960 1200 750
3 Laida Do 45 40 35 20 18 15 20 3600 3200 2800 1600 1440 1200 1000
4 Rengloi Do 60 35 40 25 15 35 30 4800 2800 3200 2000 1200 2800 1500
5 Rugudipali Do 30 25 20 10 0 0 0 2000 1600 800 0 0 0 0
Source: authors’ own analysis of primary data
a= Rohi (Indian major carp); b= Bhakur; c= Mirkali; d=Balia; e= Magur (Cat fish); f= Grass Carp; g= Small fish # The Average market rate is taken as Rs. 80/kg for all types of fishes except for small fish (Rs. 50/- per kg)
The total economic value of the fish catch made by community members range from Rs. 18,400 in the case of Gadloisingh, followed
by Rengloi with Rs. 18,300 to a minimum of Rs.4,400 in the case of Rugudipali.
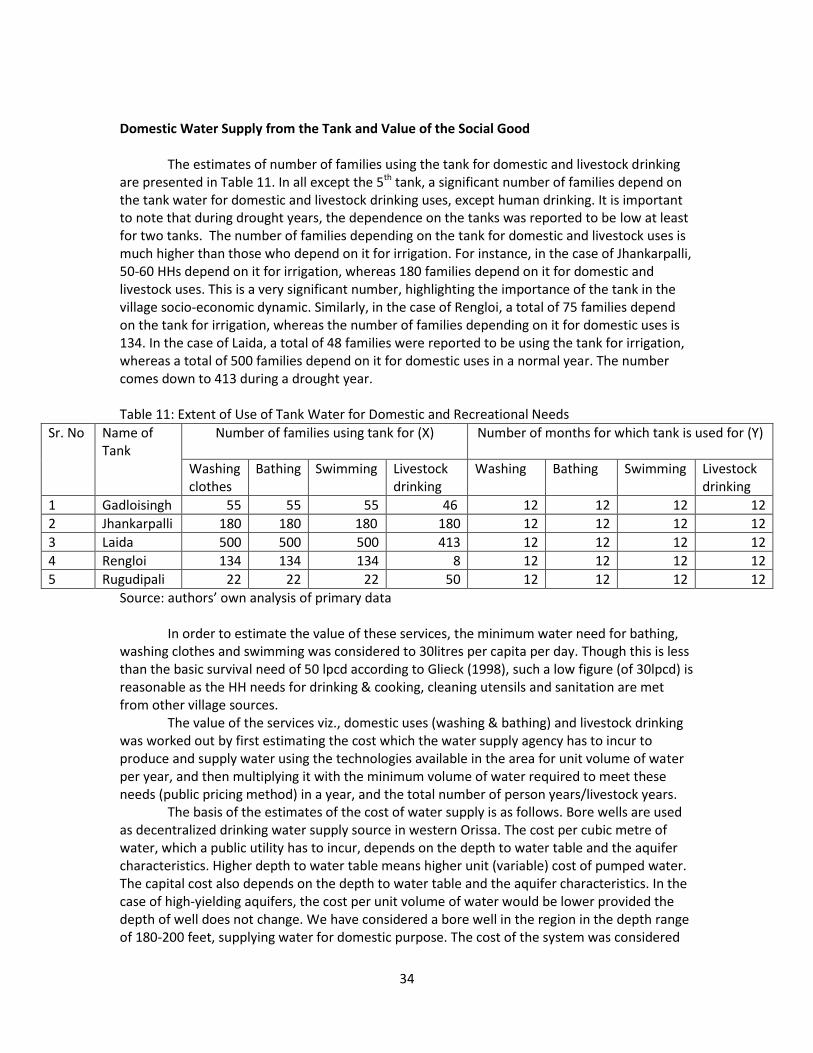
34
Domestic Water Supply from the Tank and Value of the Social Good
The estimates of number of families using the tank for domestic and livestock drinking are presented in Table 11. In all except the 5th tank, a significant number of families depend on the tank water for domestic and livestock drinking uses, except human drinking. It is important to note that during drought years, the dependence on the tanks was reported to be low at least for two tanks. The number of families depending on the tank for domestic and livestock uses is much higher than those who depend on it for irrigation. For instance, in the case of Jhankarpalli, 50-60 HHs depend on it for irrigation, whereas 180 families depend on it for domestic and livestock uses. This is a very significant number, highlighting the importance of the tank in the village socio-economic dynamic. Similarly, in the case of Rengloi, a total of 75 families depend on the tank for irrigation, whereas the number of families depending on it for domestic uses is 134. In the case of Laida, a total of 48 families were reported to be using the tank for irrigation, whereas a total of 500 families depend on it for domestic uses in a normal year. The number comes down to 413 during a drought year.
Table 11: Extent of Use of Tank Water for Domestic and Recreational Needs
Sr. No Name of Tank
Number of families using tank for (X) Number of months for which tank is used for (Y)
Washing clothes
Bathing Swimming Livestock drinking
Washing Bathing Swimming Livestock drinking
1 Gadloisingh 55 55 55 46 12 12 12 12
2 Jhankarpalli 180 180 180 180 12 12 12 12
3 Laida 500 500 500 413 12 12 12 12
4 Rengloi 134 134 134 8 12 12 12 12
5 Rugudipali 22 22 22 50 12 12 12 12
Source: authors’ own analysis of primary data
In order to estimate the value of these services, the minimum water need for bathing, washing clothes and swimming was considered to 30litres per capita per day. Though this is less than the basic survival need of 50 lpcd according to Glieck (1998), such a low figure (of 30lpcd) is reasonable as the HH needs for drinking & cooking, cleaning utensils and sanitation are met from other village sources.
The value of the services viz., domestic uses (washing & bathing) and livestock drinking was worked out by first estimating the cost which the water supply agency has to incur to produce and supply water using the technologies available in the area for unit volume of water per year, and then multiplying it with the minimum volume of water required to meet these needs (public pricing method) in a year, and the total number of person years/livestock years. The basis of the estimates of the cost of water supply is as follows. Bore wells are used as decentralized drinking water supply source in western Orissa. The cost per cubic metre of water, which a public utility has to incur, depends on the depth to water table and the aquifer characteristics. Higher depth to water table means higher unit (variable) cost of pumped water. The capital cost also depends on the depth to water table and the aquifer characteristics. In the case of high-yielding aquifers, the cost per unit volume of water would be lower provided the depth of well does not change. We have considered a bore well in the region in the depth range of 180-200 feet, supplying water for domestic purpose. The cost of the system was considered
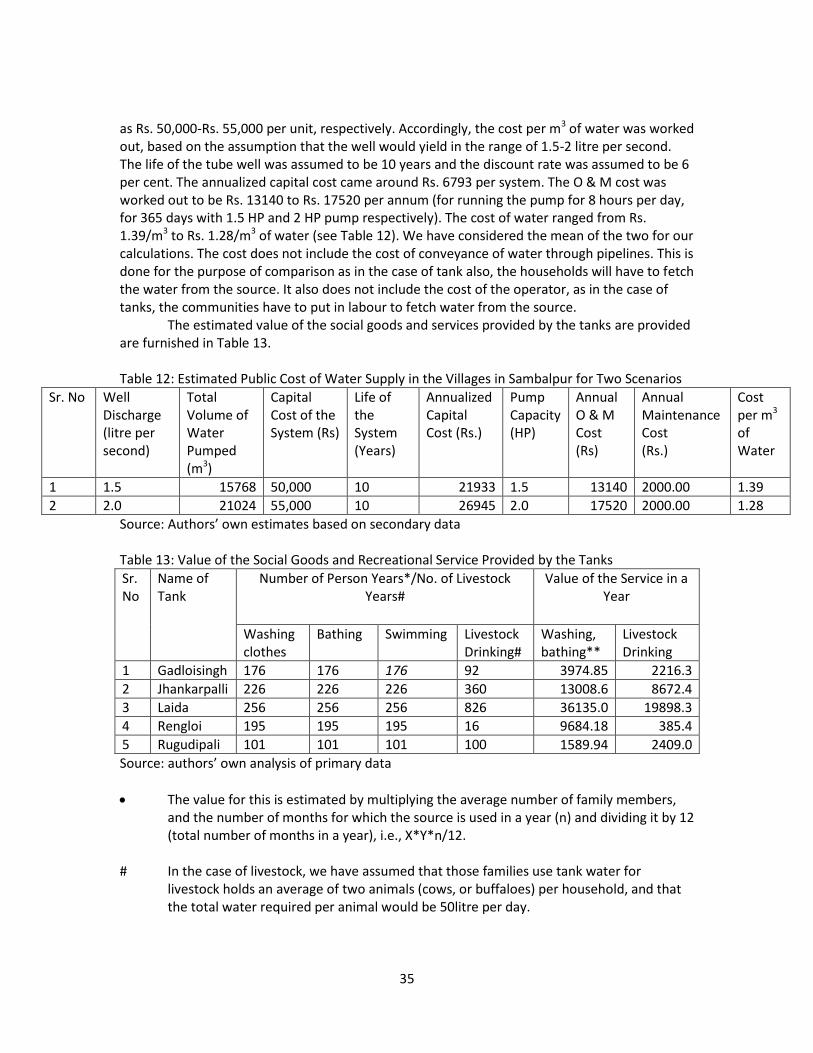
35
as Rs. 50,000-Rs. 55,000 per unit, respectively. Accordingly, the cost per m3 of water was worked out, based on the assumption that the well would yield in the range of 1.5-2 litre per second. The life of the tube well was assumed to be 10 years and the discount rate was assumed to be 6 per cent. The annualized capital cost came around Rs. 6793 per system. The O & M cost was worked out to be Rs. 13140 to Rs. 17520 per annum (for running the pump for 8 hours per day, for 365 days with 1.5 HP and 2 HP pump respectively). The cost of water ranged from Rs. 1.39/m3 to Rs. 1.28/m3 of water (see Table 12). We have considered the mean of the two for our calculations. The cost does not include the cost of conveyance of water through pipelines. This is done for the purpose of comparison as in the case of tank also, the households will have to fetch the water from the source. It also does not include the cost of the operator, as in the case of tanks, the communities have to put in labour to fetch water from the source. The estimated value of the social goods and services provided by the tanks are provided are furnished in Table 13. Table 12: Estimated Public Cost of Water Supply in the Villages in Sambalpur for Two Scenarios
Sr. No Well Discharge (litre per second)
Total Volume of Water Pumped (m3)
Capital Cost of the System (Rs)
Life of the System (Years)
Annualized Capital Cost (Rs.)
Pump Capacity (HP)
Annual O & M Cost (Rs)
Annual Maintenance Cost (Rs.)
Cost per m3 of Water
1 1.5 15768 50,000 10 21933 1.5 13140 2000.00 1.39
2 2.0 21024 55,000 10 26945 2.0 17520 2000.00 1.28
Source: Authors’ own estimates based on secondary data Table 13: Value of the Social Goods and Recreational Service Provided by the Tanks
Sr. No
Name of Tank
Number of Person Years*/No. of Livestock Years#
Value of the Service in a Year
Washing clothes
Bathing Swimming Livestock Drinking#
Washing, bathing**
Livestock Drinking
1 Gadloisingh 176 176 176 92 3974.85 2216.3
2 Jhankarpalli 226 226 226 360 13008.6 8672.4
3 Laida 256 256 256 826 36135.0 19898.3
4 Rengloi 195 195 195 16 9684.18 385.4
5 Rugudipali 101 101 101 100 1589.94 2409.0
Source: authors’ own analysis of primary data
The value for this is estimated by multiplying the average number of family members, and the number of months for which the source is used in a year (n) and dividing it by 12 (total number of months in a year), i.e., X*Y*n/12.
# In the case of livestock, we have assumed that those families use tank water for
livestock holds an average of two animals (cows, or buffaloes) per household, and that the total water required per animal would be 50litre per day.
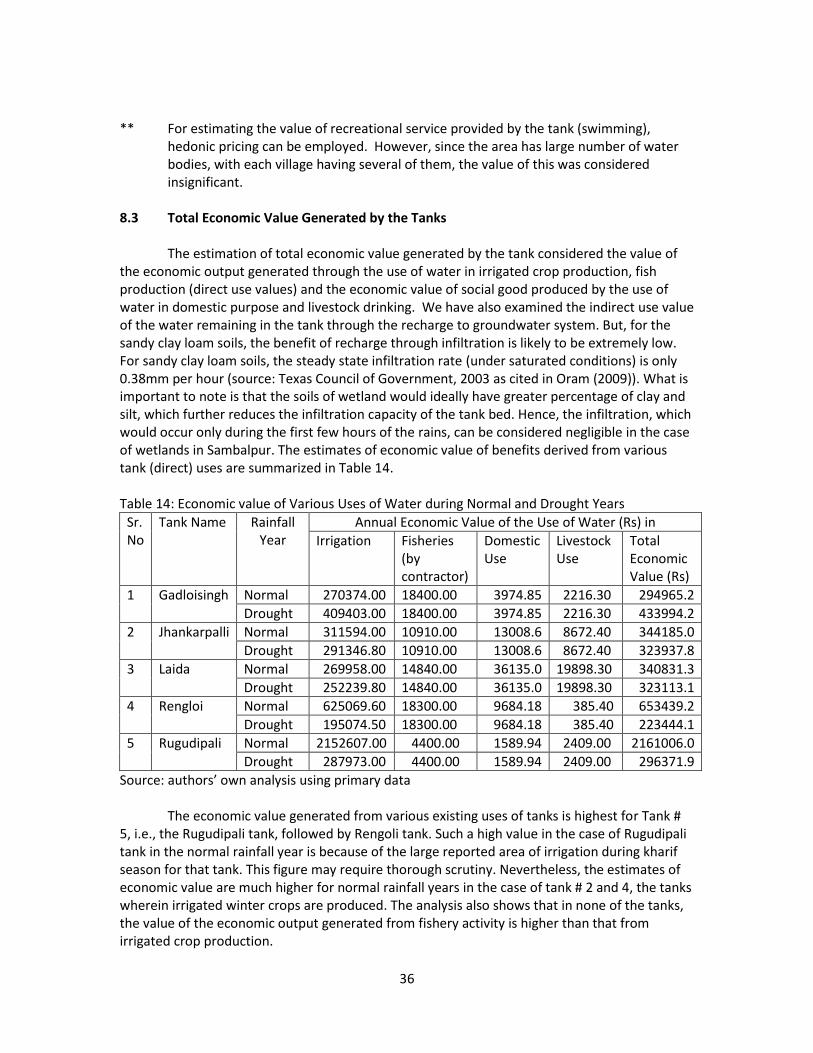
36
** For estimating the value of recreational service provided by the tank (swimming), hedonic pricing can be employed. However, since the area has large number of water bodies, with each village having several of them, the value of this was considered insignificant.
8.3 Total Economic Value Generated by the Tanks The estimation of total economic value generated by the tank considered the value of the economic output generated through the use of water in irrigated crop production, fish production (direct use values) and the economic value of social good produced by the use of water in domestic purpose and livestock drinking. We have also examined the indirect use value of the water remaining in the tank through the recharge to groundwater system. But, for the sandy clay loam soils, the benefit of recharge through infiltration is likely to be extremely low. For sandy clay loam soils, the steady state infiltration rate (under saturated conditions) is only 0.38mm per hour (source: Texas Council of Government, 2003 as cited in Oram (2009)). What is important to note is that the soils of wetland would ideally have greater percentage of clay and silt, which further reduces the infiltration capacity of the tank bed. Hence, the infiltration, which would occur only during the first few hours of the rains, can be considered negligible in the case of wetlands in Sambalpur. The estimates of economic value of benefits derived from various tank (direct) uses are summarized in Table 14. Table 14: Economic value of Various Uses of Water during Normal and Drought Years
Sr. No
Tank Name Rainfall Year
Annual Economic Value of the Use of Water (Rs) in
Irrigation Fisheries (by contractor)
Domestic Use
Livestock Use
Total Economic Value (Rs)
1 Gadloisingh
Normal 270374.00 18400.00 3974.85 2216.30 294965.2
Drought 409403.00 18400.00 3974.85 2216.30 433994.2
2 Jhankarpalli
Normal 311594.00 10910.00 13008.6 8672.40 344185.0
Drought 291346.80 10910.00 13008.6 8672.40 323937.8
3 Laida Normal 269958.00 14840.00 36135.0 19898.30 340831.3
Drought 252239.80 14840.00 36135.0 19898.30 323113.1
4 Rengloi Normal 625069.60 18300.00 9684.18 385.40 653439.2
Drought 195074.50 18300.00 9684.18 385.40 223444.1
5 Rugudipali Normal 2152607.00 4400.00 1589.94 2409.00 2161006.0
Drought 287973.00 4400.00 1589.94 2409.00 296371.9
Source: authors’ own analysis using primary data The economic value generated from various existing uses of tanks is highest for Tank # 5, i.e., the Rugudipali tank, followed by Rengoli tank. Such a high value in the case of Rugudipali tank in the normal rainfall year is because of the large reported area of irrigation during kharif season for that tank. This figure may require thorough scrutiny. Nevertheless, the estimates of economic value are much higher for normal rainfall years in the case of tank # 2 and 4, the tanks wherein irrigated winter crops are produced. The analysis also shows that in none of the tanks, the value of the economic output generated from fishery activity is higher than that from irrigated crop production.
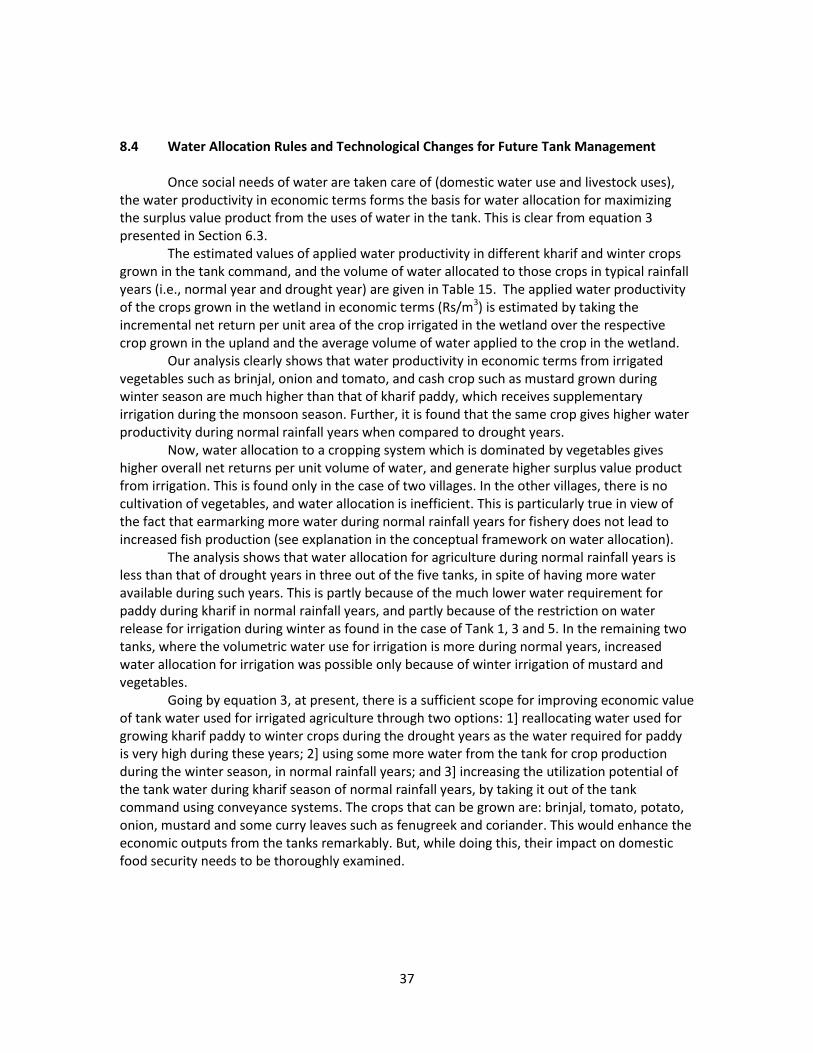
37
8.4 Water Allocation Rules and Technological Changes for Future Tank Management Once social needs of water are taken care of (domestic water use and livestock uses), the water productivity in economic terms forms the basis for water allocation for maximizing the surplus value product from the uses of water in the tank. This is clear from equation 3 presented in Section 6.3. The estimated values of applied water productivity in different kharif and winter crops grown in the tank command, and the volume of water allocated to those crops in typical rainfall years (i.e., normal year and drought year) are given in Table 15. The applied water productivity of the crops grown in the wetland in economic terms (Rs/m3) is estimated by taking the incremental net return per unit area of the crop irrigated in the wetland over the respective crop grown in the upland and the average volume of water applied to the crop in the wetland.
Our analysis clearly shows that water productivity in economic terms from irrigated vegetables such as brinjal, onion and tomato, and cash crop such as mustard grown during winter season are much higher than that of kharif paddy, which receives supplementary irrigation during the monsoon season. Further, it is found that the same crop gives higher water productivity during normal rainfall years when compared to drought years.
Now, water allocation to a cropping system which is dominated by vegetables gives higher overall net returns per unit volume of water, and generate higher surplus value product from irrigation. This is found only in the case of two villages. In the other villages, there is no cultivation of vegetables, and water allocation is inefficient. This is particularly true in view of the fact that earmarking more water during normal rainfall years for fishery does not lead to increased fish production (see explanation in the conceptual framework on water allocation).
The analysis shows that water allocation for agriculture during normal rainfall years is less than that of drought years in three out of the five tanks, in spite of having more water available during such years. This is partly because of the much lower water requirement for paddy during kharif in normal rainfall years, and partly because of the restriction on water release for irrigation during winter as found in the case of Tank 1, 3 and 5. In the remaining two tanks, where the volumetric water use for irrigation is more during normal years, increased water allocation for irrigation was possible only because of winter irrigation of mustard and vegetables.
Going by equation 3, at present, there is a sufficient scope for improving economic value of tank water used for irrigated agriculture through two options: 1] reallocating water used for growing kharif paddy to winter crops during the drought years as the water required for paddy is very high during these years; 2] using some more water from the tank for crop production during the winter season, in normal rainfall years; and 3] increasing the utilization potential of the tank water during kharif season of normal rainfall years, by taking it out of the tank command using conveyance systems. The crops that can be grown are: brinjal, tomato, potato, onion, mustard and some curry leaves such as fenugreek and coriander. This would enhance the economic outputs from the tanks remarkably. But, while doing this, their impact on domestic food security needs to be thoroughly examined.
38
Table 15: Water Productivity of Different Crops during Normal and Drought Years
Tank Type of Year
Paddy Brinjal Mustard Onion Potato Tomato Others
Rs /m3 Volume (m3)
Rs /m3 Volume (m3)
Rs /m3 Volume (m3)
Rs /m3 Volume (m3)
Rs /m3 Volume (m3)
Rs /m3 Volume (m3)
Rs /m3 Volume (m3)
Gadloisingh Normal Year 25.12 5518.80
Drought Year 22.93 17108.5
Jhankarpalli Normal Year
101.38 1723.80
27.62 3864.20 7.13 1646.80 59.88 4154.80 27.62 1204.20
Drought Year 2.10 5607.60 34.81 2140.10
23.26 2285.60 4.63 1045.90 56.69 1573.90 17.49 837.70
Laida Normal Year #
Drought Year 8.22 16774.70
Rengloi Normal Year 9.0 5348.20
273.23 3220.90
NA 1612.0
55.64 3233.30
Drought Year 12.24
288.29 563.60
411.0
20.47 1346.10
Rugudipali Normal Year 404.92 5211.60
Drought Year 22.19 14968.80
Source: authors’ analysis using primary data # The applied water productivity value is not estimated as the value of denominator, i.e., irrigation dosage, is zero.
39
8.5 Institutional Arrangement for Management of Tanks for Multiple Uses It is clear from our analysis that the water demand for agriculture is extremely high during drought years due to the peculiar nature of the cropping pattern in the tank commands. During drought years there is greater restriction on the amount of water that can be diverted from the tank during kharif season also. This reduces the area irrigated during those years, and hence in most instances the economic value generated from the use of water is less as compared to the normal rainfall years.
On the contrary, kharif water demand during normal years is much lower as compared to drought years. This is because of low irrigation water requirement per unit area of kharif paddy, and the constraints in expanding the area under irrigation. But, there is abundance of water available in the tanks during the normal rainfall years, and only a small quantity of that water is actually utilized for irrigation during kharif season. Because of restriction on lifting for irrigation during the non-monsoon (winter) season imposed by the Panchayat and the fishing contractors, no winter crops are taken by farmers during the winter season in Tank # 1, 3 and 5 with the result that the volume of water drawn for agriculture in normal rainfall years is much less than that of drought years. This imposes a severe constraint on the scale of economic activity that can be generated from agricultural use of tank water.
Though there is a great scope for releasing extra water during normal years, it is not possible because of the restriction imposed by the fishing contractors. This means, the “rules” and “norms” for allocation of water from the tank have to change. However, such change in norms will not adversely affect the fish production as the increase in volume of water, beyond a certain level, will not result in increased fish production. In tank 2 and 4, some water withdrawal was allowed for irrigation during winter season (in both normal and drought years), and as a result the volumetric water withdrawal was found to be high during normal years.
Mechanisms should be made to harness this water for irrigation during kharif season or more water should be allocated for irrigated winter crops, or both. The first intervention would require infrastructure for conveyance of water to the uplands falling outside the command area of the tanks. The second would require a strong institutional mechanism to make sure that while water is drawn for agriculture, it does not hamper the prospects of fish farming. This would help maximize the gross tank product. Whereas in drought years, water used for growing kharif paddy, which requires intensive irrigation, can be re-allocated for high valued winter crops so as to obtain higher water productivity in economic terms.
But to affect these new rules for water allocation, there is a need for an effective institution for water allocation at the local level, which would make judicious allocation of water amongst different sectors of water use such as domestic use, livestock use, irrigation and fisheries based on economic efficiency criteria. The Panchayat, which is the only local institution that is mandated with the management of these village tanks, is not in a position to determine the water requirements for crops and fish production. It could not assess the values generated from water, ascertain the total amount of inflows the tank receives in different years, and prepare proper water allocation plans. Neither it has got the technical skills to plan, develop and manage water resources, to which the tank form a part, for meeting various social, economic and ecological needs, in an integrated manner, nor it has got the capacity to carry out water quality monitoring and ensuring good quality of water for domestic needs and fisheries. The Panchayat has its vested interest in leasing out the tank to fishery contractors owing to the
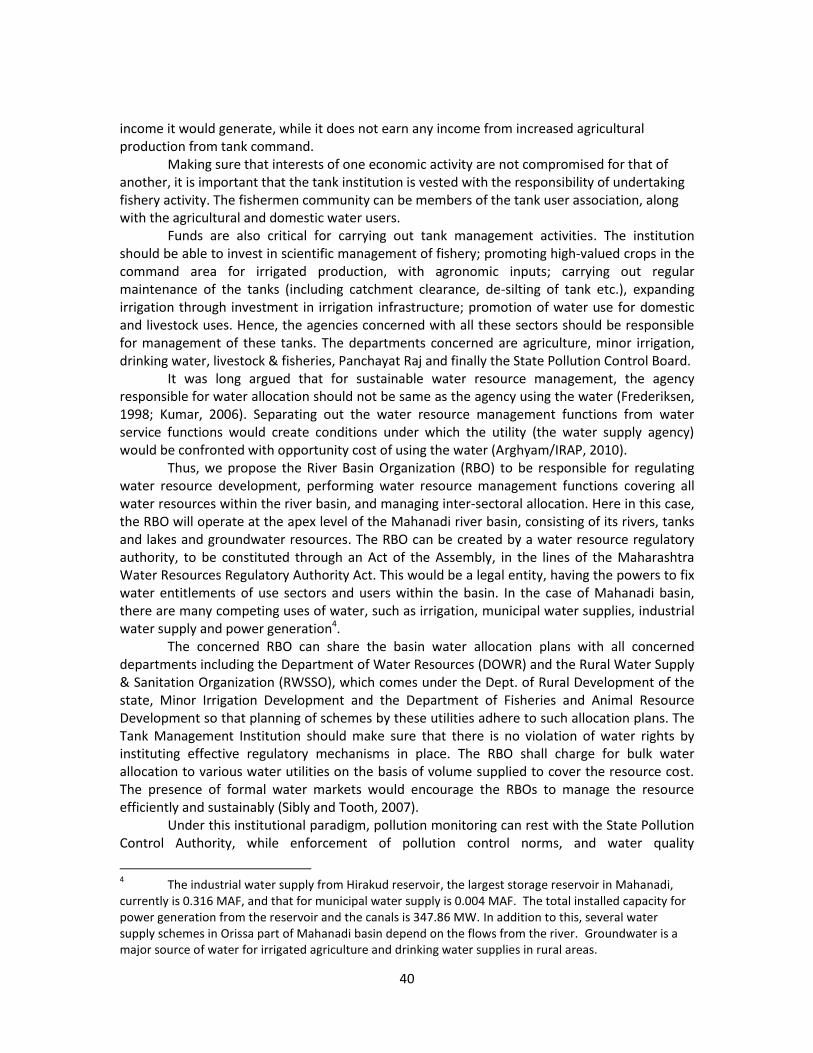
40
income it would generate, while it does not earn any income from increased agricultural production from tank command.
Making sure that interests of one economic activity are not compromised for that of another, it is important that the tank institution is vested with the responsibility of undertaking fishery activity. The fishermen community can be members of the tank user association, along with the agricultural and domestic water users. Funds are also critical for carrying out tank management activities. The institution should be able to invest in scientific management of fishery; promoting high-valued crops in the command area for irrigated production, with agronomic inputs; carrying out regular maintenance of the tanks (including catchment clearance, de-silting of tank etc.), expanding irrigation through investment in irrigation infrastructure; promotion of water use for domestic and livestock uses. Hence, the agencies concerned with all these sectors should be responsible for management of these tanks. The departments concerned are agriculture, minor irrigation, drinking water, livestock & fisheries, Panchayat Raj and finally the State Pollution Control Board.
It was long argued that for sustainable water resource management, the agency responsible for water allocation should not be same as the agency using the water (Frederiksen, 1998; Kumar, 2006). Separating out the water resource management functions from water service functions would create conditions under which the utility (the water supply agency) would be confronted with opportunity cost of using the water (Arghyam/IRAP, 2010).
Thus, we propose the River Basin Organization (RBO) to be responsible for regulating water resource development, performing water resource management functions covering all water resources within the river basin, and managing inter-sectoral allocation. Here in this case, the RBO will operate at the apex level of the Mahanadi river basin, consisting of its rivers, tanks and lakes and groundwater resources. The RBO can be created by a water resource regulatory authority, to be constituted through an Act of the Assembly, in the lines of the Maharashtra Water Resources Regulatory Authority Act. This would be a legal entity, having the powers to fix water entitlements of use sectors and users within the basin. In the case of Mahanadi basin, there are many competing uses of water, such as irrigation, municipal water supplies, industrial water supply and power generation4.
The concerned RBO can share the basin water allocation plans with all concerned departments including the Department of Water Resources (DOWR) and the Rural Water Supply & Sanitation Organization (RWSSO), which comes under the Dept. of Rural Development of the state, Minor Irrigation Development and the Department of Fisheries and Animal Resource Development so that planning of schemes by these utilities adhere to such allocation plans. The Tank Management Institution should make sure that there is no violation of water rights by instituting effective regulatory mechanisms in place. The RBO shall charge for bulk water allocation to various water utilities on the basis of volume supplied to cover the resource cost. The presence of formal water markets would encourage the RBOs to manage the resource efficiently and sustainably (Sibly and Tooth, 2007).
Under this institutional paradigm, pollution monitoring can rest with the State Pollution Control Authority, while enforcement of pollution control norms, and water quality
4 The industrial water supply from Hirakud reservoir, the largest storage reservoir in Mahanadi,
currently is 0.316 MAF, and that for municipal water supply is 0.004 MAF. The total installed capacity for power generation from the reservoir and the canals is 347.86 MW. In addition to this, several water supply schemes in Orissa part of Mahanadi basin depend on the flows from the river. Groundwater is a major source of water for irrigated agriculture and drinking water supplies in rural areas.
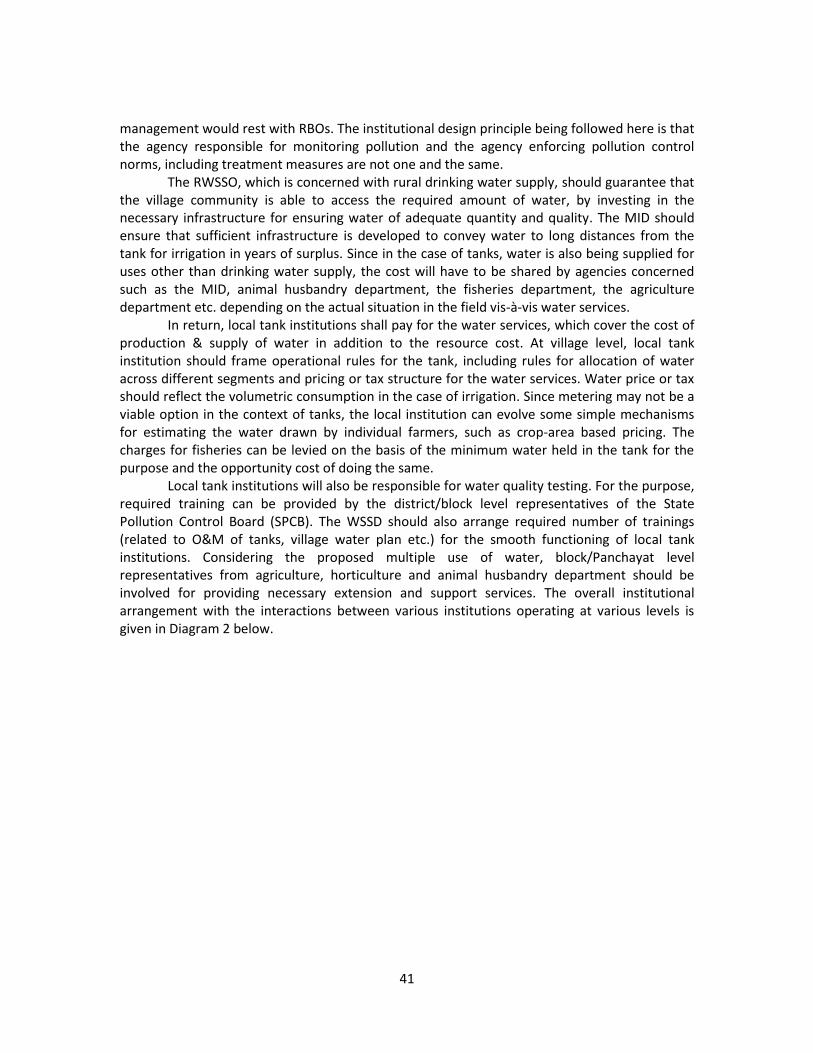
41
management would rest with RBOs. The institutional design principle being followed here is that the agency responsible for monitoring pollution and the agency enforcing pollution control norms, including treatment measures are not one and the same.
The RWSSO, which is concerned with rural drinking water supply, should guarantee that the village community is able to access the required amount of water, by investing in the necessary infrastructure for ensuring water of adequate quantity and quality. The MID should ensure that sufficient infrastructure is developed to convey water to long distances from the tank for irrigation in years of surplus. Since in the case of tanks, water is also being supplied for uses other than drinking water supply, the cost will have to be shared by agencies concerned such as the MID, animal husbandry department, the fisheries department, the agriculture department etc. depending on the actual situation in the field vis-à-vis water services.
In return, local tank institutions shall pay for the water services, which cover the cost of production & supply of water in addition to the resource cost. At village level, local tank institution should frame operational rules for the tank, including rules for allocation of water across different segments and pricing or tax structure for the water services. Water price or tax should reflect the volumetric consumption in the case of irrigation. Since metering may not be a viable option in the context of tanks, the local institution can evolve some simple mechanisms for estimating the water drawn by individual farmers, such as crop-area based pricing. The charges for fisheries can be levied on the basis of the minimum water held in the tank for the purpose and the opportunity cost of doing the same.
Local tank institutions will also be responsible for water quality testing. For the purpose, required training can be provided by the district/block level representatives of the State Pollution Control Board (SPCB). The WSSD should also arrange required number of trainings (related to O&M of tanks, village water plan etc.) for the smooth functioning of local tank institutions. Considering the proposed multiple use of water, block/Panchayat level representatives from agriculture, horticulture and animal husbandry department should be involved for providing necessary extension and support services. The overall institutional arrangement with the interactions between various institutions operating at various levels is given in Diagram 2 below.
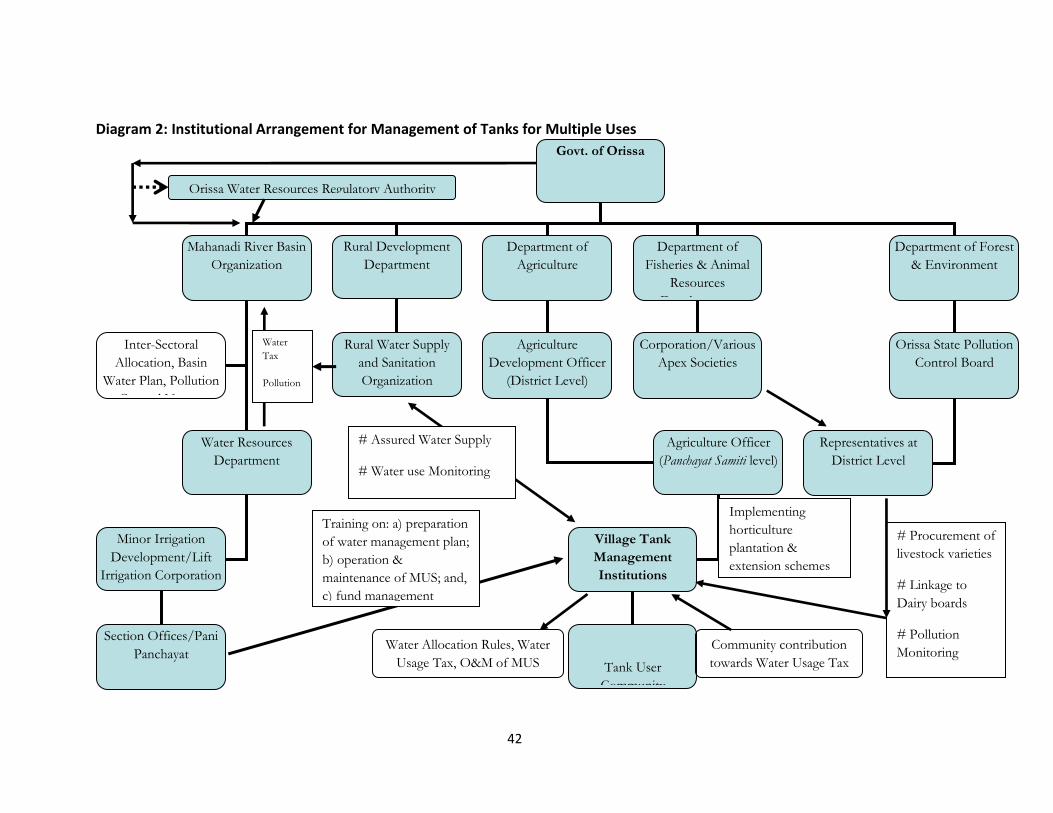
42
Diagram 2: Institutional Arrangement for Management of Tanks for Multiple Uses
Govt. of Orissa
Mahanadi River Basin
Organization
Department of
Agriculture
Department of Forest
& Environment
Water Resources
Department
Agriculture
Development Officer
(District Level)
Orissa State Pollution
Control Board
Inter-Sectoral
Allocation, Basin
Water Plan, Pollution
Control Norms
interventions
Minor Irrigation
Development/Lift
Irrigation Corporation
Section Offices/Pani
Panchayat
Agriculture Officer
(Panchayat Samiti level)
Implementing
horticulture
plantation &
extension schemes
Department of
Fisheries & Animal
Resources
Development
Corporation/Various
Apex Societies
# Assured Water Supply
# Water use Monitoring
# Village payment for
water supply Training on: a) preparation
of water management plan;
b) operation &
maintenance of MUS; and,
c) fund management
Water
Tax
Pollution
Tax
Orissa Water Resources Regulatory Authority
(Proposed)
Rural Development
Department
Rural Water Supply
and Sanitation
Organization
Village Tank
Management
Institutions
Tank User
Community
Representatives at
District Level
# Procurement of
livestock varieties
# Linkage to
Dairy boards
# Pollution
Monitoring
# Training on
Water Quality
Testing
Water Allocation Rules, Water
Usage Tax, O&M of MUS
Community contribution
towards Water Usage Tax

43

44
9. Findings and Conclusions Analysis of five wetlands in western Orissa shows that that there are five major uses of water from the wetland. They are domestic water use; livestock water use; water use for irrigation; water use for fish production; and swimming, which is a recreational use. The economic value of the multiple use benefits created by the direct use of water from the tank was estimated by several methods, viz., hedonic pricing method, market analysis and public pricing method. The total economic value (TEV) of various uses ranged from Rs. 2.95lac in a normal year in Gadloisingh tank to Rs. 21.61lac in the case of Rugudipali tank in a normal year. Interestingly, the incremental return from the use of water per unit area of irrigated crop in the wetland over upland was found to be higher during drought years for three tanks, indicating the greater value the tank water has for the farmers in such years. Nevertheless, at the aggregate level, the incremental return from the use of tank water was found to be lower in four out of the five tanks, indicating the distress it causes on poor tank irrigators. Irrigated agriculture using tank water produces the highest value in economic terms in all the tanks.
Water allocation from the tanks for agriculture during normal rainfall years is less than that of drought years in three out of the five tanks, in spite of having more water available during such years. In the remaining two tanks, where the volumetric water use is more during normal years, it was made possible through winter irrigation. The extremely low water demand for paddy grown during the kharif season, the inability to expand the command of the tank, and the restriction on water withdrawal during winter season imposed by the Panchayat, which leases out the tank to contractors for fish production, are the reasons for this. Because of this restricted water allocation, the economic value of the benefits realized from the use of tank water is quite low during normal years. Irrigated agriculture is in direct conflict with fishery production.
Water productivity analysis shows that all the winter crops except potato have higher water productivity as compared to kharif paddy, during normal as well as drought years. Also, the same crop, grown in the wetland, yields higher water productivity during normal years as compared to drought years. A conceptual model developed for analyzing the gross tank product from direct uses of water from the tank for different water availability scenarios (Diagram 1). Subsequently, we have also derived the mathematical formulations for simulating the economic value of various benefits derived from the tank under various water allocation scenarios, with various physical and socio-economic constraints induced as constraints and boundary conditions.
Application of this model for the current situation in the tanks shows that there are no significant trade-offs between maximizing the economic value of water in agriculture production, and meeting water needs for other existing uses of the tanks. Consequently, there is a sufficient scope for improving economic value of tank water used for irrigated agriculture, without compromising on the basic needs and fisheries. Three major options for this are: 1] reallocating water used for growing kharif paddy to winter crops during the drought years as the water required for paddy is very high during these years; 2] using some more water from the tank for production of crops that are high valued, and that which give high economic returns per unit volume of water during the winter season, in normal rainfall years; and 3] increasing the utilization potential of the tank water in kharif season itself by taking it to areas outside the command through new conveyance systems. The crops that can be grown during winter are: brinjal, tomato, potato, onion, mustard and some curry leaves such as fenugreek and coriander.
45
But to affect the enforcement of these rules, strong institutional intervention would be required. Water reallocation is the biggest challenge. First, there should be sufficient infrastructure for expanding the command area of the tank during normal rainfall years. Second: there is a need for an institutional mechanism to ensure that sufficient water from the tank is earmarked for winter crop production. This can be done without compromising on fish production which needs the presence of minimum quantity of water for longer time periods. This should be supported by good scientific and technical knowledge of growing horticultural crops, and raising fish. Periodic water quality testing is required for ensuring good quality water for domestic uses, and fisheries. It is to be kept in mind that keeping a lot of water in the tank, without allowing it to be used for crop production, for fisheries does not result in increased fish yield.
The institutional arrangement suggested for tank management comprises administrative set up, rules and regulations, water right, and mechanisms for generating finance for tank management, which ensure local institutional capacity for management of these tanks as multiple use systems for rural livelihood enhancement. There is a great scope for further research to deepen the understanding of tanks in the region. The future research can concentrate on mapping out actual area irrigated by tanks in typical rainfall years, valuation of the ecological services offered by the tanks, and undertaking the analysis at the level of sub-basins. Remote sensing and GIS would be the best tool for mapping out the area irrigated.
Acknowledgements The authors, on behalf of the Institute for Resource Analysis and Policy, and Manav Adhikar Seva Samiti (MASS) express their sincere gratitude to the IWMI-Tata Water Policy Research program (ITP), Patancheru, AP, and Prof. K. Palanisami, Director, ITP for extending financial support for undertaking this research and also for providing valuable inputs during finalization of the research proposal.
References Arghyam/Institute for Resource Analysis and Policy (IRAP) (2010) Developing a Tool Kit on
Integrated Urban Water Management in India, final report submitted to Arghyam, Bangalore, October, 2010.
Asian Development Bank (2006) Rehabilitation and Management of Tanks in India: A Study of
Selected States, Asian Development Bank, Manila, Philippines. Central Ground Water Board (CGWB), 2006. Dynamic ground water resources of India.
Faridabad, India: Ministry of Water Resources, Govt. of India. Foster, J.H. (1978) Measuring the Social Value of Wetland Benefits, In Greeson, P.E.., Clarke, J.R
(eds.) Wetland Functions and Values: The State of our Understanding, Proceedings of the National Symposium on Wetlands, 7-10 November 1978, American Water Resources Association, Lake Buena Vista, Florida.
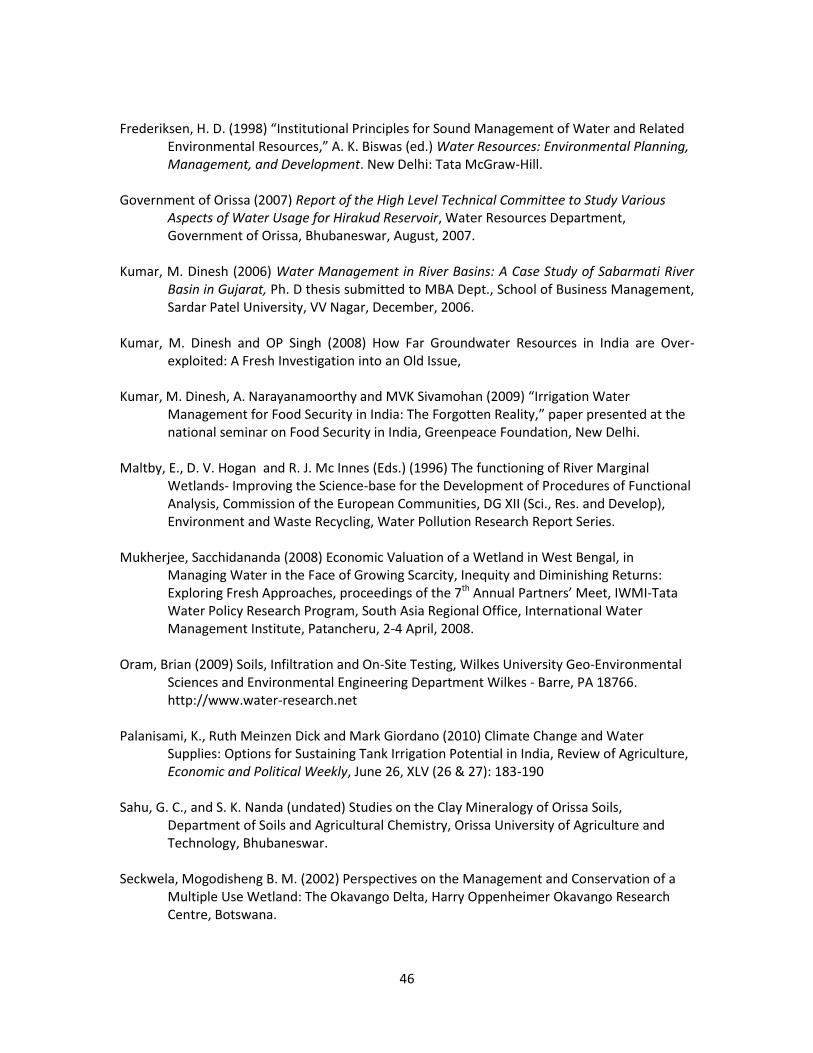
46
Frederiksen, H. D. (1998) “Institutional Principles for Sound Management of Water and Related Environmental Resources,” A. K. Biswas (ed.) Water Resources: Environmental Planning, Management, and Development. New Delhi: Tata McGraw-Hill.
Government of Orissa (2007) Report of the High Level Technical Committee to Study Various
Aspects of Water Usage for Hirakud Reservoir, Water Resources Department, Government of Orissa, Bhubaneswar, August, 2007.
Kumar, M. Dinesh (2006) Water Management in River Basins: A Case Study of Sabarmati River
Basin in Gujarat, Ph. D thesis submitted to MBA Dept., School of Business Management, Sardar Patel University, VV Nagar, December, 2006.
Kumar, M. Dinesh and OP Singh (2008) How Far Groundwater Resources in India are Over-
exploited: A Fresh Investigation into an Old Issue, Kumar, M. Dinesh, A. Narayanamoorthy and MVK Sivamohan (2009) “Irrigation Water
Management for Food Security in India: The Forgotten Reality,” paper presented at the national seminar on Food Security in India, Greenpeace Foundation, New Delhi.
Maltby, E., D. V. Hogan and R. J. Mc Innes (Eds.) (1996) The functioning of River Marginal
Wetlands- Improving the Science-base for the Development of Procedures of Functional Analysis, Commission of the European Communities, DG XII (Sci., Res. and Develop), Environment and Waste Recycling, Water Pollution Research Report Series.
Mukherjee, Sacchidananda (2008) Economic Valuation of a Wetland in West Bengal, in
Managing Water in the Face of Growing Scarcity, Inequity and Diminishing Returns: Exploring Fresh Approaches, proceedings of the 7th Annual Partners’ Meet, IWMI-Tata Water Policy Research Program, South Asia Regional Office, International Water Management Institute, Patancheru, 2-4 April, 2008.
Oram, Brian (2009) Soils, Infiltration and On-Site Testing, Wilkes University Geo-Environmental
Sciences and Environmental Engineering Department Wilkes - Barre, PA 18766. http://www.water-research.net
Palanisami, K., Ruth Meinzen Dick and Mark Giordano (2010) Climate Change and Water
Supplies: Options for Sustaining Tank Irrigation Potential in India, Review of Agriculture, Economic and Political Weekly, June 26, XLV (26 & 27): 183-190
Sahu, G. C., and S. K. Nanda (undated) Studies on the Clay Mineralogy of Orissa Soils,
Department of Soils and Agricultural Chemistry, Orissa University of Agriculture and Technology, Bhubaneswar.
Seckwela, Mogodisheng B. M. (2002) Perspectives on the Management and Conservation of a
Multiple Use Wetland: The Okavango Delta, Harry Oppenheimer Okavango Research Centre, Botswana.

47
Sibly, H. and Richard Tooth (2007) Bringing Competition to Urban Water Supply, School of Economics and Finance, UTAS, Australia.
Sikka, Alok K. (2009) Water Productivity of Different Agricultural Systems, in Kumar, M. Dinesh
and Upali Amarasinghe (Eds.) Water Productivity Improvements in Indian Agriculture: Potentials, Constraints and Prospects, Strategic Analyses of the National River Linking Project (NRLP) of India-Series 4, International Water Management Institute, Colombo, Sri Lanka.
Srivastava, R. C., K. Kannan, S. Mohanty, P. Nanda, N. Sahoo, R. K. Mohanty and N. Das (2009)
Rainwater Management for Smallholder Irrigation and its Impact on Crop Yield in Eastern India, Water Resources Management, 27 (6):
Turner, R.K., JCJM van Den Bergh, A. Barendregt, E. Maltby (1998) Ecological-Economic Analysis of Wetlands: Science and Social Science Integration, paper prepared for Global Wetlands Economics Network.
Van Koppen, Barbara, S. Smits, R. Moriarty, F. Penning Devries, M. Mikhail and E. Boelee (2009)
Climbing the Water Ladder: Multiple Use Water Services for Poverty Reduction, The Hague, The Netherlands, IRC International Water and Sanitation Centre and International Water Management Institute, (TP series; no. 52), 213 p.
Webb, G.J.W. (1997). The Links between Wildlife Conservation and Sustainable Use, in
Conservation Through Sustainable Use of Wildlife (eds: G. Grigg, P. Hale and D. Lunney). Centre for Conservation Biology, University of Queensland, Brisbane, 15-28.