Embed Size (px)
Citation preview

TANF/SFA/ WorkFirst
SFY
2017 The federal Temporary Assistance for Needy Families (TANF) and the State Family Assistance (SFA) programs provide cash grants for eligible low-income families. The state’s WorkFirst program provides welfare-to-work and support services to TANF/SFA clients to help them move forward on a pathway to self-sufficiency.
ESA Briefing Book

TANF/SFA/WorkFirst 2017
2 ESA Briefing Book
Table of Contents TANF, SFA, and WorkFirst Overview ......................................................................................................................... 3
Selected TANF/SFA Program Overview, SFY 2016 and SFY 2017 .............................................................................. 4
TANF/SFA Caseload, SFY 2008 – 2017 ....................................................................................................................... 5
TANF/SFA Caseload by Funding Type, SFY 2017 ....................................................................................................... 6
Caseload by DSHS Region and CSO of Issuance and Residence, June 2017 Snapshot .............................................. 7
Caseload by Home and Community Services Offices (HCS), June 2017 Snapshot .................................................. 12
Caseload by County of Residence, June 2017 Snapshot ......................................................................................... 14
Client Density Maps by Residential County, June 2017 Snapshot .......................................................................... 15
Caseload by Case Type, SFY 2008 – 2017 ................................................................................................................ 17
Child-Only Caseload by Major Caretaker Groups, June 2017 Snapshot .................................................................. 18
Caseload by Number of Children, SFY 2008 – 2017 ................................................................................................ 19
Teen Head of Household, SFY 2008 – 2017 ............................................................................................................. 20
Teen Parents under Age 18, SFY 2008 – 2017 ......................................................................................................... 21
Pregnant Women & Women with Child under Age 1, SFY 2008 – 2017 ................................................................. 22
TANF/SFA Adult Clients Participating in WorkFirst Activities, SFY 2017 ................................................................. 23
WorkFirst Cases and Clients in NCS Sanction Status, SFY 2008 – 2017 ................................................................... 24
WorkFirst Clients in NCS Sanction Status by Month, SFY 2017 ............................................................................... 25
Employment Rates for WorkFirst Clients, SFY 2008 – 2017 .................................................................................... 26
WorkFirst Adults Receiving Quarterly Wages, July 2012 – June 2017 .................................................................... 27
Caseload by Primary Language, June 2017 Snapshot ............................................................................................. 28
Client Demographics, June 2017 Snapshot ............................................................................................................. 29
Child Demographics, June 2017 Snapshot .............................................................................................................. 31

TANF/SFA/WorkFirst 2017
3 ESA Briefing Book
TANF, SFA, and WorkFirst Overview This chapter summarizes the Temporary Assistance for Needy Families, State Family Assistance, and WorkFirst caseload and client data for SFY 2017. Temporary Assistance for Needy Families (TANF) provides cash grants for families in need. Persons who are caring for a relative's child, or are legal guardians, or are acting in the place of a parent, are also able to apply for TANF benefits on behalf of these eligible children. Persons who are residents of Washington State and are ineligible for TANF solely because of eligibility changes due to the Welfare Reform Act may be eligible for State Family Assistance (SFA). Some TANF/SFA families participate in the WorkFirst Program, which helps participants find and keep jobs. Highlights Washington State’s TANF/SFA average monthly caseload declined by 8.7% in SFY 2017, from 31,284 in SFY 2016 to 28,555 in SFY 2017. The decline is part of an ongoing trend, although it slowed as a result of a 9% grant increase that began in July 2015. The monthly average proportion of WorkFirst clients sanctioned due to noncompliance with participation requirements slightly increased from 4.0% in SFY 2016 to 4.2% in SFY 2017. Child-only households comprised 46.7% of the total TANF/SFA caseload in SFY 2017, up from 44.6% in SFY 2016. TECHNICAL NOTES DATA SOURCES: Data for this chapter is based on the September 2017 ESA Automated Client Eligibility System (ACES) database. Quarterly employment and earnings for WorkFirst participants is based on Unemployment Insurance (UI) wage data provided by the Employment Security Department (ESD). DATA NOTES: 1) Unless otherwise noted, both federally-funded TANF and state-funded SFA cases/clients are reported jointly in this section. 2) WorkFirst clients are adult clients receiving TANF/SFA benefits. This can include teen parents. 3) WorkFirst cases are those in which at least one adult is receiving TANF/SFA assistance. 4) Percentages may not add up to expected totals due to rounding.

TANF/SFA/WorkFirst 2017
4 ESA Briefing Book
Selected TANF/SFA Program Overview, SFY 2016 and SFY 2017
SFY 2016 SFY 2017
Change (July 2015-June 2016) (July 2016-June 2017)
Average Number of Cases Per Month (Range)
31,284 (29,753 - 32,189)
28,555 (26,945 -29,221)
-8.7% (Decrease)
Average Number of Persons Per Month (Range)
70,037 (66,257 - 72,682)
63,704 (59,666 – 65,828)
-9.0% (Decrease)
Average Number of Adults Per Month (Range)
19,701 (18,288 - 20,403)
17,323 (16,122 - 18,016)
-12.1% (Decrease)
Average Number of Children Per Month (Range)
50,336 (47,969 - 52,452)
46,381 (43,544 - 48,243)
-7.9% (Decrease)
State Population 7,183,700 7,310,300 1.8%
(Increase)
Recipients as a Percent of State’s Total Population
1.0% 0.9% -0.1% Point (Decrease)
Children as Percent of Recipients
71.9% 72.8% 0.9% Point (Increase)
Average Persons Per Case 2.2 2.2 No
Change
Average Children Per Case 1.6 1.6 No
Change
Average Children Per Adult 2.6 2.7 0.1%
(Increase)
Average Monthly Payment Per Case (Range)1
$409 ($405 - $413)
$408 ($406 - $413)
-0.3% (Decrease)
1 Payments not adjusted for refunds.

TANF/SFA/WorkFirst 2017
5 ESA Briefing Book
TANF/SFA Caseload, SFY 2008 – 20172
SFY 2017 Total Caseload Persons Grant Expenditures Average Payment
Per Case
July 29,201 64,839 $11,893,650 $407.3
August 29,155 65,037 $11,849,263 $406.4
September 28,936 64,448 $11,772,765 $406.9
October 28,914 64,657 $11,800,084 $408.1
November 28,828 64,430 $11,774,393 $408.4
December 29,009 65,132 $11,853,367 $408.6
January 29,221 65,828 $11,914,623 $407.7
February 29,156 65,314 $12,028,556 $412.6
March 28,598 63,744 $11,709,580 $409.5
April 27,574 61,235 $11,266,951 $408.6
May 27,125 60,114 $11,060,968 $407.8
June 26,945 59,666 $10,950,856 $406.4
Mo. Avg. 28,555 63,704 $11,656,255 $408.2
2 Washington State implemented stricter time limit extension criteria and a 15% TANF grant reduction effective February 1, 2011. The TANF grant increased by 9% on July 1, 2015, resulting in a substantially slower caseload decrease.
0
10,000
20,000
30,000
40,000
50,000
60,000
70,000
SFY0
8
SFY0
9
SFY1
0
SFY1
1
SFY1
2
SFY1
3
SFY1
4
SFY1
5
SFY1
6
SFY1
7
Jul-
16
Au
g-1
6
Sep
-16
Oct
-16
No
v-16
Dec
-16
Jan
-17
Feb
-17
Mar
-17
Ap
r-1
7
May
-17
Jun
-17
10 Year Trend by SFY Monthly Caseload in SFY17
SFY Monthly Average Caseload SFY Monthly Average Caseload
SFY08 50,116 SFY13 48,675
SFY09 56,456 SFY14 42,564
SFY10 64,448 SFY15 35,158
SFY11 65,127 SFY16 31,284
SFY12 54,425 SFY17 28,555

TANF/SFA/WorkFirst 2017
6 ESA Briefing Book
TANF/SFA Caseload by Funding Type, SFY 2017
SFY 2017 Total
Caseload3
TANF Only Mixed TANF & SFA4 SFA Only
Caseload % of Total Caseload % of Total Caseload % of Total
July 29,201 28,397 97.2% 472 1.6% 332 1.1%
August 29,155 28,353 97.2% 464 1.6% 338 1.2%
September 28,936 28,164 97.3% 445 1.5% 327 1.1%
October 28,914 28,136 97.3% 440 1.5% 338 1.2%
November 28,828 28,024 97.2% 460 1.6% 344 1.2%
December 29,009 28,165 97.1% 490 1.7% 354 1.2%
January 29,221 28,355 97.0% 513 1.8% 353 1.2%
February 29,156 28,269 97.0% 516 1.8% 371 1.3%
March 28,598 27,712 96.9% 512 1.8% 374 1.3%
April 27,574 26,731 96.9% 460 1.7% 383 1.4%
May 27,125 26,305 97.0% 433 1.6% 387 1.4%
June 26,945 26,100 96.9% 458 1.7% 387 1.4%
Mo. Avg. 28,555 27,726 97.1% 472 1.7% 357 1.3%
SFY 2017 SFA Caseload
State Expenditures on
SFA Cases
Federal Expenditures on
SFA Cases5
Average State Expenditures Per
Case
Total Average Expenditures Per
Case
July 804 $252,527 $109,886 $314 $450.8
August 802 $247,171 $107,617 $308 $442.4
September 772 $240,076 $105,367 $311 $447.5
October 778 $249,025 $102,974 $320 $452.4
November 804 $253,221 $104,460 $315 $444.9
December 844 $268,691 $113,888 $318 $453.3
January 866 $273,427 $118,447 $316 $452.5
February 887 $279,422 $123,107 $315 $453.8
March 886 $283,124 $126,340 $320 $462.1
April 843 $277,322 $111,381 $329 $461.1
May 820 $269,131 $106,352 $328 $457.9
June 845 $270,325 $108,374 $320 $448.2
Mo. Avg. 829 $263,622 $111,516 $318 $452.5
3 Program detail may not sum to totals because cases may be in more than one program during the month. 4 The mixed TANF/SFA cases have at least one member in the household receiving federal TANF and at least one member receiving SFA benefits. 5 These are federal expenditures on mixed TANF/SFA households.

TANF/SFA/WorkFirst 2017
7 ESA Briefing Book
Caseload by DSHS Region and CSO of Issuance and Residence, June 2017 Snapshot The following pages detail the TANF/SFA caseload, June 2017 snapshot, by both the CSO of Issuance and CSO of Residence.
CSO of Issuance: Based on the location from which benefits were issued. While most benefits are issued through ESA’s Community Service Offices (CSO), benefits may be issued by Customer Service Contact Centers (CSCC) or Home and Community Services Offices (HCS) within DSHS’s Aging and Long-Term Support Administration.
CSO of Residence: Based on where the clients live within a CSO coverage area.
Overview
CSO of Issuance CSO of Residence
# of Cases
% of State Total
# of Clients
% of State Total
# of Cases
% of State Total
# of Clients
% of State Total
Region 1 CSOs 8,058 29.9% 18,001 30.2% 8,057 29.9% 17,985 30.1%
Region 2 CSOs 8,317 30.9% 19,131 32.1% 8,236 30.6% 18,924 31.7%
Region 3 CSOs 10,563 39.2% 22,524 37.8% 10,647 39.5% 22,746 38.1%
CSCCs 1 <0.1% 1 <0.1% N/A
HCS 6 <0.1% 9 <0.1% N/A
Not Reported / Unidentifiable
0 0.0% 0 0.0% 5 <0.1% 11 <0.1%
State Total 26,945 100.0% 59,666 100.0% 26,945 100.0% 59,666 100.0%

TANF/SFA/WorkFirst 2017
8 ESA Briefing Book
Caseload by DSHS Region and CSO of Issuance and Residence, June 2017 Snapshot (continued)
Region 1 CSO
CSO of Issuance CSO of Residence
# of Cases
% of State Total
# of Clients
% of State Total
# of Cases
% of State Total
# of Clients
% of State Total
CLARKSTON 189 0.7% 438 0.7% 188 0.7% 436 0.7%
COLFAX 79 0.3% 169 0.3% 78 0.3% 165 0.3%
COLVILLE 197 0.7% 449 0.8% 198 0.7% 453 0.8%
ELLENSBURG 133 0.5% 271 0.5% 135 0.5% 274 0.5%
GOLDENDALE 91 0.3% 188 0.3% 92 0.3% 191 0.3%
KENNEWICK 1,093 4.1% 2,591 4.3% 1,136 4.2% 2,688 4.5%
MOSES LAKE 583 2.2% 1,264 2.1% 591 2.2% 1,276 2.1%
NEWPORT 102 0.4% 214 0.4% 101 0.4% 210 0.4%
OKANOGAN 176 0.7% 323 0.5% 165 0.6% 303 0.5%
REPUBLIC 34 0.1% 76 0.1% 34 0.1% 76 0.1%
SPOKANE MAPLE 1,078 4.0% 2,427 4.1% 1204 4.5% 2719 4.6%
SPOKANE TRENT 1,652 6.1% 3,762 6.3% 1529 5.7% 3472 5.8%
SUNNYSIDE 384 1.4% 885 1.5% 329 1.2% 760 1.3%
TOPPENISH 389 1.4% 812 1.4% 392 1.5% 817 1.4%
WALLA WALLA 244 0.9% 573 1.0% 253 0.9% 588 1.0%
WENATCHEE 382 1.4% 792 1.3% 379 1.4% 782 1.3%
WHITE SALMON 38 0.1% 83 0.1% 37 0.1% 80 0.1%
YAKIMA 1,214 4.5% 2,684 4.5% 1,216 4.5% 2,695 4.5%
Region 1 Total 8,058 29.9% 18,001 30.2% 8,057 29.9% 17,985 30.1%

TANF/SFA/WorkFirst 2017
9 ESA Briefing Book
Caseload by DSHS Region and CSO of Issuance and Residence, June 2017 Snapshot (continued)
Region 2 CSO
CSO of Issuance CSO of Residence
# of Cases
% of State Total
# of Clients
% of State Total
# of Cases
% of State Total
# of Clients
% of State Total
ALDERWOOD 481 1.8% 1,095 1.8% 473 1.8% 1,080 1.8%
AUBURN 606 2.2% 1,363 2.3% 602 2.2% 1,348 2.3%
BELLINGHAM 722 2.7% 1,520 2.5% 715 2.7% 1,502 2.5%
BELLTOWN 124 0.5% 263 0.4% 127 0.5% 279 0.5%
CAPITOL HILL 242 0.9% 538 0.9% 235 0.9% 516 0.9%
EVERETT 678 2.5% 1,585 2.7% 679 2.5% 1,581 2.6%
FEDERAL WAY 570 2.1% 1,425 2.4% 558 2.1% 1,395 2.3%
KING EASTSIDE 427 1.6% 950 1.6% 413 1.5% 911 1.5%
KING NORTH 473 1.8% 1,102 1.8% 461 1.7% 1,080 1.8%
KING SOUTH 833 3.1% 2,256 3.8% 820 3.0% 2,224 3.7%
MT VERNON 456 1.7% 973 1.6% 443 1.6% 950 1.6%
OAK HARBOR 126 0.5% 251 0.4% 138 0.5% 274 0.5%
RAINIER 510 1.9% 1,203 2.0% 521 1.9% 1,224 2.1%
RENTON 510 1.9% 1,180 2.0% 510 1.9% 1,176 2.0%
SKY VALLEY 219 0.8% 438 0.7% 214 0.8% 426 0.7%
SMOKEY POINT 631 2.3% 1,340 2.2% 628 2.3% 1,329 2.2%
WHITE CENTER 709 2.6% 1,649 2.8% 699 2.6% 1,629 2.7%
Region 2 Total 8,317 30.9% 19,131 32.1% 8,236 30.6% 18,924 31.7%

TANF/SFA/WorkFirst 2017
10 ESA Briefing Book
Caseload by DSHS Region and CSO of Issuance and Residence, June 2017 Snapshot (continued)
Region 3 CSO
CSO of Issuance CSO of Residence
# of Cases
% of State Total
# of Clients
% of State Total
# of Cases
% of State Total
# of Clients
% of State Total
ABERDEEN 527 2.0% 1,082 1.8% 537 2.0% 1,104 1.9%
BREMERTON 900 3.3% 1,838 3.1% 896 3.3% 1,830 3.1%
CHEHALIS 597 2.2% 1,316 2.2% 596 2.2% 1,311 2.2%
COLUMBIA RIVER 1,527 5.7% 3,253 5.5% 1,523 5.7% 3,244 5.4%
FORKS 74 0.3% 136 0.2% 75 0.3% 138 0.2%
KELSO 946 3.5% 2,071 3.5% 944 3.5% 2,063 3.5%
LAKEWOOD 1,136 4.2% 2,533 4.2% 1,139 4.2% 2,561 4.3%
LONG BEACH 60 0.2% 107 0.2% 60 0.2% 105 0.2%
OLYMPIA 1,071 4.0% 2,206 3.7% 1,181 4.4% 2,485 4.2%
PIERCE NORTH 748 2.8% 1,655 2.8% 741 2.8% 1,626 2.7%
PIERCE SOUTH 1,232 4.6% 2,752 4.6% 1,214 4.5% 2,708 4.5%
PORT ANGELES 192 0.7% 367 0.6% 193 0.7% 370 0.6%
PORT TOWNSEND 104 0.4% 225 0.4% 104 0.4% 226 0.4%
PUYALLUP VALLEY 941 3.5% 1,961 3.3% 940 3.5% 1,961 3.3%
SHELTON 376 1.4% 719 1.2% 376 1.4% 721 1.2%
SOUTH BEND 81 0.3% 189 0.3% 79 0.3% 183 0.3%
STEVENSON 51 0.2% 114 0.2% 49 0.2% 110 0.2%
Region 3 Total 10,563 39.2% 22,524 37.8% 10,647 39.5% 22,746 38.1%

TANF/SFA/WorkFirst 2017
11 ESA Briefing Book
Caseload by DSHS Region and CSO of Issuance and Residence, June 2017 Snapshot (continued)
Customer Service Contact Centers (CSCC)
CSO of Issuance
# of Cases % of State Total # of Clients % of State Total
CUSTOMER SVC CENTRAL 0 0.0% 0 0.0%
CUSTOMER SVC NE 0 0.0% 0 0.0%
CUSTOMER SVC NW 0 0.0% 0 0.0%
CUSTOMER SVC SW 0 0.0% 0 0.0%
CUSTOMER SVC SO SOUND 0 0.0% 0 0.0%
CUSTOMER SERV WASHCAP 0 0.0% 0 0.0%
PGST 1 <0.1% 1 <0.1%
CSCC/PGST Total 1 <0.1% 1 <0.1%

TANF/SFA/WorkFirst 2017
12 ESA Briefing Book
Caseload by Home and Community Services Offices (HCS), June 2017 Snapshot
Home and Community Service Offices (HCS) – Region 1
HCS of Issuance
# of Cases % of State Total Clients % of State Total
CLARKSTON HCS OFFICE 1 <0.1% 1 <0.1%
COLVILLE HCS OFFICE 0 0.0% 0 0.0%
ELLENSBURG HCS 0 0.0% 0 0.0%
MOSES LK HCS OFFICE 0 0.0% 0 0.0%
OKANOGAN HCS OFFICE 0 0.0% 0 0.0%
SPOKANE HCS OFFICE 0 0.0% 0 0.0%
SUNNYSIDE HCS OFFICE 0 0.0% 0 0.0%
TRI-CITIES HCS OFC 0 0.0% 0 0.0%
WALLA WALLA HCS OFC 0 0.0% 0 0.0%
WAPATO HCS 0 0.0% 0 0.0%
WENATCHEE HCS OFFICE 1 <0.1% 2 <0.1%
YAKIMA HCS OFFICE 2 <0.1% 4 <0.1%
HCS Region 1 Total 4 <0.1% 7 <0.1%
Home and Community Service Offices (HCS) – Region 2
HCS of Issuance
# of Cases % of State Total Clients % of State Total
ALDERWOOD HCS OFFICE 0 0.0% 0 0.0%
BELLINGHAM HCS OFC 0 0.0% 0 0.0%
EVERETT HCS OFFICE 0 0.0% 0 0.0%
HOLGATE HCS OFFICE 0 0.0% 0 0.0%
MT VERNON HCS OFFICE 0 0.0% 0 0.0%
OAK HARBOR HCS 0 0.0% 0 0.0%
SKYKOMISH HCS OFFICE 0 0.0% 0 0.0%
SMOKEY POINT HCS 0 0.0% 0 0.0%
HCS Region 2 Total 0 0.0% 0 0.0%

TANF/SFA/WorkFirst 2017
13 ESA Briefing Book
Caseload by Home and Community Services Offices (HCS), June 2017 Snapshot (continued)
Home and Community Service Offices (HCS) – Region 3
HCS of Issuance
# of Cases % of State Total # of Clients % of State Total
ABERDEEN HCS OFFICE 1 <0.1% 1 <0.1%
BREMERTON HCS OFFICE 0 0.0% 0 0.0%
CHEHALIS HCS OFFICE 1 <0.1% 1 <0.1%
KELSO HCS OFFICE 0 0.0% 0 0.0%
OLYMPIA HCS OFFICE 0 0.0% 0 0.0%
PACIFIC COUNTY HCS 0 0.0% 0 0.0%
PORT ANGELES HCS 0 0.0% 0 0.0%
TACOMA HCS OFFICE 0 0.0% 0 0.0%
VANCOUVER HCS OFFICE 0 0.0% 0 0.0%
LTC SPECIALTY UNIT 0 0.0% 0 0.0%
HCS Region 3 Total 2 <0.1% 2 <0.1%
TANF/SFA/WorkFirst 2017
14 ESA Briefing Book
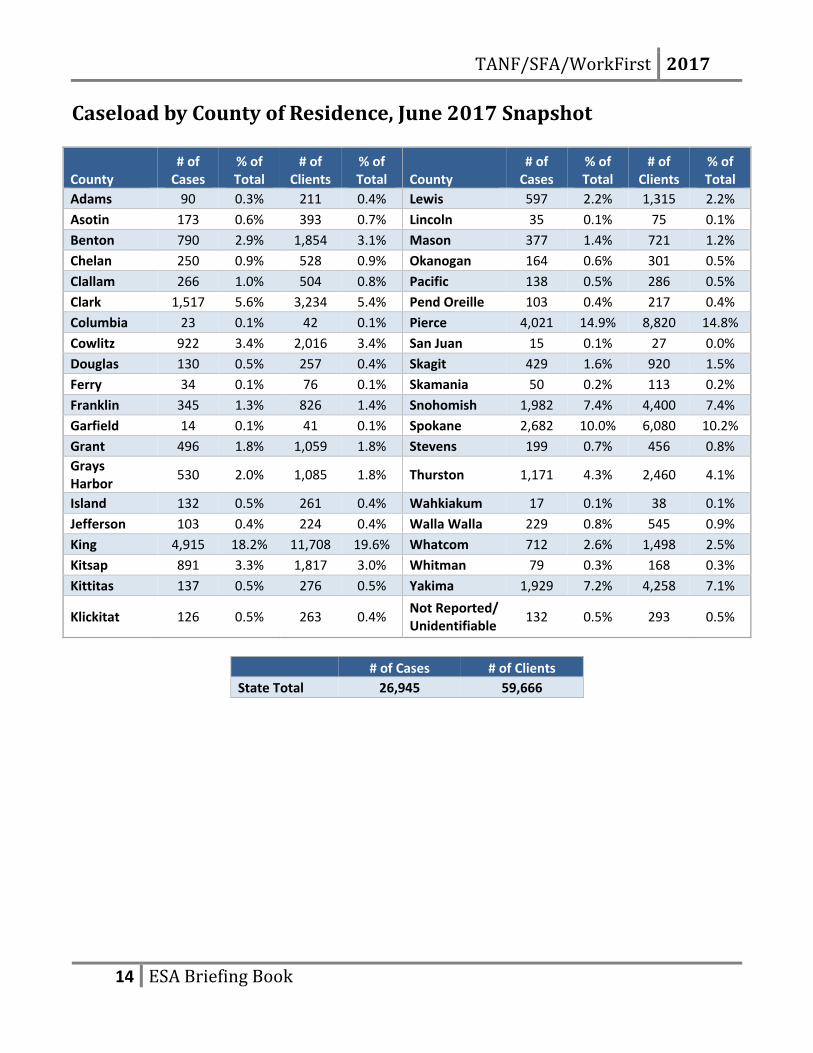
Caseload by County of Residence, June 2017 Snapshot
County # of
Cases % of Total
# of Clients
% of Total County
# of Cases
% of Total
# of Clients
% of Total
Adams 90 0.3% 211 0.4% Lewis 597 2.2% 1,315 2.2%
Asotin 173 0.6% 393 0.7% Lincoln 35 0.1% 75 0.1%
Benton 790 2.9% 1,854 3.1% Mason 377 1.4% 721 1.2%
Chelan 250 0.9% 528 0.9% Okanogan 164 0.6% 301 0.5%
Clallam 266 1.0% 504 0.8% Pacific 138 0.5% 286 0.5%
Clark 1,517 5.6% 3,234 5.4% Pend Oreille 103 0.4% 217 0.4%
Columbia 23 0.1% 42 0.1% Pierce 4,021 14.9% 8,820 14.8%
Cowlitz 922 3.4% 2,016 3.4% San Juan 15 0.1% 27 0.0%
Douglas 130 0.5% 257 0.4% Skagit 429 1.6% 920 1.5%
Ferry 34 0.1% 76 0.1% Skamania 50 0.2% 113 0.2%
Franklin 345 1.3% 826 1.4% Snohomish 1,982 7.4% 4,400 7.4%
Garfield 14 0.1% 41 0.1% Spokane 2,682 10.0% 6,080 10.2%
Grant 496 1.8% 1,059 1.8% Stevens 199 0.7% 456 0.8%
Grays Harbor
530 2.0% 1,085 1.8% Thurston 1,171 4.3% 2,460 4.1%
Island 132 0.5% 261 0.4% Wahkiakum 17 0.1% 38 0.1%
Jefferson 103 0.4% 224 0.4% Walla Walla 229 0.8% 545 0.9%
King 4,915 18.2% 11,708 19.6% Whatcom 712 2.6% 1,498 2.5%
Kitsap 891 3.3% 1,817 3.0% Whitman 79 0.3% 168 0.3%
Kittitas 137 0.5% 276 0.5% Yakima 1,929 7.2% 4,258 7.1%
Klickitat 126 0.5% 263 0.4% Not Reported/ Unidentifiable
132 0.5% 293 0.5%
# of Cases # of Clients
State Total 26,945 59,666

TANF/SFA/WorkFirst 2017
15 ESA Briefing Book
Client Density Maps by Residential County, June 2017 Snapshot

TANF/SFA/WorkFirst 2017
16 ESA Briefing Book
Client Density Maps, June 2017 Snapshot (continued)

TANF/SFA/WorkFirst 2017
17 ESA Briefing Book
Caseload by Case Type, SFY 2008 – 2017
Caseload By Case Type
SFY 2017
Total Child-Only 1 Adult 2 or More Adults
Caseload Caseload % of Total Caseload % of Total Caseload % of Total
July 29,201 13,344 45.7% 13,741 47.1% 2,116 7.2%
August 29,155 13,227 45.4% 13,828 47.4% 2,100 7.2%
September 28,936 13,192 45.6% 13,688 47.3% 2,056 7.1%
October 28,914 13,196 45.6% 13,613 47.1% 2,105 7.3%
November 28,828 13,330 46.2% 13,366 46.4% 2,132 7.4%
December 29,009 13,558 46.7% 13,256 45.7% 2,195 7.6%
January 29,221 13,847 47.4% 13,144 45.0% 2,230 7.6%
February 29,156 13,838 47.5% 13,106 45.0% 2,212 7.6%
March 28,598 13,602 47.6% 12,846 44.9% 2,150 7.5%
April 27,574 13,157 47.7% 12,337 44.7% 2,080 7.5%
May 27,125 12,890 47.5% 12,216 45.0% 2,019 7.4%
June 26,945 12,805 47.5% 12,145 45.1% 1,995 7.4%
Mo. Avg. 28,555 13,332 46.7% 13,107 45.9% 2,116 7.4%
0
10,000
20,000
30,000
40,000
50,000
60,000
70,000SF
Y08
SFY0
9
SFY1
0
SFY1
1
SFY1
2
SFY1
3
SFY1
4
SFY1
5
SFY1
6
SFY1
7
Jul-
16
Au
g-1
6
Sep
-16
Oct
-16
No
v-16
Dec
-16
Jan
-17
Feb
-17
Mar
-17
Ap
r-1
7
May
-17
Jun
-17
10 Year Trend by SFY Monthly Caseload in SFY17
Child-Only1 Adult2 or More Adults

TANF/SFA/WorkFirst 2017
18 ESA Briefing Book
Child-Only Caseload by Major Caretaker Groups, June 2017 Snapshot6
Kinship – Some parents are unable to care for their children due to their own circumstances, such as substance abuse,
mental health, or other problems. Often, grandparents or other relatives step in to provide the needed care, even though they have no legal responsibility to do so. Unless these relative caregivers are willing to get licensed as foster parents (a much more expensive program for the state), a TANF child-only grant may be the only way they can afford to care for these children. As long as the child has no income or assets of his/her own that would disqualify the child, the relative caregiver can receive TANF on the child’s behalf even if they do not have legal custody of the child. They only need to show that the child lives with them most of the time and that they are currently the child’s primary caregiver.
Undocumented Immigrant – Children in households headed by undocumented immigrants may be U.S. citizens and therefore eligible for TANF benefits if the household, including non-recipient adults, meets financial eligibility criteria. Undocumented immigrant parents may apply for TANF on behalf of their citizen children, but they receive no continuing benefits (cash, food, or medical) for themselves.
Disabled – Disabled parents who receive Supplemental Security Income (SSI) will not qualify for TANF because federal law does not allow them to receive both. Their minor children will still be eligible for TANF, as long as the household meets the program’s financial eligibility criteria.
Guardian – Sometimes, in the absence of the parent, a relative or other concerned adult will seek legal guardianship of a child. As with relative caregivers without this legal status, guardians may receive TANF on behalf of an otherwise eligible child.
Disqualified – Some parents may be disqualified from receiving TANF because of fleeing a felony conviction, a probation or parole violation, or fraudulent receipt of public assistance. Their minor children will still be eligible for TANF, as long as the household meets financial eligibility criteria. Fleeing felons and probation or parole violators can restore their TANF eligibility by complying with the law. The court determines the period of ineligibility for those convicted of fraud.
Other – Caretaker is defined using the child’s relationship to the head of household member. Other cases are those in which the head of the household’s status is unknown.
6 The chart may not add up to 100% exactly due to rounding.
Kinship52.1%
Disabled9.8%
Undocumented Immigrant
28.8%
Guardian8.7%
Disqualified0.6%
Other<0.1%

TANF/SFA/WorkFirst 2017
19 ESA Briefing Book
Caseload by Number of Children7, SFY 2008 – 2017
Caseload by Number of Children
SFY 2017
Total TANF No Children 1 to 2 Children 3 or More Children
Caseload Caseload % of Total Caseload % of Total Caseload % of Total
July 29,201 1,428 4.9% 23,027 78.9% 4,746 16.3%
August 29,155 1,420 4.9% 22,972 78.8% 4,763 16.3%
September 28,936 1,410 4.9% 22,817 78.9% 4,709 16.3%
October 28,914 1,351 4.7% 22,792 78.8% 4,771 16.5%
November 28,828 1,338 4.6% 22,710 78.8% 4,780 16.6%
December 29,009 1,323 4.6% 22,734 78.4% 4,952 17.1%
January 29,221 1,281 4.4% 22,843 78.2% 5,097 17.4%
February 29,156 1,353 4.6% 22,815 78.3% 4,988 17.1%
March 28,598 1,315 4.6% 22,463 78.5% 4,820 16.9%
April 27,574 1,243 4.5% 21,743 78.9% 4,588 16.6%
May 27,125 1,258 4.6% 21,376 78.8% 4,491 16.6%
June 26,945 1,227 4.6% 21,270 78.9% 4,448 16.5%
Mo. Avg. 28,555 1,329 4.7% 22,464 78.7% 4,763 16.7%
7 In cases where the only children eligible for TANF are receiving SSI, those children will not receive a TANF payment, but the parents will receive a TANF payment. Also, pregnant women with no children are eligible for TANF.
0
10,000
20,000
30,000
40,000
50,000
60,000
70,000SF
Y08
SFY0
9
SFY1
0
SFY1
1
SFY1
2
SFY1
3
SFY1
4
SFY1
5
SFY1
6
SFY1
7
Jul-
16
Au
g-1
6
Sep
-16
Oct
-16
No
v-16
Dec
-16
Jan
-17
Feb
-17
Mar
-17
Ap
r-1
7
May
-17
Jun
-17
10 Year Trend by SFY Monthly Caseload in SFY 2017
TANF Cases With 3 or More Children on the AU
TANF Cases With 1 to 2 Children on the AU
TANF Cases With No Children on the AU

TANF/SFA/WorkFirst 2017
20 ESA Briefing Book
Teen Head of Household, SFY 2008 – 2017
Teen Head of Households8
SFY 2017
Total TANF
16 Years Old or Younger 17 Years Old 18 Years Old
Caseload Caseload % of Total Caseload % of Total Caseload % of Total
July 299 5 1.7% 20 6.7% 274 91.6%
August 294 4 1.4% 21 7.1% 269 91.5%
September 290 4 1.4% 16 5.5% 270 93.1%
October 278 4 1.4% 18 6.5% 256 92.1%
November 265 5 1.9% 18 6.8% 242 91.3%
December 276 3 1.1% 23 8.3% 250 90.6%
January 281 4 1.4% 24 8.5% 253 90.0%
February 277 6 2.2% 25 9.0% 246 88.8%
March 255 8 3.1% 20 7.8% 227 89.0%
April 241 7 2.9% 18 7.5% 216 89.6%
May 236 8 3.4% 18 7.6% 210 89.0%
June 237 8 3.4% 15 6.3% 214 90.3%
Mo. Avg. 269 6 2.2% 20 7.4% 244 90.7%
8 Numbers reflect households where the head of household member is a teen parent living independently from his/her formal legal guardian.
0
200
400
600
800
1,000
1,200
1,400
SFY0
8
SFY0
9
SFY1
0
SFY1
1
SFY1
2
SFY1
3
SFY1
4
SFY1
5
SFY1
6
SFY1
7
Jul-
16
Au
g-1
6
Sep
-16
Oct
-16
No
v-16
Dec
-16
Jan
-17
Feb
-17
Mar
-17
Ap
r-1
7
May
-17
Jun
-17
10 Year Trend by SFY Monthly Caseload in SFY 2017
16 Year Olds as Head of Household
17 Year Olds as Head of Household
18 Year Olds as Head of Household

TANF/SFA/WorkFirst 2017
21 ESA Briefing Book
Teen Parents under Age 18, SFY 2008 – 2017
Teen Parents Under Age 189
Living with a Legal Guardian Head of Household, Spouse
or Other Parent
SFY 2017 Total Clients Caseload % of Total Caseload % of Total
July 31 3 9.7% 28 90.3%
August 32 4 12.5% 28 87.5%
September 27 4 14.8% 23 85.2%
October 30 6 20.0% 24 80.0%
November 27 4 14.8% 23 85.2%
December 31 4 12.9% 27 87.1%
January 36 5 13.9% 31 86.1%
February 39 5 12.8% 34 87.2%
March 36 5 13.9% 31 86.1%
April 31 5 16.1% 26 83.9%
May 31 3 9.7% 28 90.3%
June 30 4 13.3% 26 86.7%
Mo. Avg. 32 4 12.5% 27 84.4%
9 Teen Parents are defined based on the client’s head of household relationship. If the client is coded as “CP” (child parent), the child is considered to be living under legal guardianship while caring for their own child.
0
20
40
60
80
100
120
140
160
180
200SF
Y08
SFY0
9
SFY1
0
SFY1
1
SFY1
2
SFY1
3
SFY1
4
SFY1
5
SFY1
6
SFY1
7
Jul-
16
Au
g-1
6
Sep
-16
Oct
-16
No
v-16
Dec
-16
Jan
-17
Feb
-17
Mar
-17
Ap
r-1
7
May
-17
Jun
-17
10 Year Trend by SFY Monthly Caseload in SFY 2017
Teen Parents Under 18 Living With a Guardian
Teen Parents Under 18 who are the Head ofHousehold, Spouse, or Other Parent

TANF/SFA/WorkFirst 2017
22 ESA Briefing Book
Pregnant Women & Women with Child under Age 1, SFY 2008 – 2017
% of Total TANF/SFA Caseload with Adults that have a Pregnant Woman or Child Under Age 1
Caseload with
Adults10
Pregnant11 0 – 3 Months Old 4 – 12 Months Old
SFY 2017 Caseload % of Total Caseload % of Total Caseload % of Total
July 15,857 3,217 20.3% 1,694 10.7% 2,828 17.8%
August 15,928 3,004 18.9% 1,739 10.9% 2,828 17.8%
September 15,744 2,621 16.6% 1,718 10.9% 2,732 17.4%
October 15,718 2,478 15.8% 1,770 11.3% 2,716 17.3%
November 15,498 2,322 15.0% 1,742 11.2% 2,687 17.3%
December 15,451 2,216 14.3% 1,707 11.0% 2,752 17.8%
January 15,374 2,132 13.9% 1,700 11.1% 2,774 18.0%
February 15,318 2,065 13.5% 1,582 10.3% 2,833 18.5%
March 14,996 2,038 13.6% 1,561 10.4% 2,719 18.1%
April 14,417 1,958 13.6% 1,542 10.7% 2,574 17.9%
May 14,235 2,020 14.2% 1,518 10.7% 2,551 17.9%
June 14,140 1,986 14.0% 1,531 10.8% 2,538 17.9%
Mo. Avg. 15,223 2,338 15.4% 1,650 10.8% 2,711 17.8%
10 Cases are unduplicated across groups. If a case has multiple young children or a pregnant recipient and a young child, the case category reflects the youngest child. Adults include teen parents. 11 Pregnant women were identified using pregnancy status data entered in ACES.
0%
5%
10%
15%
20%
25%
30%
35%
40%
45%
50%
55%
60%
65%
70%
0
10,000
20,000
30,000
40,000
50,000
60,000
70,000
80,000SF
Y08
SFY0
9
SFY1
0
SFY1
1
SFY1
2
SFY1
3
SFY1
4
SFY1
5
SFY1
6
SFY1
7
Jul-
16
Au
g-1
6
Sep
-16
Oct
-16
No
v-16
Dec
-16
Jan
-17
Feb
-17
Mar
-17
Ap
r-1
7
May
-17
Jun
-17
10 Year Trend Monthly Caseload in SFY 2017
TANF/SFA Cases with Adults
% of total TANF/SFA who are pregnant or parenting a child under the age of 1

TANF/SFA/WorkFirst 2017
23 ESA Briefing Book
TANF/SFA Adult Clients Participating in WorkFirst Activities, SFY 2017
The WorkFirst program provides job search assistance, employment, education and skills training, and work supports to TANF recipients. The goal of WorkFirst is to help these families build a pathway that can lead them out of poverty and toward economic security. Participation in WorkFirst activities is mandatory for most adult TANF recipients.12 Failure to meet the participation requirements without a good cause is subject to the WorkFirst noncompliance sanction (NCS)13.
SFY 2017
Total WorkFirst Clients Receiving
TANF/SFA
Total WorkFirst Clients Exempted14 from Participation
WorkFirst Clients Required to
Participate (Non-Exempt)
% of Non-Exempt WorkFirst Clients Participating in
WorkFirst Activities
July 17,960 4,577 13,383 73.8%
August 18,016 4,596 13,420 74.8%
September 17,784 4,579 13,205 74.9%
October 17,806 4,557 13,249 75.7%
November 17,612 4,541 13,071 76.4%
December 17,629 4,506 13,123 75.9%
January 17,585 4,504 13,081 76.1%
February 17,512 4,444 13,068 76.5%
March 17,130 4,453 12,677 77.1%
April 16,483 4,314 12,169 77.5%
May 16,240 4,326 11,914 78.9%
June 16,122 4,332 11,790 78.2%
Mo. Avg. 17,323 4,477 12,846 76.3%
12 WorkFirst participation may be waived or deferred if the individual meets an exemption criterion as described in WAC 388-310-0350. 13 The non-compliance sanction (NCS) policy for WorkFirst was modified effective November 1, 2014 (See WAC 388-310-1600). The NCS policy terminates TANF or SFA when adults fail to participate for two months in a row. The NCS policy also terminates TANF or SFA when mandatory, noncompliant WorkFirst adults fail to attend a non-compliance case staffing and DSHS is not able to make contact with them at the subsequent home visit or alternative site visit. Prior to November 1, 2014, the sanction period was four months (not two) and did not require a home/alternative site visit. 14 Clients meeting one or more of the following exemption or deferral definitions may be exempted from WorkFirst participation: Infant Exemption, Postpartum Exemption, Pursuing SSI, 55 & older caretaker relative, Caring for an adult with disabilities who is not a full time student, Caring for a child with special needs who is not a full time student, or an adult with severe and chronic disabilities.
TANF/SFA/WorkFirst 2017
24 ESA Briefing Book
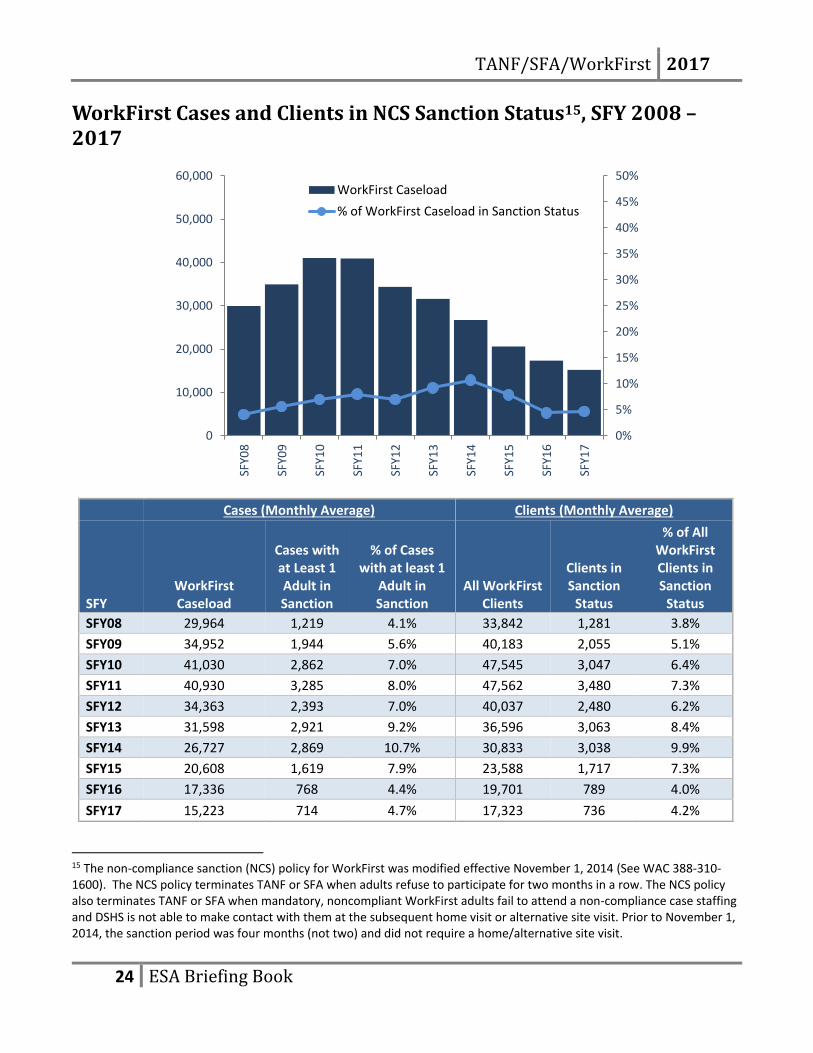
WorkFirst Cases and Clients in NCS Sanction Status15, SFY 2008 – 2017
Cases (Monthly Average) Clients (Monthly Average)
SFY WorkFirst Caseload
Cases with at Least 1 Adult in Sanction
% of Cases with at least 1
Adult in Sanction
All WorkFirst Clients
Clients in Sanction
Status
% of All WorkFirst Clients in Sanction
Status
SFY08 29,964 1,219 4.1% 33,842 1,281 3.8%
SFY09 34,952 1,944 5.6% 40,183 2,055 5.1%
SFY10 41,030 2,862 7.0% 47,545 3,047 6.4%
SFY11 40,930 3,285 8.0% 47,562 3,480 7.3%
SFY12 34,363 2,393 7.0% 40,037 2,480 6.2%
SFY13 31,598 2,921 9.2% 36,596 3,063 8.4%
SFY14 26,727 2,869 10.7% 30,833 3,038 9.9%
SFY15 20,608 1,619 7.9% 23,588 1,717 7.3%
SFY16 17,336 768 4.4% 19,701 789 4.0%
SFY17 15,223 714 4.7% 17,323 736 4.2%
15 The non-compliance sanction (NCS) policy for WorkFirst was modified effective November 1, 2014 (See WAC 388-310-1600). The NCS policy terminates TANF or SFA when adults refuse to participate for two months in a row. The NCS policy also terminates TANF or SFA when mandatory, noncompliant WorkFirst adults fail to attend a non-compliance case staffing and DSHS is not able to make contact with them at the subsequent home visit or alternative site visit. Prior to November 1, 2014, the sanction period was four months (not two) and did not require a home/alternative site visit.
0%
5%
10%
15%
20%
25%
30%
35%
40%
45%
50%
0
10,000
20,000
30,000
40,000
50,000
60,000
SFY0
8
SFY0
9
SFY1
0
SFY1
1
SFY1
2
SFY1
3
SFY1
4
SFY1
5
SFY1
6
SFY1
7
WorkFirst Caseload
% of WorkFirst Caseload in Sanction Status

TANF/SFA/WorkFirst 2017
25 ESA Briefing Book
WorkFirst Clients in NCS Sanction Status by Month, SFY 2017
SFY 2017
TANF/SFA Adult Clients in WorkFirst Non-Compliance Sanction (NCS)
Total WorkFirst Clients
Required to Participate
(Non-exempt16)
Total Non-exempt Clients
in Sanction Status
% Non-exempt Clients in
Sanction Status
Clients Receiving an NCS
Termination Without Grant
Reduction17
Clients in Sanction Status
with Grant Reduction
July 13,385 795 5.9% 267 528
August 13,421 847 6.3% 253 594
September 13,209 738 5.6% 217 521
October 13,256 745 5.6% 235 510
November 13,077 710 5.4% 218 492
December 13,128 744 5.7% 233 511
January 13,087 680 5.2% 212 468
February 13,073 691 5.3% 170 521
March 12683 801 6.3% 291 510
April 12,177 733 6.0% 216 517
May 11929 700 5.9% 187 513
June 11,815 646 5.5% 206 440
Mo. Avg. 12,853 736 5.7% 225 510
16 Clients meeting one or more of the following exemption definitions may be exempted from WorkFirst participation: Infant Exemption, Postpartum Exemption, Pursuing SSI, 55 & older caretaker relative, Caring for an adult with disabilities who is not a full time student, Caring for a child with special needs who is not a full time student, or an adult with severe and chronic disabilities. 17 Effective November 1, 2014, clients who did not attend the required NCS case staffing and the home visit may be terminated from TANF without a grant reduction. Some of these clients may be reinstated if they reapply and complete a financial intake by the end of the month of their case closures.
0%
5%
10%
15%
20%
25%
30%
35%
40%
45%
50%
0
5,000
10,000
15,000
20,000
Jul-
16
Au
g-1
6
Sep
-16
Oct
-16
No
v-16
Dec
-16
Jan
-17
Feb
-17
Mar
-17
Ap
r-1
7
May
-17
Jun
-17
Total WorkFirst Clients Required to Participate
% Non-exempt Clients in Sanction Status

TANF/SFA/WorkFirst 2017
26 ESA Briefing Book
Employment Rates for WorkFirst Clients18, SFY 2008 – 2017
SFY 2017 # of WorkFirst
Clients
# Employed (Earned Income >
$5.00)
% Employed (Earned Income >
$5.00)
Avg. Monthly Hours Worked (Among those
Employed)
July 17,960 1,772 9.9% 57
August 18,016 1,635 9.1% 56
September 17,784 1,769 9.9% 56
October 17,806 1,646 9.2% 53
November 17,612 1,756 10.0% 54
December 17,629 1,845 10.5% 57
January 17,585 1,711 9.7% 55
February 17,512 1,730 9.9% 55
March 17,130 1,702 9.9% 56
April 16,483 1,578 9.6% 57
May 16,240 1,551 9.6% 55
June 16,122 1,713 10.6% 57
Mo. Avg. 17,323 1,701 9.8% 55.7
18Employment status is based on the client’s self-reported earnings from work as recorded in the ACES database. If the client reported $5 or more earned income in the month, the client is considered employed.
0.0%
2.0%
4.0%
6.0%
8.0%
10.0%
12.0%
14.0%SF
Y08
SFY0
9
SFY1
0
SFY1
1
SFY1
2
SFY1
3
SFY1
4
SFY1
5
SFY1
6
SFY1
7
Jul-
16
Au
g-1
6
Sep
-16
Oct
-16
No
v-16
Dec
-16
Jan
-17
Feb
-17
Mar
-17
Ap
r-1
7
May
-17
Jun
-17
10 Year Trend by SFY Monthly Rate in SFY 2017

TANF/SFA/WorkFirst 2017
27 ESA Briefing Book
WorkFirst Adults Receiving Quarterly Wages19, July 2012 – June 2017
Adults with Wages20 Total Quarterly Total Quarterly
Quarter Total Adults Number Percent Wages21 Hourly Wages22
2012Q3 47,041 13,195 28.0% $2,186 $11.4
2012Q4 45,853 12,452 27.2% $2,267 $11.5
2013Q1 44,460 10,117 22.8% $2,049 $11.6
2013Q2 42,505 11,400 26.8% $2,123 $11.5
2013Q3 40,905 11,974 29.3% $2,216 $11.5
2013Q4 38,767 10,884 28.1% $2,241 $11.6
2014Q1 37,956 8,639 22.8% $2,056 $11.9
2014Q2 36,643 10,245 28.0% $2,222 $11.7
2014Q3 33,336 9,923 29.8% $2,460 $11.8
2014Q4 31,019 9,168 29.6% $2,395 $11.9
2015Q1 28,237 7,159 25.4% $2,044 $11.9
2015Q2 26,435 7,801 29.5% $2,309 $11.9
2015Q3 26,019 8,074 31.0% $2,329 $12.3
2015Q4 25,606 7,765 30.3% $2,445 $12.2
2016Q1 24,849 6,503 26.2% $2,130 $12.5
2016Q2 23,792 7,338 30.8% $2,362 $12.5
2016Q3 23,312 7,441 31.9% $2,479 $12.7
2016Q4 22,750 6,933 30.5% $2,496 $12.8
2017Q1 21,718 5,735 26.4% $2,333 $13.5
2017Q2 21,184 6,347 30.0% $2,454 $13.5
19 Quarterly wage info is based on the Employment Security Department’s Unemployment Insurance (UI) wage data. 20 Adults with wages are those adult clients with wages who earned total wages of more than $5.00 in a quarter. 21 Total quarterly wages per person for those adult clients with wages in a quarter. 22 Jobs without hours or with 1,000 hours are excluded. Only includes jobs with an hourly wage rate between $5 and $50.
0.0%
5.0%
10.0%
15.0%
20.0%
25.0%
30.0%
0
10,000
20,000
30,000
40,000
50,000
60,000
70,000
80,000
90,000
100,000Q
3
Q4
Q1
Q2
Q3
Q4
Q1
Q2
Q3
Q4
Q1
Q2
Q3
Q4
Q1
Q2
Q3
Q4
Q1
Q2
2012 2013 2014 2015 2016 2017
Total Adult Clients
% of Adults With Wages
% E
mp
loye
d
Tota
l Wo
rkFi
rst
Ad
ult
s

TANF/SFA/WorkFirst 2017
28 ESA Briefing Book
Caseload by Primary Language, June 2017 Snapshot
Primary Language23 # of Cases Percent of
Cases
Percentage of Non-English
Cases
English Language Codes English 24,106 89.5%
Large Print 63 0.2%
Sign Language 6 <0.1%
Braille 1 <0.1%
Total English Languages 24,176 89.7%
Non-English Language Cases
Spanish 1,542 5.7% 55.7%
Arabic 298 1.1% 10.8%
Somali 211 0.8% 7.6%
Russian 164 0.6% 5.9%
Tigrigna 58 0.2% 2.1%
Vietnamese 51 0.2% 1.8%
Farsi 49 0.2% 1.8%
Dari 45 0.2% 1.6%
Amharic 41 0.2% 1.5%
Ukrainian 34 0.1% 1.2%
Burmese 27 0.1% 1.0%
Swahili 22 0.1% 0.8%
Cambodian (Khmer) 17 0.1% 0.6%
French 17 0.1% 0.6%
Trukese 16 0.1% 0.6%
Oromo 14 0.1% 0.5%
Samoan 12 <0.1% 0.4%
Pashto 9 <0.1% 0.3%
Chinese 9 <0.1% 0.3%
Other Languages24 133 0.5% 4.8%
Total Non-English Language Cases 2,769 10.3% 100.0%
Total 26,945 100.0%
23 Primary Language Code comes from the language chosen by the Assistance Unit that is used for letters, notices, and other written communications. 24 Clients who are coded as “Other Language” in the ACES database or speak a language with less than 10 clients in the caseload.

TANF/SFA/WorkFirst 2017
29 ESA Briefing Book
Client Demographics, June 2017 Snapshot
Characteristic
All Clients All Adults All Children
# of Clients
% of Total
Clients # of
Clients
% of Total
Adults # of
Clients
% of Total
Children
Total Clients 59,666 100.0% 16,122 100.0% 43,544 100.0%
Gender All Clients All Adults All Children
Female 34,508 57.8% 12,890 80.0% 21,618 49.6%
Male 25,154 42.2% 3,232 20.0% 21,922 50.3%
Unknown 4 <0.1% 0 0.0% 4 <0.1%
Ethnicity and Race All Clients All Adults All Children
Hispanic or Latino 12,351 20.7% 2,225 13.8% 10,126 23.3%
Not Hispanic or Latino25 47,315 79.3% 13,897 86.2% 33,418 76.7%
White 26,714 44.8% 9,013 55.9% 17,701 40.7%
Black/African American 7,579 12.7% 2,207 13.7% 5,372 12.3%
Asian/Pacific Islander 2,404 4.0% 803 5.0% 1,601 3.7%
American Indian/Alaska Native 1,783 3.0% 400 2.5% 1,383 3.2%
Two or More Races 1,332 2.2% 228 1.4% 1,104 2.5%
Race Not Reported 7,503 12.6% 1,246 7.7% 6,257 14.4%
Marital Status All Adults
Separated 1,581 9.8%
Married 3,646 22.6%
Never Married 8,837 54.8%
Divorced 1,803 11.2%
Widowed 113 0.7%
Not Reported/Unidentifiable 142 0.9%
Citizenship Status All Clients All Adults All Children
U.S. Citizen 53,905 90.3% 13,526 83.9% 40,379 92.7%
Resident Alien 5,601 9.4% 2,535 15.7% 3,066 7.0%
U.S. National26 160 0.3% 61 0.4% 99 0.2%
25 Includes clients not reporting whether or not they are of Hispanic or Latino origin 26 U.S. National: A national of the United States or a person who, though not a citizen of the United States, owes permanent allegiance to the United States (e.g., persons born in American Samoa or Swains Island).

TANF/SFA/WorkFirst 2017
30 ESA Briefing Book
Client Demographics, June 2017 Snapshot (continued)
Characteristic
All Clients All Adults
# of Clients
% of Total
Clients # of
Clients
% of Total
Adults
Homeless Status All Clients All Adults
Homeless27 8,579 14.4% 3,835 23.8%
Education Status All Adults
Less than a High School Diploma 3,962 24.6%
High School Graduate or GED 8,069 50.0%
Some College or College Degree 3,786 23.5%
Not Reported/Unidentifiable 305 1.9%
Age All Clients All Adults
< 1 Year Old 4,102 6.9%
1 – 5 Years Old 13,446 22.5%
6 – 10 Years Old 11,817 19.8%
11 – 15 Years Old 9,755 16.3%
16 – 17 Years Old 28 3,440 5.8% 24 0.1%
18 – 24 Years Old 28 4,635 7.8% 3,627 22.5%
25 – 34 Years Old 6,843 11.5% 6,843 42.4%
35 – 44 Years Old 3,961 6.6% 3,961 24.6%
45 – 54 Years Old 1,393 2.3% 1,393 8.6%
55 – 64 Years Old 264 0.4% 264 1.6%
65+ Years Old 10 <0.1% 10 0.1%
Average Age of Children 7.7 Years
Average Age of Adults 32.0 Years
Months on Assistance Since July 1997 (All Adults)
Average 25
Median 16
27 Homeless is defined as: homeless without housing, homeless with housing (staying temporarily with family or friends), emergency shelter, or battered spouse shelter. 28 Clients are classified as adults or children based on their relationship to the head of household, rather than age.

TANF/SFA/WorkFirst 2017
31 ESA Briefing Book
Child Demographics, June 2017 Snapshot
Characteristic
All Children Children in Child-Only Cases
# of Clients % of All Children
# of Clients
% of Children in Child-Only Cases
Total Clients 43,544 100.0% 20,273 100.0%
Gender All Children Children in Child-Only Cases
Female 21,618 49.6% 10,278 50.7%
Male 21,922 50.3% 9,992 49.3%
Unknown 4 <0.1% 3 <0.1%
Ethnicity and Race All Children Children in Child-Only Cases
Hispanic or Latino 10,126 23.3% 5,902 29.1%
Not Hispanic or Latino29 33,418 76.7% 14,371 70.9%
White 17,701 40.7% 7,967 39.3%
Black/African American 5,372 12.3% 2,072 10.2%
Asian/Pacific Islander 1,601 3.7% 622 3.1%
American Indian/Alaska Native 1,383 3.2% 920 4.5%
Two or More Races 1,104 2.5% 482 2.4%
Race Not Reported 6,257 14.4% 2,308 11.4%
Citizenship Status All Children Children in Child-Only Cases
U.S. Citizen 40,379 92.7% 19,881 98.1%
Resident Alien 3,066 7.0% 349 1.7%
U.S. National30 99 0.2% 43 0.2%
29 Includes clients not reporting whether or not they are of Hispanic or Latino origin 30 U.S. National: A national of the United States or a person who, though not a citizen of the United States, owes permanent allegiance to the United States (e.g., persons born in American Samoa or Swains Island). 31 Clients are classified as adults or children based on their relationship to the head of household, rather than age.
Age All Children Children in Child-Only Cases
< 1 Year Old 4,102 9.4% 766 3.8%
1 – 5 Years Old 13,446 30.9% 5,050 24.9%
6 – 10 Years Old 11,817 27.1% 5,949 29.3%
11 – 15 Years Old 9,755 22.4% 5,735 28.3%
16 – 17 Years Old31 3,416 7.8% 2,129 10.5%
18 – 24 Years Old31 1,008 2.3% 644 3.2%
Average Age of Children 7.7 Years
Average Age of Children in Child-Only Cases
9.1 Years