Embed Size (px)
Citation preview
TAMING THE
TAKS TEST
Objective One
• Nature of science– Lab safety, first aid, respect for environment,
eliminating bias– Lab equipment– Accuracy vs Precision– Scientific Method– Charts, graphs, tables, pictures

Safty Rules• Use only labeled
materials.
• Read labels twice to make sure.
• Know the procedure.
• Ask about the MSDS if you are not familiar with the substance.
Safety with Temperature Changes
• Do not handle hot or cold containers.
• Use the proper holder for the container.
• When heating a substance, aim it away from everyone.
Safety with Gases
• Odors are tested by wafting.
• Reactions which produce gases should be done in a fume hood.
• Gases should be trapped only in a large volume container to provide for rapid expansion.
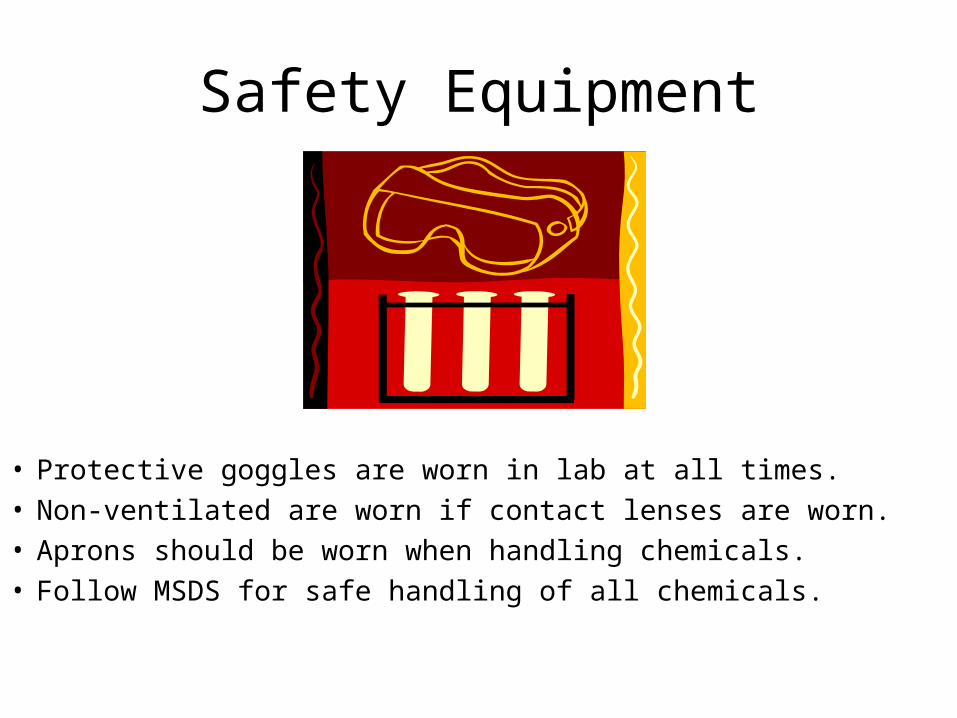
Safety Equipment
• Protective goggles are worn in lab at all times. • Non-ventilated are worn if contact lenses are worn. • Aprons should be worn when handling chemicals. • Follow MSDS for safe handling of all chemicals.
1 The safest way to dilute concentrated sulfuric acid is to add —A a series of small volumes
of water to the acid while stirring
B the acid to water slowly while stirring constantly
C the acid to a small volume of water and then add more water
D dilute sulfuric acid to a small volume of the concentrated acid
• I want you to remember
A & W ROOTBEER
always pour acid into water
if you pour water into acid it will splash acid all over you

Other Safety Tips That Might Be On The TAKS Test!
• Do experiments only approved by the teacher!
• If you have any questions, problems, or concerns ALWAYS ASK THE TEACHER!
• Never eat or drink in lab!
• Keep work area clean!
• When using scapel, cut away from you!

First Aid
• Burns – apply cold water• Cuts & bruises – stop
bleeding by direct pressure, apply cold compresses to bruises
• Spill in eye and skin – flush with water, use eyewash or safety shower
• Fainting – leave person lying down, loosen clothing
Respect For The Environment
• Clean up after yourself
• Do not harm habitat

Know Lab Equipment and What Each Piece of Equipment Does!
Use Elmo!!!
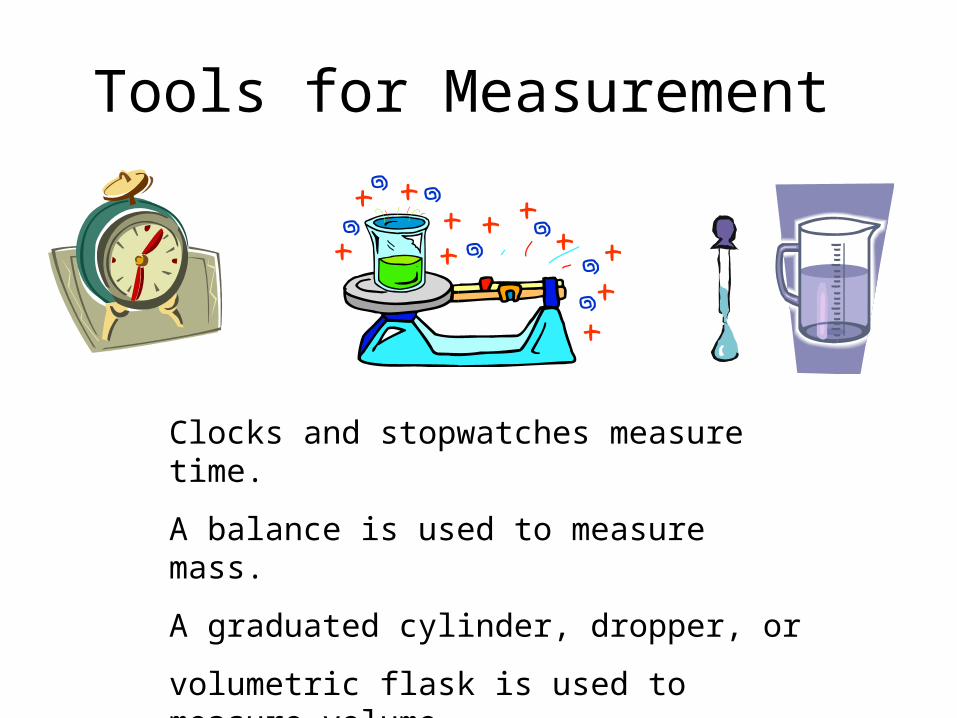
Tools for Measurement
Clocks and stopwatches measure time.
A balance is used to measure mass.
A graduated cylinder, dropper, or
volumetric flask is used to measure volume.
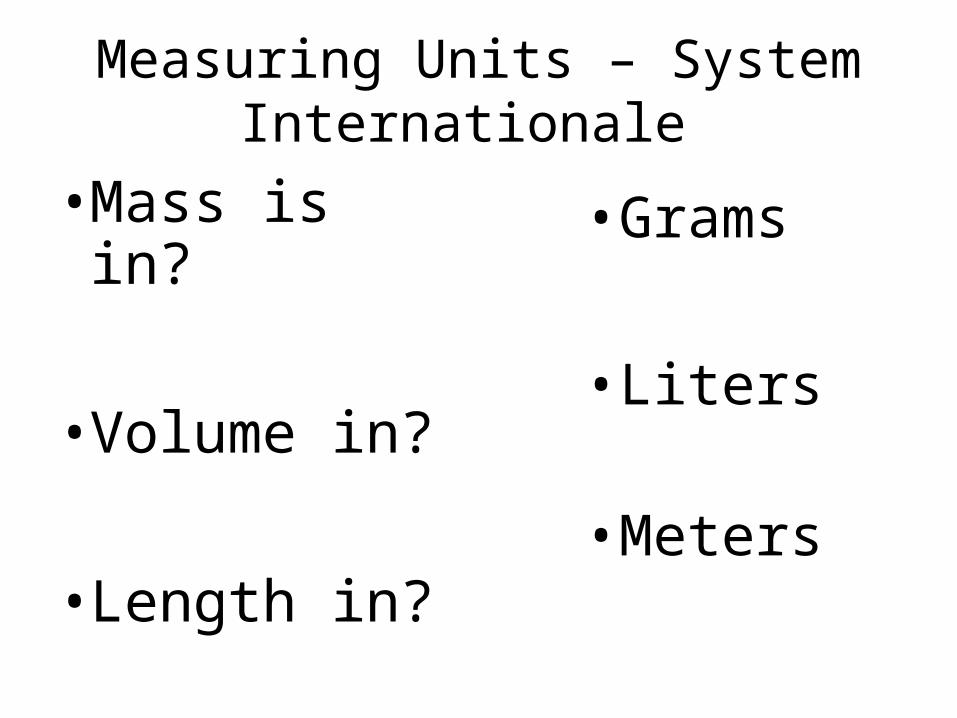
Measuring Units – System Internationale
• Mass is in?
• Volume in?
• Length in?
• Grams
• Liters • Meters

Your turn!
10. Which of the following pieces of equipment would be most appropriate for measuring the volume of a marble
A. B. C. D.
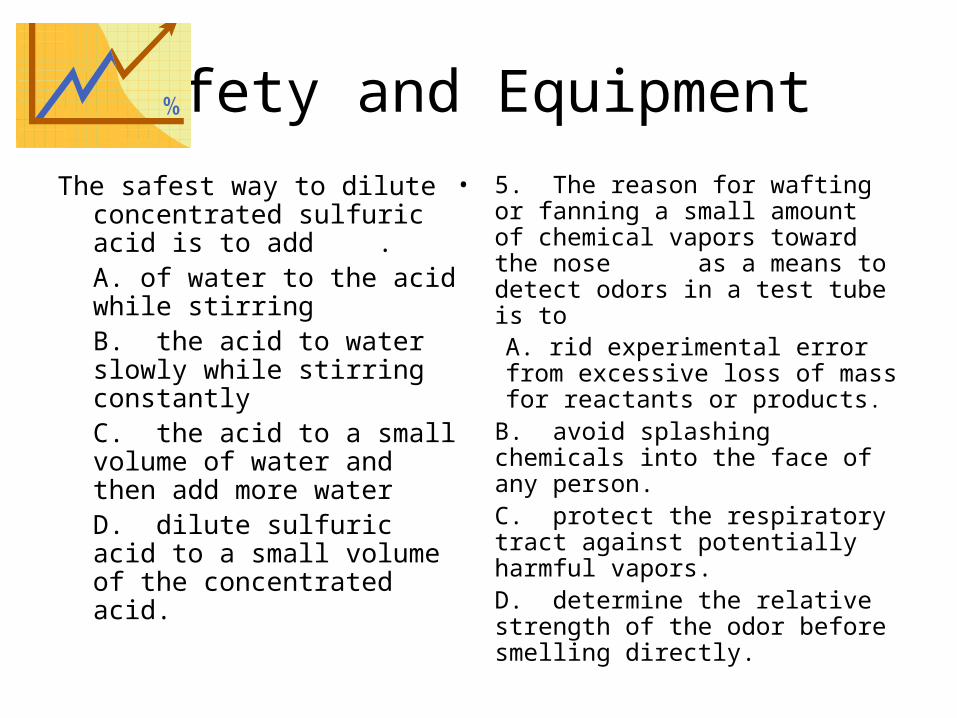
Safety and Equipment
The safest way to dilute concentrated sulfuric acid is to add .A. of water to the acid while stirringB. the acid to water slowly while stirring constantlyC. the acid to a small volume of water and then add more waterD. dilute sulfuric acid to a small volume of the concentrated acid.
• 5. The reason for wafting or fanning a small amount of chemical vapors toward the nose as a means to detect odors in a test tube is to A. rid experimental error from excessive loss of mass for reactants or products.
B. avoid splashing chemicals into the face of any person.C. protect the respiratory tract against potentially harmful vapors.D. determine the relative strength of the odor before smelling directly.
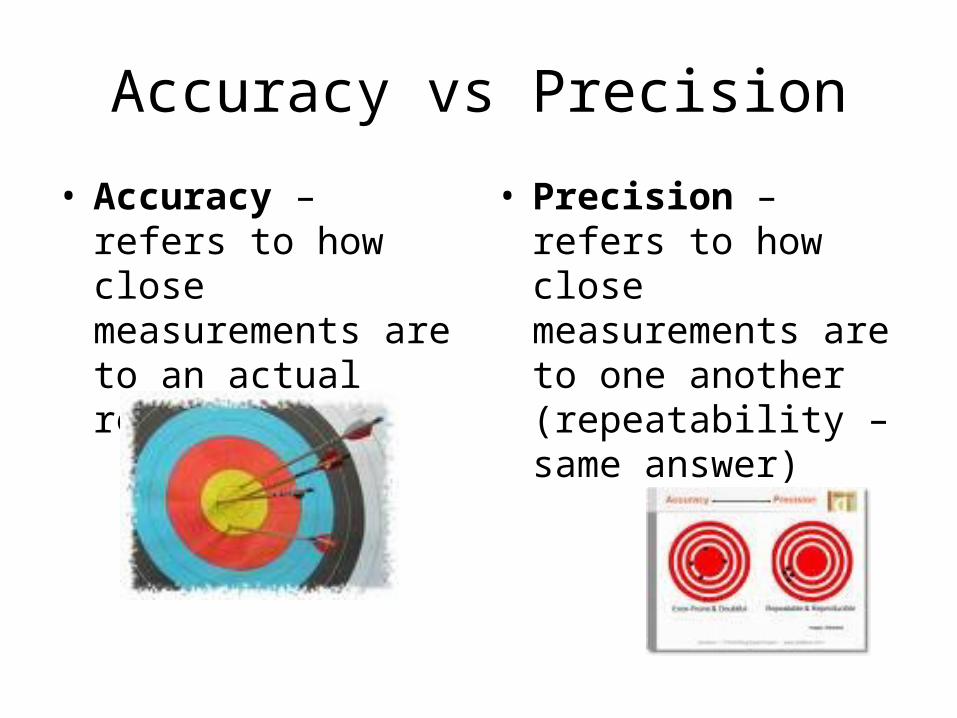
Accuracy vs Precision
• Accuracy – refers to how close measurements are to an actual result
• Precision – refers to how close measurements are to one another (repeatability – same answer)

Another Look At Accuracy
• This is when a measurement is closest to its true value.
• Several thermometers reading exactly the same temperature would indicate good accuracy.

Accuracy vs. Precision
Which of the following will allow measurement of a liquid’s volume with the greatest precision?
A 50 mL cylinder graduated in 1 mL increments
B 50 mL cylinder graduated in 0.5 mL increments
C 100 mL cylinder graduated in 1 mL increments
D 200 mL cylinder graduated in 5 mL increments
Answer: B

13 Four lab groups measured the volume of acid required to neutralize a standard solution of sodium hydroxide base. Which of the groups measured the
volume with the highest precision?

Scientific Method
• Problem
• Hypothesis
• Experiment
• Data
• Conclusion

Problem
• What are you trying to solve?
• Only one thing can be tested

Hypothesis
• “Educated guess”• Telling how one
variable will effect another variable
• What you think is the answer to your problem?
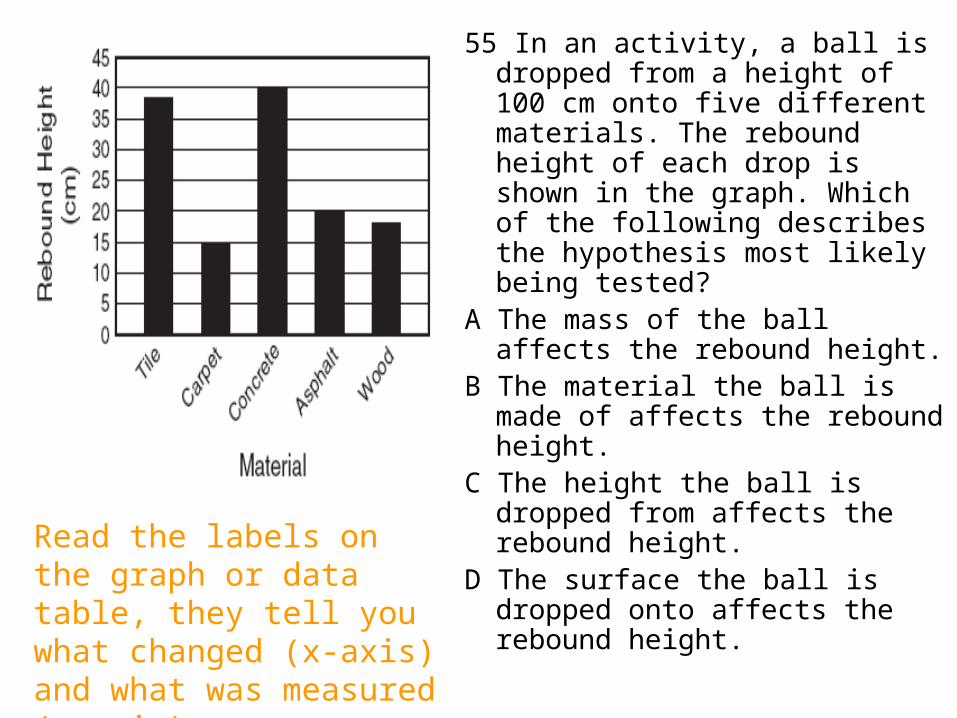
55 In an activity, a ball is dropped from a height of 100 cm onto five different materials. The rebound height of each drop is shown in the graph. Which of the following describes the hypothesis most likely being tested?
A The mass of the ball affects the rebound height.
B The material the ball is made of affects the rebound height.
C The height the ball is dropped from affects the rebound height.
D The surface the ball is dropped onto affects the rebound height.
Read the labels on the graph or data table, they tell you what changed (x-axis) and what was measured (y-axis).
Experiment
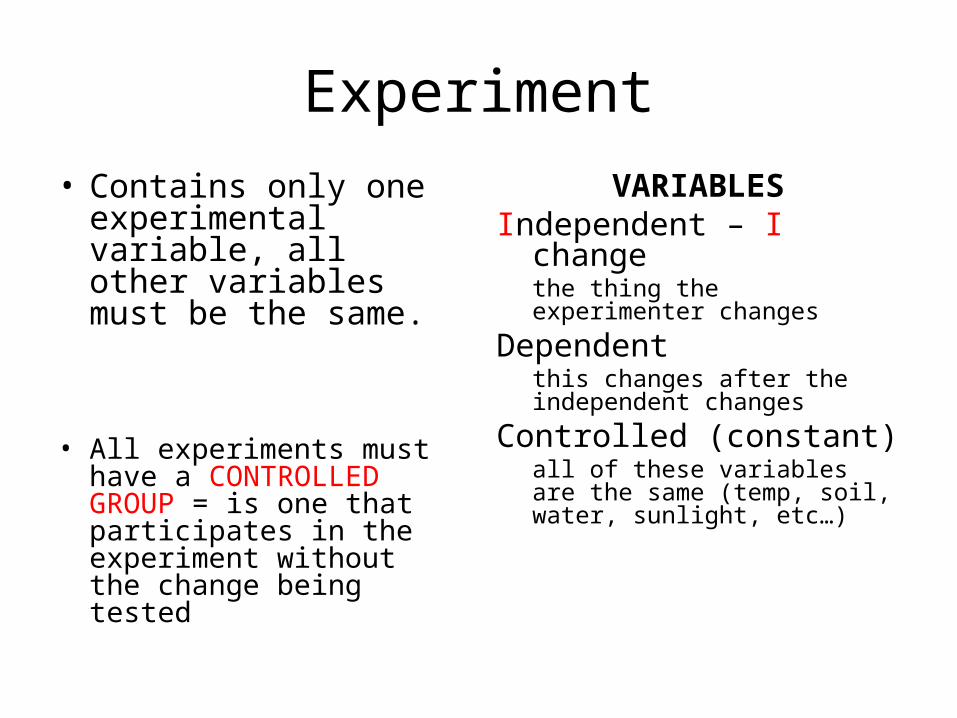
• Contains only one experimental variable, all other variables must be the same.
• All experiments must have a CONTROLLED GROUP = is one that participates in the experiment without the change being tested
VARIABLESIndependent – I change
the thing the experimenter changes
Dependent this changes after the independent changes
Controlled (constant)all of these variables are the same (temp, soil, water, sunlight, etc…)
DATA
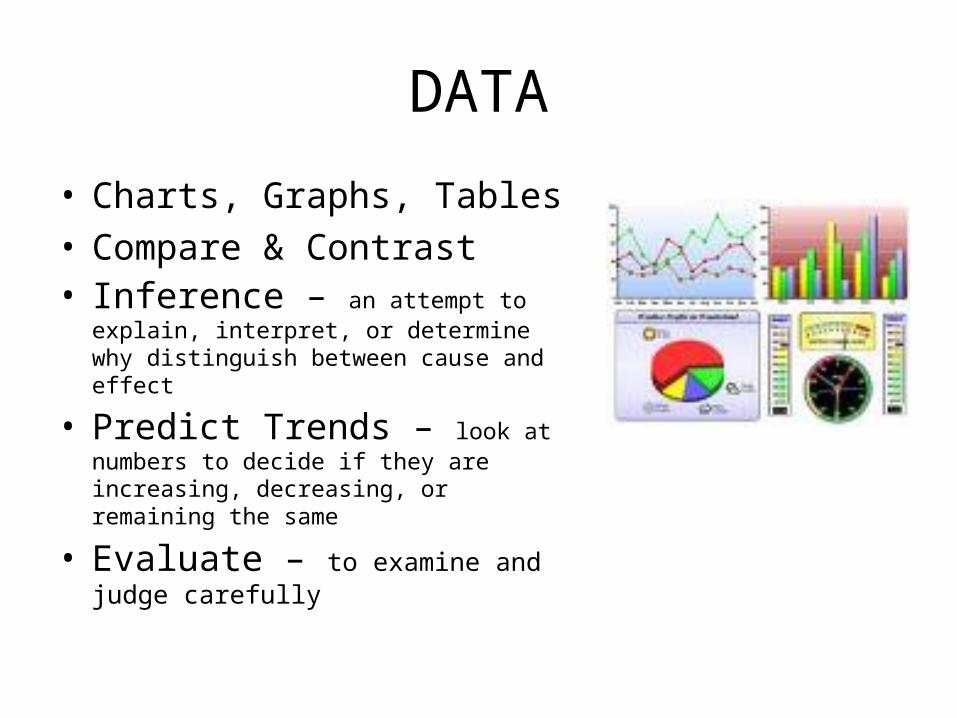
• Charts, Graphs, Tables• Compare & Contrast• Inference – an attempt to explain,
interpret, or determine why distinguish between cause and effect
• Predict Trends – look at numbers to decide if they are increasing, decreasing, or remaining the same
• Evaluate – to examine and judge carefully

Reading Tables and Graphs
1. When a question includes a table or graph, read it first, before the question.
2. Don’t just Look at it READ IT. 3. What is the Title, what is being measured
or compared? What units (grams, mLs, minutes, years) are given?
4. Are the numbers or slope increasing, decreasing?
5. After reading the data, now read the question!

Reading Graphs
Always read the title.
Read the x- & y-axis labels & UNITS.
What is happening?
As the pressure of oxygen increases, the % saturation is
increased.
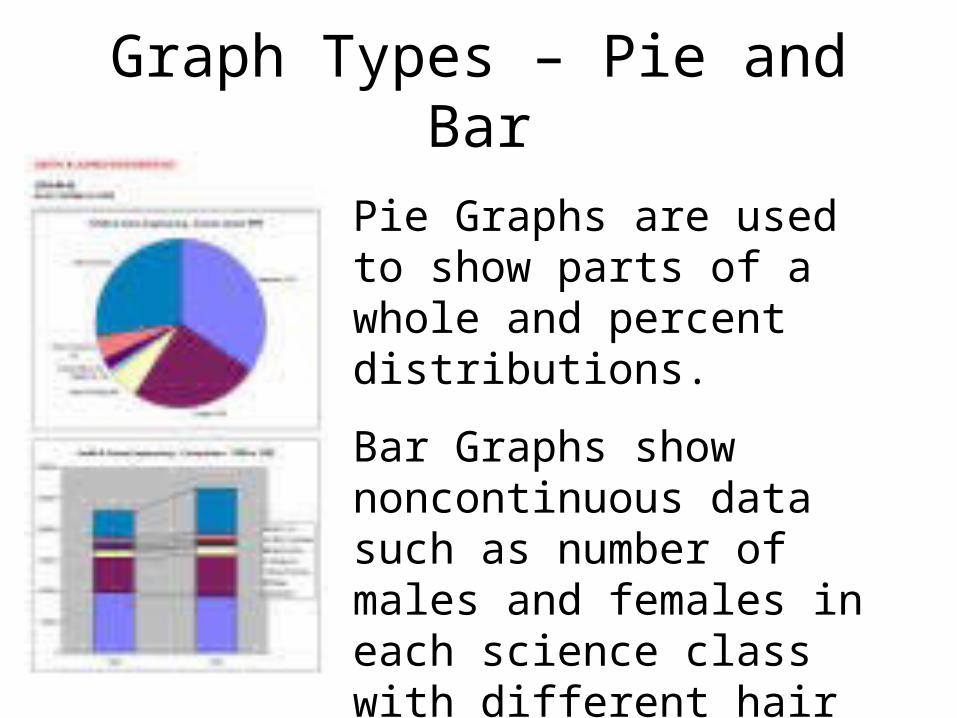
Graph Types – Pie and Bar
Pie Graphs are used to show parts of a whole and percent distributions.
Bar Graphs show noncontinuous data such as number of males and females in each science class with different hair colors.

Graphs – Line or Curves
Line Graphs show continuous data like distance vs. time, acceleration, or plant growth over 6 weeks
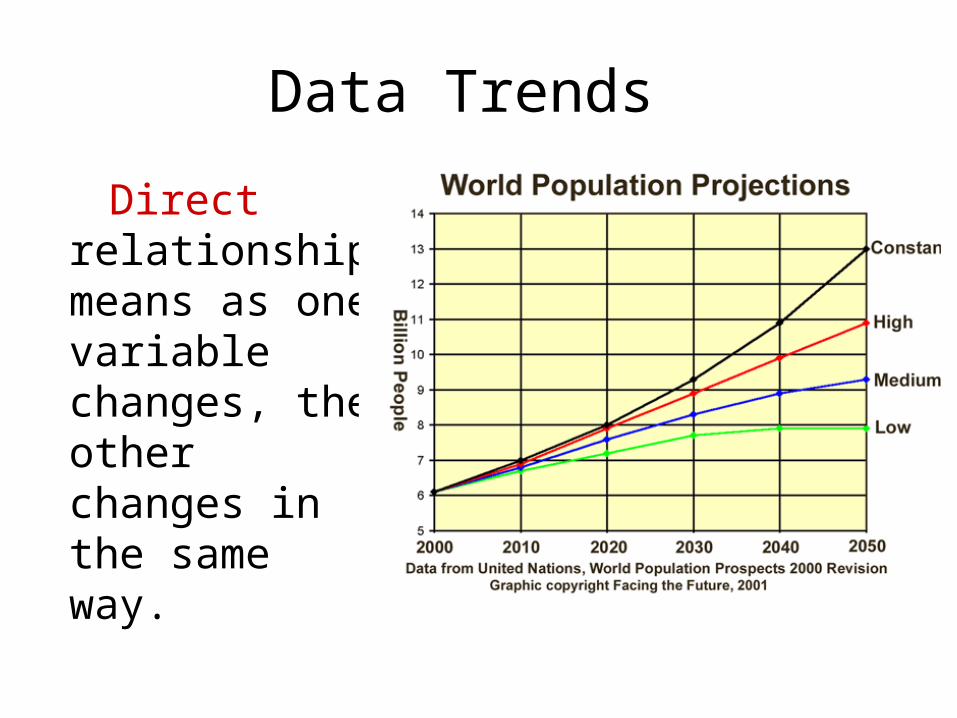
Data Trends
Direct relationship means as one variable changes, the other changes in the same way.
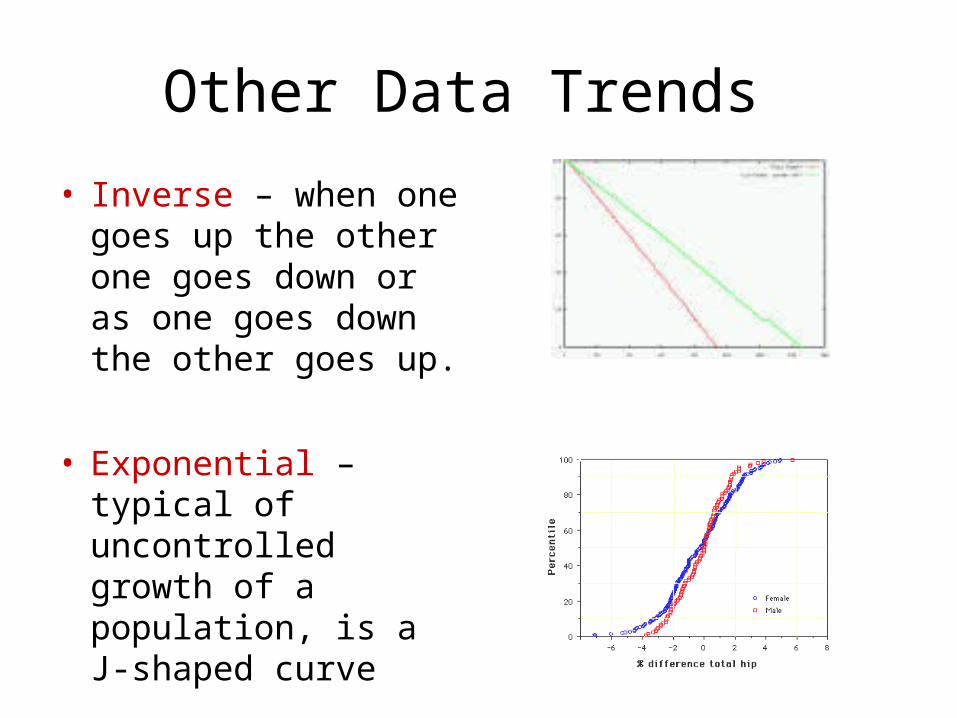
Other Data Trends
• Inverse – when one goes up the other one goes down or as one goes down the other goes up.
• Exponential – typical of uncontrolled growth of a population, is a J-shaped curve

30 A researcher determined the percentage of electrical energy transformed into different forms of energy by a toaster. The best way to communicate these results is to display the data using a —
F histogramG circle graphH line graphJ box-whisker graph
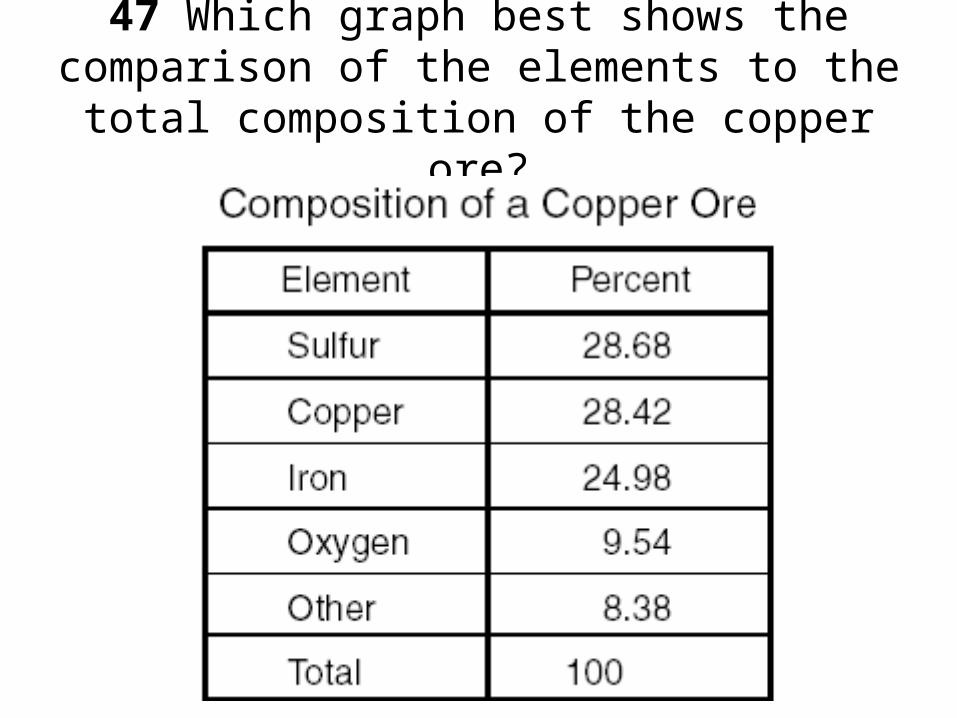
47 Which graph best shows the comparison of the elements to the total composition of
the copper ore?
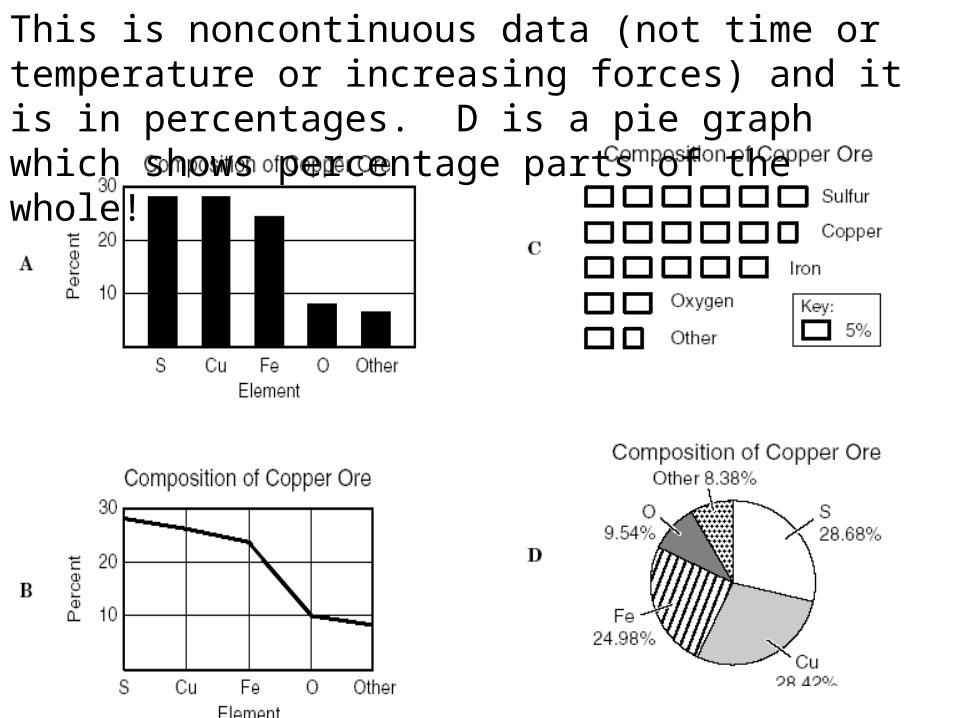
This is noncontinuous data (not time or temperature or increasing forces) and it is in percentages. D is a pie graph which shows percentage parts of the whole!

Conclusions - Summary of what happened – stating if your
hypothesis was right or wrong
• Conclusions must be
based upon the data collected.
• Opinions are not to be included, however an inference based upon data and observations may be included to propose another type of experiment.
• Conclusions also should include an error analysis.
• What possible changes to the experiment are needed to improve results?
• Can the experiment be repeated with the same outcome?
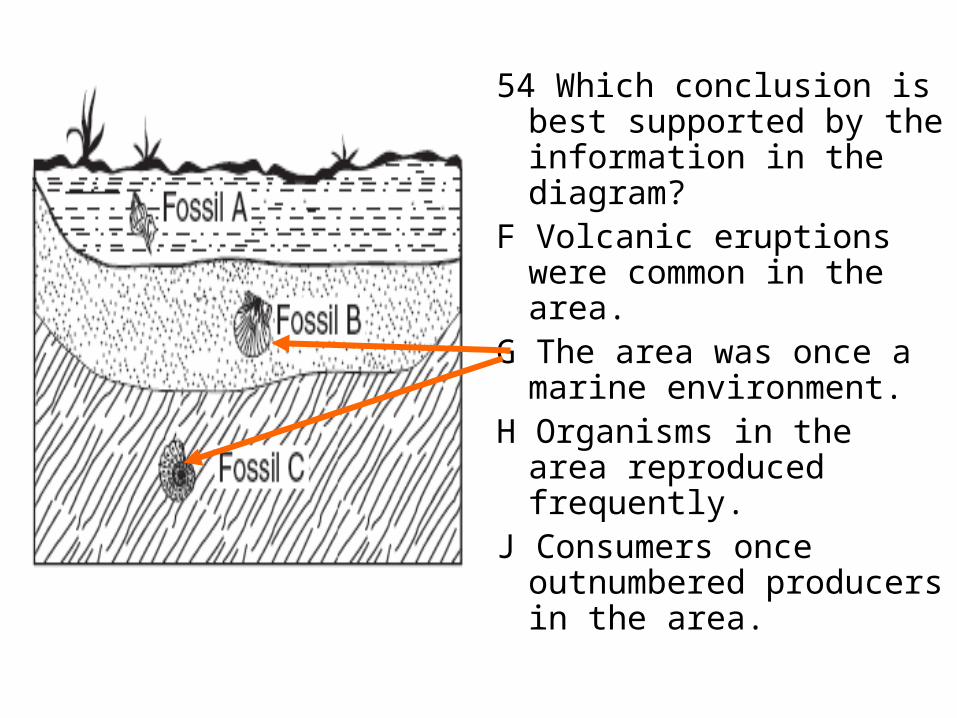
54 Which conclusion is best supported by the information in the diagram?
F Volcanic eruptions were common in the area.
G The area was once a marine environment.
H Organisms in the area reproduced frequently.
J Consumers once outnumbered producers in the area.
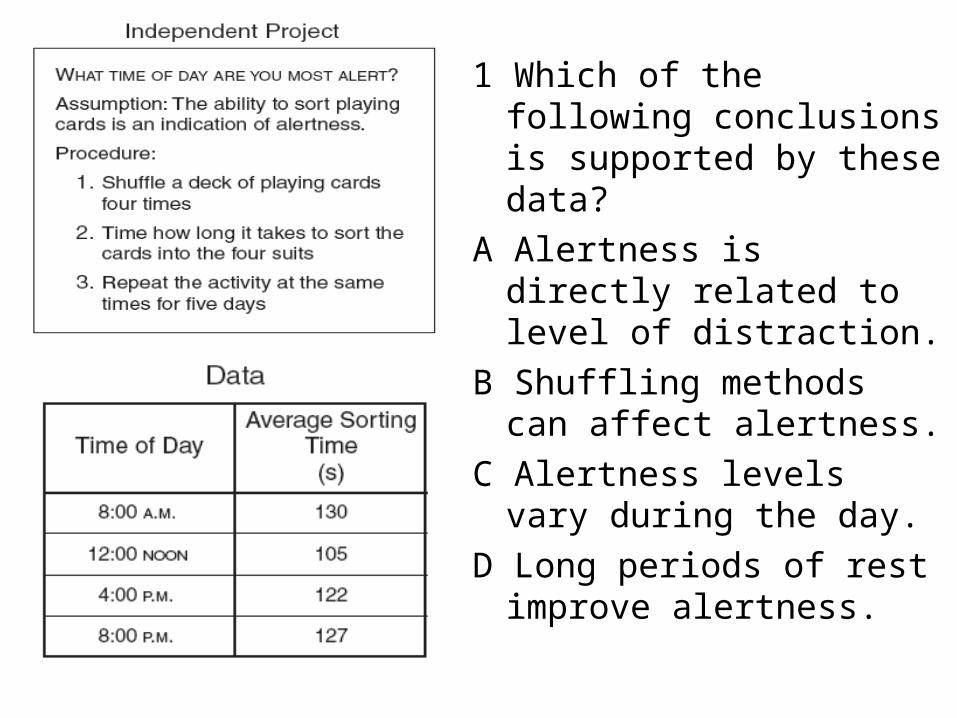
1 Which of the following conclusions is supported by these data?
A Alertness is directly related to level of distraction.
B Shuffling methods can affect alertness.
C Alertness levels vary during the day.
D Long periods of rest improve alertness.
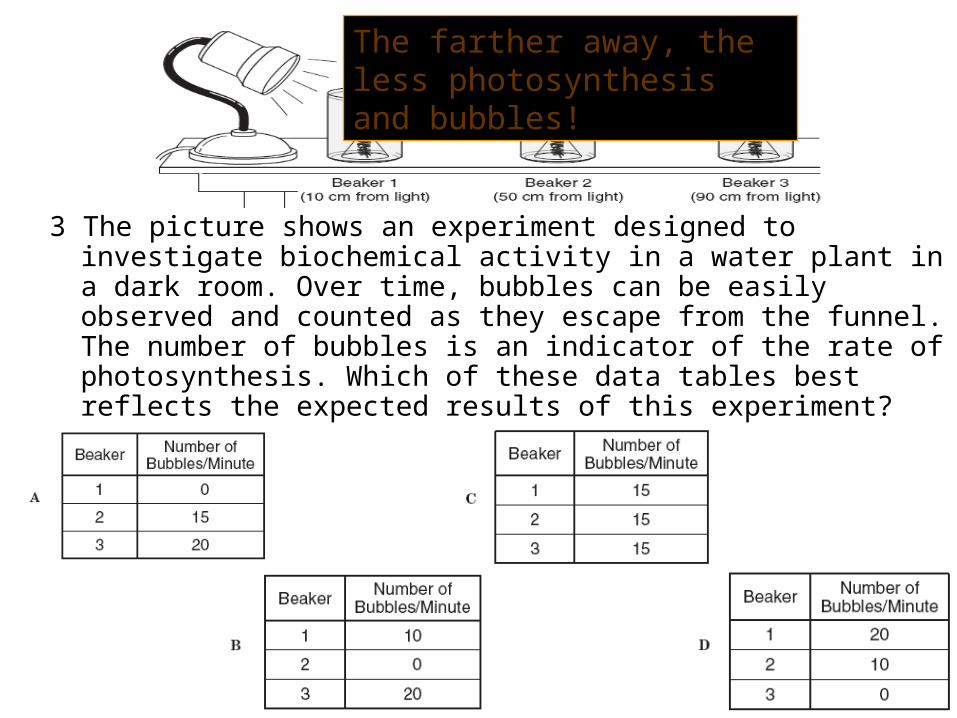
3 The picture shows an experiment designed to investigate biochemical activity in a water plant in a dark room. Over time, bubbles can be easily observed and counted as they escape from the funnel. The number of bubbles is an indicator of the rate of photosynthesis. Which of these data tables best reflects the expected results of this experiment?
The farther away, the less photosynthesis and bubbles!