Embed Size (px)
Citation preview
THE POTENTIAL FOR REDUCING CLIMATE EMISSIONS RELATED TO TRANSPORTATION AND URBAN FORM
Lewison Lem, [email protected]
Parsons Brinckerhoff and Center for Climate Strategies
for
Sonoran Institute and Lincoln Institute of Land Policy
February 2008

REDUCING THE CLIMATE IMPACT OF TRANSPORTATION AND URBAN FORM
Transportation as a Major Source of Climate Change
How Do We Reduce the Climate Impact of the Transportation and Urban Form? ?
Science-Based Climate Stabilization Targets (450-550 ppm CO2)
2
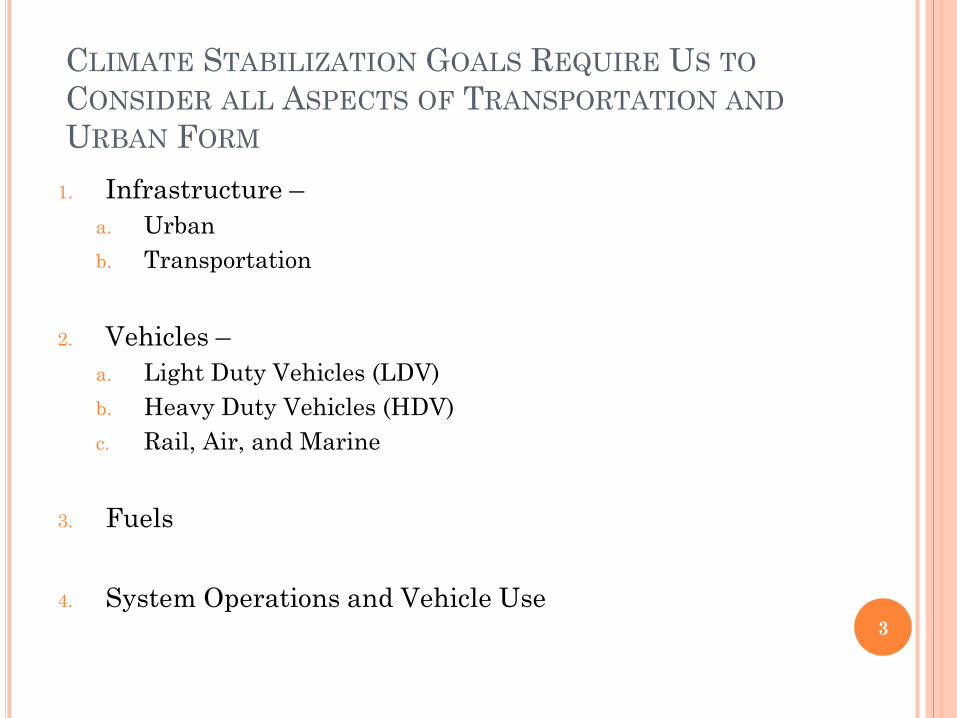
CLIMATE STABILIZATION GOALS REQUIRE US TOCONSIDER ALL ASPECTS OF TRANSPORTATION ANDURBAN FORM
1. Infrastructure –a. Urbanb. Transportation
2. Vehicles –a. Light Duty Vehicles (LDV)b. Heavy Duty Vehicles (HDV)c. Rail, Air, and Marine
3. Fuels
4. System Operations and Vehicle Use3

4
• Transportation and Urban Form is particularly important
• Transportation and Land Use together constitute one of the largest sector sources of greenhouse gas emissions.
• Other sectors are working to make substantial reductions in greenhouse gases
• How can transportation and urban form reduce its share of emissions on a fair and reasonable, if not proportional, basis?
4
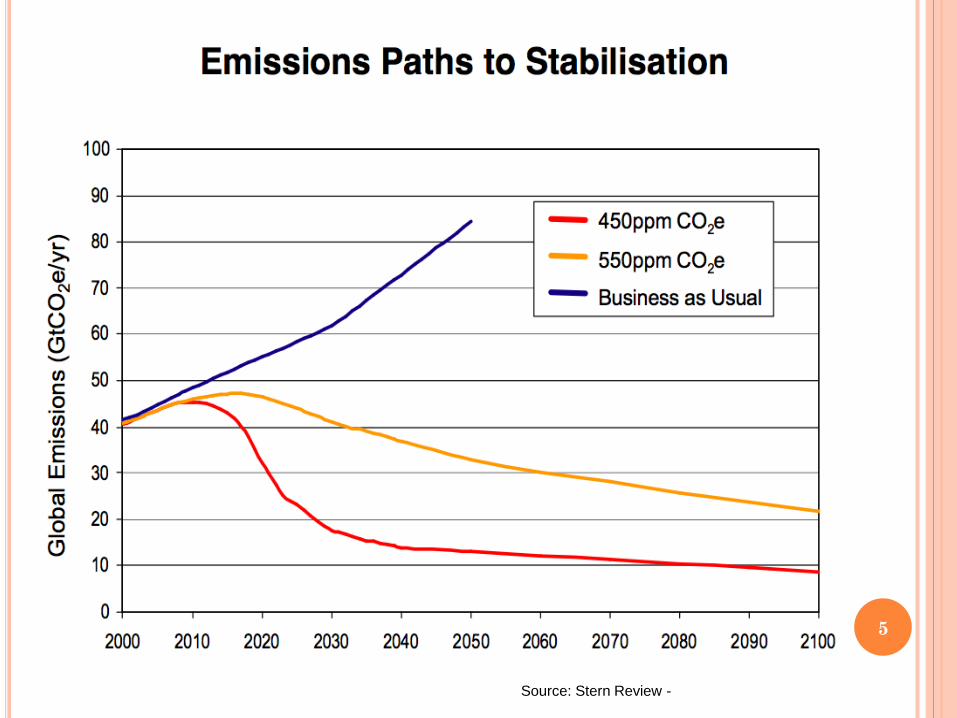
Source: Stern Review -
5
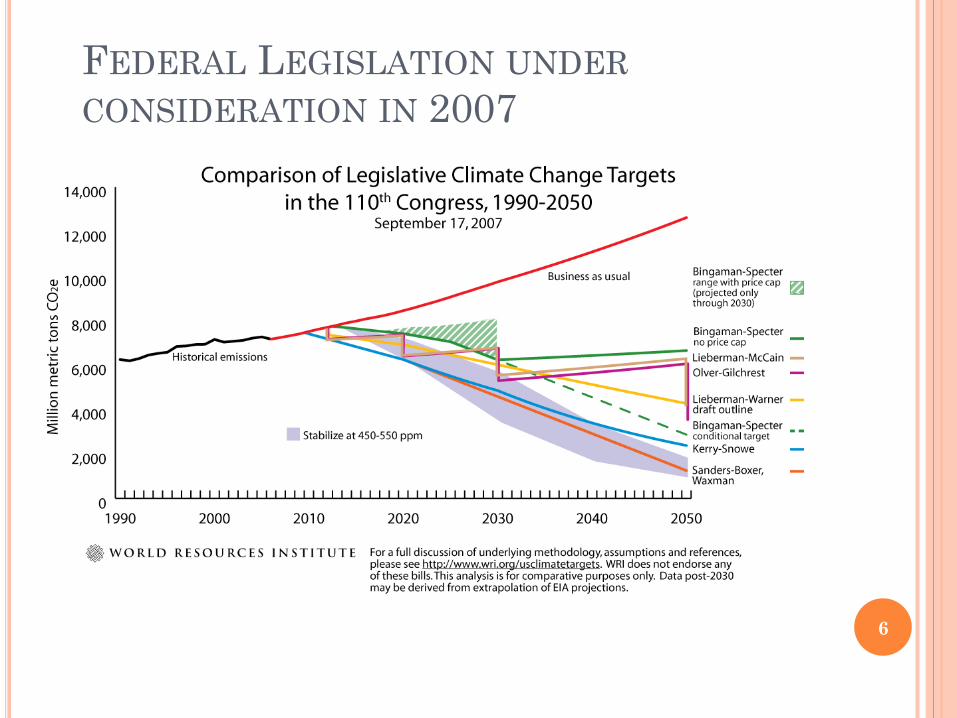
FEDERAL LEGISLATION UNDERCONSIDERATION IN 2007
6

STATES AND REGIONS ARE DEVELOPINGPLANS TO REDUCE CLIMATE CHANGEEMISSIONS
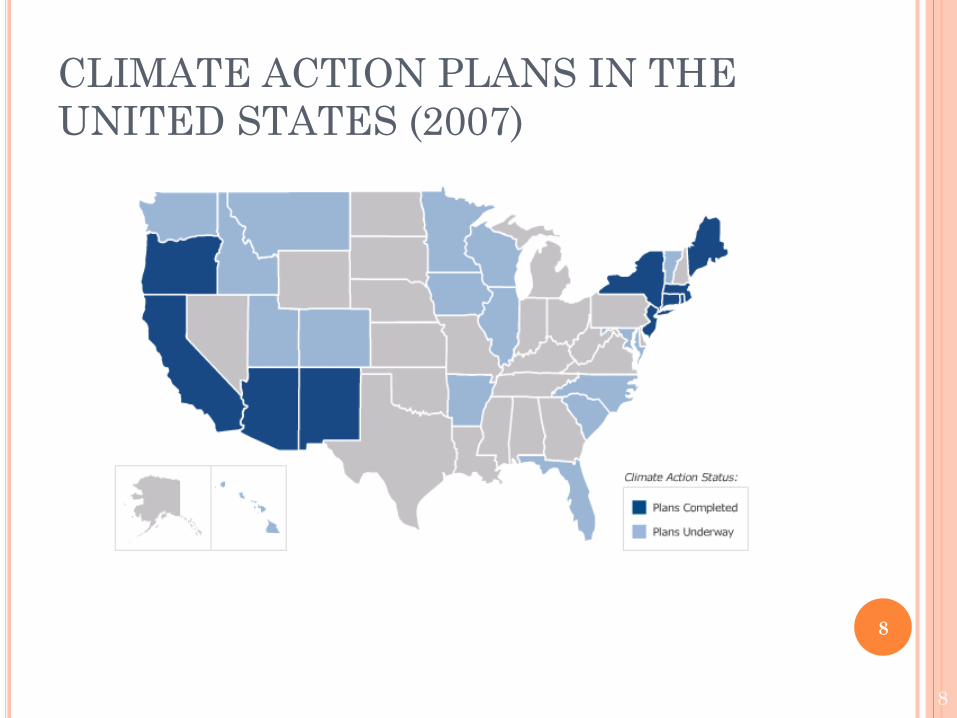
For a number of years, the national government has left a vacuum of climate policy leadership in the United States
Cities, counties, states, and regions have increased activities during this period
Coordinated and consistent policy development and implementation is moving from individual state actions towards regional multi-state cooperation and coordination. New England States Western States Midwestern States
7
8 8
CLIMATE ACTION PLANS IN THE UNITED STATES (2007)
8
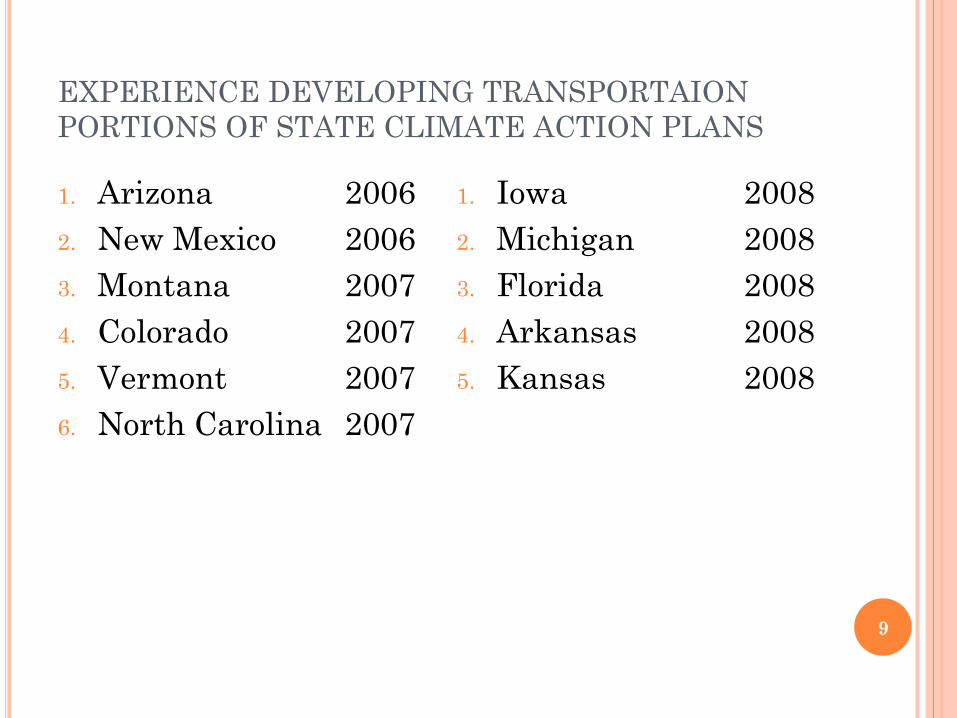
EXPERIENCE DEVELOPING TRANSPORTAION PORTIONS OF STATE CLIMATE ACTION PLANS
1. Arizona 20062. New Mexico 20063. Montana 20074. Colorado 20075. Vermont 20076. North Carolina 2007
1. Iowa 20082. Michigan 20083. Florida 20084. Arkansas 20085. Kansas 2008
9
10
10
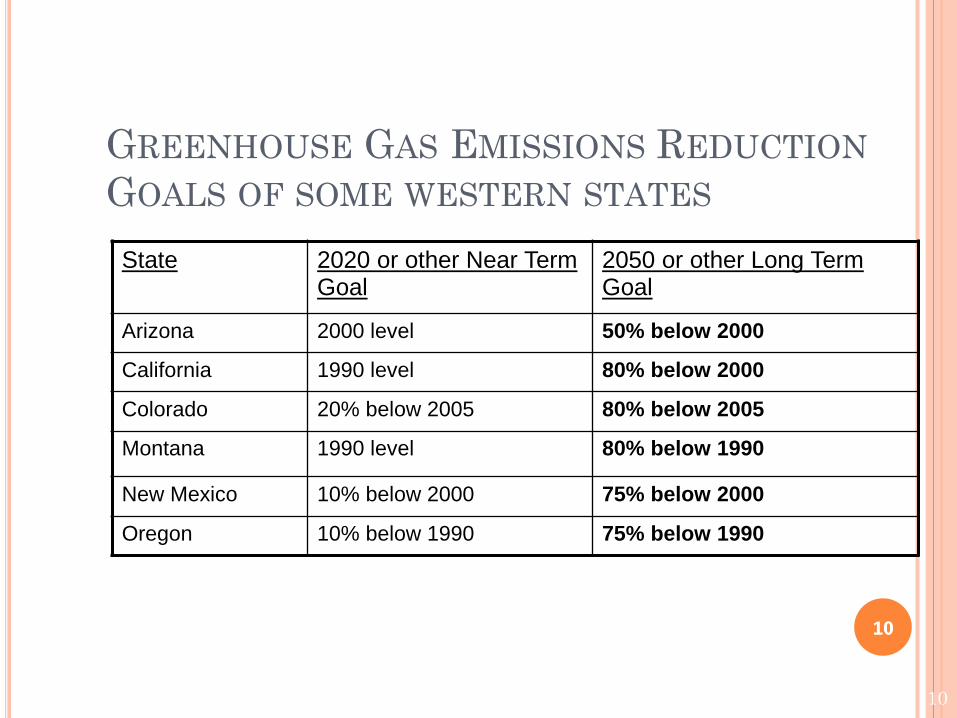
GREENHOUSE GAS EMISSIONS REDUCTIONGOALS OF SOME WESTERN STATES
State 2020 or other Near Term Goal
2050 or other Long Term Goal
Arizona 2000 level 50% below 2000
California 1990 level 80% below 2000
Colorado 20% below 2005 80% below 2005
Montana 1990 level 80% below 1990
New Mexico 10% below 2000 75% below 2000
Oregon 10% below 1990 75% below 1990
10
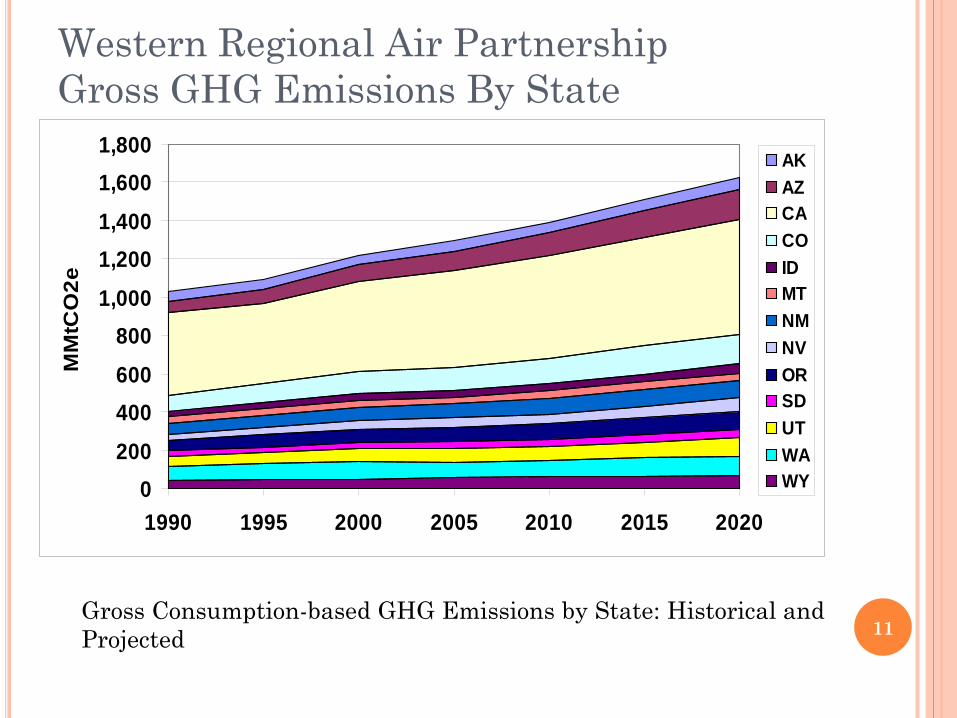
Western Regional Air Partnership Gross GHG Emissions By State
Gross Consumption-based GHG Emissions by State: Historical and Projected
0200400600800
1,0001,2001,4001,6001,800
1990 1995 2000 2005 2010 2015 2020
MM
tCO
2e
AKAZCACOIDMTNMNVORSDUTWAWY
11
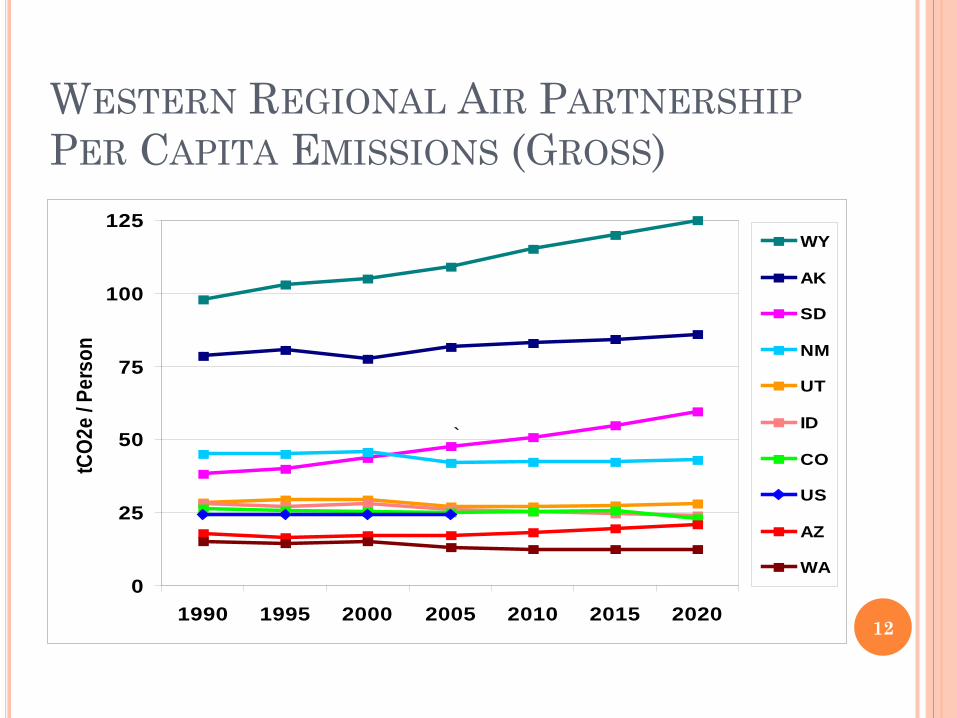
WESTERN REGIONAL AIR PARTNERSHIPPER CAPITA EMISSIONS (GROSS)
0
25
50
75
100
125
1990 1995 2000 2005 2010 2015 2020
tCO2
e / P
erso
n
WY
AK
SD
NM
UT
ID
CO
US
AZ
WA
`
12
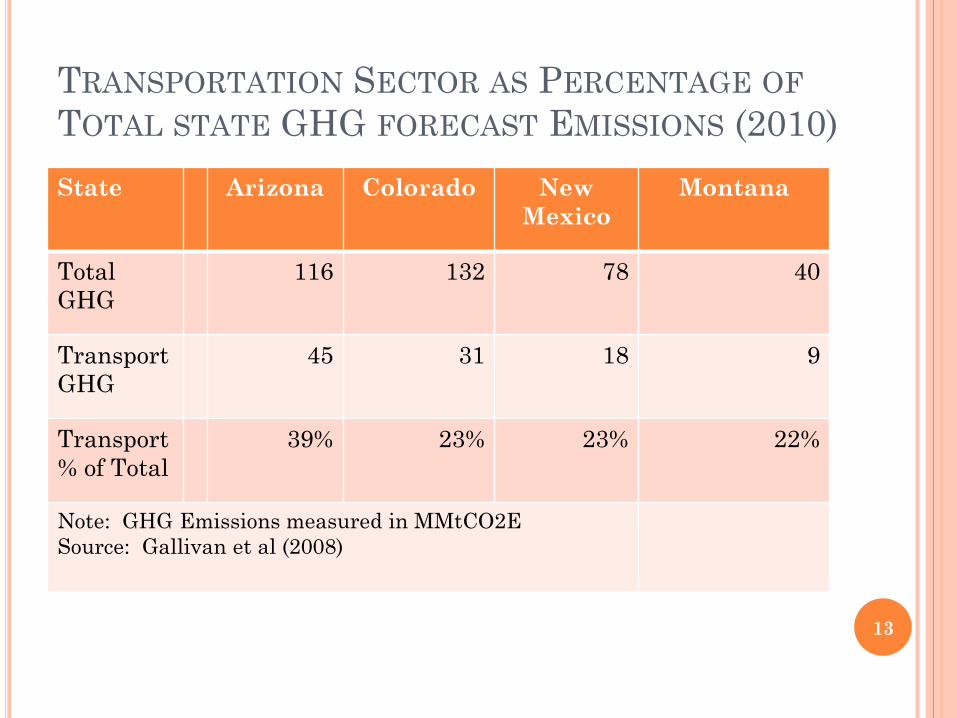
TRANSPORTATION SECTOR AS PERCENTAGE OFTOTAL STATE GHG FORECAST EMISSIONS (2010)State Arizona Colorado New
MexicoMontana
Total GHG
116 132 78 40
Transport GHG
45 31 18 9
Transport % of Total
39% 23% 23% 22%
Note: GHG Emissions measured in MMtCO2ESource: Gallivan et al (2008)
13
WHAT DRIVES GROWTH OF TRANSPORTATION SECTORGHG EMISSIONS ?
1) POPULATION
2) VEHICLE OWNERSHIP RATES
3) VEHICLE MILES OF TRAVEL (VMT) RATES
4) FUEL ECONOMY OF VEHICLE FLEET
5) TYPES OF FUELS USED IN VEHICLES
6) PRICE OF VEHICLE OPERATION (e.g. fuel price, etc)
14
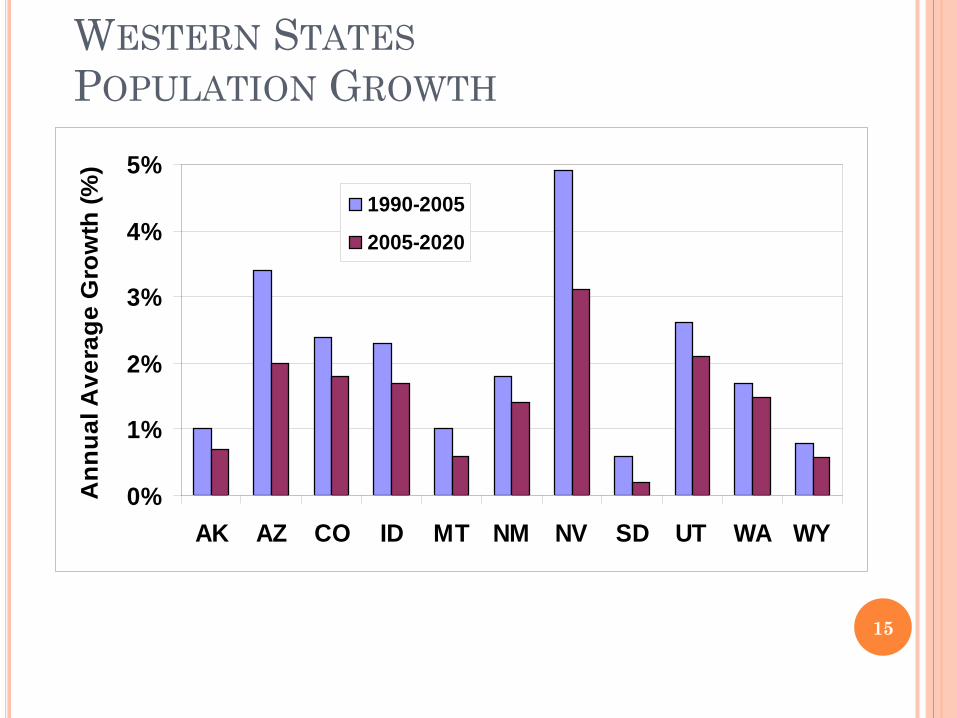
WESTERN STATESPOPULATION GROWTH
0%
1%
2%
3%
4%
5%
AK AZ CO ID MT NM NV SD UT WA WY
Ann
ual A
vera
ge G
row
th (%
)
1990-2005
2005-2020
15
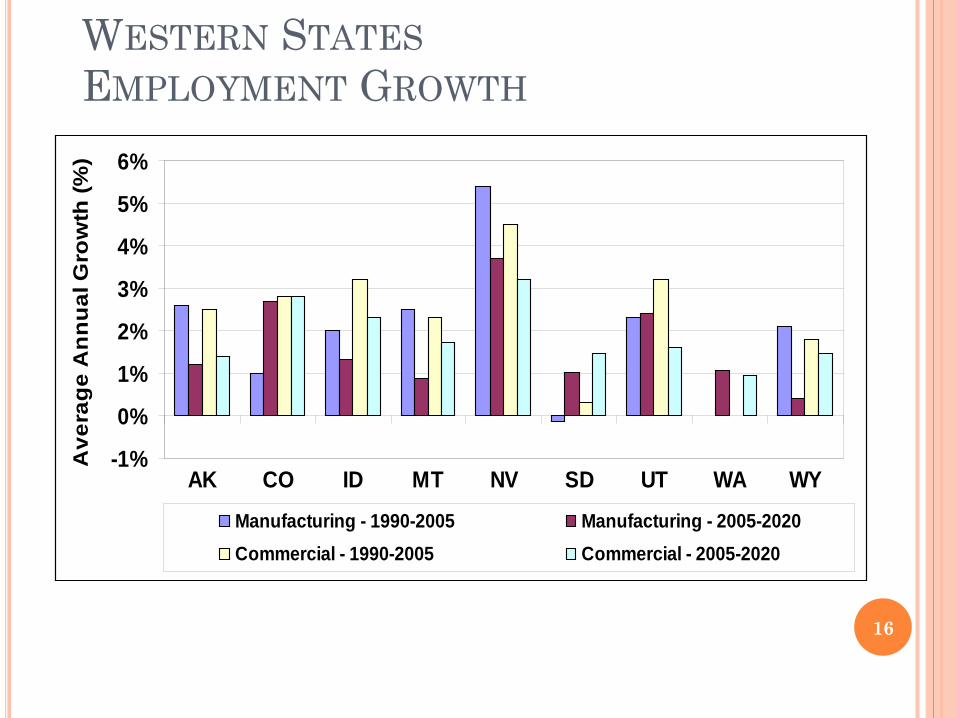
WESTERN STATESEMPLOYMENT GROWTH
-1%
0%
1%
2%
3%
4%
5%
6%
AK CO ID MT NV SD UT WA WY
Ave
rag
e A
nn
ual
Gro
wth
(%)
Manufacturing - 1990-2005 Manufacturing - 2005-2020Commercial - 1990-2005 Commercial - 2005-2020
16
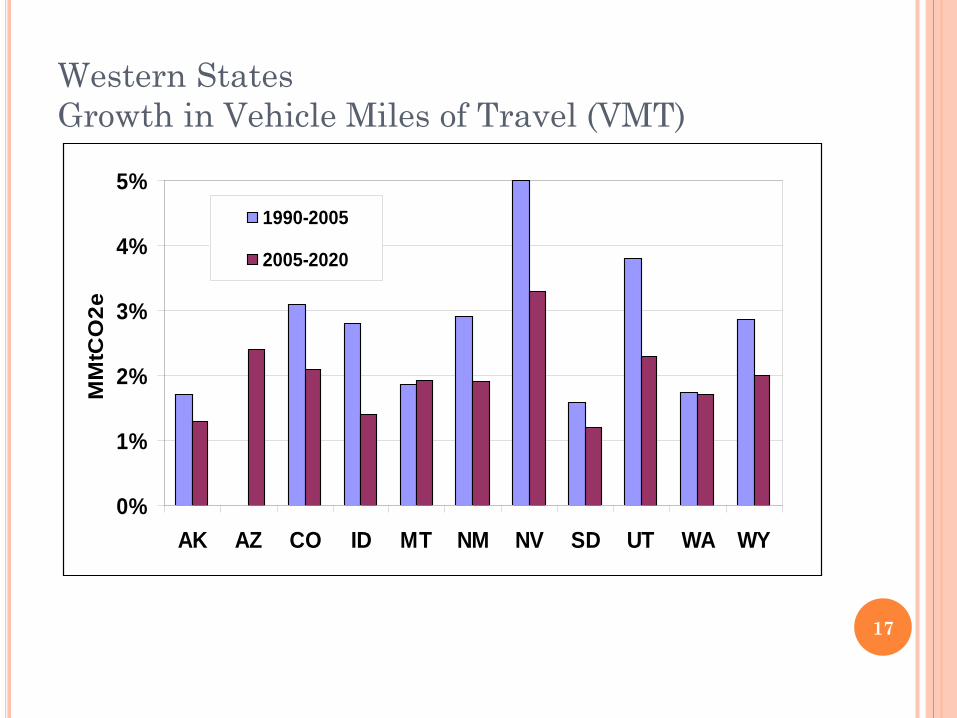
Western States Growth in Vehicle Miles of Travel (VMT)
0%
1%
2%
3%
4%
5%
AK AZ CO ID MT NM NV SD UT WA WY
MM
tCO
2e
1990-2005
2005-2020
17
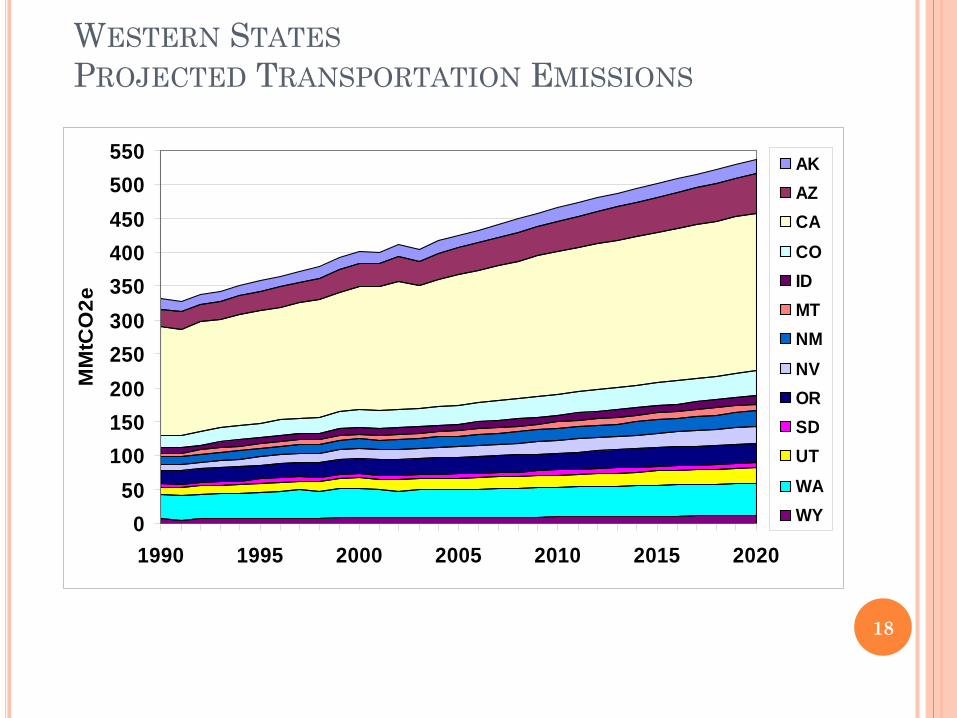
WESTERN STATESPROJECTED TRANSPORTATION EMISSIONS
050
100150200250300350400450500550
1990 1995 2000 2005 2010 2015 2020
MM
tCO
2e
AKAZCACOIDMTNMNVORSDUTWAWY
18
19
There is some difference of opinion among professional analysts about the effectiveness and cost-effectiveness of various strategies for emissions reductions from transportation and urban form.
19
There is significant difference of opinion among professional analysts and political leaders regarding the efficacy of:
(1) Smart Growth and Transit(2) Transportation System Efficiency
as compared with the effectiveness of strategies in other transportation categories:
(3) Vehicle Improvements and(4) Fuels Strategies.
20
Some argue that technology-based vehicle and fuel improvements for the transportation sector may be sufficient to meet the transportation sectors share of GHG emissions reduction goals.
In contrast, the Urban Land Institute (ULI) has recently released a report arguing for the viability of GHG emissions reductions through smart growth and ‘growing cooler’.
21
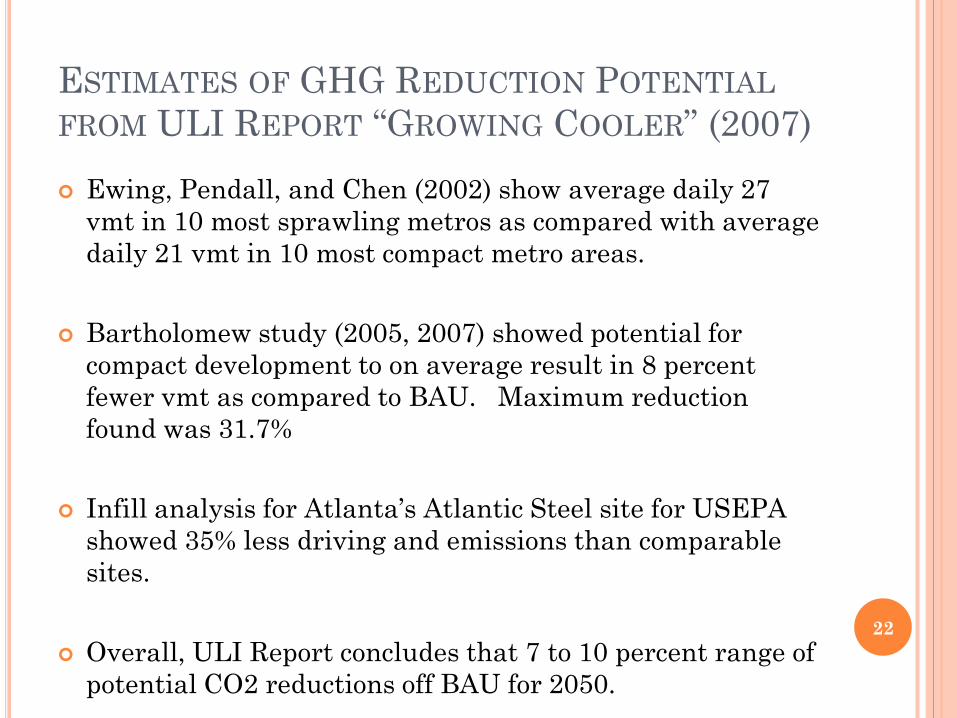
ESTIMATES OF GHG REDUCTION POTENTIALFROM ULI REPORT “GROWING COOLER” (2007) Ewing, Pendall, and Chen (2002) show average daily 27
vmt in 10 most sprawling metros as compared with average daily 21 vmt in 10 most compact metro areas.
Bartholomew study (2005, 2007) showed potential for compact development to on average result in 8 percent fewer vmt as compared to BAU. Maximum reduction found was 31.7%
Infill analysis for Atlanta’s Atlantic Steel site for USEPA showed 35% less driving and emissions than comparable sites.
Overall, ULI Report concludes that 7 to 10 percent range of potential CO2 reductions off BAU for 2050.
22
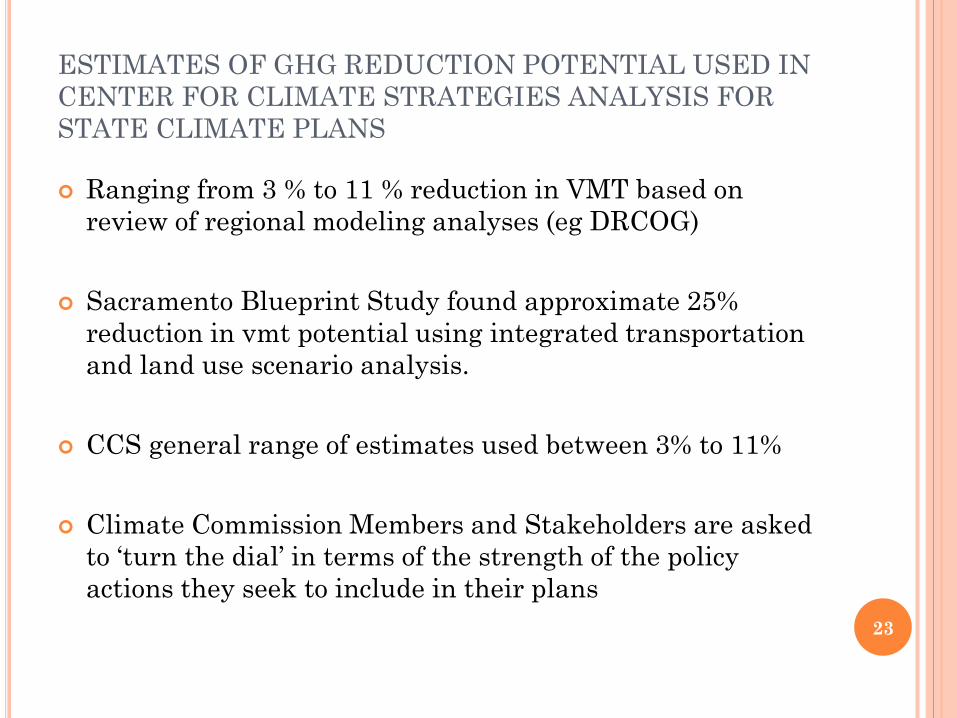
ESTIMATES OF GHG REDUCTION POTENTIAL USED IN CENTER FOR CLIMATE STRATEGIES ANALYSIS FOR STATE CLIMATE PLANS
Ranging from 3 % to 11 % reduction in VMT based on review of regional modeling analyses (eg DRCOG)
Sacramento Blueprint Study found approximate 25% reduction in vmt potential using integrated transportation and land use scenario analysis.
CCS general range of estimates used between 3% to 11%
Climate Commission Members and Stakeholders are asked to ‘turn the dial’ in terms of the strength of the policy actions they seek to include in their plans
23
24 24
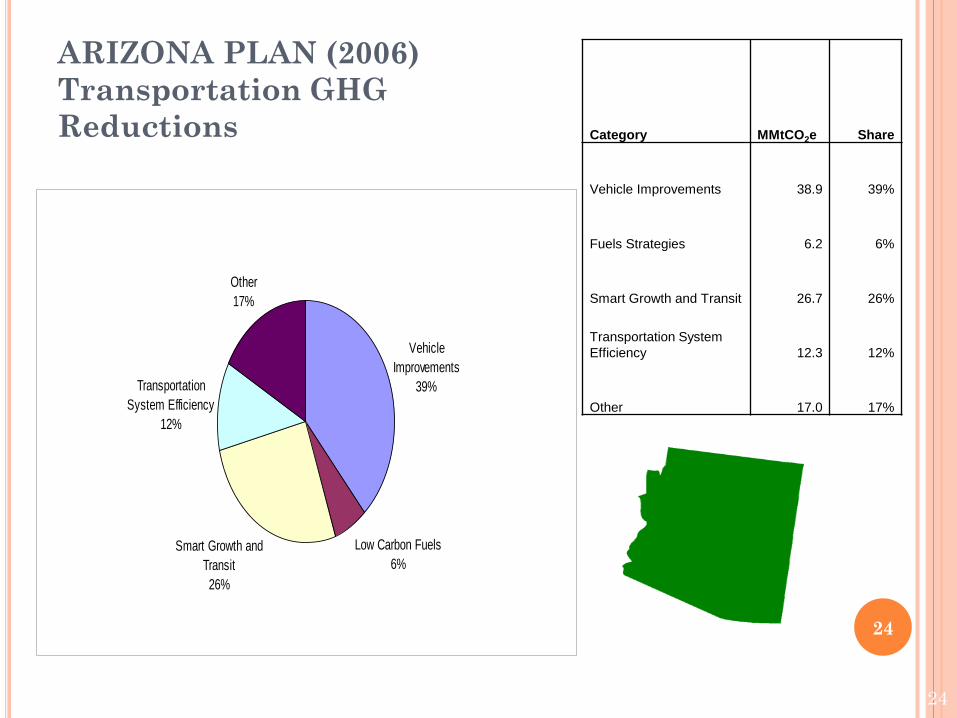
ARIZONA PLAN (2006) Transportation GHG Reductions Category MMtCO2e Share
Vehicle Improvements 38.9 39%
Fuels Strategies 6.2 6%
Smart Growth and Transit 26.7 26%
Transportation System Efficiency 12.3 12%
Other 17.0 17%
Low Carbon Fuels6%
Smart Growth and Transit 26%
Transportation System Efficiency
12%
Other17%
Vehicle Improvements
39%
24

25 25
NEW MEXICO PLAN (2006)TRANSPORTATION GHG REDUCTIONS Category MMtCO2e Share
Vehicle Improvements 15.9 29%
Fuels Strategies 9.1 17%
Smart Growth and Transit 13.4 24%
Transportation System Efficiency 7.6 14%
Other 9.1 17%Transportation System Efficiency
14%
Smart Growth and Transit24%
Low Carbon Fuels17%
Vehicle Improvements 28%
Other17%
25
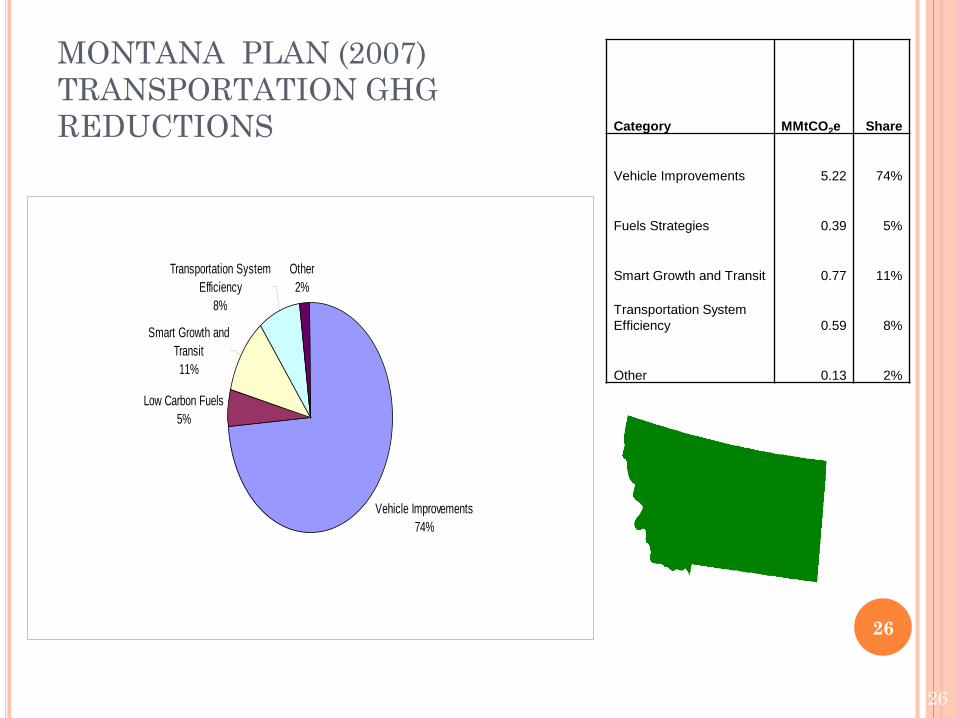
26 26
MONTANA PLAN (2007) TRANSPORTATION GHG REDUCTIONS Category MMtCO2e Share
Vehicle Improvements 5.22 74%
Fuels Strategies 0.39 5%
Smart Growth and Transit 0.77 11%
Transportation System Efficiency 0.59 8%
Other 0.13 2%
Vehicle Improvements74%
Low Carbon Fuels5%
Smart Growth and Transit 11%
Transportation System Efficiency
8%
Other2%
26
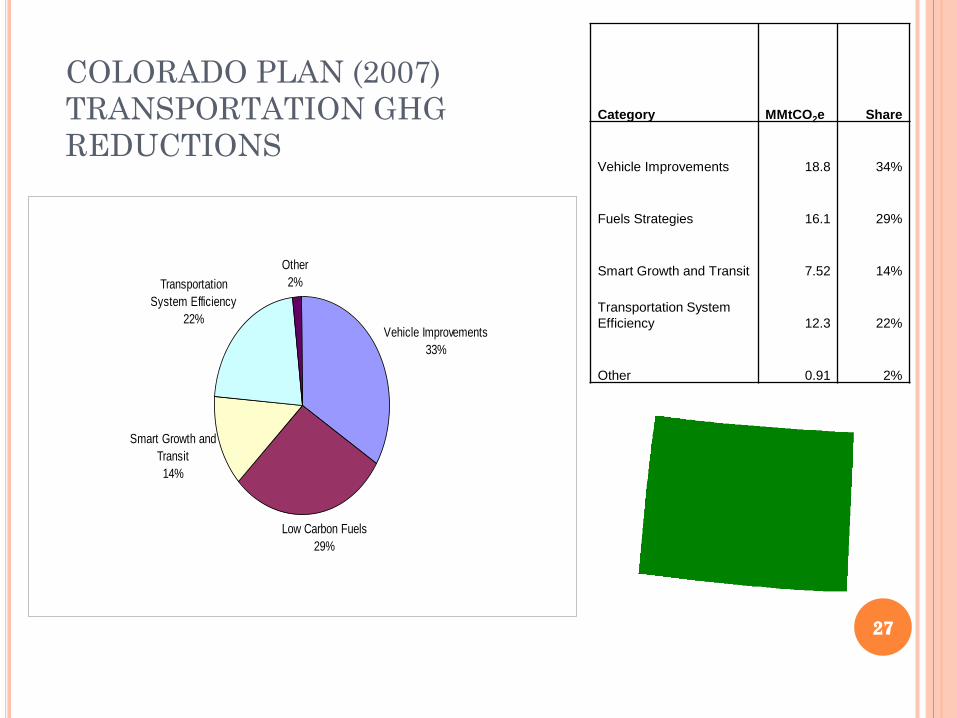
27
COLORADO PLAN (2007) TRANSPORTATION GHG REDUCTIONS
Vehicle Improvements33%
Low Carbon Fuels29%
Smart Growth and Transit14%
Transportation System Efficiency
22%
Other2%
Category MMtCO2e Share
Vehicle Improvements 18.8 34%
Fuels Strategies 16.1 29%
Smart Growth and Transit 7.52 14%
Transportation System Efficiency 12.3 22%
Other 0.91 2%
27