Embed Size (px)
Citation preview

Page 1 of 35
Basel III - Pillar 3 Disclosures as on September 30, 2016
1. Scope of Application and Capital Adequacy
Table DF-1- Scope of application Name of the head of the banking group
to which the framework applies:- Tamilnad Mercantile Bank Ltd., Qualitative Disclosures Applicability to our Bank
a. List of Group entities considered for consolidation. The Bank does not belong to any group and does not have any associate, subsidiaries, joint venture, etc.
b. List of Group entities not considered for
consolidation both under the accounting and regulatory
scope of consolidation.
Not Applicable
Quantitative Disclosures
c. List of group entities considered for consolidation The Bank does not belong to any group and does not have any associate, subsidiaries, joint venture, etc.
d. The aggregate amount of capital deficiencies in all
subsidiaries which are not included in the regulatory
scope of consolidation i.e. that are deducted and the
name(s) of such subsidiaries.
Not Applicable
e. The aggregate amounts (e.g. Current book value) of
the bank’s total interests in insurance entities, which
are risk-weighted.
Not Applicable
f. Any restriction or impediments on transfer of funds or
regulatory capital within the banking group.
Not Applicable

Page 2 of 35
Table DF-2-Capital Adequacy Qualitative Disclosures
A. A summary discussion of the Bank's approach to assessing the adequacy of its capital to support current and future activities.
The Bank is following standardized approach, Standardized Duration approach and
Basic Indicator approach for measurement of capital charge in respect of credit risk,
market risk and operational risk respectively.
The computation of Capital for credit risk under Standardized Approach is done
granularly borrower & account wise based on the data captured through Core
Banking Solution. Bank is also taking efforts on an ongoing basis for the accuracy of
the data. The various aspects of NCAF norms are imparted to field level staff
regularly through circulars and letters for continuous purification of data and to
ensure accurate computation of Risk Weight and the Capital Charge. The Bank has
used the credit risk mitigation in computation of capital for credit risk, as prescribed
in the RBI guidelines under Standardized Approach.
The capital for credit risk on Loans and Advances, market risk and operational risk
as per the prescribed approaches are being computed at the bank’s Head Office and
aggregated to arrive at the bank’s CRAR position. The bank has followed the RBI
guidelines in force, to arrive at the eligible capital funds, for computing CRAR.
Besides computing CRAR under the Pillar I requirement, the Bank also periodically
undertakes stress testing in various risk areas to assess the impact of stressed
scenario or plausible events on asset quality, liquidity, profitability and capital
adequacy.
The bank conducts Internal Capital Adequacy Assessment Process (ICAAP) on
annual basis to assess the sufficiency of its capital funds to cover the risks specified
under Pillar- II of Basel guidelines. The adequacy of Bank’s capital funds to meet the
future business growth is also assessed in the ICAAP document, which is approved
by the Board. While the surplus CRAR available at present acts as a buffer to
support the future activities, the headroom available for the bank for mobilizing Tier 1
and Tier 2 capital (subject to approval by the competent authorities) is also assessed
to meet the required CRAR against future activities.

Page 3 of 35
The Bank has high quality Common Equity Tier 1 capital, as the entire components
of CET1 capital comprises of Paid up Capital, Reserves & Surplus and retained
earnings.
Minimum capital requirements under Basel-III:
Under the Basel III Capital Regulations, Banks are required to maintain a minimum
Pillar 1 Capital (Tier-I + Tier-II) to Risk-weighted Assets Ratio (CRAR) of 9% on an
on-going basis. Besides this minimum capital requirement, Basel III also provides for
creation of capital conservation buffer (CCB). The transitional period of full
implementation of Basel III capital regulation in India is extended up to March 31,
2019. Accordingly the CCB requirements are to be implemented from March 31,
2016 in phases and are to be fully implemented by March 31, 2019 to the extent of
2.5% of Risk weighted Assets. The banks are required to maintain minimum CRAR
of 9.625 %( including CCB of 0.625%) as on 30.09.2016.
The total regulatory capital fund under Basel- III norms will consist of the sum of the
following categories and banks are required to maintain 11.50% of Risk Weighted
Assets (9% + 2.5%) by March 2019 with the phase in requirements under CCB from
2016.
• Tier 1 Capital comprises of:- o Common Equity Tier 1 capital (with a minimum of 5.5%) o Additional Tier 1 capital (1.50%) o Total Tier 1 capital of minimum 7%
• Tier 2 Capital (2%) o Total Tier 1 + Tier 2 should be more than 9%
• Capital Conservation Buffer (CCB). (with a minimum of 2.5%) o Total capital including CCB should be 11.5%
In line with the RBI guidelines for implementing the New Capital Adequacy Frame
Work under Basel III, the bank has successfully migrated from April 01, 2013.
Component of Capital: ( ₹ in millions)
Particulars Amount
Common Equity Tier 1 (CET1) Capital 29222.37
Tier 1 Capital 29222.37
Tier 2 Capital 2396.48
Total Capital 31618.85
Page 4 of 35
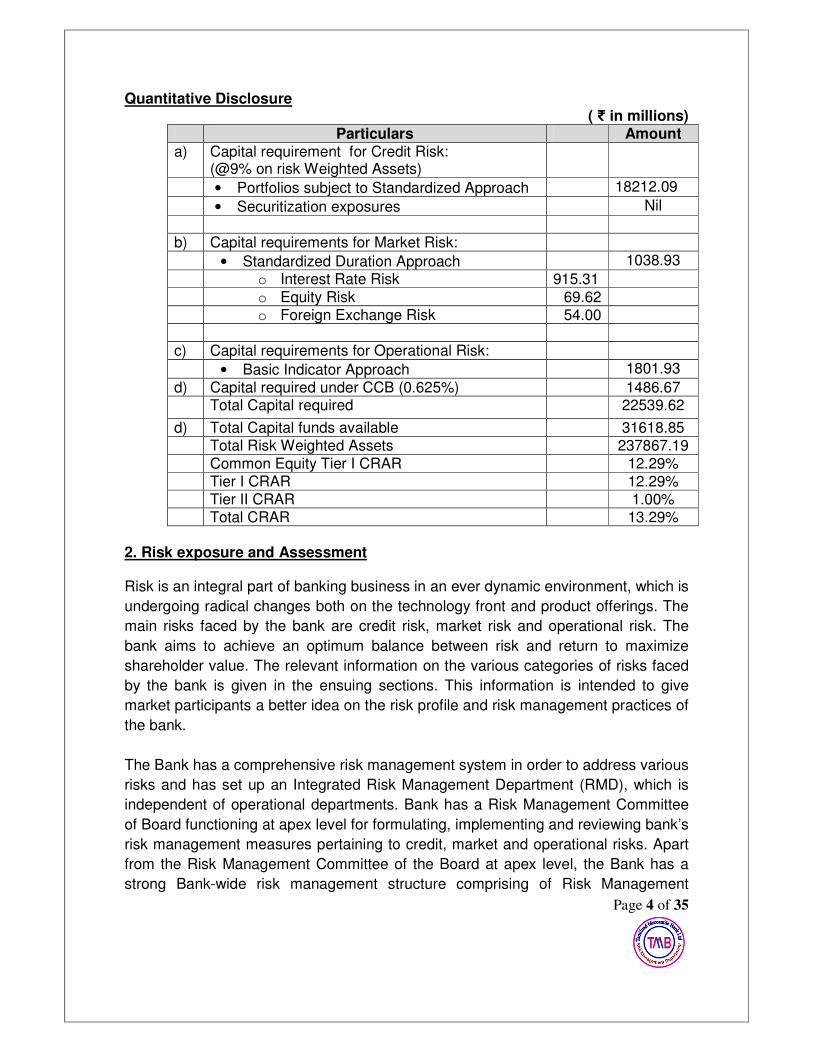
Quantitative Disclosure ( ₹ in millions)
Particulars Amount a) Capital requirement for Credit Risk:
(@9% on risk Weighted Assets)
• Portfolios subject to Standardized Approach 18212.09
• Securitization exposures Nil
b) Capital requirements for Market Risk: • Standardized Duration Approach 1038.93
o Interest Rate Risk 915.31
o Equity Risk 69.62 o Foreign Exchange Risk 54.00 c) Capital requirements for Operational Risk: • Basic Indicator Approach 1801.93
d) Capital required under CCB (0.625%) 1486.67 Total Capital required 22539.62
d) Total Capital funds available 31618.85 Total Risk Weighted Assets 237867.19
Common Equity Tier I CRAR 12.29% Tier I CRAR 12.29% Tier II CRAR 1.00% Total CRAR 13.29%
2. Risk exposure and Assessment
Risk is an integral part of banking business in an ever dynamic environment, which is
undergoing radical changes both on the technology front and product offerings. The
main risks faced by the bank are credit risk, market risk and operational risk. The
bank aims to achieve an optimum balance between risk and return to maximize
shareholder value. The relevant information on the various categories of risks faced
by the bank is given in the ensuing sections. This information is intended to give
market participants a better idea on the risk profile and risk management practices of
the bank.
The Bank has a comprehensive risk management system in order to address various
risks and has set up an Integrated Risk Management Department (RMD), which is
independent of operational departments. Bank has a Risk Management Committee
of Board functioning at apex level for formulating, implementing and reviewing bank’s
risk management measures pertaining to credit, market and operational risks. Apart
from the Risk Management Committee of the Board at apex level, the Bank has a
strong Bank-wide risk management structure comprising of Risk Management

Page 5 of 35
Committee of Executives (RMCE) and Asset Liability Management Committee
(ALCO) at senior management level.
The Bank has formulated the required policies such as Loan Policy, Credit Risk
Management Policy, Credit Risk Mitigation Techniques & Collateral Management
Policy, ALM Policy, Operational Risk Management Policy, Investment Policy, Foreign
Exchange Risk Management Policy, Policy guidelines for Hedging Foreign Currency
Exposure, Concurrent Audit Policy, Inspection Policies, IS Audit Policy, KYC policy,
Post Credit Supervision Policy, Stock Audit Policy, Out Sourcing Policy, IT Business
Continuity and Disaster Recovery Plan (IT BC-DRP),Risk Based Internal Audit
Policy, Stress Testing Policy, Disclosure Policy, ICAAP Policy, etc for mitigating the
risks in various areas and monitoring the same. The bank continues to focus on
refining and improving its risk measurement and management systems.
Table DF-3- CREDIT RISK: GENERAL DISCLOSURES Qualitative Disclosures: a. Credit Risk
Credit risk is the possibility of losses associated with diminution in the credit quality
of borrowers or counter-parties. In a Bank’s portfolio, Credit Risk arises mostly from
lending activities of the Bank, as a borrower is unable to meet his financial
obligations to the lender. It emanates from potential changes in the credit quality /
worthiness of the borrowers or counter-parties.
Credit Rating & Appraisal Process
The Bank has well-structured internal credit rating framework and well-established
standardized credit appraisal / approval processes. Credit Rating is a decision-
enabling tool that helps the bank to take a view on acceptability or otherwise of any
credit proposal. In order to widen the scope and coverage further and strengthen the
credit risk management practices, the bank has developed risk sensitive rating
models in-house during the year 2008-09 and 2009-10.
The internal rating factors take into consideration the quantitative and qualitative
issues relating to management risk, business risk, industry risk, financial risk, credit
discipline, and also risk mitigation, based on the collaterals available.
Credit rating, as a concept, has been well internalized within the Bank. The rating for
eligible borrower is reviewed at least once in a year. The Bank uses the credit
Page 6 of 35
ratings for deciding the interest rates on borrowal accounts. The advantage of credit
rating is that it enables to rank different proposals and do meaningful comparison.
With the view to migrate to advanced approaches in credit risk, the Bank has
implemented the system driven rating using web based rating model solution (RAM
& CRESS) acquired from M/s. Crisil Risk &Infrastructure solutions Ltd.,
The bank follows a well-defined multi layered discretionary power structure for
sanction of loans. Credit Approval Grid has been constituted at H.O for considering
in-principle approval for taking up fresh credit proposals above a specified cut-off.
Credit Risk Management Policies The Bank has put in place a well-structured Credit Risk Management Policy duly
approved by the Bank’s Board. The Policy document defines organization structure,
role & responsibilities and, the processes whereby the Credit Risks carried out by the
Bank can be identified, quantified & managed within the framework that the Bank
considers consistent with its mandate and risk tolerance.
Credit Risk is monitored on a bank-wide basis and compliance with the risk limits
approved by Board/Risk Management Committee of Board is ensured.
The Bank has taken earnest steps to put in place best credit risk management
practices in the bank. In addition to Credit Risk Policy, the bank has also framed
Board approved Loan Policy, Investment Policy etc. which forms integral part in
monitoring Credit risk in the bank. Besides, the bank has framed a policy on Credit
Risk Mitigation Techniques & Collateral Management with the approval of the Board
which lays down the details of securities (both Primary and Collateral) normally
accepted by the Bank and administration of such securities to protect the interest of
the Bank. These securities act as mitigation against the credit risk to which the bank
is exposed.
Classification of Non-Performing Assets The Bank follows the prudential guidelines issued by the RBI on classification of non-
performing assets as under,
i) interest and/or installment of principal remain overdue for a period of more than
90 days in respect of a term loan.

Page 7 of 35
ii) the account remains ‘out of order’ if the outstanding balance remains
continuously in excess of sanctioned limits / DP for more than 90 days in respect
of Overdraft/Cash Credit (OD/CC).
iii) the bill remains overdue for a period of more than 90 days in the case of bills
purchased and discounted
iv) the installment of principal or interest thereon remains overdue for two crop
seasons for short duration crop.
v) the installment of principal or interest thereon remains overdue for one crop
season for long duration crops.
vi) in respect of derivative transactions, the overdue receivables representing
positive mark-to-market value of a derivative contract, if these remain unpaid for
a period of 90 days from the specified due date for payment
Where the interest charged during any quarter is not serviced fully within 90 days
from the end of the quarter, the account is classified as non-performing. A non-
performing asset ceases to generate income for the bank.
b. Gross Credit Risk exposures as on 30th September 2016.
(₹ in millions)
Category Gross Credit Exposure
Fund Based 1 295422.75
Non Fund Based 2 41118.36
Total 336541.11
1. Fund based exposure includes advances, un-availed portion (including un-availed
portion of credit card) of fund based advances.
2. Non-Fund Based exposure includes outstanding Letter of Credit, Acceptances, Bank
Guarantee Exposures and credit equivalent of Forward Contracts.
Page 8 of 35
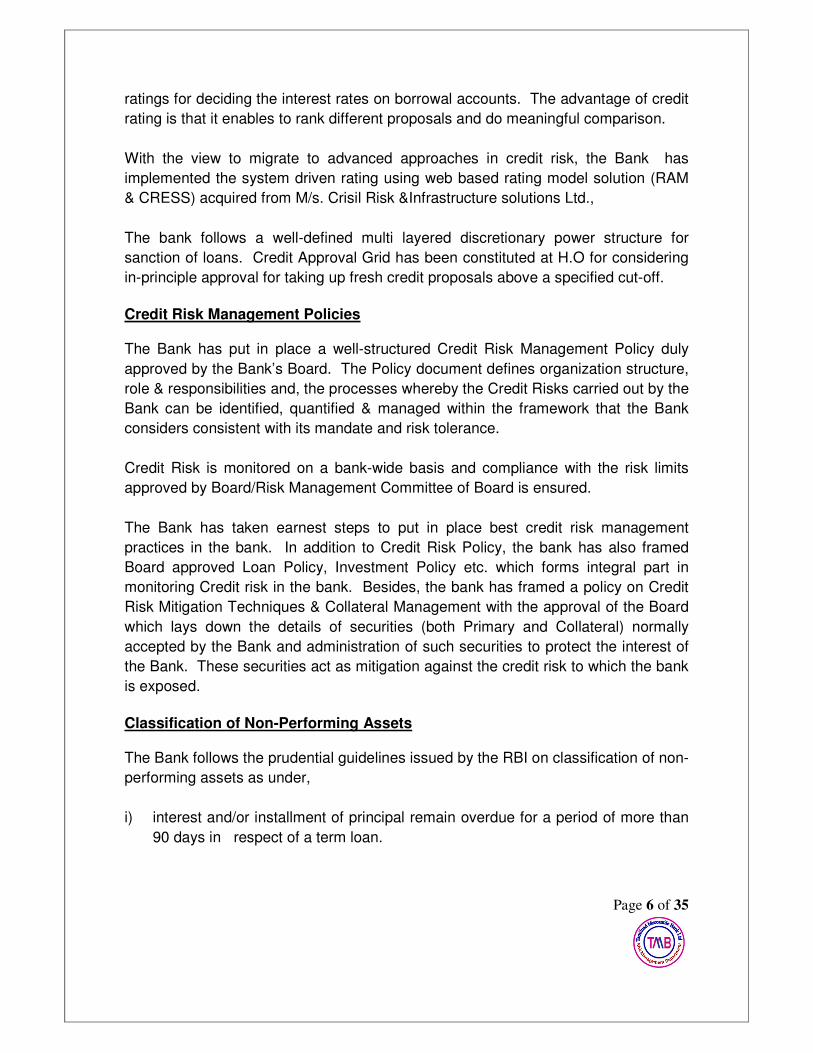
c. Geographical Distribution of Gross Credit Exposures as on 30th September 2016 (₹ in millions )
Exposure Distribution
Treasury Corporate / Wholesale banking
Retail Banking Total credit Exposure
FB NFB FB NFB FB NFB
Domestic 90437.35 135652.18 35087.23 159770.57 6031.13 295422.75 41118.36
Overseas 0.00 0.00 0.00 0.00 0.00 0.00 0.00
Total 90437.35 135652.18 35087.23 159770.57 6031.13 295422.75 41118.36
d. Industry type distribution of credit exposures as on 30.09.2016
(₹ in millions)
Industry Name Exposures
FB NFB Investment Total
A. Mining and Quarrying 767.67 1219.71 0.36 1987.74
B. Food Processing 2226.92 5358.04 0.00 7584.96 C. Beverages (excluding Tea & Coffee) and Tobacco 355.63 7.01 1.02 363.66
D. Textiles 40835.10 2293.06 7.34 43135.50
E. Leather and Leather products 168.79 4.00 0.00 172.79
F. Wood and Wood Products 1876.76 692.04 0.00 2568.80
G. Paper and Paper Products 2583.99 138.94 0.00 2722.93 H. Petroleum (non-infra), Coal Products (non-mining) and Nuclear Fuels 805.30 0.53 44.51 850.34 I. Chemicals and Chemical Products (Dyes, Paints, etc.) 2268.27 80.76 1.15 2350.18 J. Rubber, Plastic and their Products 1441.63 208.63 0.00 1650.26
K. Glass & Glassware 51.35 0.00 0.00 51.35
L. Cement and Cement Products 70.30 0.00 0.00 70.30 M. Basic Metal and Metal Products 6603.98 267.86 104.87 6976.71
N. All Engineering 2079.52 66.70 12.15 2158.37 O. Vehicles, Vehicle Parts and Transport Equipments 96.45 14.75 0.00 111.20
P. Gems and Jewellery 326.09 9.30 0.00 335.39
Q. Construction 539.43 1.37 0.00 540.80
R. Infrastructure 24638.20 1137.40 1884.35 27659.95
S. Other Industries, pl. specify 13669.19 1474.69 0.00 15143.88
All Industries (A to S) 101404.57 12974.79 2055.75 116435.11

Page 9 of 35
The details of the industries wherein the bank’s exposure in the related industry has
exceeded the 5% of total gross credit exposure as on 30.09.2016 is furnished below:
(₹ in millions)
Industry Fund Based
Non Fund Based
% to Gross Credit Exposures
Textile 40835.10 2293.06 12.82%
Infrastructure 24638.20 1137.40 7.66%
e. Residual Contractual Maturity Breakdown of assets as on 30.09.2016
(₹ in millions)
Maturity Buckets
Cash and
Balance with RBI
Balance with
Banks and Money at Call and
Short Notice
Investments Advances Fixed
Assets Other
Assets Grand Total
Next day 2357.19 600.72 14168.20 3646.00 0.00 1859.19 22631.30
2-7 days 6054.31 4371.00 3407.50 3625.30 0.00 320.44 17778.55
8-14 days 202.39 0.00 1125.00 4174.20 0.00 422.30 5923.89
15-30 days 209.51 0.00 2208.50 10513.40 0.00 610.59 13542.00
31 days to 2 months 844.66 0.00 6847.10 8970.10 0.00 683.43 17345.29
2 to 3 months 343.23 0.00 2057.20 3924.70 0.00 1042.47 7367.60
Over 3 to 6 months 767.92 0.00 8617.00 10457.60 0.00 2411.40 22253.92
Over 6m to 1 year 2775.04 0.00 16472.59 24874.80 0.00 192.32 44314.75
over 1 year to 3 years 4807.85 10.00 22413.30 114653.20 0.00 352.13 142236.48
Over 3 to 5 years 803.36 0.00 5465.50 21653.20 0.00 9879.78 37801.84
Above 5 years 492.35 0.00 7260.29 16582.40 1514.02 2839.94 28689.00
Total 19657.81 4981.72 90042.18* 223074.90* 1514.02 20613.99 359884.62
(Covers Net Assets for Domestic Operations) *Net of Provisions/ depreciation

Page 10 of 35
f. Amount of Gross Non-Performing Advances (NPAs): (₹ in millions)
Amount of Gross NPAs
Amount of NPAs (Gross) 5368.82
• Substandard 2647.57
• Doubtful 2631.07
• Of which DF1 1688.20
• DF2 681.80
• Df3 261.07
• Loss 90.18
g. Net NPAs 2433.09
h. NPA Ratios
• Gross NPAs to gross advances 2.37%
• Net NPAs to net advances 1.09%
i. Movement of NPAs(Gross): (₹ in millions)
Movement of NPAs
• Opening Balance as on 01.04.2016 4189.41
• Additions 2603.17
• Reductions 1423.76
• Closing Balance as on 30.09.2016 5368.82
j. Movement of provisions a. Movement of provisions for NPAs *:
(₹ in millions) Particulars
• Opening Balance as on 01.04.2016 2181.96*
• Provisions made during the period 744.64
• Write off 0.00
• Reductions 0.00
• Write back of excess provisions / Transfers 5.32
• Closing Balance as on 30.09.2016 2921.28*
*includes floating provision
Page 11 of 35
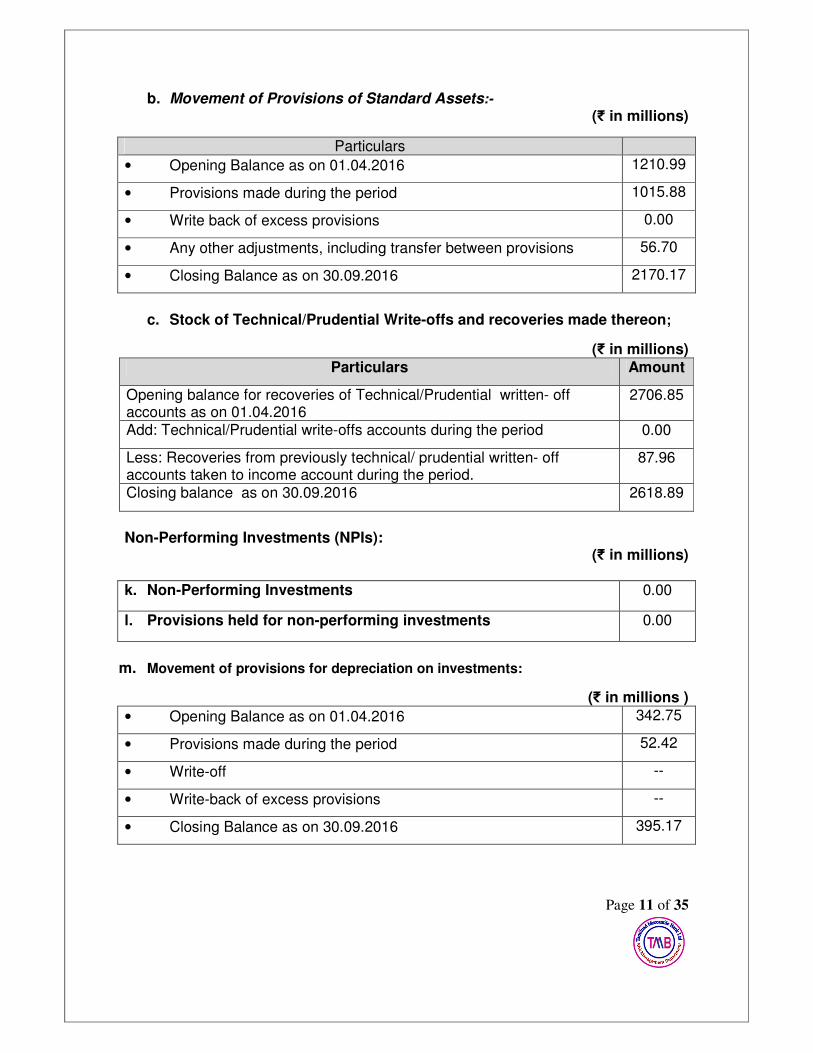
b. Movement of Provisions of Standard Assets:-
(₹ in millions)
Particulars
• Opening Balance as on 01.04.2016 1210.99
• Provisions made during the period 1015.88
• Write back of excess provisions 0.00
• Any other adjustments, including transfer between provisions 56.70
• Closing Balance as on 30.09.2016 2170.17
c. Stock of Technical/Prudential Write-offs and recoveries made thereon;
(₹ in millions) Particulars Amount
Opening balance for recoveries of Technical/Prudential written- off accounts as on 01.04.2016
2706.85
Add: Technical/Prudential write-offs accounts during the period 0.00
Less: Recoveries from previously technical/ prudential written- off accounts taken to income account during the period.
87.96
Closing balance as on 30.09.2016 2618.89
Non-Performing Investments (NPIs): (₹ in millions)
k. Non-Performing Investments 0.00
l. Provisions held for non-performing investments 0.00
m. Movement of provisions for depreciation on investments:
(₹ in millions )
• Opening Balance as on 01.04.2016 342.75
• Provisions made during the period 52.42
• Write-off --
• Write-back of excess provisions --
• Closing Balance as on 30.09.2016 395.17

Page 12 of 35
n. Industry wise distribution of NPAs:
(₹ in millions )
Industry Name As on September 2016 For the half September 30,2016
Gross NPA
Provision for NPA
Standard Asset
Provision
Write -off
NPA Provision
Standard Asset
Provision
A. Mining and Quarrying 0.26 0.26 2.67 0.00 0.00 0.09
B. Food Processing 221.69 206.04 6.16 0.00 12.87 (0.23) C. Beverages (excluding Tea & Coffee) and Tobacco 0.00 0.00 1.10 0.00 0.00 (0.07)
D. Textiles 286.58 112.55 90.15 0.00 36.24 (6.45) E. Leather and Leather products 0.27 0.13 0.34 0.01 0.00 0.02 F. Wood and Wood Products 332.14 288.10 3.15 0.00 14.11 0.08 G. Paper and Paper Products 9.90 3.56 9.52 0.00 (0.37) 0.27 H. Petroleum (non-infra), Coal Products (non-mining) and Nuclear Fuels 583.19 146.02 0.48 0.01 0.00 0.10 I. Chemicals and Chemical Products (Dyes, Paints, etc.) 2.92 0.80 6.89 0.00
(0.57) (0.71)
J. Rubber, Plastic and their Products 6.23 1.82 3.37 0.00 1.44 (0.04)
K. Glass & Glassware 0.00 0.00 0.08 0.00 0.00 0.00
L. Cement and Cement Products 0.17 0.17 0.16 0.00 0.00 0.03 M. Basic Metal and Metal Products 765.10 418.80 147.79 0.00 0.53 54.76
N. All Engineering 16.19 4.05 5.10 0.00 (0.04) 0.04 O. Vehicles, Vehicle Parts and Transport Equipments 0.24 0.24 0.21 0.00 0.00 0.00
P. Gems and Jewellery 23.36 22.94 0.76 0.00 22.80 (0.20)
Q. Construction 44.32 11.09 1.18 0.00 3.43 0.02
R. Infrastructure 404.94 101.24 1121.05 0.00 (1.04) 458.75
S. Other Industries, pl. specify 155.51 64.81 56.91 0.00 4.30 26.13

Page 13 of 35
All Industries (A to S) 2853.01 1382.62 1457.07 0.00 93.70 532.59
All others 2515.81 1246.66 713.10 0.00 73.01 10.48
Total 5368.82 2629.28 2170.17 0.00 166.71 543.07
o. Geographic distribution of NPAs:
(₹ in millions) Particulars Domestic Overseas Total
Gross NPA 5368.82 0.00 5368.82
Provisions for NPA* 2921.28* 0.00 2921.28*
Provision for Standard assets 2113.47 0.00 2170.17
*includes floating provision
Table DF – 4
CREDIT RISK: DISCLOSURES FOR PORTFOLIOS SUBJECT TO THE STANDARDISED APPROACH
Qualitative disclosures: a) General Principle: In accordance with RBI guidelines, the Bank has adopted Standardized Approach of
the New Capital Adequacy Framework (NCAF) for computation of capital for Credit
Risk with effect from 31.03.2009. In computation of capital, the bank has assigned
risk weights to different assets classified as prescribed by the RBI.
External Credit Ratings:
Ratings of borrowers by External Credit Rating Agencies (ECRA) assume
importance in the light of guideline for implementation of the New Capital Adequacy
Framework (Basel-II). Exposures on Corporate / PSEs / Primary Dealers are
assigned with risk weights based on the external ratings. For this purpose, the
Reserve Bank of India has permitted Banks to use the rating of the six domestic
ECRAs namely (a) Credit Analysis and Research Ltd., (CARE), (b) CRISIL Ltd., (c)
India Ratings and Research P. Ltd., (India Ratings)., (d) ICRA Ltd., (e) Brickwork
Ratings India P. Ltd (Brickwork) and (f) SMERA Rating Limited (SMERA). In
consideration of the above guidelines the bank has decided to accept the ratings
assigned by all these ECRAs.

Page 14 of 35
The bank has well-structured internal credit rating mechanism to evaluate the credit
risk associated with a borrower and accordingly the systems are in place for taking
credit decisions with regard to acceptability of proposals, and level of exposures and
pricing.
In case of bank’s investment in particular issues of Corporate / PSEs, the issue
specific rating of the approved ECRAs are reckoned and accordingly the risk weights
have been applied after a corresponding mapping to rating scale provided.
As regards the coverage of exposures by external ratings as relevant for capital
computation under Standardized Approach, the process is being popularized among
the borrowers so as to take the benefit of capital relief available for better rating of its
customers. At the same time, the Bank is well aware and prepared for the
application of higher risk weight (100%) for the unrated exposures of borrowers
having an aggregate exposure of upto ₹.100 Crore in the entire Banking system
relating to all fresh sanctions or renewals in excess of the threshold limit prescribed
by Reserve Bank of India and the borrowers having an aggregate exposure of above
₹.100 Crore in the entire Banking system, which were previously rated and now the
validity of the rating expired and not reviewed attracts a Risk weight of 150%(earlier
it was 100%) as per the recent RBI circular
Ref.No.DBR.No.BP.BC.6/21.06.001/2016-17 dated 15th August 2016.The Bank
follows below mentioned procedures as laid down in the Basel III guidelines for
usage of external ratings:
• Rating assigned by one rating agency is used for all the types of claims on the
borrowing entity.
• Long term ratings are used for facilities with contractual maturity of one year &
above.
• Short term ratings are generally applied for facilities with contractual maturity
of less than one year.
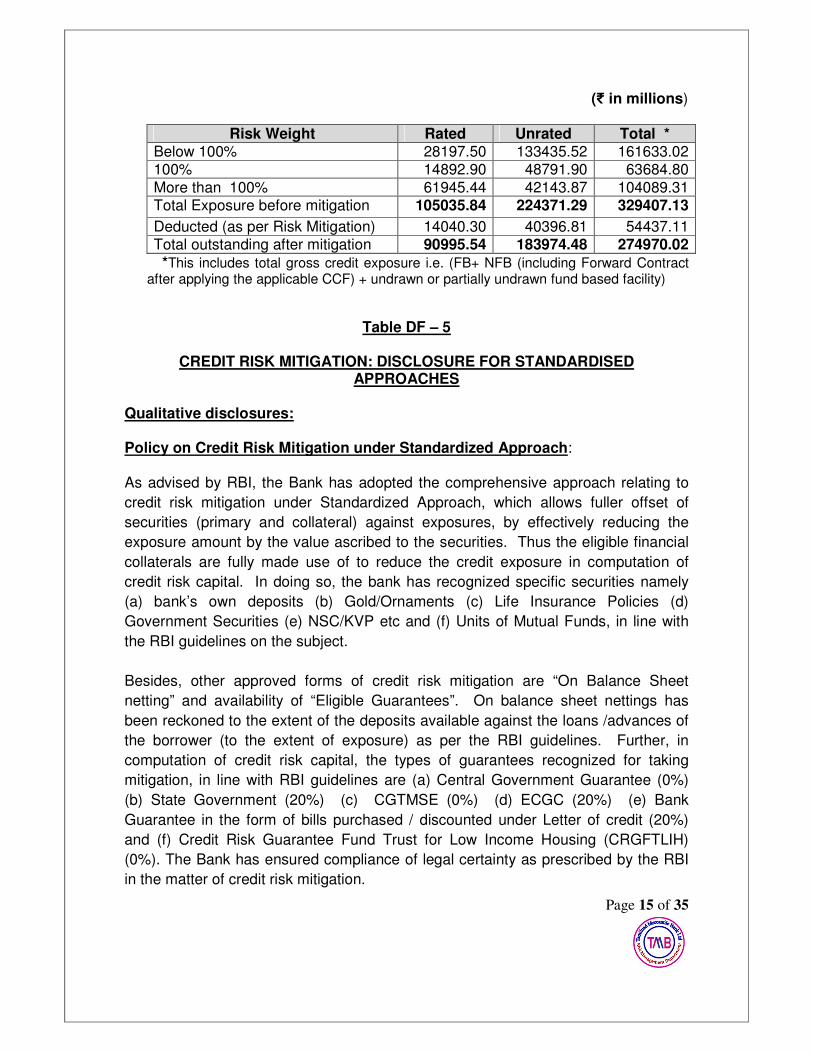
Quantitative Disclosures For exposure amounts after risk mitigation subject to the standardized approach,
amount of a bank’s outstanding (rated and unrated) in the following three major risk
buckets as well as those that are deducted as per risk mitigation are given below;
Page 15 of 35
(₹ in millions)
Risk Weight Rated Unrated Total * Below 100% 28197.50 133435.52 161633.02 100% 14892.90 48791.90 63684.80
More than 100% 61945.44 42143.87 104089.31 Total Exposure before mitigation 105035.84 224371.29 329407.13
Deducted (as per Risk Mitigation) 14040.30 40396.81 54437.11 Total outstanding after mitigation 90995.54 183974.48 274970.02
*This includes total gross credit exposure i.e. (FB+ NFB (including Forward Contract after applying the applicable CCF) + undrawn or partially undrawn fund based facility)
Table DF – 5
CREDIT RISK MITIGATION: DISCLOSURE FOR STANDARDISED APPROACHES
Qualitative disclosures: Policy on Credit Risk Mitigation under Standardized Approach: As advised by RBI, the Bank has adopted the comprehensive approach relating to
credit risk mitigation under Standardized Approach, which allows fuller offset of
securities (primary and collateral) against exposures, by effectively reducing the
exposure amount by the value ascribed to the securities. Thus the eligible financial
collaterals are fully made use of to reduce the credit exposure in computation of
credit risk capital. In doing so, the bank has recognized specific securities namely
(a) bank’s own deposits (b) Gold/Ornaments (c) Life Insurance Policies (d)
Government Securities (e) NSC/KVP etc and (f) Units of Mutual Funds, in line with
the RBI guidelines on the subject.
Besides, other approved forms of credit risk mitigation are “On Balance Sheet
netting” and availability of “Eligible Guarantees”. On balance sheet nettings has
been reckoned to the extent of the deposits available against the loans /advances of
the borrower (to the extent of exposure) as per the RBI guidelines. Further, in
computation of credit risk capital, the types of guarantees recognized for taking
mitigation, in line with RBI guidelines are (a) Central Government Guarantee (0%)
(b) State Government (20%) (c) CGTMSE (0%) (d) ECGC (20%) (e) Bank
Guarantee in the form of bills purchased / discounted under Letter of credit (20%)
and (f) Credit Risk Guarantee Fund Trust for Low Income Housing (CRGFTLIH)
(0%). The Bank has ensured compliance of legal certainty as prescribed by the RBI
in the matter of credit risk mitigation.
Page 16 of 35
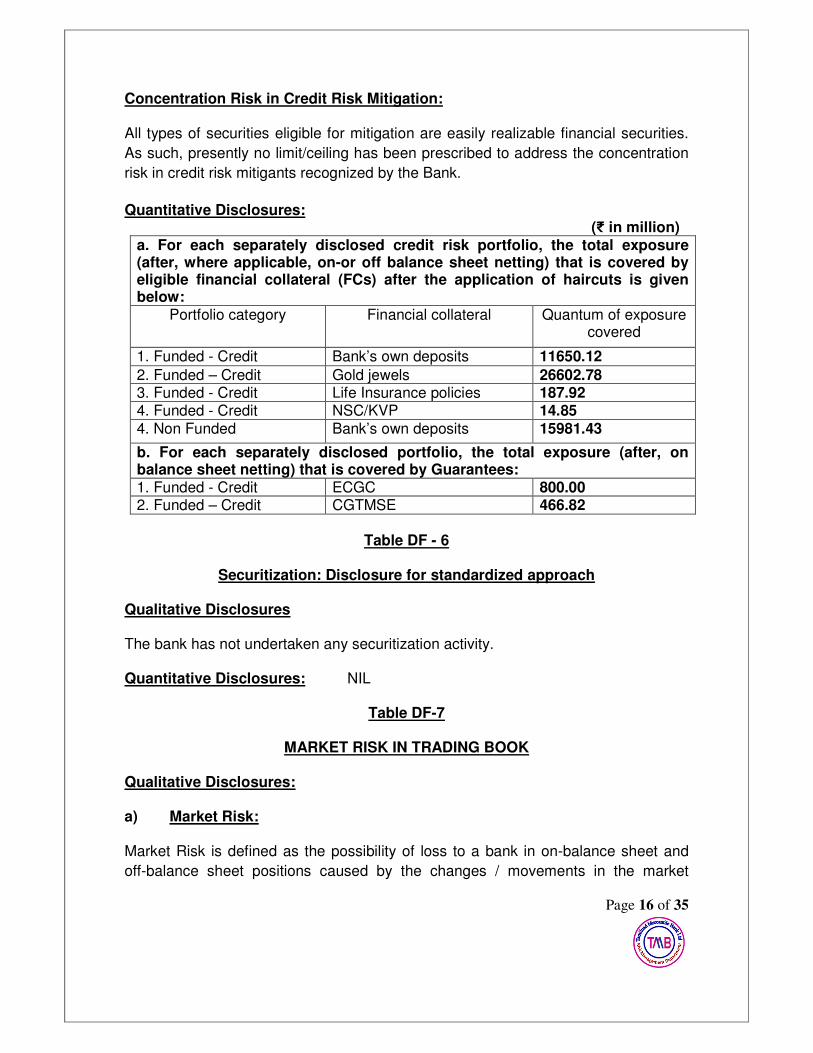
Concentration Risk in Credit Risk Mitigation: All types of securities eligible for mitigation are easily realizable financial securities.
As such, presently no limit/ceiling has been prescribed to address the concentration
risk in credit risk mitigants recognized by the Bank.
Quantitative Disclosures: (₹ in million)
a. For each separately disclosed credit risk portfolio, the total exposure (after, where applicable, on-or off balance sheet netting) that is covered by eligible financial collateral (FCs) after the application of haircuts is given below:
Portfolio category Financial collateral Quantum of exposure covered
1. Funded - Credit Bank’s own deposits 11650.12
2. Funded – Credit Gold jewels 26602.78 3. Funded - Credit Life Insurance policies 187.92 4. Funded - Credit NSC/KVP 14.85
4. Non Funded Bank’s own deposits 15981.43
b. For each separately disclosed portfolio, the total exposure (after, on balance sheet netting) that is covered by Guarantees: 1. Funded - Credit ECGC 800.00 2. Funded – Credit CGTMSE 466.82
Table DF - 6
Securitization: Disclosure for standardized approach
Qualitative Disclosures The bank has not undertaken any securitization activity. Quantitative Disclosures: NIL
Table DF-7
MARKET RISK IN TRADING BOOK Qualitative Disclosures: a) Market Risk: Market Risk is defined as the possibility of loss to a bank in on-balance sheet and
off-balance sheet positions caused by the changes / movements in the market

Page 17 of 35
variables such as interest rates, foreign currency exchange rates, equity prices and
commodity prices. Bank’s exposure to market risk arises from domestic investments
(interest related instruments and equities) in trading book (both AFS and HFT
categories), the Foreign exchange positions (including open position in precious
metals) and trading related derivatives. The objective of the market risk
management is to minimize the impact of losses on earnings and equity capital
arising from market risk.
Policies for management of Market Risk: The bank has put in place Board approved Asset Liability Management (ALM) policy
and treasury Policy (Investment Policy) for effective management of market risk in
the bank. The policy sets various risk limits for effective management of market risk
and ensuring that the operations are in line with Bank’s expectation of return to
market risk through proper Asset Liability Management. The policy also deals with
the reporting framework for effective monitoring of market risk.
The ALM policy specifically deals with liquidity risk management and interest rate
risk management framework. As envisaged in the policy, Liquidity risk is managed
through the mismatch analysis, based on residual maturity / behavioral pattern of
assets and liabilities, on a daily basis based on best available data coverage, as
prescribed by the RBI. The bank has put in place mechanism of short-term dynamic
liquidity management and contingent funding plan. Prudential (tolerance) limits are
prescribed for different residual maturity time buckets for efficient asset liability
management. Liquidity profile of the bank is evaluated through various liquidity
ratios. The bank has also drawn various contingent measures to deal with any kind
of stress on liquidity position. Bank ensures adequate liquidity managed on a real
time basis by Domestic Treasury through systematic and stable funds planning.
Interest Rate Risk is managed through use of GAP analysis of rate sensitive assets
and liabilities and monitored through prudential (tolerance) limits prescribed. The
bank has also put in place Duration Gap Analysis framework for management of
interest rate risk. The bank estimates Earnings at Risk (EaR) and Modified Duration
Gap (DGAP) periodically against adverse movement in interest rate (as prescribed in
the Policy) for assessing the impact on Net Interest Income (NII) and Economic
Value of Equity (EVE) with a view to optimize shareholder value.
The Asset-Liability Management Committee (ALCO) /Risk Management Committee
of Board (RMCB) monitors adherence of prudential limits fixed by the bank and
determines the strategy in the light of the market condition (current and expected) as
articulated in the ALM policy.
Page 18 of 35
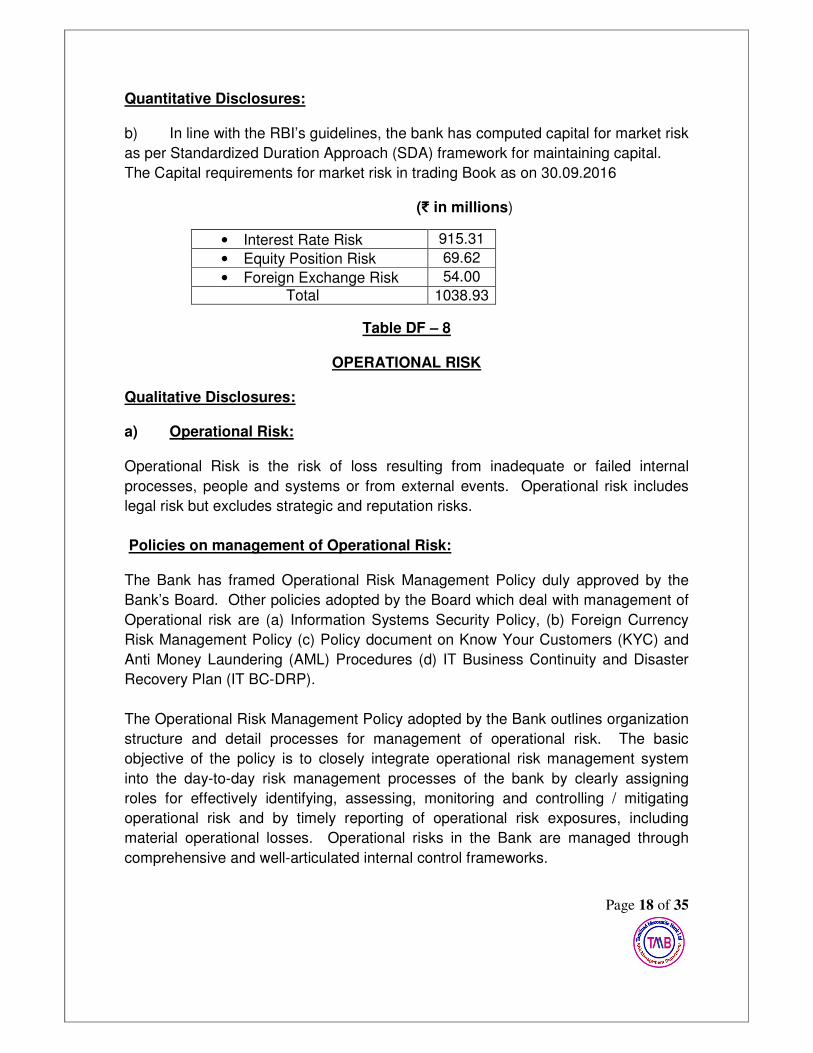
Quantitative Disclosures: b) In line with the RBI’s guidelines, the bank has computed capital for market risk
as per Standardized Duration Approach (SDA) framework for maintaining capital.
The Capital requirements for market risk in trading Book as on 30.09.2016
(₹ in millions)
Table DF – 8
OPERATIONAL RISK Qualitative Disclosures: a) Operational Risk: Operational Risk is the risk of loss resulting from inadequate or failed internal
processes, people and systems or from external events. Operational risk includes
legal risk but excludes strategic and reputation risks.
Policies on management of Operational Risk: The Bank has framed Operational Risk Management Policy duly approved by the
Bank’s Board. Other policies adopted by the Board which deal with management of
Operational risk are (a) Information Systems Security Policy, (b) Foreign Currency
Risk Management Policy (c) Policy document on Know Your Customers (KYC) and
Anti Money Laundering (AML) Procedures (d) IT Business Continuity and Disaster
Recovery Plan (IT BC-DRP).
The Operational Risk Management Policy adopted by the Bank outlines organization
structure and detail processes for management of operational risk. The basic
objective of the policy is to closely integrate operational risk management system
into the day-to-day risk management processes of the bank by clearly assigning
roles for effectively identifying, assessing, monitoring and controlling / mitigating
operational risk and by timely reporting of operational risk exposures, including
material operational losses. Operational risks in the Bank are managed through
comprehensive and well-articulated internal control frameworks.
• Interest Rate Risk 915.31
• Equity Position Risk 69.62
• Foreign Exchange Risk 54.00
Total 1038.93

Page 19 of 35
Quantitative Disclosures: b) In line with the final guidelines issued by RBI, our Bank has adopted the Basic
Indicator Approach for computing capital for Operational Risk. As per the guidelines,
the capital charge for Operational Risk is equal to the average over the previous
three years (2013-14, 2014-15 & 2015-16) of 15% of positive annual Gross Income
as defined by RBI. As per such estimate, the capital requirement for operational risk
as on 30.09.2016 is ₹ 1801.93 mn.
Table DF – 9
INTEREST RATE RISK IN THE BANKING BOOK (IRRBB) Qualitative Disclosures: a) Interest Rate Risk in the Banking Book: Interest Rate Risk is the risk where changes in the market interest rates might affect
a bank’s financial condition. Changes in interest rates affect both the current
earnings (earnings perspective) and also the net worth of the Bank (economic value
perspective). The risk from earnings perspective can be measured as impact in the
Net Interest Income (NII) or Net Interest Margin (NIM). Similarly, the risk from
economic value perspective can be measured as drop in the Economic value of
Equity (EVE).
The Bank identifies the risks associated with the changing interest rates on its on-
balance sheet and off-balance sheet exposures in the banking book from a short
term (Earning perspective) and long term (Economic value perspective). The impact
on income (Earning perspective) is measured through use of Gap Analysis by
applying notional rate shock upto 200 bps as prescribed in Bank’s ALM policy.
Prudential limits have been prescribed for such impacts as a percentage to NII of the
Bank and the same is monitored periodically on a fortnightly basis. For the
calculation of impact on earnings, the Traditional Gap is taken from the Rate
Sensitivity Statement and based on the remaining period from the mid point of a
particular bucket the impact for change in interest rates upto 100 bps is arrived at.
The same is reported to ALCO/Risk Management Committee of Board (RMCB)
periodically along with the Rate Sensitivity statement on monthly basis. Such limits
are fixed based on the previous year’s NII.
The Bank has adopted Traditional Gap Analysis combined with Duration Gap
Analysis for assessing the impact (as a percentage) on the Economic value of Equity

Page 20 of 35
(Economic Value Perspective) by applying a notional interest rate shock of 200 bps.
As per the Guidelines on Banks” Asset Liability Management Framework-Interest
Rate Risk issued by the RBI (DBOD.No.BP.BC.59/21.04.098/2010-11 dated
04.11.2010), the Bank calculates Modified Duration Gap (DGAP) & the impact on the
Economic Value of equity (EVE). Assets and Liabilities are grouped as per Rate
Sensitivity Statement & bucket wise Modified Duration is computed for these groups
of Assets (excluding investments) and Liabilities using common maturity, coupon
and yield parameters. For investment portfolio, the Modified Duration of individual
items are computed and taken. The DGAP is calculated by the Bank once in a
month and is reported to ALCO/ Risk Management Committee of Board (RMCB).
The Asset-Liability Management Committee (ALCO) / Risk Management Committee
of Board (RMCB) monitors adherence of prudential limits fixed by the bank and
determines the strategy in the light of market conditions (current and expected).
Quantitative Disclosures: The increase or decrease in earnings and economic value for upward and downward
rate shocks based on the assets and liabilities outstanding as on 30.09.2016 are as
follows.
1. The impact of change in Interest Rate i.e Earnings at Risk for increasing 100
Basis points interest rate shock is ₹492.69mn (4.72% of previous year Net
Interest Income).
2. Change in Market Value of Equity for 200 basis points interest rate shock is ₹
3059.75mn (9.81% of Net worth)
TABLE DF – 10
General disclosures for exposures related to counterparty credit risk
Counterparty Credit Risk (CCR) is the risk that a counter party to a transaction could
default before the final settlement of the transaction cash flows. Unlike a firm’s
exposure to credit risk through a loan, where the exposure to credit risk is unilateral
and only the lending bank faces the risk of loss, CCR creates a bilateral risk of loss
to either party.
Counterparty credit risk in case of derivative contracts arises from the forward
contracts. The subsequent credit risk exposures depend on the value of underlying
market factors (e.g., interest rates and foreign exchange rates), which can be volatile

Page 21 of 35
and uncertain in nature. The Bank does not enter into derivative transactions other
than forward contracts.
Credit exposures on forward contracts
The Bank enters into the forward contracts in the normal course of business for
proprietary trading and arbitrage purposes, as well as for our own risk management
needs, including mitigation of interest rate and foreign currency risk. Derivative
exposures are calculated according to the current exposures method.
Counterparty Credit exposure as on September 30, 2016
( ₹ in millions)
Nature Notional Amount
Current Credit Exposure
(positive mark to market value)
Potential Future Credit
Exposure
Total Credit Exposure
under Current Exposure
Method (CEM) Forward contracts
74166.70 603.73 1523.99 2127.72
Composition of Capital Disclosure Templates
TABLE DF – 11: Composition of Capital
Part II: Template to be used before March 31, 2017 (ie., During the transition period of Basel III Regulatory adjustments)
(₹ In Million)
Basel III common disclosure template to be used during the transition of regulatory adjustments (i.e. from April 1, 2013 to
December 31, 2016)
Amounts Subject to Pre-Basel
III Treatment
Ref No.
Common Equity Tier 1 capital: instruments and reserves
1 Directly issued qualifying common share capital plus related stock surplus (share premium)
1425.11
2 Retained earnings
3 Accumulated other comprehensive income (and other reserves)
27797.26
4 Directly issued capital subject to phase out from CET1 (only applicable to non-joint stock companies)
Public sector capital injections grandfathered until January 1, 2018
5 Common share capital issued by subsidiaries and held by third parties (amount allowed in group CET1)

Page 22 of 35
6 Common Equity Tier 1 capital before regulatory adjustments
29222.37
Common Equity Tier 1 capital : Regulatory adjustments
7 Prudential valuation adjustments
8 Goodwill (net of related tax liability)
9 Intangibles other than mortgage-servicing rights (net of related tax liability)
10 Deferred tax assets2
11 Cash-flow hedge reserve
12 Shortfall of provisions to expected losses
13 Securitization gain on sale
14 Gains and losses due to changes in own credit risk on fair valued liabilities
15 Defined-benefit pension fund net assets
16 Investments in own shares (if not already netted off paid-up capital on reported balance sheet)
17 Reciprocal cross-holdings in common equity
18 Investments in the capital of banking, financial and insurance entities that are outside the scope of regulatory consolidation, net of eligible short positions, where the bank does not own more than 10% of the issued share capital (amount above 10% threshold)
19 Significant investments in the common stock of banking, financial and insurance entities that are outside the scope of regulatory consolidation, net of eligible short positions
(amount above 10% threshold)3
20 Mortgage servicing rights(amount above 10% threshold)
21 Deferred tax assets arising from temporary
differences5(amount above 10% threshold, net of related tax liability)
22 Amount exceeding the 15% threshold
23 of which : significant investments in the common stock of financial entities
24 of which : mortgage servicing rights
25 of which : deferred tax assets arising from temporary differences
26 National specific regulatory adjustments7
(26a+26b+26c+26d)
26a of which : Investments in the equity capital of unconsolidated insurance subsidiaries
26b of which : Investments in the equity capital of unconsolidated non- financial subsidiaries
26c of which : Shortfall in the equity capital of majority owned financial entities which have not been consolidated with the bank

Page 23 of 35
26d of which : Unamortised pension funds expenditures
Regulatory Adjustments Applied to Common Equity Tier 1 in respect of Amounts Subject to Pre-Basel III Treatment
of which : [INSERT TYPE OF ADJUSTMENT] For example: filtering out of unrealised losses on AFS debt securities (not relevant in Indian context)
of which : [INSERT TYPE OF ADJUSTMENT]
of which : [INSERT TYPE OF ADJUSTMENT]
27 Regulatory adjustments applied to Common Equity Tier 1 due to insufficient Additional Tier 1 and Tier 2 to cover deductions
28 Total regulatory adjustments to Common equity Tier 1
29 Common Equity Tier 1 capital (CET1) 29222.37
Additional Tier 1 capital : instruments
30 Directly issued qualifying Additional Tier 1 instruments plus related stock surplus (share premium) (31+32)
31 of which : classified as equity under applicable accounting standards
32 of which : classified as liabilities under applicable accounting standards (Perpetual debt Instruments)
33 Directly issued capital instruments subject to phase out from Additional Tier 1
34 Additional Tier 1 instruments (and CET1 instruments not included in row 5) issued by subsidiaries and held by third parties (amount allowed in group AT1)
35 of which : instruments issued by subsidiaries subject to phase out
36 Additional Tier 1 capital before regulatory adjustments
Additional Tier 1 capital: regulatory adjustments
37 Investments in own Additional Tier 1 instruments
38 Reciprocal cross-holdings in Additional Tier 1 instruments
39 Investments in the capital of banking, financial and insurance entities that are outside the scope of regulatory consolidation, net of eligible short positions, where the bank does not own more than 10% of the issued common share capital of the entity (amount above 10% threshold)
40 Significant investments in the capital of banking, financial and insurance entities that are outside the scope of regulatory consolidation (net of eligible short positions)

Page 24 of 35
41 National specific regulatory adjustments (41a+41b)
41a Investments in the Additional Tier 1 capital of unconsolidated insurance subsidiaries
41b Shortfall in the Additional Tier 1 capital of majority owned financial
Regulatory Adjustments Applied to Additional Tier 1 in respect of Amounts Subject to Pre-Basel III Treatment
of which : [INSERT TYPE OF ADJUSTMENT e.g. DTAs]
of which : [INSERT TYPE OF ADJUSTMENT
of which : [INSERT TYPE OF ADJUSTMENT]
42 Regulatory adjustments applied to Additional Tier 1 due to insufficient Tier 2 to cover deductions
43 Total regulatory adjustments to Additional Tier 1 capital
44 Additional Tier 1 capital (AT1)
45 Tier 1 capital (T1 = CET1 + Admissible AT1) (29 + 44a)
29222.37
Tier 2 capital : instruments and provisions
46 Directly issued qualifying Tier 2 instruments plus related stock surplus
47 Directly issued capital instruments subject to phase out from Tier 2
48 Tier 2 instruments (and CET1 and AT1 instruments not included in rows 5 or 34) issued by subsidiaries and held by third parties (amount allowed in group Tier 2)
49 of which : instruments issued by subsidiaries subject to phase out
50 Provisions include the following
a) Investment Reserve ₹ 194.41 mn
b) Provision for Standard Asset including restructured standard assets ₹1210.99 mn c) Provision for unhedged Foreign Currency Exposure ₹22.30 mn
51 Tier 2 capital before regulatory adjustments 2396.48
Tier 2 capital: regulatory adjustments
52 Investments in own Tier 2 instruments
53 Reciprocal cross-holdings in Tier 2 instruments
54 Investments in the capital of banking, financial and insurance entities that are outside the scope of regulatory consolidation, net of eligible short positions, where the bank does not own more than 10% of the issued common share capital of the entity (amount above the 10% threshold)

Page 25 of 35
55 Significant investments in the capital banking, financial and insurance entities that are outside the scope of regulatory consolidation (net of eligible short positions)
56 National specific regulatory adjustments (56a+56b)
56a of which : Investments in the Tier 2 capital of unconsolidated insurance subsidiaries
56b of which : Shortfall in the Tier 2 capital of majority owned financial entities which have not been consolidated with the bank
Regulatory Adjustments Applied To Tier 2 in respect of Amounts Subject to Pre-Basel III Treatment
of which : [INSERT TYPE OF ADJUSTMENT e.g. existing adjustments which are deducted from Tier 2 at 50%]
of which : [INSERT TYPE OF ADJUSTMENT
57 Total regulatory adjustments to Tier 2 capital
58 Tier 2 capital (T2) 2396.48
59 Total capital (TC = T1 + T2) (45 + 58c) 31618.85
Risk Weighted Assets in respect of Amounts Subject to Pre-Basel III Treatment
of which : [INSERT TYPE OF ADJUSTMENT]
of which : …
60 Total risk weighted assets (60a + 60b + 60c) 237867.19
60a of which : total credit risk weighted assets 202356.50
60b of which : total market risk weighted assets 12986.59
60c of which : total operational risk weighted assets 22524.10
Capital ratios
61 Common Equity Tier 1 (as a percentage of risk weighted assets)
12.29%
62 Tier 1 (as a percentage of risk weighted assets) 12.29%
63 Total capital (as a percentage of risk weighted assets) 13.29%
64 Institution specific buffer requirement (minimum CET1 requirement plus capital conservation and countercyclical buffer requirements, expressed as a percentage of risk weighted assets)
65 of which : capital conservation buffer requirement
66 of which : bank specific countercyclical buffer requirement -
67 of which : G-SIB buffer requirement
68 Common Equity Tier 1 available to meet buffers (as a percentage of risk weighted assets)
NA

Page 26 of 35
National minima (if different from Basel III)
69 National Common Equity Tier 1 minimum ratio (if different from Basel III minimum)
5.50%
70 National Tier 1 minimum ratio (if different from Basel III minimum)
7.00% 6.00%
71 National total capital minimum ratio (if different from Basel III minimum)
9.625% 9.625%
Amounts below the thresholds for deduction (before risk weighting)
72 Non-significant investments in the capital of other financial entities
73 Significant investments in the common stock of financial entities
74 Mortgage servicing rights (net of related tax liability)
75 Deferred tax assets arising from temporary differences (net of related tax liability)
Applicable caps on the inclusion of provisions in Tier 2
76 Provisions eligible for inclusion in Tier 2 in respect of exposures subject to standardized approach (prior to application of cap)
77 Cap on inclusion of provisions in Tier 2 under standardized approach
78 Provisions eligible for inclusion in Tier 2 in respect of exposures subject to internal ratings-based approach (prior to application of cap)
79 Cap for inclusion of provisions in Tier 2 under internal ratings-based approach
Capital instruments subject to phase-out arrangements (only applicable between March 31, 2017 and March 31, 2022)
80 Current cap on CET1 instruments subject to phase out arrangements
NA
81 Amount excluded from CET1 due to cap (excess over cap after redemptions and maturities)
82 Current cap on AT1 instruments subject to phase out arrangements
83 Amount excluded from AT1 due to cap (excess over cap after redemptions and maturities)
84 Current cap on T2 instruments subject to phase out arrangements
85 Amount excluded from T2 due to cap (excess over cap after redemptions and maturities)
9

Page 27 of 35
Notes to the template
Row No. of the template
Particulars
(₹ in Millions)
10 Deferred tax assets associated with accumulated losses
Deferred tax assets (excluding those associated with accumulated losses) net of Deferred tax liability
0.00
Total as indicated in row 10 0.00
19 If investments in insurance subsidiaries are not deducted fully from capital and instead considered under 10% threshold for deduction, the resultant increase in the capital of bank
of which : Increase in Common Equity Tier 1 capital
of which : Increase in Additional Tier 1 capital
of which : Increase in Tier 2 capital
26b If investments in the equity capital of unconsolidated non-financial subsidiaries are not deducted and hence, risk weighted then :
(i) Increase in Common Equity Tier 1 capital
(ii) Increase in risk weighted assets
50 Eligible Provisions included in Tier 2 capital 2202.07
Eligible Reserves included in Tier 2 capital 194.41
Total of row 50 2396.48
Table DF-12:
Composition of Capital – Reconciliation Requirements
Step 1:
(₹. in million)
Balance sheet as in financial
statements
Balance sheet under
regulatory scope of
consolidation
As on reporting date
As on reporting date
A Capital & Liabilities
i. Paid-up Capital 1425.11 N.A
Reserves & Surplus 29765.05 N.A
Minority Interest 0
Total Capital 31190.16 N.A
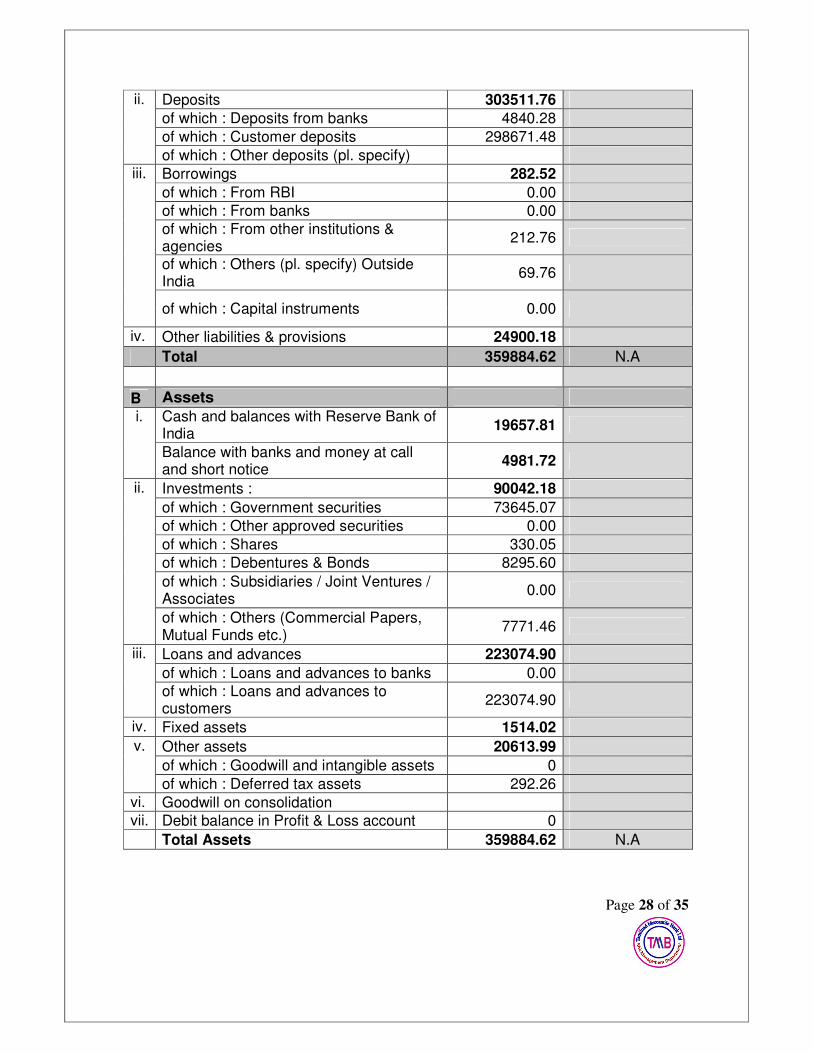
Page 28 of 35
ii. Deposits 303511.76
of which : Deposits from banks 4840.28
of which : Customer deposits 298671.48
of which : Other deposits (pl. specify)
iii. Borrowings 282.52
of which : From RBI 0.00
of which : From banks 0.00
of which : From other institutions & agencies
212.76
of which : Others (pl. specify) Outside India
69.76
of which : Capital instruments 0.00
iv. Other liabilities & provisions 24900.18
Total 359884.62 N.A
B Assets
i. Cash and balances with Reserve Bank of India
19657.81
Balance with banks and money at call and short notice
4981.72
ii. Investments : 90042.18
of which : Government securities 73645.07
of which : Other approved securities 0.00
of which : Shares 330.05
of which : Debentures & Bonds 8295.60
of which : Subsidiaries / Joint Ventures / Associates
0.00
of which : Others (Commercial Papers, Mutual Funds etc.)
7771.46
iii. Loans and advances 223074.90
of which : Loans and advances to banks 0.00
of which : Loans and advances to customers
223074.90
iv. Fixed assets 1514.02
v. Other assets 20613.99
of which : Goodwill and intangible assets 0
of which : Deferred tax assets 292.26
vi. Goodwill on consolidation
vii. Debit balance in Profit & Loss account 0
Total Assets 359884.62 N.A
Page 29 of 35
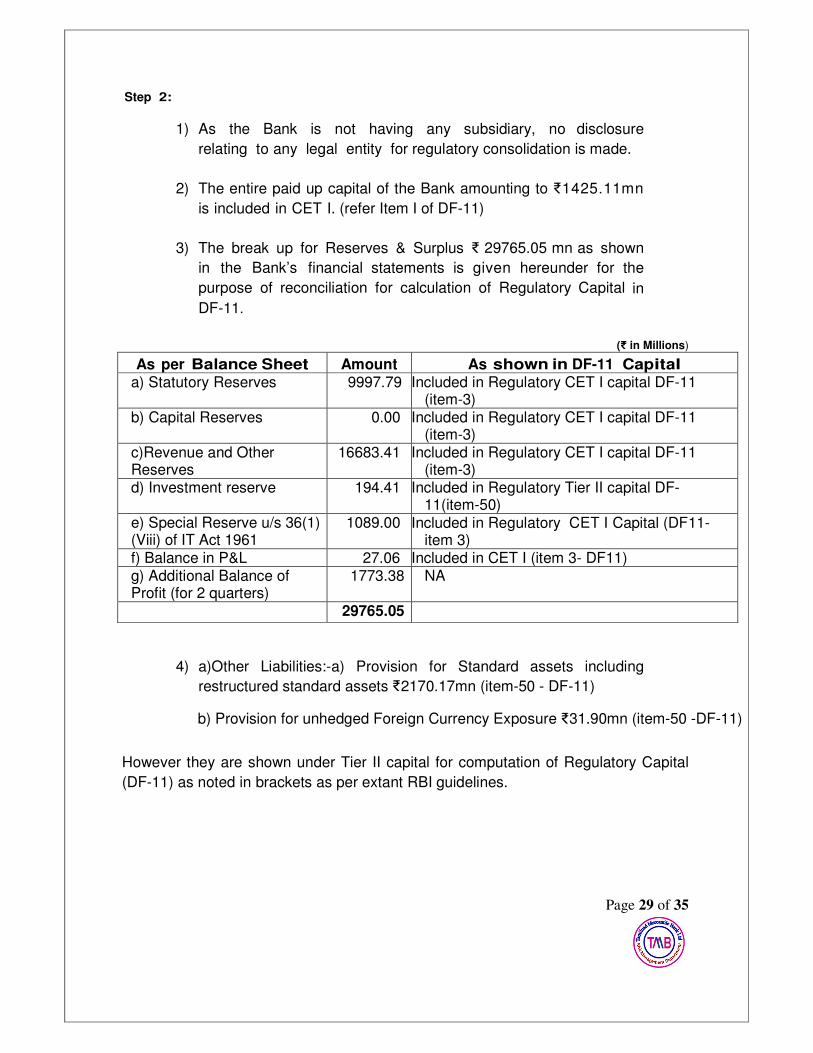
Step 2:
1) As the Bank is not having any subsidiary, no disclosure
relating to any legal entity for regulatory consolidation is made.
2) The entire paid up capital of the Bank amounting to ₹1425.11mn
is included in CET I. (refer Item I of DF-11)
3) The break up for Reserves & Surplus ₹ 29765.05 mn as shown
in the Bank’s financial statements is given hereunder for the
purpose of reconciliation for calculation of Regulatory Capital in
DF-11.
(₹ in Millions)
As per Balance Sheet Amount As shown in DF-11 Capital
a) Statutory Reserves 9997.79 Included in Regulatory CET I capital DF-11 (item-3)
b) Capital Reserves 0.00 Included in Regulatory CET I capital DF-11 (item-3)
c)Revenue and Other Reserves
16683.41 Included in Regulatory CET I capital DF-11 (item-3)
d) Investment reserve 194.41 Included in Regulatory Tier II capital DF-11(item-50)
e) Special Reserve u/s 36(1) (Viii) of IT Act 1961
1089.00 Included in Regulatory CET I Capital (DF11-item 3)
f) Balance in P&L 27.06 Included in CET I (item 3- DF11)
g) Additional Balance of Profit (for 2 quarters)
1773.38 NA
29765.05 4) a)Other Liabilities:-a) Provision for Standard assets including
restructured standard assets ₹2170.17mn (item-50 - DF-11)
b) Provision for unhedged Foreign Currency Exposure ₹31.90mn (item-50 -DF-11)
However they are shown under Tier II capital for computation of Regulatory Capital
(DF-11) as noted in brackets as per extant RBI guidelines.
Page 30 of 35
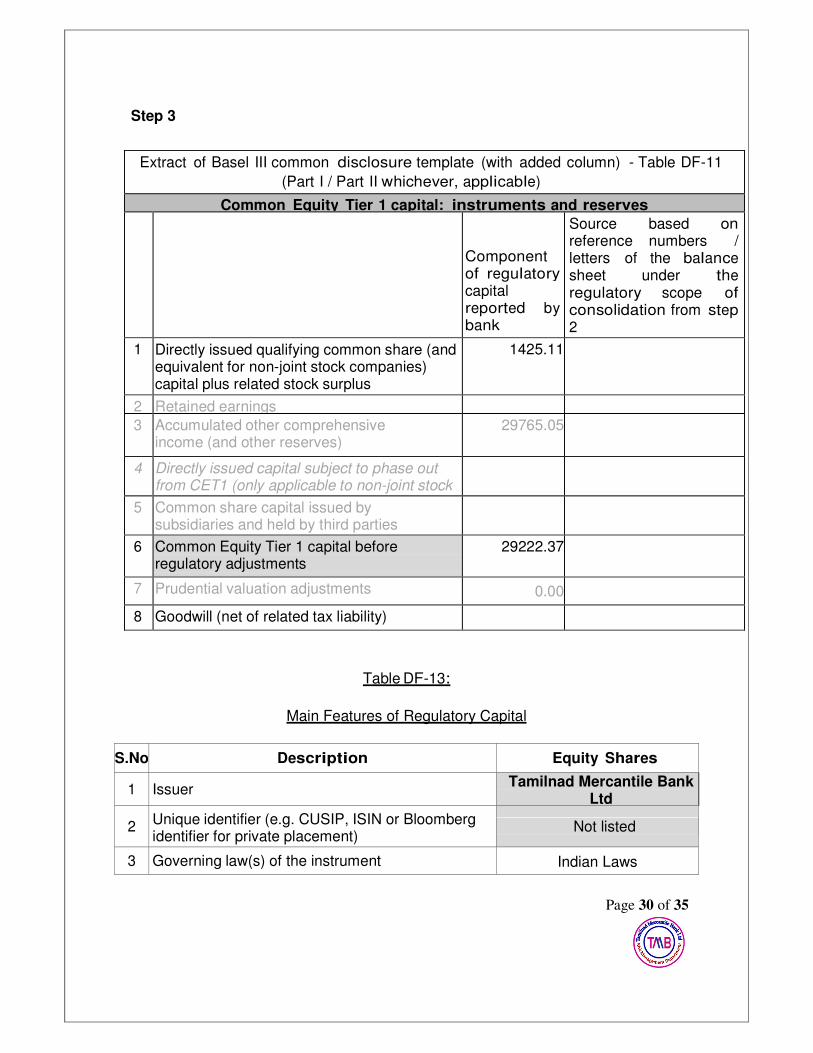
Step 3
Extract of Basel III common disclosure template (with added column) - Table DF-11
(Part I / Part II whichever, applicable)
Common Equity Tier 1 capital: instruments and reserves
Component of regulatory capital reported by bank
Source based on reference numbers / letters of the balance sheet under the regulatory scope of consolidation from step 2
1 Directly issued qualifying common share (and equivalent for non-joint stock companies) capital plus related stock surplus
1425.11
2 Retained earnings
3 Accumulated other comprehensive income (and other reserves)
29765.05
4 Directly issued capital subject to phase out from CET1 (only applicable to non-joint stock companies)
5 Common share capital issued by subsidiaries and held by third parties (amount allowed in group CET1)
6 Common Equity Tier 1 capital before regulatory adjustments
29222.37
7 Prudential valuation adjustments 0.00
8 Goodwill (net of related tax liability)
Table DF-13:
Main Features of Regulatory Capital
S.No Description Equity Shares
1 Issuer Tamilnad Mercantile Bank
Ltd
2 Unique identifier (e.g. CUSIP, ISIN or Bloomberg identifier for private placement)
Not listed
3 Governing law(s) of the instrument Indian Laws

Page 31 of 35
Regulatory treatment
4 Transitional Basel III rules Common Equity Tier 1
5 Post-transitional Basel III rules Common Equity Tier 1
6 Eligible at solo / group / group & solo Solo
7 Instrument type Common Shares
8 Amount recognized in regulatory capital (Rs. in million, as of most recent reporting date)
₹1425.11 million
9 Par value of instrument ₹ 10 per share
10 Accounting classification Shareholder’s
Equity
11 Original date of issuance Various
12 Perpetual or dated Perpetual
13 Original maturity date No Maturity
14 Issuer call subject to prior supervisory approval No
15 Optional call date, contingent call dates and redemption amount
NA
16 Subsequent call dates, if applicable NA
Coupons / dividends
17 Fixed or floating dividend / coupon NA
18 Coupon rate and any related index NA
19 Existence of a dividend stopper No
20 Fully discretionary, partially discretionary or mandatory
Fully Discretionary
21 Existence of step up or other incentive to redeem No
22 Noncumulative or cumulative Non-Cumulative
23 Convertible or non-convertible NA
24 If convertible, conversion trigger(s) NA
25 If convertible, fully or partially NA
26 If convertible, conversion rate NA
27 If convertible, mandatory or optional conversion NA
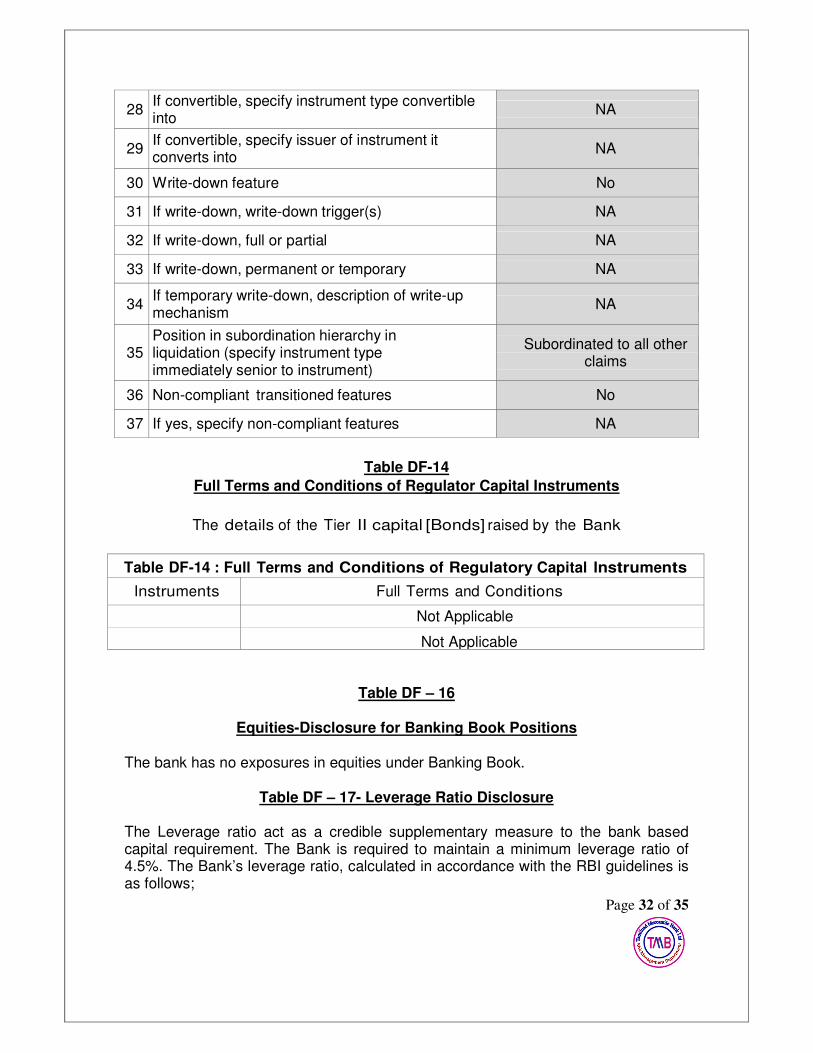
Page 32 of 35
28 If convertible, specify instrument type convertible into
NA
29 If convertible, specify issuer of instrument it converts into
NA
30 Write-down feature No
31 If write-down, write-down trigger(s) NA
32 If write-down, full or partial NA
33 If write-down, permanent or temporary NA
34 If temporary write-down, description of write-up mechanism
NA
35 Position in subordination hierarchy in liquidation (specify instrument type immediately senior to instrument)
Subordinated to all other claims
36 Non-compliant transitioned features No
37 If yes, specify non-compliant features NA
Table DF-14
Full Terms and Conditions of Regulator Capital Instruments
The details of the Tier II capital [Bonds] raised by the Bank
Table DF-14 : Full Terms and Conditions of Regulatory Capital Instruments
Instruments Full Terms and Conditions
Not Applicable
Not Applicable
Table DF – 16
Equities-Disclosure for Banking Book Positions
The bank has no exposures in equities under Banking Book.
Table DF – 17- Leverage Ratio Disclosure The Leverage ratio act as a credible supplementary measure to the bank based capital requirement. The Bank is required to maintain a minimum leverage ratio of 4.5%. The Bank’s leverage ratio, calculated in accordance with the RBI guidelines is as follows;

Page 33 of 35
COMPARISON OF ACCOUNTING ASSETS AND LEVERAGE RATIO EXPOSURE
( ₹ in million)
S.No. Particulars Amount
as of Dec’15
Amount as of
Mar’16
Amount as of
June’16
Amount as of
Sep’16
1 Total consolidated assets as per published financial statements include SFTs
346707.31 352663.12 350599.84 359884.62
2
Adjustment for investments in banking, financial, insurance or commercial entities that are consolidated for accounting purposes but outside the scope of regulatory consolidation
0.00 0.00 0.00 0.00
3
Adjustment for fiduciary assets recognized on the balance sheet pursuant to the operative accounting framework but excluded from the leverage ratio exposure measure
0.00 0.00 0.00 0.00
4 Adjustments for derivative financial instruments
1589.76 1534.75 1460.79 1523.99
5
Adjustment for securities financing transactions (i.e. repos and similar secured lending)
0.00 0.00 0.00 0.00
6
Adjustment for off-balance sheet items (i.e. conversion to credit equivalent amounts of off- balance sheet exposures)
35035.42 40151.55 40017.86 40830.13
7 Other adjustments 0.00 0.00 0.00 0.00
8 Leverage ratio exposure
383332.49 394349.42 392078.49 402238.74

Page 34 of 35
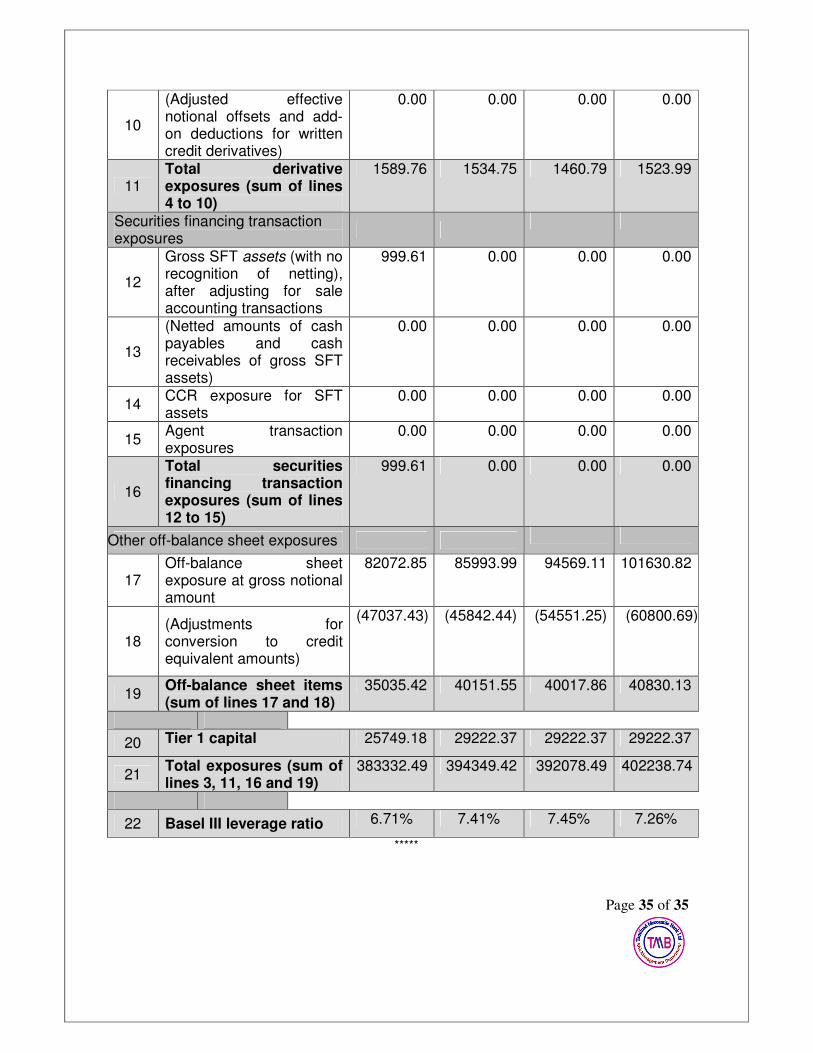
Table DF – 18
Leverage ratio common disclosure ( ₹ in millions)
S.No Leverage Ratio Framework
Amount as of
Dec’15
Amount as of
Mar’16
Amount as of
June’16
Amount as of
Sep’16
On-balance sheet exposures
1
On-balance sheet items (excluding derivatives and SFTs, but including collateral)
345707.70 352663.12 350599.84 359884.62
2
(Asset amounts deducted in determining Basel III Tier 1 capital)
0.00 0.00 0.00 0.00
3
Total on-balance sheet exposures (excluding derivatives and SFTs) (sum of lines 1 and 2)
345707.70 352663.12 350599.84 359884.62
Derivative exposures
4
Replacement cost associated with all derivatives transactions (i.e. net of eligible cash variation margin)
0 0 0 0
5 Add-on amounts for PFE associated with all derivatives transactions
1589.76 1534.75 1460.79 1523.99
6
Gross-up for derivatives collateral provided where deducted from the balance sheet assets pursuant to the operative accounting framework
0.00 0.00 0.00 0.00
7
(Deductions of receivables assets for cash variation margin provided in derivatives transactions)
0.00 0.00 0.00 0.00
8 (Exempted CCP leg of client-cleared trade exposures)
0.00 0.00 0.00 0.00
9 Adjusted effective notional amount of written credit derivatives
0.00 0.00 0.00 0.00
Page 35 of 35
10
(Adjusted effective notional offsets and add-on deductions for written credit derivatives)
0.00 0.00 0.00 0.00
11 Total derivative exposures (sum of lines 4 to 10)
1589.76 1534.75 1460.79 1523.99
Securities financing transaction exposures
12
Gross SFT assets (with no recognition of netting), after adjusting for sale accounting transactions
999.61 0.00 0.00 0.00
13
(Netted amounts of cash payables and cash receivables of gross SFT assets)
0.00 0.00 0.00 0.00
14 CCR exposure for SFT assets
0.00 0.00 0.00 0.00
15 Agent transaction exposures
0.00 0.00 0.00 0.00
16
Total securities financing transaction exposures (sum of lines 12 to 15)
999.61 0.00 0.00 0.00
Other off-balance sheet exposures
17 Off-balance sheet exposure at gross notional amount
82072.85 85993.99 94569.11 101630.82
18 (Adjustments for conversion to credit equivalent amounts)
(47037.43) (45842.44) (54551.25) (60800.69)
19 Off-balance sheet items (sum of lines 17 and 18)
35035.42 40151.55 40017.86 40830.13
20 Tier 1 capital 25749.18 29222.37 29222.37 29222.37
21 Total exposures (sum of lines 3, 11, 16 and 19)
383332.49 394349.42 392078.49 402238.74
22 Basel III leverage ratio 6.71% 7.41% 7.45% 7.26%
*****


![[XLS]petroleum.nic.inpetroleum.nic.in/dbt/bank/Tamilnad Mercantile Bank.xlsx · Web viewSURVEY NO. 23, SINHGAD ROAD,NANDED CITY,PUNE,411041 Odisha Cuttack 68-69,WARD NO.14,GROUND](https://img.pdfslide.us/doc/110x75/5b22af5d7f8b9ab56c8b4643/xls-mercantile-bankxlsx-web-viewsurvey-no-23-sinhgad-roadnanded-citypune411041.jpg)