Embed Size (px)
Citation preview

605 International Research: Journal of Library & Information Science | Vol.4 No.4, Dec. 2014
User Behavior and Awareness among the Different Public Libraries in Chennai District,
Tamil Nadu: A Comparative Study
Dr. Kotti Thavamani
Library Assistant
Dr. M.G.R. Medical University
Chennai, Tamil Nadu, India
___________________________________________________________________________
Abstract: The study focused on comparative study of user behavior and awareness among the
two different public libraries in Chennai district, Tamil Nadu. A total number of 130 users
and two different public libraries are taken into account for the study through a
questionnaire based survey method. A well structured questionnaire is designed and
distributed to the selected 130 readers. The collected data were classified, analyzed, and
tabulated by using simple statistical methods. This study covers the impact of print resources
on users in their libraries. The major findings are majority of the respondent are satisfied
with availability of newspapers and magazines section being situated separately in the
library. The results of the study are also indicates that majority of the users are colleges
students. The users are good opinion about the reference sources.
Introduction
A Public library is rightly called as “Peoples University”. Its motto is “free book
services for all”. The traditional concepts of a public library as an indispensable tool for
elitists and literate sections of the society have changed in modern times. The public libraries
are the local gateway to knowledge; provide a basic condition for lifelong learning,
independent decision making and cultural development of the individual and social groups. In
a developing country library plays a vital role in the area of educational, political, cultural
and economic spheres; this is the centre for Cultural Heritage for promotion of National
Integration, for promotion of Communal Harmony for promotion of Spiritual Unity between
hearts etc. It creates in children a love for reading, which can lead to the formation of reading
habit at an early age. The public library is a practical demonstration of democracy’s faith in
universal education as a continuing and life-long process.
Literature Review
Thavamani, K (2014) studied Information use pattern of Connemara public library, Chennai.
The majority of 88.50% respondents are satisfied with availability of the information sources
606 International Research: Journal of Library & Information Science | Vol.4 No.4, Dec. 2014
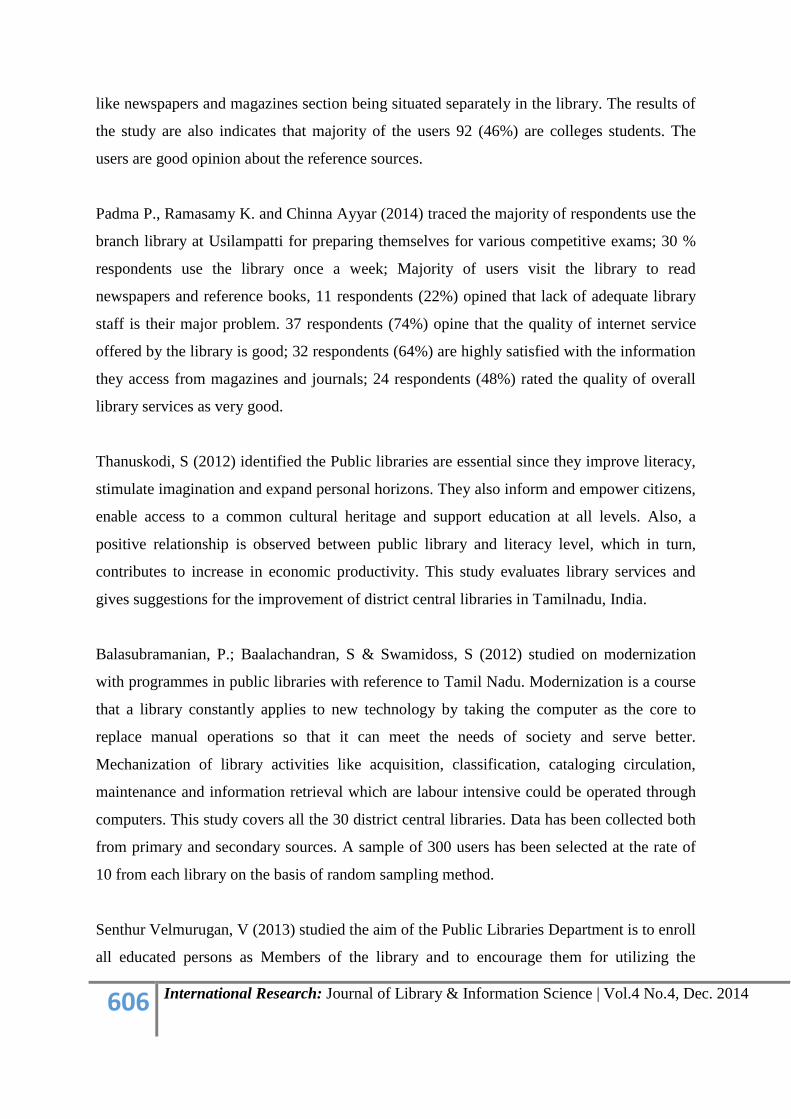
like newspapers and magazines section being situated separately in the library. The results of
the study are also indicates that majority of the users 92 (46%) are colleges students. The
users are good opinion about the reference sources.
Padma P., Ramasamy K. and Chinna Ayyar (2014) traced the majority of respondents use the
branch library at Usilampatti for preparing themselves for various competitive exams; 30 %
respondents use the library once a week; Majority of users visit the library to read
newspapers and reference books, 11 respondents (22%) opined that lack of adequate library
staff is their major problem. 37 respondents (74%) opine that the quality of internet service
offered by the library is good; 32 respondents (64%) are highly satisfied with the information
they access from magazines and journals; 24 respondents (48%) rated the quality of overall
library services as very good.
Thanuskodi, S (2012) identified the Public libraries are essential since they improve literacy,
stimulate imagination and expand personal horizons. They also inform and empower citizens,
enable access to a common cultural heritage and support education at all levels. Also, a
positive relationship is observed between public library and literacy level, which in turn,
contributes to increase in economic productivity. This study evaluates library services and
gives suggestions for the improvement of district central libraries in Tamilnadu, India.
Balasubramanian, P.; Baalachandran, S & Swamidoss, S (2012) studied on modernization
with programmes in public libraries with reference to Tamil Nadu. Modernization is a course
that a library constantly applies to new technology by taking the computer as the core to
replace manual operations so that it can meet the needs of society and serve better.
Mechanization of library activities like acquisition, classification, cataloging circulation,
maintenance and information retrieval which are labour intensive could be operated through
computers. This study covers all the 30 district central libraries. Data has been collected both
from primary and secondary sources. A sample of 300 users has been selected at the rate of
10 from each library on the basis of random sampling method.
Senthur Velmurugan, V (2013) studied the aim of the Public Libraries Department is to enroll
all educated persons as Members of the library and to encourage them for utilizing the

607 International Research: Journal of Library & Information Science | Vol.4 No.4, Dec. 2014
services of this Department. The other activities of this Department are to provide facilities in
the Library, stock books useful for variety of readers, opening of libraries with the co-
operation of the public.
Subramanian, N (2014) identified the electronic information use patterns of Yercaud tribal
students in Salem district Tamil Nadu. This paper describes the background of the Yercaud
tribal area, ICT facilities available in Yercaud, the awareness of school and college students
about electronic resources
Objectives of the study
The present study is conducted to find out the user behavior and awareness among the
different public libraries in Chennai district, Tamil Nadu. Specific objectives are as follows:
To examine the users profile of the libraries
To find out the use pattern of library materials.
To assess the user satisfaction of library services.
Public library systems in Tamil Nadu
In Tamil nadu the Directorate of Public Libraries (DPL) functioning under the control
of Public Libraries Department is responsible in establishing and monitoring of public
libraries which include branch libraries, village libraries, part - time libraries and mobile
libraries of each district. The public library in each District in Tamil Nadu is functions under
the Directorate of Public Libraries (DPL). It is performing with one Joint Director, District
Officers, Additional Directors and Office Staff. Local Library Authorities of DPL execute the
duties of District Library Officer with support of technical and ministerial staff under the
control of the Directorate of Public Libraries. There are different types of public libraries
functioning in the State of Tamil nadu. At present there are 4187 Public Libraries in various
categories as detailed bellow are functioning in the State.

608 International Research: Journal of Library & Information Science | Vol.4 No.4, Dec. 2014
Table 1: Types of Public Libraries in Tamil Nadu
S.
No. District
State
Central
Libraries
District
Central
Libraries
Branch
Libraries
Mobile
Libraries
Village
Libraries
Part -
Time
Libraries
Total
1 Ariyalur -- 1 16 0 21 4 42
2 Chennai -- 1 138 0 0 19 158
3 Coimbatore -- 1 84 4 101 46 236
4 Cuddalore -- 1 66 0 48 23 138
5 Dharmapuri -- 1 32 0 71 20 124
6 Dindigul -- 1 56 0 93 5 155
7 Erode -- 1 79 1 103 17 201
8 Krishnagiri 1 28 70 20 119
9 Kancheepuram -- 1 68 1 59 28 157
10 Kanyakumari -- 1 16 0 111 5 133
11 Karur -- 1 29 0 59 2 91
12 Madurai -- 1 62 1 67 4 135
13 Nagapattinam -- 1 43 0 51 6 101
14 Namakkal -- 1 47 0 70 27 145
15 Nilgiris -- 1 48 0 33 1 83
16 Perambalur -- 1 14 0 31 8 54
17 Pudukottai -- 1 35 0 42 0 78
18 Ramanathapuram -- 1 52 0 27 6 86
19 Salem -- 1 60 1 80 21 163
20 Sivagangai -- 1 53 0 55 12 121
21 Tanjavur -- 1 53 1 50 5 110
22 Theni -- 1 65 0 53 16 135
23 Thirupur -- 1 53 79 7 140
24 Thiruvannamalai -- 1 44 0 75 22 142

609 International Research: Journal of Library & Information Science | Vol.4 No.4, Dec. 2014
25 Thiruvallur -- 1 68 1 53 11 134
26 Tiruvarur -- 1 30 0 52 6 89
27 Thuthukudi -- 1 48 0 59 18 126
28 Tiruchirapalli -- 1 59 1 67 4 132
29 Tirunelveli -- 1 99 1 89 1 191
30 Vellore -- 1 62 0 74 14 151
31 Villupuram -- 1 64 0 76 14 155
32 Virudhunagar -- 1 94 0 58 7 160
33 Connemara Public Library 1 -- -- -- -- -- 1
34 Anna Centenary Library 1 -- - -- -- -- 1
Total 2 32 1765 12 1977 399 4187
http://pallikalvi.in/Directorates/DPL/Reports/Reports.aspx
Methodology
The present study is mainly based on the primary data collected from the readers of
two different public libraries in Chennai district, Tamil Nadu. In addition, the data have been
collected from the sources available from the different libraries. At present in Chennai district
there are 160 (District library – 1, Branch libraries – 138, Part time libraries – 19, Connemara
(State Central) library – 1, and Anna Centenary Library – 1) different types of libraries are
functioning. For the purpose of this study, to compare the user behavior and awareness
among the two different public libraries are selected. Responses were collected from two
different (Villivakkam and Ambattur) public libraries representing the different geographical
zones in Chennai district. A total of 130 users have been selected in the present study. In each
library sixty five users are selected, the sixty five respondents have been selected according
to their regular utilization of the libraries. The users have been selected in random from the
user‘s records maintained by the library. The collected data were classified, analyzed, and
tabulated by using simple statistical methods.
Data Analysis and Findings

610 International Research: Journal of Library & Information Science | Vol.4 No.4, Dec. 2014
The study was conducted at two different public libraries in Chennai district, Tamil Nadu for
the benefit of its user community.
Table 2: Distribution of Readers by Age
Library
Age Total
10-20 21-30 31-40 41-50 51-60 61-70
Ambattur
9
(13.84%)
27
(41.53%)
14
(21.53%)
9
(13.84%)
4
(6.15%)
2
(3.07%)
65
(100%)
Villivakkam
11
(16.92%)
24
(36.92%)
13
(20.00%)
10
(15.38%)
6
(9.23%)
1
(1.53%)
65
(100%)
Total
20
(15.38%)
51
(39.23%)
27
(20.76%)
19
(14.61%)
10
(7.69%)
3
(2.30%)
130
(100%)
The table 2 shows that age wise distribution of various categories of respondents. The
highest numbers of 27(41.53%) respondents are belonging to the age group of 21-30 in the
Ambattur library users are using. The lowest number of users i.e., 61-70 age group of
respondents being 1 (1.53%) are fewer users in Villivakkam library.
Table 3: Distribution of Readers by Gender
Library Sex
Total Male Female
Ambattur 49
(75.38%)
16
(24.61%)
65
(100.00)
Villivakkam 53
(81.53%)
12
(18.46%)
65
(100.00)
Total 102
(78.46%)
28
(21.53%)
130
(100.00)

611 International Research: Journal of Library & Information Science | Vol.4 No.4, Dec. 2014
Figure 1: Distribution of Readers by Gender
The table 3 and figure 1shows that out of 130 respondents, 102 (78.46%) are belongs
to male. There are 28 female respondents (21.53%) are less users gender wise. In
Villivakkam library, maximum numbers of male visitors (53) are visiting the library. The
lowest 12 (18.45%) female visitors are visiting the Villivakkam library.
Table 4: Distribution of Respondents by Academic Background
Library Academic Background
Total School College University
Ambattur 14
(21.53%)
32
(49.23%)
19
(29.23%)
65
(100.00)
Villivakkam 11
(16.92%)
37
(56.92%)
17
(26.15%)
65
(100.00)
Total 25
(19.23%)
69
(53.07%)
36
(27.69%)
130
(100.00)

612 International Research: Journal of Library & Information Science | Vol.4 No.4, Dec. 2014
Figure 2: Respondents by Academic Background
The table 4 and figure 2 shows that, out of 130 respondents 69 (53.07%) are college
level which is the highest, 25 respondents (19.23%) are school level which is the lowest. In
Villivakkam library, maximum number of College level users (37) is using the library,
maximum number of University level users 19 (29.23%) are using the library in Ambattur
library.
Table 5: Awareness of Information Resources
Library
Response Total
Yes No
Ambattur 59
(90.76%)
6
(9.23%)
65
(100.00)
Villivakkam 62
(95.38%)
3
(4.61%)
65
(100.00)
Total 121
(93.07%)
9
(6.92%)
130
(100.00)

613 International Research: Journal of Library & Information Science | Vol.4 No.4, Dec. 2014
Figure 3: Awareness of Information Resources
Table 5 and figure 3 show that majority 121 (93.07%) of the respondents are aware of
the information resources available from the libraries and only 9 (6.92%) are not aware of it.
It is a positive sign towards the use of the information resources by the library user
community. The highest number of users 62 (95.38%) are aware of the information sources in
Villivakkam library.
Table 6: Distribution of Respondents by Frequency of Library Visitors
Library
Frequency
Total Daily
Once in
A Week
Once in
Fortnight
Monthly
once
Ambattur 18
(27.69%)
31
(47.69%)
11
(16.92%)
5
(7.69%)
65
(100.00)
Villivakkam 16
(24.61%)
29
(44.61%)
14
(21.53%)
6
(9.23%)
65
(100.00)
Total 34
(26.15%)
60
(46.15%)
25
(19.23%)
11
(8.46%)
130
(100.00)
The table shows that among the library visitors 60 (46.15%) respondents are visiting
library once in a week. 25 (19.23%) respondents are visiting library once in a fortnight. The
second highest number 34 (26.15%) of users are visiting the library in daily. In Ambattur
library, maximum number of respondents 31 (47.69%) are using the library once a week.
Daily visitors are maximum 18 (27.69%) in Ambattur library.
614 International Research: Journal of Library & Information Science | Vol.4 No.4, Dec. 2014
Table 7: Distribution of Respondents by Reading Hours in Library
Library
Reading Hours
Total 1 Hour 2 Hours
Above 2
Hours
Ambattur 29
(44.61%)
22
(33.84%)
14
(21.53%)
65
(100.00)
Villivakkam 32
(49.23%)
17
(26.15%)
16
(24.61%)
65
(100.00)
Total 61
(46.92%)
39
(30.00%)
30
(23.07%)
130
(100.00)
The table shows that the 61 (46.92%) respondents are reading up to one hour in the
library. 39 (30.00%) respondents are reading 2 hours in the library. In Villivakkam, maximum
number of respondents 32 (49.23%) are reading up to 1 hour in the library. Two hours reading
in the library are maximum 22 (33.84%) in Ambattur library, and 2 hours and above reading
are maximum (16) in Villivakkam library.
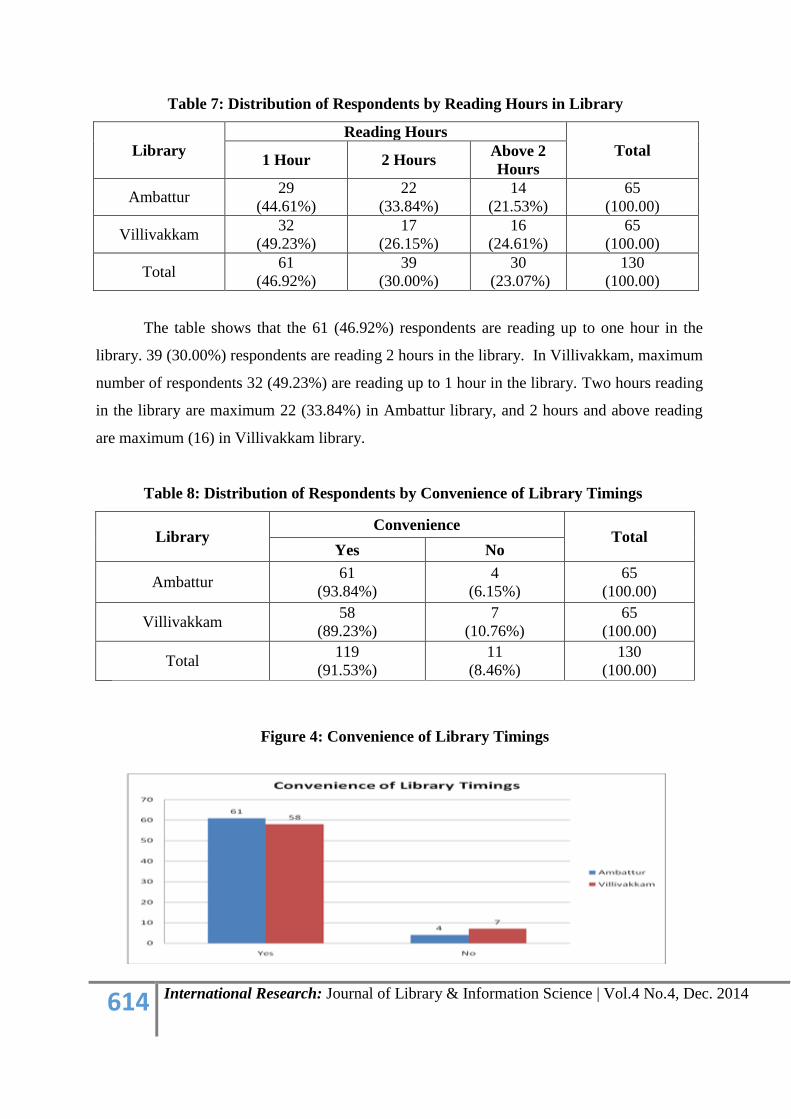
Table 8: Distribution of Respondents by Convenience of Library Timings
Library Convenience
Total Yes No
Ambattur 61
(93.84%)
4
(6.15%)
65
(100.00)
Villivakkam 58
(89.23%)
7
(10.76%)
65
(100.00)
Total 119
(91.53%)
11
(8.46%)
130
(100.00)
Figure 4: Convenience of Library Timings

615 International Research: Journal of Library & Information Science | Vol.4 No.4, Dec. 2014
The table 8 and figure 4 shows 119 (91.53%) respondents of library users are satisfied
with library timings. And only 11 (8.46%) respondents are not satisfied with library timings.
In Ambattur library, 61 (93.84%) of the respondents are satisfied with library timings. Only 7
(10.76%) respondents are not satisfied with library timings in Villivakkam library.
Table 9: Distribution of Respondents by Availability of Sources
The table 9 shows that 100 (76.92%) respondents of library users are satisfied with
availability of the reference sources. Only 30 (23.07%) respondents are not satisfied with
reference section in the library. In Villivakkam, library maximum number of respondents 54
(83.07%) are satisfied with availability of the reference sources. And 19 (29.23%)
respondents are not satisfied with reference sources in Ambattur library.
Table 10: Distribution of Respondents by Availability of Newspapers & Magazines
Section
Library Availability
Total Yes No
Ambattur 63
(96.92%)
2
(3.07%)
65
(100.00)
Villivakkam 64
(98.46%)
1
(1.53%)
65
(100.00)
Total 127
(97.69%)
3
(2.30%)
130
(100.00)
Figure 5: Availability of Newspapers and Magazines
Library Availability
Total Yes No
Ambattur 46
(70.76%)
19
(29.23%)
65
(100.00)
Villivakkam 54
(83.07%)
11
(16.92%)
65
(100.00)
Total 100
(76.92%)
30
(23.07%)
130
(100.00)

616 International Research: Journal of Library & Information Science | Vol.4 No.4, Dec. 2014
The table 10 and figure 5 shows that 127 (97.69%) respondents of library users are
satisfied with availability of newspapers and magazines section being situated separately in
the library. Only 3 (2.30%) respondents are not satisfied. In Villivakkam, library maximum
number of respondents 64 (983.46%) are satisfied with availability of newspapers and
magazines section. And only 2 (3.07%) respondents are not satisfied in Ambattur library.
Table 11 Opinion about Information Resources
Library Opinion
Total Satisfied Partly Satisfied Not satisfied
Ambattur 49
(75.38%)
11
(16.92%)
5
(7.69%) 65
(100.00)
Villivakkam 54
(83.07%)
9
(13.84%)
2
(3.07%) 65
(100.00)
Total 103
(79.23%)
20
(15.38%)
7
(5.38%) 130
(100.00)
Figure 6: Opinion about Information Resources

617 International Research: Journal of Library & Information Science | Vol.4 No.4, Dec. 2014
Table 11 and figure 6 shows that the majority 103 (97.23%) of respondents were
satisfied with the relevance of the information resources, followed by 20 (15.38%) partially
satisfied. Only 7 (5.38%) respondents were not satisfied with the availability of the
information sources.
Table 12 Comparison of the Two Different Libraries
Sl.
No.
Comparison Library
Ambattur Villivakkam
1 Age 27 24
2 Gender 46 53
3 Academic Background 32 37
4 Awareness of Information Resources 59 62
5 Frequency of Library Visitors 31 29
6 Reading Hours in Library 29 32
7 Convince of Library Timings 41 58
8 Availability of Sources 46 54
9 Availability of News Papers and Magazines 63 64
10 Opinion about Information Resources 49 54
Figure 7: Comparison of the Two Different Libraries

618 International Research: Journal of Library & Information Science | Vol.4 No.4, Dec. 2014
Table 12 and figure 7 show that the comparative of age wise (21-30) is dominant role
(27) in Ambattur library to compare the Villivakkam library. In gender wise 53 male users
are most dominant role compare to Ambattur library. To compare the academic background
wise the Villivakkam library users are major role. And to compare reading hours wise
Villivakkam library users (32) are most dominant. And finally overall compare to the above
table the Villivakkam library users are most dominant role in all aspects.
Finding and Conclusion
The highest numbers of 27(41.53%) respondents are belonging to the age group of 21-
30 in the Ambattur library users are using.
Out of 130 respondents, 102 (78.46%) are belongs to male users. In Villivakkam
library, maximum numbers of male visitors (53) are visiting the library.
Out of 130 respondents 69 (53.07%) are college level users which is the highest. In
Villivakkam library, maximum number of College level users (37) is using the library.

619 International Research: Journal of Library & Information Science | Vol.4 No.4, Dec. 2014
Majority 121 (93.07%) respondents are aware of the information resources available
from the libraries. The highest number of users 62 (95.38%) are aware of the
information sources in Villivakkam library.
Among the library visitors 60 (46.15%) respondents are visiting library once in a
week. In Ambattur library, maximum number of respondents 31 (47.69%) are using
the library once a week. Daily visitors are maximum 18 (27.69%) in Ambattur library.
61 (46.92%) respondents are reading up to one hour in the library. 39 (30.00%)
respondents is reading 2 hours in the library. In Villivakkam, maximum number of
respondents 32 (49.23%) are reading up to 1 hour in the library.
119 (91.53%) respondents of library users are satisfied with library timings. And only
11 (8.46%) respondents are not satisfied with library timings. In Ambattur library, 61
(93.84%) of the respondents are satisfied with library timings.
100 (76.92%) respondents of library users are satisfied with availability of the
reference sources. In Villivakkam, library maximum number of respondents 54
(83.07%) are satisfied with availability of the reference sources.
127 (97.69%) respondents of library users are satisfied with availability of
newspapers and magazines section being situated separately in the library.
Majority 103 (97.23%) of respondents were satisfied with the relevance of the
information resources in the library, followed by 20 (15.38%) partially satisfied.
This paper aimed to know the performance of comparative study of user behavior and
awareness among the two different public libraries in Chennai district, Tamil Nadu, from the
study majority of the users of the libraries satisfied with the collection of the information
resources, services and facilities offered by the different public libraries.

620 International Research: Journal of Library & Information Science | Vol.4 No.4, Dec. 2014
References
1. Thavamani, K, (2014) Information Use Pattern of Connemara Public Library,
Chennai, Tamil Nadu: A Case Study, International Research: Journal of Library and
Information Science, 4 (1) 182-196.
2. Padma P., Ramasamy, K. & Chinna Ayyar (2014) Information Seeking Behaviour of
Users at Usilampatti Public Library, Tamilnadu, India: A Case Study, Research
Journal of Library Sciences, 2 (3) 1-5.
3. Thanuskodi, S (2012) Assessing the Efficacy of Library Services of District Central
Libraries in Tamil Nadu from Users Perception, DESIDOC Journal of Library and
Information Technology, 32, (6) 485-492.
4. Balasubramanian, P.; Baalachandran, S & Swamidoss, S (2012) A Study on
Modernization Programmes in Public Libraries with Reference to Tamil Nadu. IJISS,
2 (2) 1-5.
5. Senthur Velmurugan, V (2013) Libraries in Tamilnadu: A History of Public Library.
International Journal of Multidisciplinary Academic Research, 1 (1) 22-31.
6. Subramanian, N (2014) Electronic Information Use Pattern of Yercaud Tribal
Students in Salem District, Tamil Nadu, Journal of Advances in Library and
Information Science, 3 (1) 47-52.
7. UNESCO Public Library Manifesto in IFLA for Public Libraries. IFLA: (1956) 13.
8. Ashok kumar, S.K, (2008) Public Library System and Services in Tamil nadu.
Bharathi Puthagalayam: Chennai. 33-35.

621 International Research: Journal of Library & Information Science | Vol.4 No.4, Dec. 2014
9. Kulasekaran, P (2006) Public Libraries Department: An Overview. Regional Seminar
on Delivery of Books and Newspapers (Public Libraries) Act, 1954 held at World
University Centre, Chennai. 31-39.
10. Selvamani, J & Thavamani, K (2010) Role of Public Libraries in Continuing
Education Programme. Proceedings of The National Seminar on Developing
Utilization Based Public Library System In Digital Environment: Challenges and
Opportunities, Organized by Department of Library and Information Science,
Annamalai University. 106-107.
Follow us on: IRJLIS, Facebook, Twitter