Embed Size (px)
Citation preview
Tamar Valley Council Feasibility Study
West Tamar and George Town CouncilsApril 2018
KPMG, an Australian partnership and a member firm of the KPMG network of independent member firms affiliated with KPMG International Cooperative (“KPMG International”), a Swiss entity. 2
Tel +61 (3) 6230 4000Fax +61 (3) 6230 4050
KPMGEnterprise AdvisoryLevel 3/ 100 Melville StreetHobart TAS 7000
Private and confidential
The Mayors and General Managers,
George Town Council & West Tamar Council
Merger Feasibility Study
KPMG is pleased to present our Final Report into the feasibility of a merger between George Town Council and West Tamar Council, to form a Tamar Valley Council. The study has found:
— The councils share the Tamar River boundary and each comprise a diverse mix of small communities. Population projections point to an ageing community (and in George Town, a declining population), which will put pressure on the revenue raising capacity of the councils
— The councils offer many similar services to levels that the Council General Managers assess to comply with statutory obligations and meet community expectations. West Tamar’s larger scale and financial resources may present opportunities for a merged council to share the benefits of that scale across the region as a whole
— A merged council would generate annual savings to the region of at least $1.3 M p.a. with an estimated upfront implementation cost of $1.6 M. These estimates are based on conservative assumptions with no asset sales and no changes to services. This would provide the Tamar Valley region with additional financial resources to invest in improved services and infrastructure and provide enhanced strategic capacity to deal with the issues facing the region
— A merged council may be entitled to up to 10 councillors, down from the 9 in each council (18 in total) under the current arrangements. The representation ratio for a Tamar Valley Council is not unreasonable compared to some other Tasmanian councils. A merged council could also further develop access to representation, using approaches such as new technologies and ‘grass-roots’ community-led bodies.
— Having regard to the Minister's principles guiding any potential reform of local government, on balance, the study concludes a merger may be in the best interests of the region. Accordingly, there would be merit in taking this opportunity to the communities of each council to seek further input and direction.
We thank you for the opportunity to have undertaken this study.
Tim Rutherford David RichardsonDirector Director
Important Notice
Inherent Limitations
This report is given subject to the written terms of KPMG’s engagement. This report hasbeen prepared as outlined in Scope Section. The services provided in connection withthis engagement comprise an advisory engagement which is not subject to AustralianAuditing Standards or Australian Standards on Review or Assurance Engagements, andconsequently no opinions or conclusions intended to convey assurance have beenexpressed.
No warranty of completeness, accuracy or reliability is given in relation to the statementsand representations made by, and the information and documentation provided by theGeorge Town Council and West Tamar Council (the Councils) consulted as part of theprocess.
KPMG have indicated within this report the sources of the information provided. We havenot sought to independently verify those sources unless otherwise noted within the report.
No reliance should be placed by the Councils or Department of Premier and Cabinet onadditional oral remarks provided, unless these are confirmed in writing by KPMG. KPMGis under no obligation in any circumstance to update this report, in either oral or writtenform, for events occurring after the report has been issued in final form.
The findings in this report have been formed on the above basis.
Third Party Reliance
This report has been prepared at the request of the Councils and the Department ofPremier and Cabinet in accordance with the terms of KPMG’s engagement letter/contractdated 9 June 2017. Other than our responsibility to the Councils and the Department ofPremier and Cabinet neither KPMG nor any member or employee of KPMG undertakesresponsibility arising in any way from reliance placed by a third party on this report. Anyreliance placed is that party’s sole responsibility.
This report is provided solely for the benefit of the parties identified in the engagementletter/contract and are not to be copied, quoted or referred to in whole or in part withoutKPMG’s prior written consent. KPMG accepts no responsibility to anyone other than theparties identified in the engagement letter/contract for the information contained in thisreport.
3
Document Classification: KPMG Confidential
© 2018 KPMG, an Australian partnership and a member firm of the KPMG network of independent member firms affiliated with KPMG International Cooperative (“KPMG International”), a Swiss entity. All rights reserved. The KPMG name and logo are registered trademarks or trademarks of KPMG International. Liability limited by a scheme approved under Professional Standards Legislation.
Contents
Page
Headlines 5
1. Executive Summary 8
2. Current State Assessment 18-53
2.1 Financial Profile 20
2.2 Service Profile 26
2.3 Employment Profile 37
2.4 Community Profile 42
3. The Merged Option 54-77
3.1 Key Considerations 56
3.2 Financial Assumptions 61
3.3 Financial Assessment 66
3.4 Community & GovernanceAssessment 69
The contacts at KPMG in connection with this report are:
Paul GreenEnterprise AdvisoryPartner, KPMG Tasmania
Tel: +61 (3) 6230 [email protected]
David RichardsonEnterprise AdvisoryDirector, KPMG Tasmania
Tel: +61 (3) 6230 [email protected]
Tim RutherfordEnterprise AdvisoryDirector, KPMG Tasmania
Tel: +61 (3) 6230 [email protected]
Page
4. Conclusions 77-84
4.1 Assessment Against Principles 78
4.2 Potential Transition Arrangements 81
Appendices
1. Study Requirements
2. Merger benchmarks
3. Financial statistics and definitions
4. Council Rating Policies
5. References
85
88
91
94
97
4
Document Classification: KPMG Confidential
© 2018 KPMG, an Australian partnership and a member firm of the KPMG network of independent member firms affiliated with KPMG International Cooperative (“KPMG International”), a Swiss entity. All rights reserved. The KPMG name and logo are registered trademarks or trademarks of KPMG International. Liability limited by a scheme approved under Professional Standards Legislation.
List of Tables
Table 1 Summary Employment Data
Table 2 Key Auditor General 2016-17 Benchmarks
Table 3 Revenue Assumptions
Table 4 Expenditure Assumptions
Table 5 Asset Management
Table 6 Governance Statistics
Table 7 Summary of Planning and Building Services by the Councils
Table 8 Infrastructure Profile
Table 9 IT Infrastructure and Systems
Table 10 IT Staffing & Spend
Table 11 IT Systems & Users
Table 12 FTE Comparison
Table 13 Summary Employment Data
Table 14 George Town Council Staffing
Table 15 West Tamar Staffing
Table 16 Industrial Agreement Comparison
Table 17 Labour Force Survey as at March 2017
Table 18 Summary of Modelling Assumptions
Table 19 Modelling Assumptions: Staffing
Table 20 2016-17 Grant Funding
Table 21 Current Enterprise Agreement Comparison for Voluntary Redundancies
Table 22 Benchmarked Assumptions around Financial Benefits of a Merger
Table 23 Benchmarked Assumptions around Financial Costs of a Merger
Table 24 Financial statistics and definitions- Operating Metrics
Table 25 Financial statistics and definitions- Asset Metrics

Headlines
6
Document Classification: KPMG Confidential
© 2018 KPMG, an Australian partnership and a member firm of the KPMG network of independent member firms affiliated with KPMG International Cooperative (“KPMG International”), a Swiss entity. All rights reserved. The KPMG name and logo are registered trademarks or trademarks of KPMG International. Liability limited by a scheme approved under Professional Standards Legislation.
HeadlinesTamar Valley Council Feasibility Study
Introduction
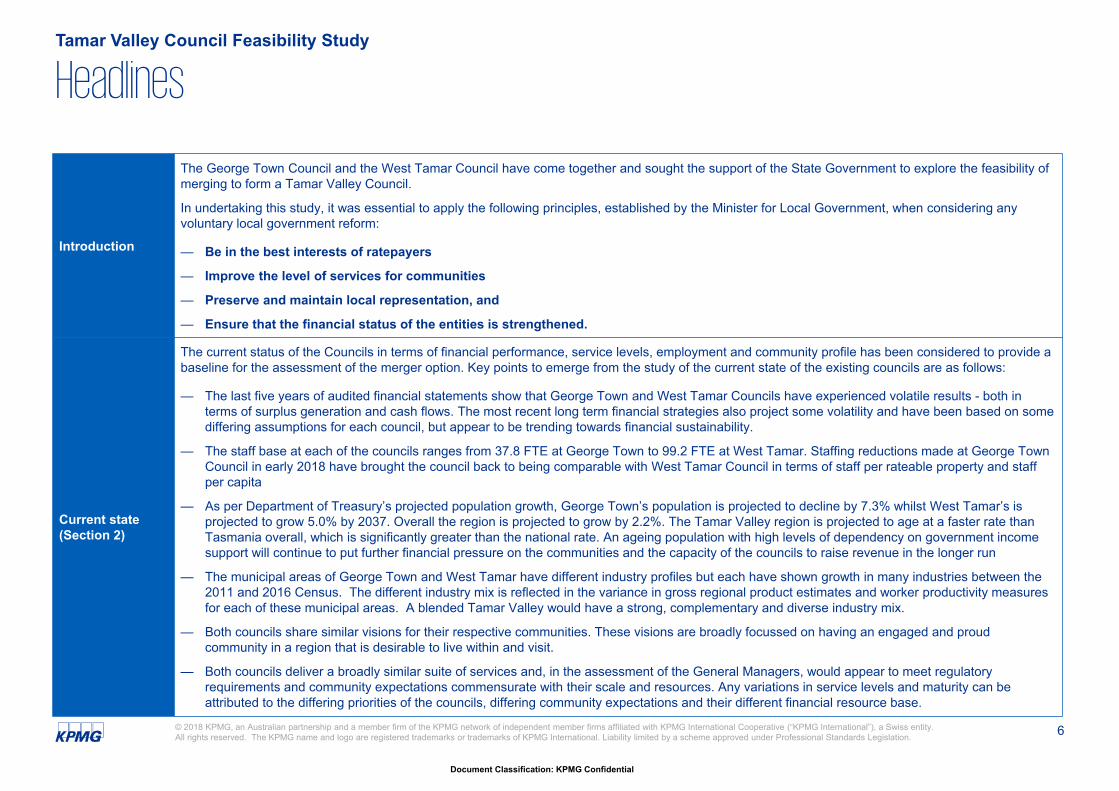
The George Town Council and the West Tamar Council have come together and sought the support of the State Government to explore the feasibility of merging to form a Tamar Valley Council.
In undertaking this study, it was essential to apply the following principles, established by the Minister for Local Government, when considering any voluntary local government reform:
— Be in the best interests of ratepayers
— Improve the level of services for communities
— Preserve and maintain local representation, and
— Ensure that the financial status of the entities is strengthened.
Current state(Section 2)
The current status of the Councils in terms of financial performance, service levels, employment and community profile has been considered to provide a baseline for the assessment of the merger option. Key points to emerge from the study of the current state of the existing councils are as follows:
— The last five years of audited financial statements show that George Town and West Tamar Councils have experienced volatile results - both in terms of surplus generation and cash flows. The most recent long term financial strategies also project some volatility and have been based on some differing assumptions for each council, but appear to be trending towards financial sustainability.
— The staff base at each of the councils ranges from 37.8 FTE at George Town to 99.2 FTE at West Tamar. Staffing reductions made at George Town Council in early 2018 have brought the council back to being comparable with West Tamar Council in terms of staff per rateable property and staff per capita
— As per Department of Treasury’s projected population growth, George Town’s population is projected to decline by 7.3% whilst West Tamar’s is projected to grow 5.0% by 2037. Overall the region is projected to grow by 2.2%. The Tamar Valley region is projected to age at a faster rate than Tasmania overall, which is significantly greater than the national rate. An ageing population with high levels of dependency on government income support will continue to put further financial pressure on the communities and the capacity of the councils to raise revenue in the longer run
— The municipal areas of George Town and West Tamar have different industry profiles but each have shown growth in many industries between the 2011 and 2016 Census. The different industry mix is reflected in the variance in gross regional product estimates and worker productivity measures for each of these municipal areas. A blended Tamar Valley would have a strong, complementary and diverse industry mix.
— Both councils share similar visions for their respective communities. These visions are broadly focussed on having an engaged and proud community in a region that is desirable to live within and visit.
— Both councils deliver a broadly similar suite of services and, in the assessment of the General Managers, would appear to meet regulatory requirements and community expectations commensurate with their scale and resources. Any variations in service levels and maturity can be attributed to the differing priorities of the councils, differing community expectations and their different financial resource base.
7
Document Classification: KPMG Confidential
© 2018 KPMG, an Australian partnership and a member firm of the KPMG network of independent member firms affiliated with KPMG International Cooperative (“KPMG International”), a Swiss entity. All rights reserved. The KPMG name and logo are registered trademarks or trademarks of KPMG International. Liability limited by a scheme approved under Professional Standards Legislation.
HeadlinesTamar Valley Council Feasibility Study
The Merged Option(Section 3)
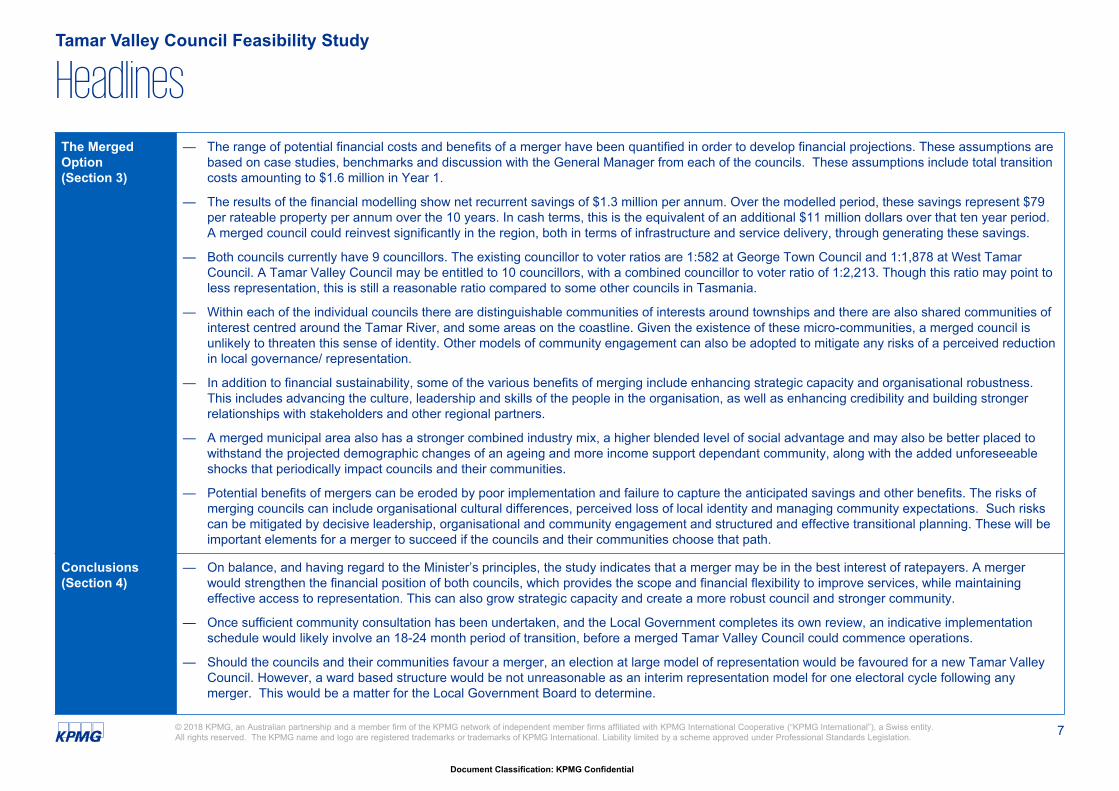
— The range of potential financial costs and benefits of a merger have been quantified in order to develop financial projections. These assumptions are based on case studies, benchmarks and discussion with the General Manager from each of the councils. These assumptions include total transition costs amounting to $1.6 million in Year 1.
— The results of the financial modelling show net recurrent savings of $1.3 million per annum. Over the modelled period, these savings represent $79 per rateable property per annum over the 10 years. In cash terms, this is the equivalent of an additional $11 million dollars over that ten year period. A merged council could reinvest significantly in the region, both in terms of infrastructure and service delivery, through generating these savings.
— Both councils currently have 9 councillors. The existing councillor to voter ratios are 1:582 at George Town Council and 1:1,878 at West Tamar Council. A Tamar Valley Council may be entitled to 10 councillors, with a combined councillor to voter ratio of 1:2,213. Though this ratio may point to less representation, this is still a reasonable ratio compared to some other councils in Tasmania.
— Within each of the individual councils there are distinguishable communities of interests around townships and there are also shared communities of interest centred around the Tamar River, and some areas on the coastline. Given the existence of these micro-communities, a merged council is unlikely to threaten this sense of identity. Other models of community engagement can also be adopted to mitigate any risks of a perceived reduction in local governance/ representation.
— In addition to financial sustainability, some of the various benefits of merging include enhancing strategic capacity and organisational robustness. This includes advancing the culture, leadership and skills of the people in the organisation, as well as enhancing credibility and building stronger relationships with stakeholders and other regional partners.
— A merged municipal area also has a stronger combined industry mix, a higher blended level of social advantage and may also be better placed to withstand the projected demographic changes of an ageing and more income support dependant community, along with the added unforeseeable shocks that periodically impact councils and their communities.
— Potential benefits of mergers can be eroded by poor implementation and failure to capture the anticipated savings and other benefits. The risks of merging councils can include organisational cultural differences, perceived loss of local identity and managing community expectations. Such risks can be mitigated by decisive leadership, organisational and community engagement and structured and effective transitional planning. These will be important elements for a merger to succeed if the councils and their communities choose that path.
Conclusions(Section 4)
— On balance, and having regard to the Minister’s principles, the study indicates that a merger may be in the best interest of ratepayers. A mergerwould strengthen the financial position of both councils, which provides the scope and financial flexibility to improve services, while maintaining effective access to representation. This can also grow strategic capacity and create a more robust council and stronger community.
— Once sufficient community consultation has been undertaken, and the Local Government completes its own review, an indicative implementation schedule would likely involve an 18-24 month period of transition, before a merged Tamar Valley Council could commence operations.
— Should the councils and their communities favour a merger, an election at large model of representation would be favoured for a new Tamar Valley Council. However, a ward based structure would be not unreasonable as an interim representation model for one electoral cycle following any merger. This would be a matter for the Local Government Board to determine.
1. Executive Summary
9
Document Classification: KPMG Confidential
© 2018 KPMG, an Australian partnership and a member firm of the KPMG network of independent member firms affiliated with KPMG International Cooperative (“KPMG International”), a Swiss entity. All rights reserved. The KPMG name and logo are registered trademarks or trademarks of KPMG International. Liability limited by a scheme approved under Professional Standards Legislation.
Scope
The George Town Council and the West Tamar Council have come together and sought the support of the State Government to explore the feasibility of merging to form a Tamar Valley Council.
The following principles, established by the Minister for Local Government, should be applied when considering any voluntary local government reform:
— Be in the best interests of ratepayers
— Improve the level of services for communities
— Preserve and maintain local representation, and
— Ensure that the financial status of the entities is strengthened.
Deliverables
The deliverables for the study are to be:
— A feasibility study report into the voluntary merger of the councils that will be made publicly available
— An abridged version of the report which will be suitable for any community consultation to be undertaken by one or more of the participating Councils, and
— A presentation to the State Government and participating councils
The participating councils have collectively developed a scope of work that broadly falls into three categories:
— Financial requirements
— Operational requirements
— Community and governance requirements
The key elements to be considered in each of these areas of requirement are set out In Appendix 1. The requirements include items that need to be considered by this study as identified by the Local Government Board.
RequirementsTamar Valley Council Feasibility Study
10
Document Classification: KPMG Confidential
© 2018 KPMG, an Australian partnership and a member firm of the KPMG network of independent member firms affiliated with KPMG International Cooperative (“KPMG International”), a Swiss entity. All rights reserved. The KPMG name and logo are registered trademarks or trademarks of KPMG International. Liability limited by a scheme approved under Professional Standards Legislation.
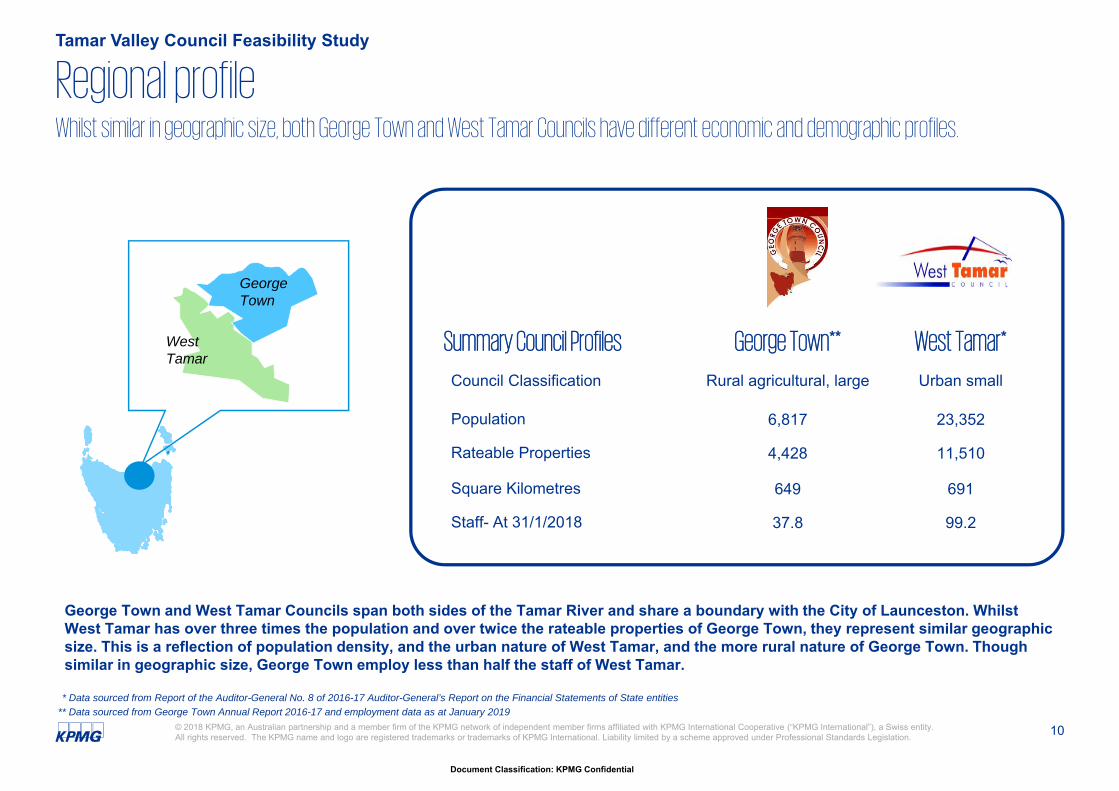
Whilst similar in geographic size, both George Town and West Tamar Councils have different economic and demographic profiles.
Tamar Valley Council Feasibility Study
Regional profile
GeorgeTown
West Tamar
Summary Council Profiles George Town** West Tamar*
Council Classification Rural agricultural, large Urban small
Population 6,817 23,352
Rateable Properties 4,428 11,510
Square Kilometres 649 691
Staff- At 31/1/2018 37.8 99.2
* Data sourced from Report of the Auditor-General No. 8 of 2016-17 Auditor-General’s Report on the Financial Statements of State entities
George Town and West Tamar Councils span both sides of the Tamar River and share a boundary with the City of Launceston. Whilst West Tamar has over three times the population and over twice the rateable properties of George Town, they represent similar geographic size. This is a reflection of population density, and the urban nature of West Tamar, and the more rural nature of George Town. Though similar in geographic size, George Town employ less than half the staff of West Tamar.
** Data sourced from George Town Annual Report 2016-17 and employment data as at January 2019
11
Document Classification: KPMG Confidential
© 2018 KPMG, an Australian partnership and a member firm of the KPMG network of independent member firms affiliated with KPMG International Cooperative (“KPMG International”), a Swiss entity. All rights reserved. The KPMG name and logo are registered trademarks or trademarks of KPMG International. Liability limited by a scheme approved under Professional Standards Legislation.
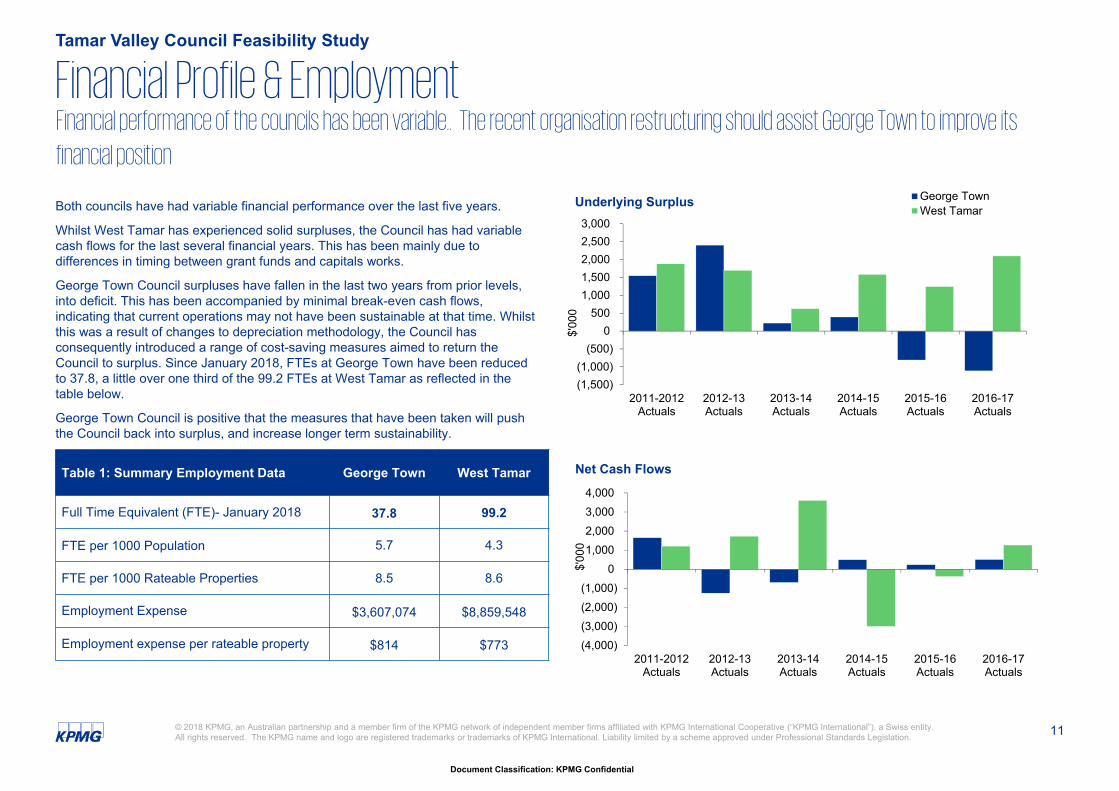
Both councils have had variable financial performance over the last five years.
Whilst West Tamar has experienced solid surpluses, the Council has had variable cash flows for the last several financial years. This has been mainly due to differences in timing between grant funds and capitals works.
George Town Council surpluses have fallen in the last two years from prior levels, into deficit. This has been accompanied by minimal break-even cash flows, indicating that current operations may not have been sustainable at that time. Whilst this was a result of changes to depreciation methodology, the Council has consequently introduced a range of cost-saving measures aimed to return the Council to surplus. Since January 2018, FTEs at George Town have been reduced to 37.8, a little over one third of the 99.2 FTEs at West Tamar as reflected in the table below.
George Town Council is positive that the measures that have been taken will push the Council back into surplus, and increase longer term sustainability.
Tamar Valley Council Feasibility Study
Financial Profile & EmploymentFinancial performance of the councils has been variable.. The recent organisation restructuring should assist George Town to improve its
financial position
(1,500)(1,000)
(500)0
5001,0001,5002,0002,5003,000
2011-2012Actuals
2012-13Actuals
2013-14Actuals
2014-15Actuals
2015-16Actuals
2016-17Actuals
$'00
0
Underlying Surplus George TownWest Tamar
(4,000)(3,000)(2,000)(1,000)
01,0002,0003,0004,000
2011-2012Actuals
2012-13Actuals
2013-14Actuals
2014-15Actuals
2015-16Actuals
2016-17Actuals
$'00
0
Net Cash FlowsTable 1: Summary Employment Data George Town West Tamar
Full Time Equivalent (FTE)- January 2018 37.8 99.2
FTE per 1000 Population 5.7 4.3
FTE per 1000 Rateable Properties 8.5 8.6
Employment Expense $3,607,074 $8,859,548
Employment expense per rateable property $814 $773
12
Document Classification: KPMG Confidential
© 2018 KPMG, an Australian partnership and a member firm of the KPMG network of independent member firms affiliated with KPMG International Cooperative (“KPMG International”), a Swiss entity. All rights reserved. The KPMG name and logo are registered trademarks or trademarks of KPMG International. Liability limited by a scheme approved under Professional Standards Legislation.
Community ProfileTamar Valley Council Feasibility Study
Regional SnapshotPopulation
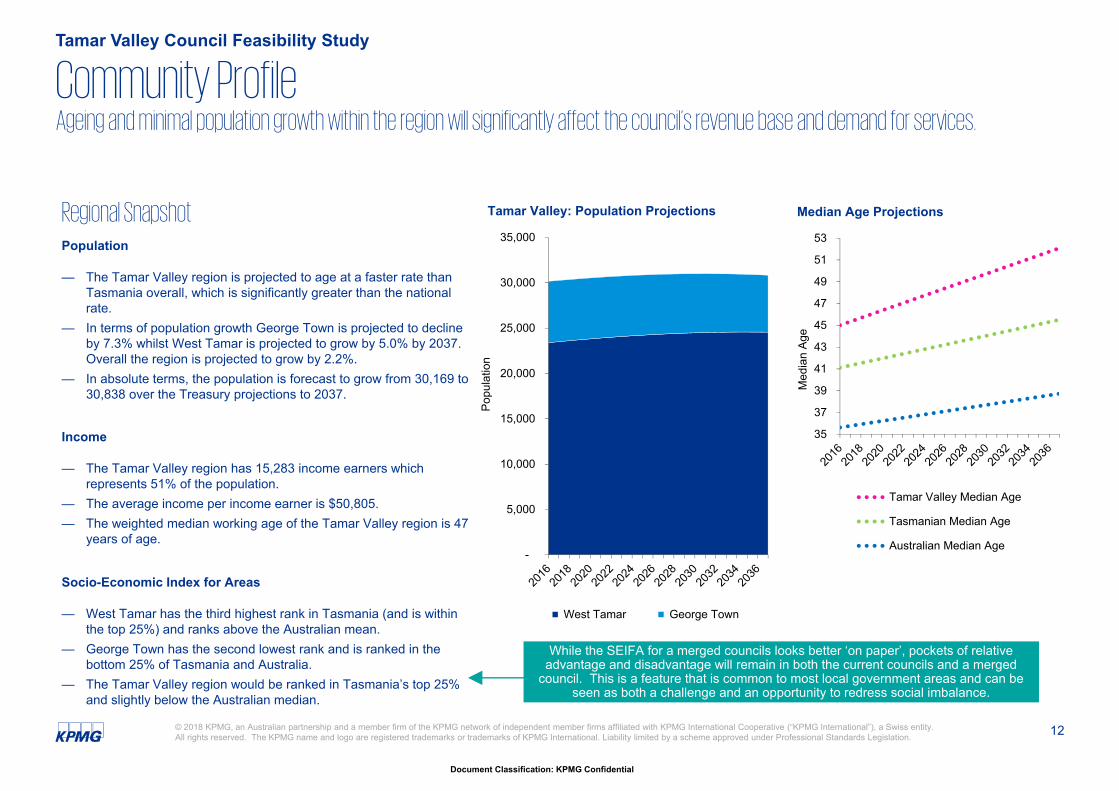
— The Tamar Valley region is projected to age at a faster rate than Tasmania overall, which is significantly greater than the national rate.
— In terms of population growth George Town is projected to decline by 7.3% whilst West Tamar is projected to grow by 5.0% by 2037. Overall the region is projected to grow by 2.2%.
— In absolute terms, the population is forecast to grow from 30,169 to 30,838 over the Treasury projections to 2037.
Income
— The Tamar Valley region has 15,283 income earners which represents 51% of the population.
— The average income per income earner is $50,805. — The weighted median working age of the Tamar Valley region is 47
years of age.
Socio-Economic Index for Areas
— West Tamar has the third highest rank in Tasmania (and is within the top 25%) and ranks above the Australian mean.
— George Town has the second lowest rank and is ranked in the bottom 25% of Tasmania and Australia.
— The Tamar Valley region would be ranked in Tasmania’s top 25% and slightly below the Australian median.
Ageing and minimal population growth within the region will significantly affect the council’s revenue base and demand for services.
-
5,000
10,000
15,000
20,000
25,000
30,000
35,000
Popu
latio
n
Tamar Valley: Population Projections
West Tamar George Town
35
37
39
41
43
45
47
49
51
53
Med
ian
Age
Median Age Projections
Tamar Valley Median Age
Tasmanian Median Age
Australian Median Age
While the SEIFA for a merged councils looks better ‘on paper’, pockets of relative advantage and disadvantage will remain in both the current councils and a merged
council. This is a feature that is common to most local government areas and can be seen as both a challenge and an opportunity to redress social imbalance.
13
Document Classification: KPMG Confidential
© 2018 KPMG, an Australian partnership and a member firm of the KPMG network of independent member firms affiliated with KPMG International Cooperative (“KPMG International”), a Swiss entity. All rights reserved. The KPMG name and logo are registered trademarks or trademarks of KPMG International. Liability limited by a scheme approved under Professional Standards Legislation.
Services profileTamar Valley Council Feasibility Study
Administration
Human resources
Finance
Information Technology
Risk Management
Legal Services
Marketing & Communications
Governance support
Council Services
& Activities
Corporate
Engineeringand Regulatory
Community
Recreational services and civil works
Economic Development & Other
Environmental Health
Animal Control
Building Control
Building Surveying
Planning
Plumbing
Asset management
Engineering Design
Contract management
Natural Resource Management
Economic Development
Street Lighting
Childcare
Health services
Emergency services
Community Participation
Community Grants
Events
Volunteer programs
Youth services
Customer service
Tourism
Visitor Centres
Recreation facilities
Roads, streets and bridges
Drainage
Civil works
Waste management
= Some scope for improved service levels for a merged council= Greater scope for improved service levels for a merged council
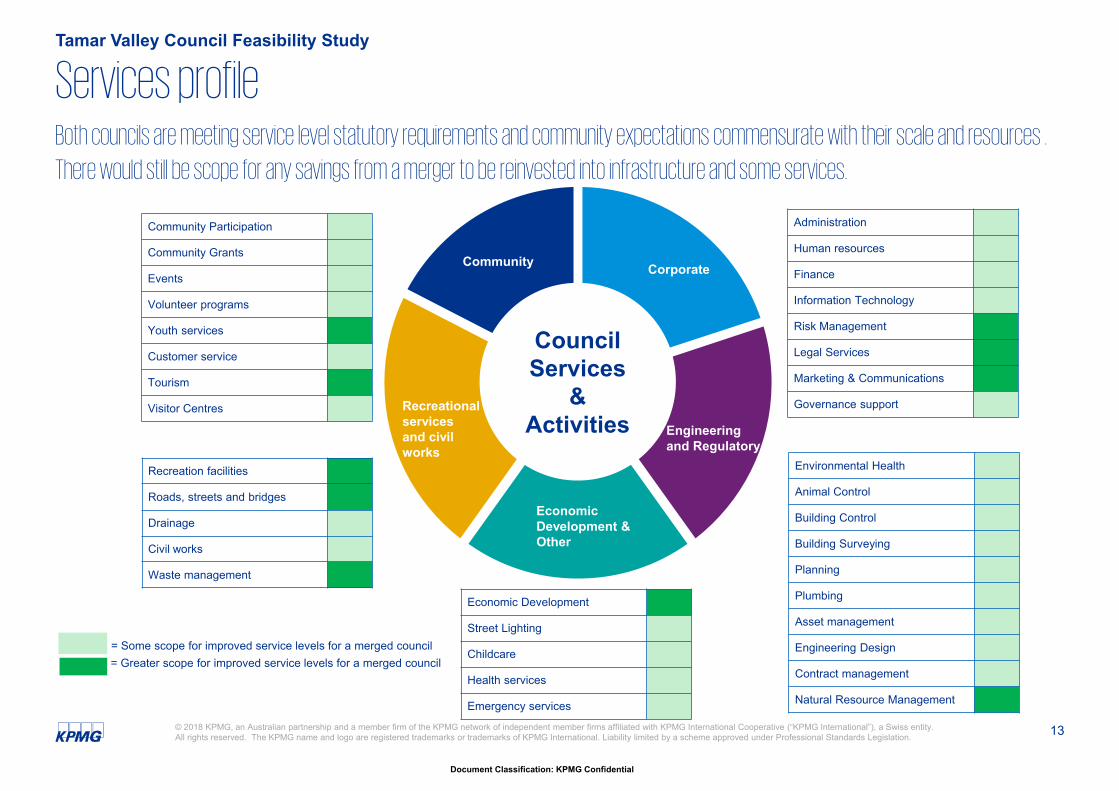
Both councils are meeting service level statutory requirements and community expectations commensurate with their scale and resources .
There would still be scope for any savings from a merger to be reinvested into infrastructure and some services.
14
Document Classification: KPMG Confidential
© 2018 KPMG, an Australian partnership and a member firm of the KPMG network of independent member firms affiliated with KPMG International Cooperative (“KPMG International”), a Swiss entity. All rights reserved. The KPMG name and logo are registered trademarks or trademarks of KPMG International. Liability limited by a scheme approved under Professional Standards Legislation.
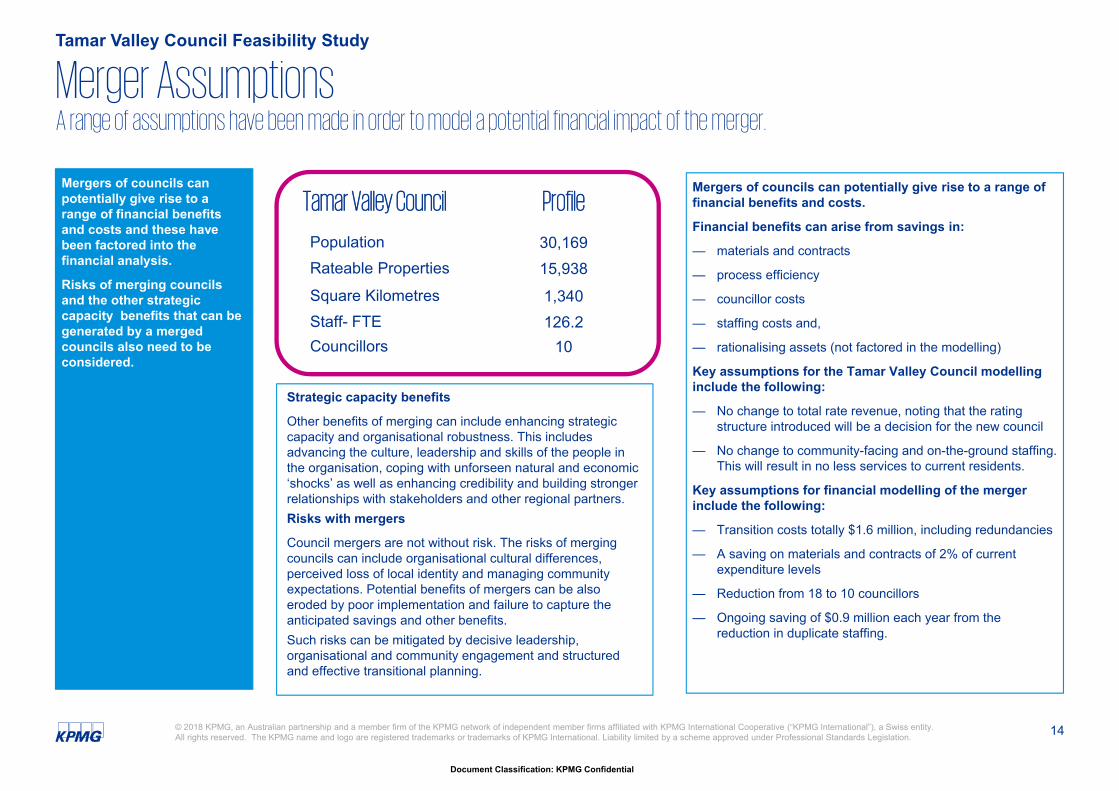
Mergers of councils can potentially give rise to a range of financial benefits and costs and these have been factored into the financial analysis.
Risks of merging councils and the other strategic capacity benefits that can be generated by a merged councils also need to be considered.
Mergers of councils can potentially give rise to a range of financial benefits and costs.
Financial benefits can arise from savings in:
— materials and contracts
— process efficiency
— councillor costs
— staffing costs and,
— rationalising assets (not factored in the modelling)
Key assumptions for the Tamar Valley Council modelling include the following:
— No change to total rate revenue, noting that the rating structure introduced will be a decision for the new council
— No change to community-facing and on-the-ground staffing. This will result in no less services to current residents.
Key assumptions for financial modelling of the merger include the following:
— Transition costs totally $1.6 million, including redundancies
— A saving on materials and contracts of 2% of current expenditure levels
— Reduction from 18 to 10 councillors
— Ongoing saving of $0.9 million each year from the reduction in duplicate staffing.
Merger AssumptionsTamar Valley Council Feasibility Study
Tamar Valley Council Profile
Population 30,169Rateable Properties 15,938Square Kilometres 1,340Staff- FTE 126.2Councillors 10
A range of assumptions have been made in order to model a potential financial impact of the merger.
Strategic capacity benefits
Other benefits of merging can include enhancing strategic capacity and organisational robustness. This includes advancing the culture, leadership and skills of the people in the organisation, coping with unforseen natural and economic ‘shocks’ as well as enhancing credibility and building stronger relationships with stakeholders and other regional partners. Risks with mergers
Council mergers are not without risk. The risks of merging councils can include organisational cultural differences, perceived loss of local identity and managing community expectations. Potential benefits of mergers can be also eroded by poor implementation and failure to capture the anticipated savings and other benefits. Such risks can be mitigated by decisive leadership, organisational and community engagement and structured and effective transitional planning.
15
Document Classification: KPMG Confidential
© 2018 KPMG, an Australian partnership and a member firm of the KPMG network of independent member firms affiliated with KPMG International Cooperative (“KPMG International”), a Swiss entity. All rights reserved. The KPMG name and logo are registered trademarks or trademarks of KPMG International. Liability limited by a scheme approved under Professional Standards Legislation.
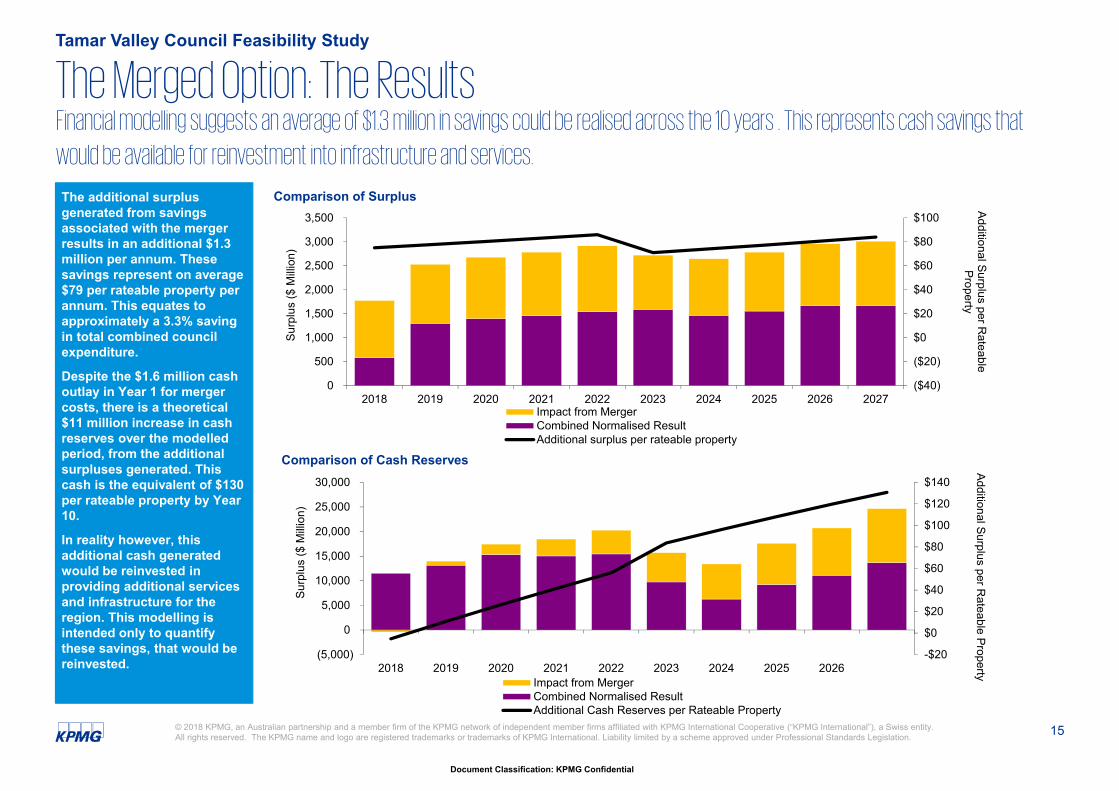
The additional surplus generated from savings associated with the merger results in an additional $1.3 million per annum. These savings represent on average $79 per rateable property per annum. This equates to approximately a 3.3% saving in total combined council expenditure.
Despite the $1.6 million cash outlay in Year 1 for merger costs, there is a theoretical $11 million increase in cash reserves over the modelled period, from the additional surpluses generated. This cash is the equivalent of $130 per rateable property by Year 10.
In reality however, this additional cash generated would be reinvested in providing additional services and infrastructure for the region. This modelling is intended only to quantify these savings, that would be reinvested.
The Merged Option: The ResultsTamar Valley Council Feasibility Study
Financial modelling suggests an average of $1.3 million in savings could be realised across the 10 years . This represents cash savings that
would be available for reinvestment into infrastructure and services.
($40)
($20)
$0
$20
$40
$60
$80
$100
0
500
1,000
1,500
2,000
2,500
3,000
3,500
2018 2019 2020 2021 2022 2023 2024 2025 2026 2027
Additional Surplus per Rateable
Property
Surp
lus
($ M
illion
)
Comparison of Surplus
Impact from MergerCombined Normalised ResultAdditional surplus per rateable property
-$20
$0
$20
$40
$60
$80
$100
$120
$140
(5,000)
0
5,000
10,000
15,000
20,000
25,000
30,000
2018 2019 2020 2021 2022 2023 2024 2025 2026
Additional Surplus per Rateable Property
Surp
lus
($ M
illion
)
Comparison of Cash Reserves
Impact from MergerCombined Normalised ResultAdditional Cash Reserves per Rateable Property
16
Document Classification: KPMG Confidential
© 2018 KPMG, an Australian partnership and a member firm of the KPMG network of independent member firms affiliated with KPMG International Cooperative (“KPMG International”), a Swiss entity. All rights reserved. The KPMG name and logo are registered trademarks or trademarks of KPMG International. Liability limited by a scheme approved under Professional Standards Legislation.
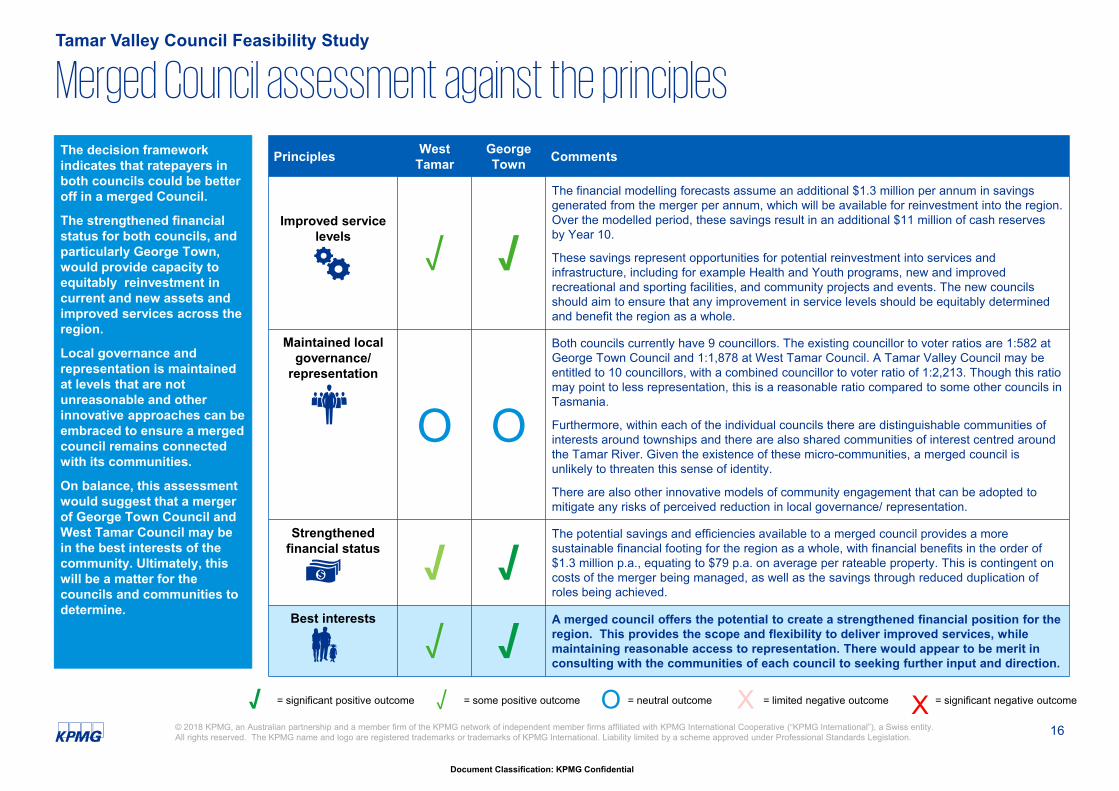
The decision framework indicates that ratepayers in both councils could be better off in a merged Council.
The strengthened financial status for both councils, and particularly George Town, would provide capacity to equitably reinvestment in current and new assets and improved services across the region.
Local governance and representation is maintained at levels that are not unreasonable and other innovative approaches can be embraced to ensure a merged council remains connected with its communities.
On balance, this assessment would suggest that a merger of George Town Council and West Tamar Council may be in the best interests of the community. Ultimately, this will be a matter for the councils and communities to determine.
Merged Council assessment against the principlesTamar Valley Council Feasibility Study
Principles West Tamar
George Town Comments
Improved servicelevels
√ √
The financial modelling forecasts assume an additional $1.3 million per annum in savings generated from the merger per annum, which will be available for reinvestment into the region. Over the modelled period, these savings result in an additional $11 million of cash reserves by Year 10.
These savings represent opportunities for potential reinvestment into services and infrastructure, including for example Health and Youth programs, new and improved recreational and sporting facilities, and community projects and events. The new councils should aim to ensure that any improvement in service levels should be equitably determined and benefit the region as a whole.
Maintained local governance/
representation
O O
Both councils currently have 9 councillors. The existing councillor to voter ratios are 1:582 at George Town Council and 1:1,878 at West Tamar Council. A Tamar Valley Council may be entitled to 10 councillors, with a combined councillor to voter ratio of 1:2,213. Though this ratio may point to less representation, this is a reasonable ratio compared to some other councils in Tasmania.
Furthermore, within each of the individual councils there are distinguishable communities of interests around townships and there are also shared communities of interest centred around the Tamar River. Given the existence of these micro-communities, a merged council is unlikely to threaten this sense of identity.
There are also other innovative models of community engagement that can be adopted to mitigate any risks of perceived reduction in local governance/ representation.
Strengthenedfinancial status √ √
The potential savings and efficiencies available to a merged council provides a more sustainable financial footing for the region as a whole, with financial benefits in the order of $1.3 million p.a., equating to $79 p.a. on average per rateable property. This is contingent on costs of the merger being managed, as well as the savings through reduced duplication of roles being achieved.
Best interests
√ √A merged council offers the potential to create a strengthened financial position for the region. This provides the scope and flexibility to deliver improved services, while maintaining reasonable access to representation. There would appear to be merit in consulting with the communities of each council to seeking further input and direction.
= significant positive outcome = some positive outcome = neutral outcome = limited negative outcome = significant negative outcomeXO X√√
17
Document Classification: KPMG Confidential
© 2018 KPMG, an Australian partnership and a member firm of the KPMG network of independent member firms affiliated with KPMG International Cooperative (“KPMG International”), a Swiss entity. All rights reserved. The KPMG name and logo are registered trademarks or trademarks of KPMG International. Liability limited by a scheme approved under Professional Standards Legislation.
Next StepsTamar Valley Council Feasibility Study
Transition Schedule
Year 1 Year 2 Year 3
Council consideration and community consultation
Board Reviews
Due Diligence
Operating model design
Representation model design
Council decision to
request Local Government
Board Review
Minister/ Governor approval to merge
Local Transition Committee formed
Organisation and representation
design completed
Council election and implementation of designs
New council commences
operation
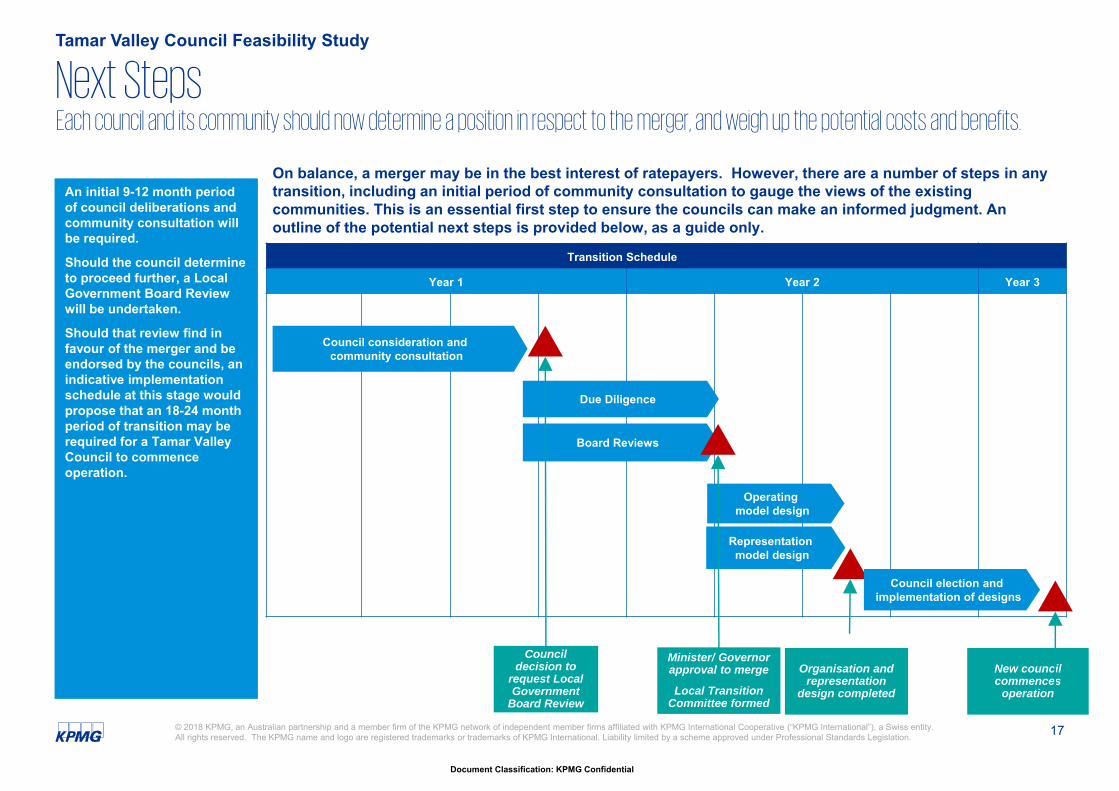
An initial 9-12 month period of council deliberations and community consultation will be required.
Should the council determine to proceed further, a Local Government Board Review will be undertaken.
Should that review find in favour of the merger and be endorsed by the councils, an indicative implementation schedule at this stage would propose that an 18-24 month period of transition may be required for a Tamar Valley Council to commence operation.
On balance, a merger may be in the best interest of ratepayers. However, there are a number of steps in any transition, including an initial period of community consultation to gauge the views of the existing communities. This is an essential first step to ensure the councils can make an informed judgment. An outline of the potential next steps is provided below, as a guide only.
Each council and its community should now determine a position in respect to the merger, and weigh up the potential costs and benefits.
2. Current state assessment
19
Document Classification: KPMG Confidential
© 2018 KPMG, an Australian partnership and a member firm of the KPMG network of independent member firms affiliated with KPMG International Cooperative (“KPMG International”), a Swiss entity. All rights reserved. The KPMG name and logo are registered trademarks or trademarks of KPMG International. Liability limited by a scheme approved under Professional Standards Legislation.
Current state headlinesTamar Valley Council Feasibility Study
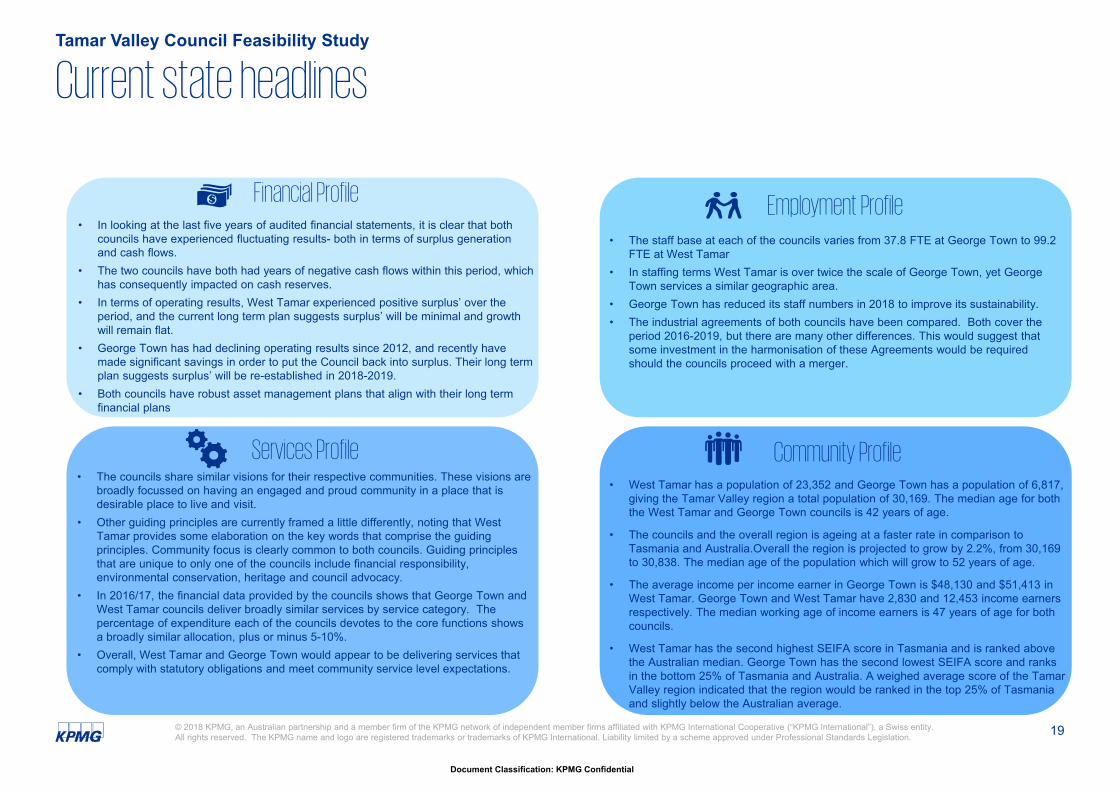
Financial Profile• In looking at the last five years of audited financial statements, it is clear that both
councils have experienced fluctuating results- both in terms of surplus generation and cash flows.
• The two councils have both had years of negative cash flows within this period, which has consequently impacted on cash reserves.
• In terms of operating results, West Tamar experienced positive surplus’ over the period, and the current long term plan suggests surplus’ will be minimal and growth will remain flat.
• George Town has had declining operating results since 2012, and recently have made significant savings in order to put the Council back into surplus. Their long term plan suggests surplus’ will be re-established in 2018-2019.
• Both councils have robust asset management plans that align with their long term financial plans
Community Profile• West Tamar has a population of 23,352 and George Town has a population of 6,817,
giving the Tamar Valley region a total population of 30,169. The median age for both the West Tamar and George Town councils is 42 years of age.
• The councils and the overall region is ageing at a faster rate in comparison to Tasmania and Australia.Overall the region is projected to grow by 2.2%, from 30,169 to 30,838. The median age of the population which will grow to 52 years of age.
• The average income per income earner in George Town is $48,130 and $51,413 in West Tamar. George Town and West Tamar have 2,830 and 12,453 income earners respectively. The median working age of income earners is 47 years of age for both councils.
• West Tamar has the second highest SEIFA score in Tasmania and is ranked above the Australian median. George Town has the second lowest SEIFA score and ranks in the bottom 25% of Tasmania and Australia. A weighed average score of the Tamar Valley region indicated that the region would be ranked in the top 25% of Tasmania and slightly below the Australian average.
Services Profile• The councils share similar visions for their respective communities. These visions are
broadly focussed on having an engaged and proud community in a place that is desirable place to live and visit.
• Other guiding principles are currently framed a little differently, noting that West Tamar provides some elaboration on the key words that comprise the guiding principles. Community focus is clearly common to both councils. Guiding principles that are unique to only one of the councils include financial responsibility, environmental conservation, heritage and council advocacy.
• In 2016/17, the financial data provided by the councils shows that George Town and West Tamar councils deliver broadly similar services by service category. The percentage of expenditure each of the councils devotes to the core functions shows a broadly similar allocation, plus or minus 5-10%.
• Overall, West Tamar and George Town would appear to be delivering services that comply with statutory obligations and meet community service level expectations.
Employment Profile• The staff base at each of the councils varies from 37.8 FTE at George Town to 99.2
FTE at West Tamar• In staffing terms West Tamar is over twice the scale of George Town, yet George
Town services a similar geographic area.• George Town has reduced its staff numbers in 2018 to improve its sustainability.• The industrial agreements of both councils have been compared. Both cover the
period 2016-2019, but there are many other differences. This would suggest that some investment in the harmonisation of these Agreements would be required should the councils proceed with a merger.
2.1 Financial Profile
21
Document Classification: KPMG Confidential
© 2018 KPMG, an Australian partnership and a member firm of the KPMG network of independent member firms affiliated with KPMG International Cooperative (“KPMG International”), a Swiss entity. All rights reserved. The KPMG name and logo are registered trademarks or trademarks of KPMG International. Liability limited by a scheme approved under Professional Standards Legislation.
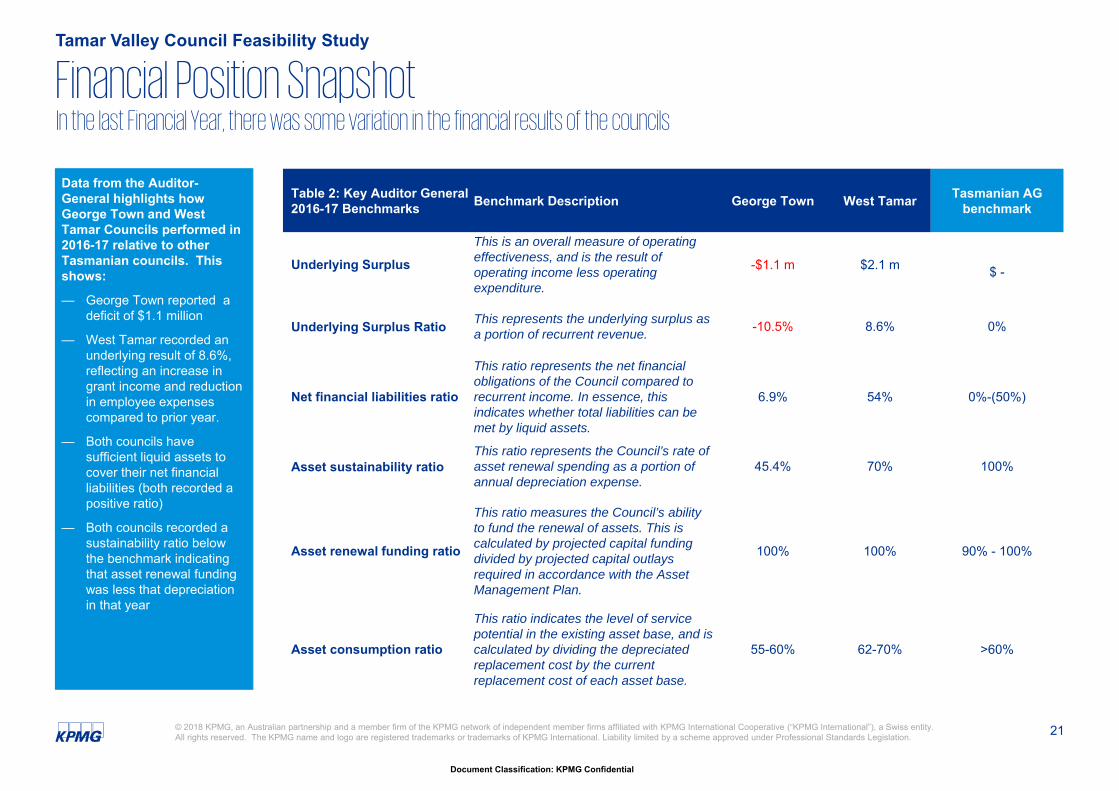
Data from the Auditor-General highlights how George Town and West Tamar Councils performed in 2016-17 relative to other Tasmanian councils. This shows:
— George Town reported a deficit of $1.1 million
— West Tamar recorded an underlying result of 8.6%, reflecting an increase in grant income and reduction in employee expenses compared to prior year.
— Both councils have sufficient liquid assets to cover their net financial liabilities (both recorded a positive ratio)
— Both councils recorded a sustainability ratio below the benchmark indicating that asset renewal funding was less that depreciation in that year
Financial Position SnapshotTamar Valley Council Feasibility Study
Table 2: Key Auditor General 2016-17 Benchmarks Benchmark Description George Town West Tamar Tasmanian AG
benchmark
Underlying Surplus
This is an overall measure of operating effectiveness, and is the result of operating income less operating expenditure.
-$1.1 m $2.1 m $ -
Underlying Surplus Ratio This represents the underlying surplus as a portion of recurrent revenue. -10.5% 8.6% 0%
Net financial liabilities ratio
This ratio represents the net financial obligations of the Council compared to recurrent income. In essence, this indicates whether total liabilities can be met by liquid assets.
6.9% 54% 0%-(50%)
Asset sustainability ratioThis ratio represents the Council’s rate of asset renewal spending as a portion of annual depreciation expense.
45.4% 70% 100%
Asset renewal funding ratio
This ratio measures the Council’s ability to fund the renewal of assets. This is calculated by projected capital funding divided by projected capital outlays required in accordance with the Asset Management Plan.
100% 100% 90% - 100%
Asset consumption ratio
This ratio indicates the level of service potential in the existing asset base, and is calculated by dividing the depreciated replacement cost by the current replacement cost of each asset base.
55-60% 62-70% >60%
In the last Financial Year, there was some variation in the financial results of the councils
22
Document Classification: KPMG Confidential
© 2018 KPMG, an Australian partnership and a member firm of the KPMG network of independent member firms affiliated with KPMG International Cooperative (“KPMG International”), a Swiss entity. All rights reserved. The KPMG name and logo are registered trademarks or trademarks of KPMG International. Liability limited by a scheme approved under Professional Standards Legislation.
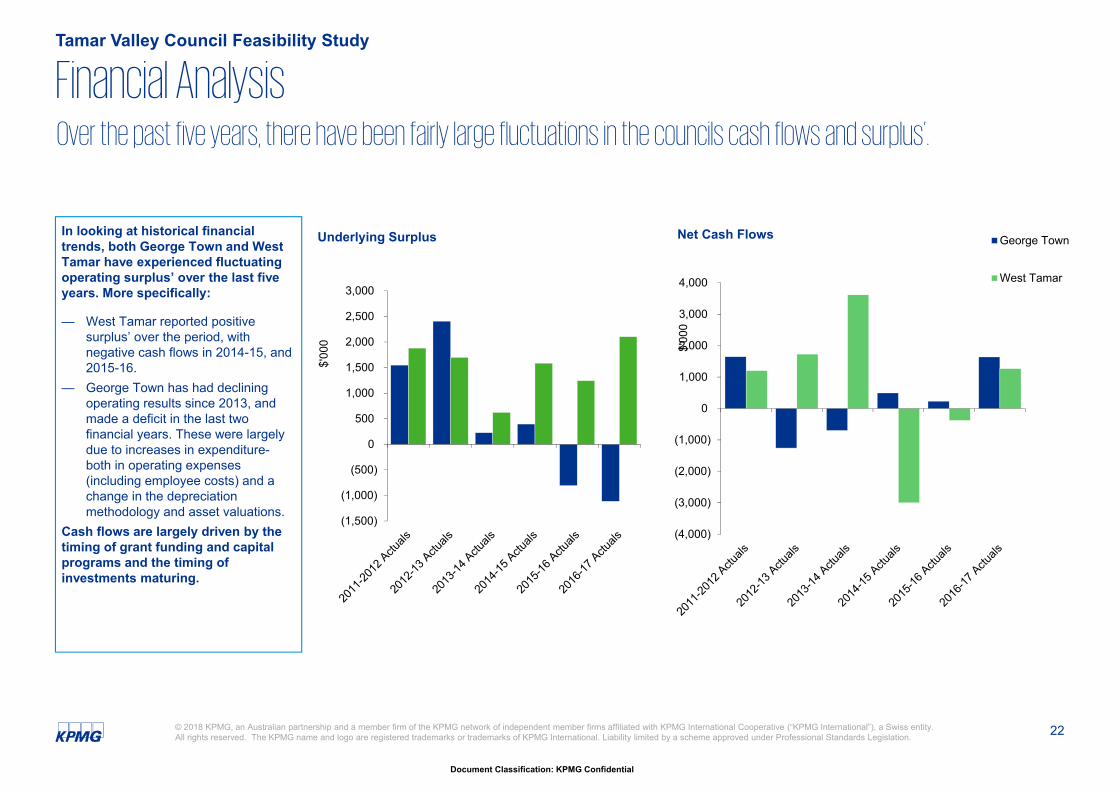
In looking at historical financial trends, both George Town and West Tamar have experienced fluctuating operating surplus’ over the last five years. More specifically:
— West Tamar reported positive surplus’ over the period, with negative cash flows in 2014-15, and 2015-16.
— George Town has had declining operating results since 2013, and made a deficit in the last two financial years. These were largely due to increases in expenditure-both in operating expenses (including employee costs) and a change in the depreciation methodology and asset valuations.
Cash flows are largely driven by the timing of grant funding and capital programs and the timing of investments maturing.
Financial AnalysisTamar Valley Council Feasibility Study
Over the past five years, there have been fairly large fluctuations in the councils cash flows and surplus’.
(1,500)
(1,000)
(500)
0
500
1,000
1,500
2,000
2,500
3,000
$'00
0
Underlying Surplus
(4,000)
(3,000)
(2,000)
(1,000)
0
1,000
2,000
3,000
4,000
$'00
0
Net Cash Flows George Town
West Tamar
23
Document Classification: KPMG Confidential
© 2018 KPMG, an Australian partnership and a member firm of the KPMG network of independent member firms affiliated with KPMG International Cooperative (“KPMG International”), a Swiss entity. All rights reserved. The KPMG name and logo are registered trademarks or trademarks of KPMG International. Liability limited by a scheme approved under Professional Standards Legislation.
(1,500)(1,000)
(500)0
5001,0001,5002,0002,5003,000
$'00
0
Net Surplus: Historical Results & Long Term Financial Plan George TownWest Tamar
Financial AnalysisTamar Valley Council Feasibility Study
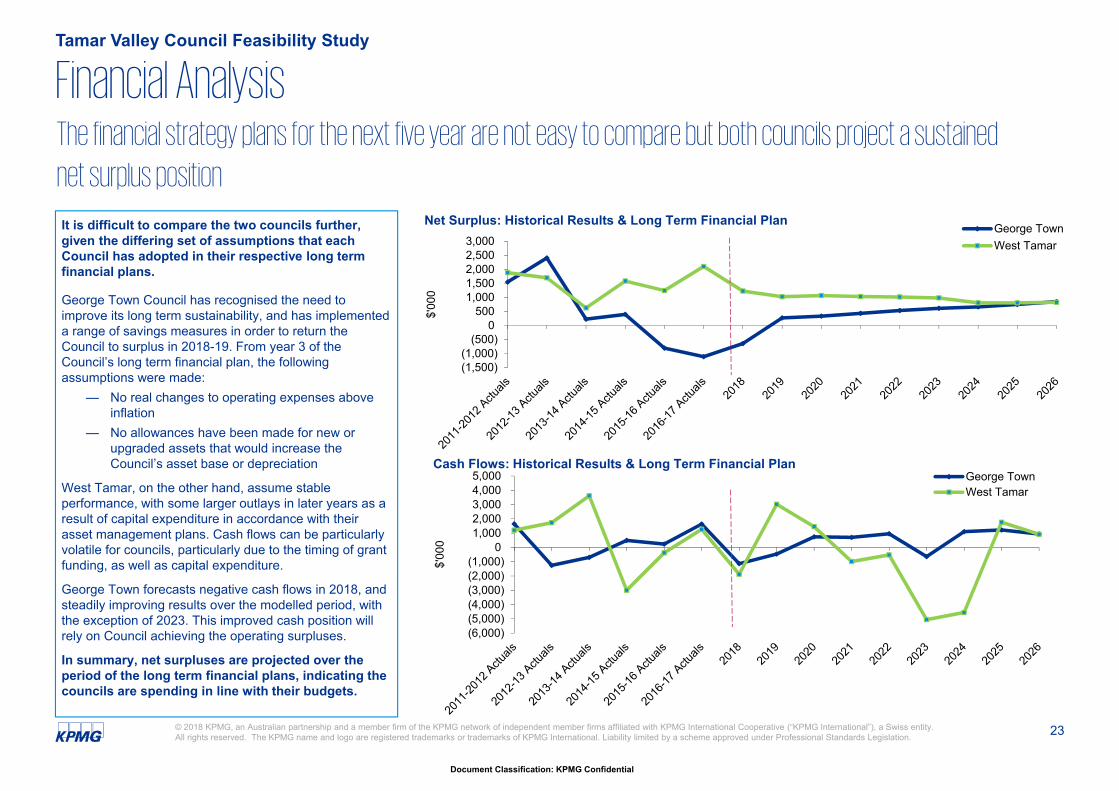
It is difficult to compare the two councils further, given the differing set of assumptions that each Council has adopted in their respective long term financial plans.
George Town Council has recognised the need to improve its long term sustainability, and has implemented a range of savings measures in order to return the Council to surplus in 2018-19. From year 3 of the Council’s long term financial plan, the following assumptions were made:
— No real changes to operating expenses above inflation
— No allowances have been made for new or upgraded assets that would increase the Council’s asset base or depreciation
West Tamar, on the other hand, assume stable performance, with some larger outlays in later years as a result of capital expenditure in accordance with their asset management plans. Cash flows can be particularly volatile for councils, particularly due to the timing of grant funding, as well as capital expenditure.
George Town forecasts negative cash flows in 2018, and steadily improving results over the modelled period, with the exception of 2023. This improved cash position will rely on Council achieving the operating surpluses.
In summary, net surpluses are projected over the period of the long term financial plans, indicating the councils are spending in line with their budgets.
The financial strategy plans for the next five year are not easy to compare but both councils project a sustained
net surplus position
(6,000)(5,000)(4,000)(3,000)(2,000)(1,000)
01,0002,0003,0004,0005,000
$'00
0
Cash Flows: Historical Results & Long Term Financial PlanGeorge TownWest Tamar
24
Document Classification: KPMG Confidential
© 2018 KPMG, an Australian partnership and a member firm of the KPMG network of independent member firms affiliated with KPMG International Cooperative (“KPMG International”), a Swiss entity. All rights reserved. The KPMG name and logo are registered trademarks or trademarks of KPMG International. Liability limited by a scheme approved under Professional Standards Legislation.
Tamar Valley Council Feasibility Study
Financial assumptions
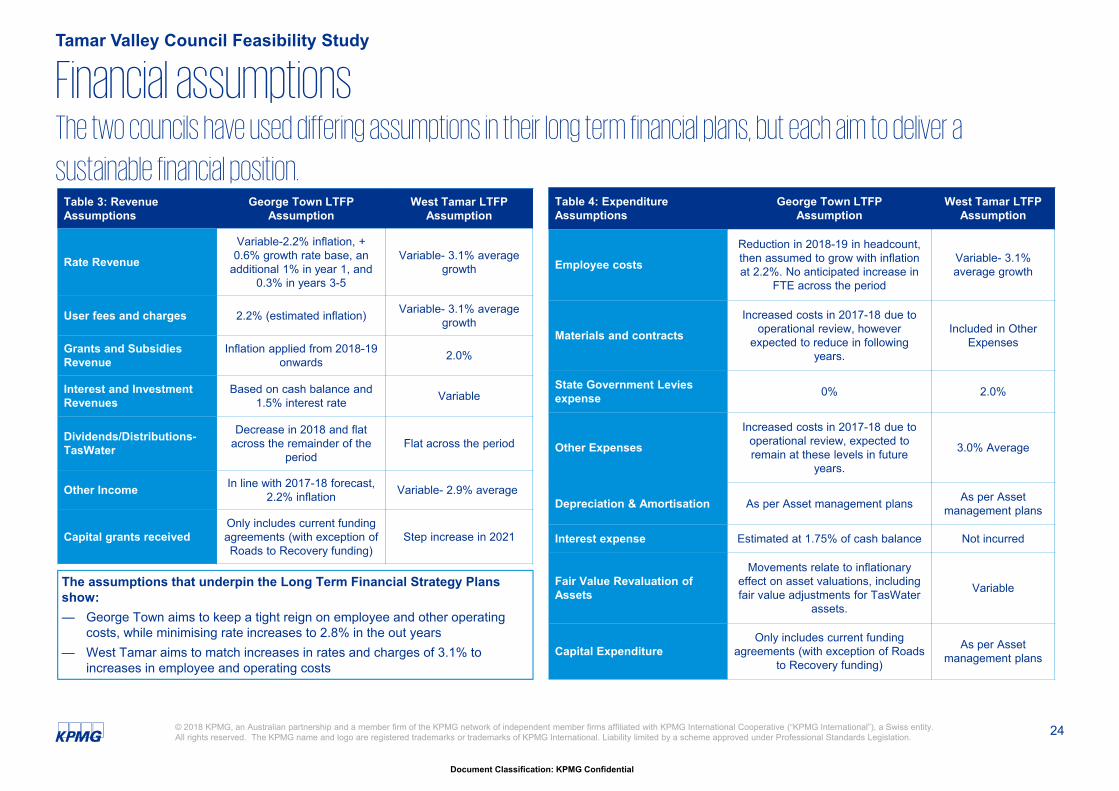
Table 3: Revenue Assumptions
George Town LTFP Assumption
West Tamar LTFPAssumption
Rate Revenue
Variable-2.2% inflation, + 0.6% growth rate base, an
additional 1% in year 1, and 0.3% in years 3-5
Variable- 3.1% average growth
User fees and charges 2.2% (estimated inflation) Variable- 3.1% average growth
Grants and Subsidies Revenue
Inflation applied from 2018-19 onwards 2.0%
Interest and Investment Revenues
Based on cash balance and 1.5% interest rate Variable
Dividends/Distributions-TasWater
Decrease in 2018 and flat across the remainder of the
period Flat across the period
Other Income In line with 2017-18 forecast, 2.2% inflation Variable- 2.9% average
Capital grants receivedOnly includes current funding agreements (with exception of Roads to Recovery funding)
Step increase in 2021
The two councils have used differing assumptions in their long term financial plans, but each aim to deliver a
sustainable financial position. Table 4: Expenditure Assumptions
George Town LTFPAssumption
West Tamar LTFPAssumption
Employee costs
Reduction in 2018-19 in headcount, then assumed to grow with inflation at 2.2%. No anticipated increase in
FTE across the period
Variable- 3.1% average growth
Materials and contracts
Increased costs in 2017-18 due to operational review, however
expected to reduce in following years.
Included in Other Expenses
State Government Levies expense 0% 2.0%
Other Expenses
Increased costs in 2017-18 due to operational review, expected to remain at these levels in future
years.
3.0% Average
Depreciation & Amortisation As per Asset management plans As per Asset management plans
Interest expense Estimated at 1.75% of cash balance Not incurred
Fair Value Revaluation of Assets
Movements relate to inflationary effect on asset valuations, including fair value adjustments for TasWater
assets.
Variable
Capital ExpenditureOnly includes current funding
agreements (with exception of Roads to Recovery funding)
As per Asset management plans
The assumptions that underpin the Long Term Financial Strategy Plans show:— George Town aims to keep a tight reign on employee and other operating
costs, while minimising rate increases to 2.8% in the out years— West Tamar aims to match increases in rates and charges of 3.1% to
increases in employee and operating costs
25
Document Classification: KPMG Confidential
© 2018 KPMG, an Australian partnership and a member firm of the KPMG network of independent member firms affiliated with KPMG International Cooperative (“KPMG International”), a Swiss entity. All rights reserved. The KPMG name and logo are registered trademarks or trademarks of KPMG International. Liability limited by a scheme approved under Professional Standards Legislation.
Tamar Valley Council Feasibility Study
Asset Management
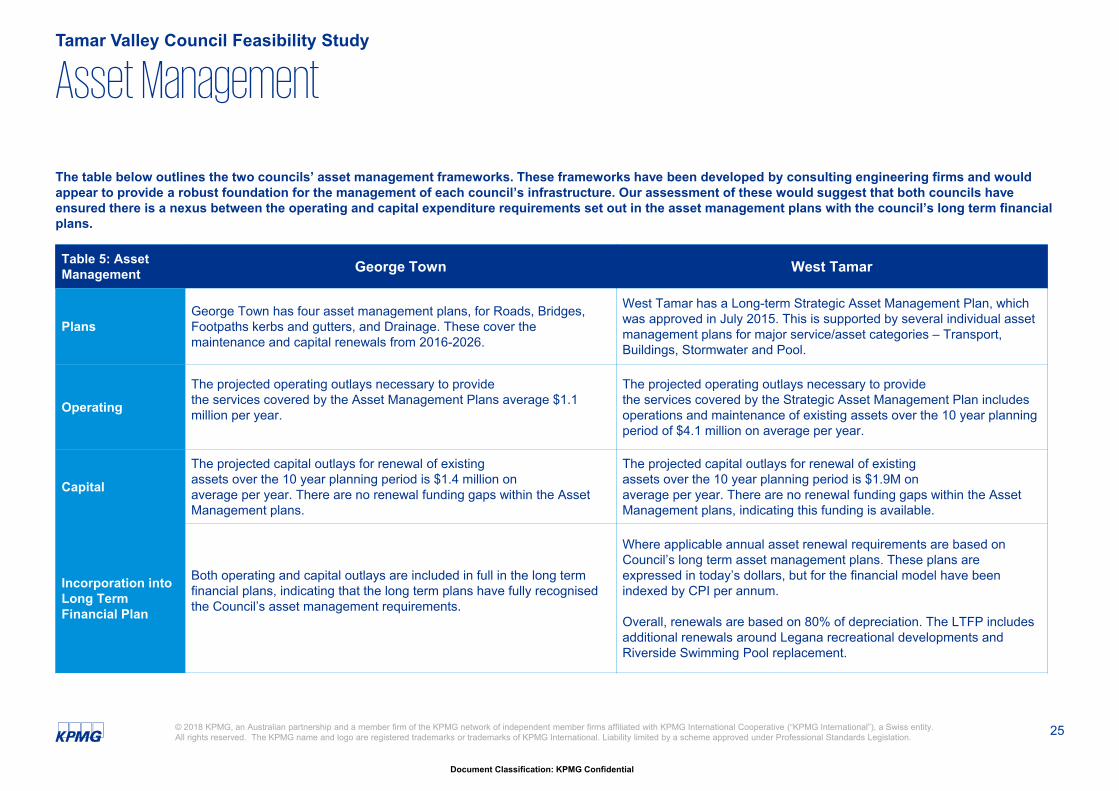
Table 5: Asset Management George Town West Tamar
PlansGeorge Town has four asset management plans, for Roads, Bridges, Footpaths kerbs and gutters, and Drainage. These cover the maintenance and capital renewals from 2016-2026.
West Tamar has a Long-term Strategic Asset Management Plan, which was approved in July 2015. This is supported by several individual asset management plans for major service/asset categories – Transport, Buildings, Stormwater and Pool.
Operating
The projected operating outlays necessary to providethe services covered by the Asset Management Plans average $1.1 million per year.
The projected operating outlays necessary to providethe services covered by the Strategic Asset Management Plan includes operations and maintenance of existing assets over the 10 year planning period of $4.1 million on average per year.
Capital
The projected capital outlays for renewal of existingassets over the 10 year planning period is $1.4 million onaverage per year. There are no renewal funding gaps within the Asset Management plans.
The projected capital outlays for renewal of existingassets over the 10 year planning period is $1.9M onaverage per year. There are no renewal funding gaps within the Asset Management plans, indicating this funding is available.
Incorporation into Long Term Financial Plan
Both operating and capital outlays are included in full in the long term financial plans, indicating that the long term plans have fully recognised the Council’s asset management requirements.
Where applicable annual asset renewal requirements are based on Council’s long term asset management plans. These plans are expressed in today’s dollars, but for the financial model have been indexed by CPI per annum.
Overall, renewals are based on 80% of depreciation. The LTFP includes additional renewals around Legana recreational developments and Riverside Swimming Pool replacement.
The table below outlines the two councils’ asset management frameworks. These frameworks have been developed by consulting engineering firms and would appear to provide a robust foundation for the management of each council’s infrastructure. Our assessment of these would suggest that both councils have ensured there is a nexus between the operating and capital expenditure requirements set out in the asset management plans with the council’s long term financial plans.
2.2 Services Profile
27
Document Classification: KPMG Confidential
© 2018 KPMG, an Australian partnership and a member firm of the KPMG network of independent member firms affiliated with KPMG International Cooperative (“KPMG International”), a Swiss entity. All rights reserved. The KPMG name and logo are registered trademarks or trademarks of KPMG International. Liability limited by a scheme approved under Professional Standards Legislation.
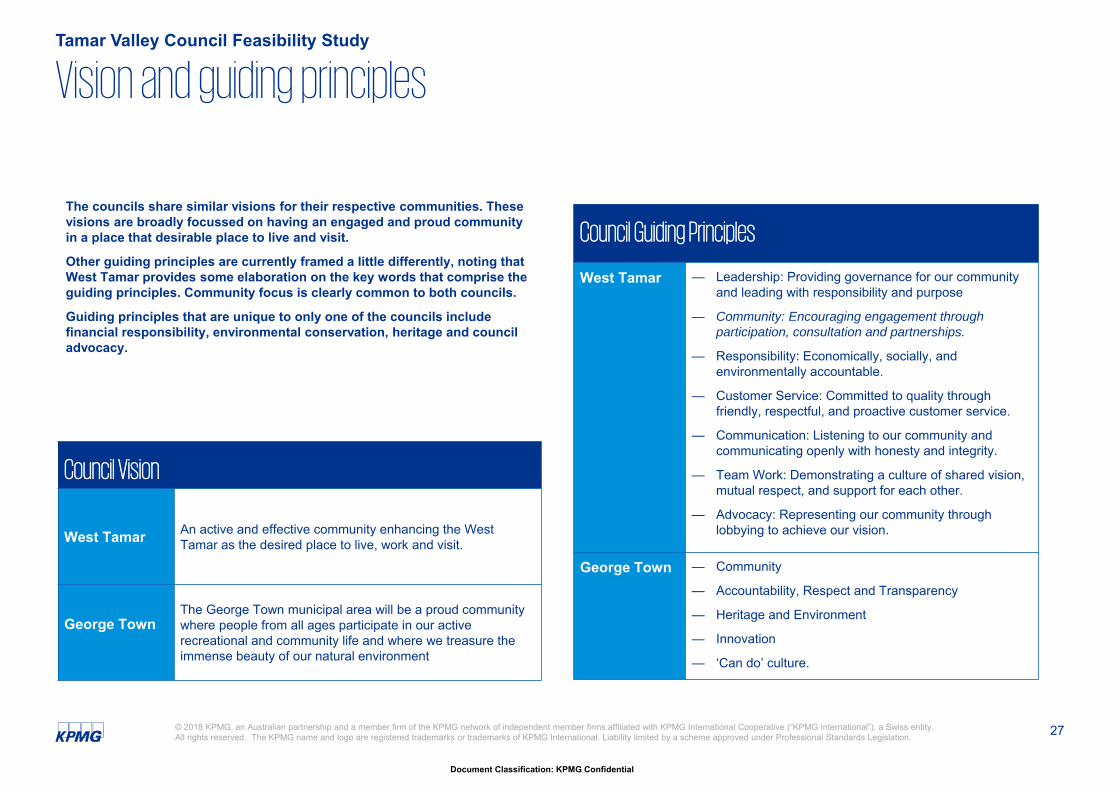
Vision and guiding principlesTamar Valley Council Feasibility Study
Council Guiding Principles
West Tamar — Leadership: Providing governance for our community and leading with responsibility and purpose
— Community: Encouraging engagement through participation, consultation and partnerships.
— Responsibility: Economically, socially, and environmentally accountable.
— Customer Service: Committed to quality through friendly, respectful, and proactive customer service.
— Communication: Listening to our community and communicating openly with honesty and integrity.
— Team Work: Demonstrating a culture of shared vision, mutual respect, and support for each other.
— Advocacy: Representing our community through lobbying to achieve our vision.
George Town — Community
— Accountability, Respect and Transparency
— Heritage and Environment
— Innovation
— ‘Can do’ culture.
The councils share similar visions for their respective communities. These visions are broadly focussed on having an engaged and proud community in a place that desirable place to live and visit.
Other guiding principles are currently framed a little differently, noting that West Tamar provides some elaboration on the key words that comprise the guiding principles. Community focus is clearly common to both councils.
Guiding principles that are unique to only one of the councils include financial responsibility, environmental conservation, heritage and council advocacy.
Council Vision
West Tamar An active and effective community enhancing the West Tamar as the desired place to live, work and visit.
George TownThe George Town municipal area will be a proud community where people from all ages participate in our active recreational and community life and where we treasure the immense beauty of our natural environment
28
Document Classification: KPMG Confidential
© 2018 KPMG, an Australian partnership and a member firm of the KPMG network of independent member firms affiliated with KPMG International Cooperative (“KPMG International”), a Swiss entity. All rights reserved. The KPMG name and logo are registered trademarks or trademarks of KPMG International. Liability limited by a scheme approved under Professional Standards Legislation.
Services profileTamar Valley Council Feasibility Study
Administration
Human resources
Finance
Information Technology
Risk Management
Legal Services
Marketing & Communications
Governance support
Council Services
& Activities
Corporate
Engineeringand Regulatory
Community
Recreational services and civil works
Economic Development & Other
Environmental Health
Animal Control
Building Control
Building Surveying
Planning
Plumbing
Asset management
Engineering Design
Contract management
Natural Resource management
Economic Development
Street Lighting
Childcare
Health services
Emergency services
Community Participation
Community Grants
Events
Volunteer programs
Youth services
Customer service
Tourism
Visitor Centres
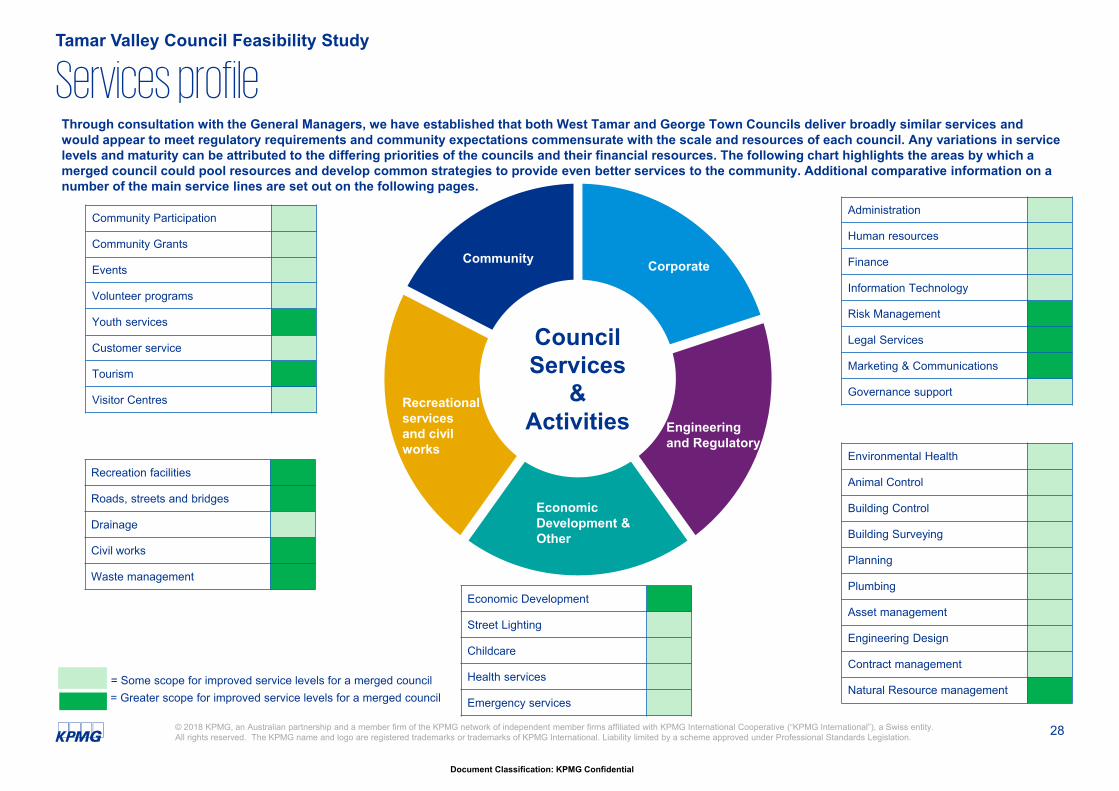
Through consultation with the General Managers, we have established that both West Tamar and George Town Councils deliver broadly similar services and would appear to meet regulatory requirements and community expectations commensurate with the scale and resources of each council. Any variations in service levels and maturity can be attributed to the differing priorities of the councils and their financial resources. The following chart highlights the areas by which a merged council could pool resources and develop common strategies to provide even better services to the community. Additional comparative information on a number of the main service lines are set out on the following pages.
Recreation facilities
Roads, streets and bridges
Drainage
Civil works
Waste management
= Some scope for improved service levels for a merged council= Greater scope for improved service levels for a merged council
29
Document Classification: KPMG Confidential
© 2018 KPMG, an Australian partnership and a member firm of the KPMG network of independent member firms affiliated with KPMG International Cooperative (“KPMG International”), a Swiss entity. All rights reserved. The KPMG name and logo are registered trademarks or trademarks of KPMG International. Liability limited by a scheme approved under Professional Standards Legislation.
Governance, corporate services & other
28%
Regulatory Services
11%Infrastructure
35%
Waste Management
9%
Community17%
George Town Council Expenditure by Function- Annual Report 2016/17
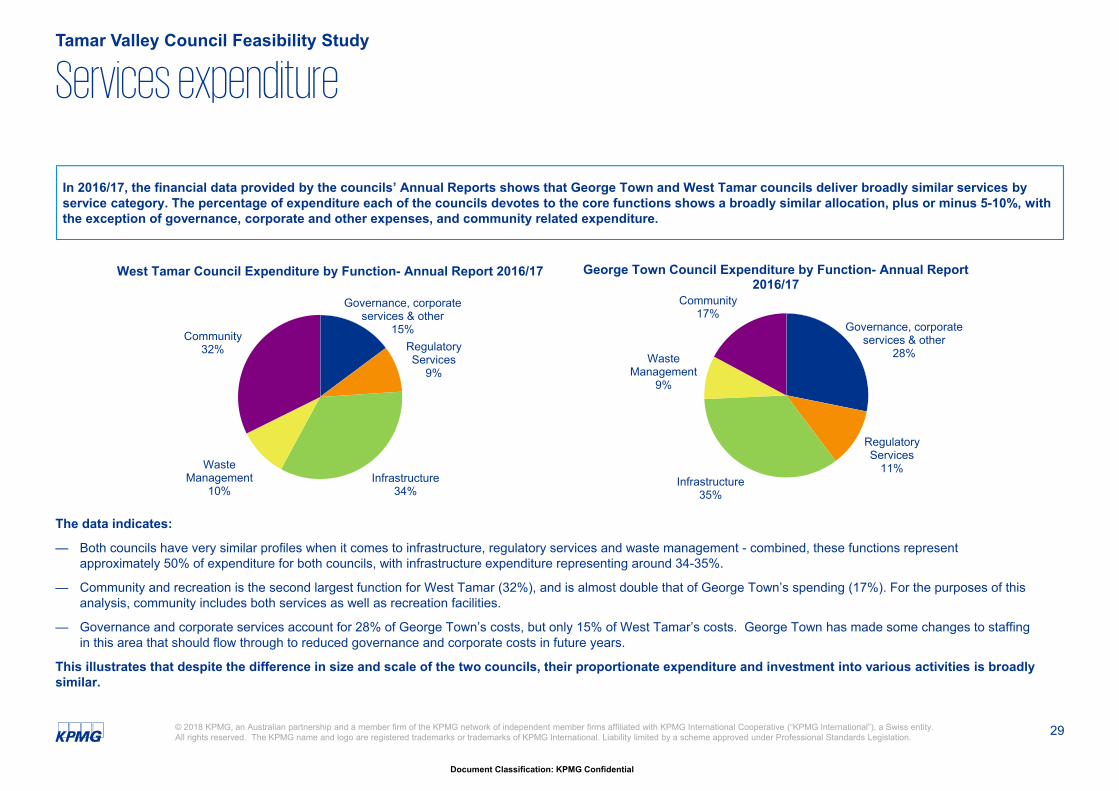
In 2016/17, the financial data provided by the councils’ Annual Reports shows that George Town and West Tamar councils deliver broadly similar services by service category. The percentage of expenditure each of the councils devotes to the core functions shows a broadly similar allocation, plus or minus 5-10%, with the exception of governance, corporate and other expenses, and community related expenditure.
Services expenditureTamar Valley Council Feasibility Study
The data indicates:
— Both councils have very similar profiles when it comes to infrastructure, regulatory services and waste management - combined, these functions represent approximately 50% of expenditure for both councils, with infrastructure expenditure representing around 34-35%.
— Community and recreation is the second largest function for West Tamar (32%), and is almost double that of George Town’s spending (17%). For the purposes of this analysis, community includes both services as well as recreation facilities.
— Governance and corporate services account for 28% of George Town’s costs, but only 15% of West Tamar’s costs. George Town has made some changes to staffing in this area that should flow through to reduced governance and corporate costs in future years.
This illustrates that despite the difference in size and scale of the two councils, their proportionate expenditure and investment into various activities is broadly similar.
Governance, corporate services & other
15%Regulatory Services
9%
Infrastructure34%
Waste Management
10%
Community32%
West Tamar Council Expenditure by Function- Annual Report 2016/17
30
Document Classification: KPMG Confidential
© 2018 KPMG, an Australian partnership and a member firm of the KPMG network of independent member firms affiliated with KPMG International Cooperative (“KPMG International”), a Swiss entity. All rights reserved. The KPMG name and logo are registered trademarks or trademarks of KPMG International. Liability limited by a scheme approved under Professional Standards Legislation.
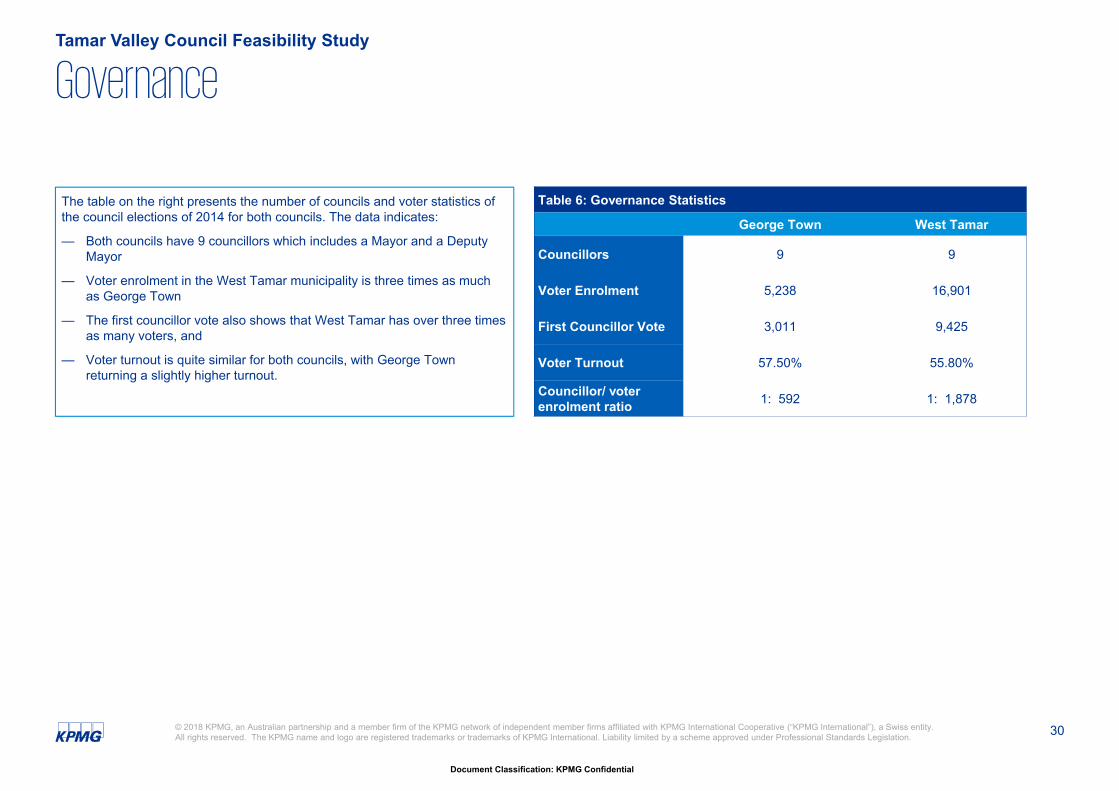
The table on the right presents the number of councils and voter statistics of the council elections of 2014 for both councils. The data indicates:
— Both councils have 9 councillors which includes a Mayor and a Deputy Mayor
— Voter enrolment in the West Tamar municipality is three times as much as George Town
— The first councillor vote also shows that West Tamar has over three times as many voters, and
— Voter turnout is quite similar for both councils, with George Town returning a slightly higher turnout.
GovernanceTamar Valley Council Feasibility Study
Table 6: Governance Statistics
George Town West Tamar
Councillors 9 9
Voter Enrolment 5,238 16,901
First Councillor Vote 3,011 9,425
Voter Turnout 57.50% 55.80%
Councillor/ voter enrolment ratio 1: 592 1: 1,878
31
Document Classification: KPMG Confidential
© 2018 KPMG, an Australian partnership and a member firm of the KPMG network of independent member firms affiliated with KPMG International Cooperative (“KPMG International”), a Swiss entity. All rights reserved. The KPMG name and logo are registered trademarks or trademarks of KPMG International. Liability limited by a scheme approved under Professional Standards Legislation.
Planning and Building
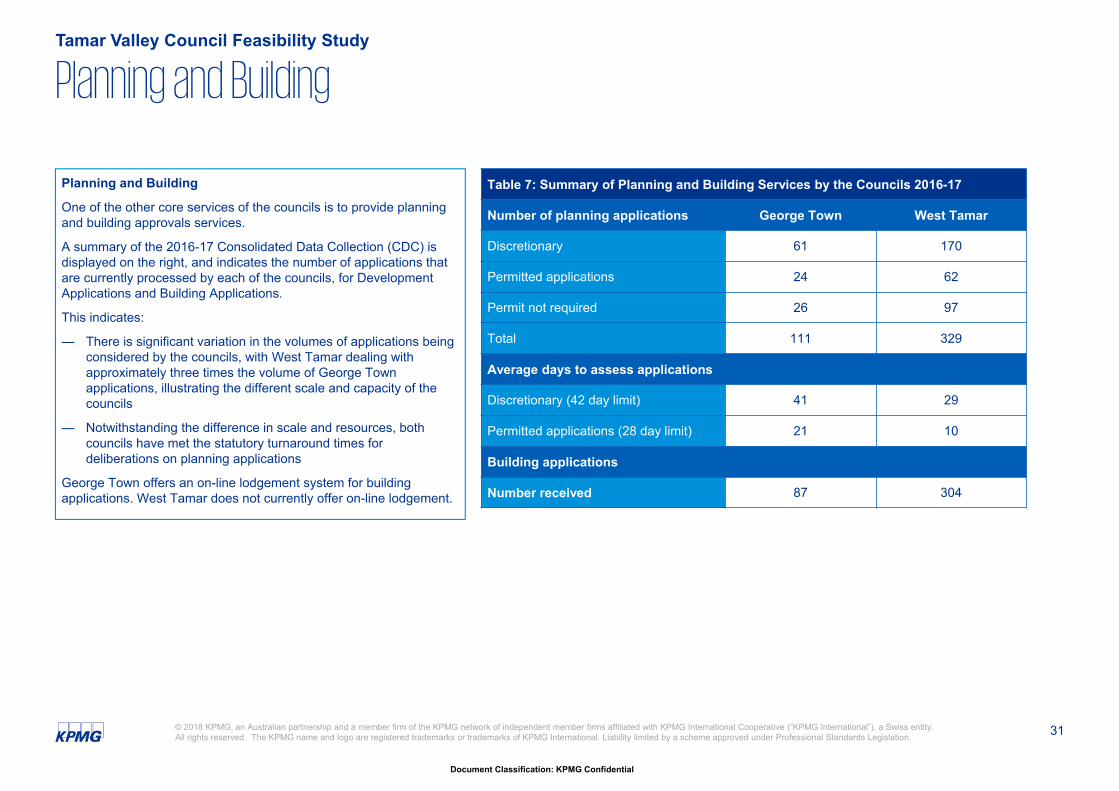
One of the other core services of the councils is to provide planning and building approvals services.
A summary of the 2016-17 Consolidated Data Collection (CDC) is displayed on the right, and indicates the number of applications that are currently processed by each of the councils, for Development Applications and Building Applications.
This indicates:
— There is significant variation in the volumes of applications being considered by the councils, with West Tamar dealing with approximately three times the volume of George Town applications, illustrating the different scale and capacity of the councils
— Notwithstanding the difference in scale and resources, both councils have met the statutory turnaround times for deliberations on planning applications
George Town offers an on-line lodgement system for building applications. West Tamar does not currently offer on-line lodgement.
Planning and BuildingTamar Valley Council Feasibility Study
Table 7: Summary of Planning and Building Services by the Councils 2016-17
Number of planning applications George Town West Tamar
Discretionary 61 170
Permitted applications 24 62
Permit not required 26 97
Total 111 329
Average days to assess applications
Discretionary (42 day limit) 41 29
Permitted applications (28 day limit) 21 10
Building applications
Number received 87 304
32
Document Classification: KPMG Confidential
© 2018 KPMG, an Australian partnership and a member firm of the KPMG network of independent member firms affiliated with KPMG International Cooperative (“KPMG International”), a Swiss entity. All rights reserved. The KPMG name and logo are registered trademarks or trademarks of KPMG International. Liability limited by a scheme approved under Professional Standards Legislation.
Tamar Valley Council Feasibility Study
Infrastructure
Table 8: Infrastructure Profile George Town West Tamar Total
Assets
Number of assets by category:
- Buildings 55 109 164
- Roads: comprising 182 465 647
- Sealed (kms) 90 312 402
- Unsealed (kms) 92 154 246
- Bridges & Culverts 55 49 104
- Stormwater
- Pipes (kms) 46 150 196
- Inlets/Outlets/Pits 460 11,528 11,988
- Park assets 56 194 250
- Plant and Machinery 236 170 406
- Furniture, Fittings & Office Equipment 107 233 340
- Land 83 537 620
- Intangibles 5 15 20
- Number of design briefs p.a. 10 22 32
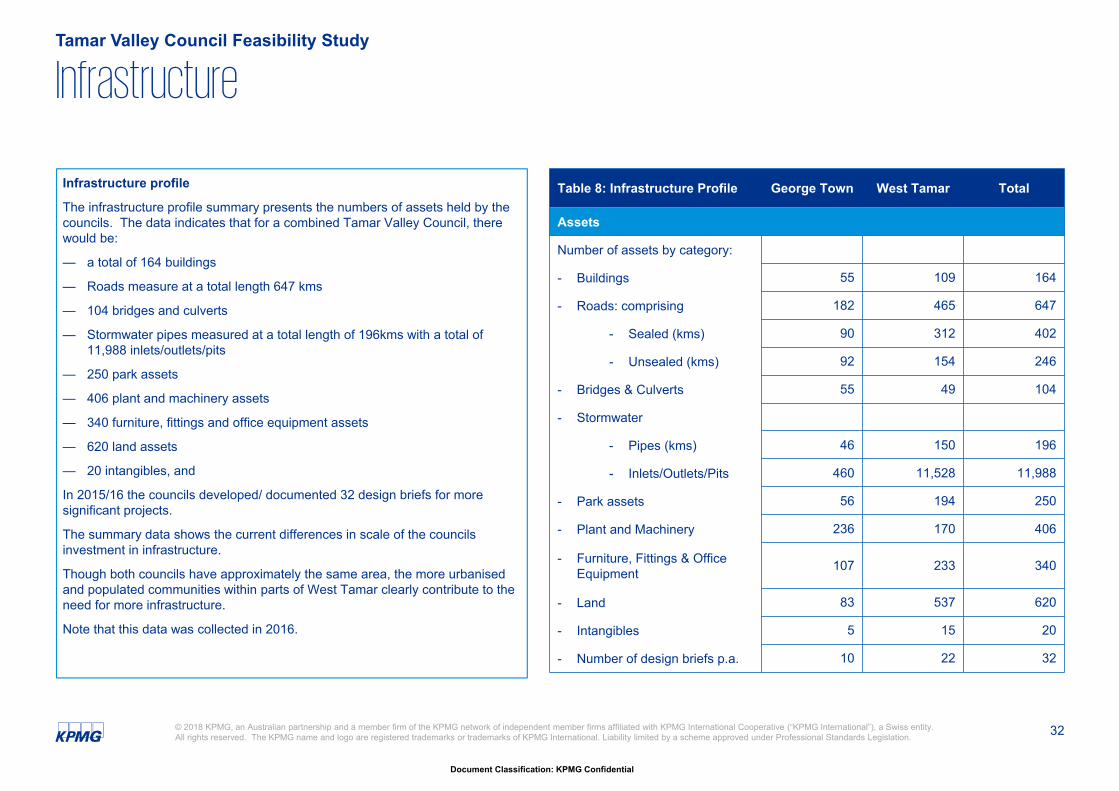
Infrastructure profile
The infrastructure profile summary presents the numbers of assets held by the councils. The data indicates that for a combined Tamar Valley Council, there would be:
— a total of 164 buildings
— Roads measure at a total length 647 kms
— 104 bridges and culverts
— Stormwater pipes measured at a total length of 196kms with a total of 11,988 inlets/outlets/pits
— 250 park assets
— 406 plant and machinery assets
— 340 furniture, fittings and office equipment assets
— 620 land assets
— 20 intangibles, and
In 2015/16 the councils developed/ documented 32 design briefs for more significant projects.
The summary data shows the current differences in scale of the councils investment in infrastructure.
Though both councils have approximately the same area, the more urbanised and populated communities within parts of West Tamar clearly contribute to the need for more infrastructure.
Note that this data was collected in 2016.
33
Document Classification: KPMG Confidential
© 2018 KPMG, an Australian partnership and a member firm of the KPMG network of independent member firms affiliated with KPMG International Cooperative (“KPMG International”), a Swiss entity. All rights reserved. The KPMG name and logo are registered trademarks or trademarks of KPMG International. Liability limited by a scheme approved under Professional Standards Legislation.
IT Infrastructure & SystemsTamar Valley Council Feasibility Study
Table 9: IT Infrastructure and Systems
AreaGeorge Town West Tamar
On Premises SOAS / Third Party On Premises SOAS / Third Party
Finance Civica Authority IT Vision SoftwareMagiq Software
Payroll Civica Authority IT Vision Software
Human Resources Manual Spreadsheets ECM Dataworks for records IT Vision SoftwareManual Systems
Risk Management Manual Forms, Excel Files IT Vision SoftwareManual Systems
Legal Hard Copy FilesECM Electronic Records
IT Vision SoftwareManual Systems
Engineering Services Civica Authority IT Vision SoftwareManual Systems
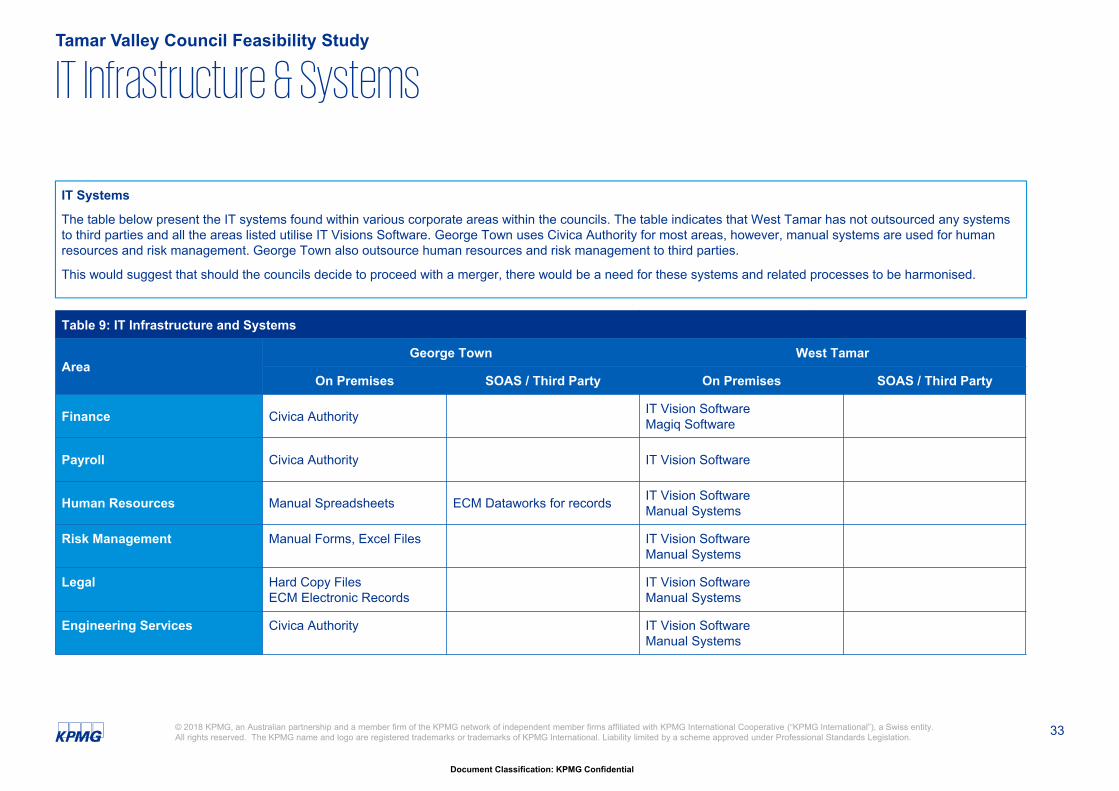
IT Systems
The table below present the IT systems found within various corporate areas within the councils. The table indicates that West Tamar has not outsourced any systems to third parties and all the areas listed utilise IT Visions Software. George Town uses Civica Authority for most areas, however, manual systems are used for human resources and risk management. George Town also outsource human resources and risk management to third parties.
This would suggest that should the councils decide to proceed with a merger, there would be a need for these systems and related processes to be harmonised.
34
Document Classification: KPMG Confidential
© 2018 KPMG, an Australian partnership and a member firm of the KPMG network of independent member firms affiliated with KPMG International Cooperative (“KPMG International”), a Swiss entity. All rights reserved. The KPMG name and logo are registered trademarks or trademarks of KPMG International. Liability limited by a scheme approved under Professional Standards Legislation.
IT Infrastructure & SystemsTamar Valley Council Feasibility Study
Table 10: IT Staffing & Spend George Town West Tamar
Total Current FTE 0.7 2.0
- Management 0.2 0.8
- Network 0.3 0.5
- Infrastructure 0.1 0.5
- Applications 0.1 0.2
Current Location Anne Street Beaconsfield; Riverside
Financial Spend (p.a.)
OPEX
- Salaries $28,321 $250,000
- Overheads $50,000
- Materials and contracts $100,831 $242,000
- Other $70,606 $1,500
TOTAL OPEX $199,758 $543,500
Planned Capex
- 2017/18 $50,000 $125,000
- 2018/19 $100,000
- 2019/20
Total CAPEX $50,000 $225,000
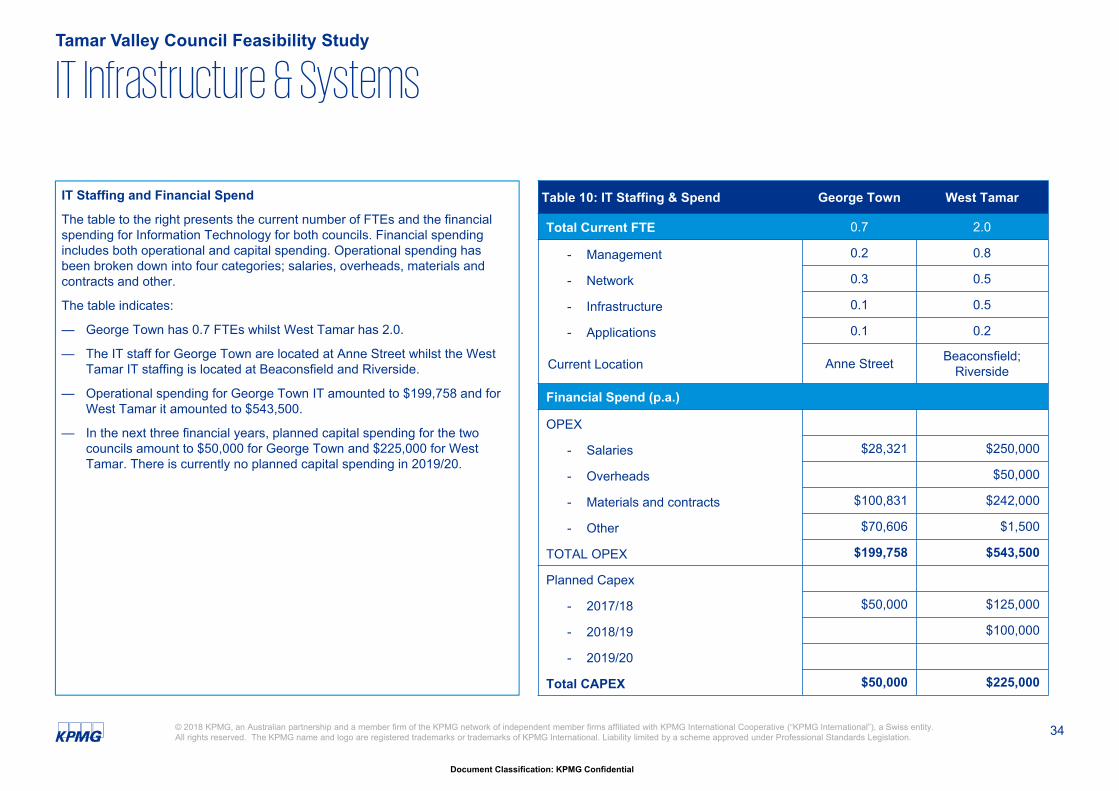
IT Staffing and Financial Spend
The table to the right presents the current number of FTEs and the financial spending for Information Technology for both councils. Financial spending includes both operational and capital spending. Operational spending has been broken down into four categories; salaries, overheads, materials and contracts and other.
The table indicates:
— George Town has 0.7 FTEs whilst West Tamar has 2.0.
— The IT staff for George Town are located at Anne Street whilst the West Tamar IT staffing is located at Beaconsfield and Riverside.
— Operational spending for George Town IT amounted to $199,758 and for West Tamar it amounted to $543,500.
— In the next three financial years, planned capital spending for the two councils amount to $50,000 for George Town and $225,000 for West Tamar. There is currently no planned capital spending in 2019/20.
35
Document Classification: KPMG Confidential
© 2018 KPMG, an Australian partnership and a member firm of the KPMG network of independent member firms affiliated with KPMG International Cooperative (“KPMG International”), a Swiss entity. All rights reserved. The KPMG name and logo are registered trademarks or trademarks of KPMG International. Liability limited by a scheme approved under Professional Standards Legislation.
IT Infrastructure & SystemsTamar Valley Council Feasibility Study
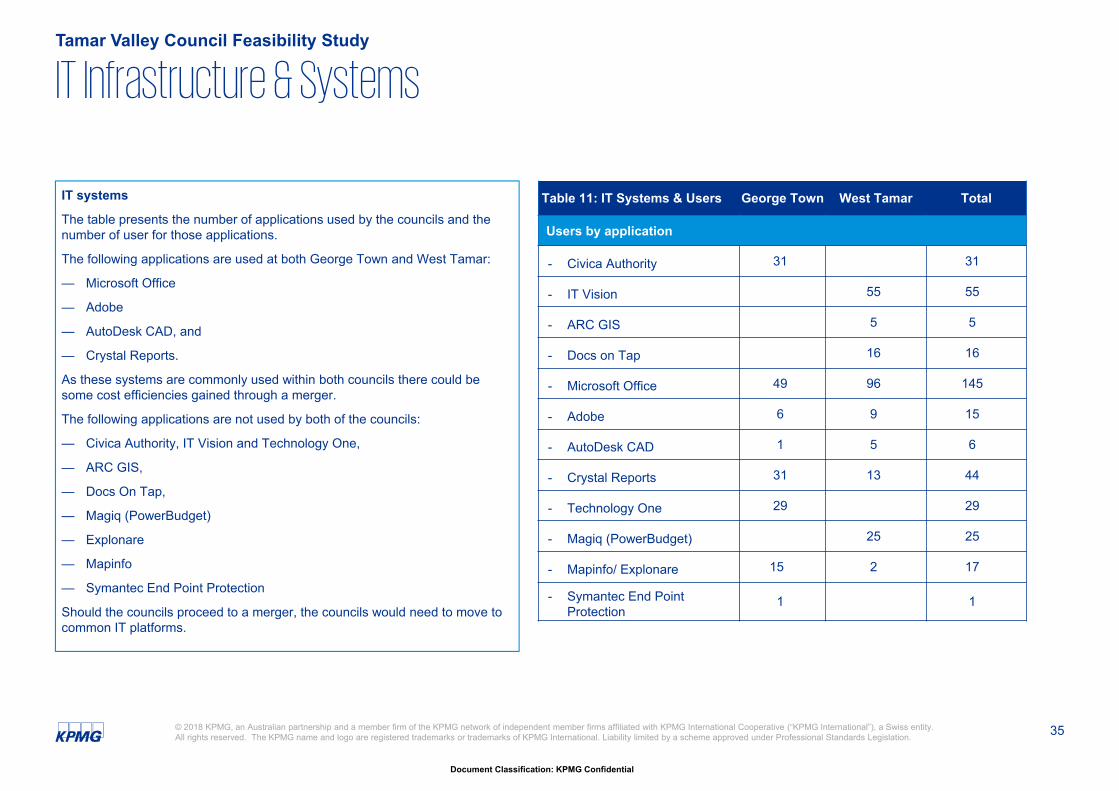
IT systems
The table presents the number of applications used by the councils and the number of user for those applications.
The following applications are used at both George Town and West Tamar:
— Microsoft Office
— Adobe
— AutoDesk CAD, and
— Crystal Reports.
As these systems are commonly used within both councils there could be some cost efficiencies gained through a merger.
The following applications are not used by both of the councils:
— Civica Authority, IT Vision and Technology One,
— ARC GIS,
— Docs On Tap,
— Magiq (PowerBudget)
— Explonare
— Mapinfo
— Symantec End Point Protection
Should the councils proceed to a merger, the councils would need to move to common IT platforms.
Table 11: IT Systems & Users George Town West Tamar Total
Users by application
- Civica Authority 31 31
- IT Vision 55 55
- ARC GIS 5 5
- Docs on Tap 16 16
- Microsoft Office 49 96 145
- Adobe 6 9 15
- AutoDesk CAD 1 5 6
- Crystal Reports 31 13 44
- Technology One 29 29
- Magiq (PowerBudget) 25 25
- Mapinfo/ Explonare 15 2 17
- Symantec End Point Protection
1 1
36
Document Classification: KPMG Confidential
© 2018 KPMG, an Australian partnership and a member firm of the KPMG network of independent member firms affiliated with KPMG International Cooperative (“KPMG International”), a Swiss entity. All rights reserved. The KPMG name and logo are registered trademarks or trademarks of KPMG International. Liability limited by a scheme approved under Professional Standards Legislation.
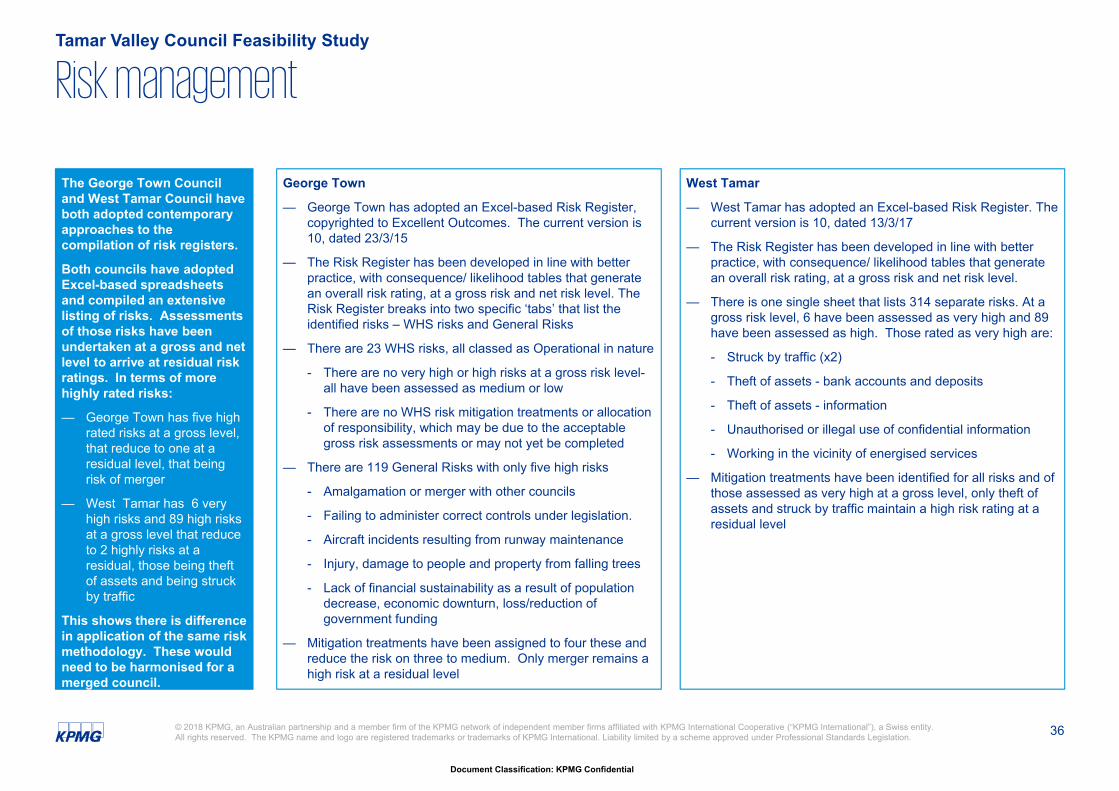
The George Town Council and West Tamar Council have both adopted contemporary approaches to the compilation of risk registers.
Both councils have adopted Excel-based spreadsheets and compiled an extensive listing of risks. Assessments of those risks have been undertaken at a gross and net level to arrive at residual risk ratings. In terms of more highly rated risks:
— George Town has five high rated risks at a gross level, that reduce to one at a residual level, that being risk of merger
— West Tamar has 6 very high risks and 89 high risks at a gross level that reduce to 2 highly risks at a residual, those being theft of assets and being struck by traffic
This shows there is difference in application of the same risk methodology. These would need to be harmonised for a merged council.
George Town
— George Town has adopted an Excel-based Risk Register, copyrighted to Excellent Outcomes. The current version is 10, dated 23/3/15
— The Risk Register has been developed in line with better practice, with consequence/ likelihood tables that generate an overall risk rating, at a gross risk and net risk level. The Risk Register breaks into two specific ‘tabs’ that list the identified risks – WHS risks and General Risks
— There are 23 WHS risks, all classed as Operational in nature
- There are no very high or high risks at a gross risk level-all have been assessed as medium or low
- There are no WHS risk mitigation treatments or allocation of responsibility, which may be due to the acceptable gross risk assessments or may not yet be completed
— There are 119 General Risks with only five high risks
- Amalgamation or merger with other councils
- Failing to administer correct controls under legislation.
- Aircraft incidents resulting from runway maintenance
- Injury, damage to people and property from falling trees
- Lack of financial sustainability as a result of population decrease, economic downturn, loss/reduction of government funding
— Mitigation treatments have been assigned to four these and reduce the risk on three to medium. Only merger remains a high risk at a residual level
West Tamar
— West Tamar has adopted an Excel-based Risk Register. The current version is 10, dated 13/3/17
— The Risk Register has been developed in line with better practice, with consequence/ likelihood tables that generate an overall risk rating, at a gross risk and net risk level.
— There is one single sheet that lists 314 separate risks. At a gross risk level, 6 have been assessed as very high and 89 have been assessed as high. Those rated as very high are:
- Struck by traffic (x2)
- Theft of assets - bank accounts and deposits
- Theft of assets - information
- Unauthorised or illegal use of confidential information
- Working in the vicinity of energised services
— Mitigation treatments have been identified for all risks and of those assessed as very high at a gross level, only theft of assets and struck by traffic maintain a high risk rating at a residual level
Risk managementTamar Valley Council Feasibility Study
2.3 Employment Profile
38
Document Classification: KPMG Confidential
© 2018 KPMG, an Australian partnership and a member firm of the KPMG network of independent member firms affiliated with KPMG International Cooperative (“KPMG International”), a Swiss entity. All rights reserved. The KPMG name and logo are registered trademarks or trademarks of KPMG International. Liability limited by a scheme approved under Professional Standards Legislation.
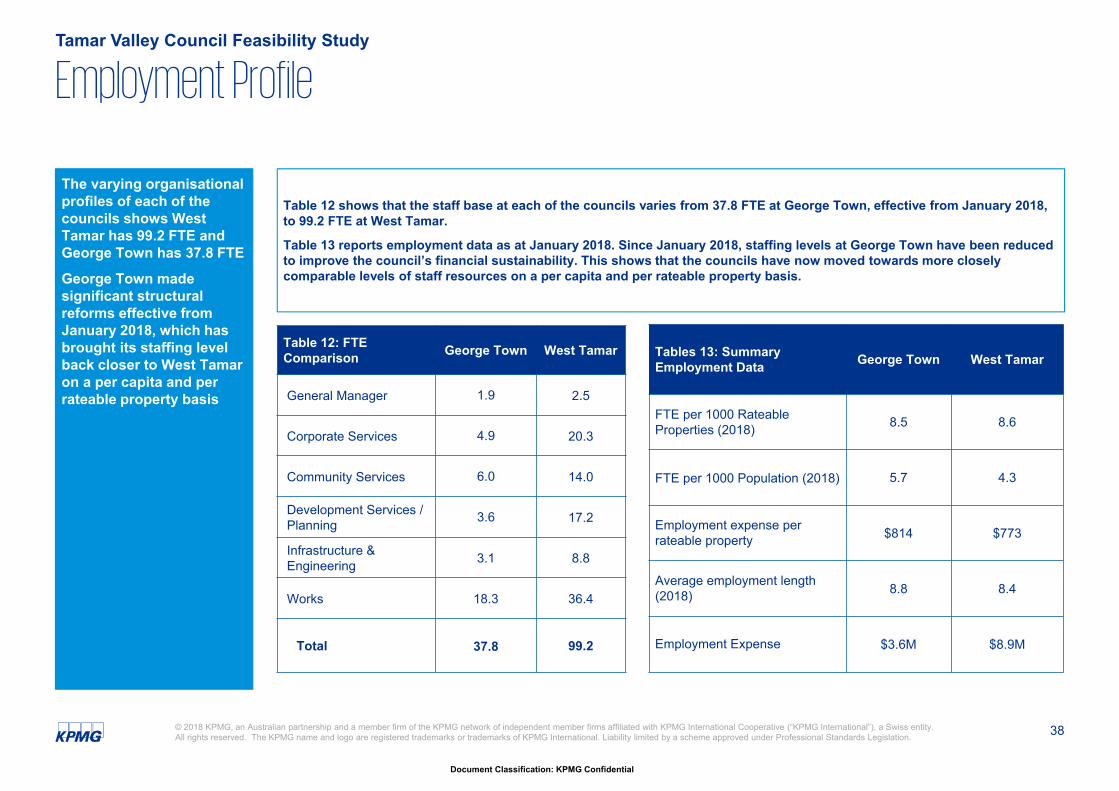
The varying organisational profiles of each of the councils shows West Tamar has 99.2 FTE and George Town has 37.8 FTE
George Town made significant structural reforms effective from January 2018, which has brought its staffing level back closer to West Tamar on a per capita and per rateable property basis
Table 12 shows that the staff base at each of the councils varies from 37.8 FTE at George Town, effective from January 2018, to 99.2 FTE at West Tamar.
Table 13 reports employment data as at January 2018. Since January 2018, staffing levels at George Town have been reduced to improve the council’s financial sustainability. This shows that the councils have now moved towards more closely comparable levels of staff resources on a per capita and per rateable property basis.
Employment ProfileTamar Valley Council Feasibility Study
Tables 13: Summary Employment Data George Town West Tamar
FTE per 1000 Rateable Properties (2018) 8.5 8.6
FTE per 1000 Population (2018) 5.7 4.3
Employment expense per rateable property $814 $773
Average employment length (2018) 8.8 8.4
Employment Expense $3.6M $8.9M
Table 12: FTE Comparison George Town West Tamar
General Manager 1.9 2.5
Corporate Services 4.9 20.3
Community Services 6.0 14.0
Development Services / Planning 3.6 17.2
Infrastructure & Engineering 3.1 8.8
Works 18.3 36.4
Total 37.8 99.2
39
Document Classification: KPMG Confidential
© 2018 KPMG, an Australian partnership and a member firm of the KPMG network of independent member firms affiliated with KPMG International Cooperative (“KPMG International”), a Swiss entity. All rights reserved. The KPMG name and logo are registered trademarks or trademarks of KPMG International. Liability limited by a scheme approved under Professional Standards Legislation.
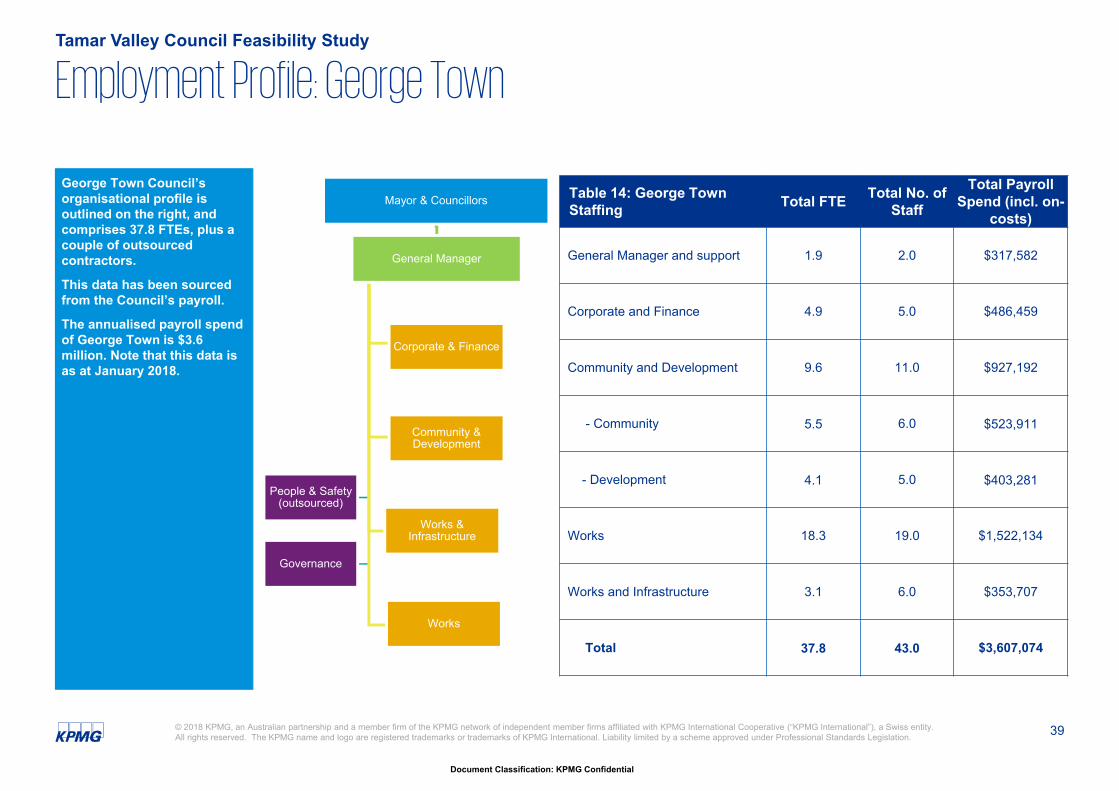
George Town Council’s organisational profile is outlined on the right, and comprises 37.8 FTEs, plus a couple of outsourced contractors.
This data has been sourced from the Council’s payroll.
The annualised payroll spend of George Town is $3.6 million. Note that this data is as at January 2018.
Employment Profile: George TownTamar Valley Council Feasibility Study
Table 14: George Town Staffing Total FTE Total No. of
Staff
Total Payroll Spend (incl. on-
costs)
General Manager and support 1.9 2.0 $317,582
Corporate and Finance 4.9 5.0 $486,459
Community and Development 9.6 11.0 $927,192
- Community 5.5 6.0 $523,911
- Development 4.1 5.0 $403,281
Works 18.3 19.0 $1,522,134
Works and Infrastructure 3.1 6.0 $353,707
Total 37.8 43.0 $3,607,074
Mayor & Councillors
General Manager
Corporate & Finance
Community & Development
Works & Infrastructure
Works
People & Safety (outsourced)
Governance
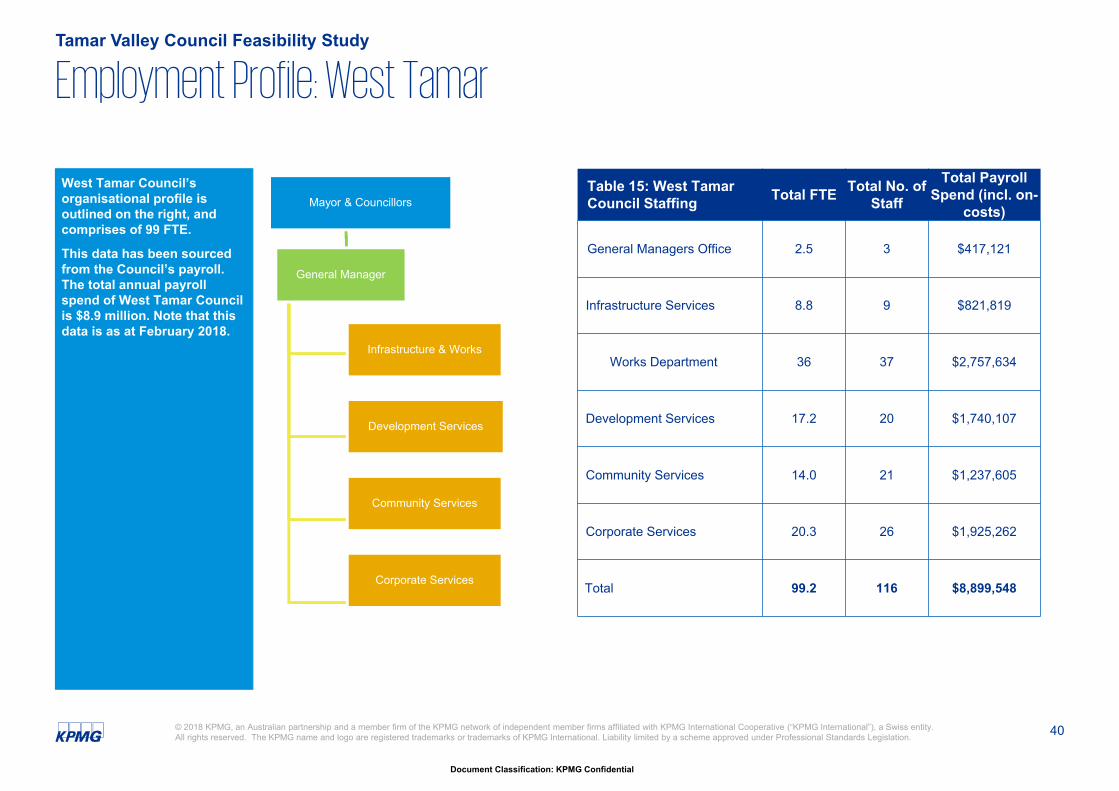
40
Document Classification: KPMG Confidential
© 2018 KPMG, an Australian partnership and a member firm of the KPMG network of independent member firms affiliated with KPMG International Cooperative (“KPMG International”), a Swiss entity. All rights reserved. The KPMG name and logo are registered trademarks or trademarks of KPMG International. Liability limited by a scheme approved under Professional Standards Legislation.
West Tamar Council’s organisational profile is outlined on the right, and comprises of 99 FTE.
This data has been sourced from the Council’s payroll. The total annual payroll spend of West Tamar Council is $8.9 million. Note that this data is as at February 2018.
Employment Profile: West TamarTamar Valley Council Feasibility Study
Table 15: West Tamar Council Staffing Total FTE Total No. of
Staff
Total Payroll Spend (incl. on-
costs)
General Managers Office 2.5 3 $417,121
Infrastructure Services 8.8 9 $821,819
Works Department 36 37 $2,757,634
Development Services 17.2 20 $1,740,107
Community Services 14.0 21 $1,237,605
Corporate Services 20.3 26 $1,925,262
Total 99.2 116 $8,899,548
Mayor & Councillors
General Manager
Infrastructure & Works
Development Services
Community Services
Corporate Services
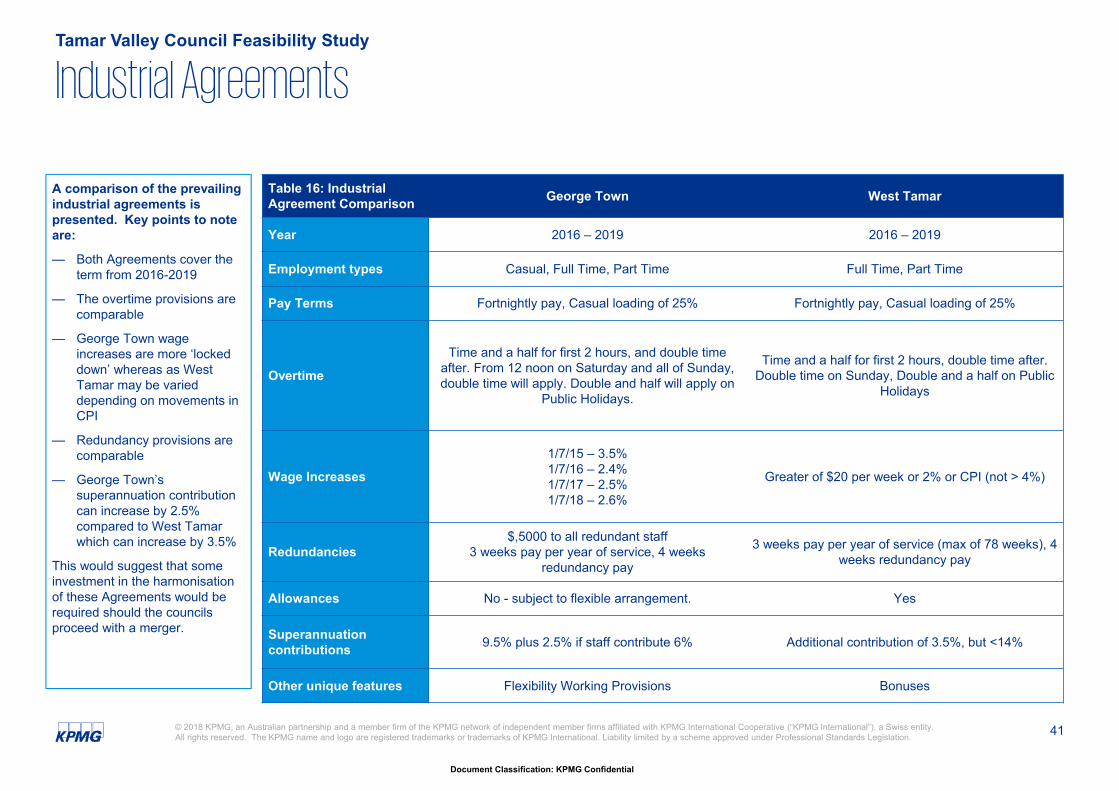
41
Document Classification: KPMG Confidential
© 2018 KPMG, an Australian partnership and a member firm of the KPMG network of independent member firms affiliated with KPMG International Cooperative (“KPMG International”), a Swiss entity. All rights reserved. The KPMG name and logo are registered trademarks or trademarks of KPMG International. Liability limited by a scheme approved under Professional Standards Legislation.
Industrial AgreementsTamar Valley Council Feasibility Study
Table 16: Industrial Agreement Comparison George Town West Tamar
Year 2016 – 2019 2016 – 2019
Employment types Casual, Full Time, Part Time Full Time, Part Time
Pay Terms Fortnightly pay, Casual loading of 25% Fortnightly pay, Casual loading of 25%
Overtime
Time and a half for first 2 hours, and double time after. From 12 noon on Saturday and all of Sunday, double time will apply. Double and half will apply on
Public Holidays.
Time and a half for first 2 hours, double time after. Double time on Sunday, Double and a half on Public
Holidays
Wage Increases
1/7/15 – 3.5%1/7/16 – 2.4%1/7/17 – 2.5%1/7/18 – 2.6%
Greater of $20 per week or 2% or CPI (not > 4%)
Redundancies$,5000 to all redundant staff
3 weeks pay per year of service, 4 weeks redundancy pay
3 weeks pay per year of service (max of 78 weeks), 4 weeks redundancy pay
Allowances No - subject to flexible arrangement. Yes
Superannuation contributions 9.5% plus 2.5% if staff contribute 6% Additional contribution of 3.5%, but <14%
Other unique features Flexibility Working Provisions Bonuses
A comparison of the prevailing industrial agreements is presented. Key points to note are:
— Both Agreements cover the term from 2016-2019
— The overtime provisions are comparable
— George Town wage increases are more ‘locked down’ whereas as West Tamar may be varied depending on movements in CPI
— Redundancy provisions are comparable
— George Town’s superannuation contribution can increase by 2.5% compared to West Tamar which can increase by 3.5%
This would suggest that some investment in the harmonisation of these Agreements would be required should the councils proceed with a merger.
2.4 Community Profile
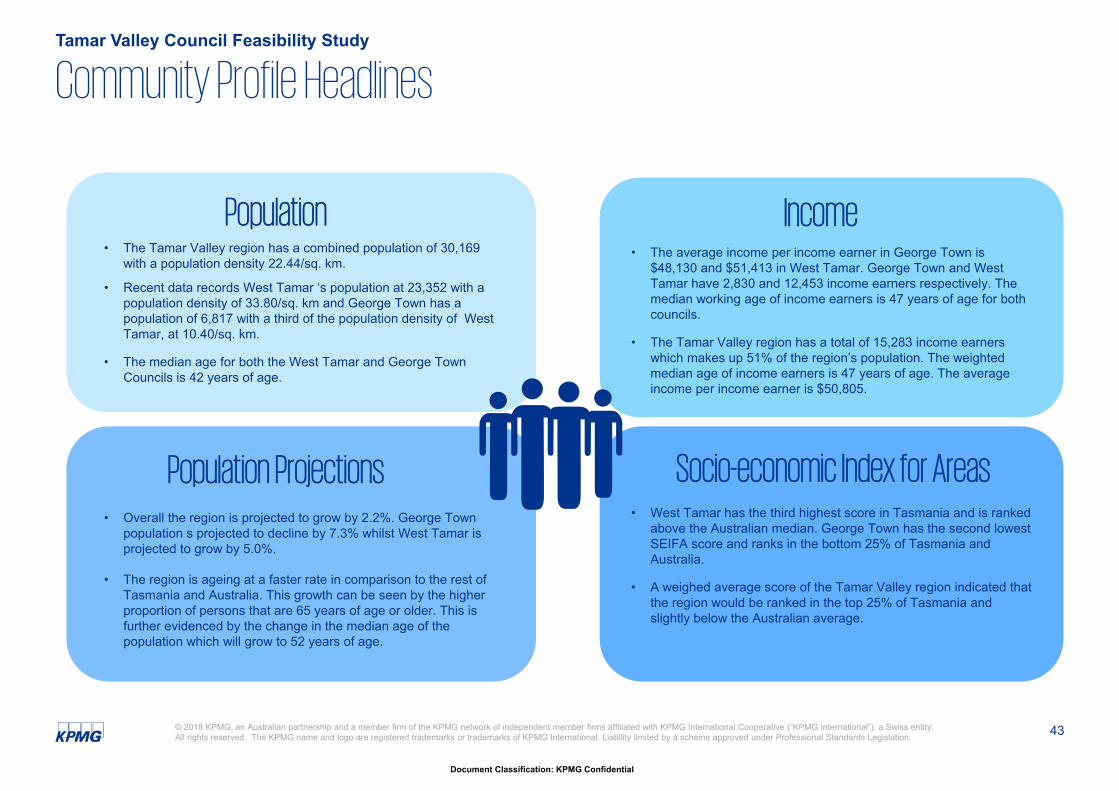
43
Document Classification: KPMG Confidential
© 2018 KPMG, an Australian partnership and a member firm of the KPMG network of independent member firms affiliated with KPMG International Cooperative (“KPMG International”), a Swiss entity. All rights reserved. The KPMG name and logo are registered trademarks or trademarks of KPMG International. Liability limited by a scheme approved under Professional Standards Legislation.
Community Profile HeadlinesTamar Valley Council Feasibility Study
• The Tamar Valley region has a combined population of 30,169 with a population density 22.44/sq. km.
• Recent data records West Tamar ‘s population at 23,352 with a population density of 33.80/sq. km and George Town has a population of 6,817 with a third of the population density of West Tamar, at 10.40/sq. km.
• The median age for both the West Tamar and George Town Councils is 42 years of age.
• Overall the region is projected to grow by 2.2%. George Town population s projected to decline by 7.3% whilst West Tamar is projected to grow by 5.0%.
• The region is ageing at a faster rate in comparison to the rest of Tasmania and Australia. This growth can be seen by the higher proportion of persons that are 65 years of age or older. This is further evidenced by the change in the median age of the population which will grow to 52 years of age.
• The average income per income earner in George Town is $48,130 and $51,413 in West Tamar. George Town and West Tamar have 2,830 and 12,453 income earners respectively. The median working age of income earners is 47 years of age for both councils.
• The Tamar Valley region has a total of 15,283 income earners which makes up 51% of the region’s population. The weighted median age of income earners is 47 years of age. The average income per income earner is $50,805.
• West Tamar has the third highest score in Tasmania and is ranked above the Australian median. George Town has the second lowest SEIFA score and ranks in the bottom 25% of Tasmania and Australia.
• A weighed average score of the Tamar Valley region indicated that the region would be ranked in the top 25% of Tasmania and slightly below the Australian average.
Income
Socio-economic Index for AreasPopulation Projections
Population
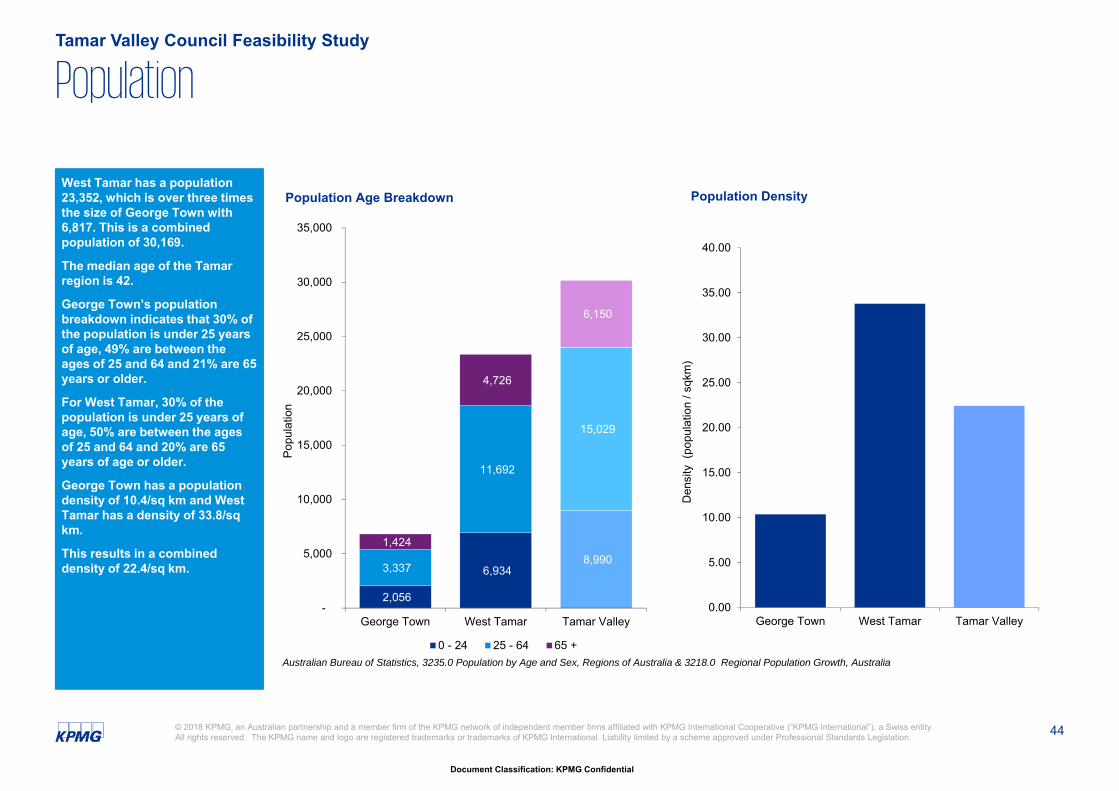
44
Document Classification: KPMG Confidential
© 2018 KPMG, an Australian partnership and a member firm of the KPMG network of independent member firms affiliated with KPMG International Cooperative (“KPMG International”), a Swiss entity. All rights reserved. The KPMG name and logo are registered trademarks or trademarks of KPMG International. Liability limited by a scheme approved under Professional Standards Legislation.
West Tamar has a population 23,352, which is over three times the size of George Town with 6,817. This is a combined population of 30,169.
The median age of the Tamar region is 42.
George Town’s population breakdown indicates that 30% of the population is under 25 years of age, 49% are between the ages of 25 and 64 and 21% are 65 years or older.
For West Tamar, 30% of the population is under 25 years of age, 50% are between the ages of 25 and 64 and 20% are 65 years of age or older.
George Town has a population density of 10.4/sq km and West Tamar has a density of 33.8/sq km.
This results in a combined density of 22.4/sq km.
PopulationTamar Valley Council Feasibility Study
Australian Bureau of Statistics, 3235.0 Population by Age and Sex, Regions of Australia & 3218.0 Regional Population Growth, Australia
2,056
6,934 8,990
3,337
11,692
15,029
1,424
4,726
6,150
-
5,000
10,000
15,000
20,000
25,000
30,000
35,000
George Town West Tamar Tamar Valley
Popu
latio
n
Population Age Breakdown
0 - 24 25 - 64 65 +
0.00
5.00
10.00
15.00
20.00
25.00
30.00
35.00
40.00
George Town West Tamar Tamar Valley
Den
sity
(pop
ulat
ion
/ sqk
m)
Population Density
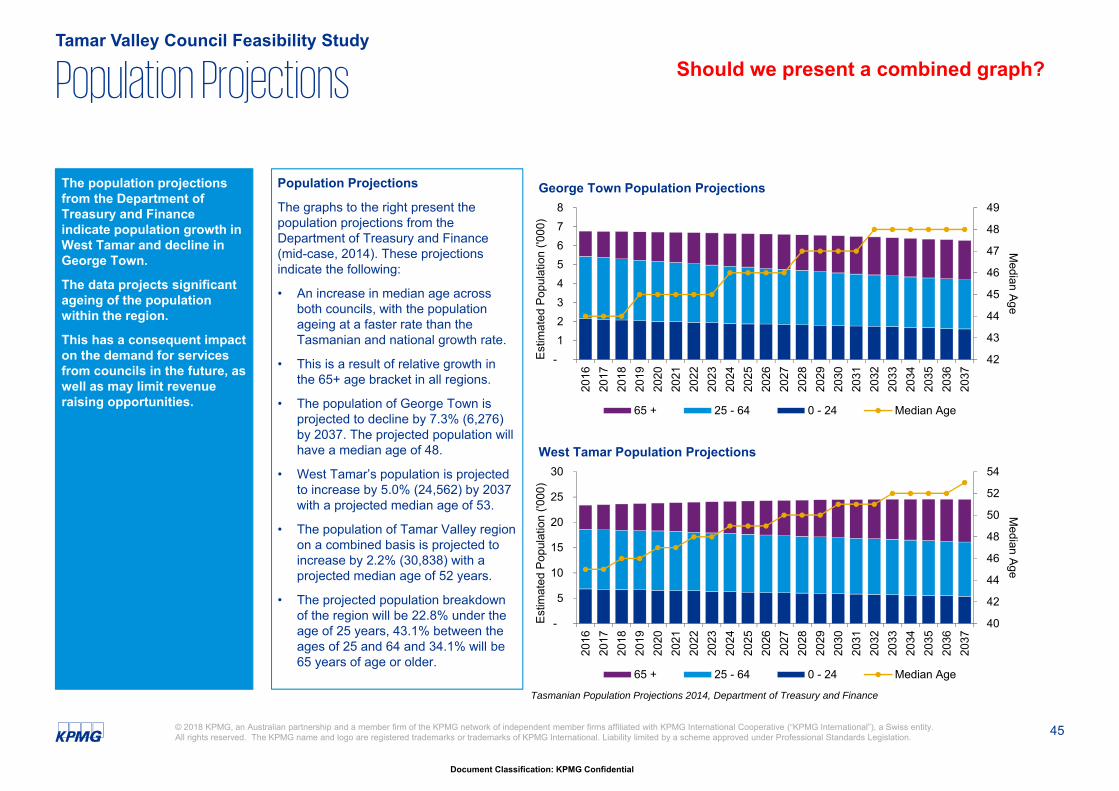
45
Document Classification: KPMG Confidential
© 2018 KPMG, an Australian partnership and a member firm of the KPMG network of independent member firms affiliated with KPMG International Cooperative (“KPMG International”), a Swiss entity. All rights reserved. The KPMG name and logo are registered trademarks or trademarks of KPMG International. Liability limited by a scheme approved under Professional Standards Legislation.
The population projections from the Department of Treasury and Finance indicate population growth in West Tamar and decline in George Town.
The data projects significant ageing of the population within the region.
This has a consequent impact on the demand for services from councils in the future, as well as may limit revenue raising opportunities.
Population Projections
The graphs to the right present the population projections from the Department of Treasury and Finance (mid-case, 2014). These projections indicate the following:
• An increase in median age across both councils, with the population ageing at a faster rate than the Tasmanian and national growth rate.
• This is a result of relative growth in the 65+ age bracket in all regions.
• The population of George Town is projected to decline by 7.3% (6,276) by 2037. The projected population will have a median age of 48.
• West Tamar’s population is projected to increase by 5.0% (24,562) by 2037 with a projected median age of 53.
• The population of Tamar Valley region on a combined basis is projected to increase by 2.2% (30,838) with a projected median age of 52 years.
• The projected population breakdown of the region will be 22.8% under the age of 25 years, 43.1% between the ages of 25 and 64 and 34.1% will be 65 years of age or older.
Population ProjectionsTamar Valley Council Feasibility Study
42
43
44
45
46
47
48
49
- 1 2 3 4 5 6 7 8
2016
2017
2018
2019
2020
2021
2022
2023
2024
2025
2026
2027
2028
2029
2030
2031
2032
2033
2034
2035
2036
2037
Median Age
Estim
ated
Pop
ulat
ion
('000
)
George Town Population Projections
65 + 25 - 64 0 - 24 Median Age
40
42
44
46
48
50
52
54
-
5
10
15
20
25
30
2016
2017
2018
2019
2020
2021
2022
2023
2024
2025
2026
2027
2028
2029
2030
2031
2032
2033
2034
2035
2036
2037
Median Age
Estim
ated
Pop
ulat
ion
('000
)
West Tamar Population Projections
65 + 25 - 64 0 - 24 Median Age
Tasmanian Population Projections 2014, Department of Treasury and Finance
Should we present a combined graph?
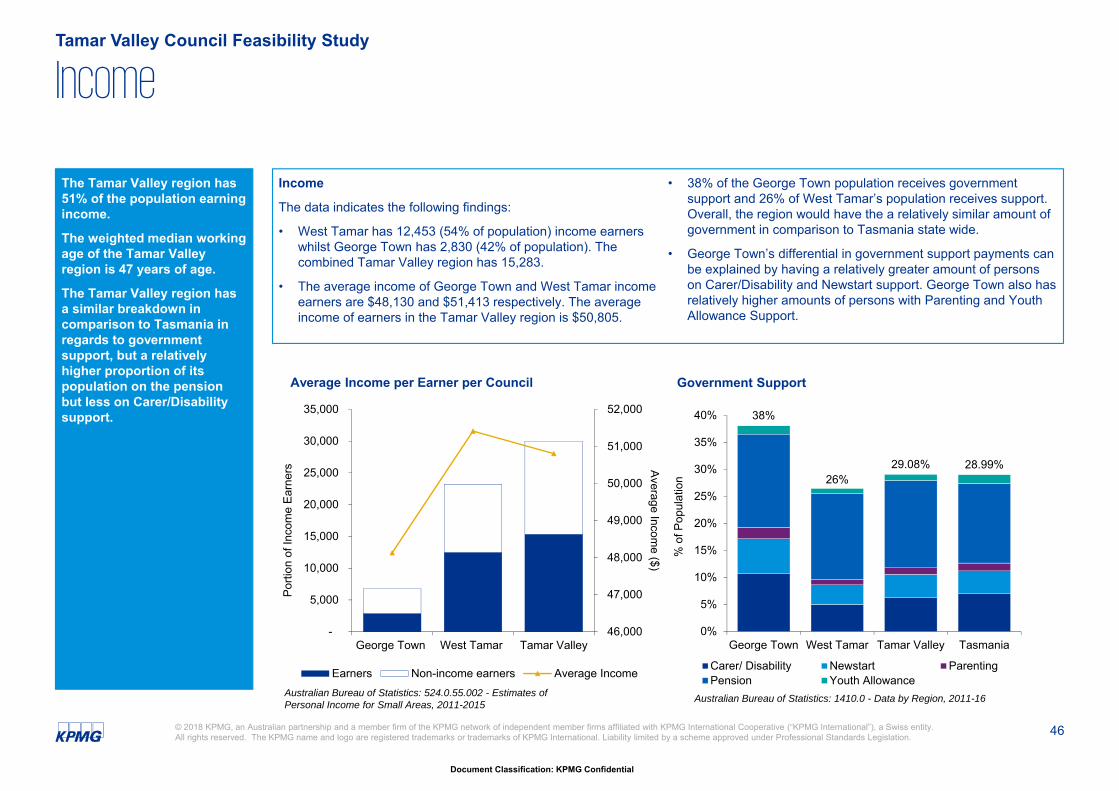
46
Document Classification: KPMG Confidential
© 2018 KPMG, an Australian partnership and a member firm of the KPMG network of independent member firms affiliated with KPMG International Cooperative (“KPMG International”), a Swiss entity. All rights reserved. The KPMG name and logo are registered trademarks or trademarks of KPMG International. Liability limited by a scheme approved under Professional Standards Legislation.
The Tamar Valley region has 51% of the population earning income.
The weighted median working age of the Tamar Valley region is 47 years of age.
The Tamar Valley region has a similar breakdown in comparison to Tasmania in regards to government support, but a relatively higher proportion of its population on the pension but less on Carer/Disability support.
IncomeTamar Valley Council Feasibility Study
46,000
47,000
48,000
49,000
50,000
51,000
52,000
-
5,000
10,000
15,000
20,000
25,000
30,000
35,000
George Town West Tamar Tamar Valley
Average Income ($)
Porti
on o
f Inc
ome
Earn
ers
Average Income per Earner per Council
Earners Non-income earners Average Income
Income
The data indicates the following findings:
• West Tamar has 12,453 (54% of population) income earners whilst George Town has 2,830 (42% of population). The combined Tamar Valley region has 15,283.
• The average income of George Town and West Tamar income earners are $48,130 and $51,413 respectively. The average income of earners in the Tamar Valley region is $50,805.
• 38% of the George Town population receives government support and 26% of West Tamar’s population receives support. Overall, the region would have the a relatively similar amount of government in comparison to Tasmania state wide.
• George Town’s differential in government support payments can be explained by having a relatively greater amount of persons on Carer/Disability and Newstart support. George Town also has relatively higher amounts of persons with Parenting and Youth Allowance Support.
Australian Bureau of Statistics: 524.0.55.002 - Estimates of Personal Income for Small Areas, 2011-2015 Australian Bureau of Statistics: 1410.0 - Data by Region, 2011-16
38%
26%29.08% 28.99%
0%
5%
10%
15%
20%
25%
30%
35%
40%
George Town West Tamar Tamar Valley Tasmania
% o
f Pop
ulat
ion
Government Support
Carer/ Disability Newstart ParentingPension Youth Allowance
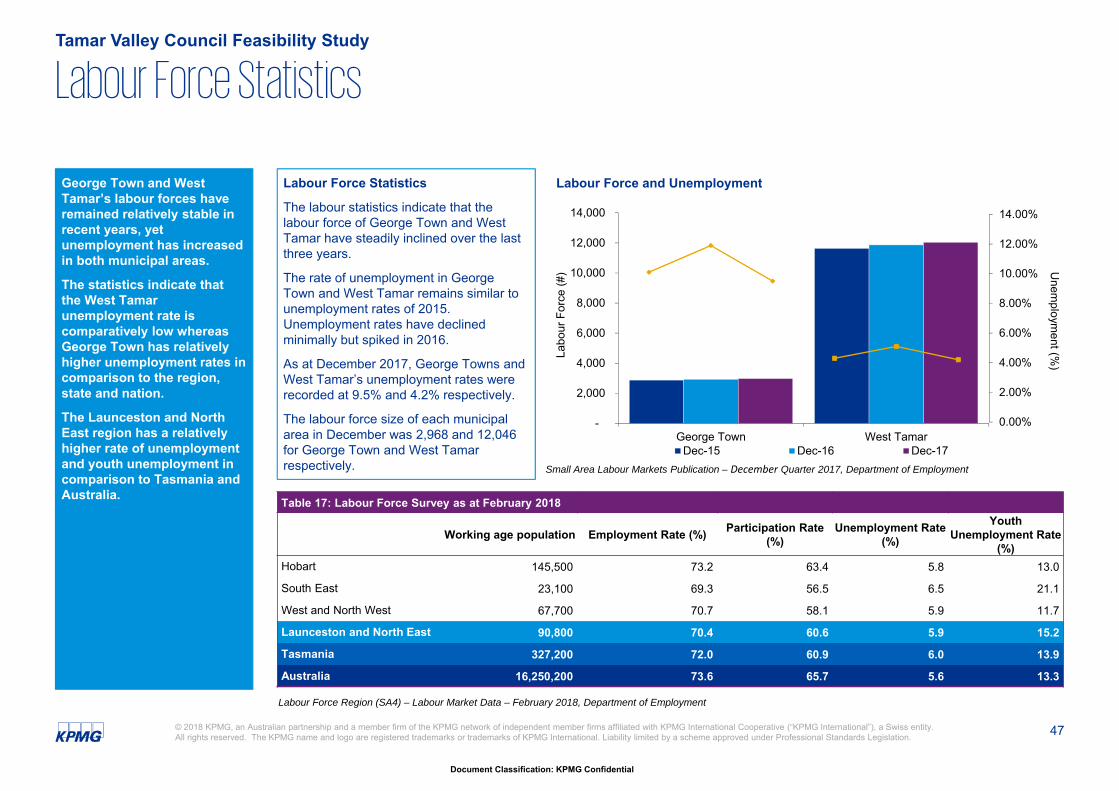
47
Document Classification: KPMG Confidential
© 2018 KPMG, an Australian partnership and a member firm of the KPMG network of independent member firms affiliated with KPMG International Cooperative (“KPMG International”), a Swiss entity. All rights reserved. The KPMG name and logo are registered trademarks or trademarks of KPMG International. Liability limited by a scheme approved under Professional Standards Legislation.
George Town and West Tamar’s labour forces have remained relatively stable in recent years, yet unemployment has increased in both municipal areas.
The statistics indicate that the West Tamar unemployment rate is comparatively low whereas George Town has relatively higher unemployment rates in comparison to the region, state and nation.
The Launceston and North East region has a relatively higher rate of unemployment and youth unemployment in comparison to Tasmania and Australia.
Labour Force Statistics
The labour statistics indicate that the labour force of George Town and West Tamar have steadily inclined over the last three years.
The rate of unemployment in George Town and West Tamar remains similar to unemployment rates of 2015. Unemployment rates have declined minimally but spiked in 2016.
As at December 2017, George Towns and West Tamar’s unemployment rates were recorded at 9.5% and 4.2% respectively.
The labour force size of each municipal area in December was 2,968 and 12,046 for George Town and West Tamar respectively.
Labour Force StatisticsTamar Valley Council Feasibility Study
Table 17: Labour Force Survey as at February 2018
Working age population Employment Rate (%) Participation Rate (%)
Unemployment Rate (%)
Youth Unemployment Rate
(%)Hobart 145,500 73.2 63.4 5.8 13.0
South East 23,100 69.3 56.5 6.5 21.1
West and North West 67,700 70.7 58.1 5.9 11.7
Launceston and North East 90,800 70.4 60.6 5.9 15.2
Tasmania 327,200 72.0 60.9 6.0 13.9
Australia 16,250,200 73.6 65.7 5.6 13.3
Labour Force Region (SA4) – Labour Market Data – February 2018, Department of Employment
Small Area Labour Markets Publication – December Quarter 2017, Department of Employment
-
2,000
4,000
6,000
8,000
10,000
12,000
14,000
George Town West Tamar
Labo
ur F
orce
(#)
Labour Force and Unemployment
Dec-15 Dec-16 Dec-17
0.00%
2.00%
4.00%
6.00%
8.00%
10.00%
12.00%
14.00%
Unem
ployment (%
)
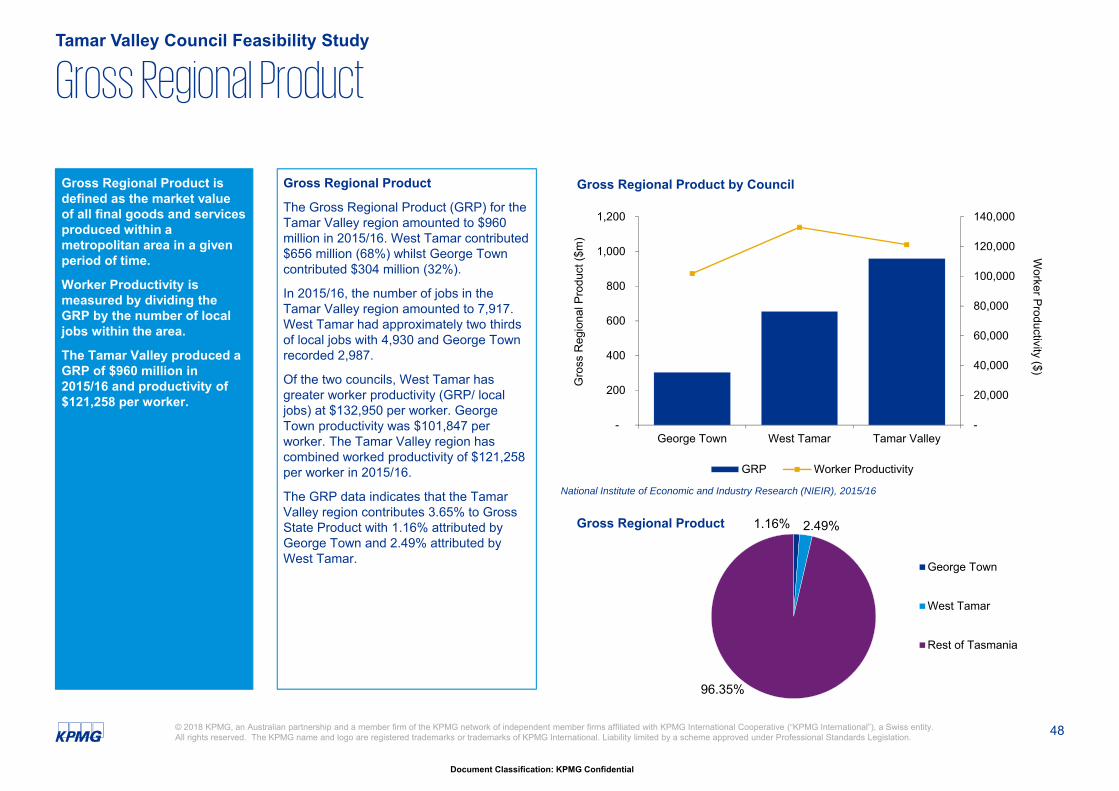
48
Document Classification: KPMG Confidential
© 2018 KPMG, an Australian partnership and a member firm of the KPMG network of independent member firms affiliated with KPMG International Cooperative (“KPMG International”), a Swiss entity. All rights reserved. The KPMG name and logo are registered trademarks or trademarks of KPMG International. Liability limited by a scheme approved under Professional Standards Legislation.
Gross Regional Product is defined as the market value of all final goods and services produced within a metropolitan area in a given period of time.
Worker Productivity is measured by dividing the GRP by the number of local jobs within the area.
The Tamar Valley produced a GRP of $960 million in 2015/16 and productivity of $121,258 per worker.
Gross Regional Product
The Gross Regional Product (GRP) for the Tamar Valley region amounted to $960 million in 2015/16. West Tamar contributed $656 million (68%) whilst George Town contributed $304 million (32%).
In 2015/16, the number of jobs in the Tamar Valley region amounted to 7,917. West Tamar had approximately two thirds of local jobs with 4,930 and George Town recorded 2,987.
Of the two councils, West Tamar has greater worker productivity (GRP/ local jobs) at $132,950 per worker. George Town productivity was $101,847 per worker. The Tamar Valley region has combined worked productivity of $121,258 per worker in 2015/16.
The GRP data indicates that the Tamar Valley region contributes 3.65% to Gross State Product with 1.16% attributed by George Town and 2.49% attributed by West Tamar.
Gross Regional ProductTamar Valley Council Feasibility Study
-
20,000
40,000
60,000
80,000
100,000
120,000
140,000
-
200
400
600
800
1,000
1,200
George Town West Tamar Tamar Valley
Worker Productivity ($)
Gro
ss R
egio
nal P
rodu
ct ($
m)
Gross Regional Product by Council
GRP Worker Productivity
National Institute of Economic and Industry Research (NIEIR), 2015/16
1.16% 2.49%
96.35%
Gross Regional Product
George Town
West Tamar
Rest of Tasmania
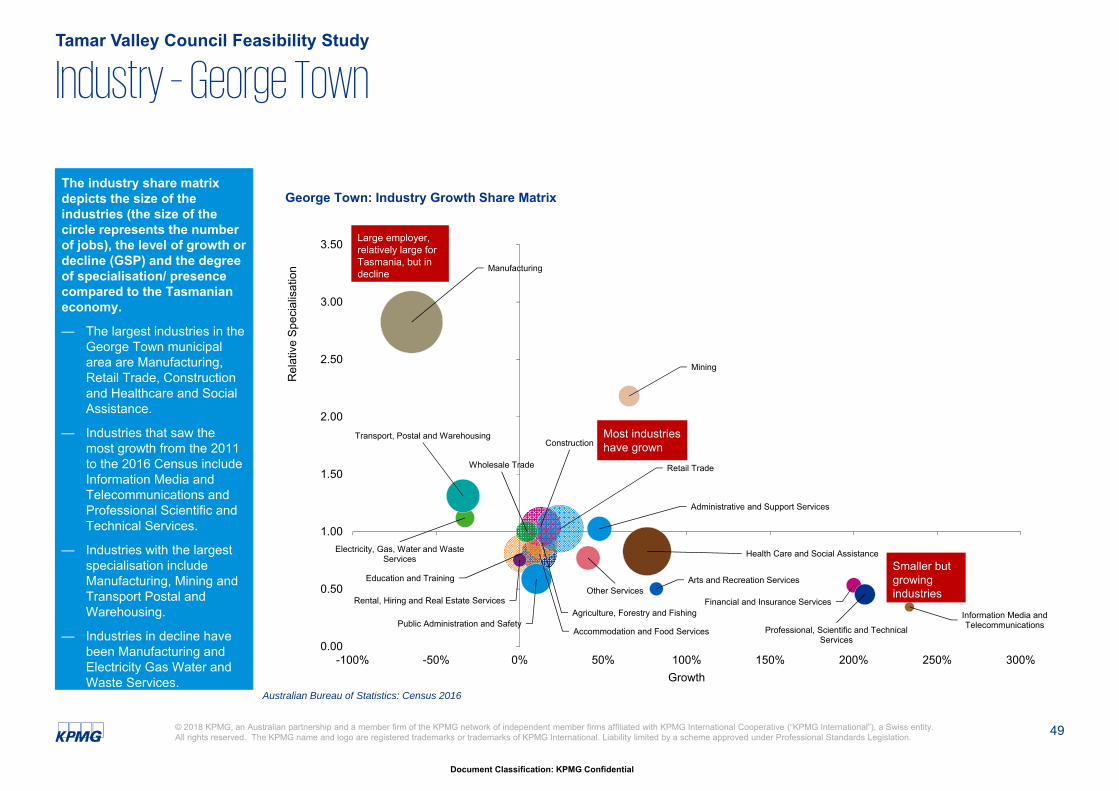
49
Document Classification: KPMG Confidential
© 2018 KPMG, an Australian partnership and a member firm of the KPMG network of independent member firms affiliated with KPMG International Cooperative (“KPMG International”), a Swiss entity. All rights reserved. The KPMG name and logo are registered trademarks or trademarks of KPMG International. Liability limited by a scheme approved under Professional Standards Legislation.
The industry share matrix depicts the size of the industries (the size of the circle represents the number of jobs), the level of growth or decline (GSP) and the degree of specialisation/ presence compared to the Tasmanian economy.
— The largest industries in the George Town municipal area are Manufacturing, Retail Trade, Construction and Healthcare and Social Assistance.
— Industries that saw the most growth from the 2011 to the 2016 Census include Information Media and Telecommunications and Professional Scientific and Technical Services.
— Industries with the largest specialisation include Manufacturing, Mining and Transport Postal and Warehousing.
— Industries in decline have been Manufacturing and Electricity Gas Water and Waste Services.
Industry – George TownTamar Valley Council Feasibility Study
Australian Bureau of Statistics: Census 2016
Accommodation and Food Services
Administrative and Support Services
Agriculture, Forestry and Fishing
Arts and Recreation Services
Construction
Education and Training
Electricity, Gas, Water and Waste Services
Financial and Insurance Services
Health Care and Social Assistance
Information Media and Telecommunications
Manufacturing
Mining
Other Services
Professional, Scientific and Technical Services
Public Administration and Safety
Rental, Hiring and Real Estate Services
Retail Trade
Transport, Postal and Warehousing
Wholesale Trade
0.00
0.50
1.00
1.50
2.00
2.50
3.00
3.50
-100% -50% 0% 50% 100% 150% 200% 250% 300%
Rel
ativ
e Sp
ecia
lisat
ion
Growth
George Town: Industry Growth Share Matrix
Large employer, relatively large for Tasmania, but in decline
Smaller but growing industries
Most industries have grown
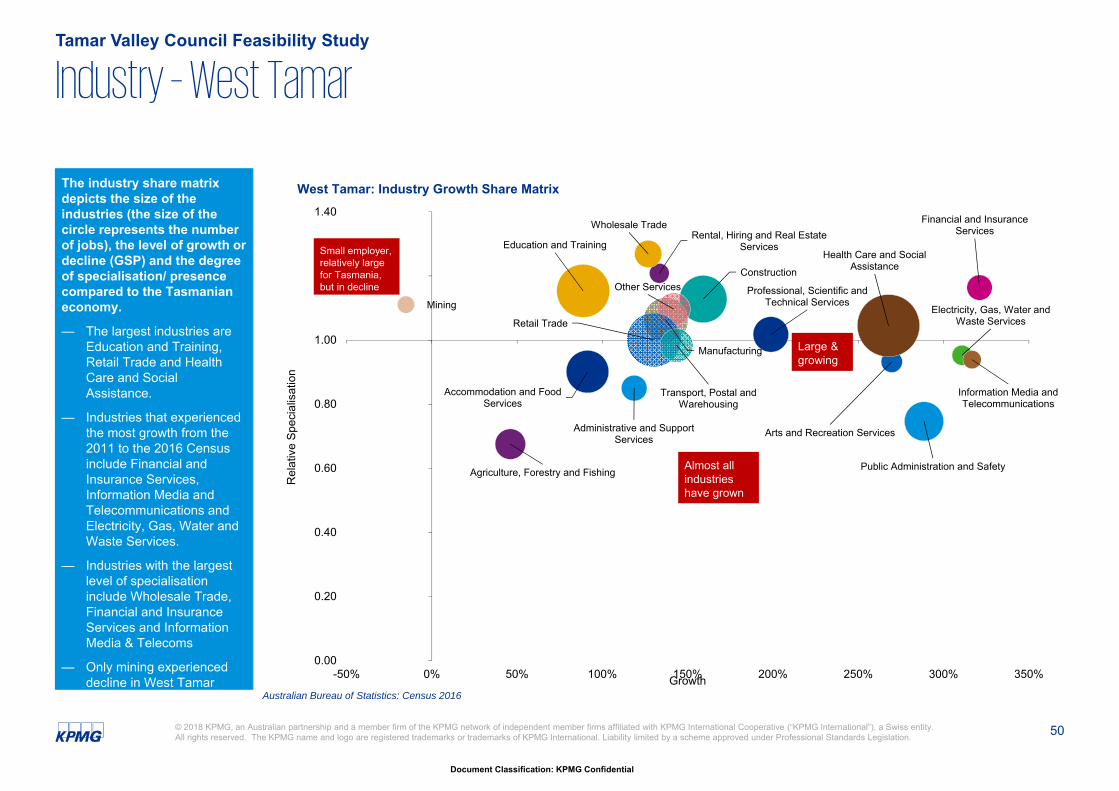
50
Document Classification: KPMG Confidential
© 2018 KPMG, an Australian partnership and a member firm of the KPMG network of independent member firms affiliated with KPMG International Cooperative (“KPMG International”), a Swiss entity. All rights reserved. The KPMG name and logo are registered trademarks or trademarks of KPMG International. Liability limited by a scheme approved under Professional Standards Legislation.
The industry share matrix depicts the size of the industries (the size of the circle represents the number of jobs), the level of growth or decline (GSP) and the degree of specialisation/ presence compared to the Tasmanian economy.
— The largest industries are Education and Training, Retail Trade and Health Care and Social Assistance.
— Industries that experienced the most growth from the 2011 to the 2016 Census include Financial and Insurance Services, Information Media and Telecommunications and Electricity, Gas, Water and Waste Services.
— Industries with the largest level of specialisation include Wholesale Trade, Financial and Insurance Services and Information Media & Telecoms
— Only mining experienced decline in West Tamar
Industry – West TamarTamar Valley Council Feasibility Study
Australian Bureau of Statistics: Census 2016
Accommodation and Food Services
Administrative and Support Services
Agriculture, Forestry and Fishing
Arts and Recreation Services
Construction
Education and Training
Electricity, Gas, Water and Waste Services
Financial and Insurance Services
Health Care and Social Assistance
Information Media and Telecommunications
Manufacturing
Mining
Other Services Professional, Scientific and Technical Services
Public Administration and Safety
Rental, Hiring and Real Estate Services
Retail Trade
Transport, Postal and Warehousing
Wholesale Trade
0.00
0.20
0.40
0.60
0.80
1.00
1.20
1.40
-50% 0% 50% 100% 150% 200% 250% 300% 350%
Rel
ativ
e Sp
ecia
lisat
ion
Growth
West Tamar: Industry Growth Share Matrix
Almost all industries have grown
Small employer, relatively large for Tasmania, but in decline
Large & growing
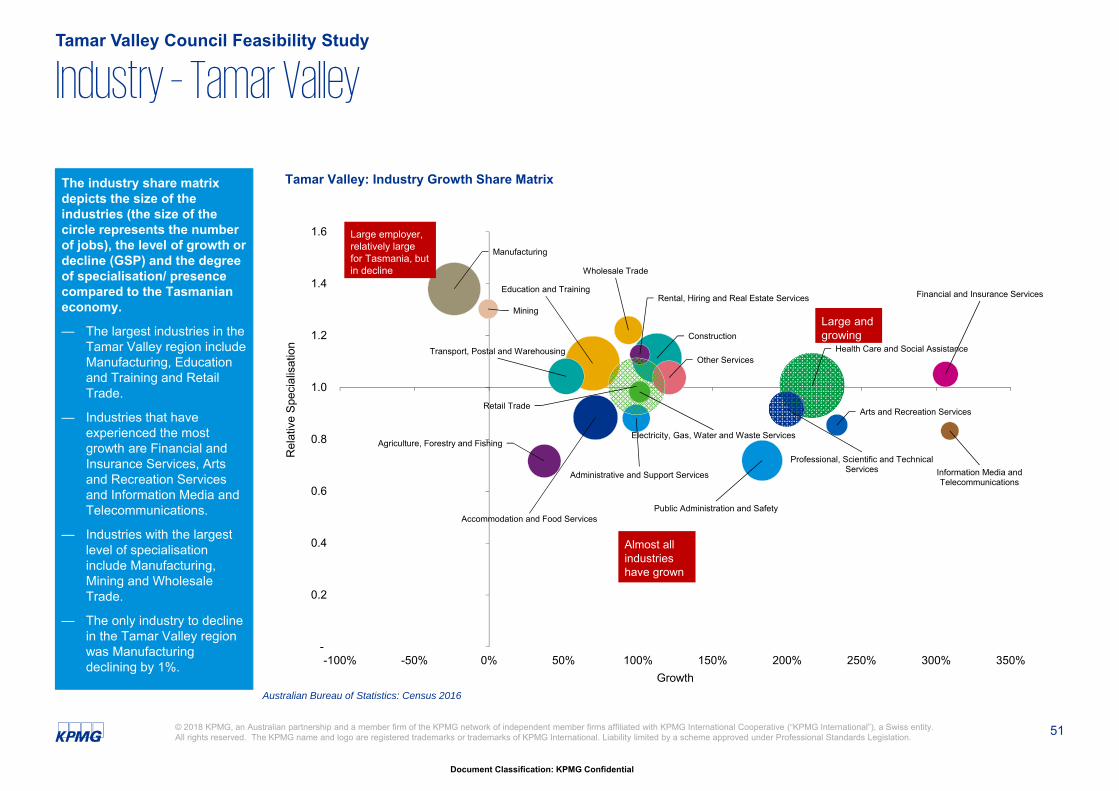
51
Document Classification: KPMG Confidential
© 2018 KPMG, an Australian partnership and a member firm of the KPMG network of independent member firms affiliated with KPMG International Cooperative (“KPMG International”), a Swiss entity. All rights reserved. The KPMG name and logo are registered trademarks or trademarks of KPMG International. Liability limited by a scheme approved under Professional Standards Legislation.
The industry share matrix depicts the size of the industries (the size of the circle represents the number of jobs), the level of growth or decline (GSP) and the degree of specialisation/ presence compared to the Tasmanian economy.
— The largest industries in the Tamar Valley region include Manufacturing, Education and Training and Retail Trade.
— Industries that have experienced the most growth are Financial and Insurance Services, Arts and Recreation Services and Information Media and Telecommunications.
— Industries with the largest level of specialisation include Manufacturing, Mining and Wholesale Trade.
— The only industry to decline in the Tamar Valley region was Manufacturing declining by 1%.
Industry – Tamar ValleyTamar Valley Council Feasibility Study
Australian Bureau of Statistics: Census 2016
Accommodation and Food Services
Administrative and Support Services
Agriculture, Forestry and Fishing
Arts and Recreation Services
Construction
Education and Training
Electricity, Gas, Water and Waste Services
Financial and Insurance Services
Health Care and Social Assistance
Information Media and Telecommunications
Manufacturing
Mining
Other Services
Professional, Scientific and Technical Services
Public Administration and Safety
Rental, Hiring and Real Estate Services
Retail Trade
Transport, Postal and Warehousing
Wholesale Trade
-
0.2
0.4
0.6
0.8
1.0
1.2
1.4
1.6
-100% -50% 0% 50% 100% 150% 200% 250% 300% 350%
Rel
ativ
e Sp
ecia
lisat
ion
Growth
Tamar Valley: Industry Growth Share Matrix
Large employer, relatively large for Tasmania, but in decline
Almost all industries have grown
Large and growing
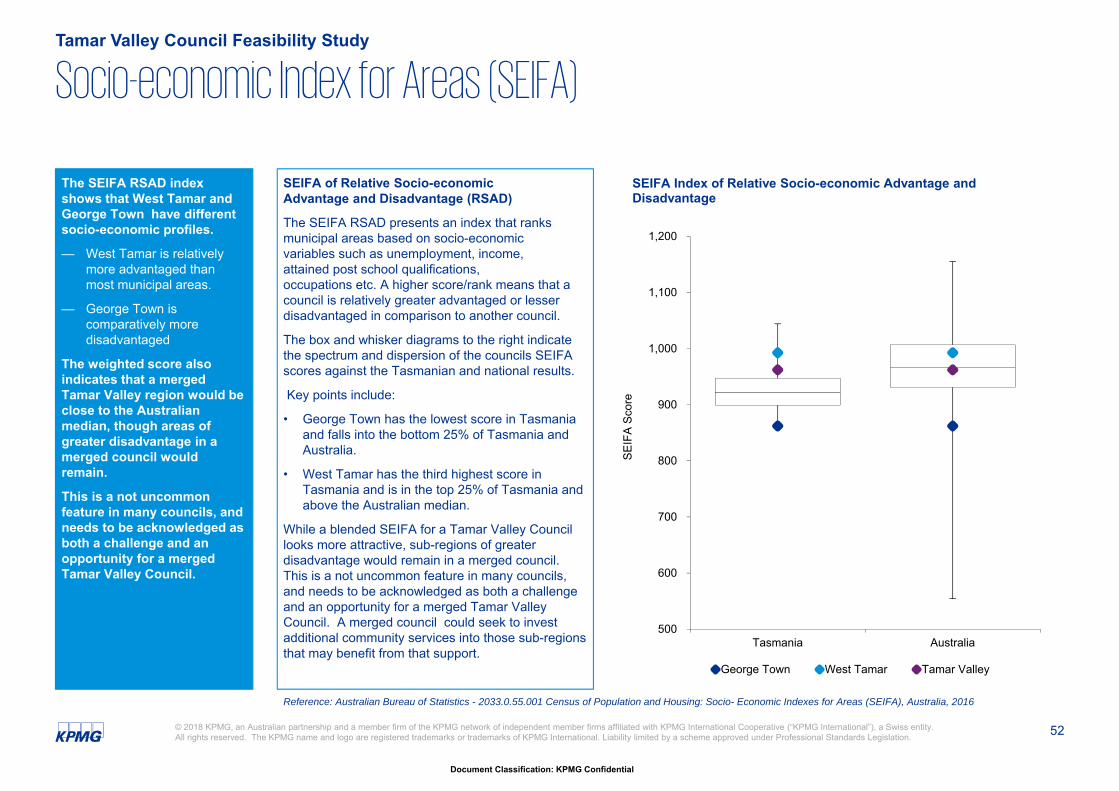
52
Document Classification: KPMG Confidential
© 2018 KPMG, an Australian partnership and a member firm of the KPMG network of independent member firms affiliated with KPMG International Cooperative (“KPMG International”), a Swiss entity. All rights reserved. The KPMG name and logo are registered trademarks or trademarks of KPMG International. Liability limited by a scheme approved under Professional Standards Legislation.
The SEIFA RSAD index shows that West Tamar and George Town have different socio-economic profiles.
— West Tamar is relatively more advantaged than most municipal areas.
— George Town is comparatively more disadvantaged
The weighted score also indicates that a merged Tamar Valley region would be close to the Australian median, though areas of greater disadvantage in a merged council would remain.
This is a not uncommon feature in many councils, and needs to be acknowledged as both a challenge and an opportunity for a merged Tamar Valley Council.
SEIFA of Relative Socio-economicAdvantage and Disadvantage (RSAD)
The SEIFA RSAD presents an index that ranksmunicipal areas based on socio-economicvariables such as unemployment, income,attained post school qualifications,occupations etc. A higher score/rank means that a council is relatively greater advantaged or lesser disadvantaged in comparison to another council.
The box and whisker diagrams to the right indicate the spectrum and dispersion of the councils SEIFA scores against the Tasmanian and national results.
Key points include:
• George Town has the lowest score in Tasmania and falls into the bottom 25% of Tasmania and Australia.
• West Tamar has the third highest score in Tasmania and is in the top 25% of Tasmania and above the Australian median.
While a blended SEIFA for a Tamar Valley Council looks more attractive, sub-regions of greater disadvantage would remain in a merged council. This is a not uncommon feature in many councils, and needs to be acknowledged as both a challenge and an opportunity for a merged Tamar Valley Council. A merged council could seek to invest additional community services into those sub-regions that may benefit from that support.
Socio-economic Index for Areas (SEIFA)Tamar Valley Council Feasibility Study
Reference: Australian Bureau of Statistics - 2033.0.55.001 Census of Population and Housing: Socio- Economic Indexes for Areas (SEIFA), Australia, 2016
500
600
700
800
900
1,000
1,100
1,200
Tasmania AustraliaSE
IFA
Scor
e
SEIFA Index of Relative Socio-economic Advantage and Disadvantage
George Town West Tamar Tamar Valley
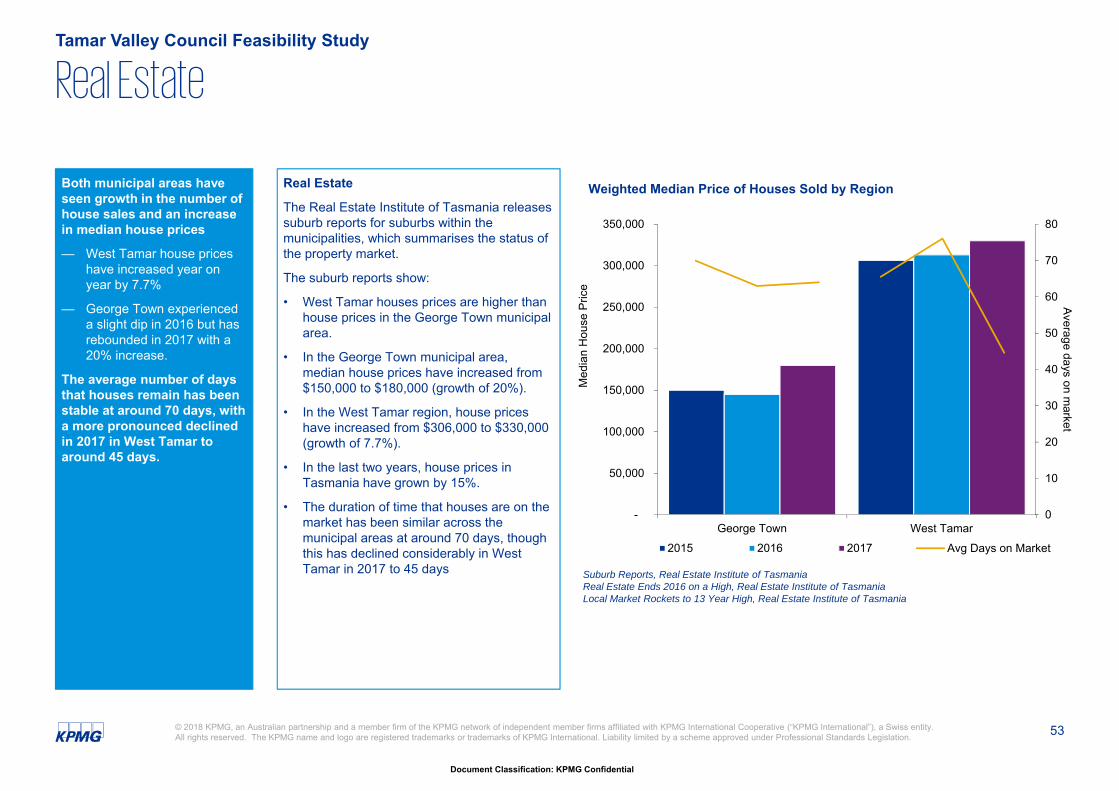
53
Document Classification: KPMG Confidential
© 2018 KPMG, an Australian partnership and a member firm of the KPMG network of independent member firms affiliated with KPMG International Cooperative (“KPMG International”), a Swiss entity. All rights reserved. The KPMG name and logo are registered trademarks or trademarks of KPMG International. Liability limited by a scheme approved under Professional Standards Legislation.
Both municipal areas have seen growth in the number of house sales and an increase in median house prices
— West Tamar house prices have increased year on year by 7.7%
— George Town experienced a slight dip in 2016 but has rebounded in 2017 with a 20% increase.
The average number of days that houses remain has been stable at around 70 days, with a more pronounced declined in 2017 in West Tamar to around 45 days.
Real Estate
The Real Estate Institute of Tasmania releases suburb reports for suburbs within the municipalities, which summarises the status of the property market.
The suburb reports show:
• West Tamar houses prices are higher than house prices in the George Town municipal area.
• In the George Town municipal area, median house prices have increased from $150,000 to $180,000 (growth of 20%).
• In the West Tamar region, house prices have increased from $306,000 to $330,000 (growth of 7.7%).
• In the last two years, house prices in Tasmania have grown by 15%.
• The duration of time that houses are on the market has been similar across the municipal areas at around 70 days, though this has declined considerably in West Tamar in 2017 to 45 days
Real EstateTamar Valley Council Feasibility Study
Suburb Reports, Real Estate Institute of TasmaniaReal Estate Ends 2016 on a High, Real Estate Institute of TasmaniaLocal Market Rockets to 13 Year High, Real Estate Institute of Tasmania
-
50,000
100,000
150,000
200,000
250,000
300,000
350,000
George Town West Tamar
Med
ian
Hou
se P
rice
Weighted Median Price of Houses Sold by Region
2015 2016 2017
0
10
20
30
40
50
60
70
80
Average days on market
Avg Days on Market
3. The Merger Option
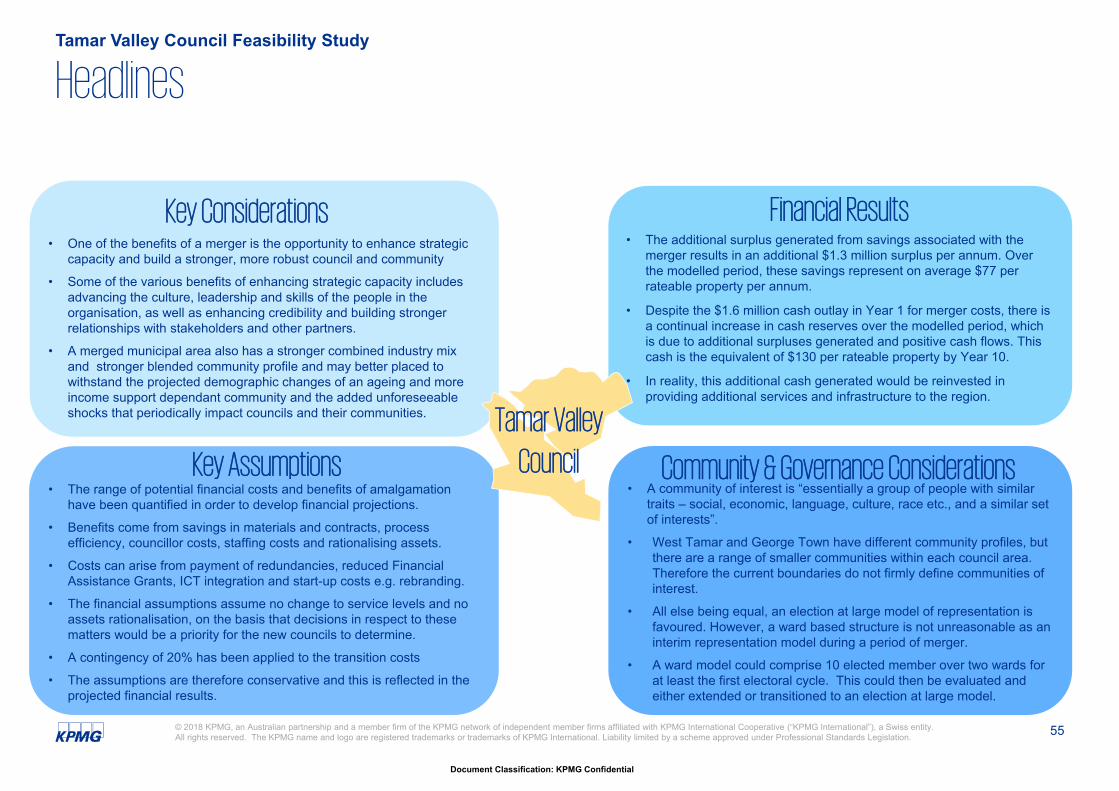
55
Document Classification: KPMG Confidential
© 2018 KPMG, an Australian partnership and a member firm of the KPMG network of independent member firms affiliated with KPMG International Cooperative (“KPMG International”), a Swiss entity. All rights reserved. The KPMG name and logo are registered trademarks or trademarks of KPMG International. Liability limited by a scheme approved under Professional Standards Legislation.
• One of the benefits of a merger is the opportunity to enhance strategic capacity and build a stronger, more robust council and community
• Some of the various benefits of enhancing strategic capacity includes advancing the culture, leadership and skills of the people in the organisation, as well as enhancing credibility and building stronger relationships with stakeholders and other partners.
• A merged municipal area also has a stronger combined industry mix and stronger blended community profile and may better placed to withstand the projected demographic changes of an ageing and more income support dependant community and the added unforeseeable shocks that periodically impact councils and their communities.
HeadlinesTamar Valley Council Feasibility Study
• The range of potential financial costs and benefits of amalgamation have been quantified in order to develop financial projections.
• Benefits come from savings in materials and contracts, process efficiency, councillor costs, staffing costs and rationalising assets.
• Costs can arise from payment of redundancies, reduced Financial Assistance Grants, ICT integration and start-up costs e.g. rebranding.
• The financial assumptions assume no change to service levels and no assets rationalisation, on the basis that decisions in respect to these matters would be a priority for the new councils to determine.
• A contingency of 20% has been applied to the transition costs
• The assumptions are therefore conservative and this is reflected in the projected financial results.
Key Considerations
Key Assumptions• A community of interest is “essentially a group of people with similar
traits – social, economic, language, culture, race etc., and a similar set of interests”.
• West Tamar and George Town have different community profiles, but there are a range of smaller communities within each council area. Therefore the current boundaries do not firmly define communities of interest.
• All else being equal, an election at large model of representation is favoured. However, a ward based structure is not unreasonable as an interim representation model during a period of merger.
• A ward model could comprise 10 elected member over two wards for at least the first electoral cycle. This could then be evaluated and either extended or transitioned to an election at large model.
• The additional surplus generated from savings associated with the merger results in an additional $1.3 million surplus per annum. Over the modelled period, these savings represent on average $77 per rateable property per annum.
• Despite the $1.6 million cash outlay in Year 1 for merger costs, there is a continual increase in cash reserves over the modelled period, which is due to additional surpluses generated and positive cash flows. This cash is the equivalent of $130 per rateable property by Year 10.
• In reality, this additional cash generated would be reinvested in providing additional services and infrastructure to the region.
Financial Results
Community & Governance Considerations
Tamar Valley
Council
3.1 Key considerations
57
Document Classification: KPMG Confidential
© 2018 KPMG, an Australian partnership and a member firm of the KPMG network of independent member firms affiliated with KPMG International Cooperative (“KPMG International”), a Swiss entity. All rights reserved. The KPMG name and logo are registered trademarks or trademarks of KPMG International. Liability limited by a scheme approved under Professional Standards Legislation.
One of the benefits of a merger is the opportunity to enhance strategic capacity.
Some of the various benefits of enhancing strategic capacity includes advancing the culture, leadership and skills of the people in the organisation, as well as enhancing credibility and building stronger relationships with stakeholders and other partners.
An important amalgamation consideration is the opportunity to achieve enhanced strategic capacity (Aulich et al, 2011). This includes the following benefits.
Robust revenue base and increased discretionary spendingIt is the desire of the councils to increase and diversify their revenue base to support jobs growth and employment and living standards in the region. By having a larger and diverse revenue base, the councils consequently have a greater and more stable revenue base, which also minimises the impact of any adverse growth effects.
Scope to undertake new functions and major projects to enhance regional collaborationThe George Town and West Tamar Councils have already taken small steps to enhance regional collaboration through some shared services and other economic, tourism, and community projects. A merged council would therefore have the ability to directly increase this regional collaboration.
Ability to employ a wider range of skilled staff, and potential for up skilling of existing staffA larger council has the requirement to recruit skilled staff, as there is a greater population to serve and greater asset base to maintain. This provides opportunities for existing staff to up skill, as well as for new staff to bring in a more diverse range of professional skills and qualities.
Fostering creativity and innovationNew staff and increased collaboration can foster a culture of creativity and increased innovation. In the current rapidly changing technology-led era, contemporary service delivery models, especially to remote areas can improve services to communities.
Advancing skills in strategic planning and policy developmentThese higher order conceptual skills increasingly demand well developed research, analysis and community engagement. Well resourced councils are better able to invest in staff and advisors and build the engagement of councillors and communities in these processes
Enhancing credibility for more effective advocacyA larger, stronger council can have a louder voice, when it comes to dealings with other spheres of government, investors, industry leaders and major employers. This can help to influence outcomes and bring about change that may otherwise be lost against competing demands from other regions.
Stronger partner for state and federal agenciesOther spheres of government will often look to councils to assist in the delivery of services, respond to grant programs and more generally seek to meet common goals for communities.
Better equipped to cope with complex and unexpected changesA larger council with a more robust and stable revenue base can more easily absorb any unexpected financial impacts than smaller councils. Unforseen ‘shocks’ such as natural events and industry downturns can be more diluted across a broader financial base.
Potential for higher quality political and managerial leadershipLarger, stronger councils have a greater ability to attract, remunerate and retain more highly skilled and experienced leaders, both at the political and executive management levels.
Potential for greater strategic capacityTamar Valley Council Feasibility Study
58
Document Classification: KPMG Confidential
© 2018 KPMG, an Australian partnership and a member firm of the KPMG network of independent member firms affiliated with KPMG International Cooperative (“KPMG International”), a Swiss entity. All rights reserved. The KPMG name and logo are registered trademarks or trademarks of KPMG International. Liability limited by a scheme approved under Professional Standards Legislation.
Mergers of councils can potentially give rise to a range of financial benefits and costs.
Benefits can arise from savings in:
— materials and contracts
— process efficiency
— councillor costs
— staffing costs
— rationalising assets
Costs can arise from:
— payment of redundancies
— reduced Financial Assistance Grants
— ICT integration
— start-up costs such as rebranding
Amalgamation costs
Redundancies: Redundancy costs arise from the reduction in staff who would be performing duplicate activities and functions under an amalgamated model.
Financial Assistance Grants reduction: The principles for determining the distribution of grant funding are set by the Commonwealth Government, and are consequently determined and administered by the State Grants Commission. The base grant for councils are made up of a per capita component, and a relative needs component, as well as a roads component. In considering a merger, it is acknowledged that the per capita and roads components do not change under each scenario. Therefore, the only component of the grants distribution that will likely change as a result of a council merger is the relative needs component. The relative needs component may reduce if the financial performance of an amalgamated council is superior to the individual performance of the stand-alone councils.
ICT integration: ICT integration costs may include the licensing and implementation of organisational-wide IT systems and applications, which would be a one-off cost.
Start up costs: Start up costs covers the wide range of implementation costs for a new council; amalgamation costs such as relocation, rebranding, and undertaking more detailed reviews of operations- such as assets and IT requirements. This is anticipated to be a one-off item, incurred in the first phase of implementation (currently the first year).
Amalgamation benefits and costsTamar Valley Council Feasibility Study
Amalgamation benefits
Reduction in materials and contracts expenses: Savings from materials and contracts can arise through the greater buying power of a larger entity. Such saving have already been substantially achieved since the councils currently purchase and procure nearly all plant, equipment, leasing through shared arrangements or through state or industry aggregated contracts. However, under all the options being considered, further savings can arise from having increased purchasing power due to size and the ability to negotiate on key contracts.Reduction in councillor expenditure: A lower number of Councillors is expected to represent the population in any amalgamated model, under the current arrangements. For the purposes of the modelling, the average councillor allowances paid by each council in 2015 form the average councillor allowances used in the modelling.
Reduction in employment costs: Efficiency gains can be realised from reduced employee costs, through the reduction of staff performing duplicated activities, as well as from redeploying staff from back-office to front-line positions. Corporate Services, Works and Planning are functions that are common across the councils, and could provide process efficiencies as well as reduction in FTEs. Community and economic development functions are less able to yield savings through reduction in employment due to the greater diversity of services. The average of the highest 20% of salaries has been used to estimate savings.
Asset rationalisation: There may be scope for asset sales (land and buildings, plant and equipment) which contributes to a reduction in the operating costs of assets. However, there is work involved in consolidating and reviewing these assets upon merging.
59
Document Classification: KPMG Confidential
© 2018 KPMG, an Australian partnership and a member firm of the KPMG network of independent member firms affiliated with KPMG International Cooperative (“KPMG International”), a Swiss entity. All rights reserved. The KPMG name and logo are registered trademarks or trademarks of KPMG International. Liability limited by a scheme approved under Professional Standards Legislation.
The George Town and West Tamar councils currently levy different average rates per rateable property. This is broadly reflective of the different breadth and depth of services provided and the capacity/ willingness of communities to pay.
The study has assumed no changes to service levels or rates as a result of any reform. Should the councils merge, it necessarily follows that there would continue to be variations in services and service levels across a broader region, unless the council and its communities decides otherwise.
That scenario can be accommodated through the differential rating provisions of the Local Government Act.
It would not be unreasonable for service levels and rates to harmonise in the long run.
Services and rates relationship
This study has found that there are different rating policies and average rates levied per rateable property across the two council areas.
George Town Council has adopted the Averaged Area Rate method to be the fairest means of ensuring an equitable rating outcome. On the other hand, West Tamar Council chooses the Assessed Annual Value (AAV) method to determine rate charges, which takes into account capital value of properties and gross annual rental value. More detail around these rating policies are found in Appendix 4.
The disparity in rates levied per rateable property may be broadly explained by the breadth and depth/ quality of services provided by each of the councils.
This study has assumed, for financial modelling purposes, that there would be no changes to services under any of the reform options.
This in turn suggests that any variations in service levels that may exist now, would not necessarily have to change, for better or worse, if a merger was to occur.
This could conceivably mean that any new council may not move to harmonise service levels, but rather recognise that the current levels may be reflective of the needs and wants of the ratepayers.
Therefore there would need to be a mechanism for a newly formed council to provide some services at different levels and levy rates accordingly. That mechanism is differential rating.
Differential rating
Differential rating recognises that a council may apply a higher rating differential to communities/ area that have higher demands/ expectations and receive higher services accordingly. Equally, communities/ areas that lower service demands/ expectations may attract a lower rating differential.
Differential rating is not uncommon. In Victoria in 2011/12, 80% of councils used up to five differential rates. In Auckland, there are 9 differential rating categories ranging from urban residential that attracts a factor of 1, urban business (2.76 x the residential rate), (rural business 2.68 times) through to farm and lifestyle (0.8 times the residential rate), sea only access properties (0.25 times) and so on.
The Local Government Act
Section 107 of the Act allows a council to declare that the general rate, service rate or service charge may vary with the municipal area, having regard to any or all of a range of factors including the use/ non-use of the land, the locality of the land, any planning zone and any other prescribed factor.
This power would allow any newly formed council to develop rating policies that are reflective of variations in services across a broader geographical area, where that is appropriate and in line with the service demands and expectations on the different communities of interest.
Naturally, any newly formed council may seek to apply any saving from a merger to generally raise service levels. However, this study has made no assumptions in that regard, instead believing that to be a policy decision for a new council.
Services and rating considerationsTamar Valley Council Feasibility Study
60
Document Classification: KPMG Confidential
© 2018 KPMG, an Australian partnership and a member firm of the KPMG network of independent member firms affiliated with KPMG International Cooperative (“KPMG International”), a Swiss entity. All rights reserved. The KPMG name and logo are registered trademarks or trademarks of KPMG International. Liability limited by a scheme approved under Professional Standards Legislation.
The effect of the consolidation of these conservative assumptions means that there may be additional financial benefits depending on the decisions that a future council may wish to make.
In order to undertake the financial modelling, a number of complementary approaches have been taken:
— A bottom-up approach was employed to determine the merger costs and savings, which involved consultation with the councils’ General Managers. This includes a bottom-up calculation of recurrent employee savings, revised councilor costs and one-off amalgamation costs
— All assumptions were then overlaid with KPMG’s industry experience and general assessment of ‘reasonableness’.
Notwithstanding, there are several risks and limitations associated with the assumptions:
— Transitional and implementation costs may differ from the assumptions used, and a contingency of 20% has been added to reflect the risks of variation
— The financial performance of the merged council is dependent on decisions being made and implemented by a future council
— The final governance model that represents the communities of interest across the proposed merger area may impact on the assumed governance costs
In order to minimise these risks, the financial modelling has been conservative, in terms of forecasting the projected financialbenefits at the lower end of a range and adopting realistic implementation and change costs.
— There is no change to the existing service levels that are provided to the community within each of the council areas
— There are no changes to customer-facing staff and shop fronts will be retained in all current locations to deliver face to face services
— There are no changes to the rates that the community currently pays (i.e. there is a continuation of current rate payments adjusted for CPI over the forecast period)
— There is no sale of assets such as council chambers, land and buildings, plant and equipment
— There is no revaluation of assets at the point of merger between councils in any of the options
Financial modelling considerationsTamar Valley Council Feasibility Study
3.2 Financial assumptions
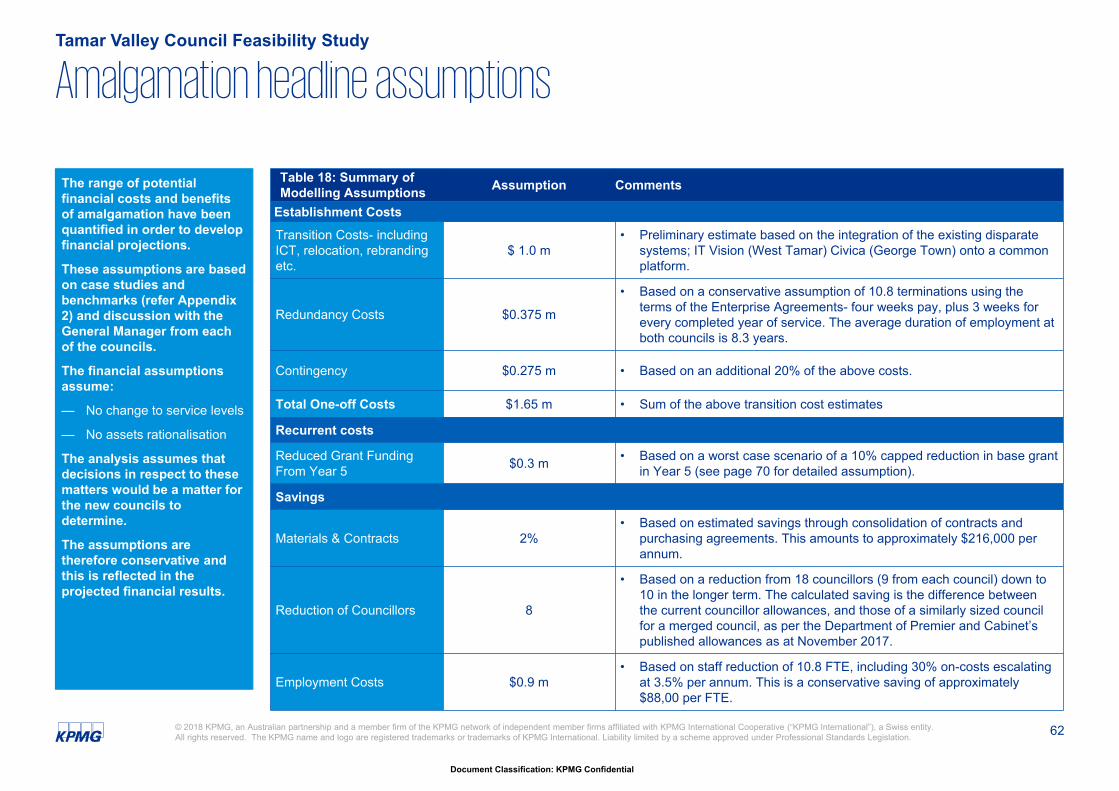
62
Document Classification: KPMG Confidential
© 2018 KPMG, an Australian partnership and a member firm of the KPMG network of independent member firms affiliated with KPMG International Cooperative (“KPMG International”), a Swiss entity. All rights reserved. The KPMG name and logo are registered trademarks or trademarks of KPMG International. Liability limited by a scheme approved under Professional Standards Legislation.
The range of potential financial costs and benefits of amalgamation have been quantified in order to develop financial projections.
These assumptions are based on case studies and benchmarks (refer Appendix 2) and discussion with the General Manager from each of the councils.
The financial assumptions assume:
— No change to service levels
— No assets rationalisation
The analysis assumes that decisions in respect to these matters would be a matter for the new councils to determine.
The assumptions are therefore conservative and this is reflected in the projected financial results.
Amalgamation headline assumptions Tamar Valley Council Feasibility Study
Table 18: Summary of Modelling Assumptions Assumption Comments
Establishment CostsTransition Costs- including ICT, relocation, rebranding etc.
$ 1.0 m• Preliminary estimate based on the integration of the existing disparate
systems; IT Vision (West Tamar) Civica (George Town) onto a common platform.
Redundancy Costs $0.375 m
• Based on a conservative assumption of 10.8 terminations using the terms of the Enterprise Agreements- four weeks pay, plus 3 weeks for every completed year of service. The average duration of employment at both councils is 8.3 years.
Contingency $0.275 m • Based on an additional 20% of the above costs.
Total One-off Costs $1.65 m • Sum of the above transition cost estimates
Recurrent costs
Reduced Grant Funding From Year 5 $0.3 m • Based on a worst case scenario of a 10% capped reduction in base grant
in Year 5 (see page 70 for detailed assumption).
Savings
Materials & Contracts 2%• Based on estimated savings through consolidation of contracts and
purchasing agreements. This amounts to approximately $216,000 per annum.
Reduction of Councillors 8
• Based on a reduction from 18 councillors (9 from each council) down to 10 in the longer term. The calculated saving is the difference between the current councillor allowances, and those of a similarly sized council for a merged council, as per the Department of Premier and Cabinet’s published allowances as at November 2017.
Employment Costs $0.9 m• Based on staff reduction of 10.8 FTE, including 30% on-costs escalating
at 3.5% per annum. This is a conservative saving of approximately $88,00 per FTE.
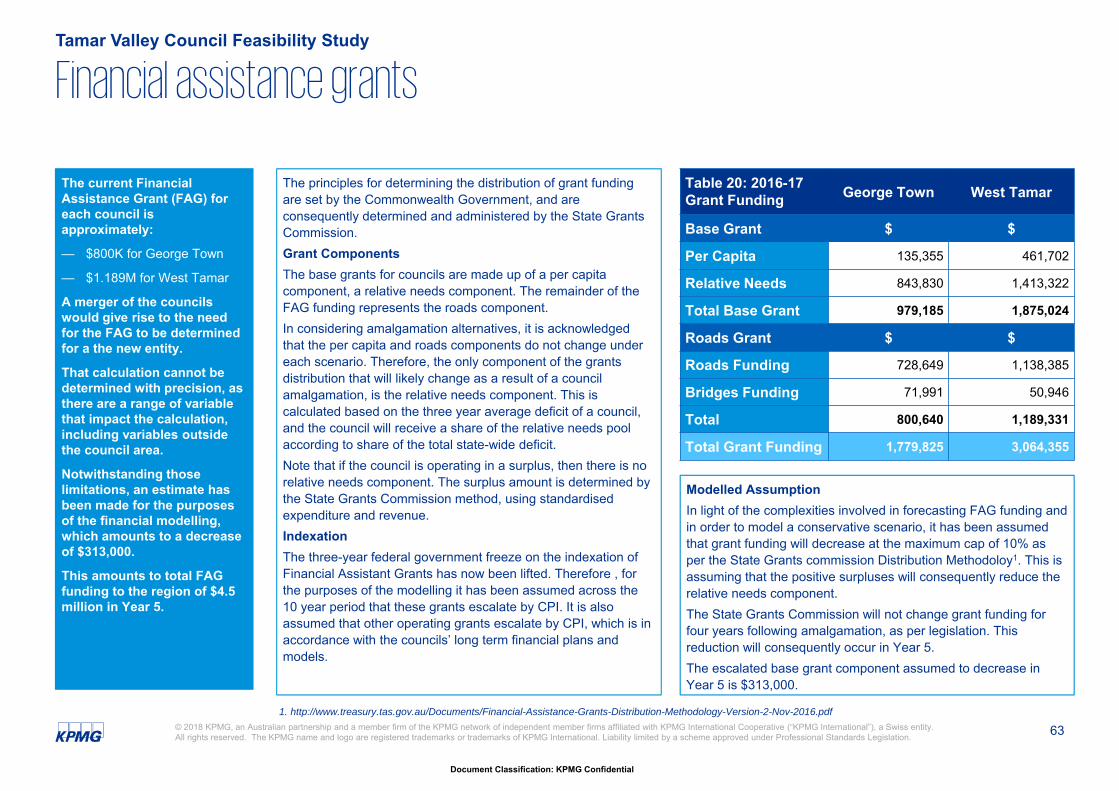
63
Document Classification: KPMG Confidential
© 2018 KPMG, an Australian partnership and a member firm of the KPMG network of independent member firms affiliated with KPMG International Cooperative (“KPMG International”), a Swiss entity. All rights reserved. The KPMG name and logo are registered trademarks or trademarks of KPMG International. Liability limited by a scheme approved under Professional Standards Legislation.
The current Financial Assistance Grant (FAG) for each council is approximately:
— $800K for George Town
— $1.189M for West Tamar
A merger of the councils would give rise to the need for the FAG to be determined for a the new entity.
That calculation cannot be determined with precision, as there are a range of variable that impact the calculation, including variables outside the council area.
Notwithstanding those limitations, an estimate has been made for the purposes of the financial modelling, which amounts to a decrease of $313,000.
This amounts to total FAG funding to the region of $4.5 million in Year 5.
The principles for determining the distribution of grant funding are set by the Commonwealth Government, and are consequently determined and administered by the State Grants Commission. Grant ComponentsThe base grants for councils are made up of a per capita component, a relative needs component. The remainder of the FAG funding represents the roads component. In considering amalgamation alternatives, it is acknowledged that the per capita and roads components do not change under each scenario. Therefore, the only component of the grants distribution that will likely change as a result of a council amalgamation, is the relative needs component. This is calculated based on the three year average deficit of a council, and the council will receive a share of the relative needs pool according to share of the total state-wide deficit. Note that if the council is operating in a surplus, then there is no relative needs component. The surplus amount is determined by the State Grants Commission method, using standardised expenditure and revenue.IndexationThe three-year federal government freeze on the indexation of Financial Assistant Grants has now been lifted. Therefore , for the purposes of the modelling it has been assumed across the 10 year period that these grants escalate by CPI. It is also assumed that other operating grants escalate by CPI, which is in accordance with the councils’ long term financial plans and models.
Financial assistance grantsTamar Valley Council Feasibility Study
Table 20: 2016-17 Grant Funding George Town West Tamar
Base Grant $ $
Per Capita 135,355 461,702
Relative Needs 843,830 1,413,322
Total Base Grant 979,185 1,875,024
Roads Grant $ $
Roads Funding 728,649 1,138,385
Bridges Funding 71,991 50,946
Total 800,640 1,189,331
Total Grant Funding 1,779,825 3,064,355
Modelled AssumptionIn light of the complexities involved in forecasting FAG funding and in order to model a conservative scenario, it has been assumed that grant funding will decrease at the maximum cap of 10% as per the State Grants commission Distribution Methodoloy1. This is assuming that the positive surpluses will consequently reduce the relative needs component. The State Grants Commission will not change grant funding for four years following amalgamation, as per legislation. This reduction will consequently occur in Year 5. The escalated base grant component assumed to decrease in Year 5 is $313,000.
1. http://www.treasury.tas.gov.au/Documents/Financial-Assistance-Grants-Distribution-Methodology-Version-2-Nov-2016.pdf
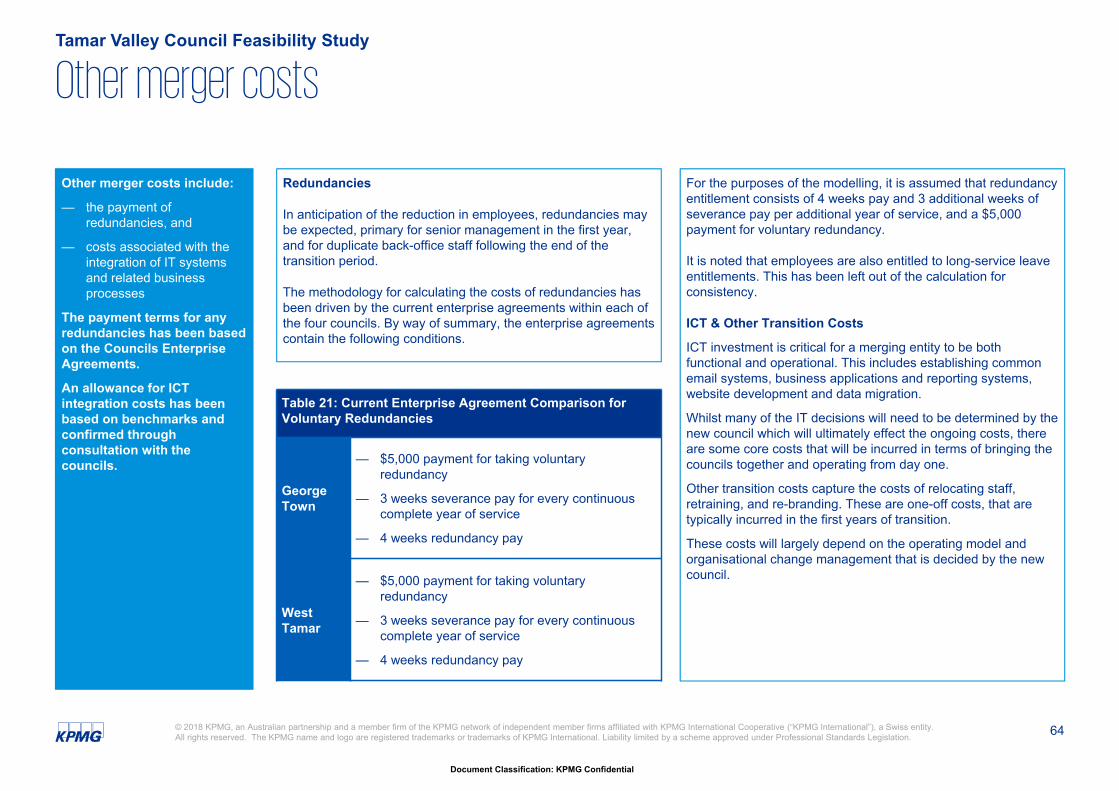
64
Document Classification: KPMG Confidential
© 2018 KPMG, an Australian partnership and a member firm of the KPMG network of independent member firms affiliated with KPMG International Cooperative (“KPMG International”), a Swiss entity. All rights reserved. The KPMG name and logo are registered trademarks or trademarks of KPMG International. Liability limited by a scheme approved under Professional Standards Legislation.
Other merger costs include:
— the payment of redundancies, and
— costs associated with the integration of IT systems and related business processes
The payment terms for any redundancies has been based on the Councils Enterprise Agreements.
An allowance for ICT integration costs has been based on benchmarks and confirmed through consultation with the councils.
Redundancies
In anticipation of the reduction in employees, redundancies may be expected, primary for senior management in the first year, and for duplicate back-office staff following the end of the transition period.
The methodology for calculating the costs of redundancies has been driven by the current enterprise agreements within each of the four councils. By way of summary, the enterprise agreements contain the following conditions.
For the purposes of the modelling, it is assumed that redundancy entitlement consists of 4 weeks pay and 3 additional weeks of severance pay per additional year of service, and a $5,000 payment for voluntary redundancy.
It is noted that employees are also entitled to long-service leave entitlements. This has been left out of the calculation for consistency.
ICT & Other Transition Costs
ICT investment is critical for a merging entity to be both functional and operational. This includes establishing common email systems, business applications and reporting systems, website development and data migration.
Whilst many of the IT decisions will need to be determined by the new council which will ultimately effect the ongoing costs, there are some core costs that will be incurred in terms of bringing the councils together and operating from day one.
Other transition costs capture the costs of relocating staff, retraining, and re-branding. These are one-off costs, that are typically incurred in the first years of transition.
These costs will largely depend on the operating model and organisational change management that is decided by the new council.
Other merger costs Tamar Valley Council Feasibility Study
Table 21: Current Enterprise Agreement Comparison for Voluntary Redundancies
George Town
— $5,000 payment for taking voluntary redundancy
— 3 weeks severance pay for every continuous complete year of service
— 4 weeks redundancy pay
West Tamar
— $5,000 payment for taking voluntary redundancy
— 3 weeks severance pay for every continuous complete year of service
— 4 weeks redundancy pay
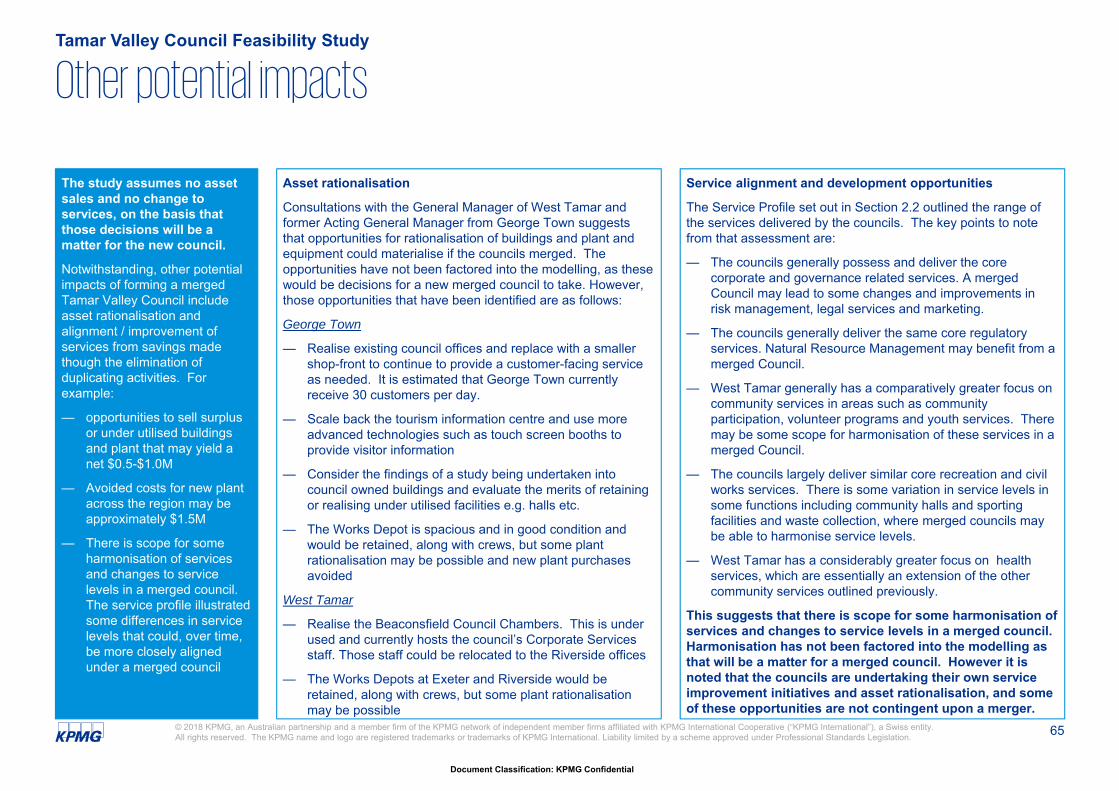
65
Document Classification: KPMG Confidential
© 2018 KPMG, an Australian partnership and a member firm of the KPMG network of independent member firms affiliated with KPMG International Cooperative (“KPMG International”), a Swiss entity. All rights reserved. The KPMG name and logo are registered trademarks or trademarks of KPMG International. Liability limited by a scheme approved under Professional Standards Legislation.
The study assumes no asset sales and no change to services, on the basis that those decisions will be a matter for the new council.
Notwithstanding, other potential impacts of forming a merged Tamar Valley Council include asset rationalisation and alignment / improvement of services from savings made though the elimination of duplicating activities. For example:
— opportunities to sell surplus or under utilised buildings and plant that may yield a net $0.5-$1.0M
— Avoided costs for new plant across the region may be approximately $1.5M
— There is scope for some harmonisation of services and changes to service levels in a merged council. The service profile illustrated some differences in service levels that could, over time, be more closely aligned under a merged council
Asset rationalisation
Consultations with the General Manager of West Tamar and former Acting General Manager from George Town suggests that opportunities for rationalisation of buildings and plant and equipment could materialise if the councils merged. The opportunities have not been factored into the modelling, as these would be decisions for a new merged council to take. However, those opportunities that have been identified are as follows:
George Town
— Realise existing council offices and replace with a smaller shop-front to continue to provide a customer-facing service as needed. It is estimated that George Town currently receive 30 customers per day.
— Scale back the tourism information centre and use more advanced technologies such as touch screen booths to provide visitor information
— Consider the findings of a study being undertaken into council owned buildings and evaluate the merits of retaining or realising under utilised facilities e.g. halls etc.
— The Works Depot is spacious and in good condition and would be retained, along with crews, but some plant rationalisation may be possible and new plant purchases avoided
West Tamar
— Realise the Beaconsfield Council Chambers. This is under used and currently hosts the council’s Corporate Services staff. Those staff could be relocated to the Riverside offices
— The Works Depots at Exeter and Riverside would be retained, along with crews, but some plant rationalisation may be possible
Service alignment and development opportunities
The Service Profile set out in Section 2.2 outlined the range of the services delivered by the councils. The key points to note from that assessment are:
— The councils generally possess and deliver the core corporate and governance related services. A merged Council may lead to some changes and improvements in risk management, legal services and marketing.
— The councils generally deliver the same core regulatory services. Natural Resource Management may benefit from a merged Council.
— West Tamar generally has a comparatively greater focus on community services in areas such as community participation, volunteer programs and youth services. There may be some scope for harmonisation of these services in a merged Council.
— The councils largely deliver similar core recreation and civil works services. There is some variation in service levels in some functions including community halls and sporting facilities and waste collection, where merged councils may be able to harmonise service levels.
— West Tamar has a considerably greater focus on health services, which are essentially an extension of the other community services outlined previously.
This suggests that there is scope for some harmonisation of services and changes to service levels in a merged council. Harmonisation has not been factored into the modelling as that will be a matter for a merged council. However it is noted that the councils are undertaking their own service improvement initiatives and asset rationalisation, and some of these opportunities are not contingent upon a merger.
Other potential impactsTamar Valley Council Feasibility Study
3.3 Financial assessment
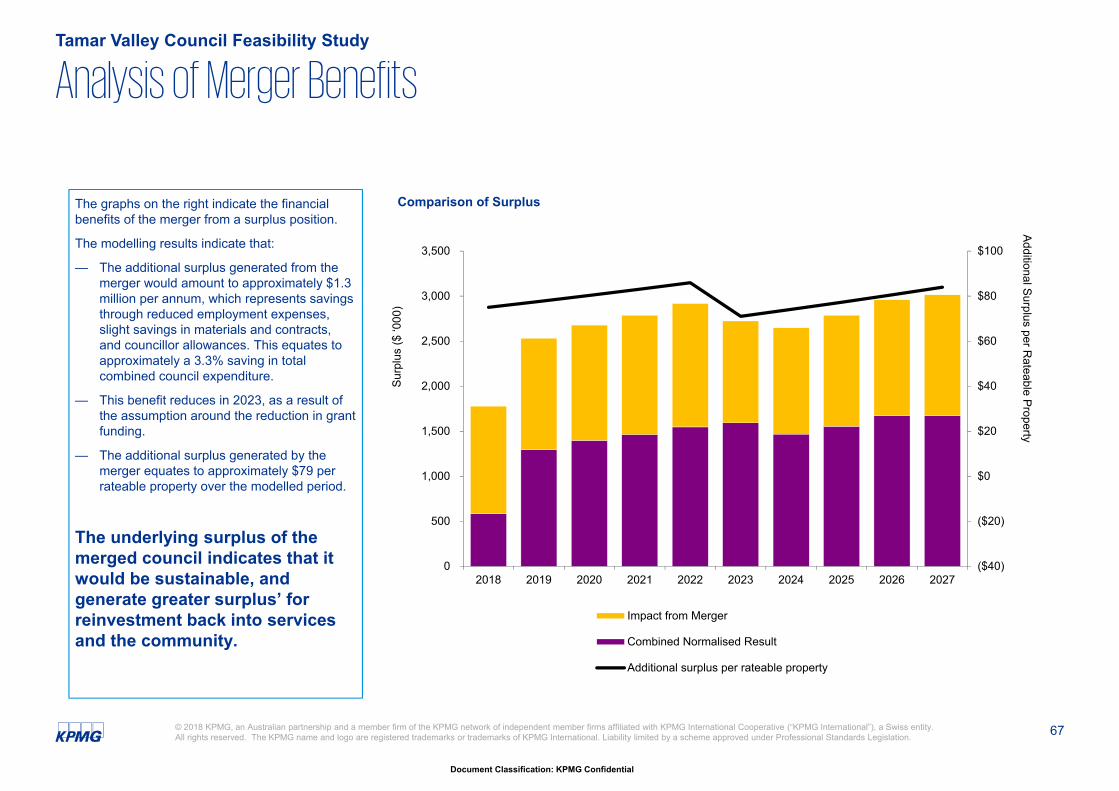
67
Document Classification: KPMG Confidential
© 2018 KPMG, an Australian partnership and a member firm of the KPMG network of independent member firms affiliated with KPMG International Cooperative (“KPMG International”), a Swiss entity. All rights reserved. The KPMG name and logo are registered trademarks or trademarks of KPMG International. Liability limited by a scheme approved under Professional Standards Legislation.
Analysis of Merger BenefitsTamar Valley Council Feasibility Study
The graphs on the right indicate the financial benefits of the merger from a surplus position.
The modelling results indicate that:
— The additional surplus generated from the merger would amount to approximately $1.3 million per annum, which represents savings through reduced employment expenses, slight savings in materials and contracts, and councillor allowances. This equates to approximately a 3.3% saving in total combined council expenditure.
— This benefit reduces in 2023, as a result of the assumption around the reduction in grant funding.
— The additional surplus generated by the merger equates to approximately $79 per rateable property over the modelled period.
The underlying surplus of the merged council indicates that it would be sustainable, and generate greater surplus’ for reinvestment back into services and the community.
($40)
($20)
$0
$20
$40
$60
$80
$100
0
500
1,000
1,500
2,000
2,500
3,000
3,500
2018 2019 2020 2021 2022 2023 2024 2025 2026 2027
Additional Surplus per Rateable Property
Surp
lus
($ ‘0
00)
Comparison of Surplus
Impact from Merger
Combined Normalised Result
Additional surplus per rateable property
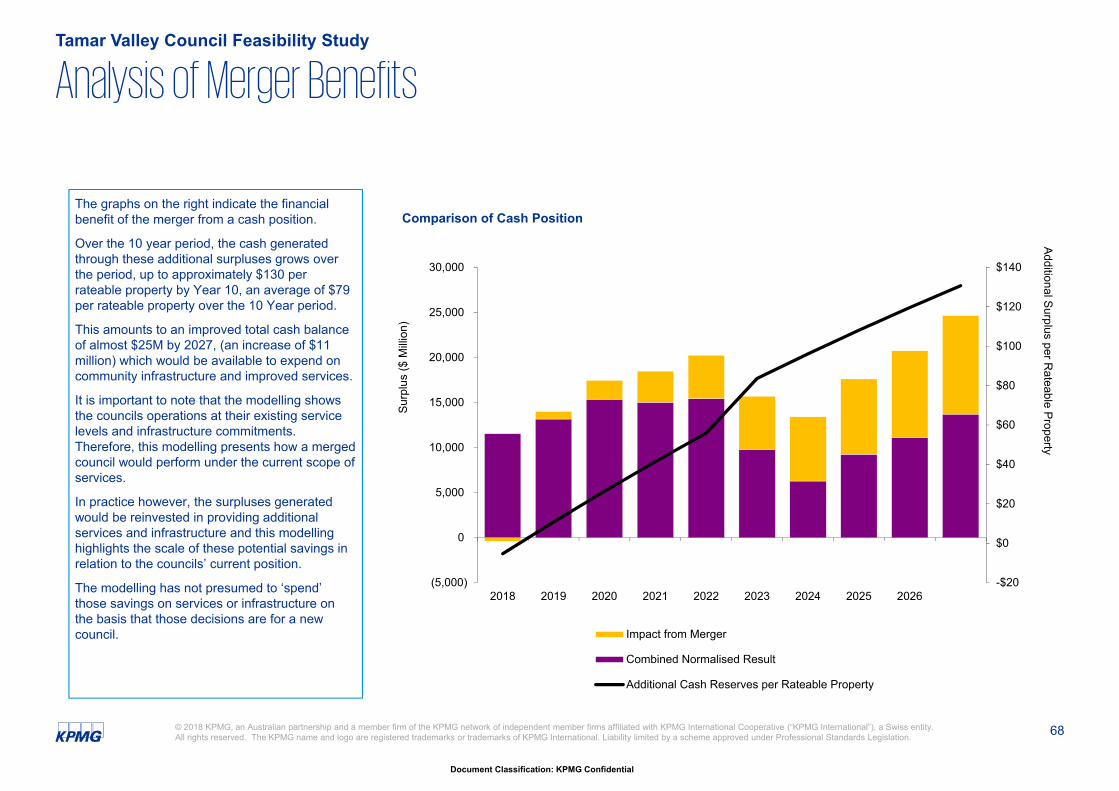
68
Document Classification: KPMG Confidential
© 2018 KPMG, an Australian partnership and a member firm of the KPMG network of independent member firms affiliated with KPMG International Cooperative (“KPMG International”), a Swiss entity. All rights reserved. The KPMG name and logo are registered trademarks or trademarks of KPMG International. Liability limited by a scheme approved under Professional Standards Legislation.
Analysis of Merger BenefitsTamar Valley Council Feasibility Study
The graphs on the right indicate the financial benefit of the merger from a cash position.
Over the 10 year period, the cash generated through these additional surpluses grows over the period, up to approximately $130 per rateable property by Year 10, an average of $79 per rateable property over the 10 Year period.
This amounts to an improved total cash balance of almost $25M by 2027, (an increase of $11 million) which would be available to expend on community infrastructure and improved services.
It is important to note that the modelling shows the councils operations at their existing service levels and infrastructure commitments. Therefore, this modelling presents how a merged council would perform under the current scope of services.
In practice however, the surpluses generated would be reinvested in providing additional services and infrastructure and this modelling highlights the scale of these potential savings in relation to the councils’ current position.
The modelling has not presumed to ‘spend’ those savings on services or infrastructure on the basis that those decisions are for a new council.
-$20
$0
$20
$40
$60
$80
$100
$120
$140
(5,000)
0
5,000
10,000
15,000
20,000
25,000
30,000
2018 2019 2020 2021 2022 2023 2024 2025 2026
Additional Surplus per Rateable Property
Surp
lus
($ M
illion
)
Comparison of Cash Position
Impact from Merger
Combined Normalised Result
Additional Cash Reserves per Rateable Property
3.4 Community and governance assessment
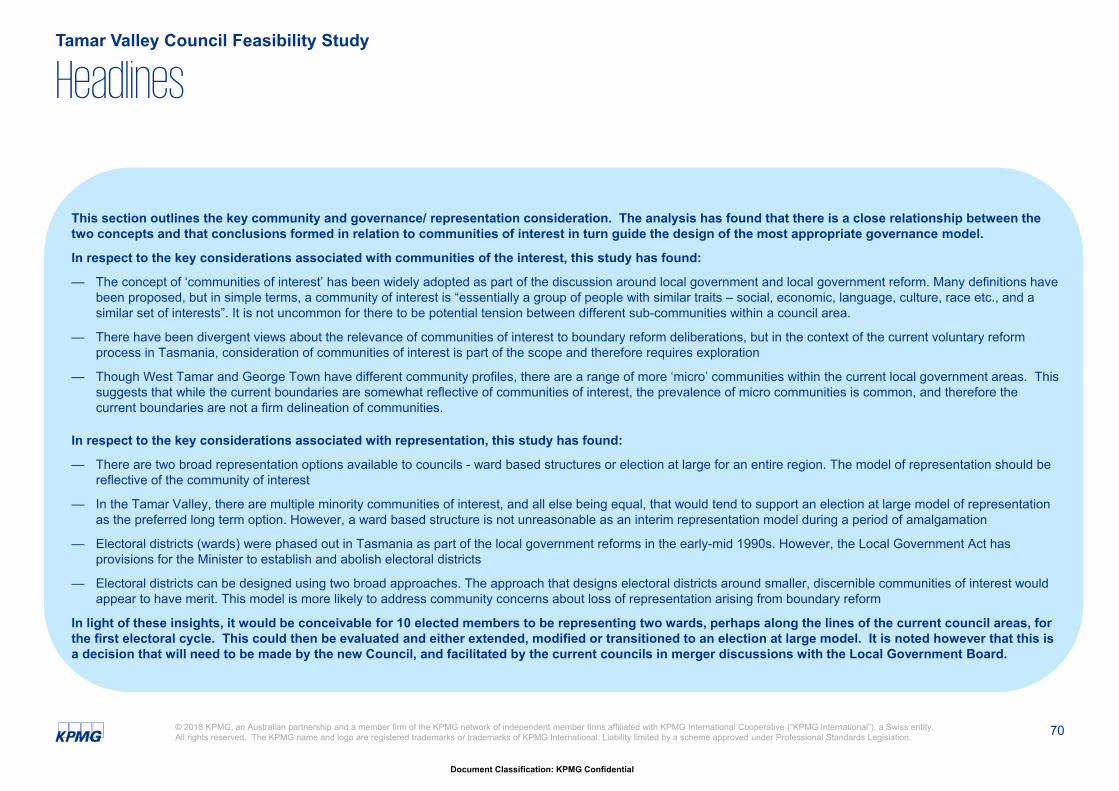
70
Document Classification: KPMG Confidential
© 2018 KPMG, an Australian partnership and a member firm of the KPMG network of independent member firms affiliated with KPMG International Cooperative (“KPMG International”), a Swiss entity. All rights reserved. The KPMG name and logo are registered trademarks or trademarks of KPMG International. Liability limited by a scheme approved under Professional Standards Legislation.
This section outlines the key community and governance/ representation consideration. The analysis has found that there is a close relationship between the two concepts and that conclusions formed in relation to communities of interest in turn guide the design of the most appropriate governance model.
In respect to the key considerations associated with communities of the interest, this study has found:
— The concept of ‘communities of interest’ has been widely adopted as part of the discussion around local government and local government reform. Many definitions have been proposed, but in simple terms, a community of interest is “essentially a group of people with similar traits – social, economic, language, culture, race etc., and a similar set of interests”. It is not uncommon for there to be potential tension between different sub-communities within a council area.
— There have been divergent views about the relevance of communities of interest to boundary reform deliberations, but in the context of the current voluntary reform process in Tasmania, consideration of communities of interest is part of the scope and therefore requires exploration
— Though West Tamar and George Town have different community profiles, there are a range of more ‘micro’ communities within the current local government areas. This suggests that while the current boundaries are somewhat reflective of communities of interest, the prevalence of micro communities is common, and therefore the current boundaries are not a firm delineation of communities.
In respect to the key considerations associated with representation, this study has found:
— There are two broad representation options available to councils - ward based structures or election at large for an entire region. The model of representation should be reflective of the community of interest
— In the Tamar Valley, there are multiple minority communities of interest, and all else being equal, that would tend to support an election at large model of representation as the preferred long term option. However, a ward based structure is not unreasonable as an interim representation model during a period of amalgamation
— Electoral districts (wards) were phased out in Tasmania as part of the local government reforms in the early-mid 1990s. However, the Local Government Act has provisions for the Minister to establish and abolish electoral districts
— Electoral districts can be designed using two broad approaches. The approach that designs electoral districts around smaller, discernible communities of interest would appear to have merit. This model is more likely to address community concerns about loss of representation arising from boundary reform
In light of these insights, it would be conceivable for 10 elected members to be representing two wards, perhaps along the lines of the current council areas, for the first electoral cycle. This could then be evaluated and either extended, modified or transitioned to an election at large model. It is noted however that this is a decision that will need to be made by the new Council, and facilitated by the current councils in merger discussions with the Local Government Board.
Tamar Valley Council Feasibility Study
Headlines
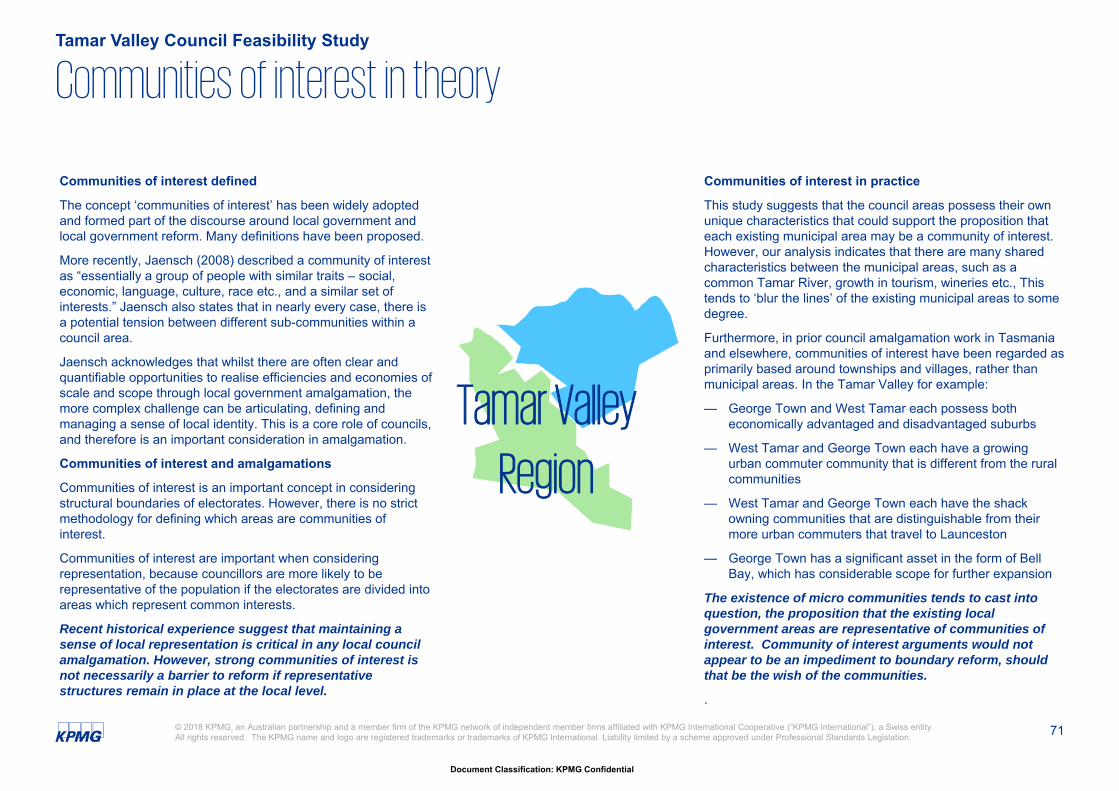
71
Document Classification: KPMG Confidential
© 2018 KPMG, an Australian partnership and a member firm of the KPMG network of independent member firms affiliated with KPMG International Cooperative (“KPMG International”), a Swiss entity. All rights reserved. The KPMG name and logo are registered trademarks or trademarks of KPMG International. Liability limited by a scheme approved under Professional Standards Legislation.
Communities of interest defined
The concept ‘communities of interest’ has been widely adopted and formed part of the discourse around local government and local government reform. Many definitions have been proposed.
More recently, Jaensch (2008) described a community of interest as “essentially a group of people with similar traits – social, economic, language, culture, race etc., and a similar set of interests.” Jaensch also states that in nearly every case, there is a potential tension between different sub-communities within a council area.
Jaensch acknowledges that whilst there are often clear and quantifiable opportunities to realise efficiencies and economies of scale and scope through local government amalgamation, the more complex challenge can be articulating, defining and managing a sense of local identity. This is a core role of councils, and therefore is an important consideration in amalgamation.
Communities of interest and amalgamations
Communities of interest is an important concept in considering structural boundaries of electorates. However, there is no strict methodology for defining which areas are communities of interest.
Communities of interest are important when considering representation, because councillors are more likely to be representative of the population if the electorates are divided into areas which represent common interests.
Recent historical experience suggest that maintaining a sense of local representation is critical in any local council amalgamation. However, strong communities of interest is not necessarily a barrier to reform if representative structures remain in place at the local level.
Communities of interest in practice
This study suggests that the council areas possess their own unique characteristics that could support the proposition that each existing municipal area may be a community of interest. However, our analysis indicates that there are many shared characteristics between the municipal areas, such as a common Tamar River, growth in tourism, wineries etc., This tends to ‘blur the lines’ of the existing municipal areas to some degree.
Furthermore, in prior council amalgamation work in Tasmania and elsewhere, communities of interest have been regarded as primarily based around townships and villages, rather than municipal areas. In the Tamar Valley for example:
— George Town and West Tamar each possess both economically advantaged and disadvantaged suburbs
— West Tamar and George Town each have a growing urban commuter community that is different from the rural communities
— West Tamar and George Town each have the shack owning communities that are distinguishable from their more urban commuters that travel to Launceston
— George Town has a significant asset in the form of Bell Bay, which has considerable scope for further expansion
The existence of micro communities tends to cast into question, the proposition that the existing local government areas are representative of communities of interest. Community of interest arguments would not appear to be an impediment to boundary reform, should that be the wish of the communities.
.
Communities of interest in theoryTamar Valley Council Feasibility Study
Tamar Valley
Region
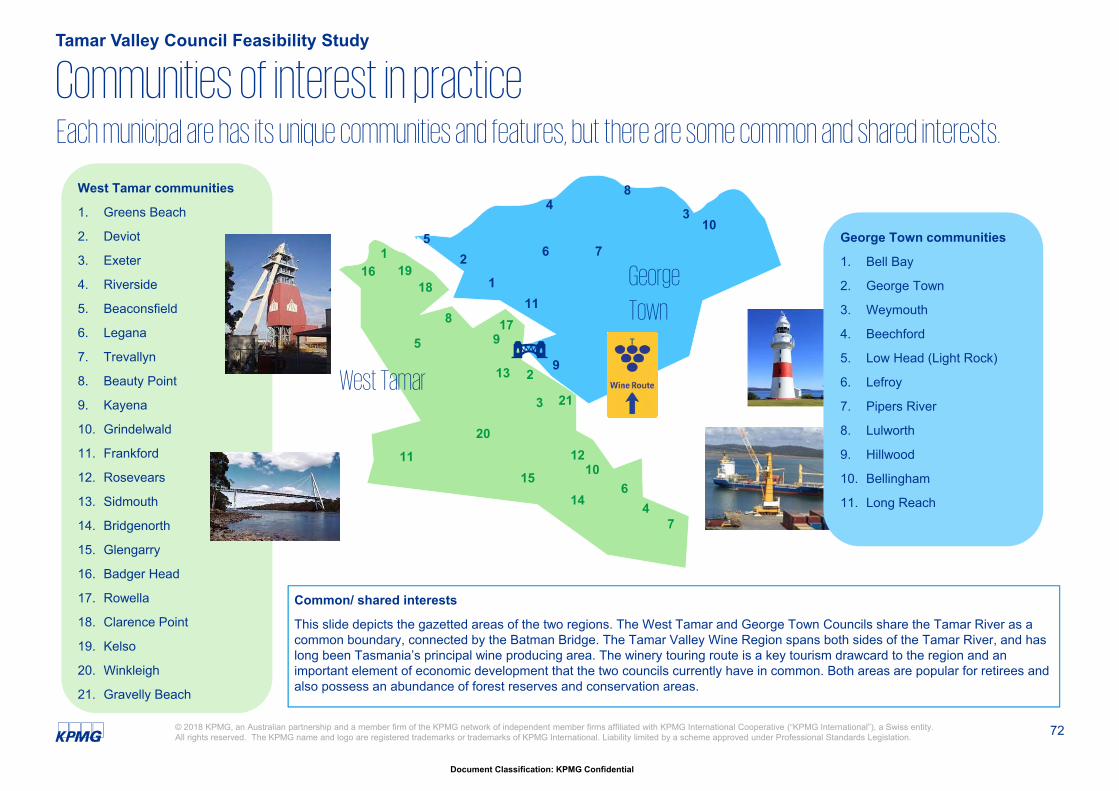
72
Document Classification: KPMG Confidential
© 2018 KPMG, an Australian partnership and a member firm of the KPMG network of independent member firms affiliated with KPMG International Cooperative (“KPMG International”), a Swiss entity. All rights reserved. The KPMG name and logo are registered trademarks or trademarks of KPMG International. Liability limited by a scheme approved under Professional Standards Legislation.
Each municipal are has its unique communities and features, but there are some common and shared interests.
Tamar Valley Council Feasibility Study
Communities of interest in practice
Common/ shared interests
This slide depicts the gazetted areas of the two regions. The West Tamar and George Town Councils share the Tamar River as a common boundary, connected by the Batman Bridge. The Tamar Valley Wine Region spans both sides of the Tamar River, and has long been Tasmania’s principal wine producing area. The winery touring route is a key tourism drawcard to the region and an important element of economic development that the two councils currently have in common. Both areas are popular for retirees and also possess an abundance of forest reserves and conservation areas.
West Tamar communities
1. Greens Beach
2. Deviot
3. Exeter
4. Riverside
5. Beaconsfield
6. Legana
7. Trevallyn
8. Beauty Point
9. Kayena
10. Grindelwald
11. Frankford
12. Rosevears
13. Sidmouth
14. Bridgenorth
15. Glengarry
16. Badger Head
17. Rowella
18. Clarence Point
19. Kelso
20. Winkleigh
21. Gravelly Beach
George
Town
West Tamar
1
8
2
3
9
10
4
5
6
7
1
25
7
34
6
8
9
11
10
11
1215
20
13
14
21
16 1918
17
George Town communities
1. Bell Bay
2. George Town
3. Weymouth
4. Beechford
5. Low Head (Light Rock)
6. Lefroy
7. Pipers River
8. Lulworth
9. Hillwood
10. Bellingham
11. Long Reach
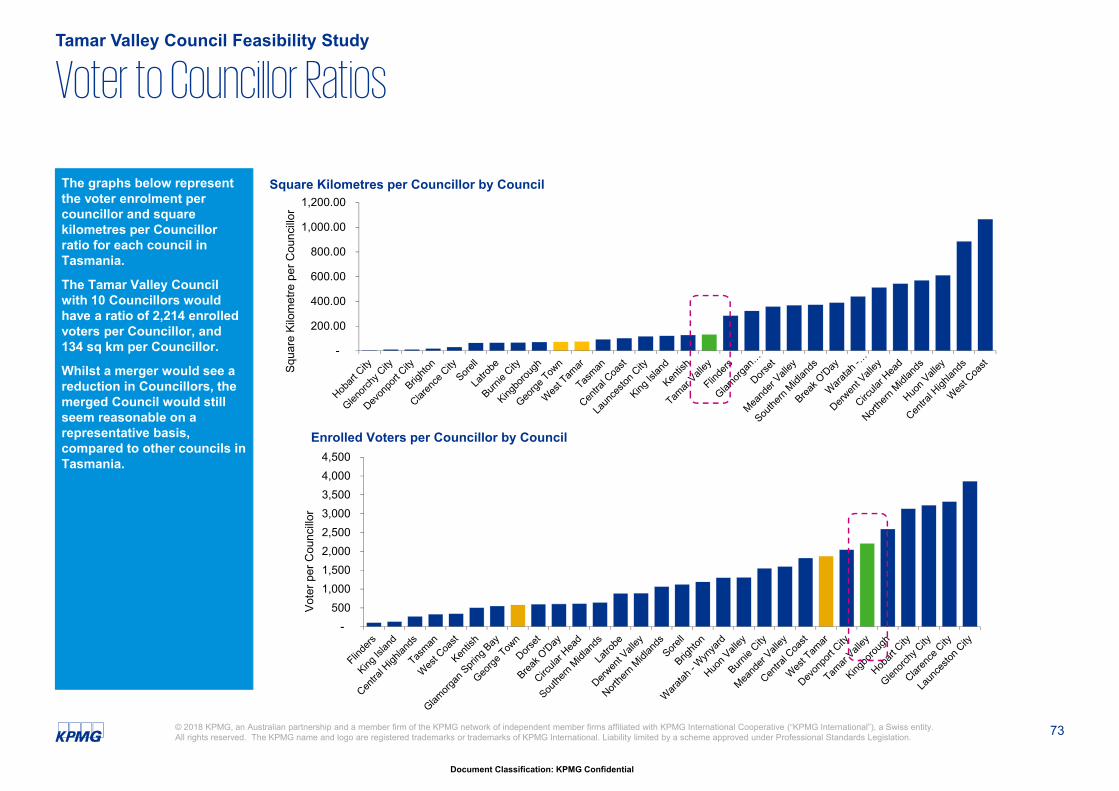
73
Document Classification: KPMG Confidential
© 2018 KPMG, an Australian partnership and a member firm of the KPMG network of independent member firms affiliated with KPMG International Cooperative (“KPMG International”), a Swiss entity. All rights reserved. The KPMG name and logo are registered trademarks or trademarks of KPMG International. Liability limited by a scheme approved under Professional Standards Legislation.
The graphs below represent the voter enrolment per councillor and square kilometres per Councillor ratio for each council in Tasmania.
The Tamar Valley Council with 10 Councillors would have a ratio of 2,214 enrolled voters per Councillor, and 134 sq km per Councillor.
Whilst a merger would see a reduction in Councillors, the merged Council would still seem reasonable on a representative basis, compared to other councils in Tasmania.
Voter to Councillor RatiosTamar Valley Council Feasibility Study
- 500
1,000 1,500 2,000 2,500 3,000 3,500 4,000 4,500
Vote
r per
Cou
ncillo
r
Enrolled Voters per Councillor by Council
-
200.00
400.00
600.00
800.00
1,000.00
1,200.00
Squa
re K
ilom
etre
per
Cou
ncillo
r
Square Kilometres per Councillor by Council
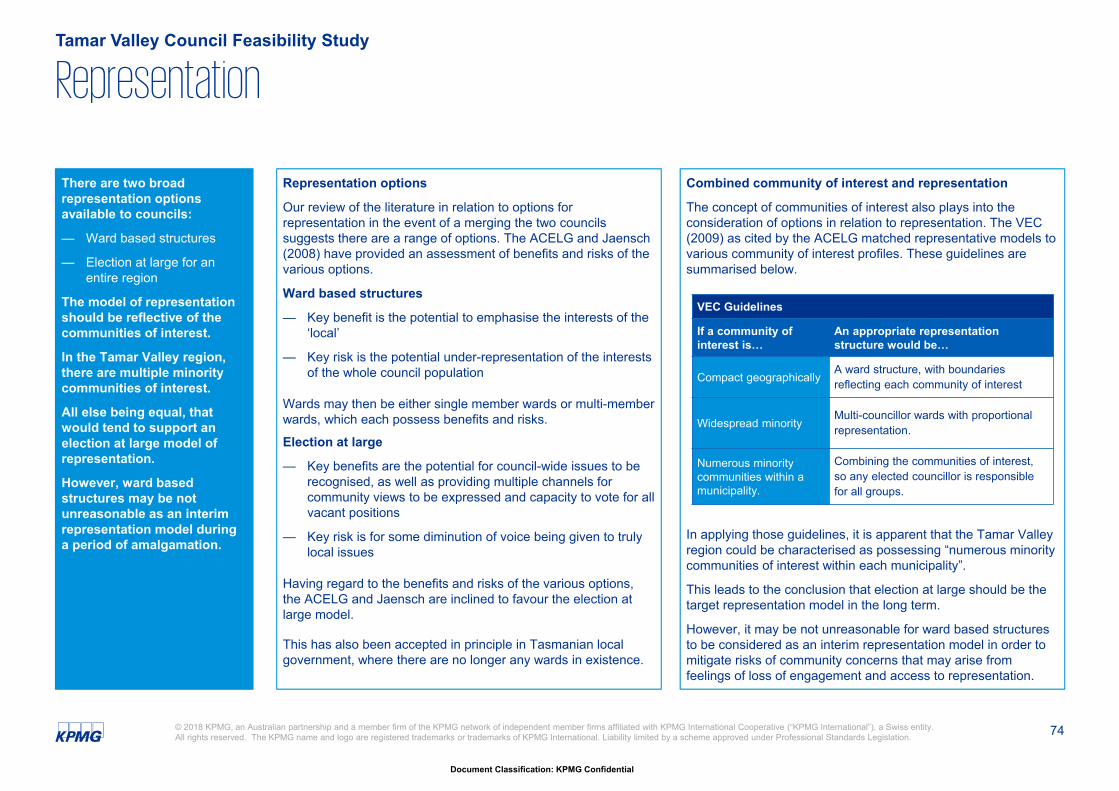
74
Document Classification: KPMG Confidential
© 2018 KPMG, an Australian partnership and a member firm of the KPMG network of independent member firms affiliated with KPMG International Cooperative (“KPMG International”), a Swiss entity. All rights reserved. The KPMG name and logo are registered trademarks or trademarks of KPMG International. Liability limited by a scheme approved under Professional Standards Legislation.
There are two broad representation options available to councils:
— Ward based structures
— Election at large for an entire region
The model of representation should be reflective of the communities of interest.
In the Tamar Valley region, there are multiple minority communities of interest.
All else being equal, that would tend to support an election at large model of representation.
However, ward based structures may be not unreasonable as an interim representation model during a period of amalgamation.
Representation options
Our review of the literature in relation to options for representation in the event of a merging the two councils suggests there are a range of options. The ACELG and Jaensch (2008) have provided an assessment of benefits and risks of the various options.
Ward based structures
— Key benefit is the potential to emphasise the interests of the ‘local’
— Key risk is the potential under-representation of the interests of the whole council population
Wards may then be either single member wards or multi-member wards, which each possess benefits and risks.
Election at large
— Key benefits are the potential for council-wide issues to be recognised, as well as providing multiple channels for community views to be expressed and capacity to vote for all vacant positions
— Key risk is for some diminution of voice being given to truly local issues
Having regard to the benefits and risks of the various options, the ACELG and Jaensch are inclined to favour the election at large model.
This has also been accepted in principle in Tasmanian local government, where there are no longer any wards in existence.
Combined community of interest and representation
The concept of communities of interest also plays into the consideration of options in relation to representation. The VEC (2009) as cited by the ACELG matched representative models to various community of interest profiles. These guidelines are summarised below.
In applying those guidelines, it is apparent that the Tamar Valley region could be characterised as possessing “numerous minority communities of interest within each municipality”.
This leads to the conclusion that election at large should be the target representation model in the long term.
However, it may be not unreasonable for ward based structures to be considered as an interim representation model in order to mitigate risks of community concerns that may arise from feelings of loss of engagement and access to representation.
RepresentationTamar Valley Council Feasibility Study
VEC Guidelines
If a community of interest is…
An appropriate representation structure would be…
Compact geographicallyA ward structure, with boundaries reflecting each community of interest
Widespread minorityMulti-councillor wards with proportional representation.
Numerous minoritycommunities within a municipality.
Combining the communities of interest, so any elected councillor is responsible for all groups.
75
Document Classification: KPMG Confidential
© 2018 KPMG, an Australian partnership and a member firm of the KPMG network of independent member firms affiliated with KPMG International Cooperative (“KPMG International”), a Swiss entity. All rights reserved. The KPMG name and logo are registered trademarks or trademarks of KPMG International. Liability limited by a scheme approved under Professional Standards Legislation.
Electoral districts (wards) were phased out in Tasmania as part of the local government reforms in the early-mid 1990s.
The Local Government Act has provisions for the Minister to establish and abolish electoral districts.
Electoral districts can be designed using two broad approaches.
The approach that designs electoral districts around smaller, discernible communities of interest would appear to have merit. This model is more likely to address community concerns about loss of representation arising from boundary reform.
Electoral districts
In the past before the large-scale amalgamations of the 1990s, 42 of the 46 councils that existed had wards. On the establishment of the Local Government Act 1993, wards were effectively relabelled electoral districts.
The Kentish Council was the last council in Tasmania to have wards. The council had fived wards - Barrington, Railton, Roland, Sheffield and Wilmot, represented by 15 elected members 3 elected members per ward. The Council was 1187 square kilometres and had a population of 5,500. The representation ratio of the council was 550 heads per councillor. In 1996, the electoral districts were abolished and the number of elected members was reduced to 10. Currently in Tasmania, no existing council has electoral districts.
Legislation in Tasmania
Section 17 of the Local Government Act 1993 allows for a municipal area to be divided into two or more electoral districts. Section 214E of the Act states that as a result of any review, the governor, by order and on the recommendation of the Minister may do any of the following in relation to electoral districts:
— Determine the number of persons to be elected in respect of each electoral district
— Divide a municipal area into 2 or more electoral districts
— Abolish the division of a municipal area into electoral districts
— Alter the boundaries of an electoral district
— Combine 2 or more electoral districts in a municipal area to form one electoral district
— Name or change the name of an electoral district.
Electoral districts for the Tamar Valley
Research shows there are two broad methods to establish ward boundaries.
Method 1 is to reflect a dominant community of interest. Dominant communities of interests may include:
1. the more urban industrial, commercial and residential groups
2. the satellite commuter communities
3. the more rural regions/ townships
A method such as this may allow wards to represent each community of interest but may reduce focus on council wide issues.
Method 2 is to deliberately include a mix of communities of interest within the wards. That is, each ward would comprise a combination of urban, satellite and rural elements.
This would encourage representatives from each of the wards to consider council wide issues but may have the potential to overlook narrower, economic and sector interests.
In the context of local government reform, and having regard to potential community anxiety about the risk of loss of access to representation, Method 1 would appear to have merit.
The final design of the model would be a matter for the councils to determine in consultation with their communities and State Government. However, by way of illustration, 10 elected members over two wards (perhaps based on the existing council areas for one electoral cycle may be not unreasonable, before moving to the election at large model.
Representation Tamar Valley Council Feasibility Study
76
Document Classification: KPMG Confidential
© 2018 KPMG, an Australian partnership and a member firm of the KPMG network of independent member firms affiliated with KPMG International Cooperative (“KPMG International”), a Swiss entity. All rights reserved. The KPMG name and logo are registered trademarks or trademarks of KPMG International. Liability limited by a scheme approved under Professional Standards Legislation.
A reduction in councilor number as a result of a merger is often seen as a synonymous with a Loss of access to local governance and representation.
That may be so, all else being equal. However, with expanded community access to social media, internet based transactions with councils and other innovative models of representation established to augment the traditional councilor model, there should be ways for an expanded Tamar valley Council to maintain access to representation.
The formation of West Tamar in 1993 has maintained ratepayer satisfaction in the formerly separate Beaconsfield area and provides some insights into how a merged council can work to maintain access to representation.
Other models of representation1
“There is a growing level of both interest and practice in experimenting with new ways of working with com‐ munities ... yet there is a wide diversity of views on when and how to involve the community”2
Community governance at the local government level generally involves engaging the community in the decision‐making process while keeping the final decision making responsibilities with council.
There is a current shift within NSW local government towards more evolved models of community governance, which can be seen in the number of councils that are:
— Working more closely with community groups on specific issues or projects
— Devolving the delivery of services to community based organisations (e.g. children’s services)
— Engaging with the community regarding land use planning and development control
— Increasing the level of community engagement
Community Boards, sometimes called local boards, are a form of community governance established to support the work of a larger regional council.
This model of governance can result in enhanced local representation and decision making, as decisions that affect the local community are made by the Community Board, whereas strategic decisions that affect the region as a whole are made at the Regional Council level.
Lessons from the creation of West Tamar
In 1993, a Local Government Advisory Board (LGAB), report resulted in substantial changes to council boundaries across the whole State. The LGAB’s report resulted in a reduction in the number of Tasmanian councils from 46 to 29, and was accompanied by substantial changes to the legislation under which local government operates.
As part of these reforms, the West Tamar Council was inaugurated on the 2nd April 1993, with offices since retained in Riverside, Exeter and Beaconsfield. Prior to this inauguration, the Beaconsfield region was a separate local government area.
This area is therefore familiar with boundary reform and West Tamar Council considers that the residents of the former Beaconsfield municipal area are now ‘at ease’ with the current arrangements, evidenced by community surveys.
A reduction in the number of councilors in the West Tamar and George Town council areas from 18 down to 10, would invariably encounter some resistance.
However, with the passage of time, earlier reforms suggest that concerns about loss of representation are likely to subside. Providing a new Tamar Valley Council engages proactively, regularly and constructively with its community, a merged council need not necessarily equate to a material loss in access to representation.
Other models of representationTamar Valley Council Feasibility Study
1. Representation and Decision Making: Local Government Review Panel, 20122 Evolution in Community Governance – Building on What Works, Australian Centre of Excellence for Local Government, 2012
4. Conclusions
4.1 Assessment against Principles
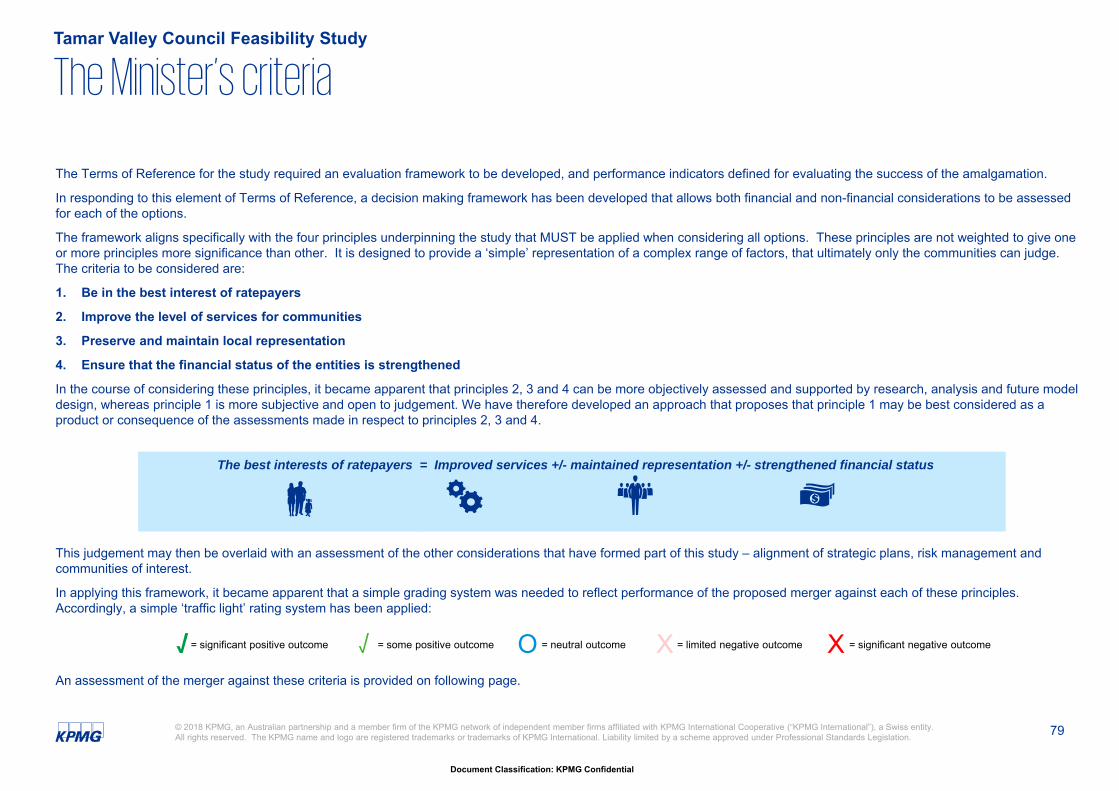
79
Document Classification: KPMG Confidential
© 2018 KPMG, an Australian partnership and a member firm of the KPMG network of independent member firms affiliated with KPMG International Cooperative (“KPMG International”), a Swiss entity. All rights reserved. The KPMG name and logo are registered trademarks or trademarks of KPMG International. Liability limited by a scheme approved under Professional Standards Legislation.
The Terms of Reference for the study required an evaluation framework to be developed, and performance indicators defined for evaluating the success of the amalgamation.
In responding to this element of Terms of Reference, a decision making framework has been developed that allows both financial and non-financial considerations to be assessed for each of the options.
The framework aligns specifically with the four principles underpinning the study that MUST be applied when considering all options. These principles are not weighted to give one or more principles more significance than other. It is designed to provide a ‘simple’ representation of a complex range of factors, that ultimately only the communities can judge. The criteria to be considered are:
1. Be in the best interest of ratepayers
2. Improve the level of services for communities
3. Preserve and maintain local representation
4. Ensure that the financial status of the entities is strengthened
In the course of considering these principles, it became apparent that principles 2, 3 and 4 can be more objectively assessed and supported by research, analysis and future model design, whereas principle 1 is more subjective and open to judgement. We have therefore developed an approach that proposes that principle 1 may be best considered as a product or consequence of the assessments made in respect to principles 2, 3 and 4.
This judgement may then be overlaid with an assessment of the other considerations that have formed part of this study – alignment of strategic plans, risk management and communities of interest.
In applying this framework, it became apparent that a simple grading system was needed to reflect performance of the proposed merger against each of these principles. Accordingly, a simple ‘traffic light’ rating system has been applied:
An assessment of the merger against these criteria is provided on following page.
The Minister’s criteria
The best interests of ratepayers = Improved services +/- maintained representation +/- strengthened financial status
Tamar Valley Council Feasibility Study
= significant positive outcome = some positive outcome = neutral outcome = limited negative outcome = significant negative outcome√ √ O X X
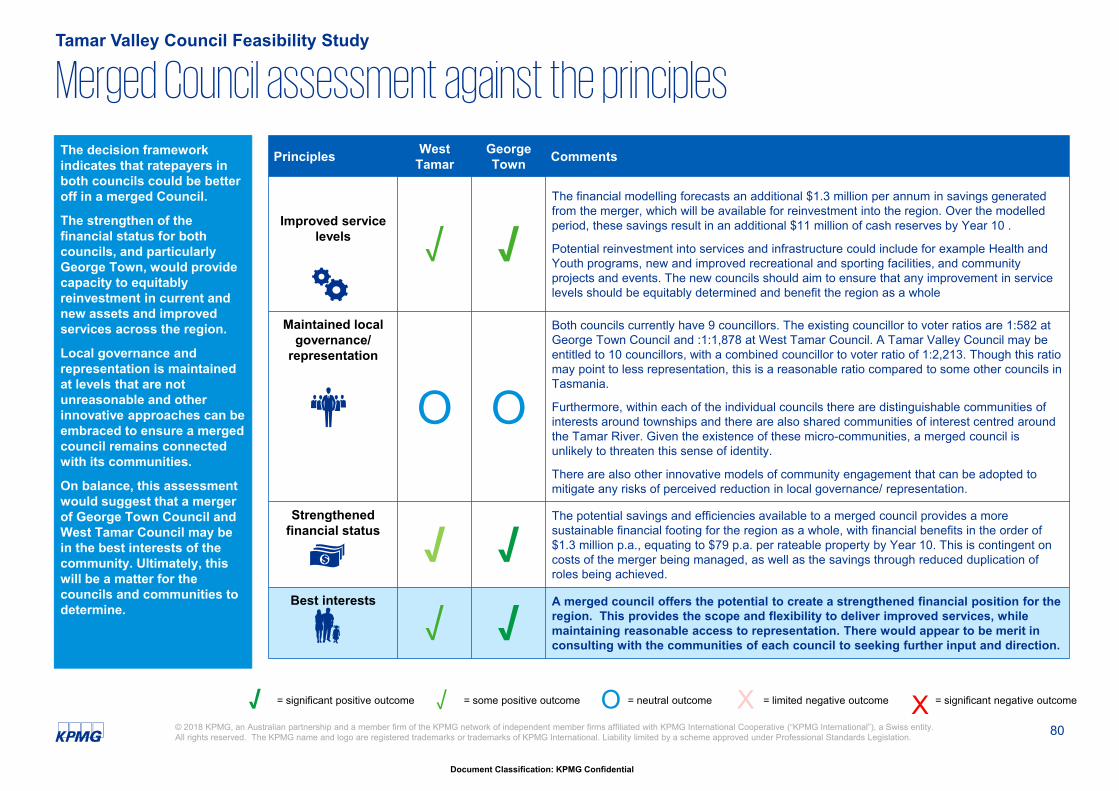
80
Document Classification: KPMG Confidential
© 2018 KPMG, an Australian partnership and a member firm of the KPMG network of independent member firms affiliated with KPMG International Cooperative (“KPMG International”), a Swiss entity. All rights reserved. The KPMG name and logo are registered trademarks or trademarks of KPMG International. Liability limited by a scheme approved under Professional Standards Legislation.
The decision framework indicates that ratepayers in both councils could be better off in a merged Council.
The strengthen of the financial status for both councils, and particularly George Town, would provide capacity to equitably reinvestment in current and new assets and improved services across the region.
Local governance and representation is maintained at levels that are not unreasonable and other innovative approaches can be embraced to ensure a merged council remains connected with its communities.
On balance, this assessment would suggest that a merger of George Town Council and West Tamar Council may be in the best interests of the community. Ultimately, this will be a matter for the councils and communities to determine.
Merged Council assessment against the principlesTamar Valley Council Feasibility Study
Principles West Tamar
George Town Comments
Improved servicelevels √ √
The financial modelling forecasts an additional $1.3 million per annum in savings generated from the merger, which will be available for reinvestment into the region. Over the modelled period, these savings result in an additional $11 million of cash reserves by Year 10 .
Potential reinvestment into services and infrastructure could include for example Health and Youth programs, new and improved recreational and sporting facilities, and community projects and events. The new councils should aim to ensure that any improvement in service levels should be equitably determined and benefit the region as a whole
Maintained local governance/
representation
O O
Both councils currently have 9 councillors. The existing councillor to voter ratios are 1:582 at George Town Council and :1:1,878 at West Tamar Council. A Tamar Valley Council may be entitled to 10 councillors, with a combined councillor to voter ratio of 1:2,213. Though this ratio may point to less representation, this is a reasonable ratio compared to some other councils in Tasmania.
Furthermore, within each of the individual councils there are distinguishable communities of interests around townships and there are also shared communities of interest centred around the Tamar River. Given the existence of these micro-communities, a merged council is unlikely to threaten this sense of identity.
There are also other innovative models of community engagement that can be adopted to mitigate any risks of perceived reduction in local governance/ representation.
Strengthenedfinancial status √ √
The potential savings and efficiencies available to a merged council provides a more sustainable financial footing for the region as a whole, with financial benefits in the order of $1.3 million p.a., equating to $79 p.a. per rateable property by Year 10. This is contingent on costs of the merger being managed, as well as the savings through reduced duplication of roles being achieved.
Best interests
√ √A merged council offers the potential to create a strengthened financial position for the region. This provides the scope and flexibility to deliver improved services, while maintaining reasonable access to representation. There would appear to be merit in consulting with the communities of each council to seeking further input and direction.
= significant positive outcome = some positive outcome = neutral outcome = limited negative outcome = significant negative outcomeXO X√√
4.2 Potential Transition arrangements
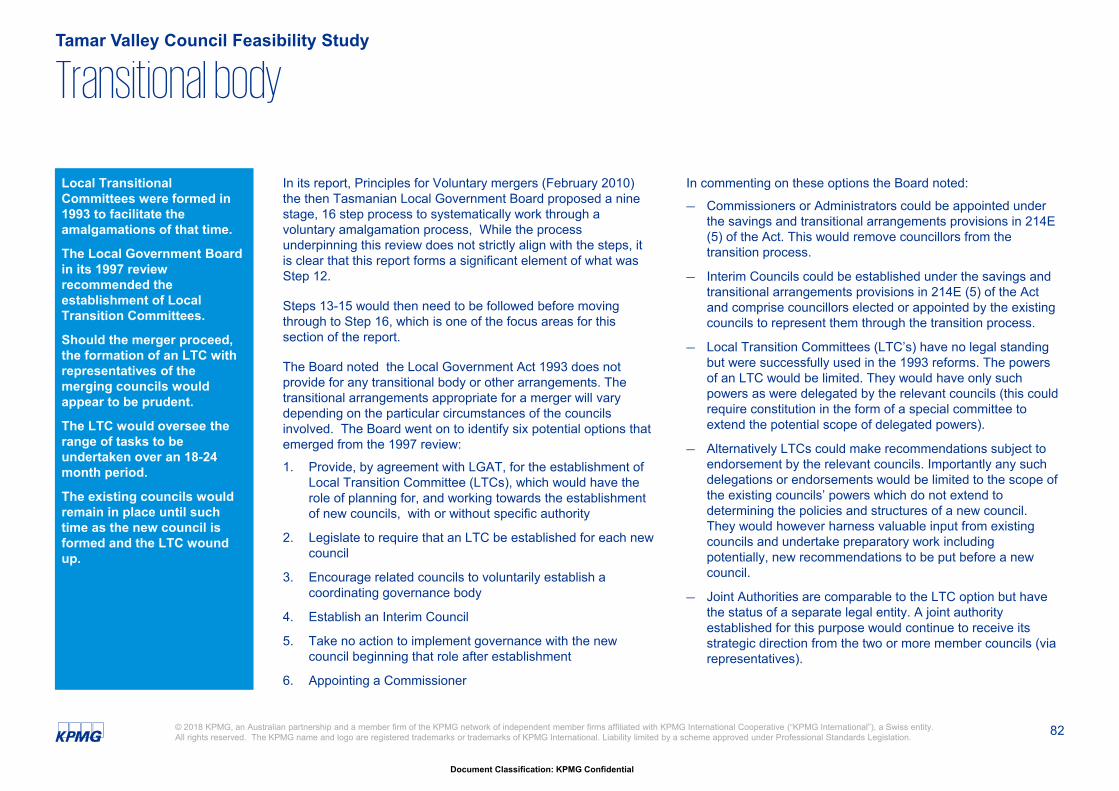
82
Document Classification: KPMG Confidential
© 2018 KPMG, an Australian partnership and a member firm of the KPMG network of independent member firms affiliated with KPMG International Cooperative (“KPMG International”), a Swiss entity. All rights reserved. The KPMG name and logo are registered trademarks or trademarks of KPMG International. Liability limited by a scheme approved under Professional Standards Legislation.
Local Transitional Committees were formed in 1993 to facilitate the amalgamations of that time.
The Local Government Board in its 1997 review recommended the establishment of Local Transition Committees.
Should the merger proceed, the formation of an LTC with representatives of the merging councils would appear to be prudent.
The LTC would oversee the range of tasks to be undertaken over an 18-24 month period.
The existing councils would remain in place until such time as the new council is formed and the LTC wound up.
In its report, Principles for Voluntary mergers (February 2010) the then Tasmanian Local Government Board proposed a nine stage, 16 step process to systematically work through a voluntary amalgamation process, While the process underpinning this review does not strictly align with the steps, it is clear that this report forms a significant element of what was Step 12.
Steps 13-15 would then need to be followed before moving through to Step 16, which is one of the focus areas for this section of the report.
The Board noted the Local Government Act 1993 does not provide for any transitional body or other arrangements. The transitional arrangements appropriate for a merger will vary depending on the particular circumstances of the councils involved. The Board went on to identify six potential options that emerged from the 1997 review:
1. Provide, by agreement with LGAT, for the establishment of Local Transition Committee (LTCs), which would have the role of planning for, and working towards the establishment of new councils, with or without specific authority
2. Legislate to require that an LTC be established for each new council
3. Encourage related councils to voluntarily establish a coordinating governance body
4. Establish an Interim Council
5. Take no action to implement governance with the new council beginning that role after establishment
6. Appointing a Commissioner
In commenting on these options the Board noted:
— Commissioners or Administrators could be appointed under the savings and transitional arrangements provisions in 214E (5) of the Act. This would remove councillors from the transition process.
— Interim Councils could be established under the savings and transitional arrangements provisions in 214E (5) of the Act and comprise councillors elected or appointed by the existing councils to represent them through the transition process.
— Local Transition Committees (LTC’s) have no legal standing but were successfully used in the 1993 reforms. The powers of an LTC would be limited. They would have only such powers as were delegated by the relevant councils (this could require constitution in the form of a special committee to extend the potential scope of delegated powers).
— Alternatively LTCs could make recommendations subject to endorsement by the relevant councils. Importantly any such delegations or endorsements would be limited to the scope of the existing councils’ powers which do not extend to determining the policies and structures of a new council. They would however harness valuable input from existing councils and undertake preparatory work including potentially, new recommendations to be put before a new council.
— Joint Authorities are comparable to the LTC option but have the status of a separate legal entity. A joint authority established for this purpose would continue to receive its strategic direction from the two or more member councils (via representatives).
Transitional bodyTamar Valley Council Feasibility Study
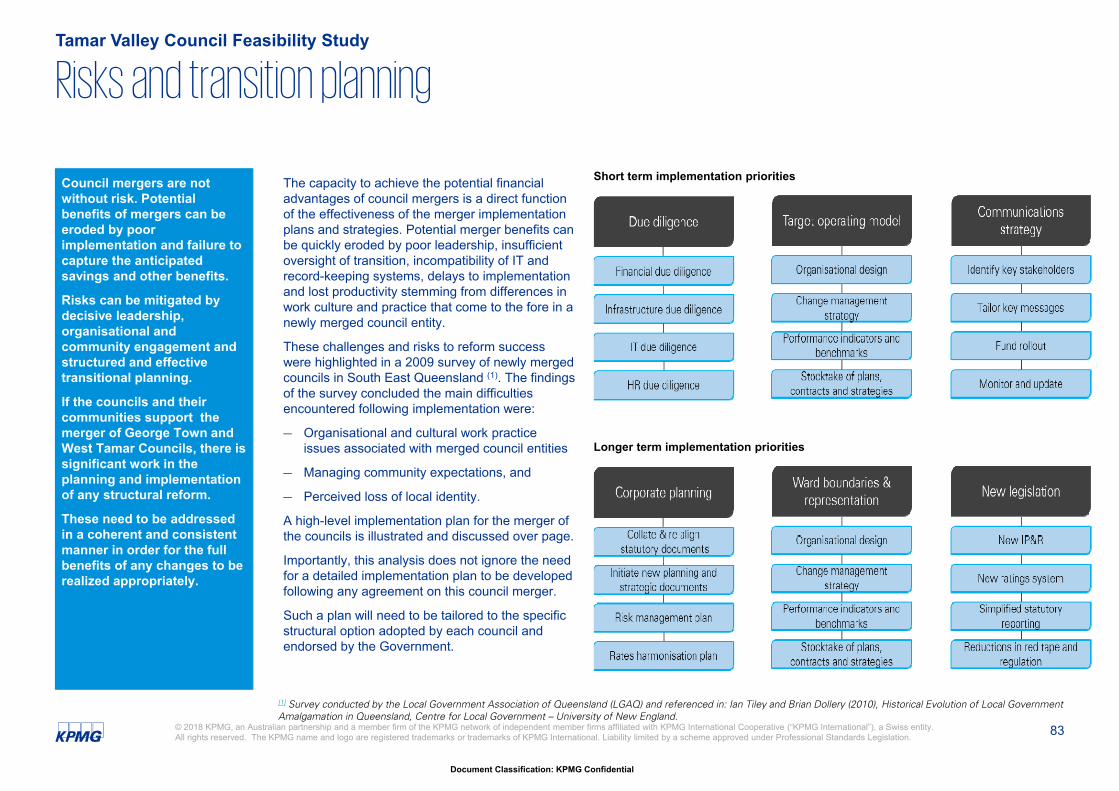
83
Document Classification: KPMG Confidential
© 2018 KPMG, an Australian partnership and a member firm of the KPMG network of independent member firms affiliated with KPMG International Cooperative (“KPMG International”), a Swiss entity. All rights reserved. The KPMG name and logo are registered trademarks or trademarks of KPMG International. Liability limited by a scheme approved under Professional Standards Legislation.
Council mergers are not without risk. Potential benefits of mergers can be eroded by poor implementation and failure to capture the anticipated savings and other benefits.
Risks can be mitigated by decisive leadership, organisational and community engagement and structured and effective transitional planning.
If the councils and their communities support the merger of George Town and West Tamar Councils, there is significant work in the planning and implementation of any structural reform.
These need to be addressed in a coherent and consistent manner in order for the full benefits of any changes to be realized appropriately.
The capacity to achieve the potential financial advantages of council mergers is a direct function of the effectiveness of the merger implementation plans and strategies. Potential merger benefits can be quickly eroded by poor leadership, insufficient oversight of transition, incompatibility of IT and record-keeping systems, delays to implementation and lost productivity stemming from differences in work culture and practice that come to the fore in a newly merged council entity.
These challenges and risks to reform success were highlighted in a 2009 survey of newly merged councils in South East Queensland (1). The findings of the survey concluded the main difficulties encountered following implementation were:
— Organisational and cultural work practice issues associated with merged council entities
— Managing community expectations, and
— Perceived loss of local identity.
A high-level implementation plan for the merger of the councils is illustrated and discussed over page.
Importantly, this analysis does not ignore the need for a detailed implementation plan to be developed following any agreement on this council merger.
Such a plan will need to be tailored to the specific structural option adopted by each council and endorsed by the Government.
Risks and transition planningTamar Valley Council Feasibility Study
Short term implementation priorities
Longer term implementation priorities
[1] Survey conducted by the Local Government Association of Queensland (LGAQ) and referenced in: Ian Tiley and Brian Dollery (2010), Historical Evolution of Local Government Amalgamation in Queensland, Centre for Local Government – University of New England.

84
Document Classification: KPMG Confidential
© 2018 KPMG, an Australian partnership and a member firm of the KPMG network of independent member firms affiliated with KPMG International Cooperative (“KPMG International”), a Swiss entity. All rights reserved. The KPMG name and logo are registered trademarks or trademarks of KPMG International. Liability limited by a scheme approved under Professional Standards Legislation.
Next StepsTamar Valley Council Feasibility Study
Transition Schedule
Year 1 Year 2 Year 3
Council consideration and community consultation
Board Reviews
Due Diligence
Operating model design
Representation model design
Council decision to
request Local Government
Board Review
Minister/ Governor approval to merge
Local Transition Committee formed
Organisation and representation
design completed
Council election and implementation of designs
New council commences
operation
An initial 9-12 month period of council deliberations and community consultation will be required.
Should the council determine to proceed further, a Local Government Board Review will be undertaken.
Should that review find in favour of the merger and be endorsed by the councils, an indicative implementation schedule at this stage would propose that an 18-24 month period of transition may be required for a Tamar Valley Council to commence operation.
On balance, a merger may be in the best interest of ratepayers. However, there are a number of steps in any transition, including an initial period of community consultation to gauge the views of the existing communities. This is an essential first step to ensure the councils can make an informed judgment. An outline of the potential next steps is provided below, as a guide only.
Each council and its community should now determine a position in respect to the merger, and weigh up the potential costs and benefits.

DRAFT
Appendix 1
Study Requirements
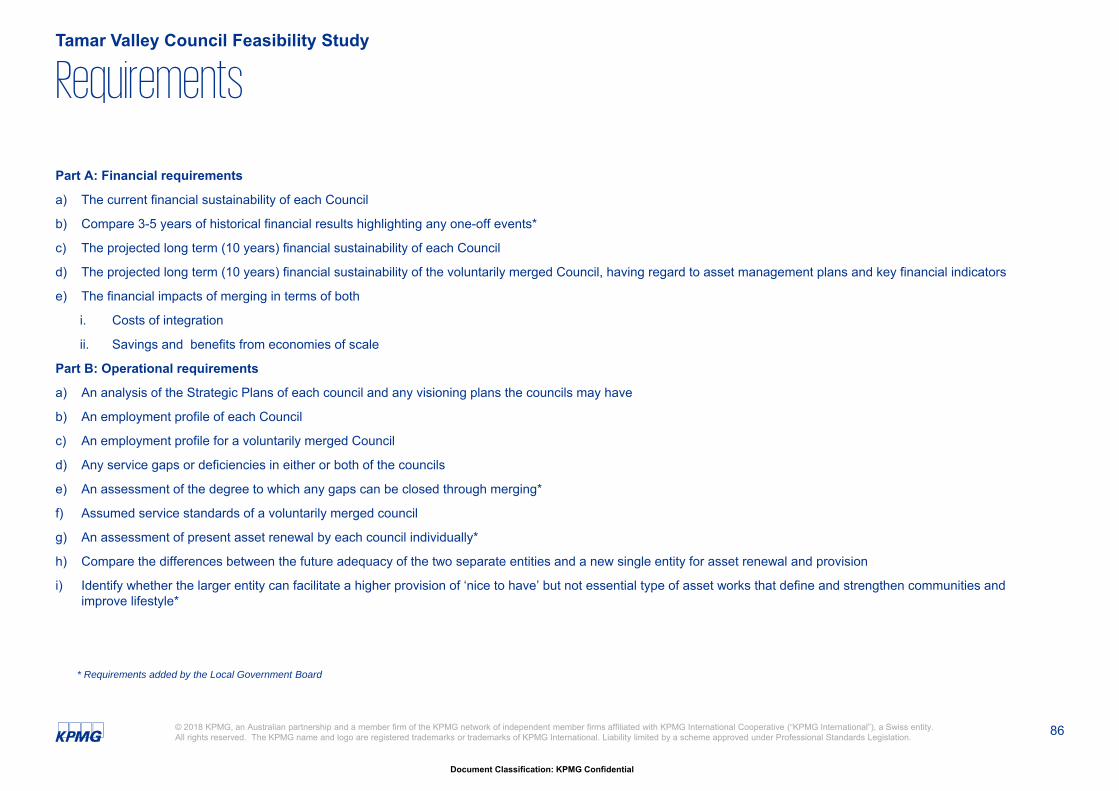
86
Document Classification: KPMG Confidential
© 2018 KPMG, an Australian partnership and a member firm of the KPMG network of independent member firms affiliated with KPMG International Cooperative (“KPMG International”), a Swiss entity. All rights reserved. The KPMG name and logo are registered trademarks or trademarks of KPMG International. Liability limited by a scheme approved under Professional Standards Legislation.
Part A: Financial requirements
a) The current financial sustainability of each Council
b) Compare 3-5 years of historical financial results highlighting any one-off events*
c) The projected long term (10 years) financial sustainability of each Council
d) The projected long term (10 years) financial sustainability of the voluntarily merged Council, having regard to asset management plans and key financial indicators
e) The financial impacts of merging in terms of both
i. Costs of integration
ii. Savings and benefits from economies of scale
Part B: Operational requirements
a) An analysis of the Strategic Plans of each council and any visioning plans the councils may have
b) An employment profile of each Council
c) An employment profile for a voluntarily merged Council
d) Any service gaps or deficiencies in either or both of the councils
e) An assessment of the degree to which any gaps can be closed through merging*
f) Assumed service standards of a voluntarily merged council
g) An assessment of present asset renewal by each council individually*
h) Compare the differences between the future adequacy of the two separate entities and a new single entity for asset renewal and provision
i) Identify whether the larger entity can facilitate a higher provision of ‘nice to have’ but not essential type of asset works that define and strengthen communities and improve lifestyle*
RequirementsTamar Valley Council Feasibility Study
* Requirements added by the Local Government Board
87
Document Classification: KPMG Confidential
© 2018 KPMG, an Australian partnership and a member firm of the KPMG network of independent member firms affiliated with KPMG International Cooperative (“KPMG International”), a Swiss entity. All rights reserved. The KPMG name and logo are registered trademarks or trademarks of KPMG International. Liability limited by a scheme approved under Professional Standards Legislation.
Part C: Community and governance requirements
a) An understanding of the different communities of interest each Council serves and their shared values
b) Any significant risks that exist in each Council and whether those risks would be mitigated or managed under a merged Council
c) The economic and demographic profiles of each council
d) Analyse the opportunities and challenges of the Tamar River being a natural barrier dividing the proposed municipality. With only the Batman Bridge linking the two municipalities, do residents and businesses currently interact with each other or are they drawn to Launceston for services outside of their municipality? How well supported are linkages (for example, public transport)*
e) Assess the cultural differences and values of communities of interest where the potential for fractionalisation may be high*
f) Identify whether there are other examples in Australia where communities only have one access point to interact with each other and whether this is an issue*
g) Provide qualitative discussion on the broader social and economic benefits of a merged council, relative to the status quo. Could a merged council provide better strategic outcomes (for example, strategic land use planning opportunities for a merged municipality, compared with planning outcomes identified by the separate entities)*
h) Identify models of community engagement / consultation that may enhance representation across communities of interest;
i) Report on how West Tamar has maintained community engagement with its communities since it was created in 1993 and incorporated previously different local government areas*
j) A prospective governance model that provides for the transition to a Tamar Valley Council
RequirementsTamar Valley Council Feasibility Study
* Requirements added by the Local Government Board

DRAFT
Appendix 2
Merger benchmarks
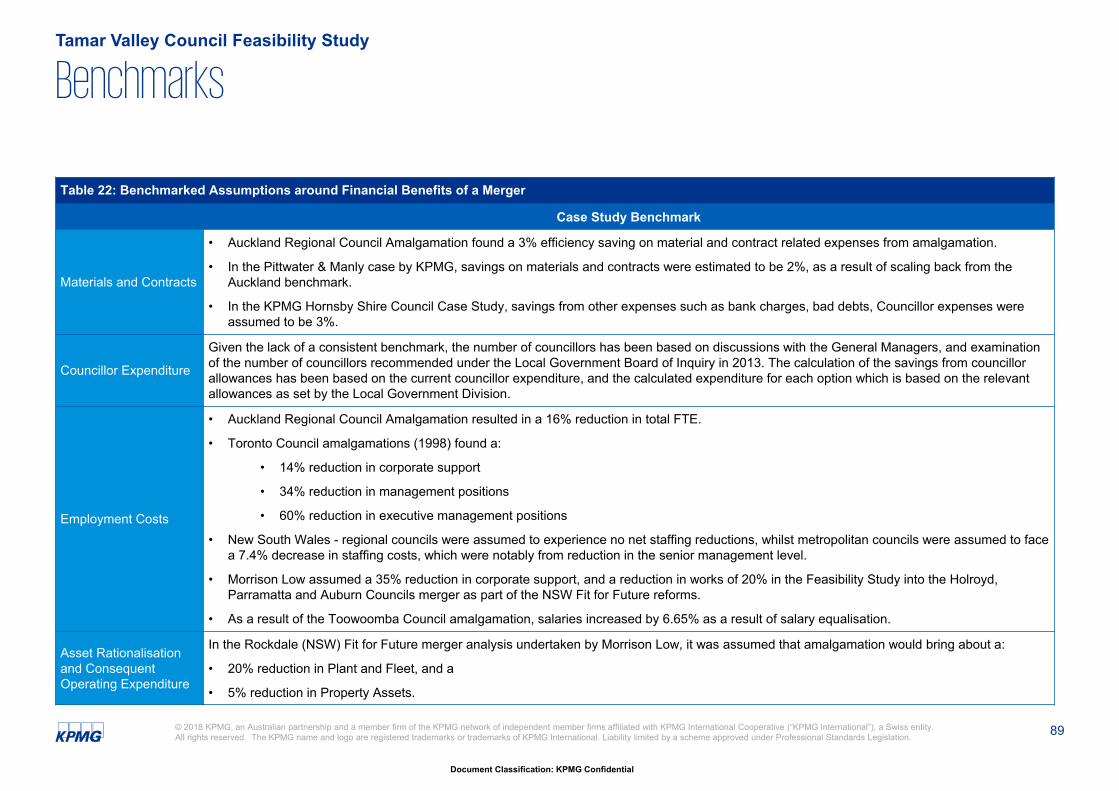
89
Document Classification: KPMG Confidential
© 2018 KPMG, an Australian partnership and a member firm of the KPMG network of independent member firms affiliated with KPMG International Cooperative (“KPMG International”), a Swiss entity. All rights reserved. The KPMG name and logo are registered trademarks or trademarks of KPMG International. Liability limited by a scheme approved under Professional Standards Legislation.
BenchmarksTamar Valley Council Feasibility Study
Table 22: Benchmarked Assumptions around Financial Benefits of a Merger
Case Study Benchmark
Materials and Contracts
• Auckland Regional Council Amalgamation found a 3% efficiency saving on material and contract related expenses from amalgamation.
• In the Pittwater & Manly case by KPMG, savings on materials and contracts were estimated to be 2%, as a result of scaling back from the Auckland benchmark.
• In the KPMG Hornsby Shire Council Case Study, savings from other expenses such as bank charges, bad debts, Councillor expenses were assumed to be 3%.
Councillor Expenditure
Given the lack of a consistent benchmark, the number of councillors has been based on discussions with the General Managers, and examination of the number of councillors recommended under the Local Government Board of Inquiry in 2013. The calculation of the savings from councillor allowances has been based on the current councillor expenditure, and the calculated expenditure for each option which is based on the relevant allowances as set by the Local Government Division.
Employment Costs
• Auckland Regional Council Amalgamation resulted in a 16% reduction in total FTE.
• Toronto Council amalgamations (1998) found a:
• 14% reduction in corporate support
• 34% reduction in management positions
• 60% reduction in executive management positions
• New South Wales - regional councils were assumed to experience no net staffing reductions, whilst metropolitan councils were assumed to face a 7.4% decrease in staffing costs, which were notably from reduction in the senior management level.
• Morrison Low assumed a 35% reduction in corporate support, and a reduction in works of 20% in the Feasibility Study into the Holroyd, Parramatta and Auburn Councils merger as part of the NSW Fit for Future reforms.
• As a result of the Toowoomba Council amalgamation, salaries increased by 6.65% as a result of salary equalisation.
Asset Rationalisation and Consequent Operating Expenditure
In the Rockdale (NSW) Fit for Future merger analysis undertaken by Morrison Low, it was assumed that amalgamation would bring about a:
• 20% reduction in Plant and Fleet, and a
• 5% reduction in Property Assets.
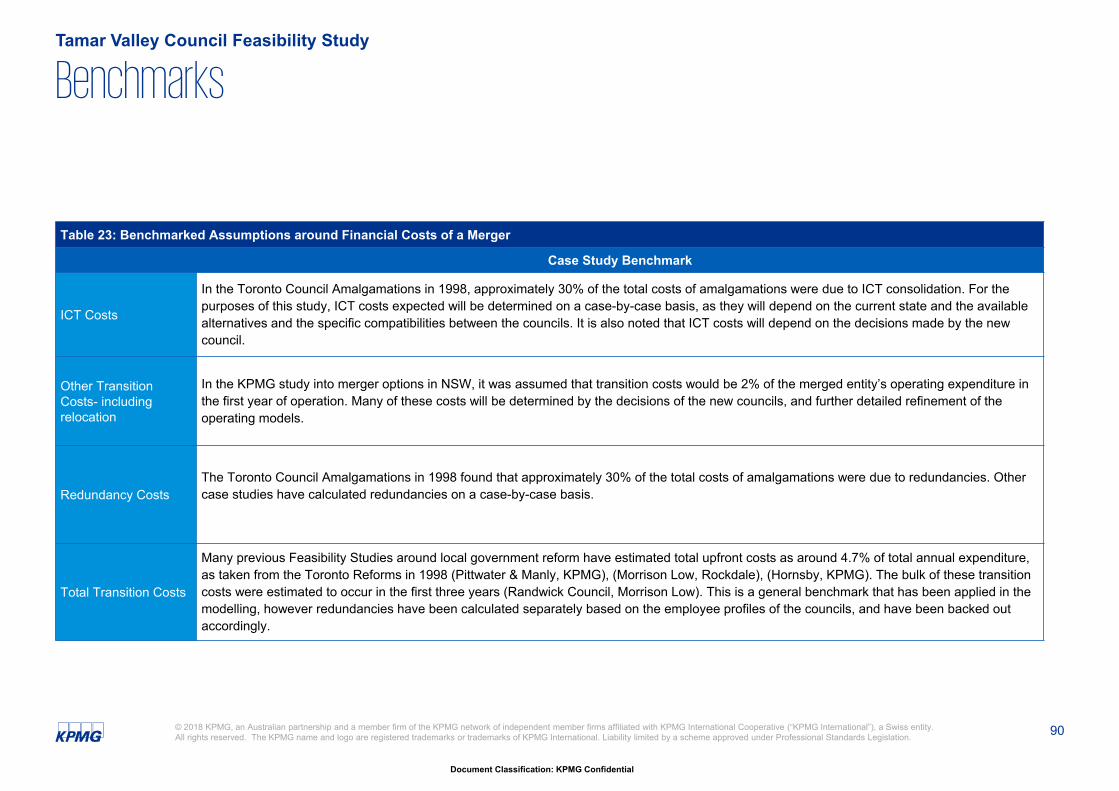
90
Document Classification: KPMG Confidential
© 2018 KPMG, an Australian partnership and a member firm of the KPMG network of independent member firms affiliated with KPMG International Cooperative (“KPMG International”), a Swiss entity. All rights reserved. The KPMG name and logo are registered trademarks or trademarks of KPMG International. Liability limited by a scheme approved under Professional Standards Legislation.
BenchmarksTamar Valley Council Feasibility Study
Table 23: Benchmarked Assumptions around Financial Costs of a Merger
Case Study Benchmark
ICT Costs
In the Toronto Council Amalgamations in 1998, approximately 30% of the total costs of amalgamations were due to ICT consolidation. For the purposes of this study, ICT costs expected will be determined on a case-by-case basis, as they will depend on the current state and the available alternatives and the specific compatibilities between the councils. It is also noted that ICT costs will depend on the decisions made by the new council.
Other Transition Costs- including relocation
In the KPMG study into merger options in NSW, it was assumed that transition costs would be 2% of the merged entity’s operating expenditure in the first year of operation. Many of these costs will be determined by the decisions of the new councils, and further detailed refinement of the operating models.
Redundancy CostsThe Toronto Council Amalgamations in 1998 found that approximately 30% of the total costs of amalgamations were due to redundancies. Other case studies have calculated redundancies on a case-by-case basis.
Total Transition Costs
Many previous Feasibility Studies around local government reform have estimated total upfront costs as around 4.7% of total annual expenditure, as taken from the Toronto Reforms in 1998 (Pittwater & Manly, KPMG), (Morrison Low, Rockdale), (Hornsby, KPMG). The bulk of these transition costs were estimated to occur in the first three years (Randwick Council, Morrison Low). This is a general benchmark that has been applied in the modelling, however redundancies have been calculated separately based on the employee profiles of the councils, and have been backed out accordingly.

DRAFT
Appendix 3
Financial statistics and definitions
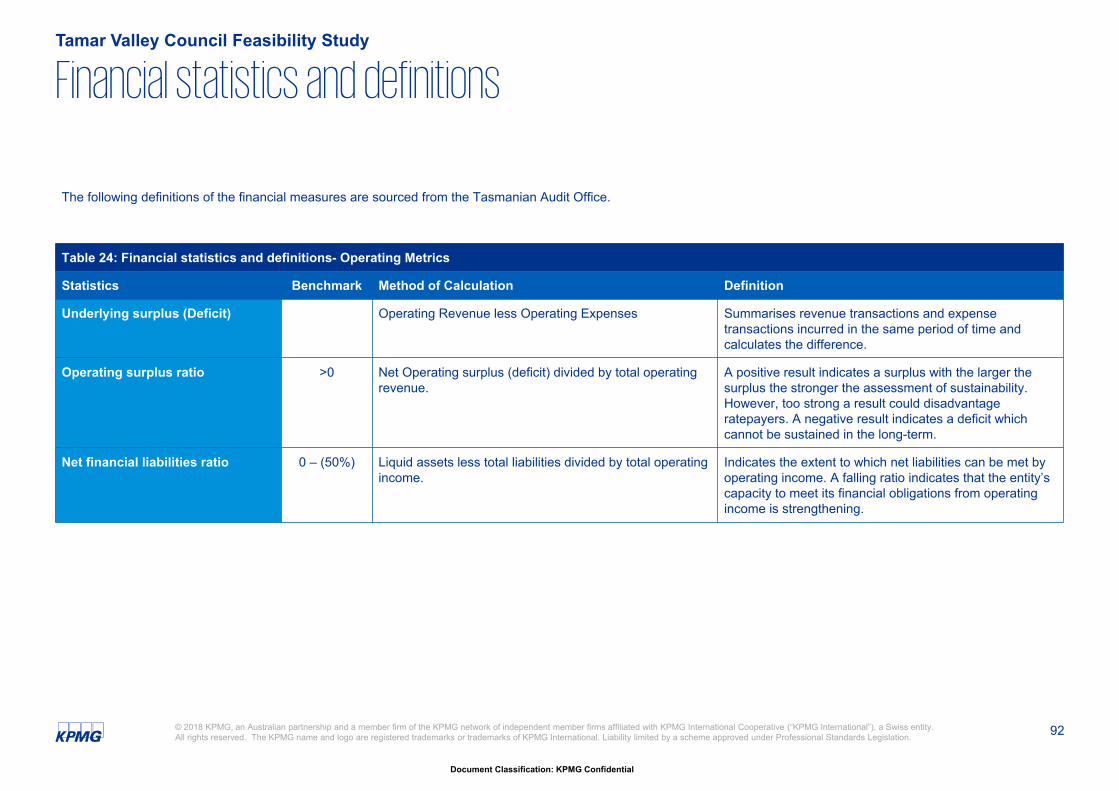
92
Document Classification: KPMG Confidential
© 2018 KPMG, an Australian partnership and a member firm of the KPMG network of independent member firms affiliated with KPMG International Cooperative (“KPMG International”), a Swiss entity. All rights reserved. The KPMG name and logo are registered trademarks or trademarks of KPMG International. Liability limited by a scheme approved under Professional Standards Legislation.
Financial statistics and definitionsTamar Valley Council Feasibility Study
Table 24: Financial statistics and definitions- Operating Metrics
Statistics Benchmark Method of Calculation Definition
Underlying surplus (Deficit) Operating Revenue less Operating Expenses Summarises revenue transactions and expense transactions incurred in the same period of time and calculates the difference.
Operating surplus ratio >0 Net Operating surplus (deficit) divided by total operating revenue.
A positive result indicates a surplus with the larger the surplus the stronger the assessment of sustainability. However, too strong a result could disadvantage ratepayers. A negative result indicates a deficit which cannot be sustained in the long-term.
Net financial liabilities ratio 0 – (50%) Liquid assets less total liabilities divided by total operating income.
Indicates the extent to which net liabilities can be met by operating income. A falling ratio indicates that the entity’s capacity to meet its financial obligations from operating income is strengthening.
The following definitions of the financial measures are sourced from the Tasmanian Audit Office.
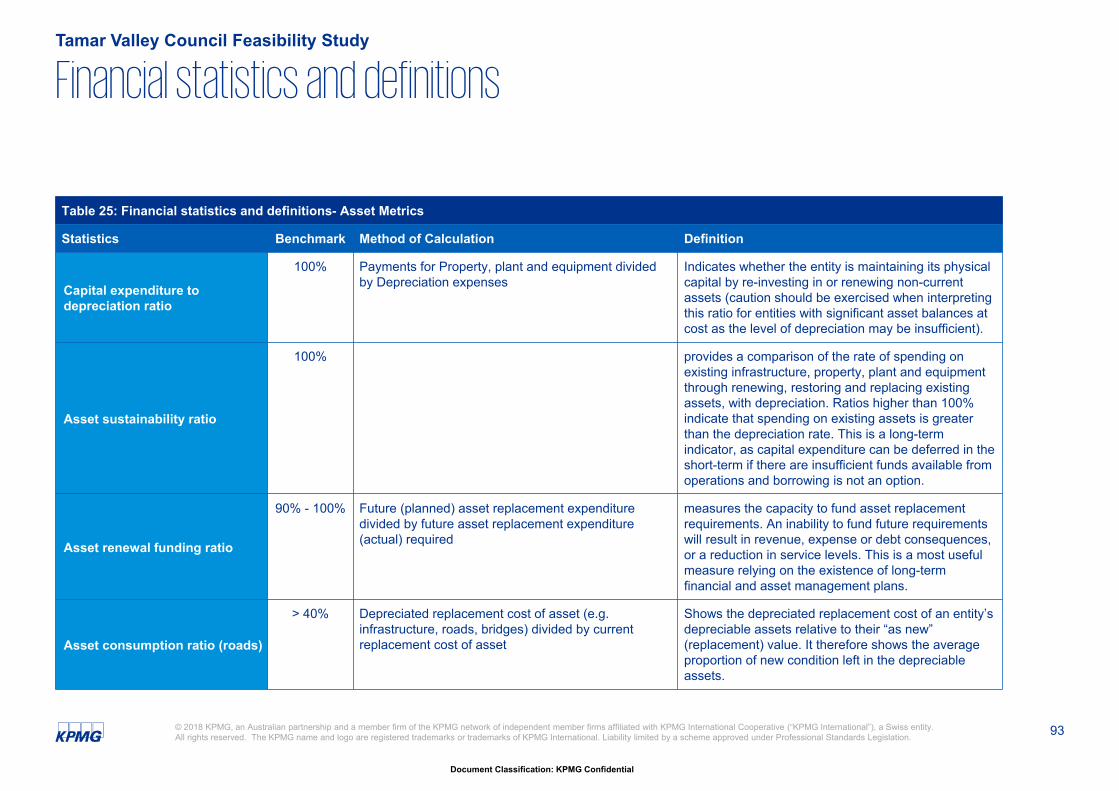
93
Document Classification: KPMG Confidential
© 2018 KPMG, an Australian partnership and a member firm of the KPMG network of independent member firms affiliated with KPMG International Cooperative (“KPMG International”), a Swiss entity. All rights reserved. The KPMG name and logo are registered trademarks or trademarks of KPMG International. Liability limited by a scheme approved under Professional Standards Legislation.
Financial statistics and definitionsTamar Valley Council Feasibility Study
Table 25: Financial statistics and definitions- Asset Metrics
Statistics Benchmark Method of Calculation Definition
Capital expenditure to depreciation ratio
100% Payments for Property, plant and equipment divided by Depreciation expenses
Indicates whether the entity is maintaining its physical capital by re-investing in or renewing non-current assets (caution should be exercised when interpreting this ratio for entities with significant asset balances at cost as the level of depreciation may be insufficient).
Asset sustainability ratio
100% provides a comparison of the rate of spending on existing infrastructure, property, plant and equipment through renewing, restoring and replacing existing assets, with depreciation. Ratios higher than 100% indicate that spending on existing assets is greater than the depreciation rate. This is a long-termindicator, as capital expenditure can be deferred in the short-term if there are insufficient funds available from operations and borrowing is not an option.
Asset renewal funding ratio
90% - 100% Future (planned) asset replacement expenditure divided by future asset replacement expenditure (actual) required
measures the capacity to fund asset replacement requirements. An inability to fund future requirements will result in revenue, expense or debt consequences, or a reduction in service levels. This is a most useful measure relying on the existence of long-term financial and asset management plans.
Asset consumption ratio (roads)
> 40% Depreciated replacement cost of asset (e.g.infrastructure, roads, bridges) divided by current replacement cost of asset
Shows the depreciated replacement cost of an entity’sdepreciable assets relative to their “as new” (replacement) value. It therefore shows the average proportion of new condition left in the depreciable assets.
DRAFT
Appendix 4
Council Rating Policies
95
Document Classification: KPMG Confidential
© 2018 KPMG, an Australian partnership and a member firm of the KPMG network of independent member firms affiliated with KPMG International Cooperative (“KPMG International”), a Swiss entity. All rights reserved. The KPMG name and logo are registered trademarks or trademarks of KPMG International. Liability limited by a scheme approved under Professional Standards Legislation.
Rating Policy Summary: George TownTamar Valley Council Feasibility Study
General rate
Council has considered Section 86A of the Act in its adoption of Average Area Rates (AAR) for properties used for residential purposes within the municipality. The AAR is determined by ascertaining the total revenue that would ordinarily be collected on the basis of the sum of all relevant amounts of individual properties in a locality, and dividing the revenue by the total number of properties in each locality. Council considers that the AAR provides the fairest and most equitable means of ensuring all residential ratepayers within a location contribute equally to the delivery, maintenance, renewal, upgrade and administration of Council’s existing and additional infrastructure, and services.
Council sets a minimum rate to ensure that all ratepayers make a reasonable base contribution to services and infrastructure provided for the whole community, including recreational and community engagement facilities.
Council currently varies the general rate by land use, and the George Town Council Interim Planning Scheme 2013. While all residents benefit from Council’s total infrastructure and service provision, the aim of varying rates is to collect revenue in order that services to all ratepayers can be provided throughout the municipality.
Differential Rate
A differential rate is applied to land predominantly used for the following purposes:
• Commercial;
• Industrial activity – and varied according to zones within the Planning Scheme.
Service Rates & Charges
The Fire Protection Rate is levied on behalf of the State Government to contribute towards the funding of the Fire Commission. The Fire Protection Rate is determined by the Fire Commission.
Waste Management charges apply in respect of all land to which council supplies waste management services - including garbage and recycling collection.
Payment
Quarterly instalments. For late payments, Council charges a penalty of the unpaid rate or instalment at a rate of 5% (maximum rate is 10% under the Act).
• Council charges interest in respect of the unpaid rate or instalment for the period during which it is unpaid, on a daily basis, in accordance with the Act.
96
Document Classification: KPMG Confidential
© 2018 KPMG, an Australian partnership and a member firm of the KPMG network of independent member firms affiliated with KPMG International Cooperative (“KPMG International”), a Swiss entity. All rights reserved. The KPMG name and logo are registered trademarks or trademarks of KPMG International. Liability limited by a scheme approved under Professional Standards Legislation.
Rating Policy Summary: West TamarTamar Valley Council Feasibility Study
General rate
Council, along with the majority of Tasmanian Councils, chooses the AAV basis for rating purposes. Council is satisfied with the AAV adopted method and considers the method is positioned well to address capacity to pay considerations. The approach is consistent with the equity, efficiency and simplicity principles of taxation.
Differential Rate
Council will consider the variation of the general rate within different parts of the municipal area to assist the development of public, sporting or recreational facilities. If a council varies a rate, the general manager must notify the ratepayer in a rates notice of the rate as varied, of the variation factor used and of the date it takes affect. A ratepayer may object to a variation in a rate based on that the use of the ratepayer’s land is not the use of land on which the variation is based.
Currently pursuant to section 107 of the Act council varies the general rate for the area identified by that part of the Launceston Urban Fire Brigade District located in the West Tamar Municipal Area. This variation is to raise additional revenue for development of Windsor Park facilities.
Service Rates & Charges
Council has waste management service charges to assist to recover the cost of the service from the user through annual charges. The service charge for waste management (garbage removal) is in respect to all lands to which council supplies a waste management service and is increased if ratepayers opt for a larger size mobile garbage bin.
The Fire Protection Rate is levied on behalf of the State Government to contribute towards the funding of the Fire Commission. The Fire Protection Rate is determined by the Fire Commission.
Payment
Payment through instalments. If rates are not paid by the due date (21 days), daily interest will be charged at the prescribed percentage in accordance with Section 128 of the Local government Act 1993.
DRAFT
Appendix 5
References
98
Document Classification: KPMG Confidential
© 2018 KPMG, an Australian partnership and a member firm of the KPMG network of independent member firms affiliated with KPMG International Cooperative (“KPMG International”), a Swiss entity. All rights reserved. The KPMG name and logo are registered trademarks or trademarks of KPMG International. Liability limited by a scheme approved under Professional Standards Legislation.
Community Profile References
— Australian Bureau of Statistics
• 3235.0 Population by Age and Sex, Regions of Australia
• 3218.0 Regional Population Growth, Australia
• 524.0.55.002 - Estimates of Personal Income for Small Areas, 2011-2015
• 1410.0 - Data by Region, 2011-16
• Census 2011
• 2033.0.55.001 Census of Population and Housing: Socio- Economic Indexes for Areas (SEIFA), Australia, 2011
— Tasmanian Population Projections 2014, Department of Treasury and Finance
— Labour Force Region (SA4) – Labour Market Data – March 2017, Department of Employment
— National Institute of Economic and Industry Research (NIEIR), 6 National economic indicators for local government areas, 2015/2016 https://economic-indicators.id.com.au/?StateId=6
— Real Estate Institute of Tasmania
• Suburb Reports
• Real Estate Ends 2016 on a High
• Local Market Rockets to 13 Year High
ReferencesTamar Valley Council Feasibility Study

Document Classification: KPMG Confidential
kpmg.com.au kpmg.com.au/app
© 2018 KPMG, an Australian partnership and a member firm of the KPMG network of independent member firms affiliated with KPMGInternational Cooperative (“KPMG International”), a Swiss entity. All rights reserved. The KPMG name and logo are registered trademarks or trademarks of KPMG International. Liability limited by a scheme approved under Professional Standards Legislation.