Embed Size (px)
Citation preview
TAM ETG Webinar SeriesWebinar 2: TAM 101 for MPOs
Sponsored by the TAM Expert Task GroupChris Evilla, TAM ETG Member
Submit questions and comments using the webinar’s Q&A feature
Webinar 2 — May 13 2015
Welcome
2
• The TAM ETG is pleased to sponsor this webinar on Target Setting in Asset Management Plans
• Since 2012, FHWA and AASHTO have been hosting these types of webinars to provide an opportunity to connect with the asset management community and to bring people together around a series of important topics
• Sharing knowledge is a critical component of advancing asset management practice
• All of the webinars in the series can be accessed online at:http://tam.transportation.org/Pages/Webinars.aspx
Agenda
• MAP-21 Performance Management Requirements: What it means for MPOsFrancine Shaw-Whitson, FHWASpencer Stevens, FHWA
• Puget Sound Regional CouncilBenjamin Brackett
• North Central Texas Council of GovernmentsJeffrey Neal
• Northeast Ohio Areawide Coordinating AgencyKathy Sarli
• Question and AnswerChris Evilla, Moderator
3
TAM ETGOverview
• Established to serve as a forum to discuss changes in the way highway agencies are managing assets
• Activities include:– Identifying strategies for advancing asset management practice and influencing
change within state DOTs/MPOs– Providing input to FHWA, AASHTO, and TRB– Developing and implementing a plan for communicating the work of the TAM ETG
to the transportation community.
• Meetings– In-Person Meetings are open to the public
• October 2016, St. Paul MN• http://www.fhwa.dot.gov/asset/etg/
• Membership– Public sector representing federal, state and local agencies
4
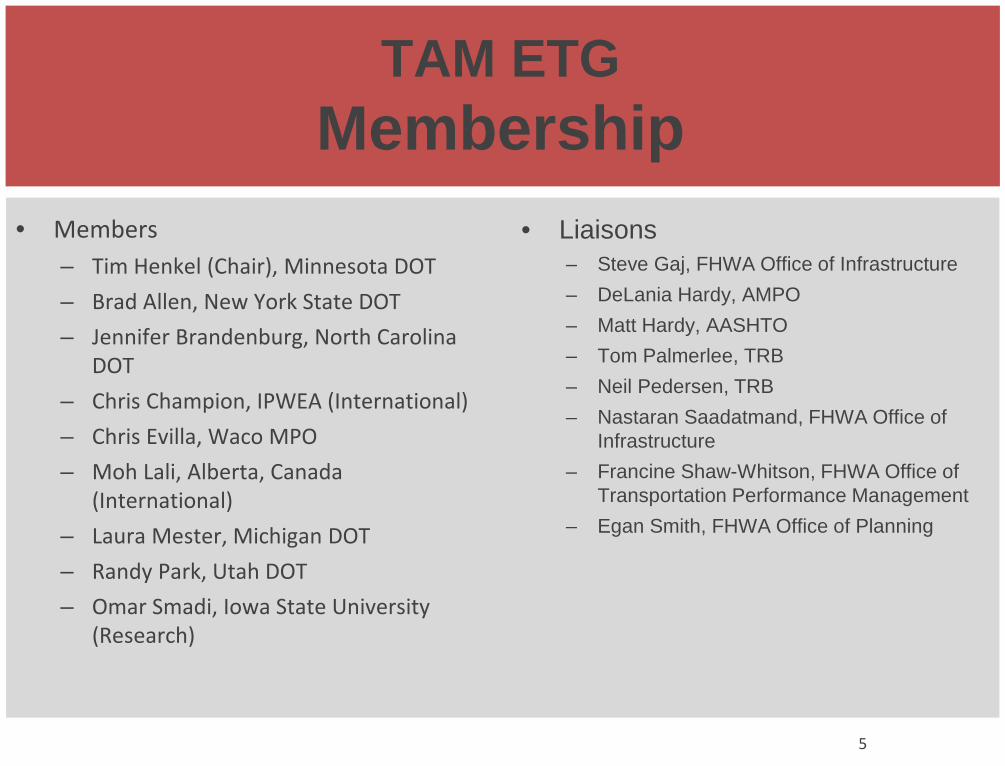
TAM ETGMembership
• Members– Tim Henkel (Chair), Minnesota DOT– Brad Allen, New York State DOT– Jennifer Brandenburg, North Carolina
DOT– Chris Champion, IPWEA (International)– Chris Evilla, Waco MPO– Moh Lali, Alberta, Canada
(International)– Laura Mester, Michigan DOT– Randy Park, Utah DOT– Omar Smadi, Iowa State University
(Research)
• Liaisons– Steve Gaj, FHWA Office of Infrastructure– DeLania Hardy, AMPO– Matt Hardy, AASHTO– Tom Palmerlee, TRB– Neil Pedersen, TRB– Nastaran Saadatmand, FHWA Office of
Infrastructure– Francine Shaw-Whitson, FHWA Office of
Transportation Performance Management– Egan Smith, FHWA Office of Planning
5

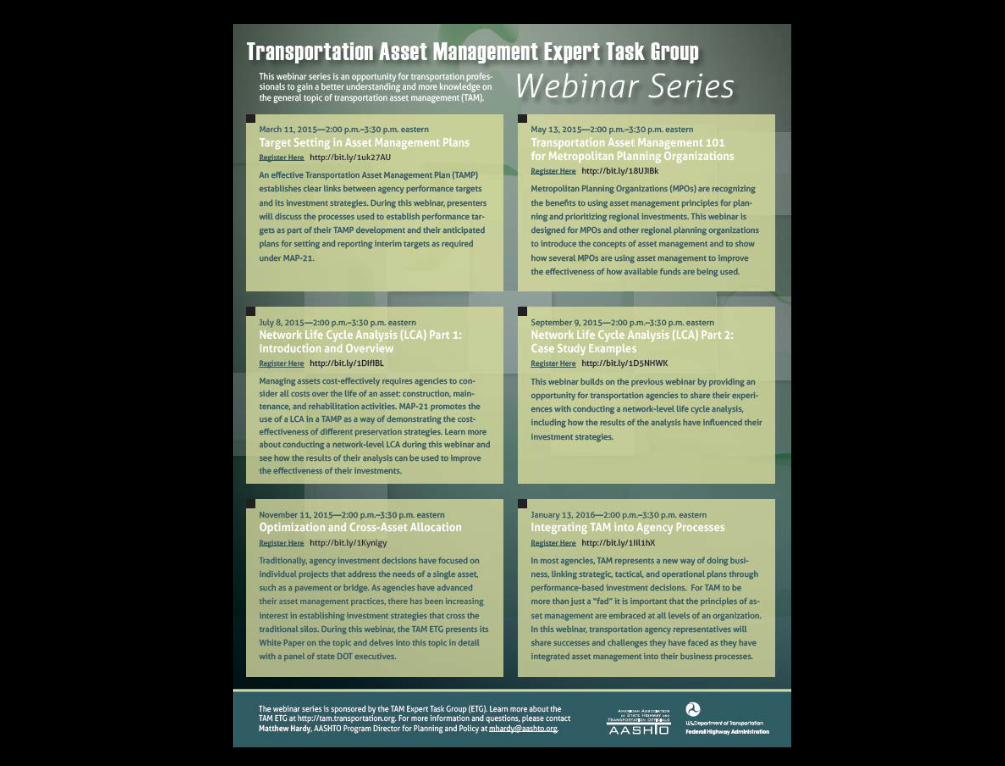
TAM ETGWebinars Overview
1. March 11: Target Setting and TAMPs2. May 13: TAM 101 for MPOs3. July 8: Network Life Cycle Cost Analysis Part 14. September 9: Network Life Cycle Cost Analysis Part 25. November 11: Optimization and Cross-Asset Allocation6. January 13, 2016: Integrating TAM into Agency Processes
6
FHWA
7
TitleSubtitle
MeetingDate
Office of Transportation Performance Management
MAP-21 Performance Management Requirements
What it means for MPOsMay 13, 2015
Francine Shaw Whitson and Spencer StevensFederal Highway Administration
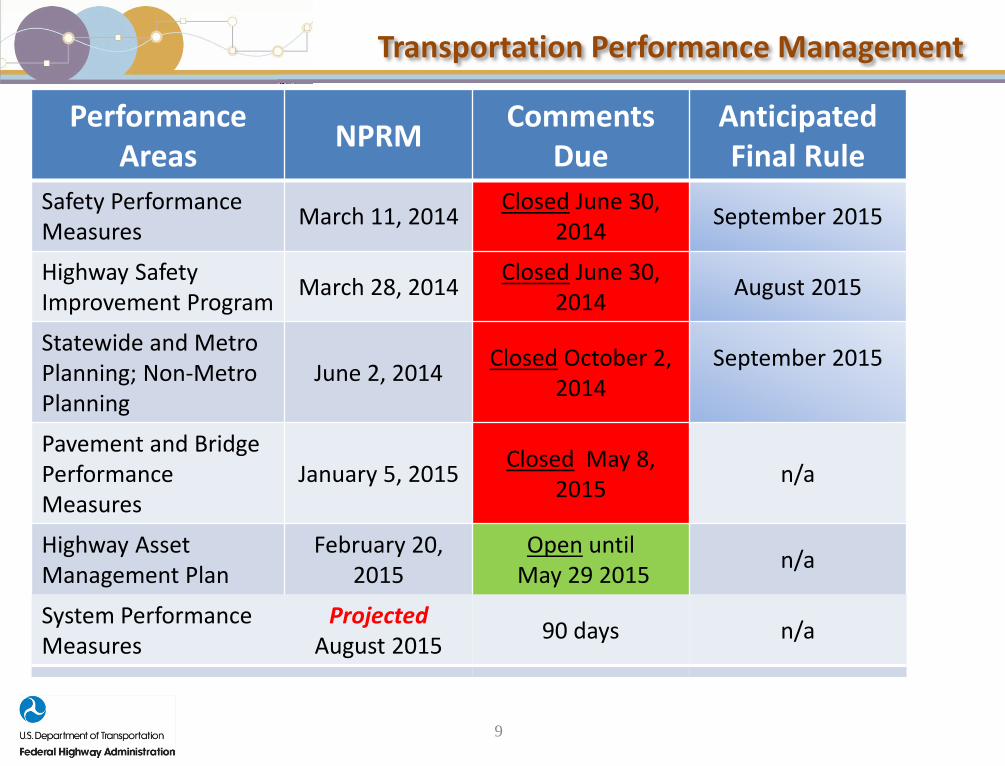
Transportation Performance Management
9
Performance Areas NPRM Comments
DueAnticipated Final Rule
Safety Performance Measures March 11, 2014 Closed June 30,
2014 September 2015
Highway Safety Improvement Program March 28, 2014 Closed June 30,
2014 August 2015
Statewide and Metro Planning; Non-Metro Planning
June 2, 2014 Closed October 2, 2014
September 2015
Pavement and Bridge Performance Measures
January 5, 2015 Closed May 8, 2015 n/a
Highway Asset Management Plan
February 20, 2015
Open until May 29 2015 n/a
System PerformanceMeasures
ProjectedAugust 2015 90 days n/a
Transportation Performance Management
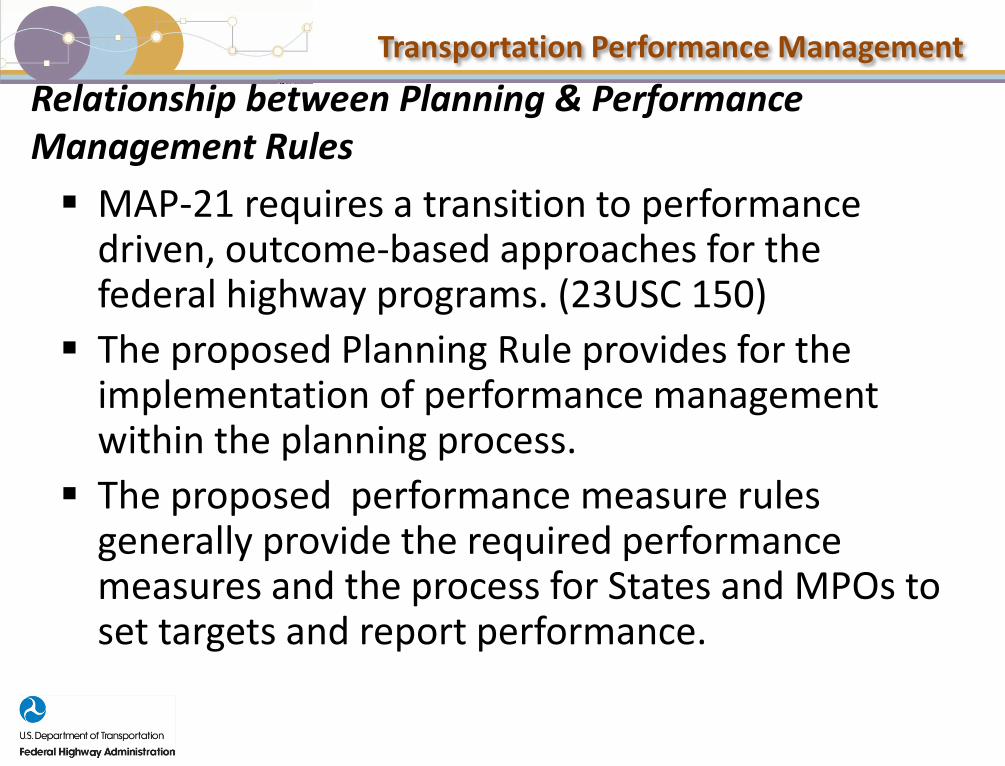
Relationship between Planning & Performance Management Rules MAP-21 requires a transition to performance
driven, outcome-based approaches for the federal highway programs. (23USC 150)
The proposed Planning Rule provides for the implementation of performance management within the planning process.
The proposed performance measure rules generally provide the required performance measures and the process for States and MPOs to set targets and report performance.
Transportation Performance Management
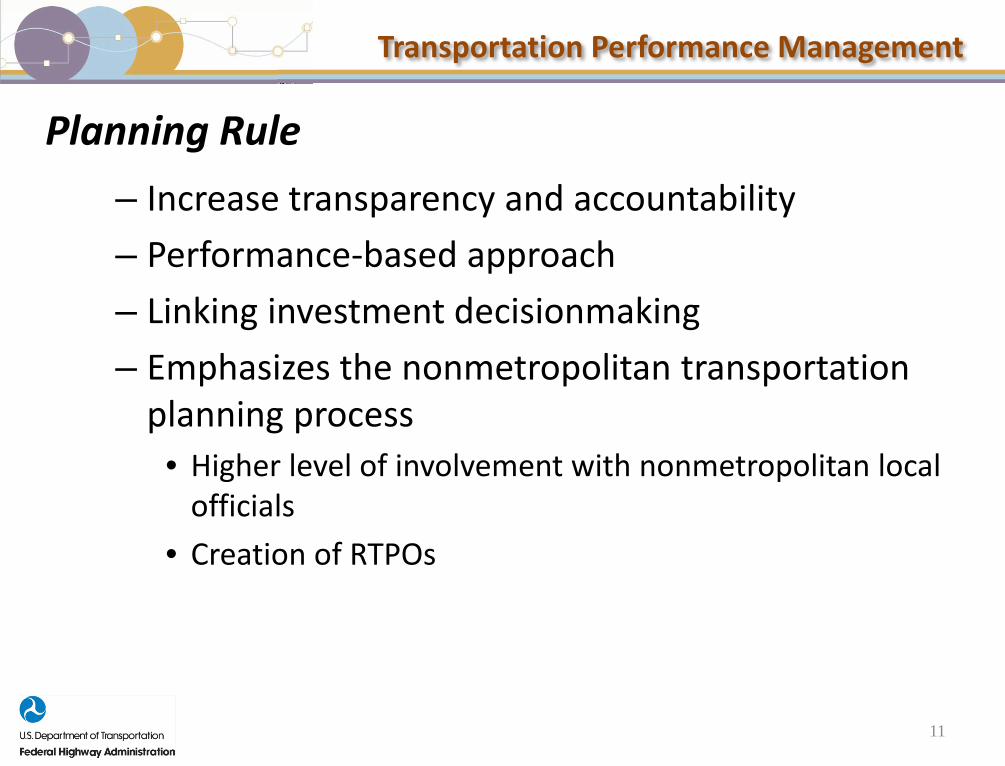
Planning Rule– Increase transparency and accountability– Performance-based approach – Linking investment decisionmaking– Emphasizes the nonmetropolitan transportation
planning process• Higher level of involvement with nonmetropolitan local
officials • Creation of RTPOs
11
Transportation Performance Management
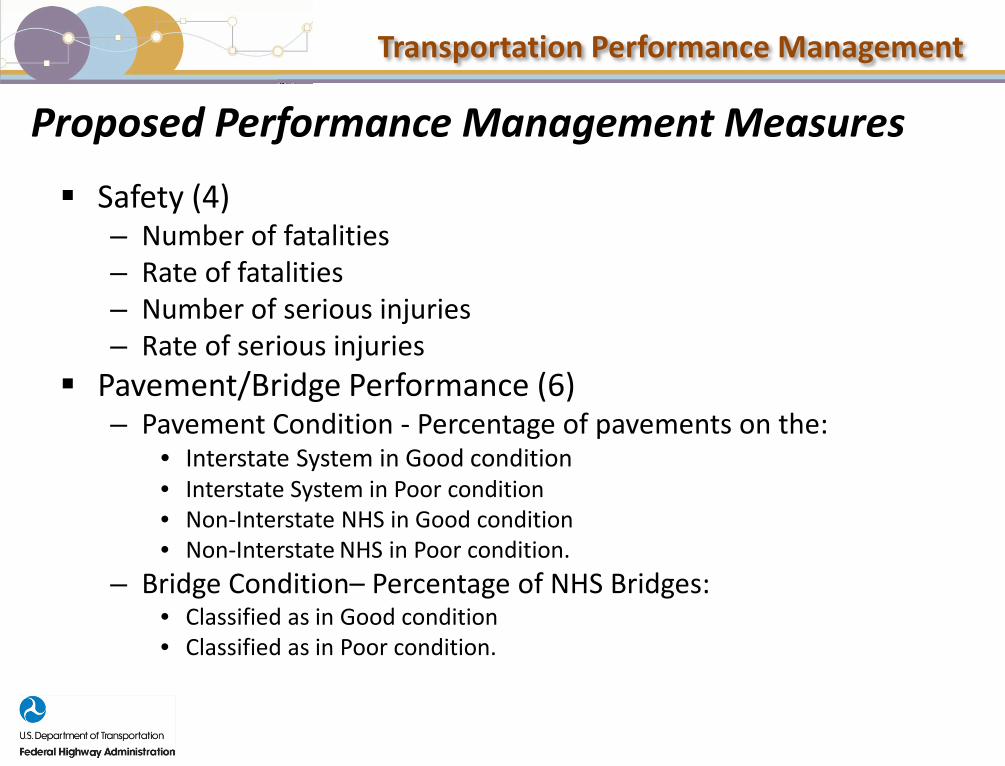
Proposed Performance Management Measures
Safety (4)– Number of fatalities – Rate of fatalities– Number of serious injuries– Rate of serious injuries
Pavement/Bridge Performance (6)– Pavement Condition - Percentage of pavements on the:
• Interstate System in Good condition• Interstate System in Poor condition• Non-Interstate NHS in Good condition• Non-Interstate NHS in Poor condition.
– Bridge Condition– Percentage of NHS Bridges: • Classified as in Good condition • Classified as in Poor condition.
Transportation Performance Management
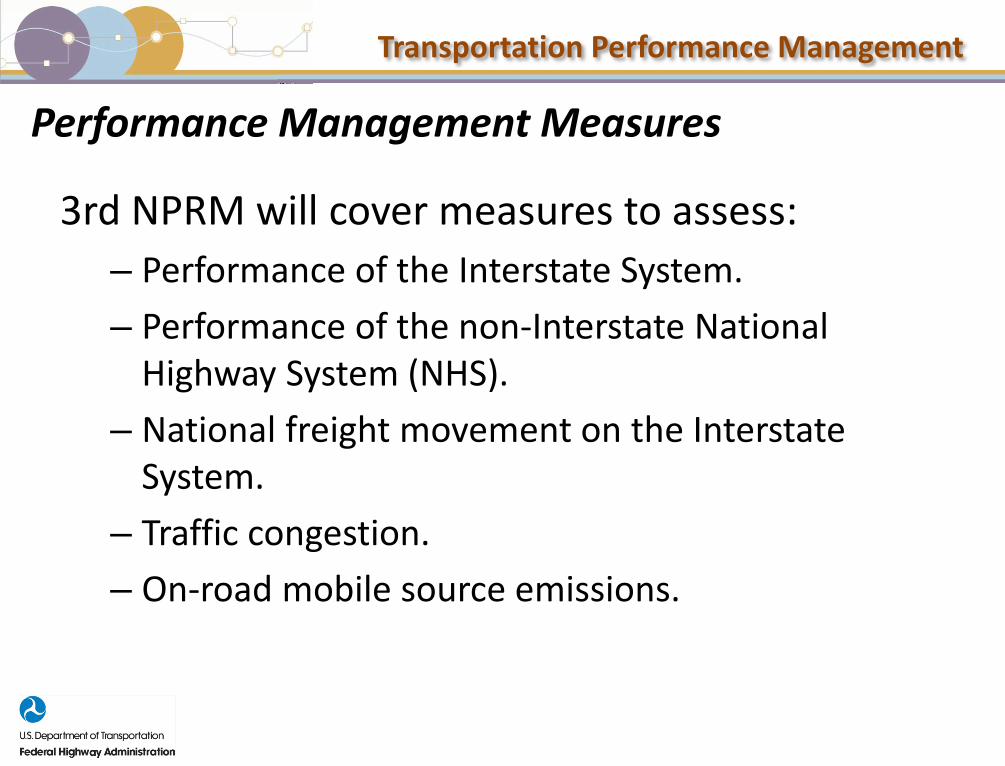
Performance Management Measures
3rd NPRM will cover measures to assess:– Performance of the Interstate System.– Performance of the non-Interstate National
Highway System (NHS).– National freight movement on the Interstate
System.– Traffic congestion.– On-road mobile source emissions.
Transportation Performance Management
• States & MPOs would work together• States & MPOs would use existing 3-C process• States & MPOs would decide what works for
them
14
Coordination Efforts
Transportation Performance Management
States Target Establishment – FHWA’s proposals• Establish targets not later than 1 year after the effective date
of rule establishing measures (23 USC 150(d))– Statewide targets would be required.– States would have the option to set any number of
additional targets for urbanized areas and non-urbanized areas.
– State DOTs shall coordinate with relevant MPOs on the selection of targets to ensure consistency, to the maximum extent practicable (23 U.S.C. 134(h)(2)(D)).
15
Transportation Performance Management
MPOs Target Establishment – FHWA’s proposals• Establish targets no later than 180 days after the respective State DOT(s)
establishes their targets (23 USC 134(h)(2)(C))– Targets would be established for MPA area – Propose only 4-year targets– Coordinate with relevant State DOT(s) on the selection of targets to
ensure consistency, to the maximum extent practicable (23 USC 134(h)(2)(B))
• Proposed 2 Target establishment options – agree to plan a program of projects so that they contribute to the
adjusted State DOT target; or– commit to a new quantifiable target for the metropolitan planning
area.
16
Transportation Performance Management
Integration Opportunity in the Planning Process
Transportation Performance Management
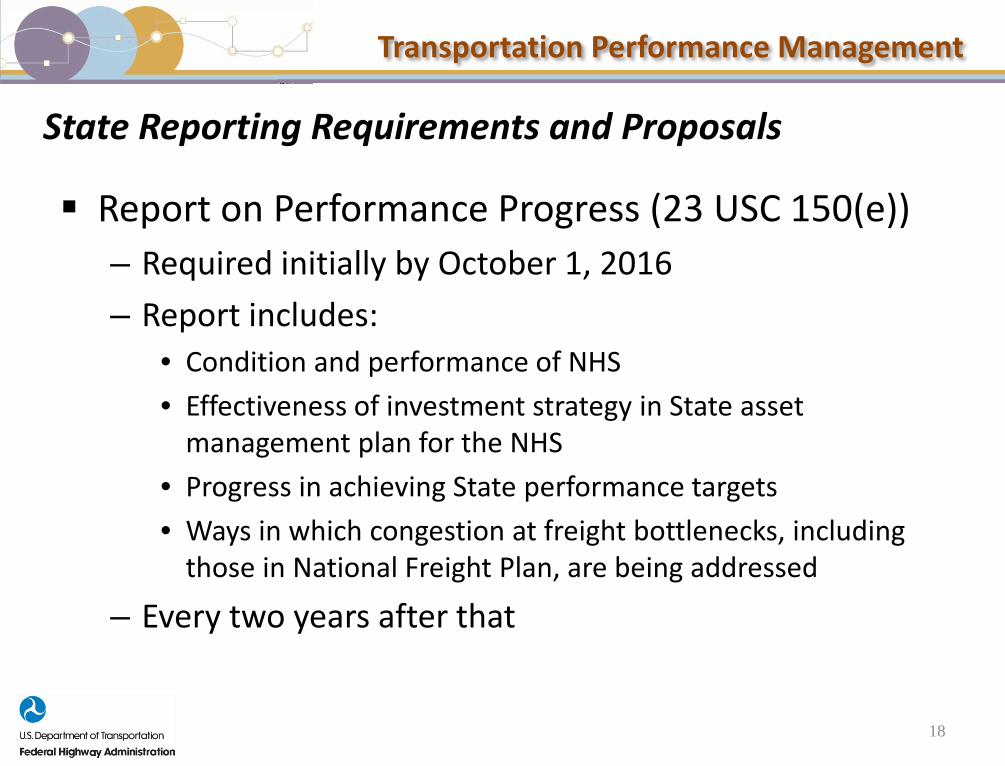
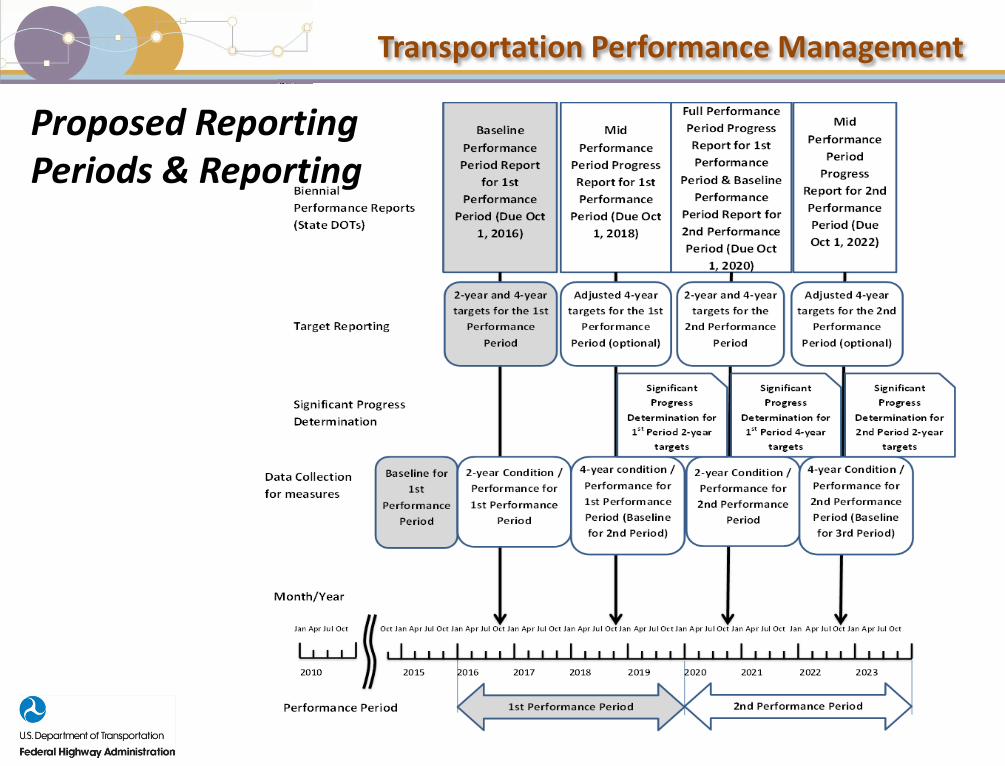
State Reporting Requirements and Proposals
Report on Performance Progress (23 USC 150(e))– Required initially by October 1, 2016– Report includes:
• Condition and performance of NHS• Effectiveness of investment strategy in State asset
management plan for the NHS• Progress in achieving State performance targets• Ways in which congestion at freight bottlenecks, including
those in National Freight Plan, are being addressed
– Every two years after that
18
Transportation Performance Management
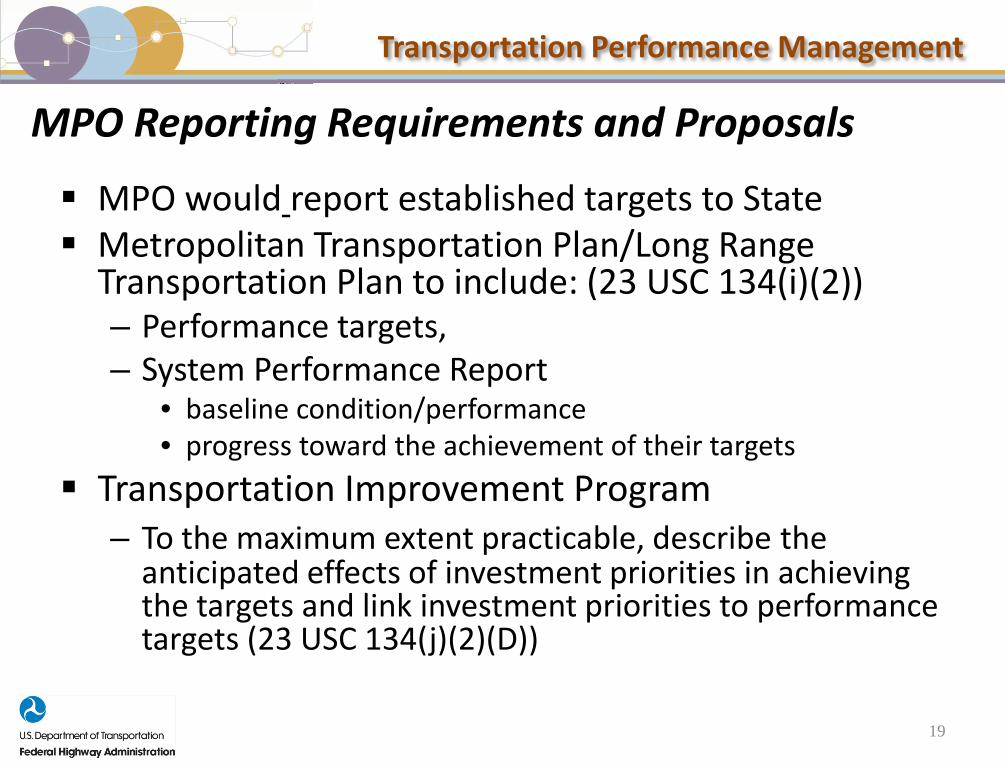
MPO Reporting Requirements and Proposals
MPO would report established targets to State Metropolitan Transportation Plan/Long Range
Transportation Plan to include: (23 USC 134(i)(2))– Performance targets, – System Performance Report
• baseline condition/performance• progress toward the achievement of their targets
Transportation Improvement Program– To the maximum extent practicable, describe the
anticipated effects of investment priorities in achieving the targets and link investment priorities to performance targets (23 USC 134(j)(2)(D))
19
Transportation Performance Management
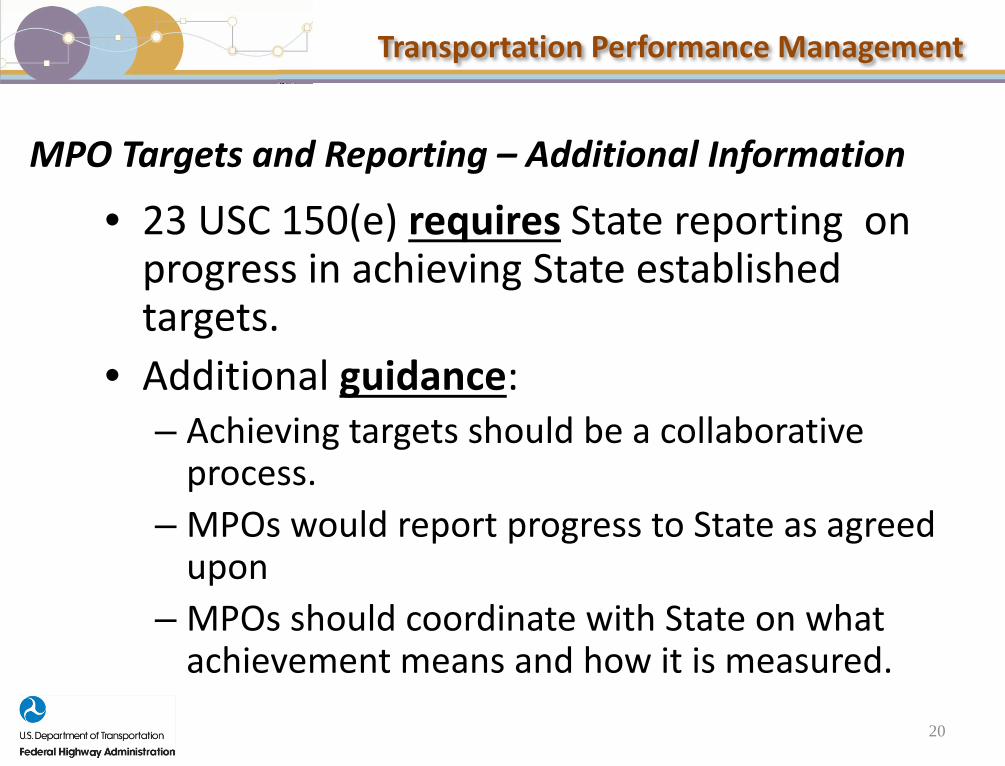
MPO Targets and Reporting – Additional Information
• 23 USC 150(e) requires State reporting on progress in achieving State established targets.
• Additional guidance:– Achieving targets should be a collaborative
process.– MPOs would report progress to State as agreed
upon– MPOs should coordinate with State on what
achievement means and how it is measured.
20
Transportation Performance Management
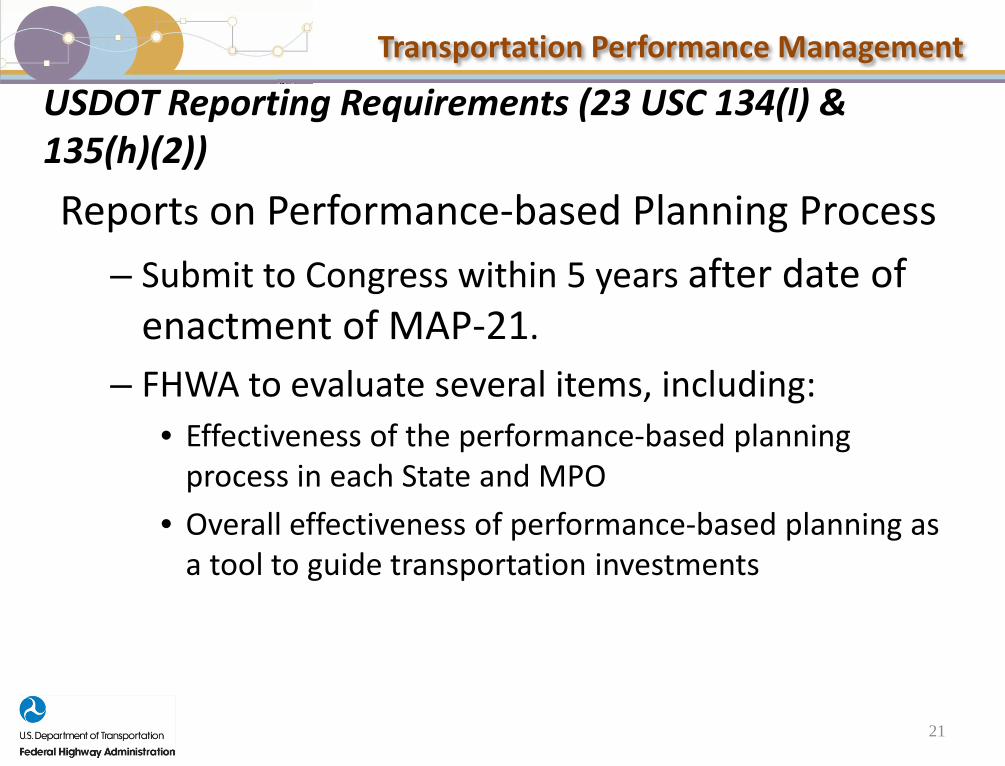
USDOT Reporting Requirements (23 USC 134(l) & 135(h)(2))Reports on Performance-based Planning Process
– Submit to Congress within 5 years after date of enactment of MAP-21.
– FHWA to evaluate several items, including:• Effectiveness of the performance-based planning
process in each State and MPO• Overall effectiveness of performance-based planning as
a tool to guide transportation investments
21
Transportation Performance Management
Proposed Reporting Periods & Reporting
Transportation Performance Management
Reviewing and Commenting on NPRM
www.regulations.gov23
Transportation Performance Management
Upcoming Exchanges/Webinars
Let’s Talk Performance • Fundamentals of Transportation Data
Part 2: Data Analysis and Usability–6/9/15, 2:00-3:30 (EDT)
• Telling the Performance Story–9/8/15, 2:00-3:30 (EDT)
• Register at www.fhwa.dot.gov/tpm
24
Transportation Performance Management
25
Francine Shaw WhitsonLeader, TPM Programs
FHWA, Office of Transportation Performance
Spencer StevensTransportation PlannerFHWA, Office of [email protected]
PSRC
26
Asset Management 101 for MPOs
Regional Asset Management Program Peer Review
May 13, 201
28
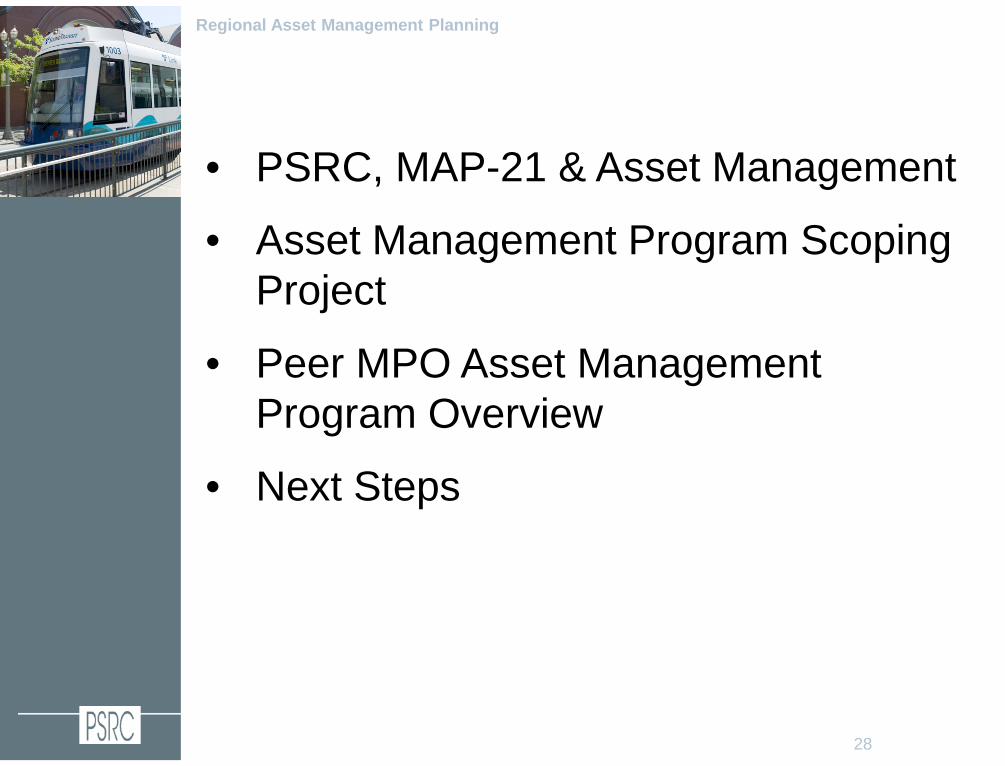
Presentation OverviewRegional Asset Management Planning
• PSRC, MAP-21 & Asset Management
• Asset Management Program Scoping Project
• Peer MPO Asset Management Program Overview
• Next Steps
29
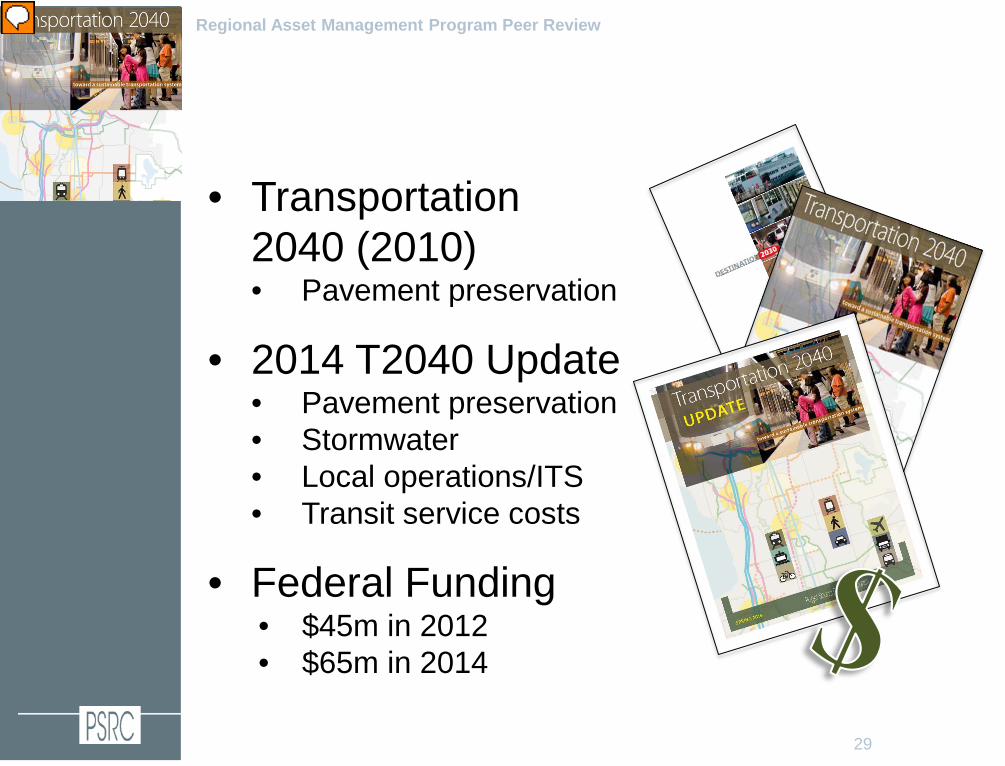
PSRC and Asset ManagementRegional Asset Management Program Peer Review
• Transportation 2040 (2010) • Pavement preservation
• 2014 T2040 Update• Pavement preservation• Stormwater• Local operations/ITS• Transit service costs
• Federal Funding• $45m in 2012 • $65m in 2014
30
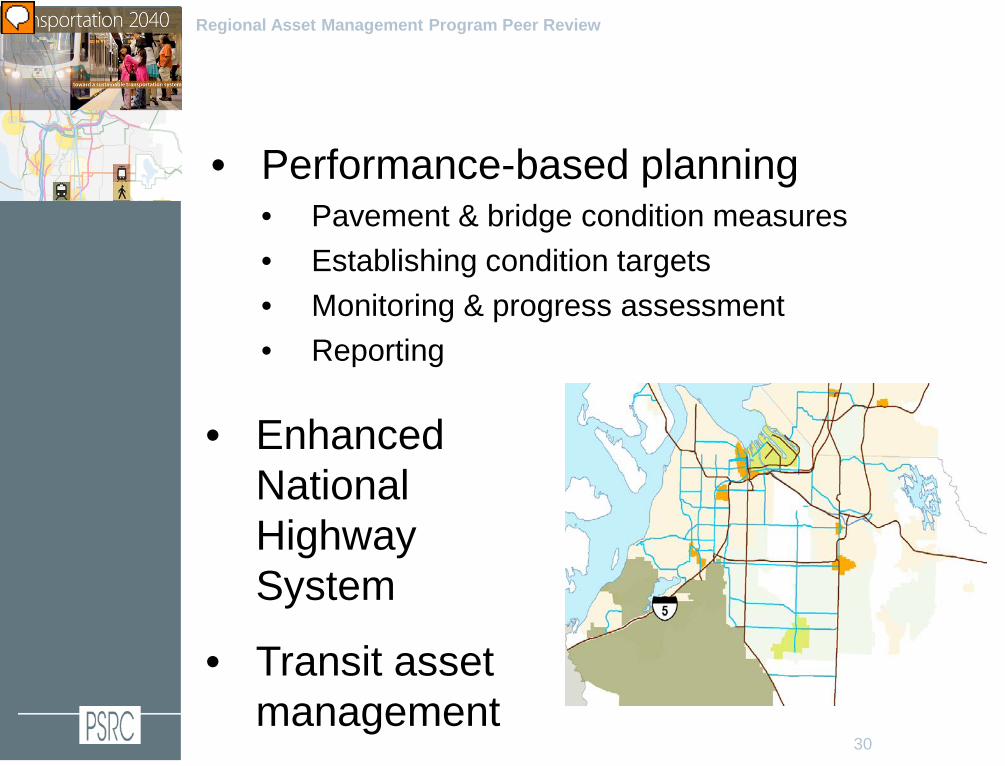
MAP-21 and Asset ManagementRegional Asset Management Program Peer Review
• Performance-based planning• Pavement & bridge condition measures• Establishing condition targets• Monitoring & progress assessment• Reporting
• Enhanced National Highway System
• Transit asset management
31
Regional Asset Management Planning
MAP-21 Implications for MPOs• Develop performance measures for bridges and
pavements (in progress)
• Incorporate pavement and bridge condition performance targets into planning process
• Understand how level of investment in long-range plan impacts future pavement and bridge conditions
• Data collection (direct or indirect)
• Tracking of current conditions in relation to targets
• Integration of transit asset management plans with long-range planning process
32
Asset Mgmt. Program Scoping Project
Regional Asset Management Program Peer Review
• Funded by FHWA INVEST grant
• Scope a “value added” regional asset management program• What do other agencies do?• Establish regional goals• How can we partner with local agencies in
support of a regional program?• What tools do we need to carry out vision?
• Support development of the 2018 regional transportation plan
33
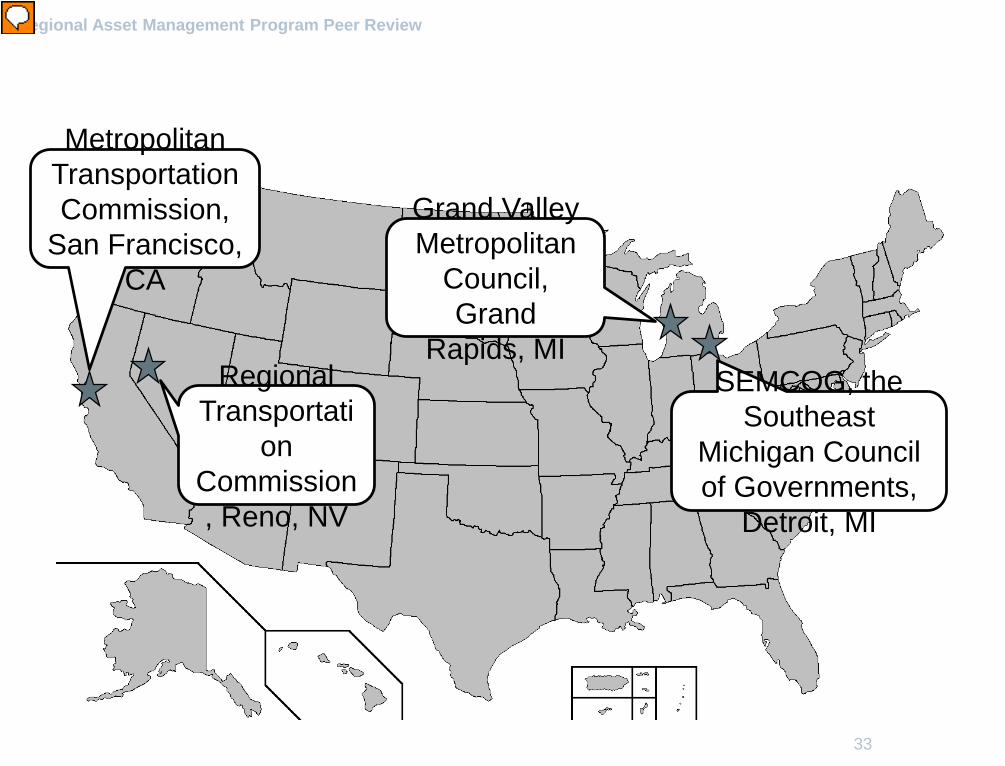
Regional Asset Management Program Peer Review
Peer RegionsMetropolitan
Transportation Commission,
San Francisco, CA
Regional Transportati
on Commission, Reno, NV
Grand Valley Metropolitan
Council, Grand
Rapids, MISEMCOG, the
Southeast Michigan Council of Governments,
Detroit, MI
34
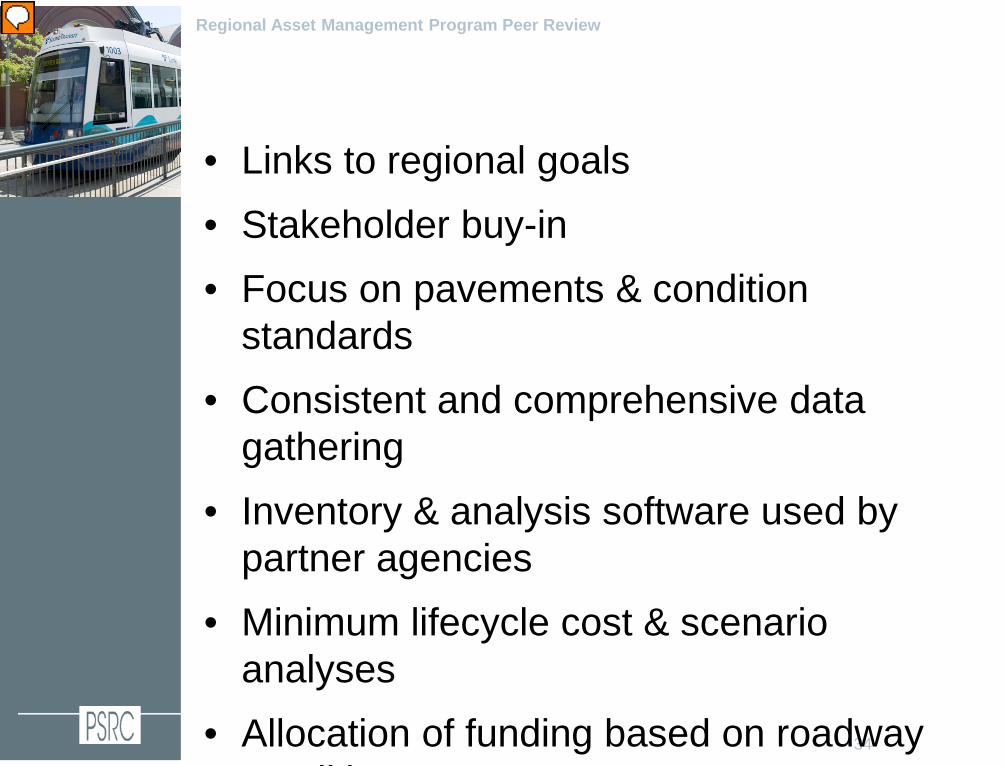
Regional Asset Management Program Peer Review
Common Features• Links to regional goals• Stakeholder buy-in• Focus on pavements & condition
standards• Consistent and comprehensive data
gathering• Inventory & analysis software used by
partner agencies• Minimum lifecycle cost & scenario
analyses• Allocation of funding based on roadway
diti
35
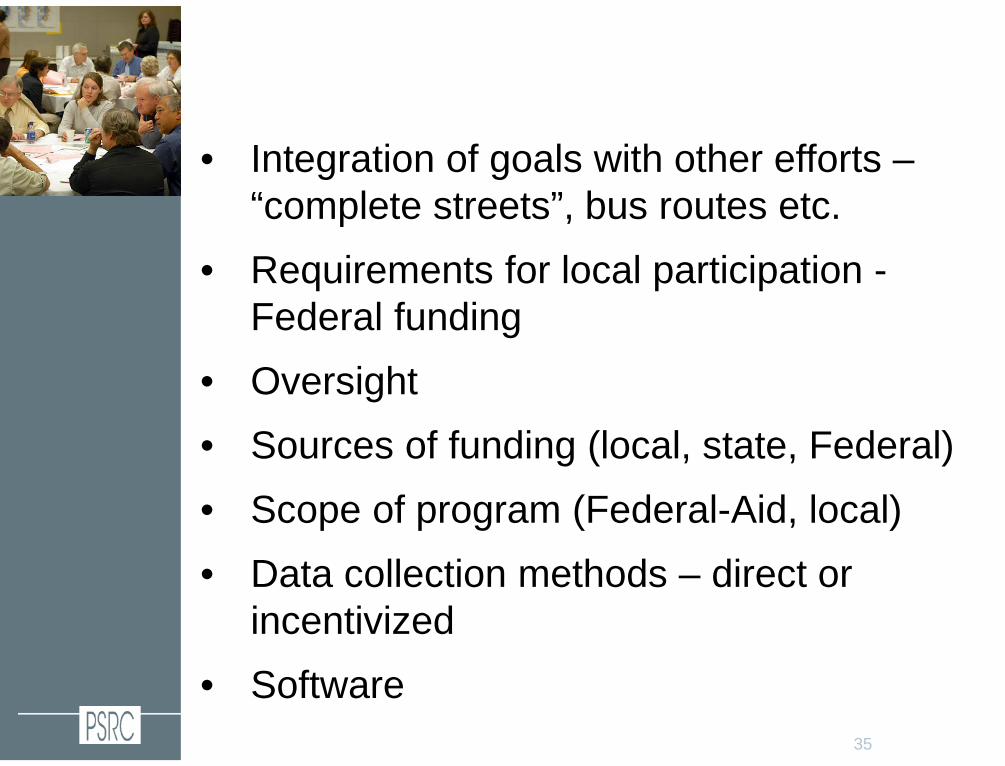
Unique Aspects – General• Integration of goals with other efforts –
“complete streets”, bus routes etc.• Requirements for local participation -
Federal funding• Oversight • Sources of funding (local, state, Federal)• Scope of program (Federal-Aid, local)• Data collection methods – direct or
incentivized • Software
36
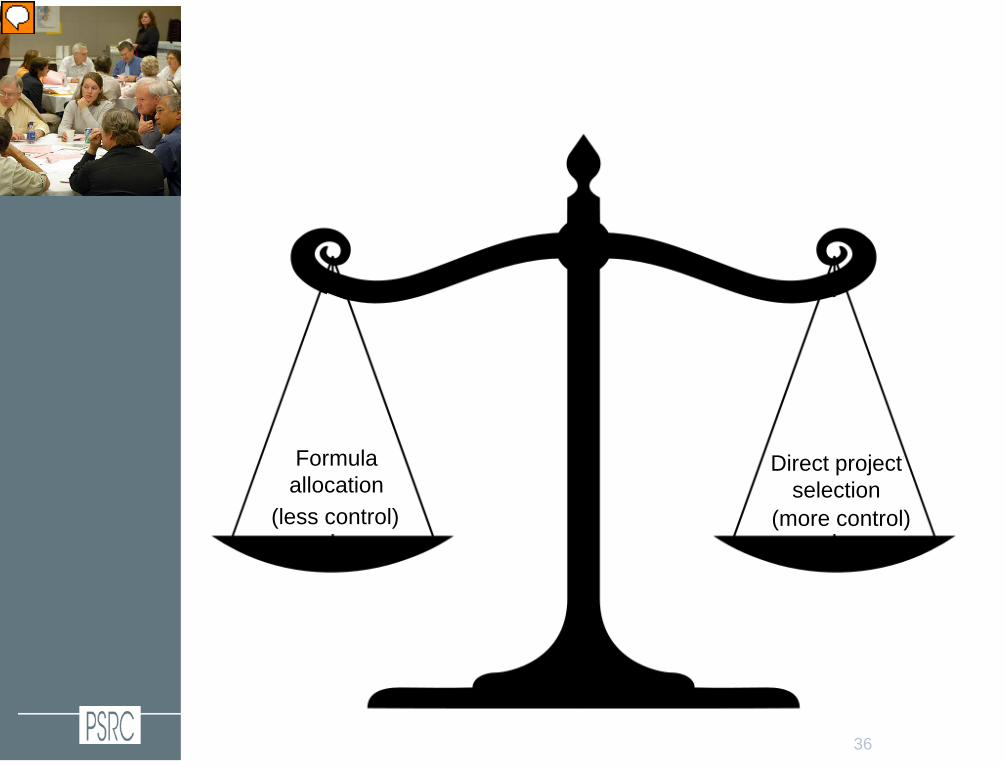
Unique Aspects – Funding
Formula allocation
(less control)
Direct projectselection
(more control)
37
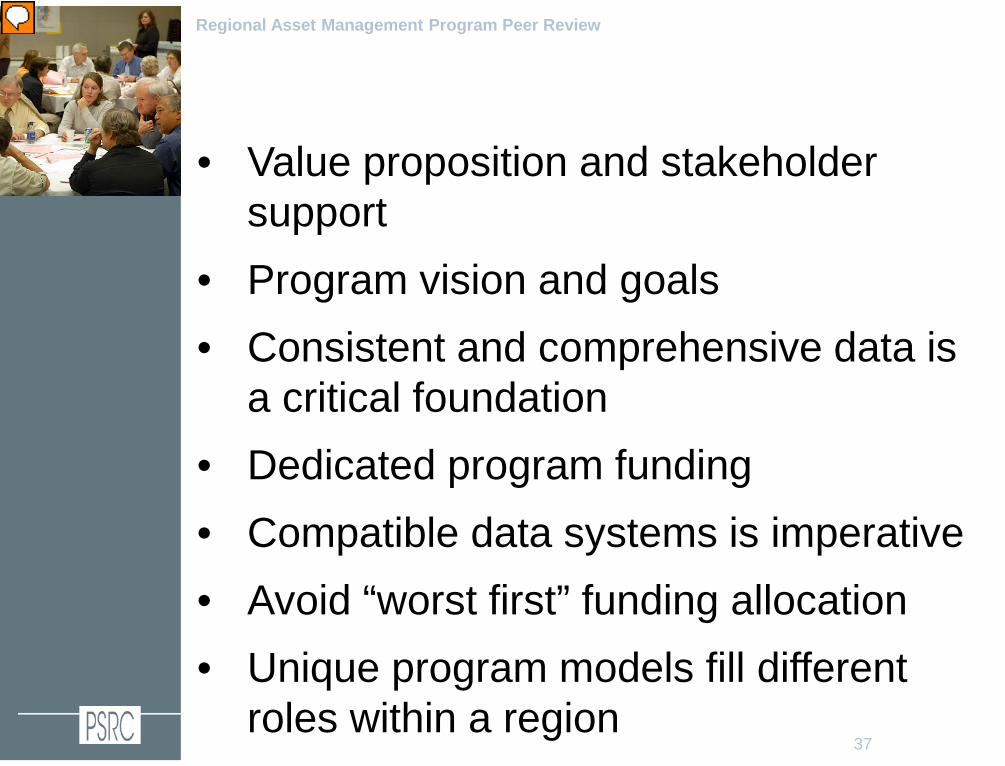
Regional Asset Management Program Peer Review
Key Findings & Takeaways• Value proposition and stakeholder
support• Program vision and goals• Consistent and comprehensive data is
a critical foundation• Dedicated program funding• Compatible data systems is imperative• Avoid “worst first” funding allocation• Unique program models fill different
roles within a region
38
Regional Asset Management Program Peer Review
Top 3 Tips
1. Start simple with capacity to grow (both breadth and depth)
2. Maintain a consistent data structure and system
3. Develop dedicated revenue sources through a systematic process
39
Next Steps
• Final MAP-21 rule expected in Fall 2015
• Build off MAP-21 requirements to establish regional goals for program
• Continue to build stakeholder support • Identify local capabilities to support
regional program• Identify software and data tools• Broadly define program
40
Information and Contacts
PSRC State of Good Repair Webpagehttp://www.psrc.org/transportation/sgr/
Benjamin BrackettSenior Planner(206) [email protected]
Robin Mayhew, AICPProgram Manager(206) [email protected]
NCTCOG
41
Climate Change/Extreme WeatherInfrastructure Vulnerability Assessment:
Federal Highway Administration (FHWA)Pilot Study for the Dallas-Fort Worth Region
May 13, 2015 Transportation Asset Management ETG Webinar #2“Asset Management for MPO’s”
43
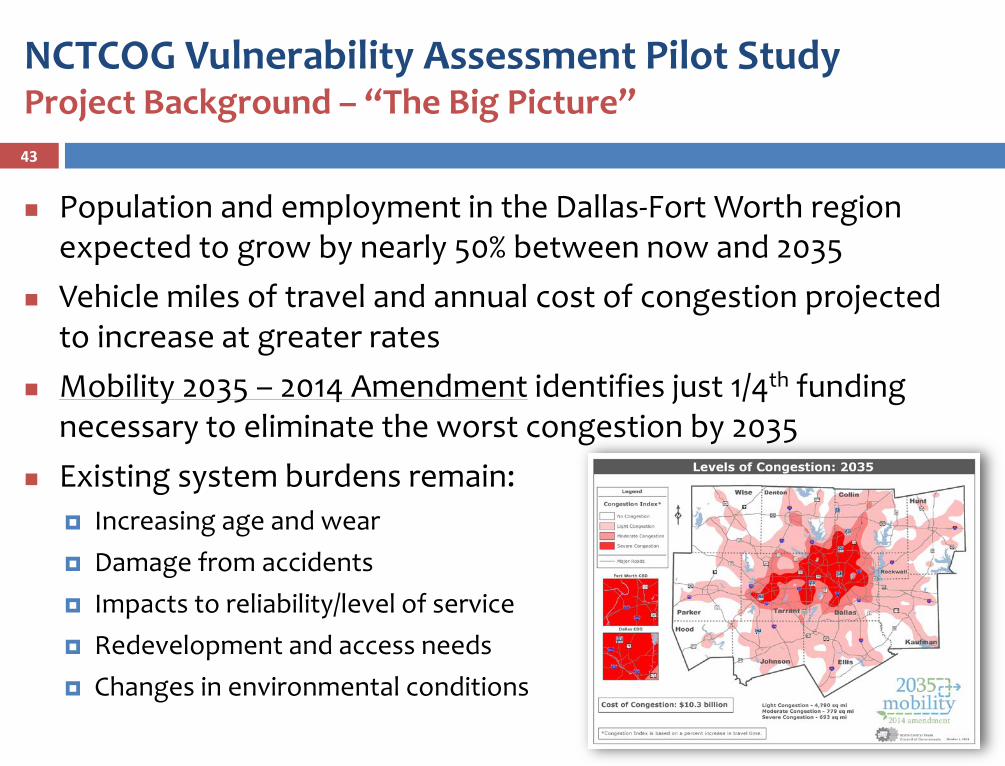
Population and employment in the Dallas-Fort Worth region expected to grow by nearly 50% between now and 2035
Vehicle miles of travel and annual cost of congestion projected to increase at greater rates
Mobility 2035 – 2014 Amendment identifies just 1/4th funding necessary to eliminate the worst congestion by 2035
Existing system burdens remain: Increasing age and wear Damage from accidents Impacts to reliability/level of service Redevelopment and access needs Changes in environmental conditions
NCTCOG Vulnerability Assessment Pilot StudyProject Background – “The Big Picture”
44
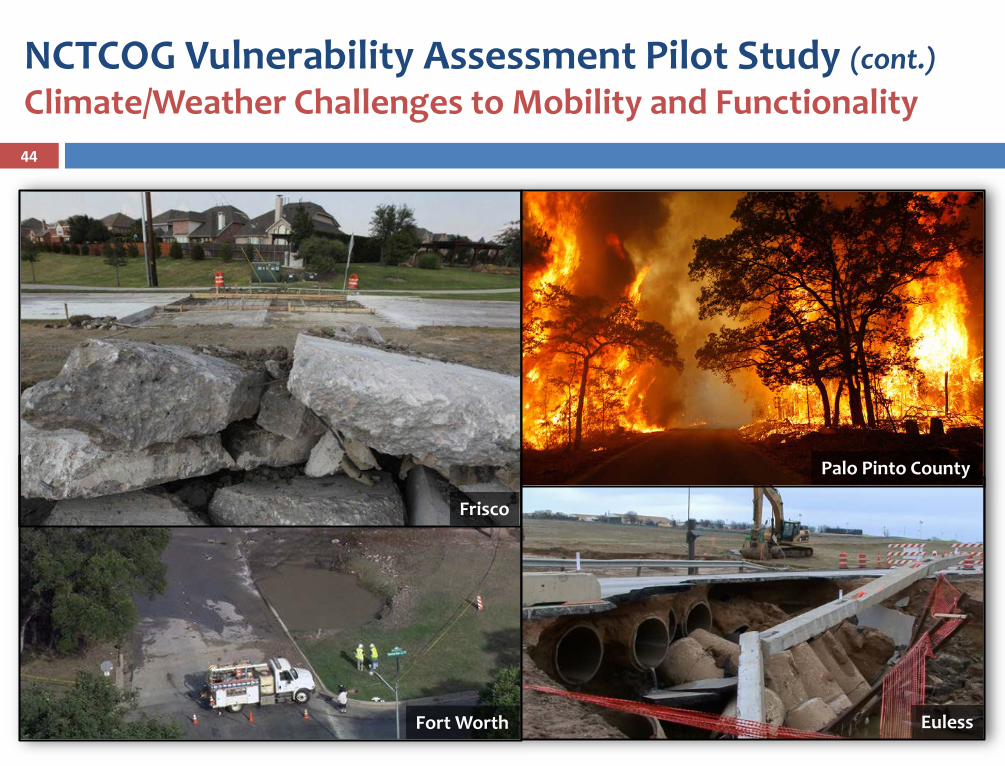
NCTCOG Vulnerability Assessment Pilot Study (cont.)Climate/Weather Challenges to Mobility and Functionality
Palo Pinto County
Frisco
Fort Worth Euless
45
NCTCOG Vulnerability Assessment Pilot Study (cont.)Project Overview
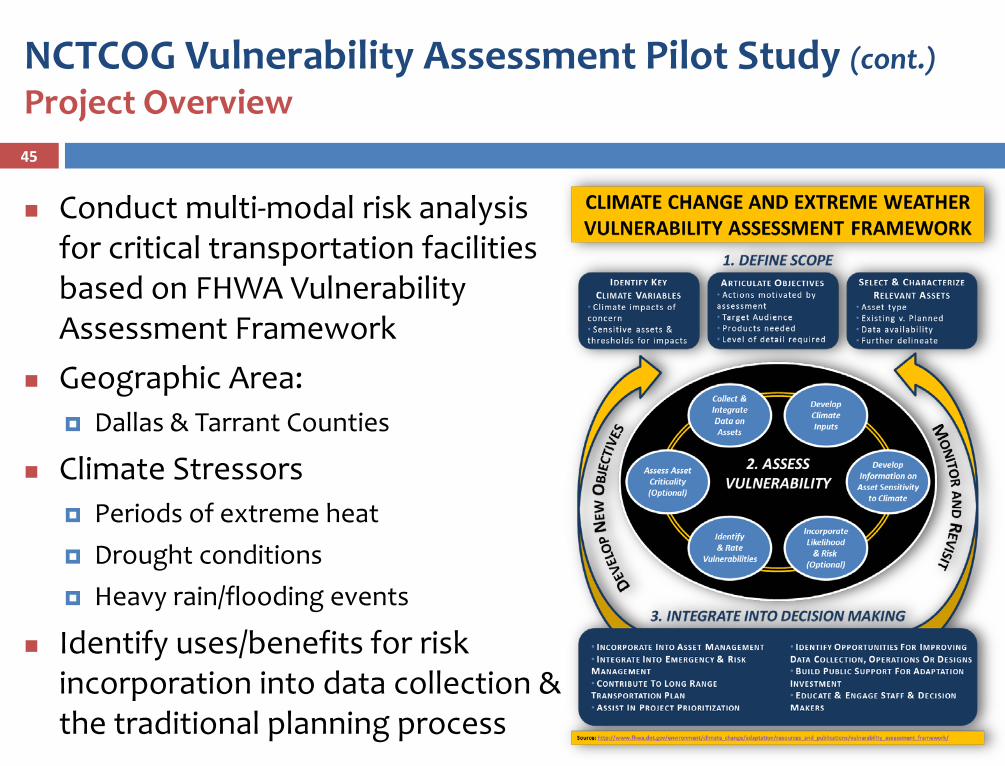
Conduct multi-modal risk analysis for critical transportation facilities based on FHWA Vulnerability Assessment Framework
Geographic Area: Dallas & Tarrant Counties
Climate Stressors Periods of extreme heat Drought conditions Heavy rain/flooding events
Identify uses/benefits for risk incorporation into data collection & the traditional planning process
46
NCTCOG Vulnerability Assessment Pilot Study (cont.)Project Partners and Roles
City of Dallas (Streets & Emergency Management Departments) Provide jurisdictional performance data and reference historical
weather-related reports at vulnerable roadway locations
Fort Worth Transportation Authority Provide transit service maintenance data/reports
University of Texas at Arlington (College of Geosciences) Retrieve/analyze regional climate data Examine regional heat island intensity and effects
Texas Department of Transportation Identify/define potential exposure thresholds and ranges of
facility effects
Continuous Agency Involvem
ent
47
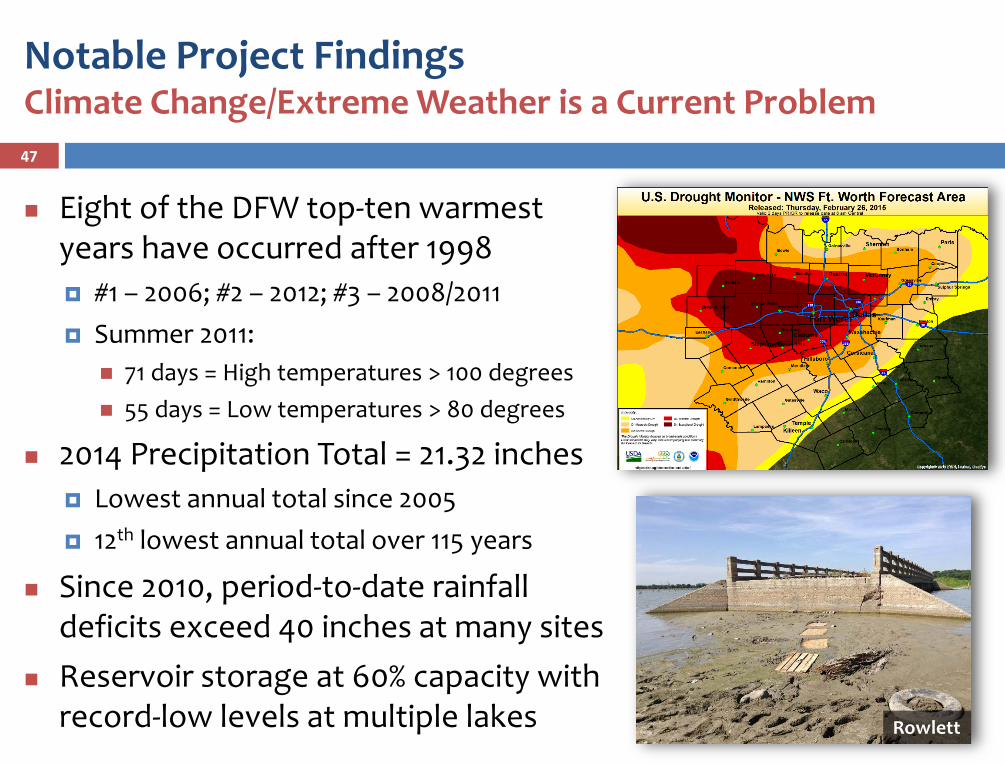
Notable Project FindingsClimate Change/Extreme Weather is a Current Problem
Eight of the DFW top-ten warmest years have occurred after 1998 #1 – 2006; #2 – 2012; #3 – 2008/2011 Summer 2011:
71 days = High temperatures > 100 degrees 55 days = Low temperatures > 80 degrees
2014 Precipitation Total = 21.32 inches Lowest annual total since 2005 12th lowest annual total over 115 years
Since 2010, period-to-date rainfall deficits exceed 40 inches at many sites
Reservoir storage at 60% capacity with record-low levels at multiple lakes Rowlett
48
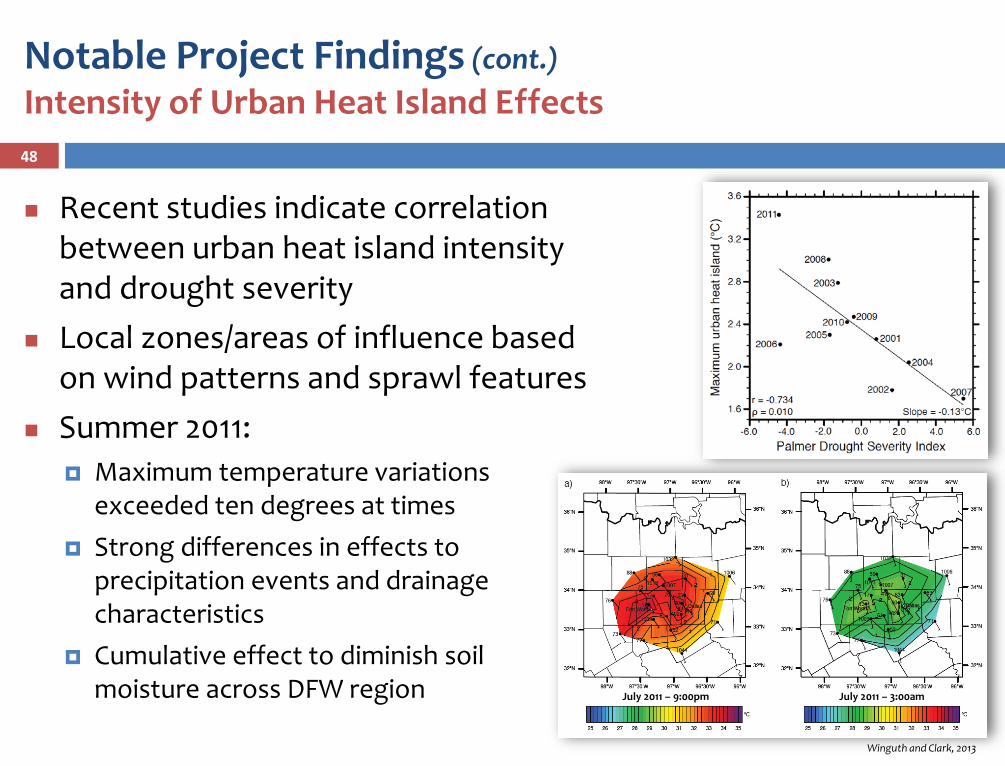
Notable Project Findings (cont.)Intensity of Urban Heat Island Effects
Recent studies indicate correlation between urban heat island intensity and drought severity
Local zones/areas of influence based on wind patterns and sprawl features
Summer 2011: Maximum temperature variations
exceeded ten degrees at times Strong differences in effects to
precipitation events and drainage characteristics
Cumulative effect to diminish soil moisture across DFW region July 2011 – 9:00pm July 2011 – 3:00am
Winguth and Clark, 2013
49
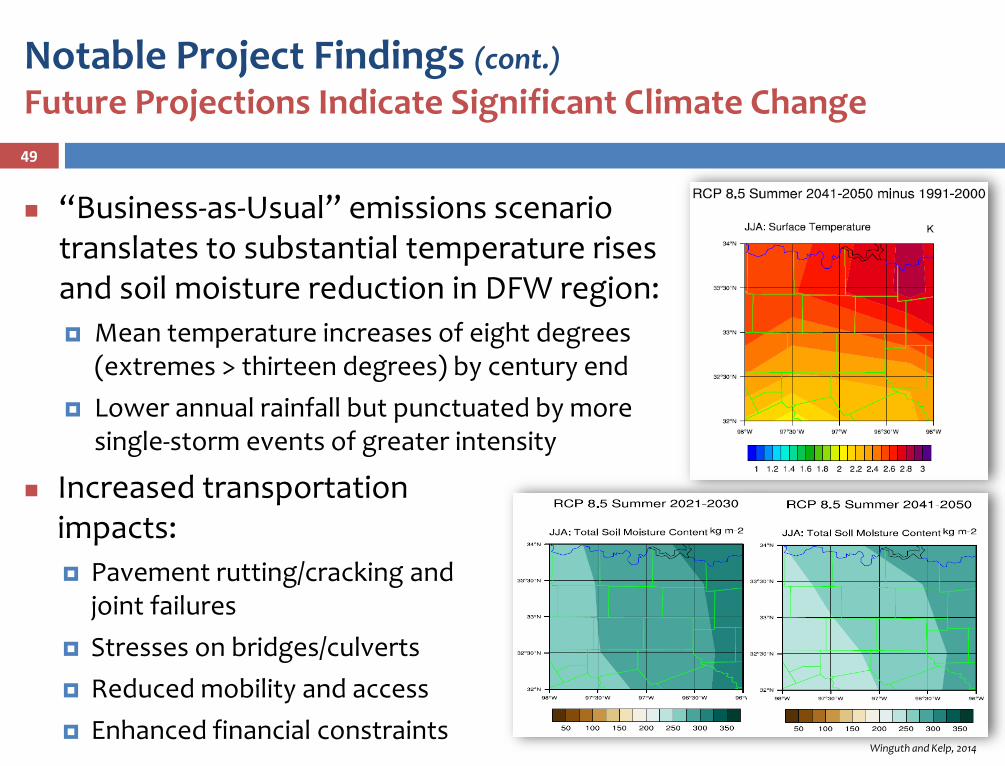
Notable Project Findings (cont.)Future Projections Indicate Significant Climate Change
“Business-as-Usual” emissions scenario translates to substantial temperature rises and soil moisture reduction in DFW region: Mean temperature increases of eight degrees
(extremes > thirteen degrees) by century end Lower annual rainfall but punctuated by more
single-storm events of greater intensity
Winguth and Kelp, 2014
Increased transportation impacts: Pavement rutting/cracking and
joint failures Stresses on bridges/culverts Reduced mobility and access Enhanced financial constraints
50
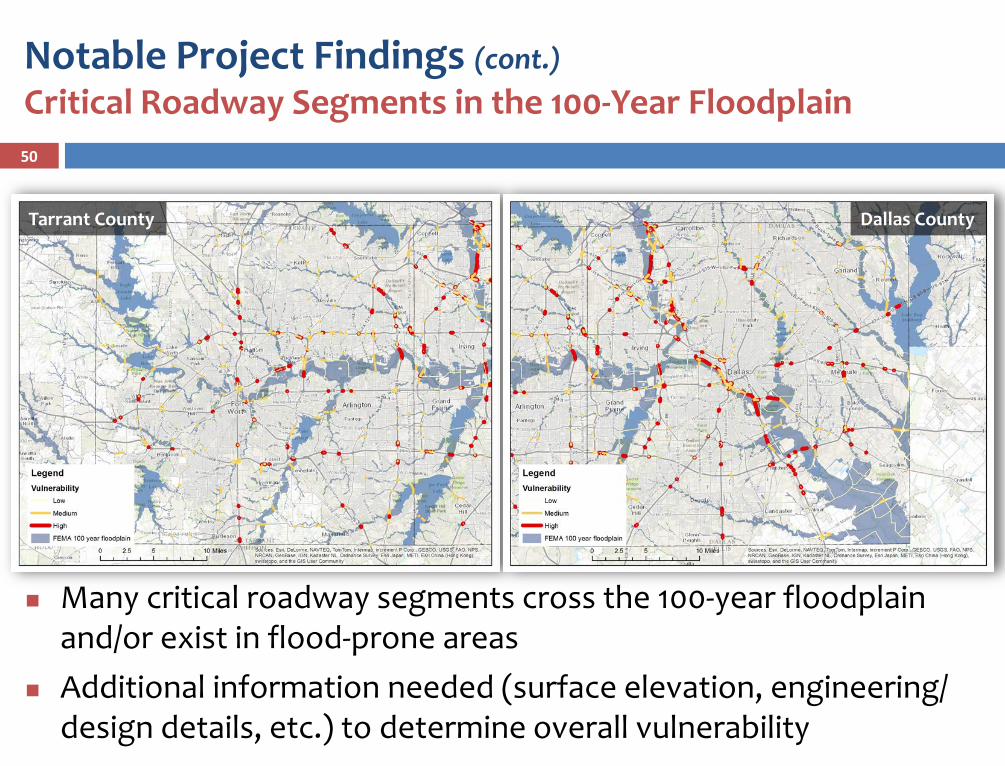
Notable Project Findings (cont.)Critical Roadway Segments in the 100-Year Floodplain
Tarrant County Dallas County
Many critical roadway segments cross the 100-year floodplain and/or exist in flood-prone areas
Additional information needed (surface elevation, engineering/ design details, etc.) to determine overall vulnerability
51
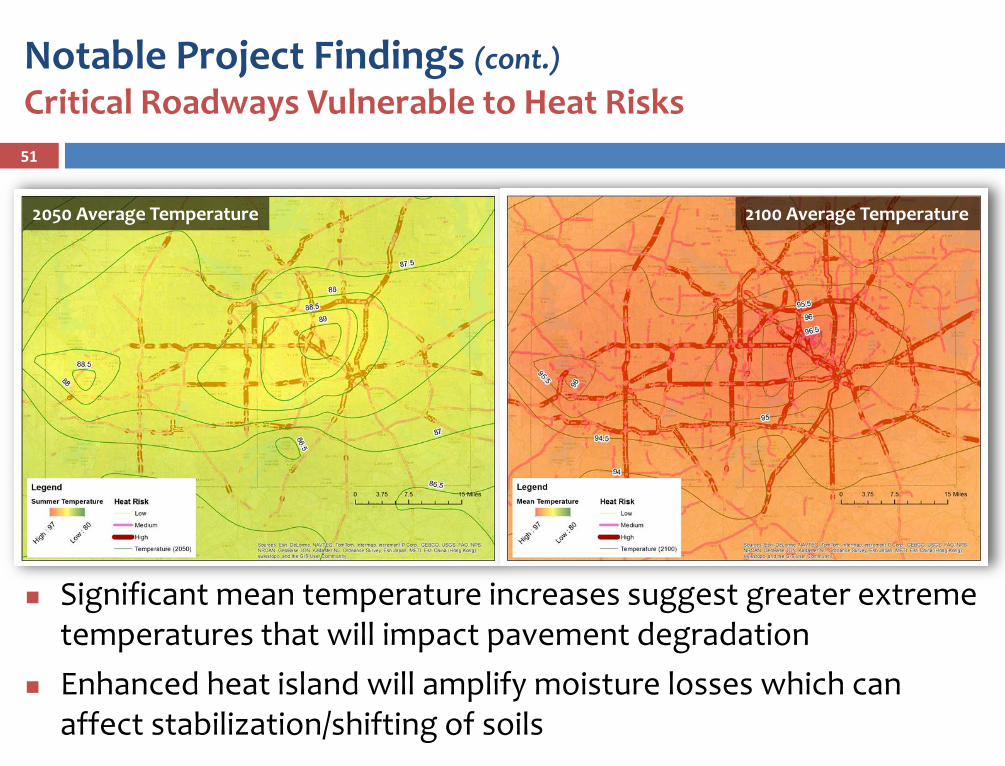
Notable Project Findings (cont.)Critical Roadways Vulnerable to Heat Risks
2050 Average Temperature 2100 Average Temperature
Significant mean temperature increases suggest greater extreme temperatures that will impact pavement degradation
Enhanced heat island will amplify moisture losses which can affect stabilization/shifting of soils
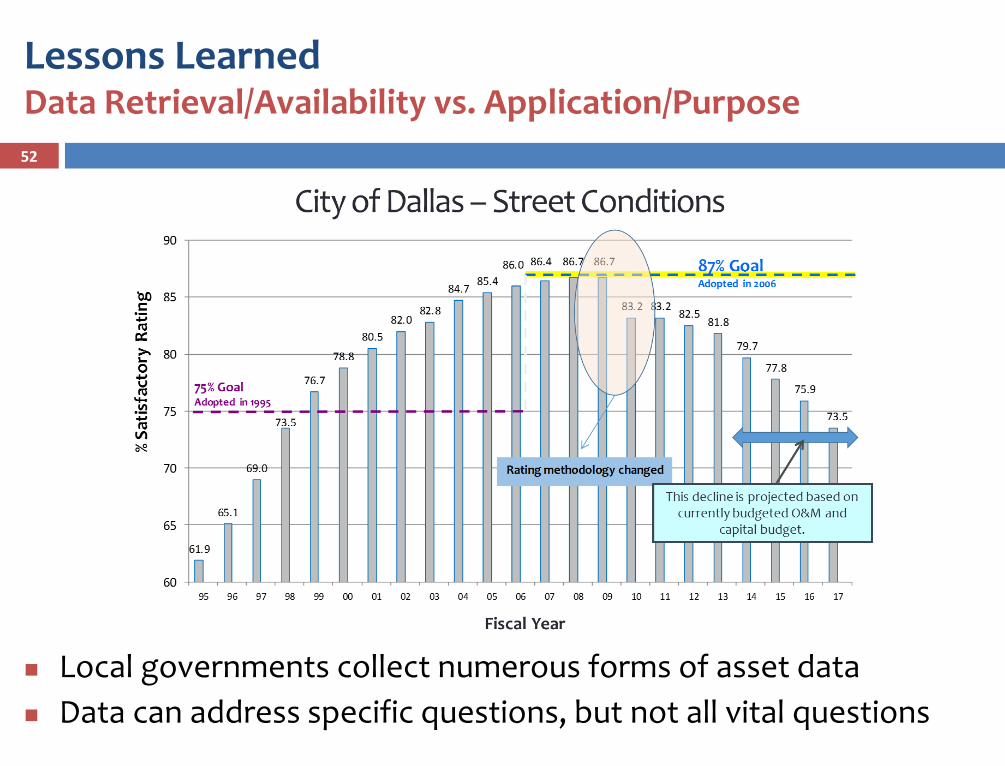
52
Lessons LearnedData Retrieval/Availability vs. Application/Purpose
Local governments collect numerous forms of asset data Data can address specific questions, but not all vital questions
53
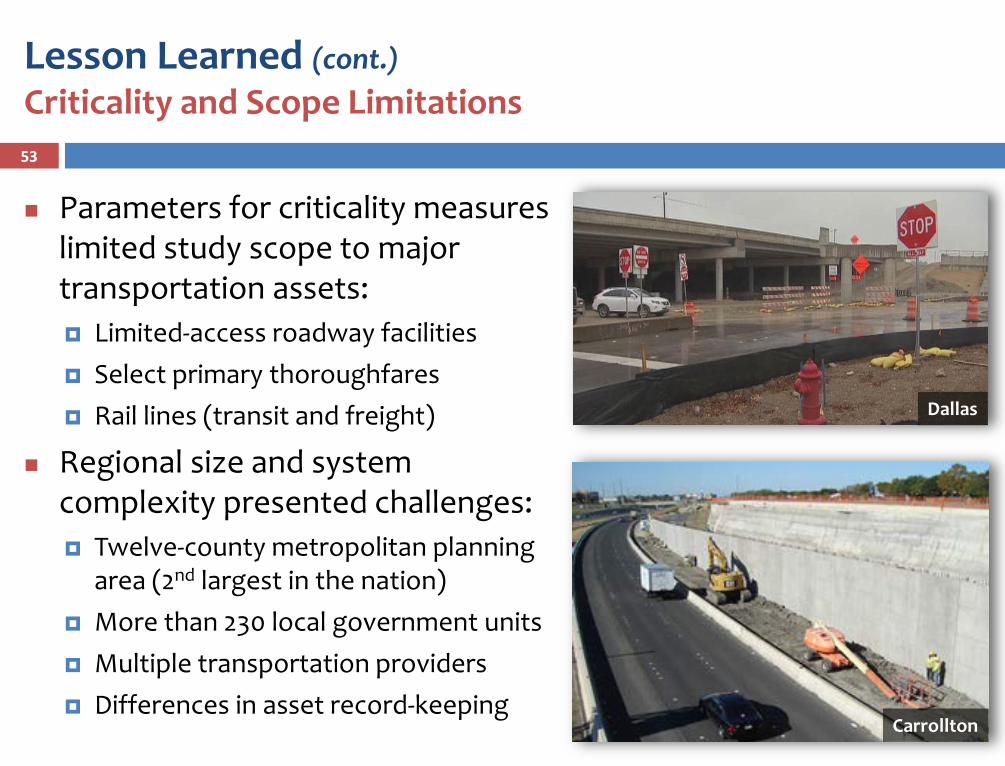
Lesson Learned (cont.)Criticality and Scope Limitations
Parameters for criticality measures limited study scope to major transportation assets: Limited-access roadway facilities Select primary thoroughfares Rail lines (transit and freight)
Regional size and system complexity presented challenges: Twelve-county metropolitan planning
area (2nd largest in the nation) More than 230 local government units Multiple transportation providers Differences in asset record-keeping
Dallas
Carrollton
54
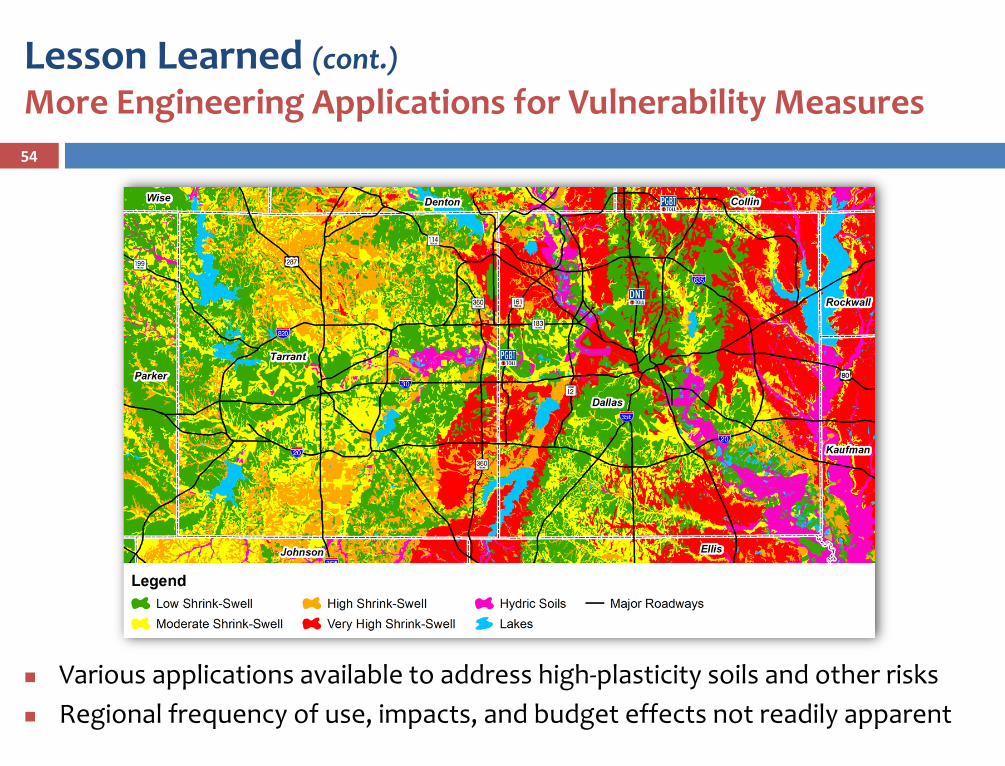
Lesson Learned (cont.)More Engineering Applications for Vulnerability Measures
Various applications available to address high-plasticity soils and other risks Regional frequency of use, impacts, and budget effects not readily apparent
55
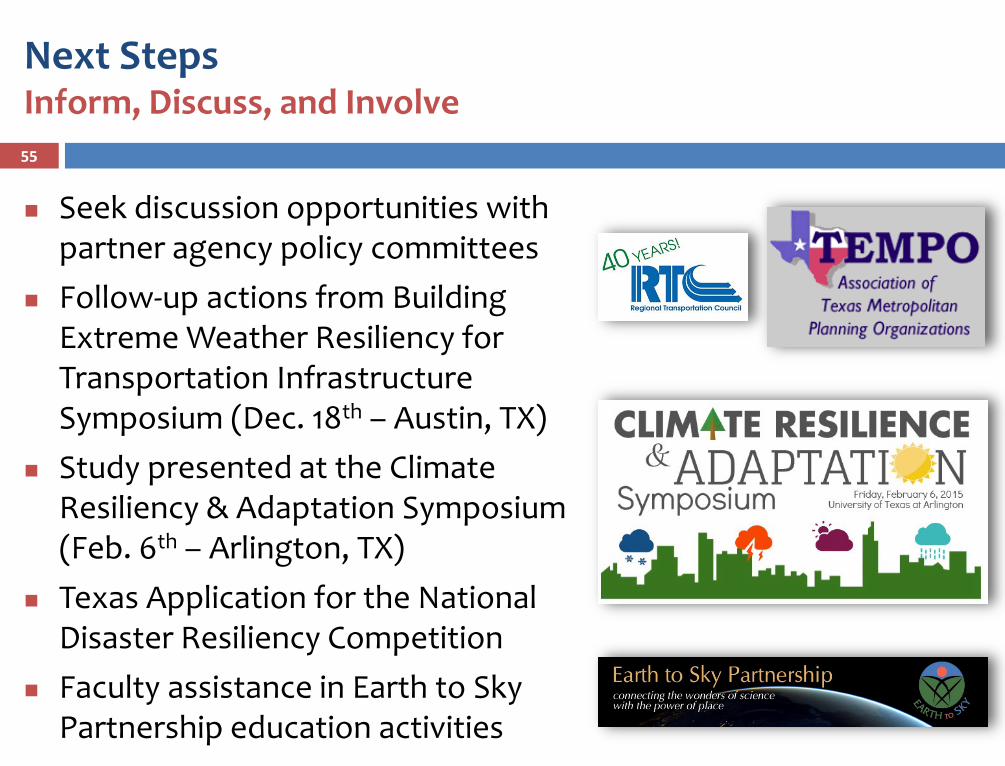
Next StepsInform, Discuss, and Involve
Seek discussion opportunities with partner agency policy committees
Follow-up actions from Building Extreme Weather Resiliency for Transportation Infrastructure Symposium (Dec. 18th – Austin, TX)
Study presented at the Climate Resiliency & Adaptation Symposium (Feb. 6th – Arlington, TX)
Texas Application for the National Disaster Resiliency Competition
Faculty assistance in Earth to Sky Partnership education activities
56
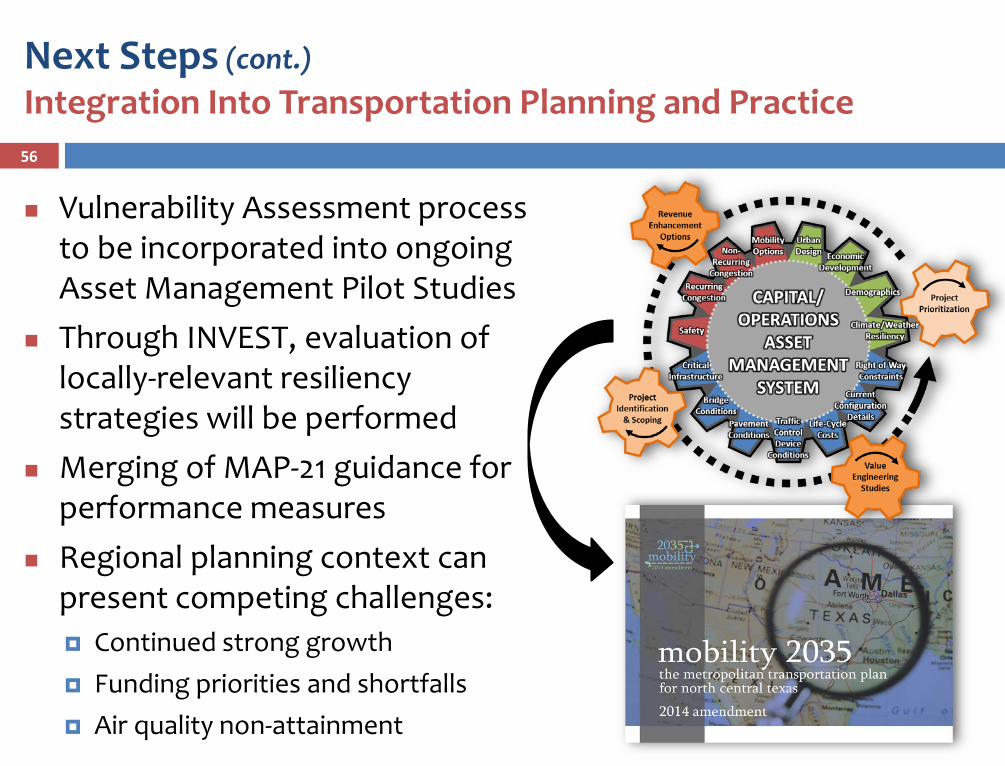
Next Steps (cont.)Integration Into Transportation Planning and Practice
Vulnerability Assessment process to be incorporated into ongoing Asset Management Pilot Studies
Through INVEST, evaluation of locally-relevant resiliency strategies will be performed
Merging of MAP-21 guidance for performance measures
Regional planning context can present competing challenges: Continued strong growth Funding priorities and shortfalls Air quality non-attainment
57
Future Needs/ActionsAddressing Cumulative Challenges to Transportation
Configure asset databases to show direct influence of climate change/extreme weather on performance measures
Create improved modeling to simulate hydrologic effects to transportation outside of typical floodplain areas
Identify future opportunities to conduct a similar assessment for the remainder of the 12-county Metropolitan Planning Area
Develop provider partnerships to update design methods and maintenance practices with improved focus on infrastructure resiliency (Centers of Development Excellence – UT Arlington)
Identify and/or improve best practices/measures in the monitoring and evaluation of vulnerability factors
Investigate climate change and weather-related impacts among various transportation system investment strategies
NCTCOG Contact Information:
Jeffrey C. NealProgram Manager
(817) [email protected]
May 13, 2015 Transportation Asset Management ETG Webinar #2“Asset Management for MPO’s”
Northeast Ohio AreawideCoordinating Agency
59
TAM ETG Webinar #2; Transportation Asset Management 101 for MPOsMay 13, 2015
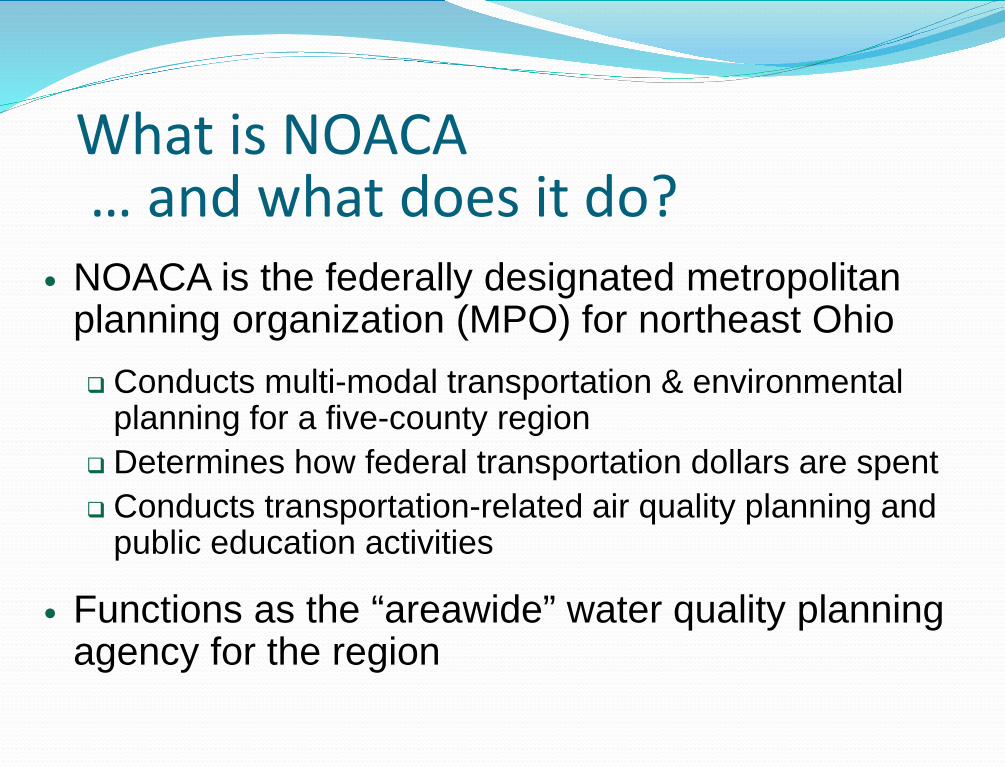
What is NOACA … and what does it do?
NOACA is the federally designated metropolitan planning organization (MPO) for northeast Ohio Conducts multi-modal transportation & environmental
planning for a five-county region Determines how federal transportation dollars are spent Conducts transportation-related air quality planning and
public education activities
Functions as the “areawide” water quality planning agency for the region
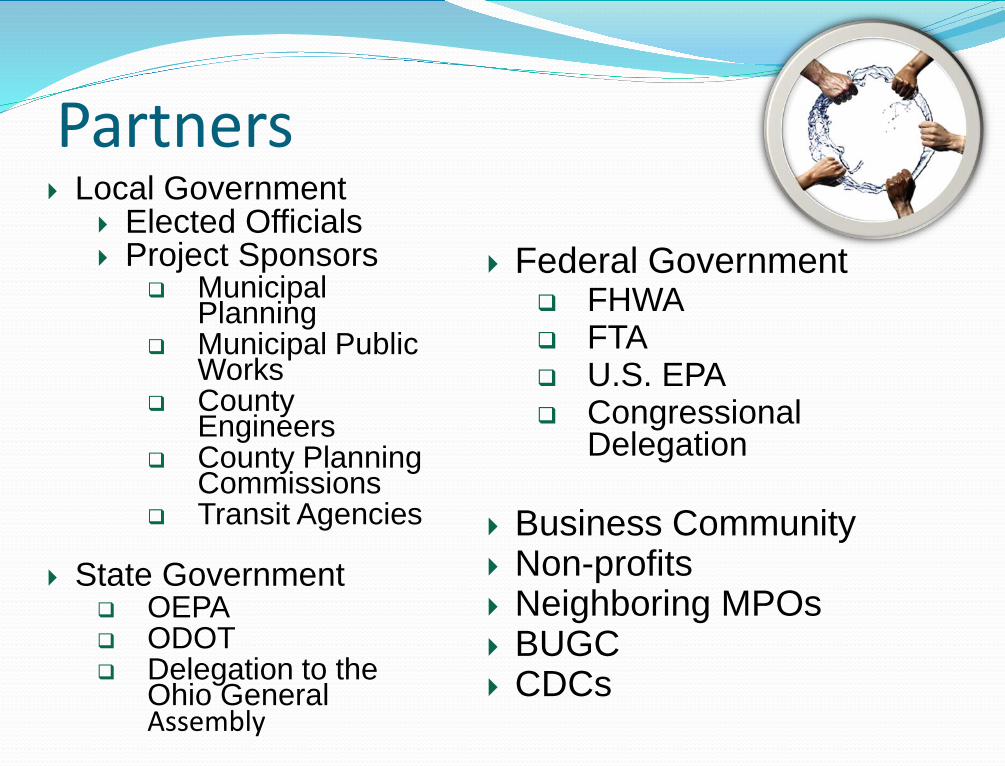
Partners Local Government
Elected Officials Project Sponsors
Municipal Planning
Municipal Public Works
County Engineers
County Planning Commissions
Transit Agencies
State Government OEPA ODOT Delegation to the
Ohio General Assembly
Federal Government FHWA FTA U.S. EPA Congressional
Delegation
Business Community Non-profits Neighboring MPOs BUGC CDCs
Federal Requirements: Transportation 3C planning processComprehensive, cooperative & continuing process for
transportation Air quality (Transportation-related) Major planning effortsLong-range transportation plan (LRTP)Transportation Improvement Program (TIP)Overall Work Program (OWP)
Public involvement Project programming & funds management
Board Composition 45- Member Board Principal membersCuyahoga CountyGeauga CountyLake CountyLorain CountyMedina County
Cities, Villages and Townships Regional Governmental Authorities and Districts Ohio EPA (non-voting)
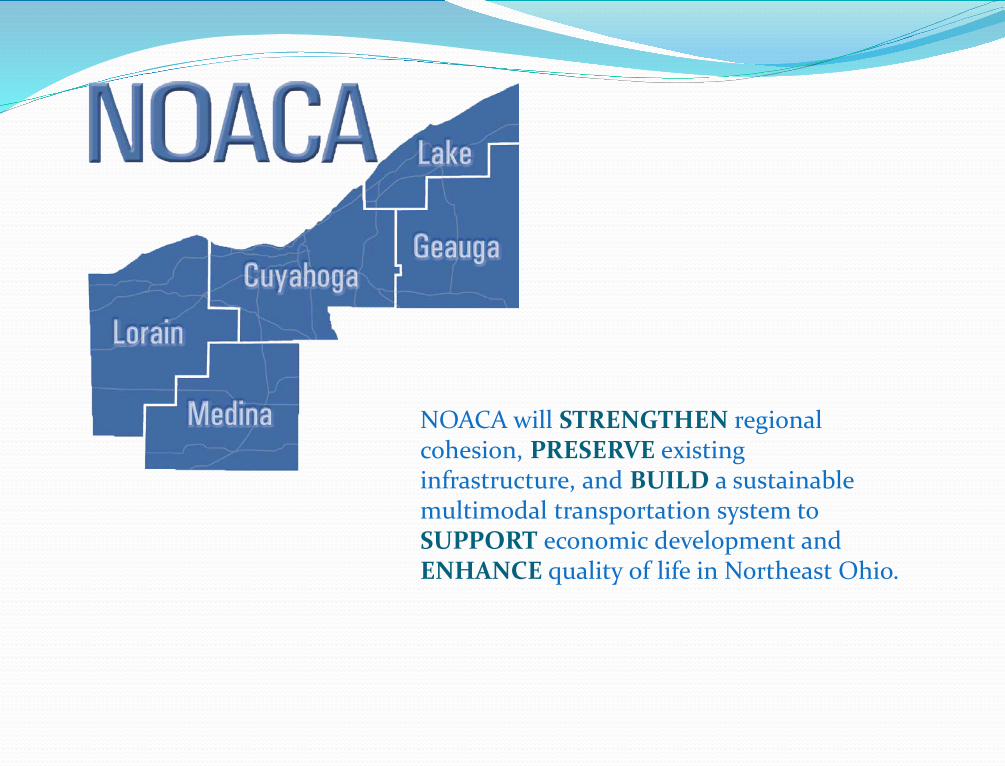
Vision Statement NOACA will STRENGTHEN regional cohesion,
PRESERVE existing infrastructure, and BUILD a sustainable multi-modal transportation system to SUPPORT economic development and ENHANCE quality of life in Northeast Ohio
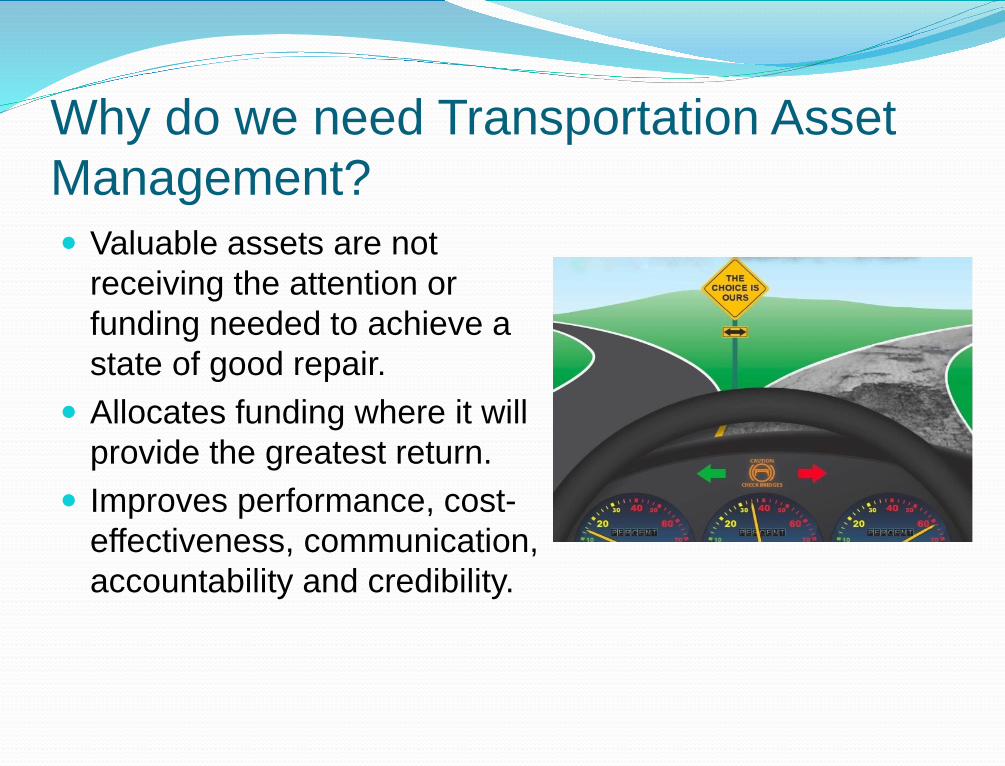
Why do we need Transportation Asset Management? Valuable assets are not
receiving the attention or funding needed to achieve a state of good repair.
Allocates funding where it will provide the greatest return.
Improves performance, cost-effectiveness, communication, accountability and credibility.
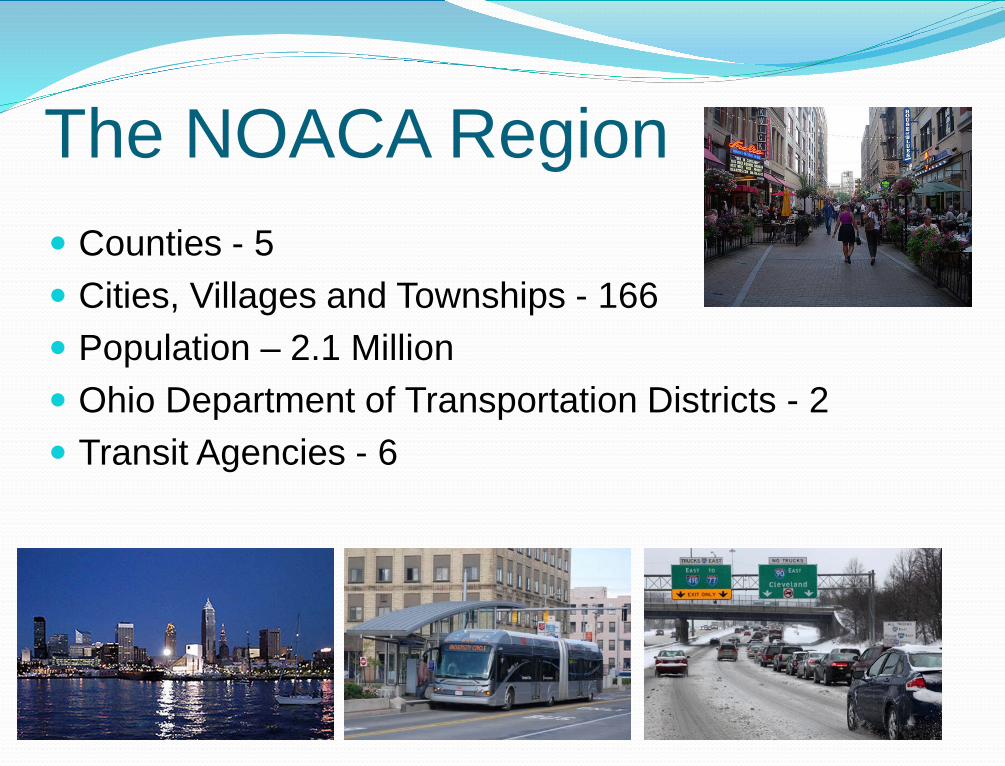
The NOACA Region Counties - 5 Cities, Villages and Townships - 166 Population – 2.1 Million Ohio Department of Transportation Districts - 2 Transit Agencies - 6
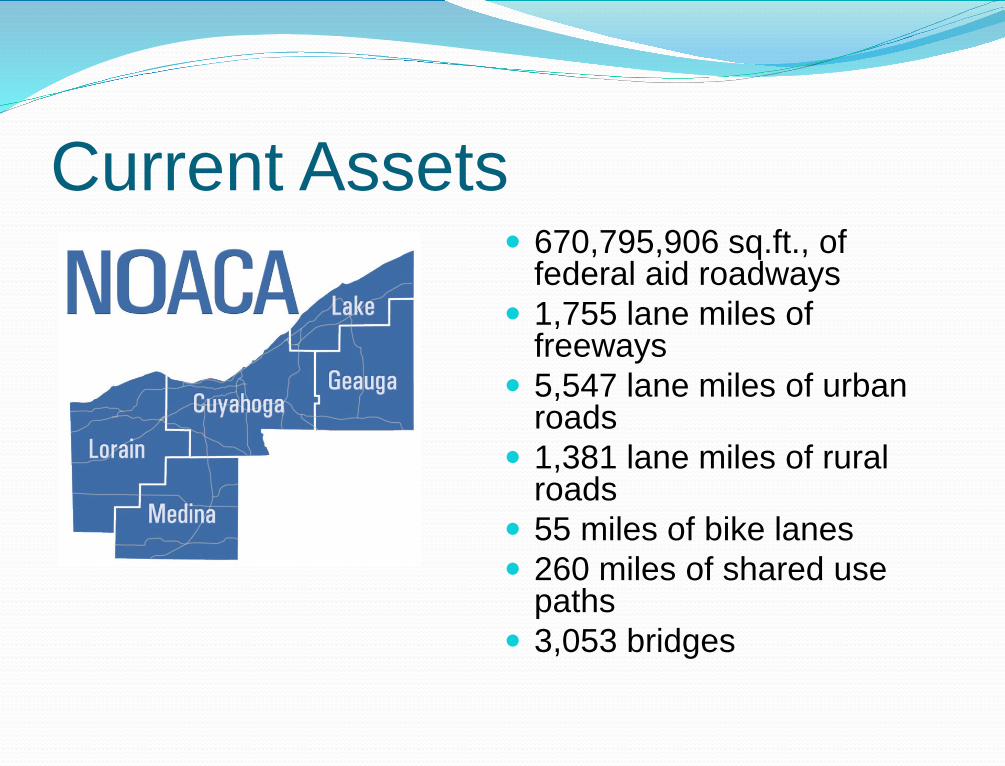
Current Assets 670,795,906 sq.ft., of
federal aid roadways 1,755 lane miles of
freeways 5,547 lane miles of urban
roads 1,381 lane miles of rural
roads 55 miles of bike lanes 260 miles of shared use
paths 3,053 bridges
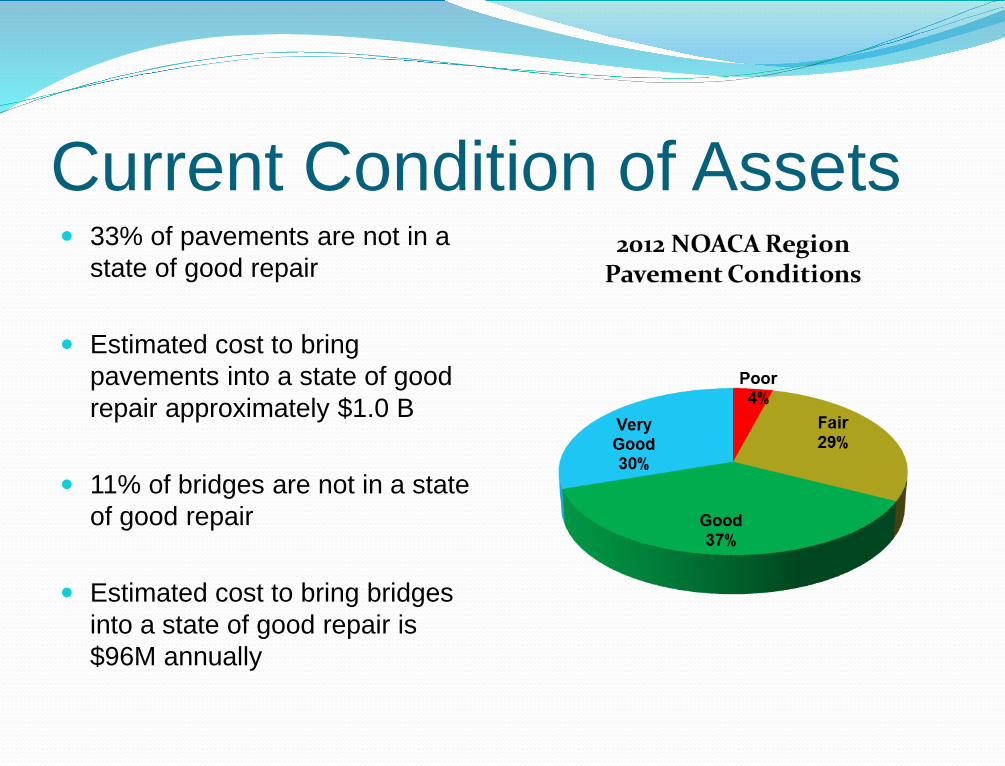
Current Condition of Assets 33% of pavements are not in a
state of good repair
Estimated cost to bring pavements into a state of good repair approximately $1.0 B
11% of bridges are not in a state of good repair
Estimated cost to bring bridges into a state of good repair is $96M annually
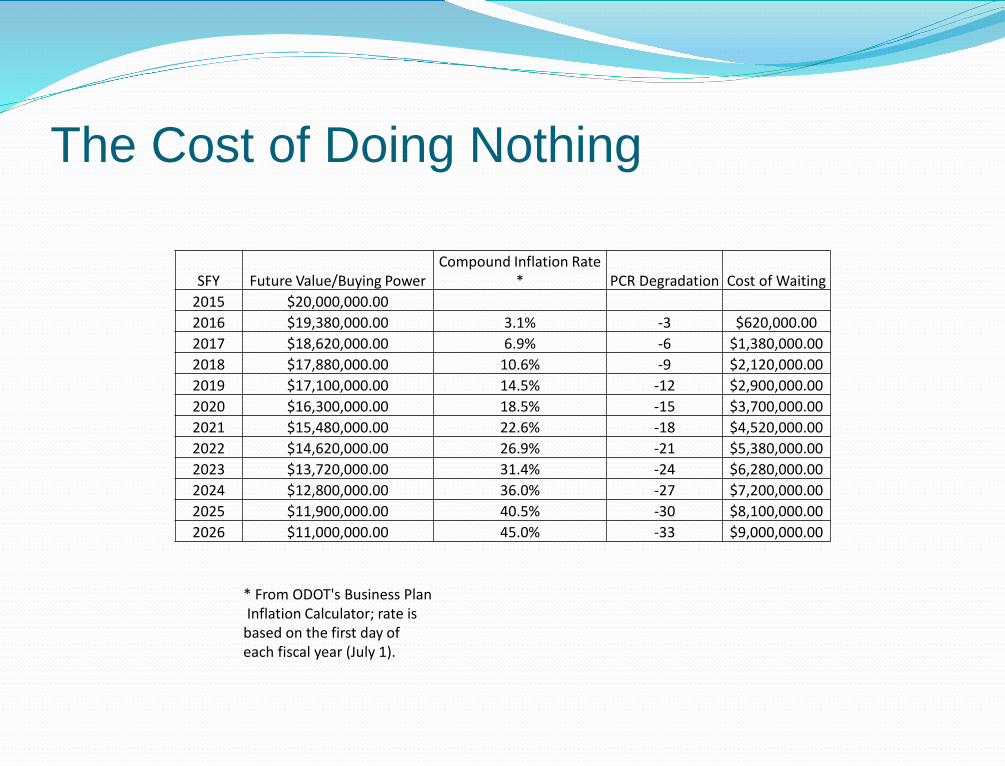
The Cost of Doing Nothing
SFY Future Value/Buying PowerCompound Inflation Rate
* PCR Degradation Cost of Waiting2015 $20,000,000.002016 $19,380,000.00 3.1% -3 $620,000.002017 $18,620,000.00 6.9% -6 $1,380,000.002018 $17,880,000.00 10.6% -9 $2,120,000.002019 $17,100,000.00 14.5% -12 $2,900,000.002020 $16,300,000.00 18.5% -15 $3,700,000.002021 $15,480,000.00 22.6% -18 $4,520,000.002022 $14,620,000.00 26.9% -21 $5,380,000.002023 $13,720,000.00 31.4% -24 $6,280,000.002024 $12,800,000.00 36.0% -27 $7,200,000.002025 $11,900,000.00 40.5% -30 $8,100,000.002026 $11,000,000.00 45.0% -33 $9,000,000.00
* From ODOT's Business PlanInflation Calculator; rate is
based on the first day of each fiscal year (July 1).
Decision With a surface transportation program (STP) annual
allocation of only $27.5 M, NOACA needed a strategic framework for making cost effective decisions about allocating resources and managing infrastructure
TAMP Development NOACA is committed to developing a comprehensive
transportation asset management program to improve and sustain the condition of the highway infrastructure toward a state of good repair.
While the TAMP is under development, NOACA has developed a Provisional Transportation Asset Management Program to address the regions critical pavement needs
Not only will this policy allow the region’s roads to be maintained in a state of good repair, it will also furnish critical information and experience that can be used in developing the long term policy

What is the Provisional Transportation Asset Management Policy?
Eligibility: Every community in
NOACA’s five County region that maintains local federal aid roadways.
Plan elements directly related to pavement resurfacing are eligible for funding through this policy.
What is the Provisional Transportation Asset Management Policy? Project Selection:
NOACA’s Regional Pavement Management System (RPMS) was used to prioritize projects based on a benefit analysis using pavement condition rating (PCR), average daily traffic (ADT), functional classification of the roadways and connectivity value
ODOT maintained routes were not included Only roadways with a PCR less than 75 were considered NOACA partnered with the affected communities to establish a
final project list Selected projects are following the normal NOACA process
What is the Provisional Transportation Asset Management Policy? Funding:
Not to exceed $40 m over a two year period Restructuring or reorganizing the Transportation
Improvement Program (TIP) (rightsizing) Resulted in fully funding the FY 2015 projects, totaling over
$12.5 m Although insufficient to fully fund the FY 2016 projects, the
remaining balance is adequate for debt service.
What is the Provisional Transportation Asset Management Policy? Sponsor Responsibilities:
Preliminary development and detailed design phase activities
Development of the Plans, Specifications and Estimate (PS&E) package
20% local funding match requirement for construction and construction engineering related activities.
Projects are expected to move to construction prior to the close of SFY 2016 or will not be eligible for this funding
Development of a Comprehensive, Long Term TAMP RFP Released April 2014 Project divided into two parts
Part I: lays the foundation by completing an accurate Asset Inventory and Condition Assessment and recommending a Pavement Management System
Part II: focuses on the development of the overall TAMP and explores the strategic efforts necessary to ensure its adoption and implementation
Development of a Comprehensive, Long Term TAMP Key Principles:
Strategic & proactive in approach Places a premium on data, information and collaboration A long term and comprehensive view of infrastructure
performance and cost An explicit, visible, and transparent approach requiring
effective communication among all stakeholders Investment choices that are policy driven with trade-offs
among competing priorities
Development of a Comprehensive, Long Term TAMP Transportation Asset Management Steering
Committee formed Engineers and Planners from City and County
Government, ODOT and FHWA Consultant selection Guide the development of the TAMP Provide expertise
Development of a Comprehensive, Long Term TAMP Cambridge Systematics selected and approved by
the Board of Directors July 2014 Project Team:
Cambridge Systematics, Inc. (CS): Samuel Van Hecke – Project Manager Joseph Guerre, P.E. – Principal-in-Charge Jason Bittner, MPA – Deputy Project Manager Hugh Louch Erik Cempel, AICP Erika Witzke, P.E. David Baumgartner, EIT Jason Hyde
Applied Pavement Technology, Inc.: Mark P. Gardner, P.E. Kathryn A. Zimmerman, P.E. Prashant V. Ram, EIT
Deighton Associates Ltd.: Robert Piane, P. Eng. Daniel Roberts, P.E. Jeff Zavitski
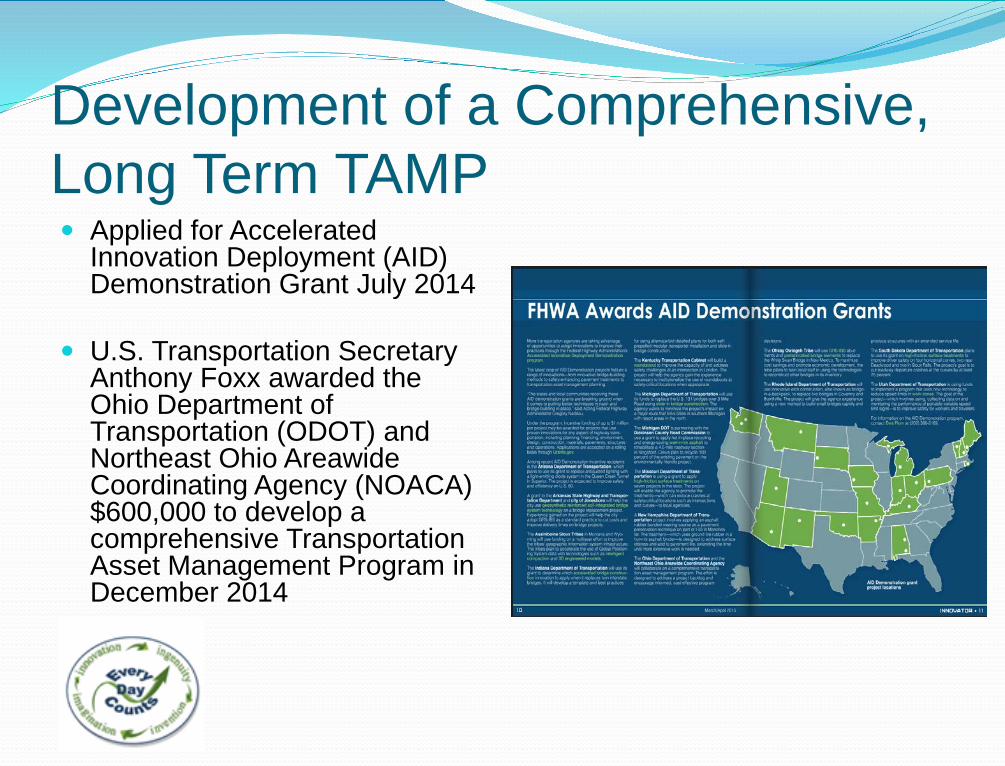
Development of a Comprehensive, Long Term TAMP Applied for Accelerated
Innovation Deployment (AID) Demonstration Grant July 2014
U.S. Transportation Secretary Anthony Foxx awarded the Ohio Department of Transportation (ODOT) and Northeast Ohio Areawide Coordinating Agency (NOACA) $600,000 to develop a comprehensive Transportation Asset Management Program in December 2014
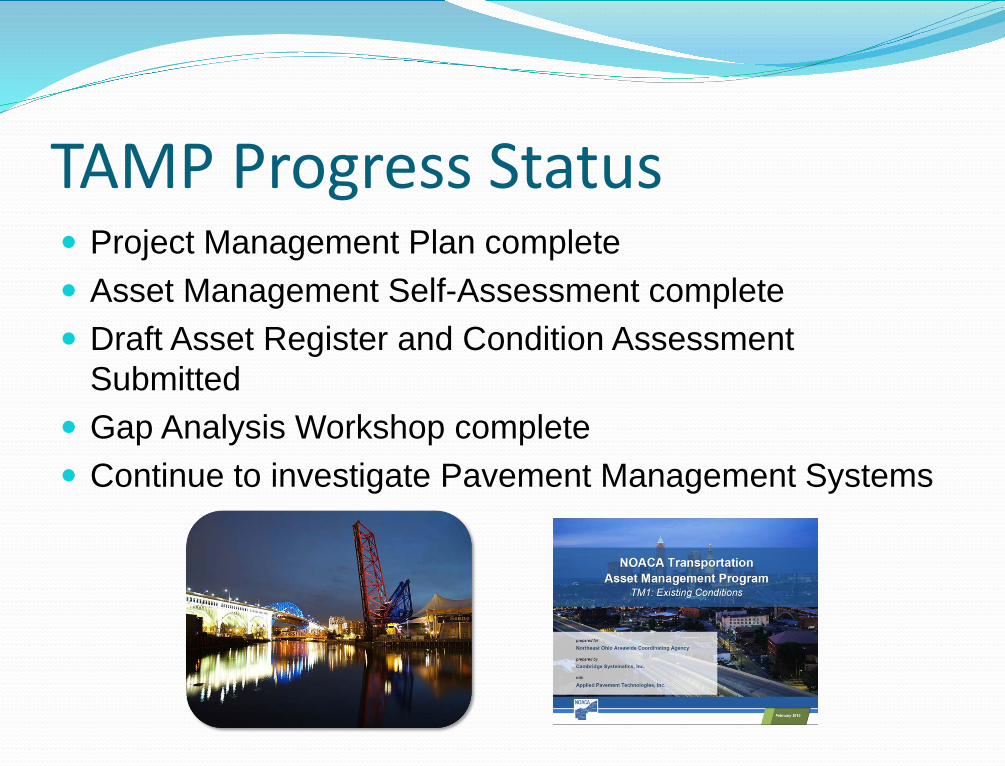
TAMP Progress Status Project Management Plan complete Asset Management Self-Assessment complete Draft Asset Register and Condition Assessment
Submitted Gap Analysis Workshop complete Continue to investigate Pavement Management Systems
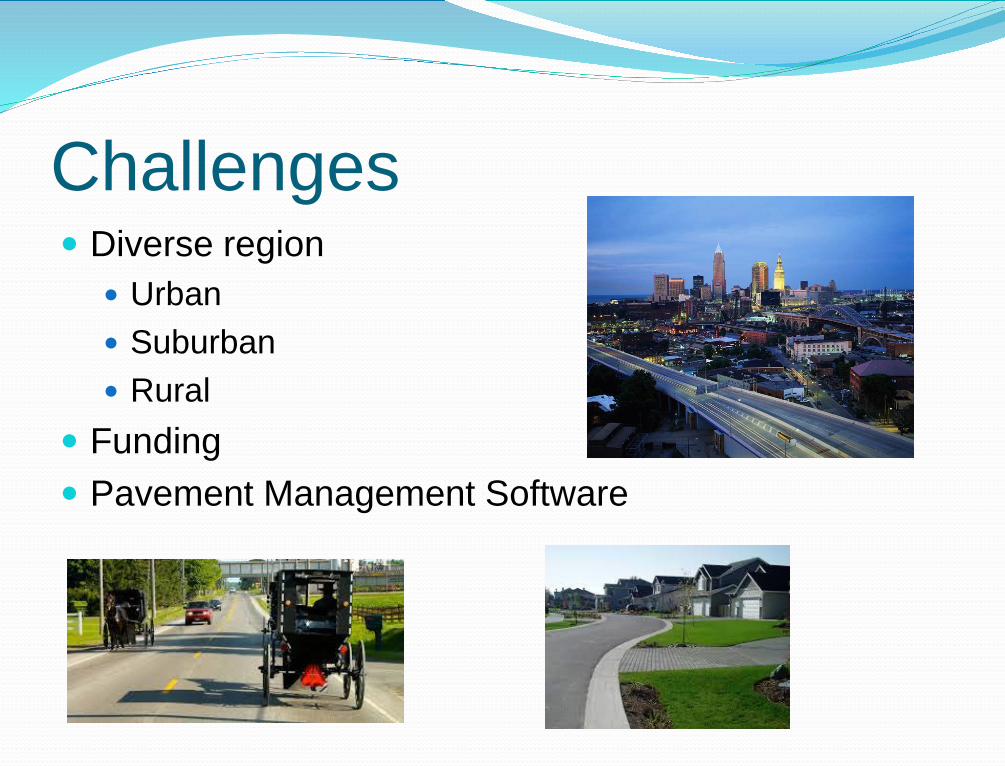
Challenges Diverse region
Urban Suburban Rural
Funding Pavement Management Software
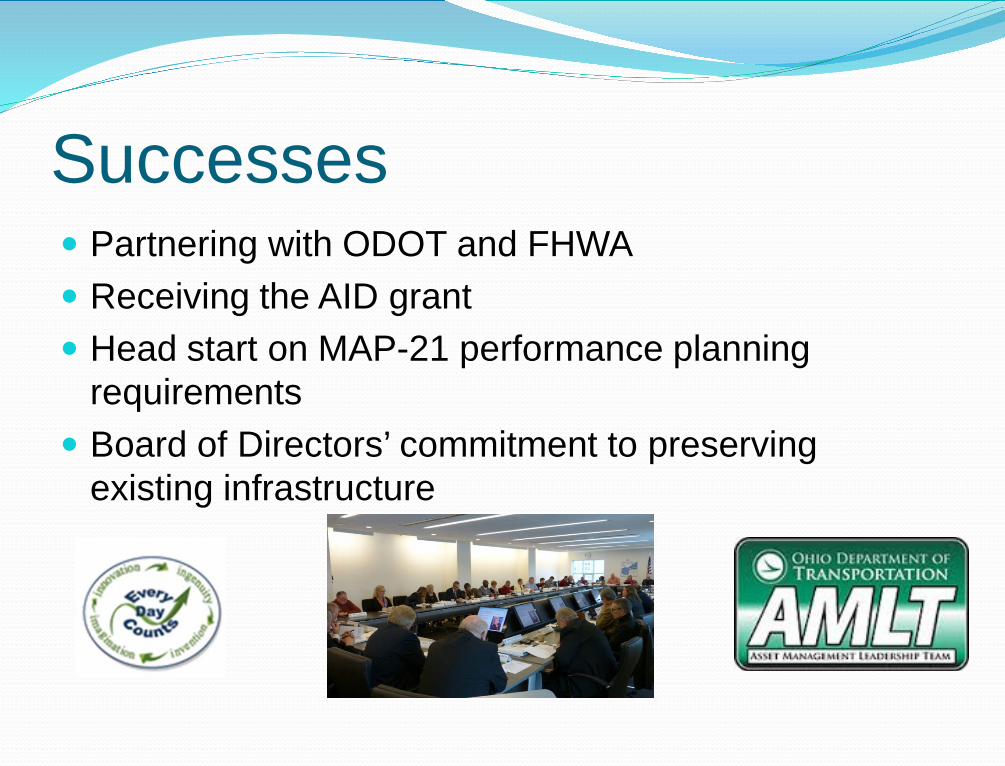
Successes Partnering with ODOT and FHWA Receiving the AID grant Head start on MAP-21 performance planning
requirements Board of Directors’ commitment to preserving
existing infrastructure
NOACA will STRENGTHEN regional cohesion, PRESERVE existing infrastructure, and BUILD a sustainable multimodal transportation system to SUPPORT economic development and ENHANCE quality of life in Northeast Ohio.

Questions?
• Submit your questions using the webinar’s Q&A feature
86


![Utility And Scope Of Electrotridoshagraphy [Etg]](https://img.pdfslide.us/doc/110x75/5878d7fa1a28ab917a8b67a3/utility-and-scope-of-electrotridoshagraphy-etg.jpg)