Embed Size (px)
Citation preview
TallFacades Identification of Cost-effective and Resilient Envelopes for
Wood Constructions
Scientific Report
Project Partners Technical University Munich, Germany (coordinator) RUBNER Holzbau GmbH, Germany Eternit GmbH, Germany NTNU Trondheim, Norway SINTEF, Norway ISOLA AS, Norway Overhalla Industrier AS, Norway RISE Samhällsbyggnad/Byggteknik, Sweden Martinsons Building System, Sweden Moelven Modular Buildings AB, Sweden Institut technologique FCBA, France The project was funded by national funding organisations: BMEL (FNR), ADEME, RCN, VINNOVA, and cofunded under FP7 ERA-Net Woodwisdom-Net by the European Union
Scientific Report
2
Authors list
Andrea Tietze (TUM): Chapter 3.2.3.; 4.3.1.; 4.3.2.; 5.1.; 6.; 8.3.3.
Stephan Ott (TUM): 1.; 2.; 7.3.; 8.1.; 8.3.1.; 9.
Sylvain Boulet (FCBA): 3.2.5.; 3.2.7.; 7.1.; 8.2.
Klodian Gradeci (NTNU): 3.1.; 3.2.1.; 3.2.4.; 4.1.; 4.2.; 4.3.1.; 5.2.; 5.4.; 8.3.2.
Nathalie Labonnote (SINTEF): 3.2.4.; 5.3.;
Steinar Grynning (SINTEF): 7.2.
Joakim Noreen (RISE/SP): 3.2.6.; 5.3.; 6.3.
Anna Pousette (RISE/SP): 3.2.6.; 5.3.; 6.3.
Citation recommendation:
Tietze, Andrea; Ott, Stephan; Boulet, Sylvain; Gradeci, Klodian; Labonnote, Nathalie; Grynning, Steinar; Noreen, Joakim; Pousette, Anna; Tall Timber Facades – Identification of Cost-effective and Resilient Envelopes for Wood Constructions Scientific Project Report; Technical University Munich; Munich; 31.07.2017.
Scientific Report
3
Content 1. Introduction ....................................................................................................................................... 7
2. Problem description .......................................................................................................................... 9
3. Risk approach for moisture safety .................................................................................................. 11
Generic risk model ................................................................................................................. 11
System Definition ........................................................................................................... 11
Exposures ...................................................................................................................... 13
Input data ............................................................................................................................... 15
Representation of weather phenomena ........................................................................ 15
Selection of indoor climate ............................................................................................ 18
Construction of facade systems .................................................................................... 19
Failure modes ................................................................................................................ 28
Consequences ............................................................................................................... 37
Monetarization and environmental impact of consequences ........................................ 42
4. Development of risk assessment processes .................................................................................. 45
Probabilistic-based design methodology ............................................................................... 45
Risk model part A .................................................................................................................. 45
Risk Model Part B .................................................................................................................. 46
Qualitative Risk Assessment ......................................................................................... 46
Event Tree Methodology ............................................................................................... 47
Reversed approach to Risk Areas ................................................................................. 49
5. Application for plain wall systems .................................................................................................. 51
System overview.................................................................................................................... 51
Direct consequences ............................................................................................................. 55
Results of the standard undistrubed cases ................................................................... 55
Results of the cases with deficiencies ........................................................................... 61
Indirect consequences ........................................................................................................... 63
Parametric LCA ............................................................................................................. 63
Monetary consequences ............................................................................................... 63
Conclusions ........................................................................................................................... 64
6. RiFa tool part B - Details ................................................................................................................ 66
Selection of Details ................................................................................................................ 66
Direct Consequences with Event Tree Procedure ................................................................ 68
Indirect consequence scenarios LCA and LCC ..................................................................... 69
Damage scenarios ......................................................................................................... 69
LCA of damages ............................................................................................................ 71
LCC of damages ............................................................................................................ 72
Conclusions ........................................................................................................................... 75
7. Experiments ................................................................................................................................... 76
FCBA tests ............................................................................................................................. 76
Test protocol .................................................................................................................. 76
Scientific Report
4
Results ........................................................................................................................... 78
SINTEF tests ......................................................................................................................... 87
Moisture robustness of eaves solutions for ventilated roofs ......................................... 87
Rain tightness of door sill sealings ................................................................................ 89
TUM tests .............................................................................................................................. 89
Cladding water-runoff test protocol ................................................................................ 89
Results ........................................................................................................................... 91
Conclusions from runoff tests ........................................................................................ 92
8. Recommendations ......................................................................................................................... 93
Existing rules and limits ......................................................................................................... 93
Moisture protection and safety standards...................................................................... 93
Overview of the standards regarding mold growth ........................................................ 98
Probabilistic safety concept ......................................................................................... 100
Human error – and how to avoid it ...................................................................................... 104
Construction of Facade Systems ................................................................................. 104
Internal control before delivery of prefabricated façade elements .............................. 106
Quality control .............................................................................................................. 110
Guideline for Robust Construction....................................................................................... 112
Basic Principles of Moisture Safe Building with Wood ................................................ 112
RiFa-Tool A .................................................................................................................. 113
RiFa-Tool B .................................................................................................................. 117
9. Conclusions and Outlook ............................................................................................................. 121
Findings and Conclusions ................................................................................................... 121
Outlook ................................................................................................................................ 122
10. List of Tables ........................................................................................................................... 123
11. List of Figures .......................................................................................................................... 124
Scientific Report
5
Executive Summary
Project objective: With an increasing height of timber buildings the challenge is growing to provide moisture-safe conditions for the expected lifetime of building envelopes. Tall buildings are particularly exposed to high wind pressures combined with driving rain. Additionally, large-scale buildings require longer times of construction in which the structural elements are especially exposed to moisture. Last but not least inspection, maintenance and repair possibilities are limited in high rise structures. Compared to fire safety and static demands, the risk of failure due to moisture today is dramatically underestimated in planning and building processes and in quality management. Although statistics of construction damages clearly show the high amount of moisture related failure of the building shell resulting in an immense economic loss that is estimated to 3 – 5% of total annual investment in new buildings in Europe. Experts guess that this range may exceed due to higher insulated, more complex and more sensitive enclosures in future. This may also lead to an image risk for timber buildings, if damages will increase in future. Therefore ‘semi-probabilistic safety concepts’, similar to those in static calculations, are necessary to prevent negative consequences caused by inappropriate reaction of construction to climate exposure. The main objective of the project is to facilitate the confident design of durable and therefore cost-effective design solutions for tall timber facades. The risk based RiFa-Tool taking into account exposure and vulnerability of façade systems will enable the moisture-safe design consistently. Project results: The straightforward achievement is the identification of damage scenarios related to human error and construction processes, which is closely related with the identification of building’s architectural design and detail construction related risk areas. In risk model part A, a scientific approach, more suitable for research and development of components is developed. The performance assessment process employed as part of this RiFa-Tool A. The entire probabilistic-based approach is implemented in the form of a seamless and integrated parametric workflow. By means of efficiently combining the MATLAB®, Python and XML codes. The seamless workflow enables an efficient conversion of the variability of the input parameters into a probabilistic representation of the output. The user of RiFa-Tool B can choose between two tools, depending on how much information he has about the details. If the frequency of failure and potential repair costs are known (or can be guessed accurately enough) the so-called event tree can be used. If this is not the case the so-called reversed approach can still find a threshold from which the user recommends one or the other solution. The event tree method can be used as system analysis tool and for consequence identification. Additionally the event tree method gives a structured and generalized approach to solve different problems on joints or connections of components, which are highly prone to moisture leakage. It is a very good way to integrate load bearing, fire-safety, and sound transmission together with the moisture safety. The main advantage of its use is its flexibility; instead of solving problem with many different catalogues with details, which are not related to each other or already outdated. Therefore no component catalog was developed in the classical sense. The uncertainty discussed above – due to a multitude of possibilities of materials and combinations – makes it virtually impossible to provide a reasonably up to date and valid component catalog. Instead, the more purposeful and promising approach chosen has been to develop and provide a methodology for the structured collection and assessment of the moisture risks of detail connections, allowing to analyze and evaluate any design fundamental version and its variants. In the context of the principles of moisture-proof design, there is a procedure for constructing a design roughly based on the basic rules and then refining and optimizing it with the RiFa-Tool B. Under explicit event tree queries for failure, the tool will be able to serve work preparation and quality control. Hence, it will serve the improvement of quality in production, mounting, and avoidance of human error.
Scientific Report
6
Findings: 1. Development of a risk model representation of exposure of exterior walls and facade
detailing, considering moisture penetration and accumulation. 2. Categorization of risk areas of tall urban facades. 3. Implementation of various failure modes, e.g. mold and decay based on scientific
literature. 4. Risk-Façade tool A (RiFa-Tool A) can be used for a versatile simulation process and to
determine of indirect consequences in terms of repair or maintenance cost. 5. Derivation of a generalized procedure for risk assessment of envelope details based on an
event tree methodology (RiFa-Tool B). 6. A second branch of the RiFa-Tool B is usable as a reverse consequence-based method to
evaluate connections or joints of moisture risk areas. 7. Development of a measurement protocol in order to compare the results of the experiment
with the RiFa tool B for the respective detail connection 8. Validation of the methods by the simulation of numerous façade constructions and their
variants. 9. The monetarization of consequences demonstrated the relevance of moisture safety
measures in order to avoid very high costs for timber construction companies.
It can be concluded that a risk-based approach for moisture-safe facade assessment was formulated. The RiFa-Tool A (numerical) is directly usable for prototype design, and the RiFa-Tool B (qualitative) can be used for development of alternative joint solutions. The findings are relevant for construction companies due to the high monetary impact of possible moisture damages on envelopes of tall timber buildings. The outlook can be summed up in the essential to formulate a semi-probabilistic design concept, embed risk-based approach in LCA-analysis, expand the numerical RiFa-Tool A on critical connections and moisture risk areas, and enhance RiFa-Tool B with empirical data. TUM, July 2017
Scientific Report
7
1. Introduction
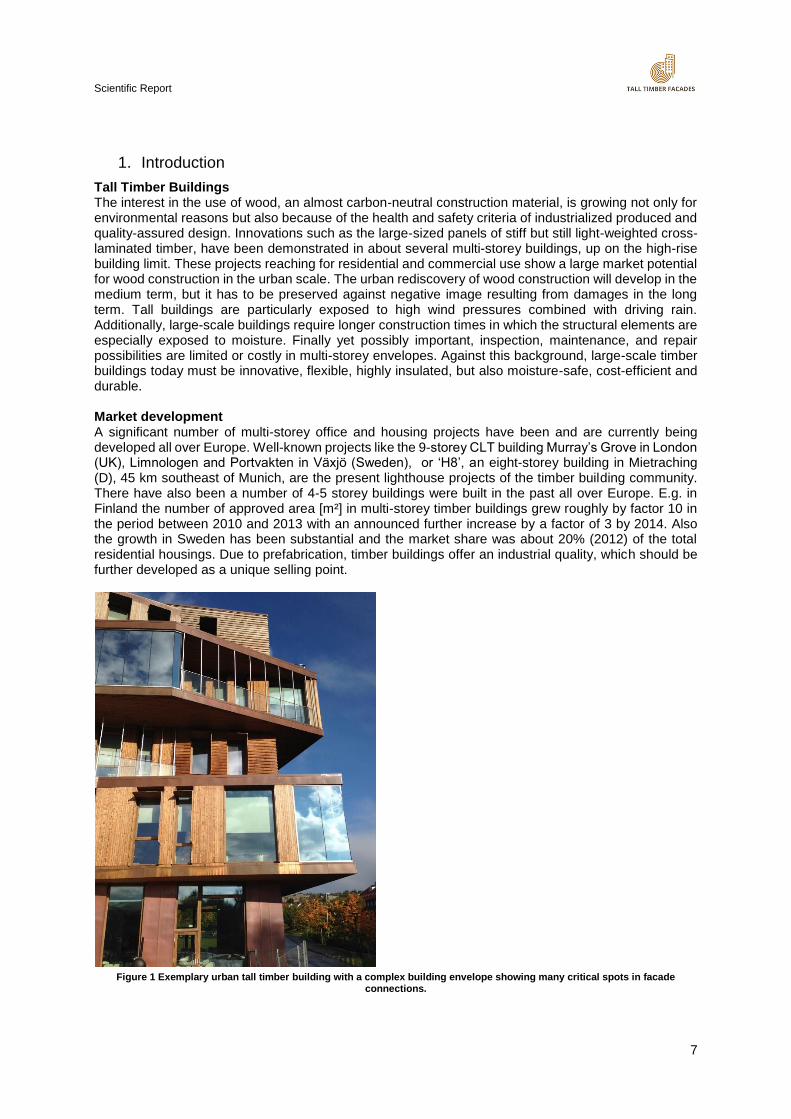
Tall Timber Buildings The interest in the use of wood, an almost carbon-neutral construction material, is growing not only for environmental reasons but also because of the health and safety criteria of industrialized produced and quality-assured design. Innovations such as the large-sized panels of stiff but still light-weighted cross-laminated timber, have been demonstrated in about several multi-storey buildings, up on the high-rise building limit. These projects reaching for residential and commercial use show a large market potential for wood construction in the urban scale. The urban rediscovery of wood construction will develop in the medium term, but it has to be preserved against negative image resulting from damages in the long term. Tall buildings are particularly exposed to high wind pressures combined with driving rain. Additionally, large-scale buildings require longer construction times in which the structural elements are especially exposed to moisture. Finally yet possibly important, inspection, maintenance, and repair possibilities are limited or costly in multi-storey envelopes. Against this background, large-scale timber buildings today must be innovative, flexible, highly insulated, but also moisture-safe, cost-efficient and durable. Market development A significant number of multi-storey office and housing projects have been and are currently being developed all over Europe. Well-known projects like the 9-storey CLT building Murray’s Grove in London (UK), Limnologen and Portvakten in Växjö (Sweden), or ‘H8’, an eight-storey building in Mietraching (D), 45 km southeast of Munich, are the present lighthouse projects of the timber building community. There have also been a number of 4-5 storey buildings were built in the past all over Europe. E.g. in Finland the number of approved area [m²] in multi-storey timber buildings grew roughly by factor 10 in the period between 2010 and 2013 with an announced further increase by a factor of 3 by 2014. Also the growth in Sweden has been substantial and the market share was about 20% (2012) of the total residential housings. Due to prefabrication, timber buildings offer an industrial quality, which should be further developed as a unique selling point.
Figure 1 Exemplary urban tall timber building with a complex building envelope showing many critical spots in facade
connections.
Scientific Report
8
Motivation But - wood as a natural material is – in opposite to the competing materials concrete and steel in that it is much more moisture sensitive and based on detrimental moisture subject to fungi and decay. As long as dry conditions can be secured, timber is one of the most durable materials known. Fire safety and structural design therefore will not be the main restrictions, but adequate moisture safety against water from outside and sometimes inside (e.g. from sprinklers) has to be observed more closely in future. Today most of the ‘nearly high-rise’ and multi-storey timber buildings are built as nearly Zero Energy Buildings (nZEB). The heat energy consumption of these buildings is on average 25 kWh/m²a. The very good floor area / building envelope ratio - in combination with insulation layers of 250-350 mm thicknesses - helps to meet high energy-efficiency requirements. Excellent airtightness values are self-evident, as well is the high-level noise insulation. Fortunately, up to now few problems have occurred in the realized buildings. However, thick insulation layers that meet high-energy requirements result in very complex details (especially in the northern climate). In addition, it is in their nature to have a high moisture storage capacity and leakages are often recognized very late, with dramatic consequences. Therefore, the aim is usually to decrease the thickness of walls using more efficient insulation, a subject that has been taken into account in the project. As shown previously, the market for wooden urban buildings is growing. In order to preserve and develop the chances on the market, wood construction must be reliable, durable, flexible and strong in off-site production/prefabrication. To fulfil most of these requirements, prolonged moisture-safety is necessary, this is in the focus of this project.
Scientific Report
9
2. Problem description Damages of building envelopes Statistics of construction damages clearly show a high amount of moisture related failure of the building shell, independent from the main material, resulting in an immense economic loss that is estimated to 3 – 5% of total annual investment in new buildings in Europe [1]. Experts guess that this range may increase in future due to highly insulated, more complex and sensitive enclosures. Recent studies show a trend of increasing damages related to moisture-safety. Causes are manifold, from design mistakes, unplanned joints, execution errors, to missing inspection and maintenance. This could lead to an important moisture and later on to an image risk for timber buildings if damages would increase in future. As explained above the probability of these risks is quite high because timber can be sensitive to continuing and excessive moisture load, and modern envelopes are complex systems, which might show a hard to predict behavior. On the over hand, the timber construction sector has a long experience with and robust solutions for moisture safe constructions with highly insulated, complex envelopes. The durability and resistance of wood is examined exhaustively for its risk to moisture induced damage material properties and moisture buffering capacity. Its durable use in building envelopes is demonstrated well by the large amount of historic timber buildings still in exist today. Consequences With the increasing height of timber buildings, the challenge to provide moisture-safe conditions for the expected lifetime of building envelopes is growing. Compared to fire safety and static demands, the riskof moisture damages today is dramatically underestimated in planning, building processes, and quality management. Therefore ‘semi-probabilistic safety concepts’, similar to those in static calculations, are developed to prevent damage caused by the inappropriate reaction of construction to climate exposure and allow cost-efficient solutions. The main objective of this project is to facilitate the confident design of durable and therefore cost-effective detailing for tall timber facades by the combination of existing best-practice with a risk-based concept. The methodology contains a general risk model representation with the vulnerability of timber-based shell and the climate conditions for exposure. Accordingly, the damage mechanisms that lead to failure and consequences are identified. The construction processes and conditions and the repetition of an increased amount of detailing are economic effective and influence the success of a project. This results in the development of a moisture-management model for wood-based shells considering specific exposure aspects of wind driven rain, climate change, and interior moisture sources. The model also contains a transient hygrothermal simulation of entire crosssections with validated software tools. Moreover, lab-tests deliver missing functions of uncertain parameters. To round out the model it contains the limit state characterizations for mold and other wood specific failure modes. Finally, all different risk assessment steps are combined with LCC and LCA methods to a multidisciplinary design optimization setting. The maintenance management can deal with the accepted level of risk due to an understanding and control over the equilibrium of moisture in woodbased building shells. Uncertainty All parts of risk assessment from exterior climate exposure over system composition, to interior climate conditions and even the moisture criteria for failure are uncertain. A point to focus on in the near future is uncertainty of climate exposure especially the future development against the background of climate change. Herewith façade specific phenomena like rain and wind will increase in parts of central and northern Europe. The resistance of new materials or modified properties of wood products show the other side of the medal, where complex interaction in wall compositions and unforeseen reaction/results to moisture intake are hardly to predict. The uncertainty of human error related to design and construction processes is taken into account on a qualitative basis. Risk assessment framework The variety of options and configurations of the building envelope and the diversity of the effects of the external and the internal climate necessitate assistance in the selection of material and design options. For this reason, based on risk analysis methods, a Risk Facade Tool (RiFa-Tool) will be developed which will enable planners and producers to make substantiated decisions for specific constructions. In addition, the tool is used to create a guideline for Tall Timber Facades - envelope constructions, which are developed together with industry partners for practical application.

Scientific Report
10
The main objective of the project is to facilitate the confident design of durable and therefore costeffective design solutions for tall timber facades. A risk based design tool taking into account exposure and vulnerability of façade components and systems consistently will enable moisture safe design. The risk based design concept for wooden facades is developed with relation to existing exposure models for wind driven rain coupled with heat and moisture (HAM) transport models and failure mode models. Moreover, a simplified semi-probabilistic design framework (comparable with the Eurocode 1990 load-resistance design format) is developed which enables easy utilisation of the results of this project by practitioners. Based on the identified design concept standard best-practice solutions for durable façade systems and details (corners, windows, cornice, etc.) are identified and documented within the project. Other requirements for constructions such as thermal transfer, load-bearing capacity, fire safety, sound transmission will be considered. References [1] IFB, 2015. Analyse der Entwicklung der Bauschäden und der Bauschadenkosten. Forschungsbericht IFB - 14553. Braunschweig.
Scientific Report
11
3. Risk approach for moisture safety
Generic risk model
The purpose of this section is to identify the system and setting up an initial risk-based design model for tall timber facades. Therefore the current section focuses on the identification of the consequences, the associated physical phenomena and on the corresponding exposures. The associated categories, all moisture related, are grouped as the following:
a) Direct consequences of free water and excessive moisture content b) Direct consequences of material degradation c) Indirect consequences d) Indirect consequences (related to monetary costs) e) Condensation within the façade element f) Water ingress g) Weather and climate related h) Building/use related
Furthermore, the risk-reducing measures providing the option for controlling risks are discussed. Risk reduction measures may be implemented at different levels in the system representation; with regard to the exposure (improvement of knowledge regarding climate conditions), the vulnerability (physical characteristics of the façade assembly and construction phases) and the robustness (performance of the structural system).
System Definition
General description of the façade system For the development of a probabilistic risk based design framework for tall timber façades rather complex interactions of different aspects have to be considered. In the initial phase of developments the level of detail of the considered system should be as simple as possible. Correspondingly, a façade cross section as illustrated in Figure 1 has to be chosen as a basis for the discussions during the risk screening meeting.
Figure 2 Cross section of timber façade, FCBA
The different components of the façade element illustrated in Figure 1 are listed together with representative indicators describing their correspondionding properties in Table 1.
Table 1 Components of the façade element listed together with indicators describing their corresponding properties.
Scientific Report
31.07.2017 12
Component Indicators
Timber cladding Material properties Treatment, painting Thickness, dimension Joining, tighness
Timber battens for the cladding Material properties Treatment, painting Dimension Distance Joining
Wind/Rain barrier Material properties Thickness Tightness Joining
Insulation Material properties Thickness Joining
Vapour barrier Material properties Thickness
Bracing panel Material properties Thickness, dimensions Joining, tightness Distance
Timber battens for gypsum board Material properties Treatment, painting Dimension Distance Joining
Gypsum board Material properties Treatment, painting Thickness Joining
In addition to the properties of the façade elements, it is of relevance describing the position of the facade element as part of the building. Indicators for this description are:
Orientation (N-E-S-W)
Height over the ground
Distance to the roof
Overhang of the roof
Distance from building edges / corners
In order to gain an overview and general consensus about other relevant system constituents and their interaction, in the risk screening meeting was first focused on consequences, then on the associated physical phenomena and later on an corresponding exposures. Events and sequences of events that lead to consequences All relevant consequences that have been discussed during the risk-screening meeting are moisture related; i.e. excessive moisture content in the façade materials or even the presence of free water in the façade. The associated consequences, grouped into direct and indirect consequences, are as the follow:
A) Direct consequences of free water and excessive moisture content
Material degradation due to: 1. Mold 2. Fungi (decay) influencing strength, stiffness and the air quality 3. Strength and stiffness reduction due to moisture induced creep effects
Scientific Report
31.07.2017 13
4. Deterioration of the façade surface integrity / shrinkage or swelling (Openings leading to deformations, leading to the increase of water penetrations which leads to the decrease of strength and stiffness)
B) Direct consequences of material degradation
1. Failure or rupture of load bearing elements. (subsequent to A1, A2, and/or A3) 2. Excessive deformations of load bearing elements. (subsequent to A1, A2, and/or A3) 3. Further moisture penetration (caused from the imperfections of the façade layer, failure
of defenses)
C) Indirect consequences
1. Increase of the thermal conductivity of the façade elements 2. Decrease of indoor air quality 3. Decrease of the value of wellbeing (quality of life) 4. Aesthetical issues 5. Reputation for construction type (chain: company-building-design)
D) Indirect consequences (related to monetary costs)
1. Replacement 2. Repair, continuous due to maintenance 3. Decrease of the value of the building
Physical phenomena and process Different physical phenomena or processes might lead to excessive moisture content in the façade materials or presence of free water in the façade, such as the following:
E) Condensation within the façade element
The moisture related to condensation has three different sources: 1. Built-in moisture, from building process, enclosure in small gaps from defects (reduce
moisture content of material 5-18%, depending of the country regulations) 2. Diffusion from outside to inside, depending on the inside climate and the properties of
different layers (indoor moisture and built indoor moisture) 3. Convention – through air gaps, the entering of air inside may cause penetration
F) Water ingress
1. Lack of protection integrity of the outer surface of the façade 2. Lack of tightness of the wind barrier 3. Lack of tightness of the inner surface of the façade 4. Bad practice in detailing and implementation (systematic issues)
Exposures
The exposures that imitate the physical phenomena and subsequent consequences are defined. To facilitate a more structured framework, the latter are divided into the subsequent:
G) Weather and climate related
1. Temperature 2. Rain (accumulated) 3. Rain (intensity) 4. Wind-speed 5. Wind-direction 6. Wind driving rain 7. Terrain roughness factor 8. Air vapor content 9. RH (Relative Humidity) 10. Solar radiation 11. Atmospheric pressure

Scientific Report
31.07.2017 14
12. Atmospheric emission
H) Building / use related
1. Temperature (inside) 2. Air vapor content (inside) 3. Vapor production 4. RH (Relative Humidity) 5. Presence of sprinkler system
Risk Reduction Measures Risk reduction measures provide the option for controlling risks and may be implemented at different levels in the system representation; with regard to the exposure (improvement of knowledge regarding climate conditions), the vulnerability (physical characteristics of the façade assembly and construction phases) and the robustness (performance of the structural system). These measures may be introduced from the design stage of the project, fabrication and quality management, during the installation process and during the usage of the building. Some of the reducing measures concerning the reduction of exposures, reduction of vulnerability and the improvement of robustness discussed during the risk screening meeting are the following:
- Material properties and quality of rain/wind barriers (Layer of wind/rain barrier without wood, with plastic tubes for condensation)
- Movement of vapor barrier 5 cm, results in higher protection - During the construction phase the rain should be avoided as much as possible, for e.g. tents
to keep the structure dry at all times, even from the fabrication to the store or building site - Quality management may be improved - Prefabrication of the assembly - For the convention hazard point, quality control, good design and quality production are
advised - Investing in proper calculation of the structure
Relevant variables and the corresponding causal interaction In Figure 2 variables that have been identified in the risk screening meeting are schematized and the corresponding causal relationships are indicated by arrows. (If an arrow is pointing from variable A towards B it means that variable B is dependent on A.) As shown in the figure below, the exposure events (weather and climate related and building/use related) are represented by the blue color. Following, the physical phenomena or the processes that might lead to excessive moisture content are represented by the green color. Subsequently, the direct consequences (of free water, excessive moisture content and of material degradation) are represented by light pink color and the follow-up consequences or indirect consequences are represented by dark pink color.
Scientific Report
31.07.2017 15
Figure 3 Relevant variables and the corresponding causal relationships.
Input data
Representation of weather phenomena
One of the most influencing parameters for the facade construction’s performance is its climate
exposure; the outdoor weather and the indoor climate, whereas the latter is affected from the former
together with the use of inner space. The conventional approach of assessing the façade performance
is by using one-year-long historical time series weather data for a specific or several climate exposures.
Scientific Report
31.07.2017 16
Generally, the MDRY (Moisture Design Reference Year) is applied [3]. However, several limitations of
this approach should be considered including the followings:
A serious drawback of specifying an MDRY for a certain location is that different constructions
exhibit different levels of performance in response to different types of climates [4].
Consequently the use of MDRY is limited to some types of constructions and might not be
suitable for innovative constructions.
As for most bio-deterioration failure mechanisms, their activity is a result of complex biological
phenomena and occurs only when certain conditions (expressed in terms of humidity and
temperature) are met over time. A given year, such as the MDRY, may include growth scenarios
dependent on humidity, but may lack potential growth scenarios that are mostly dependent on
temperature or vice-versa. Thus, the use of a specific year as a basis for façade construction
assessment might not include plausible scenarios favorable for decay activation and growth,
and it does not account for the variability of the weather parameters.
The use of a single year’s climate exposure data is too short to provide realistic results,
especially when the failure mode is modelled as non-declining biological activity as it is
considered for the decay phenomenon in the predicting models. When using single-year data,
the results become highly sensitive to the initial time of the climate series, which is also a
stochastic variable. Lastly, if several additive MDRYs are used in such cases to prolong the
duration, results are likely to be conservative and not suitable to support a risk-based decision
process.
Several simulations are required to represent multiple parameter variabilities in order to consider
the uncertainties related to a given façade’s outdoor exposure. This process may be considered
impractical, cumbersome and time-consuming, especially when traditional HAM tools are used
to run manual simulations.
The aforementioned reasons confirm the need to use a different approach when assessing façade construction performance, which is highly influenced by outdoor weather exposure. This work considers two ways to represent the weather phenomena:
a) Representation of weather phenomena with ARMA models b) Representation of weather phenomena based on a combination of the historical data
3.2.1.1. Representation of weather phenomena with ARMA models [1]
The methodology presented hereby proposes the sampling of realizations of weather properties by using time series analysis according to autoregressive–moving-average model. Several authors have used this approach, such for example in forecasting global warming [5] and weather pricing derivative applications [6]. This method provides the opportunity to identify a mathematical expression that generates possible historical patterns in a time series containing plausible sequences, frequencies and correlations. This ensures that varying climatic influences are taken fully into account. The utilization of time series is also motivated by their ability to accommodate a large number of simulations that help exploiting the influence of each parameter during sensitivity analyses. This section is demonstrated for Oslo climate. The same methodology can be applied for other climates. The parameters of the stochastic model representing the weather conditions (hourly-based temperature and relative humidity) are calibrated based on the historical hourly-measured data over a period of 15 consecutive years (01.10.2002 to 30.09.2016) at the Blindern Station in Oslo [7]. The time series are firstly computed for temperature. Since relative humidity does not exhibit clear seasonality, absolute humidity series (which do exhibit seasonality) are firstly simulated. The series are then transformed into relative humidity considering the coupled effect of the simulated temperatures. Several steps are required to compute the simulations of weather data realisations. Firstly, the trend of the data is checked. Since the trend of the data is very small (0.03 °C increase in 15 years), it is decided to use a constant value. A mean hourly temperature for 15 consecutive years is calculated and then removed from the time series. A double sine model is fitted afterwards to the remaining data as directed by the physical nature of the weather data and seasonality, as follows:
Scientific Report
31.07.2017 17
𝑆𝑒𝑎𝑠𝑜𝑛𝑎𝑙𝑡 = 𝑥1 ∙ 𝑠𝑖𝑛(𝑦1 ∙ 𝑡 + 𝑧1) + 𝑥2 ∙ 𝑠𝑖𝑛(𝑦2 ∙ 𝑡 + 𝑧2) (6)
where 𝑡 is the time [in hours], and 𝑥, 𝑦, 𝑧 are the calculated parameters.
The seasonal component is subtracted from the times series and the residuals are studied. The autocorrelation and partial autocorrelation factors of the residuals are examined to check their randomness. An auto-regressive model involving 94 seasonal lags, representing a correlation for four days, is used to model the residuals which are then retrieved from the series. The second residuals series are calculated and their partial autocorrelation functions are computed. The results show that the second residuals (𝜀𝑡) are uncorrelated, and therefore they can be represented by independent and
identically distributed random variables with mean 0 and variance 𝜎2. Finally, the time series model is constructed by assembling the following quantities; a) a constant value, b) the seasonal component, c) the regression parameters and autocorrelation lags (to simulate the relationship between subsequent and preceding data) and d) the residuals.
𝑻𝒕 = 𝑪𝒔𝒕 + 𝑺𝒆𝒂𝒔𝒐𝒏𝒂𝒍𝒕 + 𝒇𝒕(𝒂𝒖𝒕𝒐𝒄𝒐𝒓𝒓𝒆𝒍𝒂𝒕𝒊𝒐𝒏, 𝒓𝒆𝒈𝒓𝒆𝒔𝒔𝒊𝒗𝒆) + 𝜺𝒕 (𝟕)
The Pearson correlation coefficient is computed for the simulated data and the historical measurement,
and the results vary from 0.76 to 0.84. This demonstrates good agreement with the measured data while
accounting for the variability of the weather exposure data. Three random realizations of the simulated
temperature time series are illustrated together with the measured temperature times series in Figure 4.
Figure 4: Three simulated temperature time series and the measured temperature time series.
3.2.1.2. Representation of weather phenomena based on a combination of the historical data
The representation according to the previous section can consider the uncertainties related to the relative humidity and temperature. It also con accommodate long-term series that can represent the expected life time of the constructions. It can be considered an accurate representation [1, 8] for ventilated construction exposed to climates where the wind-driven rain or radiation do not contribute to the final results, for example the case of Oslo. However, this method lack accounting for the radiation and wind-driven rain and therefore cannot provide reliable results for climates exposures where the
Scientific Report
31.07.2017 18
aforementioned factors highly affect the results. Therefore, another method is proposed to address this challenge. Five year long data including relative humidity, temperature, solar radiation and wind-driven rain are constructed based on the historical weather data. In order to account for the uncertainties related to the representation of the weather exposure, this method uses the combination of different one-year long weather time series, retrieved from the measured historical data, to construct the final five-year long climate scenarios. From the 1 years of historical weather data, one-year weather series are subtracted. The initiation date, including 1st April – 1st July – 1st October – and 1st January is also considered a random variable. This accounts for the fact that different construction walls are built in different times of the year. Finally, the one-year long weather series are randomly combined together to create the five-year long weather climates.
3.2.1.3. Selection of climate zones
The following climate zones, associated with different characteristic exposure features, are considered in this report to assess the performance of the façade construction presented in section 3.2.3.
- Bergen, Norway - Stockholm, Sweden - Lyst, Germany - Basel, Switzerland
References [1] K. Gradeci, N. Labonnote, B. Time, and J. Köhler, "A proposed probabilistic-based design
methodology for predicting mold occurrence in timber façades," in World Conference on Timber Engineering, Vienna, 2016.
[2] K. Gradeci, M. Baravalle, B. Time, and J. Köhler, "Cost-Optimisation for Timber Façades Exposed to Rot Decay," in 12th International Conference on Structural Safety & Reliability Vienna, 2017.
[3] Hygrothermal performance of building components and building elements, 2004. [4] S. Geving, "Moisture design of building constructions. Hygrothermal analysis using simulation
models," Department of Building and Construction Engineering, The Norwegian University of Science and Technology, 1997.
[5] W. A. Woodward and H. L. Gray, "Global warming and the problem of testing for trend in time series data," Journal of Climate, vol. 6, no. 5, pp. 953-962, 1993.
[6] S. D. Campbell and F. X. Diebold, "Weather forecasting for weather derivatives," Journal of the American Statistical Association, 2011.
[7] eKlima. (2016). www.eklima.met.no. [8] A. Tietze, S. Boulet, S. Ott, and S. Winter, "Consideration of disturbances and deficiencies in
the moisture safety design of tall timber facades," in World Conference on Timber Engineering, Vienna, 2016.
Selection of indoor climate
The emphasize of the project lies on the influence and the modification of exterior climate conditions, but nevertheless, a realistic indoor climate is necessary to evaluate the behaviour of the considered compositions. The interior climate is dependent on many different factors; exterior climate conditions, HVAC systems, the wall cross-section, and the inhabitants might be the most important ones. There are different possibilities how values for the indoor climate can be achieved, e.g. by measurements, calculation using exterior climate data or by other simplified assumptions.
Scientific Report
31.07.2017 19
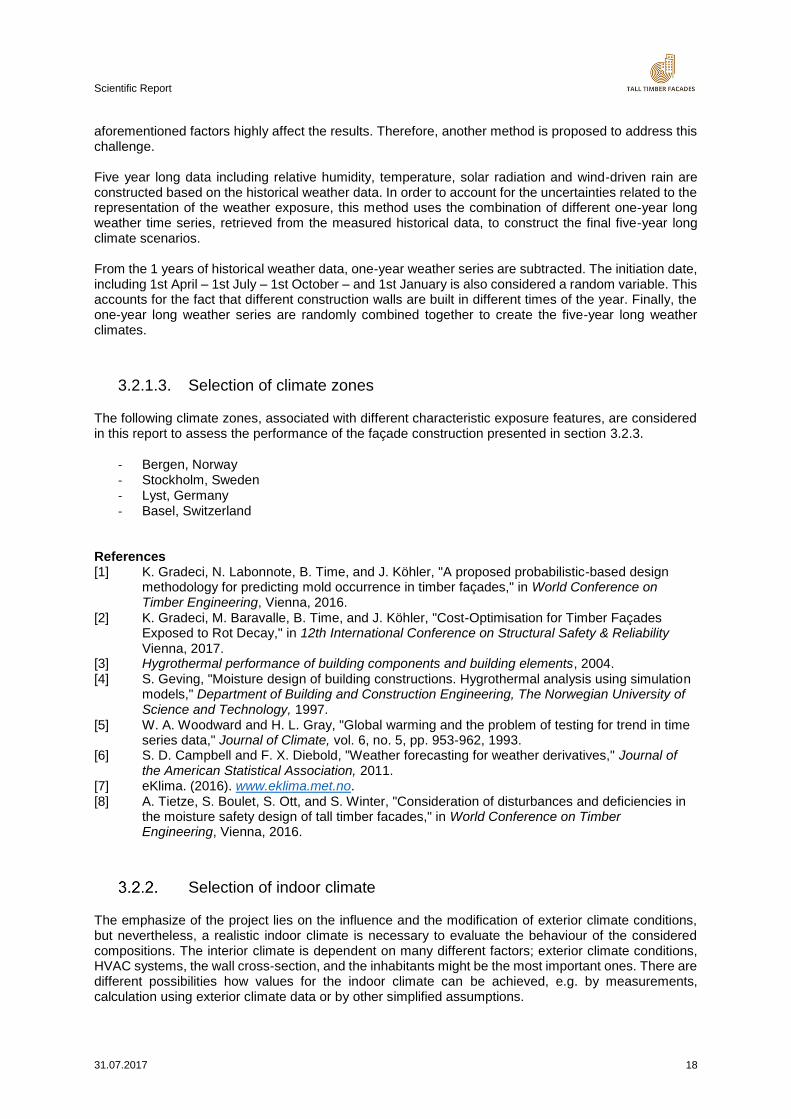
Measurements of interior climate conditions are far beyond the scope of the current project. The calculation out of exterior climate data can be performed according to various standards (EN 15026, ISO 13788, ASHRAE 160). However, this calculation leads to difficulties within the automated simulation process which is described in chapter 4.2 and performed in chapter 5.2. Therefore, a more simplified approach is applied using sine curves for both temperature and relative humidity. It is possible to change the parameters of the curves; but for reasons of comparability they will be kept constant while only the exterior climate is modified.
Figure 5: Sine curves for calculation of the indoor climate.
Construction of facade systems
Since the project deals with water ingress in façade systems, particular attention is given to the selection and evaluation of exemplary compositions. These compositions are used for analysing the theory of water transport mechanisms and describing the principles of watertight constructions. Moreover, a comparison of how walls and details are designed in the four involved countries Germany, Norway, France and Sweden is given. Last but not least, some exemplary compositions are necessary to develop and test the RIFA tools. This chapter deals with the collection of various compositions and prepares them for further analyses, which are performed in the following chapters. In the scope of the project it became clear that details like windows or balconies cannot be analyzed in the same way as plain “undisturbed” walls (cf. chapter 4). Therefore, this chapter is divided into two parts: one for plain walls and one for details. Plain Walls The first step is to collect good working compositions that are commonly used in the four involved countries. With the help of industry partners, national recommendations and publications 13 assemblies are identified (cf. Table 2). There are much more in reality, but the aim was to break the huge variety of constructions down to a manageable amount and to use only examples which have proven their functioning in the past. Although very differently at first sight, the compositions show many similarities and can therefore be reduced to specific categories (see Figure 6):
Scientific Report
31.07.2017 20
Figure 6: Classification of compositions.
The first category refers to the static system. It is either possible to use either a timber frame construction or a massive timber construction. The second key distinction is the defense strategy against moisture ingress. A ventilated composition provides an air layer behind the cladding and counts on two defence layers against exterior moisture whereas a non-ventilated system (also known as Exterior Insulation Finishing System EIFS) relies on one single barrier against rain. Table 2 shows the collected examples sorted in these categories. Afterwards, the different categories are described and put into the context of the project.
Table 2: Collected examples of plain walls
Timber Frame Construction – Ventilated
20 mm spruce 30 mm air cavity / battens 16 mm medium density fibre board 160 mm insulation / stud 15 mm OSB 40 mm insulation / battens 12.5 mm gypsum board cf. [Ifo15]
20 mm spruce 40 mm air cavity / battens membrane 2x18 mm gypsum board 160 mm insulation / stud membrane 2x18 mm gypsum board cf. [Grä15]
22 mm spruce 25 mm air cavity / battens membrane 60 mm insulation 10 mm OSB 145 mm insulation / stud membrane 25 mm air layer / battens 13 mm gypsum board cf. [Cat17]
Scientific Report
31.07.2017 21
20 mm spruce 30 mm air cavity / battens membrane 160 mm insulation membrane 50 mm insulation 15 mm int. cladding cf. [SINTEF]
20 mm spruce 30 mm air cavity / battens 8 mm wind barrier 50 mm insulation 150 mm insulation / studs membrane 50 mm insulation / battens 15 mm int. cladding cf. [Trä17]
8 mm plaster 12 mm cement board 28 mm air cavity / battens 30 mm mineral wool 9 mm gypsum board 195 mm insulations / studs membrane 2x13 mm gypsum board cf. Moelven
Timber Frame Construction – Non-Ventilated
10 mm stucco 60 mm insulation 160 mm insulation / stud 15 mm OSB 12.5 mm gypsum board cf. [Ifo15]
Massive Timber Construction - Ventilated
Scientific Report
31.07.2017 22
20 mm spruce 30 mm air cavity / battens membrane 15 mm gypsum board 200 mm insulation 100 mm CLT 60 mm battens / insulation 12.5 mm gypsum board cf. [Tei13]
20 mm spruce 30 mm air cavity / battens membrane 160 mm insulation 100 mm CLT cf. SINTEF
25 mm Glulam panel 22 mm air cavity / battens membrane 140 mm insulation membrane 120 mm CLT cf. Martinsons
Massive Timber Construction – Non-Ventilated
10 mm stucco 140 mm insulation 18 mm gypsum board 100 mm CLT 2x18 mm gypsum board cf. [Grä15]
Structural System While load-bearing structure and main insulation are in the same layer in a timber frame construction, a massive timber construction consists of a solid load-bearing wooden element (often Cross-Laminated Timber CLT) and a separate layer for insulation. Both systems are used in practice; however, the current report focusses mainly on timber frame compositions. They seem to be more interesting to analyse due to the following reasons:
Since insulation and load-bearing structure are in the same layer, the exterior parts of the wooden beams are exposed to a relatively cold climate and consequently to a high relative humidity. This is a decisive aspect when it comes to the evaluation of mold occurrence.
Scientific Report
31.07.2017 23
A timber frame wall is not only used as a load-bearing wall but can also be applied as curtain wall in so-called hybrid structures. Therefore, they have a larger field of application than massive timber constructions.
A timber frame wall is more complex with respect to building physics and building construction. The CLT element in a massive construction can be used as air barrier and vapour barrier besides its load-bearing function. A timber frame wall, needs additional layers to provide air tightness and vapour tightness. Therefore, it is more complex to analyse the timber frame system with its numerous layers (see below). It will be easy to transfer all methods and findings of the project to the less complex system of a massive timber construction.
Moisture Defence Strategy The second category deals with the moisture management. Water transport can happen in three ways: liquid water transport, diffusion and convection. Each wall has to resist all three of them. A ventilated wall (also known as two-stage tightening [Nor09] or (pressure equalized) rainscreen [Nor09], [RDH02]) has usually four layers to resist moisture ingress (see Figure 7).
Figure 7: Barrier approach of a ventilated composition.
The cladding functions as water shedding surface. It shall drain most of the rain immediately to the ground. However, the cladding is usually not completely tight. Small gaps are accepted and often wished for aesthetical reasons, but they enable some water to overcome this first water shedding barrier. Therefore, a second moisture barrier is necessary to protect the inner parts of the wall from moisture ingress. It is called “second defence layer” in the German speaking countries, “wind barrier” in the Scandinavian area, and [RDH02] calls it “exterior moisture barrier”. This shows that the layer shall not only support the cladding in keeping the wall dry from liquid water, but it shall also prevent the wind to blow through the construction. The air layer also plays its role in the struggle against liquid water. Ventilation reduces the relative humidity within in the air layer and therefore the exposure for the inner wall. Moreover, it provides a space for the drainage of the liquid water, which crossed the first defense layer of the cladding. It is also useful to create a capillary break between the completely wet cladding and the rest of the wall and thereby cut off the capillary path. A vapor barrier is necessary to stop a diffusion current through the wall. A diffusion-tight layer is therefore located at the interior side in countries with cool and moderate climate. At the same time, the exterior materials should remain diffusion-open to ensure dry-out possibilities for initial moisture or small leakages. Table 3 shows the requirements for the sd-values in Germany, Norway and France.
Table 3: Requirements for sd-values.
sd,exterior sd,interior
Germany [DIN 68800-2]
≤ 0.1 m ≥ 1.0 m
≤ 0.3 m ≥ 2.0 m
0.3 m ≤ sd ≤ 4.0 m 6 sd,exterior only when prefabricated
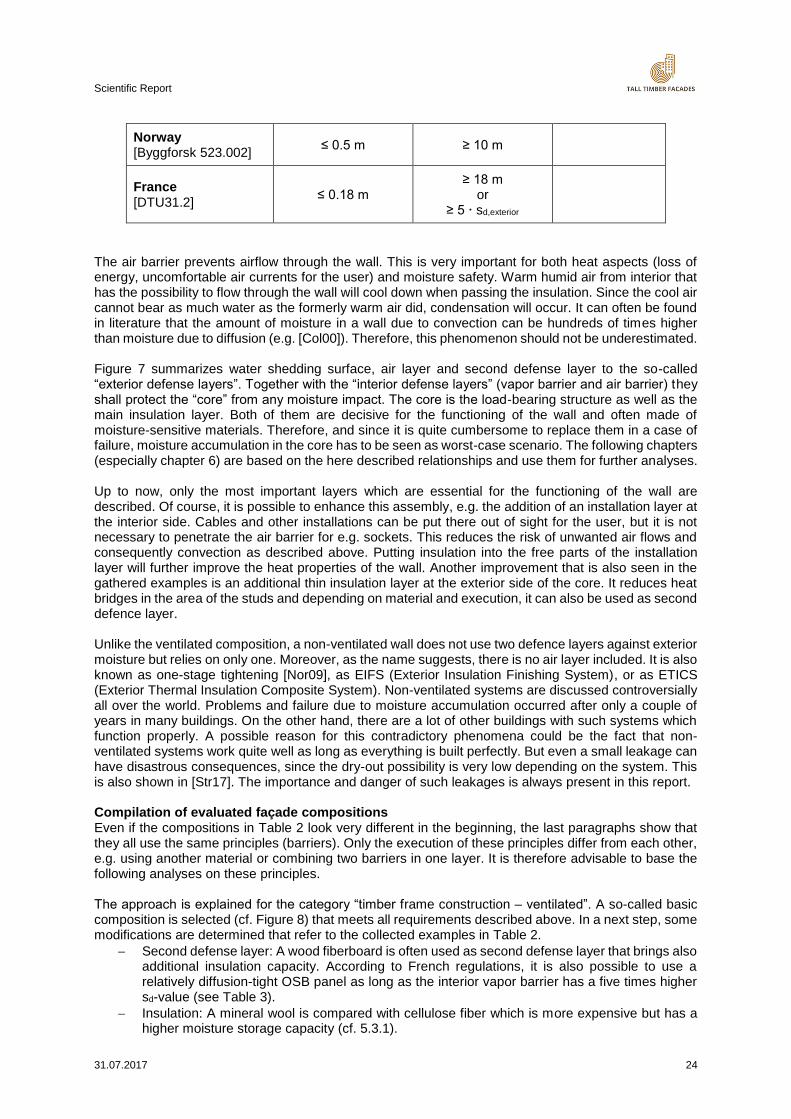
Scientific Report
31.07.2017 24
Norway [Byggforsk 523.002]
≤ 0.5 m ≥ 10 m
France [DTU31.2]
≤ 0.18 m ≥ 18 m
or ≥ 5 sd,exterior
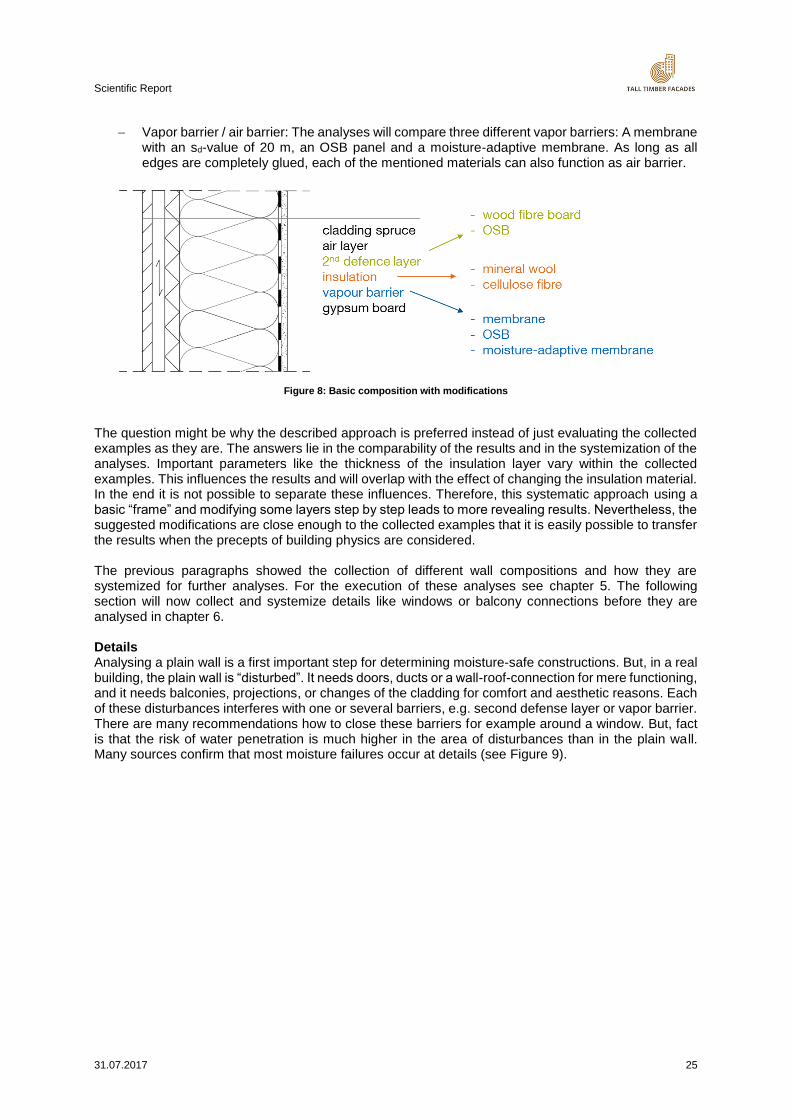
The air barrier prevents airflow through the wall. This is very important for both heat aspects (loss of energy, uncomfortable air currents for the user) and moisture safety. Warm humid air from interior that has the possibility to flow through the wall will cool down when passing the insulation. Since the cool air cannot bear as much water as the formerly warm air did, condensation will occur. It can often be found in literature that the amount of moisture in a wall due to convection can be hundreds of times higher than moisture due to diffusion (e.g. [Col00]). Therefore, this phenomenon should not be underestimated. Figure 7 summarizes water shedding surface, air layer and second defense layer to the so-called “exterior defense layers”. Together with the “interior defense layers” (vapor barrier and air barrier) they shall protect the “core” from any moisture impact. The core is the load-bearing structure as well as the main insulation layer. Both of them are decisive for the functioning of the wall and often made of moisture-sensitive materials. Therefore, and since it is quite cumbersome to replace them in a case of failure, moisture accumulation in the core has to be seen as worst-case scenario. The following chapters (especially chapter 6) are based on the here described relationships and use them for further analyses. Up to now, only the most important layers which are essential for the functioning of the wall are described. Of course, it is possible to enhance this assembly, e.g. the addition of an installation layer at the interior side. Cables and other installations can be put there out of sight for the user, but it is not necessary to penetrate the air barrier for e.g. sockets. This reduces the risk of unwanted air flows and consequently convection as described above. Putting insulation into the free parts of the installation layer will further improve the heat properties of the wall. Another improvement that is also seen in the gathered examples is an additional thin insulation layer at the exterior side of the core. It reduces heat bridges in the area of the studs and depending on material and execution, it can also be used as second defence layer. Unlike the ventilated composition, a non-ventilated wall does not use two defence layers against exterior moisture but relies on only one. Moreover, as the name suggests, there is no air layer included. It is also known as one-stage tightening [Nor09], as EIFS (Exterior Insulation Finishing System), or as ETICS (Exterior Thermal Insulation Composite System). Non-ventilated systems are discussed controversially all over the world. Problems and failure due to moisture accumulation occurred after only a couple of years in many buildings. On the other hand, there are a lot of other buildings with such systems which function properly. A possible reason for this contradictory phenomena could be the fact that non-ventilated systems work quite well as long as everything is built perfectly. But even a small leakage can have disastrous consequences, since the dry-out possibility is very low depending on the system. This is also shown in [Str17]. The importance and danger of such leakages is always present in this report. Compilation of evaluated façade compositions Even if the compositions in Table 2 look very different in the beginning, the last paragraphs show that they all use the same principles (barriers). Only the execution of these principles differ from each other, e.g. using another material or combining two barriers in one layer. It is therefore advisable to base the following analyses on these principles. The approach is explained for the category “timber frame construction – ventilated”. A so-called basic composition is selected (cf. Figure 8) that meets all requirements described above. In a next step, some modifications are determined that refer to the collected examples in Table 2.
Second defense layer: A wood fiberboard is often used as second defense layer that brings also additional insulation capacity. According to French regulations, it is also possible to use a relatively diffusion-tight OSB panel as long as the interior vapor barrier has a five times higher sd-value (see Table 3).
Insulation: A mineral wool is compared with cellulose fiber which is more expensive but has a higher moisture storage capacity (cf. 5.3.1).
Scientific Report
31.07.2017 25
Vapor barrier / air barrier: The analyses will compare three different vapor barriers: A membrane with an sd-value of 20 m, an OSB panel and a moisture-adaptive membrane. As long as all edges are completely glued, each of the mentioned materials can also function as air barrier.
Figure 8: Basic composition with modifications
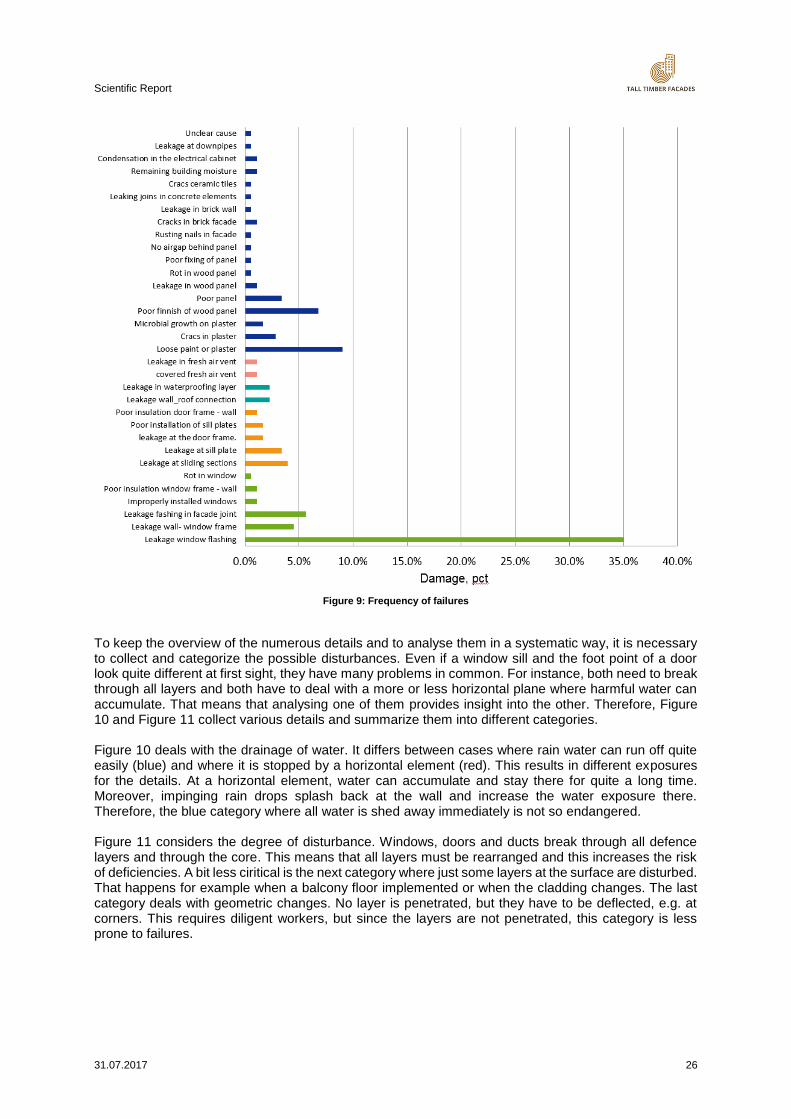
The question might be why the described approach is preferred instead of just evaluating the collected examples as they are. The answers lie in the comparability of the results and in the systemization of the analyses. Important parameters like the thickness of the insulation layer vary within the collected examples. This influences the results and will overlap with the effect of changing the insulation material. In the end it is not possible to separate these influences. Therefore, this systematic approach using a basic “frame” and modifying some layers step by step leads to more revealing results. Nevertheless, the suggested modifications are close enough to the collected examples that it is easily possible to transfer the results when the precepts of building physics are considered. The previous paragraphs showed the collection of different wall compositions and how they are systemized for further analyses. For the execution of these analyses see chapter 5. The following section will now collect and systemize details like windows or balcony connections before they are analysed in chapter 6. Details Analysing a plain wall is a first important step for determining moisture-safe constructions. But, in a real building, the plain wall is “disturbed”. It needs doors, ducts or a wall-roof-connection for mere functioning, and it needs balconies, projections, or changes of the cladding for comfort and aesthetic reasons. Each of these disturbances interferes with one or several barriers, e.g. second defense layer or vapor barrier. There are many recommendations how to close these barriers for example around a window. But, fact is that the risk of water penetration is much higher in the area of disturbances than in the plain wall. Many sources confirm that most moisture failures occur at details (see Figure 9).
Scientific Report
31.07.2017 26
Figure 9: Frequency of failures
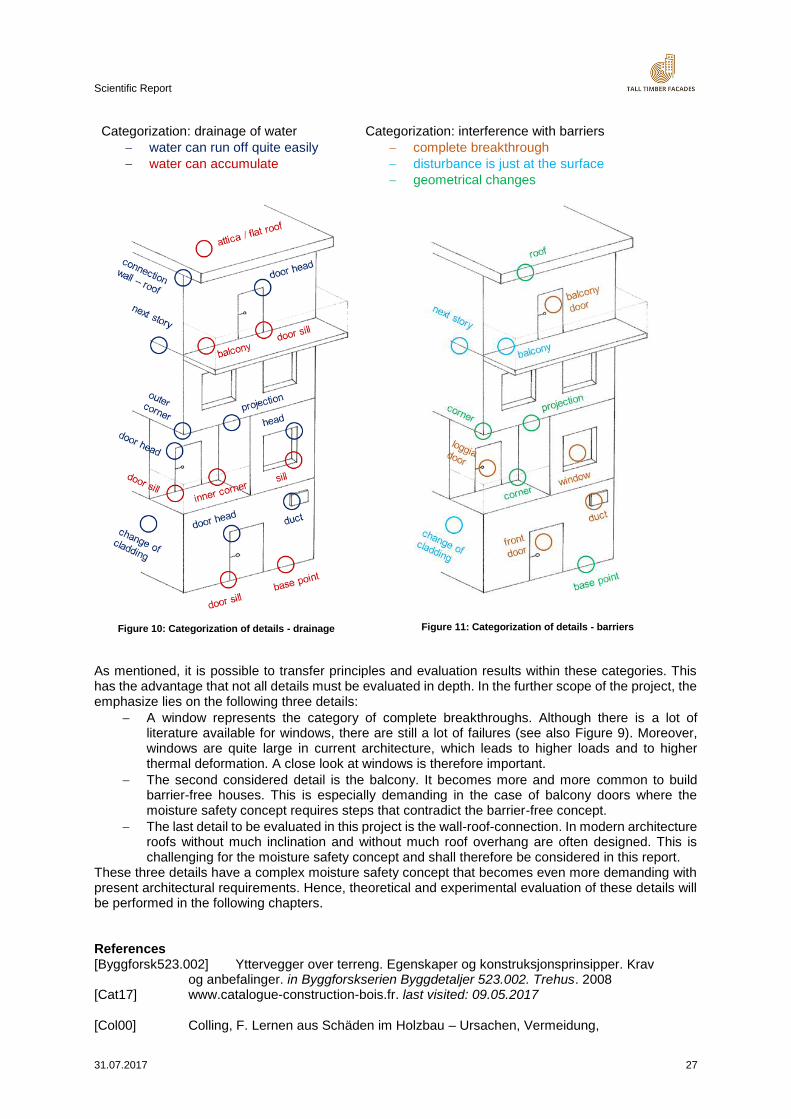
To keep the overview of the numerous details and to analyse them in a systematic way, it is necessary to collect and categorize the possible disturbances. Even if a window sill and the foot point of a door look quite different at first sight, they have many problems in common. For instance, both need to break through all layers and both have to deal with a more or less horizontal plane where harmful water can accumulate. That means that analysing one of them provides insight into the other. Therefore, Figure 10 and Figure 11 collect various details and summarize them into different categories. Figure 10 deals with the drainage of water. It differs between cases where rain water can run off quite easily (blue) and where it is stopped by a horizontal element (red). This results in different exposures for the details. At a horizontal element, water can accumulate and stay there for quite a long time. Moreover, impinging rain drops splash back at the wall and increase the water exposure there. Therefore, the blue category where all water is shed away immediately is not so endangered. Figure 11 considers the degree of disturbance. Windows, doors and ducts break through all defence layers and through the core. This means that all layers must be rearranged and this increases the risk of deficiencies. A bit less ciritical is the next category where just some layers at the surface are disturbed. That happens for example when a balcony floor implemented or when the cladding changes. The last category deals with geometric changes. No layer is penetrated, but they have to be deflected, e.g. at corners. This requires diligent workers, but since the layers are not penetrated, this category is less prone to failures.
Scientific Report
31.07.2017 27
Categorization: drainage of water
water can run off quite easily
water can accumulate
Figure 10: Categorization of details - drainage
Categorization: interference with barriers
complete breakthrough
disturbance is just at the surface
geometrical changes
Figure 11: Categorization of details - barriers
As mentioned, it is possible to transfer principles and evaluation results within these categories. This has the advantage that not all details must be evaluated in depth. In the further scope of the project, the emphasize lies on the following three details:
A window represents the category of complete breakthroughs. Although there is a lot of literature available for windows, there are still a lot of failures (see also Figure 9). Moreover, windows are quite large in current architecture, which leads to higher loads and to higher thermal deformation. A close look at windows is therefore important.
The second considered detail is the balcony. It becomes more and more common to build barrier-free houses. This is especially demanding in the case of balcony doors where the moisture safety concept requires steps that contradict the barrier-free concept.
The last detail to be evaluated in this project is the wall-roof-connection. In modern architecture roofs without much inclination and without much roof overhang are often designed. This is challenging for the moisture safety concept and shall therefore be considered in this report.
These three details have a complex moisture safety concept that becomes even more demanding with present architectural requirements. Hence, theoretical and experimental evaluation of these details will be performed in the following chapters. References [Byggforsk523.002] Yttervegger over terreng. Egenskaper og konstruksjonsprinsipper. Krav og anbefalinger. in Byggforskserien Byggdetaljer 523.002. Trehus. 2008 [Cat17] www.catalogue-construction-bois.fr. last visited: 09.05.2017 [Col00] Colling, F. Lernen aus Schäden im Holzbau – Ursachen, Vermeidung,
Scientific Report
31.07.2017 28
Beispiele. Deutsche Gesellschaft für Holzforschung. 2000 [DIN68800-2] DIN 68800-2 Wood preservation – Part 2: Preventive constructional measures
in buildings [DTU31.2] NF DTU 31.2 Construction de maisons et bâtiments à ossature en bois [Grä15] Gräfe, M. et al. Regeldetailkatalog für den mehrgeschossigen Holzbau in Gebäudeklasse 4. Fraunhofer IRB Verlag. Bauforschung für die Praxis – Band 4. 2015 [Ifo15] Informationsdienst Holz - Holzrahmenbau. Holzbau Handbuch – Reihe 1 – Teil1 Folge 7. 2015 [Nor09] Nore, K. Hygrothermal performance of ventilated wooden cladding. PhD-Thesis. NTNU Trondheim. 2009 [RDH02] RDH Building Engineering Limited. Water penetration resistance of windows – study of manufacturing, building design, installation and maintenance factors. 2002 [Str17] Strobel, K. Simulation of the Moisture Performance of Non-Ventilated Wooden Walls. Master´s Thesis. Technical University of Munich. 2017 (not published) [Tei13] Teibinger, M. and Matzinger, I. Bauen mit Brettsperrholz im Geschossbau – Fokus Bauphysik. Planungsbroschüre Holzforschung Austria. 2013 [Trä17] www.traguiden.se. last visited: 09.05.2017
Failure modes
In the end the RiFa-tool shall decide whether a composition performs well or poorly. Therefore, it must be determined which criteria will be used for this evaluation and what “failure” means. A wall can fail due to many cases; the risk screening in the beginning (cf. c. 3.1) reveals four of them:
mold
decay
moisture creep
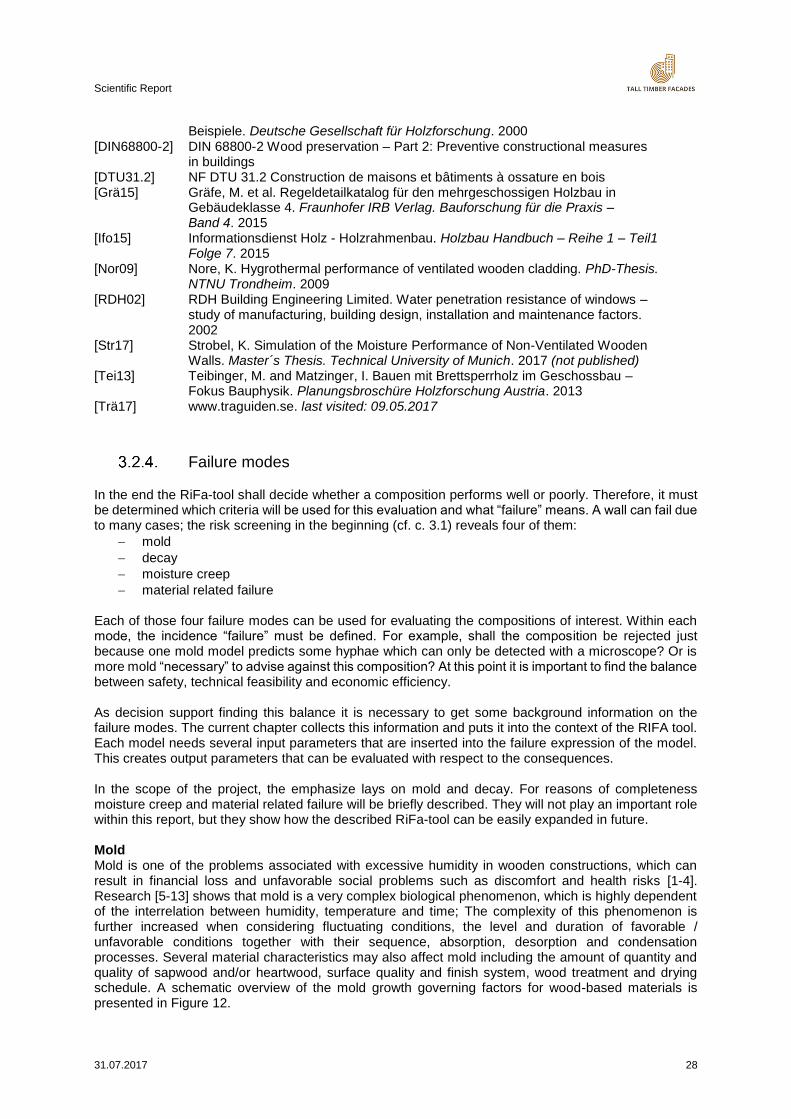
material related failure Each of those four failure modes can be used for evaluating the compositions of interest. Within each mode, the incidence “failure” must be defined. For example, shall the composition be rejected just because one mold model predicts some hyphae which can only be detected with a microscope? Or is more mold “necessary” to advise against this composition? At this point it is important to find the balance between safety, technical feasibility and economic efficiency. As decision support finding this balance it is necessary to get some background information on the failure modes. The current chapter collects this information and puts it into the context of the RIFA tool. Each model needs several input parameters that are inserted into the failure expression of the model. This creates output parameters that can be evaluated with respect to the consequences. In the scope of the project, the emphasize lays on mold and decay. For reasons of completeness moisture creep and material related failure will be briefly described. They will not play an important role within this report, but they show how the described RiFa-tool can be easily expanded in future. Mold Mold is one of the problems associated with excessive humidity in wooden constructions, which can result in financial loss and unfavorable social problems such as discomfort and health risks [1-4]. Research [5-13] shows that mold is a very complex biological phenomenon, which is highly dependent of the interrelation between humidity, temperature and time; The complexity of this phenomenon is further increased when considering fluctuating conditions, the level and duration of favorable / unfavorable conditions together with their sequence, absorption, desorption and condensation processes. Several material characteristics may also affect mold including the amount of quantity and quality of sapwood and/or heartwood, surface quality and finish system, wood treatment and drying schedule. A schematic overview of the mold growth governing factors for wood-based materials is presented in Figure 12.
Scientific Report
31.07.2017 29
Figure 12 Mold growth governing factors [13]
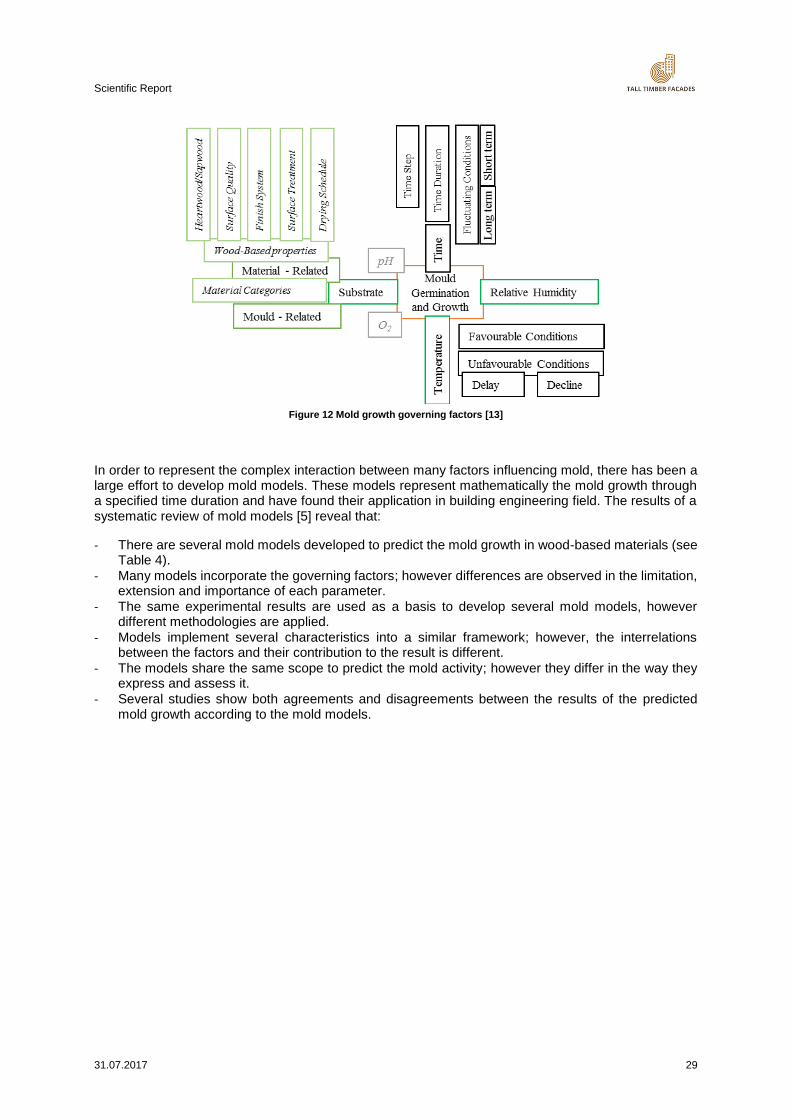
In order to represent the complex interaction between many factors influencing mold, there has been a large effort to develop mold models. These models represent mathematically the mold growth through a specified time duration and have found their application in building engineering field. The results of a systematic review of mold models [5] reveal that:
- There are several mold models developed to predict the mold growth in wood-based materials (see Table 4).
- Many models incorporate the governing factors; however differences are observed in the limitation, extension and importance of each parameter.
- The same experimental results are used as a basis to develop several mold models, however different methodologies are applied.
- Models implement several characteristics into a similar framework; however, the interrelations between the factors and their contribution to the result is different.
- The models share the same scope to predict the mold activity; however they differ in the way they express and assess it.
- Several studies show both agreements and disagreements between the results of the predicted mold growth according to the mold models.
Scientific Report
31.07.2017 30
Table 4 Overview of different characteristics related to mold models (symbol ‘’ stands for ‘accounted or covered in the model’, symbol ‘-‘ stands for ‘not accounted or not covered’, symbol ‘Y/N’ stands for Yes/No) [5]
Model Factor
ESP-r(1996) Max days – Model (1997)
VTT Model (1999)
Biohygro-thermal (2001)
Mold Germinati-on Graph
(2004)
Johansson et al. Indices (2001)
MRD Model (2010)
Gobakken et al. model (2010)
m - model (2011)
RH
<75 % - - - - - - -
75 % - 80 % - - - -
>80 %
T
<0 oC - - - - -
0 oC – 5 oC - - -
5 oC - 30 oC
>30 oC - -
Experiments
Agar - - - - -
Laboratory - - -
Exposed - - - - - -
Inspection
Visual - -
Microscope - -
Assessment
Onset
Add. Growth - - - - -
Unit Y/N Y/N VTT Index mm, Index Time Mold Indices Time, Index logit ratio Time, Index
Computation
Delay - - implicit
Steps hourly weekly hourly hourly daily hourly 12 hours daily hourly
Decrease - - - - - implicit
Ass. Period no limit one year no limit no limit no limit no limit no limit 12 years 4 years
Mold-based Six mold
categories - - - A. Versicolor
Cladosporium spp.
- - -
Material-based - Wooden materials
Four classes Four classes - Wooden materials
Variation of wooden materials
Wooden materials & properties
Four classes
Software ESP-r - Latenite, TCCC2D, Delphin
WUFI®-Bio - - WUFI® - -
Methodology Equation & isopleths
Equation Equation Isopleths and biohygrothermal model
Isopleths & equation
Indices & isopleth
Dose & isopleths
Logit model Equation
Literature [14, 15] [16-19] [18, 20-25] [11, 26, 27] [28-31] [32] [18, 22, 33-
39] [40-43]
[18, 21, 44-46]
Scientific Report
31.07.2017 31
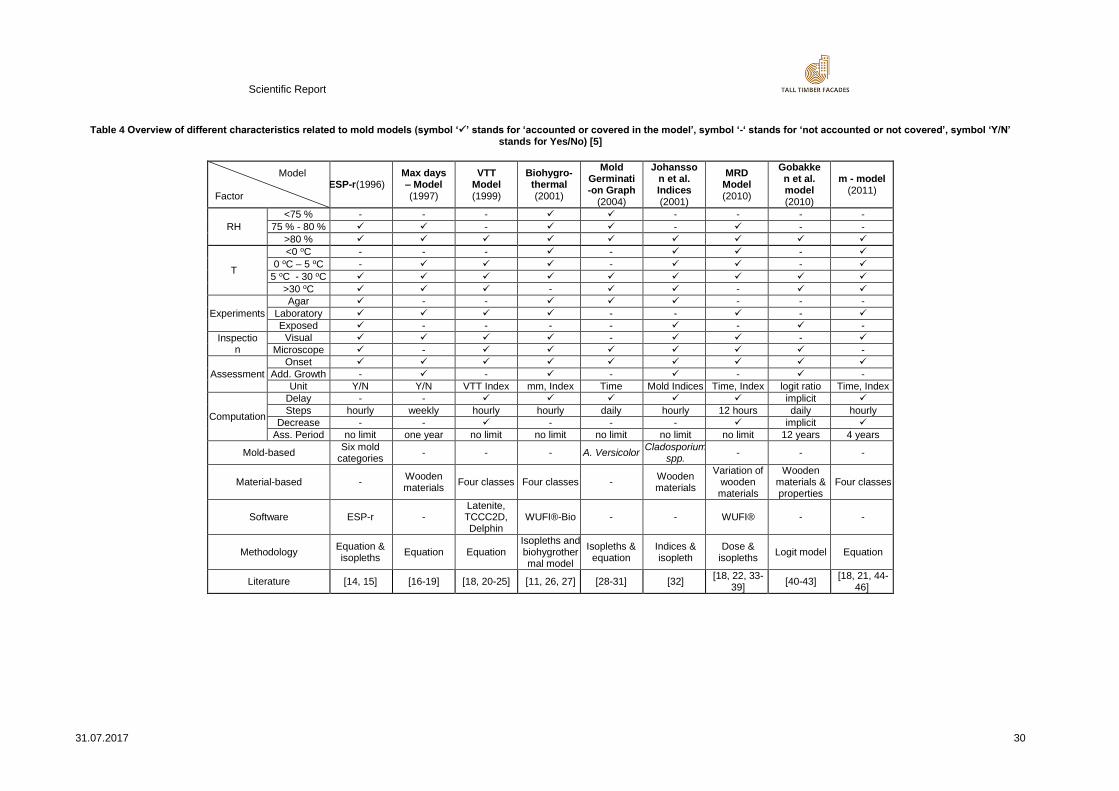
Figure 13. Schematics of the three mold models (MRD, IBP Biohygrothermal and VTT – model) by adapting the framework on [13]
Scientific Report
31.07.2017 [Hier eingeben] 32
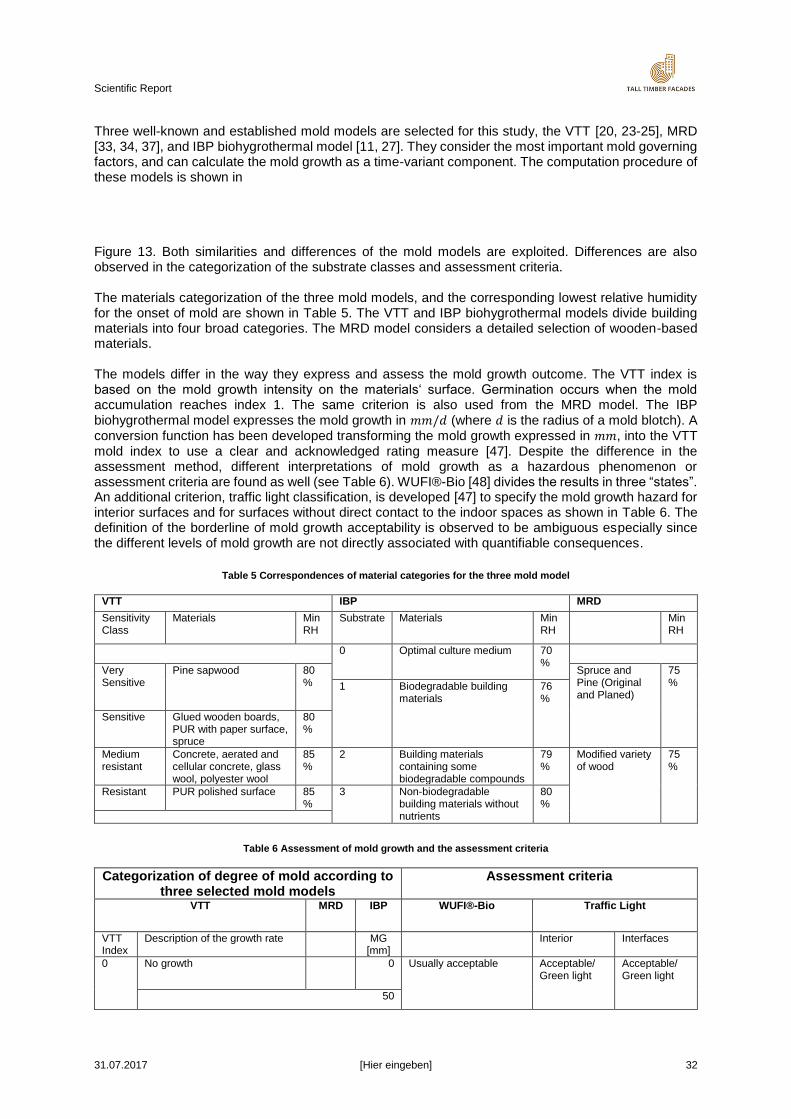
Three well-known and established mold models are selected for this study, the VTT [20, 23-25], MRD [33, 34, 37], and IBP biohygrothermal model [11, 27]. They consider the most important mold governing factors, and can calculate the mold growth as a time-variant component. The computation procedure of these models is shown in
Figure 13. Both similarities and differences of the mold models are exploited. Differences are also observed in the categorization of the substrate classes and assessment criteria. The materials categorization of the three mold models, and the corresponding lowest relative humidity for the onset of mold are shown in Table 5. The VTT and IBP biohygrothermal models divide building materials into four broad categories. The MRD model considers a detailed selection of wooden-based materials. The models differ in the way they express and assess the mold growth outcome. The VTT index is based on the mold growth intensity on the materials‘ surface. Germination occurs when the mold accumulation reaches index 1. The same criterion is also used from the MRD model. The IBP biohygrothermal model expresses the mold growth in 𝑚𝑚/𝑑 (where 𝑑 is the radius of a mold blotch). A conversion function has been developed transforming the mold growth expressed in 𝑚𝑚, into the VTT mold index to use a clear and acknowledged rating measure [47]. Despite the difference in the assessment method, different interpretations of mold growth as a hazardous phenomenon or assessment criteria are found as well (see Table 6). WUFI®-Bio [48] divides the results in three “states”. An additional criterion, traffic light classification, is developed [47] to specify the mold growth hazard for interior surfaces and for surfaces without direct contact to the indoor spaces as shown in Table 6. The definition of the borderline of mold growth acceptability is observed to be ambiguous especially since the different levels of mold growth are not directly associated with quantifiable consequences.
Table 5 Correspondences of material categories for the three mold model
VTT IBP MRD
Sensitivity Class
Materials Min RH
Substrate Materials Min RH
Min RH
0 Optimal culture medium 70 %
Very Sensitive
Pine sapwood 80 %
Spruce and Pine (Original and Planed)
75 % 1 Biodegradable building
materials 76 %
Sensitive Glued wooden boards, PUR with paper surface, spruce
80 %
Medium resistant
Concrete, aerated and cellular concrete, glass wool, polyester wool
85 %
2 Building materials containing some biodegradable compounds
79 %
Modified variety of wood
75 %
Resistant PUR polished surface 85 %
3 Non-biodegradable building materials without nutrients
80 %
Table 6 Assessment of mold growth and the assessment criteria
Categorization of degree of mold according to three selected mold models
Assessment criteria
VTT MRD IBP WUFI®-Bio Traffic Light
VTT Index
Description of the growth rate MG [mm]
Interior Interfaces
0 No growth 0 Usually acceptable Acceptable/ Green light
Acceptable/ Green light
50
Scientific Report
31.07.2017 [Hier eingeben] 33
1 Small amounts of mold surface (microscope), initial stages of local growth
Onset of mold
130 Additional criteria or investigations required to assess acceptability
2 Several local mold growth colonies on surface (microscope)
175 Yellow traffic light
3 200
Visual findings of mold on surface, <10% coverage, or <50% coverage of mold (microscope)
238 Usually not acceptable Unacceptable/ Red light
Yellow traffic light
4 Visual findings of mold on surface, 10 - 50 % coverage, or >50% coverage of mold (microscope)
335 Unacceptable/ Red light
5 Plenty of growth on surface, > 50% coverage (visual)
450
6 Heavy and tight growth, coverage about 100%
575
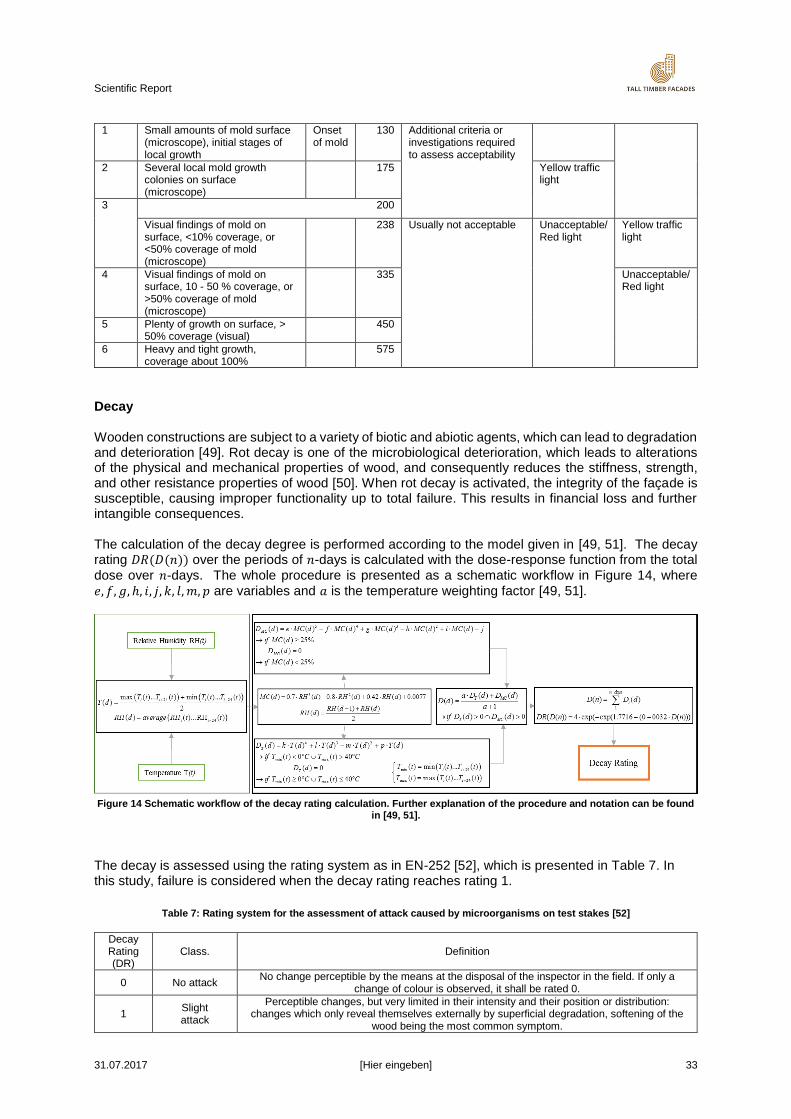
Decay Wooden constructions are subject to a variety of biotic and abiotic agents, which can lead to degradation and deterioration [49]. Rot decay is one of the microbiological deterioration, which leads to alterations of the physical and mechanical properties of wood, and consequently reduces the stiffness, strength, and other resistance properties of wood [50]. When rot decay is activated, the integrity of the façade is susceptible, causing improper functionality up to total failure. This results in financial loss and further intangible consequences. The calculation of the decay degree is performed according to the model given in [49, 51]. The decay rating 𝐷𝑅(𝐷(𝑛)) over the periods of 𝑛-days is calculated with the dose-response function from the total
dose over 𝑛-days. The whole procedure is presented as a schematic workflow in Figure 14, where
𝑒, 𝑓, 𝑔, ℎ, 𝑖, 𝑗, 𝑘, 𝑙, 𝑚, 𝑝 are variables and 𝑎 is the temperature weighting factor [49, 51].
Figure 14 Schematic workflow of the decay rating calculation. Further explanation of the procedure and notation can be found
in [49, 51].
The decay is assessed using the rating system as in EN-252 [52], which is presented in Table 7. In this study, failure is considered when the decay rating reaches rating 1.
Table 7: Rating system for the assessment of attack caused by microorganisms on test stakes [52]
Decay Rating (DR)
Class. Definition
0 No attack No change perceptible by the means at the disposal of the inspector in the field. If only a
change of colour is observed, it shall be rated 0.
1 Slight attack
Perceptible changes, but very limited in their intensity and their position or distribution: changes which only reveal themselves externally by superficial degradation, softening of the
wood being the most common symptom.
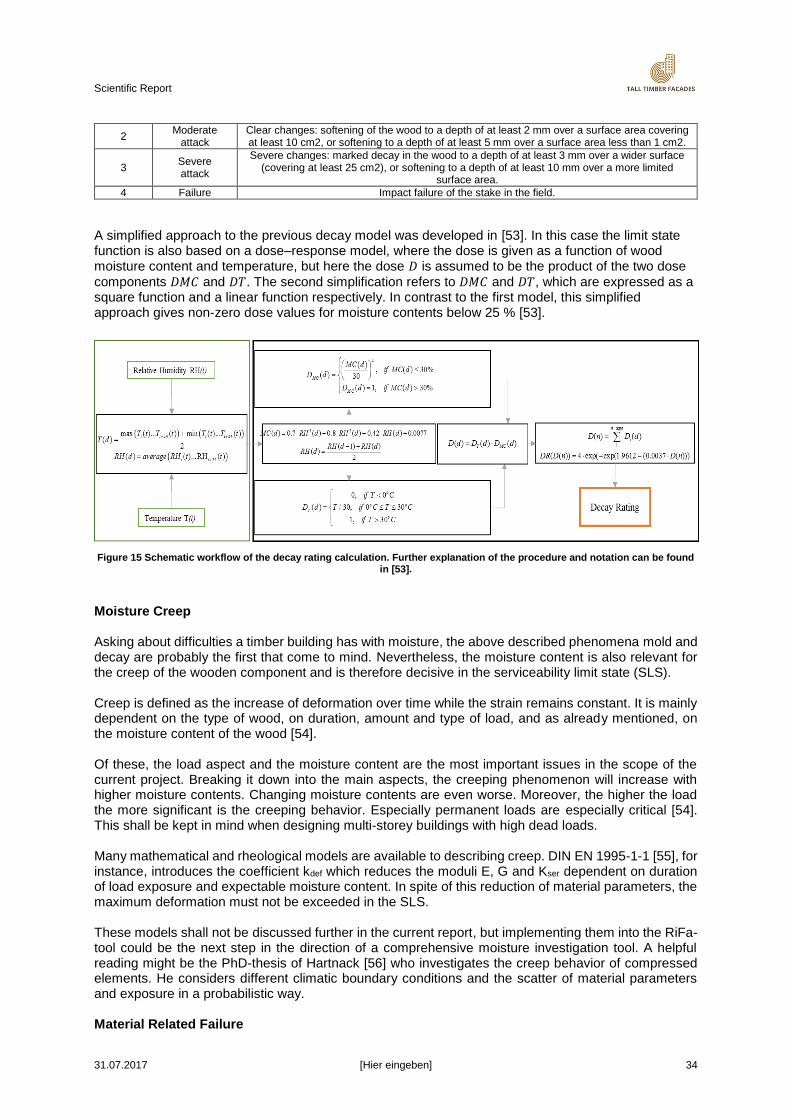
Scientific Report
31.07.2017 [Hier eingeben] 34
2 Moderate
attack Clear changes: softening of the wood to a depth of at least 2 mm over a surface area covering at least 10 cm2, or softening to a depth of at least 5 mm over a surface area less than 1 cm2.
3 Severe attack
Severe changes: marked decay in the wood to a depth of at least 3 mm over a wider surface (covering at least 25 cm2), or softening to a depth of at least 10 mm over a more limited
surface area.
4 Failure Impact failure of the stake in the field.
A simplified approach to the previous decay model was developed in [53]. In this case the limit state function is also based on a dose–response model, where the dose is given as a function of wood moisture content and temperature, but here the dose 𝐷 is assumed to be the product of the two dose
components 𝐷𝑀𝐶 and 𝐷𝑇. The second simplification refers to 𝐷𝑀𝐶 and 𝐷𝑇, which are expressed as a square function and a linear function respectively. In contrast to the first model, this simplified approach gives non-zero dose values for moisture contents below 25 % [53].
Figure 15 Schematic workflow of the decay rating calculation. Further explanation of the procedure and notation can be found in [53].
Moisture Creep Asking about difficulties a timber building has with moisture, the above described phenomena mold and decay are probably the first that come to mind. Nevertheless, the moisture content is also relevant for the creep of the wooden component and is therefore decisive in the serviceability limit state (SLS). Creep is defined as the increase of deformation over time while the strain remains constant. It is mainly dependent on the type of wood, on duration, amount and type of load, and as already mentioned, on the moisture content of the wood [54]. Of these, the load aspect and the moisture content are the most important issues in the scope of the current project. Breaking it down into the main aspects, the creeping phenomenon will increase with higher moisture contents. Changing moisture contents are even worse. Moreover, the higher the load the more significant is the creeping behavior. Especially permanent loads are especially critical [54]. This shall be kept in mind when designing multi-storey buildings with high dead loads. Many mathematical and rheological models are available to describing creep. DIN EN 1995-1-1 [55], for instance, introduces the coefficient kdef which reduces the moduli E, G and Kser dependent on duration of load exposure and expectable moisture content. In spite of this reduction of material parameters, the maximum deformation must not be exceeded in the SLS. These models shall not be discussed further in the current report, but implementing them into the RiFa- tool could be the next step in the direction of a comprehensive moisture investigation tool. A helpful reading might be the PhD-thesis of Hartnack [56] who investigates the creep behavior of compressed elements. He considers different climatic boundary conditions and the scatter of material parameters and exposure in a probabilistic way. Material Related Failure
Scientific Report
31.07.2017 [Hier eingeben] 35
"Material-related failure" is defined the change of color and structure due to weathering alone. Weathering is the general term used to define the slow degradation of materials exposed to the weather. The degradation mechanism depends on the type of material, but the cause is a combination of factors found in nature: moisture, sunlight, heat/cold, chemicals, abrasion by windblown materials, and biological agents [57]. In general, understanding the chemistry of wood degradation requires knowledge of its macroscopic properties -e.g. specific gravity, earlywood / latewood, texture, juvenile wood, compression wood, heartwood/sapwood –, its anatomical structure, and the chemical nature of polysaccharides, lignin, and extractives, which is out of the scope of the present report. The chemical changes induced by weathering include free radical formation and formation of hydroperoxides, a specific depth of degradation (which in turns induces colour change), and acid effects. The physical aspects of degradation comprise:
- Microscopic effects: destruction of middle lamella, destruction of bordered pits, and cell wall checking
- Macroscopic effects: loss of fibre, change of grain orientation, decrease of water repellence, development of checks, and raised grain.
There exist chemical treatments to retard weathering, among them: chromic acid, chromated copper arsenate preservatives, copper-based preservatives, chemically bonded stabilizers, commercial stabilizers, different chemical modifications, water-repellent preservatives, paints, and stains. For more details, the reader is directed to the complete review from Williams [57]. References [1] WHO Guidelines for indoor air quality, 2010. [2] R. Arthur, "Damp Indoor Spaces and Health.," Journal of Public Health, vol. 27, no. 2, pp. 234-
234, 2005. [3] M. S. Jaakkola and J. J. Jaakkola, "Indoor molds and asthma in adults," Advances in applied
microbiology, vol. 55, pp. 309-338, 2004. [4] IOM, "Damp Indoor Spaces and Health," N. A. Press, Ed., ed. Washington DC, 2004. [5] K. Gradeci, N. Labonnote, B. Time, and J. Köhler, "Mold Growth Criteria and Design
Avoidance Approaches in Wood-Based Materials – A Systematic Review (Article in Press)," Jounral of Construction and Building Materials, 2017.
[6] O. Adan and R. Samson, Fundamentals of mold growth in indoor environmens and strategies for a healthy living. Wageningen, The Netherlands, 2011.
[7] H. Hens, "Fungal defacement in buildings: A performance related approach," HVAC&R Research, vol. 5, no. 3, pp. 265-280, 1999.
[8] IEA, "Guideline & Practice," in "ANNEX XIV : Condensation and Energy," 1990, vol. 2. [9] P. Johansson, T. Svensson, and A. Ekstrand-Tobin, "Validation of critical moisture conditions
for mold growth on building materials," Building and Environment, vol. 62, pp. 201-209, 2013. [10] A. L. Pasanen et al., "Fungal growth and survival in building materials under fluctuating
moisture and temperature conditions," (in English), International Biodeterioration and Biodegradation, Article vol. 46, no. 2, pp. 117-127, 2000.
[11] K. Sedlbauer, "Prediction of mold fungus formation on the surface of and inside building components," PhD, Fraunhofer Institute, 2001.
[12] H. Viitanen et al., "Moisture and bio-deterioration risk of building materials and structures," Journal of Building Physics, vol. 33, no. 3, pp. 201-224, 2010.
[13] K. Gradeci, N. Labonnote, B. Time, and J. Köhler, "Mold Models Applicable to Wood-Based Materials – A Generic Framework (Accepted manuscript)," Energy Procedia, 2017.
[14] J. Anderson, J. Clarke, N. Kelly, R. McLean, N. Rowan, and J. Smith, "Development of a technique for the prediction/alleviation of conditions leading to mold growth in houses' Final Report for Contract Number 68017 Scottish Homes," ed: Edinburgh, 1996.
[15] J. A. Clarke et al., "A technique for the prediction of the conditions leading to mold growth in buildings," (in English), Building and Environment, Article vol. 34, no. 4, pp. 515-521, 1999.
Scientific Report
31.07.2017 [Hier eingeben] 36
[16] S. Geving, "Moisture Design of Building Constructions," PhD, Norwegian University of Science and Technology, Trondheim, 1997.
[17] S. Geving, "Hygrothermal conditions in wooden claddings: test house measurements: report from Climate 2000," Byggforsk, 2006.
[18] H. Viitanen and A. Ritschkoff, "Mold growth in pine and spruce sapwood in relation to air humidity and temperature," Uppsala1991, vol. 221.
[19] H. Viitanen, "Factors affecting the development of biodeterioration in wooden constructions," (in English), Materials and Structures, Article vol. 27, no. 8, pp. 483-493, 1994.
[20] A. Hukka and H. Viitanen, "A mathematical model of mold growth on wooden material," Wood Science and Technology, vol. 33, no. 6, pp. 475-485, 1999.
[21] H. Viitanen and J. Bjurman, "Mold growth on wood under fluctuating humidity conditions," (in English), Material und Organismen, Article vol. 29, no. 1, pp. 27-46, 1995.
[22] H. A. Viitanen, "Modelling the time factor in the development of mold fungi-The effect of critical humidity and temperature conditions on pine and spruce sapwood," Holzforschung-International Journal of the Biology, Chemistry, Physics and Technology of Wood, vol. 51, no. 1, pp. 6-14, 1997.
[23] H. Viitanen and T. Ojanen, "Improved Model to Predict Mold Growth in Building Materials," 2007.
[24] T. Ojanen, H. Viitanen, R. Peuhkuri, K. Lähdesmäki, J. Vinha, and K. Salminen, "Mold growth modeling of building structures using sensitivity classes of materials," in Thermal performance of the exterior envelopes of whole buildings XI international conference., 2010, pp. 1-10.
[25] T. Ojanen, R. Peuhkuri, H. Viitanen, K. Lähdesmäki, J. Vinha, and K. Salminen, "Classification of material sensitivity–new approach for mold growth modeling," in 9th Nordic symposium on building physics, 2011, vol. 2, pp. 867-874.
[26] M. Krus, K. Sedlbauer, W. Zillig, and H. M. Künzel, "A New Model for Mold Prediction and its Application on a Test Roof," presented at the The current problems of building-physics in the rural building, Cracow, 1999.
[27] K. Sedlbauer, "Prediction of Mold Growth by Hygrothermal Calculation," Journal of Building Physics, vol. 25, no. 4, pp. 321-336, 2002.
[28] H. J. Moon, "Assessing Mold Risks in Buildings under Uncertainty," PhD, College of Architecture, Georgia Institute of Technology, USA, 2005.
[29] H. J. Moon and G. L. M. Augenbroe, "Towards a practical mold growth risk indicator," (in English), Building Services Engineering Research and Technology, Article vol. 25, no. 4, pp. 317-326, 2004.
[30] G. Ayerst, "The effects of moisture and temperature on growth and spore germination in some fungi," Journal of Stored Products Research, vol. 5, no. 2, pp. 127-141, 1969.
[31] S. L. Smith and S. T. Hill, "Influence of temperature and water activity on germination and growth of Aspergillus restrictus and A. versicolor," Transactions of the British Mycological Society, vol. 79, no. 3, pp. 558-560, // 1982.
[32] S. Johansson, L. Wadsö, and K. Sandin, "Estimation of mold growth levels on rendered façades based on surface relative humidity and surface temperature measurements," Building and Environment, vol. 45, no. 5, pp. 1153-1160, 2010.
[33] S. Thelandersson, T. Isaksson, A. Ekstrand-Tobin, and P. Johansson, "Modelling of onset of mold growth for wood exposed to varying climate conditions," Beijing, China24-28 May 2009 2009.
[34] T. Isaksson, S. Thelandersson, A. Ekstrand-Tobin, and P. Johansson, "Critical conditions for onset of mold growth under varying climate conditions," Building and Environment, vol. 45, no. 7, pp. 1712-1721, 2010.
[35] H. A. Viitanen, "Modelling the time factor in the development of brown rot decay in pine and spruce sapwood-the effect of critical humidity and temperature conditions," Holzforschung-International Journal of the Biology, Chemistry, Physics and Technology of Wood, pp. 99-106, 1997.
[36] P. Johansson, G. Bok, and A. Ekstrand-Tobin, "The effect of cyclic moisture and temperature on mold growth on wood compared to steady state conditions," Building and Environment, vol. 65, pp. 178-184, 2013.
[37] S. Thelandersson and T. Isaksson, "Mold resistance design (MRD) model for evaluation of risk for microbial growth under varying climate conditions," Building and Environment, vol. 65, pp. 18-25, 2013.

Scientific Report
31.07.2017 [Hier eingeben] 37
[38] H. Viitanen, "Critical conditions for mold and decay resistance of wood," (in English), 2009 Wood and Fiber Product Seminar: VTT and USDA Joint Activity, Conference Paper no. 263, pp. 114-118, 2010.
[39] S. Thelandersson, T. Isaksson, and J. Niklewski, "Fuktsäker utformning av klimatskiljande byggnadsdelar med fuktkänsliga material," Lund2014.
[40] L. R. Gobakken and P. K. Lebow, "Modelling mold growth on coated modified and unmodified wood substrates exposed outdoors," (in English), Wood Science and Technology, Article vol. 44, no. 2, pp. 315-333, 2010.
[41] L. R. Gobakken and M. Westin, "Surface mold growth on five modified wood substrates coated with three different coating systems when exposed outdoors," (in English), International Biodeterioration and Biodegradation, Article vol. 62, no. 4, pp. 397-402, 2008.
[42] L. R. Gobakken, O. A. Høibø, and H. Solheim, "Mold growth on paints with different surface structures when applied on wooden claddings exposed outdoors," (in English), International Biodeterioration and Biodegradation, Article vol. 64, no. 5, pp. 339-345, 2010.
[43] L. R. Gobakken, O. A. Høibø, and H. Solheim, "Factors influencing surface mold growth on wooden claddings exposed outdoors," (in English), Wood Material Science and Engineering, Article vol. 5, no. 1, pp. 1-12, 2010.
[44] B. Berggren and M. Wall, "Hygrothermal conditions in exterior walls for passive houses in cold climate considering future climate scenario," PassivhusNorden, vol. 2012, 2012.
[45] Togerö, Åse, and Tengberg, "The m-model: a method to assess the risk for mold growth in wood structures with fluctuating hygrothermal conditions.," presented at the NSB 2011 - 9th Nordic Symposium on Building Physics, Tampere, Finland, 2011.
[46] H. Viitanen, "Factors affecting the development of mold and brown rot decay in wooden material and wooden structures," 1996.
[47] H. Viitanen, M. Krus, T. Ojanen, V. Eitner, and D. Zirkelbach, "Mold Risk Classification Based on Comparative Evaluation of Two Established Growth Models," Energy Procedia, vol. 78, pp. 1425-1430, 11// 2015.
[48] WUFI®®Bio, "WUFI®®Bio," ed: Fraunhofer IBP. [49] C. Brischke and L. Meyer-Veltrup, "Modelling timber decay caused by brown rot fungi,"
Materials and Structures, pp. 1-11, 2016. [50] R. A. Eaton and M. D. C. Hale, Wood: decay, pests and protection. 1993. [51] C. Brischke, "Decay Modelling," G. Klodian, Ed., ed, 2016. [52] Field test method for determining the relative protective effectiveness of a wood preservative
in ground contact, 2014. [53] T. Isaksson, C. Brischke, and S. Thelandersson, "Development of decay performance models
for outdoor timber structures," Materials and structures, vol. 46, no. 7, pp. 1209-1225, 2013. [54] H. Neuhaus, Ingenieurholzbau. Grundlagen, Bemessung, Nachweise,
Beispiele. 3. Auflage. 2011 [55] DIN EN 1995-1-1:2010. Eurocode 5: Design of timber structures – Common rules and rules for buildings [56] R. Hartnack, Langzeittragverhalten von druckbeanspruchten Bauteilen aus Holz.
Dissertation. 2004 [57] S. R. Williams, Weathering of Wood. USDA, Forest Service, Forest Products Laboratory,
Madison, WI. available online: https://www.fpl.fs.fed.us/documnts/pdf2005/fpl_2005_williams001.pdf
Consequences
3.2.5.1. Direct consequences
Excessive moisture in buildings, especially in timber construction, can lead to consequences that are more than just an aesthetic problem. It can have harmful effects on the occupant health, the building state, its value itself, and its energy consumption. Moisture damage can decrease lifetime of the building and can result in costly and constraining repairs. Air Quality Molds are often present inside buildings, building users see mainly the aesthetic disorders that they generate. However, they are especially dangerous for health. There is already a natural level of mold
Scientific Report
31.07.2017 [Hier eingeben] 38
in the air but, form excessive humidity in the building envelope they increase in ambient air and can degrade the indoor air quality. When mold grows inside a building, it can damage materials and all objects in contact with the indoor air on which it grows, but mold can also affect the health and comfort of occupants and it causes allergies. Allergy sufferers may react to mold spores. Its effects on health vary according to the type of mold, the level of exposure and the predisposition of the occupants. The population at risk of being affected by the presence of mold are pregnant women, babies, the elderly, and people with respiratory problems or a weakened immune system. Potential health consequences for users:
Inflammatory Reactions
Allergies
Rhinitis
Asthma
Chronic bronchitis
Irritation of eyes, skin
Cough
Tiredness
Headache Additional, in a room with excessive moisture, regarding the comfort the “cold feeling” is more intense and rooms warm up poorly.
Reduced strength Humidity represents an undeniable risk to the stability of the building, as it causes decay of the wooden elements, such as the floor, beams or frame. Structures can be affected: when the wood is too wet it can rot fragile framing structure; also the water accumulated in materials freezes in winter and might break up certain parts of structures. Humidity also affects insulation, piping, etc. In some extreme cases, weakened buildings may even collapse. The danger of moisture on occupant safety is not to be underestimated.
Figure 16 Illustration of a damaged floor structure - FCBA expertise.
Aesthetics Inside the building, at the cold surfaces on the inside walls, windows or furniture, moisture can cause mold growth, peeling of wallpaper, or flaking of paints. At the external side, some wood species are considered to be resistant to fungi, which can affect mechanical characteristics (decay), but they are not protected to aesthetic degradation by mold and fungus which can blue or darken the surface in cases of high weather exposure.
Scientific Report
31.07.2017 [Hier eingeben] 39
Figure 17 Indoor facing with traces of mold – FCBA expertise.
Figure 18 Two different appearances of outdoor cladding on the same building.
Deformation Wood is a hygroscopic material, the variations of its water content cause deformation (swelling or shrinkage). The deformations of the wooden structures are manifested more by their aesthetic nuisance (deflection of ceiling and roof) than by a real danger for the structures stability. Excessive moisture in wood is an aggravating factor for future deformation and any wood element is subject to creep under long-term load. The change of wood water content between the anhydrous state (0%) and the saturation point of the fibers (30%) causes variations in volume and dimensions. These variations occur in the three main directions: axial, radial and tangential. This deformation problem can lead to serious disorder, especially for millwork; wood swells and then retracts creating gap between pieces. Moreover, there can be different types of wood in the same element (core, knots...) which do not deform in the same way, this causes cracks fragilizing the structure and degrading the aesthetic.
Scientific Report
31.07.2017 [Hier eingeben] 40
Figure 19 Deformation of wood.
Figure 20 Deformation of a window frame - FCBA expertise.
Reduced insulation capacity Thermal conductivity of some insulation increases with increased water content. For example, the thermal conductivity of cellulose insulation at saturation is more than 10 times higher comparing to its dry state. The following Table 8 shows the evolution of thermal conductivity of some insulation materials in dry state and in saturation state. For most of insulation materials, thermal conductivity does not change much below 80% relative humidity. Natural-based insulation materials are more sensitive than the others, for mineral wool, significant increase of thermal conductivity is observed from 95%.
Insulation material Thermal conductivity (dry) Thermal conductivity (saturation)
Cellulose insulation 0,04 0,58
Mineral Wool 0,04 0,60
Wood fibre 0,042 0,18
Expanded polystyrene 0,044 0,14
Table 8 Example of evolution of insulation thermal conductivity for regarding their water content – WUFI® Pro.
A high level of relative humidity in indoor air may causes an increase in energy consumption and therefore, on the heating costs. First, with the reduction of the insulation performance of the building
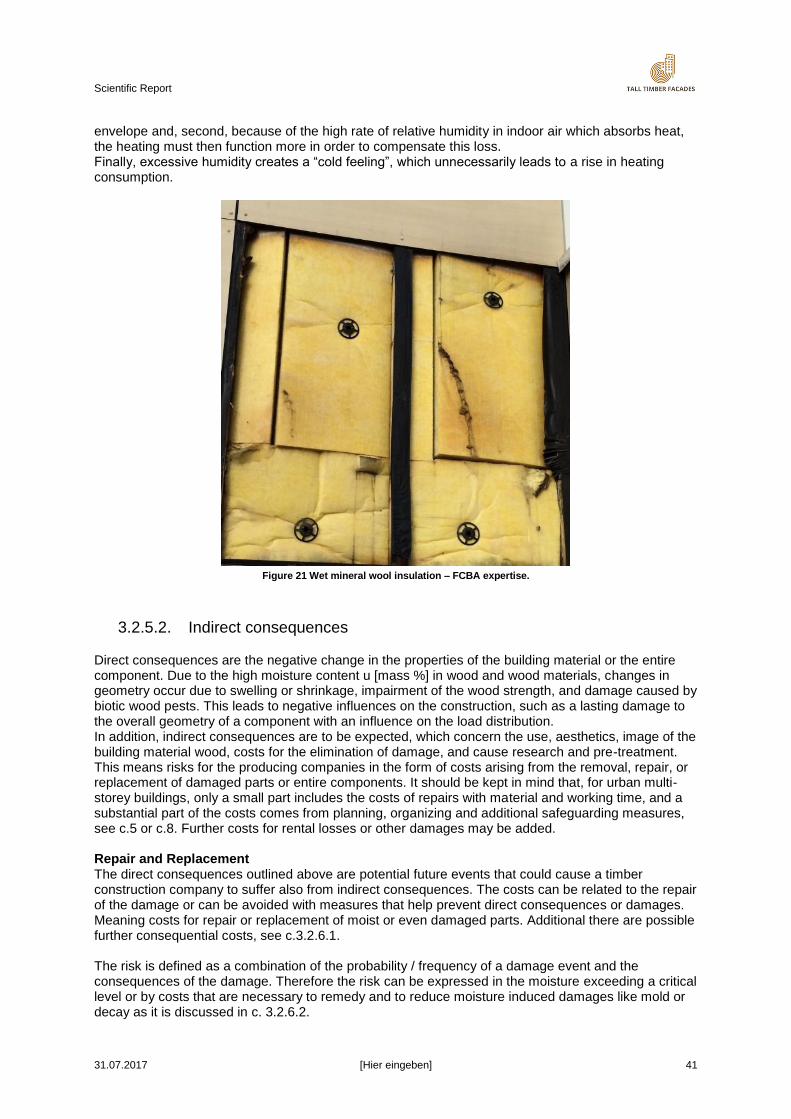
Scientific Report
31.07.2017 [Hier eingeben] 41
envelope and, second, because of the high rate of relative humidity in indoor air which absorbs heat, the heating must then function more in order to compensate this loss. Finally, excessive humidity creates a “cold feeling”, which unnecessarily leads to a rise in heating consumption.
Figure 21 Wet mineral wool insulation – FCBA expertise.
3.2.5.2. Indirect consequences
Direct consequences are the negative change in the properties of the building material or the entire component. Due to the high moisture content u [mass %] in wood and wood materials, changes in geometry occur due to swelling or shrinkage, impairment of the wood strength, and damage caused by biotic wood pests. This leads to negative influences on the construction, such as a lasting damage to the overall geometry of a component with an influence on the load distribution. In addition, indirect consequences are to be expected, which concern the use, aesthetics, image of the building material wood, costs for the elimination of damage, and cause research and pre-treatment. This means risks for the producing companies in the form of costs arising from the removal, repair, or replacement of damaged parts or entire components. It should be kept in mind that, for urban multi-storey buildings, only a small part includes the costs of repairs with material and working time, and a substantial part of the costs comes from planning, organizing and additional safeguarding measures, see c.5 or c.8. Further costs for rental losses or other damages may be added. Repair and Replacement The direct consequences outlined above are potential future events that could cause a timber construction company to suffer also from indirect consequences. The costs can be related to the repair of the damage or can be avoided with measures that help prevent direct consequences or damages. Meaning costs for repair or replacement of moist or even damaged parts. Additional there are possible further consequential costs, see c.3.2.6.1. The risk is defined as a combination of the probability / frequency of a damage event and the consequences of the damage. Therefore the risk can be expressed in the moisture exceeding a critical level or by costs that are necessary to remedy and to reduce moisture induced damages like mold or decay as it is discussed in c. 3.2.6.2.
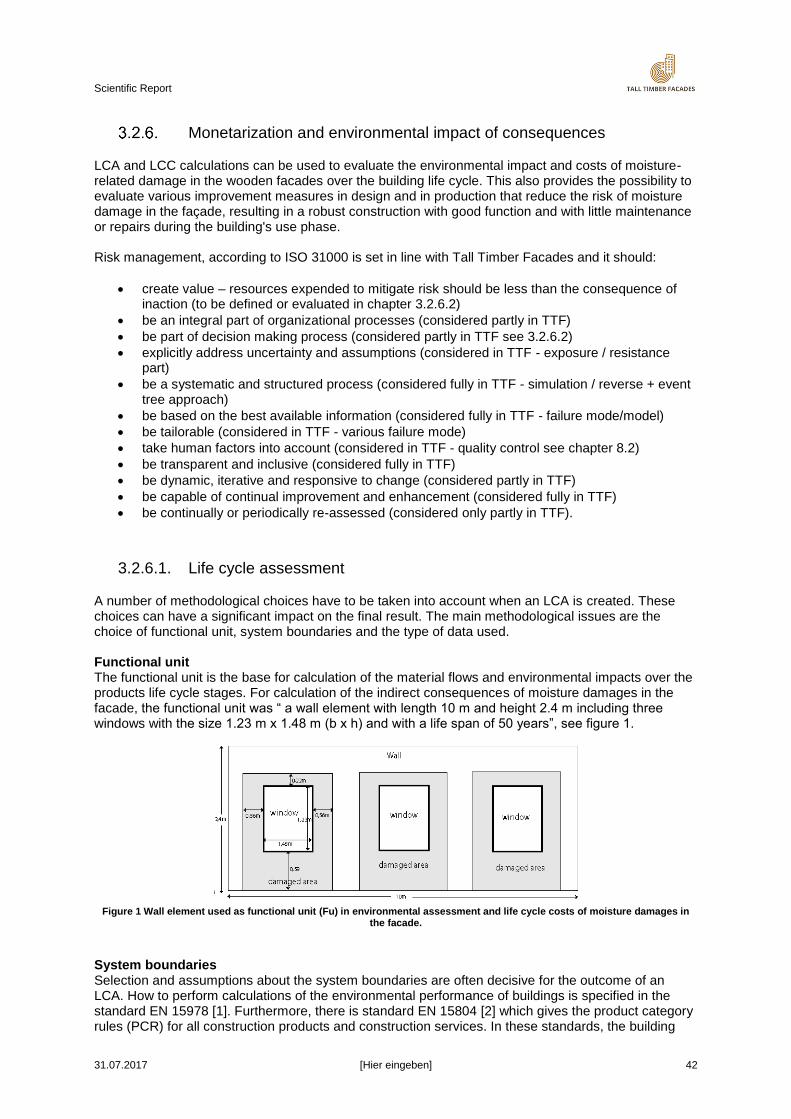
Scientific Report
31.07.2017 [Hier eingeben] 42
Monetarization and environmental impact of consequences
LCA and LCC calculations can be used to evaluate the environmental impact and costs of moisture-related damage in the wooden facades over the building life cycle. This also provides the possibility to evaluate various improvement measures in design and in production that reduce the risk of moisture damage in the façade, resulting in a robust construction with good function and with little maintenance or repairs during the building's use phase. Risk management, according to ISO 31000 is set in line with Tall Timber Facades and it should:
create value – resources expended to mitigate risk should be less than the consequence of inaction (to be defined or evaluated in chapter 3.2.6.2)
be an integral part of organizational processes (considered partly in TTF)
be part of decision making process (considered partly in TTF see 3.2.6.2)
explicitly address uncertainty and assumptions (considered in TTF - exposure / resistance part)
be a systematic and structured process (considered fully in TTF - simulation / reverse + event tree approach)
be based on the best available information (considered fully in TTF - failure mode/model)
be tailorable (considered in TTF - various failure mode)
take human factors into account (considered in TTF - quality control see chapter 8.2)
be transparent and inclusive (considered fully in TTF)
be dynamic, iterative and responsive to change (considered partly in TTF)
be capable of continual improvement and enhancement (considered fully in TTF)
be continually or periodically re-assessed (considered only partly in TTF).
3.2.6.1. Life cycle assessment
A number of methodological choices have to be taken into account when an LCA is created. These choices can have a significant impact on the final result. The main methodological issues are the choice of functional unit, system boundaries and the type of data used. Functional unit The functional unit is the base for calculation of the material flows and environmental impacts over the products life cycle stages. For calculation of the indirect consequences of moisture damages in the facade, the functional unit was “ a wall element with length 10 m and height 2.4 m including three windows with the size 1.23 m x 1.48 m (b x h) and with a life span of 50 years”, see figure 1.
Figure 1 Wall element used as functional unit (Fu) in environmental assessment and life cycle costs of moisture damages in the facade.
System boundaries Selection and assumptions about the system boundaries are often decisive for the outcome of an LCA. How to perform calculations of the environmental performance of buildings is specified in the standard EN 15978 [1]. Furthermore, there is standard EN 15804 [2] which gives the product category rules (PCR) for all construction products and construction services. In these standards, the building
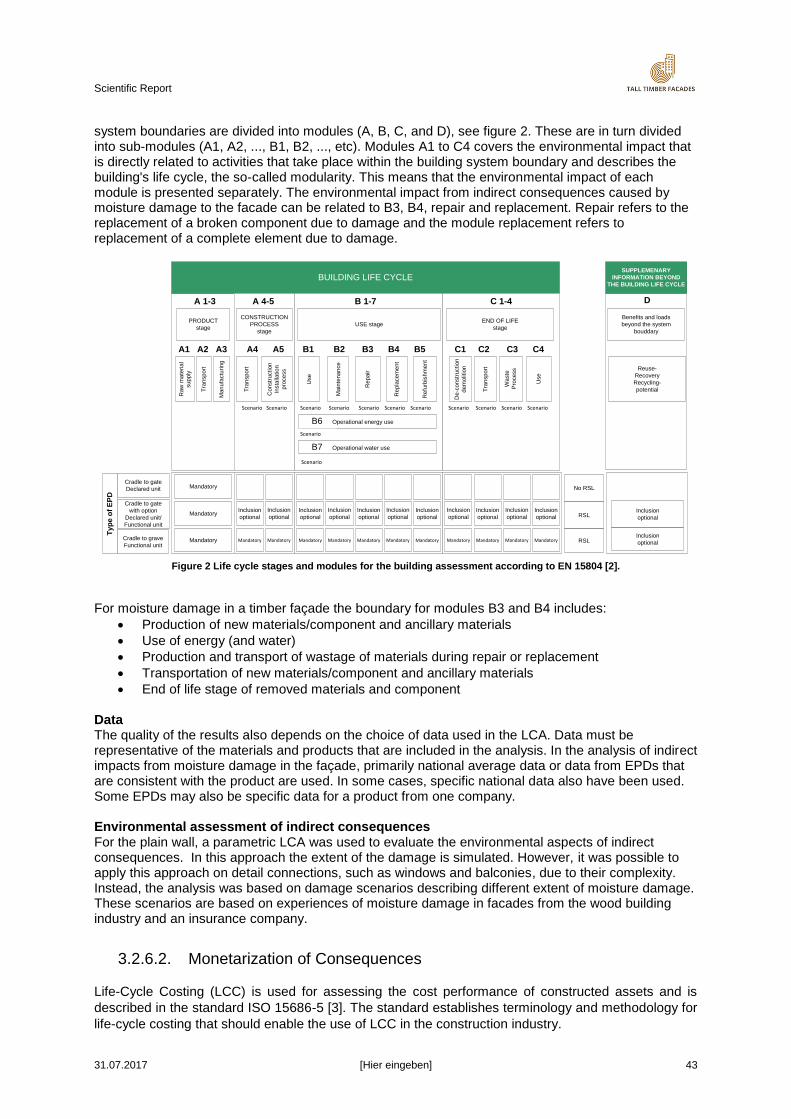
Scientific Report
31.07.2017 [Hier eingeben] 43
system boundaries are divided into modules (A, B, C, and D), see figure 2. These are in turn divided into sub-modules (A1, A2, ..., B1, B2, ..., etc). Modules A1 to C4 covers the environmental impact that is directly related to activities that take place within the building system boundary and describes the building's life cycle, the so-called modularity. This means that the environmental impact of each module is presented separately. The environmental impact from indirect consequences caused by moisture damage to the facade can be related to B3, B4, repair and replacement. Repair refers to the replacement of a broken component due to damage and the module replacement refers to replacement of a complete element due to damage.
Figure 2 Life cycle stages and modules for the building assessment according to EN 15804 [2].
For moisture damage in a timber façade the boundary for modules B3 and B4 includes:
Production of new materials/component and ancillary materials
Use of energy (and water)
Production and transport of wastage of materials during repair or replacement
Transportation of new materials/component and ancillary materials
End of life stage of removed materials and component Data The quality of the results also depends on the choice of data used in the LCA. Data must be representative of the materials and products that are included in the analysis. In the analysis of indirect impacts from moisture damage in the façade, primarily national average data or data from EPDs that are consistent with the product are used. In some cases, specific national data also have been used. Some EPDs may also be specific data for a product from one company. Environmental assessment of indirect consequences For the plain wall, a parametric LCA was used to evaluate the environmental aspects of indirect consequences. In this approach the extent of the damage is simulated. However, it was possible to apply this approach on detail connections, such as windows and balconies, due to their complexity. Instead, the analysis was based on damage scenarios describing different extent of moisture damage. These scenarios are based on experiences of moisture damage in facades from the wood building industry and an insurance company.
3.2.6.2. Monetarization of Consequences
Life-Cycle Costing (LCC) is used for assessing the cost performance of constructed assets and is
described in the standard ISO 15686-5 [3]. The standard establishes terminology and methodology for
life-cycle costing that should enable the use of LCC in the construction industry.
BUILDING LIFE CYCLESUPPLEMENARY
INFORMATION BEYOND
THE BUILDING LIFE CYCLE
PRODUCT
stage
CONSTRUCTION
PROCESS
stage
USE stageEND OF LIFE
stage
Benefits and loads
beyond the system
bouddary
Ra
w m
ate
ria
l
su
pp
ly
Tra
nsp
ort
Ma
nu
factu
rin
g
A1 A2 A3
Tra
nsp
ort
Ma
inte
na
nce
Co
nstr
uctio
n
Insta
llatio
n
pro
ce
ss
Use
Inclusion
optional
Mandatory
Cradle to gate
Declared unit
Cradle to gate
with option
Declared unit/
Functional unit
Cradle to grave
Functional unit
Mandatory
Mandatory
Mandatory
Inclusion
optional
Mandatory
Inclusion
optional
Mandatory
Inclusion
optional
Mandatory
Inclusion
optional
Mandatory
Inclusion
optional
Mandatory
Inclusion
optional
Mandatory
Inclusion
optional
Mandatory
Inclusion
optional
Mandatory
Inclusion
optional
Mandatory
Inclusion
optional
Mandatory
A4 A5 B1 B2 B3 B4 B5
Re
pa
ir
Re
pla
ce
me
nt
Re
furb
ish
me
nt
B6 Operational energy use
B7 Operational water use
Reuse-
Recovery
Recycling-
potential
Scenario Scenario Scenario Scenario Scenario Scenario Scenario
Scenario
Scenario
A 1-3 A 4-5 B 1-7
C1 C2 C3 C4
C 1-4
De
-co
nstr
uctio
n
de
mo
litio
n
Tra
nsp
ort
Wa
ste
Pro
ce
ss
Use
Scenario Scenario Scenario Scenario
Ty
pe
of
EP
D
No RSL
RSL
RSL
Inclusion
optional
Inclusion
optional
D
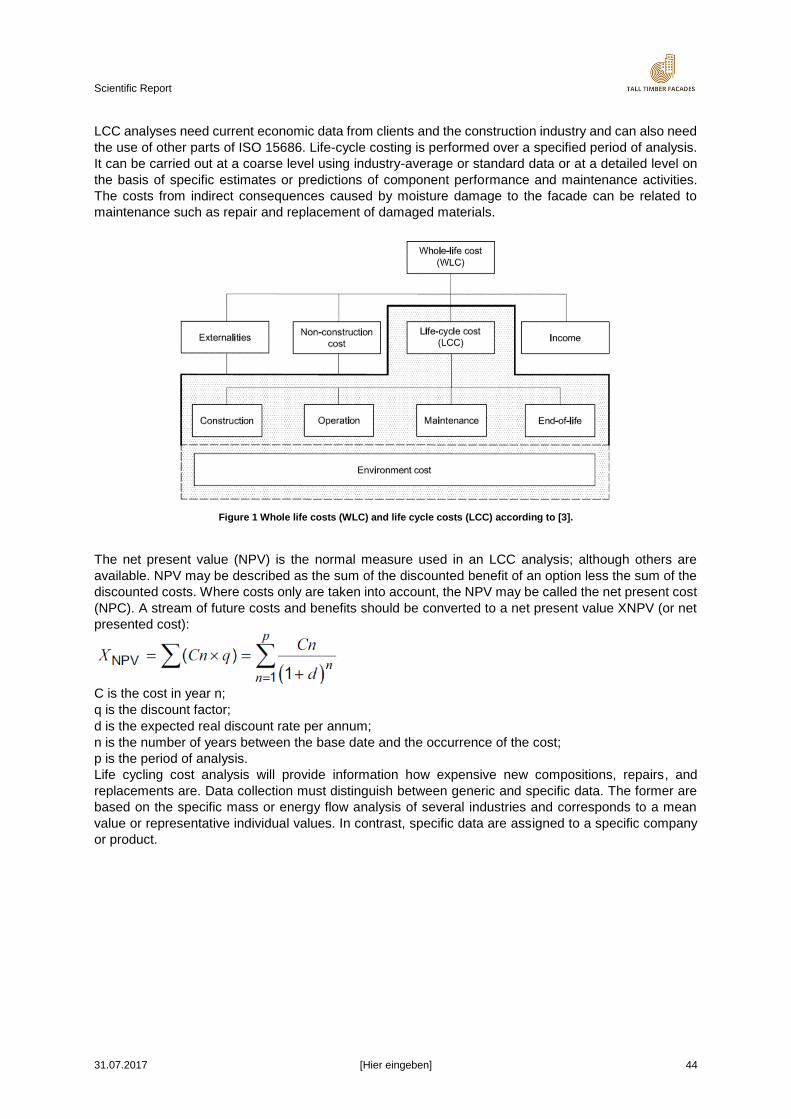
Scientific Report
31.07.2017 [Hier eingeben] 44
LCC analyses need current economic data from clients and the construction industry and can also need
the use of other parts of ISO 15686. Life-cycle costing is performed over a specified period of analysis.
It can be carried out at a coarse level using industry-average or standard data or at a detailed level on
the basis of specific estimates or predictions of component performance and maintenance activities.
The costs from indirect consequences caused by moisture damage to the facade can be related to
maintenance such as repair and replacement of damaged materials.
Figure 1 Whole life costs (WLC) and life cycle costs (LCC) according to [3].
The net present value (NPV) is the normal measure used in an LCC analysis; although others are
available. NPV may be described as the sum of the discounted benefit of an option less the sum of the
discounted costs. Where costs only are taken into account, the NPV may be called the net present cost
(NPC). A stream of future costs and benefits should be converted to a net present value XNPV (or net
presented cost):
C is the cost in year n;
q is the discount factor;
d is the expected real discount rate per annum;
n is the number of years between the base date and the occurrence of the cost;
p is the period of analysis.
Life cycling cost analysis will provide information how expensive new compositions, repairs, and
replacements are. Data collection must distinguish between generic and specific data. The former are
based on the specific mass or energy flow analysis of several industries and corresponds to a mean
value or representative individual values. In contrast, specific data are assigned to a specific company
or product.
Scientific Report
31.07.2017 45
4. Development of risk assessment processes
Probabilistic-based design methodology
The development of a risk-based design concept requires a probabilistic model representation of the physical phenomena that are associated with the relevant damage scenarios in the façade. The model representation also includes the expected value of monetary consequences of damage (or risk) as well as the costs of possible measures to reduce the consequences (or risk-reducing measures). As a result of this approach, optimal investment into risk-reducing measures may be identified. This probabilistic model representation can also serve as a basis for simplified semi-probabilistic design concepts consisting of characteristic values of the relevant parameters and partial safety factors. The probabilistic model representation will be implemented into a computer interface that facilitates the risk-based analysis of façade elements. The methodology is applicable for the most relevant façade configurations and surrounding geometrical details.
Risk model part A
In risk model part A, a scientific approach, more suitable for research and development of components is developed [1]. The performance assessment process employed as part of this Risk model part A and approach consists of the following steps:
- Selection of the failure performance criterion. The first step is the identification of a façade construction damage mechanism based on our economic, social and structural criteria. The identified failures modes are presented in section 3.2.4.
- Identification of influencing parameters. Following identification of the damage mechanism, a fault tree analysis and a clear and concise cause-and-effect investigation can be developed. All factors influencing these mechanisms are selected. In the case of biological phenomena, these factors include relative humidity, temperature, time, and nutrients. In turn, the input parameters affecting these factors include exterior weather conditions, indoor climate, as well as the material properties and geometry of the façade construction.
- Development of probabilistic models for input parameters supported by sensitivity analysis. The Monte Carlo method is an alternative for sampling the varying influential parameters input to the simulation model. In order to rationalize computational resources, a metamodel may also be incorporated.
- Evaluation of output and the decision-making process. The results support the decision-making process. If the probability of failure is higher than expected, based on the results of the sensitivity analysis, it may be possible to determine which construction parameters can be changed to effectively reduce failure occurrence.
In structural reliability applications, failure is defined as the difference between the capacity and demand for a given limit state is negative, according to the following condition:
0F C D (1)
Where C is the capacity term and D is the demand term. In our case study, demand is expressed as the predicted microbial growth for each simulation, while capacity is expressed according to the criteria set out. The demand term is sampled using the Monte Carlo method. After N simulations have been conducted, the approximate probability of failure is given by the following equation:
Ff
NP
N
(2)
where FN is the number of trials during which 0F .
The entire probabilistic-based approach is implemented in the form of a seamless and integrated parametric workflow by means of efficiently combining the MATLAB® [2], Python [3] and xml codes. A schematic workflow is presented in Figure 22. The seamless workflow enables an efficient conversion of the variability of the input parameters into a probabilistic representation of the output.
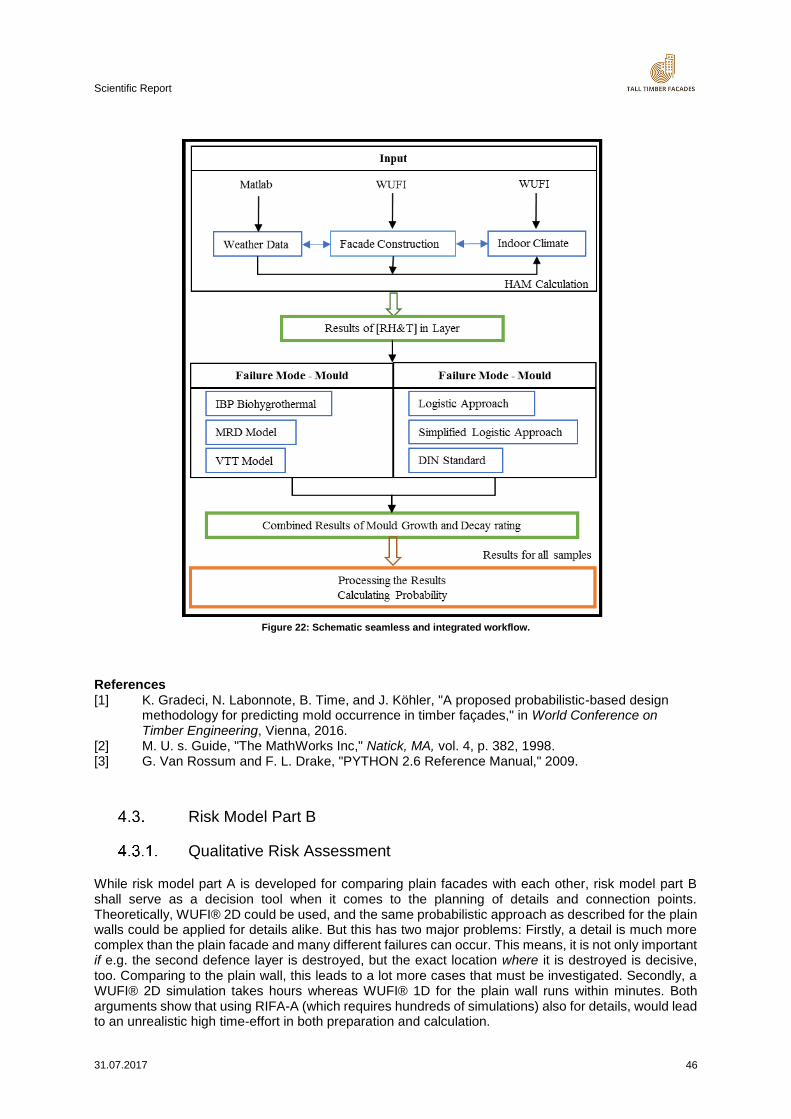
Scientific Report
31.07.2017 46
Figure 22: Schematic seamless and integrated workflow.
References [1] K. Gradeci, N. Labonnote, B. Time, and J. Köhler, "A proposed probabilistic-based design
methodology for predicting mold occurrence in timber façades," in World Conference on Timber Engineering, Vienna, 2016.
[2] M. U. s. Guide, "The MathWorks Inc," Natick, MA, vol. 4, p. 382, 1998. [3] G. Van Rossum and F. L. Drake, "PYTHON 2.6 Reference Manual," 2009.
Risk Model Part B
Qualitative Risk Assessment
While risk model part A is developed for comparing plain facades with each other, risk model part B shall serve as a decision tool when it comes to the planning of details and connection points. Theoretically, WUFI® 2D could be used, and the same probabilistic approach as described for the plain walls could be applied for details alike. But this has two major problems: Firstly, a detail is much more complex than the plain facade and many different failures can occur. This means, it is not only important if e.g. the second defence layer is destroyed, but the exact location where it is destroyed is decisive, too. Comparing to the plain wall, this leads to a lot more cases that must be investigated. Secondly, a WUFI® 2D simulation takes hours whereas WUFI® 1D for the plain wall runs within minutes. Both arguments show that using RIFA-A (which requires hundreds of simulations) also for details, would lead to an unrealistic high time-effort in both preparation and calculation.
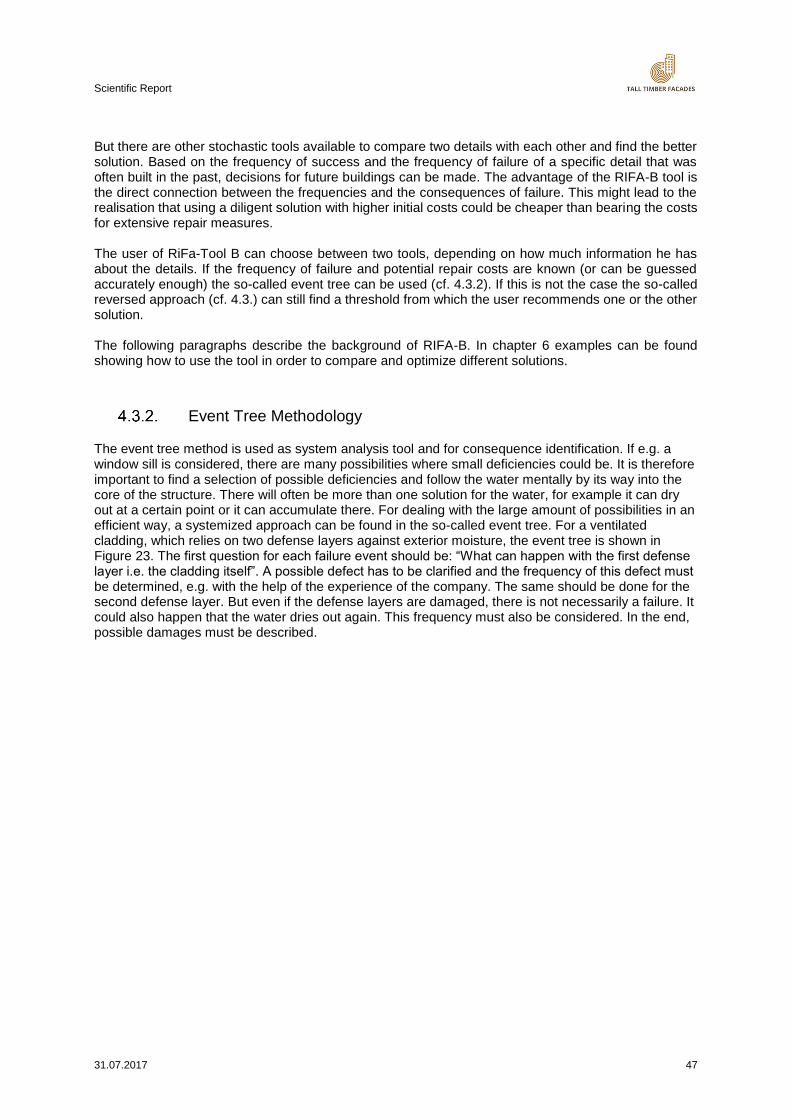
Scientific Report
31.07.2017 47
But there are other stochastic tools available to compare two details with each other and find the better solution. Based on the frequency of success and the frequency of failure of a specific detail that was often built in the past, decisions for future buildings can be made. The advantage of the RIFA-B tool is the direct connection between the frequencies and the consequences of failure. This might lead to the realisation that using a diligent solution with higher initial costs could be cheaper than bearing the costs for extensive repair measures. The user of RiFa-Tool B can choose between two tools, depending on how much information he has about the details. If the frequency of failure and potential repair costs are known (or can be guessed accurately enough) the so-called event tree can be used (cf. 4.3.2). If this is not the case the so-called reversed approach (cf. 4.3.) can still find a threshold from which the user recommends one or the other solution. The following paragraphs describe the background of RIFA-B. In chapter 6 examples can be found showing how to use the tool in order to compare and optimize different solutions.
Event Tree Methodology
The event tree method is used as system analysis tool and for consequence identification. If e.g. a window sill is considered, there are many possibilities where small deficiencies could be. It is therefore important to find a selection of possible deficiencies and follow the water mentally by its way into the core of the structure. There will often be more than one solution for the water, for example it can dry out at a certain point or it can accumulate there. For dealing with the large amount of possibilities in an efficient way, a systemized approach can be found in the so-called event tree. For a ventilated cladding, which relies on two defense layers against exterior moisture, the event tree is shown in Figure 23. The first question for each failure event should be: “What can happen with the first defense layer i.e. the cladding itself”. A possible defect has to be clarified and the frequency of this defect must be determined, e.g. with the help of the experience of the company. The same should be done for the second defense layer. But even if the defense layers are damaged, there is not necessarily a failure. It could also happen that the water dries out again. This frequency must also be considered. In the end, possible damages must be described.
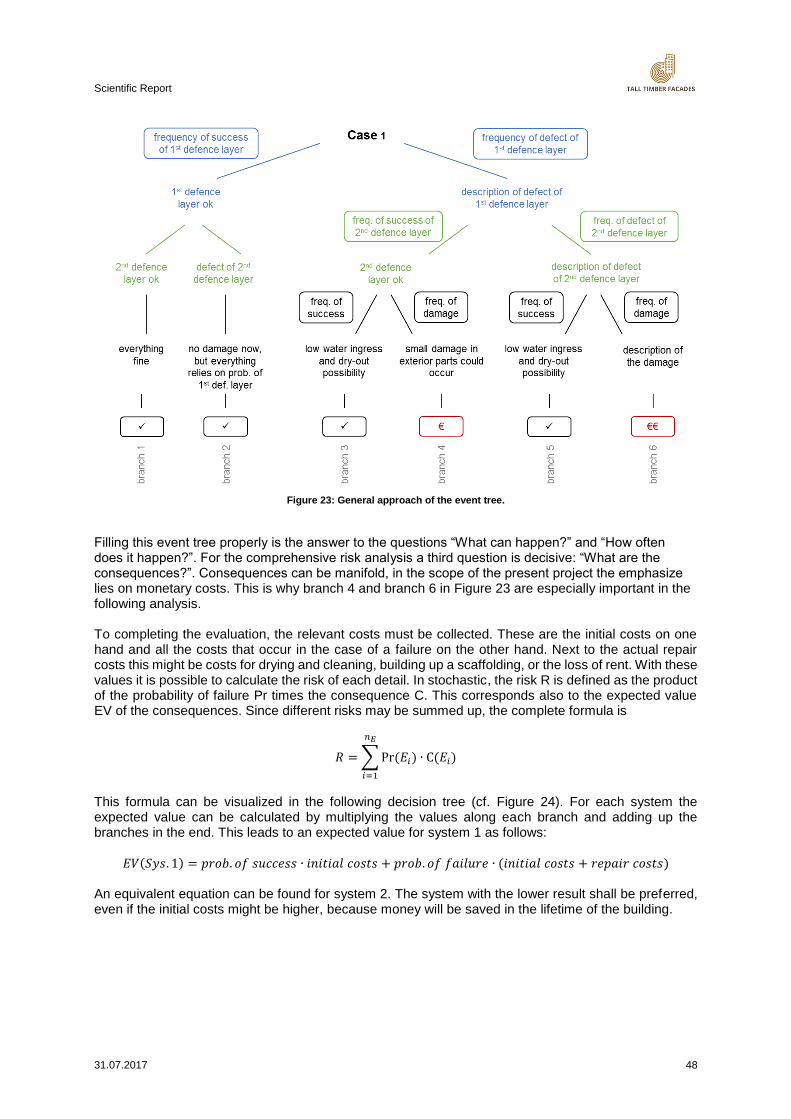
Scientific Report
31.07.2017 48
Figure 23: General approach of the event tree.
Filling this event tree properly is the answer to the questions “What can happen?” and “How often does it happen?”. For the comprehensive risk analysis a third question is decisive: “What are the consequences?”. Consequences can be manifold, in the scope of the present project the emphasize lies on monetary costs. This is why branch 4 and branch 6 in Figure 23 are especially important in the following analysis. To completing the evaluation, the relevant costs must be collected. These are the initial costs on one hand and all the costs that occur in the case of a failure on the other hand. Next to the actual repair costs this might be costs for drying and cleaning, building up a scaffolding, or the loss of rent. With these values it is possible to calculate the risk of each detail. In stochastic, the risk R is defined as the product of the probability of failure Pr times the consequence C. This corresponds also to the expected value EV of the consequences. Since different risks may be summed up, the complete formula is
𝑅 = ∑ Pr (𝐸𝑖) ∙ C(𝐸𝑖)
𝑛𝐸
𝑖=1
This formula can be visualized in the following decision tree (cf. Figure 24). For each system the expected value can be calculated by multiplying the values along each branch and adding up the branches in the end. This leads to an expected value for system 1 as follows:
𝐸𝑉(𝑆𝑦𝑠. 1) = 𝑝𝑟𝑜𝑏. 𝑜𝑓 𝑠𝑢𝑐𝑐𝑒𝑠𝑠 ∙ 𝑖𝑛𝑖𝑡𝑖𝑎𝑙 𝑐𝑜𝑠𝑡𝑠 + 𝑝𝑟𝑜𝑏. 𝑜𝑓 𝑓𝑎𝑖𝑙𝑢𝑟𝑒 ∙ (𝑖𝑛𝑖𝑡𝑖𝑎𝑙 𝑐𝑜𝑠𝑡𝑠 + 𝑟𝑒𝑝𝑎𝑖𝑟 𝑐𝑜𝑠𝑡𝑠) An equivalent equation can be found for system 2. The system with the lower result shall be preferred, even if the initial costs might be higher, because money will be saved in the lifetime of the building.
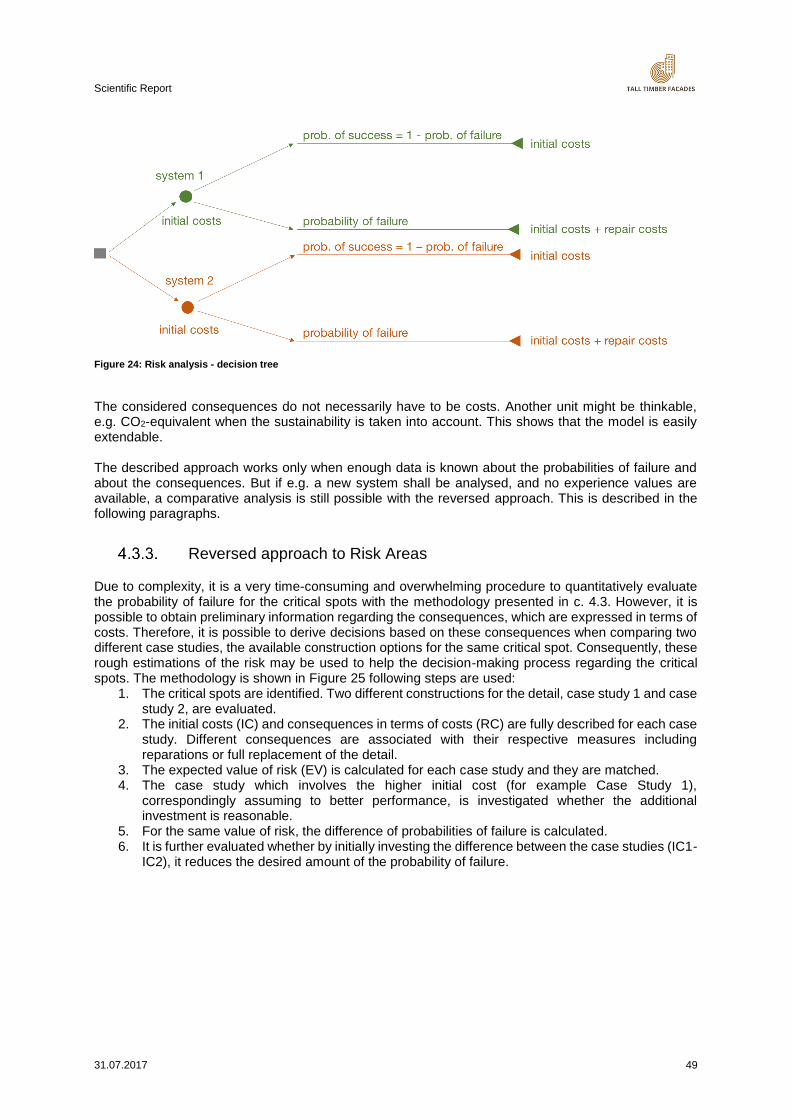
Scientific Report
31.07.2017 49
Figure 24: Risk analysis - decision tree
The considered consequences do not necessarily have to be costs. Another unit might be thinkable, e.g. CO2-equivalent when the sustainability is taken into account. This shows that the model is easily extendable. The described approach works only when enough data is known about the probabilities of failure and about the consequences. But if e.g. a new system shall be analysed, and no experience values are available, a comparative analysis is still possible with the reversed approach. This is described in the following paragraphs.
Reversed approach to Risk Areas
Due to complexity, it is a very time-consuming and overwhelming procedure to quantitatively evaluate the probability of failure for the critical spots with the methodology presented in c. 4.3. However, it is possible to obtain preliminary information regarding the consequences, which are expressed in terms of costs. Therefore, it is possible to derive decisions based on these consequences when comparing two different case studies, the available construction options for the same critical spot. Consequently, these rough estimations of the risk may be used to help the decision-making process regarding the critical spots. The methodology is shown in Figure 25 following steps are used:
1. The critical spots are identified. Two different constructions for the detail, case study 1 and case study 2, are evaluated.
2. The initial costs (IC) and consequences in terms of costs (RC) are fully described for each case study. Different consequences are associated with their respective measures including reparations or full replacement of the detail.
3. The expected value of risk (EV) is calculated for each case study and they are matched. 4. The case study which involves the higher initial cost (for example Case Study 1),
correspondingly assuming to better performance, is investigated whether the additional investment is reasonable.
5. For the same value of risk, the difference of probabilities of failure is calculated. 6. It is further evaluated whether by initially investing the difference between the case studies (IC1-
IC2), it reduces the desired amount of the probability of failure.
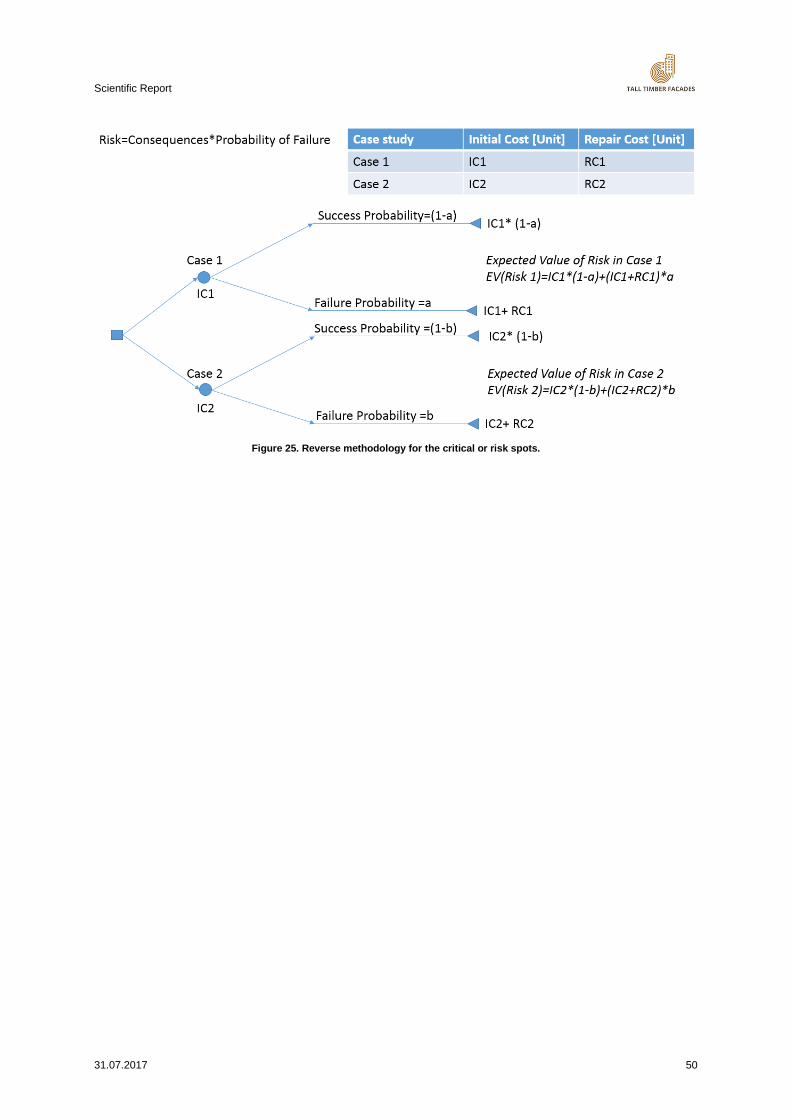
Scientific Report
31.07.2017 50
Figure 25. Reverse methodology for the critical or risk spots.
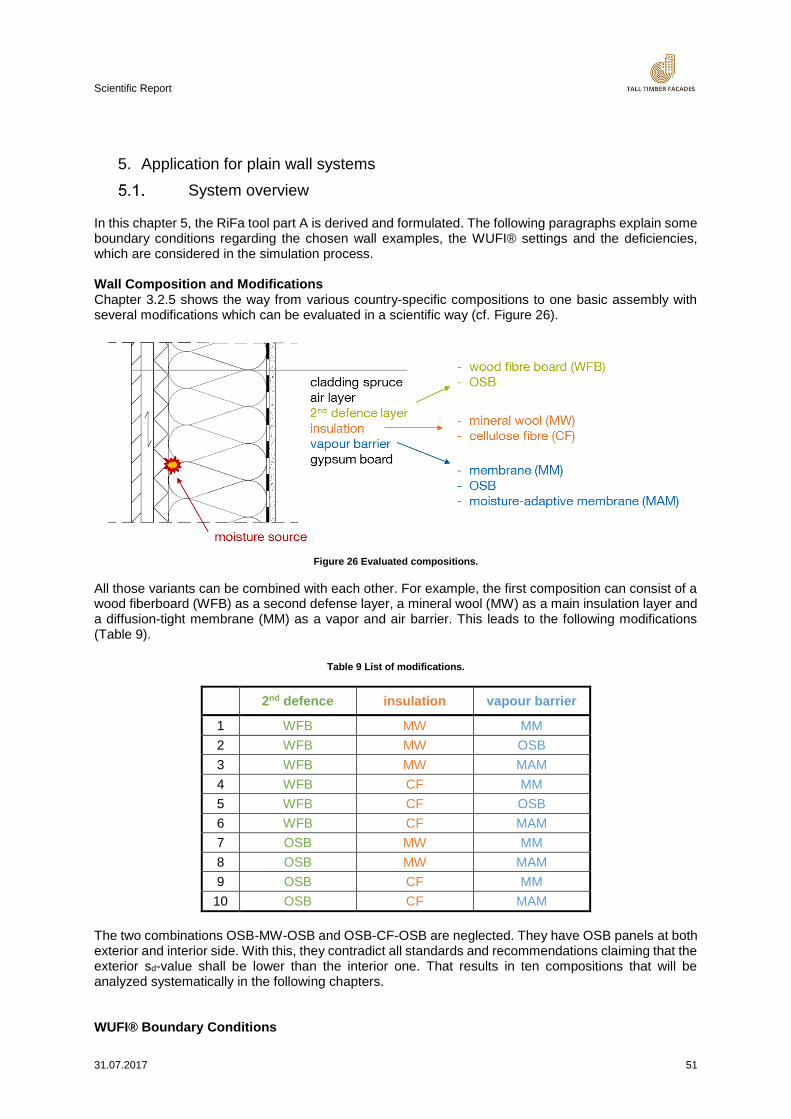
Scientific Report
31.07.2017 51
5. Application for plain wall systems
System overview
In this chapter 5, the RiFa tool part A is derived and formulated. The following paragraphs explain some boundary conditions regarding the chosen wall examples, the WUFI® settings and the deficiencies, which are considered in the simulation process. Wall Composition and Modifications Chapter 3.2.5 shows the way from various country-specific compositions to one basic assembly with several modifications which can be evaluated in a scientific way (cf. Figure 26).
Figure 26 Evaluated compositions.
All those variants can be combined with each other. For example, the first composition can consist of a wood fiberboard (WFB) as a second defense layer, a mineral wool (MW) as a main insulation layer and a diffusion-tight membrane (MM) as a vapor and air barrier. This leads to the following modifications (Table 9).
Table 9 List of modifications.
2nd defence insulation vapour barrier
1 WFB MW MM
2 WFB MW OSB
3 WFB MW MAM
4 WFB CF MM
5 WFB CF OSB
6 WFB CF MAM
7 OSB MW MM
8 OSB MW MAM
9 OSB CF MM
10 OSB CF MAM
The two combinations OSB-MW-OSB and OSB-CF-OSB are neglected. They have OSB panels at both exterior and interior side. With this, they contradict all standards and recommendations claiming that the exterior sd-value shall be lower than the interior one. That results in ten compositions that will be analyzed systematically in the following chapters. WUFI® Boundary Conditions
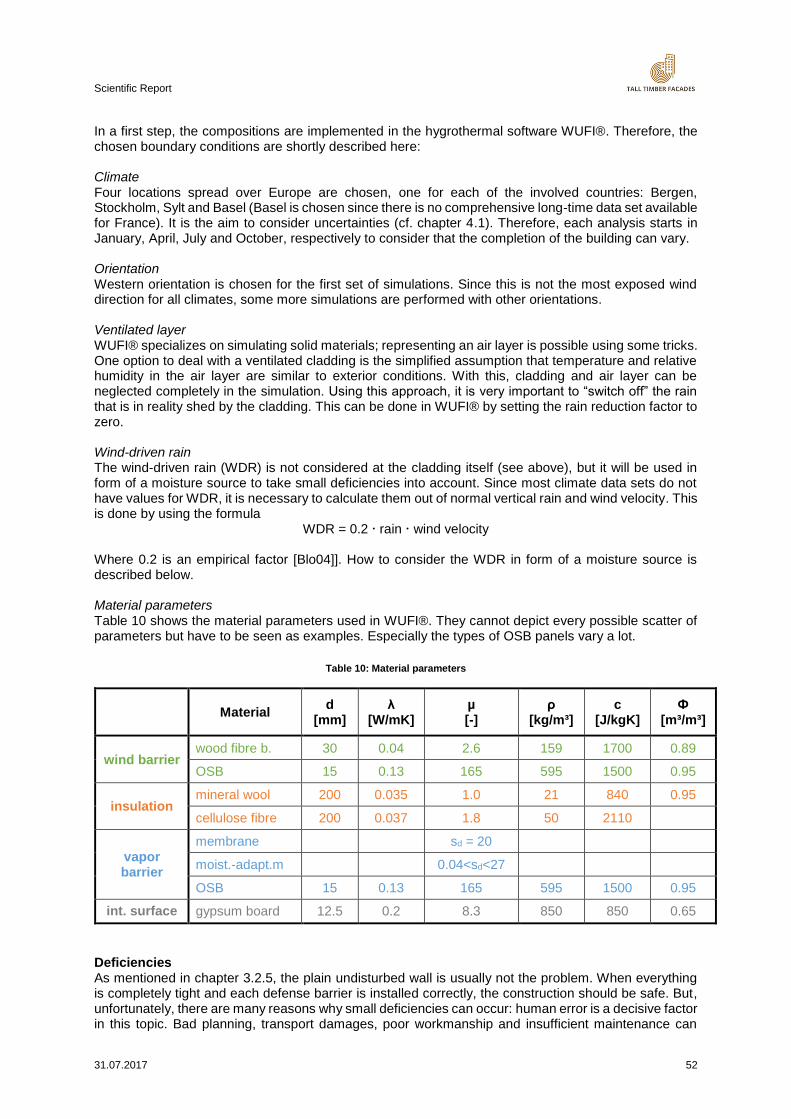
Scientific Report
31.07.2017 52
In a first step, the compositions are implemented in the hygrothermal software WUFI®. Therefore, the chosen boundary conditions are shortly described here: Climate Four locations spread over Europe are chosen, one for each of the involved countries: Bergen, Stockholm, Sylt and Basel (Basel is chosen since there is no comprehensive long-time data set available for France). It is the aim to consider uncertainties (cf. chapter 4.1). Therefore, each analysis starts in January, April, July and October, respectively to consider that the completion of the building can vary. Orientation Western orientation is chosen for the first set of simulations. Since this is not the most exposed wind direction for all climates, some more simulations are performed with other orientations. Ventilated layer WUFI® specializes on simulating solid materials; representing an air layer is possible using some tricks. One option to deal with a ventilated cladding is the simplified assumption that temperature and relative humidity in the air layer are similar to exterior conditions. With this, cladding and air layer can be neglected completely in the simulation. Using this approach, it is very important to “switch off” the rain that is in reality shed by the cladding. This can be done in WUFI® by setting the rain reduction factor to zero. Wind-driven rain The wind-driven rain (WDR) is not considered at the cladding itself (see above), but it will be used in form of a moisture source to take small deficiencies into account. Since most climate data sets do not have values for WDR, it is necessary to calculate them out of normal vertical rain and wind velocity. This is done by using the formula
WDR = 0.2 rain wind velocity
Where 0.2 is an empirical factor [Blo04]]. How to consider the WDR in form of a moisture source is described below. Material parameters Table 10 shows the material parameters used in WUFI®. They cannot depict every possible scatter of parameters but have to be seen as examples. Especially the types of OSB panels vary a lot.
Table 10: Material parameters
Material d
[mm] λ
[W/mK] µ [-]
ρ [kg/m³]
c [J/kgK]
Ф [m³/m³]
wind barrier wood fibre b. 30 0.04 2.6 159 1700 0.89
OSB 15 0.13 165 595 1500 0.95
insulation mineral wool 200 0.035 1.0 21 840 0.95
cellulose fibre 200 0.037 1.8 50 2110
vapor barrier
membrane sd = 20
moist.-adapt.m 0.04<sd<27
OSB 15 0.13 165 595 1500 0.95
int. surface gypsum board 12.5 0.2 8.3 850 850 0.65
Deficiencies As mentioned in chapter 3.2.5, the plain undisturbed wall is usually not the problem. When everything is completely tight and each defense barrier is installed correctly, the construction should be safe. But, unfortunately, there are many reasons why small deficiencies can occur: human error is a decisive factor in this topic. Bad planning, transport damages, poor workmanship and insufficient maintenance can
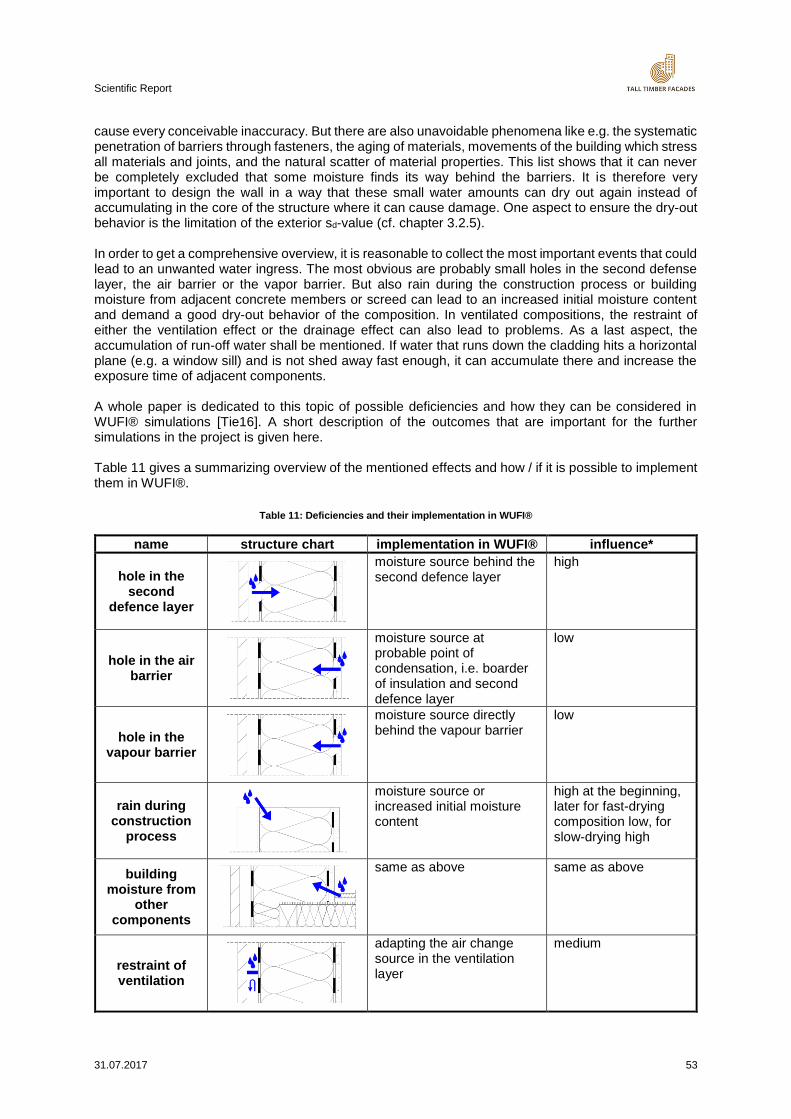
Scientific Report
31.07.2017 53
cause every conceivable inaccuracy. But there are also unavoidable phenomena like e.g. the systematic penetration of barriers through fasteners, the aging of materials, movements of the building which stress all materials and joints, and the natural scatter of material properties. This list shows that it can never be completely excluded that some moisture finds its way behind the barriers. It is therefore very important to design the wall in a way that these small water amounts can dry out again instead of accumulating in the core of the structure where it can cause damage. One aspect to ensure the dry-out behavior is the limitation of the exterior sd-value (cf. chapter 3.2.5). In order to get a comprehensive overview, it is reasonable to collect the most important events that could lead to an unwanted water ingress. The most obvious are probably small holes in the second defense layer, the air barrier or the vapor barrier. But also rain during the construction process or building moisture from adjacent concrete members or screed can lead to an increased initial moisture content and demand a good dry-out behavior of the composition. In ventilated compositions, the restraint of either the ventilation effect or the drainage effect can also lead to problems. As a last aspect, the accumulation of run-off water shall be mentioned. If water that runs down the cladding hits a horizontal plane (e.g. a window sill) and is not shed away fast enough, it can accumulate there and increase the exposure time of adjacent components. A whole paper is dedicated to this topic of possible deficiencies and how they can be considered in WUFI® simulations [Tie16]. A short description of the outcomes that are important for the further simulations in the project is given here. Table 11 gives a summarizing overview of the mentioned effects and how / if it is possible to implement them in WUFI®.
Table 11: Deficiencies and their implementation in WUFI®
name structure chart implementation in WUFI® influence*
hole in the second
defence layer
moisture source behind the second defence layer
high
hole in the air barrier
moisture source at probable point of condensation, i.e. boarder of insulation and second defence layer
low
hole in the vapour barrier
moisture source directly behind the vapour barrier
low
rain during construction
process
moisture source or increased initial moisture content
high at the beginning, later for fast-drying composition low, for slow-drying high
building moisture from
other components
same as above same as above
restraint of ventilation
adapting the air change source in the ventilation layer
medium
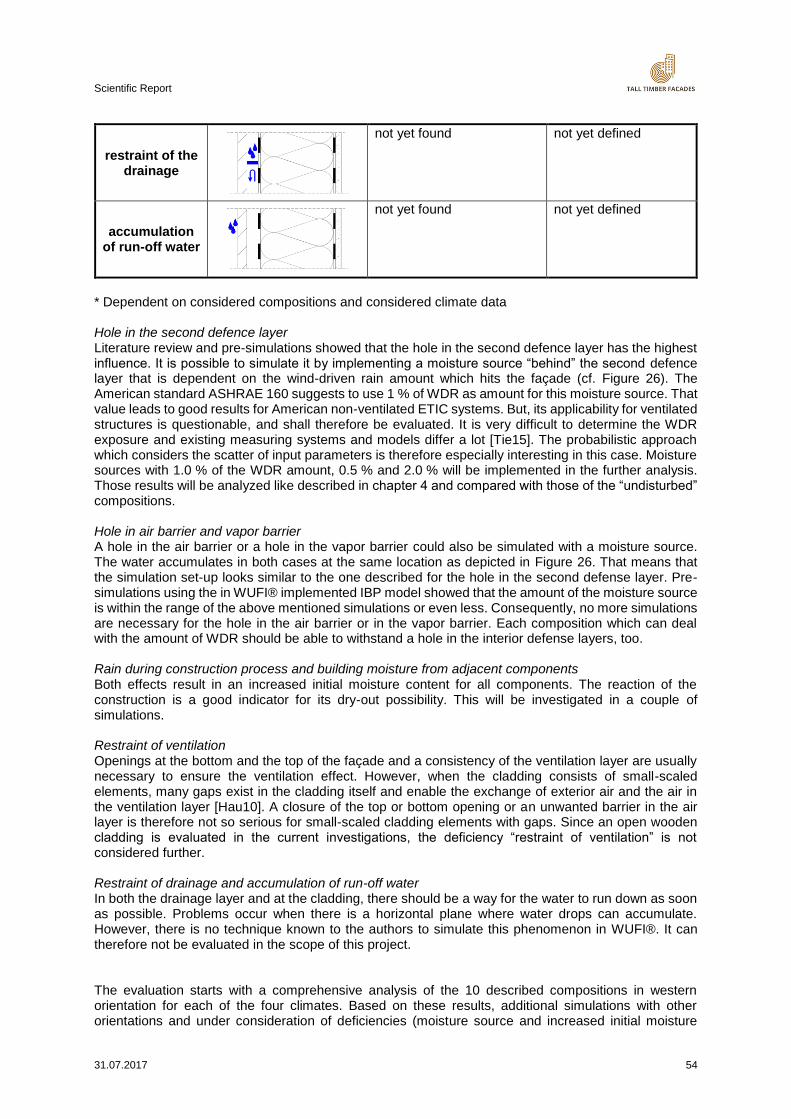
Scientific Report
31.07.2017 54
restraint of the drainage
not yet found not yet defined
accumulation of run-off water
not yet found not yet defined
* Dependent on considered compositions and considered climate data Hole in the second defence layer Literature review and pre-simulations showed that the hole in the second defence layer has the highest influence. It is possible to simulate it by implementing a moisture source “behind” the second defence layer that is dependent on the wind-driven rain amount which hits the façade (cf. Figure 26). The American standard ASHRAE 160 suggests to use 1 % of WDR as amount for this moisture source. That value leads to good results for American non-ventilated ETIC systems. But, its applicability for ventilated structures is questionable, and shall therefore be evaluated. It is very difficult to determine the WDR exposure and existing measuring systems and models differ a lot [Tie15]. The probabilistic approach which considers the scatter of input parameters is therefore especially interesting in this case. Moisture sources with 1.0 % of the WDR amount, 0.5 % and 2.0 % will be implemented in the further analysis. Those results will be analyzed like described in chapter 4 and compared with those of the “undisturbed” compositions. Hole in air barrier and vapor barrier A hole in the air barrier or a hole in the vapor barrier could also be simulated with a moisture source. The water accumulates in both cases at the same location as depicted in Figure 26. That means that the simulation set-up looks similar to the one described for the hole in the second defense layer. Pre-simulations using the in WUFI® implemented IBP model showed that the amount of the moisture source is within the range of the above mentioned simulations or even less. Consequently, no more simulations are necessary for the hole in the air barrier or in the vapor barrier. Each composition which can deal with the amount of WDR should be able to withstand a hole in the interior defense layers, too. Rain during construction process and building moisture from adjacent components Both effects result in an increased initial moisture content for all components. The reaction of the construction is a good indicator for its dry-out possibility. This will be investigated in a couple of simulations. Restraint of ventilation Openings at the bottom and the top of the façade and a consistency of the ventilation layer are usually necessary to ensure the ventilation effect. However, when the cladding consists of small-scaled elements, many gaps exist in the cladding itself and enable the exchange of exterior air and the air in the ventilation layer [Hau10]. A closure of the top or bottom opening or an unwanted barrier in the air layer is therefore not so serious for small-scaled cladding elements with gaps. Since an open wooden cladding is evaluated in the current investigations, the deficiency “restraint of ventilation” is not considered further. Restraint of drainage and accumulation of run-off water In both the drainage layer and at the cladding, there should be a way for the water to run down as soon as possible. Problems occur when there is a horizontal plane where water drops can accumulate. However, there is no technique known to the authors to simulate this phenomenon in WUFI®. It can therefore not be evaluated in the scope of this project. The evaluation starts with a comprehensive analysis of the 10 described compositions in western orientation for each of the four climates. Based on these results, additional simulations with other orientations and under consideration of deficiencies (moisture source and increased initial moisture
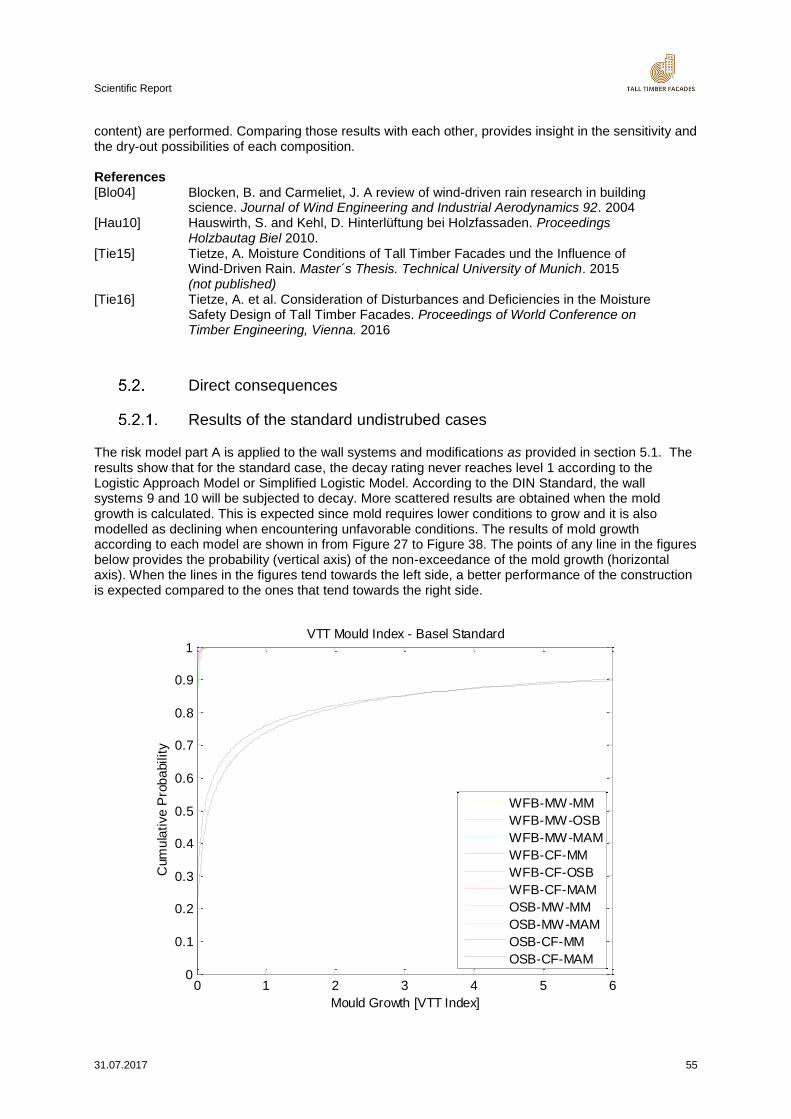
Scientific Report
31.07.2017 55
content) are performed. Comparing those results with each other, provides insight in the sensitivity and the dry-out possibilities of each composition. References [Blo04] Blocken, B. and Carmeliet, J. A review of wind-driven rain research in building science. Journal of Wind Engineering and Industrial Aerodynamics 92. 2004 [Hau10] Hauswirth, S. and Kehl, D. Hinterlüftung bei Holzfassaden. Proceedings Holzbautag Biel 2010. [Tie15] Tietze, A. Moisture Conditions of Tall Timber Facades und the Influence of Wind-Driven Rain. Master´s Thesis. Technical University of Munich. 2015 (not published) [Tie16] Tietze, A. et al. Consideration of Disturbances and Deficiencies in the Moisture Safety Design of Tall Timber Facades. Proceedings of World Conference on Timber Engineering, Vienna. 2016
Direct consequences
Results of the standard undistrubed cases
The risk model part A is applied to the wall systems and modifications as provided in section 5.1. The results show that for the standard case, the decay rating never reaches level 1 according to the Logistic Approach Model or Simplified Logistic Model. According to the DIN Standard, the wall systems 9 and 10 will be subjected to decay. More scattered results are obtained when the mold growth is calculated. This is expected since mold requires lower conditions to grow and it is also modelled as declining when encountering unfavorable conditions. The results of mold growth according to each model are shown in from Figure 27 to Figure 38. The points of any line in the figures below provides the probability (vertical axis) of the non-exceedance of the mold growth (horizontal axis). When the lines in the figures tend towards the left side, a better performance of the construction is expected compared to the ones that tend towards the right side.
0 1 2 3 4 5 60
0.1
0.2
0.3
0.4
0.5
0.6
0.7
0.8
0.9
1
Mould Growth [VTT Index]
Cum
ula
tive P
rob
abilit
y
VTT Mould Index - Basel Standard
WFB-MW-MM
WFB-MW-OSB
WFB-MW-MAM
WFB-CF-MM
WFB-CF-OSB
WFB-CF-MAM
OSB-MW-MM
OSB-MW-MAM
OSB-CF-MM
OSB-CF-MAM
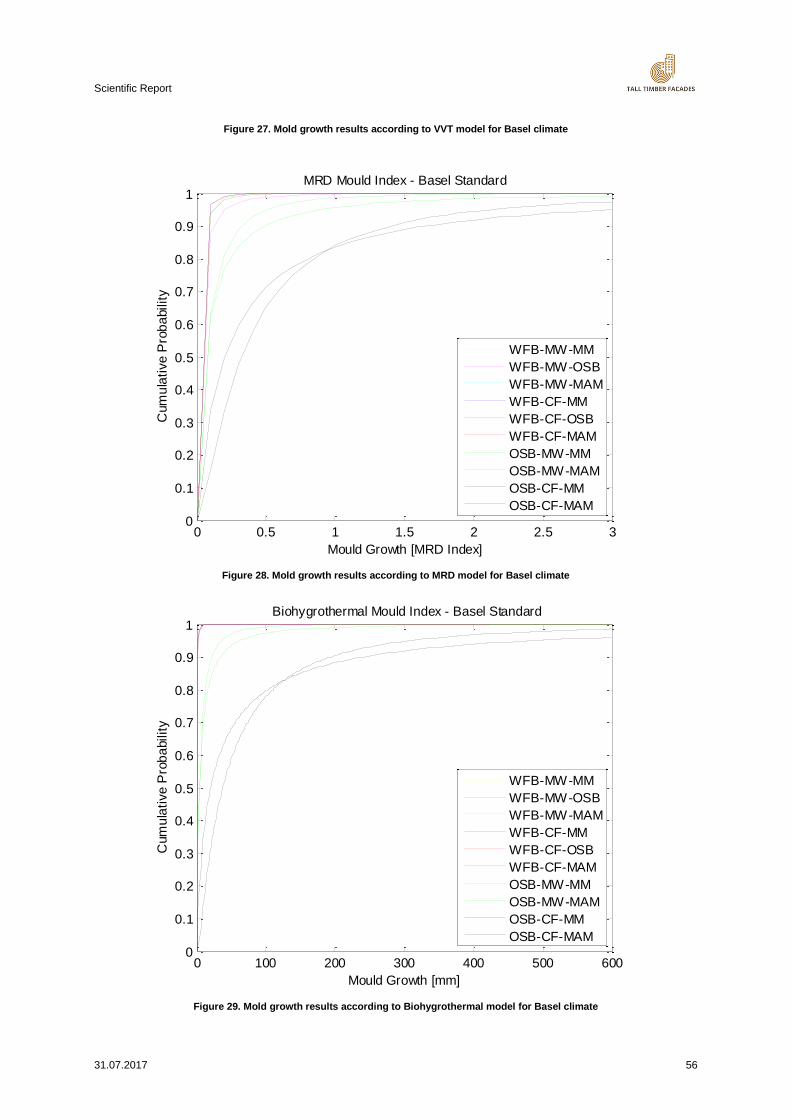
Scientific Report
31.07.2017 56
Figure 27. Mold growth results according to VVT model for Basel climate
Figure 28. Mold growth results according to MRD model for Basel climate
Figure 29. Mold growth results according to Biohygrothermal model for Basel climate
0 0.5 1 1.5 2 2.5 30
0.1
0.2
0.3
0.4
0.5
0.6
0.7
0.8
0.9
1
Mould Growth [MRD Index]
Cum
ula
tive P
rob
abilit
y
MRD Mould Index - Basel Standard
WFB-MW-MM
WFB-MW-OSB
WFB-MW-MAM
WFB-CF-MM
WFB-CF-OSB
WFB-CF-MAM
OSB-MW-MM
OSB-MW-MAM
OSB-CF-MM
OSB-CF-MAM
0 100 200 300 400 500 6000
0.1
0.2
0.3
0.4
0.5
0.6
0.7
0.8
0.9
1
Mould Growth [mm]
Cum
ula
tive P
rob
abilit
y
Biohygrothermal Mould Index - Basel Standard
WFB-MW-MM
WFB-MW-OSB
WFB-MW-MAM
WFB-CF-MM
WFB-CF-OSB
WFB-CF-MAM
OSB-MW-MM
OSB-MW-MAM
OSB-CF-MM
OSB-CF-MAM
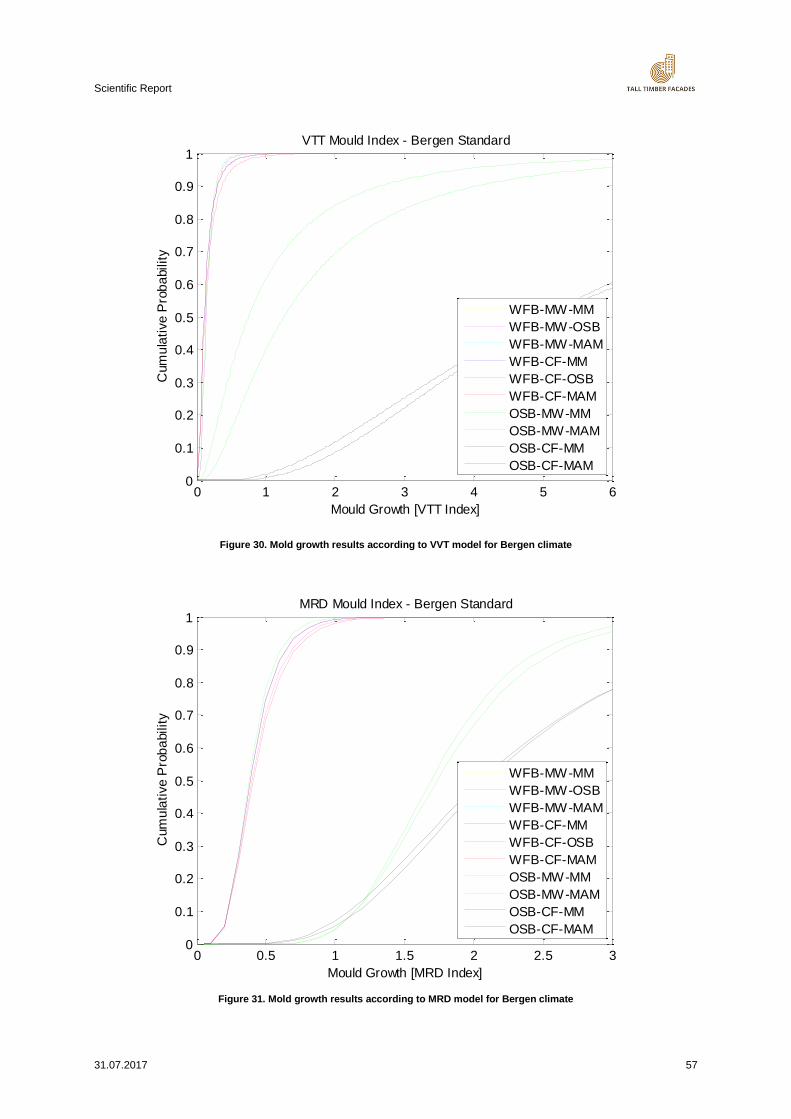
Scientific Report
31.07.2017 57
Figure 30. Mold growth results according to VVT model for Bergen climate
Figure 31. Mold growth results according to MRD model for Bergen climate
0 1 2 3 4 5 60
0.1
0.2
0.3
0.4
0.5
0.6
0.7
0.8
0.9
1
Mould Growth [VTT Index]
Cum
ula
tive P
rob
abilit
y
VTT Mould Index - Bergen Standard
WFB-MW-MM
WFB-MW-OSB
WFB-MW-MAM
WFB-CF-MM
WFB-CF-OSB
WFB-CF-MAM
OSB-MW-MM
OSB-MW-MAM
OSB-CF-MM
OSB-CF-MAM
0 0.5 1 1.5 2 2.5 30
0.1
0.2
0.3
0.4
0.5
0.6
0.7
0.8
0.9
1
Mould Growth [MRD Index]
Cum
ula
tive P
rob
abilit
y
MRD Mould Index - Bergen Standard
WFB-MW-MM
WFB-MW-OSB
WFB-MW-MAM
WFB-CF-MM
WFB-CF-OSB
WFB-CF-MAM
OSB-MW-MM
OSB-MW-MAM
OSB-CF-MM
OSB-CF-MAM
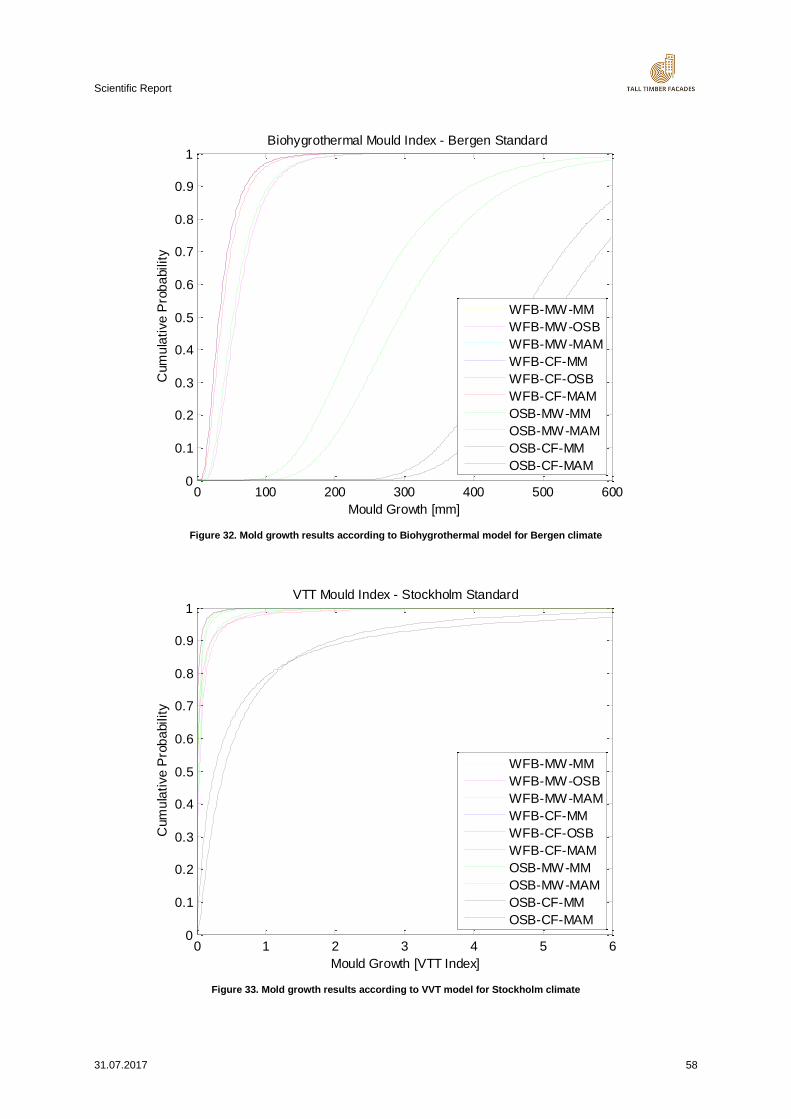
Scientific Report
31.07.2017 58
Figure 32. Mold growth results according to Biohygrothermal model for Bergen climate
Figure 33. Mold growth results according to VVT model for Stockholm climate
0 100 200 300 400 500 6000
0.1
0.2
0.3
0.4
0.5
0.6
0.7
0.8
0.9
1
Mould Growth [mm]
Cum
ula
tive P
rob
abilit
y
Biohygrothermal Mould Index - Bergen Standard
WFB-MW-MM
WFB-MW-OSB
WFB-MW-MAM
WFB-CF-MM
WFB-CF-OSB
WFB-CF-MAM
OSB-MW-MM
OSB-MW-MAM
OSB-CF-MM
OSB-CF-MAM
0 1 2 3 4 5 60
0.1
0.2
0.3
0.4
0.5
0.6
0.7
0.8
0.9
1
Mould Growth [VTT Index]
Cum
ula
tive P
rob
abilit
y
VTT Mould Index - Stockholm Standard
WFB-MW-MM
WFB-MW-OSB
WFB-MW-MAM
WFB-CF-MM
WFB-CF-OSB
WFB-CF-MAM
OSB-MW-MM
OSB-MW-MAM
OSB-CF-MM
OSB-CF-MAM
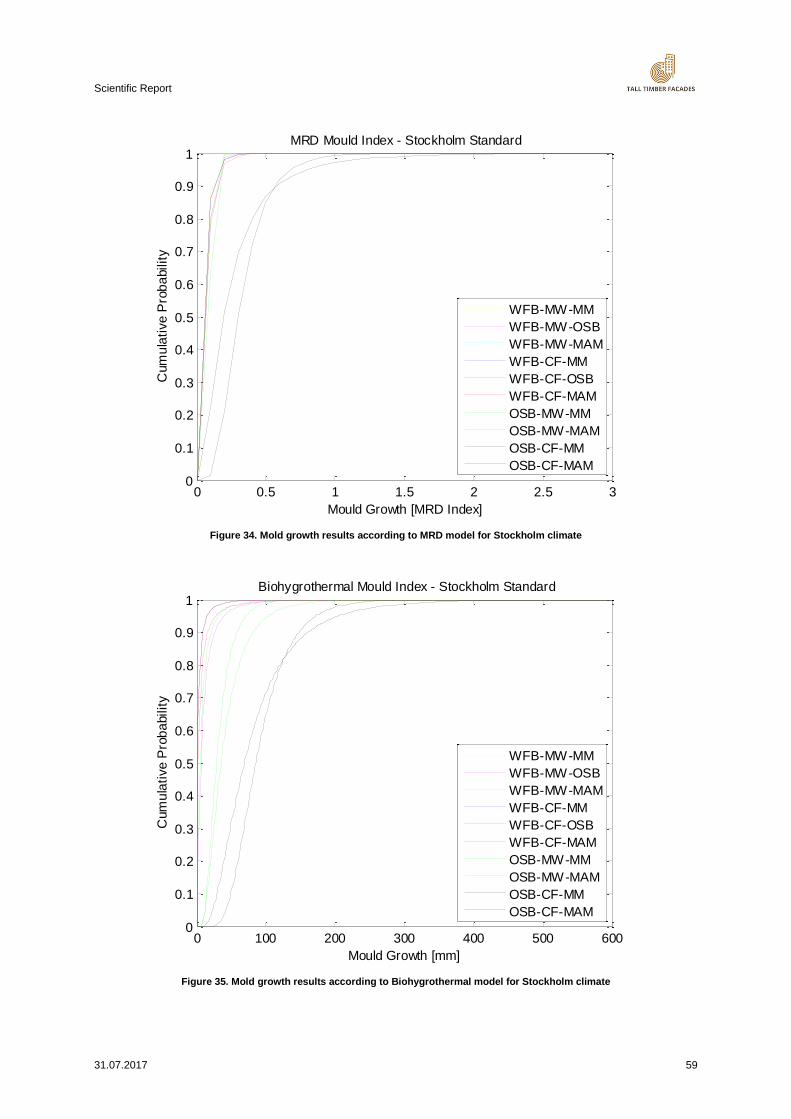
Scientific Report
31.07.2017 59
Figure 34. Mold growth results according to MRD model for Stockholm climate
Figure 35. Mold growth results according to Biohygrothermal model for Stockholm climate
0 0.5 1 1.5 2 2.5 30
0.1
0.2
0.3
0.4
0.5
0.6
0.7
0.8
0.9
1
Mould Growth [MRD Index]
Cum
ula
tive P
rob
abilit
y
MRD Mould Index - Stockholm Standard
WFB-MW-MM
WFB-MW-OSB
WFB-MW-MAM
WFB-CF-MM
WFB-CF-OSB
WFB-CF-MAM
OSB-MW-MM
OSB-MW-MAM
OSB-CF-MM
OSB-CF-MAM
0 100 200 300 400 500 6000
0.1
0.2
0.3
0.4
0.5
0.6
0.7
0.8
0.9
1
Mould Growth [mm]
Cum
ula
tive P
rob
abilit
y
Biohygrothermal Mould Index - Stockholm Standard
WFB-MW-MM
WFB-MW-OSB
WFB-MW-MAM
WFB-CF-MM
WFB-CF-OSB
WFB-CF-MAM
OSB-MW-MM
OSB-MW-MAM
OSB-CF-MM
OSB-CF-MAM
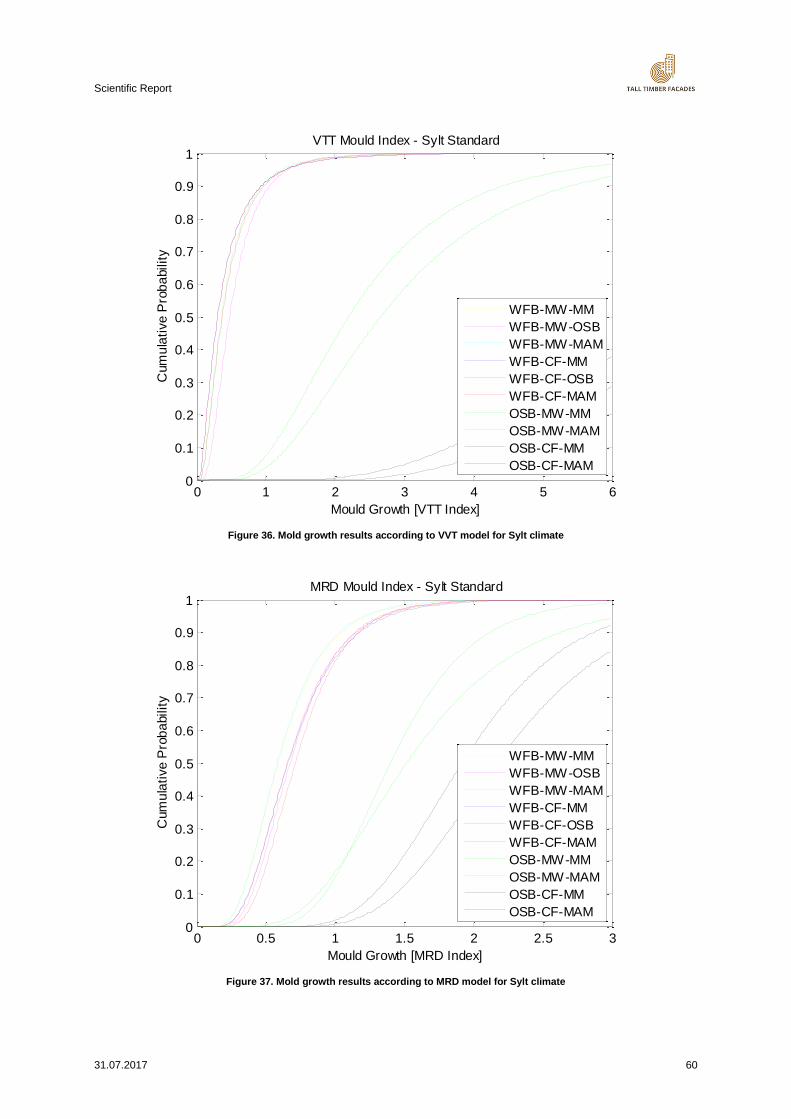
Scientific Report
31.07.2017 60
Figure 36. Mold growth results according to VVT model for Sylt climate
Figure 37. Mold growth results according to MRD model for Sylt climate
0 1 2 3 4 5 60
0.1
0.2
0.3
0.4
0.5
0.6
0.7
0.8
0.9
1
Mould Growth [VTT Index]
Cum
ula
tive P
rob
abilit
y
VTT Mould Index - Sylt Standard
WFB-MW-MM
WFB-MW-OSB
WFB-MW-MAM
WFB-CF-MM
WFB-CF-OSB
WFB-CF-MAM
OSB-MW-MM
OSB-MW-MAM
OSB-CF-MM
OSB-CF-MAM
0 0.5 1 1.5 2 2.5 30
0.1
0.2
0.3
0.4
0.5
0.6
0.7
0.8
0.9
1
Mould Growth [MRD Index]
Cum
ula
tive P
rob
abilit
y
MRD Mould Index - Sylt Standard
WFB-MW-MM
WFB-MW-OSB
WFB-MW-MAM
WFB-CF-MM
WFB-CF-OSB
WFB-CF-MAM
OSB-MW-MM
OSB-MW-MAM
OSB-CF-MM
OSB-CF-MAM
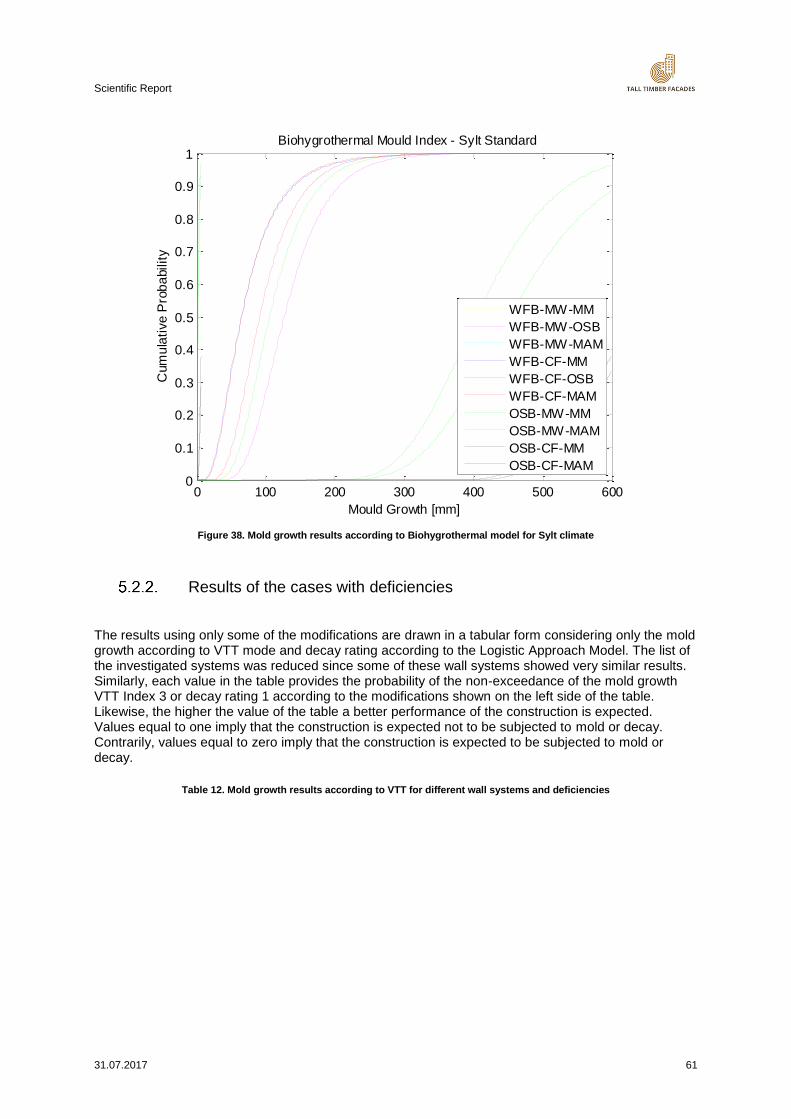
Scientific Report
31.07.2017 61
Figure 38. Mold growth results according to Biohygrothermal model for Sylt climate
Results of the cases with deficiencies
The results using only some of the modifications are drawn in a tabular form considering only the mold growth according to VTT mode and decay rating according to the Logistic Approach Model. The list of the investigated systems was reduced since some of these wall systems showed very similar results. Similarly, each value in the table provides the probability of the non-exceedance of the mold growth VTT Index 3 or decay rating 1 according to the modifications shown on the left side of the table. Likewise, the higher the value of the table a better performance of the construction is expected. Values equal to one imply that the construction is expected not to be subjected to mold or decay. Contrarily, values equal to zero imply that the construction is expected to be subjected to mold or decay.
Table 12. Mold growth results according to VTT for different wall systems and deficiencies
0 100 200 300 400 500 6000
0.1
0.2
0.3
0.4
0.5
0.6
0.7
0.8
0.9
1
Mould Growth [mm]
Cum
ula
tive P
rob
abilit
y
Biohygrothermal Mould Index - Sylt Standard
WFB-MW-MM
WFB-MW-OSB
WFB-MW-MAM
WFB-CF-MM
WFB-CF-OSB
WFB-CF-MAM
OSB-MW-MM
OSB-MW-MAM
OSB-CF-MM
OSB-CF-MAM
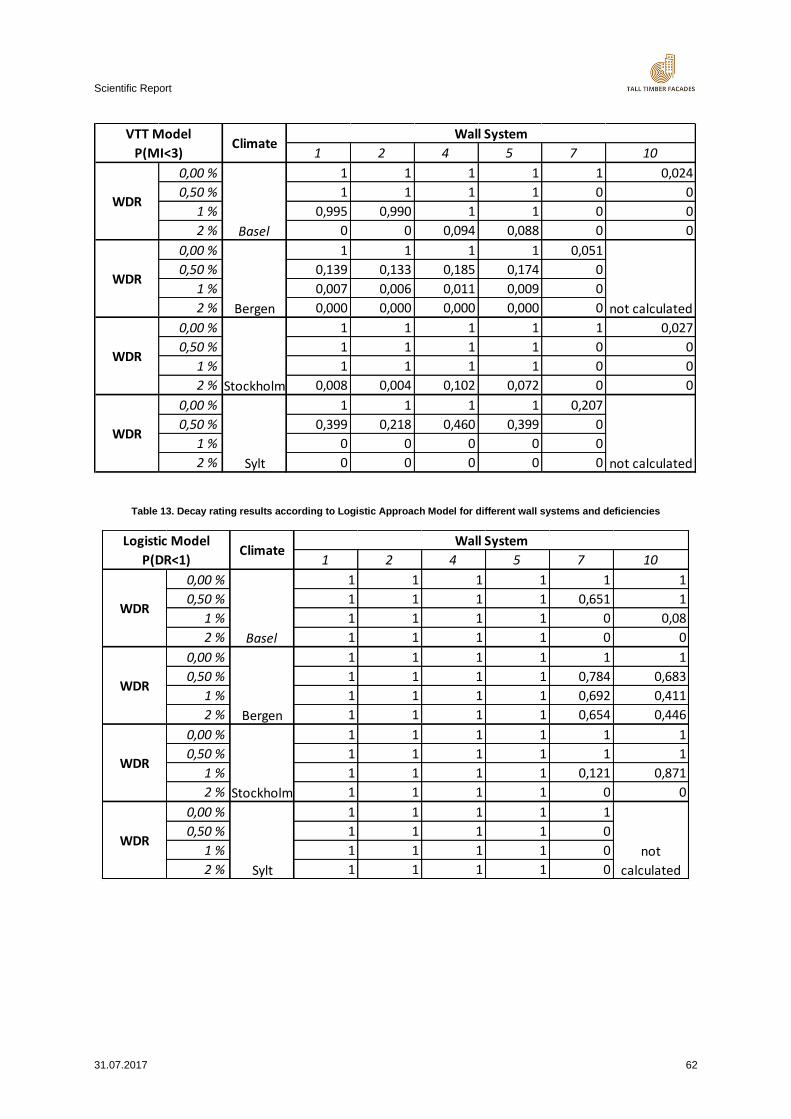
Scientific Report
31.07.2017 62
Table 13. Decay rating results according to Logistic Approach Model for different wall systems and deficiencies
1 2 4 5 7 10
0,00 % 1 1 1 1 1 0,024
0,50 % 1 1 1 1 0 0
1 % 0,995 0,990 1 1 0 0
2 % 0 0 0,094 0,088 0 0
0,00 % 1 1 1 1 0,051
0,50 % 0,139 0,133 0,185 0,174 0
1 % 0,007 0,006 0,011 0,009 0
2 % 0,000 0,000 0,000 0,000 0
0,00 % 1 1 1 1 1 0,027
0,50 % 1 1 1 1 0 0
1 % 1 1 1 1 0 0
2 % 0,008 0,004 0,102 0,072 0 0
0,00 % 1 1 1 1 0,207
0,50 % 0,399 0,218 0,460 0,399 0
1 % 0 0 0 0 0
2 % 0 0 0 0 0 not calculated
not calculated
Climate
WDR
Basel
Bergen
Stockholm
Sylt
WDR
WDR
WDR
VTT Model
P(MI<3)
Wall System
1 2 4 5 7 10
0,00 % 1 1 1 1 1 1
0,50 % 1 1 1 1 0,651 1
1 % 1 1 1 1 0 0,08
2 % 1 1 1 1 0 0
0,00 % 1 1 1 1 1 1
0,50 % 1 1 1 1 0,784 0,683
1 % 1 1 1 1 0,692 0,411
2 % 1 1 1 1 0,654 0,446
0,00 % 1 1 1 1 1 1
0,50 % 1 1 1 1 1 1
1 % 1 1 1 1 0,121 0,871
2 % 1 1 1 1 0 0
0,00 % 1 1 1 1 1
0,50 % 1 1 1 1 0
1 % 1 1 1 1 0
2 % 1 1 1 1 0
WDR
Stockholm
WDR
Sylt
not
calculated
Logistic Model
P(DR<1)Climate
Wall System
WDR
Basel
WDR
Bergen
Scientific Report
31.07.2017 63
Indirect consequences
Parametric LCA
The increased use of multi-storey timber buildings can potentially create a significant reduction to the life cycle environmental impact of a building. However, with the increasing height of timber buildings the challenge is to provide dry conditions throughout the expected lifetime of the building. Tall buildings are particularly exposed to high wind pressures combined with driving rain. Additionally, tall buildings require longer times of construction in which the structural elements are especially exposed to moisture. Furthermore, inspection, maintenance and repair possibilities are limited compared to low-rise buildings. In this work, a parametric life cycle assessment methodology was developed to evaluate the consequences (the risk on the greenhouse gas emissions) of a potential moisture damage that cause a failure event (considered as the mold growth) in typical ventilated timber wall constructions from four countries: Germany (DE), France (FR), Norway (NO) and Sweden (SE). The environmental performance was evaluated throughout the life cycle of the wall construction according to EN 15978, with global warming potential (GWP) as a proxy indicator for environmental impact. The emissions are measured in terms of GWP (kgCO2eq/m2/yr), and are calculated according to the IPCC GWP 100-year method. Three parameters; i) number of windows, ii) extent of damaged around the window area, and iii) the number of damaged layers; were used to evaluate the potential risk of CO2eq emission from moisture damage around window connections. A probabilistic-based design methodology was also applied for further analyze the probability of a failure, which is considered as mold occurrence. The total CO2eq emissions results from different scenarios considered in this study and the magnitude of environmental impact related to probabilistic damage are presented. The results revealed that utilizing the parametric LCA analysis has a substantial potential for evaluating the effect of moisture on the embodied emission arising from wall components and performing a comparative assessment for different solutions. Performing parametric LCA analysis at early design phase helps to consider alternative design and construction approaches for timber wall construction that can be used in tall buildings and minimize the potential risks from moisture damage and the associated embodied emission. In the future, this parametric analysis tool can be used for evaluating building envelope schemes and setting moisture performance goals and measures in tall buildings. The results also show that the parametric results are sensitive to the variables used to estimate the area of replacement, the number of windows, the number of damaged layers, and the considered failure event. In further studies, the assumptions used for developing the parameters can be further modified using the actual data. A fully detailed description of the study can be found in [1]. References [1] Fufa, Skaar, Gradeci, Labonnote, Time, Köhler. Parametric LCA of a ventilated timber wall
construction in tall timber buildings, in Proceedings of the 14th International Conference on Durability of Building Materials and Components, Ghent, Belgium, 29-31 May 2017.
Monetary consequences
Case 1: Use of scaffolding (outdoor) The first scenario is for exterior repair work with a scaffolding and an optional mobile crane. It comprises additional repair appliances which are not necessarily used for single familiy or small scale houses. In the following two variations repair scenarios in different height of buildings are calculated. The repair scenario is for a facade area of about 24 m² with three windows included on an exposed facade according to the examplary facade set up.
Position Description Cost Unit
Fences and signs 10 meter + 5 signs 710.00 €/month
elevator, allocation 200 kg load with persons 700.00 €
elevator, usage
650.00 €/week
Mobile crane (optional) 160.00 €/hour
Scientific Report
31.07.2017 64
Facade scaffolding allocation
0,9 m width, no roof 7.00 €/m²
Facade scaffolding usage 0.40 €/m² week
Facade scaffolding foil For weather protection 6.00 €/m²
Waste container 7 m³ volume, incl. transport 650.00 €/piece
Waste disposal Mixed construction waste, landfill
110.00 €/m³
Table 14 Cost data for supplementary appliances of a facade repair from the exterior side
Variation A (medium size building up to 5 storey high or below 15 m) repair needs approximately 2 weeks.
Fences and signs are needed for double the length.
Facade scaffolding area is: 12 m x 15 m = 180 m²
Elevator is used two weeks
Transport can be handeled with the elevator and does not need a mobile crane. Variation B (large size building up to 8 storey high or below 24 m):
Fences and signs are needed for triple the length (secure mobile crane)
Facade scaffolding area is: 12 m x 24 m = 288 m²
Elevator is used two weeks
Mobile crane is used 2 days: 2 x 8 h = 16 h Case 2: Lifter (instead of scaffolding) In case 2 an autonomous, mobile lifter is assumed instead of a scaffolding.
Position Description Cost Unit
Lifter autonomous, 15 m height, 250 kg load capacity
200.00 €/day
Table 15 Cost data for supplementary appliances with alternative equipment
Case 3: Use of drying maching (indoor) The second scenario describes an interior repair work where the facade is opened from the inside and the areas with excessive moisture are cleaned and dried with a drying machine. This kind of repair scenario can also take part in single familiy or small scale houses. In the following two variations repair scenarios in different height of buildings are calculated.
Position Description Cost Unit
Floor protection Particle boards 43.00 €/m²
Dryer machine 220.00 €/piece
Protection wall Foil 28.00 €/m²
Dust cover Foil 11.00 €/m²
Waste container 7 m³ volume, incl. transport 650.00 €/piece
Waste disposal Mixed construction waste, landfill
110.00 €/m³
Table 16 Cost data for supplementary appliances of a facade repair from the interior side
Conclusions
Based on the results we can conclude:
The outcome according to biohygrothermal model provides the largest mold growth, while the MRD the smallest. This is expected since the biohygrothermal model considers the mold growth as non-declining when encountering unfavourable conditions.
Wall system with a wood fibre board as a wind barrier provide more robust solutions compared to those that use an OSB as wind barrier. Wall systems using an OSB as wind barrier show a high degree of the decay rating. Wall systems using a wood fibre board as a wind barrier do not show problems regarding the decay rating.
Scientific Report
31.07.2017 65
The choice between the membrane or the OSB as vapour barrier does not seem to affect the outcome.
Results show that wall systems with a cellulose fibre are more robust compared to those with mineral wool.
The moisture source of 0,5% change significantly the outcome compared to the undisturbed cases. However, when the moisture source is increased the results are slightly affected.
The results obtained from a probabilistic approach show a more detailed behaviour of the construction performance against mold or decay occurrence. The comparison between different wall systems is more overarching.
This approach facilitates a more comprehensive assessment compared to the conventional approach that is based on a single criterion. It also facilitates the end-user a clear association between mold growth intensities or decay rating with the corresponding probabilities/likelihoods.
Final Report
31.07.2017 66
6. RiFa tool part B - Details
Selection of Details
The window, the balcony and the connection between roof and wall are selected in chapter 3.2.5 for further investigation within this project. On the example of a window the application of the event tree approach (cf. chapter 4.3.2) shall be shown. The first task is to identify critical risk areas as depicted by the six red circles in
Figure 39. They show the locations where moisture ingress due to a deficiency is possible. The way of the water into the core of the structure and all the layers that could be damaged must be described for each failure event. In
Figure 39 the following scenarios should be considered: 1. The top board, which should actually shed the run-off water away from the window, could fail or
be forgotten. This could lead to a water ingress behind the roller blind and – if the second defence layer (green) fails as well – to an increased moisture content in the wood fibre board and the load-bearing beam.
2. The drainage water running down at the impregnated wood fibre board must be shed away properly before it hits the horizontal plane of the roller blind. If this is not the case, similar problems as described in 1 can happen.
3. The emphasize of the current project lies on exterior exposure, but in order to create a moisture-safe detail phenomena like condensation must be taken into account, too. It must be ensured that the air barrier is continuous. If this is not the case, the warm humid air from interior could cross the insulation layer, cool down and condensate in the core of the structure.
4. A very critical point is the exterior window sill and its flashing. Intruding water can cause large damages here. This point is therefore analysed comprehensively in chapter 6.2.
5. The condensation mechanism in point 5 is the same as in point 3. Water ingress in position 5 might be a bit more dangerous since the water runs due to gravity even deeper into the structure. In case 3 it will leak at the top of the window and the damage will be detected quite soon.
6. The last location that is considered in 7. Figure 39 is the connection between the reveal panel and the window frame. The continuity of
especially the second defence layer has to be ensured.
A risk analysis (as shown in chapter 4.3) should be performed for each of these cases. Filling the event tree helps to remember all necessary steps and to keep the overview. The following chapter 6.2 shows the application of the RiFa-B approach for the exterior flashing (number 4 in
Figure 39). An analysis of the balcony connection can be found in chapter 7. It shows the advantage of combining experiments with the theoretical approach of the event tree.
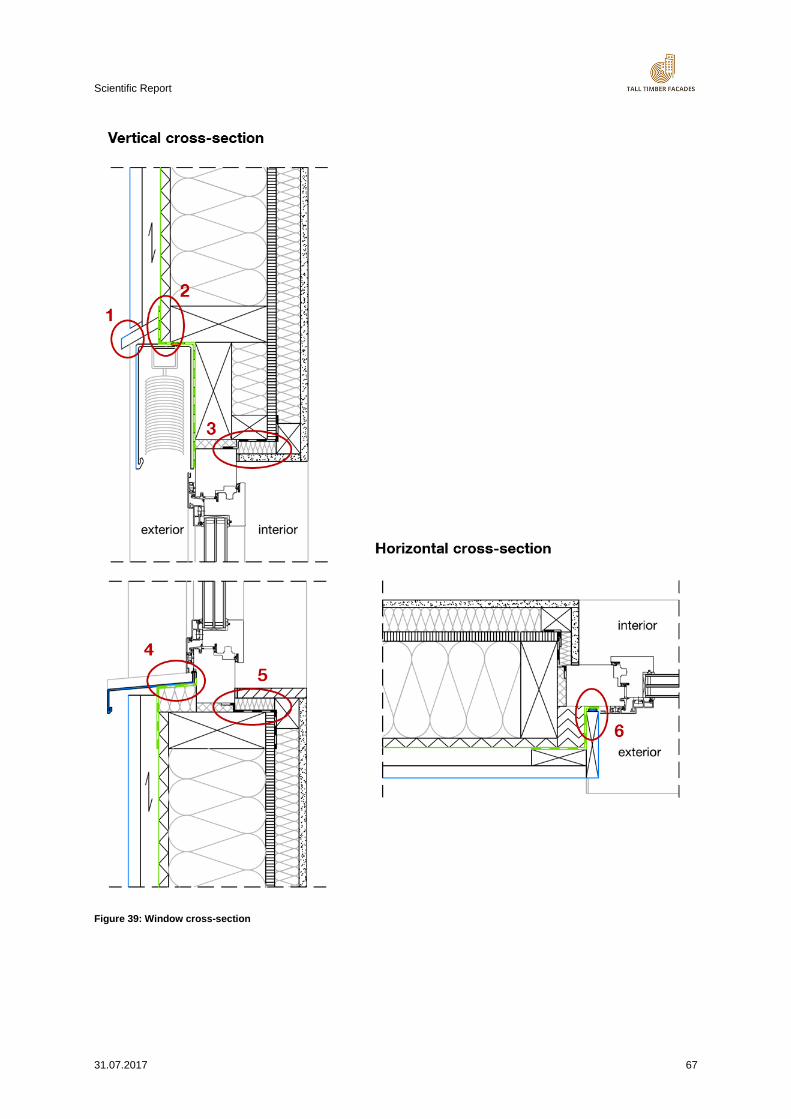
Scientific Report
31.07.2017 67
Figure 39: Window cross-section
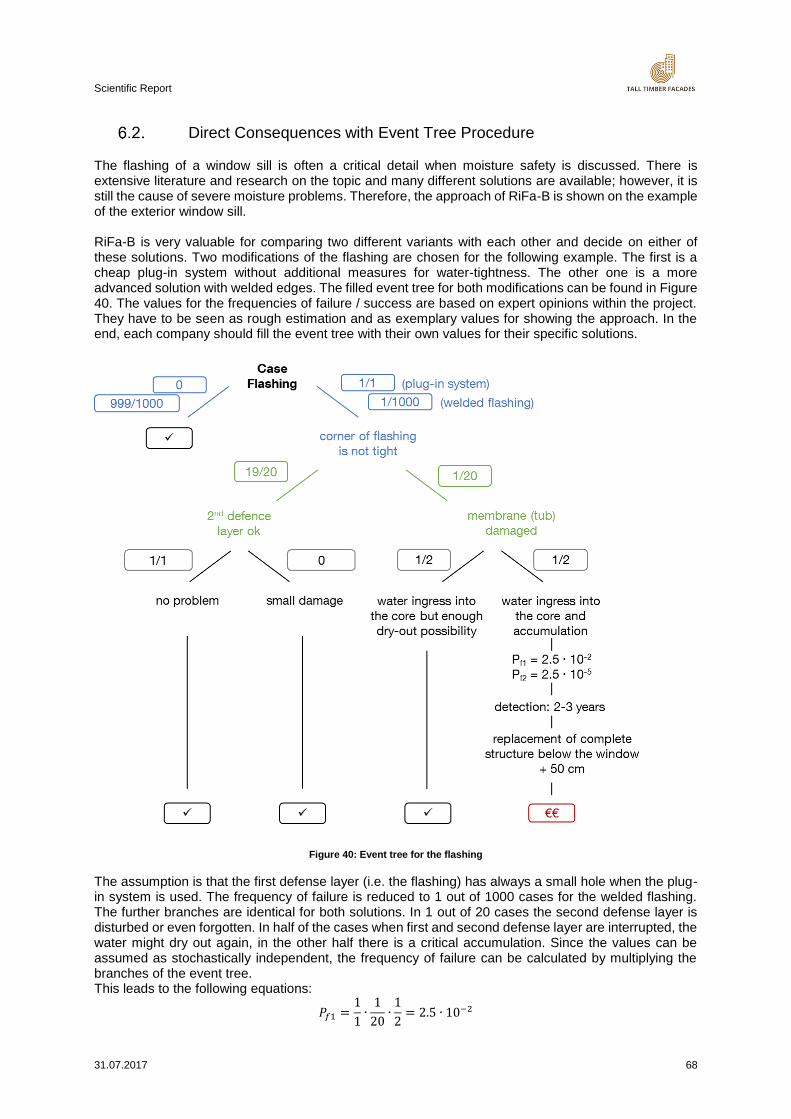
Scientific Report
31.07.2017 68
Direct Consequences with Event Tree Procedure
The flashing of a window sill is often a critical detail when moisture safety is discussed. There is extensive literature and research on the topic and many different solutions are available; however, it is still the cause of severe moisture problems. Therefore, the approach of RiFa-B is shown on the example of the exterior window sill. RiFa-B is very valuable for comparing two different variants with each other and decide on either of these solutions. Two modifications of the flashing are chosen for the following example. The first is a cheap plug-in system without additional measures for water-tightness. The other one is a more advanced solution with welded edges. The filled event tree for both modifications can be found in Figure 40. The values for the frequencies of failure / success are based on expert opinions within the project. They have to be seen as rough estimation and as exemplary values for showing the approach. In the end, each company should fill the event tree with their own values for their specific solutions.
Figure 40: Event tree for the flashing
The assumption is that the first defense layer (i.e. the flashing) has always a small hole when the plug-in system is used. The frequency of failure is reduced to 1 out of 1000 cases for the welded flashing. The further branches are identical for both solutions. In 1 out of 20 cases the second defense layer is disturbed or even forgotten. In half of the cases when first and second defense layer are interrupted, the water might dry out again, in the other half there is a critical accumulation. Since the values can be assumed as stochastically independent, the frequency of failure can be calculated by multiplying the branches of the event tree. This leads to the following equations:
𝑃𝑓1 =1
1∙
1
20∙
1
2= 2.5 ∙ 10−2
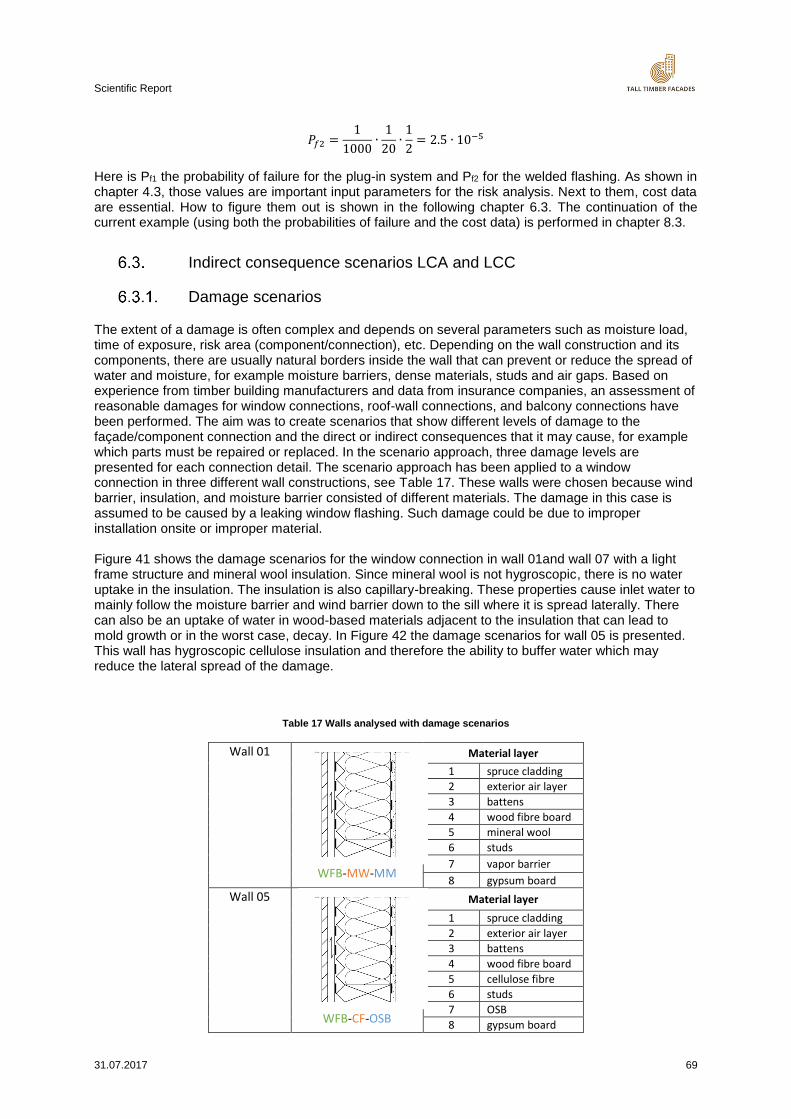
Scientific Report
31.07.2017 69
𝑃𝑓2 =1
1000∙
1
20∙
1
2= 2.5 ∙ 10−5
Here is Pf1 the probability of failure for the plug-in system and Pf2 for the welded flashing. As shown in chapter 4.3, those values are important input parameters for the risk analysis. Next to them, cost data are essential. How to figure them out is shown in the following chapter 6.3. The continuation of the current example (using both the probabilities of failure and the cost data) is performed in chapter 8.3.
Indirect consequence scenarios LCA and LCC
Damage scenarios
The extent of a damage is often complex and depends on several parameters such as moisture load, time of exposure, risk area (component/connection), etc. Depending on the wall construction and its components, there are usually natural borders inside the wall that can prevent or reduce the spread of water and moisture, for example moisture barriers, dense materials, studs and air gaps. Based on experience from timber building manufacturers and data from insurance companies, an assessment of reasonable damages for window connections, roof-wall connections, and balcony connections have been performed. The aim was to create scenarios that show different levels of damage to the façade/component connection and the direct or indirect consequences that it may cause, for example which parts must be repaired or replaced. In the scenario approach, three damage levels are presented for each connection detail. The scenario approach has been applied to a window connection in three different wall constructions, see Table 17. These walls were chosen because wind barrier, insulation, and moisture barrier consisted of different materials. The damage in this case is assumed to be caused by a leaking window flashing. Such damage could be due to improper installation onsite or improper material. Figure 41 shows the damage scenarios for the window connection in wall 01and wall 07 with a light frame structure and mineral wool insulation. Since mineral wool is not hygroscopic, there is no water uptake in the insulation. The insulation is also capillary-breaking. These properties cause inlet water to mainly follow the moisture barrier and wind barrier down to the sill where it is spread laterally. There can also be an uptake of water in wood-based materials adjacent to the insulation that can lead to mold growth or in the worst case, decay. In Figure 42 the damage scenarios for wall 05 is presented. This wall has hygroscopic cellulose insulation and therefore the ability to buffer water which may reduce the lateral spread of the damage.
Table 17 Walls analysed with damage scenarios
Wall 01
WFB-MW-MM
Material layer
1 spruce cladding
2 exterior air layer
3 battens
4 wood fibre board
5 mineral wool
6 studs
7 vapor barrier
8 gypsum board
Wall 05
WFB-CF-OSB
Material layer
1 spruce cladding
2 exterior air layer
3 battens
4 wood fibre board
5 cellulose fibre
6 studs
7 OSB
8 gypsum board
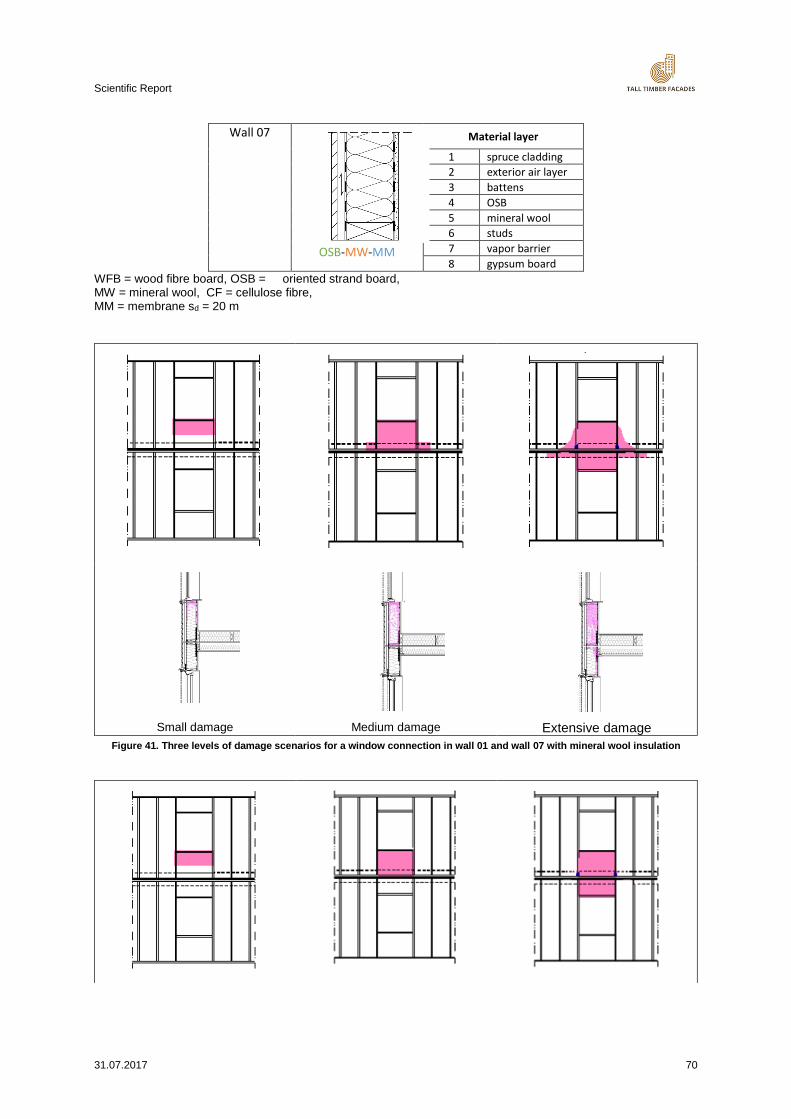
Scientific Report
31.07.2017 70
Wall 07
OSB-MW-MM
Material layer
1 spruce cladding
2 exterior air layer
3 battens
4 OSB
5 mineral wool
6 studs
7 vapor barrier
8 gypsum board
WFB = wood fibre board, OSB = oriented strand board, MW = mineral wool, CF = cellulose fibre, MM = membrane sd = 20 m
Small damage Medium damage Extensive damage
Figure 41. Three levels of damage scenarios for a window connection in wall 01 and wall 07 with mineral wool insulation
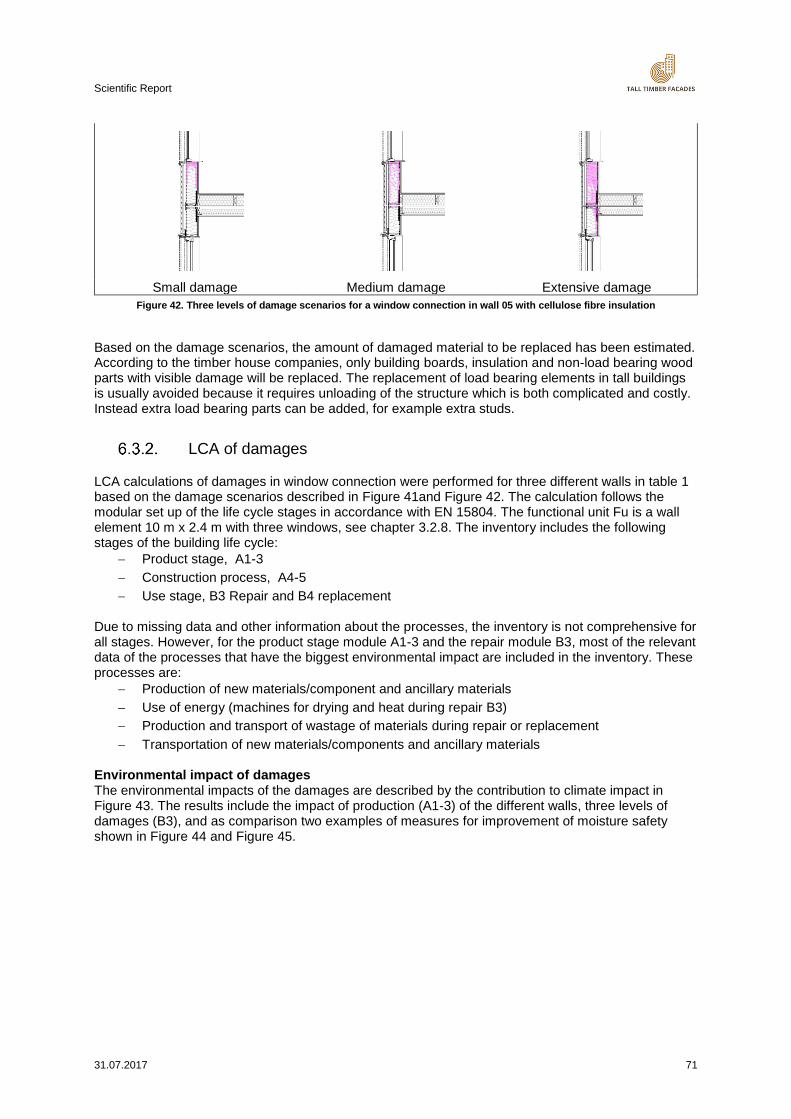
Scientific Report
31.07.2017 71
Small damage Medium damage Extensive damage
Figure 42. Three levels of damage scenarios for a window connection in wall 05 with cellulose fibre insulation
Based on the damage scenarios, the amount of damaged material to be replaced has been estimated. According to the timber house companies, only building boards, insulation and non-load bearing wood parts with visible damage will be replaced. The replacement of load bearing elements in tall buildings is usually avoided because it requires unloading of the structure which is both complicated and costly. Instead extra load bearing parts can be added, for example extra studs.
LCA of damages
LCA calculations of damages in window connection were performed for three different walls in table 1 based on the damage scenarios described in Figure 41and Figure 42. The calculation follows the modular set up of the life cycle stages in accordance with EN 15804. The functional unit Fu is a wall element 10 m x 2.4 m with three windows, see chapter 3.2.8. The inventory includes the following stages of the building life cycle:
Product stage, A1-3
Construction process, A4-5
Use stage, B3 Repair and B4 replacement
Due to missing data and other information about the processes, the inventory is not comprehensive for all stages. However, for the product stage module A1-3 and the repair module B3, most of the relevant data of the processes that have the biggest environmental impact are included in the inventory. These processes are:
Production of new materials/component and ancillary materials
Use of energy (machines for drying and heat during repair B3)
Production and transport of wastage of materials during repair or replacement
Transportation of new materials/components and ancillary materials
Environmental impact of damages The environmental impacts of the damages are described by the contribution to climate impact in Figure 43. The results include the impact of production (A1-3) of the different walls, three levels of damages (B3), and as comparison two examples of measures for improvement of moisture safety shown in Figure 44 and Figure 45.
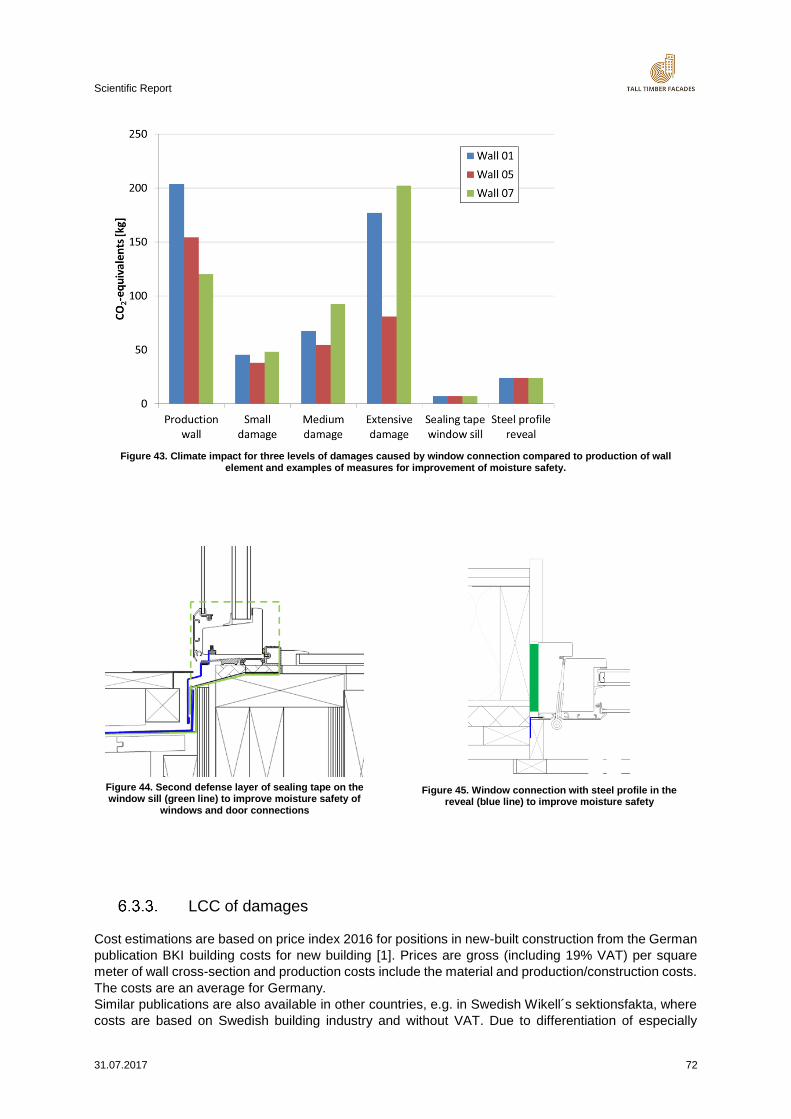
Scientific Report
31.07.2017 72
Figure 43. Climate impact for three levels of damages caused by window connection compared to production of wall
element and examples of measures for improvement of moisture safety.
Figure 44. Second defense layer of sealing tape on the window sill (green line) to improve moisture safety of
windows and door connections
Figure 45. Window connection with steel profile in the
reveal (blue line) to improve moisture safety
LCC of damages
Cost estimations are based on price index 2016 for positions in new-built construction from the German
publication BKI building costs for new building [1]. Prices are gross (including 19% VAT) per square
meter of wall cross-section and production costs include the material and production/construction costs.
The costs are an average for Germany.
Similar publications are also available in other countries, e.g. in Swedish Wikell´s sektionsfakta, where
costs are based on Swedish building industry and without VAT. Due to differentiation of especially
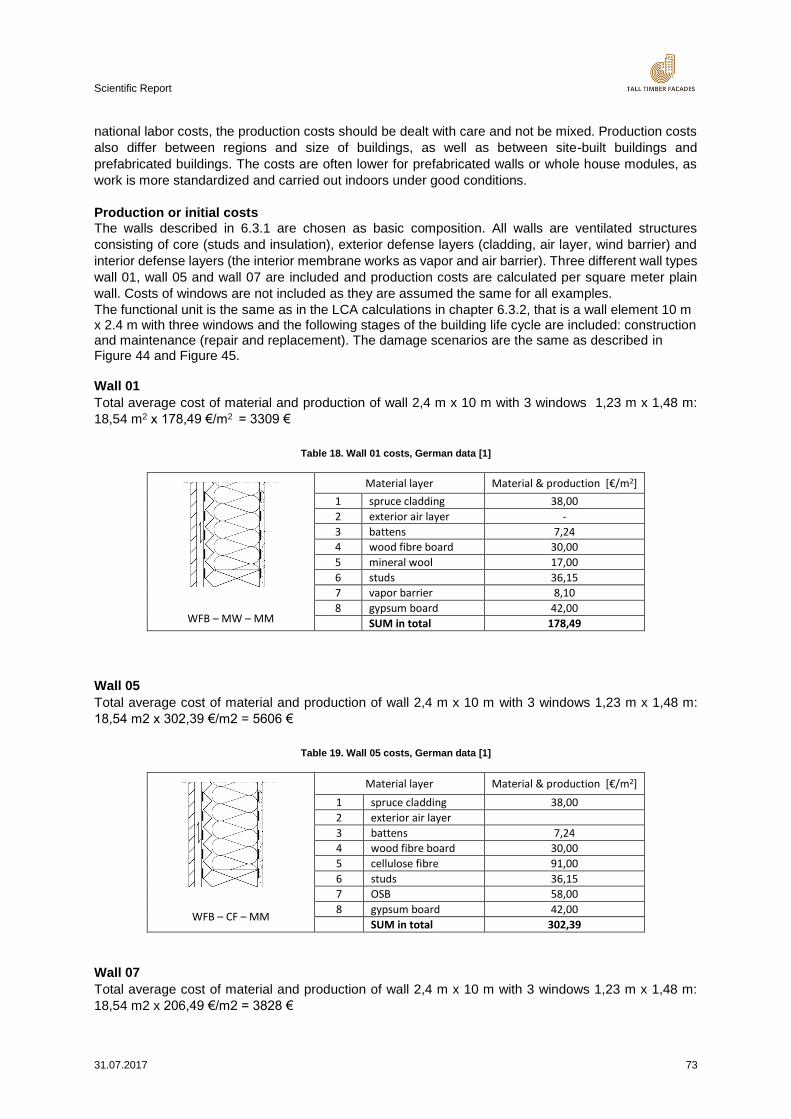
Scientific Report
31.07.2017 73
national labor costs, the production costs should be dealt with care and not be mixed. Production costs
also differ between regions and size of buildings, as well as between site-built buildings and
prefabricated buildings. The costs are often lower for prefabricated walls or whole house modules, as
work is more standardized and carried out indoors under good conditions.
Production or initial costs
The walls described in 6.3.1 are chosen as basic composition. All walls are ventilated structures
consisting of core (studs and insulation), exterior defense layers (cladding, air layer, wind barrier) and
interior defense layers (the interior membrane works as vapor and air barrier). Three different wall types
wall 01, wall 05 and wall 07 are included and production costs are calculated per square meter plain
wall. Costs of windows are not included as they are assumed the same for all examples.
The functional unit is the same as in the LCA calculations in chapter 6.3.2, that is a wall element 10 m x 2.4 m with three windows and the following stages of the building life cycle are included: construction and maintenance (repair and replacement). The damage scenarios are the same as described in Figure 44 and Figure 45. Wall 01
Total average cost of material and production of wall 2,4 m x 10 m with 3 windows 1,23 m x 1,48 m:
18,54 m2 x 178,49 €/m2 = 3309 €
Table 18. Wall 01 costs, German data [1]
WFB – MW – MM
Material layer Material & production [€/m2]
1 spruce cladding 38,00
2 exterior air layer -
3 battens 7,24
4 wood fibre board 30,00
5 mineral wool 17,00
6 studs 36,15
7 vapor barrier 8,10
8 gypsum board 42,00
SUM in total 178,49
Wall 05
Total average cost of material and production of wall 2,4 m x 10 m with 3 windows 1,23 m x 1,48 m:
18,54 m2 x 302,39 €/m2 = 5606 €
Table 19. Wall 05 costs, German data [1]
WFB – CF – MM
Material layer Material & production [€/m2]
1 spruce cladding 38,00
2 exterior air layer
3 battens 7,24
4 wood fibre board 30,00
5 cellulose fibre 91,00
6 studs 36,15
7 OSB 58,00
8 gypsum board 42,00
SUM in total 302,39
Wall 07
Total average cost of material and production of wall 2,4 m x 10 m with 3 windows 1,23 m x 1,48 m:
18,54 m2 x 206,49 €/m2 = 3828 €
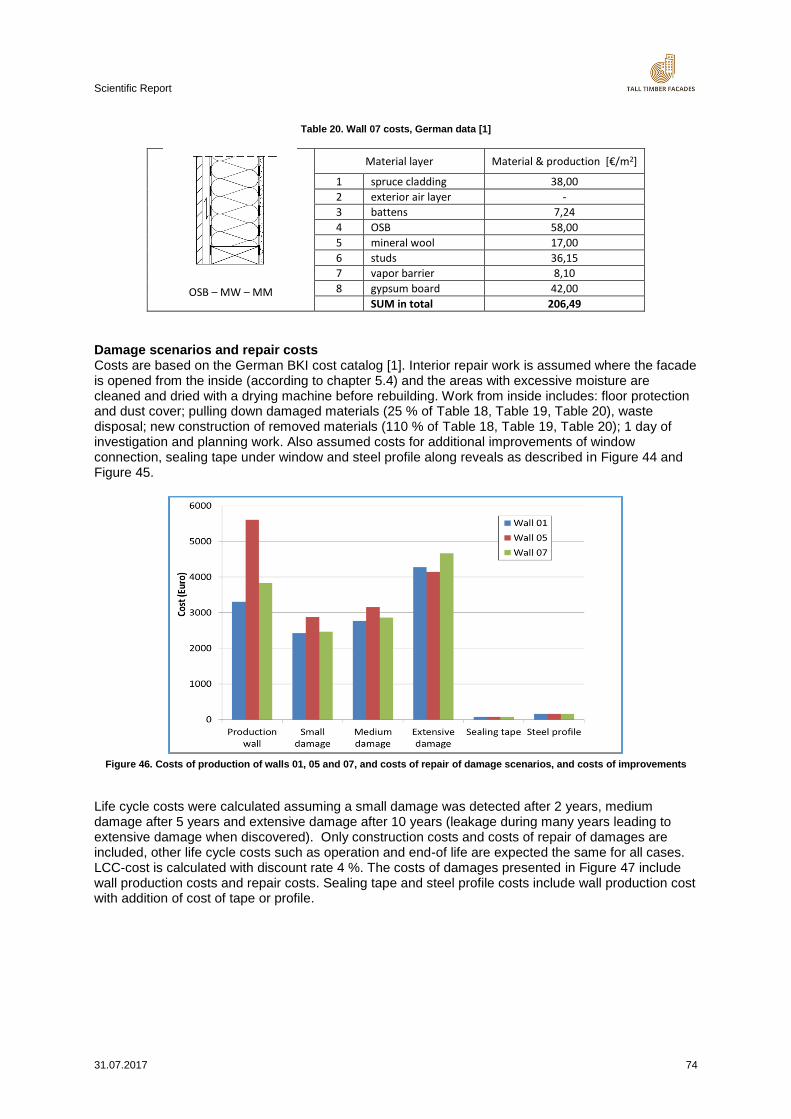
Scientific Report
31.07.2017 74
Table 20. Wall 07 costs, German data [1]
OSB – MW – MM
Material layer Material & production [€/m2]
1 spruce cladding 38,00
2 exterior air layer -
3 battens 7,24
4 OSB 58,00
5 mineral wool 17,00
6 studs 36,15
7 vapor barrier 8,10
8 gypsum board 42,00
SUM in total 206,49
Damage scenarios and repair costs Costs are based on the German BKI cost catalog [1]. Interior repair work is assumed where the facade is opened from the inside (according to chapter 5.4) and the areas with excessive moisture are cleaned and dried with a drying machine before rebuilding. Work from inside includes: floor protection and dust cover; pulling down damaged materials (25 % of Table 18, Table 19, Table 20), waste disposal; new construction of removed materials (110 % of Table 18, Table 19, Table 20); 1 day of investigation and planning work. Also assumed costs for additional improvements of window connection, sealing tape under window and steel profile along reveals as described in Figure 44 and Figure 45.
Figure 46. Costs of production of walls 01, 05 and 07, and costs of repair of damage scenarios, and costs of improvements
Life cycle costs were calculated assuming a small damage was detected after 2 years, medium damage after 5 years and extensive damage after 10 years (leakage during many years leading to extensive damage when discovered). Only construction costs and costs of repair of damages are included, other life cycle costs such as operation and end-of life are expected the same for all cases. LCC-cost is calculated with discount rate 4 %. The costs of damages presented in Figure 47 include wall production costs and repair costs. Sealing tape and steel profile costs include wall production cost with addition of cost of tape or profile.
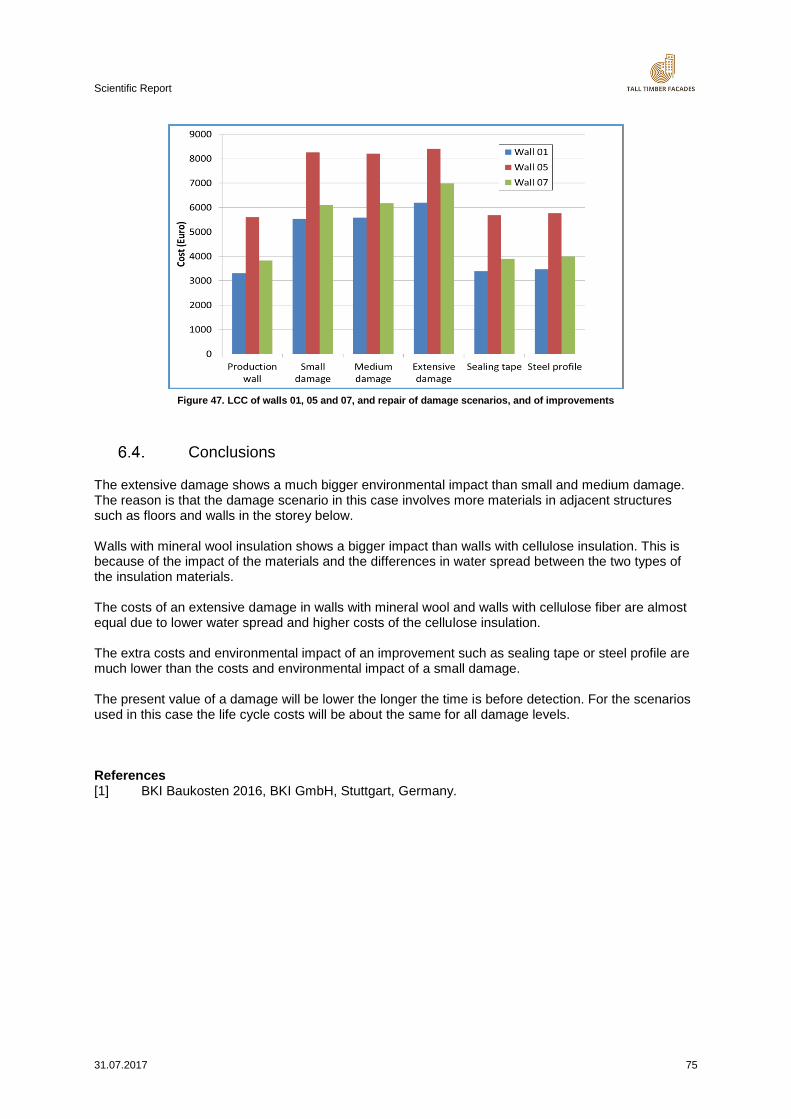
Scientific Report
31.07.2017 75
Figure 47. LCC of walls 01, 05 and 07, and repair of damage scenarios, and of improvements
Conclusions
The extensive damage shows a much bigger environmental impact than small and medium damage. The reason is that the damage scenario in this case involves more materials in adjacent structures such as floors and walls in the storey below. Walls with mineral wool insulation shows a bigger impact than walls with cellulose insulation. This is because of the impact of the materials and the differences in water spread between the two types of the insulation materials. The costs of an extensive damage in walls with mineral wool and walls with cellulose fiber are almost equal due to lower water spread and higher costs of the cellulose insulation. The extra costs and environmental impact of an improvement such as sealing tape or steel profile are much lower than the costs and environmental impact of a small damage. The present value of a damage will be lower the longer the time is before detection. For the scenarios used in this case the life cycle costs will be about the same for all damage levels. References [1] BKI Baukosten 2016, BKI GmbH, Stuttgart, Germany.
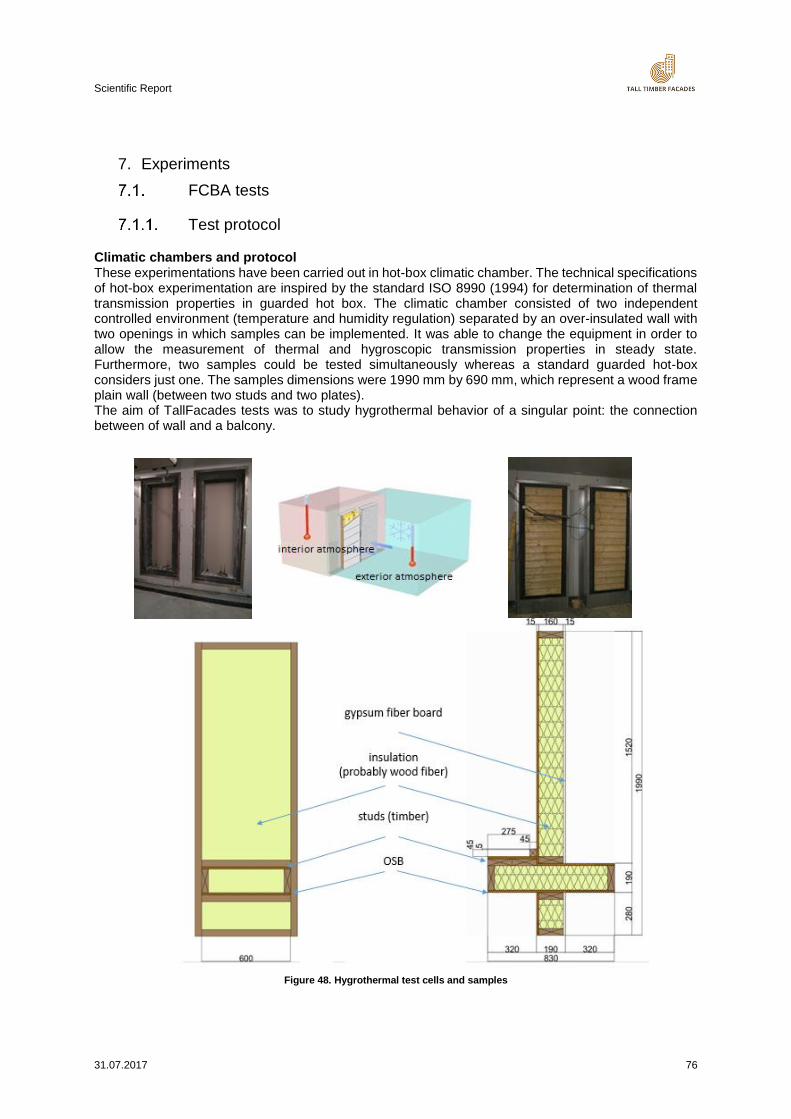
Scientific Report
31.07.2017 76
7. Experiments
FCBA tests
Test protocol
Climatic chambers and protocol These experimentations have been carried out in hot-box climatic chamber. The technical specifications of hot-box experimentation are inspired by the standard ISO 8990 (1994) for determination of thermal transmission properties in guarded hot box. The climatic chamber consisted of two independent controlled environment (temperature and humidity regulation) separated by an over-insulated wall with two openings in which samples can be implemented. It was able to change the equipment in order to allow the measurement of thermal and hygroscopic transmission properties in steady state. Furthermore, two samples could be tested simultaneously whereas a standard guarded hot-box considers just one. The samples dimensions were 1990 mm by 690 mm, which represent a wood frame plain wall (between two studs and two plates). The aim of TallFacades tests was to study hygrothermal behavior of a singular point: the connection between of wall and a balcony.
Figure 48. Hygrothermal test cells and samples
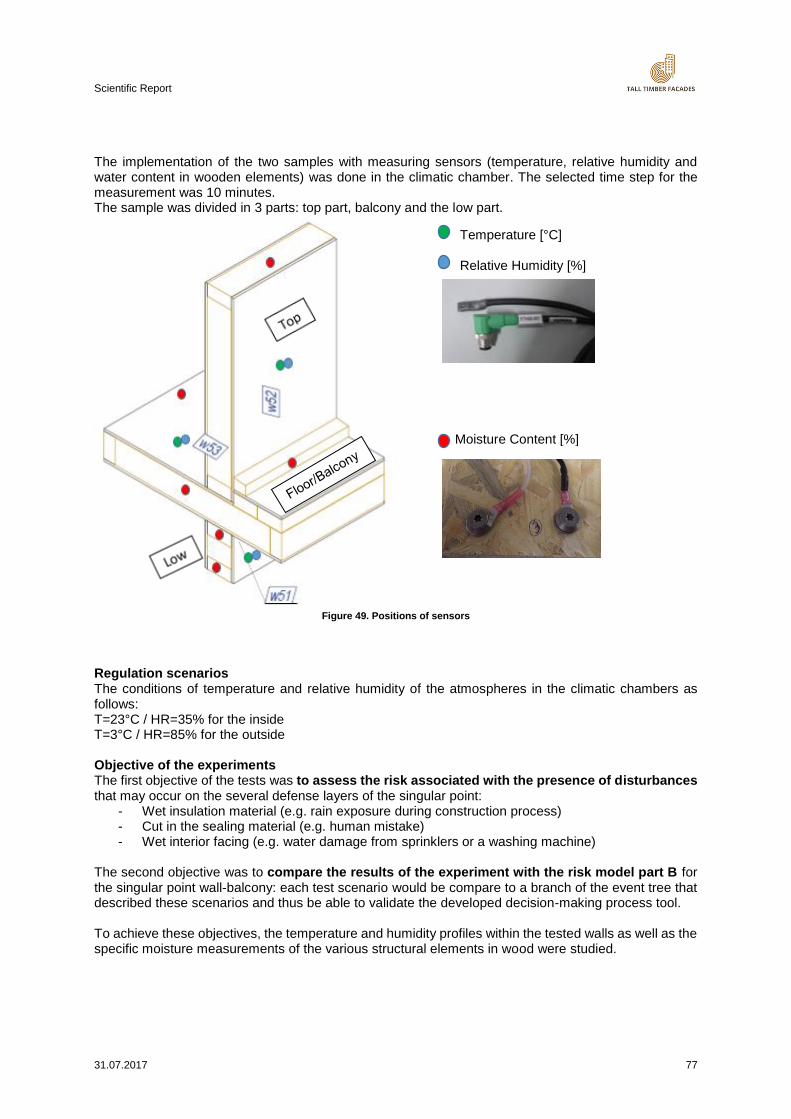
Scientific Report
31.07.2017 77
The implementation of the two samples with measuring sensors (temperature, relative humidity and water content in wooden elements) was done in the climatic chamber. The selected time step for the measurement was 10 minutes. The sample was divided in 3 parts: top part, balcony and the low part.
Figure 49. Positions of sensors
Regulation scenarios The conditions of temperature and relative humidity of the atmospheres in the climatic chambers as follows: T=23°C / HR=35% for the inside T=3°C / HR=85% for the outside Objective of the experiments The first objective of the tests was to assess the risk associated with the presence of disturbances that may occur on the several defense layers of the singular point:
- Wet insulation material (e.g. rain exposure during construction process) - Cut in the sealing material (e.g. human mistake) - Wet interior facing (e.g. water damage from sprinklers or a washing machine)
The second objective was to compare the results of the experiment with the risk model part B for the singular point wall-balcony: each test scenario would be compare to a branch of the event tree that described these scenarios and thus be able to validate the developed decision-making process tool. To achieve these objectives, the temperature and humidity profiles within the tested walls as well as the specific moisture measurements of the various structural elements in wood were studied.
Temperature [°C] Relative Humidity [%]
Moisture Content [%]
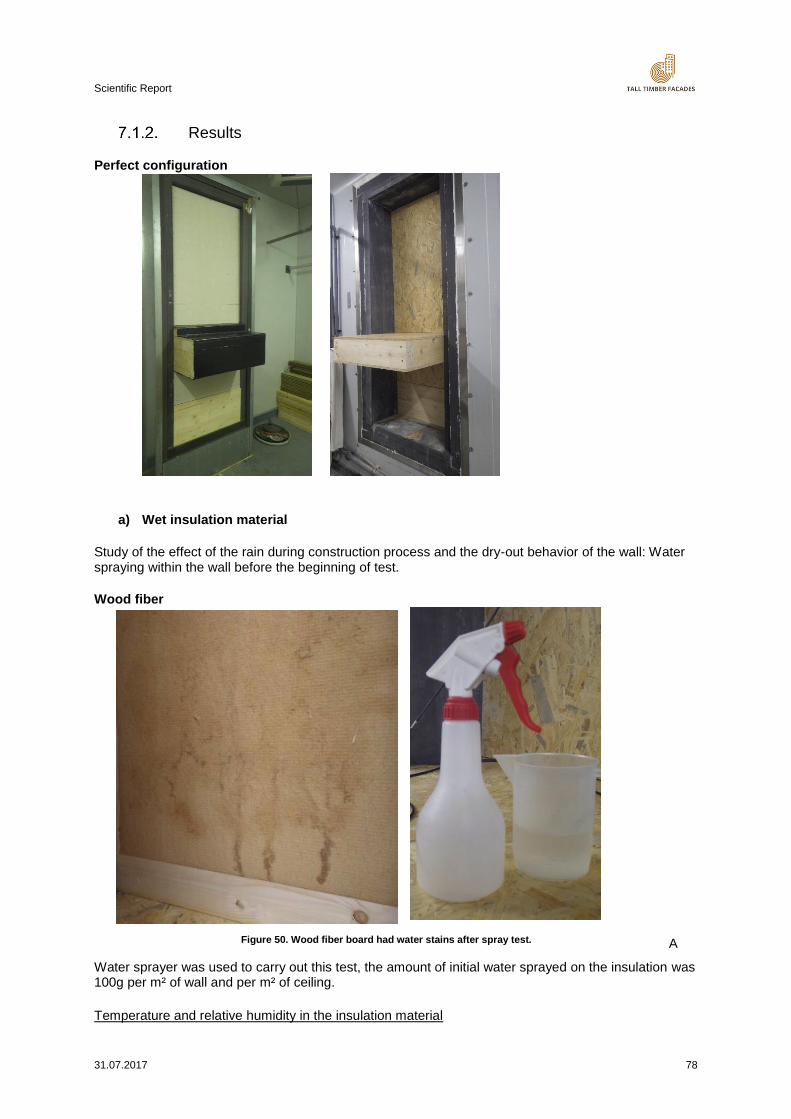
Scientific Report
31.07.2017 78
Results
Perfect configuration
a) Wet insulation material
Study of the effect of the rain during construction process and the dry-out behavior of the wall: Water spraying within the wall before the beginning of test.
Wood fiber
A
Water sprayer was used to carry out this test, the amount of initial water sprayed on the insulation was 100g per m² of wall and per m² of ceiling.
Temperature and relative humidity in the insulation material
Figure 50. Wood fiber board had water stains after spray test.
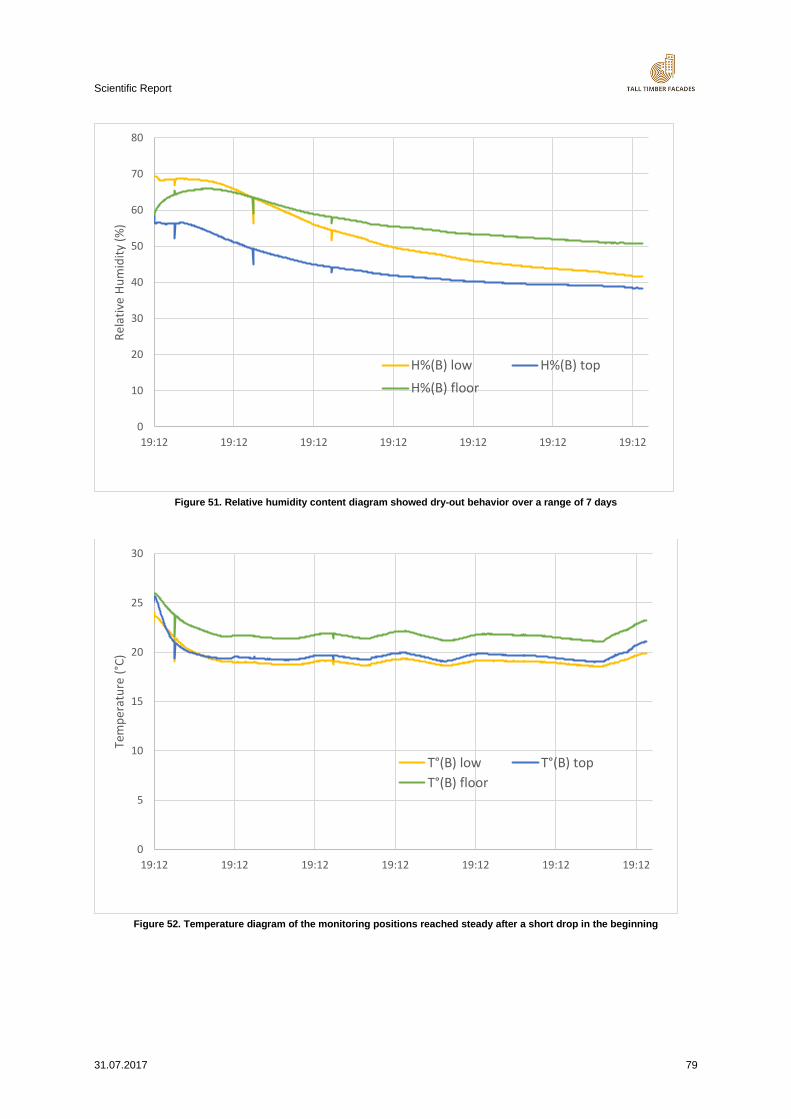
Scientific Report
31.07.2017 79
Figure 51. Relative humidity content diagram showed dry-out behavior over a range of 7 days
Figure 52. Temperature diagram of the monitoring positions reached steady after a short drop in the beginning
0
10
20
30
40
50
60
70
80
19:12 19:12 19:12 19:12 19:12 19:12 19:12
Rel
ativ
e H
um
idit
y (%
)
H%(B) low H%(B) top
H%(B) floor
0
5
10
15
20
25
30
19:12 19:12 19:12 19:12 19:12 19:12 19:12
Tem
per
atu
re (
°C)
T°(B) low T°(B) top
T°(B) floor
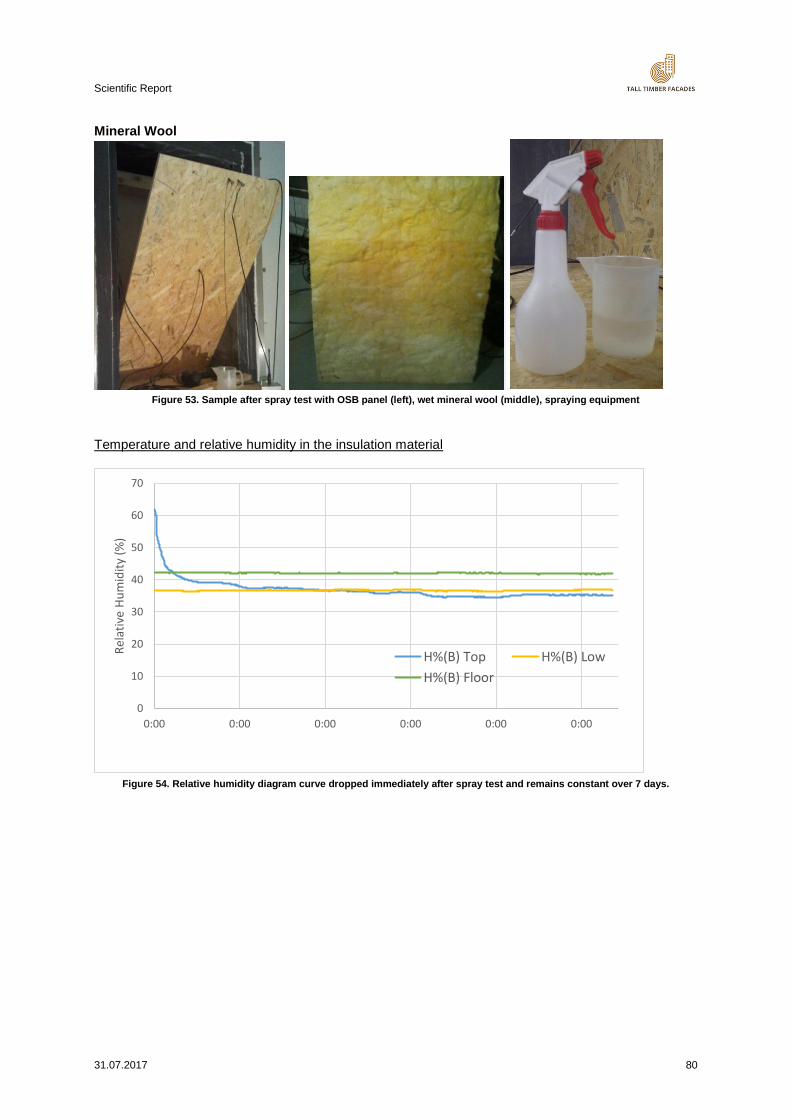
Scientific Report
31.07.2017 80
Mineral Wool
Figure 53. Sample after spray test with OSB panel (left), wet mineral wool (middle), spraying equipment
Temperature and relative humidity in the insulation material
Figure 54. Relative humidity diagram curve dropped immediately after spray test and remains constant over 7 days.
0
10
20
30
40
50
60
70
0:00 0:00 0:00 0:00 0:00 0:00
Rel
ativ
e H
um
idit
y (%
)
H%(B) Top H%(B) Low
H%(B) Floor
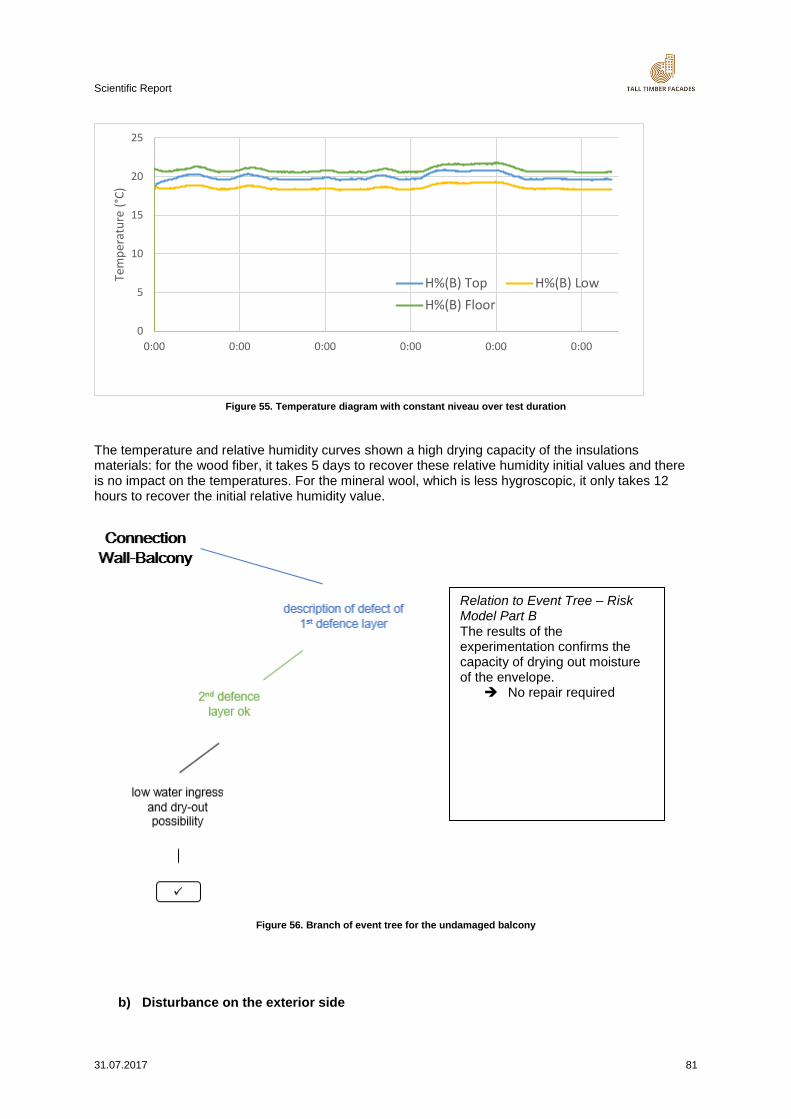
Scientific Report
31.07.2017 81
Figure 55. Temperature diagram with constant niveau over test duration
The temperature and relative humidity curves shown a high drying capacity of the insulations materials: for the wood fiber, it takes 5 days to recover these relative humidity initial values and there is no impact on the temperatures. For the mineral wool, which is less hygroscopic, it only takes 12 hours to recover the initial relative humidity value.
Figure 56. Branch of event tree for the undamaged balcony
b) Disturbance on the exterior side
0
5
10
15
20
25
0:00 0:00 0:00 0:00 0:00 0:00
Tem
per
atu
re (
°C)
H%(B) Top H%(B) Low
H%(B) Floor
Relation to Event Tree – Risk Model Part B The results of the experimentation confirms the capacity of drying out moisture of the envelope.
No repair required
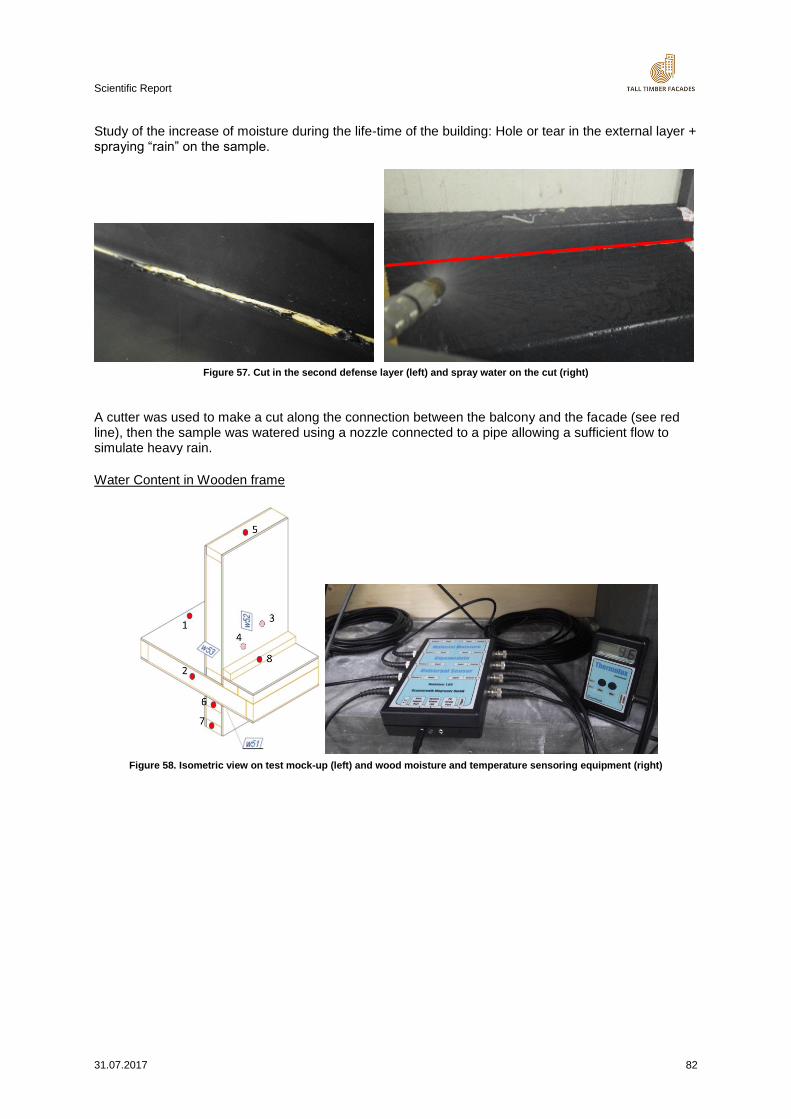
Scientific Report
31.07.2017 82
Study of the increase of moisture during the life-time of the building: Hole or tear in the external layer + spraying “rain” on the sample.
Figure 57. Cut in the second defense layer (left) and spray water on the cut (right)
A cutter was used to make a cut along the connection between the balcony and the facade (see red line), then the sample was watered using a nozzle connected to a pipe allowing a sufficient flow to simulate heavy rain.
Water Content in Wooden frame
Figure 58. Isometric view on test mock-up (left) and wood moisture and temperature sensoring equipment (right)
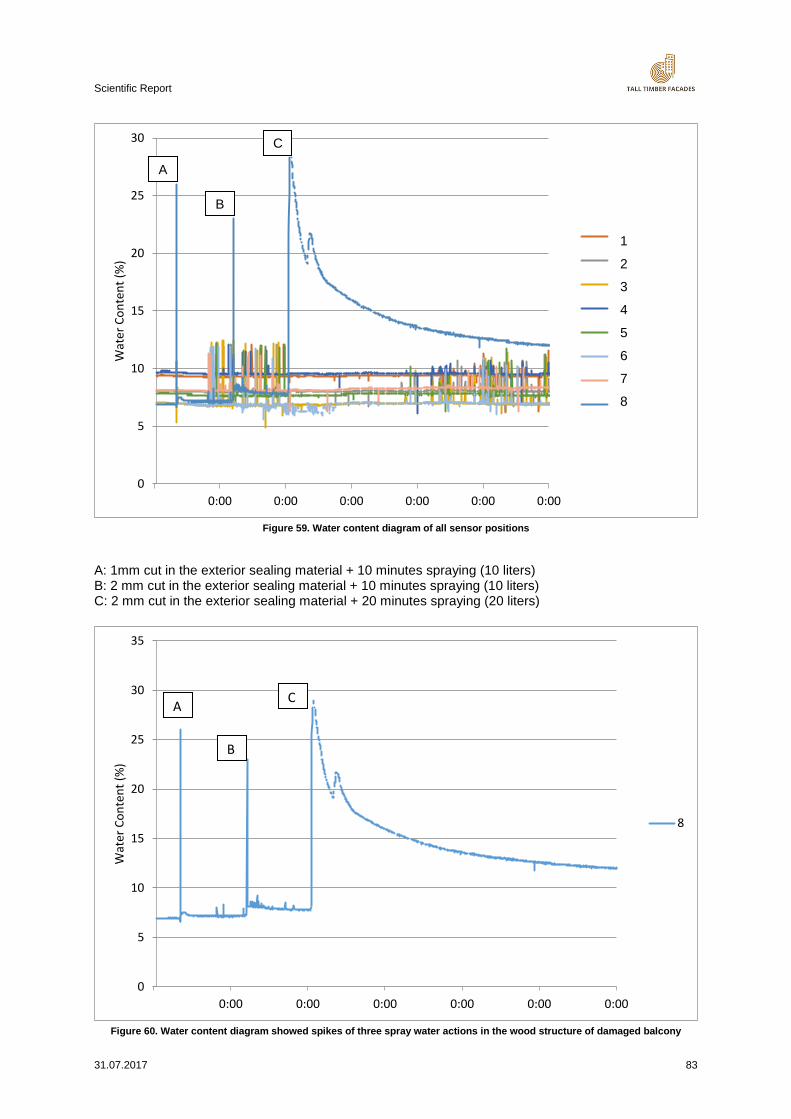
Scientific Report
31.07.2017 83
Figure 59. Water content diagram of all sensor positions
A: 1mm cut in the exterior sealing material + 10 minutes spraying (10 liters) B: 2 mm cut in the exterior sealing material + 10 minutes spraying (10 liters) C: 2 mm cut in the exterior sealing material + 20 minutes spraying (20 liters)
Figure 60. Water content diagram showed spikes of three spray water actions in the wood structure of damaged balcony
0
5
10
15
20
25
30
0:00 0:00 0:00 0:00 0:00 0:00
Wat
er C
on
ten
t (%
)
Datenreihen2
Datenreihen3
Datenreihen4
Datenreihen5
Datenreihen6
Datenreihen7
Datenreihen8
8
0
5
10
15
20
25
30
35
0:00 0:00 0:00 0:00 0:00 0:00
Wat
er C
on
ten
t (%
)
8
A
B
C
1
2
3
4
5
6
7
8
A
B
C
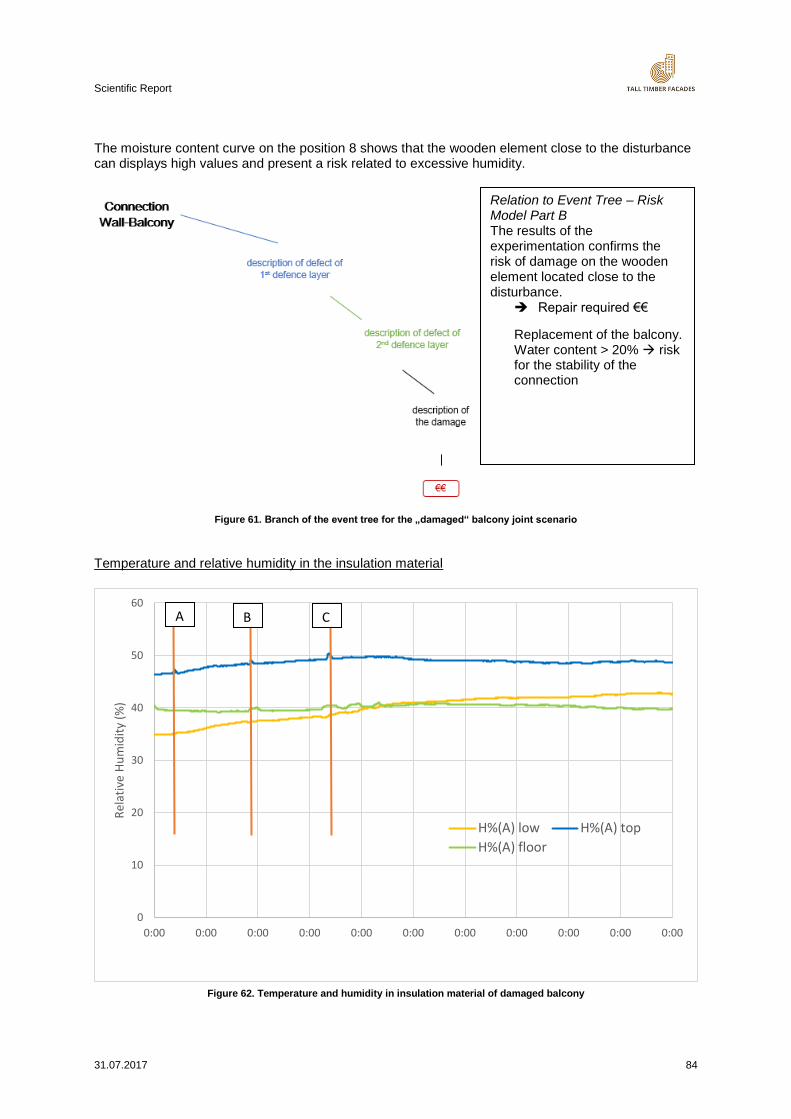
Scientific Report
31.07.2017 84
Relation to Event Tree – Risk Model Part B The results of the experimentation confirms the risk of damage on the wooden element located close to the disturbance.
Repair required €€
Replacement of the balcony. Water content > 20% risk for the stability of the connection
The moisture content curve on the position 8 shows that the wooden element close to the disturbance can displays high values and present a risk related to excessive humidity.
Figure 61. Branch of the event tree for the „damaged“ balcony joint scenario
Temperature and relative humidity in the insulation material
Figure 62. Temperature and humidity in insulation material of damaged balcony
0
10
20
30
40
50
60
0:00 0:00 0:00 0:00 0:00 0:00 0:00 0:00 0:00 0:00 0:00
Rel
ativ
e H
um
idit
y (%
)
H%(A) low H%(A) top
H%(A) floor
A B C
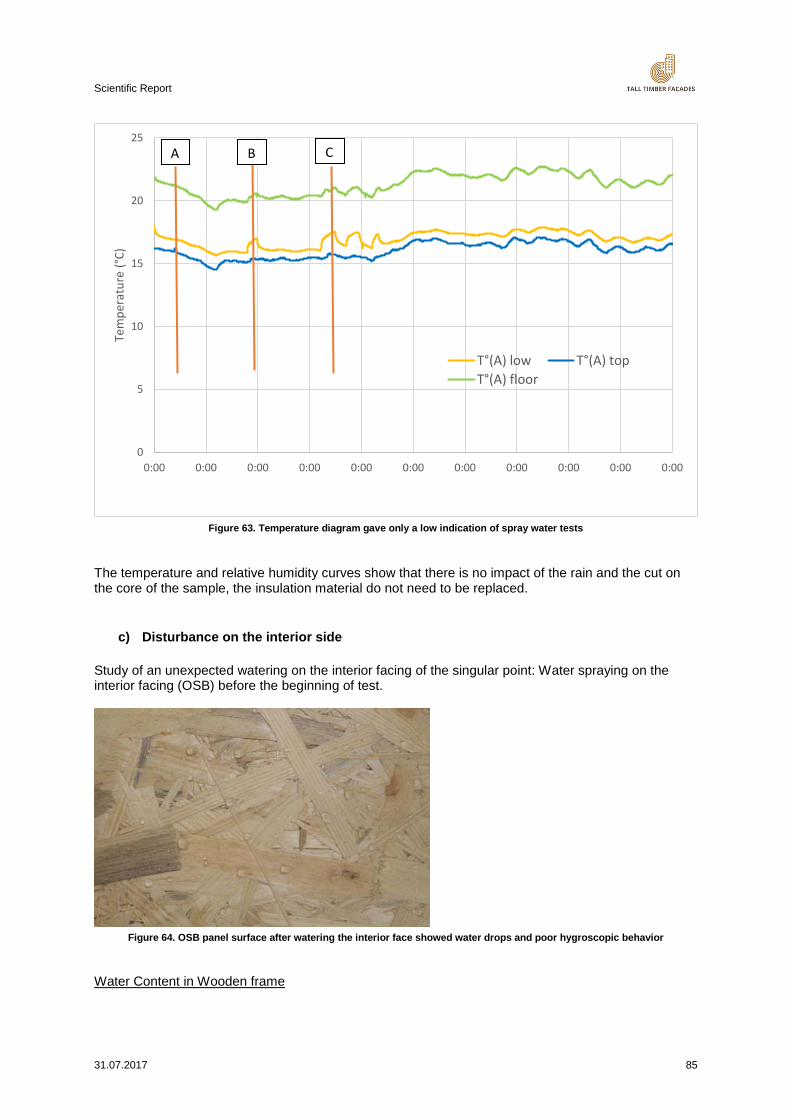
Scientific Report
31.07.2017 85
Figure 63. Temperature diagram gave only a low indication of spray water tests
The temperature and relative humidity curves show that there is no impact of the rain and the cut on the core of the sample, the insulation material do not need to be replaced.
c) Disturbance on the interior side
Study of an unexpected watering on the interior facing of the singular point: Water spraying on the interior facing (OSB) before the beginning of test.
Figure 64. OSB panel surface after watering the interior face showed water drops and poor hygroscopic behavior
Water Content in Wooden frame
0
5
10
15
20
25
0:00 0:00 0:00 0:00 0:00 0:00 0:00 0:00 0:00 0:00 0:00
Tem
per
atu
re (
°C)
T°(A) low T°(A) top
T°(A) floor
A B C
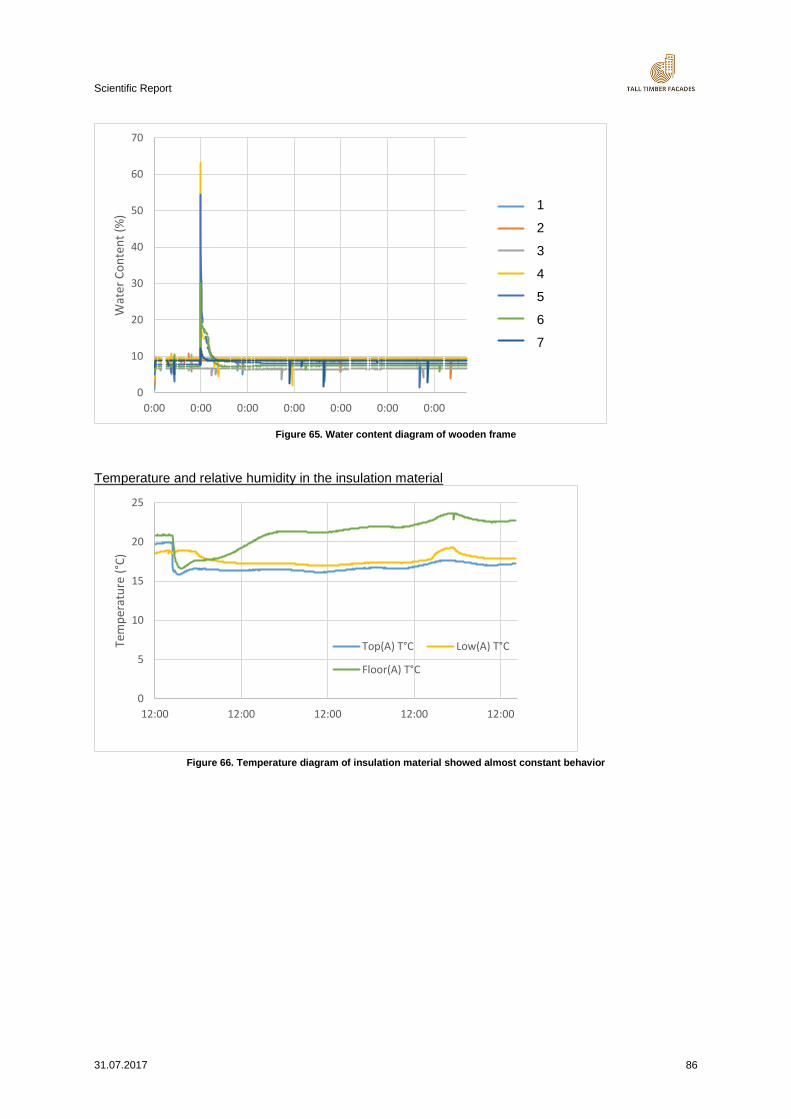
Scientific Report
31.07.2017 86
Figure 65. Water content diagram of wooden frame
Temperature and relative humidity in the insulation material
Figure 66. Temperature diagram of insulation material showed almost constant behavior
0
10
20
30
40
50
60
70
0:00 0:00 0:00 0:00 0:00 0:00 0:00
Wat
er C
on
ten
t (%
)
Datenreihen1
Datenreihen2
Datenreihen3
Datenreihen4
Datenreihen5
Datenreihen6
Datenreihen7
0
5
10
15
20
25
12:00 12:00 12:00 12:00 12:00
Tem
per
atu
re (
°C)
Top(A) T°C Low(A) T°C
Floor(A) T°C
1
2
3
4
5
6
7
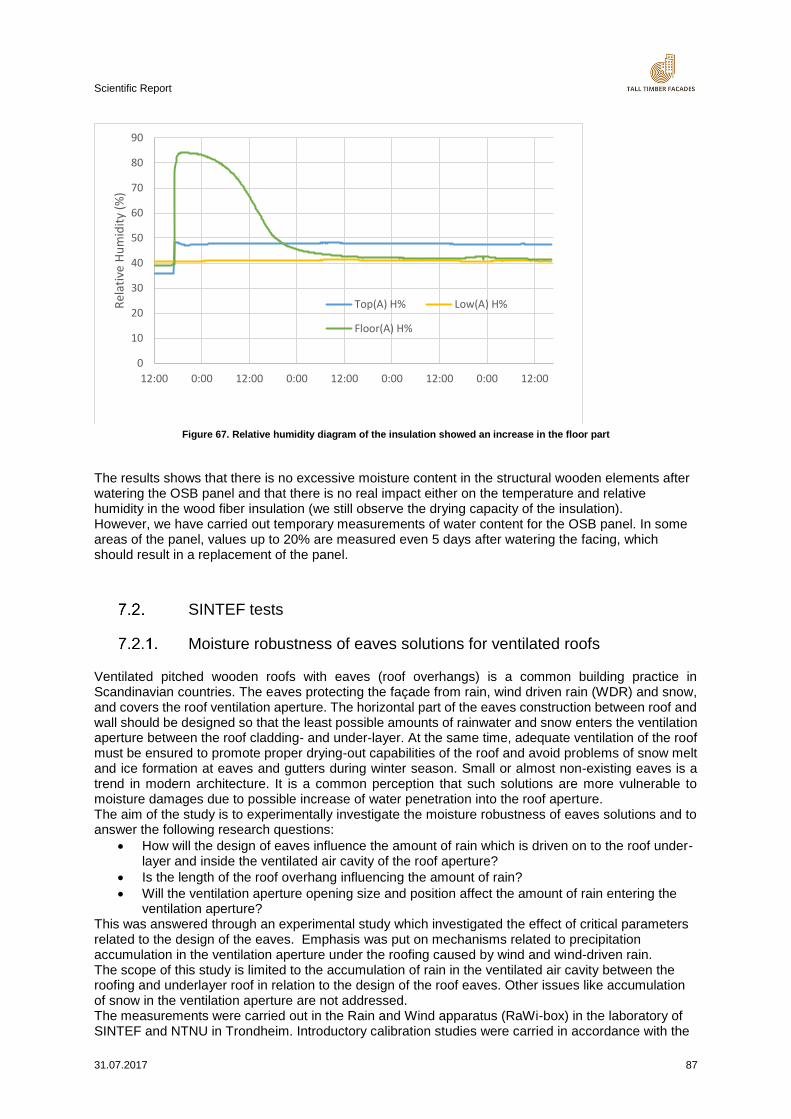
Scientific Report
31.07.2017 87
Figure 67. Relative humidity diagram of the insulation showed an increase in the floor part
The results shows that there is no excessive moisture content in the structural wooden elements after watering the OSB panel and that there is no real impact either on the temperature and relative humidity in the wood fiber insulation (we still observe the drying capacity of the insulation). However, we have carried out temporary measurements of water content for the OSB panel. In some areas of the panel, values up to 20% are measured even 5 days after watering the facing, which should result in a replacement of the panel.
SINTEF tests
Moisture robustness of eaves solutions for ventilated roofs
Ventilated pitched wooden roofs with eaves (roof overhangs) is a common building practice in Scandinavian countries. The eaves protecting the façade from rain, wind driven rain (WDR) and snow, and covers the roof ventilation aperture. The horizontal part of the eaves construction between roof and wall should be designed so that the least possible amounts of rainwater and snow enters the ventilation aperture between the roof cladding- and under-layer. At the same time, adequate ventilation of the roof must be ensured to promote proper drying-out capabilities of the roof and avoid problems of snow melt and ice formation at eaves and gutters during winter season. Small or almost non-existing eaves is a trend in modern architecture. It is a common perception that such solutions are more vulnerable to moisture damages due to possible increase of water penetration into the roof aperture. The aim of the study is to experimentally investigate the moisture robustness of eaves solutions and to answer the following research questions:
How will the design of eaves influence the amount of rain which is driven on to the roof under-layer and inside the ventilated air cavity of the roof aperture?
Is the length of the roof overhang influencing the amount of rain?
Will the ventilation aperture opening size and position affect the amount of rain entering the ventilation aperture?
This was answered through an experimental study which investigated the effect of critical parameters related to the design of the eaves. Emphasis was put on mechanisms related to precipitation accumulation in the ventilation aperture under the roofing caused by wind and wind-driven rain. The scope of this study is limited to the accumulation of rain in the ventilated air cavity between the roofing and underlayer roof in relation to the design of the roof eaves. Other issues like accumulation of snow in the ventilation aperture are not addressed. The measurements were carried out in the Rain and Wind apparatus (RaWi-box) in the laboratory of SINTEF and NTNU in Trondheim. Introductory calibration studies were carried in accordance with the
0
10
20
30
40
50
60
70
80
90
12:00 0:00 12:00 0:00 12:00 0:00 12:00 0:00 12:00
Rel
ativ
e H
um
idit
y (%
)
Top(A) H% Low(A) H%
Floor(A) H%

Scientific Report
31.07.2017 88
principles given in standard NS-EN 12865:2001 [25]. Smaller quantities of rain than those advised in the method description were used due to limitations of the equipment. The modified procedure according to Method B, which was intended for quantitative testing, was carried out according to the procedure in Table 1. Ten different eaves-solutions were tested, as described in Table 21. It was found that the amount of collected water in the different test series, is to a large extent given by both the water droplet size as well as the wind velocity inside the air cavity. In practice the amount of WDR hitting the facade and more specific the area directly beneath the roof overhang is dependent of wind speed, wind direction, rainfall intensity, raindrop size, and the rain event duration. The results from this study simulated an example of a rain event with heavy rain intensity (660 l /h) and strong winds (storm). The test represented an example of a storm event with a given droplet size distribution. Therefore the actual amount of water collected in each of the test configurations was less interesting. However, comparing the amounts of water of the different test-configurations are of larger interest. Furthermore, it must be noted that there were some limitations of the measurements that have been carried out. There was no feasible way of controlling the droplet size distribution other than that the use of water-mist nozzles created smaller droplets than the driving rain nozzles. It was not possible to adjust the amount of water applied on the sample. The air velocity inside the ventilation cavity was high. However, this was necessary to induce rain penetration in the ventilation cavity. The effect of varying wind direction was not accounted for and should be included in future studies. Only rain accumulation in the ventilation aperture was studied. Future measurements should also be coupled to experiments studying challenges related to snow, which might be a bigger issue. Future studies should also include the combined effects and implications of eaves-design on WDR effects on cladding. Future measurements studying real-climate performance should also be carried out.
Table 21. Test sample configuration overview
Configuration A Configuration B Configuration C
Test series
Overhang d = 36 mm Overhang, d = 100 mm Overhang, d = 200 mm
1
2
3
4
5
A more detailed description of the experimental study is available in [1]. Reference [1] S. Grynning. Moisture robustness of eaves solutions for ventilated roofs – experimental studies. submitted for publication in Journal of Building Physics
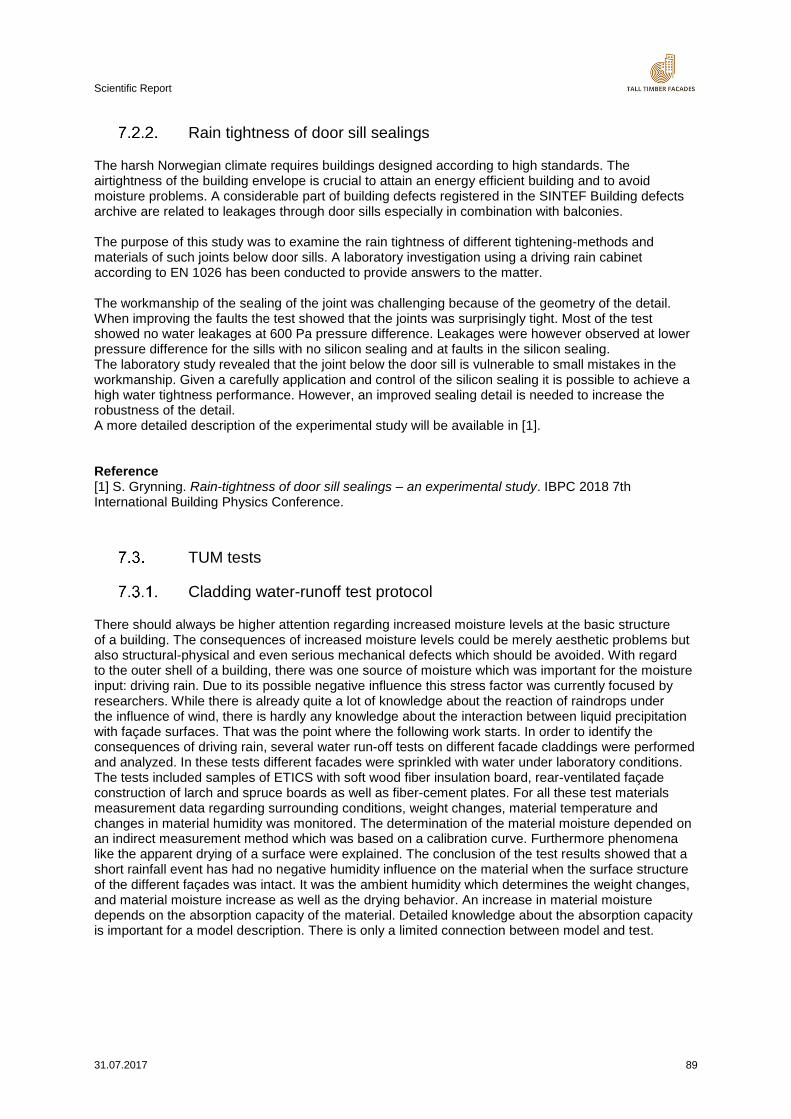
Scientific Report
31.07.2017 89
Rain tightness of door sill sealings
The harsh Norwegian climate requires buildings designed according to high standards. The airtightness of the building envelope is crucial to attain an energy efficient building and to avoid moisture problems. A considerable part of building defects registered in the SINTEF Building defects archive are related to leakages through door sills especially in combination with balconies. The purpose of this study was to examine the rain tightness of different tightening-methods and materials of such joints below door sills. A laboratory investigation using a driving rain cabinet according to EN 1026 has been conducted to provide answers to the matter. The workmanship of the sealing of the joint was challenging because of the geometry of the detail. When improving the faults the test showed that the joints was surprisingly tight. Most of the test showed no water leakages at 600 Pa pressure difference. Leakages were however observed at lower pressure difference for the sills with no silicon sealing and at faults in the silicon sealing. The laboratory study revealed that the joint below the door sill is vulnerable to small mistakes in the workmanship. Given a carefully application and control of the silicon sealing it is possible to achieve a high water tightness performance. However, an improved sealing detail is needed to increase the robustness of the detail. A more detailed description of the experimental study will be available in [1]. Reference [1] S. Grynning. Rain-tightness of door sill sealings – an experimental study. IBPC 2018 7th International Building Physics Conference.
TUM tests
Cladding water-runoff test protocol
There should always be higher attention regarding increased moisture levels at the basic structure of a building. The consequences of increased moisture levels could be merely aesthetic problems but also structural-physical and even serious mechanical defects which should be avoided. With regard to the outer shell of a building, there was one source of moisture which was important for the moisture input: driving rain. Due to its possible negative influence this stress factor was currently focused by researchers. While there is already quite a lot of knowledge about the reaction of raindrops under the influence of wind, there is hardly any knowledge about the interaction between liquid precipitation with façade surfaces. That was the point where the following work starts. In order to identify the consequences of driving rain, several water run-off tests on different facade claddings were performed and analyzed. In these tests different facades were sprinkled with water under laboratory conditions. The tests included samples of ETICS with soft wood fiber insulation board, rear-ventilated façade construction of larch and spruce boards as well as fiber-cement plates. For all these test materials measurement data regarding surrounding conditions, weight changes, material temperature and changes in material humidity was monitored. The determination of the material moisture depended on an indirect measurement method which was based on a calibration curve. Furthermore phenomena like the apparent drying of a surface were explained. The conclusion of the test results showed that a short rainfall event has had no negative humidity influence on the material when the surface structure of the different façades was intact. It was the ambient humidity which determines the weight changes, and material moisture increase as well as the drying behavior. An increase in material moisture depends on the absorption capacity of the material. Detailed knowledge about the absorption capacity is important for a model description. There is only a limited connection between model and test.
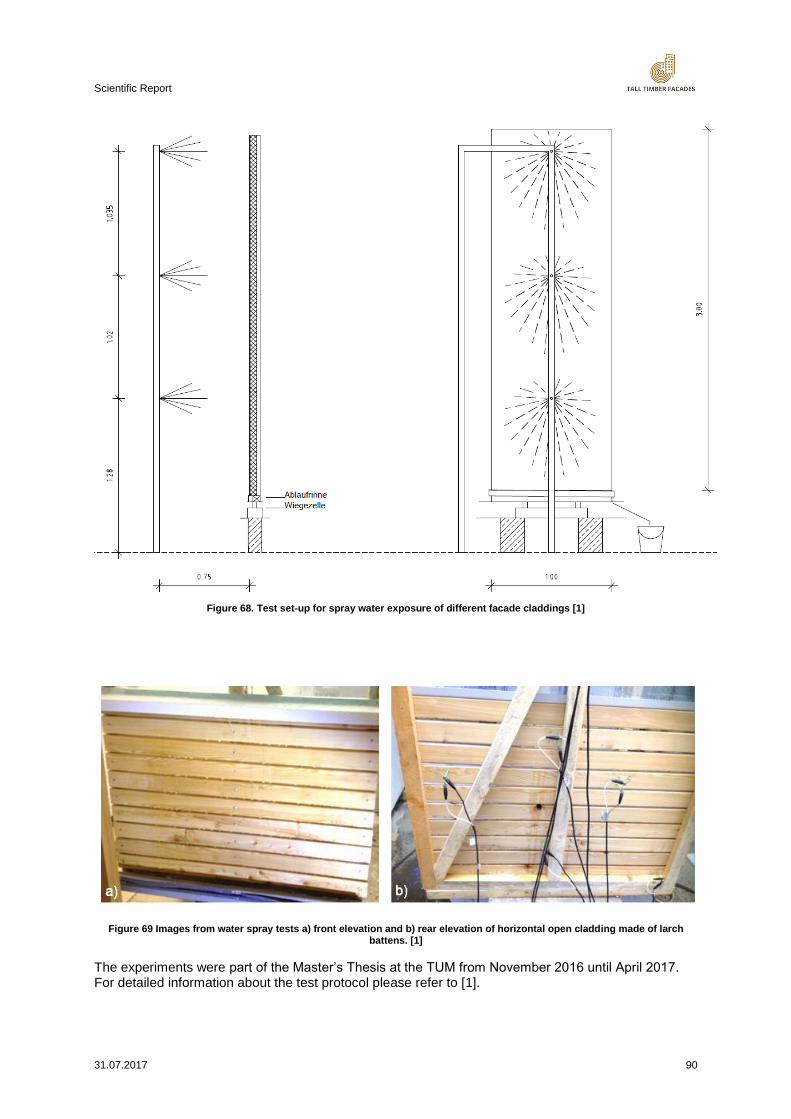
Scientific Report
31.07.2017 90
Figure 68. Test set-up for spray water exposure of different facade claddings [1]
Figure 69 Images from water spray tests a) front elevation and b) rear elevation of horizontal open cladding made of larch battens. [1]
The experiments were part of the Master’s Thesis at the TUM from November 2016 until April 2017. For detailed information about the test protocol please refer to [1].
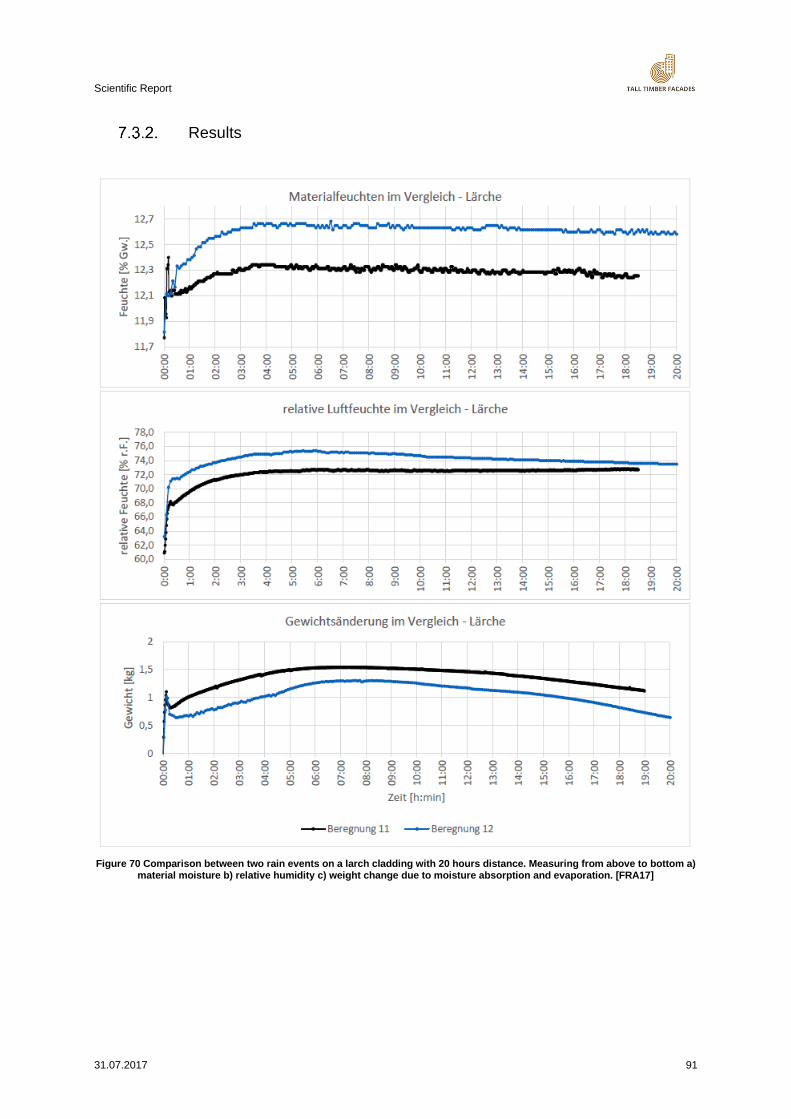
Scientific Report
31.07.2017 91
Results
Figure 70 Comparison between two rain events on a larch cladding with 20 hours distance. Measuring from above to bottom a)
material moisture b) relative humidity c) weight change due to moisture absorption and evaporation. [FRA17]
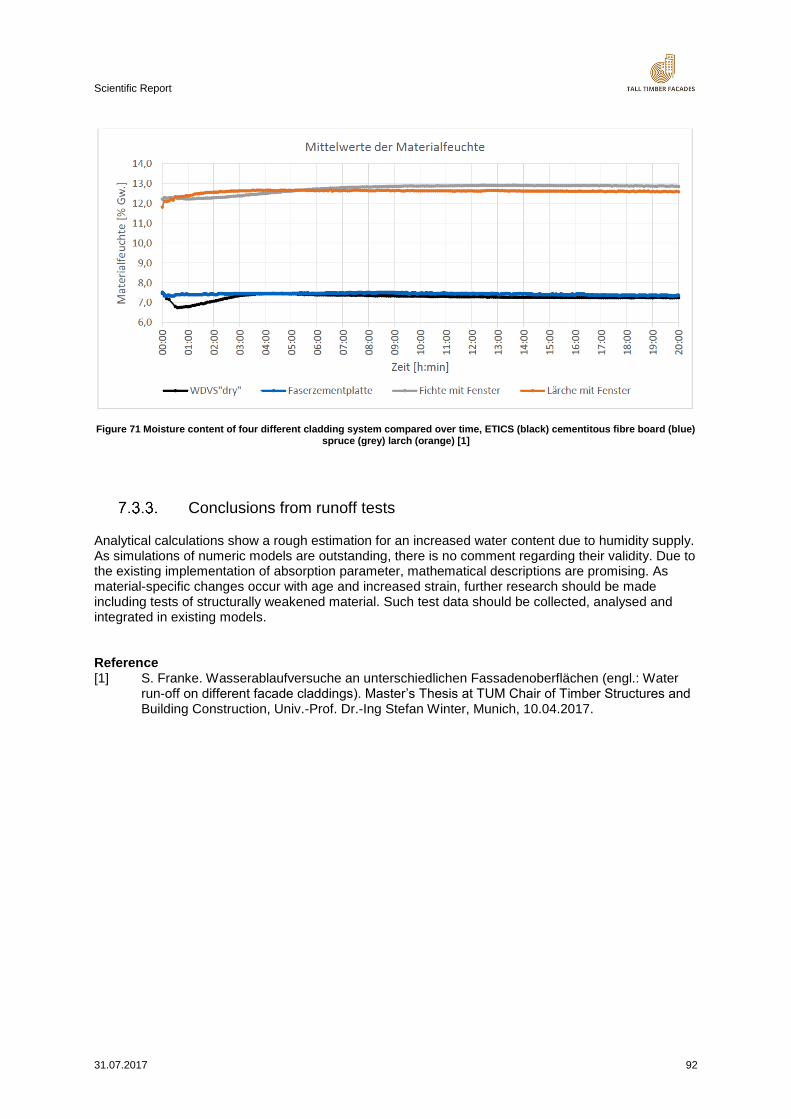
Scientific Report
31.07.2017 92
Figure 71 Moisture content of four different cladding system compared over time, ETICS (black) cementitous fibre board (blue) spruce (grey) larch (orange) [1]
Conclusions from runoff tests
Analytical calculations show a rough estimation for an increased water content due to humidity supply. As simulations of numeric models are outstanding, there is no comment regarding their validity. Due to the existing implementation of absorption parameter, mathematical descriptions are promising. As material-specific changes occur with age and increased strain, further research should be made including tests of structurally weakened material. Such test data should be collected, analysed and integrated in existing models. Reference [1] S. Franke. Wasserablaufversuche an unterschiedlichen Fassadenoberflächen (engl.: Water
run-off on different facade claddings). Master’s Thesis at TUM Chair of Timber Structures and Building Construction, Univ.-Prof. Dr.-Ing Stefan Winter, Munich, 10.04.2017.
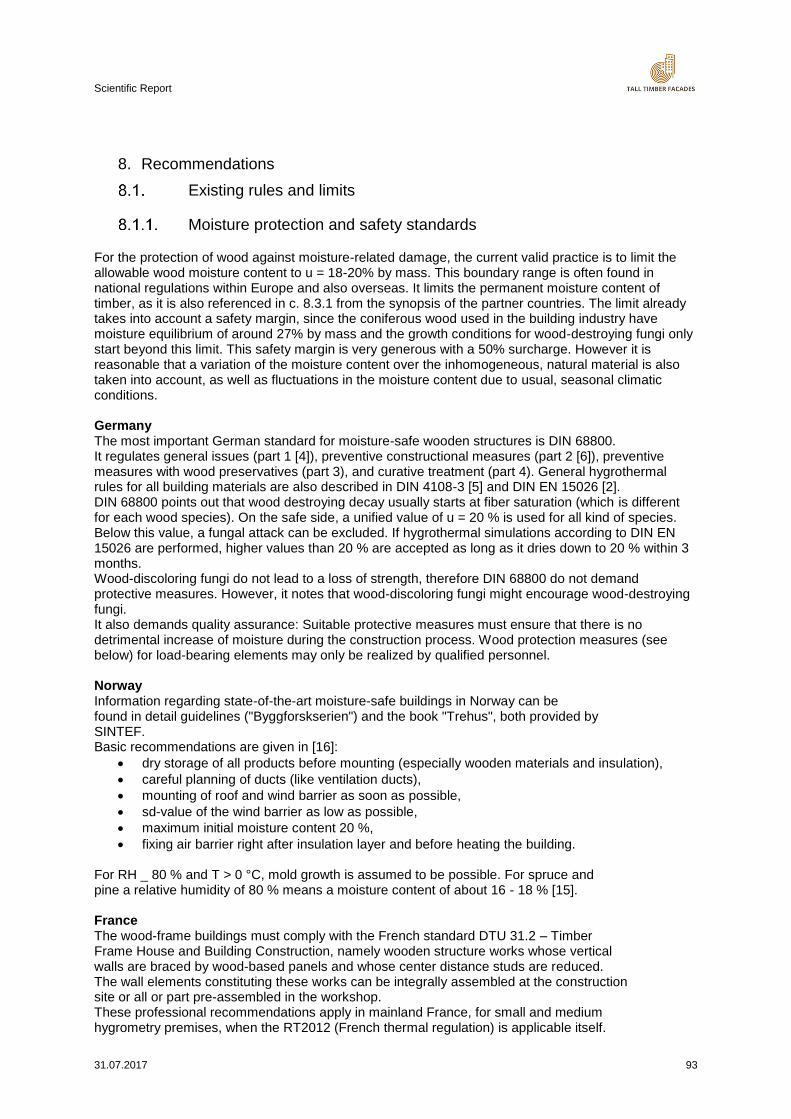
Scientific Report
31.07.2017 93
8. Recommendations
Existing rules and limits
Moisture protection and safety standards
For the protection of wood against moisture-related damage, the current valid practice is to limit the allowable wood moisture content to u = 18-20% by mass. This boundary range is often found in national regulations within Europe and also overseas. It limits the permanent moisture content of timber, as it is also referenced in c. 8.3.1 from the synopsis of the partner countries. The limit already takes into account a safety margin, since the coniferous wood used in the building industry have moisture equilibrium of around 27% by mass and the growth conditions for wood-destroying fungi only start beyond this limit. This safety margin is very generous with a 50% surcharge. However it is reasonable that a variation of the moisture content over the inhomogeneous, natural material is also taken into account, as well as fluctuations in the moisture content due to usual, seasonal climatic conditions. Germany The most important German standard for moisture-safe wooden structures is DIN 68800. It regulates general issues (part 1 [4]), preventive constructional measures (part 2 [6]), preventive measures with wood preservatives (part 3), and curative treatment (part 4). General hygrothermal rules for all building materials are also described in DIN 4108-3 [5] and DIN EN 15026 [2]. DIN 68800 points out that wood destroying decay usually starts at fiber saturation (which is different for each wood species). On the safe side, a unified value of u = 20 % is used for all kind of species. Below this value, a fungal attack can be excluded. If hygrothermal simulations according to DIN EN 15026 are performed, higher values than 20 % are accepted as long as it dries down to 20 % within 3 months. Wood-discoloring fungi do not lead to a loss of strength, therefore DIN 68800 do not demand protective measures. However, it notes that wood-discoloring fungi might encourage wood-destroying fungi. It also demands quality assurance: Suitable protective measures must ensure that there is no detrimental increase of moisture during the construction process. Wood protection measures (see below) for load-bearing elements may only be realized by qualified personnel. Norway Information regarding state-of-the-art moisture-safe buildings in Norway can be found in detail guidelines ("Byggforskserien") and the book "Trehus", both provided by SINTEF. Basic recommendations are given in [16]:
dry storage of all products before mounting (especially wooden materials and insulation),
careful planning of ducts (like ventilation ducts),
mounting of roof and wind barrier as soon as possible,
sd-value of the wind barrier as low as possible,
maximum initial moisture content 20 %,
fixing air barrier right after insulation layer and before heating the building. For RH _ 80 % and T > 0 °C, mold growth is assumed to be possible. For spruce and pine a relative humidity of 80 % means a moisture content of about 16 - 18 % [15]. France The wood-frame buildings must comply with the French standard DTU 31.2 – Timber Frame House and Building Construction, namely wooden structure works whose vertical walls are braced by wood-based panels and whose center distance studs are reduced. The wall elements constituting these works can be integrally assembled at the construction site or all or part pre-assembled in the workshop. These professional recommendations apply in mainland France, for small and medium hygrometry premises, when the RT2012 (French thermal regulation) is applicable itself.
Scientific Report
31.07.2017 94
For overseas departments, where the thermal performance is linked to the requirements of RTAA DOM (Thermal, acoustic and ventilation rules for overseas departments), an annex to professional guidelines provides specific requirements. Professional recommendations are only on the energy performance of parts of the works constituting the envelope of timber frame buildings. Some specific technical points are addressed specifically in professional recommendations or specific guide RAGE (Règles de l’Art Grenelle Environnement 2012) (insulation wooden roof terraces, integration of external joinery in wood frame walls). These professional recommendations describe only technical solutions relating to the reliability of thermal performance, watertight and airtight timber frame buildings. The compatibility of these solutions with other requirements (stability, fire safety, acoustic performance ...) must be justified for each new project. Sweden BBR - Swedish Building Regulations, from Swedish National Board of Housing, Building and Planning (Boverket) contains requirements and recommendations for buildings. The regulations specify the minimum requirements, and they are mostly formulated as performance requirements. In connection to the regulations, there are general recommendations set at levels for the regulations to be met. If the general recommendations are not followed, the alternative performance must be at least as good as the performance in the general recommendation. Recommendations for materials and details are given in AMA Hus (AMA Buildings) and RA Hus. AMA Hus is a reference used in the preparation of descriptions and execution of building construction. RA Hus contains advice and instructions for the descriptions for building construction. Public Health Agency of Sweden is an authority for public health issues, and gives general advice on ventilation and air circulation in buildings. The Public Health Agency’s Statutes (FoHMFS) include compulsory regulations and general advice on how a statute can or should be applied. Information regarding the state-of-art of moisture safe buildings in Sweden can be found in guidelines TräGuiden (Svenskt Trä), Träfasader (SP), Träfasader – Guide för projektering, materialtillverkning, montage, underhåll (SP), Fukthandboken (Byggtjänst), ByggaF (Fuktcentrum, Lund), several research reports from SP and Universities, for example Fuktsäkra träkonstruktioner, vägledning för utformning av träbaserade väggar, S. Olof Hägerstedt, Rapport TVBH-3052 Lund 2012. Synopsis The TallFacades partners collected their knowledge and enable an overview on safety recommendations throughout the countries in a synopsis. Different approaches to moisture safety in national handbooks or standards for moisture safe construction are shown in a synopsis below in Figure 72 and Figure 73.
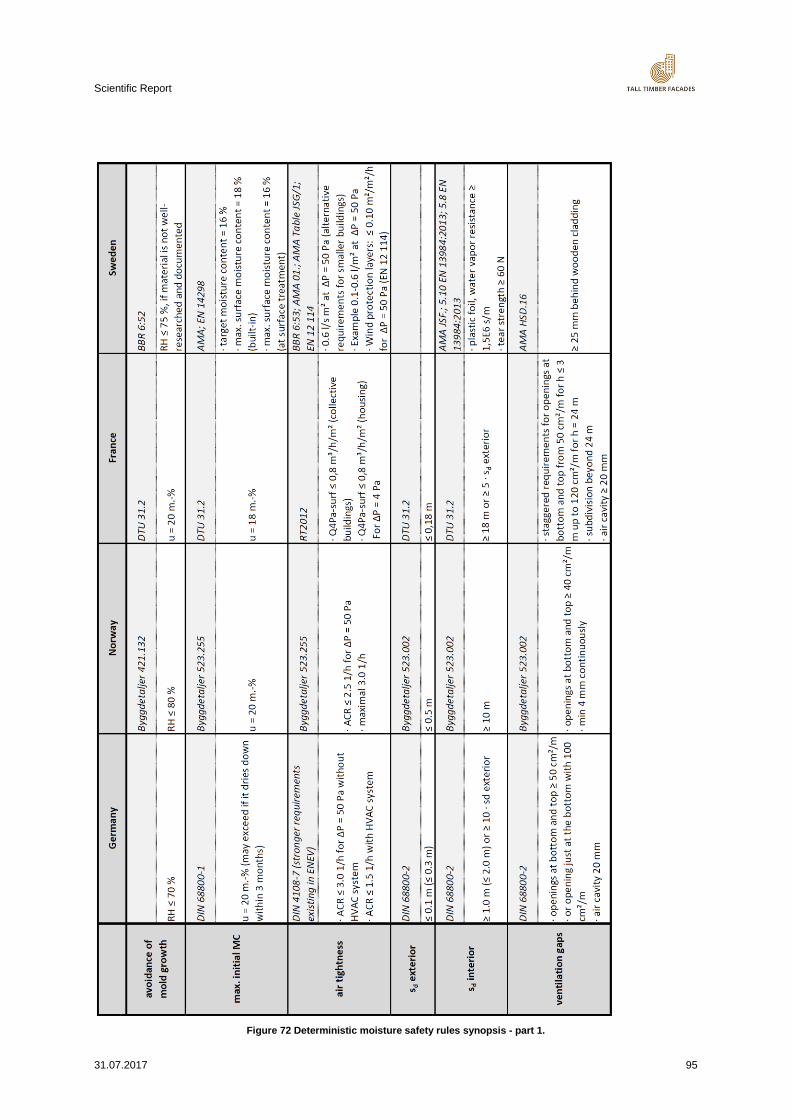
Scientific Report
31.07.2017 95
Figure 72 Deterministic moisture safety rules synopsis - part 1.
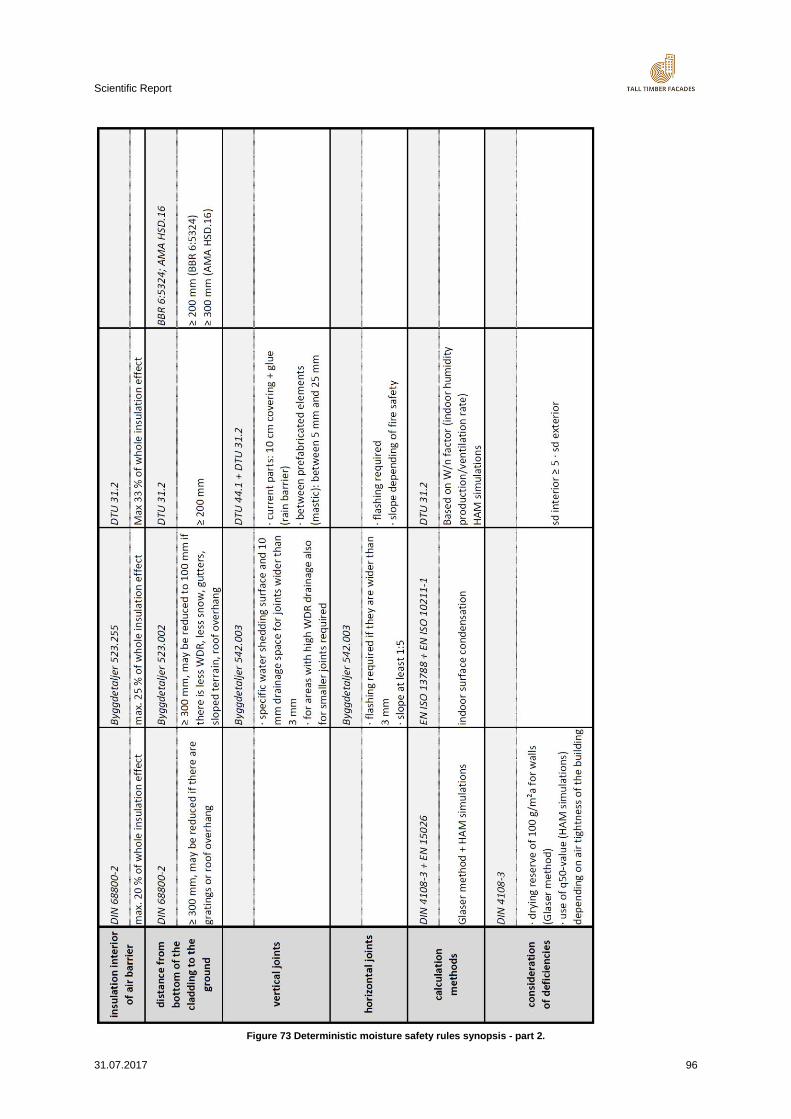
Scientific Report
31.07.2017 96
Figure 73 Deterministic moisture safety rules synopsis - part 2.
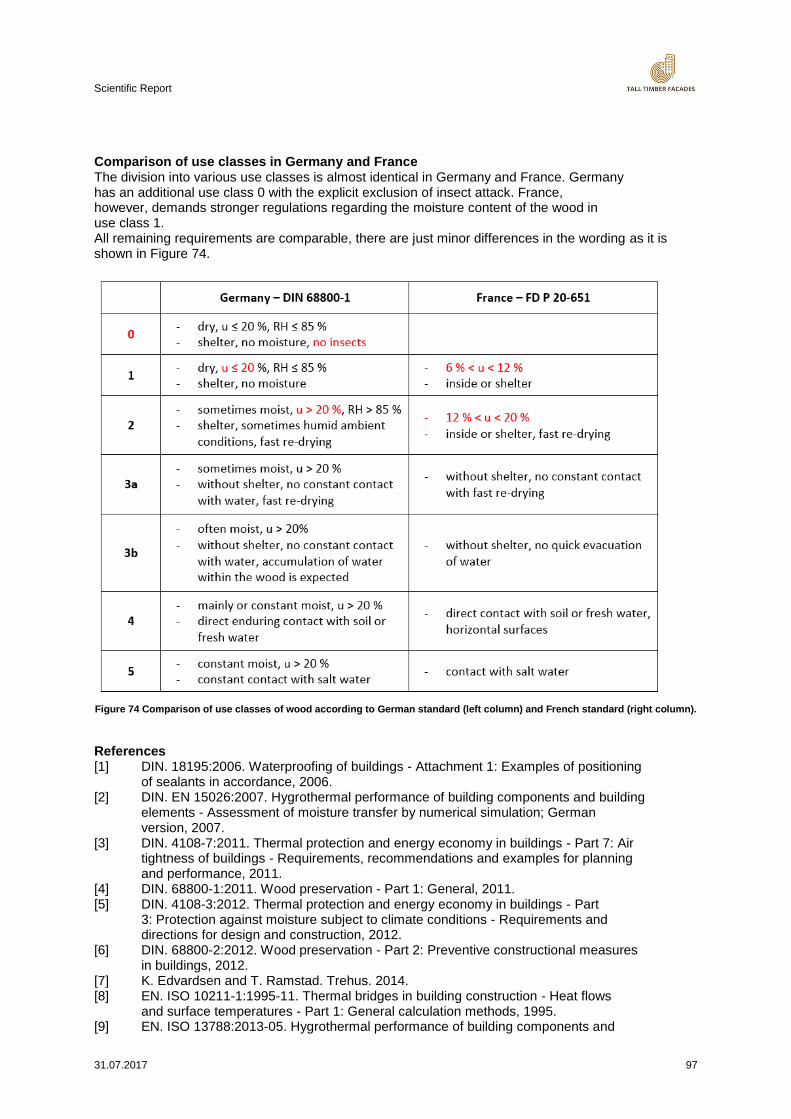
Scientific Report
31.07.2017 97
Comparison of use classes in Germany and France The division into various use classes is almost identical in Germany and France. Germany has an additional use class 0 with the explicit exclusion of insect attack. France, however, demands stronger regulations regarding the moisture content of the wood in use class 1. All remaining requirements are comparable, there are just minor differences in the wording as it is shown in Figure 74.
Figure 74 Comparison of use classes of wood according to German standard (left column) and French standard (right column).
References [1] DIN. 18195:2006. Waterproofing of buildings - Attachment 1: Examples of positioning
of sealants in accordance, 2006. [2] DIN. EN 15026:2007. Hygrothermal performance of building components and building
elements - Assessment of moisture transfer by numerical simulation; German version, 2007.
[3] DIN. 4108-7:2011. Thermal protection and energy economy in buildings - Part 7: Air tightness of buildings - Requirements, recommendations and examples for planning and performance, 2011.
[4] DIN. 68800-1:2011. Wood preservation - Part 1: General, 2011. [5] DIN. 4108-3:2012. Thermal protection and energy economy in buildings - Part
3: Protection against moisture subject to climate conditions - Requirements and directions for design and construction, 2012.
[6] DIN. 68800-2:2012. Wood preservation - Part 2: Preventive constructional measures in buildings, 2012.
[7] K. Edvardsen and T. Ramstad. Trehus. 2014. [8] EN. ISO 10211-1:1995-11. Thermal bridges in building construction - Heat flows
and surface temperatures - Part 1: General calculation methods, 1995. [9] EN. ISO 13788:2013-05. Hygrothermal performance of building components and
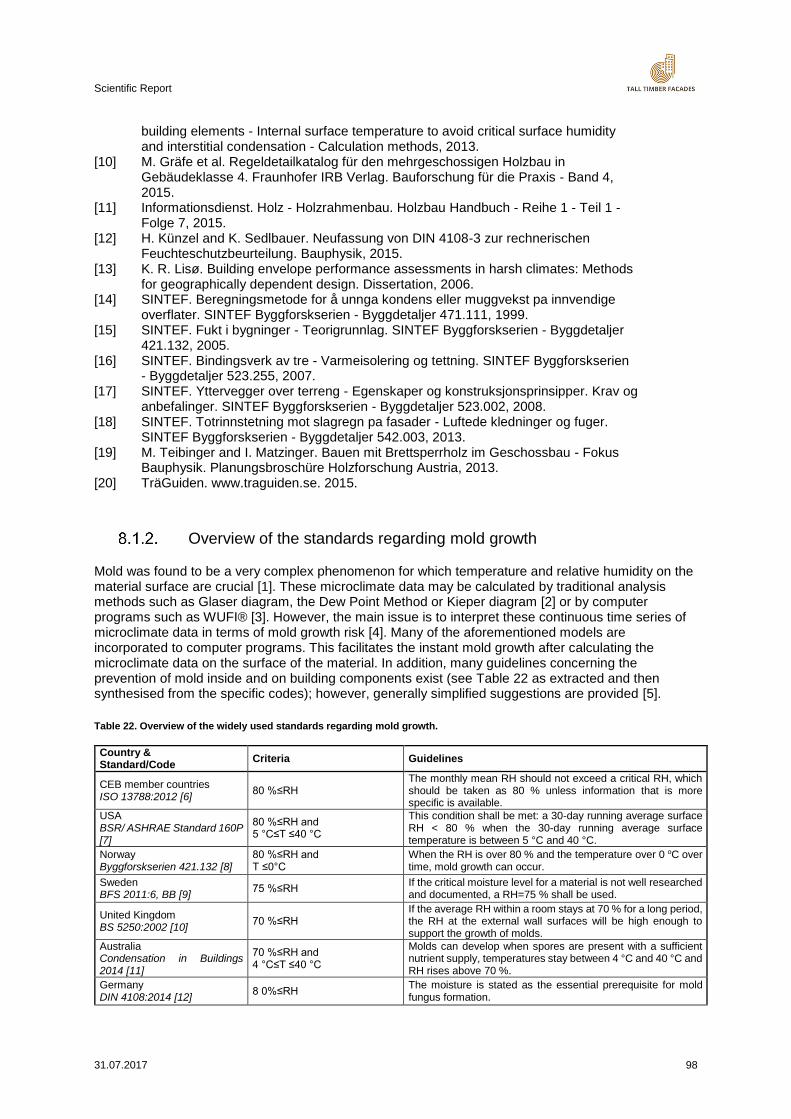
Scientific Report
31.07.2017 98
building elements - Internal surface temperature to avoid critical surface humidity and interstitial condensation - Calculation methods, 2013.
[10] M. Gräfe et al. Regeldetailkatalog für den mehrgeschossigen Holzbau in Gebäudeklasse 4. Fraunhofer IRB Verlag. Bauforschung für die Praxis - Band 4, 2015.
[11] Informationsdienst. Holz - Holzrahmenbau. Holzbau Handbuch - Reihe 1 - Teil 1 - Folge 7, 2015.
[12] H. Künzel and K. Sedlbauer. Neufassung von DIN 4108-3 zur rechnerischen Feuchteschutzbeurteilung. Bauphysik, 2015.
[13] K. R. Lisø. Building envelope performance assessments in harsh climates: Methods for geographically dependent design. Dissertation, 2006.
[14] SINTEF. Beregningsmetode for å unnga kondens eller muggvekst pa innvendige overflater. SINTEF Byggforskserien - Byggdetaljer 471.111, 1999.
[15] SINTEF. Fukt i bygninger - Teorigrunnlag. SINTEF Byggforskserien - Byggdetaljer 421.132, 2005.
[16] SINTEF. Bindingsverk av tre - Varmeisolering og tettning. SINTEF Byggforskserien - Byggdetaljer 523.255, 2007.
[17] SINTEF. Yttervegger over terreng - Egenskaper og konstruksjonsprinsipper. Krav og anbefalinger. SINTEF Byggforskserien - Byggdetaljer 523.002, 2008.
[18] SINTEF. Totrinnstetning mot slagregn pa fasader - Luftede kledninger og fuger. SINTEF Byggforskserien - Byggdetaljer 542.003, 2013.
[19] M. Teibinger and I. Matzinger. Bauen mit Brettsperrholz im Geschossbau - Fokus Bauphysik. Planungsbroschüre Holzforschung Austria, 2013.
[20] TräGuiden. www.traguiden.se. 2015.
Overview of the standards regarding mold growth
Mold was found to be a very complex phenomenon for which temperature and relative humidity on the material surface are crucial [1]. These microclimate data may be calculated by traditional analysis methods such as Glaser diagram, the Dew Point Method or Kieper diagram [2] or by computer programs such as WUFI® [3]. However, the main issue is to interpret these continuous time series of microclimate data in terms of mold growth risk [4]. Many of the aforementioned models are incorporated to computer programs. This facilitates the instant mold growth after calculating the microclimate data on the surface of the material. In addition, many guidelines concerning the prevention of mold inside and on building components exist (see Table 22 as extracted and then synthesised from the specific codes); however, generally simplified suggestions are provided [5].
Table 22. Overview of the widely used standards regarding mold growth.
Country & Standard/Code
Criteria Guidelines
CEB member countries ISO 13788:2012 [6]
80 %≤RH The monthly mean RH should not exceed a critical RH, which should be taken as 80 % unless information that is more specific is available.
USA BSR/ ASHRAE Standard 160P [7]
80 %≤RH and 5 °C≤T ≤40 °C
This condition shall be met: a 30-day running average surface RH < 80 % when the 30-day running average surface temperature is between 5 °C and 40 °C.
Norway Byggforskserien 421.132 [8]
80 %≤RH and T ≤0°C
When the RH is over 80 % and the temperature over 0 oC over time, mold growth can occur.
Sweden BFS 2011:6, BB [9]
75 %≤RH If the critical moisture level for a material is not well researched and documented, a RH=75 % shall be used.
United Kingdom BS 5250:2002 [10]
70 %≤RH If the average RH within a room stays at 70 % for a long period, the RH at the external wall surfaces will be high enough to support the growth of molds.
Australia Condensation in Buildings 2014 [11]
70 %≤RH and 4 °C≤T ≤40 °C
Molds can develop when spores are present with a sufficient nutrient supply, temperatures stay between 4 °C and 40 °C and RH rises above 70 %.
Germany DIN 4108:2014 [12]
8 0%≤RH The moisture is stated as the essential prerequisite for mold fungus formation.
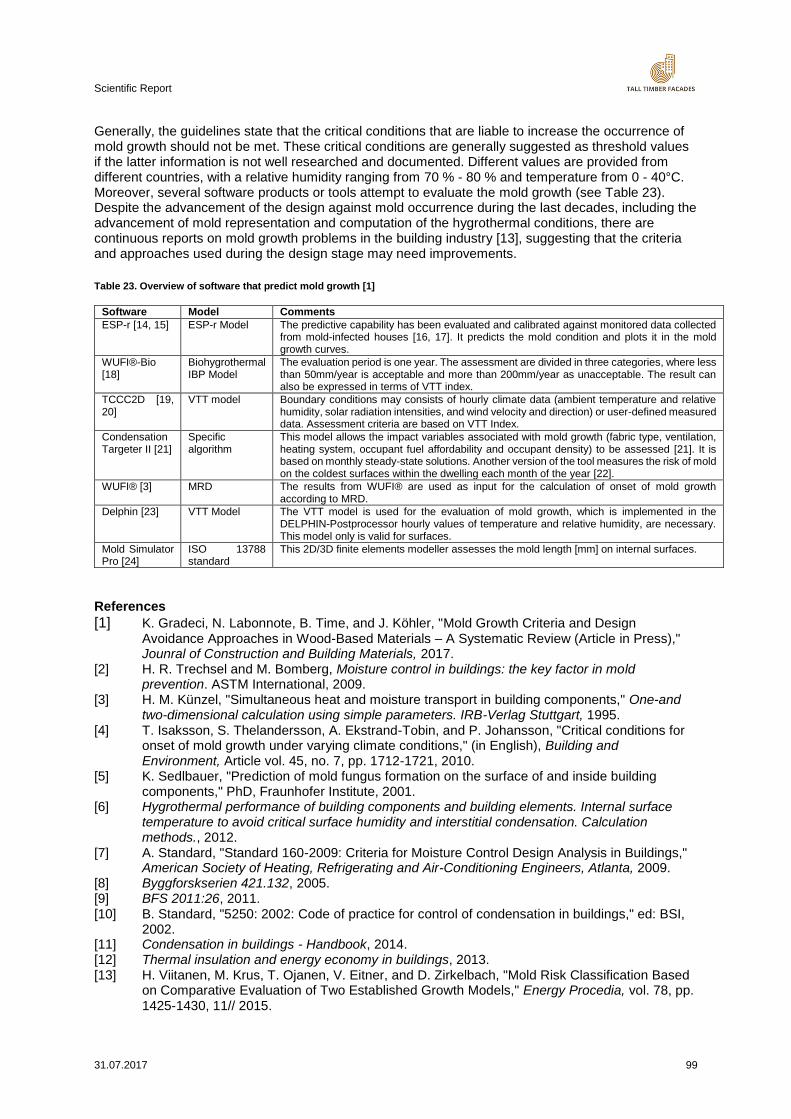
Scientific Report
31.07.2017 99
Generally, the guidelines state that the critical conditions that are liable to increase the occurrence of mold growth should not be met. These critical conditions are generally suggested as threshold values if the latter information is not well researched and documented. Different values are provided from different countries, with a relative humidity ranging from 70 % - 80 % and temperature from 0 - 40°C. Moreover, several software products or tools attempt to evaluate the mold growth (see Table 23). Despite the advancement of the design against mold occurrence during the last decades, including the advancement of mold representation and computation of the hygrothermal conditions, there are continuous reports on mold growth problems in the building industry [13], suggesting that the criteria and approaches used during the design stage may need improvements.
Table 23. Overview of software that predict mold growth [1]
Software Model Comments
ESP-r [14, 15] ESP-r Model The predictive capability has been evaluated and calibrated against monitored data collected from mold-infected houses [16, 17]. It predicts the mold condition and plots it in the mold growth curves.
WUFI®-Bio [18]
Biohygrothermal IBP Model
The evaluation period is one year. The assessment are divided in three categories, where less than 50mm/year is acceptable and more than 200mm/year as unacceptable. The result can also be expressed in terms of VTT index.
TCCC2D [19, 20]
VTT model Boundary conditions may consists of hourly climate data (ambient temperature and relative humidity, solar radiation intensities, and wind velocity and direction) or user-defined measured data. Assessment criteria are based on VTT Index.
Condensation Targeter II [21]
Specific algorithm
This model allows the impact variables associated with mold growth (fabric type, ventilation, heating system, occupant fuel affordability and occupant density) to be assessed [21]. It is based on monthly steady-state solutions. Another version of the tool measures the risk of mold on the coldest surfaces within the dwelling each month of the year [22].
WUFI® [3] MRD The results from WUFI® are used as input for the calculation of onset of mold growth according to MRD.
Delphin [23] VTT Model The VTT model is used for the evaluation of mold growth, which is implemented in the DELPHIN-Postprocessor hourly values of temperature and relative humidity, are necessary. This model only is valid for surfaces.
Mold Simulator Pro [24]
ISO 13788 standard
This 2D/3D finite elements modeller assesses the mold length [mm] on internal surfaces.
References
[1] K. Gradeci, N. Labonnote, B. Time, and J. Köhler, "Mold Growth Criteria and Design Avoidance Approaches in Wood-Based Materials – A Systematic Review (Article in Press)," Jounral of Construction and Building Materials, 2017.
[2] H. R. Trechsel and M. Bomberg, Moisture control in buildings: the key factor in mold prevention. ASTM International, 2009.
[3] H. M. Künzel, "Simultaneous heat and moisture transport in building components," One-and two-dimensional calculation using simple parameters. IRB-Verlag Stuttgart, 1995.
[4] T. Isaksson, S. Thelandersson, A. Ekstrand-Tobin, and P. Johansson, "Critical conditions for onset of mold growth under varying climate conditions," (in English), Building and Environment, Article vol. 45, no. 7, pp. 1712-1721, 2010.
[5] K. Sedlbauer, "Prediction of mold fungus formation on the surface of and inside building components," PhD, Fraunhofer Institute, 2001.
[6] Hygrothermal performance of building components and building elements. Internal surface temperature to avoid critical surface humidity and interstitial condensation. Calculation methods., 2012.
[7] A. Standard, "Standard 160-2009: Criteria for Moisture Control Design Analysis in Buildings," American Society of Heating, Refrigerating and Air-Conditioning Engineers, Atlanta, 2009.
[8] Byggforskserien 421.132, 2005. [9] BFS 2011:26, 2011. [10] B. Standard, "5250: 2002: Code of practice for control of condensation in buildings," ed: BSI,
2002. [11] Condensation in buildings - Handbook, 2014. [12] Thermal insulation and energy economy in buildings, 2013. [13] H. Viitanen, M. Krus, T. Ojanen, V. Eitner, and D. Zirkelbach, "Mold Risk Classification Based
on Comparative Evaluation of Two Established Growth Models," Energy Procedia, vol. 78, pp. 1425-1430, 11// 2015.
Scientific Report
31.07.2017 100
[14] J. Clarke, "Energy Systems Research Unit in collaboration with Department of Bioscience/Biotechnology, Energy Systems Unit," Dept of Bioscience and Biotechnology, University of Stracthclyde, 1996.
[15] J. A. Clarke, Energy simulation in building design. Routledge, 2001. [16] J. A. Clarke et al., "A technique for the prediction of the conditions leading to mold growth in
buildings," (in English), Building and Environment, Article vol. 34, no. 4, pp. 515-521, 1999. [17] J. Clarke, "Moisture flow modelling within the ESP-r integrated building performance
simulation system," (in English), Journal of Building Performance Simulation, Article vol. 6, no. 5, pp. 385-399, 2013.
[18] WUFI®®Bio, "WUFI®®Bio," ed: Fraunhofer IBP. [19] T. Ojanen, R. Kohonen, and M. K. Kumaran, "Modeling heat, air, and moisture transport
through building materials and components," Moisture control in buildings, pp. 18-34, 1994. [20] T. Ojanen, H. Viitanen, and R. Peuhkuri, "Modelling of Mold Growth in Building Envelopes," in
IEA-Annex Meeting Porto, 2007. [21] T. Oreszczyn and S. Pretlove, "Condensation Targeter II: Modelling surface relative humidity
to predict mold growth in dwellings," Building Services Engineering Research and Technology, vol. 20, no. 3, pp. 143-153, 1999.
[22] T. Oreszczyn and S. Pretlove, "Mold index," 2000. [23] B. B. Dresden, "Simulation program for the calculation of coupled heat, moisture, air, pollutant,
and salt transport," ed. [24] Dartwin, "Mold Simulator," ed. Italy.
Probabilistic safety concept
As reliability is already, a well-known paradigm in structural design it is more seldom used in other construction engineering fields. The moisture safety of building envelopes for example is a specific field of application where a high uncertainty about the exposure as well as the resistance of the envelope and its parts exist. The project Tall Timber Facades sets the starting point for a universal moisture reliability assessment and its framework for limit state design for wooden building envelopes. Beyond the existing safety approach the moisture protection concept TallFacades proposes, is based on a probabilistic examination that comprises the identification of the basic requirements and a procedure for the calculation of moisture intake into construction components, their reaction and the possible moisture accumulation. One focus is on the exposure and another on the implementation of failure modes describing the reaction of construction compositions. The problem is a huge amount of different envelope compositions and even the variations of similar composition frequently show different moisture behavior. The consequences hence were developed and assigned to the results on basis of life cycle costs and the repair scenario for selected parts of the facade. Further quantitative evaluation was done on the life cycle environmental impact by methods of LCA. Both are needed to identify the risks, which have to be managed within a company producing multi-storey, urban building envelopes. Eurocode Analogy In Eurocode 0 the foundations for the design of load-bearing structures are determined independently of the building material. TallFacades adopts these principles of the Eurocode 0 and describes the moisture safety concept in analogy to its preconditions. The safety concept is based on a limitation of the consequences and a categorization in damage categories or consequence classes by means of appropriate measures to avoid the limit state conditions. The consequence classes are supplemented and differentiated by reliability classes. In TallFacades a corresponding categorization has not yet been developed. This is not possible now because of the limited scope of the examined constructions and especially because of missing or not yet sufficiently documented damage cases. What has clearly emerged from the round of experts involved is the decisive influence of the monitoring measures during the planning phase. As a result, the quality assurance measures as described in c. 8.2. Are to be checked and, if possible, transferred to an existing QM system, or it is indispensable to create a company-internal QM system for multi-storey timber construction. Since this is also necessary, for example, in the monitoring of the structure for the manufacture of high-fire-resistant components from building class 4, both can be produced jointly.
Scientific Report
31.07.2017 101
Basic requirements A building envelope shall be designed and constructed in such a way as to ensure adequate reliability and economic viability during the erection and in the intended period of use
withstand the possible effects and influences;
retains the required performance characteristics.
In the planning and calculation of the building envelope
adequate moisture resistance,
convenience and
durability
must be observed.
Reliability For the building envelope falling within the scope of TallFacades, the required reliability shall be ensured by:
a) the design and the design according to the principles of humidified construction; b) using RiFa tools or other qualified methods; and c) appropriate
Execution and
Quality management measures are applied.
Design working life The design working life or the planned period of use is determined according to EC0 for a period of 50 years. Durability Moisture protection must be planned and implemented in such a way that time-dependent changes in the properties during the service life do not impair the building envelope or parts thereof; environmental conditions and maintenance measures must be taken into account. Quality management In order to create a building envelope which meets the requirements and the assumptions of the moisture safety criteria, appropriate quality assurance measures should be taken, cf. c. 8.2. These measures include:
the definition of the reliability requirements,
organizational measures and
monitoring during the planning phase, during execution, during use and maintenance.
Principles of limit state design It is necessary to differentiate between the ultimate limit state of the moisture safety and the serviceability limit state. Design situations The relevant design situations shall be determined taking account of the circumstances in which the building envelope must fulfill its function.
normal climate exposure
temporary exposure (e.g. u > 20% and duration < 3 months; construction or maintenance phase)
extraordinary exposure (e.g. natural hazard like thunderstorm, human error in design or construction)
In addition to the normal, temporary or extraordinary exposure, the planner must take into account the vulnerability to which the envelope is expected to be exposed to over the intended service life. The limit state defines the state from which parts of the building envelope no longer meet the relevant design criteria or design limits. Two basic limit states are distinguished. Firstly, the state of
Scientific Report
31.07.2017 102
serviceability, which marks the short-term and reversible overrun of limit criteria, here the moisture content of wood and wood materials. Secondly, the failure state, in which the component is massively and irreversibly damaged by excessively high and long-lasting moisture. While Eurocode 5 – Design of timber structures – only defines use classes for wood materials each is described with a broad range of environmental conditions. Only few national annexes e.g. the German one provide discreet numbers for allowed maximum moisture content in combination with surrounding conditions for respective use classes:
Use class 1: The use class 1 is characterized by a moisture content in the construction product, which corresponds to a temperature of 20 °C and a relative humidity of the ambient air that exceeds 65% for only a few weeks per year. In use class 1, the average moisture content of most conifers does not exceed 12% (EC5 NA: u in-between 5 % - 15 %).
Use class 2: The use class 2 is characterized by a moisture content in the building materials, which corresponds to a temperature of 20 ° C and a relative humidity of the ambient air, which exceeds 85% for only a few weeks per year. In use class 2, the average moisture content of most conifers does not exceed 20% (EC5 NA: u in-between 10 % - 20 %)
Use class 3: The use class 3 records climatic conditions which lead to higher moisture contents than in use class 2. (EC5 NA: u in-between 12 % - 24 %)
Limit State Design The limit states define the states beyond which the structure no longer fulfils the relevant design criteria. It will be divided by the serviceability limit state and the ultimate limit state. Limit State Design (LSD) for moisture safe building envelops mainly made of wood products. Design for limit states shall be based on the use of construction compositions and moisture load models for relevant limit states. It shall be verified that no limit state is exceeded when relevant design values for
actions,
material properties, or
product properties, and
geometrical data
are used in these models. The verifications shall be carried out for all relevant design situations and load cases. Serviceability Limit State of building envelopes States that correspond to conditions beyond which specified service requirements for a structure or structural member are no longer met. The limiting states, the
reduce the function of the building envelope or one of its parts under normal conditions of use (loss of heat insulation properties by moisture, swelling and shrinkage with settlements);
impair the well - being of users (mold on interior surfaces) or
the appearance of the structure (discoloration, deformations).
Are to be classified as limit states of usability. Serviceability Limit State (SLS) describes e.g. mold in the closed and airtight cavity of the wooden construction therefore it will not reach the interior air. Only if mold and the damaged area is affecting the interior surface meaning that it is releasing spores to the indoor air which and tenants might be exposed to them. A damage on interior surfaces can be detected quiet well because the wet material shows coloring or change of the smooth surface even it is a non-wooden material like plaster and gypsum, which is very often used to cover installation layers or just the interior side of structural members. A deterministic moisture content limit for SLS is not useful any more as a probabilistic approach is presented with the RiFa-Tool A in c. 8.3.2. The development of failure mode and the used failure mode models give appropriate limits of moisture content. Ultimate Limit State of building envelopes Ultimate Limit State (ULS) of building envelopes are states associated with collapse or with other similar forms of moisture related failure The limit states that concern:
Scientific Report
31.07.2017 103
the safety of people, and/or (caused by interior mold growth) or
the safety of the structural members (moisture creep or decay)
shall be classified as ultimate limit states. The following ultimate limit states of moisture safety shall be verified where they are relevant:
failure caused by fatigue or other time-dependent effects which is related to most of moisture related damages
loss of dry conditions and increase of moisture leading to cause of damage of the construction or any part of it, considered as a moisture proof building envelope;
failure by excessive deformation, transformation of the structure or any part of it into
a mechanism, loss of stability of the structure or any part of it, including
integrated components.
Ultimate Limit State (ULS) is also related to the moisture content of wood. Air dry u = 10 – 20 %, fibre saturation between 27-30 % depending on the wood species. The ULS is allowed above the fibre saturation for a short time. The ULS should be differentiated according to the use class and the duration of moisture above u = 20 %, cf. the Eurocode EC5-1-1/NA [3].
Reference [1] EN 1990:2002 Eurocode — Basis of structural design. [2] EN 1995-1-1:2010-12. 1995-1-1, Eurocode 5: Design of timber structures - Part 1-1: General -
Common rules and rules for buildings. [3] DIN EN 1995-1-1/NA:2013-08. National Annex - Nationally determined parameters -
Eurocode 5: Design of timber structures - Part 1-1: General - Common rules and rules for buildings. German version.
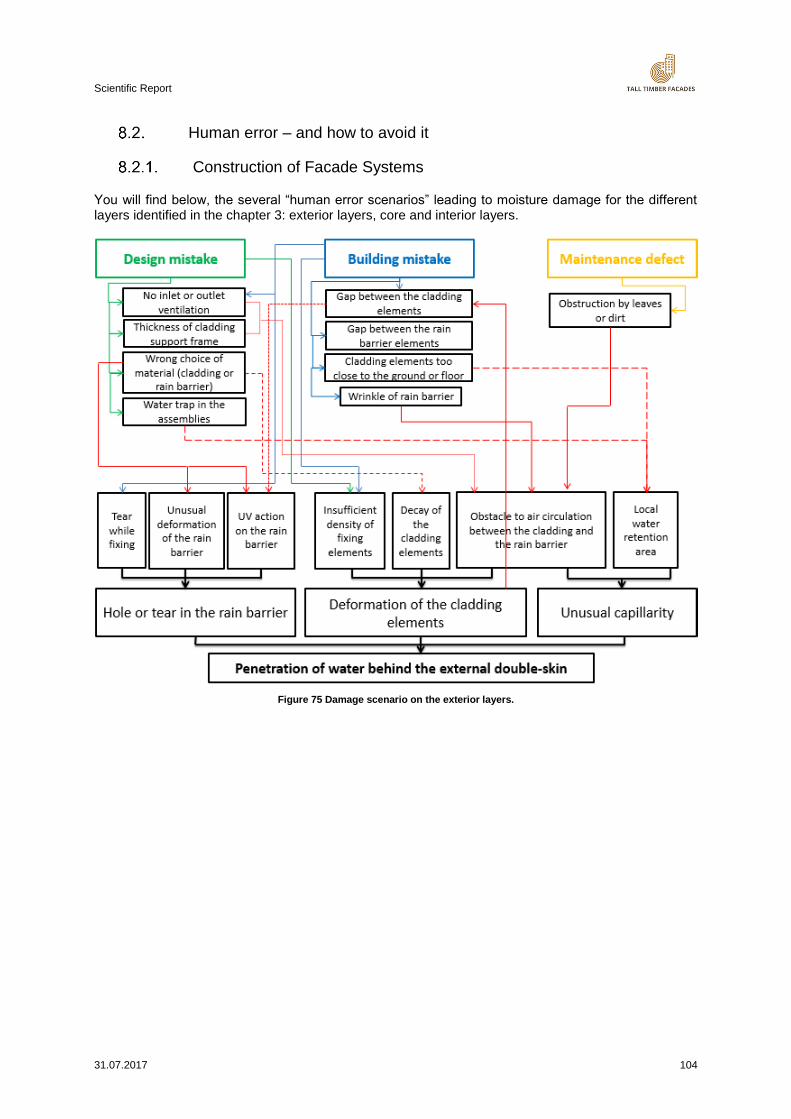
Scientific Report
31.07.2017 104
Human error – and how to avoid it
Construction of Facade Systems
You will find below, the several “human error scenarios” leading to moisture damage for the different layers identified in the chapter 3: exterior layers, core and interior layers.
Figure 75 Damage scenario on the exterior layers.

Scientific Report
31.07.2017 105
Figure 76. Damage scenario on the core of the facade.
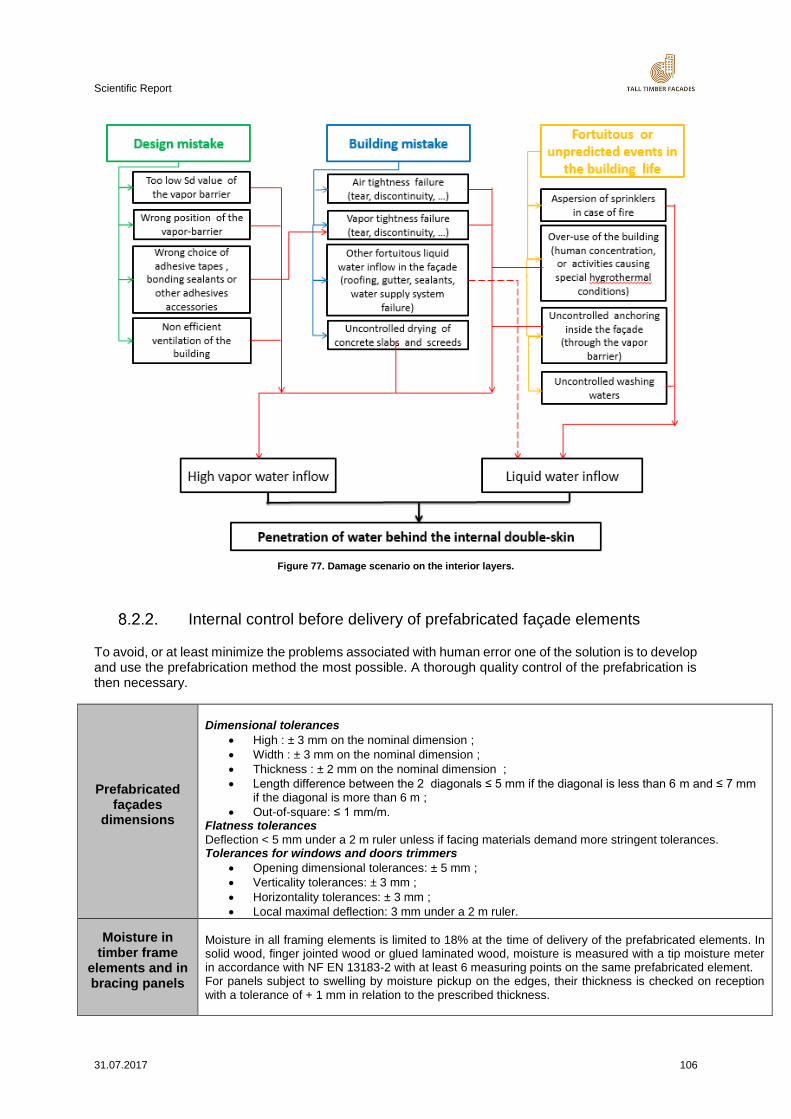
Scientific Report
31.07.2017 106
Figure 77. Damage scenario on the interior layers.
Internal control before delivery of prefabricated façade elements
To avoid, or at least minimize the problems associated with human error one of the solution is to develop and use the prefabrication method the most possible. A thorough quality control of the prefabrication is then necessary.
Prefabricated façades
dimensions
Dimensional tolerances
High : ± 3 mm on the nominal dimension ;
Width : ± 3 mm on the nominal dimension ;
Thickness : ± 2 mm on the nominal dimension ;
Length difference between the 2 diagonals ≤ 5 mm if the diagonal is less than 6 m and ≤ 7 mm if the diagonal is more than 6 m ;
Out-of-square: ≤ 1 mm/m. Flatness tolerances
Deflection < 5 mm under a 2 m ruler unless if facing materials demand more stringent tolerances. Tolerances for windows and doors trimmers
Opening dimensional tolerances: ± 5 mm ;
Verticality tolerances: ± 3 mm ;
Horizontality tolerances: ± 3 mm ;
Local maximal deflection: 3 mm under a 2 m ruler.
Moisture in timber frame
elements and in bracing panels
Moisture in all framing elements is limited to 18% at the time of delivery of the prefabricated elements. In solid wood, finger jointed wood or glued laminated wood, moisture is measured with a tip moisture meter in accordance with NF EN 13183-2 with at least 6 measuring points on the same prefabricated element. For panels subject to swelling by moisture pickup on the edges, their thickness is checked on reception with a tolerance of + 1 mm in relation to the prescribed thickness.
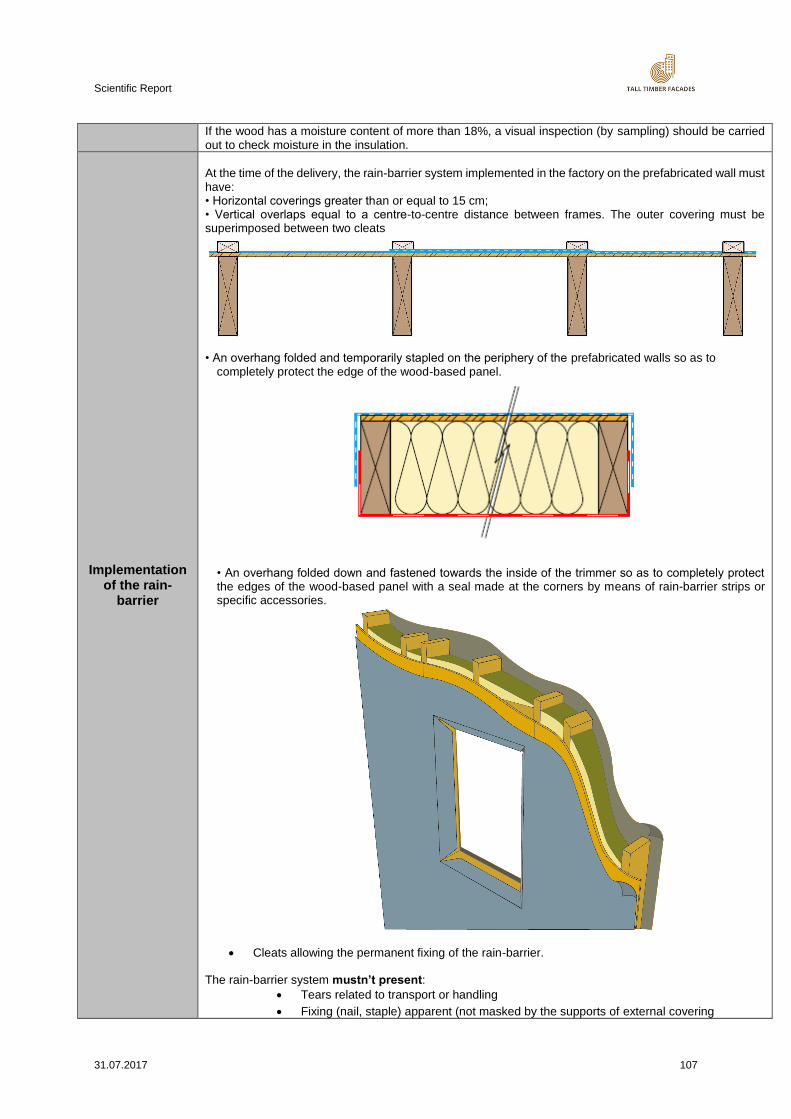
Scientific Report
31.07.2017 107
If the wood has a moisture content of more than 18%, a visual inspection (by sampling) should be carried out to check moisture in the insulation.
Implementation of the rain-
barrier
At the time of the delivery, the rain-barrier system implemented in the factory on the prefabricated wall must have: • Horizontal coverings greater than or equal to 15 cm; • Vertical overlaps equal to a centre-to-centre distance between frames. The outer covering must be superimposed between two cleats
• An overhang folded and temporarily stapled on the periphery of the prefabricated walls so as to
completely protect the edge of the wood-based panel.
• An overhang folded down and fastened towards the inside of the trimmer so as to completely protect the edges of the wood-based panel with a seal made at the corners by means of rain-barrier strips or specific accessories.
Cleats allowing the permanent fixing of the rain-barrier.
The rain-barrier system mustn’t present:
Tears related to transport or handling
Fixing (nail, staple) apparent (not masked by the supports of external covering
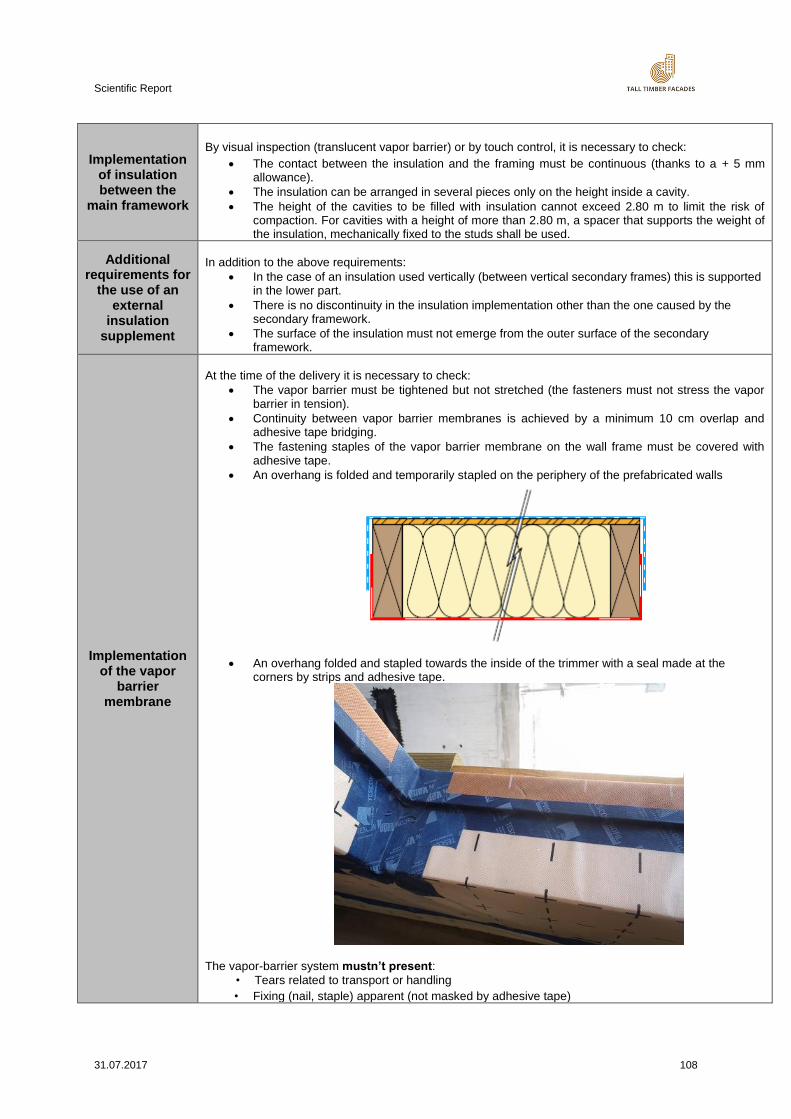
Scientific Report
31.07.2017 108
Implementation of insulation between the
main framework
By visual inspection (translucent vapor barrier) or by touch control, it is necessary to check:
The contact between the insulation and the framing must be continuous (thanks to a + 5 mm allowance).
The insulation can be arranged in several pieces only on the height inside a cavity.
The height of the cavities to be filled with insulation cannot exceed 2.80 m to limit the risk of compaction. For cavities with a height of more than 2.80 m, a spacer that supports the weight of the insulation, mechanically fixed to the studs shall be used.
Additional requirements for
the use of an external
insulation supplement
In addition to the above requirements:
In the case of an insulation used vertically (between vertical secondary frames) this is supported in the lower part.
There is no discontinuity in the insulation implementation other than the one caused by the secondary framework.
The surface of the insulation must not emerge from the outer surface of the secondary framework.
Implementation of the vapor
barrier membrane
At the time of the delivery it is necessary to check:
The vapor barrier must be tightened but not stretched (the fasteners must not stress the vapor barrier in tension).
Continuity between vapor barrier membranes is achieved by a minimum 10 cm overlap and adhesive tape bridging.
The fastening staples of the vapor barrier membrane on the wall frame must be covered with adhesive tape.
An overhang is folded and temporarily stapled on the periphery of the prefabricated walls
An overhang folded and stapled towards the inside of the trimmer with a seal made at the
corners by strips and adhesive tape.
The vapor-barrier system mustn’t present:
• Tears related to transport or handling
• Fixing (nail, staple) apparent (not masked by adhesive tape)
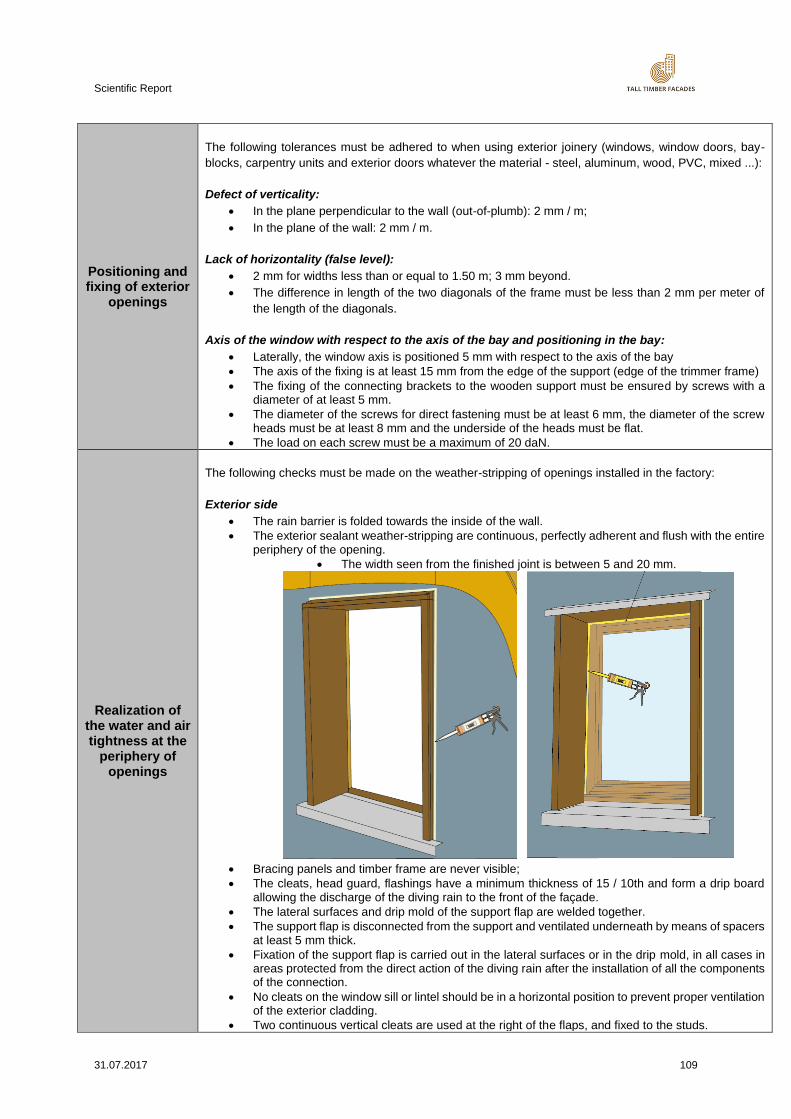
Scientific Report
31.07.2017 109
Positioning and fixing of exterior
openings
The following tolerances must be adhered to when using exterior joinery (windows, window doors, bay-
blocks, carpentry units and exterior doors whatever the material - steel, aluminum, wood, PVC, mixed ...):
Defect of verticality:
In the plane perpendicular to the wall (out-of-plumb): 2 mm / m;
In the plane of the wall: 2 mm / m.
Lack of horizontality (false level):
2 mm for widths less than or equal to 1.50 m; 3 mm beyond.
The difference in length of the two diagonals of the frame must be less than 2 mm per meter of
the length of the diagonals.
Axis of the window with respect to the axis of the bay and positioning in the bay:
Laterally, the window axis is positioned 5 mm with respect to the axis of the bay
The axis of the fixing is at least 15 mm from the edge of the support (edge of the trimmer frame)
The fixing of the connecting brackets to the wooden support must be ensured by screws with a diameter of at least 5 mm.
The diameter of the screws for direct fastening must be at least 6 mm, the diameter of the screw heads must be at least 8 mm and the underside of the heads must be flat.
The load on each screw must be a maximum of 20 daN.
Realization of the water and air tightness at the
periphery of openings
The following checks must be made on the weather-stripping of openings installed in the factory:
Exterior side
The rain barrier is folded towards the inside of the wall.
The exterior sealant weather-stripping are continuous, perfectly adherent and flush with the entire periphery of the opening.
The width seen from the finished joint is between 5 and 20 mm.
Bracing panels and timber frame are never visible;
The cleats, head guard, flashings have a minimum thickness of 15 / 10th and form a drip board allowing the discharge of the diving rain to the front of the façade.
The lateral surfaces and drip mold of the support flap are welded together.
The support flap is disconnected from the support and ventilated underneath by means of spacers at least 5 mm thick.
Fixation of the support flap is carried out in the lateral surfaces or in the drip mold, in all cases in areas protected from the direct action of the diving rain after the installation of all the components of the connection.
No cleats on the window sill or lintel should be in a horizontal position to prevent proper ventilation of the exterior cladding.
Two continuous vertical cleats are used at the right of the flaps, and fixed to the studs.
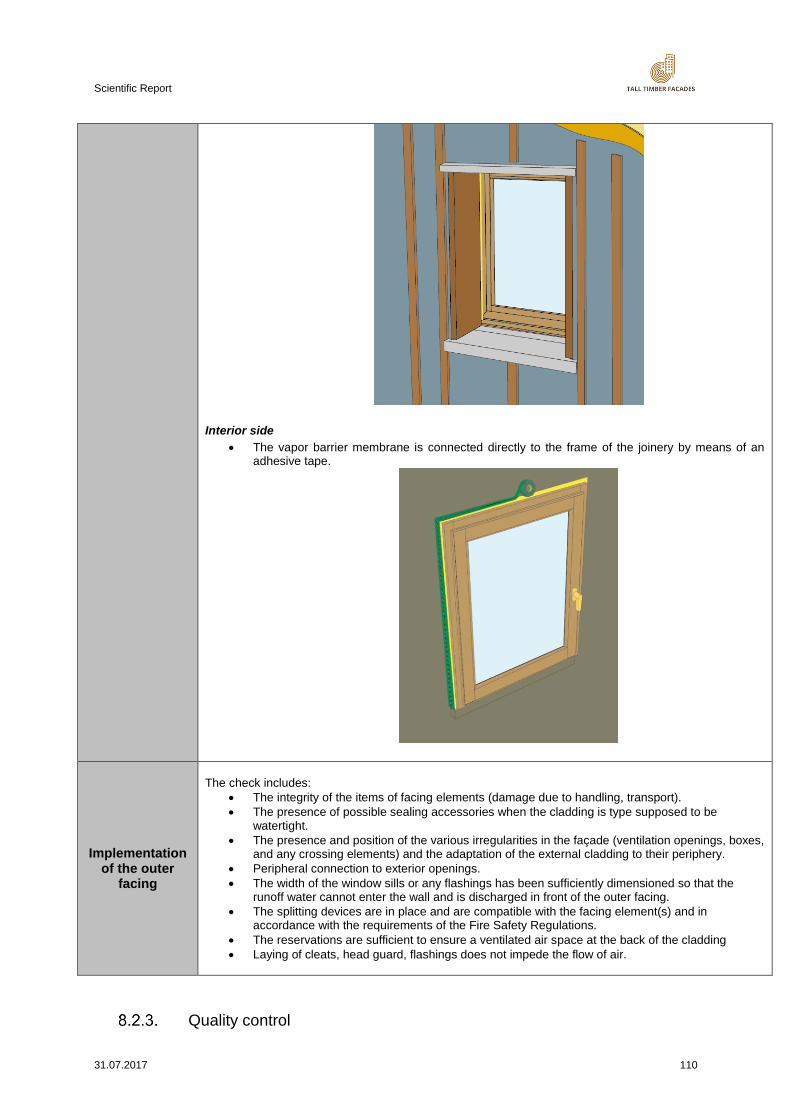
Scientific Report
31.07.2017 110
Interior side
The vapor barrier membrane is connected directly to the frame of the joinery by means of an adhesive tape.
Implementation of the outer
facing
The check includes:
The integrity of the items of facing elements (damage due to handling, transport).
The presence of possible sealing accessories when the cladding is type supposed to be watertight.
The presence and position of the various irregularities in the façade (ventilation openings, boxes, and any crossing elements) and the adaptation of the external cladding to their periphery.
Peripheral connection to exterior openings.
The width of the window sills or any flashings has been sufficiently dimensioned so that the runoff water cannot enter the wall and is discharged in front of the outer facing.
The splitting devices are in place and are compatible with the facing element(s) and in accordance with the requirements of the Fire Safety Regulations.
The reservations are sufficient to ensure a ventilated air space at the back of the cladding
Laying of cleats, head guard, flashings does not impede the flow of air.
Quality control
Scientific Report
31.07.2017 111
- Internal control (manufacture production control) The manufacturer is obliged to take a set of pre-established and systematic provisions to give confidence in obtaining the required quality. These provisions are described in a compendium of procedures and audited during the fact-finding visit. The manufacturer is obliged to carry out the necessary checks for the design and manufacturing steps and to record them on a permanently maintained medium at the disposal of the quality auditors. All the results of these checks must be recorded and kept for a period of at least 5 years and can be consulted at any time by the quality auditors. An acceptance check must be carried out on all the products used in the manufacture of the elements under certification. This control must include, among others: wood, connectors, treatment products, adhesives, structural panels, etc. These controls can be: dimensional, hygrometric, qualitative, etc. (see above). Controls must be carried out on all manufacturing steps to ensure that the required conditions and requirements are met. Similarly, the manufacturer must carry out checks on the finished products in order to verify that the products are strictly in accordance with the initial production data. In order to ensure that the data collected during the various checks linked to measurements are reliable, the manufacturer is required to verify and / or periodically calibrate all its monitoring means. These calibrations and verifications may be carried out, depending on their nature, either by the manufacturer or by a third party, which must then be recognized for this purpose.
- External control Quality control body carries out at least 2 audits per year. A production obligation must be complied with, on at least one of the two annual audits. If quality control body deems it necessary, the audits may be carried out unexpectedly. Technical audits at the manufacturing site include, in particular, visits to the design office, manufacturing facilities, possible "in situ" tests, consultation of the registrations of the various checks carried out by the holder and the operation. These audits also include an examination of any changes made to the design, manufacturing and control means and their consequences for achieving the required quality level. The following points will be examined at each of the periodic audits:
Activities of the design office
Verification of design methods and calculations used
Compliance of established calculation notes
Verification of installation plans, bracing and anti-buckling These examinations are conducted on a sample basis. Technical auditors may take technical files as
they deem necessary for a more complete audit.
Manufacturing conditions
Procurement Requirements
Wood quality and moisture at the time of manufacture
Quality of machining
Assemblies
Compliance of products manufactured with calculation parameters
Preservation treatment (*) Markings - Informative documents
Verification of the marking of the elements (and marking of bracing parts when they are part of the batch)
Scientific Report
31.07.2017 112
Preparation of declarations of conformity and technical documents necessary for the implementation of the elements.
The technical auditors may take any samples they deem necessary to verify the quality of the wood, the assemblies, the effectiveness of the treatment, the resistance of the structures, etc. They may request communication of the calculation methods.
Guideline for Robust Construction
Basic Principles of Moisture Safe Building with Wood
The objective of this guideline is to give support to moisture safe wooden envelopes but also start the discussion about how consequences can be evaluated; identified, categorized and how costly are different categories of consequences are. Apart from repair or replacement measures, avoiding damages should be of highest priority. This strategy also causes costs and are indirect consequences. This is essential for the risk assessment process because the risk or cost mitigation should always be lower than the resources of removing, repairing and avoiding future failure. The probability of consequences of inaction have to be taken into account carefully but this was already explained in depth in c. 3.2.5.ff. On one hand, a construction project has to cope with the physical actions to improve moisture safety technically. This can be assessed much better because it is founded on facts and quantifiable costs of risk reduction and a cost-benefit analysis is easier to deal with. On the other hand, there are softer measures, e.g. processes in planning and construction with investment in people or in their capacity building, where the results are much more difficult to evaluate. Hence, in construction projects and especially for facades the part individual ideas and wishes are requested by clients and non-standardized solutions have to be offered by companies. Investment in “soft” risk reducing measures promises to be quiet effective. Companies are recommended to install internal Quality Control (QC) and Quality Management (QM) procedures. The main issue is to set up a failure incident report and tracking system. The collected incidents that should be linked to costs have to be categorized into Moisture Related Failure (MRF) and further identification if it is caused during design, production or on-site construction. After an invest in capacity the result is identifiable in a decrease of MRF - but it might take some effort to collect enough data to measure a failure decrease), The offer of such non-standard solution should be made with a risk assessment procedure that is outlined in the following bullet points:
Risk assessment should be part of decision making process (event tree),
explicitly address uncertainty and assumptions (event tree),
be a systematic and structured process (event tree),
be based on the best available information (consider QC and QM measures),
be tailorable (yes, for different constructions possible, only the failure tree has to be adopted to new facade connections and assumptions on probability of failure have to be collected or derived from existing data),
as responsible planner or construction company take human errors into account. Existing moisture-safety rules and principles should be applied within design, production and construction processes. Here the principles of the German standard [1] for wood preservation and espacially its part 2 - Preventive constructional measures in buildings - defines basic safety principles:
Planning of moisture safety in the area of interior and exterior defense layers (this can be supported by a systematic procedure with the event-tree of RiFa-Tool B),
Material production, packaging, storage, transport and construction or mounting of wood should avoid moisture exposure,
Notice special properties and conditions for wood products (boards or panels from wood raw material) according to use class defined in the Eurocode 5 NA,
Prefer off-site prefabrication in dry and warm conditions,
Scientific Report
31.07.2017 113
Moisture protection measures on-site during mounting and fixing (e.g. avoiding settlements by insufficient fixing or due to high moisture content of wood)
Quality control (QC) of the production and mounting process (the comprehensive risk management based planning process has already identified the risk hotspots where additional safety measures have to be taken or where preventive planning should be done),
Control moisture content of the built-in construction wood or wood products and insulation material in general,
Use dry wood u < 20 % which is technically dried (ideally to the moisture conditions in the state of use)
Limit duration time of exposure and high moisture content (e.g. due to rain during construction),
Notice specific requirements for risk construction components (wall, roof, ceiling, foundation plate of crawl space, etc.),
Air tight components to avoid convection,
Avoidance of condensation by high water vapor diffusion,
Wind tight, first defense layer (might also support moisture safety),
Heat-bridge free joints (avoid condensation at heat-bridges),
Preventive measures which reduce moisture exposure (e.g. limit distance of wood close to ground, provide roof overhang),
Wood species selection with appropriate durability (use classes of wood),
Re-drying capacity of components (safety margin of moisture dry out amount ≥ 250 g/(m²a) in roofs and ≥ 100 g/(m²a) in walls using “Glaser” method),
Avoid moisture from building’s use (e.g. bathroom use, damage by accidents like broken washing machine or sprinklers, damage by leaking installations)
Notice Serviceability Limit State (SLS) and Ultimate Limit State (ULS) described in c. 8.1.3.
Reference [1] DIN 68800-2:2012 Wood preservation. Part 2 - Preventive constructional measures in
buildings defines basic safety principles. German version. [2] EN 350-2 Durability of wood and wood products. [3] DIN EN 844-2:1997-08. Round and sawn timber - Terminology - Part 4: Terms relating to
moisture content. German version.
RiFa-Tool A
Moisture protection of wooden building shells depends on limits of moisture load on materials and different resistance of the materials as well as the interaction between the layers of the overall structure of the shell construction. The wood moisture is an important physical parameter for the assessment of the strength properties of wood and it is the decisive factor for the development of biotic damage to wood from wood destroying insects and from wood destroying fungi. The exposure from the climate varies, over the course of the year as well as with the location. It also depends on other local conditions such as microclimate, wind driven rain, topography, and interaction between height and geometry of a building and even construction connections. This leads to a statistical distribution of the exposure as moisture impact on the construction, particularly the incorporated wooden material, and the associated uncertainties in the reaction and even the failure of the wood or wood products of the shell components. The different properties of the building materials used vary in large bandwidths and therefore have different responses to the influence of moisture and the susceptibility of the construction. Moreover, the moisture content is strongly influenced by the way the material is joint or the construction system used. In addition, wood can tolerate certain higher moisture contents over short time if it dries again afterwards. This results in a hard to predict moisture behavior of a building shell, which is strongly dependent on the uncertainties in the correct construction works. For this reason, the concept of the limit state design, which is applied in the Eurocode for the design of load-bearing structures, was a starting point in the research proposal for the improvement of moisture safety. In this way, the fundamentals and a framework for the implementation of a semi-probabilistic
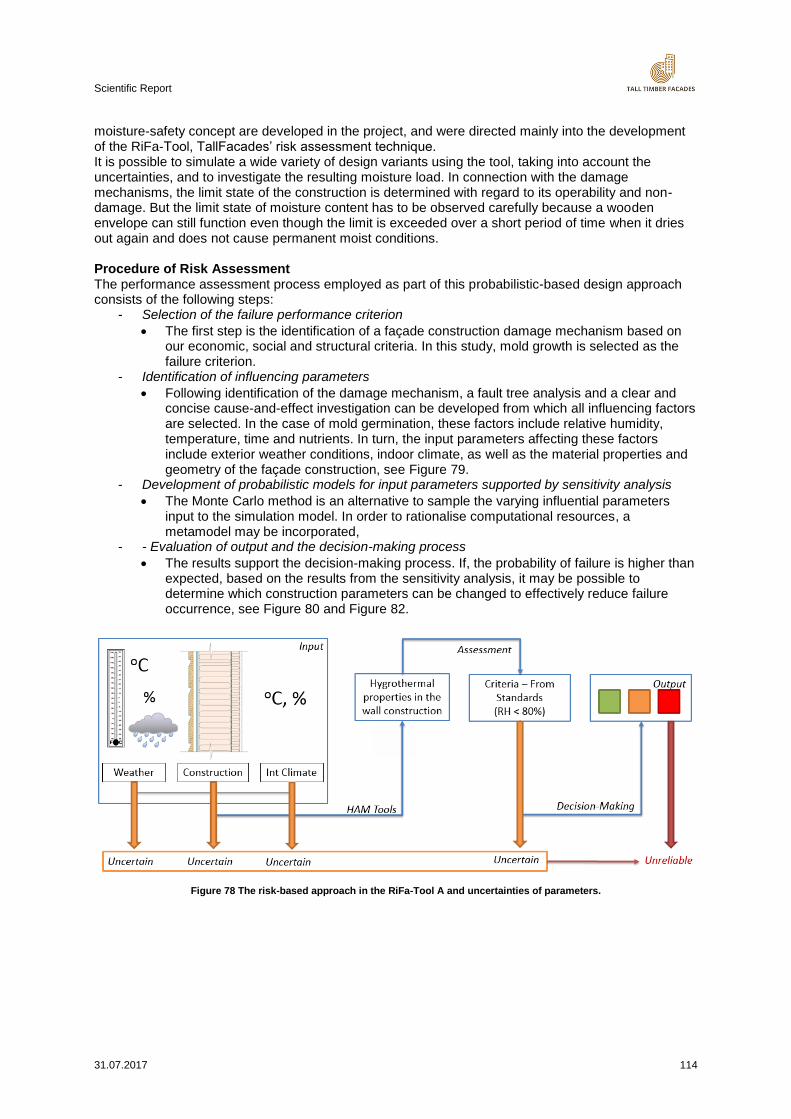
Scientific Report
31.07.2017 114
moisture-safety concept are developed in the project, and were directed mainly into the development of the RiFa-Tool, TallFacades’ risk assessment technique. It is possible to simulate a wide variety of design variants using the tool, taking into account the uncertainties, and to investigate the resulting moisture load. In connection with the damage mechanisms, the limit state of the construction is determined with regard to its operability and non-damage. But the limit state of moisture content has to be observed carefully because a wooden envelope can still function even though the limit is exceeded over a short period of time when it dries out again and does not cause permanent moist conditions. Procedure of Risk Assessment The performance assessment process employed as part of this probabilistic-based design approach consists of the following steps:
- Selection of the failure performance criterion
The first step is the identification of a façade construction damage mechanism based on our economic, social and structural criteria. In this study, mold growth is selected as the failure criterion.
- Identification of influencing parameters
Following identification of the damage mechanism, a fault tree analysis and a clear and concise cause-and-effect investigation can be developed from which all influencing factors are selected. In the case of mold germination, these factors include relative humidity, temperature, time and nutrients. In turn, the input parameters affecting these factors include exterior weather conditions, indoor climate, as well as the material properties and geometry of the façade construction, see Figure 79.
- Development of probabilistic models for input parameters supported by sensitivity analysis
The Monte Carlo method is an alternative to sample the varying influential parameters input to the simulation model. In order to rationalise computational resources, a metamodel may be incorporated,
- - Evaluation of output and the decision-making process
The results support the decision-making process. If, the probability of failure is higher than expected, based on the results from the sensitivity analysis, it may be possible to determine which construction parameters can be changed to effectively reduce failure occurrence, see Figure 80 and Figure 82.
Figure 78 The risk-based approach in the RiFa-Tool A and uncertainties of parameters.
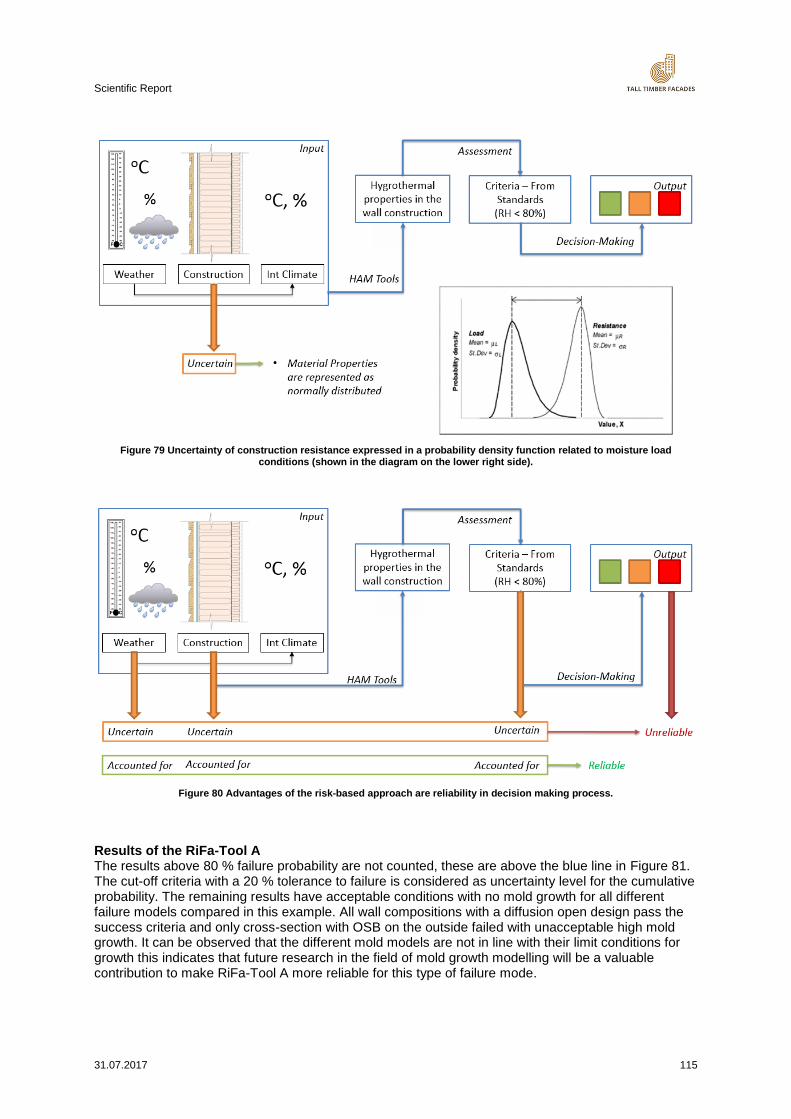
Scientific Report
31.07.2017 115
Figure 79 Uncertainty of construction resistance expressed in a probability density function related to moisture load
conditions (shown in the diagram on the lower right side).
Figure 80 Advantages of the risk-based approach are reliability in decision making process.
Results of the RiFa-Tool A The results above 80 % failure probability are not counted, these are above the blue line in Figure 81. The cut-off criteria with a 20 % tolerance to failure is considered as uncertainty level for the cumulative probability. The remaining results have acceptable conditions with no mold growth for all different failure models compared in this example. All wall compositions with a diffusion open design pass the success criteria and only cross-section with OSB on the outside failed with unacceptable high mold growth. It can be observed that the different mold models are not in line with their limit conditions for growth this indicates that future research in the field of mold growth modelling will be a valuable contribution to make RiFa-Tool A more reliable for this type of failure mode.
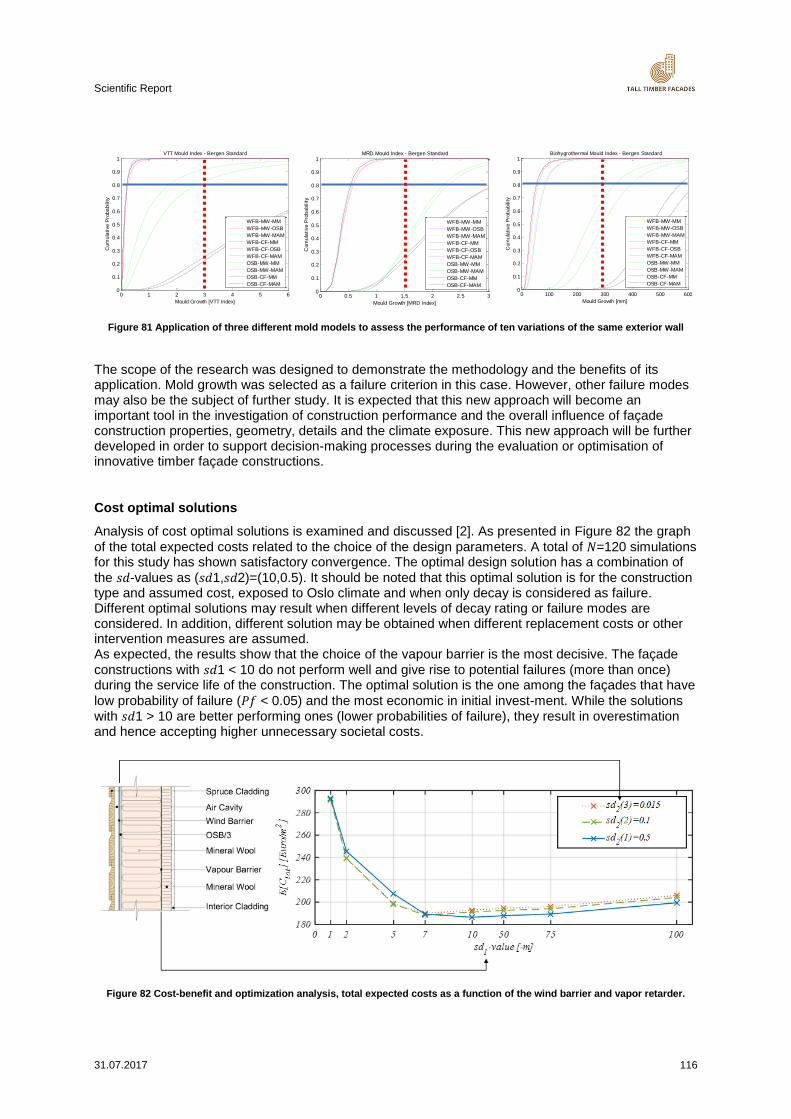
Scientific Report
31.07.2017 116
Figure 81 Application of three different mold models to assess the performance of ten variations of the same exterior wall
The scope of the research was designed to demonstrate the methodology and the benefits of its application. Mold growth was selected as a failure criterion in this case. However, other failure modes may also be the subject of further study. It is expected that this new approach will become an important tool in the investigation of construction performance and the overall influence of façade construction properties, geometry, details and the climate exposure. This new approach will be further developed in order to support decision-making processes during the evaluation or optimisation of innovative timber façade constructions.
Cost optimal solutions
Analysis of cost optimal solutions is examined and discussed [2]. As presented in Figure 82 the graph
of the total expected costs related to the choice of the design parameters. A total of 𝑁=120 simulations for this study has shown satisfactory convergence. The optimal design solution has a combination of
the 𝑠𝑑-values as (𝑠𝑑1,𝑠𝑑2)=(10,0.5). It should be noted that this optimal solution is for the construction type and assumed cost, exposed to Oslo climate and when only decay is considered as failure. Different optimal solutions may result when different levels of decay rating or failure modes are considered. In addition, different solution may be obtained when different replacement costs or other intervention measures are assumed. As expected, the results show that the choice of the vapour barrier is the most decisive. The façade
constructions with 𝑠𝑑1 < 10 do not perform well and give rise to potential failures (more than once) during the service life of the construction. The optimal solution is the one among the façades that have
low probability of failure (𝑃𝑓 < 0.05) and the most economic in initial invest-ment. While the solutions with 𝑠𝑑1 > 10 are better performing ones (lower probabilities of failure), they result in overestimation and hence accepting higher unnecessary societal costs.
Figure 82 Cost-benefit and optimization analysis, total expected costs as a function of the wind barrier and vapor retarder.
0 1 2 3 4 5 60
0.1
0.2
0.3
0.4
0.5
0.6
0.7
0.8
0.9
1
Mould Growth [VTT Index]
Cum
ula
tive P
rob
abilit
y
VTT Mould Index - Bergen Standard
WFB-MW-MM
WFB-MW-OSB
WFB-MW-MAM
WFB-CF-MM
WFB-CF-OSB
WFB-CF-MAM
OSB-MW-MM
OSB-MW-MAM
OSB-CF-MM
OSB-CF-MAM
0 0.5 1 1.5 2 2.5 30
0.1
0.2
0.3
0.4
0.5
0.6
0.7
0.8
0.9
1
Mould Growth [MRD Index]C
um
ula
tive P
rob
abilit
y
MRD Mould Index - Bergen Standard
WFB-MW-MM
WFB-MW-OSB
WFB-MW-MAM
WFB-CF-MM
WFB-CF-OSB
WFB-CF-MAM
OSB-MW-MM
OSB-MW-MAM
OSB-CF-MM
OSB-CF-MAM
0 100 200 300 400 500 6000
0.1
0.2
0.3
0.4
0.5
0.6
0.7
0.8
0.9
1
Mould Growth [mm]
Cum
ula
tive P
rob
abilit
y
Biohygrothermal Mould Index - Bergen Standard
WFB-MW-MM
WFB-MW-OSB
WFB-MW-MAM
WFB-CF-MM
WFB-CF-OSB
WFB-CF-MAM
OSB-MW-MM
OSB-MW-MAM
OSB-CF-MM
OSB-CF-MAM
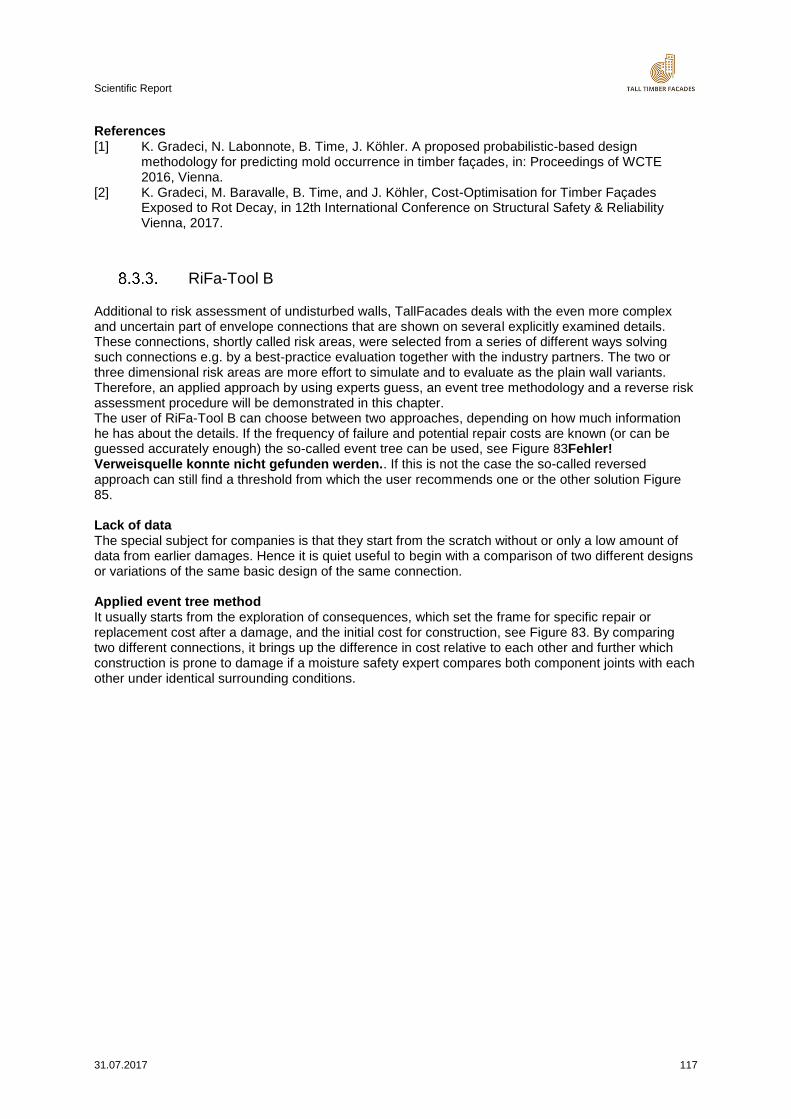
Scientific Report
31.07.2017 117
References [1] K. Gradeci, N. Labonnote, B. Time, J. Köhler. A proposed probabilistic-based design
methodology for predicting mold occurrence in timber façades, in: Proceedings of WCTE 2016, Vienna.
[2] K. Gradeci, M. Baravalle, B. Time, and J. Köhler, Cost-Optimisation for Timber Façades Exposed to Rot Decay, in 12th International Conference on Structural Safety & Reliability Vienna, 2017.
RiFa-Tool B
Additional to risk assessment of undisturbed walls, TallFacades deals with the even more complex and uncertain part of envelope connections that are shown on several explicitly examined details. These connections, shortly called risk areas, were selected from a series of different ways solving such connections e.g. by a best-practice evaluation together with the industry partners. The two or three dimensional risk areas are more effort to simulate and to evaluate as the plain wall variants. Therefore, an applied approach by using experts guess, an event tree methodology and a reverse risk assessment procedure will be demonstrated in this chapter. The user of RiFa-Tool B can choose between two approaches, depending on how much information he has about the details. If the frequency of failure and potential repair costs are known (or can be guessed accurately enough) the so-called event tree can be used, see Figure 83Fehler! Verweisquelle konnte nicht gefunden werden.. If this is not the case the so-called reversed approach can still find a threshold from which the user recommends one or the other solution Figure 85. Lack of data The special subject for companies is that they start from the scratch without or only a low amount of data from earlier damages. Hence it is quiet useful to begin with a comparison of two different designs or variations of the same basic design of the same connection. Applied event tree method It usually starts from the exploration of consequences, which set the frame for specific repair or replacement cost after a damage, and the initial cost for construction, see Figure 83. By comparing two different connections, it brings up the difference in cost relative to each other and further which construction is prone to damage if a moisture safety expert compares both component joints with each other under identical surrounding conditions.
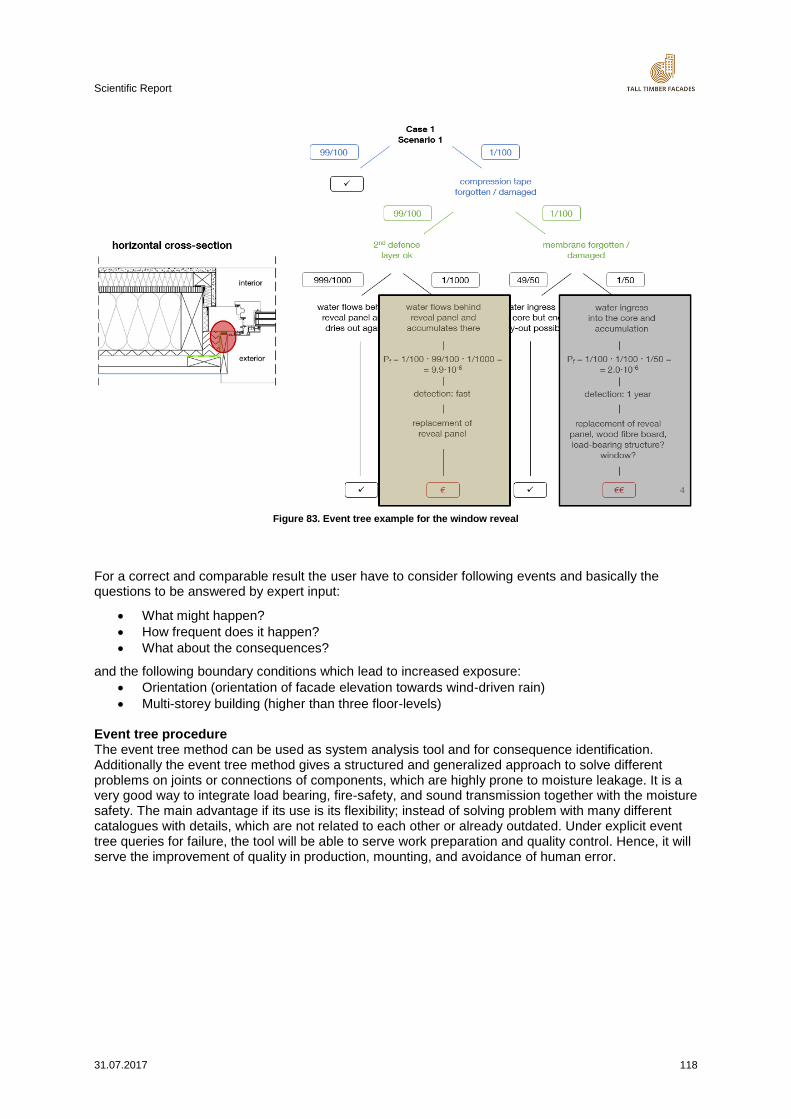
Scientific Report
31.07.2017 118
Figure 83. Event tree example for the window reveal
For a correct and comparable result the user have to consider following events and basically the questions to be answered by expert input:
What might happen?
How frequent does it happen?
What about the consequences?
and the following boundary conditions which lead to increased exposure:
Orientation (orientation of facade elevation towards wind-driven rain)
Multi-storey building (higher than three floor-levels) Event tree procedure The event tree method can be used as system analysis tool and for consequence identification. Additionally the event tree method gives a structured and generalized approach to solve different problems on joints or connections of components, which are highly prone to moisture leakage. It is a very good way to integrate load bearing, fire-safety, and sound transmission together with the moisture safety. The main advantage if its use is its flexibility; instead of solving problem with many different catalogues with details, which are not related to each other or already outdated. Under explicit event tree queries for failure, the tool will be able to serve work preparation and quality control. Hence, it will serve the improvement of quality in production, mounting, and avoidance of human error.
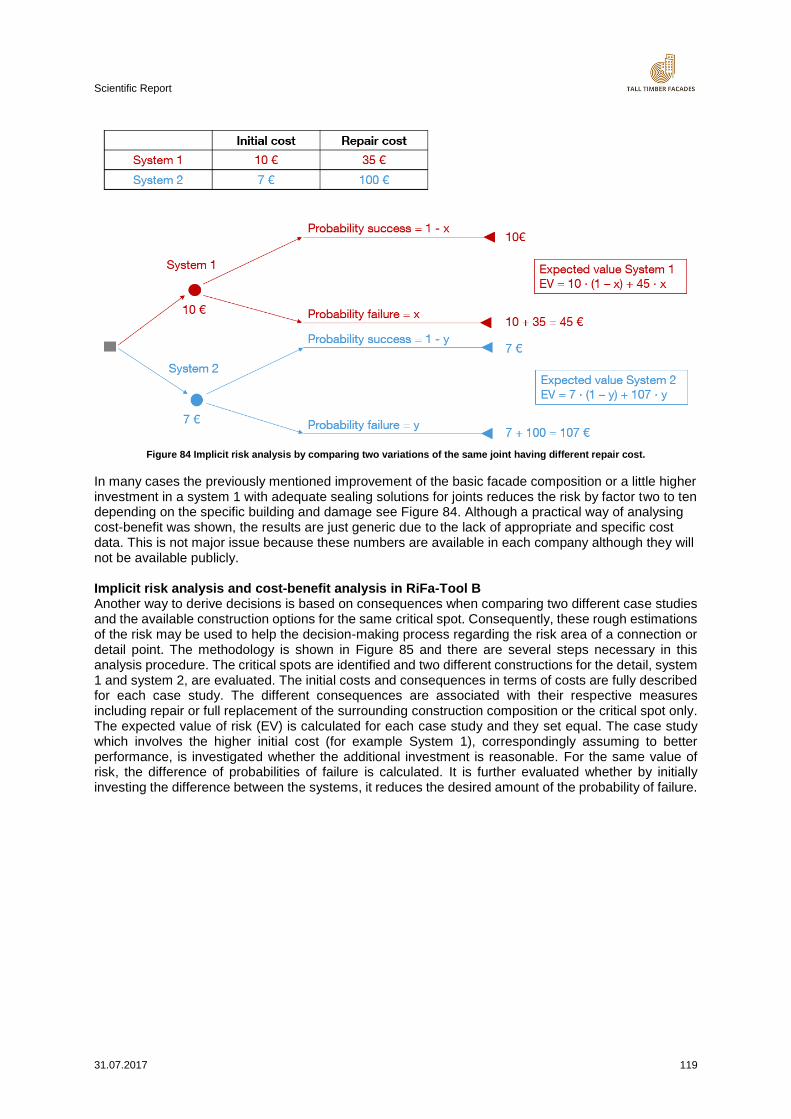
Scientific Report
31.07.2017 119
Figure 84 Implicit risk analysis by comparing two variations of the same joint having different repair cost.
In many cases the previously mentioned improvement of the basic facade composition or a little higher investment in a system 1 with adequate sealing solutions for joints reduces the risk by factor two to ten depending on the specific building and damage see Figure 84. Although a practical way of analysing cost-benefit was shown, the results are just generic due to the lack of appropriate and specific cost data. This is not major issue because these numbers are available in each company although they will not be available publicly. Implicit risk analysis and cost-benefit analysis in RiFa-Tool B Another way to derive decisions is based on consequences when comparing two different case studies and the available construction options for the same critical spot. Consequently, these rough estimations of the risk may be used to help the decision-making process regarding the risk area of a connection or detail point. The methodology is shown in Figure 85 and there are several steps necessary in this analysis procedure. The critical spots are identified and two different constructions for the detail, system 1 and system 2, are evaluated. The initial costs and consequences in terms of costs are fully described for each case study. The different consequences are associated with their respective measures including repair or full replacement of the surrounding construction composition or the critical spot only. The expected value of risk (EV) is calculated for each case study and they set equal. The case study which involves the higher initial cost (for example System 1), correspondingly assuming to better performance, is investigated whether the additional investment is reasonable. For the same value of risk, the difference of probabilities of failure is calculated. It is further evaluated whether by initially investing the difference between the systems, it reduces the desired amount of the probability of failure.
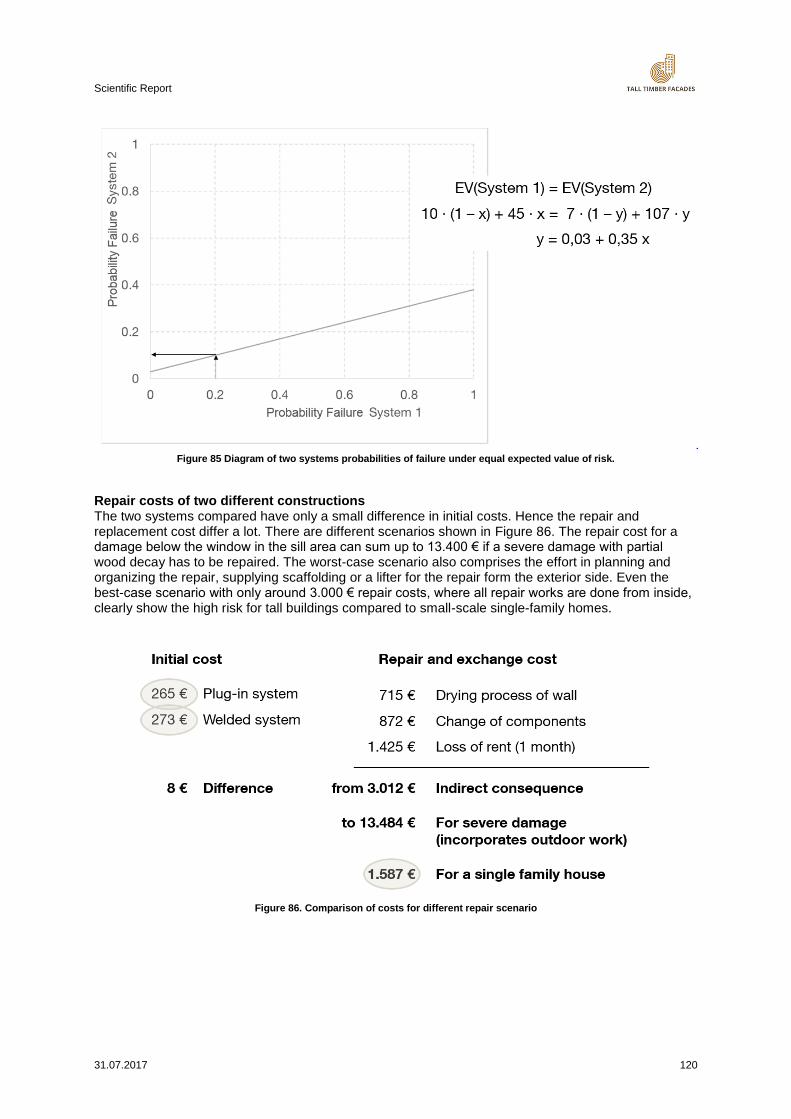
Scientific Report
31.07.2017 120
Figure 85 Diagram of two systems probabilities of failure under equal expected value of risk.
Repair costs of two different constructions The two systems compared have only a small difference in initial costs. Hence the repair and replacement cost differ a lot. There are different scenarios shown in Figure 86. The repair cost for a damage below the window in the sill area can sum up to 13.400 € if a severe damage with partial wood decay has to be repaired. The worst-case scenario also comprises the effort in planning and organizing the repair, supplying scaffolding or a lifter for the repair form the exterior side. Even the best-case scenario with only around 3.000 € repair costs, where all repair works are done from inside, clearly show the high risk for tall buildings compared to small-scale single-family homes.
Figure 86. Comparison of costs for different repair scenario
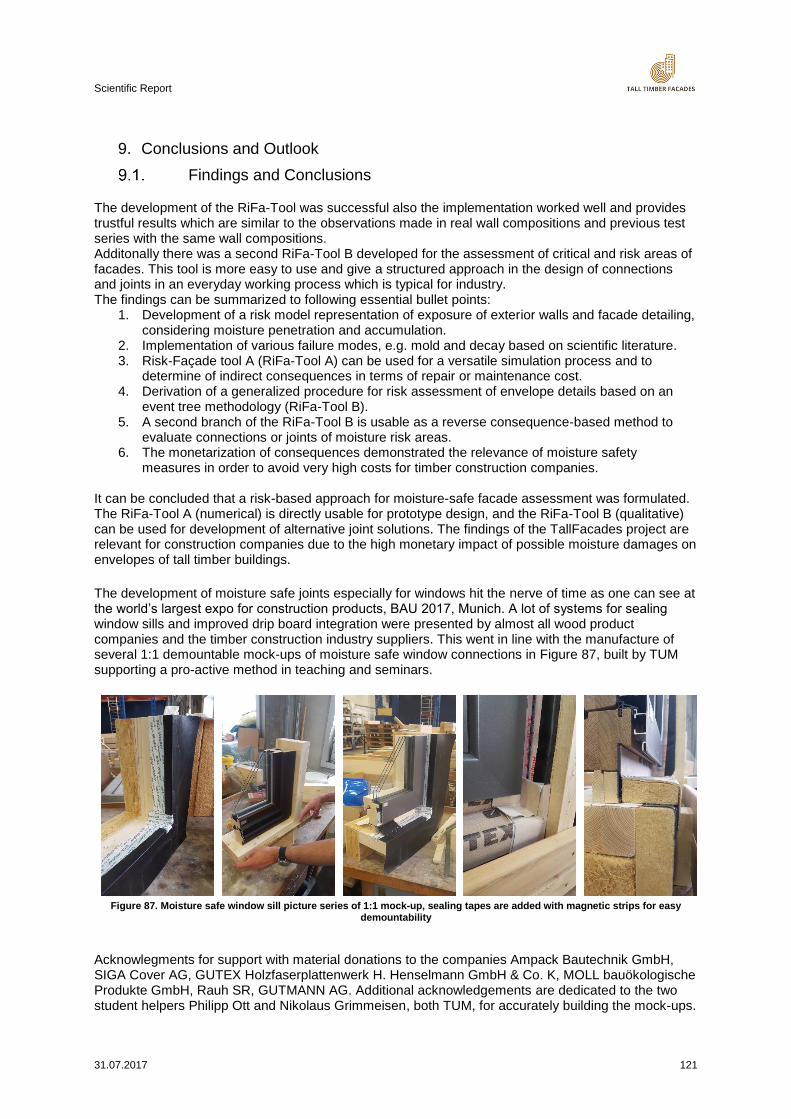
Scientific Report
31.07.2017 121
9. Conclusions and Outlook
Findings and Conclusions
The development of the RiFa-Tool was successful also the implementation worked well and provides trustful results which are similar to the observations made in real wall compositions and previous test series with the same wall compositions. Additonally there was a second RiFa-Tool B developed for the assessment of critical and risk areas of facades. This tool is more easy to use and give a structured approach in the design of connections and joints in an everyday working process which is typical for industry. The findings can be summarized to following essential bullet points:
1. Development of a risk model representation of exposure of exterior walls and facade detailing, considering moisture penetration and accumulation.
2. Implementation of various failure modes, e.g. mold and decay based on scientific literature. 3. Risk-Façade tool A (RiFa-Tool A) can be used for a versatile simulation process and to
determine of indirect consequences in terms of repair or maintenance cost. 4. Derivation of a generalized procedure for risk assessment of envelope details based on an
event tree methodology (RiFa-Tool B). 5. A second branch of the RiFa-Tool B is usable as a reverse consequence-based method to
evaluate connections or joints of moisture risk areas. 6. The monetarization of consequences demonstrated the relevance of moisture safety
measures in order to avoid very high costs for timber construction companies. It can be concluded that a risk-based approach for moisture-safe facade assessment was formulated. The RiFa-Tool A (numerical) is directly usable for prototype design, and the RiFa-Tool B (qualitative) can be used for development of alternative joint solutions. The findings of the TallFacades project are relevant for construction companies due to the high monetary impact of possible moisture damages on envelopes of tall timber buildings.
The development of moisture safe joints especially for windows hit the nerve of time as one can see at the world’s largest expo for construction products, BAU 2017, Munich. A lot of systems for sealing window sills and improved drip board integration were presented by almost all wood product companies and the timber construction industry suppliers. This went in line with the manufacture of several 1:1 demountable mock-ups of moisture safe window connections in Figure 87, built by TUM supporting a pro-active method in teaching and seminars.
Figure 87. Moisture safe window sill picture series of 1:1 mock-up, sealing tapes are added with magnetic strips for easy
demountability
Acknowlegments for support with material donations to the companies Ampack Bautechnik GmbH, SIGA Cover AG, GUTEX Holzfaserplattenwerk H. Henselmann GmbH & Co. K, MOLL bauökologische Produkte GmbH, Rauh SR, GUTMANN AG. Additional acknowledgements are dedicated to the two student helpers Philipp Ott and Nikolaus Grimmeisen, both TUM, for accurately building the mock-ups.
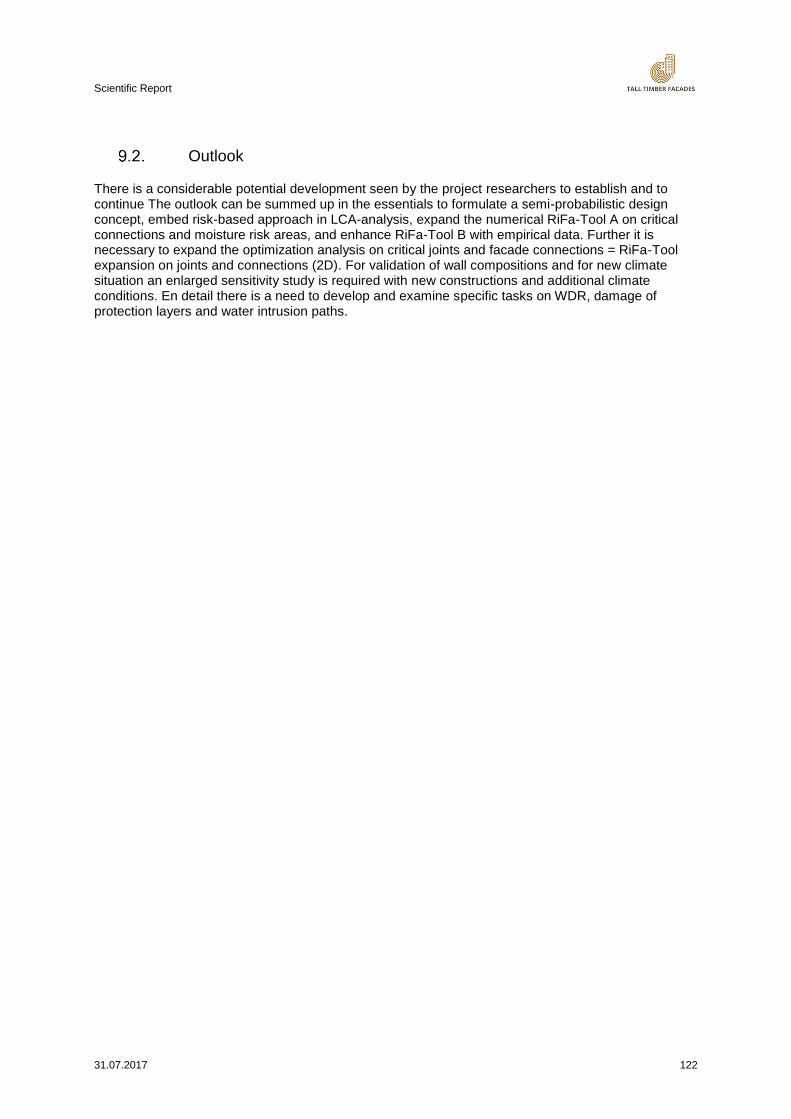
Scientific Report
31.07.2017 122
Outlook
There is a considerable potential development seen by the project researchers to establish and to continue The outlook can be summed up in the essentials to formulate a semi-probabilistic design concept, embed risk-based approach in LCA-analysis, expand the numerical RiFa-Tool A on critical connections and moisture risk areas, and enhance RiFa-Tool B with empirical data. Further it is necessary to expand the optimization analysis on critical joints and facade connections = RiFa-Tool expansion on joints and connections (2D). For validation of wall compositions and for new climate situation an enlarged sensitivity study is required with new constructions and additional climate conditions. En detail there is a need to develop and examine specific tasks on WDR, damage of protection layers and water intrusion paths.
Scientific Report
31.07.2017 123
10. List of Tables
Table 1 Components of the façade element listed together with indicators describing their corresponding properties. ...................................................................................................................... 11 Table 2: Collected examples of plain walls ........................................................................................... 20 Table 3: Requirements for sd-values. ................................................................................................... 23 Table 4 Overview of different characteristics related to mold models (symbol ‘’ stands for ‘accounted or covered in the model’, symbol ‘-‘ stands for ‘not accounted or not covered’, symbol ‘Y/N’ stands for Yes/No) [5] ............................................................................................................................................. 30 Table 5 Correspondences of material categories for the three mold model ......................................... 32 Table 6 Assessment of mold growth and the assessment criteria ........................................................ 32 Table 7: Rating system for the assessment of attack caused by microorganisms on test stakes [52] . 33 Table 8 Example of evolution of insulation thermal conductivity for regarding their water content – WUFI® Pro. ........................................................................................................................................... 40 Table 9 List of modifications. ................................................................................................................. 51 Table 10: Material parameters............................................................................................................... 52 Table 11: Deficiencies and their implementation in WUFI® .................................................................. 53 Table 12. Mold growth results according to VTT for different wall systems and deficiencies ............... 61 Table 13. Decay rating results according to Logistic Approach Model for different wall systems and deficiencies ............................................................................................................................................ 62 Table 14 Cost data for supplementary appliances of a facade repair from the exterior side ................ 64 Table 15 Cost data for supplementary appliances with alternative equipment ..................................... 64 Table 16 Cost data for supplementary appliances of a facade repair from the interior side ................. 64 Table 17 Walls analysed with damage scenarios ................................................................................. 69 Table 18. Wall 01 costs, German data [1] ............................................................................................. 73 Table 19. Wall 05 costs, German data [1] ............................................................................................. 73 Table 20. Wall 07 costs, German data [1] ............................................................................................. 74 Table 21. Test sample configuration overview ...................................................................................... 88 Table 22. Overview of the widely used standards regarding mold growth. ........................................... 98 Table 23. Overview of software that predict mold growth [1] ................................................................ 99
Scientific Report
31.07.2017 124
11. List of Figures
Figure 1 Exemplary urban tall timber building with a complex building envelope showing many critical spots in facade connections. ................................................................................................................... 7 Figure 2 Cross section of timber façade, FCBA .................................................................................... 11 Figure 3 Relevant variables and the corresponding causal relationships. ............................................ 15 Figure 4: Three simulated temperature time series and the measured temperature time series. ........ 17 Figure 5: Sine curves for calculation of the indoor climate. ................................................................... 19 Figure 6: Classification of compositions. ............................................................................................... 20 Figure 7: Barrier approach of a ventilated composition. ........................................................................ 23 Figure 8: Basic composition with modifications ..................................................................................... 25 Figure 9: Frequency of failures .............................................................................................................. 26 Figure 10: Categorization of details - drainage ..................................................................................... 27 Figure 11: Categorization of details - barriers ....................................................................................... 27 Figure 12 Mold growth governing factors [13] ....................................................................................... 29 Figure 13. Schematics of the three mold models (MRD, IBP Biohygrothermal and VTT – model) by adapting the framework on [13] ............................................................................................................. 31 Figure 14 Schematic workflow of the decay rating calculation. Further explanation of the procedure and notation can be found in [49, 51]. ................................................................................................... 33 Figure 15 Schematic workflow of the decay rating calculation. Further explanation of the procedure and notation can be found in [53]. ......................................................................................................... 34 Figure 16 Illustration of a damaged floor structure - FCBA expertise. .................................................. 38 Figure 17 Indoor facing with traces of mold – FCBA expertise. ............................................................ 39 Figure 18 Two different appearances of outdoor cladding on the same building. ................................ 39 Figure 19 Deformation of wood. ............................................................................................................ 40 Figure 20 Deformation of a window frame - FCBA expertise. ............................................................... 40 Figure 21 Wet mineral wool insulation – FCBA expertise. .................................................................... 41 Figure 22: Schematic seamless and integrated workflow. .................................................................... 46 Figure 23: General approach of the event tree. .................................................................................... 48 Figure 24: Risk analysis - decision tree ................................................................................................. 49 Figure 25. Reverse methodology for the critical or risk spots. .............................................................. 50 Figure 26 Evaluated compositions. ....................................................................................................... 51 Figure 27. Mold growth results according to VVT model for Basel climate ........................................... 56 Figure 28. Mold growth results according to MRD model for Basel climate ......................................... 56 Figure 29. Mold growth results according to Biohygrothermal model for Basel climate ....................... 56 Figure 30. Mold growth results according to VVT model for Bergen climate ........................................ 57 Figure 31. Mold growth results according to MRD model for Bergen climate ....................................... 57 Figure 32. Mold growth results according to Biohygrothermal model for Bergen climate ..................... 58 Figure 33. Mold growth results according to VVT model for Stockholm climate ................................... 58 Figure 34. Mold growth results according to MRD model for Stockholm climate .................................. 59 Figure 35. Mold growth results according to Biohygrothermal model for Stockholm climate ............... 59 Figure 36. Mold growth results according to VVT model for Sylt climate .............................................. 60 Figure 37. Mold growth results according to MRD model for Sylt climate............................................. 60 Figure 38. Mold growth results according to Biohygrothermal model for Sylt climate .......................... 61 Figure 39: Window cross-section .......................................................................................................... 67 Figure 40: Event tree for the flashing .................................................................................................... 68 Figure 41. Three levels of damage scenarios for a window connection in wall 01 and wall 07 with mineral wool insulation .......................................................................................................................... 70 Figure 42. Three levels of damage scenarios for a window connection in wall 05 with cellulose fibre insulation ................................................................................................................................................ 71 Figure 43. Climate impact for three levels of damages caused by window connection compared to production of wall element and examples of measures for improvement of moisture safety. .............. 72 Figure 44. Second defense layer of sealing tape on the window sill (green line) to improve moisture safety of windows and door connections ............................................................................................... 72 Figure 45. Window connection with steel profile in the reveal (blue line) to improve moisture safety .. 72 Figure 46. Costs of production of walls 01, 05 and 07, and costs of repair of damage scenarios, and costs of improvements ........................................................................................................................... 74 Figure 47. LCC of walls 01, 05 and 07, and repair of damage scenarios, and of improvements ......... 75 Figure 48. Hygrothermal test cells and samples ................................................................................... 76
Scientific Report
31.07.2017 125
Figure 49. Positions of sensors ............................................................................................................. 77 Figure 50. Wood fiber board had water stains after spray test. ............................................................ 78 Figure 51. Relative humidity content diagram showed dry-out behavior over a range of 7 days ......... 79 Figure 52. Temperature diagram of the monitoring positions reached steady after a short drop in the beginning ............................................................................................................................................... 79 Figure 53. Sample after spray test with OSB panel (left), wet mineral wool (middle), spraying equipment .............................................................................................................................................. 80 Figure 54. Relative humidity diagram curve dropped immediately after spray test and remains constant over 7 days. ........................................................................................................................................... 80 Figure 55. Temperature diagram with constant niveau over test duration ............................................ 81 Figure 56. Branch of event tree for the undamaged balcony ................................................................ 81 Figure 57. Cut in the second defense layer (left) and spray water on the cut (right) ............................ 82 Figure 58. Isometric view on test mock-up (left) and wood moisture and temperature sensoring equipment (right) ................................................................................................................................... 82 Figure 59. Water content diagram of all sensor positions ..................................................................... 83 Figure 60. Water content diagram showed spikes of three spray water actions in the wood structure of damaged balcony .................................................................................................................................. 83 Figure 61. Branch of the event tree for the „damaged“ balcony joint scenario ..................................... 84 Figure 62. Temperature and humidity in insulation material of damaged balcony ................................ 84 Figure 63. Temperature diagram gave only a low indication of spray water tests ................................ 85 Figure 64. OSB panel surface after watering the interior face showed water drops and poor hygroscopic behavior ............................................................................................................................. 85 Figure 65. Water content diagram of wooden frame ............................................................................. 86 Figure 66. Temperature diagram of insulation material showed almost constant behavior .................. 86 Figure 67. Relative humidity diagram of the insulation showed an increase in the floor part ............... 87 Figure 68. Test set-up for spray water exposure of different facade claddings [1] ............................... 90 Figure 69 Images from water spray tests a) front elevation and b) rear elevation of horizontal open cladding made of larch battens. [1] ....................................................................................................... 90 Figure 70 Comparison between two rain events on a larch cladding with 20 hours distance. Measuring from above to bottom a) material moisture b) relative humidity c) weight change due to moisture absorption and evaporation. [FRA17] .................................................................................................... 91 Figure 71 Moisture content of four different cladding system compared over time, ETICS (black) cementitous fibre board (blue) spruce (grey) larch (orange) [1] ............................................................ 92 Figure 72 Deterministic moisture safety rules synopsis - part 1. ........................................................... 95 Figure 73 Deterministic moisture safety rules synopsis - part 2. ........................................................... 96 Figure 74 Comparison of use classes of wood according to German standard (left column) and French standard (right column). ......................................................................................................................... 97 Figure 75 Damage scenario on the exterior layers. ............................................................................ 104 Figure 76. Damage scenario on the core of the facade. ..................................................................... 105 Figure 77. Damage scenario on the interior layers. ............................................................................ 106 Figure 78 The risk-based approach in the RiFa-Tool A and uncertainties of parameters. ................. 114 Figure 79 Uncertainty of construction resistance expressed in a probability density function related to moisture load conditions (shown in the diagram on the lower right side). .......................................... 115 Figure 80 Advantages of the risk-based approach are reliability in decision making process. ........... 115 Figure 81 Application of three different mold models to assess the performance of ten variations of the same exterior wall ................................................................................................................................ 116 Figure 82 Cost-benefit and optimization analysis, total expected costs as a function of the wind barrier and vapor retarder. .............................................................................................................................. 116 Figure 83. Event tree example for the window reveal ......................................................................... 118 Figure 84 Implicit risk analysis by comparing two variations of the same joint having different repair cost. ..................................................................................................................................................... 119 Figure 85 Diagram of two systems probabilities of failure under equal expected value of risk. ......... 120 Figure 86. Comparison of costs for different repair scenario .............................................................. 120 Figure 87. Moisture safe window sill picture series of 1:1 mock-up, sealing tapes are added with magnetic strips for easy demountability .............................................................................................. 121
Scientific Report
31.07.2017 126