Embed Size (px)
Citation preview

TALIS 2018 Technical Report
T E A C H I N G A N D L E A R N I N G I N T E R N A T I O N A L S U R V E Y

1
TALIS 2018 TECHNICAL REPORT © OECD 2020
000
TALIS
TALIS 2018 Technical Report
PUBE
This work is published under the responsibility of the Secretary-General of the OECD. The opinions
expressed and arguments employed herein do not necessarily reflect the official views of the OECD
member countries.
This document, as well as any data and any map included herein, are without prejudice to the status of or
sovereignty over any territory, to the delimitation of international frontiers and boundaries and to the name
of any territory, city or area.
The statistical data for Israel are supplied by and under the responsibility of the relevant Israeli authorities.
The use of such data by the OECD is without prejudice to the status of the Golan Heights, East Jerusalem
and Israeli settlements in the West Bank under the terms of international law.
Note by Turkey
The information in this document with reference to “Cyprus” relates to the southern part of the Island.
There is no single authority representing both Turkish and Greek Cypriot people on the Island. Turkey
recognises the Turkish Republic of Northern Cyprus (TRNC). Until a lasting and equitable solution is
found within the context of the United Nations, Turkey shall preserve its position concerning the “Cyprus
issue”.
Note by all the European Union Member States of the OECD and the European Union
The Republic of Cyprus is recognised by all members of the United Nations with the exception of Turkey.
The information in this document relates to the area under the effective control of the Government of the
Republic of Cyprus.
Photo credits:
Cover © Hill Street Studios/Gettyimages
You can copy, download or print OECD content for your own use, and you can include excerpts from
OECD publications, databases and multimedia products in your own documents, presentations, blogs,
websites and teaching materials, provided that suitable acknowledgement of OECD as source and
copyright owner is given. All requests for public or commercial use and translation rights should be
submitted to [email protected]. Requests for permission to photocopy portions of this material for public
or commercial use shall be addressed directly to the Copyright Clearance Center (CCC) at
[email protected] or the Centre français d’exploitation du droit de copie (CFC) at

3
TALIS 2018 TECHNICAL REPORT © OECD 2019
Acknowledgements
The OECD Teaching and Learning International Survey (TALIS) is the outcome of
collaboration among the participating countries and economies, the OECD Secretariat, the
European Commission and an international consortium led by the International Association
for the Evaluation of Educational Achievement (IEA).
The OECD recognises the significant contributions of members of the IEA Hamburg,
Germany, IEA Amsterdam, the Netherlands, as well as Statistics Canada, who authored
this report. The principal authors of the respective chapters were as follows:
Chapter 1: Steffen Knoll and Ralph Carstens
Chapter 2: John Ainley and Ralph Carstens
Chapter 3: Ralph Carstens
Chapter 4: Michelle Djekić, David Ebbs, Sandra Dohr, Jan-Philipp Wagner, Steffen
Knoll and Viktoria Böhm
Chapter 5: Jean Dumais and Yves Morin
Chapter 6: Viktoria Böhm, Alena Becker and Christine Busch
Chapter 7: Michelle Djekić, David Ebbs, Sandra Dohr, Jan-Philipp Wagner,
Viktoria Böhm, Alena Becker and Steffen Knoll
Chapter 8: Alena Becker and Christine Busch
Chapter 9: Jean Dumais and Yves Morin
Chapter 10: Jean Dumais, Alena Becker, Jan-Philipp Wagner, David Ebbs and
Steffen Knoll
Chapter 11: Agnes Stancel-Piątak, Justin Wild, Minge Chen, Mojca Rozman,
Plamen Mirazchiyski and Hynek Cigler
Chapter 12: Ann-Kristin Koop, Falk Brese and Agnes Stancel-Piątak.
Paula Wagemaker copy-edited the report on behalf of the IEA. OECD Directorate for
Education and Skills (EDU) analysts Pablo Fraser, Gabor Fulöp and Noémie Le Donné
provided additional editorial support. Timothy L. Kennel, Bart Meuleman and
Christian Monseur provided valuable comments during the development of some chapters.
Emily Groves (EDU) provided additional proofreading and managed the layout process,
with support from Eleonore Morena, who verified the final layout, and from Henri Pearson
(EDU communications team). Emily Groves also provided administrative assistance.
We would like to gratefully acknowledge the contribution to TALIS of the late Fons van
de Vijver, who was Chair of the Technical Advisory Group and an advisor to TALIS since
the first cycle in 2008.

4
TALIS 2018 TECHNICAL REPORT © OECD 2019
Table of contents
Acknowledgements ................................................................................................................................ 3
Abbreviations and acronyms .............................................................................................................. 13
Three-digit operational codes of TALIS 2018 participants ............................................................. 15
Executive summary ............................................................................................................................. 17
Governance, management and structure ............................................................................................ 17 Participants, international options and survey phases ........................................................................ 18 Framework and questionnaire development, translation ................................................................... 18 Sampling of schools and teachers ...................................................................................................... 19 Main survey administration and quality observations ....................................................................... 19 Data collection, processing, weighting and adjudication ................................................................... 20 Scaling, analysis and results table production ................................................................................... 20 Differences between TALIS 2018 and the 2008 and/or 2013 cycles................................................. 21
Chapter 1. Introduction ...................................................................................................................... 22
1.1. TALIS in brief ............................................................................................................................ 23 1.2. Participating countries and economies ........................................................................................ 24 1.3. Managing the survey internationally .......................................................................................... 26 1.4. Working with national project managers .................................................................................... 27 1.5. Standardised procedures ............................................................................................................. 29 1.6. Key survey phases ...................................................................................................................... 30 References .......................................................................................................................................... 33 Notes .................................................................................................................................................. 33
Chapter 2. Development of the conceptual framework ................................................................... 34
2.1. Introduction ................................................................................................................................. 35 2.2. General purpose of TALIS and policy focus for 2018 ................................................................ 35 2.3. Developing and refining the conceptual framework ................................................................... 37 2.4. Connecting the conceptual framework with proposed analyses ................................................. 46 References .......................................................................................................................................... 48 Notes .................................................................................................................................................. 49
Chapter 3. Development of the teacher and principal questionnaires ........................................... 50
3.1. General aims and principles ........................................................................................................ 51 3.2. Timeline ...................................................................................................................................... 54 3.3. Questionnaire Expert Group (QEG) role, membership and collaboration .................................. 56 3.4. Pilot phase ................................................................................................................................... 58 3.5. Field trial phase ........................................................................................................................... 62 3.6. Main survey phase ...................................................................................................................... 68 References .......................................................................................................................................... 78 Notes .................................................................................................................................................. 79
Chapter 4. Preparation of national survey instruments .................................................................. 81
4.1. Overview of adaptation and translation verification ................................................................... 82 4.2. Instruments requiring adaptation and translation ........................................................................ 83

5
TALIS 2018 TECHNICAL REPORT © OECD 2019
4.3. Identifying the target language ................................................................................................... 83 4.4. Adaptations ................................................................................................................................. 85 4.5. National adaptation forms ........................................................................................................... 88 4.6. Hierarchy of international options during instrument preparation .............................................. 88 4.7. Engaging translators ................................................................................................................... 90 4.8. Producing translations ................................................................................................................. 91 4.9. International translation verification ........................................................................................... 92 4.10. Feedback from NPMs on international translation and translation verification ....................... 93 4.11. Layout verification: Paper and online data collection .............................................................. 94 References .......................................................................................................................................... 95 Notes .................................................................................................................................................. 95
Chapter 5. Sample design ................................................................................................................... 96
5.1. Overview ..................................................................................................................................... 97 5.2. International sampling plan......................................................................................................... 97 5.3. Target population and survey population: International requirements and national
implementations ................................................................................................................................. 97 5.4. Sample size requirements ........................................................................................................... 99 5.5. National sampling strategies ..................................................................................................... 101 5.6. ISCED levels 2, 1 and 3 samples, by participating country and economy ............................... 103 Reference ......................................................................................................................................... 108 Notes ................................................................................................................................................ 108
Chapter 6. Field operations procedures .......................................................................................... 109
6.1. Technical standards, manuals and software .............................................................................. 110 6.2. Administering the TALIS core and additional international options ........................................ 112 6.3. Contacting schools and within-school sampling procedures .................................................... 113 6.4. Administering the questionnaires and conducting national quality observations ..................... 116 6.5. Monitoring the online questionnaires ....................................................................................... 119 6.6. Material receipt and preparing for data entry............................................................................ 119 Notes ................................................................................................................................................ 120
Chapter 7. Quality assurance procedures for the TALIS data collection .................................... 121
7.1. Quality control in survey administration .................................................................................. 122 7.2. International quality control programme .................................................................................. 122 7.3. School visit design .................................................................................................................... 125 7.4. Interviews with the SCs ............................................................................................................ 127 7.5. Translation verification report(s) .............................................................................................. 133 7.6. Extra quality control questions ................................................................................................. 133 7.7. Survey activities questionnaire ................................................................................................. 133 Notes ................................................................................................................................................ 138
Chapter 8. Creating and checking the international database ...................................................... 139
8.1. Overview ................................................................................................................................... 140 8.2. Online data collection and verification ..................................................................................... 140 8.3. Data entry and verification of paper questionnaires at national centres ................................... 142 8.4. Data checking, editing and quality control at the IEA Hamburg .............................................. 144 8.5. Interim data products ................................................................................................................ 152 8.6. Building the international database ........................................................................................... 153 Reference ......................................................................................................................................... 155

6
TALIS 2018 TECHNICAL REPORT © OECD 2019
Note .................................................................................................................................................. 155
Chapter 9. Estimation weights, participation rates and sampling error ...................................... 156
9.1. Overview ................................................................................................................................... 157 9.2. Estimation weights .................................................................................................................... 157 9.3. Weights for school and principal data....................................................................................... 158 9.4. Weights for teacher data ........................................................................................................... 160 9.5. Weights for the TALIS-PISA link data..................................................................................... 163 9.6. Participation rates ..................................................................................................................... 163 9.7. Sampling error with balanced repeated replication (BRR) ....................................................... 165 References ........................................................................................................................................ 175 Notes ................................................................................................................................................ 175
Chapter 10. Data adjudication ......................................................................................................... 176
10.1. The general adjudication process in TALIS ........................................................................... 177 10.2. What was adjudicated in TALIS? ........................................................................................... 177 10.3. The criteria for assessment ...................................................................................................... 179 10.4. Recommended usage ratings for participants ......................................................................... 179 10.5. Adjudicating the TALIS-PISA samples .................................................................................. 188 References ........................................................................................................................................ 190 Notes ................................................................................................................................................ 190
Chapter 11. Validation of scales and construction of scale scores ................................................ 191
11.1. Overview ................................................................................................................................. 192 11.2. Computation of simple indices ............................................................................................... 192 11.3. Scaling procedures .................................................................................................................. 198 11.4. Results from scales evaluation and scale score creation ......................................................... 217 References ........................................................................................................................................ 431 Notes ................................................................................................................................................ 433
Chapter 12. Table production and verification, analyses .............................................................. 437
12.1. Introduction ............................................................................................................................. 438 12.2. Responsibilities ....................................................................................................................... 438 12.3. Populating the table shells: General procedures ..................................................................... 438 12.4. Estimating standard errors using weights ............................................................................... 440 12.5. OECD average, TALIS average and EU total ........................................................................ 440 12.6. Estimating percentiles ............................................................................................................. 441 12.7. Use of weights in tables featuring analyses of teachers’ and principals’ data ........................ 441 12.8. Calculating parameters for the analyses of change over time ................................................. 442 12.9. Tables based on the results of regression analysis .................................................................. 443 12.10. Handling of filter-dependent questions ................................................................................. 444 12.11. Annotation rules related to data quality requirements (minimum number of cases, item
non-response) ................................................................................................................................... 444 12.12. Quality assurance and table verification ............................................................................... 445 References ........................................................................................................................................ 447 Notes ................................................................................................................................................ 447
Annex A. Consortium, experts and consultants.............................................................................. 448
IEA Hamburg (Hamburg, Germany) ............................................................................................... 448 IEA Amsterdam (Amsterdam, the Netherlands) .............................................................................. 450

7
TALIS 2018 TECHNICAL REPORT © OECD 2019
Statistics Canada (Ottawa, Canada) ................................................................................................. 450 Australian Council for Educational Research (ACER, Melbourne, Australia) ............................... 451 Consultants....................................................................................................................................... 451 TALIS Expert Groups ...................................................................................................................... 451
Annex B. Technical standards .......................................................................................................... 453
Annex C. Sampling forms ................................................................................................................. 454
Annex D. Target and survey population ......................................................................................... 463
Annex E. Characteristics of national samples ISCED levels 1, 2 and 3 ........................................ 474
Annex F. Teacher listing and tracking forms ................................................................................. 475
Annex G. Unweighted and weighted participation rates ............................................................... 476
Annex H. Questionnaires .................................................................................................................. 482
Annex I. Construction and validation of scales and indices .......................................................... 483
Annex J. Table production and verification, analyses ................................................................... 488
Recoded variables that are part of the TALIS 2018 public data set................................................. 488 Recoded variables that are not part of the TALIS 2018 public data set .......................................... 490 Note .................................................................................................................................................. 493 References ........................................................................................................................................ 494
Tables
Table 1.1. TALIS 2018 participants in ISCED level 2 (core survey), ISCED levels 1 and 3 options
and the TALIS-PISA link .............................................................................................................. 25 Table 2.1. Country priority ratings of themes for inclusion in TALIS 2018 ISCED level 2 ................. 39 Table 2.2. Themes for inclusion in TALIS 2018 with frequently nominated indicators from TALIS
2013 ............................................................................................................................................... 40 Table 2.3. Map of TALIS 2018 themes to policy issues ....................................................................... 42 Table 2.4. Average rating points of themes under each policy heading, all countries (ISCED 2) ........ 42 Table 3.1. Field trial questionnaire sections .......................................................................................... 66 Table 3.2. Field trial questionnaire design ............................................................................................ 67 Table 3.3. Overview of question count across TALIS 2008, 2013 and 2018 (field trial and main
survey) ........................................................................................................................................... 76 Table 4.1. Languages used in TALIS 2018 ........................................................................................... 84 Table 4.2. Excluded TALIS 2018 principal questionnaire questions (before translation verification) . 86 Table 4.3. Excluded TALIS 2018 teacher questionnaire questions (before translation verification) ... 87 Table 4.4. List of the teacher and principal target populations in TALIS 2018 by country .................. 89 Table 5.1. TALIS 2018 target and survey populations .......................................................................... 99 Table 5.2. Establishing the sample size for TALIS 2018 .................................................................... 100 Table 5.3. Illustration of systematic random sampling with PPS ........................................................ 103 Table 5.4. Overview of the ISCED level 2 samples ............................................................................ 103 Table 5.5. Overview of the ISCED level 1 samples ............................................................................ 106 Table 5.6. Overview of the ISCED level 3 samples ............................................................................ 107 Table 5.7. Overview of the TALIS-PISA link samples ....................................................................... 107 Table 6.1. Instrument preparation time ............................................................................................... 113 Table 6.2. Originally planned and actual data collection windows for ISCED levels 1, 2 and 31 ...... 117

8
TALIS 2018 TECHNICAL REPORT © OECD 2019
Table 7.1. Planned distribution of school visits across international options ...................................... 126 Table 7.2. Comparison of the planned and realised school visit design .............................................. 127 Table 7.3. IQO-reported interview responses of the SCs to questions about teacher co-operation
and comfort when participating in TALIS .................................................................................. 128 Table 7.4. IQO-reported interview responses of the SCs to questions about their experiences,
training and initial survey preparation ......................................................................................... 129 Table 7.5. IQO-reported interview responses of the SCs about explaining TALIS to participants .... 130 Table 7.6. IQO-reported interview responses of the SCs about distribution procedures .................... 130 Table 7.7. IQO-reported interview responses of the SCs about distribution time ............................... 131 Table 7.8. IQO-reported interview responses of the SCs to questions about security and anonymity 131 Table 7.9. IQO-reported interview responses of the SCs to questions about their general
impressions of the survey administration .................................................................................... 132 Table 9.1. Example of BRR-ready sample design and random assignment of pseudo PSUs ............. 166 Table 9.2. Estimated design effects for selected scales, ISCED level 2, principal data ...................... 170 Table 9.3. Estimated design effects for selected scales, ISCED level 1, principal data ...................... 172 Table 9.4. Estimated design effects for selected scales, ISCED level 3, principal data ...................... 172 Table 9.5. Estimated design effects for selected scales, ISCED level 2, teacher data......................... 172 Table 9.6. Estimated design effects for selected scales, ISCED level 1, teacher data......................... 174 Table 9.7. Estimated design effects for selected scales, ISCED level 3, teacher data......................... 174 Table 10.1. Adjudication rules for school or principal data in TALIS 2018 ....................................... 179 Table 10.2. Adjudication rules for teacher data in TALIS 2018 ......................................................... 180 Table 10.3. ISCED level 1: Principals’ participation and recommended ratings ................................ 181 Table 10.4. ISCED level 1: Teachers’ participation and recommended ratings ................................. 182 Table 10.5. ISCED level 2: Principals’ participation and recommended ratings ................................ 183 Table 10.6. ISCED level 2: Teachers’ participation and recommended ratings ................................. 185 Table 10.7. ISCED level 3: Principals’ participation and recommended ratings ................................ 187 Table 10.8. ISCED level 3: Teachers’ participation and recommended ratings ................................. 188 Table 10.9. TALIS-PISA Link: Principal's participation and recommended ratings .......................... 189 Table 10.10. TALIS-PISA Link: Teacher's participation and recommended ratings .......................... 189 Table 11.1. Measured items for school autonomy............................................................................... 194 Table 11.2. Measured items for school resources ............................................................................... 198 Table 11.3. Cut-offs for CFA model evaluation for TALIS 2018 ....................................................... 203 Table 11.4. Items average scale score equivalent table for the scale T3PERUT ................................ 212 Table 11.5. Scale counts of the invariance levels for both populations .............................................. 213 Table 11.6. Invariance level reached for each scale by ISCED level .................................................. 214 Table 11.7. Excluded populations from the estimation of the parameters of principal scales ............ 219 Table 11.8. Item wording for teacher motivation and perceptions scales ........................................... 220 Table 11.9. Reliability coefficients for teacher motivation and perceptions scales ............................ 220 Table 11.10. CFA model-data fits for scale T3PERUT ...................................................................... 223 Table 11.11. CFA model-data fit for scale T3SOCUT ........................................................................ 225 Table 11.12. CFA model-data fit for scale T3VALP .......................................................................... 225 Table 11.13. Invariance tests results for scale T3PERUT ................................................................... 226 Table 11.14: Invariance tests results for scale T3SOCUT .................................................................. 227 Table 11.15. Invariance tests results for scale T3VALP ..................................................................... 227 Table 11.16. Unstandardised factor loadings for T3PERUT, T3SOCUT and T3VALP for all
countries for all populations ........................................................................................................ 227 Table 11.17. Standardised factor loadings and unstandardised intercepts for scale T3PERUT .......... 228 Table 11.18. Standardised factor loadings and unstandardised intercepts for scale T3SOCUT ......... 230 Table 11.19. Standardised factor loadings and unstandardised intercepts for scale T3VALP ............ 232 Table 11.20. Item wording for instructional practices scale items ...................................................... 234

9
TALIS 2018 TECHNICAL REPORT © OECD 2019
Table 11.21. Reliability coefficients for instructional practices scales ............................................... 235 Table 11.22. CFA model-data fit for scale T3CLAIN ........................................................................ 237 Table 11.23. CFA model-data fit for scale T3COGAC ....................................................................... 239 Table 11.24. CFA model-data fit for scale T3CLASM ....................................................................... 241 Table 11.25. Invariance test results for scale T3CLAIN ..................................................................... 243 Table 11.26. Invariance test results for scale T3COGAC ................................................................... 243 Table 11.27. Invariance test results for scale T3CLASM ................................................................... 244 Table 11.28. Unstandardised factor loadings for T3CLAIN and T3COGAC for all countries for all
populations .................................................................................................................................. 244 Table 11.29. Standardised factor loadings and unstandardised intercepts for scale T3CLAIN .......... 245 Table 11.30. Standardised factor loadings and unstandardised intercepts for scale T3COGAC ........ 247 Table 11.31. Standardised factor loadings and unstandardised intercepts for scale T3CLASM ......... 249 Table 11.32. Item wording for professional practices scale ................................................................ 252 Table 11.33. Reliability coefficients for professional practices scales ................................................ 252 Table 11.34. CFA model-data fit for scale T3EXCH .......................................................................... 254 Table 11.35. CFA model-data fit for scale T3COLES ........................................................................ 256 Table 11.36. Invariance test results for scale T3EXCH ...................................................................... 258 Table 11.37. Invariance test results for scale T3COLES .................................................................... 258 Table 11.38. Unstandardised factor loadings for T3COLES for all countries for all populations ...... 259 Table 11.39. Standardised factor loadings and unstandardised intercepts for scale T3EXCH ........... 259 Table 11.40. Standardised factor loadings and unstandardised intercepts for scale T3COLES .......... 261 Table 11.41. Item wording for feedback and development scales ...................................................... 265 Table 11.42. Reliability coefficients for feedback and development scales ........................................ 265 Table 11.43. CFA model-data fit for scale T3EFFPD ......................................................................... 267 Table 11.44. CFA model-data fit for scale T3PDPED ........................................................................ 269 Table 11.45. CFA model-data fit for scale T3PDIV ........................................................................... 271 Table 11.46. CFA model-data fit for the scale T3PDBAR.................................................................. 271 Table 11.47. Invariance test results for scale T3EFFPD ..................................................................... 273 Table 11.48. Invariance test results for scale T3PDPED .................................................................... 274 Table 11.49. Invariance test results for scale T3PDIV ........................................................................ 274 Table 11.50. Invariance test results for scale T3PDBAR .................................................................... 275 Table 11.51. Unstandardised factor loadings for T3PDPED and T3PDIV for all countries for all
populations .................................................................................................................................. 275 Table 11.52. Standardised factor loadings and unstandardised intercepts for scale T3EFFPD .......... 275 Table 11.53. Standardised factor loadings and unstandardised intercepts for scale T3PDPED .......... 277 Table 11.54. Standardised factor loadings and unstandardised intercepts for scale T3PDIV ............. 279 Table 11.55. Standardised factor loadings and unstandardised intercepts for scale T3PDBAR ......... 281 Table 11.56. Item wording for teacher self-efficacy scales ................................................................. 285 Table 11.57. Reliability coefficients for teacher self-efficacy scales .................................................. 285 Table 11.58. CFA model-data fit for scale T3SECLS ......................................................................... 287 Table 11.59. CFA model-data fit for scale T3SEINS .......................................................................... 289 Table 11.60. CFA model-data fit for scale T3SEENG ........................................................................ 291 Table 11.61. Invariance test results for scale T3SECLS ..................................................................... 293 Table 11.62. Invariance test results for scale T3SEINS ...................................................................... 293 Table 11.63. Invariance test results for scale T3SEENG .................................................................... 294 Table 11.64. Unstandardised factor loadings for T3SECLS, T3SEINS and T3SEENG for all
countries for all populations ........................................................................................................ 294 Table 11.65. Standardised factor loadings and unstandardised intercepts for scale T3SECLS .......... 294 Table 11.66. Standardised factor loadings and unstandardised intercepts for scale T3SEINS ........... 296 Table 11.67. Standardised factor loadings and unstandardised intercepts for scale T3SEENG ......... 298

10
TALIS 2018 TECHNICAL REPORT © OECD 2019
Table 11.68. Item wording for job satisfaction scales ......................................................................... 302 Table 11.69. Reliability coefficients for job satisfaction scales .......................................................... 302 Table 11.70. CFA model-data fit for scale T3JSENV ......................................................................... 304 Table 11.71. CFA model-data fit for scale T3JSPRO ......................................................................... 306 Table 11.72. CFA model-data fit for scale T3SATAT ........................................................................ 308 Table 11.73. Invariance test results for scale T3JSENV ..................................................................... 310 Table 11.74. Invariance test results for scale T3JSPRO ...................................................................... 310 Table 11.75. Invariance test results for scale T3SATAT .................................................................... 311 Table 11.76. Unstandardised factor loadings for T3JSENV, T3JSPRO and T3SATAT for all
countries for all populations ........................................................................................................ 311 Table 11.77. Standardised factor loadings and unstandardised intercepts for scale T3JSENV .......... 311 Table 11.78. Standardised factor loadings and unstandardised intercepts for scale T3JSPRO ........... 313 Table 11.79. Standardised factor loadings and unstandardised intercepts for scale T3SATAT ......... 315 Table 11.80. Item wording for workplace well-being and stress scales .............................................. 319 Table 11.81. Omega coefficients for workplace well-being and stress scales .................................... 319 Table 11.82. CFA model-data fit for scale T3WELS .......................................................................... 321 Table 11.83. CFA model-data fit for scale T3WLOAD ...................................................................... 323 Table 11.84. Invariance test results for scale T3WELS ...................................................................... 325 Table 11.85. Invariance test results for scale T3WLOAD .................................................................. 326 Table 11.86. Invariance test results for scale T3STBEH .................................................................... 326 Table 11.87. Unstandardised factor loadings for T3WELS, T3WLOAD and T3STBEH for all
countries for all populations ........................................................................................................ 326 Table 11.88. Standardised factor loadings and unstandardised intercepts for scale T3WELS ........... 327 Table 11.89. Standardised factor loadings and unstandardised intercepts for scale T3WLOAD ....... 329 Table 11.90. Standardised factor loadings and unstandardised intercepts for scale T3STBEH .......... 331 Table 11.91. Item wording for school climate scales .......................................................................... 334 Table 11.92. Omega coefficients for populations of each participating country/economy ................. 334 Table 11.93. CFA model-data fit for scale T3DISC ............................................................................ 336 Table 11.94. CFA model-data fit for scale T3STUD .......................................................................... 338 Table 11.95. CFA model-data fit for scale T3STAKE ........................................................................ 340 Table 11.96. Invariance test results for scale T3DISC ........................................................................ 342 Table 11.97. Invariance test results for scale T3STUD ....................................................................... 342 Table 11.98. Invariance test results for scale T3STAKE .................................................................... 343 Table 11.99. Unstandardised factor loadings for T3DISC, T3STUD and T3STAKE for all countries
for all populations ........................................................................................................................ 343 Table 11.100. Standardised factor loadings and unstandardised intercepts for scale T3DISC ........... 343 Table 11.101. Standardised factor loadings and unstandardised intercepts for scale T3STUD .......... 345 Table 11.102. Standardised factor loadings and unstandardised intercepts for scale T3STAKE ....... 347 Table 11.103. Item wording for the team innovativeness scale .......................................................... 350 Table 11.104. Omega coefficients for the populations in each participating country/economy ......... 350 Table 11.105. CFA model-data fit for scale T3TEAM ....................................................................... 352 Table 11.106. Invariance test results for scale T3TEAM .................................................................... 354 Table 11.107. Unstandardised factor loadings and intercepts for T3TEAM for all countries for all
populations .................................................................................................................................. 354 Table 11.108. Standardised factor loadings for scale T3TEAM ......................................................... 354 Table 11.109. Item wording for equity and diversity scales................................................................ 358 Table 11.110. Reliability coefficients for the populations of participating each country/economy .... 358 Table 11.111. CFA model-data fit for scale T3SEFE ......................................................................... 360 Table 11.112. CFA model-data fit for scale T3DIVP ......................................................................... 362 Table 11.113. Invariance test results for scale T3SEFE ...................................................................... 364
11
TALIS 2018 TECHNICAL REPORT © OECD 2019
Table 11.114. Invariance test results for scale T3DIVP ...................................................................... 364 Table 11.115. Unstandardised factor loadings for T3SEFE for all countries for ISCED level 2 ........ 364 Table 11.116. Standardised factor loadings and unstandardised intercepts for T3SEFE .................... 365 Table 11.117. Standardised factor loadings and unstandardised intercepts for T3DIVP .................... 367 Table 11.118. Item wording for teaching practices ............................................................................. 369 Table 11.119. Item wording for job satisfaction scales ....................................................................... 372 Table 11.120 Reliability coefficients for job satisfaction scales ......................................................... 372 Table 11.121. CFA model-data fit for scale T3PJSENV .................................................................... 374 Table 11.122. CFA model-data fit for scale T3PJSPRO ..................................................................... 376 Table 11.123. Invariance test results for scale T3PJSENV ................................................................. 378 Table 11.124. Invariance test results for scale T3PJSPRO ................................................................. 379 Table 11.125. Invariance test results for scale T3PWLOAD .............................................................. 379 Table 11.126. Standardised factor loadings and unstandardised intercepts for scale T3PJSENV ...... 379 Table 11.127. Standardised factor loadings and unstandardised intercepts for scale T3PJSPRO ....... 381 Table 11.128. Standardised factor loadings and unstandardised intercepts for the scale
T3PWLOAD ............................................................................................................................... 383 Table 11.129. Item wording for school leadership .............................................................................. 387 Table 11.130. Omega coefficients for the school leadership scales .................................................... 387 Table 11.131. CFA model-data fit for scale T3PLEADS .................................................................... 389 Table 11.132. CFA model-data fit for scale T3PLEADP .................................................................... 389 Table 11.133. Invariance test results for scale T3PLEADS ................................................................ 391 Table 11.134. Invariance test results for scale T3PLEADP ................................................................ 392 Table 11.135. Unstandardised factor loadings for school leadership scales for all participating
countries/economies for all populations ...................................................................................... 392 Table 11.136. Standardised factor loadings and unstandardised intercepts for scale T3PLEADS ..... 392 Table 11.137. Standardised factor loadings and unstandardised intercepts for scale T3PLEADP ..... 394 Table 11.138. Item wording for school climate scale items ................................................................ 399 Table 11.139. Omega coefficients for school climate scales............................................................... 399 Table 11.140. CFA model-data fit for scale T3PACAD ..................................................................... 401 Table 11.141. CFA model-data fit for scale T3PCOM ....................................................................... 402 Table 11.142. CFA model-data fit for scale T3PLACSN ................................................................... 402 Table 11.143. CFA model-data fit for scale T3PDELI ....................................................................... 403 Table 11.144. Invariance test results for scale T3PACAD .................................................................. 405 Table 11.145. Invariance test results for scale T3PCOM .................................................................... 405 Table 11.146. Invariance test results for scale T3PLACSN ................................................................ 405 Table 11.147. Invariance test results for scale T3PDELI .................................................................... 406 Table 11.148. Unstandardised factor loadings for school climate scales for all participating
countries/economies for all populations ...................................................................................... 406 Table 11.149. Standardised factor loadings and unstandardised intercepts for scale T3PACAD ....... 406 Table 11.150. Standardised factor loadings and unstandardised intercepts for scale T3PCOM ......... 408 Table 11.151. Standardised factor loadings and unstandardised intercepts for scale T3PLACSN ..... 410 Table 11.152. Standardised factor loadings and unstandardised intercepts for scale T3PDELI ......... 412 Table 11.153. Item wording for the innovation scale .......................................................................... 415 Table 11.154. Omega coefficient for the scale on innovation ............................................................. 415 Table 11.155. CFA model-data fit for scale T3PORGIN .................................................................... 417 Table 11.156. Invariance test results for scale T3PORGIN ................................................................ 419 Table 11.157. Standardised factor loadings and unstandardised intercepts for scale T3PORGIN ..... 420 Table 11.158. Item wording for equity and diversity scale ................................................................. 423 Table 11.159. Omega coefficient for the equity and diversity scale ................................................... 423 Table 11.160. CFA model-data fit for scale T3PDIVB ....................................................................... 425

12
TALIS 2018 TECHNICAL REPORT © OECD 2019
Table 11.161. Invariance test results for scale T3PDIVB ................................................................... 427 Table 11.162. Unstandardised factor loadings and intercepts for scale T3DIVB for all participating
countries/economies for all populations ...................................................................................... 427 Table 11.163. Standardised factor loadings for scale T3PDIVB......................................................... 427 Table 11.164. Item wording for distributed leadership scale .............................................................. 430 Table 11.165. Item wording for diversity practices, school scale ....................................................... 430 Table 11.166. Item wording for diversity policies, school scale ......................................................... 430 Table 11.167. Item wording for equity beliefs scale ........................................................................... 430 Table 12.1. Type of professional development undertaken by principals ........................................... 439 Table 12.2. School practices related to diversity ................................................................................. 442 Table 12.3. Principals’ gender, by school characteristics .................................................................... 445
Figures
Figure 6.1. Responsibilities of national study centres and the school co-ordinator during survey
administration .............................................................................................................................. 116 Figure 8.1. Iterative data-cleaning process .......................................................................................... 146 Figure 11.1. Illustration of the midpoint of a scale’s items ................................................................. 211
Boxes
Box 12.1. Interpretation of results derived from analysis of teachers’ and principals’ data ............... 442 Box 12.2. Annotation rules relating to data-quality requirements ...................................................... 444

13
TALIS 2018 TECHNICAL REPORT © OECD 2019
Abbreviations and acronyms
Abbreviation/Acronym Description Comment
ACER Australian Council for Educational Research
AV Adaptation verification
BRR Balanced repeated replication
CFA Confirmatory factor analysis
CFI Comparative fit index
CNO Co-ordinated national options
DME IEA Data Management Expert IEA software
DPE IEA Data Processing Expert IEA software
EAS IEA eAssessment IEA software
EFA Exploratory factor analysis
EM Expectation-maximization
EU European Union
FSD Factor score determinacy
FT Field trial
ICC Intra-class correlation coefficient
ID Identification number
IDB International database
IEA International Association for the Evaluation of Educational Achievement
IQO International quality observer Contracted by IEA
IRT Item response theory
ISC International study centre For TALIS: IEA Hamburg
ISCED UNESCO International Standard Classification of Education
Published in 2011
ISCED level 1 Primary school
ISCED level 2 Lower secondary school
ISCED level 3 Upper secondary school
MGCFA Multiple-group confirmatory factor analysis
MLR Maximum likelihood robust
MOS Measure of size
MS Main survey
NA Not applicable
NADB National Adaptations Database
NAF National adaptation form
NDM National data manager
NPM National project manager
NQO National quality observer Contracted by national centre
NRBA Non-response bias analysis
NSM National sampling manager
ODC Online data collection
OECD Organisation for Economic Co-operation and Development
OSS IEA Online Survey System IEA software
P&P Paper and pencil

14
TALIS 2018 TECHNICAL REPORT © OECD 2019
Abbreviation/Acronym Description Comment
PISA OECD Programme for International Student Assessment
PQ Principal questionnaire
PRE IEA Participation Rate Estimator Software
QEG Questionnaire Expert Group
RandA Research and Analysis Team Unit within IEA Hamburg
RMSEA Root mean square error of approximation
SAQ Survey activities questionnaire
SC School co-ordinator
SEM Structural equation modelling
SOP Survey operations procedures
SPSS Statistical Package for the Social Sciences Software
SRMR Standardized root mean square residual
StatCan Statistics Canada
TAG Technical Advisory Group
TALIS OECDTeaching and Learning International Survey
TGB TALIS Governing Board
TLF Teacher listing form Form produced by WinW3S
TLI Tucker-Lewis Index
TQ Teacher questionnaire
TTF Teacher tracking form Form produced by WinW3S
UNESCO-UIS UNESCO Institute for Statistics
WinW3S IEA Within-School Sampling Software IEA software
WLSMV Weighted least squares mean variance
WRMR Weighted root mean square residual
15
TALIS 2018 TECHNICAL REPORT © OECD 2019
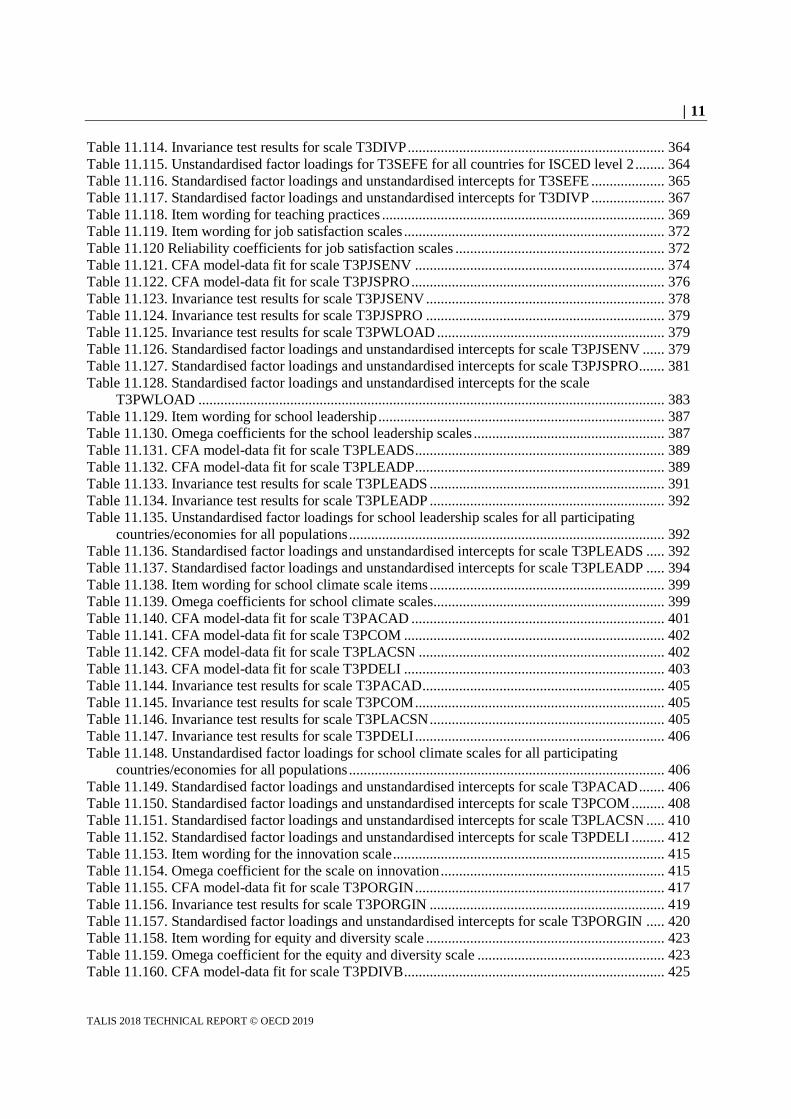
Three-digit operational codes of TALIS 2018 participants
TALIS 2018 participant Code
Alberta (Canada) CAB
Australia AUS
Austria AUT
Belgium BEL
Flemish Community (Belgium) BFL
Brazil BRA
Bulgaria BGR
CABA – Ciudad Autónoma de Buenos Aires (Argentina) ABA
Chile CHL
Colombia COL
Croatia HRV
Cyprus1,2 CYP
Czech Republic CZE
Denmark DNK
England (United Kingdom) ENG
Estonia EST
Finland FIN
France FRA
Georgia GEO
Hungary HUN
Iceland ISL
Israel ISR
Italy ITA
Japan JPN
Kazakhstan KAZ
Korea KOR
Latvia LVA
Lithuania LTU
Malta MLT
Mexico MEX
Netherlands NLD
New Zealand NZL
Norway NOR
Portugal PRT
Romania ROU
Russian Federation RUS
Saudi Arabia SAU
Shanghai (China) CSH
Singapore SGP
Slovak Republic SVK
Slovenia SVN
South Africa ZAF
Spain ESP
Sweden SWE
Chinese Taipei TWN

16
TALIS 2018 TECHNICAL REPORT © OECD 2019
TALIS 2018 participant Code
Turkey TUR
United Arab Emirates ARE
United States USA
Viet Nam VNM
1. Note by Turkey: The information in this document with reference to “Cyprus” relates to the southern part of
the Island. There is no single authority representing both Turkish and Greek Cypriot people on the Island.
Turkey recognises the Turkish Republic of Northern Cyprus (TRNC). Until a lasting and equitable solution is
found within the context of the United Nations, Turkey shall preserve its position concerning the “Cyprus
issue”.
2. Note by all the European Union Member States of the OECD and the European Union: The Republic of
Cyprus is recognised by all members of the United Nations with the exception of Turkey. The information in
this document relates to the area under the effective control of the Government of the Republic of Cyprus.

17
TALIS 2018 TECHNICAL REPORT © OECD 2019
Executive summary
This technical report details the steps, procedures, methodologies, standards and rules that
the Teaching and Learning International Survey (TALIS) 2018 used to collect high-quality
data. The primary purpose of the report is to support readers of the international and
subsequent thematic reports as well as users of the public international database when
interpreting results, contextualising information and using the data. A user guide
complements this technical report and provides detailed guidance and examples for
individuals using TALIS 2018 data.
The report is structured in the form of 12 chapters followed by 9 annexes.
Chapters 1 to 12 provide an overview of the conceptual framework and questionnaire
development processes, translation and translation verification, further field operations and
the quality observations of the fieldwork in countries/economies. It describes the sampling,
weighting and adjudication procedures applied, followed by the preparation and structure
of the international databases. Finally, the scaling methodology and the scaling results
produced as well as information on the production and verification of the international
result tables are included.
Annexes A to I focus on the individuals and groups who prepared and conducted the survey,
the technical standards, forms and questionnaires used, the achieved participation rates of
the various target populations and the scaling process and its results.
The following summary highlights the key operational parameters and approaches applied
in TALIS 2018 and further detailed in this technical report. The summary then details the
key changes made during TALIS 2018 in comparison to previous cycles, especially TALIS
2013.
Governance, management and structure
TALIS 2018 was initiated and managed by the Organisation for Economic Co-operation
and Development (OECD) on behalf of participating countries and economies. The TALIS
Governing Board (TGB) and its Strategic Development Group (SDG) were the primary
decision-making bodies.
The TALIS 2018 International Consortium, led by the International Association for the
Evaluation of Educational Achievement (IEA), with its premises in Amsterdam,
the Netherlands, and Hamburg, Germany, was responsible for implementing the survey at
the international level on behalf of the OECD Secretariat. The IEA’s partners were
Statistics Canada, based in Ottawa, Canada, and the Australian Council for Educational
Research (ACER) based in Melbourne, Australia.
The TALIS International Study Centre (ISC) is located at the IEA Hamburg, Germany, and
led by Steffen Knoll (IEA).

18
TALIS 2018 TECHNICAL REPORT © OECD 2019
The Questionnaire Expert Group (QEG), chaired by Ralph Carstens (IEA), developed the
principal and teacher questionnaires and contributed (along with others) to the TALIS
analysis plan.
The Technical Advisory Group (TAG), chaired by Fons van de Vijver, Tilburg University,
the Netherlands, provided on-demand and further support to the consortium and the OECD
in relation to technical, methodological and analytical matters.
Participants, international options and survey phases
Forty-eight countries and economies (jointly referred to as “participants”) took part in the
“core” survey, that is, teachers and their principals in lower secondary level schools
according to the UNESCO International Standard Classification of Education (ISCED)
level 2. Within each, a national project manager (NPM) had primary responsibility for all
local work.
TALIS participants were offered one or more international survey options in addition to
the core. Fifteen participants administered TALIS 2018 in upper secondary schools (ISCED
level 3); 11 participants conducted the survey at the primary level (ISCED level 1); and 9
participants administered it in schools selected for the Programme for International Student
Assessment (PISA) 2018.
The survey was organised and conducted in three phases: (1) the pilot phase, the purpose
of which was to develop and trial the content of the survey questions with a small number
of TALIS participants; (2) the field trial phase, designed to test and evaluate the
questionnaires and item formats as well as the survey procedures and data collection
modes; and (3) the main survey phase, focused on collecting the TALIS data in the
48 participating countries and economies.
Framework and questionnaire development, translation
The TALIS 2018 conceptual framework guided the theory-driven development of the
survey’s school principal and teacher instruments.
Instruments reflected the participating countries/economies’ interest in monitoring changes
(trend data) over time, improving some instrument materials and introducing new materials
for topics of emerging importance.
A core and extended Questionnaire Expert Group (QEG) translated goals and priorities into
questionnaire materials and an analysis plan.
Development took place between September 2015 and August 2017 in three phases: the
pilot, which used a focus group approach; the quantitative field trial; and extensive
psychometric analyses prior to the main survey.
A series of experiments embedded at the field trial stage were analysed through use of a
system of three different, partially overlapping forms of the questionnaire for teachers.
The resulting master questionnaire for principals and teachers was used for the ISCED
level 2 core survey and, with some adaptation, for the ISCED levels 1 and 3 and the
TALIS-PISA link international options. Each questionnaire took respondents about 45 to
60 minutes to complete (English-language version).

19
TALIS 2018 TECHNICAL REPORT © OECD 2019
All participating countries/economies were responsible for producing their own national
survey instruments. National study centres used the international versions (English and
French) of the survey instruments as the basis of their national questionnaires and used the
national adaptation form to document any adaptations they made to the instruments to suit
their respective national contexts.
To ensure high quality and comparability, the national instruments underwent
three verification steps: national adaptation verification, translation verification and layout
verification. Instruments were adapted, translated and verified for 48 countries/economies
for a total of 83 samples across all ISCED levels and options and 62 language versions.
Nine participants administered the survey in more than one language.
The survey activities questionnaire (SAQ) showed that most of the survey’s national project
managers (NPMs) experienced no difficulties translating the source questionnaires into
national languages or adapting them to local contexts.
Sampling of schools and teachers
TALIS 2018’s canonical sampling design was unchanged from earlier cycles, in
accordance with the OECD terms of reference (TOR) of this survey. A first-stage random
sample of 200 schools was followed by a second-stage random sample of 20 teachers from
the selected schools.
All anticipated adaptations to national conditions (e.g. number of schools or teachers in the
population of interest; excluded areas; analytical or reporting requirements) were
implemented.
The samples of schools for each participating country/economy were drawn centrally, after
which the national teams used consortium-provided software to select the samples of
teachers.
Main survey administration and quality observations
Main survey data collection took place between September and December 2017 for
Southern Hemisphere participants (with some countries extending into January 2018 as an
exception) and March to May 2018 for Northern Hemisphere participants (with some
participants starting early in February and some extending into July 2018). Extensions to
the data collection period were needed in 17 countries and economies to achieve the
required participation rates.
All but three participants administered the survey on line, the default mode.
Eleven participants administered TALIS in a mixed mode, that is, online and paper
instruments. During the main survey, 91.3% of the respondents completed the survey
on line and 8.7% completed it on paper.
Three different quality observation activities were implemented: an international quality
observation (IQO) programme overseen by the IEA Amsterdam (main survey only); a
national quality control programme run by the NPMs (field trial and main survey); and an
online survey activities questionnaire, used to gather national study centres’ feedback on
the different survey activities (field trial and main survey).
For the international quality control programme, the IEA Amsterdam recruited independent
observers who monitored the administration of the survey in a subsample of the
participating schools.

20
TALIS 2018 TECHNICAL REPORT © OECD 2019
The findings from the international quality control programme generally confirmed that all
participating countries/economies implemented the procedures related to the survey
administration in accordance with technical standards.
Information from the survey activities questionnaire showed that collaboration between the
national study centres and the TALIS 2018 Consortium facilitated the successful
administration of TALIS 2018.
Data collection, processing, weighting and adjudication
The IEA Hamburg applied a vast number of checks and cleaning routines to the data and
continuously sent data to the partners, the analysis teams and the OECD.
Countries/economies were provided with regular data updates for verification.
The average participation rate for ISCED level 2 principal/school data before replacement
was 85.9% (91.6% after replacement); rates ranged from 49.9% to 100.0% before
replacement. The average overall ISCED level 2 teacher participation rate was 84.3%, with
the rates ranging from 52% to 99.9%. The average overall participation rates of teachers
and principals in countries/economies that also participated in TALIS 2008 or 2013 did not
vary from the participation rates in 2018 although some countries showed improvements
while others experienced drops.
Adjudication was performed to determine the overall quality of the data, that is, whether
the data released to participants and OECD were “fit for use” as intended under the lead of
the sampling referee for TALIS 2018. The design and application of the quality assurance
processes drew on expert advice and opinion, on qualitative information and learned
judgement, and on quantitative information.
Each individual data set from all countries and economies was examined by the consortium
and arising issues were discussed and clarified with other actors as necessary. The
consortium considered the overall quality of the survey implementation and the data
yielded to be high.
The adjudication resulted in recommendations for data users regarding the quality of the
collected teacher data (samples rated as 59 good, 11 fair, 3 poor, 2 insufficient) and
principal data (samples rated as 57 good, 15 fair, 0 poor, 3 insufficient) in ISCED levels 1,
2 and 3. Recommended ratings were based on the participation rates (weighted or
unweighted) most favourable to the participants.
Two versions of the international database were created: a public-use file (PUF) available
on the OECD’s website for secondary data users and researchers; and a restricted-use file
(RUF) available only to accredited members nominated by the respective national TALIS
Governing Board members and who also accepted the respective confidentiality and
embargo rules.
Scaling, analysis and results table production
Indices created in TALIS 2018 encompassed simple indices (e.g. ratios) and complex
indices (i.e. scale scores).
The scaling procedure for the complex indices was conducted by the IEA Hamburg within
the framework of multiple-group confirmatory factor analysis (MGCFA) and consisted of
two major steps – scale evaluation and scale score computation.

21
TALIS 2018 TECHNICAL REPORT © OECD 2019
Measurement invariance techniques were used to test cross-country comparability. Across
the two instruments (teacher questionnaire and principal questionnaire), the majority of
scales reached the metric level of invariance allowing comparisons of correlational analysis
across countries/economies. Only two scales reached the scalar level of measurement
invariance allowing comparisons of scale score means across countries/economies.
The preparation of the tables consisted of two major steps. The first was the development,
review and revision of table shells. The second was data analysis and table production,
followed by independent verification.
The main goal of the TALIS surveys is to generate reliable, valid and comparable
population estimates based on sample data. All parameters presented in the tables for the
TALIS 2018 international report were weighted. Fay’s variant of the balanced repeated
replication (BRR) technique was used to estimate the standard errors.
Differences between TALIS 2018 and the 2008 and/or 2013 cycles
The following aspects describe key technical changes applied in TALIS 2018 since 2013
especially and should be read as initial guidance to users of the public-use files until the
user guide is published later in 2019.
In keeping with the TALIS terms of reference for TALIS 2018, the sampling team
introduced a provision to control for possible shifts in coverage due to the evolution
of ISCED level definitions (ISCED-2011, previously ISCED-97). None of the
participating countries/economies reported changes to their mapping to ISCED
levels that could have adversely affected comparisons of the TALIS 2018 results
with the results of the previous two cycles.
Principal/school data were adjudicated on their own in 2018, an occurrence that
resulted in the notion of a “participating school for principal/school data” being
introduced. A school was considered “participating” if its principal returned his or
her questionnaire with at least one valid response. For the teacher data, the
minimum of 50% teacher participation remained the criterion for determining
whether a school was “participating” or not. Consequently, and in contrast to
TALIS 2008 and 2013, a school record remained on the school file if the principal
responded to the questionnaire, even if fewer than 50% of the teachers in the school
participated in the survey.
The scale score estimation implemented in TALIS 2018 was, on the one hand, more
rigorous than in TALIS 2013 and, on the other hand, more tailored to each
education system than in previous TALIS cycles. The scale scores for the 2018
cycle reflect the level of comparability across countries/economies as well as
between different ISCED levels within countries/economies. The applied
procedure enhances cross-country comparability by reducing the bias while
providing additional opportunities for comparisons between ISCED levels for
national purposes.
In this TALIS cycle, the tables for the international report were produced by the IEA and
verified by experts at the Australian Council for Educational Research (ACER) in
Melbourne, Australia.

22
TALIS 2018 TECHNICAL REPORT © OECD 2019
Chapter 1. Introduction
This chapter provides an overview of the survey components and the preparation and
implementation of the Teaching and Learning International Survey (TALIS) 2018, initiated
and co-ordinated by the Organisation for Economic Co-operation and Development
(OECD). It introduces the management structure established to administer this third cycle
of the survey, the survey’s target populations and educational levels investigated, the role
of the national project managers, the key development phases of the study and the
standardised procedures implemented to allow the collection of high-quality data in 48
countries and economies.
The statistical data for Israel are supplied by and under the responsibility of the relevant Israeli authorities. The
use of such data by the OECD is without prejudice to the status of the Golan Heights, East Jerusalem and Israeli
settlements in the West Bank under the terms of international law.

23
TALIS 2018 TECHNICAL REPORT © OECD 2019
1.1. TALIS in brief
This OECD Teaching and Learning International Survey (TALIS) 2018 Technical Report
documents the development of the TALIS survey instruments as well as the methods used
to conduct the following: sampling; data collection, weighting, scaling and analysis; and
production of tables. It enables readers to review and understand these procedures and to
gain insight into the rigorous quality control programme that encompassed all phases of the
survey.
TALIS, the first international series of surveys to focus on the learning environment and
the working conditions of teachers in schools, offers teachers and school principals the
opportunity to provide their perspectives on school contexts. Countries can then use this
information to deepen analysis of the questions TALIS examines and to aid the
development of policy relating to these matters. TALIS data also allow countries to identify
other countries facing similar challenges and to learn from their approaches to policy
development.
The first cycle of TALIS, conducted in 2008, involved 24 countries and economies.1 The
success of this cycle, especially its valuable contribution to teacher policy development in
those countries, led to the TALIS Board of Participating Countries (BPC) and the OECD
Secretariat agreeing to conduct a second cycle, TALIS 2013.
TALIS 2013 included 34 countries and economies.2 Four additional countries and
economies3 decided to join this second TALIS cycle on a shifted schedule, which meant
they collected their main survey data in 2014, one year after the main group of participants
completed their main data collection. To ensure comparability, the four additional
participants followed the same rules, standards and principles employed for the main group.
They also used the same manuals, forms and materials.
From the time of its first cycle (2008), TALIS has required all participants to conduct its
“core” survey at the lower secondary level of education, that is, level 2 of the International
Standard Classification of Education (UNESCO-UIS, 2006[1]). Since 2013, countries have
also been able to elect to administer the survey at ISCED level 1 (primary education) and/or
ISCED level 3 (upper secondary education). A third option during TALIS 2013 invited
countries that took part in the OECD 2012 Programme for International Student
Assessment (PISA) to implement TALIS in the same schools that participated in PISA.
This option was called the “TALIS-PISA link”. Six of the 2013 countries/economies
conducted the ISCED level 1 survey, 10 the ISCED level 2 option, and 8 the TALIS-PISA
link option.
After the two successful TALIS cycles in 2008 and 2013, the TALIS BPC, the decision-
making body for the TALIS programme, now transformed into the TALIS Governing
Board (TGB), decided to conduct the third cycle of TALIS (TALIS 2018) between 2015
and 2019, with a main data collection between September and December 2017 for Southern
Hemisphere participants and between February and May 2018 for Northern Hemisphere
participants.
In 2018, 48 countries/economies participated in TALIS. As in the previous two cycles, the
“core” populations were ISCED level 2 teachers and their school leaders, that is, teachers
and leaders at the lower secondary level of school education (UNESCO-UIS, 2012[2]).4 In
addition, countries could again elect to administer the survey at ISCED level 1 and/or
ISCED level 3. Because the OECD PISA 2018 and TALIS 2018 were administered at the
same time in 2017/18, those countries/economies that took part in both programmes again

24
TALIS 2018 TECHNICAL REPORT © OECD 2019
had a third option, that of implementing TALIS in the same schools that participated in
PISA. This option was again described as the TALIS-PISA link. Fifteen participants used
the ISCED level 1 option, 11 the ISCED level 3 option, and 9 the TALIS-PISA link option.
The themes and topics covered in TALIS 2018 include not only those addressed in previous
cycles but also new topics (e.g. diversity, innovation, well-being). In particular, TALIS
2018 addressed the following 11 themes and priorities related to professional
characteristics and pedagogical practices at institutional and individual levels:
teachers’ instructional practices
school leadership
teachers’ professional practices
teacher education and initial preparation
teacher feedback and development
school climate
job satisfaction (including motivation)
teacher human resource measures and stakeholder relations
teacher self-efficacy
innovation
equity and diversity.
The TALIS 2018 conceptual framework, which guided the survey’s development and also
the TALIS Consortium’s analysis plan and the OECD’s reporting plan, was released as
OECD Education Working Papers, No. 187 (Ainley and Carstens, 2018[3]). It includes
more detailed illustrations, covers priority areas and describes the mapping between these
and the initial policy aspects driving TALIS to date. It also explores the limitations evident
in such work. We strongly recommend readers of this technical report to review key aspects
of the conceptual framework as well.
Because of the positive experience in TALIS 2008 and 2013 and in recognition of the
growing number of TALIS participants interested in and capable of collecting data on line,
the OECD Secretariat decided, in 2018, to make the online mode of data collection the
default mode. Forty-five of the 48 participating countries/economies decided to collect
TALIS data predominantly on line. Only three participants opted for the paper-and-pencil-
only data collection mode. In 2013, 27 of the 34 participants collected their data on line.
The remainder of this chapter briefly describes the management of TALIS 2018 at the
international and national levels and outlines the survey’s three major phases and
milestones.
1.2. Participating countries and economies
The following table (Table 1.1) lists the TALIS 2018 participants for all ISCED levels and
survey options.

25
TALIS 2018 TECHNICAL REPORT © OECD 2019
Table 1.1. TALIS 2018 participants in ISCED level 2 (core survey), ISCED levels 1 and 3
options and the TALIS-PISA link
Participating country/economy ISCED level 2 (core) ISCED level 1 ISCED level 3 TALIS-PISA link
Alberta (Canada) ● ●
Australia ● ● ●
Austria ●
Belgium ●
Flemish Community (Belgium) ● ●
Brazil ● ●
Bulgaria ●
Ciudad Autónoma de Buenos Aires (Argentina)
● ● ●
Chile ●
Colombia ● ●
Croatia ● ●
Cyprus1,2 ●
Czech Republic ● ●
Denmark ● ● ● ●
England (United Kingdom) ● ●
Estonia ●
Finland ●
France ● ●
Georgia ● ●
Hungary ●
Iceland ●
Israel ●
Italy ●
Japan ● ●
Kazakhstan ●
Korea ● ●
Latvia ●
Lithuania ●
Malta ● ●
Mexico ●
Netherlands ● ●
New Zealand ●
Norway ●
Portugal ● ●
Romania ●
Russian Federation ●
Saudi Arabia ●
Shanghai (China) ●
Singapore ●
Slovak Republic ●
Slovenia ● ●
South Africa ●
Spain ● ●
Sweden ● ● ●
Chinese Taipei ● ● ●

26
TALIS 2018 TECHNICAL REPORT © OECD 2019
Participating country/economy ISCED level 2 (core) ISCED level 1 ISCED level 3 TALIS-PISA link
Turkey ● ● ● ●
United Arab Emirates ● ● ●
United States ●
Viet Nam ● ● ● ●
1. Note by Turkey: The information in this document with reference to “Cyprus” relates to the southern part of the Island.
There is no single authority representing both Turkish and Greek Cypriot people on the Island. Turkey recognises the
Turkish Republic of Northern Cyprus (TRNC). Until a lasting and equitable solution is found within the context of the
United Nations, Turkey shall preserve its position concerning the “Cyprus issue”.
2. Note by all the European Union Member States of the OECD and the European Union: The Republic of Cyprus is
recognised by all members of the United Nations with the exception of Turkey. The information in this document relates
to the area under the effective control of the Government of the Republic of Cyprus.
1.3. Managing the survey internationally
In January 2016, the OECD entered a partnership with the International Association for the
Evaluation of Educational Achievement (IEA) and its consortium partners, Statistics
Canada (Ottawa, Canada) and the Australian Council for Educational Research (ACER,
Melbourne, Australia). Under this partnership, the OECD commissioned the IEA Hamburg
office as the international study centre (ISC) to conduct TALIS 2018. The consortium
included staff from both IEA offices in Amsterdam and Hamburg and from Statistics
Canada and ACER.
The team at the ISC was led by Steffen Knoll (co-director for operations) and
Ralph Carstens (co-director for content) and included Friederike Westphal (study
co-ordinator until May 2016), Viktoria Böhm (study co-ordinator since May 2016),
Malgorzata Petersen (study co-ordinator assistant since October 2017), Juliane Kobelt
(study co-ordinator since November 2018), Alena Becker (international data manager), and
Christine Busch (deputy international data manager). Ralph Carstens (IEA Hamburg)
chaired the Questionnaire Expert Group (QEG). Its role was to co-ordinate the team of
internationally selected researchers responsible for developing the TALIS 2018
questionnaires. John Ainley (ACER), in collaboration with the QEG members, prepared
the conceptual framework. The analysis team at the IEA Hamburg, led by Agnes Stancel-
Piatak, was responsible for data scaling and table production. The team developed and
implemented the validation and scaling procedures, produced the scale scores, prepared the
datasets for analysis and produced the tables according to pre-agreed analysis and reporting
plans.
At the IEA Amsterdam, the IEA financial director Roel Burger managed the financial and
contractual affairs in co-operation with Christian Groth, head of accounting and controlling
at the IEA Hamburg. David Ebbs co-ordinated the translation verification of the national
survey questionnaires in 62 language versions. cApStAn Linguistic Quality Control,
specialising in semantic quality control of translations in a range of international surveys
and based in Brussels, Belgium, was contracted to support this work. Michelle Djekic was
responsible for managing the international quality observation programme in all
participating countries/economies by contracting, training and supervising independent
quality observers. She was supported by Sandra Dohr, who took over this responsibility in
August 2018.
The study’s sampling referee, Jean Dumais, and the sampling team manager, Yves Morin,
both of Statistics Canada, were responsible for the survey’s international sample design
and its national sampling plans, implementation, weighting and adjudication.

27
TALIS 2018 TECHNICAL REPORT © OECD 2019
The OECD Secretariat’s Directorate for Education and Skills in Paris, France, responsible
for the overall supervision of the project across the participating countries/economies and
TALIS governing bodies, was led by Karine Tremblay. She was supported by Pablo Fraser
and Noémie Le Donné.
The OECD Secretariat appointed Fons van de Vijver (Tilburg University) as chair of the
TALIS 2018 Technical Advisory Group (TAG). Its task was to provide the OECD and the
TALIS Consortium and QEG with expert advice and guidance on methods, processes and
analyses.
1.4. Working with national project managers
In November 2015, the BPC initiated the process of establishing a national centre in each
participating country/economy. Each centre was to be led by an experienced national
project manager (NPM) who would be asked to adhere to consortium guidance on NPM
roles and responsibilities and would have primary responsibility for preparing and
co-ordinating the survey at the national level. The experience and expertise of the NPM
and the staff in his or her centre (e.g. involvement in other international large-scale
assessments) strongly influenced how the various centre tasks were apportioned and
managed.
The consortium also recommended that each centre appoint not only a national data
manager (NDM) to oversee and implement technical and data-related work but also a
national sampling manager (NSM) to support the work of the NPM in situations involving
complex sample designs and possible national additions and extensions to the survey. The
number of staff members in the centres varied considerably from one country/economy to
the next depending on its size and how it chose to organise the national data collection
work. Some NPMs tendered for and contracted external survey organisations to help them
conduct the study centre’s scientific and/or operational work.
The tasks required of the NPMs, data managers and/or sampling managers included the
following:
establishing an overall preparation and administration schedule in co-operation
with the ISC
attending NPM meetings in order to become familiar with all instruments, materials
and survey procedures
providing Statistics Canada with an up-to-date national sampling frame of ISCED
level 2 schools and, where applicable, ISCED levels 1, 3 and PISA schools
discussing national design options, such as oversampling, with Statistics Canada’s
sampling experts
performing within-school listing, sampling and tracking
carrying out quality control and plausibility checks on teacher lists and samples to
identify, for example, teacher lists that had been abbreviated to include only those
teachers who had agreed to participate or that were otherwise incomplete/inaccurate
liaising, with respect to the TALIS-PISA link option, with the PISA 2018 NPM to
obtain the school frames, files and other data items required to successfully
implement the link

28
TALIS 2018 TECHNICAL REPORT © OECD 2019
appointing experienced translator(s) to produce the national versions of the
international instruments
documenting required national adaptations of the instruments on national
adaptation forms
preparing for online data collection (unless opted out of)
identifying and training school co-ordinators
appointing and training national quality observers (NQOs)
nominating possible international quality observers (IQOs) and supporting their
work
monitoring the return status of all questionnaires and projected response rates
capturing responses on paper manually and performing consistency checks
completing a survey activities questionnaire (SAQ) after survey administration
submitting data and documentation to the consortium and responding to data
queries during data processing and analysis.
Regular communication between the NPM and the ISC ensured that survey administration
proceeded according to the international schedule. Deviating survey schedules were
developed for two participants to accommodate their late-joining and to ensure that their
data could be included in the international database and reports. With minor exceptions, all
participating countries/economies met the international collection milestones and
submitted all data and documentation on time.
Countries in both the Northern and Southern Hemispheres collected their TALIS data
towards the end of the school year and in line with the TALIS 2018 technical standards
(see Annex B). National centres distributed paper questionnaires or login details to teachers
and principals, who then completed the questionnaires either on paper or on line within a
defined survey window.
Although the TALIS Consortium and OECD Secretariat assumed that the survey would be
implemented on a voluntary basis in most instances, as had occurred during TALIS 2008
and 2013, some participating countries/economies made it mandatory for sampled schools
and the selected teachers and principals within them to participate in the study. In some
instances where the survey remained voluntary, convincing teachers and school leaders to
participate in the survey proved to be a challenging exercise in a sizable number of cases.
Based on experience in previous TALIS cycles, the ISC sent template strategies and best
practice examples to the national centres to support their efforts to achieve the required
participation rates.
National centres worked very closely with teacher unions, principal organisations, local,
regional and state authorities and/or the national education ministry (as applicable) to
endorse the survey and enable sufficient participation. Participants also engaged in
extensive public relations activities to raise survey awareness among principals and
teachers before the main data collection. Many centres also created their own TALIS
websites.
The working language throughout the project was English, that is, for all international
materials, communication and meetings. Most communication relied on email. The
consortium used Microsoft SharePoint as the collaboration system for document and data
29
TALIS 2018 TECHNICAL REPORT © OECD 2019
exchange between all involved parties. All systems were operated by the ISC and, in the
interests of ensuring confidentiality and security, only authorised personnel could access
information.
During the four-year survey cycle, the consortium held four meetings for all NPMs and
NDMs, during which survey progress was reported and discussions on materials,
procedures, standards and results were held. NPMs also had bilateral and plenary
opportunities to exchange experiences and learn about approaches to, for example, coping
with survey fatigue, ensuring confidentiality and simultaneously managing the
international options and other surveys.
1.5. Standardised procedures
The TALIS 2018 technical standards (see Annex B of this current report), prepared by the
consortium and approved by the TGB, provided participants with a high level of guidance
during all stages of preparation, administration and data work. The standards encompassed
the generally agreed-upon best practices in survey research to adhere to when conducting
a project (see, for example, Biemer and Lyberg (2003[4])]; Martin, Rust, and Adams
(1999[5])]; OECD (2013[6]); and Statistics Canada (2009[7])). According to the total survey
error framework (Biemer and Lyberg, 2003[4]), adherence to these standards is key to
ensuring the validity, reliability and comparability of questionnaires and data. The
consortium also developed an extensive set of operational manuals and guidelines
describing the steps that all participants needed to take to ensure successful implementation
of the survey.
TALIS used two questionnaires to collect data: a principal questionnaire, completed by
school leaders, and a teacher questionnaire, completed by the sampled teachers.
Respondents could choose to fill in the questionnaires on line or with paper and pencil. The
ISC provided the source versions of the questionnaires in English and in French. National
study centre personnel then adapted the instruments to suit local contexts, applying
standardised adaptation rules as they did so. After the consortium had verified all
adaptations, the national centres translated the English or French source versions of the
questionnaires into the local language(s).
For the field trial stage of TALIS 2018, the national study centres used the IEA
eAssessment System to translate the source versions of the survey instruments into the local
language(s). For the main survey, participants used the IEA Online Survey System (OSS)
for this purpose (see Chapters 6 and 8). Independent translation verifiers were employed to
conduct international translation verification of all translated survey instruments. The
TALIS consortium at the IEA Amsterdam was responsible for centrally co-ordinating the
work of the translation verifiers.
The Statistics Canada team performed all school sampling and weighting procedures in line
with established standards and guidelines (more details on the sampling procedures and on
the sampling weights and participation rates appear in Chapters 5 and 9 respectively). The
TALIS NPMs used the IEA Within-School Sampling Software (WinW3S) to draw the
teacher sample for each nationally sampled school and to estimate participation rates.
The IEA Amsterdam co-ordinated the quality observation of the data collection at the
international level, while the NPMs took on this responsibility at the national level.
International quality observers (IQOs) received an intensive two-day period of training (see
Chapter 7).

30
TALIS 2018 TECHNICAL REPORT © OECD 2019
Once the TALIS Consortium was confident all data quality standards had been fully met,
they recommended the data for inclusion in the TALIS 2018 database and subsequent
reports of findings. If, however, the consortium considered standards had not been fully
met, it implemented an adjudication process in consultation with the OECD Secretariat and
TAG and used it to ascertain the extent to which the data quality had been compromised.
The results determined whether data could (or could not) be recommended for
unconditional inclusion in the datasets and consequent reporting.
1.6. Key survey phases
The TALIS design included three main phases: a qualitative pilot study conducted with a
reduced number of participants, a field trial and the main survey. Each phase included all
TALIS participants.
Based on the positive experiences in previous TALIS cycles, the consortium asked
participants to establish focus groups that included teachers and principals. The purpose of
these groups was to discuss the proposed field trial survey items and to provide feedback
on their functioning, cultural applicability and other aspects (see also Chapter 3).
The field trial and main survey followed a quantitative approach. The consortium required
all participants to run the trial according to the standardised procedures outlined in the
TALIS 2018 technical standards (see Annex B). Countries that had opted to participate in
one or more of the international options had to trial them as well.
The consortium held the first meeting of NPMs at the end of April 2016 in Lübeck,
Germany, prior to administration of the pilot study. The purpose of the meeting was to
present and discuss the survey’s draft conceptual framework, the sampling procedures, the
roadmap for instruments and materials, the planned survey operations procedures and the
overall project governance and responsibilities. NPMs were also introduced to the overall
schedule for TALIS 2018, to communication procedures and to best-practice survey
development, administration and implementation procedures collated during TALIS 2008
and 2013.
1.6.1. Pilot study
The main purpose of the pilot study was to test “regular” respondents’ (teachers and
principals in a variety of national settings) understanding of the items. The goal was to
fine-tune the questionnaires for the field trial based on the analysis of the pilot outcomes.
The pilot questionnaires included new, revised and trend items that the pilot respondents
checked against the following criteria:
sufficient conceptual coverage from the perspective of teachers and principals
(important given that TALIS is seen as the voice of teachers)
conceptual understanding and clarity
international and cultural applicability
continued feasibility of an adaptable questionnaire template for ISCED level 1,
ISCED level 3 and the TALIS-PISA link
feasibility of new, modified or alternative formats of new and adapted items as
developed by the QEG

31
TALIS 2018 TECHNICAL REPORT © OECD 2019
ease with which they could be fine-tuned for the field trial (with ease based on
analysis of the pilot outcomes).
In March 2016, the ISC conducted a webinar to initiate preparation of the pilot study. The
centre also released pilot guidelines to national centres.
The pilot study, conducted in May 2016, involved 11 countries from different locations and
cultural and language backgrounds. Five countries contributed to the piloting with respect
to ISCED level 1 and four with respect to ISCED level 3. NPMs established focus groups
of seven to nine members to discuss the pilot instruments. Although translating the
instruments into national languages was not required if all focus group members were
fluent in English, some countries did complete translation work.
The teacher questionnaire included a larger number of items than were needed for testing
and trialling. This number meant that a rotated design could be used later during placement
of items in the field trial instruments. Because of the large number of items during the pilot
study, each group of teachers focused on only half (A or B) of them to keep their
questionnaire completion time within acceptable limits. However, the ISC advised that
each country/economy needed to have only one principal focus group because the number
of items used in the principal questionnaire for the pilot was similar to the number in the
2013 main survey principal questionnaire.
1.6.2. Field trial
The purpose of the field trial was two-fold. The first purpose was to gather as much data as
possible and then to use the information drawn from statistical and substantive review of
those data to fine-tune the instruments for the main survey. The second purpose was to test
all operational procedures in all participating countries and all options in preparation for
the main survey. This second bout of work included the within-school sampling, national
instrument production, survey operations, data collection and data entry.
The second meeting of NPMs took place in September 2016 in Rome, Italy. NPMs and the
TALIS Consortium members discussed the outcomes of the pilot study and the required
changes to the instruments for the field trial. Each NPM also met with the consortium to
discuss their national centre’s sampling plans, individual survey preparation schedules and
strategic plans to achieve high participation rates. After the NPM meeting, the consortium
conducted a data-management seminar to train national data managers in using IEA
software and related procedures. Forty-four of the 46 participants trialled the online
procedures for data collection during the field trial; 2 participants trialled the paper data
collection procedure and data entry.
All participating countries/economies conducted the field trial between January and March
2017. At the end of 2017, two late-joining participants entered TALIS after completing a
deferred survey schedule for the field trial and main survey. These participants conducted
the field trial in February through March of 2018.
The field trial sample size per country and option was 600 teachers and 30 principals from
30 schools. Exceptions were made for some countries/economies where the samples were
smaller due either to a relatively small total number of schools or to other local
circumstances (see Chapter 5 for more details). No separate trialling was done for the
TALIS-PISA link.
NPMs and their teams monitored data collection and supervised data entry (if applicable).
The NPMs then submitted their national datasets to the ISC for processing and quality

32
TALIS 2018 TECHNICAL REPORT © OECD 2019
checks. Extensive analysis of the field trial data by the IEA’s analysis team and QEG (the
core group as well as an extended set of experts), consultations with the TAG, the OECD
Secretariat and the TGB led to key improvements and changes in the main survey
instruments, released for translation in August 2017 (refer to Chapter 3 for more details).
The IEA analysis team referred to the field trial data when conducting the scaling of simple
and complex scales and preparing table production syntax for the main survey. They also
carried out detailed analyses designed to evaluate the scales across TALIS cycles and
across ISCED levels.
1.6.3. Main survey
The purpose of the third four-day meeting of NPMs, held in July 2017 in Lisbon, Portugal,
was to prepare the project managers for administering the main survey in accordance with
the outcomes of the field trial and in light of the draft main survey instruments. Participants
continued to discuss sampling and survey operation procedures with the consortium and
held individual consultations on the field trial data. The third meeting also provided an
opportunity to present the approach and tasks concerning the international and national
quality control observations (see Chapter 7). In contrast to the field trial, the main survey
involved external quality observers at the international level.
Most Southern Hemisphere countries/economies conducted the main survey in the fourth
quarter of 2017 and submitted their data in early 2018. However, some countries/economies
extended the time period into January 2018 as an exception. Northern Hemisphere
countries/economies administered the survey within a self-selected period during the first
and second quarters of 2018, with a final data submission date of no later than the end of
May 2018. However, some of the Northern Hemisphere countries/economies extended the
time period into July 2018. All data were then processed and cleaned at the ISC, after which
Statistics Canada conducted data weighting procedures during the second and third quarters
of 2018.
During the third quarter of 2018, the ISC began transferring all available main survey data
to the analysis team at the IEA Hamburg for scaling, analysis and table production. In
September 2018, the consortium, with the OECD Secretariat in attendance, met for three
days to review the main survey and adjudicate the data.
In October 2018, the fourth NPM meeting took place in Seoul, Korea. The purpose of this
meeting was to finalise, during plenary sessions, all collection work, to sign-off on data
and to review table shells and data for inclusion in the first international report. Participants
also had the opportunity to discuss their data in individual country sessions, while the
consortium’s sampling experts discussed sampling outcomes and weights in bilateral
country consultations. During the meeting in Seoul, the consortium asked NPMs to provide
feedback about the main survey collection experience. This feedback was deemed
particularly important because it would be used to inform future cycles of TALIS.
In March 2019, the NPMs and other national centre staff received training in the correct
use of the international database so that they could either replicate analyses in the
international report or run their own analyses to prepare national reports on the study’s
findings.

33
TALIS 2018 TECHNICAL REPORT © OECD 2019
References
Ainley, J. and R. Carstens (2018), “Teaching and Learning International Survey (TALIS) 2018
Conceptual Framework”, OECD Working Papers, No. 187, OECD Publishing, Paris,
http://dx.doi.org/10.1787/799337c2-en.
[3]
Biemer, P. and L. Lyberg (2003), Introduction to Survey Quality, John Wiley & Sons, Hoboken,
New Jersey.
[4]
Martin, M., K. Rust and R. Adams (1999), Technical Standards for IEA Studies, International
Association for the Evaluation of Educational Achievement, Amsterdam.
[5]
OECD (2013), TALIS 2013 Technical Standards, OECD Publishing, Paris. [6]
Statistics Canada (2009), Quality Guidelines, Statistics Canada, Ottawa. [7]
UNESCO-UIS (2012), International Standard Classification of Education (ISCED) 2011,
UNESCO Institute for Statistics, Montreal,
http://uis.unesco.org/sites/default/files/documents/international-standard-classification-of-
education-isced-2011-en.pdf.
[2]
UNESCO-UIS (2006), International Standard Classification of Education (ISCED) 1997, re-
edition, UNESCO Institute for Statistics, Montreal,
http://uis.unesco.org/sites/default/files/documents/international-standard-classification-of-
education-1997-en_0.pdf.
[1]
Notes
1 TALIS 2008 participants: Australia, Austria, Belgium (Flemish Community), Brazil, Bulgaria,
Denmark, Estonia, Hungary, Iceland, Ireland, Italy, Korea, Lithuania, Malaysia, Malta, Mexico,
Norway, Poland, Portugal, Slovenia, the Slovak Republic, Spain, Turkey.
2 TALIS 2013 participants: Abu Dhabi (United Arab Emirates), Alberta (Canada), Australia, Brazil,
Bulgaria, Chile, Croatia, Cyprus,* the Czech Republic, Denmark, England (United Kingdom),
Estonia, Finland, Flanders (Belgium), France, Iceland, Israel, Italy, Japan, Korea, Latvia, Malaysia,
Mexico, the Netherlands, Norway, Poland, Portugal, Romania, Serbia, Singapore, the Slovak
Republic, Spain, Sweden, the United States (*See footnotes 1 and 2 in Table 1.1).
3 TALIS 2013 additional participants: Georgia, New Zealand, Russia, Shanghai (China).
4 In TALIS 2018, the updated International Standard Classification of Education (ISCED), as
published by UNESCO-UIS in 2012, was used to identify ISCED levels in schools.

34
TALIS 2018 TECHNICAL REPORT © OECD 2019
Chapter 2. Development of the conceptual framework
This chapter describes the development of the conceptual framework that guided TALIS
2018. It describes the theoretical and policy underpinnings of the survey, articulates its
research emphases and links to existing knowledge, and sets out the indicators included in
the TALIS 2018 instruments. TALIS 2018 not only retains a focus on enduring issues
previously surveyed in TALIS 2013 and TALIS 2008 but also introduces some new and
changing aspects of teaching and learning.

35
TALIS 2018 TECHNICAL REPORT © OECD 2019
2.1. Introduction
This chapter outlines the process involved in developing the conceptual framework for the
Teaching and Learning International Survey (TALIS) 2018, which was published as OECD
Education Working Papers, No. 187 (Ainley and Carstens, 2018[1]). This chapter has three
sections: TALIS’s general purpose and policy focus; knowledge relevant to the survey’s
themes and main indicators; and the design of TALIS 2018.
2.2. General purpose of TALIS and policy focus for 2018
2.2.1. The rationale for and aims of TALIS
The Teaching and Learning International Survey (TALIS) was developed as part of the
OECD Indicators of Education Systems (INES) project. TALIS is an ongoing large-scale
survey programme of teachers, school leaders and school learning environments designed
to address policy-relevant issues chosen by the participating countries/economies. The
origins of TALIS lie in a data strategy designed to create a coherent set of indicators to
facilitate studies of teachers and teaching and the impact that teachers can have on student
learning in OECD and partner countries/economies. The TALIS programme of surveys was
influenced by the OECD review of teacher policy, which generated the report Teachers
Matter: Attracting, Developing and Retaining Effective Teachers (OECD, 2005[2]).
The main goal of TALIS is to generate internationally comparable information relevant to
teachers and teaching with an emphasis on aspects that affect student learning. It seeks to
provide reliable international indicators and policy-relevant analyses of teachers and
teaching to enable reviews of policies that promote conditions for effective teaching and
learning. TALIS describes the conditions of teaching and learning, as well as the
functioning of education structures, thus offering a means of comparing approaches to
teaching and school leadership.
Knowledge generated from TALIS contextualises the ways countries/economies develop
the educational outcomes of their education systems. It has therefore developed instruments
for comparing these contexts cross-culturally. Large, carefully selected representative
samples of survey respondents and modern quantitative methods of data collection and
analysis enable formulation of broad inferences about the surveyed populations. They also
allow the development of conclusions about important relationships between and among
factors of interest within and across countries/economies. Use of the same data collection
instruments across countries/economies allows TALIS to validly document the variation in
teacher practice and development that exists among countries/economies and within each
country/economy. TALIS also generates time-series data, making it possible to produce
reliable information about changes in key teacher-related aspects and in associations
between indicators, for each country/economy and across countries/economies.
TALIS 2008 established six principles that are still relevant to the current cycle. These
principles guided the survey strategy and are set down in the TALIS 2008 Technical Report
(OECD, 2010, pp. 24–25[3]):
Policy relevance: A focus on the policy issues and on inclusion of the questions
most relevant for participating countries/economies is essential.
Adding value: Opportunity for each participating country/economy to compare its
findings with those of the other participating countries/economies must be a key
benefit of study participation.

36
TALIS 2018 TECHNICAL REPORT © OECD 2019
Indicator-oriented: Study findings need to yield information that participating
countries/economies can use to develop indicators of the conditions of teaching and
learning in their education systems.
Validity, reliability, comparability and rigour: In accordance with a rigorous
review of relevant research, the survey should yield information that is as valid,
reliable and comparable as possible across participating countries/economies.
Interpretability: Participating countries/economies need to be able to interpret the
results in a way that is meaningful in their national or regional context.
Efficiency and cost-effectiveness: All work relating to the study needs to be timely
and cost-effective.
2.2.2. TALIS 2018 and its relation to previous cycles of TALIS
The TALIS programme of surveys encompasses two previous surveys – TALIS 2008
(OECD, 2009[4]) and TALIS 2013 (OECD, 2014[5]). TALIS 2018 continues this
programme, with its core focus remaining as teaching and learning in schools providing
education at ISCED level 2 (UNESCO-UIS, 2012[6]) and with the three population options
again evident in 2018. The TALIS 2018 conceptual framework builds on the previous two
cycles and underpins the survey’s focus on instructional and institutional conditions that
enhance student learning. It seeks to describe how these vary within and across
countries/economies and over time.
Retaining important issues over time is central to TALIS because this approach allows
countries/economies to measure and monitor change. The 2013 survey used many of the
same questions as TALIS 2008 to facilitate comparisons. Although TALIS 2018 addresses
themes, topics and headings akin to those that TALIS addressed in the past, there are
substantial differences regarding the depth and scope of the questions and indicators.
TALIS 2018, like TALIS 2013, also developed and included new material so as to remain
relevant to emerging policy interests based on insights arising from prior TALIS findings
and the impact of newly implemented policies. This material took the form of new themes
or new aspects of enduring themes (e.g. shortages of teachers and candidates for initial
teacher education, teachers prematurely leaving the profession and other aspects related to
the attractiveness of the profession).
Two themes are new to TALIS 2018: innovation, and equity and diversity. Teachers’
openness to adopting innovative practices and teachers’ perceptions regarding the barriers
to and incentives for adoption of innovation are among the indicators developed for TALIS
2018. Perceptions of issues regarding student diversity and provisions at the school and
classroom level to accommodate diversity (encompassing gender, culture and
socio-economic dimensions) have also become part of TALIS 2018. TALIS 2018
furthermore includes changes within themes, such as school leadership. The school
leadership change is informed by concepts and ideas concerned with distributed leadership
and teacher feedback and development that emerged following completion of planning for
TALIS 2013. Other changes in TALIS 2018 reflect perspectives that come from analyses
of data from earlier cycles.

37
TALIS 2018 TECHNICAL REPORT © OECD 2019
2.3. Developing and refining the conceptual framework
2.3.1. Themes for TALIS 2018
The themes for TALIS 2018 were shaped by deliberations of the TALIS Board of
Participating Countries (BPC), which became the TALIS Governing Board (TGB) from
1 January 2016, and of the OECD Secretariat (OECD, 2015[7]). Additional input was
provided from ongoing policy dialogues and networks, and from a priority rating exercise
conducted in 2015. During the rating exercise, TALIS countries/economies answered
questions and gave priority ratings to listed issues. This exercise helped determine the
structure of the TALIS 2018 themes and indicators.
Deliberations during the 2014 OECD Informal Meeting of Ministers of Education provided
further guidance on the issues that education systems deem a high priority. The
deliberations focused on “how to reflect changes in the demand for skills in the design of
educational systems and teacher professional development, how to raise teacher
effectiveness, and how to build rewarding career structures that advance the profession and
attract the most talented teachers into the most challenging classrooms” (OECD, 2015,
p. 4[7]).
The summary section of the OECD report highlighted the role of innovation in fostering
more effective learning environments and creating the environments in which innovation
can take place. The summary also identified the need for greater effort in fostering effective
pedagogical practices, generating collaborative practices and mobilising resources to
ensure that every student benefits from excellent teaching. The fourth International Summit
on the Teaching Profession (ISTP), held in 2014, identified similar needs, three of which
were fostering the conditions for innovation, fostering deeper forms of collaboration and
strengthening relationships between stakeholders.
Discussions at the ministerial level highlighted several questions that TALIS could address
(OECD, 2015, p. 5[7]). One concerned teachers’ preferences regarding the resources they
think education systems should provide to support effective teaching and learning in
schools; another focused on the types of career-related incentives (including horizontal and
vertical career structures) that teachers value. Other potential questions related to teachers’
views on the following: the conditions that enable innovation in the classroom and in
schools; the role teachers should play in educational reforms and the extent of their
involvement in educational reforms; the mechanisms essential to ensuring the
professionalism of teaching; and the ingredients needed to foster collaboration in schools,
between and across schools, and between schools and the wider community.
Another policy consideration was the potential contribution of TALIS to the United Nations
(UN) Sustainable Development Goals (SDGs). In 2015, the United Nations adopted the
SDGs as a framework for continuous and sustainable progress in social areas considered
fundamental for the improvement of nations. The SDGs established a universal agenda and
do not differentiate between rich and poor countries, and the UN challenged countries to
achieve them (UNESCO, 2016[8]). Goal 4 seeks to “Ensure inclusive and equitable quality
education and promote lifelong learning opportunities for all” (United Nations, 2015[9]).
Goal 4 requires education systems to monitor the actual learning outcomes of their young
people and it identifies seven targets and three means of monitoring achievement of this
goal.

38
TALIS 2018 TECHNICAL REPORT © OECD 2019
TALIS is relevant to this endeavour because Target 4.c of Goal 4 specifically addresses the
role of teachers in ensuring quality education: “By 2030, substantially increase the supply
of qualified teachers, including through international co-operation for teacher training in
developing countries, especially least developed countries and small island developing
States” (United Nations, 2015, p. 17[9]).
Target 4.c consists of one global indicator and six thematic indicators. The global indicator
is “Proportion of teachers in: (a) pre-primary; (b) primary; (c) lower secondary; and (d)
upper secondary education who have received at least the minimum organised teacher
training (e.g. pedagogical training) pre-service or in-service required for teaching at the
relevant level in a given country” (UNESCO, 2016, p. 81[8]).
The six thematic indicators are the pupil to trained teacher ratio by education level; the
proportion of teachers qualified according to national standards, by education level and
type of institution; the pupil to qualified teacher ratio, by education level; the average
teacher salary relative to other professions requiring a comparable level of qualification;
the teacher attrition rate, by education level; and the percentage of teachers who received
in-service training in the last 12 months, by type of training. TALIS provides data on
teacher certification and the highest educational level attained as a proxy for qualified
teachers and thereby addresses the extent to which countries have achieved Goal 4. In
addition, the TALIS indicator of professional development provides information on the
percentages of teachers who received in-service training in the last 12 months.
2.3.2. Prioritising themes for TALIS 2018
The OECD Secretariat invited not only OECD member countries, partner countries and
economies that had expressed interest in taking part in the survey but also the European
Commission to complete a priority rating exercise. Twenty OECD countries and 5 partner
countries and economies completed the exercise, which was conducted between February
and April 2015. The participating countries answered questions and provided ratings that
would help determine the following:
the structure of the TALIS 2018 questionnaires
which themes and indicators to include in TALIS 2018
which repeated indicators from the first two cycles of the survey to include in
TALIS 2018 in order to develop trend data
the preferred cycle frequency for future TALIS cycles.
Responses to these issues were sought in relation to ISCED levels 1, 2 and 3. All
participating countries/economies provided ratings for ISCED level 2. Six countries
completed this exercise for ISCED level 1 and 5 countries completed it for ISCED level 3.
Overall, participants indicated a preference for maximising international comparability
and, therefore, minimising optional modules for individual countries/economies or groups
of countries/economies. Respondents also wanted TALIS 2018 to have fewer themes than
TALIS 2013 and TALIS 2008 had (these 2 earlier iterations encompassed approximately
15 themes). The highest rating was for the proposition that the 2018 questionnaires should
cover between 10 and 13 themes.
The priority rating exercise involved three steps. During the first step, countries were asked
to allocate 100 rating points among 20 proposed themes, with higher points representing a
higher priority. Ratings were generated by aggregating the points the countries allocated to
each theme. Table 2.1 presents the results of the thematic priority rating exercise.

39
TALIS 2018 TECHNICAL REPORT © OECD 2019
Participating countries regarded some themes as very high priorities (e.g. school leadership
and teachers’ instructional practices) and other themes as less important (e.g. teacher
attrition and turnover rates and the sociological composition of teachers). Substantial
cross-country variation was evident in these rankings. In general, the highest-rated themes
were those that most closely matched the countries’/economies’ priorities. For example,
one-third of countries/economies gave a relatively low rating to the theme of teachers’
professional practices.
During the second step, countries were asked to consider the 20 themes to which they had
assigned points and to state which of the 94 indicators should be assigned to each of these
themes. The third step asked countries to indicate which of the indicators used in TALIS
2013 they thought should be maintained in TALIS 2018 to permit analysis of change
between these two cycles.
Table 2.1. Country priority ratings of themes for inclusion in TALIS 2018 ISCED level 2
Theme Average (OECD) Average (all countries)
School leadership 6.9 6.3
Teachers’ instructional practices 6.7 9.0
Teachers’ professional practices 6.7 6.7
Job satisfaction and teacher human resource measures 6.5 6.4
Profile of teachers’ continuing learning and training 6.2 6.5
School climate and ethos 6.1 6.4
Attracting good students into teaching 5.5 5.0
Frequency of in-service education and training 5.3 5.3
Recognition, rewards and evaluation of teachers 5.3 5.3
Motivations and early career experience of teachers 5.2 4.3
Satisfaction and effectiveness of in-service education and training 5.1 5.3
Teachers’ working time 4.6 4.5
Education and qualifications of teachers 4.5 4.0
Initial teacher education and pathways into the profession 4.2 3.8
Teacher self-efficacy 4.2 4.8
Innovation 4.1 4.3
ICT in teaching 3.9 4.0
Adequacy of teacher supply, teacher shortages 3.7 3.2
Teacher attrition and turnover rates 2.9 2.8
Sociological composition of teachers 2.5 2.3
Source: OECD (2015[7]), “Guiding the Policy and Content Focus of TALIS 2018”, EDU/INES/TALIS(2015)
3 (internal document), Directorate for Education and Skills, OECD, Paris, pp. 14-15.
Because of the intention to lower the number of themes in TALIS 2018, the TGB decided
to proceed with no more than ten themes that, in combination, would inform all
five identified policy issues, namely, school policies supporting effectiveness, developing
teachers within the profession, effective teachers and teaching, attracting teachers to the
profession, and retaining teachers in the profession. Another decision was to place a slight
emphasis on those themes among the 20 that addressed policies related to school and
teacher effectiveness. This decision reflected the fact that themes attracting the highest
ratings were those concerned with “school policies supporting effectiveness”.
In addition to the policy rating exercise, ministers of education in the participating
countries/economies were invited to highlight the themes they considered to be key areas
of interest. During this part of the exercise, some of the initially proposed themes were
combined with others, which resulted in variations to the initial list. For example, Theme 5

40
TALIS 2018 TECHNICAL REPORT © OECD 2019
incorporated the two elements of teacher feedback and teacher development from the
original list. In the end, nine themes were agreed to, even though the relative importance
accorded to each of them varied across the participating countries/economies. Table 2.2
sets out those nine themes, together with the most frequently nominated indicators from
TALIS 2013.
Innovation was initially seen as a cross-cutting issue closely related to teachers’
instructional practices and school climate. However, it emerged as an explicit theme
(Theme 10) during discussions by the TGB and QEG and was assigned these indicators:
teachers’ openness to adopting innovative practices
types of innovation in the school in the past year
types of innovation in the target classroom in the current or past school year
perceptions regarding the barriers to and incentives for the adoption of innovation
evaluation and dissemination of innovative practices in the school.
The TGB and QEG originally considered equity and diversity to be encapsulated in the
substance of each of the nine themes, but the TALIS participants and policy stakeholders
mutually decided to include this theme (Theme 11) as a theme of high contemporary
importance.
One further decision resulting from the priority exercise established that although there
might be a need to adapt specific questionnaire items to suit respondents at different levels
of education, the questionnaires for ISCED levels 1, 2 and 3 should all address the same
themes.
2.3.3. Mapping TALIS 2018 themes to policy issues
The TGB and QEG also considered, separately and during mutual consultation, the ratings
of the themes within the context of the five policy areas that make up the TALIS analytical
framework. This process helped to ensure that the themes would form a coherent whole
during TALIS analyses and reporting. An additional check ensured that the themes arising
out of the consultation process addressed the five policy areas defined for the ongoing
TALIS programme. Table 2.2 shows the result of this checking.
Table 2.2. Themes for inclusion in TALIS 2018 with frequently nominated indicators from
TALIS 2013
Theme Frequently nominated indicators
1. Teachers’ instructional practices
a. beliefs about teaching
b. classroom climate in target class
c. pedagogical practices in target class
d. classroom management in target class
e. individualised/differentiated teaching (including gifted students) in target class
f. teachers’ views regarding barriers to implementing a variety of practices
g. classroom composition and class size in target class
h. lesson time distribution in target class

41
TALIS 2018 TECHNICAL REPORT © OECD 2019
Theme Frequently nominated indicators
2. School leadership a. role and function of the school leader (administrative and pedagogical leadership)
b. distributed leadership (team leadership in the school)
c. qualifications and experience of school leaders
d. principal job satisfaction
e. perception of school leadership (teacher responses)
f. principal workload
g. principal working hours
h. principal autonomy in key areas (hiring and dismissing teachers, career ladders, pay, etc.)
i. training and development of school leaders
j. principal self-efficacy
3. Teachers’ professional practices
a. collaboration among staff in school
b. teachers’ participation in decision-making at the school
c. role, profile and participation in wider professional community
d. teacher mobility across and within countries
4. Teacher education and initial preparation
a. characteristics of initial teacher education and training: content (e.g. pedagogy, subject matter, practice, teaching students with special needs), length, providers
b. perceived effectiveness of training
5. Teacher feedback and development
a. support for in-service education and training
b. barriers for further engagement in in-service education and training
c. types of in-service education and training, including collaborative forms of professional development (PD)
d. types of formal forms of PD
e. content of formal forms of PD (new teaching practices and emerging innovations)
f. types of informal forms of PD (including teacher-initiated networks, online learning)
g. content of informal forms of PD (new teaching practices and emerging innovations)
6. School climate a. student–teacher relations (including supportive environment for learning)
b. parental and community relations/participation with the school
c. disciplinary climate (including tolerant climate)
d. teachers’ beliefs about how student-teacher relations can be improved
e. factors hindering instruction
f. teachers’ readiness for and openness to diversity
g. school ethos (e.g. goal driven, high aspirations, community engagement)
7. Job satisfaction a. overall job satisfaction (with school and with profession)
b. teacher perception of the value of the profession
c. teacher perceptions of national and local education policies
d. satisfaction with salary and working conditions
e. teacher opinions about priorities for education policies and reform
8. Teacher human resource issues and stakeholder relations
a. school policies that recognise, reward and evaluate teachers
b. career ladder and prospects of teachers
c. perceptions of the impact of policies that recognise, reward and evaluate teachers
d. recognition for being innovative in pedagogical practices
e. interventions to address underperformance
9. Teacher self-efficacy a. teacher self-assessment of general pedagogical knowledge (instructional processes, student learning, formative assessment)
b. teacher self-efficacy in general
c. teacher self-assessment of non-cognitive skills/patience/motivation

42
TALIS 2018 TECHNICAL REPORT © OECD 2019
Table 2.3 also shows the main connections between themes and policy areas. The
connections arise either because the theme is, by definition, part of the policy area or
because the theme encapsulates factors that could have potentially strong influences on the
policy area. The TGB and QEG in mutual consultation agreed that the themes collectively
and reasonably represent all five policy areas. Also, because there are more themes than
policy areas, more than one theme necessarily addresses the policy areas. Four of the
TALIS 2018 themes inform the policy area of effective teachers and teaching. Similarly,
some themes inform more than one policy area. For example, the theme “teacher human
resource measures and stakeholder relations” connects to attracting teachers, retaining
teachers and school effectiveness.
Table 2.3. Map of TALIS 2018 themes to policy issues
TALIS 2018 theme
TALIS policy issue
Attracting teachers
Developing teachers
Retaining teachers
School effectiveness
Effective teaching
1. Teachers’ instructional practices
2. School leadership
3. Teachers’ professional practices
4. Teacher education and initial preparation
5. Teacher feedback and development
6. School climate
7. Job satisfaction
8. Teacher human resource issues and stakeholder relations
9. Teacher self-efficacy
10. Innovation
11. Equity and diversity
Source: Based on information from OECD (2015[7]), “Guiding the Policy and Content Focus of TALIS 2018”,
EDU/INES/TALIS(2015)3 (internal document), Directorate for Education and Skills, OECD, Paris.
Table 2.4 presents the average rating given to the themes within each of the five high-level
policy headings. The top-rated policy issues were school policies supporting effectiveness
and developing teachers within the profession. The very small differences in average scores
across the five policy issues indicate support for balanced coverage of all five policy issues.
Table 2.4. Average rating points of themes under each policy heading, all countries
(ISCED 2)
Policy issues Average rating
School policies supporting effectiveness 6.3
Developing teachers within the profession 5.7
Effective teachers and teaching 5.1
Attracting teachers to the profession 4.7
Retaining teachers in the profession 4.1
Source: OECD (2015[7]), “Guiding the Policy and Content Focus of TALIS 2018”, EDU/INES/TALIS(2015)
3 (internal document), Directorate for Education and Skills, OECD, Paris, p. 16.
2.3.4. Developing TALIS 2018 theme descriptions
Specific expert members of the QEG developed the descriptions of each theme1 and then
harmonised each theme description around a common structure:

43
TALIS 2018 TECHNICAL REPORT © OECD 2019
introduction (interpretation of the theme in terms of content discussions in planning
papers)
theoretical background (review of relevant research, links to TALIS 2013,
possibilities for developing the theme in terms of new influences and perspectives)
analytical potential (the possibilities for analyses in relation to other factors and to
other themes)
indicators (high-level descriptions of materials, such as questions, items, scales, to
be retained, modified or developed).
The QEG members also described links to other themes in order to stress connections
between themes. The equity and diversity theme thus accommodated policies that promoted
assimilation in some countries/economies and encompassed socio-economic and gender
differences as well as cultural diversity. The text on innovation distinguished between a
disposition to innovate, and practices and policies that support innovation. QEG members
also added a section on school context.
Development of the theme descriptions proceeded from a set of initial drafts, reviews by
the full QEG, reflections on the results of the pilot studies and the field trial, as well as
reviews by an extended group of experts,2 thus providing perspectives related to world
regions, country/economy characteristics and types of schools. Development also reflected
feedback provided by the TGB (and previously the BPC) both at meetings and through
written documentation. The consortium also held four meetings for national project
managers (NPMs), during which discussions on the framework and materials took place.
The QEG began its work with online meetings in August 2015. Eight online meetings took
place over the course of the framework’s development. The first of the four face-to-face
meetings occurred in September 2015.
2.3.5. Background information about teachers, principals and schools
The QEG also advised on the key information that TALIS 2018 should collect on teachers’,
principals’ and schools’ backgrounds. Teachers recorded personal information
(e.g. gender, age, employment status, work experience, initial teacher education and
teaching programme) as well as characteristics of their classrooms (e.g. the student
composition of the class).
The strong influence that teachers have on instructional quality and student achievement is
widely accepted (Kyriakides, Christoforou and Charalambous, 2013[10]). Within-country
variability in teacher background is generally considerable and usually reflects large
differences in teacher profiles. These background characteristics are accepted as affecting
student outcomes through transmitted effects (e.g. teaching practices) rather than direct
effects. Because trend comparisons across time are an overarching objective for TALIS
2018, the QEG wanted as many items as possible to be consistent with the relevant items
in the TALIS 2013 cycle. However, to accommodate insights from recent literature and
interest in more in-depth information, as well as alignment with PISA 2018, additional
items were required.
Principals provided personal information, including their education and experience in
schools, as well as information about the characteristics of their respective schools
(e.g. location, school size, school type, funding model, student composition). The QEG
perceived this information as providing context for analyses of teachers’ work and the
working conditions that teachers see as enabling them to function effectively. These

44
TALIS 2018 TECHNICAL REPORT © OECD 2019
background data were also intended to reveal basic characteristics likely to be of interest in
terms of their relationship to other indicators, as descriptive information about schools and
systems, and in providing an understanding of the contexts in which data about TALIS
themes and indicators are interpreted.
School and classroom context can be conceptualised either as the social composition of the
school and classroom or as the neighbourhood in which the school is located. Debate
continues on the extent to which the overall characteristics of the student population have
an effect on student learning outcomes after statistically allowing for the effects for
individual students (Borman and Dowling, 2010[11]). However, analyses of PISA results
suggest that, in most of the countries participating in that study, students, regardless of their
own socio-economic background, are advantaged scholastically if they attend “a school
whose students are, on average, from more advantaged socio-economic backgrounds”
(OECD, 2004, p. 189[12]).
Of concern to TALIS was the degree to which the effects of school composition on student
achievement are influenced by differences in the characteristics of teachers and differences
in approaches to teaching that are associated with differences in the composition of the
school population. Students with migrant or refugee backgrounds and their education are a
priority for many countries (OECD, 2015[7]). The TGB, therefore, suggested that TALIS
2018 should examine teaching and school practices in schools with varying percentages of
students with an immigrant background. The TGB also expressed interest in the extent to
which school structural characteristics and geographic location affect student achievement
and other outcomes, with that influence mediated by the impact these characteristics and
location have on how teaching takes place.
The TGB also indicated that TALIS 2018 should continue to include consideration of the
influence of the percentage of teachers employed on a part-time basis. A number of
countries appear to have experienced an increase in the percentages of teachers who work
part-time. Williamson, Cooper, and Baird (2015[13]) documented variations in the incidence
of part-time work across countries, with Ireland, the Netherlands, Switzerland and
the United Kingdom having relatively high rates of part-time work. The TGB considered
that TALIS 2018 provided an opportunity to investigate variations within and across
countries in the percentages of teachers employed on a part-time basis and the extent to
which these variations are associated with variations in other aspects of schooling.
2.3.6. Links with other OECD studies
TALIS 2018 has links to several OECD surveys, notably the Programme for International
Student Assessment (PISA), which focuses on student achievement, the Starting Strong
Teaching and Learning International Survey (henceforth TALIS Starting Strong Survey),
which focuses on children before they commence formal schooling, and the TALIS Video
Study, which is one of the studies focusing on the use of different methods of studying
teaching. Another link is the use of TALIS data in the OECD Initial Teacher Preparation
Study. These links were accommodated in the TALIS 2018 conceptual framework.
PISA 2018
The fact that TALIS 2018 and PISA 2018 were implemented in the same year made it
possible to harmonise the two surveys, as did the fact that PISA includes questionnaires for
teachers and principals. Consideration was given to the possible synergies between TALIS
and PISA presented in a joint conceptual framework (OECD, 2015[14]). The TALIS and
PISA teams discussed these matters not only at the OECD Secretariat but also during

45
TALIS 2018 TECHNICAL REPORT © OECD 2019
exchanges with the PISA 2018 contractors, especially the Educational Testing Service
(ETS) and the German Institute for International Educational Research (DIPF).
The alignment sought was in general terms for the TALIS-PISA link international option.
The teams agreed that although some themes (TALIS) and modules (PISA) had similarities,
they were not closely aligned. The development work for PISA 2018 had commenced in
2014, with frameworks and field trial materials finalised towards the end of 2015.
Therefore, each survey considered pragmatic arrangements for 2018 in the absence of a
fully developed link between the surveys. The areas in which materials aligned with PISA
2018 were those concerned with job satisfaction, self-efficacy and school climate. Both
surveys also included specific questions on initial teacher education and teaching in
culturally diverse settings (equity and diversity).
TALIS Starting Strong Survey
The first cycle of the TALIS Starting Strong Survey, the OECD’s survey on early childhood
education and care (ECEC) staff, was implemented in 2018 in nine countries. It aimed to
generate data on which to base international comparisons of ECEC learning environments,
the well-being of staff and children within those environments, staff pedagogical practices,
staff professional development, issues related to equity and diversity, and staff and centre
characteristics. The survey has two target populations – ISCED level 0.2 staff (i.e. staff
working in “pre-primary education”, thus typically with children from three years of age
up to school age) and staff in settings serving children under the age of three years. The
TALIS and PISA teams developed links between the TALIS framework and instrument
development (especially the TALIS ISCED level 1 option) and the TALIS Starting Strong
Survey. The TALIS Consortium and the QEG also held joint meetings with staff from the
TALIS Starting Strong survey.
TALIS Video Study
The TALIS Video Study video-recorded 2 mathematics lessons taught by a representative
sample of 85 lower secondary teachers in each participating country and economy. The
lessons chosen covered the same specified subject content (i.e. quadratic equations) and the
study included pre-tests and post-tests of student achievement. Some of the assessment
items covered students’ general knowledge of mathematics, while others related directly to
the lesson content. Teacher and student surveys were administered before and after the
lessons. The teacher surveys included questions about teacher background and teaching
quality and practice (as in the TALIS main survey), as well as questions that asked teachers
for their perceptions of the lessons and the unit of work. The student surveys covered
family-related and peer-related conditions, and aspects of student cognitive, motivational
and emotional learning traits. As with the teacher survey, the student survey asked students
for their perceptions of the lessons and the unit of work. Lesson artefacts (such as lesson
plans, homework and assessments) were also gathered from teachers.
The TALIS Initial Teacher Preparation Study
During development of the TALIS 2018 conceptual framework and instruments,
consideration was given to policy and analysis-based findings from the OECD Initial
Teacher Preparation (ITP) Study, which included secondary analyses of TALIS 2013 data.
In order to effectively examine possible effects of initial teacher education on teaching,
TALIS 2018 asked respondents to state when they received their teaching qualifications
and to provide details on the nature of their respective initial teacher education

46
TALIS 2018 TECHNICAL REPORT © OECD 2019
programmes. TALIS also collected data on the support available for new teachers, given
these teachers tend to be the ones at the greatest risk of teacher attrition (OECD, 2005[2]).
2.4. Connecting the conceptual framework with proposed analyses
2.4.1. Samples and weights
TALIS is designed as a sequence of cross-sectional surveys that follows a modular
approach regarding the investigated content areas and the sample design. The TGB decided
that the design of TALIS 2018 would be the same as that of previous cycles of TALIS,
with ISCED level 2 schools, teachers and principals as the target populations of the core
survey, and with that survey being mandatory for all participants. It was also agreed that
the core survey would be augmented by three international options: teachers, principals and
schools at ISCED level 1; teachers, principals and schools at ISCED level 3; and teachers
and their principals drawn from the schools that also took part in the PISA 2018 cycle. The
third option, referred to as the TALIS-PISA link, required the drawing of a sample from
within each sampled PISA school of all teachers of 15-year-old students. This procedure
has enabled investigation into the teaching practices and learning environments of PISA
2018 teachers.
TALIS used two questionnaires to collect data: a principal questionnaire and a teacher
questionnaire. Respondents could choose to complete the questionnaires on line or with
paper and pencil. For the main survey, respondents used the IEA Online Survey System
(OSS) for this purpose.
The samples for the main survey consisted of approximately 200 schools per country and
20 teachers within each school. Schools were sampled with a probability proportional to
size. In some countries, sampling rates differed among strata; response rates also differed
across schools. Therefore, survey weights were computed to take into account the sample
design and differences in participation. This process allowed the generation of population
estimates and estimates of sampling error that are representative of the population of
teachers. Applying survey weights is an essential part of conducting analyses of TALIS
data. To ensure that the samples are not biased by non-response, TALIS specifies a required
response rate of 75% of sampled schools (after specified replacement), provided that each
included school attains a minimum response rate of 50%. A minimum overall participation
rate of 75% of teachers for each country is also required.
2.4.2. Analyses and reporting
The link between the TALIS 2018 conceptual framework and the initial analyses of the
survey data were specified in an analysis plan (OECD, forthcoming[15]). The TALIS
Consortium envisaged three types of analyses for the TALIS 2018 survey data:
comparisons of indicators across countries; comparison of indicators over time, often
referred to as trend analyses; and analyses of the relationships among indicators replicated
across countries/economies to establish general patterns. All depend on establishing
measurement invariance, that is, whether the same construct is being measured across
countries/economies or across other specified groups (e.g. gender, cultural background,
socio-economic background). TALIS 2018 planned analyses of measurement invariance to
test the validity of cross-country and cross-time comparisons of indicators and relationships
(OECD, forthcoming[15]).
The analyses outlined in the TALIS 2018 Draft Analysis Plan (OECD, forthcoming[15]) were
conceptualised as within-theme analyses (e.g. analyses concerned with teachers’

47
TALIS 2018 TECHNICAL REPORT © OECD 2019
instructional practices) and cross-theme analyses (e.g. analyses of the associations between
teachers’ instructional practices and teachers’ professional practices). Some of these
analyses can be conducted at a teacher or school level while others can be conducted only
at a school or country/economy (system) level. Time-series (cross-cycle) analyses enable
monitoring of changes over time (assuming measurement equivalence over time has been
established).
The reporting plan for TALIS 2018 outlines the content and structure of the initial report
of the survey’s findings (OECD, 2018[16]). The report is planned as a policy-oriented
document designed to stimulate reflection on practice and to relate to broader research on
the TALIS 2018 themes. The initial report will be released in two volumes dealing with
two main dimensions of teachers’ and school leaders’ work. The first volume will focus on
the knowledge and skills dimension of professionalism and will examine contemporary
teaching and learning practices, as well as mechanisms available to support teachers’ and
school leaders’ learning throughout their career pathways in order to deliver quality
schooling for all students. The second volume will then focus on teachers and school
leaders’ other professional practices and examine the mechanisms available to support and
strengthen their professionalism.
Across these topics, there will be an emphasis on:
reporting of results about both teachers and school leaders
commenting on meaningful international comparisons
discussing results in context
reporting relations between themes (cross-theme analyses)
describing trends (cross-cycle analyses).
Additional thematic reports or policy briefs will cover the following options and themes:
primary education teachers and principals (ISCED level 1 option) and upper
secondary education teachers and principals (ISCED level 3 option)
schools performing against the odds (TALIS-PISA link option)
equity issues across schools, teachers and students
supporting teachers’ well-being and retention.

48
TALIS 2018 TECHNICAL REPORT © OECD 2019
References
Ainley, J. and R. Carstens (2018), Teaching and Learning International Survey (TALIS) 2018
Conceptual Framework, OECD Publishing, Paris, http://dx.doi.org/10.1787/799337c2-en.
[1]
Borman, G. and M. Dowling (2010), “Schools and inequality: A multilevel analysis of
Coleman’s equality of educational opportunity data”, Teachers College Record, Vol. 112/5,
pp. 1201-1246, http://www.tcrecord.org/library/abstract.asp?contentid=15664.
[11]
Kyriakides, L., C. Christoforou and C. Charalambous (2013), “What matters for student learning
outcomes: A meta-analysis of studies exploring factors of effective teaching”, Teacher and
Teacher Education, Vol. 36, pp. 143-152, http://dx.doi.org/10.1016/j.tate.2013.07.010.
[10]
OECD (2018), “Proposal for the TALIS 2018 Reporting Plan”, EDU/TALIS/GB(2017)2/REV4
(internal document), Directorate for Education and Skills, OECD, Paris.
[16]
OECD (2015), “Guiding the Policy and Content Focus of TALIS 2018”,
EDU/INES/TALIS(2015)3 (internal document), Directorate for Education and Skills, OECD,
Paris.
[7]
OECD (2015), “Joint Conceptual Framework for TALIS and PISA Synergies”,
EDU/INES/TALIS(2015)6 (internal document), Directorate for Education and Skills, OECD,
Paris.
[14]
OECD (2014), TALIS 2013 Results: An International Perspective on Teaching and Learning,
TALIS, OECD Publishing, Paris, http://dx.doi.org/10.1787/9789264196261-en.
[5]
OECD (2010), TALIS 2008 Technical Report, TALIS, OECD Publishing, Paris,
https://dx.doi.org/10.1787/9789264079861-en.
[3]
OECD (2009), Creating Effective Teaching and Learning Environments: First Results from
TALIS, TALIS, OECD Publishing, Paris, https://dx.doi.org/10.1787/9789264068780-en.
[4]
OECD (2005), Teachers Matter: Attracting, Developing and Retaining Effective Teachers,
Education and Training Policy, OECD Publishing, Paris,
https://dx.doi.org/10.1787/9789264018044-en.
[2]
OECD (2004), Learning for Tomorrow’s World: First Results from PISA 2003, PISA, OECD
Publishing, Paris, http://dx.doi.org/10.1787/9789264006416-en.
[12]
OECD (forthcoming), “TALIS 2018 Draft Analysis Plan”, EDU/TALIS/GB(2018)3/ANN1
(internal document), Directorate for Education and Skills, OECD, Paris.
[15]
UNESCO (2016), Education 2030: Incheon Declaration and Framework for Action for the
Implementation of Sustainable Development Goal 4, UNESCO, Paris,
http://uis.unesco.org/sites/default/files/documents/education-2030-incheon-framework-for-
action-implementation-of-sdg4-2016-en_2.pdf.
[8]

49
TALIS 2018 TECHNICAL REPORT © OECD 2019
UNESCO-UIS (2012), International Standard Classification of Education (ISCED) 2011,
UNESCO Institute for Statistics, Montreal, Quebec,
http://uis.unesco.org/sites/default/files/documents/international-standard-classification-of-
education-isced-2011-en.pdf.
[6]
United Nations (2015), Transforming our World: The 2030 Agenda for Sustainable
Development, United Nations, New York,
http://www.un.org/ga/search/view_doc.asp?symbol=A/RES/70/1&Lang=E.
[9]
Williamson, S., R. Cooper and M. Baird (2015), “Job-sharing among teachers: Positive, negative
(and unintended) consequences”, The Economic and Labour Relations Review, Vol. 26/3,
pp. 448-464, http://dx.doi.org/10.1177/1035304615595740.
[13]
Notes
1 The QEG members working on the themes (and the themes for which they were responsible) were
S. Blömeke, R. Scherer and T. Nilsen (teachers’ instructional practices, teacher education and initial
preparation, teacher self-efficacy, innovation); D. Muijs (school leadership, teacher human resource issues
and stakeholder relations); H. Hollingsworth (teachers’ professional practices, teacher feedback and
continuing development); H. Price (school climate, job satisfaction); and F. van de Vijver and J. Ainley
(equity and diversity). D. Kaplan contributed to the QEG’s consideration of research methods across all
themes.
2 The extended QEG reviewers were E. Aller, S. Howie, M. Mok, S. Seeber and S. Taut.

50
TALIS 2018 TECHNICAL REPORT © OECD 2019
Chapter 3. Development of the teacher and principal questionnaires
The development of the survey instruments for TALIS 2018 described in this chapter was
strictly guided by the conceptual framework (see Chapter 2). A Questionnaire Expert
Group (QEG) was established under TALIS 2018 International Consortium management
to translate the identified goals and priorities into survey questionnaires, support materials
and an analysis plan. At the operational level, the development and validation of
instruments were implemented in several phases, with the observations and outcomes of
the previous step influencing revisions and plans for the subsequent phase. The key
challenges related to the significant increase in the number of participating
countries/economies, the interest in monitoring changes over time while keeping a
forward-looking approach, and the intention to embed a series of experiments at the field
trial stage.

51
TALIS 2018 TECHNICAL REPORT © OECD 2019
3.1. General aims and principles
Throughout its existence, TALIS’s main goal has been to generate valid, internationally
comparable information that is relevant to teachers and teaching and maintains an emphasis
on aspects at the system, school and teacher levels that are known or can be expected to
affect student learning. TALIS develops instruments for comparing these contexts cross-
culturally. Large, carefully selected representative samples of survey respondents and
modern methods of data collection and of quantitative analysis enable formulation of broad
inferences about the surveyed populations. Together, these approaches also allow the
development of conclusions about important relationships between and among factors of
interest within and across countries and economies.
Accordingly, TALIS 2018 strived to apply the following set of key principles to its
development process to the maximum extent possible:
a theory-driven development guided by a conceptual framework (see Chapter 2)
maximum country/economy input (at the policy as well as the operational level)
into the development and selection of constructs, questions and items
extensive consultations with experts in the survey’s corresponding thematic areas
as well as experts in questionnaire and sample design
retention of selected constructs, variables and measures from TALIS 2013 to allow
analyses of changes across TALIS cycles
improvements to questions and items as deemed appropriate and validated through
comparative experiments
descriptions of the cross-cultural validity of measures.
Use of the same data collection instruments across countries/economies, along with some
minor contextual alterations for the ISCED levels 1 and 3 options, allows TALIS to validly
document the variation in teacher practice and development that exists not only across
countries/economies and within each country/economy but also, where applicable, across
levels of education. TALIS also generates, for each country/economy and across
countries/economies with available data, reliable information about changes over time in
key aspects between indicators relating to teachers and the contexts of their work.
Based on the initial priorities voiced by the TALIS Board of Participating Countries (BPC)
in 2015 (2015[1]), the TALIS 2018 International Consortium, in close collaboration with
the Questionnaire Expert Group (QEG) members (see next section), drafted a
comprehensive development plan (OECD, 2015[2]) in late 2015 designed to capture general
considerations and proposals that would inform the start of the development work and also
establish initial proposals for each theme/topic that the BPC could consider and comment
on during its nineteenth meeting. This plan for the conceptual framework articulated the
survey’s initial research focus and direction. It also articulated the survey’s theoretical
underpinnings, existing knowledge and evidence, and the methods that would be used to
guide the development of the TALIS 2018 instruments, indicators and operations. The plan
described an iterative process in which academics and scholars formulated concepts,
discussed them with relevant stakeholders and then revised and reformulated the concepts
as necessary.

52
TALIS 2018 TECHNICAL REPORT © OECD 2019
The QEG members developed for each theme (and the cross-cutting issue of innovation)
initial free-format concept notes and discussed these at their first meeting in September
2015. Members standardised the notes around four headings to the extent possible:
country priorities and other inputs
o interpreting themes within the OECD “policy and content” focus document
o interpreting aspects of themes as described in other OECD documents,
especially PISA
theoretical background and justification
o a general introduction to each issue, with particular consideration given to the
established TALIS 2013 legacy
o the general direction to be taken during the development of each theme
(e.g. new influences, paradigm shifts, incomplete coverage in 2008 and 2013)
o a brief review of relevant research literature, including studies that had
produced some evidence of possible causal relationships
o a focus on the nature of TALIS, on teaching and learning from teachers’
perspectives, and on the working conditions of teachers
o a statement on why TALIS should investigate each issue
key development directions and most important changes
o major areas of new development as well as areas needing re-working and/or a
shift in focus
o high-level descriptions of materials (questions, items, scales) to be retained,
reworked, introduced or dropped (“chopping board”)
o triangulation and possible harbouring of crosscutting issues
analytical potential and indicators
o outlook on the type of research questions for which data are being sought
o relationships to other themes and systems, schools, teacher characteristics
(e.g. the link to and interaction between school climate and aspects of
leadership)
o policy relevance and use (general, current, emerging)
o a brief sketch of potential indicators.
The initial drafts of the concept notes outlined a wide range of possible directions for
development and it soon became clear that full implementation of all changes would not be
compatible with the aim of retaining a sufficiently high proportion of (key) materials that
would enable links back to 2013.
Ensuing discussion of the development plan at the next BPC meeting, therefore, focused
on:
the need, because of the requirement to maintain an average response time of
45 minutes for the English version of the principal questionnaire (PQ) and for the
teacher questionnaire (TQ), to achieve balance across each questionnaire with
respect to the following: maintaining existing questions from TALIS 2013, revising

53
TALIS 2018 TECHNICAL REPORT © OECD 2019
questions so as to improve the measurement of existing constructs, and introducing
questions that would address new topics that had emerged within the nominated
themes
the plan to keep the themes constant across ISCED levels 1, 2 and 3 while tailoring
items to suit specific aspects of each ISCED level where necessary and appropriate
aligning TALIS 2018 with PISA 2018 in terms of instrument design, sample
alignment and overlap control, especially in relation to sequencing, given that the
development process for PISA 2018 was already well underway
the possibility of linking work on the OECD Innovative Teaching for Effective
Learning Teacher Knowledge Survey (ITEL-TKS) with work on TALIS 2018
conceptual linkages between the TALIS ISCED level 1 work and the proposed
Early Childhood Education and Care (ECEC) staff survey, which later became
known as the Starting Strong Teaching and Learning International Survey
(henceforth TALIS Starting Strong Survey).
This discussion yielded important design and content directions, notably that TALIS 2018
would:
maintain a universal instrument across all ISCED levels, while allowing necessary
adaptations to suit each ISCED level
have a general target wherein one-third of the questionnaire would remain
unaltered, one‑third would be revised and/or improved, and one‑third would be
reserved for new materials and perspectives
ensure overlap with the optional PISA 2018 teacher questionnaire would be
minimised given PISA’s focus on the subject domain of reading1
emphasise that any overlap with work conducted for the ECEC staff survey would,
because of that survey’s trailing timeline, be mostly covered by the ECEC survey’s
governance structure and operational partners.
The BPC confirmed that all countries/economies would conduct the core TALIS 2018
survey at ISCED level 2. It also confirmed that a smaller number of countries/economies
were interested in the international options of surveying teachers and principals in schools
at ISCED level 1 (15 countries/economies), in schools at ISCED level 3
(11 countries/economies) and in schools that had participated in PISA 2018 through the
TALIS-PISA link (9 countries/economies). The board furthermore confirmed that the
online mode of collecting data would be the default mode in 2018, given the continuing
growth in online participation during the TALIS programme of surveys (about 70% of all
data were collected on line in 2008 and about 80% in 2013).
The questionnaires were designed to collect information that reflected these BPC
deliberations and decisions, and this meant that they also reflected an explicit trade-off
between capturing information on a wide variety of topics and measuring fewer topics in
greater depth. Indicators function at different levels of depth, with greater depth providing
richer information on how systems choose to influence or control these features through
policy design; see, in this regard, work by Jensen and Couper (Jensen and Couper, 2015[3]).

54
TALIS 2018 TECHNICAL REPORT © OECD 2019
As indicators drill deeper, the number of questionnaire items required increases. Some
indicators collect information about whether particular features exist, such as a mentoring
system, for example. Some indicators collect slightly richer data on the scale or frequency
of certain features. Examples include the typology of mentoring offered or the frequency
with which some activities occur. Other indicators aim to collect enough information to
determine how something works, such as identifying the features of a professional
development activity that has had a perceived positive impact. Finally, some indicators
collect data on what schools, principals and teachers do, and what degree of impact can be
attributed to those activities.
The types of questions that TALIS asks are, therefore, either simple questions of existence
or type (typically yes/no or nominal multiple-choice questions), questions capturing
frequency, extent or agreement (typically count, multiple-choice or matrix questions) or
questions that are more complex in format. The latter are typically questions that combine
a relatively large number of aspects as individual items, with these sometimes combined
with simpler formats (e.g. a yes/no question combined with a question on perceived
preparedness for certain elements of initial teacher preparation). Finally, sequences or sets
of questions, for example, those that combine factual (system) information or reports of
implemented activities and attitudes towards these, can be analysed jointly to obtain a
deeper level of understanding of what exists or is implemented, of how it works or how its
impact is perceived. In general, development of TALIS questions has followed established
development principles for cross-national survey research, such as those described in work
conducted by, for example, Harkness et al. (2010[4]), Johnson et al. (2018[5]) and the Survey
Research Center (2016[6]).
Later sections of this chapter detail the process and key outcomes of TALIS 2018’s
three main development stages: the pilot in 2016, the field trial in early 2017 and the main
survey in late 2017 and early 2018 (although some data collection occurred later than this,
especially for the TALIS-PISA link and in the countries/economies that joined TALIS in
late 2018). Annex H displays the final main survey principal and teacher questionnaires
(English master version).
While this chapter describes the process and criteria for instrument development, it does
not provide in-depth details about the development of specific items or questions, nor does
it provide extensive discussion about these.
3.2. Timeline
Under a generally tight and challenging timeline, the key stages and milestones for the
instrument development were as follows (data collection phases in bold, meetings in
italics):
September 2015: First Questionnaire Expert Group (QEG) meeting (Hamburg) –
inception and agenda setting
October 2015: Content proposals and drafting of the development plan
November 2015: Nineteenth TALIS Board of Participating Countries (BPC)
meeting (Copenhagen) – review of proposals
December 2015 to January 2016: Ongoing development of the conceptual
framework and initial development work on the instruments
February 2016: Second QEG meeting (Oslo) – agreement on pilot materials

55
TALIS 2018 TECHNICAL REPORT © OECD 2019
February 2016: Release of draft framework/pilot instruments for review by the
TALIS Governing Board (TGB) 2
March 2016: First TGB meeting (Singapore) – review of pilot materials and
operational approaches
February to March 2016: Country/economy recruitment into pilot study; training
webinars
April 2016: Pilot instruments finalised in accordance with TGB feedback
April 2016: First national project managers’ (NPMs) meeting (Lübeck) –
presentation of pilot instruments and plans
May 2016: Pilot instruments, glossary and focus group guidelines released to
countries/economies
May 2016: First Technical Advisory Group (TAG) meeting3 (Paris) – review of
technical standards, field trial preparation and measurement invariance
approaches
May 2016: Pilot conducted in countries/economies
June 2016: Pilot feedback collation and analysis
July 2016: Third QEG meeting (Hamburg) – preparation of field trial instruments
July to August 2016: Work designed to ensure that all agreements to date were
reflected in drafts, final revisions, further reductions, question sequencing and
forms
September 2016: Second TGB meeting (Paris) – presentation and approval of field
trial questionnaires; agreement on reducing questionnaire size as deemed
necessary
September 2016: Second NPM meeting (Rome) – presentation of field trial
instruments and collection of operational/translation feedback
October 2016: Release of instruments to countries/economies for field trial
adaptation/translation
November 2016 to Jan 2017: Instrument translation and verification; field trial
preparation
February to March 2017: Field trial data collection, followed by data
submission
March to May 2017: Analyses of field trial data by TALIS 2018 Consortium and
QEG
May 2017: Fourth QEG meeting (Paris) – main survey instruments prepared and
validated
June 2017: Further revision and analyses
June 2017: Second TAG meeting (Paris) – review of field trial outcomes
July 2017: Third TGB meeting (Lisbon) – review and confirmation of main survey
instruments and presentation of the analysis plan (in outline form)

56
TALIS 2018 TECHNICAL REPORT © OECD 2019
July 2017: Third NPM meeting (Lisbon) – collection of operational advice on
translation of instruments
August 2017: Release of instruments, glossary and support materials for main
survey adaptation/translation
September 2017: Commencement of main work on data analysis plan
September to December 2017: Main survey data collection in Southern
Hemisphere countries/economies
December 2017 to June 2018: Drafting of analysis plans
March to May 2018: Main survey collection in Northern Hemisphere
countries/economies
September 2017 to February 2018: Analysis plan finalised
November 2018: Third TAG meeting (Paris) – review of main survey issues;
implications for reporting of findings and for future TALIS cycles.
3.3. Questionnaire Expert Group (QEG) role, membership and collaboration
The QEG was responsible for developing the TALIS 2018 conceptual framework (see
Chapter 2) and the survey instruments. The IEA convened the group in July 2015, which
was when the TALIS 2018 Consortium began its activities. The IEA created a long list of
potential experts for the group. Some of these individuals were sourced from the IEA’s
expansive research network, some had been involved in the TALIS 2013 Instrument
Development Expert Group (IDEG) and others were individuals suggested by the BPC.
Conditional on availability and interest, the IEA, in consultation with the OECD
Secretariat, invited those experts who provided the best possible and contemporary
coverage of the topics within the TALIS 2018 purview to be members of the group. The
QEG, as eventually constituted, included the following education, policy and survey
experts:
Sigrid Blömeke, Centre for Educational Measurement (CEMO), Norway
Hilary Hollingsworth, Australian Council for Educational Research (ACER),
Australia
David Kaplan, University of Wisconsin-Madison, United States4
Daniel Muijs, University of Southampton, United Kingdom
Trude Nilsen, University of Oslo, Norway
Heather Price, Basis Policy Research and Marian University, United States5
Ronny Scherer, Centre for Educational Measurement (CEMO), Norway.
The QEG also included ex-officio members from:
The IEA: Ralph Carstens (QEG chair, consortium co-director of content),
Steffen Knoll (consortium co-director of operations), Agnes Stancel-Piatak
(analysis lead) and Deana Desa (analysis expert)
ACER: John Ainley (framework lead)

57
TALIS 2018 TECHNICAL REPORT © OECD 2019
RAND Europe: Julie Belanger (liaison to the TALIS Starting Strong Survey, QEG
chair of that survey)
Statistics Canada: Jean Dumais (sampling referee)
OECD Secretariat: Karine Tremblay (project lead), Pablo Fraser,
Katarzyna Kubacka and Noémie Le Donné
Technical Advisory Group (TAG): Fons van de Vijver (TAG chair).6
The QEG began its work, the first major development phase, with a virtual meeting in
August 2015 that introduced the survey’s content focus, inputs and related information, as
well as the group’s intended work process. After that meeting, members developed a set of
draft concept notes that they reviewed at a two-day in-person meeting in Hamburg
(September 2015). Those concept notes informing the development plan were further
revised and incorporated into the conceptual framework. This process was guided by
deliberations from the BPC (later TGB) and additional input from ongoing policy dialogue
and networks among members of the OECD Directorate for Education and Skills’ senior
management team.
Having noted the general aim of reducing the number of themes (or headings) covered by
each cycle of the TALIS survey, the QEG determined that nine themes would initially
structure their work. Note, however, that the fifth theme in the following list incorporates
the two elements of teacher feedback and teacher development that were covered separately
during TALIS 2013. Note, too, that the QEG had no intention of assigning equal
importance (as expressed by, for example, response time or number of questions) to all
themes. The list below provides the themes as well as the leading QEG expert (or experts)
for each.
1. Teachers’ instructional practices and beliefs:7 Blömeke, Scherer and Nilsen
2. School leadership: Muijs
3. Teachers’ professional practices, including mobility issues advocated by the
European Commission: Hollingsworth
4. Teacher education and initial preparation: Blömeke, Scherer and Nilsen
5. Teacher feedback and development, combining teacher feedback and continuing
development: Hollingsworth
6. School climate: Price
7. Job satisfaction: Price
8. Teacher human resource issues and stakeholder relations: Muijs
9. Teacher self-efficacy: Blömeke, Scherer and Nilsen.
The BPC/TGB discussions on the content focus document resulted in the suggestion to
include questions on equity and diversity, later covered by Ainley and van den Vijver in
2016 as standalone theme number 10. The development plan also included a concept note
on the cross-cutting issue of innovation, later covered by Blömeke, Scherer and Nilsen as
a separate theme (number 11). The QEG deemed this theme to be an issue of particular
importance. Because members of the group saw equity and diversity and innovation as
themes encapsulated in the substance of each of the nine themes, they considered there was
no need (initially) to prepare separate papers on these topics. The QEG determined suitable
58
TALIS 2018 TECHNICAL REPORT © OECD 2019
intersections between these two special themes and the nine general themes in order to
balance analytical potential as well as survey priorities and space.
After the initial in-person meeting, the QEG held a series of in-person or virtual meetings,
each of which lasted for about one to three hours. These occurred in December 2015
(virtual), January 2016 (virtual), February 2016 (in-person, Oslo, hosted by the Centre for
Educational Measurement), March 2016 (virtual), June 2016 (virtual), July 2016
(in-person, Hamburg, hosted by the IEA), August 2016 (virtual), November 2016 (virtual),
February 2017 (virtual), May 2017 (in-person, Paris, hosted by the OECD) and August
2017 (virtual). All meetings were scheduled in accordance with TALIS 2018’s general
development and operational timeline, that is, in keeping with the scheduled data collection
phases for the pilot, field trial and main survey, and the subsequent availability of empirical
data, feedback from NPMs and analytical outputs.
While the QEG’s core group of experts and ex-officio members remained constant
throughout the 2015 to 2017 developmental work, the IEA invited five additional academic
experts to provide specific perspectives on the pilot and field trial instruments, with their
reviews starting in May 2016 and due in June 2016. These “extended” members were:
Elsebeth Aller (Ministry of Education, Denmark; formerly Metropolitan University
College, Denmark), who provided perspectives on teaching and learning contexts
at the primary education level
Sarah Howie (University of Stellenbosch, South Africa), who provided
perspectives from low-income and middle-income countries/economies
Magdalena Mok (The Education University of Hong Kong, Hong Kong, China),
for an Asian perspective, given that no countries/economies from Asia contributed
to the TALIS 2018 pilot
Susan Seeber (Georg-August-Universität Göttingen, Germany) in relation to
teaching and learning contexts at ISCED level 3 and, in particular, vocational
education and training (VET)
Sandy Taut (Educational Quality Agency, State of Bavaria, Germany; formerly
Pontificia Universidad Católica de Chile, Chile) for a Latin American perspective.
The QEG’s later work, especially in regard to the consortium’s analysis plan, was managed
solely via desk reviews and written exchanges. As stipulated by the OECD’s terms of
reference for TALIS 2018, the QEG’s responsibilities ended with the development of the
draft main survey instruments and accompanying analytical advice and recommendations;
members were not involved in the production and/or review of the international reports.8
However, some members provided advice (Scherer and Nilsen, through the OECD
Secretariat) or were involved in reviewing draft chapters of the report in early 2019 (Price,
through the consortium).
3.4. Pilot phase
3.4.1. Proposing new, revised and retained materials for ISCED level 2
The TALIS 2018 consortium, in close co-operation with the QEG and the OECD
Secretariat, and seeking advice from the TAG at key stages, moved from the development
plan to the second major phase of developing the teacher and principal questionnaires.

59
TALIS 2018 TECHNICAL REPORT © OECD 2019
During this second phase, the consortium generally addressed all interests and needs voiced
by stakeholders or indicated by the literature cited in the development plan.
The consortium presented the first drafts of the instruments at the TGB’s first meeting in
Singapore in March 2016. Subsequent feedback included written comments from the board,
additional reviews from the extended QEG, additional feedback from institutional partners
and observers to the TGB (such as Education International), as well as from the OECD
Directorate for Education and Skills’ senior management. The work at this stage also
focused on earlier input from policy work associated with the TALIS Initial Teacher
Preparation (ITP) study and from initial work on the TALIS Starting Strong Survey.
During the meeting in Singapore, the TGB considered and then provided advice on the
extent to which the content of the survey instruments needed to be balanced between
existing questions from TALIS 2013, questions designed to improve the measurement of
existing constructs and questions addressing new topics that had emerged within the
nominated themes. To yield the type of feedback that would advance the instrument design
parameters from the initial content focus and incorporate the consortium’s development
proposals, meeting participants worked in small groups and developed plenary summaries.
Suggestions on improving the measurement of existing constructs were generally based on
reflections on analyses of TALIS 2013 data. Introduction of questions reflecting new topics
within the survey themes typically arose from scrutiny of recent research literature or from
areas of interest identified by countries and economies or by institutional stakeholders.
Increasing synergy between TALIS and, most importantly, the TALIS Starting Strong
Survey and the PISA 2018 survey contexts, yielded other areas of interest. It soon became
clear that effort to fully implement all desired changes and additions could result in the
instruments not retaining a sufficient amount of (key) content that would elicit the data
needed to support analyses of changes over time. The TGB was also mindful of the
necessity to review any proposed extensions (and their intended indicators) to the
instruments in terms of survey time and burden for teachers.
In pragmatic terms, the TGB wanted to achieve a balance of instrument content within an
average response time (for the English version) of 45 minutes. However, the board also
recognised that the issue of time itself was still under review and would not be resolved
until after the field trial when reliable timing information based on larger volumes of data
would be available. In the meantime, the TGB invited the OECD Secretariat and the TALIS
2018 consortium to use evidence from previous rounds of TALIS as the basis of discussion
on questionnaire length and the potential consequences of varying questionnaire lengths
for data quality. The consortium accordingly re-analysed timing and other process data
from the 2013 field trial in terms of survey fatigue and disproportionate increases of item
non-response as a function of time. The 2013 data indicated that while the percentages of
respondents who did not complete the survey varied substantially across
countries/economies and contexts, the percentages generally increased in a linear way
along the question sequence. The actual time it took respondents to complete the survey
also varied considerably, with the averages exceeding the 45-minute target in many cases.
Limitations with respect to time (including those for national additions) also directly
affected ability to revise materials, introduce new materials or keep core questions constant.
Because decisions on these matters would be necessary and feasible only when the main
survey administration began towards the end of 2017, the consortium foresaw the need to
conduct a priority rating exercise that would facilitate work directed towards managing and
reducing survey content after completion of the field trial.

60
TALIS 2018 TECHNICAL REPORT © OECD 2019
The consortium presented NPMs with drafts of the instruments during the first NPM
meeting in April 2016. The NPMs, in turn, provided helpful feedback relating to local
relevance, translatability and validity in general. The consortium collated feedback
pertaining to survey implementation, including clarity of terminology, and shared and
discussed it with the QEG. As had occurred during previous development rounds, deep
discussion emphasised instrument length and related response burden and resulted in a
recommendation to significantly reduce both before the field trial and then again prior to
the main survey.
3.4.2. Pilot operations
The main purpose of the pilot was to test the extent to which “regular” respondents
(teachers and principals) across a variety of national settings understood the instruments’
questions and items. The goal would then be one of using the insights and feedback
obtained during the pilot to fine-tune the questionnaires for the field trial.
The pilot questionnaires included a “super-set” of all new, revised and retained items, each
of which had to be checked against the following criteria:
sufficient conceptual coverage from the perspective of teachers and principals,
given that TALIS continues to be seen as the “voice of teachers” (see also
Chapter 2)
conceptual understanding and clarity
international and cultural applicability
continued feasibility of an adaptable questionnaire template for ISCED level 2 and
the ISCED level 1, ISCED level 3 and TALIS-PISA link international options
feasibility of the universal instrument, especially for ISCED level 1 (e.g. with
respect to potentially different approaches to initial teacher preparation)
feasibility of bringing in new, modified or alternative formats of new and adapted
items developed by the QEG.
For the pilot, and in keeping with practice in 2013, the TALIS 2018 consortium recruited
small focus groups of teachers and principals from the participating countries and
economies. There was no need during the pilot to recruit the larger number of schools and
teachers evident during the field trial because the consortium had no intention of
conducting quantitative analyses of the pilot data. The expectation with regard to the focus
group discussions was to gain the types of information and insight that are best elicited
through deep interaction. Opportunity to listen to others’ experiences typically stimulates
perceptions, ideas and experiences or may refine or emphasise one’s own. Focus groups
are also useful in bringing together a range of perceptions and perspectives on specified
matters.
The focus group work was additionally guided by “probing questions” developed by the
QEG. One such question, “Are the concepts used in the items relevant for your country,
region and school?”, fitted into questions designed to address teaching in culturally diverse
environments. The feedback and information collected during this work put the QEG in a
better position to revise the content, response categories, wording, and item and question
structures of the field trial questionnaires.

61
TALIS 2018 TECHNICAL REPORT © OECD 2019
More specifically, the review of the pilot questionnaires focused on the following key
dimensions:
applicability of concepts and validity
level of complexity of the questionnaires
organisation of topics and items
applicability of items across ISCED levels and programmes (academic/vocational)
international versus local applicability of items
item wording and definition of terms
appropriateness and cultural relevance
mandatory national adaptations
foreseen translation issues
flow of questions (overall and specifically with respect to skipping instructions)
length of questionnaires.
The TALIS 2018 Consortium planned that around ten countries/economies would
contribute to the pilot by translating the generic source version of the questionnaires from
English into the national target language and by having a group of target population
members review the questionnaire items under the oversight of the respective NPMs.
However, when the schedule for this work proved to be too tight, the possible solution
offered was that of making only the mandatory national adaptations to the generic English
source version, provided that all focus group members were bilingual. Eventually, 11 of
these countries and economies contributed to the pilot study.9 It is important to note that
there was never an intention to test applicability and functioning of the pilot questionnaires
in all national settings and contexts, that is, in the 48 countries, economies and educational
systems that participated in TALIS 2018.
The pilot instruments (along with a draft glossary) were finalised in late April 2016 and
released for the data collection in May 2016. The consortium held preparation webinars
with representatives from the pilot countries/economies in late March and early April 2016
and also released a comprehensive guidance manual that included a concise list of general
and per-item probing questions. The pilot was conducted in May 2016.
Six countries/economies translated the questionnaires into one national language and one
country translated them into two languages. The remaining four countries/economies used
the English source version of the questionnaires with necessary local adaptations. The pilot
was conducted using paper instruments and the only data entry work required was that
NPMs filled in an online structured-session feedback questionnaire at the end of the focus
group work. To manage the response burden at the pilot stage, the consortium and QEG
split the teacher questionnaire into two partially overlapping versions, A and B. Although
the QEG expected each focus group to discuss only one part in detail, members of each
group received the full teacher questionnaire so that they could see and understand the full
scope of topics, materials and contexts. There was no commensurate split for the principal
questionnaire.
The pilot countries/economies had used various convenience (i.e. non-probabilistic)
methods to gain teacher and principal collaboration (e.g. support from the ministry of
education; using existing ties with teachers’ networks developed during earlier research

62
TALIS 2018 TECHNICAL REPORT © OECD 2019
projects). The pilot countries/economies also reported using a variety of incentives and
rewards (i.e. a combination of monetary and non-monetary support as well as giveaways)
or none at all. Most of the principal and teacher focus groups consisted of about five to
ten people. In general, countries/economies tried to maintain a balance between male and
female respondents, private and public schools, and urban and rural representatives, as well
as between age groups. However, few participating principals were younger than 50 years
old. Total average session duration for answering and discussing one instrument in the
focus group was about three to three-and-a-half hours.
In terms of response burden, the majority of principals reported taking, on average, about
60 minutes to respond to the principal questionnaire, with individual times ranging from
about 30 to 80 minutes. Because the teacher questionnaire was administered in two versions
(A, B), each of the two groups of teachers responded to and discussed about two-thirds of
the materials. Some teachers were able to complete the questionnaire (again, about two-
thirds of all teacher questionnaire materials) in as little as 30 minutes, whereas some
required up to 2 hours. The average time for completing the partial teacher questionnaire
was similar to the principal questionnaire, that is, 60 minutes, indicating that teachers would
need 90 to 95 minutes to complete the full set of teacher questionnaire materials.
In general, the results and inputs from the focus groups reflected various aspects relevant
to development of the questionnaires. These included the acceptability and relevance of the
questions, the clarity of the language used in the questions, ambiguity with respect to
terminology, overburdening in terms of response detail or the need to recall past events and
facts, and preferences for the alternatives presented to respondents (e.g. two versions of
career plan questions or regarding preferred resource allocation). While most of the
feedback was incidental (i.e. raised in just 1 of the 11 countries), some of it exhibited
commonality and some of it clearly represented opposing views and feedback, with some
of the latter impossible to reconcile. The results also showed that teachers and principals
did not indicate any substantial areas, topics or issues that they might have thought were
overlooked during the TALIS 2018 thematic scoping. As expected, respondents repeatedly
reported that the questionnaires took too much time to complete.
The input and recommendations from the extended QEG, collected in June 2016, were
equally rich in nature, such as those relating to the applicability of conceptual deliberations,
literature and earlier insights from research in the context of low-income countries or in
particular regions. When the experts were asked to reflect on the applicability of universal
questionnaire templates for ISCED levels 1 and 3 (including VET), they overwhelmingly
confirmed that the materials were relevant and applicable at all targeted levels of education.
However, they did recommend the inclusion of particular materials that were not only
relevant at ISCED level 1 but also aligned with TGB interests.
3.5. Field trial phase
3.5.1. Key areas of instrument revision and further development
The QEG members revised and substantially reduced the questionnaire materials between
the pilot and the field trial with the aim of enhancing clarity and specificity and thus
reducing erroneous interpretation of question intent. Members developed their initial
proposals for changes as a desk exercise, with that work drawing on findings from the pilot
study and from insights from the extended QEG in June 2016. During the third QEG
meeting (in July 2016), members reviewed, discussed and implemented these proposals
and identified other issues requiring additional work and input. They also ensured that all

63
TALIS 2018 TECHNICAL REPORT © OECD 2019
initially agreed-on deletions, changes and additions were compiled in time for
consideration at the second QEG meeting of the TALIS Starting Strong Survey. During
this meeting, which took place later in July 2016, the experts from the early childhood
perspective noted and reflected on the changes that the TALIS QEG had made to the
materials that needed to be aligned between the two surveys. The early childhood experts
also made several salient recommendations for changes to the TALIS materials in terms of
language or clarity, as well as changes that they thought would improve the conceptual link
and analytical potential between ISCED levels 0 and 1.
The TALIS QEG members subsequently incorporated a relatively large number of edits
and changes into the TALIS materials to improve the clarity of the language used (i.e. at
the word level). Editing also focused on harmonising language across questions and items,
across response options and between the two surveys (TALIS and TALIS Starting Strong),
with the latter involving close collaboration between both QEGs. Examples of the latter
kind included, but were not limited to, consistent question instructions; consistent response
options; the highlighting of required adaptations; the consistent use of certain terminology
(e.g. “migration background”, “children and young people”, “parents or guardians”); and,
finally, the use of the personal pronouns “your/my”, but only in those instances where a
proximate personal characteristic of the respondent was meant (in contrast to, say, “your
school”). Such changes were also applied to questions retained from TALIS 2013, provided
that the QEG was assured, after careful consideration, that the change would not have an
impact on the statistical properties of the responses. Some of these changes were
nonetheless recommended for experimental comparison as part of the field trial, in the
interest of retaining the revised version or of reverting to the original in the main survey.
Some of the key substantial and structural revisions to the principal and teacher
questionnaires were the following:
The merging of two sets of questions relating to initial teacher preparation: The
first set concerned elements covered in initial teacher preparation and asked the
teachers to give a self-reported rating of their level of preparedness for each
element. The second asked teachers to identify, from a listing of subjects, if they
had specialised in any of them during their initial teacher preparation and whether
they were currently teaching the subject. The intention behind both mergers was to
extend analytical possibilities, with the latter also relating to a corresponding
question in the PISA 2018 teacher questionnaire.
A re-allocation of a set of questions relating to self-reported activities and practices
(conceptually related to instructional quality dimensions): These received separate
sets of response options depending on whether or not the practices were directly
observable (low/high or shallow/deep inference).
Changing the format of some of the questions that allowed multiple responses:
These were extended, to the extent possible, to a yes/no format. Some questions
were similarly converted from detailed counts (e.g. for certain categories of staff)
to censored intervals (e.g. “1–5”, “6–10”, etc.) on the premise that these are easier
to respond to.
Revisions to materials relating to the theme of equity and diversity: These changes
were the result of changes in items related to the global competency theme in PISA
2018, and of the TGB and NPM feedback received in March and April 2016. In
particular, filter questions were used in cases where practices related to equity and
diversity did not apply according to principals and teachers because of the local
64
TALIS 2018 TECHNICAL REPORT © OECD 2019
composition of a school. Another question was substantially extended and split in
response to comments regarding the need to include other dimensions of diversity
(e.g. gender and socio-economic status).
Revisions to section headings, number of sections and the sequence and allocation
of questions to sections: These revisions were the result of substantial development
work for TALIS 2018. In particular, the previous teacher questionnaire section on
“background” had become too extensive and was subsequently partitioned into one
section focused on personal background characteristics and qualifications and
another focused on work experience and the current job. The allocation of some
questions in the section “School Climate and Job Satisfaction” was revised (i.e.
moved to other sections), as appropriate.
Inclusion in the field trial teacher questionnaire of an additional set of initial
teacher preparation elements for teachers at ISCED level 1, which were also seen
as relevant in ECEC contexts at ISCED level 0: The TALIS and TALIS Starting
Strong QEGs decided to synchronise these materials in order to improve the
analytical potential of both surveys, especially for countries/economies
participating in both the TALIS ISCED level 1 international option and the TALIS
Starting Strong Survey at ISCED level 0.2.
As part of the QEG deliberations and processes during June to August 2016, several items
and questions were deleted, generally in response to clear evidence and input from the
pilot’s focus groups regarding problematic aspects. Deletions were also a product, to a
lesser degree, of input from the extended QEG. Examples of the deletions included items
focused on specified leadership practices by principals, and also on teachers’ school grades,
teachers’ feedback experiences and teachers’ spending priorities (here, one alternative was
retained and a forced-choice alternative was deleted).
Individual items were deleted in a number of cases, most frequently because of redundancy
or conceptual vagueness (as evident from the pilot) or because the pilot intentionally
included more items and questions than were needed for the field trial. Although the QEG
agreed that the field trial should include some alternative item formats, they considered
“anchoring vignettes” and “over-claiming” formats unsuitable for application in TALIS for
ethical reasons and/or because of the excessive reading load generated by these item
formats.
The pilot included some “situational judgement items”. Because these performed
reasonably well during the pilot, they were retained in the field trial but with the order of
the response options reversed (i.e. in the direction of the latent trait signifying endorsement
of the particular practice). The pilot also employed multiple alternative versions for some
constructs. A notable example was a “ranking” and a “forced-choice” version of a question
focusing on resource spending priorities from the perspective of teachers. As described
above, the pilot feedback and the QEG’s own evaluation work led to the better performing
version being retained.
3.5.2. Assembling questionnaires
During its work, the QEG considered the original policy priorities provided to the
consortium and reflected not only on all emerging perspectives and interests but also on
inputs and interests emanating from sibling work (i.e. the TALIS Starting Strong Survey,
TALIS Video Study, TALIS ITP Study, PISA 2018 general and global competency). The
QEG carefully considered the balance of the priorities, as well as the number of questions
65
TALIS 2018 TECHNICAL REPORT © OECD 2019
and indicators allocated to each area and theme. The QEG assessed, as a crude and,
arguably, imperfect measure, that the correlation between these 2 metrics (priority and
volume of material in terms of data points, questions and pages) was approximately equal
to 0.8 for both the principal and teacher questionnaires. While this correlation reflected a
general match between the development work at that stage and the TGB’s mandate, the
match was not perfect in all areas, in particular for school leadership in the principal
questionnaire and for the combined theme of feedback and development in the teacher
questionnaire.
This situation presented the QEG with an opportunity to choose the most appropriate
balance of materials for the field trial and, by extension, the main survey. This opportunity
aligned with the stipulation that, in keeping with technical standards, statistical
considerations, and established practices in large-scale assessments, no new materials
could be developed or admitted to the survey after the field trial.
The main concern in regard to the teacher questionnaire was that the volume of all material
in it meant a response time of about 90 minutes in total. However, the total amount of all
material that the field trial could accommodate under a form-based design meant a response
time of 75 minutes, including a maximum time of 5 minutes to answer the national
additions. As a result, the QEG needed to remove about 20% of the material from the field
trial teacher questionnaire.
Alternative versions (forms) of the teacher questionnaire were used in a rotated design for
the field trial. This approach meant the total amount of material could be trialled while
ensuring that the response burden for any one teacher would not exceed the targeted
response time for the main survey instrument, that is, 45 to 60 minutes on average for the
English version, unless analysis of timing, fatigue and non-response indicators suggested
that the total response time of 45 minutes should be closer to the time stated originally in
the survey’s terms of reference.
A second reason for using the rotated design related to the need to trial some alternative
question wordings or formats, while a third reason came from the TAG’s recommendation
that the relative position of at least one section of the teacher questionnaire should alternate
between forms to allow study of positional effects related to, for example, fatigue, effort,
or other order effects, such as priming. Full randomisation of sections was not feasible
because TALIS needed to continue to rely on a logical order of survey themes, from initial
preparation through to current teaching activities and overall satisfaction with teaching.
The QEG and consortium rejected suggestions to implement more complex designs, that
is, those with more than three different forms, for reasons of operational complexity,
especially in regard to paper-based administration of the survey instruments and in regard
to analytical requirements.
To collect the views and inputs of TGB members on what materials to retain/delete, the
consortium, in consultation with the OECD Secretariat, developed an Excel format input
sheet for the teacher questionnaire (only). The sheet listed all developed questions, the key
links to sibling activities (PISA and the Starting Strong Survey), an estimate of response
time by question and section, and the QEG’s identification of possible reductions. Because
questions deemed important for cross-cycle comparison were locked in, they were not
eligible for deletion. The consortium asked the TGB members to indicate, for each
question, whether they thought it should be dropped from the field trial teacher
questionnaire. The consortium also asked members to keep in mind, when making their
decisions, the target response time of 75 minutes total.

66
TALIS 2018 TECHNICAL REPORT © OECD 2019
The following tables illustrate the final field trial approach, which combined the TGB’s
ratings and wider considerations. Table 3.1 lists the questionnaire sections used in the field
trial along with the number of core questions determined after the TGB meeting. It also
gives the number of co-ordinated national options (CNOs) – questions that were not part
of the international core questionnaire content but ones that several countries/economies
wanted to leave in the questionnaire templates (note that CNOs counted towards the
allowance for national adaptations; see Chapter 4 for details).
Table 3.1. Field trial questionnaire sections
Core questions Co-ordinated national options (CNOs)
A Background and qualification 8 2
B Current work 10 3
C Professional development 11
D Feedback 3
E Teaching in general 8
F Teaching in the target class1 12
G School climate and job satisfaction 11
H Teaching in diverse environments 5
1. Consistent with TALIS 2008 and 2013, a section on classroom-based characteristics, activities and
perceptions was contextualised to a specific “target class” (i.e. group of students), operationalised as the first
class that teachers taught in the school after 11 a.m. on the previous Tuesday.
Table 3.2 lists the sequence of blocks included in each of the three questionnaire forms.
The design followed substantial considerations more than statistical ones. The inclusion of
Section A on background in each version enabled basic breakdowns of the data during the
field trial analyses. Each of the other two sections had two forms that differed in number
of sections. However, the two sections balanced overall with respect to the number of
questions and the estimated amount of time needed to respond to materials (between 58
and 59 minutes per questionnaire, including national options of up to 5 minutes). The page
count (about 24 to 25 pages) was roughly equivalent between versions but varied by
national version and the degree of text expansion following translation.
The asterisks (*) in Table 3.2 indicate sections that included an experimental version. The
experimental version was one that the QEG included to assess the functioning of a revised
approach to measuring an indicator and one that the group expected would not be
immediately successful and therefore would not be retained in the main survey.
Intentionally, Section G on school climate and job satisfaction appeared in two sequences
designed to assess primacy and recency effects: once in a late final position, as was the case
in TALIS 2013 (Form B), and once in an earlier position (Form C). Section H was included
as the last section because it was fairly experimental at the field trial stage and its continued
inclusion had yet to be formally decided.

67
TALIS 2018 TECHNICAL REPORT © OECD 2019
Table 3.2. Field trial questionnaire design
Form A Form B Form C
A A A
B B D
C* C E*
E* D H
F G* F
x H* G
54 questions 53 questions 49 questions
x : not applicable
The consortium considered the size of the sample required for the field trial in light of this
instrument structure (see also Chapter 5). Because a slightly larger number of schools and
teachers were needed for the field trial in 2018 than in 2013, the consortium fixed the
number at 30 schools and 20 teachers within each sampled school. Attrition aside, either
600 (common sections), 400 (materials used in 2 of 3 forms), or, as a minimum, 200 data
points (for question alternatives/experiments) would then be available per
country/economy for analyses. The above design made it possible to analyse all themes
with one another even though this possibility was not a key design goal.
Given the much smaller size of the school/principal population (about 30 schools per
country/economy), the use of a rotated administration design for the principal questionnaire
was not feasible. Timelines, resource constraints and planned analyses also precluded a
rotational or otherwise partial design in the main survey, which meant only a
single/common teacher questionnaire could be used for each target population.
3.5.3. Embedded experiments and their subsequent evaluation
Views differ somewhat on the purpose of a field trial but it is generally agreed that its
primary purpose in all large-scale assessments and surveys is to provide a “dry run” for the
main data collection, with the particular focus being on the efficacy of the survey
instruments as well as its operations. Some survey experts maintain that a field trial can
and should be used for experimentation because no other stage in a project provides room
for trialling new materials, formats or approaches. Long-term innovation in a project such
as TALIS and beyond is hence critically dependent on field trials.
As part of the field trial, the consortium, in consultation with the QEG, the TAG and
members of the PISA 2018 contractors, planned several experiments intended to shed light
on how the alternative question formats and wordings differed in terms of function. The
above design (alternative versions of certain sections) meant that while these experiments
did not add to the overall response burden on individual teachers, they did increase the time
countries/economies had to spend on translating questionnaire content. The experiments
also reduced the analytical power to, on average, 200 rather than 400 cases per
country/economy. For that reason, the consortium used the experiments sparingly.
The consortium agreed not to include experiments in the principal questionnaire because
of the lack of alternate versions as an enabling requirement. The experiments were confined
to the field trial and they included:

68
TALIS 2018 TECHNICAL REPORT © OECD 2019
alternative frequency scales for “extent” questions
alternative wording for family-related aspects
substantial revision of a question on teacher collaboration
context priming in question stems
alternative version of the resource allocation/spending question.
Advice received from the TAG in May 2016 and afterwards suggested that the assignment
of experiments should be randomised; in other words, only subsets of countries/economies
would receive the material relating to a particular experiment. However, the consortium
rejected this recommendation because it conflicted with the technical standard that all
questionnaire materials for the field trial had to be translated into all applicable languages
of each country/economy. The TAG also recommended that experiments be assigned to
respondents in a fully randomised way but the consortium disregarded this
recommendation as well, given that some of the TALIS 2018 countries/economies would
still be using paper administration. However, the consortium did acknowledge that a
randomised design would be preferable in the fully online delivery of surveys anticipated
for the future. The next section of this chapter reports the results of the experiments
conducted during the field trial.
3.6. Main survey phase
3.6.1. Analysing the field trial response and process data
Forty-six countries participated in the field trial and the consortium worked with them to
manage the adaptation and translation process, which, in many cases, involved more than
1 population besides ISCED level 2 (i.e. ISCED levels 1 and 3 and the TALIS-PISA link)
as well as additional languages.10 Notably, in comparison to the 2013 survey, the
consortium discussed, in addition to semantic issues, a significantly larger number of
suggested deviations from the structure of the questionnaires. The consortium also had to
respond to an increase in countries/economies wanting to “opt out” of specific questions
that they considered not relevant to their location and setting. This situation had not been
foreseen as an area of potential concern during TALIS 2018 because it had not arisen during
TALIS 2008 and 2013 or been foregrounded in the TALIS technical standards. It also
contradicted the results of the 2015 priority-rating exercise, which showed countries and
economies expressing a preference for a questionnaire structure that covered the same
themes for all countries/economies and offered some allowance for national adaptations.
The consortium collated a log of potential questionnaire edits and improvements in parallel
with the field trial adaptation and translation work. The consortium also received suggested
edits from experts, including the OECD Secretariat, and integrated them into the log.
consortium members then prepared an inventory of these potential improvements for the
QEG. Improvements covered minor spelling, grammar and capitalisation amendments, as
well as more substantive changes relating to the scope, structure and/or wording of items.
Following on from the work done in preparing the field trial instruments, editing focused
on harmonising language use across questions and items, across response options and
across surveys. Examples include the capitalisation of units, consistent question
instructions and the use of the OECD Style Guide (3rd edition). These changes were also
applied to questions from TALIS 2013 that were included in TALIS 2018 but only if the

69
TALIS 2018 TECHNICAL REPORT © OECD 2019
QEG was confident, after careful consideration, that these questions would not affect the
statistical properties of the responses.
Evaluation of complex scales and constructs
The analysis of the field trial data undertaken by the IEA Hamburg’s Research and Analysis
Unit encompassed: (1) scale and item evaluation; (2) cross-country/economy and
cross-populations (ISCED levels and the TALIS-PISA link population) and evaluation of
scales; and (3) cross-cycle evaluation of the scales. The QEG received the results of these
analyses as they became available prior to the fourth QEG meeting in Paris.
The scale and item evaluation in (1) consisted of item statistics for the pooled data and the
country-specific data and analysis of dimensionality via exploratory factor analysis (EFA)
for the selected scales (upon QEG request). The Hamburg team used confirmatory factor
analysis (CFA), Cronbach’s alpha and other coefficients to evaluate scale validity and item
reliability, and they used country/economy-specific model fit indices, factor loadings, item
intercepts and coefficients to evaluate the cross-country/economy and cross-population
applicability of the model in (2). The team also conducted measurement invariance
analyses for ISCED levels 1, 2 and 3 and for the TALIS-PISA population. To evaluate the
applicability of the scales across cycles in (3), the team used ISCED level 2 data from 2018
to estimate the model with the estimated parameters from the 2013 ISCED level 2 data.
They used model fit indices and item parameters to evaluate the scales. All analysed data
were weighted to ensure an equal contribution from each country/economy.
The procedures just described built on the procedures established for analysing the TALIS
2013 field trial and main survey data, and the Hamburg Research and Analysis Unit shared
all findings from their analyses with the QEG, OECD Secretariat and the TAG. Chapter 11
of this report provides additional details on this process.
In general, the models for the overall ISCED level 2 model were deemed good and
acceptable for many of the scales. However, some models did not satisfactorily fit for many
countries/economies and scales. However, model and item properties were deemed
sufficiently clear to allow selection of higher and lower quality items and scales to inform
QEG discussions and the decision-making process. The results of the experiments mostly
favoured the established formulations and formats, thus indicating the need to retain the
2013 main survey versions.
The consortium deliberately included 30 open-ended “other, please specify” dimensions in
the field trial instruments in order to determine if any other dimensions and categories
should be added to the questions for the main survey. After submission of the field trial
data, the consortium asked each country/economy to examine the responses from their
populations and to report back to the consortium those instances where a sizable proportion
of total respondents gave a similar answer. The consortium collated these reports and
provided QEG members with a summary of their content. Only five questions generated
responses that were reported sufficiently widely to warrant consideration for inclusion.
Review of experiments
The following bulleted content describes how the experiments were embedded in the field
trial and gives an account of the main insights gained from their presence:
Alternative frequency scales for “extent” questions: Some of the existing questions
from TALIS 2013 used an established set of response options (“not at all”, “to some
extent”, “quite a bit”, “a lot”), a format also used in PISA and, in part, taken from

70
TALIS 2018 TECHNICAL REPORT © OECD 2019
earlier cycles of TALIS. The QEG for TALIS 2018 raised concerns with respect to
the exactitude of the “quite a bit” option and challenged the appropriateness of the
response options. As an alternative, the consortium proposed this set of response
options: “not at all”, “very little”, “to some extent”, “a lot”. The experiment was
implemented in the established (i.e. trend) self-efficacy question, with the original
set comprising one form and the revised set the other form. Descriptive statistics
were used to evaluate each alternative, while measurement invariance analyses
along with cross-country/economy, cross-population and cross-cycle scale
validation were used to evaluate the scale reliability and validity of the two
alternatives. This work led to the established 2013 version being retained despite
some differences in the measurement properties and the response frequencies.
Alternative wording for family-related aspects: All instances of the word “family”
were changed to the words “personal life” in the 2018 questionnaires. The change
acknowledged that not all teachers have family duties and ties. The experiment,
therefore, included “family” in one form of an item on barriers to professional
development and “personal life” in the other form. This approach made it possible
to check the equivalence of response proportions and other characteristics
(e.g. non-response). Descriptive statistics were used to evaluate the item properties
of the two scales (i.e. one with “family” and the other with “personal life”).
Measurement invariance evaluation along with cross-country/economy, cross-
population and cross-cycle scale validation were used to evaluate the reliability and
validity of each scale. The established item formulation from 2013 was
subsequently retained given evidence of some substantial between-
country/economy changes in the measurement properties.
Substantial revisions of a question on teacher collaboration: The aim of this
experiment was to contrast the original (2013) and revised version of the question
for statistical equivalence, with the expectation that one of the two versions would
be retained, depending of course on the outcome of the evaluation. However, the
members of the QEG noted a preference for retaining the revised version because
they considered it had greater applicability to TALIS 2018. Descriptive statistics
were used to evaluate the item properties of the two scales, while measurement
invariance evaluation along with cross-country/economy, cross-population and
cross-cycle scale validation were used to evaluate the reliability and validity of the
two scales. As before, the 2013 formulations of the items were retained because of
substantial changes in the measurement properties.
Context priming in question stems: The intention behind these experiments was to
investigate the impact of priming respondents by including context-related
information in the question stem versus not including such information
(i.e. a context-free stem). The question used for this purpose was a school climate
question from TALIS 2013. The experiment used that version of the question as
well as an alternative version that included a stem that read: “Thinking about the
general climate in this school, …”. Once again, descriptive statistics were used to
evaluate the item properties of these two alternatives and measurement invariance
evaluation along with cross-country/economy, cross-population and cross-cycle
scale validation were used to assess scale reliability and validity. As before, the
2013 stem was retained because of substantial changes in the measurement
properties.

71
TALIS 2018 TECHNICAL REPORT © OECD 2019
Alternative version of the resource allocation/spending question: Because the
forced-choice version of the resource allocation question was dropped in
accordance with feedback from the pilot study, the QEG decided to assess
two alternatives of this question. The first was the ranking version used in the pilot.
It asked respondents to pick the first, second and third most important priority out
of a larger pool of priorities. The second – the rating version – asked respondents
to rate the priority of all spending possibilities. Descriptive statistics were used to
evaluate the two versions. The QEG rejected the one-choice-per-column variant
(i.e. ranking) due to assumed and partially evidenced order effects, which meant
they favoured retention of the earlier option.
Review of process and time data
The online delivery system collected process data for all of the countries/economies and
respondents that participated in the online mode of data collection. Only two countries
elected to collect data via paper questionnaires. The log of actions during the online
administration, such as login events, navigation and responses, was saved anonymously, as
were related absolute timestamps. Personal information about respondents, including IP
addresses, was not saved at any time. In principle, analyses of these data profiled teachers
or principals (e.g. average time to respond) as well as questions (e.g. the minimum, average
and maximum time spent on questions). The analyses were done by population (e.g. ISCED
level 2), country/economy, language and question, and also by whether a question was an
international one or a national question added to the survey. Co-ordinated national options
(CNOs) were deemed national questions.
Analyses also handled, in a standardised way, outliers that were the result of interruptions,
which meant that time per question was trimmed to a certain maximum (mean plus three
standard deviations). “Time to read” was extracted as the time a respondent took after
reaching the page (one question per page/screen) to begin answering the first item. “Time
to answer” was extracted as the time the respondent began answering until he or she
navigated away from the page (mostly by clicking “Next”). Total time was computed as
the sum of “time to read” and “time to answer”. This sum was used as the net time the
respondent took to complete the questionnaire, while “total time for questionnaire” was
computed as the gross time the respondent needed to complete it. Total time thus included
the time spent on the questionnaire’s prologue and epilogue, on navigating, on
reviewing/revising, and so on.
Before the field trial, the members of the QEG considered that 55 minutes to complete the
core materials in each of the 3 versions of the teacher questionnaire would be a realistic
and feasible target. Members also expected language expansion after translation would
result in a higher or a lower response burden in several settings and could also potentially
see the 60-minute target significantly exceeded. The QEG furthermore anticipated that a
maximum of five minutes’ response time would accommodate national additions (at the
item and/or question level).
Key observations from the field trial analyses of data from almost all samples
(i.e. countries/economies, languages, levels) included the following:
The average gross response time for each teacher across countries/economies
participating in the ISCED level 2 survey equalled almost exactly 1 hour, but
remember that each teacher responded to only about 70% of the materials due to
the use of the 3 survey forms (A, B, C). The target per person of 55 minutes of core

72
TALIS 2018 TECHNICAL REPORT © OECD 2019
time plus 5 minutes to respond to national additions was somewhat met but only on
average across the participating countries/economies.
The average gross response time for principals of about 76 minutes was somewhat
higher across the ISCED level 2 countries and economies.
The average net time (across countries/economies and respondents) for the
principal questionnaire was around 75 minutes for the English-speaking
countries/economies and 85 minutes across all countries/economies, with the range
of time spent extending from about 1 to 2 hours. Thus, the time targets expressed
in the questionnaire’s prologue (i.e. 45 to 60 minutes) were, on average, exceeded
during the field trial.
A high level of consistency was evident for both the net and gross times across the
ISCED levels and the TALIS-PISA link within countries/economies. Thus, for
example, average gross and average net times for ISCED levels 1 and 2 were
largely consistent for both teachers and principals. The QEG members used the
averages for the ISCED level 2 countries/economies as the benchmarks for their
work.
However, as occurred during TALIS 2013, the average net and gross times varied
considerably across the TALIS 2018 countries and economies.
A high level of correlation was evident in the average gross times taken to complete
the teacher and principal questionnaires administered in the same language. The
average per-question time for English-speaking versions and all languages
correlated at 0.99. However, the totals for the English and the non-English versions
were very different, with the averages for all languages consistently higher. This
finding meant that the time target for the English version, as stipulated by the
survey’s terms of reference, would not be a meaningful or fair estimate for response
burden across such a variety of countries/economies and contexts. The QEG
members, therefore, used the empirical times across all languages in the ISCED
level 2 survey for their deliberations.
Stark differences were identified between the initial crude estimates of response
time (e.g. those used at the second TGB meeting) and the actual empirical times.
The QEG, therefore, used the empirical times for ISCED level 2.
The time respondents took to read the questions versus the time they took to
respond to them varied. Generally, questions with fewer data points and less
information collected required more time to read (on average 60% of the time spent
on the question) than time to respond (around 40% of the time spent on the
question). Questions with more data points, mostly longer matrix-type questions,
required relatively less time to read (about 25% to 30% of the time) than time to
respond (around 70% to 75% of the time). The total time taken for a question
correlated highly with the amount of information it collected. However, some of
the outliers present in questions entailed a more complex and longer recall/response
process (e.g. total time worked at school in last complete week; staff counts by
category). When considering the amount of time respondents across all cases
(e.g. ISCED levels) would need to answer the questions remaining after the field
trial, the consortium estimated that 25% of the total time would be spent on reading
and 75% of the time on responding.
73
TALIS 2018 TECHNICAL REPORT © OECD 2019
Many countries/economies exceeded the five-minute threshold for national
items/questions. The consortium demanded respective reductions for the main
survey from the countries/economies concerned. The TGB, having been informed
of this situation, requested that NPMs receive support when selecting materials for
the main survey to ensure compliance with the volume limits agreed to in the
technical standards.
Comparison of overlapping questions in Forms B and C showed that the position
of these questions was identical in Sections “A. Background and Qualification” and
“G. School Climate and Job Satisfaction”. Different positions, however, applied to
the questions in sections “D. Feedback” and “H. Teaching in Diverse
Environments” (in each case, approximately 25 questions appeared further down
Form B of the questionnaire than Form C). When the accumulated response times
per question were compared, the findings showed that, in all cases, responding was
faster when identical questions appeared later in the sequence (example items
ranged from 12% to 23% faster responding). At the same time, zero-variation
response patterns (“straight-lining”) increased slightly for items presented later in
the questionnaire.
The presentation of the job satisfaction question in two different positions affected
invariance and reduced model fit in a measurement invariance model. The job
satisfaction scale was therefore administered at the end of the questionnaire, as was
done in 2013.
In regard to not-reached questions and items (i.e. those that a respondent did not
answer because of previous drop-out) in the teacher questionnaire (with Form A
used for the purpose of analysis), the proportions ranged from a minimum of 0.0%
for 3 countries/economies to a maximum of 16.3% at the other extreme. On
average, 4.7% (median 3.8%) of the teachers did not reach the end of the
questionnaire, with the averages in 11 countries/economies ranging from 5% to
10%, and the averages in 5 countries/economies exceeding 10%. The averages for
the remaining countries/economies ranged from 0% to 5%.
For the principal questionnaire (and note that case numbers were low in some
instances), the proportion of not-reached questions at the end of the questionnaire
averaged 3.1% (median 0%), with the proportions ranging from 0% (in
26 countries/economies) to 20%. Three countries/economies had average rates of
5% to 10%, and 7 had rates larger than 10%.
Both the QEG and the TAG agreed that the gradual increase in not-reached rates
within and across countries/economies over the sequence of questions appeared, as
in 2013, to follow a linear progression.
3.6.2. Revising and choosing content for the main survey
The QEG held its fourth and final in-person meeting in Paris in May 2017. The overall goal
of the meeting was to jointly discuss and agree on the proposed content of the main survey
questionnaires and related documents. The meeting adopted a conservative approach to the
process of selecting main survey questionnaire content and it used three broad
considerations to guide its deliberations. These were technical validity, conceptual value,
and efficiency/length.

74
TALIS 2018 TECHNICAL REPORT © OECD 2019
Technical validity: All items had to have proven measurement quality, meaning
that no new constructs, questions or items could be considered. If field trial data
indicated a fundamental defect, the construct, question or item was dropped rather
than revised. Minor edits relating to grammar, spelling, capitalisation and
consistency were accepted. However, no substantive or semantic changes were
considered unless sufficiently indicated by field trial data, for example, by
responses to open-ended “Other, please specify” questions.11
Conceptual value: The QEG considered the conceptual value of items in relation
to the TALIS 2018 conceptual framework and the OECD’s draft reporting plan.
Members also took into consideration linkages to the TALIS Starting Strong
Survey, the TALIS Video Study and PISA 2018, as well as possible contributions
to the Sustainable Development Goals (SDGs) Target 4 and, as a priority
consideration, to TALIS 2013.
Efficiency/length: Analysis of the timing data from the field trial signified that the
overall length of both questionnaires had to be reduced by at least one‑third. The
meeting sought, wherever possible, to reduce the number of items per question
while ensuring the most efficient coverage of constructs in the instruments. Short
questions (in terms of reading or response times) were preferred to longer ones, as
were questions that served the needs of multiple themes. Where two or more
questions covered similar constructs, all but one was dropped, with the decision
based on the need and priority to report changes over time, criterion validity or
similar rationale. In those instances where a construct was assessed from
two different perspectives, the perspective with the better psychometric quality was
the one retained.
In addition to removing almost all of the open-ended “please specify” dimensions, the
meeting members deleted around 32 items from 15 questions in the principal questionnaire,
and 65 items from 21 questions in the teacher questionnaire. In three instances, the QEG
collapsed two or more dimensions into a single dimension.
Key modifications made to the structure or scope of questions were documented, annotated
and communicated to the TGB, while minor modifications to spelling, grammar,
punctuation and wording were made in accordance with the agreed approach and rules.
Examples of deletions made on the basis of scientific rationale (poor functioning, low
comparability) or other rationales (e.g. similar information or proxies available elsewhere)
included the following: all situational judgement12 items on cognitive activation, classroom
management, clarity of instruction and teacher support (cross-cultural variation very high,
bad model fit overall); job commitment/career plans (attrition proxy could be derived from
teachers’ age and number of years remaining in teaching); and a school team’s degree of
innovativeness (same scale administered to teachers and principals, teachers able to provide
more accurate ratings).
Given increased ethical concerns about the collection and use of data, including process
data, the consortium extended the questionnaire introductions to include language that
informed respondents that process data, such as time spent on items, might be collected in
an anonymous way and used for methodological and validation purposes.13
After eliminating questions based on this scientific rationale, the QEG considered
three additional categories of possible deletions based on their understanding of priorities,
on the analytical potential of questions and on ensuring that balance breadth and depth
would still be maintained for each of the themes. Accordingly, the QEG flagged a sufficient

75
TALIS 2018 TECHNICAL REPORT © OECD 2019
number of questions under two groupings: Category 1 (possible deletion, low/limited
impact on analytical potential), and Category 2 (possible deletion, medium impact). Based
on response-time estimations, the consortium concluded – and the TAG and OECD
Secretariat agreed in principle – that all questions flagged as Category 1 and Category 2
had to be dropped to ensure maintenance of reasonable response time targets for both the
teacher and principal questionnaires. The QEG also identified some additional questions as
candidates for deletion should further reductions be required (Category 3). The final
decisions on what to retain and what to delete were taken in close consultation with the
OECD Secretariat and the TGB’s chair and vice-chairs.
The consortium then provided NPMs with a detailed mapping of all revisions at the item
and word levels, along with finalised, clean versions of the instruments, to facilitate
updating of translations from the field trial questionnaires to the main survey questionnaires
(see Chapter 4).
Because questions relating to qualification pathways and cohort and teacher mobility were
offered as co-ordinated national options in the field trial, data harmonisation, sharing and
comparison across these questions were at the discretion of the countries/economies and
not the consortium. The consortium and QEG recommended that these questions be treated
in the same way for the main survey. However, the consortium determined where the
co-ordinated national options (CNOs) would be positioned in the questionnaires. If, for
example, questions on teacher qualifications were used, these remained in the same
sequence as for the field trial, that is, within the respective background section. Questions
on teacher mobility were moved to a final section of their own, while any other national
extensions were positioned, in compliance with the TALIS technical standards, at the end
of the questionnaire. Eventually, about three out of every four countries/economies
included the CNOs in their national version, with inclusion conditional on these
participants’ data needs and priorities.
Table 3.3 lists the total number of questions across the TALIS cycles. A number of
questions are used here as a proxy for overall length in terms of pages, word count and
response time. As is evident from the table, the total number of questions included in each
cycle increased.
The last stage of selecting and approving the content of the questionnaire was resolved not
only on the basis of psychometric/statistical analyses, data and scientific rationale but also
on the basis of the TGB’s views on an appropriate allocation of material (or, the best use
of respondents’ time) to each theme and its associated questions, items and indicators, as
well as the need to derive data that would satisfy the survey’s proposed reporting plan.
The consortium projected an average net response time for the principal questionnaire, with
that time exclusive of CNOs, of about 52.9 minutes across all countries/economies (41.5
minutes for English) and an average net response time for the teacher questionnaire of about
51.4 minutes (40.6 for English). In addition to the net response time (reading and
answering), the consortium estimated that an additional 5 to 10 minutes would be needed
for logins, prologues, epilogues, reviews and navigation (with these elements jointly
forming the gross response time).

76
TALIS 2018 TECHNICAL REPORT © OECD 2019
Table 3.3. Overview of question count across TALIS 2008, 2013 and 2018 (field trial and
main survey)
2008 main survey 2013 main survey 2018 field trial 2018 main survey
Principal questionnaire
37 questions 39 questions No CNOs
Increase: 2 from 2008
55 questions No CNOs
Increase: 16 from 2013
45 questions No CNOs
Increase: 6 from 2013
Teacher questionnaire
43 questions 46 questions 3 CNOs (social
desirability, mobility)
Increase (core):
3 from 2008
68 questions 5 CNOs (initial
preparation, mobility)
Increase (core):
22 from 2013
52 questions 6 CNOs (TQ-4+5 on initial preparation,
TQ 24 on support for professional
development, TQ 56 to 58 on mobility)
Increase (core):
6 from 2013
These estimates meant that the gross average response time stipulated by the survey’s terms
of reference, that is, 45 minutes for the English version(s), would be exceeded. Given the
consortium’s concern about the overall increase in the number of questions, its members
presented key findings from the process data analysis and the preliminary response time
estimates to the TAG during the June 2017 meeting. In response, the TAG advised that it
did not see a strong technical reason for not using the proposed questionnaire materials or
for a specific cut-off time. However, the TAG did express concern that a longer
questionnaire would likely yield such disadvantages as a hastier response style and poorer
quality responses. The TAG members, therefore, suggested that process/time data be
included in the data editing and the review of “straight-lining” (including defining item-
level non-response) of the main survey data. Because of time constraints, priorities and
overall limited resources, it was not possible to use the process data in this way or to analyse
the sample process data (collected as part of the main survey) by the time this chapter was
completed.
The consortium concluded that TALIS 2018 reached a limit, firstly with respect to what
the current survey and questionnaire design could accommodate in terms of breadth and
depth within and across the sizable number of themes, and second with respect to what it
could reasonably expect from principals and teachers in terms of survey engagement and
response burden. The consortium advised the TGB to expect, in comparison to TALIS
2013, the following: (1) some reduced co-operation and thus a higher level of questionnaire
non-response; (2) some increase in the level of non-response for questions towards the end
of the questionnaire; and (3) some reduction in response quality. While Aspects 2 and 3
had not been fully analysed at the time of writing, there was initially no evidence to indicate
a noticeable effect on response rates across countries (Aspect 1) and cycles, as was reported
to the TGB during its fifth meeting in Paris in February 2019.
3.6.3. Minimum questionnaire response and the corresponding definition of a
“participating teacher”
TALIS 2013 considered a respondent to be a “participating teacher” if he or she answered
at least one item in the questionnaire, a lenient rule adopted from student achievement
studies in the field, including PISA. While the TALIS 2013 TAG initially advised to aim
for a minimum of one answer in the background section of the questionnaire and at least

77
TALIS 2018 TECHNICAL REPORT © OECD 2019
one answer from its substantive part (i.e. non-background), discussions with the TALIS
Board of Participating Countries (BPC) resulted in the board’s decision to retain the
threshold at one answer and its agreement that this criterion would, therefore, suffice to
define a “participating teacher” (Technical Standard 4.28 in TALIS 2013).
During discussions between the TALIS 2018 consortium and the TAG, it was suggested,
via an internal technical memo, that the notion of “participating teacher” should be
investigated again and that the impact of various rules should be assessed through the use
of TALIS 2013 teacher data. The data set used was one where the records contributed to
most, if not all, of the TALIS 2013 tables and models, and it was therefore seen as
preferable to a set where useful information was scarce.
To achieve the analysis, the consortium compiled a list of some 46 variables and 3 scales
comprised of 70 individual items in total (List 1) from the teacher background and initial
preparation section of the TALIS 2013 teacher questionnaire (23 items), the professional
development scale (23 items), the self-efficacy scale (12 items), the professional
collaboration scale (4 items) and the job satisfaction scale (8 items). Meanwhile, the OECD
Secretariat proposed a second list (List 2) consisting of 12 items from the teacher
background and initial preparation section of the questionnaire (3 items) and from the
professional development section of the questionnaire (9 items). List 1 spanned the entire
teacher questionnaire and addressed key TALIS 2013 topics (which remained important in
TALIS 2018). List 2 was optimised to address UN Sustainable Development Goal (SDG)
4.
The consortium then tested 3 different definitions of a “participating teacher”: (1) where
the teacher’s responses covered at least 75% of the 46 variables and 3 scales on List 1;
(2) where the responses covered at least 50% of the 46 variables and 3 scales on List 1; and
(3) where the responses covered each of the 12 variables in List 2. A response to or no
response to any other item or variable was not considered a factor in these definitions.
For each definition, the consortium assessed and classified each returned TALIS 2013
teacher questionnaire as “participating teacher” or “non-participating teacher”. Teacher
non-response adjustment factors were recomputed if needed. If the number of
“participating teachers” fell under 50% of the selected teachers, the consortium flagged the
school as “non-participating” and then recomputed the school non-response adjustment.
Final estimation weights and replication weights were also recomputed.
To assess the impact of each definition, the consortium recomputed estimates and
compared them with the results of the TALIS 2013 cycle for a number of tables. The
variables covered during this process included: (1) age and gender distributions;
(2) teachers’ educational attainment; (3) hours spent working and spent teaching;
(4) teachers’ practices and job satisfaction; (5) subjects taught in current year;
(6) professional development activities; and (8) professional development needs. The
impact on participation rates and, therefore, on adjudication recommendations was also
looked into.
In summary, and probably because of the generally high response rate in TALIS, none of
the definitions had a severe impact on the estimates: the differences between the estimates
published in 2013 and the alternative versions studied were for the most part negligible.
Definition 2 (50% of items on List 1) was the most lenient and had the least impact on the
estimates and on adjudication as hypothesised. Definition 1 (75% of List 1) and
Definition 3 (all of List 2) had more impact than Definition 2. The impact also differed
across countries/economies because both lists spanned the teacher questionnaire to

78
TALIS 2018 TECHNICAL REPORT © OECD 2019
different extents. Definition 1 tended to have the most impact on teachers who became
fatigued early on while answering the questionnaire. However, because of the shorter span
of List 2 and because the items on it appeared mostly at the beginning of the teacher
questionnaire, the impact of early drop-outs was not as clearly felt as it was under
Definition 3.
All 3 definitions had little impact on those countries/economies where teacher and school
participation rates were well above 85%. The impact was much more visible in
countries/economies where participation was moderate (say, from 60% to 75%) or where
respondents experienced survey fatigue relatively early while answering the
questionnaires. Adjudication recommendations stayed identical except for two countries
that would have seen their rating drop one category (from “good” to “fair” and from “fair”
to “poor” respectively) due to loss of “responding teachers” and the ensuing loss of
“participating schools”.
The detailed results of this study were presented to the TAG in June 2017 at their meeting
in Paris. The TAG recommended that TALIS 2018 Technical Standard 3.29 should be
modified to reflect Definition 1 (after the corresponding teacher questionnaire items in
TALIS 2018 had been identified)14. The TAG further recommended that data records which
did not meet the standard on teacher participation should be: (1) excluded from the
respective analyses; or (2) included, but with a note advising that the participating teacher
standard had not been met.
During its third meeting in Lisbon in July 2017, the TGB decided not to adopt the definition
but to apply the existing Technical Standard 3.29 instead (see Chapters 8, 9 and 10 for more
details).
References
Harkness, J. et al. (eds.) (2010), Survey Methods in Multinational, Multiregional, and
Multicultural Contexts, Wiley Series in Survey Methodology, John Wiley & Sons, Hoboken,
New Jersey.
[4]
Jensen, B. and S. Couper (2015), “Joint conceptual framework for TALIS and PISA Synergies”. [3]
Johnson, T. et al. (eds.) (2018), Advances in Comparative Survey Methods: Multinational,
Multiregional, and Multicultural Contexts (3MC), John Wiley & Sons, Hoboken, New Jersey.
[5]
OECD (2015), “Development Plan for the OECD Teaching and Learning International Survey
(TALIS) 2018”, EDU/INES/TALIS(2015)7 (internal document), Directorate for Education
and Skills, OECD, Paris.
[2]
OECD (2015), “Guiding the Policy and Content Focus of TALIS 2018”,
EDU/INES/TALIS(2015)3 (internal document), Directorate for Education and Skills, OECD,
Paris.
[1]
Survey Research Center (2016), Guidelines for Best Practice in Cross-Cultural Surveys, Institute
for Social Research, University of Michigan, Ann Arbor, MI, http://ccsg.isr.umich.edu/
(accessed on 27 March 2019).
[6]

79
TALIS 2018 TECHNICAL REPORT © OECD 2019
Notes
1 At this stage, it was determined that the concurrent uptake of the TALIS-PISA link option as part
of both TALIS and the PISA teacher questionnaire would constitute a significant overburdening of
teachers, especially in small countries where a large proportion of schools would be participating in
both TALIS and PISA, and thus could mean some teachers receiving up to three different teacher
questionnaires (core TALIS, TALIS-PISA link and PISA).
2 The TALIS Board of Participating Countries (BPC) became the TALIS Governing Board (TGB)
from 1 January 2016.
3 The TAG also provided input through a series of virtual meetings (each lasting around two to three
hours) conducted throughout the duration of the study: January 2016, March 2016, June 2016,
November 2016 and March 2018. Written consultations about specific issues also took place during
this time period.
4 Dr Kaplan’s contribution to the QEG was methodological in nature rather than related to the
survey’s core and substantial themes. Dr Kaplan also provided an important point of liaison with the
PISA 2015 and PISA 2018 QEGs as required by the TALIS 2018 terms of reference.
5 Dr Price provided essential links to the analytical work conducted as part of TALIS 2013, and
which she contributed to at the time.
6 Dr van de Vijver later contributed to the substantial development of the survey in connection with
the topic of equity and diversity. This topic was changed into a full theme rather than a cross-cutting
aspect prior to the field trial.
7 Eventually, the TALIS 2018 main survey instruments did not cover “beliefs” about teaching, given
sub-par measurement characteristics in the field trial (and originally in TALIS 2013). The theme
title was subsequently shortened in the final conceptual framework.
8 As agreed with the OECD Secretariat and TGB, QEG members received advance access to the
draft international database in mid-2019 so that they could conduct their own analyses and
publications, with that access conditional on the same embargo and data use policy that applied to
the TGB.
9 Pilot contributors were Alberta (Canada), Australia, Colombia, the Czech Republic, Dubai (United
Arab Emirates), France, Kazakhstan, the Netherlands, Norway, Portugal and Sweden.
10 Two late-joining countries/economies out of the total 48 countries/economies conducted a field
trial at a later stage; the results did not contribute to the main field trial analyses.
11 The European Commission requested the inclusion of an indicator on the proportion of students
with an immigrant background (first or second generation) in the school (principal questionnaire)
and classroom (teacher questionnaire). This late addition was problematic from a process
perspective because the question had not been field-trialled. Given the European Commission’s
strong interest in conducting analyses of school and teacher data in light of the concentration of
immigrant students, the OECD Secretariat and TALIS 2018 Consortium decided to defer the
decision to the TGB. The TGB subsequently decided, during its third meeting in Lisbon, to include
this question in the main survey.
12 A variety of approaches were used to analyse these items in co-operation with Dr Leslie
Rutkowski and in consultation with the TAG as well as additional experts convened by the OECD
Secretariat for a webinar. Most importantly, insufficient measurement properties (in item response
theory and factor analytical frameworks) and the absence of a consensus on appropriate or preferred

80
TALIS 2018 TECHNICAL REPORT © OECD 2019
situational reaction led to the QEG dropping the items. The TAG recommended that future TALIS
cycles explore different scale scoring methods, such as “wisdom of the crowd” or expert ratings.
13 For the main survey, the consortium collected process data (i.e. timestamped events reflecting
user actions, browser and screen size details, but no IP addresses) from a sample of respondents
only. The intention was to use the data to assess the overall quality and validity of the data, for
example, with respect to proportions of respondents with exceptionally low or high response times.
14 The consortium and QEG determined the following list of 20 key questions from the field trial
that could reasonably describe a teacher, that had high policy relevance and that were assumed to be
relatively stable across cycles: gender (TQ-01), age (TQ-02), highest educational attainment (TQ-
04), qualification elements and preparedness (TQ-08), employment status tenure (TQ-11),
employment status full-time equivalent (TQ-12), work experience (TQ-13), special needs teaching
status (TQ-16), subjects taught (TQ-17), time distribution – total hours (TQ-18), time distribution –
teaching hours (TQ-19), professional development types/formats (TQ-27), professional
development topics (TQ-28), professional development needs (TQ-32), engagement in collaborative
activities (scale, TQ-40), general self-efficacy (scale, TQ-41), satisfaction with classroom autonomy
(scale, TQ-52), core teaching practices in target class (scale, TQ-54), satisfaction with the profession
and school (scale, TQ-65), and self-efficacy in multicultural environments (scale, TQ-70).

81
TALIS 2018 TECHNICAL REPORT © OECD 2019
Chapter 4. Preparation of national survey instruments
This chapter summarises the outcomes and procedures for national adaptation verification
and international translation verification, and includes information about the layout
verification process of the Teaching and Learning International Survey (TALIS)
instruments. The international adaptation, translation and layout verification of all
specified instruments in the identified target languages was conducted before the field trial
and main data collection of TALIS 2018.
All participating countries/economies produced national survey instruments efficiently and
of high quality. Quality control during production of the national instruments helped
ensure the collection of high-quality data that can be compared internationally across
countries/economies and over time. National adaptation forms supported adaptations of
the international source versions in the main survey for all target populations chosen by
the participating countries and economies. The materials for each country/economy and
survey language were carefully cross-checked against the various source instruments, that
is, the international (English, French) instruments, the versions for the different target
populations and the versions used in the previous TALIS cycle (TALIS 2013).
The development of the various target questionnaires produced from the international
source questionnaire, ranging from one to four different target populations (if and when
applicable), was generally successful with respect to ensuring accuracy and consistency
not only within the national materials for each country/economy but also across the
national survey instruments used by each participating country/economy.
The statistical data for Israel are supplied by and under the responsibility of the relevant Israeli authorities. The
use of such data by the OECD is without prejudice to the status of the Golan Heights, East Jerusalem and Israeli
settlements in the West Bank under the terms of international law.

82
TALIS 2018 TECHNICAL REPORT © OECD 2019
4.1. Overview of adaptation and translation verification
The TALIS 2018 survey instruments were reviewed during several stages of their
preparation. Instruments included questionnaires (online and paper data collection) and
cover letters (online data collection). The reviews focused on approving national
modifications to all instruments (in a given target language) and this chapter describes the
procedures related to that work, which encompassed three major activities:
translation and adaptation of the international source versions of the TALIS
instruments into the national languages
international verification of the national translations and adaptations
international layout verification of the final national instruments.
Everybody involved in preparing the instruments had to meet the procedural requirements
for translation and translation verification (including the submission and review
procedures) outlined in the TALIS 2018 Technical Standards 4.1–4.27. The TALIS 2018
Survey Operations Procedures Unit 3, provided to all TALIS 2018 national project
managers (NPMs), contained detailed instructions on instrument preparation.
The survey instruments, which included an international version in English and a version
translated into French (the official languages of the OECD), were released to the national
study teams during three key phases. The first phase consisted of a pilot study, during which
experts reviewed the survey instruments. Each national study centre could use either the
English or French source version of the instruments (on the assumption that the teachers
and principals responding to them could understand English or French) or perform a full
translation into the local language(s). Because the piloted national TALIS questionnaires
were used solely to collect qualitative data and feedback rather than quantitative,
internationally comparable data, national adaptations and translations were not examined
by external verifiers.
The second and third key phases were the field trial and the main survey respectively.
During these phases, the national questionnaires underwent stringent independent
adaptation, translation and layout verification processes. The national study centres began
this work by adapting the international source version of the teacher and principal
questionnaires (available in English and French) to fit their respective national or
subnational contexts. This work included structural and non-structural adaptations of
questions and, to a very limited extent, national additions of items, categories and
questions. Each national study centre used national adaptation forms to document their
adaptations to their national survey instruments. The TALIS 2018 international study centre
(ISC) was responsible for approving all documented adaptations.
In preparation for the field trial and the main survey, decentralised translation took place.
This meant that each country was responsible for adapting and translating its own national
instruments from one of the two source versions (English or French). The translation
process required translation and translation review at the national level. For the main
survey, the ISC provided countries/economies with Word documents containing translated
questions from the field trial that could be used in unchanged form for the main survey.
During the translation verification process, overseen by the IEA Amsterdam, independent
language specialists at cApStAn Linguistic Quality Control (an agency specialising in
validating translations of international survey instruments) compared the translated
instruments side by side with the international versions. Upon completion of the

83
TALIS 2018 TECHNICAL REPORT © OECD 2019
verification, the IEA Amsterdam returned the instruments, each of which contained verifier
feedback accompanied by a severity code (established by the IEA), to the TALIS 2018
NPMs and asked them to review the verifiers’ comments and improve the translations or
adaptations in line with the IEA’s guidelines for translation. From there, the NPMs
submitted the instruments to the ISC for verification of the layout, after which the NPMs
finalised their respective sets of instruments for data collection.
4.2. Instruments requiring adaptation and translation
The following materials needed to be adapted and translated by each country/economy
based on the mode of administration (online and/or paper):
one principal questionnaire template, requiring a variety of mandatory adjustments
for the different International Standard Classification of Education (ISCED)
levels/TALIS-PISA link
one teacher questionnaire template, requiring a variety of mandatory adjustments
for the different ISCED levels/TALIS-PISA link
one principal cover letter template for online administration, requiring a variety of
mandatory adjustments for the different ISCED levels/TALIS-PISA link
one teacher cover letter template for online administration, requiring a variety of
adjustments for the different ISCED levels/TALIS-PISA link.
The TALIS 2018 School Co-ordinator Manual1 also needed to be adapted and translated
into the language(s) used by the school co-ordinators. Although the manual was not subject
to international translation or layout verification procedures, national translations of and
adaptations to the manual had to adhere to TALIS procedures. The IEA’s independent
international quality observers (IQOs) reviewed the national version(s) of the School
Co-ordinator Manual and included their comments in their translation verification report
(for details, see Chapter 7).
4.3. Identifying the target language
Most countries and economies taking part in TALIS 2018 administered the survey in
one predominant language, typically the language used throughout their entire education
system or at least understood by all respondents. Of the 48 participating
countries/economies, 9 administered the survey in more than 1 language (with the number
ranging from 2 to 5 languages). The ISC advised these countries/economies to involve
professionals familiar with more than one of these languages to review the translations and
to ensure equivalency across versions.
Participating countries/economies translated the principal and teacher questionnaires into
the languages listed in Table 4.1. The countries/economies that conducted online data
collection translated cover letters to be distributed to participants. The cover letters
contained information about the study, the web address for accessing the online
questionnaire and individualised user login information.
In general, each set of instruments underwent two rounds of translation verification – once
for the field trial and once for the main survey. However, two of the languages administered
during the main survey were not administered during the field trial. Norway initially
intended using only Bokmål but during the field trial decided to administer the instruments
in Nynorsk as well. This late decision, along with tight timelines, the fact that Bokmål was

84
TALIS 2018 TECHNICAL REPORT © OECD 2019
the only language used in the regions participating in the field trial and the similarities
between Bokmål and Nynorsk, led to the national centre and the ISC agreeing that the
instruments in Nynorsk should undergo translation verification only during the main
survey. In Finland, the only language used during the field trial was Finnish, even though
the national centre had also prepared a Swedish translation. This translation was based on
the Swedish translation that Finland borrowed from Sweden. Due to the small number of
schools in Finland that would administer the instruments in Swedish, Finland elected not
to use the Swedish version during the field trial so as to prevent under-representation during
the main survey.
Several countries/economies used the English version of the instruments, notably England
(United Kingdom), Malta and the United States. Only two countries used the French
version – Belgium and France. These countries/economies all made national adaptations to
the instruments and submitted them for adaptation verification, language verification and
layout verification.
Table 4.1. Languages used in TALIS 2018
Participating country/economy Main survey language(s)
Alberta (Canada) English
Australia English
Austria German
Belgium French
Flemish Community (Belgium) Flemish (Dutch)
Brazil Portuguese
Bulgaria Bulgarian
Chile Spanish
Ciudad Autónoma de Buenos Aires (Argentina) Spanish
Columbia Spanish
Croatia Croatian
Cyprus1,2 Greek and English
Czech Republic Czech
Denmark Danish
England (United Kingdom) English
Estonia Estonian
Finland3 Finnish and Swedish
France French
Georgia Georgian, Azeri and Russian
Hungary Hungarian
Iceland Icelandic
Israel Hebrew and Arabic
Italy Italian
Japan Japanese
Kazakhstan Kazakh and Russian
Korea Korean
Latvia Latvian
Lithuania Lithuanian
Malta English
Mexico Spanish
Netherlands Dutch
New Zealand English and Maori
Norway4 Bokmål and Nynorsk
Portugal Portuguese

85
TALIS 2018 TECHNICAL REPORT © OECD 2019
Participating country/economy Main survey language(s)
Romania Romanian
Russian Federation Russian
Saudi Arabia Arabic
Shanghai (China) Mandarin
Singapore English
Slovak Republic Slovak
Slovenia Slovenian
South Africa English
Spain Spanish (Castilian), Catalan, Galician, Valencian and Basque
Sweden Swedish
Chinese Taipei Traditional Chinese
Turkey Turkish
United Arab Emirates Arabic and English
United States English
Viet Nam Vietnamese
1. Note by Turkey: The information in this document with reference to “Cyprus” relates to the southern part of
the Island. There is no single authority representing both Turkish and Greek Cypriot people on the Island.
Turkey recognises the Turkish Republic of Northern Cyprus (TRNC). Until a lasting and equitable solution is
found within the context of the United Nations, Turkey shall preserve its position concerning the “Cyprus
issue”.
2. Note by all the European Union Member States of the OECD and the European Union: The Republic of
Cyprus is recognised by all members of the United Nations with the exception of Turkey. The information in
this document relates to the area under the effective control of the Government of the Republic of Cyprus.
3. For Finland, only Finnish was administered during the field trial.
4. For Norway, only Bokmål was administered during the field trial.
4.4. Adaptations
Adaptations were kept to a minimum but some were mandatory to ensure that the principals
and teachers in each country/economy received questions equivalent to those administered
to principals and teachers in all other countries/economies. Revisions included structural
and non-structural changes, as well as mandatory and elective adaptations.
Structural adaptations: The term “structural adaptation” referred to any adaptation
that altered the structure of the international source questionnaires by removing,
adding or splitting categories, by removing, adding or splitting national dimensions,
by removing or adding questions or by changing the width and range definition for
a question.
Non-structural adaptations: Non-structural adaptations referred to adaptations that
did not change the structure of the questionnaires, that is, neither added nor
subtracted questions, dimensions or categories to or from the instruments. The
adaptations typically involved adapting terms and phrases to fit the cultural context
of each country/economy. The adaptation of the term or phrase was more than a
pure translation because the international term or phrase was replaced by the
national term or phrase.
Mandatory adaptations: The international questionnaires contained terms or
phrases that needed to be adapted at the national level. These adaptations were non-
structural because they did not alter the structure of the instrument but adapted it to
fit a local context. To facilitate the mandatory adaptation process, the international

86
TALIS 2018 TECHNICAL REPORT © OECD 2019
versions of the questionnaires included brackets and yellow highlighting to indicate
the places where mandatory adaptations were needed.
o Square brackets. These required NPMs to add some nationally-specific
information such as that relating to procedures on how to return questionnaires
and specification of deadlines, for example, “[national return procedures and
date]”.
o Angle brackets. These required NPMs to replace the words in the brackets with
the country/economy-appropriate term or terms. Some of these words related
to the target populations (respondents). For example, <ISCED Level x> needed
to be replaced with the appropriate educational level set out in the International
Standard Classification of Education 2011 mapping (UNESCO-UIS, 2012[1]),
such as “lower secondary education”. Additional advice and instruction in the
TALIS 2018 Survey Operations Procedures Unit 3 also helped NPMs identify
appropriate adaptations.
Elective adaptations: Countries/economies could apply additional non-structural
adaptations, such as replacing (where necessary) terms or phrases with terms or
phrases relevant to their respective contexts and cultures. Examples included names
of specific institutions and ways of addressing people. Elective adaptations also
included the following:
o Valid ranges (if necessary), removal of non-applicable questions or dimensions,
and addition of categories (if necessary).2
o National questions. National study centres were permitted to add these
questions at the very end of each questionnaire. These national questions could
be ones developed by the participating countries/economies themselves or be
items originally discarded from the international instrument but still deemed
appropriate for implementation (e.g. questions on teacher mobility). The ISC
stipulated, as a general rule, that these additional questions should add no more
than five minutes of response time to a questionnaire’s total response time.
During the adaptation process, participating countries/economies decided not to administer
certain items. Table 4.2 and Table 4.3 provide an overview of the questions, dimensions
and categories that countries/economies decided to exclude from the TALIS 2018
administration before preparation of the national survey instruments.
Table 4.2. Excluded TALIS 2018 principal questionnaire questions (before translation
verification)
Participating country/ economy
PQ-08 PQ-10 PQ-11 PQ-15 PQ-17 PQ-19 PQ-20 PQ-24 PQ-25 PQ-29 PQ-33 PQ-39 PQ-42
Bulgaria H H B, C
Ciudad Autónoma de Buenos Aires (Argentina)
G–H D C, F
Croatia ISCED2: A, D, E
ISCED3: A–C
C C, F
Cyprus1 CAT 5

87
TALIS 2018 TECHNICAL REPORT © OECD 2019
Participating country/ economy
PQ-08 PQ-10 PQ-11 PQ-15 PQ-17 PQ-19 PQ-20 PQ-24 PQ-25 PQ-29 PQ-33 PQ-39 PQ-42
Denmark ISCED3: A
F–H C
France D
Italy G, J X
Japan F
Korea E
Malta E
Spain C, M
Sweden D A–D C
United States D
1. See Notes 1 and 2 under Table 4.1.
Note: In the table, an “X” means that the respective country/economy excluded the question. For questions with multiple
dimensions, the listed letters refer to those dimensions of the respective question that were not administered in the
country/economy. For example, Bulgaria excluded dimension H of PQ-08. “CAT” denotes that a question category was excluded.
Where necessary, the information presented in the table distinguishes between the different TALIS 2018 target populations (i.e.
ISCED level 1, ISCED level 2, ISCED level 3 and TALIS-PISA link). Unless stated otherwise, all information refers to the ISCED
level 2 instruments.
Table 4.3. Excluded TALIS 2018 teacher questionnaire questions (before translation
verification)
Participating country/ economy
TQ-14 TQ-15 TQ-20 TQ-24 TQ-29 TQ-35 TQ-36 TQ-50 TQ-55
Belgium A–H
Flemish Community (Belgium)
A–H
Bulgaria X H X A–I
Ciudad Autónoma de Buenos Aires (Argentina)
A–H D
Croatia C
Israel F
Italy X
Japan ISCED1: G
ISCED2: F
A–H
Netherlands ISCED1: A–G, J–K
Shanghai (China) F
United States A–H G
Note: In the table, an “X” means that the respective country/economy excluded the question. For questions with multiple
dimensions, the listed letters refer to those dimensions of the respective question that were not administered in the
country/economy. For example, Croatia excluded dimension C of TQ-29. Where necessary, the information presented in the table
distinguishes between the different TALIS 2018 target populations (i.e. ISCED level 1, ISCED level 2, ISCED level 3 and TALIS-
PISA link). Unless stated otherwise, all information refers to the ISCED level 2 instruments.

88
TALIS 2018 TECHNICAL REPORT © OECD 2019
4.5. National adaptation forms
All changes, selections and adaptations to the TALIS instruments were done with the goal
of creating an international database containing comparable data from all participating
countries/economies. NPMs noted all revisions to the instruments for the main survey in
an Excel document called a national adaptation form (NAF). NPMs received adequate
training in using the form and were required by the ISC to fill out a form for each language
and target population in which they intended to administer the instruments. Georgia, for
example, filled in a set of three NAFs because it administered TALIS in Azeri, Georgian
and Russian. The NAF ultimately contained the complete translation, adaptation and
verification history of each set of national instruments for every applicable target
population and it was, therefore, an integral part of the adaptation and translation processes
before and after international translation verification and, finally, layout review.
During preparation of the national instruments, the ISC asked the NPMs to submit the
adaptation forms at five key times (project “milestones”):
Step I, NAF approval: The ISC reviewed the proposed adaptations entered on the
NAFs. Terms and items used in TALIS 2013 had to be translated identically to
allow for trend analysis. The ISC released the TALIS 2013 main survey instruments
as a reference. The ISC also gave all participating TALIS 2018
countries/economies the International Standard Classification of Education 2011
mapping (UNESCO-UIS, 2012[1]) and asked them to use this for referencing the
ISCED levels.
Step II, translation verification: External language experts (from cApStAn)
reviewed the translated (updated) ISCED level 2 core instruments, referring to the
NAFs when relevant and commenting on any implemented adaptations. The
experts also verified translations of the cover letters and the NAFs for the other
international options (ISCED level 1, ISCED level 3 and the TALIS-PISA link).
Step III, layout verification: During this stage, the ISC compared the layout of the
national instruments with the international source versions in English or French and
noted any deviations from the international versions in the national instruments.
Step IV, online data collection (ODC) verification: The ISC prepared online
questionnaires for each participating country/economy in the respective
language(s). The online questionnaires included all adaptations to match the
national instrument structure. National study centres then used the online delivery
system to review the final online instruments.
Step V, codebook verification: The ISC created a national codebook for each
country/economy. Countries/economies were asked to check the structure of the
national codebook by entering one record for each questionnaire type.
4.6. Hierarchy of international options during instrument preparation
TALIS 2018 offered countries/economies the opportunity to survey not only the
international target population, that is, the teachers and principals in schools providing
lower secondary education (ISCED level 2) but also the populations of teachers and
principals at ISCED level 1 and ISCED level 3 and those involved in the TALIS-PISA link.
Countries/economies that chose to survey teacher and principal respondents from more
than one of the international options needed to ensure that the different survey instruments

89
TALIS 2018 TECHNICAL REPORT © OECD 2019
were consistent across the core and optional target populations. Deviations across target
populations were only permissible if the country/economy could justify them and if the ISC
approved those justifications.
As a further means of quality control, the ISC asked countries/economies to produce the
ISCED level 2 core version of the instruments in the predominant survey language and then
to use this version as the main blueprint for the international options and/or additional
language(s). This key process was ingrained in the survey operations to ensure that all
national materials were of high quality and consistent across the different instruments used
within one country/economy. The procedure applied to all steps of the national instrument
production that are outlined in this chapter.
The ISCED levels 1 and 3 instruments were not subject to a full translation verification.
Instead, revisions were recorded in the NAF, and verifiers then checked these changes. A
thorough consistency check during layout verification ensured only those adaptations to
the ISCED levels 1 and 3 instruments that the ISC had agreed to were implemented and
that the rest of the instruments matched the ISCED level 2 core instruments.
Preparation of the principal and teacher questionnaires for the TALIS-PISA link followed
the same procedure used for preparing the ISCED levels 1 and 3 questionnaires. However,
because the countries/economies administering the TALIS-PISA link had to replace the
ISCED-level information in those questionnaires with the notation “15-year-olds”, they had
to produce an extra set of questionnaires, even if they were also administering the survey
at an ISCED level where 15-year-olds were part of the population.
All participating countries/economies implemented the survey at the ISCED level 2 core,
15 implemented it at ISCED level 1, and 11 implemented it at ISCED level 3.
Nine participating countries/economies also took part in the TALIS-PISA link option (see
Table 4.4).
Table 4.4. List of the teacher and principal target populations in TALIS 2018 by country
Participating country/ economy ISCED level 1 ISCED level 2
(core) ISCED level 3 TALIS-PISA link
Alberta (Canada) X X
Australia X X X
Austria X
Belgium X
Flemish Community (Belgium) X X
Brazil X X
Bulgaria X
Chile X
Ciudad Autónoma de Buenos Aires (Argentina)
X X X
Colombia X X
Croatia X X
Cyprus1 X
Czech Republic X X
Denmark X X X X
England (United Kingdom) X X
Estonia X
Finland X
France X X
Georgia X X

90
TALIS 2018 TECHNICAL REPORT © OECD 2019
Participating country/ economy ISCED level 1 ISCED level 2
(core) ISCED level 3 TALIS-PISA link
Hungary X
Iceland X
Israel X
Italy X
Japan X X
Kazakhstan X
Korea X X
Latvia X
Lithuania X
Malta X X
Mexico X
Netherlands X X
New Zealand X
Norway X
Portugal X X
Romania X
Russian Federation X
Saudi Arabia X
Shanghai (China) X
Singapore X
Slovak Republic X
Slovenia X X
South Africa X
Spain X X
Sweden X X X
Chinese Taipei X X X
Turkey X X X X
United Arab Emirates X X X
United States X
Viet Nam X X X X
1. See Notes 1 and 2 under Table 4.1.
4.7. Engaging translators
The ISC advised NPMs to engage a minimum of two translators for each language in which
their respective countries/economies intended administering the survey. Translators needed
to have the scheduled language as their mother tongue, possess excellent knowledge of
English and be familiar with survey instruments.
The first of these translators, who was expected to be not only a language specialist but
also someone with a sound understanding of the country’s/economy’s cultural context,
translated the international English (or French) text of the instruments and manuals into the
national language. The second translator, known as the reviewer, was expected to possess
experience in the national educational context and to be familiar with the subject of the
study. This individual reviewed and commented on how appropriate the initial translation
was in terms of fitting the national educational context. This person also checked the
translation’s accuracy and readability. The country’s/economy’s NPM subsequently
reviewed the translation and the reviewer’s comments and made changes where he or she
deemed appropriate in the final document. This method meant that three independent
people compared the national versions against the original international source versions in
English or French.

91
TALIS 2018 TECHNICAL REPORT © OECD 2019
The ISC reminded NPMs planning to divide up the translation work or to produce
translations in more than one language of the importance of ensuring consistency within
and across instruments. The ISC also encouraged the countries/economies that intended
producing the survey instruments in more than one language to engage professionals
familiar with all the languages as special reviewers so as to establish equivalence across
translations.
4.8. Producing translations
For English-speaking or French-speaking countries/economies, the instrument preparation
process involved adapting language, terminology and classifications to local requirements.
Countries/economies administering the survey in a language or languages other than
English or French had to translate and adapt all survey materials into the local language(s).
When producing their national survey instruments, all but 2 of the 48 participating
countries/economies used the English source version. The exceptions were Belgium and
France. They used the French source version.
The TALIS 2018 instruments contained some questions/items used in TALIS 2013 and
these provided a basis for comparing data collected by the countries/economies that
participated in both TALIS surveys. The TALIS 2018 countries/economies that had
participated in TALIS 2013 were obligated to use the translations from the earlier cycle in
order to ensure consistency and therefore possible comparability of data across the
two surveys. The ISC asked the national study centres to adhere to this objective when
updating the field trial instruments for the TALIS 2018 main survey. The ISC also made
sure that the NPMs had access to the approved TALIS 2013 main survey instruments for
reference. If, when comparing the TALIS 2013 translations to the TALIS 2018 field trial
translations, NPMs viewed a translation from TALIS 2013 as not appropriate or had any
other concerns regarding the translation, the ISC asked the NPMs to address these issues
and concerns by contacting the ISC.
Although the instruments used for the TALIS 2018 main data collection were based on
field-tested instruments, they also contained several new items that were either not tested
in the field trial or were significantly modified after it. In addition, the ISC implemented
trend verification (across the international options) for both the field trial and the main
survey. During the main survey, a separate procedure was applied to the trend items in the
questionnaires that were used by those countries/economies that also took part in
TALIS 2013. This procedure was designed to detect any discrepancies between the two sets
of items so as to ensure consistency and make it possible to reliably measure changes in
responses to those items over time. The international source instruments were also
comprehensively edited for the 2018 cycle, which resulted in the development of
sophisticated methods and procedures to preserve the trend measurement. Any revisions
and additions to the text and/or rewording of or omissions from it that affected the meaning
of questions and/or options would also have influenced ability to preserve trend
measurement.
The TALIS 2018 Survey Operations Procedures Unit 3, Instrument Preparation (Main
Survey) specified the need for translations not only to follow the rules of the target language
and the country’s/economy’s national/school context but also to have the same meaning as
the source text. The ISC produced a glossary document containing definitions and
explanations of the most critical terms to help translators prepare sets of instruments that
captured the meaning and intent of the international instruments while safeguarding against

92
TALIS 2018 TECHNICAL REPORT © OECD 2019
inaccuracies or word-for-word translations that were not appropriate within the national
language and context.
The translator’s role was to prepare a full translation of the core questionnaires and cover
letters so that these would provide the blueprints for the other international options.
Translators introduced the mandatory adaptations for the international options and, where
applicable, documented them in the NAFs. The translated texts needed to ensure
understanding and natural flow to the extent that anyone reading the texts could not tell if
they had originated in English or French. Guidance on language use during translation, as
outlined in the TALIS 2018 Survey Operations Procedures Unit 3, Instrument Preparation
(Main Survey), comprised the following:
The translated text should have the same register (language level and degree of
formality) as the source text.
The translated text should have correct grammar and usage (e.g. subject/verb
agreement, prepositions, verb tenses, etc.).
The translated text should not add text to or omit text from the source version unless
the ISC agreed to this.
The translated text should employ equivalent qualifiers and modifiers appropriate
for the target language.
The translated text should have the equivalent social, political or historical
terminology appropriate for the target language and used at this level of education.
Idiomatic expressions should be translated appropriately, not necessarily word for
word.
Spelling, punctuation and capitalisation in the target text should be appropriate for
the target language and the country/economy or cultural context.
When the individuals in the national study centres responsible for the translation work
completed their work, reviewers read the materials to ensure that the translations were
appropriate for teacher and principal respondents, were consistent with the field trial
version of the instruments and met the requirements of TALIS 2018. After the reviewers
had commented on the consistency and quality of the translations, the translators were
expected to integrate the changes into the instruments. If a translator and a reviewer
disagreed on the most appropriate translation, the NPM acted as an arbitrator and had the
right to make the final decision.
4.9. International translation verification
International translation verification was an important part of the TALIS 2018 technical
standards (specifically, Standards 4.18–4.27). The IEA Amsterdam co-ordinated the
translation verification process and engaged the services of native-speaking linguistic
verifiers through cApStAn Linguistic Quality Control, based in Brussels, Belgium. These
verifiers, experienced in balancing the cultural and national “appropriateness” of the target
version with “faithfulness” to the source version, provided expert feedback on
country/economy translations and adaptations. The ISC then asked the NPMs to carefully
review all verifier comments and suggestions and to implement those that improved the
questionnaire materials according to the IEA’s guidelines for translation, while also
ensuring that the translations retained the original meaning of the phrases. Although an

93
TALIS 2018 TECHNICAL REPORT © OECD 2019
NPM always had the right to make final decisions regarding document content, he or she
had to describe and explain any major differences of opinions between national study centre
personnel and verifiers.
The ISCED level 2 core instruments and cover letters underwent full translation
verification. The ISC asked the NPMs to use the verified core instruments as the base from
which to develop the optional instruments and to make only approved adaptations to the
latter. Therefore, for the international options (ISCED level 1, ISCED level 3 and the
TALIS-PISA link), the additional entries in the NAFs were the only content to undergo
international translation verification. The IEA Amsterdam provided verifiers with the same
materials that the NPMs used when producing national translations.
During the main survey, translation verifiers received the international (English or French)
questionnaires in PDF format, which gave them an accurate preview of the intended format.
The translated questionnaires (for all ISCED levels and the TALIS-PISA link) and cover
letters (online data collection) were received in Word format, while the relevant NAFs were
received as Excel files. Verifiers used the “track changes” feature of Word to insert their
comments and changes directly into the national documents. Verifiers also documented and
recorded (in the form of comments) any deviations from the international source version in
the NAF and used the IEA severity code system to indicate the severity of the identified
error or issue.
Each verifier comment contained one of the following severity codes:
Code 1: Major change or error. Examples included the incorrect order of choices
in a multiple-choice item, omission of an item, incorrect translation resulting in the
answer being indicated by the item, an incorrect translation that changed the
meaning or difficulty of the text/item, and the incorrect order of items.
Code 1?: Not certain. The verifiers used a Code 1? when they were unsure of how
to correct a possible error or which intervention category to apply.
Code 2: Minor change or error. Examples included spelling errors that did not
affect comprehension.
Code 3: Suggestion for alternatives. The translation might be adequate, but the
verifier suggested different wording.
Code 4: Acceptable change. Examples included national conventions for
capitalisation and date format.
4.10. Feedback from NPMs on international translation and translation verification
The ISC developed a survey activities questionnaire (SAQ) that it administered after the
field trial and again after collection of the main survey data. The questionnaire, designed
to elicit feedback from NPMs on their experiences administering TALIS 2018, included
questions on the translation and international translation verification processes. Responses
to the SAQ administered after the main data collection period indicated that the NPMs
found the international translation verification process benefited preparation of the main
survey.
All NPMs of the participating countries/economies answered the SAQ. Their answers
showed that the majority of the participants (29 of the 48) experienced no difficulties
translating the source questionnaires into national language(s) or adapting them to local
contexts. Most of the NMPs reported that after reviewing the feedback from the

94
TALIS 2018 TECHNICAL REPORT © OECD 2019
international translation verifiers, they made several modifications to their instruments; 41
of the 48 said they corrected errors identified by the verifiers.
4.11. Layout verification: Paper and online data collection
As a final step during production of the national instruments and after completion of the
translation verification process, the ISC verified the layout of the paper versions and created
the online versions of the instruments. The ISC carefully checked the national versions of
the instruments against the international English or French versions and the documentation
in the corresponding NAFs. The aim of the layout verification was to ensure that the
national versions of the TALIS instruments looked, as much as possible, like the
international source versions and that the paper and online versions were, therefore, to the
greatest extent possible, equivalent.
The process used to verify the layout of the paper version was similar to the NAF approval
process. NPMs submitted all ISCED level 2 (core population), ISCED level 1, ISCED
level 3 and TALIS-PISA link instruments and, if applicable, the cover letters, to the ISC
for approval. The ISC then compared the ISCED levels 1 and 3 questionnaires, including
the teacher and principal questionnaires for the TALIS-PISA link, against the approved
ISCED level 2 questionnaires, which served as the new master versions.
ISC staff checked each questionnaire for font size, font changes, adjustment of cells,
response options, blank pages, word emphases, tracked changes, page breaks and
comments. If ISC staff found deviations from the documentation in the NAF, they adjusted
the paper versions and asked the relevant NPM to verify the correction of the mistake.
After paper layout approval, the ISC simultaneously implemented the instruments for all
ISCED levels and options in the IEA Online Survey System (OSS) and then checked each
online version of an instrument against its approved paper version. This practice helped
ensure that the instruments within one country/economy were the same, regardless of
whether they were administered on paper or on line. Visual checks were run using the same
standards and procedures as for verification of the paper layout. After finalising the online
files, the ISC asked each NPM to thoroughly check the files and report any mismatching to
the ISC.
Up to two rounds of checking and verification were needed for most of the language
versions of the instruments before they received final approval from the NPM.
The process involved in verifying the different international options was time-consuming
and many countries/economies were operating under a tight schedule. For these reasons,
the ISC invited those countries/economies that had elected to administer one or more of the
international options to work simultaneously on finalising the paper layout for these
options. The majority of NPMs (40 of the 48) said they found the instructions for layout
verification provided by the ISC helpful for preparing their national survey instruments. In
a few cases, NPMs detected some minor inconsistencies regarding spelling, punctuation or
layout mismatches after layout approval and prior to online system activation or printing.
The ISC changed these inconsistencies and informed the relevant NPM of the updated
version(s).

95
TALIS 2018 TECHNICAL REPORT © OECD 2019
References
UNESCO-UIS (2012), International Standard Classification of Education (ISCED) 2011,
UNESCO Institute for Statistics, Montreal,
http://uis.unesco.org/sites/default/files/documents/international-standard-classification-of-
education-isced-2011-en.pdf.
[1]
Notes
1 The TALIS School Co-ordinator Manual (internal document) contained detailed information about
the role and responsibilities of the school co-ordinator. The ISC provided two templates of the
manual in English to the NPMs, one template for online survey administration and the other for the
paper-based survey administration. The templates were to be translated and adapted by the NPM
and then distributed to the country’s/economy’s school co-ordinators.
2 TALIS 2018 set the standard that all participating countries/economies should implement 100% of
the agreed questions and items during the main survey data collection. However, systems were
offered the possibility of derogating specific questions and items if they considered they were not
suitable for their national context. Systems had to prepare a detailed explanation for each item they
wished to derogate and the request had to be approved by the OECD Secretariat and by the bureau
of the TALIS Governing Board. Only 2 of the 48 participating countries/economies requested a
derogation of items. Both of these requests were approved.

96
TALIS 2018 TECHNICAL REPORT © OECD 2019
Chapter 5. Sample design
The international target population for the Teaching and Learning International Survey
(TALIS) 2018 consisted of schools providing ISCED level 2 education (deemed the core
survey of TALIS) as defined by the International Standard Classification of Education
2011, as well as their principals and their teachers. Participating countries and economies
could also opt to survey primary (ISCED level 1) and upper secondary (ISCED level 3)
teachers. This chapter covers the sample design prepared for the TALIS 2018 countries
and economies. It also reviews the sampling strategies and the nominal sample sizes. TALIS
2018 participants who also took part in the OECD Programme for International Student
Assessment (PISA) 2018 had the option of implementing TALIS in the schools that
participated in PISA 2018. This international option is called the TALIS-PISA link.
The statistical data for Israel are supplied by and under the responsibility of the relevant Israeli authorities. The
use of such data by the OECD is without prejudice to the status of the Golan Heights, East Jerusalem and Israeli
settlements in the West Bank under the terms of international law.
97
TALIS 2018 TECHNICAL REPORT © OECD 2019
5.1. Overview
This chapter covers the sample design prepared for the countries/economies participating
in TALIS. It also reviews the sampling strategy and the sample size. The chapter focuses
solely on the standard international (the “core” survey) sampling plan. Strategies for
estimation of population characteristics and of their sampling error are detailed in
Chapter 9, while Annex E provides characteristics of each national sampling plan.
The TALIS 2018 Sampling Manual (internal document) provides a more comprehensive
description of the survey design and its recommended implementation. The salient points
of the survey design appear in the section of this chapter on the participating countries’ and
economies’ core survey (ISCED level 2)1 samples.
Participating countries/economies could opt to survey ISCED level 1 and ISCED level 3
teachers. Australia, the Flemish Community of Belgium, Ciudad Autónoma de Buenos
Aires (henceforth “CABA”, Argentina), Denmark, England (United Kingdom), France,
Japan, Korea, the Netherlands, Spain, Sweden, Chinese Taipei, Turkey, the United Arab
Emirates and Viet Nam chose to survey ISCED level 1 teachers. Alberta (Canada), Brazil,
Croatia, Denmark, Portugal, Slovenia, Sweden, Chinese Taipei, Turkey, the United Arab
Emirates and Viet Nam chose to survey ISCED level 3. Participating countries/economies
were also offered an international option, which was to administer the TALIS teacher
questionnaire to a sample of PISA teachers in a sample of schools selected for PISA 2018.
This linking of TALIS data and PISA student achievement data at the school level is known
as the TALIS-PISA link. CABA (Argentina), Colombia, the Czech Republic, Denmark,
Georgia, Malta, Turkey and Viet Nam elected to participate in this school-level option.
5.2. International sampling plan
The international sampling plan prepared for each of the TALIS 2018 teacher populations
was a stratified two-stage probability sampling design. This design meant that teachers
(second-stage units or secondary sampling units, abbreviated SSU) were randomly selected
from the list of in-scope teachers for each of the randomly selected schools (first-stage or
primary sampling units, abbreviated as PSUs).
The populations of interest comprised schools providing ISCED level 2 education, as well
as their principals and their teachers. TALIS adheres, for sampling purposes, to the OECD
international education statistics definition of a classroom teacher: “A classroom teacher is
defined as a person whose professional activity involves the planning, organising and
conducting of group activities whereby students’ knowledge, skills and attitudes develop
as stipulated by educational programmes” (OECD, 2004, p. p. 47[1]).
5.3. Target population and survey population: International requirements and
national implementations
The TALIS programme of surveys (the ISCED level 2 core survey and the options for
ISCED levels 1 and 3 and the TALIS-PISA link) aims to cover all teachers of a given
ISCED level in a participating country/economy. Because the programme’s identification
of policy issues encompasses the classroom, the teacher, the school and school
management, all subjects being taught in a school are within TALIS’s scope. As such, the
programme’s sampling coverage extends to all teachers of an ISCED level and to the
principals of the schools in which these teachers are working.

98
TALIS 2018 TECHNICAL REPORT © OECD 2019
Teachers at a given ISCED level are those who, as part of their regular duties in a target
school, provide instruction in programmes at that ISCED level. The TALIS populations of
interest also include teachers teaching a mixture of subjects at different levels in a sampled
school. This consideration applies no matter how much or how little teaching these teachers
are engaged in.
TALIS’s international target population restricts the survey to those teachers who teach in
“regular” schools and to the principals of those schools. Teachers teaching adults are not
part of the international target population and are therefore deemed “out of scope”; teachers
working with children with special needs are “in-scope” if they teach in regular schools.
However, when a school consists exclusively of these teachers, the school itself is said to
be out of scope. Teacher aides, pedagogical support staff (e.g. guidance counsellors,
librarians) and health and social support staff (e.g. doctors, nurses, psychiatrists,
psychologists, occupational therapists and social workers) are not considered teachers and
therefore cannot be part of TALIS.
Ideally, all the members of a target population should be admissible to sampling and data
collection, and this is the option that TALIS chose. As a consequence, the international
survey population (those who can be surveyed) is identical to the international target
population (those who should be surveyed).
For national reasons, participating countries/economies can choose to restrict the coverage
of their national implementation of TALIS to parts of the country/economy. For example,
a province or state experiencing civil unrest or an area that has recently been struck by a
natural disaster can be removed from the national target population to create a national
survey population. The TALIS sampling team asked participants to restrict these exclusions
to the greatest extent possible, for the reason given in the TALIS 2018 Sampling Manual:
“So as to maintain comparability and unbiasedness, exclusions should be kept to the strict
minimum and be justifiable. With only broad guidelines to help them, countries that
participated in the previous cycles of TALIS successfully managed to keep the proportion
of excluded teachers to less than 5%. A 5% threshold was thus adopted for this [third]
round of TALIS as an upper limit for the exclusion of teachers from the survey population”
(p. 11).
TALIS recognises that attempting to survey teachers in very small schools, that is, schools
with no more than three teachers at the ISCED level of interest, and those teaching in
schools located in geographically remote areas, can be costly, time-consuming and
statistically inefficient. Participating countries/economies can, therefore, excuse those
teachers from the TALIS data collection, thus creating a national survey population
different from the national target population. TALIS 2018 required the national project
manager (NPM) for each country/economy to document the reasons for exclusion, as well
as the size, location and clientele of each excluded school.
Ultimately, the TALIS 2018 samples of schools and teachers were selected from the
national survey population. Table 5.1 illustrates how the international and national survey
populations relate to one another. Note that Chapter 6 of this report covers the sampling of
teachers in the participating schools.
Annex D presents the national definitions of the TALIS 2018 target and survey populations
for each of the ISCED levels. NPMs provided this information on TALIS sampling forms,
templates of which can be found in Annex C.
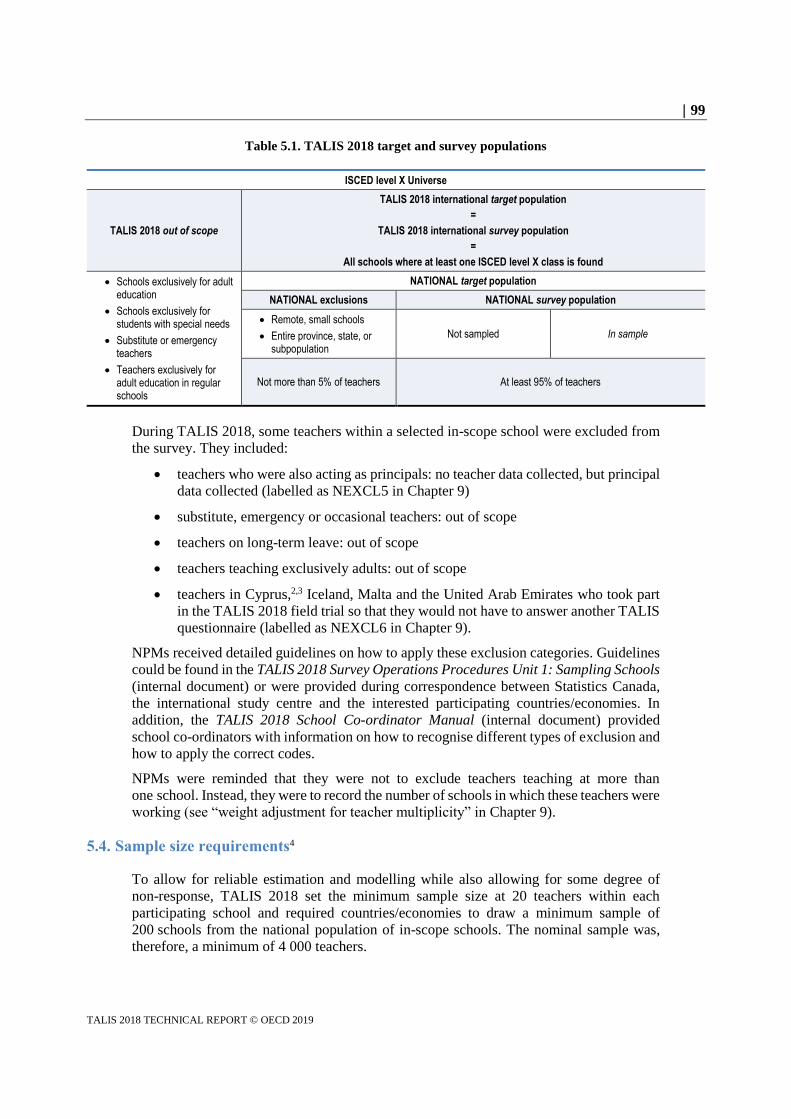
99
TALIS 2018 TECHNICAL REPORT © OECD 2019
Table 5.1. TALIS 2018 target and survey populations
ISCED level X Universe
TALIS 2018 out of scope
TALIS 2018 international target population
=
TALIS 2018 international survey population
=
All schools where at least one ISCED level X class is found
Schools exclusively for adult education
Schools exclusively for students with special needs
Substitute or emergency teachers
Teachers exclusively for adult education in regular schools
NATIONAL target population
NATIONAL exclusions NATIONAL survey population
Remote, small schools
Entire province, state, or subpopulation
Not sampled In sample
Not more than 5% of teachers At least 95% of teachers
During TALIS 2018, some teachers within a selected in-scope school were excluded from
the survey. They included:
teachers who were also acting as principals: no teacher data collected, but principal
data collected (labelled as NEXCL5 in Chapter 9)
substitute, emergency or occasional teachers: out of scope
teachers on long-term leave: out of scope
teachers teaching exclusively adults: out of scope
teachers in Cyprus,2,3 Iceland, Malta and the United Arab Emirates who took part
in the TALIS 2018 field trial so that they would not have to answer another TALIS
questionnaire (labelled as NEXCL6 in Chapter 9).
NPMs received detailed guidelines on how to apply these exclusion categories. Guidelines
could be found in the TALIS 2018 Survey Operations Procedures Unit 1: Sampling Schools
(internal document) or were provided during correspondence between Statistics Canada,
the international study centre and the interested participating countries/economies. In
addition, the TALIS 2018 School Co-ordinator Manual (internal document) provided
school co-ordinators with information on how to recognise different types of exclusion and
how to apply the correct codes.
NPMs were reminded that they were not to exclude teachers teaching at more than
one school. Instead, they were to record the number of schools in which these teachers were
working (see “weight adjustment for teacher multiplicity” in Chapter 9).
5.4. Sample size requirements4
To allow for reliable estimation and modelling while also allowing for some degree of
non-response, TALIS 2018 set the minimum sample size at 20 teachers within each
participating school and required countries/economies to draw a minimum sample of
200 schools from the national population of in-scope schools. The nominal sample was,
therefore, a minimum of 4 000 teachers.

100
TALIS 2018 TECHNICAL REPORT © OECD 2019
Teachers from the same school tend to share opinions and behave in similar ways more so
than teachers from different schools, cities or provinces in a given country/economy. This
tendency for two teachers from the same school to be “more alike” than two teachers from
different schools is called the “clustering effect” and it is measured, in single-stage designs,
by the intra-cluster correlation. In essence, the stronger the intra-cluster correlation, the
lower the number of sampled teachers needed from a school because one responding
teacher becomes a good predictor of the other teachers in that same school. In other words,
in a sample of 20 teachers from the same school, there are, in a sense, fewer than 20 original
data points. This outcome is a manifestation of the clustering effect or design effect, and
the larger the cluster, the larger the loss.
Those engaged in the preparation work for TALIS 2013 used an intra-cluster correlation
value of 0.3 as a working hypothesis, on the supposition that teachers are as homogeneous
as their students, this supposition accorded with the design of TALIS 2008. The team that
worked on the design of TALIS 2018 adopted the TALIS 2013 design, in conformity with
the Terms of Reference. The loss in sample size due to clustering, when added to the losses
due to non-response, reduced the nominal sample of 4 000 teachers to an effective sample
of approximately 400 as depicted in Table 5.2. Thus, the nominal sample of 4 000 teachers
obtained by the complex sampling design was equivalent to a simple random sample of
433 teachers.
Table 5.2. Establishing the sample size for TALIS 2018
Schools a 200
Teachers per school b 20
Total number of teachers c = a × b 4 000
School response rate d 75%
Teacher response within school e 75%
Overall response rate f = d × e 56%
Net number of responding teachers g = c × f 2 250
Intra-cluster correlation h 0.30
Design effect (deff) deff = 1 +{(e ×b)-1}×h 5.2
Effective sample = g / deff 433
The precision that is expected from the sample of 20 teachers in 200 schools is equivalent
to that of a simple random sample of 433 teachers selected from the (often unavailable)
national list of teachers. The expected margin of error for a simple random sample of this
size is ± (1.96) (1/√433) = ± 9.4%. Evidence from TALIS 2008 and TALIS 2013 shows
that, in most countries, clustering was not as great as anticipated. Hence, the achieved
precision in most countries and for most statistics was better than the expected 9.4%.
However, the requirements for the nominal sample for 2018 remained at the original level
to allow for easier tabulations at subnational levels and for more robust secondary analyses.
Participating countries/economies could choose to augment their national sample by
selecting more schools. Alternatively, they could select more teachers to increase the
within-school sample and thereby counterbalance the effect of selecting too many schools
with too few teachers.

101
TALIS 2018 TECHNICAL REPORT © OECD 2019
The sampling team reduced the sample size requirement for some participating
countries/economies because of the smaller number of schools available for sampling (see
Annex E, which presents the characteristics of the national samples). In the few cases where
the average number of teachers in the schools was lower than the number given in the
international plan, the sampling team asked for the number of schools sampled to be
increased to maintain a minimum total number of participating teachers.
5.5. National sampling strategies
Participating countries/economies could suggest variations to or adaptations of the
international sampling plan to better suit their national needs or conditions. All changes to
the international sampling plan had to be reviewed and approved by the sampling team.
5.5.1. Sampling frames
The sampling team at Statistics Canada asked participating countries/economies to give
them a current and complete list of schools providing education at the ISCED level of
interest. This list constituted the school sampling frame for TALIS and was expected to
correspond to the survey population as defined and described on the sampling forms.
The sampling frame had to contain certain key fields: a national school identifier, a measure
of size (preferably the number of teachers at the ISCED level of interest) and values for
those variables that would be used for stratification. Whenever possible, the frame also
needed to include the type of funding (private or public) and the type of education stream
(academic or vocational).
Additional sampling frames were required for the sampling of teachers, namely, the list of
admissible teachers at the ISCED level of interest in each selected school.
5.5.2. Stratification
The international sampling plan did not require stratification of the schools or of the
teachers within the selected schools. The sampling team invited participating
countries/economies that chose to implement some form of stratification (in order to answer
national requirements) to discuss their strategy with them.
Stratification could be done explicitly (whereby a fixed portion of the total sample is
allocated to the stratum) or implicitly (the variable is used to sort the sampling frame before
sample selection, thus giving, on average, a proportional representation of the implicit
strata in the sample).
In instances where explicit stratification was used, the participating country/economy and
the sampling team together determined the sample allocation scheme.
In most cases, stratification resulted in a combination of some or all of the details relating
to geography, source of financing, type of educational programme and school size.
Annex E (Tables 5.7 to 5.9) provides these details for each participating country/economy
and each ISCED level in which they participated.
5.5.3. Sample selection
The method used to select the school samples was systematic random sampling with
probability proportional to size (PPS) within explicit strata specified in the national
sampling plans. When implicit stratification was used, schools in explicit strata were sorted

102
TALIS 2018 TECHNICAL REPORT © OECD 2019
by implicit strata and measure of size (MOS) prior to sampling. Sampling frames were
always sorted by MOS prior to sampling, whether or not stratification was applied. Sorting
by MOS was done in a serpentine manner, which meant alternating increasing order and
decreasing order so that adjacent schools would be of similar sizes even across strata. This
approach is useful when creating replication zones for estimation of sampling error (see the
section in Chapter 9 on creating replicates for balanced repeated replication).
The mechanics of systematic random sampling with PPS can be described as follows. Let
M be the total MOS in an explicit stratum, let mi be the MOS for school i in the explicit
stratum and Mi be the cumulative sum of the school sizes up to and including school i, and
let n be the number of schools to be sampled from that explicit stratum. A sampling step k
is then computed as quotient Mn, and a starting point d is drawn at such that 1 d < k+1.
The sample is selected by walking steps of fixed length k along the (ordered) sampling
frame. As evident in Table 5.3 below, the point at which the step lands points to the school
to be added to the sample.
Whenever possible, the sample selection programme selected two replacement schools for
each sampled school: the school just above and the school just below the selected school
on the sampling frame sorted by MOS. The replacement schools had to come from the same
explicit stratum as the sampled school. The sampling team advised the use of this strategy
to help maintain the sample size and minimise the non-response biases that can occur when
schools with characteristics similar to those of the non-responding schools are used.
Schools selected for the original sample could not be selected as a replacement school.
To simplify and speed up the sampling process, the sampling team selected all samples of
schools.
At the end of school selection, the sampling team sent each participating country/economy
a copy of its school sampling frame, in which the selected schools were identified (marked
“S” for the original sample and marked “R1” and “R2” for the replacement schools) and
then given a standardised TALIS school identification number.
Table 5.3 illustrates how an ordinary spreadsheet can be used to implement systematic
random sampling with PPS. In this illustration, explicit stratum “A” consists of 12 schools
with a total MOS of 209 teachers. The sample needed from this stratum is n = 3 schools;
the sampling step k (209 ) = 69.7. Suppose that the random start is d = 49. The jth school
selected is then such that Mj-1 < d + (j-1) × k Mj, with M0 = 0 and j = 1, 2, 3. Here, for the
first selection, j = 1 and the pointer is 49 + (1-1) × 69.7 = 49. If j = 2, the pointer is at 49 +
(2-1) × 69.7 = 118.7 (rounded to 118), and finally the pointer is at 118.7 + 69.7 = 188.4
(rounded to 188). If available, replacement schools (the schools immediately before and
after a selected school) are assigned automatically; note that School 12 has no second
replacement.
The International Association for the Evaluation of Educational Achievement (IEA)
Hamburg provided each participating country/economy with the IEA Windows Within-
School Sampling Software (WinW3S) to help them create the sampling frames and sample
selection of teachers and to ensure compliance with the sample design and with furnishing
complete documentation.
Annex E presents the size of the sample of schools and of teachers for each participating
country/economy.

103
TALIS 2018 TECHNICAL REPORT © OECD 2019
Table 5.3. Illustration of systematic random sampling with PPS
National school ID
Explicit stratum Implicit stratum
MOS mi Cumulative
MOS Mi Sampling
step Pointer
Selections and
replacements
1 A 1 10 10
2 A 1 12 22
3 A 1 15 37 R1
4 A 1 17 54 1 49 S
5 A 2 20 74 R2
6 A 2 18 92
7 A 2 16 108 R1
8 A 2 16 124 2 118 S
9 A 3 15 139 R2
10 A 3 17 156
11 A 3 26 182 R1
12 A 3 27 M = 209 3 188 S
5.5.4. Sampling for the field trial
Between January and March 2017 and before the main data collection, each participating
country/economy conducted a field trial (FT). For that purpose, a sample of 20 schools
(plus their one replacement)5 was selected at the time of sample selection for the main
survey (MS). The simultaneous selection of the school samples for the FT and the MS
allowed some control of sample overlap and helped reduce response burden on
participating schools. When the number of schools in an explicit stratum was such that
overlap of FT and MS samples was unavoidable, the teachers who had taken part in the FT
could be excused from participation in the MS (see Chapter 9).
5.6. ISCED levels 2, 1 and 3 samples, by participating country and economy
The following three tables give an overview of the sampling plan for each participating
country/economy.
Table 5.4 covers the countries/economies that participated in ISCED level 2, Table 5.5
those countries/economies that participated in ISCED level 1 and Table 5.6 those
countries/economies that participated in ISCED level 3.
Table 5.4. Overview of the ISCED level 2 samples
Participating country/economy
Explicit stratification Number of ISCED
level 2 schools Number of ISCED level 2 teachers
School sample size Teacher sample expected size
Alberta (Canada)* Five types of school 1 019 138 297 200 4 000
Australia* Eight states x three sectors
2 536 125 251 305 6 100
Austria* Three types of school 1 495 35 054 279 5 580
Belgium* French Community, four types of funding, and Flemish Community
1 161 247 362 320 6 400
French Community (Belgium)*
French Community, four types of funding
440 115 725 120 2 400

104
TALIS 2018 TECHNICAL REPORT © OECD 2019
Participating country/economy
Explicit stratification Number of ISCED
level 2 schools Number of ISCED level 2 teachers
School sample size Teacher sample expected size
Flemish Community (Belgium)*
Flemish Community 721 131 637 200 4 000
Brazil Three types of institution
53 308 850 117 200 4 000
Bulgaria Two types of school 1 722 22 588 200 4 000
Chile Two types of institution
5 324 50 178 200 4 000
Ciudad Autónoma de Buenos Aires (Argentina)*
Two sectors x three SES indexes
488 84 762 150 3 000
Colombia* Two types of school x two locations
12 672 2 796 704 200 4 000
Croatia* Six regions 849 297 224 200 4 000
Cyprus1,2 n/a 99 4 400 99 1 980
Czech Republic Two types of school 2 616 39 441 220 4 400
Denmark* n/a 1 470 224 804 200 4 000
England (United Kingdom)*
Two types of funding x two school sizes x four locations
4 258 1 754 633 200 4 000
Estonia Two locations x two types of school
405 8 660 200 4 000
Finland* Five regions x two locations
714 170 799 150 3 000
France Three types of school x three degrees of urbanisation
6 828 209 069 200 4 000
Georgia Two locations x two types of funding
2 250 42 502 200 4 000
Hungary Seven regions x four types of community
2 759 37 812 200 4 000
Iceland* n/a 142 4 057 142 2 840
Israel* Three languages x three types of instruction
2 470 13 658 220 4 400
Italy Three territorial divisions x two types of school
5 720 153 981 200 4 000
Japan Three types of school x four locations
10 426 264 356 200 4 000
Kazakhstan Sixteen regions x two locations x two types of funding
6 386 206 668 333 6 660
Korea Seventeen regions 3 059 68 341 200 4 000
Latvia* Three types of school x four locations
692 87 799 150 3 000
Lithuania* Four locations 926 83 741 200 4 000
Malta n/a 61 3 255 61 1 220
Mexico Two types of funding x two types of school x two regions
16 722 328 554 200 4 000

105
TALIS 2018 TECHNICAL REPORT © OECD 2019
Participating country/economy
Explicit stratification Number of ISCED
level 2 schools Number of ISCED level 2 teachers
School sample size Teacher sample expected size
Netherlands* n/a 548 729 191 200 4 000
New Zealand* Five types of school x two sizes (teacher) x three decile groups
1 695 83 803 234 4 680
Norway Four municipality sizes
1 064 23 079 200 4 000
Portugal Five regions x two types of funding
1 257 36 613 200 4 000
Romania* Two regions 4 688 753 077 200 4 000
Russian Federation Fourteen regions 9 810 214 855 230 4 600
Saudi Arabia Two types of gender x 13 regions
6 266 99 766 200 4 000
Shanghai (China) Two locations x two types of funding
650 41 365 200 4 000
Singapore Two types of funding 193 12 085 169 3 380
Slovak Republic Two types of school x two types of location
1 581
24 821
200
4 000
Slovenia n/a 448 9 048 150 3 000
South Africa Nine provinces x two sectors
9 312 200 192 200 4 000
Spain Eighteen autonomous communities x two types of school for Comunidad de Madrid
6 909 200 092 399 7 980
Sweden* Two school levels x two school types
1 708 309 277 200 4 000
Chinese Taipei* Two school levels x two types of funding x three townships x two types of school
932 59 871 203 4 060
Turkey Two types of school (state and private) x 12 regions for state
16 228 310 932 200 4 000
United Arab Emirates Three regions x four school levels
563 17 191 563 11 260
United States* Two types of funding x three grade structures
63 226 12 061 144 220 4 400
Viet Nam Two school levels x three zones x two types of funding
10 821 303 018 200 4 000
n/a : not applicable.
* Measure of size (MOS) is not number of teachers.
1. Note by Turkey: The information in this document with reference to “Cyprus” relates to the southern part of the Island. There
is no single authority representing both Turkish and Greek Cypriot people on the Island. Turkey recognises the Turkish Republic
of Northern Cyprus (TRNC). Until a lasting and equitable solution is found within the context of the United Nations, Turkey shall
preserve its position concerning the “Cyprus issue”.
2. Note by all the European Union Member States of the OECD and the European Union: The Republic of Cyprus is recognised
by all members of the United Nations with the exception of Turkey. The information in this document relates to the area under the
effective control of the Government of the Republic of Cyprus.

106
TALIS 2018 TECHNICAL REPORT © OECD 2019
Table 5.5. Overview of the ISCED level 1 samples
Participating country/economy
Explicit stratification Number of ISCED
level 1 schools Number of ISCED level 1 teachers
School sample size Teacher sample expected size
Australia n/a 2 234 423 017 200 4 000
Flemish Community (Belgium)*
Two school types x three townships
2 655 14 362 201 4 020
Ciudad Autónoma de Buenos Aires (Argentina)*
6 states, two territories x three sectors
6 510 137 886 299 5 980
Denmark* Two types of funding x two sizes x four geographic regions
18 144 3 901 692 200 4 000
England (United Kingdom)*
Three type of schools x three degrees of urbanisation
32 926 4 006 439 200 4 000
France* Four school locations 20 333 385 923 200 4 000
Japan Seventeen geographical regions
5 611 116 066 200 4 000
Korea n/a 6 337 110 869 251 5 020
Netherlands Eighteen autonomous communities x two school levels for Cantabria and La Rioja communities
13 275 286 462 444 8 880
Spain Two school levels x two school types
4 261 667 183 200 4 000
Sweden* Two school types (state and private) x 12 regions for state
24 755 289 681 200 4 000
Chinese Taipei Two school levels 1 694 462 225 200 4 000
Turkey Three regions x four school levels
588 21 646 588 11 760
United Arab Emirates Three zones x six regions x two types of funding
15 143 394 935 201 4 020
Viet Nam Two school levels x three SES indexes
878 243 034 200 4 000
n/a : not applicable.
* Measure of size (MOS) is not number of teachers.
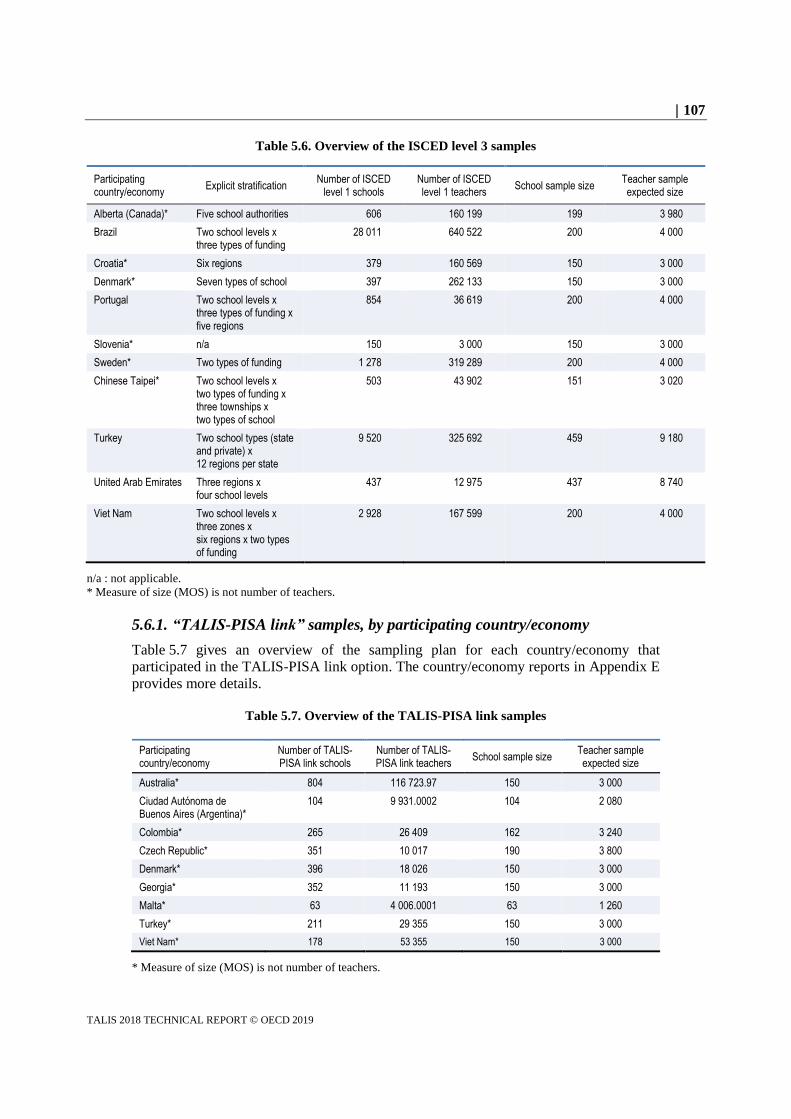
107
TALIS 2018 TECHNICAL REPORT © OECD 2019
Table 5.6. Overview of the ISCED level 3 samples
Participating country/economy
Explicit stratification Number of ISCED
level 1 schools Number of ISCED level 1 teachers
School sample size Teacher sample expected size
Alberta (Canada)* Five school authorities 606 160 199 199 3 980
Brazil Two school levels x three types of funding
28 011 640 522 200 4 000
Croatia* Six regions 379 160 569 150 3 000
Denmark* Seven types of school 397 262 133 150 3 000
Portugal Two school levels x three types of funding x five regions
854 36 619 200 4 000
Slovenia* n/a 150 3 000 150 3 000
Sweden* Two types of funding 1 278 319 289 200 4 000
Chinese Taipei* Two school levels x two types of funding x three townships x two types of school
503 43 902 151 3 020
Turkey Two school types (state and private) x 12 regions per state
9 520 325 692 459 9 180
United Arab Emirates Three regions x four school levels
437 12 975 437 8 740
Viet Nam Two school levels x three zones x six regions x two types of funding
2 928 167 599 200 4 000
n/a : not applicable.
* Measure of size (MOS) is not number of teachers.
5.6.1. “TALIS-PISA link” samples, by participating country/economy
Table 5.7 gives an overview of the sampling plan for each country/economy that
participated in the TALIS-PISA link option. The country/economy reports in Appendix E
provides more details.
Table 5.7. Overview of the TALIS-PISA link samples
Participating country/economy
Number of TALIS-PISA link schools
Number of TALIS-PISA link teachers
School sample size Teacher sample expected size
Australia* 804 116 723.97 150 3 000
Ciudad Autónoma de Buenos Aires (Argentina)*
104 9 931.0002 104 2 080
Colombia* 265 26 409 162 3 240
Czech Republic* 351 10 017 190 3 800
Denmark* 396 18 026 150 3 000
Georgia* 352 11 193 150 3 000
Malta* 63 4 006.0001 63 1 260
Turkey* 211 29 355 150 3 000
Viet Nam* 178 53 355 150 3 000
* Measure of size (MOS) is not number of teachers.

108
TALIS 2018 TECHNICAL REPORT © OECD 2019
Reference
OECD (2015), “ISCED 2011 Level 2: Lower secondary education”, in ISCED 2011
Operational Manual: Guidelines for Classifying National Education Programmes and
Related Qualifications, OECD Publishing, Paris, https://dx.doi.org/10.1787/9789264228368-
6-en.
[2]
OECD (2004), OECD Handbook for Internationally Comparative Education Statistics:
Concepts, Standards, Definitions, and Classifications, OECD Publishing, Paris,
https://doi.org/10.1787/9789264279889-en.
[1]
Notes
1 As defined by the International Standard Classification of Education 2011 (OECD, 2015[2]),
2 Note by Turkey: The information in this document with reference to “Cyprus” relates to the
southern part of the Island. There is no single authority representing both Turkish and Greek Cypriot
people on the Island. Turkey recognises the Turkish Republic of Northern Cyprus (TRNC). Until a
lasting and equitable solution is found within the context of the United Nations, Turkey shall
preserve its position concerning the “Cyprus issue”.
3 Note by all the European Union Member States of the OECD and the European Union: The
Republic of Cyprus is recognised by all members of the United Nations with the exception of
Turkey. The information in this document relates to the area under the effective control of the
Government of the Republic of Cyprus.
4 Requirements for ISCED level 1 and ISCED level 3 were identical to those imposed for ISCED
level 2; the nominal sample size for the TALIS-PISA link was set at 150 schools, which is the PISA
requirement.
5 Only one replacement school was selected for the field trial to minimise the overlap with the sample
for the main survey. Schools for the field trial of the TALIS-PISA link component were selected by
convenience.

109
TALIS 2018 TECHNICAL REPORT © OECD 2019
Chapter 6. Field operations procedures
This chapter summarises the procedures and outcomes of the TALIS 2018 field operations.
It focuses on the areas of work within national centres, which included contacting schools,
performing the within-school sampling, and monitoring the collection of data for the
International Standard Classification of Education (ISCED) level 2 core and eventual
additional international options of the TALIS 2018 main survey.
The chapter also references the materials and software that the international study centre
(ISC) gave all national study centres.1
The overall administration of TALIS 2018 in all participating countries/economies was
very successful. No mayor obstacles were encountered and the field-operation procedures,
as defined and communicated by the ISC, were met.2
Although the procedures described in this chapter focus on the administration of the ISCED
level 2 core survey, they also apply to the international ISCED level 1, ISCED level 3 and
the TALIS-PISA link options. The ISC asked all participating countries/economies to follow
the standards and procedures and made it clear that deviations from these would only be
allowed in certain cases and if discussed and agreed with the TALIS Consortium and the
OECD.
The statistical data for Israel are supplied by and under the responsibility of the relevant Israeli authorities. The
use of such data by the OECD is without prejudice to the status of the Golan Heights, East Jerusalem and Israeli
settlements in the West Bank under the terms of international law.
110
TALIS 2018 TECHNICAL REPORT © OECD 2019
6.1. Technical standards, manuals and software
During all phases of the survey, the national study centres adhered to the standardised
procedures prepared by the international study centre (ISC) and its consortium partners.
These procedures were outlined in the following documents, which the ISC released to the
national study centres before the field trial and then updated for the main survey (except
for the technical standards). To note, apart from the technical standards, these are all
internal documents:
TALIS 2018 Technical Standards (see Annex B): The ISC released the final version
prior to the main survey (MS) after the TALIS Governing Board (TGB) approved
the standards during its third meeting in June 2017. The technical standards covered
ten main topics,3 ranging from survey ethics, confidentiality and survey operations
to quality observation and data management.
TALIS 2018 National Project Managers’ Manual: The purpose of this manual was
to provide national project managers (NPMs) with an overview of TALIS, detail
the tasks NPMs and national study centres were to carry out, and give information
about key milestones and deliveries. The ISC provided detailed information about
national instrument production and survey operations in separate guideline
documents.
Survey Operations Procedures Unit 1: Sampling Schools: Statistics Canada
prepared this manual, which defined the target population of teachers for all of the
ISCED levels and the TALIS-PISA link. The manual also described how to prepare
and implement a national sampling plan, how to prepare the school sampling frame
and how to select the school sample. The manual’s annexes provided thorough
instruction on how to handle the samples for the different international options.
Survey Operations Procedures Unit 2: Working with Schools: As indicated by its
title, this manual addressed guidelines for obtaining and increasing co-operation of
schools, with the emphasis placed on public relations strategies. It also described
how to adapt the School Co-ordinator Manual to the national context and explained
details of instrument shipping and quality-control measures.
School Co-ordinator Manual: This manual was intended for school co-ordinators
(SCs). Each SC was the main contact person for the national study centre in each
school. The person fulfilling the role of SC was often a teacher or a principal of the
school participating in TALIS. The ISC released one template of the School Co-
ordinator Manual for participating countries/economies doing paper-only
administration and one template for those administering the survey solely on line
or in a mixed mode (paper and online administration). The manual described, in
detail, the steps for listing and tracking teachers and for organising the survey
administration on site. NPMs were responsible for translating the manual into their
survey administration language(s) and for adding national information where
necessary. Responsibility for translations and adaptations rested solely with the
NPMs. The ISC asked international quality observers (IQOs) to make sure the
NPMs used the correct template (see Chapter 7 for more details on quality
assurance).
Survey Operations Procedures Unit 3: Instrument Preparation: This manual
provided the national study centres with instructions on how to produce
internationally comparable national versions of the released international survey

111
TALIS 2018 TECHNICAL REPORT © OECD 2019
instruments. It gave detailed descriptions of the different verification steps
(adaptation, translation, layout) included in the process.
Survey Operations Procedures Unit 4: Data Collection and Quality Control: This
manual informed national study centres on how to prepare for and support data
collection in schools. The information included detailed explanations on the listing
and within-school sampling of teachers, on assigning and administrating the
instruments, and on tracking and monitoring the quality of the data collection.
Survey Operations Procedures Unit 5: Data Capture Procedures: The ISC used
this document to describe how to work with the IEA Data Management Expert
(DME) software, which was used to capture and verify data received on paper.
National Quality Observer Manual: Prepared by the IEA Amsterdam, this manual
showed NPMs how to conduct a national quality control programme. These
procedures related closely to those used by international observers. However,
NPMs were free to adapt the manual and procedures according to their needs.
International Quality Observer Manual: The IEA Amsterdam prepared this
document and delivered it directly to the international quality observers, all of
whom were contracted by the IEA. The manual outlined the tasks the observers
needed to complete in order to check the quality of the survey operation procedures
within the participating countries/economies. The observers had to visit the national
study centres and schools in order to interview not only the NPMs and national
teams but also the school co-ordinators. Observers documented the results of their
visits in an online survey called the “school visit record”.
Note on the Investigation of Non-response Bias: Prepared by Statistics Canada, this
document explained how to investigate the extent of agreement between the
characteristics of the sample (at the school and teacher level) and independently
available population statistics. Whether participating countries/economies had to
carry out this analysis depended on the participation rate. The consortium asked
study centres to provide this additional information only in those instances where
the data collection had yielded less than the minimally required 75% rate for school
participation after replacement but had still encompassed at least 50% of the
original sample of schools.
In addition to providing the manuals and documents described, the ISC gave NPMs
three main software packages to assist with data collection:
The IEA Windows Within-School Sampling Software (WinW3S): This software
package helped the national data managers prepare the survey listing forms, qualify
and randomly sample teachers in selected schools, and produce tracking forms for
the sampled individuals. The software stored all tracking data in a single database
so that this information could later be used to verify the integrity of the sampling
procedures, to verify the completeness of the response data and (eventually) to
compute sampling weights and participation rates.
The IEA Data Management Expert (DME) software: The DME software enabled
national study centre staff to capture the data through keyboard data entry and to
perform a range of validity checks on the entered data. The DME databases
included codebooks for each of the questionnaires, thus providing all the
information necessary for producing data files for each instrument that adhered to
the standard international format (see Chapter 8 for more details).

112
TALIS 2018 TECHNICAL REPORT © OECD 2019
A third software package, the IEA Online Survey System (OSS), helped the ISC prepare the
questionnaires for online administration. During this process, the ISC asked the
participating countries/economies to review the prepared online questionnaires via the
Internet. The web-based monitor component of the OSS allowed national centres to audit
participation in real-time and to follow up those schools that returned incomplete
questionnaires or did not return questionnaires.
During meetings with the NPMs, the ISC described and explained the field operation
procedures outlined in the manuals and guidelines and provided guidance on how to use
the software packages. Representatives of the national study centres also had to participate
in hands-on training sessions to practise the correct handling of the software and some
procedures. If any queries or concerns regarding procedures, guidelines or software
emerged during implementation, the ISC was available to support the national centres and
help them find appropriate solutions.
6.2. Administering the TALIS core and additional international options
TALIS 2018 mandated all participating countries/economies to administer the ISCED
level 2 core survey of teachers and their principals. In addition, countries/economies could
participate in one or more of the international options (Table 1.1 in Chapter 1) an overview
of the distribution of options across the participating countries/economies, while Chapter 4
outlines the development of the national survey instruments for the different options). If
countries/economies opted to administer TALIS at an additional ISCED level or to
administer the TALIS-PISA link, the ISC instructed them to prioritise the ISCED level 2
core survey. This mandate applied to national instrument production as well as to data
collection and data processing.4
For those countries/economies that decided to administer one or more of the international
options, this work, which had to be conducted alongside production of the national ISCED
level 2 instrument, presented an extra layer of complexity. The ISC, therefore, stressed the
importance of each of these countries/economies following an agreed individualised survey
preparation schedule. These schedules made it possible to monitor progress, plan for staff
resources and ensure a smooth workflow between the national study centres and the ISC.
Unlike countries/economies belonging to the Northern Hemisphere, some
countries/economies in the Southern Hemisphere had only about six to eight weeks to get
all survey instruments and materials ready in time for the start of survey administration,
which had to occur in the interval from the middle to the end of September/beginning of
October 2017. Some countries/economies extended their data collection into January 2018
as an exception.
Table 6.1 gives an overview of the official data collection windows and the time period
dedicated to instrument preparation for both hemispheres.

113
TALIS 2018 TECHNICAL REPORT © OECD 2019
Table 6.1. Instrument preparation time
School schedule Preparation time for instruments Official main survey data collection
window
Southern Hemisphere 15 August to 30 September 2017 1 September to 15 December 2017
Northern Hemisphere 15 August to 28 February 2018 1 March to 31 May 2018
Due to the tight timelines for the Southern Hemisphere countries/economies, the ISC
delivered the School Co-ordinator Manual earlier than scheduled to those national study
centres that requested it. The ISC also released instruments and some manuals and forms
earlier than originally scheduled, that is, on 1 August 2017 rather than on 15 August. In
addition, the ISC treated Australia, Brazil, Chile, Ciudad Autónoma de Buenos Aires
(Argentina), Colombia, Korea, New Zealand and Singapore as high-priority and scheduled
exclusive time during August and September 2017 for verifying their survey instruments.
Data collection for Northern Hemisphere countries was mainly from March to May 2018
(with some participants starting early in January and February and some extending into
July 2018). In the Northern Hemisphere, schedules and procedures for Denmark, Turkey
and Viet Nam were particularly complex because these countries decided to administer all
of the international options. That decision resulted in 16 instruments across the options: 4
teacher questionnaires, 4 principal questionnaires, 4 teacher cover letters and 4 principal
cover letters.
Spain administered the survey in 5 different languages, which resulted in 20 instruments
(teacher questionnaire, principal questionnaire, teacher cover letter and principal cover
letter for each language). Spain also decided, in early 2017, to join the ISCED level 1
option, which meant it had to conduct a late field trial (FT) in September/October 2017.
Because administration of the Spanish FT coincided with preparation for the Spanish MS,
this work was particularly challenging for all parties involved. France, meanwhile, had to
administer a second FT in October/November 2017 in order to trial a set of politically
sensitive questions that it had not been able to administer during the original FT in the
spring of 2017.
Saudi Arabia and South Africa had very demanding schedules as well. South Africa
decided to join TALIS in September 2017 and therefore had to conduct its FT in
March 2018 and administer its MS in August-October 2018 in line with a Southern
Hemisphere schedule. Saudi Arabia administered its FT in March 2018, followed shortly
after by administration of its MS in May 2018.
Then there were participating countries/economies for which instrument preparation was
relatively straightforward and timelines were comfortable. These countries/economies,
(e.g. Estonia, Hungary, the Russian Federation) opted to administer only the ISCED level 2
core survey and in one national language only.
6.3. Contacting schools and within-school sampling procedures
Statistics Canada sent each NPM a selected school sample based on the sampling frame the
NPM had already submitted (see Chapter 5 for more details on school sampling). In order
to achieve the highest possible participation rates at the school level, Statistics Canada
sampled two replacement schools (assuming such schools were available) in addition to
each originally sampled school.

114
TALIS 2018 TECHNICAL REPORT © OECD 2019
Once NPMs received their sample, the national study centres began contacting the
designated schools. National study centres usually adhered to the technical standards and
only contacted their first replacement school if one of the originally sampled schools
declined participation. If this replacement school also refused participation, NPMs
approached their second replacement school.
Two participating countries (the Netherlands and the United States) applied another process
so as to achieve the required participation rates, namely contacting all schools at the same
time. If the original school and the replacement school both agreed to participate in the
survey, the replacement school was marked as a national school. However, because this
procedure represented a deviation from Technical Standard 5.5, national schools were not
included during computation of the participation rates, conducted as part of the data
adjudication process. Further mention of the adjudication procedure appears in the
discussion in Chapter 10 on data adjudication.
National study centres that administered the survey in 1 or more of the international options
generally had to handle, in parallel, up to 750 schools (including the 200 for the core
survey).5 These centres, therefore, had to plan their resources carefully to meet the
requirements of the multiple tasks associated with this complex survey design.
Most of the participating countries/economies asked each school to nominate a school
co-ordinator to be responsible for carrying out all TALIS-related tasks within the school.
In many cases, the school co-ordinators were principals or another school management
team member. Nearly 50% of the national study centres said that a member of the
management team other than the principal took on this responsibility. Nearly 40% of the
study centres noted that teachers filled the role of school co-ordinators. Only one national
study centre hired an external agency and only one centre hired external staff (e.g. retired
principals or experienced assessment co-ordinators) to complete the tasks.
Close co-operation between school co-ordinators and national study centres was crucial
during all steps of teacher listing, teacher sampling and survey administration. To facilitate
smooth communication, several countries/economies established hotlines, special email
accounts, or websites and online platforms.
6.3.1. Identification number, teacher listing forms and teacher tracking forms
Information about teachers was gathered through the teacher listing form (TLF) and teacher
tracking form (TTF; see Annex F for more information on these two forms). National study
centres used the IEA WinW3S software to produce the forms. WinW3S created
hierarchical four-digit identification numbers that uniquely identified the sampled schools
within each participating country/economy. This number was also the identification code
assigned to the person answering the principal questionnaire. Teacher identification codes
were derived from the school codes by adding two additional digits at the end of the school
identifier, a process that created a hierarchical link between schools and teachers.
In accordance with the instructions in the School Co-ordinator Manual, school
co-ordinators listed each eligible teacher and his or her name, followed by a sequential
number, exemption information, year of birth, gender and main subject domain. Nearly
one-third of the NPMs reported that data protection/confidentiality laws and rules
prevented them from providing teachers’ names. These participating countries/economies,
therefore, used only numbers or codes.
Schools could choose up to a maximum of five main subject domains: language, human
sciences, mathematics and science, other, and not specified. Classifying teachers into the

115
TALIS 2018 TECHNICAL REPORT © OECD 2019
domains was sometimes a demanding task, requiring close co-operation between the school
co-ordinators and their respective national study centres. Although the TALIS core survey
targeted ISCED level 2 teachers, not every teacher teaching at this level was within scope.
Out-of-scope teachers included teachers entirely devoted to adult education; substitute,
emergency or occasional teachers; teachers on long-term leave; teacher aides; pedagogical
support staff; and health and social support staff. Teachers who were also the school
principal, as well as teachers who took part in the FT, were exempted from participation
but they still had to be included on the TLF (for more details on school sampling, see
Chapter 5).
The national study centres entered information from the TFLs into WinW3S and then drew
the random within-school teacher sample of 20 teachers per school.6 After completion of
the within-school sampling, WinW3S created TTFs that listed all sampled teachers. The
national study centres sent the TTFs to schools so that school co-ordinators knew which
teachers should receive the instruments.
The TTFs were also used to monitor the participation status of the sampled teachers and
therefore included teacher names, teacher ID, year of birth, gender, main subject domain
and teacher questionnaire mode (online or paper). Each TTF furthermore contained a
column that allowed the national study centres to document the teacher questionnaire return
status for paper administration and a column in which the centres could enter data
availability information from the online data collection. Because the form provided school
co-ordinators with a roster of selected teachers, they could also use the form to identify
which teachers within schools they needed to follow up via email or telephone.
The national study centres sent copies of the TTFs, each of which included teacher IDs but
not teacher names, to the ISC together with the survey data. Because the names on the TTFs
could be cut off, all names were kept confidential. Annex F contains a blank TFL and TTF.
6.3.2. Assigning materials to teachers and school principals
The ISC asked each school principal to complete one principal questionnaire. The school
co-ordinator assigned a teacher questionnaire to each teacher listed on the TTFs (see
Chapter 5 for more details on school sampling).
The national study centre then sent each school co-ordinator a package containing all cover
letters for online administration or paper administration as well as the TTFs and any other
relevant briefing materials. To address confidentiality concerns, several
countries/economies chose to provide teachers with pre-paid envelopes that they could send
directly to their respective national study centre rather than to the school co-ordinator.
Figure 6.1 outlines the different responsibilities of each national study centre and school
co-ordinator with regard to the correct assignment of questionnaires to teachers.

116
TALIS 2018 TECHNICAL REPORT © OECD 2019
Figure 6.1. Responsibilities of national study centres and the school co-ordinator during
survey administration
6.4. Administering the questionnaires and conducting national quality observations
The ISC asked each participating country/economy to select its own timeframe for survey
administration, but within the internationally prescribed time period at the end of the school
year. For Southern Hemisphere countries/economies, the internationally prescribed time
for the MS was between 1 October and 15 December 2017. However, some
countries/economies started in September, while others extended their data collection into
January 2018. For the Northern Hemisphere countries/economies, the prescribed time was
between 1 March 2018 and 31 May 2018, but some countries/economies started in January
and February, while others extended into July 2018 as an exception. National study centres
had to discuss any deviations from these periods with the ISC and gain the ISC’s approval
for them. The only deviations exempt from this process were those for South Africa, which
operated under a shifted survey schedule.
Table 6.2 documents the data collection windows as they were originally planned, as well
as changes to them. The table also highlights the dates that fell outside the internationally
1. Contacting participating schools
2. Preparing TFLs to be completed by schools
National study centre activity School co-ordinator activity
3. Completing the TFL, listing all eligible, in-scope
teachers within schools
4. Sampling at least 20 teachers per school using the information on the TFL
5. Preparing TTFs for administration of the teacher
cover letters/questionnaires
7. Communicating with the national study centre about participation status within the school
8. After administration of questionnaires, recording the return status of the paper questionnaires on the TTF
9. If applicable, sending completed questionnaires
back to the national study centre
10. Documenting participation of teachers and principals in WinW3S according to information on the TTFs and the IEA OnlineSurveySystem Monitor
SURVEY ADMINISTRATION
6. Administering the cover letters/ questionnaires to
principals and teachers
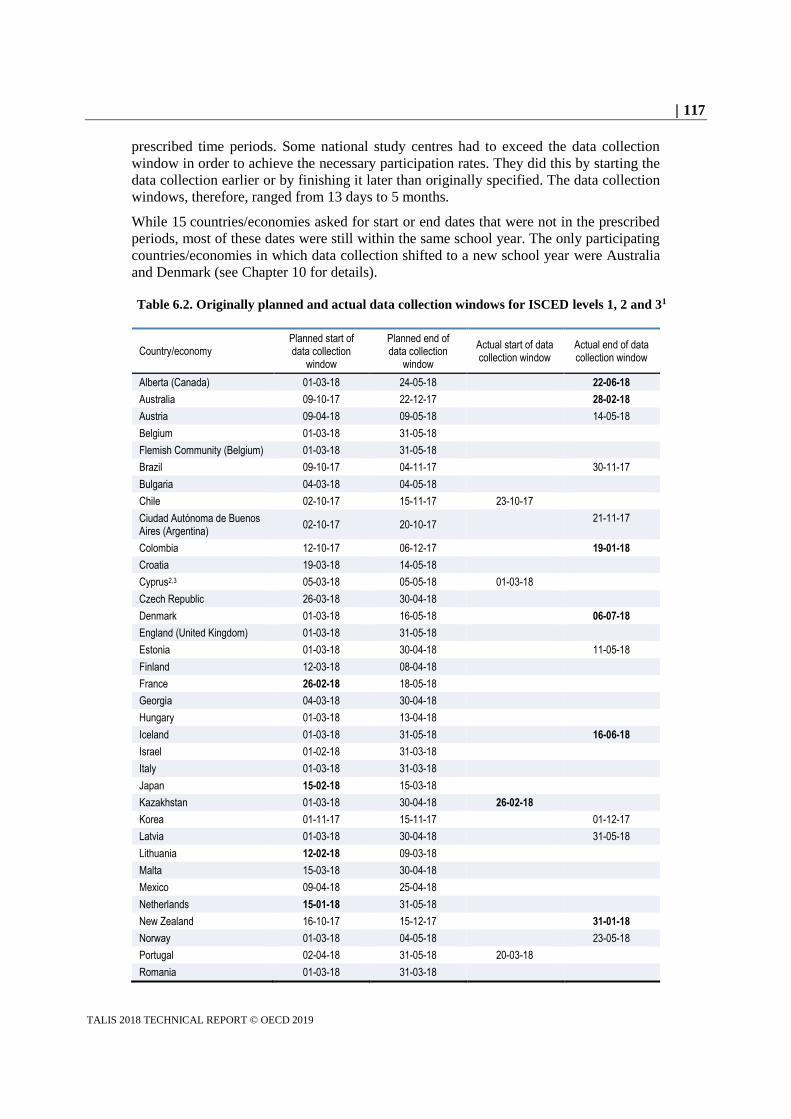
117
TALIS 2018 TECHNICAL REPORT © OECD 2019
prescribed time periods. Some national study centres had to exceed the data collection
window in order to achieve the necessary participation rates. They did this by starting the
data collection earlier or by finishing it later than originally specified. The data collection
windows, therefore, ranged from 13 days to 5 months.
While 15 countries/economies asked for start or end dates that were not in the prescribed
periods, most of these dates were still within the same school year. The only participating
countries/economies in which data collection shifted to a new school year were Australia
and Denmark (see Chapter 10 for details).
Table 6.2. Originally planned and actual data collection windows for ISCED levels 1, 2 and 31
Country/economy Planned start of data collection
window
Planned end of data collection
window
Actual start of data collection window
Actual end of data collection window
Alberta (Canada) 01-03-18 24-05-18 22-06-18
Australia 09-10-17 22-12-17 28-02-18
Austria 09-04-18 09-05-18 14-05-18
Belgium 01-03-18 31-05-18
Flemish Community (Belgium) 01-03-18 31-05-18
Brazil 09-10-17 04-11-17 30-11-17
Bulgaria 04-03-18 04-05-18
Chile 02-10-17 15-11-17 23-10-17
Ciudad Autónoma de Buenos Aires (Argentina)
02-10-17 20-10-17 21-11-17
Colombia 12-10-17 06-12-17 19-01-18
Croatia 19-03-18 14-05-18
Cyprus2,3 05-03-18 05-05-18 01-03-18
Czech Republic 26-03-18 30-04-18
Denmark 01-03-18 16-05-18 06-07-18
England (United Kingdom) 01-03-18 31-05-18
Estonia 01-03-18 30-04-18 11-05-18
Finland 12-03-18 08-04-18
France 26-02-18 18-05-18
Georgia 04-03-18 30-04-18
Hungary 01-03-18 13-04-18
Iceland 01-03-18 31-05-18 16-06-18
Israel 01-02-18 31-03-18
Italy 01-03-18 31-03-18
Japan 15-02-18 15-03-18
Kazakhstan 01-03-18 30-04-18 26-02-18
Korea 01-11-17 15-11-17 01-12-17
Latvia 01-03-18 30-04-18 31-05-18
Lithuania 12-02-18 09-03-18
Malta 15-03-18 30-04-18
Mexico 09-04-18 25-04-18
Netherlands 15-01-18 31-05-18
New Zealand 16-10-17 15-12-17 31-01-18
Norway 01-03-18 04-05-18 23-05-18
Portugal 02-04-18 31-05-18 20-03-18
Romania 01-03-18 31-03-18

118
TALIS 2018 TECHNICAL REPORT © OECD 2019
Country/economy Planned start of data collection
window
Planned end of data collection
window
Actual start of data collection window
Actual end of data collection window
Russian Federation 20-03-18 28-05-18 11-06-18
Saudi Arabia 01-03-18 10-05-18
Shanghai (China) 01-03-18 20-04-18 16-04-18
Singapore 14-09-17 17-11-17
Slovak Republic 30-04-18 18-05-18
Slovenia 15-03-18 18-04-18 07-03-18
South Africa 01-08-18 10-10-18
Spain 01-03-18 20-04-18 31-05-18
Sweden 01-03-18 30-04-18 18-05-18
Chinese Taipei 01-04-18 31-05-18 15-04-18
Turkey 01-03-18 31-03-18 15-03-18
United Arab Emirates 15-05-18 31-05-18 01-02-18 15-04-18
United States 01-03-18 31-05-18
Viet Nam 01-03-18 31-05-18
1. The TALIS-PISA link was administered together with all the other ISCED levels in TALIS and in parallel
or shortly after the PISA main survey in the Northern Hemisphere countries/economies. The Southern
Hemisphere countries/economies (Australia and Ciudad Autónoma de Buenos Aires [Argentina]) administered
PISA and therefore the TALIS-PISA link on a shifted schedule between September and November 2018.
2. Note by Turkey: The information in this document with reference to “Cyprus” relates to the southern part of
the Island. There is no single authority representing both Turkish and Greek Cypriot people on the Island.
Turkey recognises the Turkish Republic of Northern Cyprus (TRNC). Until a lasting and equitable solution is
found within the context of the United Nations, Turkey shall preserve its position concerning the “Cyprus
issue”.
3. Note by all the European Union Member States of the OECD and the European Union: The Republic of
Cyprus is recognised by all members of the United Nations with the exception of Turkey. The information in
this document relates to the area under the effective control of the Government of the Republic of Cyprus.
Bolded dates highlight dates that fell outside the internationally prescribed periods.
The end of the school year was purposely selected for administering the survey to guarantee
comparability of collected data. During this period, principals and teachers were free to fill
in the questionnaires whenever they chose. The overall target was 100% within-school
participation. A school was considered to be a participating school if at least 50% of the
sampled teachers returned their completed questionnaires.
To maintain high survey standards, the ISC expected the national study centres to run a
national quality control programme. The ISC provided a manual template for national
quality observers (NQOs); however, NPMs could elect to arrange their own programme.
NQOs could perform their national quality observations partly on the phone and partly
during school visits, but the ISC also required each NQO to personally visit at least
ten schools.
Some participating countries/economies chose national study centre staff to carry out the
NQO programme, whereas others appointed external personnel, such as researchers
interested in large-scale assessments, representatives of government agencies involved in
education and retired principals. After the TALIS MS had been administered, NPMs
reported the outcomes of the national quality control work in the survey activities
questionnaire. Chapter 7 provides a discussion of these outcomes. The IEA Amsterdam
was responsible for organising the international quality observation work; their role in this
regard is also outlined in Chapter 7.

119
TALIS 2018 TECHNICAL REPORT © OECD 2019
6.5. Monitoring the online questionnaires
Monitoring the administration of the survey was a demanding task for the school
co-ordinators, especially if data protection laws prevented them from using the online
monitor of the OSS or if teachers could send completed paper questionnaires directly to
their national study centre. In these instances, school co-ordinators relied on national study
centres to inform them of the need to follow up pending questionnaires.
National study centres monitored completion of the online questionnaires (see Chapter 8
for more details),and NPMs communicated completion status to school co-ordinators.
Countries/economies were free to manage this procedure according to their needs. Most
national study centres preferred regular email and/or telephone exchanges between the
school co-ordinators and themselves. Other centres either contacted respondents directly
using email or instant messaging, set up banners on websites, prepared reminder leaflets
for teachers and schools, asked union members to call schools or created national TALIS
websites where school co-ordinators could log on individually to access all necessary
information. Some national study centres granted school co-ordinators access to the
monitor so that they could organise the follow-up procedures themselves.
The monitoring work also included a participation-rate estimation tool that kept data
managers up to date on their current participation rate according to the already returned
paper questionnaires or submitted online questionnaires.
After the survey had been administered, each national study centre exported the
questionnaire data availability status from the OSS. National study centre personnel then
imported this participation information, as well as the participation information from the
DME with respect to administration of the paper questionnaire, into WinW3S, a practice
that enabled the national study centres to verify the participation status of each sampled
respondent. The ISC told each national centre that it was mandatory for them to verify
participation before they submitted data to the consortium, a process that all TALIS
countries/economies completed successfully.
6.6. Material receipt and preparing for data entry
The major tasks for NPMs immediately after administration of the TALIS MS included
retrieving and collating the materials from schools and verifying their integrity. On
receiving survey materials from the schools, NPMs:
checked that they had received complete and appropriate cover
letters/questionnaires for every teacher listed on the TTF
verified that all identification numbers on all cover letters/questionnaires were
accurate and legible
checked that the participation status recorded on the TTFs matched the availability
of questionnaires, the information on the paper questionnaires and the information
in the online monitor
followed up those schools that did not return all the survey materials or for which
forms were missing, incomplete or otherwise inconsistent.
National study centres recorded all necessary information about schools, principals and
teachers, as well as the return status of the questionnaires, in WinW3S. NPMs then
organised the paper questionnaires and corresponding forms for data entry (see Chapter 8).

120
TALIS 2018 TECHNICAL REPORT © OECD 2019
Notes
1 The international study centre (ISC) had prepared software packages for sampling, online data
collection, data entry and data processing to fit the needs of TALIS. The ISC requested that all
participating countries/economies use solely the IEA software to perform the survey; no exceptions
were allowed.
2 With the survey activities questionnaire (SAQ), administered after the field trial and again after the
main survey data had been collected, the ISC collected NPMs’ feedback on their experiences
administering TALIS 2018. The outcomes of the field trial activities questionnaire were considered
in terms of improvements to the main survey’s procedures and the software in use. The outcome of
the main survey questionnaire was incorporated into this chapter.
3 The ten topics included: survey ethics and planning; communication; sampling design, weighting
and adjudication; instrument adaptation, translation and verification; school co-operation and
within-school sampling; data collection and participation monitoring; observing the quality of data
collection; data capture of paper instruments, verification, submission and management;
confidentiality, security and preparation of the international database; data analysis and reporting.
4 If a participating country/economy administering one or more of the options was struggling with
low participation rates during the survey, the national study centre knew it had to first focus on the
core survey.
5 Exceptions occurred for small countries, where the sample size was reduced due to local
circumstances.
6 National study centres were given the opportunity to sample more than the recommended
20 eligible teachers per school, if desired.

121
TALIS 2018 TECHNICAL REPORT © OECD 2019
Chapter 7. Quality assurance procedures for the TALIS data collection
This chapter describes the quality control programme developed and implemented for
administration of the Teaching and Learning International Survey (TALIS) 2018. Assuring
the quality of the data collection was a three-part process, comprising: (1) an international
quality control programme overseen by the IEA Amsterdam and designed to document the
procedures for survey preparation and administration during the main data collection; (2)
a national quality control programme carried out by national study centres; and (3) a
follow-up online survey activities questionnaire that asked national project managers to
comment on the implementation of the TALIS main survey procedures in their respective
countries.
Quality control in the survey administration was extremely important for ensuring valid
comparisons of teacher and principal survey results across countries/economies. It helped
document not only the quality of survey administration and adherence to technical
standards and to standardised survey administration guidelines and procedures in each
participating country/economy but also issues that could influence the quality and
comparability of the data.
Because the information collected by the international quality observers serves as evidence
for further analysis and improvements and reveals any critical and significant process-
related issues, the school visit record and the survey activities questionnaire provided data
on key components of the survey process and of national project managers’ experiences in
conducting TALIS 2018. The international quality observers gained the impression from
their observations that most countries/economies closely followed survey procedures.
Available evidence suggests that teacher respondents generally had few problems with the
survey. Any issues or concerns regarding survey administration procedures and problem-
solving were shared between the national study centres and the TALIS International
Consortium. The quality of the implementation of the TALIS 2018 data collection
procedures was well documented, mostly by quality observers at the international level.
Data reflected stable and consistent data collection processes across participants. In
addition, the importance of effective communication in facilitating international project
work and supporting project completion was, once again, highlighted, setting the stage for
attainable success during future TALIS cycles.
The statistical data for Israel are supplied by and under the responsibility of the relevant Israeli authorities. The
use of such data by the OECD is without prejudice to the status of the Golan Heights, East Jerusalem and Israeli
settlements in the West Bank under the terms of international law.

122
TALIS 2018 TECHNICAL REPORT © OECD 2019
7.1. Quality control in survey administration
During TALIS 2018, considerable effort went into developing standardised materials and
procedures that ensured the data collected in each country/economy were internationally
comparable to the greatest extent possible. More specifically, this standardisation process
ensured that survey materials were administered to participants under comparable survey
conditions for comparable analysis, across all countries/economies and languages and for
each mode of administration (i.e. online and/or paper data collection). Quality control was
implemented at different levels and stages during instrument production, administration,
and data entry and processing in order to document the extent to which each
country/economy implemented the standard operating procedures.
This chapter describes the outcomes of the quality control activities conducted during the
main data collection. Quality control consisted of three major parts:
The IEA Amsterdam designed and managed a standardised, international quality
control programme of school and national centre visits carried out by international
quality observers (IQOs). International quality control was implemented for the
main survey only.
The data from the quality control activities for TALIS were augmented by the
responses of national project managers (NPMs) to a survey activities questionnaire
(SAQ) administered online and conducted after administration of the main survey.
The questionnaire elicited information about the NPMs’ experiences in preparing
for and conducting the TALIS 2018 data collection and the extent to which
everyone involved followed procedures and guidelines. It also provided NPMs with
an opportunity to provide feedback about all aspects of survey administration.
Information pertaining to the national quality control programmes was also
reported in the SAQ and is presented later in this chapter.
The TALIS International Consortium required the NPMs to implement national
data collection quality observations (i.e. a national quality control programme made
up of school visits) during both the field trial and the main survey. The design of
the national quality observation programme was nevertheless at the discretion of
each participant. As a member of the consortium, the IEA Amsterdam provided a
national quality observer manual template that countries/economies could adapt to
suit their national contexts and use as a basis for training their national quality
observers (NQOs).
During TALIS 2018, countries/economies could administer three international options in
addition to the core ISCED level 2 population, namely ISCED level 1, ISCED level 3 and
the TALIS-PISA link. The sampled populations (and instruments) applicable to
participants featured in the design of the quality control programme and were
proportionally included in the schools selected for international quality observations in
each country/economy. The TALIS 2018 Consortium advised NPMs to adopt a similar
approach with respect to national quality control.
7.2. International quality control programme
As part of the OECD TALIS 2018 quality assurance process, the IEA Amsterdam
established a standardised international quality control programme to document data
collection activities in the participating countries/economies.

123
TALIS 2018 TECHNICAL REPORT © OECD 2019
A crucial element of the programme was the appointment of an international quality
observer (IQO) in each participating country/economy who could conduct international
quality control externally to the national study centre. The IEA Amsterdam asked each
NPM to nominate two candidates for the TALIS 2018 IQO position who were familiar with
survey-based research, school environments and/or the day-to-day operations of schools.
The nominees could not be staff members in the national study centre or relatives or friends
of the people working in the centre. The IQOs also had to possess ICT skills and be fluent
in both English and the surveyed language(s) spoken in their countries/economies.
For each country/economy, the IEA Amsterdam selected and appointed one of the
two candidates to serve as IQO. The only exception to this practice was Belgium. Because
Belgium has two separate education systems for its Flemish and French communities,
two IQOs were necessary. To guarantee IQO independence, the IEA Amsterdam
contracted all IQOs and required them to report directly to them. IQOs were permitted to
recruit and share their duties with assistants in order to cover the range of school locations
and environments and ensure compliance with the survey timeframe.
Prior to administration of the main survey, the appointed IQOs from the TALIS countries
and economies attended and participated in a one-and-a-half-day training seminar on their
role and responsibilities. The face-to-face training sessions, conducted by the IEA office in
Amsterdam, took place from 31 August to 1 September 2017 for Southern Hemisphere
countries/economies and from 15 to 16 January 2018 for Northern Hemisphere
countries/economies (two IQOs received training remotely).
During the training seminars, the IEA Amsterdam introduced the IQOs to the TALIS design
and operating procedures and guided them through each step of the programme so they
could confidently fulfil their roles. The IQOs received the following materials:
the TALIS 2018 main survey manual for international quality observers (internal
document), outlining the IQO’s role and responsibilities
the international TALIS School Co-ordinator Manual(s) (one per administration
mode – internal documents)
the TALIS 2018 translation verification report template, international survey
instruments and translation verification files/documentation
confidential login details for the IEA Online Survey System (IEA OSS) that gave
access to the electronic versions of the national instruments used for online data
collection
the TALIS 2018 school visit record template, which provided a standardised,
structured format for interviewing the school co-ordinator (SC) on the
administration of the survey
confidential login details for the IEA OSS to enter data recorded in the school visit
record for every school visited for international quality control purposes
confidentiality agreement (template) to be signed by IQO assistants
guidance file on the documentation requirements
NPM interview outline and question template
a USB stick containing all TALIS materials (manuals, templates, informational
documents and forms) that would be used during data collection.

124
TALIS 2018 TECHNICAL REPORT © OECD 2019
IQOs were also required to collect the following documents from the national centre in
their country/economy:
national versions of the TALIS 2018 School Co-ordinator Manual (one for each
surveyed population, administration mode and language)
national survey instruments
a teacher listing form and a teacher tracking form for each school selected for
international quality observation.
IQOs had three main responsibilities with respect to the international quality control
programme. Their first task involved visiting the national study centre to interview the
country’s/economy’s NPM, collect national TALIS materials and select 20 schools to be
visited. Since a structured interview with the NPM would ensure a better understanding of
how the international procedures had been adapted to suit national contexts, the IEA
Amsterdam provided IQOs with an NPM interview outline and question template.
Second, IQOs were expected to complete a translation verification report (one report per
language of administration; a maximum of two languages). Each participating
country/economy had to translate and/or adapt the TALIS materials to the national situation
and submit all versions of their instruments1 (in all common languages) to the IEA
Amsterdam for independent international translation verification. The IEA Amsterdam
asked IQOs to review the national instruments and comment on the use of specialist advice
from the verifier regarding national translations of the international source instruments into
the official language(s) of instruction. They also had to assess and document consistency
across the national instruments used to survey the core target population and any optional
populations, and to compare the national version of the School Co-ordinator Manual with
the international templates in order to verify alignment (proper adaptation) and determine
if the TALIS 2018 guidelines produced by the international study centre (ISC) had been
followed.
The third duty, irrespective of the options (ISCED level 1, ISCED level 2, ISCED level 3
and the TALIS-PISA link), required IQOs to visit a total of 20 sampled schools to interview
the school co-ordinators (SCs) about TALIS activities leading up to and including the
distribution of materials, and to record their observations and interview responses in the
school visit record for each of the schools. The interview times ranged from approximately
30 minutes to no more than 60 minutes. IQOs were instructed to allow extra time for
questions that required a more careful explanation.
During their fieldwork, IQOs were required to report their progress to the IEA Amsterdam
and to advise of any issues that had arisen. As a result of their duties, IQOs had to send two
sets of deliverables to the IEA Amsterdam at different stages of the programme. The
deliverables included the following materials and documents:
a copy of the completed NPM interview outline and question template
a copy of the translation verification report per language of administration
a checklist documenting the materials collected from the NPM
a list of all visited schools
copies of all 20 completed school visit records
teacher listing forms and teacher tracking forms for every visited school

125
TALIS 2018 TECHNICAL REPORT © OECD 2019
a copy of the national version(s) of the School Co-ordinator Manual
copies of the TALIS study instruments per surveyed population and language of
administration
confidentiality agreements signed by the IQO assistants (if applicable).
7.3. School visit design
In co-operation with the NPM, the IQO in each country/economy selected 20 of the
sampled TALIS 2018 schools. For countries and economies that chose one or more of the
optional survey population(s), the number of school visits was distributed according to the
plan indicated in Table 7.1. If, for example, a country/economy administered two extra
international options in addition to core ISCED level 2, its IQO had to visit seven schools
for that ISCED level, seven schools for one of the international options (at the IQO’s
discretion) and six schools for the other international option (again at the IQO’s discretion).
This plan was designed to yield sufficient evidence of the quality of the data collection
sessions across the surveyed populations.
The IEA Amsterdam received documentation of the international quality control visits to
schools from all participating countries and economies. IQOs successfully conducted
968 school visits in 49 countries/economies,2 with the exception of Australia,
the Netherlands, South Africa and Sweden. Dutch schools teaching at ISCED level 1 took
industrial action during the country’s survey administration window, meaning the observer
could only conduct 19 of the 20 scheduled school visits. In Sweden, the observer
interviewed the required number of SCs (i.e. 20) but had to interview 2 of them by
telephone rather than in person. Similar measures were implemented in Australia, where
the IQO conducted 14 school visits/face-to-face interviews for the ISCED levels 1 and 2
surveys, but 6 telephone interviews for the TALIS-PISA link option. The IQO in
South Africa conducted only 18 school visits due to unforeseen personal circumstances and
practical constraints.
The IEA Amsterdam instructed IQOs to select multiple replacement schools in addition to
the 20 initially selected schools, in case problems occurred (e.g. declines in survey
participation and difficulties arranging school visits) that prevented them from visiting their
originally selected schools. Before beginning their field work, IQOs had to ask the IEA
Amsterdam to approve their respective lists of selected schools and replacement schools.
In general, observers managed to resort to their pre-selected replacement schools when
issues arose with regard to any of the 20 initially selected schools.
Monitoring of the survey administration in the TALIS-PISA link schools received special
attention. The majority of countries/economies conducted the TALIS 2018 project during
the PISA data collection in the second quarter of 2018. The exceptions were Australia and
Ciudad Autónoma de Buenos Aires (Argentina), where administration of the TALIS-PISA
link questionnaires took place in the third quarter of 2018. Both IQOs conducted the
remainder of their visits accordingly.
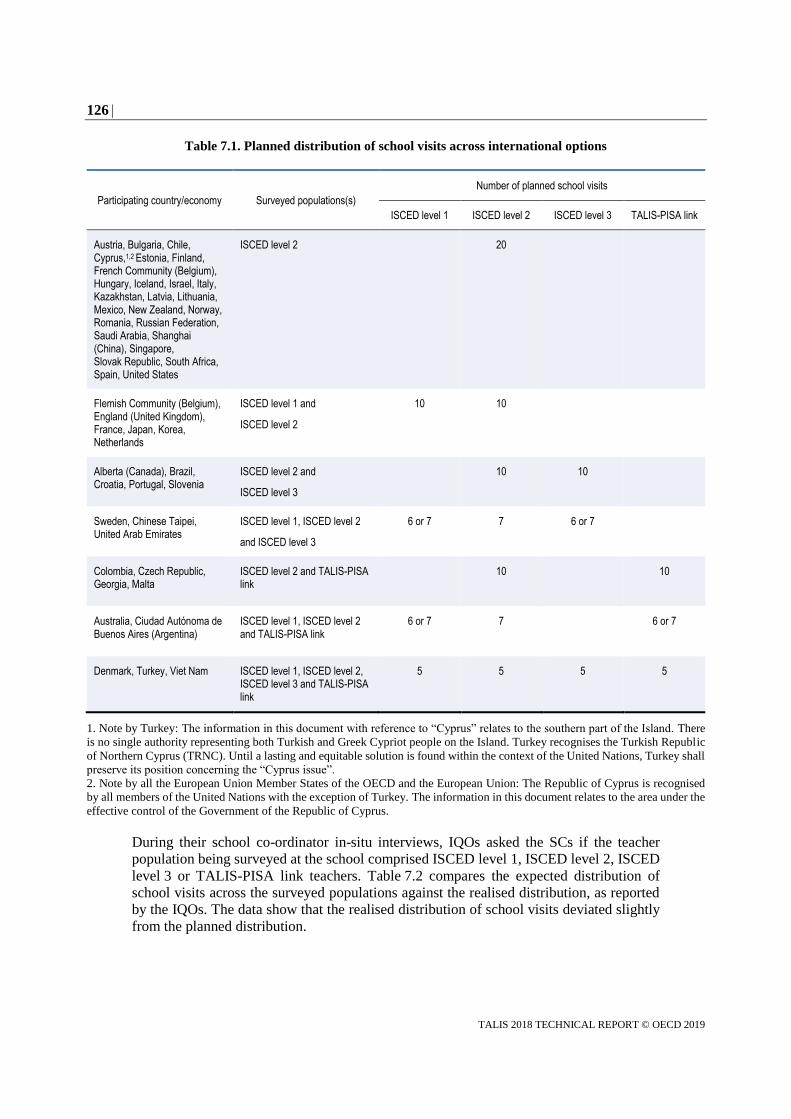
126
TALIS 2018 TECHNICAL REPORT © OECD 2019
Table 7.1. Planned distribution of school visits across international options
Participating country/economy Surveyed populations(s)
Number of planned school visits
ISCED level 1 ISCED level 2 ISCED level 3 TALIS-PISA link
Austria, Bulgaria, Chile, Cyprus,1,2 Estonia, Finland, French Community (Belgium), Hungary, Iceland, Israel, Italy, Kazakhstan, Latvia, Lithuania, Mexico, New Zealand, Norway, Romania, Russian Federation, Saudi Arabia, Shanghai (China), Singapore, Slovak Republic, South Africa, Spain, United States
ISCED level 2 20
Flemish Community (Belgium), England (United Kingdom), France, Japan, Korea, Netherlands
ISCED level 1 and
ISCED level 2
10
10
Alberta (Canada), Brazil, Croatia, Portugal, Slovenia
ISCED level 2 and
ISCED level 3
10
10
Sweden, Chinese Taipei, United Arab Emirates
ISCED level 1, ISCED level 2
and ISCED level 3
6 or 7
7
6 or 7
Colombia, Czech Republic, Georgia, Malta
ISCED level 2 and TALIS-PISA link
10
10
Australia, Ciudad Autónoma de Buenos Aires (Argentina)
ISCED level 1, ISCED level 2 and TALIS-PISA link
6 or 7 7
6 or 7
Denmark, Turkey, Viet Nam ISCED level 1, ISCED level 2, ISCED level 3 and TALIS-PISA link
5
5
5
5
1. Note by Turkey: The information in this document with reference to “Cyprus” relates to the southern part of the Island. There
is no single authority representing both Turkish and Greek Cypriot people on the Island. Turkey recognises the Turkish Republic
of Northern Cyprus (TRNC). Until a lasting and equitable solution is found within the context of the United Nations, Turkey shall
preserve its position concerning the “Cyprus issue”.
2. Note by all the European Union Member States of the OECD and the European Union: The Republic of Cyprus is recognised
by all members of the United Nations with the exception of Turkey. The information in this document relates to the area under the
effective control of the Government of the Republic of Cyprus.
During their school co-ordinator in-situ interviews, IQOs asked the SCs if the teacher
population being surveyed at the school comprised ISCED level 1, ISCED level 2, ISCED
level 3 or TALIS-PISA link teachers. Table 7.2 compares the expected distribution of
school visits across the surveyed populations against the realised distribution, as reported
by the IQOs. The data show that the realised distribution of school visits deviated slightly
from the planned distribution.

127
TALIS 2018 TECHNICAL REPORT © OECD 2019
Table 7.2. Comparison of the planned and realised school visit design
School visits ISCED level 1 (%) ISCED level 2 (%) ISCED level 3 (%) TALIS-PISA link (%) Total (%)
Planned 10.7–11.2 74.8 6.9–7.3 6.8–7.0 100.0
Realised 12.2 72.0 8.6 6.9 99.7
The results of the IQOs’ school visits across the different surveyed target populations given
in the following sections are presented together, not separately by TALIS participant.
7.4. Interviews with the SCs
The TALIS principal and teacher questionnaires were administered in
49 countries/economies during the main data collection. The IEA Amsterdam asked the
IQOs to use the school visit record to record their observations of the survey administration.
Data collected for the school visit record came from a structured interview with the SC.
The purpose of this activity was to solicit an evaluation of the administration of TALIS
from the SCs, to collect recommendations for improvement, to obtain additional
background information, and to elicit information on survey and post-survey-related
activities. The IQOs conducted interviews with the SCs according to the guidelines
included in Sections A, B, C, D and E of the school visit record:
A. SC information, that is, information about the SC and his or her involvement in the
survey.
B. Initial preparations before survey distribution, for example, assisting the NPM to
complete the teacher listing forms, determining the administration dates with the
NPM and ensuring that the survey instruments were kept in a secure place.
C. Survey administration activities, including issues of confidentiality and security,
for example, distributing the respective cover letters (online data collection) and/or
the principal questionnaires and teacher questionnaires (paper data collection) for
survey administration.
D. General impressions, that is, evaluation of procedures conducted by the SC.
E. IQO review, that is, summary of the IQO’s overall impressions.
To provide an overview of the main data collection process co-ordinated by the SCs, the
following subsections are based on the information collected in the school visit records.
The subsections accord with the five-part structure of the school visit record.
7.4.1. SC information
In all countries and economies, approximately 96% of SCs were members of the school
staff. Almost half of the co-ordinators were heads of subject or year level and/or another
member of the school management team (42%); about 23% of them were principals and
approximately 19% were teachers. In Chile, for example, co-ordinators were external to
the schools and had other jobs related to the field of education. Across the participating
countries/economies and target populations, the percentage of SCs responsible for
one TALIS school only was 96%.
A large majority of SCs stated that the attitudes of other school staff towards TALIS 2018
were slightly more neutral (about 52%) than positive (fewer than 48%), while less than 1%

128
TALIS 2018 TECHNICAL REPORT © OECD 2019
of the SCs reported negative attitudes. The negative or indifferent attitudes of the staff
members were commonly characterised as a result of the survey period overlapping with
busy periods in the school year and school staff’s limited knowledge about TALIS.
As documented by the IQOs, 31% of the SCs reported that someone other than the SC
encouraged teachers to join the survey. These people used special instructions, motivational
talks and/or incentives as encouragement. School principals, for example, tended to
encourage participation by delivering motivational or instructional talks. When this
occurred, it was usually during staff meetings or at a group session emphasising the
importance of the survey and of sound survey distribution procedures.
The SCs described teacher participants as broadly co-operative, with between roughly 40%
and 55% of them considering teachers “moderately co-operative or extremely
co-operative” (Table 7.3). Less than 0.4% of the co-ordinators considered teachers “hardly
co-operative at all”. In general, according to roughly three-quarters (76.3%) of the
co-ordinators, teacher respondents felt comfortable answering the survey questions;
approximately 15% of co-ordinators did not know whether teachers felt comfortable.
Table 7.3. IQO-reported interview responses of the SCs to questions about teacher
co-operation and comfort when participating in TALIS
Questions Extremely
co-operative (%)
Moderately co-operative
(%)
Somewhat co-operative
(%)
Not co-operative (%)
To what extent would you describe the teachers as co-operative?
55.1 39.8 4.7 0.4
Yes (%) No (%) Do not know (%)
Did teachers feel comfortable answering the survey questions?
76.3 8.3 15.4
IQOs reported that SCs administered their survey in accordance with the international
procedures. Just over half of the SCs (50.9%) from across the participating countries and
economies adhered to particular data protection rules at the national level in addition to
TALIS 2018 standardised procedures.
7.4.2. Initial preparations
Section B of the school visit record asked SCs to report on the training and other
preparatory work they did prior to survey administration in order to ready themselves for
their role in TALIS. Table 7.4 summarises the SCs’ answers to these questions.
Approximately 92% of the SCs interviewed reported receiving a leaflet about TALIS 2018
from their NPM and roughly half of them attended a training session designed specifically
for them (Table 7.4). Several countries/economies had not organised any training sessions
but many of their SCs found their national School Co-ordinator Manual self-explanatory.
When IQOs asked SCs if they had any difficulty understanding the survey procedures,
about 95% of them answered “no”. Roughly 37% of them indicated they had previous
experience serving as the SC for an international and/or national survey.

129
TALIS 2018 TECHNICAL REPORT © OECD 2019
Table 7.4. IQO-reported interview responses of the SCs to questions about their experiences,
training and initial survey preparation
x: not applicable.
Note: Percentages were derived from school co-ordinator responses during 976 interviews in total.
In terms of following pre-survey procedures, most countries used the teacher listing form
and the teacher tracking form, as evidenced by the majority of SCs stating that they used
the forms (approximately 98%). Generally, most SCs did not experience difficulties
completing the teacher listing form and teacher tracking form (roughly 91%). The SCs
prepared the teacher listing forms as part of the within-school sampling process, as
described in the School Co-ordinator Manual, which provided detailed information about
who to include on the form.
About 7% of the SCs stated they experienced some difficulty completing the teacher
tracking and teacher listing forms. In some cases, SCs struggled to list eligible teacher
respondents due to teachers working at more than one level of education (international
options) and/or because they did not have access to some of the information requested on
the forms (subjects and names). The IQO data revealed those listed on the teacher listing
form qualified as a teacher in almost all cases (about 95%). In some cases, the lists included
substitute teachers and teachers who were on long-term leave.
The IEA Amsterdam asked IQOs to collect the teacher listing and tracking forms from the
NPMs for every school selected for international quality control in their respective
country/economy and to cross-check the information recorded in the forms against the
forms prepared by the SCs. The majority of SCs (around 96%) confirmed that the IQOs
possessed a complete list of all the teachers employed at each particular school who were
teaching the surveyed population (i.e. ISCED level 1, ISCED level 2, ISCED level 3 and
the TALIS-PISA link). Discrepancies usually corresponded to staff turnover, teacher
absences and maternity leave.
Questions Yes (%) No (%) Not answered
(%)
Did the SC receive a leaflet from the NPM explaining the purpose of TALIS? 91.6 8.4 x
Has the SC previously served as a school co-ordinator for any other survey and/or assessment (national and/or international)?
36.5 63.2 0.3
Has the SC attended a training session designed for the TALIS 2018 main survey school co-ordinators?
43.4 56.5 0.1
Did the SC have any difficulty understanding the survey procedures?
Purpose of the survey 5.1 94.9 x
Survey administration (including administration, participation and security/confidentiality arrangements)
5.3 94.7 x
Survey return procedures (online and paper) 6.4 93.6 x
Did the SC experience any difficulties completing the teacher tracking form or teacher listing form?
6.8 91.2 2.0
Did the SC experience any inconsistent communication with the NPM, resulting in delays or unexpected changes?
2.5 97.4 0.1
Did you use the Teacher Tracking Form and Teacher Listing Form? 97.7 2.0 0.2
Is there anyone listed on the Teacher Listing Form who is NOT a teacher?
NOTE: School staff who do NOT qualify as teachers are out-of-scope for the purposes of TALIS, and include substitute, emergency or occasional teachers.
5.0 95.0 x

130
TALIS 2018 TECHNICAL REPORT © OECD 2019
Most SCs (approximately 95%) felt that their respective School Co-ordinator Manual
worked well, with fewer than 6% reporting the need for improvements to the document.
Some TALIS 2018 countries/economies, for example, Austria and England
(United Kingdom), did not produce a manual for SCs but opted to give them letters or other
forms of information, or, in the case of Italy, to run webinars. Some countries/economies
added supplementary material to the manual, such as short videos and screenshots.
Some SCs thought that more information on the survey itself could have been provided in
addition to the procedural information and that the document was overlong and could,
therefore, be shortened. Overall, NPMs were, as reported by the IQOs, highly consistent in
their communication with the SCs, resulting in few delays or unexpected changes.
Approximately 3% of the SCs who answered this question experienced minor
communication issues.
7.4.3. Survey administration activities
The IEA Amsterdam instructed the IQOs to refer to the teacher tracking form and teacher
listing form specific to each school when visiting it. Tables 7.5, 7.6 and 7.7 capture some
of these key tasks and demonstrate that, among the SCs interviewed, 89.4% to 92.9% said
that they explained not only the purpose of the survey to teacher respondents but also the
estimated time needed to complete the survey, along with information on confidentiality
arrangements and survey return procedures.
Table 7.5. IQO-reported interview responses of the SCs about explaining TALIS to
participants
Question Yes (%) Somewhat (%) No (%)
Did the SC explain the following aspects to the participants?
Purpose of the survey 92.9 4.3 2.8
Estimated time to complete 89.5 3.7 6.8
Confidentiality arrangements 91.8 3.4 4.8
Survey return procedures 89.4 3.1 7.5
Note: Percentages derived from school co-ordinator responses during 976 interviews in total.
Table 7.6. IQO-reported interview responses of the SCs about distribution procedures
Questions Yes (%) No (%) Not answered
(%)
Did the SC distribute the cover letters (online data collection) and/or questionnaires (paper data collection) to participants in a confidential manner?
97.4 2.6 x
Did the SC distribute the cover letters (online data collection) and/or questionnaires (paper data collection) in accordance with the teacher tracking form?
97.2 2.7 0.1
x : not applicable.
Note: Percentages derived from school co-ordinator responses during 976 interviews in total.
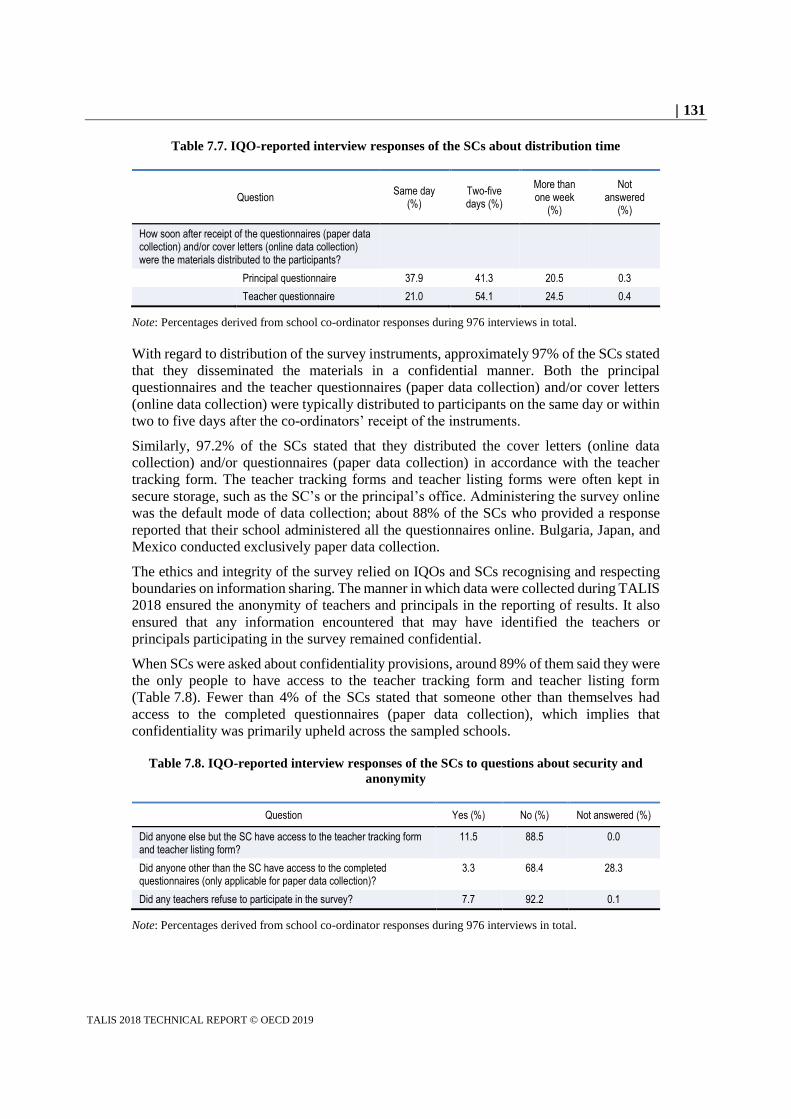
131
TALIS 2018 TECHNICAL REPORT © OECD 2019
Table 7.7. IQO-reported interview responses of the SCs about distribution time
Question Same day
(%) Two-five days (%)
More than one week
(%)
Not answered
(%)
How soon after receipt of the questionnaires (paper data collection) and/or cover letters (online data collection) were the materials distributed to the participants?
Principal questionnaire 37.9 41.3 20.5 0.3
Teacher questionnaire 21.0 54.1 24.5 0.4
Note: Percentages derived from school co-ordinator responses during 976 interviews in total.
With regard to distribution of the survey instruments, approximately 97% of the SCs stated
that they disseminated the materials in a confidential manner. Both the principal
questionnaires and the teacher questionnaires (paper data collection) and/or cover letters
(online data collection) were typically distributed to participants on the same day or within
two to five days after the co-ordinators’ receipt of the instruments.
Similarly, 97.2% of the SCs stated that they distributed the cover letters (online data
collection) and/or questionnaires (paper data collection) in accordance with the teacher
tracking form. The teacher tracking forms and teacher listing forms were often kept in
secure storage, such as the SC’s or the principal’s office. Administering the survey online
was the default mode of data collection; about 88% of the SCs who provided a response
reported that their school administered all the questionnaires online. Bulgaria, Japan, and
Mexico conducted exclusively paper data collection.
The ethics and integrity of the survey relied on IQOs and SCs recognising and respecting
boundaries on information sharing. The manner in which data were collected during TALIS
2018 ensured the anonymity of teachers and principals in the reporting of results. It also
ensured that any information encountered that may have identified the teachers or
principals participating in the survey remained confidential.
When SCs were asked about confidentiality provisions, around 89% of them said they were
the only people to have access to the teacher tracking form and teacher listing form
(Table 7.8). Fewer than 4% of the SCs stated that someone other than themselves had
access to the completed questionnaires (paper data collection), which implies that
confidentiality was primarily upheld across the sampled schools.
Table 7.8. IQO-reported interview responses of the SCs to questions about security and
anonymity
Question Yes (%) No (%) Not answered (%)
Did anyone else but the SC have access to the teacher tracking form and teacher listing form?
11.5 88.5 0.0
Did anyone other than the SC have access to the completed questionnaires (only applicable for paper data collection)?
3.3 68.4 28.3
Did any teachers refuse to participate in the survey? 7.7 92.2 0.1
Note: Percentages derived from school co-ordinator responses during 976 interviews in total.

132
TALIS 2018 TECHNICAL REPORT © OECD 2019
As documented in the school visit records, SCs reported that fewer than 8% of sampled
teachers refused to participate in TALIS. The reasons why non-respondents refused to
participate included lack of time, upcoming retirement, illness, and teachers’ unions or
associations advising against participation.
7.4.4. General impressions
Table 7.9 presents the SCs’ answers to questions about their general observations of the
TALIS 2018 implementation.
Table 7.9. IQO-reported interview responses of the SCs to questions about their general
impressions of the survey administration
Question Yes (%) No (%) Not answered
(%)
Did participants approach the SC to discuss any of the following?
Purpose of the survey 12.7 87.2 0.1
Survey return procedures 7.7 92.0 0.3
Clarification of any items 15.2 84.5 0.3
An error they spotted 1.9 97.7 0.3
Other questions about the survey 10.0 89.7 0.3
Any questions they could not answer 5.0 94.6 0.4
Very well, no problems (%)
Satisfactory, few problems
(%)
Unsatisfactory, many problems
(%)
Overall, how did the SC describe the survey distribution process? 89.8 9.7 0.5
Note: Percentages derived from school co-ordinator responses during 976 interviews in total.
IQOs asked SCs to indicate whether any of the TALIS participants approached them to
discuss or ask questions about the survey. Approximately 13% of the SCs said participants
asked them about the purpose of the survey, around 15% said participants asked them to
clarify survey items and about 8% said participants questioned them about the survey return
procedures. Around 2% of SCs said participants asked them about an error they had spotted
and 10% of the SCs reported dealing with other questions about the survey (e.g. queries
about confidentiality or requests for help to access the online questionnaire).
The majority of SCs felt the survey distribution process had gone very well, overall, and
without any problems. Of those interviewed, about 10% reported experiencing some
problems but still deemed the process satisfactory. Suggestions for improvement included
additional time to complete the survey and more detailed instructions on completing the
teacher tracking form.
7.4.5. IQO review
The IQOs formed the impression that the overall implementation of TALIS was positive.
In their opinion, roughly 87% of the SCs definitely applied the TALIS procedures seriously
and professionally. Several IQOs commended SCs for their thorough preparatory work
executed ahead of the survey, effort to meet the deadlines outlined by the NPMs and
professionalism in assuring the success of survey operations at the school level.

133
TALIS 2018 TECHNICAL REPORT © OECD 2019
The SC and IQO feedback implies that teacher respondents remained supportive of TALIS
and understood the importance of the project despite concerns some of them had about the
length of the survey and not having, in their opinion, sufficient time to complete it.
7.5. Translation verification report(s)
IQOs recorded feedback from the translation verification process and their review of the
verified national instruments and School Co-ordinator Manual(s) in the translation
verification report. The IQOs completed one translation verification report per surveyed
language (maximum of two national languages). The reports provided a starting point for
determining whether any translation problems made the item(s) internationally non-
comparable. Translation verification was implemented to help ensure the international
comparability of the survey instruments.
7.6. Extra quality control questions
As an innovative endeavour, the TALIS 2018 Consortium developed three extra questions
designed to test the feasibility of adding quality control questions to the teacher
questionnaire delivered online. The questions were administered to 25 660 teachers
representing a 10% subsample of the teachers participating in TALIS 2018. Of the
three questions developed, two functioned as expected. Since the overall response rate for
these 2 questions was above 95%, the questions could be used for further cycles. The third
question was affected by a misunderstanding and would require further revision for future
administration.
7.7. Survey activities questionnaire
The survey activities questionnaire covered all aspects of survey administration. The ISC
prepared this questionnaire online and delivered it to NPMs for Southern Hemisphere
participants in February 2018, after they had completed data collection. NPMs for Northern
Hemisphere participants received their credentials and information on the survey activities
questionnaire in April 2018. The questionnaire, which consisted of 9 content sections and
156 questions, asked the national study centres to provide information about all survey-
related activities and the extent to which procedures and guidelines had been followed. The
questionnaire also gave NPMs an opportunity to provide valuable feedback about all
aspects of survey administration, including survey procedures and manuals, guidelines,
support materials and software. All TALIS participants completed the questionnaire
between March and December 2018. The following subsections present the results of this
survey.
7.7.1. Within-school sampling
The national centres in all countries used the Windows Within-School Sampling Software
(WinW3S) provided by the ISC.
Nine national centres used prepopulated teacher listing forms. The centres included
information from ministries or school authorities in the lists before they sent them to
schools, which meant that SCs only had to update the information. Some national centres
(19%) used methods other than the paper/electronic forms created by WinW3S to list and
track teachers. These methods varied from online forms to special software provided to

134
TALIS 2018 TECHNICAL REPORT © OECD 2019
schools or already existing in schools. During TALIS 2013, 21% of national centres used
other methods; during TALIS 2008, 62% did so.
With regard to data protection and confidentiality laws, 13 countries/economies reported
restrictions on using teacher names on the listing and tracking forms and the national
questionnaires. In these instances, the countries/economies used numbers or codes on the
forms.
7.7.2. Contacting schools
In 29 of the participating countries/economies, NPMs were typically the people who made
the first contact with sampled schools, although in 20 countries/economies, the NPMs and
other members of the national study centre did this task together. In
14 countries/economies, the ministry of education made first contact, sometimes in
conjunction with the national centre.
Although the overall participation rates for TALIS 2018 were high, more than 50% of the
national centres reported difficulty convincing schools to participate. The most commonly
reported reason cited by national centres was a general work overload, at times combined
with the problematic timing of the survey at the end of the school year. Some national
centres found explaining the purpose of the survey especially difficult because schools did
not see the value it might bring. National centres also noted general survey fatigue.
Strategies to overcome school reluctance to participate included multiple follow-up
attempts and seeking the support of teacher unions or regional, state or national education
authorities. Ten of the participating countries/economies requested an extension to the
survey deadline beyond the international finalised date for data collection in order to
improve the overall response rate. Participation rates show that most of the national centres
were able to overcome these difficulties and convince schools to take part in the survey.
The persons nominated to fill the role of a school co-ordinator were generally easy to
identify and no problems resulted in appointing them. Only 12% of the national centres
reported difficulty finding a suitable person for the task.
For most of the participating countries/economies (90%), adapting the School Co-ordinator
Manual (internal document) to their national context and needs was a straightforward and
easy task. Only 10% reported some difficulties, such as adapting cultural specifics or using
the correct terms for translation.
Because the co-ordinators played a key role within the survey, 52% of NPMs provided
them with additional formal training, while 48% used different communication channels,
such as phone calls and written instructions. National study centres also used emails to
explain single tasks at the appropriate times throughout the survey process and videos to
communicate with and inform school co-ordinators.
The ISC provided the national study centres with a software tool (IEA Participation Rate
Estimator) to help them keep track of the participation rates during data collection. NPMs
sent outcomes of the estimator to the ISC mostly on a weekly to bi-weekly basis, enabling
the ISC to closely monitor participation rates in all participating countries/economies and
to contact national centres if rates seemed too low or did not evolve quickly enough. In
some cases, the ISC advised national centres to try to improve participation rates by
applying certain strategies, such as focusing on contacting schools that were near to passing
the 50% participation threshold.

135
TALIS 2018 TECHNICAL REPORT © OECD 2019
7.7.3. Listing teachers
Due to the complexity of the listing procedure, 42% of national centres reported one or
more difficulties during the listing process: 21% said that they experienced difficulty
explaining either the definition of the teacher population or the assignment of exemption
codes to the teachers. Other challenges included correctly assigning the main subject
domains (25% of national centres experienced this difficulty) and explaining to school co-
ordinators why they needed to administer only the correct (specified) questionnaire to
designated teacher respondents (a difficulty for 14% of the centres). However, centres
managed to resolve nearly all of these issues before survey administration began.
7.7.4. Preparing questionnaires
Preparation of the questionnaires involved several steps outlined in the Survey Operations
Procedures Unit 3: Instrument Preparation. National centres first prepared all national
adaptations and sent them to the ISC. The ISC thoroughly reviewed the adaptations to the
instruments, provided the national centres with feedback on the acceptability of adaptations
and described the changes that centres needed to make in order to have their adaptations
approved. As soon as national centres obtained final approval for adaptations from the ISC
and finalised their translations, they submitted their national materials for international
translation verification. International translation verifiers, whose work was co-ordinated by
the IEA Amsterdam, then verified the translated ISCED level 2 instruments. For ISCED
levels 1 and 3, including the TALIS-PISA link, translation verification encompassed only
differences between these instruments and the ISCED level 2 instruments and national
adaptations specific to those instruments.
After completing the translation verification process, NPMs revised and finalised the paper
instruments, and considered the verifiers’ suggestions as they did so. The ISC verified the
layout of all submitted instruments and gave their final approval for launching the printing
process at national centres or, if online data collection had been selected, for preparing the
online instruments (for more details about this process, see Chapter 4).
Mindful that translation and adaptation of survey instruments is a difficult exercise in any
cross-national study, the ISC supported the process by bringing a structured approach to
instrument preparation that included individualised translation verification schedules,
additional support materials (e.g. national adaptation forms) and documentation guidelines.
Overall, 83% of the national centres said that documentation of the non-structural national
adaptations (i.e. adaptations of terms or words that did not affect the structure of the
questionnaires) was a straightforward task. Only 17% of national centres characterised the
task as “somewhat difficult”, mainly because they saw the process as time-consuming. The
SAQ’s comments on the structural adaptations (i.e. adaptations that changed the structure
of the questionnaires by, for example, adding dimensions or categories) presented a similar
picture: 81% of the national centres, all of which had to document structural adaptations,
reported no difficulties with the task, while 19% described it as “somewhat difficult”.
In regard to translations, approximately 60% of the centres considered the process as not
being difficult at all, while the remainder described it as “somewhat difficult”. The majority
of reported difficulties related to certain translated terms and concepts that were difficult
to apply within the national context or to align in meaning across different survey
languages. All TALIS national centres considered the translation and adaptation guidelines
useful for facilitating completion of the task.

136
TALIS 2018 TECHNICAL REPORT © OECD 2019
7.7.5. Preparing the online questionnaires
After completion of the adaptation and translation verification processes for the paper
instruments, the ISC prepared online questionnaires for all participating countries, with the
exception of the three participants that chose to administer the paper-only version of
TALIS.
7.7.6. Online administration
The online data collection helped to reduce the time taken to conduct data entry and data
processing once all the data had been collected. Forty percent of the participating countries
and economies using online data collection reported no problems.
Most of the problems that were encountered emerged from application errors (e.g. typing
URLs in the search engine) or lost login details. Some participants reported difficulty
accessing the questionnaires because of a slow Internet connection or because of specific
browsers. In some cases, technical difficulties with the OSS (server maintenance, local
firewall settings and interface problems) were reported. One-quarter of participants said
technical problems with the OSS prevented respondents from completing the
questionnaires. Usually, these were single cases, where respondents reported being thrown
out of the system without an explanation or being unable to access the OSS. ISC staff
worked closely with the national study centres to provide technical support and resolve
problems.
To monitor the online data collection process and participation progress on a daily basis,
the ISC provided a software tool called the Online Survey System Monitor. This tool
proved very helpful and the participating countries/economies used it several times a week.
Forty participants used the software on a daily basis, while four participants used it
approximately once a week. Forty-one participants characterised the system monitor listing
as useful.
7.7.7. Paper administration
While most data were collected online, 11 TALIS 2018 participants administered paper
instruments in schools. Three of these countries/economies administered only paper
instruments; eight used a mixed-mode approach, that is, paper and online instruments. Nine
participants completed data collection in paper mode within the regular administration
window; two countries faced challenges during administration and requested an extension
of the planned survey window so they could meet the necessary minimum participation-
rate requirements at the school and teacher level.
7.7.8. Manual data entry and submission
All TALIS 2018 participants received training in performing manual data entry according
to the rules and standards outlined in the TALIS 2018 Survey Operations Procedures
Unit 5: Data Capture Procedures (Main Survey) and the TALIS 2018 Technical Standards
(internal documents) and in using the IEA’s Data Management Expert (DME) software.
Most of the participating countries/economies submitted their data and documentation by
31 May 2018. Only six participants provided the required information in June and two in
July. As an important quality control measure, countries/economies were required to
perform double entry of a sampled set of teacher and principal questionnaires to ensure
high-quality data entry.

137
TALIS 2018 TECHNICAL REPORT © OECD 2019
7.7.9. National quality observation programme
NPMs were instructed to implement national quality control during administration of the
TALIS 2018 field trial and main data collection survey instruments; the design of the
quality control programme remained at the discretion of each country/economy. National
quality observations are an important means not only of collecting information about
survey administration and implementation at schools but also of helping to ensure the
quality and comparability of the data collected in each country/economy.
The ISC asked NPMs to use the relevant section of the survey activities questionnaire to
summarise and report salient findings from the national quality observations. However, the
NPMs were not required to submit data collected by the national quality observers (NQOs)
to the ISC. Each participating country/economy was responsible for designing its own
quality assurance programme, appointing NQOs and ensuring that they met required
standards relating to data collection and survey administration. The IEA Amsterdam
developed an NQO manual template containing detailed instructions that would not only
help NPMs conduct national quality control but also serve as the basis for training the
NQOs. The TALIS 2018 NQO manual could be adapted to fit the needs of the
country/economy with respect to how it would collect its data, such as accommodating
international options or covering features important for the national centres
(e.g. communication at the national level or online resources for the school co-ordinators).
NQOs were mainly appointed from among national study centre staff but they also included
graduate students, university staff, external people or retired school principals and teachers.
As reported in the SAQ, 34 of the 49 countries/economies implemented a national
quality control programme for the main survey. National study centres in
ten countries/economies did not conduct a quality control programme at the national level
but opted to use other ways of observing survey operations and activities. These approaches
included maintaining ongoing telephone contact with schools to receive real-time feedback
and asking SCs to complete online questionnaires. The United States decided that rather
than having NQOs conduct school visits, it would administer a school co-ordinator
debriefing form in schools in order to gather information about the survey administration.
Altogether, 32 countries used the manual template supplied by the IEA Amsterdam, with
only 8 countries applying significant adaptations, such as editing, adding and/or omitting
questions. These adaptations were mainly due to the country context. For instance, Italy
excluded some questions that were not applicable to the Italian context, while Colombia
added questions to gain more information about the national processes and the teachers’
reactions to the survey. NQOs visited approximately 18 schools per country/economy and
30 of them told their NPM that the SCs distributed the teacher questionnaires/cover letters
in exact accordance with the teacher tracking form.
Problems observed by some quality observers at the national level, as reported by NPMs,
varied. They included TALIS 2018 running parallel to other surveys, the amount of time it
took a respondent to complete the questionnaire, teachers having difficulty understanding
the aim of the questions, the content of some questions not being applicable in the
national/school context, technical issues with online survey administration (e.g. problems
accessing the online questionnaires, slow Internet connections), difficulty contacting the
schools and co-ordinators to schedule an interview time, and planning visits too close to
the end of the data collection window.

138
TALIS 2018 TECHNICAL REPORT © OECD 2019
Notes
1 Countries administering additional international options (ISCED level 1, ISCED level 3 and the
TALIS-PISA link) were also required to submit the national versions of these instruments.
2 The distinct educational systems in Belgium were taken into account, leading to the recruitment of
one IQO for the Flemish community and one IQO for the French community.

139
TALIS 2018 TECHNICAL REPORT © OECD 2019
Chapter 8. Creating and checking the international database
This chapter offers an overview of the approach and strategy used to create the TALIS 2018
international database (IDB). It describes the data-entry and verification tasks carried out
by the national study centres and the exchange of data and documentation between these
centres and the international study centre at the IEA. It also describes the integration of
data from the paper and online administration modes and the data editing and database
creation procedures implemented there, including the detection and resolution of
inconsistencies in the data. The final section of the chapter details the interim data
produced and the steps that all involved centres took to confirm the IDB’s accuracy,
integrity and validity.

140
TALIS 2018 TECHNICAL REPORT © OECD 2019
8.1. Overview
Creating the TALIS 2018 international database (IDB) and ensuring its integrity required
close co-ordination and co-operation among the international study centre (ISC), Statistics
Canada, the national project managers (NPMs) and the OECD Secretariat.
The primary goals of this work were to ensure that:
all national adaptations to questionnaires were reflected appropriately in the
codebooks and corresponding documentation
all national information eventually conformed to the international data structure
and coding scheme
any errors, such as logical inconsistencies or implausible values given by
respondents or those occurring during data entry, were minimised as much as
possible.
The quality control measures applied throughout the process were identical, to the greatest
extent feasible, for all four target populations: the ISCED level 2 core, ISCED level 1,
ISCED level 3 and the TALIS-PISA link.
The IEA Hamburg supplied the national centres with the IEA Data Management Expert
(DME) software and the TALIS 2018 Main Survey Operations Procedures, Unit 5 (internal
document), which describes the process and rules associated with manual data entry, via
the DME software, of the teacher and principal questionnaires. It also provides information
about the data structure.
The IEA Hamburg also held a three-day data management training session in Rome, Italy,
in October 2016 that covered software use, procedures for national adaptations, and rules
and procedures for data entry. The seminar was specifically targeted at the national team
member(s) responsible for data management and liaising with the IEA Hamburg. In
addition, after administration of the TALIS 2018 field trial in 2017, the TALIS national
project managers (NPMs) received information about the outcomes of the field trial and
resulting software improvements at the third NPM meeting in Lisbon, Portugal, in
July 2017.
This chapter describes the additional steps taken to build the IDB and assure the quality
and accuracy of the TALIS 2018 data.
8.2. Online data collection and verification
The default mode of data collection during TALIS 2018 was online questionnaires.
However, paper questionnaires were still important. Of the 48 participating
countries/economies, 37 used the online mode exclusively and 3 used only the paper mode.
The remaining eight countries/economies applied a mixed-mode design, in which they used
the paper mode in addition to the online mode (or vice-versa) for particular ISCED levels,
for either teachers or principals, for selected schools only or for particular school principals
or teachers. National centres had to ensure that individual respondents who refused to
participate in the online mode or did not have access to the Internet received a paper
questionnaire, thereby minimising non-response as a result of a forced administration
mode.
The data from the two different collection modes were later merged into a single set per
ISCED level and country/economy. Potential sources of error originating from the use of

141
TALIS 2018 TECHNICAL REPORT © OECD 2019
the two parallel modes had to be controlled for and reduced as much as possible to ensure
uniform and comparable conditions across modes and across countries. The design
established several general principles to achieve this:
questionnaires in both modes were self-administered and comparable in terms of
layout and appearance
● the same sample design and procedures were used to identify respondents
● the same methods were used to contact respondents and to validate their
participation
● both modes of data collection occurred over the same period of time.
Notable differences between the two collection modes included approaches to skipping
questions (manually on paper, automatic on line) and the possibility of validating responses
in real time in the online mode.
The electronic versions of the TALIS questionnaires could be completed only on line. No
other options, such as sending/receiving PDF documents by email or printing out the online
questionnaires and mailing them to the national centres, were permissible. Because the
online data collection for TALIS was designed to ensure a standardised educational survey
and to accommodate specific operations, successful administration of the electronic
questionnaires relied on all participating countries/economies adhering to the technical
standard that required them to use the software provided by the TALIS Consortium.
To properly sequence preparation tasks and processes and to ensure comparability of data,
the paper versions of the two questionnaire types (i.e. principal and teacher) had to be
finalised in terms of translation and layout, even if it was likely that all or almost all of the
data would be collected on line. After these final paper versions of the questionnaires had
been converted for the online mode, their structure, text and layout were subject to final
verification.
In addition to these requirements, the design ensured that online respondents needed only
an Internet connection and a standard Internet browser. No additional software, particular
operating system or particular make or version of browsers were required.
The navigational concept for the online questionnaire had to be as similar as possible to
that of the paper questionnaires. Respondents could use “next” and “previous” buttons to
navigate to an adjacent page, actions akin to flipping physical pages. In addition, a
hyperlinked “table of contents” mirrored the experience of opening a specific page or
question of a paper questionnaire. While most respondents followed the sequence of
questions directly, these features allowed respondents to skip or omit questions just as if
they were answering a self-administered paper questionnaire.
To further ensure the similarity of the two sets of questionnaires, responses to the online
questionnaires were not mandatory, evaluated or enforced in detail (e.g. hard validations or
a strict sequence). Instead, some questions used soft validation, such as respondents being
asked to give several percentage numbers that would supposedly add up to 100%. For these
questions, the sum was constantly updated according to the respondent’s entries and was
highlighted in red as long as it differed from 100%. Even if a response remained red,
respondents could proceed to the next question.
Certain differences in the representation of the two modes remained, however. To reduce
response burden and complexity, the online survey automatically skipped questions not
applicable to the respondent, in contrast to the paper questionnaire, which instructed

142
TALIS 2018 TECHNICAL REPORT © OECD 2019
respondents to proceed to the next applicable question. Rather than presenting multiple
questions per page, the online questionnaire proceeded question by question.
While vertical scrolling was required for a few questions, particularly the longer questions
with multiple “yes/no” or Likert-type items, horizontal scrolling was not. Also, because
respondents could easily use visual cues to estimate the length and burden of the paper
questionnaires, the online questionnaires attempted to offer this feature through progress
counters and a “table of contents” that listed each question and its response status. Multiple-
choice questions were implemented with standard HTML radio buttons. Once respondents
reached the end of the online questionnaires, they were presented with a summary of the
questions they had not answered.
National centres were provided with a tool to monitor online participation. A restricted
version of this tool was also available for school co-ordinators, if requested. While NPMs
could see summary information (e.g. first login, last login, total of logins, progress of
answers) and raw data for all principals and teachers, school co-ordinators could only view
the type of summary information for their school that would prompt them to initiate
appropriate follow-up activities. They could not access actual responses.
8.3. Data entry and verification of paper questionnaires at national centres
Each national centre was responsible for transcribing the information from the principal
and teacher questionnaires into computer data files. National centres entered responses
from the paper questionnaires into data files created from an internationally predefined
codebook. This contained information about the names, lengths, labels, valid ranges (for
continuous measures or counts) or valid values (for nominal or ordinal questions) and
missing codes for each variable in each of the two questionnaire types. Before data entry
commenced, national data managers (NDMs) were required to verify the nationally adapted
codebook structure that reflected all ISC-approved adaptations (e.g. a nationally added
response category) made to the national questionnaire versions. These adapted codebooks
then served as templates for creating the corresponding data set.
In general, the ISC instructed national centres to discard any questionnaire that was unused
or returned completely empty and to enter any questionnaire that contained at least one
valid response. To ensure consistency across participating countries, the basic rule for data
entry in DME required national staff to enter data “as is”, without any interpretation,
correction, truncation, imputation or cleaning. Any inconsistencies that remained after this
data-entry stage were dealt with at the time of data cleaning (see below).
The rules for data entry meant that:
Responses to categorical questions were generally coded as “1” if the first option
(checkbox) was used, “2” if the second option was marked, and so on.
Responses to “check-all-that-apply” questions were coded as either “1” (marked)
or “9” (omitted or invalid).
Responses to numerical or scale questions (e.g. school enrolment) were entered “as
is”, that is, without any correction or truncation, even if the value was outside the
originally expected range (e.g. if a teacher reported that he or she spent 80 hours a
week teaching students in school). If countries needed to enter values that exceeded
the defined variable width, they entered these few values on an Excel sheet and
submitted it to the ISC, which then included these values during its data processing
work.

143
TALIS 2018 TECHNICAL REPORT © OECD 2019
Likewise, responses to filter questions and filter-dependent questions were entered
exactly as filled in by the respondent, even if the information provided was logically
inconsistent.
If responses were not given at all, not given in the expected format, ambiguous or
conflicting in any other way (e.g. selection of two options in a multiple-choice
question), the corresponding variable was coded as “omitted or invalid”.
During data capture, TALIS did not use a separate code to identify “not
administered” questions, such as those that were misprinted. In these rare cases, the
“omitted or invalid” code was used.
Data entered with DME were automatically validated. First, the entered respondent ID had
to be validated with a five-digit code – the checksum, generated by the IEA Windows
Within-School Sampling Software (WinW3S). A mistype in either the ID or the checksum
resulted in an error message that prompted the data-entry person to check the entered
values. The data verification module of DME also enabled identification of a range of
problems, such as inconsistencies in identification codes and out-of-range or otherwise
invalid codes. These potential problems had to be resolved or confirmed before data entry
could resume.
To check the reliability of the data entry within the participating countries/economies, their
national centres had to have at least 100 completed principal questionnaires and 5% of the
total number of completed teacher questionnaires (or at least a minimum of 100 teacher
questionnaires) entered twice by different staff members as early as possible during the
data-capture period. This procedure allowed NDMs and the ISC to identify possible
systematic or incidental misunderstandings or mishandlings of data-entry rules and to
initiate appropriate remedial actions, for example, retraining national centre staff. The
acceptable level of disagreement between the originally entered and double-entered data
was established at 1% or less; any value above this level required a complete re-entry of
data. This restriction guaranteed that the margin of error observed for processed data
remained well below the required threshold.
Before sending the data to the ISC for further processing, national centres carried out
mandatory verification steps on all entered data and undertook corrections as necessary.
The corresponding routines were included in the DME software, and the data files were
systematically checked for duplicate identification codes and data outside the expected
valid range or values defined as valid. NDMs reviewed the corresponding reports, resolved
any inconsistencies and, where possible, corrected problems by looking at the original
survey questionnaires. NDMs also verified that all returned non-empty questionnaires
were, in fact, entered and that the availability of data corresponded to the participation
indicator variables and entries on the tracking forms.
While the questionnaire data were being entered, the NDM at each national centre used the
information from the teacher tracking forms to verify the completeness of the materials. He
or she then entered the participation information (e.g. whether the teacher concerned had
left the school permanently between the time of sampling and the time of administration)
in the WinW3S software.
In addition to submitting the data files described above, national centres provided the ISC
with detailed data documentation, including hard copies or electronic scans of all original
teacher tracking forms and a report containing information on data-capture activities
collected via the online survey activities questionnaire. The ISC already had access, as part
144
TALIS 2018 TECHNICAL REPORT © OECD 2019
of the layout verification process, to electronic copies of the national versions of all
questionnaires and the final national adaptation forms (NAFs).
8.4. Data checking, editing and quality control at the IEA Hamburg
Once the national centres submitted their data to the ISC, data processing commenced. The
objective of this process was to ensure that the data adhered to international formats, that
information from principals and teachers could be linked across different survey files and
that the data accurately and consistently reflected the information collected within each
participating country/economy. The ISC went to great lengths to ensure that the data
received from participating countries/economies were internationally comparable and of
high quality. The foundation for quality assurance had been laid down before the data were
submitted to the ISC through the provision of manuals, training and software designed to
standardise a range of operational and data-related tasks, and through verification of the
content and layout of the NAFs, paper questionnaires, online questionnaires and
codebooks.
The WinW3S software performed the within-school sampling operations, strictly
adhering to the sampling rules defined by TALIS (see Chapter 5 for more details
on school sampling). The software created all necessary listing and tracking forms
and stored school-specific and teacher-specific information, such as gender and
participation status. The software also generated login credentials that consisted of
the unique ID and the corresponding checksum (the five-digit validation code) that
were used for both survey administration modes. For the purpose of paper
administration, WinW3S created questionnaire labels that included the generated
login credentials. It also included a participation rate estimator that kept NDMs up
to date on their current participation rate according to the already returned paper
questionnaires or submitted online questionnaires. The ISC asked NDMs to begin
uploading their weekly participation rate reports as soon as data collection began.
The DME software enabled entry of all questionnaire data in a standard,
internationally defined format. Data entered with the DME software were
automatically validated. This process included validation of login credentials and a
range of other issues, such as the uniqueness of the ID or out-of-range or otherwise
invalid codes. Whenever the software flagged such issues, it also prompted the
individuals entering the data to resolve or to confirm the inconsistencies before
resuming data entry. In addition, special variables called “check variables” were
used during data entry to avoid any individual entering values for the wrong
question. The ISC asked national study centres to use the DME software for data
entry. However, if the centres’ countries/economies wanted to use different tools to
enter their data, the DME gave them the option of importing these data and
verifying them with the same range of checks used by those participating
countries/economies entering the data directly via the DME software. The software
also included a range of data-verification checks that NDMs had to perform during
data capture and after data entry.
A complex study such as TALIS 2018 required a correspondingly complex data cleaning
design. Accordingly, the ISC developed processing tools in Structured Query Language
(SQL) and, where necessary, in Statistical Package for the Social Sciences (SPSS). The
ISC took the following steps to ensure that programmes ran in the correct sequence, that
no special requirements were overlooked and that the cleaning process was implemented
independently of the persons in charge.

145
TALIS 2018 TECHNICAL REPORT © OECD 2019
Before the data-cleaning programmes were applied to real data, all of them were
thoroughly tested using simulated data sets containing all expected problems or
inconsistencies.
To document versions and updates, all incoming data and documents were
registered in a specific material receipt database. The date of arrival and any
specific issues meriting attention were recorded.
All national adaptations and all detected deviations from the international data
structure were recorded in a “national adaptation database” and verified against the
national adaptation form (NAF), the national instruments, the codebooks and the
contents of the data. The reports from this process are available for data analysts in
the TALIS 2018 and TALIS Starting Strong Survey 2018 User Guide (OECD,
forthcoming[1]).
Cleaning was organised according to rules strictly and consistently applied to all
national data sets, making deviations in the cleaning sequence impossible.
All systematic or manual corrections made to data files were implemented and
recorded in specific cleaning reports that the TALIS Consortium and the NPMs
then reviewed and approved.
On completion of the data cleaning for a participating country/economy, all
cleaning checks were repeated from the beginning to detect any problems that
might have been inadvertently introduced during the cleaning process itself.
Figure 8.1 provides a schematic overview of this iterative process conducted in
co-operation with the national centres. The following subsections of this chapter give a
more detailed description of the sequential data-cleaning steps displayed in Figure 8.1.
8.4.1. Import, documentation and structure check
Data cleaning began with an analysis of the submitted data-file structures and a review of
data documentation on the teacher tracking forms. Most participating countries/economies
submitted all required documentation along with their data, which greatly facilitated the
data checking. The ISC contacted the participating countries/economies that returned
incomplete data or documentation to obtain that missing material. As soon as all required
materials were received, further data processing began.
All available codebooks and data were imported from the source files and combined in the
SQL database. This content included the respondents’ answers collected on line, the
respondents’ data entered into the DME, and all sampling and tracking information
generated by and collected with WinW3S. During this step, the data originating from the
paper questionnaires and the online questionnaires were combined and checked for
structural agreement, with all sample and tracking information also taken into
consideration. In all cases, the data from both administration modes were structurally
equivalent and used the same valid and missing codes. The early combination of these data
in the import stage ensured that data resulting from both administration modes were fed
through the same data processing steps and checks described in the remainder of this
chapter. Also, because the international structure of the files did not differ, data from all
ISCED levels were processed with the same checks in the same database.

146
TALIS 2018 TECHNICAL REPORT © OECD 2019
Figure 8.1. Iterative data-cleaning process
The structure check implemented at the ISC looked for differences between the
international and the national file structures. As described above, some participating
countries/economies made structural adaptations to the questionnaires, the extent and
nature of which differed greatly across the countries/economies. Whereas some
participating countries/economies administered the questionnaires without any change,
except for translations and necessary cultural adaptations, others inserted or removed
questions or options within existing international variables or added entirely new national
variables.

147
TALIS 2018 TECHNICAL REPORT © OECD 2019
Given the associated risk of deviating from the international data structure, NPMs wishing
to make such changes had to follow certain strict rules to allow unequivocal integration of
nationally adapted variables for international comparison. Where necessary, the ISC
modified the data according to the international design to ensure that the resulting data were
internationally comparable. For instance, the ISC recoded (mapped) additional national
options in multiple-choice questions in a way that ensured they adhered to the international
code scheme. National variables were created to hold the original values for later use in the
national reports.
NPMs and NDMs received detailed reports on structural deviations together with
documentation on how the ISC resolved them. In a few cases, data were not available for
certain variables because the corresponding question was not administered nationally; see,
in this regard, the TALIS 2018 and TALIS Starting Strong Survey 2018 User Guide (OECD,
forthcoming[1]). In a few instances, data had to be removed from the IDB because the
information was not internationally comparable due to errors in translations that were
spotted only after the data had been collected.
8.4.2. Identification variable and linkage cleaning
To uniquely identify, track and document each participant and each corresponding
questionnaire in a survey, each record in a data file needs to have an identification number
specific to it. The existence of records with duplicate identification (ID) numbers in a file
implies an error. Because, in TALIS, the uniqueness of IDs was already guaranteed through
use of the DME software and the IEA Online Survey System (OSS), duplicate IDs could
only occur in two situations: first, if the respondent administered the questionnaire on line
and also completed a paper questionnaire; and, second, if a country/economy administered
more than one language and the respondent completed the online questionnaire in two
languages. If two records shared the same ID number and contained exactly the same data,
one of the records was deleted and the other was left in the database. If the records
contained different data (apart from the ID numbers) and it was impossible to identify
which record contained the “authentic” data, NPMs were consulted to resolve the matter.
In TALIS, data collected at the school level were recorded in the principal file. It was
crucial that the records from these files could then be linked to the multiple teacher-level
records for that school. The linkage was implemented through a hierarchical ID numbering
system and was also cross-checked against the tracking forms.
Further ID cleaning focused on consistent tracking of information between the data used
for listing, sampling and tracking in WinW3S and the actual responses in the
questionnaires. Whenever necessary, the variables pertaining to teachers’ gender, year of
birth, exclusion status and participation status were verified and checked against the
original paper version of the teacher tracking form.
The ISC sought close co-operation with the national centres in order to resolve ID or
linkage inconsistencies. For this purpose, NPMs and NDMs received standardised reports
containing each identified inconsistency. Once the ISC had finalised the ID, linkage,
participation and exclusion information, it transferred these data to Statistics Canada, which
used this information to calculate participation rates, exclusion rates and, finally, sampling
weights.

148
TALIS 2018 TECHNICAL REPORT © OECD 2019
8.4.3. Resolving inconsistencies in questionnaire data
After matching the national and international data structures as specified in the international
codebooks and after resolving all ID and linkage issues, the ISC applied a series of standard
cleaning rules to the data. The process, conducted through the SQL programmes developed
at the ISC, identified and, in many cases, automatically corrected inconsistencies in the
data. The IEA Hamburg prepared detailed documentation of all cleaning checks,
procedures and actions applied to the data. It then sent these to the national centres and
explained them during the fourth NPM meeting in October 2018.
Filter questions, which appeared in certain positions in the TALIS 2018 questionnaires,
were used to direct respondents to a particular question or section of the questionnaire.
Filter questions and their dependent questions were treated automatically in most cases. If
the filter question contained a value and the respondent skipped the dependent questions
for a valid reason, the dependent variables were coded as “logically not applicable”. If a
response to a filter question was equivalent to “no”, meaning that the dependent questions
were not applicable to that respondent, and yet that person answered the dependent
questions in an ambiguous pattern, the dependent variables were set to “logically not
applicable” regardless of the value originally recorded in the dependent variable. Questions
12 and 13 in the teacher questionnaire were exceptions to this general rule.
Split-variable checks were applied to “yes/no” questions for which the responses needed to
be coded into several variables. For example, Question 15 in the teacher questionnaire (i.e.
TQ-15) listed a number of subjects and asked teachers to indicate whether they taught them
(by marking the “yes” box) or not (by marking the “no” box) for each subject. Occasionally,
teachers marked just the “yes” boxes but left the “no” boxes unchecked, resulting in omitted
values in the data file. In those instances where a combination of “yes” and “omitted or
invalid” responses was found for a given question in the data, it was assumed that the
unmarked boxes actually meant “no” and that the corresponding values were therefore
imputed.
Split-variable checks were also applied to “check-all-that-apply” questions for which the
responses needed to be coded into several variables. For example, Question 20 in the
principal questionnaire (i.e. PQ-20) asked who, within the school, had significant
responsibility for a given task. Principals could mark as many checkboxes as appropriate
corresponding to different members of the school as well as to other relevant people. In
line with the split-variable checks applied to “yes/no” questions, the check boxes coded as
“omitted or invalid” were recoded as “not checked” for those cases where some checkboxes
were left omitted, yet others were marked “checked” and “not checked”. If all of the
checkboxes within a question were marked as “not checked”, the whole question was
recoded to “omitted or invalid”.
The TALIS 2018 questionnaires included several questions that consisted of a list of
numeric variables. These questions asked respondents to enter either a percentage
(e.g. “percentage of class time” in TQ-39) or a number (e.g. “years of work experience” in
TQ-11). In cases where some of the questions on the list were left omitted while others
were answered with a value, the omitted values were recoded to zero (“0”).

149
TALIS 2018 TECHNICAL REPORT © OECD 2019
The individual responses to percentage questions were summed. These values were set to
“omitted or invalid” if they fell outside the 90 to 110 range (PQ-11 and PQ-21), or the 45
to 110 range (TQ-39), or if any of them were larger than 100.
Variables with implausible numerical values were also set to “omitted or invalid”. For
example, TQ-38 asked respondents to give the average number of students in the target
class. Values exceeding 100 were set to “omitted or invalid”.
Finally, inconsistencies between the listing information in the teacher tracking forms and
the actual responses of the teachers regarding their age and gender were resolved in a
manner that gave precedence to the teacher-supplied information.
The number of inconsistent or implausible responses in the data files varied from
one country/economy to another, but no national data were completely free of inconsistent
responses. Each problem was recorded in a database and identified by a unique problem
number. The entry also included a description of the problem and of the automatic action
taken by the software programme or the manual action taken by ISC staff. Staff referred
issues that could not be corrected using systematic rules to the relevant NPM so that he or
she could check the original data collection instruments and tracking forms and trace the
source of the inconsistency. Whenever possible, staff at the ISC suggested a solution and
asked the NPMs either to accept it or to propose an alternative. Data files were then updated
to reflect the agreed-upon solutions. Both systematic corrections and those apparent on a
case-by-case basis were applied directly in SQL programme syntax and carried out
automatically for each cleaning run.
If an NPM could not solve a problem by inspecting the instruments and forms or could not
suggest a satisfying solution or explanation, the TALIS Consortium defined the final
cleaning rules. The ISC and the OECD Secretariat together agreed to any systematic
content edits and documented them for use by the NPM.
8.4.4. Final action for logically inconsistent filter/dependent responses
If the associated filter question for each of the following questions (with the exception of
TQ-12/13) was answered in the negative (“no”), the dependent variables were set to
“logically not applicable” regardless of the originally recorded value in the dependent
variable: PQ-15 (Part A vs. B, PQ-18/19, PQ-23/24 and 25, PQ-31/32 and 33, PQ-31a/PQ-
32, PQ-34/35 and 36, PQ-37/38, TQ-4/5 and 6, TQ-12/13, TQ-19/20, TQ-22/23 to 26, TQ-
25/26, TQ-29/30 and 31, TQ-30/31, TQ-36/37 to 43, TQ-44/45, TQ-46/47 and TQ-56/57
to 58.
A special treatment was implemented for PQ-24 (“Not used in this school” vs. all other
categories of this question), TQ-19 (“No” vs. all other categories of this question) and TQ-
29 (“I have never received this feedback in this school” vs. all other categories of this
question). The respective category (i.e. “Not used in this school”, “No”, or “I have never
received this feedback in this school”) was set to “not checked” to resolve logical
inconsistencies that appeared within the dimension. If, for example, in the case of TQ-29,
a respondent marked the category “I have never received this feedback in this school” for
the first dimension (i.e. TQ-29A4) but also marked any of the other categories within this
same dimension (i.e. TQ-29A1 to A3: “External individuals or bodies”, “School principal”
or “Other colleagues within the school”), the category “I have never received this feedback
in the school” (i.e. TQ-29A4) was set to “not checked”.
150
TALIS 2018 TECHNICAL REPORT © OECD 2019
The IEA Hamburg and Statistics Canada agreed to a special treatment for TQ-12/13 for
weighting purposes and calculation of the teacher multiplicity factor (WGTADJ4) (see
Chapter 9 for more details).
If TQ-12 is “yes” (1) and TQ-13 is “omitted or invalid” or zero (0) → recode TQ-12
to “no” (2) and TQ-13 to “logically not applicable”.
If TQ-12 = “no” (2) and TQ-13 is zero (0) or one (1) → recode TQ-13 to “logically
not applicable”.
If TQ-12 is “no” (2) but TQ-13 is two (2) or more → recode TQ-12 to “yes” (1).
8.4.5. Final action for yes/no lists with more than two items
For those questions with lists that were partially answered with “yes” and “omitted or
invalid”, all omitted responses were recoded to “no”. These questions included PQ-07, PQ-
15 (Part A), PQ-33, PQ-38, PQ-39, TQ-06A (Part A), TQ-20, TQ-22, TQ-23, TQ-24, TQ-
26, TQ-31, TQ-47, TQ-56 and TQ-57.
8.4.6. Final action for check-all-that-apply questions with more than two items
For those questions that had checkboxes that were partially “checked”, “not checked” and
“omitted or invalid”, all omitted responses were recoded to “not checked”; for checkboxes
that were all marked “not checked”, all responses were recoded to “omitted or invalid”.
The relevant questions were PQ-20, PQ-24, TQ-15, TQ-19 and TQ-29.
8.4.7. Final action for out-of-range percentage sums
With PQ-11, the entire set of variables was set to “omitted or invalid” if the sum of
percentages fell outside of 90–110. If any individual variable was larger than 100, this
variable was set to “omitted or invalid”.
For PQ-21, the entire set of variables was set to “omitted or invalid” if the sum of
percentages fell outside of 90–110. If any individual variable was larger than 100, the
variable was set to “omitted or invalid”.
For TQ-39, the entire set of variables was set to “omitted or invalid” if the sum of
percentages fell outside of 45–110. If any individual variable was larger than 100, the
variable was set to “omitted or invalid”.
8.4.8. Final action for out-of-range/implausible numerical variables
The treatments specified for the following questions were:
Treatment for PQ-4a/b: if value is higher than 50 → set to “omitted or invalid”.
Treatment for PQ-4c/d/e: if value is higher than 49 → set to “omitted or invalid”.
Treatment for PQ-13a: if value is zero (0) in the questionnaire → set to “omitted or
invalid”.
Treatment for PQ-13d: if value is zero (0) in the questionnaire → set to “omitted or
invalid”.
Treatment for PQ-13a–e: if value is higher than 500 → set to “omitted or invalid”.

151
TALIS 2018 TECHNICAL REPORT © OECD 2019
Treatment for PQ-16: if value is zero (0) in the questionnaire → set to “omitted or
invalid”.
Treatment for PQ-42: if sum of self-reported principal age (PQ-2) and PQ-42 is
higher than 100 → set to “omitted or invalid”.
Treatment for TQ-05: if value is between 40 and 99 → add 1900 so values are
changed to 1940–1999.
Treatment for TQ-05: if value is not between 1940 and 2018 → set to “omitted or
invalid”.
Treatment for TQ-11a/b: if value is higher than 58 → set to “omitted or invalid”.
Treatment for TQ-11c/d: if value is higher than 57 → set to “omitted or invalid”.
Treatment for TQ-16/17/18: if value is higher than 120 → set to “omitted or
invalid”.
Treatment for TQ-38: if enrolment is zero (0) or larger than 100 → set to “omitted
or invalid”.
Treatment for TQ-50: if sum of self-reported teacher age (TQ-2) and TQ-50 is
higher than 100 → set to “omitted or invalid”.
8.4.9. Final recoding for inconsistent teacher age and gender in listing and
questionnaire information
The recoding instructions for PQ-1, TQ-1, TQ-2, GENDER (gender on listing form) and
ITBIRTHY (birth year on listing form) were as follows:
Teacher birth year (ITBIRTHY): if value is outside the range of 1941–2000 → set
to “omitted or invalid”.
Gender (TQ-1 vs. GENDER): (a) believe questionnaire information and substitute
listing information gender in case it is missing or inconsistent; (b) impute missing
questionnaire value from listing if questionnaire variable was omitted.
Teacher age (TQ-2, ITBIRTHY): (a) believe questionnaire information and delete
listing information if inconsistent; (b) impute missing questionnaire value from
listing form.
Teacher age (TQ-2): if outside of range of 18-76 → set to “omitted or invalid”.
Principal age (PQ-2): if outside of range of 23-73 → set to “omitted or invalid”.
8.4.10. Handling of missing data
During the TALIS manual data entry at the national centres using DME, two types of
entries were possible: valid data values and missing data values. Data-entry staff could
assign either the valid values or a value for “omitted or invalid”. Later, at the ISC, additional
missing values were applied to the data for further analyses and to differentiate response
behaviour.

152
TALIS 2018 TECHNICAL REPORT © OECD 2019
Four missing codes were used in the international database:
Omitted or invalid (9): the respondent had the opportunity to respond to the
question but did not do so or provided an invalid response. This value was also
assigned in extremely rare cases where questions were misprinted or otherwise not
legible.
Not administered (8): If the returned questionnaire was empty, all variables
referring to that instrument were coded as “not administered” (unit non-response).
In addition, a country/economy may have chosen not to administer a certain
question in its national questionnaire as documented in the NAF. The variables
corresponding to the question that was not administered were coded as “not
administered”. The same rule applied if all respondents for a questionnaire left out
a particular variable.
Not reached (7): A special missing code was assigned to questions that were
deemed “not reached” to distinguish them from omitted responses. Omitted
questions were those that a respondent most probably read but either consciously
decided not to answer or accidentally skipped. In other words, the respondent
started answering the questions but stopped answering before the end of the
questionnaire, probably because of a lack of time, interest or willingness to
co-operate. Not reached variables were exclusively located towards the end of the
questionnaires. The following algorithm was used for the “not reached” code. First,
the last valid answer given in a questionnaire was identified. Next, the first omitted
response after this last answer was coded as “omitted or invalid”. However, all
following responses were then coded as “not reached”. For example, the response
pattern “1 9 4 2 9 9 9 9 9 9” (where “9” represents “omitted or invalid”) was recoded
to “1 9 4 2 9 7 7 7 7 7” (where “7” represents “not reached”). When recoding
“omitted or invalid” values to “not reached”, all “not administered” values were
ignored. For example, the pattern “3 1 5 2 9 9 9 8 9 9” would have been recoded to
“3 1 5 2 9 7 7 8 7 7”.
Logically not applicable (6): the respondent answered a preceding filter question in
a way that made the following dependent questions not applicable to him or her.
This value was assigned only during data processing.
8.5. Interim data products
Building the TALIS international database was an iterative process during which the ISC
provided the OECD Secretariat and NPMs with a new version of data files whenever a
major step in data processing was completed. This process guaranteed that NPMs had a
chance to review their data and run additional plausibility and statistical checks to validate
the data. The data products that the ISC released to the OECD Secretariat and each NPM
included the teacher and principal data files as well as data summaries. All interim data
were made available to the OECD Secretariat in full, whereas each participating
country/economy received only its own data.
The ISC sent the first version of cleaned and weighted data to the OECD Secretariat at the
end of September 2018, by which time all known identification, linkage and content issues
in these data had been resolved. Estimation weights and variables facilitating variance
estimation were also included. To protect respondents’ identity, the ISC scrambled the
respondents’ IDs. These data were also used to produce the first set of draft tables for the

153
TALIS 2018 TECHNICAL REPORT © OECD 2019
international report, presented to NPMs at the fourth NPM meeting in Seoul, Korea, in
October 2018. Before this meeting, all NPMs received a version of their own cleaned and
weighted data, giving them a chance to review their data and the tables produced by the
OECD Secretariat for accuracy and validity.
During the fourth NPM meeting, NPMs were able to raise any issues concerning their data
that had, thus far, gone unnoticed. This process resulted in a second, updated data version
that concluded the main survey’s field work and included scale scores. The ISC sent this
version to the OECD Secretariat and NPMs at the end of November 2018.
All interim data products were accompanied by detailed data processing and weighting
documentation and summary statistics. The latter contained weighted and unweighted
univariate statistics and frequencies for all questionnaire variables for each
country/economy. For categorical variables, which represent the majority of variables in
TALIS, the percentages of respondents choosing each of the response options were
displayed. For numeric or count variables, various descriptive measures were reported.
These included the minimum, the maximum, the mean, the standard deviation, the median,
the mode, percentiles and quartiles. For both types of variables, the percentages of missing
information due to respondents omitting or not reaching a particular question were
reported. These summaries were used for a more in-depth review of the data at the
international and national levels in terms of plausibility, unexpected response patterns,
suspicious profiles and so on.
8.6. Building the international database
For the draft and final IDB, data cleaning at the ISC ensured that the information coded in
each variable was, in fact, internationally comparable, that national adaptations were
reflected appropriately in all variables concerned and that all records could be successfully
linked across the two levels. For countries/economies participating in the TALIS-PISA link
option, a variable was included that enabled later linkage to schools in the PISA 2018
database (PISASCHOOLID).
The interim data products described above and the draft and final (public-use) international
databases had two key differences:
All interim products included one record for each sampled unit (school or teacher),
even if the school did not return the corresponding questionnaire or returned it
empty. In contrast, the draft and final IDB included only records that satisfied the
sampling standards. Data from those units that either did not participate or did not
pass adjudication (e.g. because within-school participation was insufficient) were
removed.
To protect the confidentiality of respondents’ information, disclosure avoidance
measures were applied at the international level (1) consistently for all participating
countries/economies and (2) in specific national data sets. These measures were
implemented for all data versions and exports of the IDB for use by all other
countries/economies and public users.
The measures applied to all international-level data sets involved the following:
Scrambling of the teacher identifier (IDTEACH) and school identifier
(IDSCHOOL): Because these identifiers were scrambled, they did not match those
used during data collection; however, the structural link between the school and

154
TALIS 2018 TECHNICAL REPORT © OECD 2019
teacher level (the variable IDSCHOOL in the teacher file and the first four digits
of any IDTEACH) was maintained. Unique matching tables were created for each
country/economy and made available to authorised individuals within that
country/economy.
Variables used purely for the stratification of the teacher sample, that is, birth year
(ITBIRTHY) and gender (GENDER): These were removed. Only the gender
(TT3G01) and age (TT3G02) variables, as collected in the questionnaire, were
retained.
Variables used purely for stratification of schools, that is IDSTRATE and
IDSTRATI: These were removed to prevent identification of geographical or
organisational groups. Because the stratum information is mostly of interest for
national-level analysis, it was of course made available to the country/economy
concerned. Researchers from other countries wanting to conduct analysis by
stratification will need to request the stratification variables directly from the
respective country/economy.
Information used in the calculation of final sample and replicate weights (for the
school level, WGTFAC1 and WGTADJ1; for the teacher level, WGTFAC1,
WGTADJ1, WGTFAC2, WGTADJ2, WGTADJ3 and WGTADJ4): This
information was removed from the IDB because it could allow identification of
stratification cells.
Replication zone and unit variables (BRRSZONE, BRRSREP, BRRTZONE and
BRRTREP): These were dropped from public-use micro-data because they could
enable indirect identification of schools.
The process of building the IDB complied, at all times, with the OECD’s rules for the
processing and transfer of personal data and, where relevant, with rules stipulated by
national or regional legislation for the protection of personal data (e.g. the European
Union’s General Data Protection Regulation).
To protect its respondents’ privacy, Iceland decided to withdraw all data from the IDB.
This information can, therefore, be procured only by applying directly to this country.1
After each NPM and the OECD Secretariat had agreed on data-release policy and
confidentiality agreements, a draft IDB that included data from all participating
countries/economies was made available at the end of February 2019, prior to publication
of the first international report in June 2019. This release enabled participating
countries/economies to replicate results presented in the draft chapters of the international
report. This data version was also used in an international database training session that
ISC staff held in Lüneburg, Germany, in March 2019. However, only accredited members,
that is, the people who signed the confidentiality agreement with the OECD Secretariat,
had access to it. Non-accredited members had access to a separate mock database.
The final public-use IDB was scheduled for release in May 2019, supplemented by full
documentation in the TALIS 2018 and TALIS Starting Strong Survey 2018 User Guide
(OECD, forthcoming[1]). The database, which contains data from schools and teachers from
83 different samples in 48 participating countries/economies across 5 continents, provides
a unique resource for policymakers and analysts.
Although data for all participating TALIS 2018 entities are included in the IDB, the sample
adjudication process determined that the ISCED level 1 teacher and principal data for
Australia and the Netherlands and the ISCED level 2 principal data for Australia cannot

155
TALIS 2018 TECHNICAL REPORT © OECD 2019
reliably represent the population from which the sample was drawn. The sampling
adjudication variable INTAL18 was therefore set to zero. When conducting any analyses,
database users need to ensure that they use only those cases where INTAL18 equals 1.
Reference
OECD (forthcoming), TALIS 2018 and TALIS Starting Strong Survey 2018 User Guide,
OECD, Paris.
[1]
Note
1 Please contact the TALIS team at the OECD to be put in contact with Iceland.

156
TALIS 2018 TECHNICAL REPORT © OECD 2019
Chapter 9. Estimation weights, participation rates and sampling error
This chapter covers three important aspects of the quality of the TALIS 2018 outcomes. The
first is the weighting of the data to correct for unequal probabilities of selection and to
produce unbiased estimates. Descriptions are provided of how each component of the final
estimation weights was defined and how those components were assembled into the final
estimation weights. The second aspect, participation rates, is also described. Finally, the
balanced repeated replication (BRR) weights for the estimation of the sampling error, the
third aspect, are detailed.
The statistical data for Israel are supplied by and under the responsibility of the relevant Israeli authorities. The
use of such data by the OECD is without prejudice to the status of the Golan Heights, East Jerusalem and Israeli
settlements in the West Bank under the terms of international law.

157
TALIS 2018 TECHNICAL REPORT © OECD 2019
9.1. Overview
This chapter covers three important aspects of the quality of the TALIS 2018 outcomes:
the weighting of the data to correct for unequal probabilities of selection and produce
unbiased estimates, the participation rates and the estimation of sampling error.
Although the international sampling design was prepared as a self-weighting sampling plan
of teachers (whereby each individual ultimately had the same final estimation weight), the
conditions in the field, school and teacher non-response, and the co-ordination of multiple
samples made it impossible to fulfil that ideal plan. In the end, in most participating
countries, the national sampling plan was a stratified multi-stage probability sampling plan
with unequal probabilities of selection.
Because the sample of schools and principals was an intermediary step, that is, a by-product
of the teacher sampling design, schools and principals had the same design weights. In a
few participating countries, namely Cyprus,1 Iceland, Malta, the Netherlands, the Russian
Federation, Singapore and the United Arab Emirates, the canonical plan was modified to
suit local conditions (see Chapter 5, Annex E). How each component of the final estimation
weight was defined and how those components were assembled into the final estimation
weight are detailed below.
The section of this chapter covering the second aspect presents a description of the
participation rates and how they were computed. Annex E provides the results for each
participating country and each survey in which they participated.
Because of the unequal weights and because of the structure of the samples, sampling error
must be estimated using the design and weights. Failure to do this can translate into severely
biased estimates of sampling error. Correctly estimating sampling error for complex
samples is often a daunting task but simple and approximately unbiased methods are
available. TALIS 2018, like its predecessors, opted for balanced repeated replication (BRR)
not only because of this method’s statistical properties (consistency, asymptotic
unbiasedness) and its portability (one formula fits all types of parameter estimates) but also
because it is comparatively easy to compute.
The last section of this chapter explains how the replicates were created and how the BRR
estimates of sampling error were computed. These estimates of the sampling error were
another key element of the statistical quality of the TALIS survey outcomes.
A more detailed description of the survey design and its implementation can be found in
Chapter 2, 5 and 6 of this report, in the TALIS 2018 Survey Operations Procedures Unit 1:
Sampling Schools, in the TALIS 2018 National Project Managers Manual and in the TALIS
2018 School Co-Ordinator Manual (internal documents).
9.2. Estimation weights
The statistics produced for TALIS 2018 were derived from data obtained through samples
of schools, school principals and teachers. For these statistics to be meaningful for a
country/economy, they needed to reflect the whole population from which they were drawn
and not merely the sample used to collect them. The process of going from the sample data
to information about the parent population is called estimation. When the sample is
equiprobable, unstratified and unclustered, simple sample averages may suffice as
estimates of population averages (e.g. the average number of ISCED level 2 teachers per

158
TALIS 2018 TECHNICAL REPORT © OECD 2019
school). However, sample counts do not suffice as estimates of population totals (e.g. the
total number of ISCED level 2 teachers in a country).
The estimation weight or final weight is the device that allows the production of country-
level estimates from the observed sample data. The estimation weight indicates the number
of units that a sampled unit represents. The final weight is the combination of many factors
reflecting the probabilities of selection at the various stages of sampling and the response
obtained at each stage. Other factors may also come into play as dictated by special
conditions to maintain unbiasedness of the estimates (e.g. adjustment for teachers working
in more than one school).
Because TALIS 2018 consisted of a compulsory core segment (ISCED level 2) and
three optional segments (ISCED level 1, ISCED level 3 and the TALIS-PISA link),
estimation weights had to be computed independently for each segment. This requirement
held true even when samples were co-ordinated across TALIS segments (ISCED levels 2
and 3, for example) or across survey programmes (TALIS and TIMSS,2 for example).
Basically, final weights are the product of a design or base weight and of one or many
adjustment factors; the former is the inverse of the selection probability and the latter
compensates for random non-response and other random occurrences that could, if not
accounted for, induce biases in the estimates. These design weights and adjustment factors
are specific to each stage of the sample design and to each explicit stratum used by the
design. Clearly, in instances where the participating countries/economies adapted the
general sample design of TALIS 2018 to their own conditions, the estimation weights had
to conform to these national adaptations.
The following are the conventional notations used in this chapter. As usual, the letters h, i,
and j are used as subscripts, the lower-case letters k, l, m, n, r and t refer to the sample, and
the upper-case letters H, L, M and N refer to the population.
Each participating country has H explicit strata and the index h = 1, …, H points to
the explicit stratum. If no explicit strata were defined, then H = 1.
In each explicit stratum, a sample of size nh schools was drawn from the Nh schools
forming stratum h. The index i = 1, …, nh, therefore, points to the ith sampled
school in stratum h.
Each school i = 1, …, nh within the explicit stratum h has a measure of size (MOS)
noted as Mhi; the sum of the individual measures of size is noted as Mh.
In each responding school, a sample of mhi teachers was drawn from the listing of
Lhi teachers. If no changes had occurred in the school since the creation of the
sampling frame, then Lhi = Mhi, but this was seldom the case. If the selected school
was large enough, mhi = 20 by design. The index j = 1, …, mhi points to the teachers
and mhi can, therefore, differ from 20 if local conditions dictated that the sample
size should differ. For example, if the size of the listing was Lhi = 18, then all
teachers were selected and mhi = 18.
9.3. Weights for school and principal data
9.3.1. Design weight for school and principal data
The first stage of sampling in TALIS 2018 consisted of drawing the sample of schools. In
most of the participating countries/economies, the sample of schools followed a systematic
random sampling scheme with probability proportional to size (PPS). Thus, a school base

159
TALIS 2018 TECHNICAL REPORT © OECD 2019
weight is needed to represent this first stage of sampling. If a census sample of schools was
implemented in a country or in an explicit stratum of a country, then the school base weight
is set to 1.
Use of the above notation established the school base weight for each school i = 1, …, nh
and each explicit stratum h = 1, …, H, as:
𝑊𝐺𝑇𝐹𝐴𝐶1ℎ𝑖 =𝑀ℎ
𝑛ℎ×𝑀ℎ𝑖 .
In those countries (Cyprus,3 Iceland, Malta and the United Arab Emirates) where all schools
were selected (i.e. n = N), there was only one stratum, and WGTFAC1i = 1 for all i = 1, ...,
N. In the Russian Federation, where geographical regions were first selected at random, the
weight component corresponding to that selection was incorporated into the school base
weight (WGTFAC1).
9.3.2. Weight adjustment for school or principal non-response
Despite all efforts to secure the participation of all selected schools, some were unable or
unwilling to participate. Therefore, the schools represented by the non-participating
schools needed to be represented by those that did participate.
If we assume that the respondents and non-respondents are similar within the stratum, a
non-response adjustment factor is required within each explicit stratum. It is important to
remember at this point that a participating school is one for which the principal returned a
questionnaire and had completed at least one item in it.
For each explicit h = 1, …, H, if rh schools out of the nh selected schools participated in
TALIS 2018 (i.e. their principals each returned a questionnaire) and if dh schools were
closed or out of scope, the non-response adjustment factor was:
𝑊𝐺𝑇𝐴𝐷𝐽1ℎ = {
𝑛ℎ−𝑑ℎ
𝑟ℎ for participating schools (returned principal questionnaire)
1 for closed or out-of-scope schools0 for non-participating schools (no principal questionnaire)
In countries where a census was conducted, the school non-response adjustment factor
WGTADJ1i = (N-d) / r for all schools i = 1, ..., N, where N is the total number of schools on
the sampling frame, d is the number of sampled units found to be closed or out of scope
and r is the number of participating schools.
At the time of weighting, the “out-of-scope” records on the file needed to be assigned a
value that could be used when the final weight was assembled at a later step. The value 1
is neutral and thus assigned to those records. Later in the process, a binary flag (INTAL18,
see Chapter 8) was set to 0 for the non-responding and out-of-scope records, indicating that
they were not to be used during the compilation of tables or modelling of data.
While “closed or out-of-scope schools” did not provide data to the estimates of interest,
they still carried a positive weight because they represented those other closed or out-of-
scope schools that were on the frame but not in the sample.
9.3.3. Final (estimation) school weight for school and principal data
As described earlier, because the school estimation weight is the product of the school base
weight and the school non-response adjustment factor, it should be used for estimation of
school-related parameters.

160
TALIS 2018 TECHNICAL REPORT © OECD 2019
The final school weight (school estimation weight) for each participating school i = 1, …, rh and each explicit stratum h = 1, …, H was given as:
𝑆𝐶𝐻𝑊𝐺𝑇ℎ𝑖 = 𝑊𝐺𝑇𝐹𝐴𝐶1ℎ𝑖 ×𝑊𝐺𝑇𝐴𝐷𝐽1ℎ =𝑀ℎ
𝑛ℎ×𝑀ℎ𝑖×𝑛ℎ−𝑑ℎ
𝑟ℎ .
For those countries where a census was conducted, the final school weight was
𝑆𝐶𝐻𝑊𝐺𝑇𝑖 = 1(𝑁 − 𝑑) / 𝑟 = (𝑁 − 𝑑) / 𝑟.
9.4. Weights for teacher data
9.4.1. Design weight for teacher data
The teacher data were obtained through a two-stage sampling design, whereby the TALIS
2018 sampling team first selected a sample of schools and then selected a sample of
teachers from each selected school. The design weight for teacher data, therefore, has
two components, one to allow expansion from the individual teacher to the school and one
to allow expansion from the school to the country or economy.
The first component of the final teacher weight is as described for the school data: for each
school i = 1, …, nh and each explicit stratum h = 1, …, H, the school base weight is
WGTFAC1hi. This is the same school design weight as above (see Section Design weight
for school and principal data9.3.1), unchanged.
The second component is the teacher design, or base, weight. In each selected school, the
national sampling team selected a systematic random sample with equal probability of
in-scope teachers. Although the nominal sample size within each school was set at mhi = 20,
the number of in-scope teachers of each selected school meant that the local team
sometimes had to modify the size of the teacher sample.
In some countries, or in some smaller schools, school principals also had teaching duties.
In an effort to maintain the response burden at a tolerable level, the team considered these
individuals to be incidental exclusions even though they remained in scope for the survey.
In five countries, Cyprus,4 Iceland, Malta, Singapore and the United Arab Emirates, the
number of teachers in them meant that the teachers who had participated in the TALIS field
trial were excused for the same reason as above. These groups of teachers were given
special exclusion codes (noted as NEXCL5 and NEXCL6 respectively) during the
compilation of the school list in the Windows Within-School Sampling Software
(WinW3S). Both groups needed to be accounted for in the estimates (see Section Weight
adjustment factor for incidental exclusion of teachers.
In a school where this did happen, the size of the list for that school, Lhi, was not the size
of the list from which the sample was drawn. Consequently, let 𝐿ℎ𝑖−
= Lhi - NEXCL5hi -
NEXCL6hi be the reduced size of the list used for teacher sampling. Thus, for each selected
teacher j = 1, …, mhi of school i = 1, …, nh in explicit stratum h = 1, …, H, the teacher base
weight was:
𝑊𝐺𝑇𝐹𝐴𝐶2ℎ𝑖 =𝐿ℎ𝑖−
𝑚ℎ𝑖 .
9.4.2. Weight adjustment for non-participating schools
In the case of teacher data, a school was considered a participating school if at least 50%
of the selected teachers returned their questionnaire or filed it on line (remember that a
teacher questionnaire was deemed to be a return if it contained at least one answer). This

161
TALIS 2018 TECHNICAL REPORT © OECD 2019
condition held whether or not a principal returned his or her questionnaire. Therefore, some
schools for which principal data were available could be deemed non-participant because
fewer than 50% of the selected teachers returned their questionnaires. An adjustment factor
to the school design weight was thus necessary and it was possible that it would differ from
the adjustment factor computed for the school database.
For each explicit stratum h = 1, …, H, if rh schools participated (i.e. at least 50% of selected
teachers returned their questionnaire) in TALIS 2018 out of the nh selected schools, and if
dh schools were closed or out of scope, the non-response adjustment factor was:
𝑊𝐺𝑇𝐴𝐷𝐽1ℎ =
{
𝑛ℎ−𝑑ℎ
𝑟ℎ for participating schools (at least 50% teacher questionnaires)
1 for closed or out-of-scope schools0 for non-participating schools (less than 50% teacher questionnaire)
.
9.4.3. Weight adjustment for non-participating teachers
Unfortunately, because not all selected teachers were able or willing to participate in
TALIS, the non-participating teachers needed to be represented by the participating ones.
Under the assumption of “missing at random”, representation was achieved by way of the
teacher non-response adjustment factor.
Each participating school i = 1, …, rh of each explicit stratum h = 1, …, H, had three kinds
of teachers: those who responded (noted thi), those who left the school permanently after
the sample had been selected or were found to be out of scope and those who did not
respond but who were still at the selected school (noted qhi). Here, the teacher non-response
adjustment factor was:
𝑊𝐺𝑇𝐴𝐷𝐽2ℎ𝑖𝑗 = {
𝑡ℎ𝑖 + 𝑞ℎ𝑖𝑡ℎ𝑖
for participating teachers
1 for teachers out of scope / left school0 for non-participating teachers
.
While “teachers who had left school permanently” did not provide data to most of the
estimates of interest, they still carried a positive weight because they represented those
other “teachers who had left school permanently” and who were listed on the school roster
but not included in the sample.
9.4.4. Weight adjustment factor for incidental exclusion of teachers
Because some teachers were excluded from sampling although they were in scope (see
preceding discussion), they needed to be represented by the sample. An adjustment factor
was required to account for these so-called incidental exclusions.

162
TALIS 2018 TECHNICAL REPORT © OECD 2019
The weight adjustment factor for incidental exclusion of teachers in each participating
school i=1, …, rh in explicit stratum h = 1, …, H, was:
𝑊𝐺𝑇𝐹𝐴𝐶3ℎ𝑖𝑗 =𝐿ℎ𝑖
𝐿ℎ𝑖− .
In this adjustment factor, the numerator is the full school measure of size as listed and the
denominator is the size of the reduced list from which the sample was actually selected.
9.4.5. Weight adjustment for teacher multiplicity
Some teachers were working in more than one school. Because the measure of the size of
each school was taken independently, these teachers were counted more than once. Also,
because the samples of teachers were independent from one school to the next, selecting
the same teacher more than once was possible (though in practice not very likely). An
adjustment was needed to account for the number of schools in which a given teacher
worked. In TALIS, this information came from the teacher questionnaire. For most
teachers, the adjustment factor was 1; for the others, it was the reciprocal of the number of
schools in which they taught (capped to 6, if required, to avoid unnecessary dramatic jumps
in teacher weights).
The weight adjustment for teachers working in more than one school computed for each
responding teacher j = 1, …, thi, in each participating school i= 1, …, rh, in explicit stratum
h = 1, …, H, was:
𝑊𝐺𝑇𝐴𝐷𝐽4ℎ𝑖𝑗 =
{
1
𝑛𝑏_𝑠𝑐ℎ𝑜𝑜𝑙𝑠ℎ𝑖𝑗 for teachers working in more than 1 school
1 for teachers working in 1 school
.
This factor was set to 1 for teachers who had left the school permanently.
9.4.6. Final (estimation) weight for teacher data
The final teacher weight (estimation weight) was the product of the school design weight,
the weight adjustment for school non-response, the teacher design weight and the
three adjustment factors associated with each participating teacher. All estimates pertaining
to the populations of teachers needed to use the final teacher weight.
The final teacher weight computed for each participating teacher j = 1, …, thi, in each
participating school i= 1, …, rh, in explicit stratum h = 1, …, H, was:
𝑇𝐶𝐻𝑊𝐺𝑇ℎ𝑖𝑗
= {𝑊𝐺𝑇𝐹𝐴𝐶1ℎ𝑖 ×𝑊𝐺𝑇𝐴𝐷𝐽1ℎ𝑖}
× {𝑊𝐺𝑇𝐹𝐴𝐶2ℎ𝑖𝑗 ×𝑊𝐺𝑇𝐴𝐷𝐽2ℎ𝑖𝑗 ×𝑊𝐺𝑇𝐴𝐷𝐽3ℎ𝑖𝑗 ×𝑊𝐺𝑇𝐴𝐷𝐽4ℎ𝑖𝑗}
= {𝑀ℎ
𝑛ℎ×𝑀ℎ𝑖×𝑛ℎ−𝑑ℎ
𝑟ℎ} × {
𝐿ℎ𝑖−
𝑚ℎ𝑖×𝐿ℎ𝑖
𝐿ℎ𝑖− ×
𝑡ℎ𝑖+𝑞ℎ𝑖
𝑡ℎ𝑖×
1
𝑛𝑏_𝑠𝑐ℎ𝑜𝑜𝑙𝑠ℎ𝑖𝑗} .
In the simplest of cases, the sampling design prepared for TALIS 2018 would have yielded
equal weights for all teachers. If we assume (1) that the sample size of schools was
distributed among the explicit strata proportionally to the number of teachers in each
stratum, (2) that samples of 20 teachers could be selected from every selected school,
(3) that the school listings were equal to the measures of size used to select the schools,

163
TALIS 2018 TECHNICAL REPORT © OECD 2019
(4) that the school listings contained only in-scope teachers, (5) that no incidental exclusion
occurred, (6) that each selected school and teacher participated, and (7) that each teacher
was teaching in only one school, then the final teacher weight will be the same for all the
teachers in the sample:
𝑇𝐶𝐻𝑊𝐺𝑇ℎ𝑖𝑗
= {𝑊𝐺𝑇𝐹𝐴𝐶1ℎ𝑖 ×𝑊𝐺𝑇𝐴𝐷𝐽1ℎ𝑖}
× {𝑊𝐺𝑇𝐹𝐴𝐶2ℎ𝑖𝑗 ×𝑊𝐺𝑇𝐴𝐷𝐽2ℎ𝑖𝑗 ×𝑊𝐺𝑇𝐴𝐷𝐽3ℎ𝑖𝑗 ×𝑊𝐺𝑇𝐴𝐷𝐽4ℎ𝑖𝑗}
= {𝑀ℎ
𝑛ℎ ×𝑀ℎ𝑖× 1} × {
𝑀ℎ𝑖20
× 1 × 1 × 1}
= {𝑀
200 ×𝑀ℎ} × {
𝑀ℎ20} =
𝑀
4000
for h = 1, …, H; i= 1, …, 𝑛ℎ; j = 1, …, mhi, and where M is the total number of teachers in
the population of interest.
9.5. Weights for the TALIS-PISA link data
As described in Chapter 5, the sample of schools for the TALIS-PISA link was a subset of
the sample of schools selected to take part in PISA 2018. Given the sequencing of events
between TALIS and PISA, the sampling team could not limit subsampling for the TALIS-
PISA link to schools that had participated in PISA. They, therefore, had to draw the
subsample from the full sample of schools prior to the PISA data collection. However,
because data collection for the TALIS-PISA link was scheduled to take place after
completion of the data collection for PISA (at least, for any given school), the school base
weight was that of the PISA 2012 design, adjusted for subsampling. Where school
non-response occurred, computation of the non-response adjustment was similar to the
process described above. Again, the (TALIS-PISA link) school estimation weight was the
product of the (TALIS-PISA link) school base weight and the (TALIS-PISA link) school
non-response adjustment factor. It should also be used for estimation of the TALIS-PISA
school-related parameters.
Because teacher sampling for the TALIS-PISA link followed the same rules as for the
ISCED levels, the construction of the “PISA teacher” weight followed the same steps: base
weight within a TALIS-PISA school, non-response adjustment within the school, and
multiplicity and exclusion adjustments. The final TALIS-PISA-teacher weight (estimation
weight) was thus the product of the teacher base weight, the three adjustment factors
associated with each participating teacher and the final TALIS-PISA link school weight.
All estimates pertaining to the populations of PISA teachers, therefore, needed to use the
(TALIS-PISA link) final teacher weight.
9.6. Participation rates
The quality requirements for TALIS 2013 translated into participation rates (response rates)
for schools and for teachers (see Chapter 10 for individual participants’ results). Reaching
the required levels of participation does not preclude some degree of error in the results but
should reduce reliance on the “missing at random” assumptions made for the non-response
weighting adjustments. Experience and knowledge gained from TALIS 2008 and TALIS
2013 showed that the targets set for TALIS 2018 participation were realistic.

164
TALIS 2018 TECHNICAL REPORT © OECD 2019
9.6.1. Participation rate for schools
TALIS considered schools where the principal returned a questionnaire to be
“participating” schools for the purposes of the school weights and database. TALIS 2018
set the minimum school participation rate at 75% after replacement. Although replacement
schools could be called upon as substitutes for non-responding schools, the study’s national
project managers were encouraged to do all they could to obtain the participation of the
schools in the original sample. As the number of replacement schools increased, the sample
would have lost its probabilistic features and become increasingly “purposive”, a situation
that had the potential to undermine the reliability, validity and interpretability of a
country’s/economy’s results.
Countries that reached less than 75% school participation after replacement had to
demonstrate convincingly that their sample was not significantly biased.
The unweighted school participation rate was computed as:
𝑈𝑁𝑊𝑆𝐶𝑃𝐴𝑅𝑇 =∑ ∑ 1
𝑟ℎ𝑖=1
𝐻ℎ=1
∑ ∑ 1𝑛ℎ−𝑑ℎ𝑖=1
𝐻ℎ=1
=∑ 𝑟ℎ𝐻ℎ=1
∑ (𝑛ℎ−𝑑ℎ)𝐻ℎ=1
,
where rh, nh and dh are as defined above. This formula represents the crude proportion of
schools from which a principal questionnaire was received (the unweighted participation
rate is sometimes interpreted as a crude measure of the effectiveness of collection).
The weighted school participation rate was computed as:
𝑊𝑇𝐷𝑆𝐶𝑃𝐴𝑅𝑇 =∑ ∑ 𝑊𝐺𝑇𝐹𝐴𝐶1ℎ𝑖
𝑟ℎ𝑖=1
𝐻ℎ=1
∑ ∑ 𝑆𝐶𝐻𝑊𝐺𝑇ℎ𝑖𝑟ℎ𝑖=1
𝐻ℎ=1
.
This formula represents the proportion of the population of schools or principals accounted
for by the participating schools.
Both rates were computed once over the complete set of participating schools (after
replacement) and once over the subset of participating schools in the original selection
(before replacement).
9.6.2. Participation rate for teachers
TALIS considered schools where at least 50% of selected teachers responded to the
questionnaire to be “participating” schools for the purposes of the teacher weights and
database, regardless of their participation status on the school database, that is, regardless
of whether or not their principal returned his or her questionnaire. TALIS deemed schools
that failed to meet this threshold as “non-participating” even though the number of
responding teachers may have been sufficient to contribute to some of the analyses.
Teacher participation was calculated over all participating schools, whether the schools
were in the original sample or used as a replacement. As a consequence, the participation
rate for the teachers was a requirement only at the national level and not at the school level.
The unweighted teacher participation rate was defined as:
𝑈𝑁𝑊𝑇𝑃𝐴𝑅𝑇 =∑ ∑ ∑ 1
𝑡ℎ𝑖𝑗
𝑟ℎ𝑖=1
𝐻ℎ=1
∑ ∑ ∑ 1𝑚ℎ𝑖𝑗
𝑟ℎ𝑖=1
𝐻ℎ=1
=∑ ∑ 𝑡ℎ𝑖
𝑟ℎ𝑖=1
𝐻ℎ=1
∑ ∑ 𝑚ℎ𝑖𝑟ℎ𝑖=1
𝐻ℎ=1
.

165
TALIS 2018 TECHNICAL REPORT © OECD 2019
This formula gives the crude ratio of the number of responding teachers in participating
schools with respect to the expected sample size from the participating schools. The
weighted teacher participation rate was, therefore:
𝑊𝑇𝐷𝑇𝑃𝐴𝑅𝑇
=∑ ∑ ∑ {𝑊𝐺𝑇𝐹𝐴𝐶1ℎ𝑖 × (𝑊𝐺𝑇𝐹𝐴𝐶2ℎ𝑖𝑗 ×𝑊𝐺𝑇𝐴𝐷𝐽3ℎ𝑖𝑗 ×𝑊𝐺𝑇𝐴𝐷𝐽4ℎ𝑖𝑗)}
𝑡ℎ𝑖𝑗=1
𝑟ℎ𝑖=1
𝐻ℎ=1
∑ ∑ ∑ {𝑇𝐶𝐻𝑊𝐺𝑇ℎ𝑖𝑗}𝑡ℎ𝑖𝑗=1
𝑟ℎ𝑖=1
𝐻ℎ=1
.
9.6.3. Overall participation rates
The overall weighted and unweighted participation rates were the products of the respective
school and teacher participation rates. In the case of teachers, we had to adapt the “school
participation rate” to the context of the teacher database by using the appropriate “school
weight” defined for that context (i.e. 50% teacher participation within each school).
9.6.4. Reporting participation rates
Weighted and unweighted participation rates, with and without replacement schools, were
produced for the school and principal data and for the teacher data. The analytical results
for each country were annotated according to whether or not the response rate requirements
were adequately met.
9.6.5. Meeting participation rates’ standard for TALIS
Chapter 10 provides a detailed review of the adjudication process.
9.6.6. Evolution of participation rates over time
As a general rule, there are no visible trends. It is also visible that teacher participation in
participating schools is almost always higher than principal participation. This has to be
taken in context: when the participation of principals is 100%, teacher participation cannot
be higher than that of the principals’. Also, changes need to be considered with caution;
given the size of the sample, 200 schools, a 1% change in participation translates to 1 to 3
schools. Still, from one cycle to the next, one can observe some important changes in
participation rates. In all cases, the changes are explained by either a concerted effort to
improve participation of principals or teachers, or at the opposite end, by adverse conditions
out of the control of the national TALIS team. Among the 29 countries/economies that
participated in both TALIS 2013 and TALIS 2018, the average participation rate for
principals dropped by 1.5%; some countries/economies showed remarkable improvement
(+16%) due to judicious choices of collection strategies, while others experienced marked
drops (-36%) due to local adverse conditions and untimely events. Among the same set of
countries/economies, the changes in participation rates for teachers ranged from -36% to
+21%, but the average change was only 0.3%.
9.7. Sampling error with balanced repeated replication (BRR)
Estimation, especially estimation of sampling error for surveys with complex designs such
as TALIS, requires special attention. Both the survey design and the unequal weights are
needed to obtain (approximately) unbiased estimates of sampling error. Not taking this
approach can lead to severe underestimation of the sampling error. While exact formulae
exist in theory for stratified PPS sample designs, the required computations become

166
TALIS 2018 TECHNICAL REPORT © OECD 2019
practically impossible as soon as the number of primary units selected per stratum exceeds
two.
Over the years, various statisticians have proposed approximate solutions for this problem.
An important class of solutions is that of resampling or replication. The best-known
examples of replication methods are interpenetrating subsamples (Mahalanobis), Balanced
Half-Samples or Balanced Repeated Replication (McCarthy, Fay), the Jackknife
(Quenouille, Tukey, Durbin, Frankel), and the Bootstrap (Efron). For reviews of these
methods, see, for example, Lohr (1999[1]), Rust and Rao (1996[2]) or Wolter (2007[3]).
In a similar vein to what was done for PISA (see, for example, OECD (2009[4])), TALIS
adopted the Balanced Repeated Replication (BRR) for estimation of the sampling error of
the estimates. BRR is a replication method suited to sample designs where exactly
two primary sampling units (PSUs) are selected in each stratum.
The principle of BRR is as follows: each of the two PSUs can provide an unbiased estimate
of the total (or another parameter of interest) of its stratum. If the sampling design
comprises H strata, there are then 2H possible unbiased estimates of the parameter of
interest, obtained by combining either PSU from each of the H strata. The sampling error
of the estimate of the parameter of interest can be directly computed by comparing each of
the 2H estimates with their mean, as is usually done in simple basic statistics. Even with
moderate values of H, the number of unbiased estimates may be quite large (e.g. 25 = 32,
210 = 1 024, 220 = 1 048 576). BRR provides a way to extract from the complete set of 2H
possible replicates a much smaller subset that gives the same measure of sampling error as
the full set.
9.7.1. Creating replicates for BRR
BRR was developed for sample designs that use only two PSUs per stratum. Clearly, none
of the countries participating in TALIS 2018 implemented such a sample design.
Fortunately, it is possible to use a superimposed “BRR-ready” sample plan to approximate
the implemented sample design. The participating schools (of the original sample or the
replacements), listed in the order in which they appear on the sampling frame, were paired
within explicit strata and each pair was dubbed “pseudo stratum” or “zone”. If the number
of participating schools in an explicit stratum was odd, then a triplet was formed with the
last three schools. The pairs (or triplets) were then numbered sequentially from 1 to G,
spanning the whole sample; within each pseudo stratum or zone, each school was assigned
a random pseudo PSU number of 1 or 2 (or 3 for a triplet) as depicted in Table 9.1.
Table 9.1. Example of BRR-ready sample design and random assignment of pseudo PSUs
Explicit stratum School ID Zone = pseudo stratum Pseudo PSU Other variables of interest…
1 1001 1 1 … …
1 1002 1 2
1 1003 2 1
1 1004 2 2
2 1005 3 2
2 1006 3 1
2 1007 4 1
2 1008 4 2
… …

167
TALIS 2018 TECHNICAL REPORT © OECD 2019
Explicit stratum School ID Zone = pseudo stratum Pseudo PSU Other variables of interest…
H … G-1 2
H … G 2
H … G 1
As with the Jackknife Repeated Replication, one of the two pseudo PSUs is dropped, which
means the weight of the remaining PSU doubles. This PSU is the one that is used to
compute an estimate of the parameter of interest. Rather than randomising which PSU to
drop, we used a special matrix (of order 4t) of +1’s and -1’s (the so-called Hadamard matrix) to indicate which PSU should be kept (+1) and which should be dropped (-1) from each
pseudo stratum in BRR, a process that associated the +1’s with the PSUs numbered 1 and
the -1’s with the PSUs numbered 2. As an example, the Hadamard matrix of order 8 can be
written as:
𝐻𝑎𝑑𝑎𝑚𝑎𝑟𝑑8 =
(
+1 +1 +1 −1 +1 −1 −1 −1−1 +1 +1 +1 −1 +1 −1 −1−1 −1 +1 +1 +1 −1 +1 −1+1 −1 −1 +1 +1 +1 −1 −1−1 +1 −1 −1 +1 +1 +1 −1+1 −1 +1 −1 −1 +1 +1 −1+1 +1 −1 −1 −1 −1 +1 −1−1 −1 −1 −1 −1 −1 −1 −1)
.
In this matrix, each column is a BRR replicate and each line is a pseudo stratum or zone.
The matrix entry indicates which pseudo PSU should be kept from each pseudo stratum to
create the BRR replicate. For example, the previous matrix translates into:
BRR 1 BRR 2 BRR 3 BRR 4 BRR 5 BRR 6 BRR 7 BRR 8
ZONE 1 PSU1 PSU1 PSU1 PSU2 PSU1 PSU2 PSU2 PSU2
ZONE 2 PSU2 PSU1 PSU1 PSU1 PSU2 PSU1 PSU2 PSU2
ZONE 3 PSU2 PSU2 PSU1 PSU1 PSU1 PSU2 PSU1 PSU2
ZONE 4 PSU1 PSU2 PSU2 PSU1 PSU1 PSU1 PSU2 PSU2
ZONE 5 PSU2 PSU1 PSU2 PSU2 PSU1 PSU1 PSU1 PSU2
ZONE 6 PSU1 PSU2 PSU1 PSU2 PSU2 PSU1 PSU1 PSU2
ZONE 7 PSU1 PSU1 PSU2 PSU2 PSU2 PSU2 PSU1 PSU2
ZONE 8 PSU2 PSU2 PSU2 PSU2 PSU2 PSU2 PSU2 PSU2
For TALIS 2018, and in keeping with what was done in the previous cycles of TALIS and
PISA, a variation of the BRR developed by Fay (1989[5]) was implemented. Instead of a
PSU being completely dropped and the weight of the other one doubled, the final weight
(𝑇𝐶𝐻𝑊𝐺𝑇ℎ𝑖𝑗) of every teacher in the PSU indicated by the Hadamard matrix is multiplied
by the replicate factor of 1.5 to get the replicate weight. Likewise, the final weight
(𝑇𝐶𝐻𝑊𝐺𝑇ℎ𝑖𝑗) of the teachers in the remaining PSU is multiplied by the replicate factor of
0.5 to get the replicate weight. This strategy removes the risk of completely deleting a
domain.

168
TALIS 2018 TECHNICAL REPORT © OECD 2019
In cases where there was an odd number of PSUs in an explicit stratum, the last three PSUs
were treated as a zone in the following manner: one of the PSUs was randomly designated
as “+1” while the remaining two were both designated as “-1”. For each replicate, as
indicated by the Hadamard matrix, the weight of the selected unit was multiplied by 1.7071
if it was the single unit and the weights of the remaining pair were multiplied by 0.6464. If
the matrix indicated that the pair should be selected, then the weights of the paired units
were multiplied by 1.3536 and the weight of the single unit was multiplied by 0.2929. This
strategy, developed by Judkins (OECD, 2002[6]), ensured that the sum of the factors was 3.
Because the nominal sample size for TALIS 2018 was n = 200 schools, a maximum of G =
100 zones or pseudo strata was created for each participating country and a series of G=100
BRR replicate weights were also computed and stored. The creation of BRR weights was
applied to all participating countries/economies, regardless of the size of the sample and of
the method of sample selection.
9.7.2. Estimating the sampling error
Let be the population parameter of interest. Let 𝜃∗ be the full sample estimate for
obtained by using the final weight and let 𝜃𝑔 , g = 1, ..., 100, be the G = 100 BRR replicate
estimates of the same parameter of interest obtained by using the BRR weights described
earlier. Then, with k set to equal 0.5, Fay’s BRR estimate of the sampling variance and
sampling error of 𝜃∗ are respectively given as:
�̂�𝐹𝐴𝑌(𝜃∗) =
1
𝐺(1 − 𝑘)2∑(𝜃𝑔 − 𝜃
∗)2
𝐺
𝑔=1
= 0.04∑(𝜃𝑔 − 𝜃∗)2
100
𝑔=1
𝑠𝑒𝐹𝐴𝑌(𝜃∗) = √�̂�𝐹𝐴𝑌(𝜃
∗).
9.7.3. Using sampling error when comparing estimates
Whenever we compare estimates (either variables or groups within a country) across
two countries or a country value to the international average, it is important that we use the
appropriate estimate of sampling error to scale this comparison.
Here, the standard error for the difference of two estimates within one country, say 𝜃1 and
𝜃2, is given as:
𝑠𝑒(𝜃1 − 𝜃2) = {�̂�𝐹𝐴𝑌(�̂�1) + �̂�𝐹𝐴𝑌(𝜃2) − 2𝐶𝑜�̂�(𝜃1, 𝜃2)}12 ,
where 𝜃1 and 𝜃2 are the two characteristics of interest (e.g. hours paid, hours worked)
measured within each participating school.
The standard error for the difference of the estimates for two countries, say 𝜃𝐴 and 𝜃𝐷, is:
𝑠𝑒(𝜃𝐴 − 𝜃𝐷) = {�̂�𝐹𝐴𝑌(𝜃𝐴) + �̂�𝐹𝐴𝑌(𝜃𝐷)}12 ,

169
TALIS 2018 TECHNICAL REPORT © OECD 2019
and the standard error for the difference of an estimate for a given country, say 𝜃𝐴 and the
international average �̅̂� , is:
𝑠𝑒 (�̂�𝐴 − �̂̅�) = {(𝐶2 − 2𝐶)�̂�𝐹𝐴𝑌(�̂�𝐴)+ ∑ �̂�𝐹𝐴𝑌(�̂�𝑘)
𝐶𝑘=1
𝐶2}
12
,
where �̅̂� = ∑𝜃𝑘 𝐶⁄ , C is the number of countries contributing to the mean �̅̂�, and 𝜃𝐴 is the
estimate for country A.
Comparisons of subpopulations within a country should be done with a regression on a
dummy variable, as illustrated in the following example. Suppose that the difference
between male and female teachers for some characteristic (e.g. hours of class management
per week) is of interest. We can set a dummy variable Gender = 0 if male, Gender = 1 if
female. A regression model can then be written as Score = a0 + a1 Gender. Clearly, if
Gender = 0, then Scoremale =a0. Likewise, by setting Gender = 1, we obtain Scorefemale =a0
+ a1. Design-based estimation of the regression parameters a0 and a1 can be done using
appropriate software that uses the replicate weights to estimate the standard errors of the
regression parameters. If the test of significance on a1 cannot reject the null hypothesis
H0 : a1 = 0, then we must conclude that scores for male teachers and female teachers are not
significantly different.
If 𝜃 is one of the statistics described above and 𝑠𝑒(𝜃)is the standard error of 𝜃, then we can
easily obtain confidence intervals about zero by computing the following boundaries:
𝑙𝑜𝑤𝑒𝑟𝛼 = 𝜃 − 𝑡𝛼2,𝑑𝑓𝑠𝑒(𝜃) and 𝑢𝑝𝑝𝑒𝑟𝛼 = 𝜃 + 𝑡𝛼
2,𝑑𝑓𝑠𝑒(𝜃) ,
where 1-α is the pre-set confidence level (e.g. 1-α = 0.95) and 𝑡𝛼2,𝑑𝑓 is 1-α/2 percentile of
the Student distribution with df degrees of freedom. In most applications, df will be large
enough to allow the use of the standard normal deviate 𝑧1−𝛼2 (e.g. 𝑧1−𝛼
2 = 1.96 for α = 0.05).
However, in order to confirm the number of degrees of freedom, we still need to verify how
many zones actually contribute to the statistic 𝜃 and how many BRR replicates contribute
to the computation of 𝑠𝑒(𝜃). This matter is covered in greater detail in the TALIS 2018 and
TALIS Starting Strong Survey 2018 User Guide (OECD, forthcoming[7]).
9.7.4. Design effect (deff) and effective sample size
Sampling within complex surveys such as TALIS is known to be “less efficient” than
simple random samples of the same size. Usual explanations include the fact that
respondents are selected in groups of individuals sharing many characteristics – school
environment, professional training, classroom equipment, textbooks and so on. The loss in
efficiency is often summarised in a statistic called the “design effect” or deff (Kish, 1965[8]).
The design effect for a statistic and a sampling plan is the ratio of the variance of the
estimate under the sampling plan to the variance of the same estimate under simple random
sampling of the same size. In the case of TALIS, the true design effect was approximated
by:
𝑑𝑒𝑓𝑓(𝜃, 𝐵𝑅𝑅) =�̂�𝐵𝑅𝑅(�̂�)
�̂�𝑆𝑅𝑆(𝜃) .

170
TALIS 2018 TECHNICAL REPORT © OECD 2019
Alternatively, the design effect can be regarded as the ratio of sample sizes. We can then
speak of “effective sample size” to describe the sample size of the complex survey adjusted
for the design effect:
𝑛effective =𝑛
𝑑𝑒𝑓𝑓 .
The following tables give the estimated design effect for selected key scale variables from
the principal questionnaire (Table 9.2 to Table 9.4) and the teacher questionnaire
(Table 9.5 to Table 9.7), by the participating country/economy. Deff values near 1 mean
that the design was as precise as a simple random sample of the same size (200 schools or
4 000 teachers respectively). Deff values larger than 1 mean that the sampling design was
less efficient than a simple random sample of the same size; deff values smaller than 1
indicate a gain in precision. Alternatively, the deff values indicate by what factor the sample
size was affected: the larger the deff, the smaller the effective sample size; reciprocally, the
smaller the deff, the larger the effective sample size.
Because the value of the deff depends on the design itself (efficiency of the stratification,
clustering, sample size) and on the true sampling variance of the variable in the population,
it varies from one variable to the next.
In Chapter 5 (Table 5.2), a hypothetical deff of 5.2 was used to derive the expected effective
sample size for teachers. The tables presented below show how the actual sample designs
implemented in the various participating countries outperformed the design hypotheses,
thus resulting in effective samples that were much larger than the expected nominal 400
teachers. However, these tables also show that the various samples are not always as
efficient as simple random samples of schools, despite stratification. In all cases,
stratification was implemented to obtain reliable estimates for domains of interest rather
than as a measure to reduce sampling error.
Table 9.2. Estimated design effects for selected scales, ISCED level 2, principal data
Participating country/economy Diversity beliefs Organisational innovativeness
Overall job satisfaction
School leadership
Alberta (Canada) 13.41 2.24 3.23 7.70
Austria 1.67 1.64 1.31 1.73
Belgium 1.15 1.13 1.31 1.14
Flemish Community (Belgium) 1.21 1.59 1.45 1.19
Brazil 1.09 1.23 1.14 1.20
Bulgaria 0.96 1.07 1.11 1.19
Ciudad Autónoma de Buenos Aires (Argentina) 1.17 0.87 0.86 0.79
Chile 1.24 1.04 1.25 0.97
Colombia 1.52 1.98 1.32 1.45
Croatia 3.39 1.53 2.13 1.20
Cyprus1 1.16 0.92 1.19 0.51
Czech Republic 1.23 1.07 1.08 1.23
Denmark 0.75 1.22 0.97 1.20
England (United Kingdom) 1.16 1.19 1.09 1.38

171
TALIS 2018 TECHNICAL REPORT © OECD 2019
Participating country/economy Diversity beliefs Organisational innovativeness
Overall job satisfaction
School leadership
Estonia 1.14 0.95 0.86 0.89
Finland 1.18 0.92 1.11 1.10
France 1.00 0.96 0.94 1.14
Georgia 1.23 0.86 1.37 1.50
Hungary 1.22 1.41 0.76 1.00
Iceland 0.95 1.19 0.83 0.93
Israel 1.01 1.18 1.15 1.01
Italy 1.06 1.06 1.23 1.09
Japan 1.35 1.47 1.18 1.37
Kazakhstan 2.06 2.02 1.96 1.58
Korea 1.38 1.47 1.46 1.36
Latvia 2.87 1.46 3.07 1.32
Lithuania 1.56 0.93 1.08 0.91
Malta 1.27 1.2 0.98 0.80
Mexico 0.88 1.5 0.88 0.80
Netherlands 1.34 1.05 1.17 0.86
New Zealand 3.24 4.84 4.58 5.74
Norway 1.45 0.91 1.19 1.15
Portugal 1.20 1.00 1.10 1.10
Romania 1.65 1.77 2.41 1.96
Russian Federation 2.74 2.15 1.56 2.26
Saudi Arabia 0.94 0.93 1.38 1.74
Shanghai (China) 0.84 0.99 1.12 1.25
Singapore 0.84 1.37 1.15 1.68
Slovak Republic 0.90 1.13 1.19 0.97
Slovenia 1.08 0.88 0.83 0.97
Spain 1.50 3.33 1.99 2.39
Sweden 2.34 1.38 3.31 2.26
Chinese Taipei 1.08 1.22 1.40 1.06
Turkey 1.51 1.25 1.09 1.46
United Arab Emirates 0.95 1.11 1.07 1.16
United States 2.96 5.66 3.38 4.55
Viet Nam 1.17 1.41 1.37 1.82
1. See endnote 1.
Source: OECD, TALIS 2018 database.

172
TALIS 2018 TECHNICAL REPORT © OECD 2019
Table 9.3. Estimated design effects for selected scales, ISCED level 1, principal data
Participating country/economy Diversity beliefs Organisational innovativeness
Overall job satisfaction
School leadership
Flemish Community (Belgium) 1.59 1.04 0.70 1.20
Ciudad Autónoma de Buenos Aires (Argentina) 0.99 1.19 1.46 0.88
Denmark 1.14 0.79 1.59 2.06
England (United Kingdom) 0.80 1.64 1.05 2.07
France 0.88 1.39 1.51 1.18
Japan 1.01 1.13 1.08 1.49
Korea 1.31 1.76 1.05 1.46
Spain 2.13 2.70 1.50 3.08
Sweden 0.87 1.82 1.74 1.14
Turkey 2.64 1.96 2.51 2.12
Chinese Taipei 1.15 1.15 1.14 1.28
United Arab Emirates 0.70 0.92 1.26 1.15
Source: OECD, TALIS 2018 database.
Table 9.4. Estimated design effects for selected scales, ISCED level 3, principal data
Participating country/economy Diversity beliefs Organisational innovativeness Overall job satisfaction School leadership
Alberta (Canada) 0.94 1.19 1.65 1.56
Brazil 1.48 0.91 1.12 1.38
Croatia 1.31 1.91 2.36 1.16
Denmark 1.09 1.09 1.06 0.79
Portugal 1.10 0.94 1.29 1.40
Slovenia 1.08 1.29 0.91 1.04
Sweden 2.04 2.04 0.00 3.04
Turkey 2.49 2.84 2.89 2.64
Chinese Taipei 1.29 1.19 1.03 1.73
United Arab Emirates 1.02 0.80 1.15 0.97
Viet Nam 1.65 1.13 1.10 1.29
Source: OECD, TALIS 2018 database.
Table 9.5. Estimated design effects for selected scales, ISCED level 2, teacher data
Participating country/economy Job satisfaction Teacher co-operation Teacher self-efficacy Teaching practices
Alberta (Canada) 1.55 3.08 2.03 4.13
Australia 1.83 1.74 1.48 1.41
Austria 2.56 1.90 1.61 1.33
Belgium 1.67 2.16 1.33 0.88
Flemish Community (Belgium) 1.67 2.16 1.33 0.88
Brazil 2.75 3.66 1.96 1.72
Bulgaria 2.64 2.48 2.06 2.06
Ciudad Autónoma de Buenos Aires (Argentina)
3.27 3.43 2.95 1.86

173
TALIS 2018 TECHNICAL REPORT © OECD 2019
Participating country/economy Job satisfaction Teacher co-operation Teacher self-efficacy Teaching practices
Chile 2.00 1.56 1.11 1.87
Colombia 4.01 4.58 3.32 2.26
Croatia 3.28 3.33 2.72 1.63
Cyprus1 2.94 2.47 1.15 1.75
Czech Republic 2.34 2.98 1.50 1.82
Denmark 1.88 2.79 1.67 1.44
England (United Kingdom) 2.09 1.51 1.73 1.61
Estonia 1.79 3.35 1.61 2.15
Finland 2.8.0 2.33 1.81 1.81
France 2.01 2.00 1.11 0.97
Georgia 2.91 3.09 1.72 2.34
Hungary 3.13 2.60 1.83 1.42
Iceland 1.00 1.10 1.10 0.82
Israel 2.34 2.03 1.39 0.82
Italy 2.16 2.31 1.47 1.42
Japan 1.57 2.44 1.38 1.72
Kazakhstan 2.97 3.63 2.50 2.87
Korea 3.05 2.08 1.83 1.36
Latvia 2.89 1.80 1.98 2.12
Lithuania 3.15 2.25 1.85 1.64
Malta 1.79 2.62 1.57 0.73
Mexico 1.88 1.65 1.82 1.27
Netherlands 2.38 8.42 3.97 4.98
New Zealand 3.41 4.06 2.90 1.94
Norway 2.43 3.61 2.29 1.90
Portugal 2.89 2.29 1.28 1.07
Romania 2.57 2.53 2.38 2.12
Russian Federation 2.33 3.19 4.08 3.34
Saudi Arabia 1.75 1.75 1.83 1.31
Shanghai (China) 2.50 2.20 1.32 1.49
Singapore 1.12 0.92 1.05 1.23
Slovak Republic 1.94 1.80 1.35 1.83
Slovenia 1.57 2.17 1.20 1.17
Spain 3.63 4.47 2.82 4.10
Sweden 2.91 3.17 1.59 1.34
Chinese Taipei 2.15 2.25 1.13 1.15
Turkey 3.25 2.33 1.61 1.81
United Arab Emirates 1.39 0.96 0.98 1.52
United States 6.96 6.83 2.44 4.74
Viet Nam 4.37 5.24 3.75 6.75
1. See endnote 1.
Source: OECD, TALIS 2018 database.

174
TALIS 2018 TECHNICAL REPORT © OECD 2019
Table 9.6. Estimated design effects for selected scales, ISCED level 1, teacher data
Participating country/economy Job satisfaction Teacher co-operation Teacher self-efficacy Teaching practices
Flemish Community (Belgium) 2.00 2.01 1.65 2.23
Ciudad Autónoma de Buenos Aires (Argentina)* 3.17 2.50 2.48 2.19
Denmark 2.04 2.15 1.21 1.71
England (United Kingdom) 2.90 2.38 2.05 1.64
France 2.25 2.80 2.56 2.90
Japan 2.25 2.81 1.77 1.83
Korea 3.18 2.32 1.76 1.65
Spain 3.33 4.67 3.70 3.33
Sweden 2.25 2.10 1.57 1.76
Turkey 5.96 3.62 4.01 2.99
Chinese Taipei 2.07 2.64 1.32 1.35
United Arab Emirates 1.07 1.39 1.10 1.34
Viet Nam 3.76 4.80 4.02 2.42
Source: OECD, TALIS 2018 database.
Table 9.7. Estimated design effects for selected scales, ISCED level 3, teacher data
Participating country/economy Job satisfaction Teacher co-operation Teacher self-efficacy Teaching practices
Alberta (Canada) 2.25 3.42 1.74 1.39
Brazil 2.96 5.67 3.19 1.80
Croatia 1.95 2.47 1.34 2.05
Denmark 2.54 1.66 1.41 1.25
Portugal 2.45 2.60 1.60 1.39
Slovenia 1.17 1.25 1.44 1.22
Sweden 2.48 2.38 1.82 1.80
Turkey 5.78 4.93 5.34 4.13
Chinese Taipei 2.22 2.37 1.60 1.29
United Arab Emirates 1.31 1.11 1.47 1.62
Viet Nam 3.51 4.38 2.64 1.50
Source: OECD, TALIS 2018 database.

175
TALIS 2018 TECHNICAL REPORT © OECD 2019
References
Fay, R. (1989), “Theory and application of replicate weighting for variance calculation”,
Proceedings of the Section on Survey Research Methods of the American Statistical
Association, pp. 212-217.
[5]
Kish, L. (1965), Survey Sampling, Wiley, New York. [8]
Lohr, S. (1999), Sampling: Design and Analysis, Duxbury Press, New York. [1]
OECD (2009), PISA 2006 Technical Report, PISA, OECD Publishing, Paris,
https://dx.doi.org/10.1787/9789264048096-en.
[4]
OECD (2002), PISA 2000 Technical Report, OECD Publishing, Paris,
http://dx.doi.org/doi.org/10.1787/19963777.
[6]
OECD (forthcoming), TALIS 2018 and TALIS Starting Strong Survey 2018 User Guide, OECD,
Paris.
[7]
Rust, K. and J. Rao (1996), “Variance estimation for complex estimators in sample surveys”,
Statistics in Medical Research, Vol. 5/4, pp. 381-397.
[2]
Wolter, K. (2007), Introduction to Variance Estimation, 2nd edition, Springer Verlag, New
York.
[3]
Notes
1 Note by Turkey: The information in this document with reference to “Cyprus” relates to the
southern part of the Island. There is no single authority representing both Turkish and Greek Cypriot
people on the Island. Turkey recognises the Turkish Republic of Northern Cyprus (TRNC). Until a
lasting and equitable solution is found within the context of the United Nations, Turkey shall
preserve its position concerning the “Cyprus issue”.
Note by all the European Union Member States of the OECD and the European Union: The Republic
of Cyprus is recognised by all members of the United Nations with the exception of Turkey. The
information in this document relates to the area under the effective control of the Government of the
Republic of Cyprus.
2 TIMSS: trends in International Mathematics and Science Study, https://www.iea.nl/timss.
3 See endnote 1.
4 See endnote 1.

176
TALIS 2018 TECHNICAL REPORT © OECD 2019
Chapter 10. Data adjudication
This chapter covers the adjudication of TALIS 2018. The first two sections of the chapter
address the purpose of adjudication and what was adjudicated during TALIS 2018, after
which the criteria used to assess each parameter are presented and briefly described in the
third section. The last section describes the recommended usage rating for each
participating country/economy and survey population. Individual rating recommendations
can be found in Annex G.
The statistical data for Israel are supplied by and under the responsibility of the relevant Israeli authorities. The
use of such data by the OECD is without prejudice to the status of the Golan Heights, East Jerusalem and Israeli
settlements in the West Bank under the terms of international law.

177
TALIS 2018 TECHNICAL REPORT © OECD 2019
10.1. The general adjudication process in TALIS
The TALIS Consortium is responsible for providing participating countries/economies and
the OECD with databases that: (1) inform policy relevant to those countries and economies;
(2) allow international comparisons; (3) permit the development of indicators; (4) contain
valid and reliable data obtained via rigorous, effective and efficient methods; and (5)
provide estimates that can be interpreted across participating countries/economies (OECD,
2015[1]).
The consortium is therefore also responsible not only for demonstrating and documenting,
through adjudication, that TALIS’s survey processes were designed and implemented to
meet these requirements but also for alerting the participating countries/economies and the
OECD of any shortcomings or limitations affecting the use of any data elements.
This chapter defines and describes the adjudication process for TALIS 2018, with the
elements for adjudication listed and commented on in turn. The criteria used to assess the
quality of each element appear in the third section of the chapter, while the fourth section
focuses on what each rating means in practice. The outcomes of the adjudication, that is,
the recommended rating for each participating country/economy and each TALIS 2018
option, are given at the end of this section. The full unweighted and weighted participation
rates can be found in Annex G.
10.2. What was adjudicated in TALIS?
The basic principle guiding adjudication was to determine, for each participating
country/economy and for each of the TALIS options, whether the data released to the
countries and to the OECD were “fit for use” as intended.
To establish fitness for use, several quality assurance processes were designed and
activated throughout the survey. Some processes relied on expert advice and opinion; some
relied on qualitative information and learned judgement; and some relied on quantitative
information. The quality observations that the international quality observers (IQOs)
conducted in each participating country/economy provide an example of adjudication in
practice (see Chapter 7).
In general, the consortium considered the overall quality of the survey implementation and
the data yielded to be high. However, several issues arose during the survey with respect
to, for example, national adaptations of the source questionnaires and extensions of the data
collection window. The consortium adjudicators discussed and clarified each issue with the
relevant participating country/economy and sometimes sought advice from the OECD
Secretariat. Once the consortium found a solution that was not only agreeable to the
participating country/economy but also complied with the TALIS 2018 Technical
Standards (see Annex B), it considered the issue settled in terms of having no impact on
data quality. Some problems were discovered only during data processing, weighting or
scaling. The impact of each of these issues on data quality – that is, their potential to limit
the utility of the data – was assessed and documented.
During the adjudication session, held at the IEA Hamburg offices in September 2018 in the
presence of representatives of the OECD Secretariat, each individual dataset, that is, all
data from each country’s/economy’s survey options1 and questionnaire types,2 was
submitted to the same examination. For the first time since the original TALIS survey of
2008, the consortium adjudicated the principal/school data independently of the teacher
data. The members of the consortium responsible for a particular key step of the survey
178
TALIS 2018 TECHNICAL REPORT © OECD 2019
presented, discussed and assessed any unresolved issues that might reduce each dataset’s
final fitness for use. The following references provide a detailed review of survey processes
and of the principles and implementation of quality assurance in a survey: Kish (1965[2]),
Statistics Canada (2003[3]; 2009[4]; 2017[5]) and the United Nations Commission for Europe
(UNECE, 2014[6]).
Outstanding and unresolved situations likely to diminish the overall utility of a dataset
could occur during any step of the survey process. For example:
Adaptation of questionnaires to the national context: incomplete questionnaires
(national questionnaires needed to include all of the introductory texts and
questions in the international source versions of the questionnaires as well as the
corresponding notes, instructions, response categories and coding schemes);
questions removed or modified without agreement.
Translation and verification: changes to national translations of trend items that
would make comparisons difficult.
Quality of sampling frame (before sampling and confirmation at weighting):
measure of size disproportionate to what was known of the participating
country/economy; missing values.
Handling of out-of-scope and of refusal units: for example, a replaced unit found
to be out of scope.
Handling of replacement and “volunteer” units: for example, replacement schools
participating when the original school was also on the database.
Teacher rosters and within-school sampling: apparent incompleteness; apparent
biased selection of teacher sample.
Main survey administration: noncompliance with the technical standards and
survey operational procedures, units, rules and guidelines; failure to administer the
data collection within the agreed data collection window; failure to administer the
questionnaires according to the tracking form.
Data collection (paper and online modes): missing records (physical or electronic).
Data cleaning: issues with cleaning and editing; need to make post-collection call-
backs to national project managers (NPMs).
Quality observers’ reports: reported issues included differences in the
documentation of national decisions on translation verification feedback and the
actual implementation in the final national instruments; unnatural and non-fluent
national translations; deviations in sampling procedures for listing all eligible
participants in a school; failure to administer the questionnaires according to the
tracking form.
Weighting: miscoded schools or teachers; only rough comparisons of survey results
with frame information; need to make call-backs to NPMs; estimates of population
sizes not matching information on frame; school listings too short; school ID having
no matching unit on frame.
Participation rates of principals and teachers: weighted and unweighted rates
strikingly different; participation rates computed within 1% of a rating borderline.

179
TALIS 2018 TECHNICAL REPORT © OECD 2019
In those instances where there were no outstanding or unresolved issues, the consortium
adjudication committee established the recommended rating as per the technical standards.
These standards, which were based on participation rates, are repeated below for reference
(see also Chapter 9).
10.3. The criteria for assessment
As a general criterion, the consortium members at the adjudication considered that any
problem that had been satisfactorily resolved was no longer a problem and that they did not
need to discuss it. The consortium member mainly responsible for the issue at hand only
presented the issue if unusual circumstances made it stand out.
Otherwise, if a problem had been only partially resolved, the adjudication committee
worked through a series of questions to help them clearly determine the nature of the issue
and its potential impact on data quality: What was the problem? What solutions had been
tried and failed? What solutions had partially worked and to what extent? Was the
perceived impact such that words of caution should be issued to users? Did the adjudication
committee feel that international (or national) comparisons appeared to have been
compromised or limited to the largest subpopulations? Was more information from
countries/economies needed to assess the issue in full?
Once the committee had assessed each survey process, they formulated a recommended
rating for it that accounted for the participation rates and any unresolved issues.
10.4. Recommended usage ratings for participants
For easy reference, Tables 10.1 and 10.2 reproduce the adjudication tables found in the
TALIS 2018 Technical Standards (see Annex B).
Table 10.1. Adjudication rules for school or principal data in TALIS 2018
School participation
(returned principal questionnaires) (%) Risk of school non-response bias
Rating
before replacement after replacement
≥ 75 ≥ 75 Good
50–75 ≥ 75 Fair A
50–75 Low Fair C
High Poor D
< 50 Insufficient
Source: TALIS 2018 Technical Standards (Annex B).

180
TALIS 2018 TECHNICAL REPORT © OECD 2019
Table 10.2. Adjudication rules for teacher data in TALIS 2018
School participation
(minimum teacher participation) (%) Teacher participation
after school replacement (%)
Risk of teacher non-response
bias Rating
before replacement after replacement
≥ 75 ≥ 75 ≥ 75 Good
50–75 Fair A
50–75 ≥ 75 ≥ 75 Fair B
50–75 Low Fair C
High Poor D
50–75 50–75 Poor E
< 50 ≥ 75 Poor F
< 50 < 75 Insufficient
Source: TALIS 2018 Technical Standards (Annex B).
The aim of the following bulleted list is to help data users understand what constitutes
limitations on use or quality of the data:
Good: the participating country’s/economy’s data can be used for all reporting and
analytical purposes and should be included in international comparisons.
Fair (line A): national and subnational estimates can be produced; some teacher
characteristics may be less precise, as indicated by a larger standard error (s.e.),
hence the warning “fair”, but with no additional warnings to users deemed
necessary.
Fair (line B, only for teacher data adjudication): national and subnational estimates
can be produced; some subnational estimates may be of lower precision (larger s.e.)
if the sample size is locally low, hence the warning “fair”, but with no additional
warnings to users considered necessary.
Fair (line C): national and subnational estimates can be produced; some
subnational estimates may be of lower precision (larger s.e.) if the sample size is
locally low, hence the warning “fair”, but with the possible inclusion of a note on
data quality that points to the outcome of the non-response bias analysis (NRBA);
school participation somewhat lower than under (B), meaning that comparison of
subnational estimates needs to be done with care given that some of these results
are based on just a few schools; comparison of small subnational estimates with
similar groups from other countries is unlikely to uncover statistically meaningful
differences because of potentially overly large standard errors.
Poor (line D): in addition to the warnings issued for the previous category, a note
that warns users of indications of non-response bias in some estimates should be
appended; comparisons of subnational estimates need to be limited to the groups
with the larger sample sizes (because the sample at this point represents between
37% and 56% of the teaching workforce, from a relatively small sample of schools,
comparisons with similar groups in foreign countries is inadvisable).
Poor (line E, only for teacher data adjudication): subnational estimates not
recommended; a note pointing out the difficulty of obtaining a representative
sample of schools, therefore, needs to be appended.

181
TALIS 2018 TECHNICAL REPORT © OECD 2019
Poor (line F, only for teacher data adjudication): limitations similar to those for
line E, but with the inclusion of a note pointing out the difficulty of obtaining at
least 50% participation of the selected sample of schools; evident risk of having a
non-representative sample of schools.
Insufficient: weights should not be calculated for any official tabulations, meaning
that data should not be incorporated3 into international tables, models, averages,
etc.
Thus, the final ratings depended on participation rates before and after replacements, on
data quality issues raised during the adjudication session and on the apparent severity of
the non-response biases. The next six tables present the recommended rating for each
participating country/economy, by ISCED level and population.4
As mentioned earlier, the recommended rating was based on the participation rates
(weighted or unweighted) most favourable to the countries. Detailed results of unweighted
and weighted participation can be found in Annex G.
Table 10.3. ISCED level 1: Principals’ participation and recommended ratings
Participating country/economy Number of
participating principals
Principals’ participation before
replacement (%)
Principals’ participation after replacement (%)
Recommended rating
Australia* 223 48.8 77.9 Insufficient
Flemish Community (Belgium)* 184 70.0 92.2 Fair
Ciudad Autónoma de Buenos Aires (Argentina) 175 85.0 87.5 Good
Denmark* 145 56.6 73.2 Fair
England (United Kingdom) 161 76.4 89.5 Good
France* 178 89.3 91.5 Good
Japan 197 97.2 99.5 Good
Korea 161 78.0 80.5 Good
Netherlands* 135 40.7 69.6 Insufficient
Spain* 436 98.2 98.2 Good
Sweden* 166 84.7 87.4 Good
Chinese Taipei 200 99.8 100.0 Good
Turkey 171 99.3 99.3 Good
United Arab Emirates 502 90.6 90.6 Good
Viet Nam 194 100.0 100.0 Good
Notes: A school was deemed a participating school if the principal returned his or her questionnaire with at least 1 question
answered.
Australia: data collection window extended into the following school year.
Flemish Community (Belgium): entries on the sampling frame were administrative units and not “schools” as they are usually
defined. Because a “school” may comprise one or several administrative units, the principal would have been reporting for the
school, not just the selected administrative unit. Users, therefore, need to exercise care when analysing the school-level statistics.
Denmark: because non-response bias analysis showed no evidence of a high risk of school non-response bias, Denmark’s rating
was upgraded from “poor” to “fair”. Item PQ-39b and PQ-39c were dropped because of an inaccurate translation.
France: item PQ-06c was withdrawn at France’s request because the wording was not sufficiently clear to ensure
non-misinterpretation of the data. Item PQ-14c was dropped due to an inaccurate translation.

182
TALIS 2018 TECHNICAL REPORT © OECD 2019
Netherlands: the Netherlands began its data collection six weeks earlier than the other Northern Hemisphere countries/economies
and had an extended collection window. Because the Netherlands Ministry of Education, Culture and Science decided to support
all schools willing to participate, this resulted in the inclusion of some 50 “national” schools that were not included in the
international dataset but were left on the national dataset. Thus, participation rates were computed on the international dataset.
Item PQ-12 was withdrawn at the Netherlands’ request because the public/private status of schools in the Netherlands is not always
obvious and this question was often misinterpreted, despite the explanation provided.
Spain: item PQ-03 was dropped because of an inaccurate translation.
Sweden: item PQ-07a was dropped because of an inaccurate translation.
Source: OECD TALIS 2018 Database.
Table 10.4. ISCED level 1: Teachers’ participation and recommended ratings
Participating country/economy
Number of participating
schools
Number of participating
teachers
Estimated size of teacher
population
School participation
before replacement
(%)
School participation
after replacement
(%)
Teachers’ participation
in participating schools (%)
Overall teacher
participation (%)
Recommended rating
Australia* 213 3 030 133 915 48.8 74.0 76.4 56.5 Insufficient
Flemish Community (Belgium)*
177 2 662 30 192 66.3 88.5 92.2 81.7 Fair
Ciudad Autónoma de Buenos Aires (Argentina)
167 2 514 16 221 81.0 83.5 86.9 72.5 Good
Denmark* 154 2 592 34 166 58.6 77.8 87.5 68.1 Fair
England (United Kingdom)
152 2 009 225 194 74.3 85.9 85.0 73.1 Fair
France 178 1 429 209 981 88.6 91.2 92.1 84.0 Good
Japan 197 3 308 354 795 97.0 99.5 98.8 98.3 Good
Korea* 182 3 207 128 831 86.0 91.0 91.9 83.6 Good
Netherlands* 130 1 504 68 640 39.3 67.0 86.8 58.2 Insufficient
Spain* 442 7 246 210 627 99.3 99.5 95.4 95.0 Good
Sweden 178 2 404 57 183 90.0 93.7 78.8 73.8 Good
Chinese Taipei 200 3 494 89 608 99.5 100.0 97.6 97.6 Good
Turkey 172 3 204 212 347 99.4 99.4 98.5 97.9 Good
United Arab Emirates
552 9 188 16 372 99.6 99.6 96.6 96.2 Good
Viet Nam 194 3 991 385 301 100.0 100.0 98.3 98.3 Good
Notes: A school was deemed a participating school if at least 50% of the selected teachers returned their respective questionnaires
with at least 1 question answered.
Australia: Australia’s data collection window extended into the following school year.
Flemish Community (Belgium): entries on the sampling frame were administrative units and not “schools” as they are usually
defined. Because a “school” may comprise one or several administrative units, the principal would have been reporting for the
school, not just the selected administrative unit. Users, therefore, need to exercise care when analysing the school-level statistics.
France: Item TQ-33b and TQ-33d were dropped because of an inaccurate translation.
Denmark: because non-response bias analysis showed no evidence of a high risk of school non-response bias, Denmark’s rating
was upgraded from “poor” to “fair”.
Korea: in some schools, teacher listings were found to be incorrect; these schools were therefore categorised as “non-participant”.
Netherlands: the Netherlands began its data collection six weeks earlier than the other Northern Hemisphere countries/economies
and had an extended collection window. Because of an unapproved collection protocol that resulted in the inclusion of some 50
“national” schools that were not included in the international dataset but were left on the national dataset, participation rates were
computed on the international dataset.
Spain: item TQ-03 was dropped because of an inaccurate translation.
Source: OECD TALIS 2018 Database.

183
TALIS 2018 TECHNICAL REPORT © OECD 2019
Table 10.5. ISCED level 2: Principals’ participation and recommended ratings
Participating country/economy Number of participating
principals Principals’ participation before replacement (%)
Principals’ participation after replacement(%)
Recommended rating
Alberta (Canada)* 129 54.4 66.2 Fair
Australia* 230 49.0 75.7 Insufficient
Austria* 277 96.0 100.0 Good
Belgium* 307 86.6 95.9 Good
Flemish Community (Belgium)* 188 82.5 94.0 Good
French Community (Belgium) 119 93.3 99.2 Fair
Brazil 184 88.0 95.4 Good
Bulgaria 200 97.,5 100.0 Good
Chile 169 78.9 87.6 Good
Ciudad Autónoma de Buenos Aires (Argentina)
121 77.5 82.6 Good
Colombia* 141 68.8 70.9 Fair
Croatia 188 95.0 95.6 Good
Cyprus1,2 88 88.9 88.9 Good
Czech Republic* 218 99.5 99.5 Good
Denmark* 140 51.5 71.4 Fair
England (United Kingdom) 157 71.9 81.8 Fair
Estonia 195 88.3 100.0 Good
Finland 148 100.0 100.0 Good
France* 195 97.6 98.0 Good
Georgia* 177 91.7 91.7 Good
Hungary 182 91.2 94.3 Good
Iceland* 101 74.3 74.3 Fair
Israel* 184 90.9 93.7 Good
Italy* 190 92.4 98.6 Good
Japan 195 93.9 99.4 Good
Kazakhstan 331 100.0 100.0 Good
Korea 150 68.1 77.8 Fair
Latvia 136 80.4 91.9 Good
Lithuania 195 100.0 100.0 Good
Malta 54 93.1 93.1 Good
Mexico* 193 90.6 97.0 Good
Netherlands* 125 56.2 85.6 Fair
New Zealand* 189 71.7 92.0 Fair
Norway 162 67.5 81.0 Fair
Portugal 200 97.7 100.0 Good
Romania 199 100.0 100.0 Good
Russian Federation* 230 99.1 100.0 Good
Saudi Arabia* 192 96.5 96.5 Good
Shanghai (China)* 198 100.0 100.0 Good
Singapore 167 97.0 98.8 Good
Slovak Republic 180 84.4 90.5 Good
Slovenia 119 74.8 79.3 Good

184
TALIS 2018 TECHNICAL REPORT © OECD 2019
Participating country/economy Number of participating
principals Principals’ participation before replacement (%)
Principals’ participation after replacement(%)
Recommended rating
South Africa 169 92.3 92.3 Good
Spain* 396 98.7 99.2 Good
Sweden* 171 85.9 89.1 Good
Chinese Taipei 202 100.0 100.0 Good
Turkey 196 99.0 99.0 Good
United Arab Emirates* 476 91.4 91.4 Good
United States* 164 63.1 77.6 Fair
Viet Nam 196 100.0 100.0 Good
1. Note by Turkey: The information in this document with reference to “Cyprus” relates to the southern part of the Island. There
is no single authority representing both Turkish and Greek Cypriot people on the Island. Turkey recognises the Turkish Republic
of Northern Cyprus (TRNC). Until a lasting and equitable solution is found within the context of the United Nations, Turkey shall
preserve its position concerning the “Cyprus issue”.
2. Note by all the European Union Member States of the OECD and the European Union: The Republic of Cyprus is recognised
by all members of the United Nations with the exception of Turkey. The information in this document relates to the area under the
effective control of the Government of the Republic of Cyprus. Notes: A school was deemed a participating school if the principal
returned his or her questionnaire.
Alberta (Canada): because non-response bias analysis showed no evidence of a high risk of school non-response bias, Alberta’s
rating was upgraded from “poor” to “fair”. TALIS was conducted as a new Collective Bargaining Agreement for teachers was
being negotiated.
Australia: Australia’s data collection window extended into the following school year.
Austria: item PQ-06 was withdrawn at Austria’s request because the wording was not sufficiently clear to ensure
non-misinterpretation of the data.
Belgium and Flemish Community (Belgium): entries on the sampling frame were administrative units and not “schools” as they
are usually defined. Because a “school” may comprise one or several administrative units, the principal would have been reporting
for the school, not just the selected administrative unit. Users, therefore, need to exercise care when analysing the school-level
statistics.
French Community (Belgium): The sample size is lower than the minimum number of schools required for TALIS, namely, 150,
unless a census of all schools is conducted. Item PQ-14c was dropped due to an inaccurate translation.
Colombia: non-response bias analysis showed no evidence of a high risk of school non-response bias.
Czech Republic: because some translation issues could still exist in the trend items, users need to exercise caution when comparing
results across TALIS cycles.
Denmark: because non-response bias analysis showed no evidence of a high risk of school non-response bias, Denmark’s rating
was upgraded from “poor” to “fair”. Items PQ-39b and PQ-39c were dropped because of an inaccurate translation.
France: item PQ-06c was withdrawn at France’s request because the wording was not sufficiently clear to ensure
non-misinterpretation of the data. Item PQ-14c was dropped due to an inaccurate translation.
Georgia: the overall quality of the translation was found to be questionable. It is also likely that translation issues still exist in the
Georgian and Azerbaijani instruments for Georgia that could affect the data.
Iceland: because Iceland missed 75% participation by only 1 school, Iceland’s rating was upgraded from “poor” to “fair”.
Israel: ultra-orthodox schools were removed post-facto because of very low responses rates, making coverage identical to that of
TALIS 2013. Because translation issues could still exist in the trend items, users need to exercise caution when comparing results
across TALIS cycles. Item PQ-12 was withdrawn at Israel’s request because the classifications of private schools were not defined
well enough to ensure non-misinterpretation of data.
Italy: because translation issues could still exist in the trend items, users need to exercise caution when comparing results across
TALIS cycles. Item PQ-16 was withdrawn at Italy’s request.
Mexico: item PQ-04e, “years working in other jobs”, was dropped because of an inaccurate translation.
Netherlands: the Netherlands began its data collection six weeks earlier than the other Northern Hemisphere countries/economies
and had an extended collection window. Because an unapproved collection protocol resulted in the inclusion of some 50 “national”
schools that were not included in the international dataset but were left on the national dataset, participation rates were computed
on the international dataset. Item PQ-12 was withdrawn at the Netherland’s request because the classifications of private schools
were not defined well enough to ensure non-misinterpretation of data.
New Zealand: coverage was extended to small schools (four or fewer teachers). While the impact of this action on the target
population of teachers was negligible, the impact on the target population of principals is important because, compared to TALIS
2013, the target population for principals nearly doubled in size. TALIS 2018 data comparisons with TALIS 2013 should,
therefore, be restricted to the 2013 coverage.
Russian Federation: Moscow was excluded from TALIS 2018.
Saudi Arabia: two provinces bordering Yemen were excluded from TALIS 2018.
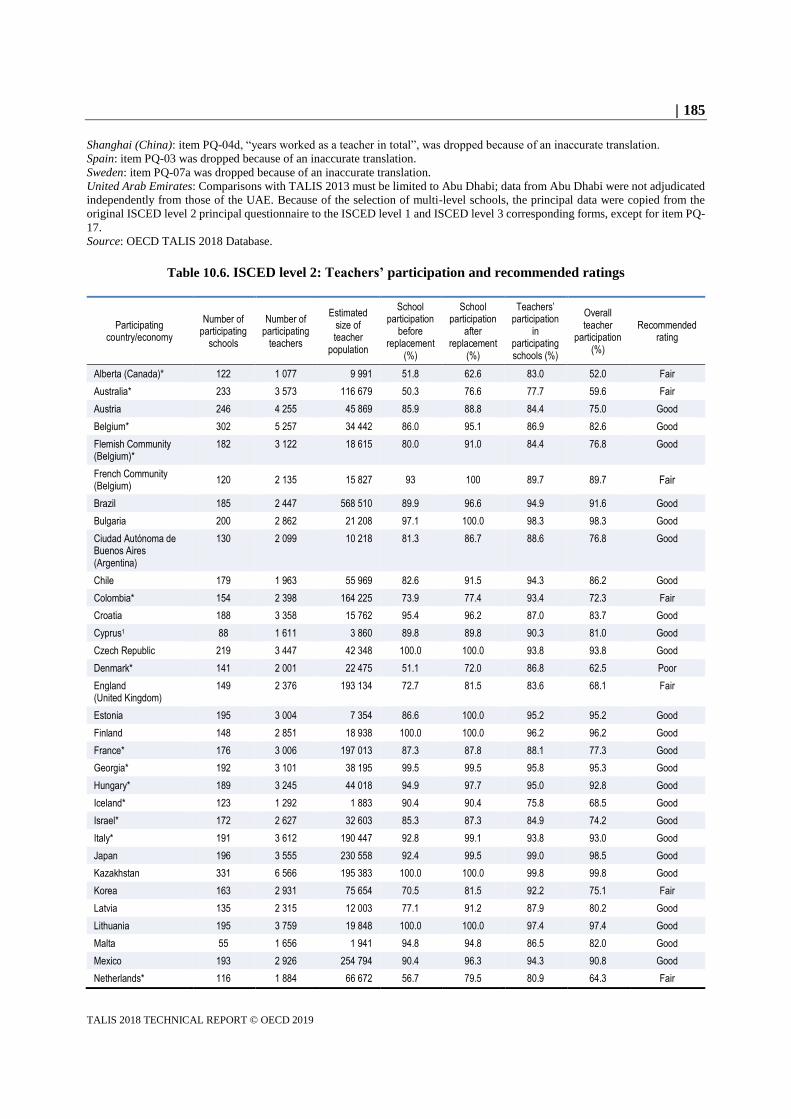
185
TALIS 2018 TECHNICAL REPORT © OECD 2019
Shanghai (China): item PQ-04d, “years worked as a teacher in total”, was dropped because of an inaccurate translation.
Spain: item PQ-03 was dropped because of an inaccurate translation.
Sweden: item PQ-07a was dropped because of an inaccurate translation.
United Arab Emirates: Comparisons with TALIS 2013 must be limited to Abu Dhabi; data from Abu Dhabi were not adjudicated
independently from those of the UAE. Because of the selection of multi-level schools, the principal data were copied from the
original ISCED level 2 principal questionnaire to the ISCED level 1 and ISCED level 3 corresponding forms, except for item PQ-
17.
Source: OECD TALIS 2018 Database.
Table 10.6. ISCED level 2: Teachers’ participation and recommended ratings
Participating country/economy
Number of participating
schools
Number of participating
teachers
Estimated size of teacher
population
School participation
before replacement
(%)
School participation
after replacement
(%)
Teachers’ participation
in participating schools (%)
Overall teacher
participation (%)
Recommended rating
Alberta (Canada)* 122 1 077 9 991 51.8 62.6 83.0 52.0 Fair
Australia* 233 3 573 116 679 50.3 76.6 77.7 59.6 Fair
Austria 246 4 255 45 869 85.9 88.8 84.4 75.0 Good
Belgium* 302 5 257 34 442 86.0 95.1 86.9 82.6 Good
Flemish Community (Belgium)*
182 3 122 18 615 80.0 91.0 84.4 76.8 Good
French Community (Belgium)
120 2 135 15 827 93 100 89.7 89.7 Fair
Brazil 185 2 447 568 510 89.9 96.6 94.9 91.6 Good
Bulgaria 200 2 862 21 208 97.1 100.0 98.3 98.3 Good
Ciudad Autónoma de Buenos Aires (Argentina)
130 2 099 10 218 81.3 86.7 88.6 76.8 Good
Chile 179 1 963 55 969 82.6 91.5 94.3 86.2 Good
Colombia* 154 2 398 164 225 73.9 77.4 93.4 72.3 Fair
Croatia 188 3 358 15 762 95.4 96.2 87.0 83.7 Good
Cyprus1 88 1 611 3 860 89.8 89.8 90.3 81.0 Good
Czech Republic 219 3 447 42 348 100.0 100.0 93.8 93.8 Good
Denmark* 141 2 001 22 475 51.1 72.0 86.8 62.5 Poor
England (United Kingdom)
149 2 376 193 134 72.7 81.5 83.6 68.1 Fair
Estonia 195 3 004 7 354 86.6 100.0 95.2 95.2 Good
Finland 148 2 851 18 938 100.0 100.0 96.2 96.2 Good
France* 176 3 006 197 013 87.3 87.8 88.1 77.3 Good
Georgia* 192 3 101 38 195 99.5 99.5 95.8 95.3 Good
Hungary* 189 3 245 44 018 94.9 97.7 95.0 92.8 Good
Iceland* 123 1 292 1 883 90.4 90.4 75.8 68.5 Good
Israel* 172 2 627 32 603 85.3 87.3 84.9 74.2 Good
Italy* 191 3 612 190 447 92.8 99.1 93.8 93.0 Good
Japan 196 3 555 230 558 92.4 99.5 99.0 98.5 Good
Kazakhstan 331 6 566 195 383 100.0 100.0 99.8 99.8 Good
Korea 163 2 931 75 654 70.5 81.5 92.2 75.1 Fair
Latvia 135 2 315 12 003 77.1 91.2 87.9 80.2 Good
Lithuania 195 3 759 19 848 100.0 100.0 97.4 97.4 Good
Malta 55 1 656 1 941 94.8 94.8 86.5 82.0 Good
Mexico 193 2 926 254 794 90.4 96.3 94.3 90.8 Good
Netherlands* 116 1 884 66 672 56.7 79.5 80.9 64.3 Fair

186
TALIS 2018 TECHNICAL REPORT © OECD 2019
Participating country/economy
Number of participating
schools
Number of participating
teachers
Estimated size of teacher
population
School participation
before replacement
(%)
School participation
after replacement
(%)
Teachers’ participation
in participating schools (%)
Overall teacher
participation (%)
Recommended rating
New Zealand* 185 2 257 23 227 62.8 79.5 79.6 63.3 Fair
Norway* 185 4 154 21 828 77.4 92.6 83.2 77.0 Good
Portugal 200 3 676 39 703 97.9 100.0 92.7 92.7 Good
Romania 199 3 658 66 039 100.0 100.0 98.3 98.3 Good
Russian Federation* 230 4 011 646 405 98.7 100.0 99.9 99.9 Good
Saudi Arabia* 179 2 744 99 661 89.7 89.7 86.0 77.1 Good
Shanghai (China)* 198 3 976 38 902 100.0 100.0 99.5 99.5 Good
Singapore 169 3 280 11 544 98.2 100.0 99.2 99.2 Good
Slovak Republic 176 3 015 24 746 82.4 88.9 95.4 84.7 Good
Slovenia 132 2 094 7 422 82.2 88.0 91.5 80.5 Good
South Africa 170 2 046 92 127 92.3 92.9 89.7 83.3 Good
Spain* 399 7 407 186 171 99.5 100.0 94.6 94.6 Good
Sweden 180 2 782 31 421 89.1 93.9 81.3 76.3 Good
Chinese Taipei 200 3 835 53 208 99.0 99.0 97.2 96.2 Good
Turkey 196 3 952 277 187 99.0 99.0 98.5 97.5 Good
United Arab Emirates* 521 8 648 14 489 100.0 100.0 96.0 96.0 Good
United States* 165 2 560 1 144 751 60.1 76.8 89.6 68.8 Fair
Viet Nam 196 3 825 295 033 100.0 100.0 96.3 96.3 Good
1. See endnotes 1 and 2 for Table 10.5.
Notes: A school was deemed a participating school if at least 50% of the selected teachers returned their respective questionnaires.
Alberta (Canada): because non-response bias analysis showed no evidence of a high risk of school non-response bias, Alberta’s
rating was upgraded from “poor” to “fair”. TALIS was conducted as a new Collective Bargaining Agreement for teachers was
being negotiated.
Australia: Australia’s data collection window extended into the following school year.
Belgium and Flemish Community (Belgium): entries on the sampling frame were administrative units and not “schools” as they
are usually defined. Because a “school” may comprise one or several administrative units, the principal would have been reporting
for the school, not just the selected administrative unit. Users, therefore, need to exercise care when analysing the school-level
statistics.
French Community (Belgium): The sample size is lower than the minimum number of schools required for TALIS, namely, 150,
unless a census of all schools is conducted.
Colombia: non-response bias analysis showed no evidence of a high risk of school non-response bias.
Denmark: because non-response bias analysis showed no evidence of a high risk of school non-response bias, Denmark’s rating
was upgraded from “poor” to “fair”. Because some translation issues could still exist in the trend items, users need to exercise
caution when comparing results across TALIS cycles.
France: Item TQ-33b and TQ-33d were dropped because of an inaccurate translation. Item TQ-55 was dropped because of an
inaccurate translation of the categories.
Georgia: the overall quality of the translation was deemed questionable. Translation issues could therefore still exist in the
Georgian and Azerbaijani instruments that could detrimentally affect the comparability of the data.
Hungary: items TQ-24, TQ-25, TQ-26 and TQ-28 were withdrawn at Hungary’s request because the wording was not sufficiently
clear to ensure non-misinterpretation of the data.
Iceland: because Iceland missed 75% participation by only 1 school, its rating was upgraded from “poor” to “fair”.
Israel: ultra-orthodox schools were removed post-facto because of very low responses rates, making coverage identical to that of
TALIS 2013. Because translation issues could still exist in the trend items, users need to exercise caution when comparing results
across TALIS cycles.
Italy: because translation issues could still exist in the trend items, users need to exercise caution when comparing results across
TALIS cycles.
Netherlands: the Netherlands began its data collection six weeks earlier than the other Northern Hemisphere countries/economies
and had an extended data collection window. Because an unapproved collection protocol resulted in the inclusion of some 50
“national” schools that were not included in the international dataset but were left on the national dataset, participation rates were
computed on the international dataset.

187
TALIS 2018 TECHNICAL REPORT © OECD 2019
New Zealand: coverage was extended to small schools (four or fewer teachers). While the impact on the target population of
teachers was negligible, the impact on the target population of principals is important because, compared to TALIS 2013, the
target population of teachers nearly doubled in size. Comparison of TALIS 2018 data with TALIS 2013 data should, therefore, be
restricted to the 2013 coverage.
Norway: item TQ-42p was withdrawn on Norway’s request because of a problematic national adaptation that could have led to
misinterpretation of the data.
Russian Federation: Moscow was excluded from TALIS 2018. Item TQ-10 b was dropped because of an inaccurate translation.
Item TQ-34 was dropped because of an error in the layout of the questionnaires that could have led to misinterpretation of the
data.
Saudi Arabia: two provinces bordering Yemen were excluded.
Shanghai (China): item TQ-17 was dropped because of an inaccurate translation.
Spain: item TQ-03 was dropped because of an inaccurate translation.
United Arab Emirates: Comparisons with TALIS 2013 must be limited to Abu Dhabi; data from Abu Dhabi were not adjudicated
independently from those of the UAE. Because of the selection of multi-level schools, the principal data were copied from the
original ISCED level 2 principal questionnaire to the ISCED level 1 and ISCED level 3 corresponding forms, except for item PQ-
17.
Source: OECD TALIS 2018 Database.
Table 10.7. ISCED level 3: Principals’ participation and recommended ratings
Participating country/economy
Number of participating principals
Principals’ participation before replacement (%)
Principals’ participation after replacement (%)
Recommended rating
Alberta (Canada)* 115 51.8 59.6 Fair
Brazil 187 91.4 97.5 Good
Croatia 145 96.7 96.7 Good
Denmark* 96 58.3 70.8 Fair
Portugal* 195 98.0 99.5 Good
Slovenia* 103 69.6 69.6 Fair
Sweden* 174 91.6 93.8 Good
Chinese Taipei 151 100.0 100.0 Good
Turkey 448 98.0 98.0 Good
United Arab Emirates* 366 89.7 89.7 Good
Viet Nam 199 100.0 100.0 Good
Notes: A school was deemed a participating school if the principal returned his or her questionnaire.
Alberta (Canada): because non-response bias analysis showed no evidence of a high risk of school non-response bias, Alberta’s
rating was upgraded from “poor” to “fair”. TALIS was conducted as a new Collective Bargaining Agreement for teachers was
being negotiated.
Denmark: because non-response bias analysis showed no evidence of a high risk of school non-response bias, Denmark’s rating
was upgraded from “poor” to “fair”. Items PQ-39b and PQ-39c were dropped because of an inaccurate translation.
Portugal: Part B of item PQ-15 was dropped because of an inaccurate translation.
Slovenia: Slovenia missed 75% participation by 0.5% of a principal, which led to the recommendation to upgrade Slovenia’s rating
from “poor” to “fair”.
Sweden: item PQ-07a was dropped because of an inaccurate translation.
United Arab Emirates: Comparisons with TALIS 2013 must be limited to Abu Dhabi; data from Abu Dhabi were not adjudicated
independently from those of the UAE. Because of the selection of multi-level schools, the principal data were copied from the
original ISCED level 2 principal questionnaire to the ISCED level 1 and ISCED level 3 corresponding forms, except for item PQ-
17.
Source: OECD TALIS 2018 Database.

188
TALIS 2018 TECHNICAL REPORT © OECD 2019
Table 10.8. ISCED level 3: Teachers’ participation and recommended ratings
Participating country/economy
Number of participating
schools
Number of participating
teachers
Estimated size of teacher
population
School participation
before replacement
(%)
School participation
after replacement
(%)
Teacher participation
in participating schools (%)
Overall teacher
participation (%)
Recommended rating
Alberta (Canada)* 112 1 094 7 819 51.6 56.6 80.2 45.4 Fair
Brazil 186 2 828 421 593 92.3 97.4 94.5 92.0 Good
Croatia 147 2 661 14 818 97.9 97.9 89.7 87.9 Good
Denmark 111 1 670 16 726 72.2 85.6 84.7 72.4 Fair
Portugal 195 3 551 36 188 99.0 99.7 91.3 91.0 Good
Slovenia 119 2 200 5 393 80.4 80.4 87.8 70.6 Good
Sweden 181 2 933 26 891 95.3 97.8 81.7 79.9 Good
Chinese Taipei 148 2 800 41 220 98.1 98.1 95.8 94.1 Good
Turkey 457 8 342 252 277 100.0 100.0 98.0 98.0 Good
United Arab Emirates*
405 6 118 10 143 99.3 99.3 95.7 95.0 Good
Viet Nam 199 3 884 175 061 100.0 100.0 97.7 97.7 Good
Notes: A school was deemed a participating school if at least 50% of the selected teachers returned their respective questionnaires.
Alberta (Canada): because non-response bias analysis showed no evidence of a high risk of school non-response bias, Alberta’s
rating was upgraded from “poor” to “fair”. TALIS was conducted as a new Collective Bargaining Agreement for teachers was
being negotiated.
United Arab Emirates: Comparisons with TALIS 2013 must be limited to Abu Dhabi; data from Abu Dhabi were not adjudicated
independently from those of the UAE. Because of the selection of multi-level schools, the principal data were copied from the
original ISCED level 2 principal questionnaire to the ISCED level 1 and ISCED level 3 corresponding forms, except for item PQ-
17.
Source: OECD TALIS 2018 Database.
10.5. Adjudicating the TALIS-PISA samples
Sampling of schools for the TALIS-PISA link is described in Chapter 5 of this report. In
summary, a sample of 150 schools (unless discussions with the NPM led to a different size)
was drawn randomly from the sample of schools drawn for PISA. As the PISA data
collection proceeded, the set of (original sample or replacement) schools participating in
PISA emerged, and thus the set of schools where the TALIS-PISA link should be
administered. The distribution of the TALIS Principal Questionnaire and of the TALIS
Teacher Questionnaire to a sample of twenty “PISA teachers” (i.e. teachers of 15-year-old
students) could then go ahead in each of the schools that had participated in PISA and also
sampled for the TALIS-PISA link.
The school and teacher participation rates for the TALIS-PISA link are computed as they
are for the ISCED levels (see Chapter 9 for details). Since the TALIS-PISA link sample is
a random subsample of the PISA sample of schools, the TALIS-PISA school weights (or
school weight component of the teacher weight) refer back to the original PISA population.
The adjudication of the TALIS-PISA samples had to wait until the PISA samples had been
adjudicated, as the former was dependent on the latter to allow the final determination of
the recommended rating. Even if the recommended rating for TALIS-PISA link, solely
based on what happened during the preparation and collection of the TALIS-PISA link,

189
TALIS 2018 TECHNICAL REPORT © OECD 2019
were “good”, if the data or samples from PISA ware to be rated less favourably, the
matched file could not be adjudicated as “good”. It could only be adjudicated as the
weakest, at most, of either rating.
Table 10.9 and Table 10.10 display the participation rates for the principals and teachers in
each country/economy that participated in the TALIS-PISA Link.
Table 10.9. TALIS-PISA Link: Principal's participation and recommended ratings
Participating country/economy
Number of schools sub-
sampled
Number of eligible schools
Number of participating
principals
Principals’ participation
before replacement (%)
Principals’ participation after replacement (%)
Recommended rating
Australia 150 148 131 66.9 88.5 Fair
Ciudad Autónoma de Buenos Aires (Argentina)
104 81 77 88.9 95.1 Good
Colombia 162 162 153 91.4 94.4 Good
Czech Republic 190 182 175 96.8 96.8 Good
Denmark 150 150 83 52.0 57.8 Poor
Georgia 150 144 124 86.1 86.1 Good
Malta 63 50 47 94.0 94.0 Good
Turkey 150 147 142 96.6 96.6 Good
Viet Nam 150 115 115 100.0 100.0 Good
Table 10.10. TALIS-PISA Link: Teacher's participation and recommended ratings
Participating country/ economy
School sample
size
Number of eligible schools
Number of participating
schools
Number of participating
teachers
Estimated size of teacher
population
School participation
before replacement
(%)
School participation
after replacement
(%)
Teachers’ participation
in participating schools (%)
Overall teacher
participation (%)
Recommended rating
Australia 150 148 131 2 233 34 598 65.6 88.8 93.4 82.9 Good
Ciudad Autónoma de Buenos Aires (Argentina)
104 81 73 1 194 2 673 87.7 90.1 85.1 76.7 Good
Colombia 162 162 154 2 242 179 900 91.4 95.1 94.6 89.9 Good
Czech Republic
190 182 173 2 592 62 040 95.1 95.1 94.8 90.0 Good
Denmark 150 150 100 1 079 20 777 65.8 70.0 85.9 60.2 Poor
Georgia 150 144 132 1 923 24 592 93.1 93.1 94.3 87.8 Good
Malta 63 50 44 857 1 102 88.0 88.0 88.6 78.0 Good
Turkey 150 147 142 3 591 236 904 97.9 97.9 99.6 97.5 Good
Viet Nam 150 115 114 2 170 250 645 99.3 99.3 98.4 97.7 Good

190
TALIS 2018 TECHNICAL REPORT © OECD 2019
References
Kish, L. (1965), Survey Sampling, Wiley, New York. [2]
OECD (2018), Teaching and Learning International Survey (TALIS) 2018 (database), OECD,
Paris.
[8]
OECD (2017), TALIS 2018 Technical Standards, Internal Document, OECD, Paris. [7]
OECD (2015), Call for Tenders 100001191: Teaching and Learning International Survey
(TALIS 2018), OECD, Paris,
http://www.oecd.org/callsfortenders/2015%2002%2025%20CFT%20for%20TALIS%202018
.pdf.
[1]
Statistics Canada (2017), Statistics Canada’s Quality Assurance Framework, 3rd Edition,
Statistics Canada, Ottawa, https://www150.statcan.gc.ca/n1/en/pub/12-586-x/12-586-
x2017001-eng.pdf?st=YIabaxa0.
[5]
Statistics Canada (2009), Quality Guidelines, 5th Edition, Statistics Canada, Ottawa,
https://unstats.un.org/unsd/econstatkb/knowledgebasearticle10247.aspx.
[4]
Statistics Canada (2003), Survey Methods and Practice, Statistics Canada, Ottawa,
https://www150.statcan.gc.ca/n1/en/catalogue/12-587-X.
[3]
UNECE (2014), Generic Statistical Business Process Model, United Nations Economic
Commission for Europe,
https://www.unece.org/fileadmin/DAM/stats/documents/ece/ces/ge.57/2015/Paper_CES_GSP
BM_EN.pdf.
[6]
Notes
1 Survey option refers to ISCED level 1, ISCED level 2, and ISCED level 3. The TALIS-PISA link
data could not be adjudicated at that time.
2 Questionnaire type refers to the teacher questionnaire or the principal questionnaire.
3 At their last meeting held in Paris in November 2018, the technical advisory group recommended
that data from countries that had not reached 50% participation be nonetheless weighted and
displayed in tables but not used in the computation of international averages or models.
4 Table 10.3 to Table 10.8 display the participation-rate estimates that were the most favourable for
the adjudication rating. The most favourable estimates could have been weighted or unweighted
depending on the characteristics of the country/economy, the teacher and principal population and
the educational level.

191
TALIS 2018 TECHNICAL REPORT © OECD 2019
Chapter 11. Validation of scales and construction of scale scores
To enable reporting on a latent trait (sometimes referred to as a construct) or other
abstract trait, some questions in the TALIS 2018 questionnaires were combined into an
index or scale. This chapter explains how the indices were created and describes the
methodology used to validate scales and construct scale scores. It details latent trait
evaluation and the procedure involved in computing scale scores and illustrates the
implications of the evaluation results for using scale scores in further analyses. The chapter
also describes the possibilities and limitations of using scale scores for cross-
country/economy comparisons and presents each scale in more detail together with its
statistical properties.
The statistical data for Israel are supplied by and under the responsibility of the relevant Israeli authorities. The
use of such data by the OECD is without prejudice to the status of the Golan Heights, East Jerusalem and Israeli
settlements in the West Bank under the terms of international law.

192
TALIS 2018 TECHNICAL REPORT © OECD 2019
11.1. Overview
The TALIS questionnaires include numerous items pertaining to, for example, school
characteristics and principals’ and teachers’ attitudes, perceptions and practices. Use of
suitable statistical procedures allows for the combination of responses to these items into
indices or scales. In line with previous TALIS cycles, two types of combinations were
considered for TALIS 2018:
Simple indices (e.g. ratios), constructed through simple arithmetical
transformations or by recoding one or more items.
Scale scores, derived using latent modelling within the framework of confirmatory
factor analysis (CFA).
CFA treats items as indicators of unobservable personal characteristics of respondents, such
as self-efficacy or beliefs, and uses combinations of items to develop a model of the latent
construct. After testing and confirming a stable latent construct model, scale scores may be
estimated that serve as numeric values for the latent constructs.
While simple indices enhance the analysis of observable (manifest) characteristics, such as
student-teacher ratio, scales enable analysis of non-observable (latent) characteristics such
as attitudes or other personal traits. This chapter begins by outlining the procedures used to
compute simple indices. It then describes the procedures involved in scale evaluation and
scale score estimation. A detailed description of the scales, including the items used to
compose each scale and the results of scale evaluation, follows. The chapter ends by
exploring the implications of these results for further analyses, especially in relation to
cross-country/economy comparisons.
11.2. Computation of simple indices
This section describes the construction of simple indices that are used in multiple tables of
the OECD final report (OECD, 2019[1]) and are part of the publicly available international
database. These indices were constructed through arithmetical transformation or recoding
of one or more items. More details are provided in Chapter 12.
11.2.1. Ratios and recoded variables
Student-teacher ratio
The student-teacher ratio was calculated at the school-level based on the information
derived from school principals’ responses to questions about the number of currently
employed teachers1 (headcounts) and the total number of enrolled students (headcounts)
from all grades. Thus, the index reflects the overall student-teacher ratio in each school
rather than being restricted to the target population. The ratio (STRATIO) is derived by
dividing the total number of students enrolled (TC3G16) by the number of employed
teachers in a given school (TC3G13A).
Ratio of teachers and personnel for pedagogical support
The ratio of teachers and personnel for pedagogical support was calculated at the school
level based on the information derived from school principals’ responses to a question
about the number of employed teachers (headcounts; see endnote 1) and the number of
personnel for pedagogical support.2 Thus, the index reflects the overall ratio of teachers

193
TALIS 2018 TECHNICAL REPORT © OECD 2019
and personnel for pedagogical support in each school rather than being restricted to the
target population. The ratio (TPRATIO) was derived by dividing the number of teachers
(TC3G13A) by the number of personnel for pedagogical support (TC3G13B).
Ratio of teachers and school administrative or management personnel
The ratio of teachers and school administrative or management personnel was calculated
at the school level and was based on information derived from school principals’ responses
to a question about the number of employed teachers2 (headcounts) and the number of
school administrative or management personnel.3 Thus, the index reflects the overall ratio
of teachers and school administrative or management personnel in each school rather than
being restricted to the target population. The ratio (TARATIO) was derived by dividing the
number of teachers (TC3G13A) by the number of school administrative or management
personnel (TC3G13C + TC3G13D).
School location in urban or rural areas – collapsed variable
The school location variable was calculated by using the responses of school principals to
the question about the size of the city in which the school was located (TC3G10). To
calculate the new index (SCHLOC), the second and third categories (3 001 to 15 000
people; 15 001 to 100 000 people) were collapsed together as were the fourth and fifth
categories (100 001 to 1 000 000; more than 1 000 000 people).
Principal age groups – categorised variable
The principal age group variable was calculated by using the responses of school principals
to the question about their age (TC3G02). To calculate the new index (PRAGEGR), the
values from the original question were recoded into four categories. The first category
includes all principals under the age of 40, the second category includes all principals
between 40 and 49 years of age, the third category all principals between 50 and 59, and
the fourth category all principals 60 years of age and older.
Teacher age groups – categorised variable
The teacher age group variable was calculated by using the responses of teachers to the
question about their age (TT3G02). To calculate the new index (TCHAGEGR), the values
from the original question were recoded into six categories. The first category includes all
teachers under the age of 25, the second category includes all teachers between 25 and 29
years of age, the third category all teachers between 30 and 39, the fourth category all
teachers between 40 and 49, the fifth category all teachers between 50 and 59, and the sixth
category all teachers 60 years of age and older.
Number of enrolled students – categorised variable
The number of enrolled students variable was calculated using the responses of principals
to the question about the current school enrolment (TC3G16). To calculate the new index
(NENRSTUD), the values from the original question were recoded into five categories.
The first category includes all schools with fewer than 250 students, the second category
includes schools with 250 to 499 students, the third category includes schools with 500 to
749 students, the fourth category includes schools with 750 to 999 students, and the fifth
category includes schools with 1000 and more students.

194
TALIS 2018 TECHNICAL REPORT © OECD 2019
11.2.2. Simple categorisation indices and their parameters
In addition to scale scores developed through CFA, indices for school resources and school
autonomy were created using recodings of the frequencies of the items, as CFA models
were not appropriate for the measured items comprising these indices.4
School autonomy: School autonomy for staffing (T3PAUTS); School autonomy for
budgeting (T3PAUTB); School autonomy for educational policies (T3PAUTP),
School autonomy for instructional policies (T3PAUTI); School autonomy for
curriculum (T3PAUTC)
To describe the extent of school autonomy in decision making, indices were derived from
question TC3G20 of the school principal questionnaire. Five simple indices were formed:
school autonomy for staffing (T3PAUTS), school autonomy for budgeting (T3PAUTB),
school autonomy for educational policies (T3PAUTP), school autonomy for instructional
policies (T3PAUTI), and school autonomy for curriculum (T3PAUTC).
School autonomy indices were created using 11 items, each of which had five response
options. School principals had to indicate who, among a range of stakeholders, had a
considerable responsibility in making decisions relating to tasks listed in the questionnaire.
Considerable responsibility could be attributed to one or more of the following: the
principal, other members of the <school management team>, teachers (not a part of the
<school management team>), <school governing board> or <local, municipality/regional,
state, or national/federal>. For a particular task, the extent of school-level autonomy was
determined by whether considerable responsibility lay at the school level (i.e. with the
principal, other members of the <school management team>, teachers (not as a part of the
<school management team>) and the <school governing board>), with other authorities
(i.e. <local, municipality/regional, state, or national/federal>) or was shared by both groups.
Each response option (checked/not checked) was a variable of its own. The 11 items
describing the tasks produced 55 variables in total. Table 11.1 lists the indices with the
corresponding items.
Table 11.1. Measured items for school autonomy
T3PAUTS: School autonomy for staffing
TC3G20: Regarding this school, who has a significant responsibility for the following tasks?
A “significant responsibility” is one where an active role is played in decision making.
Please mark as many choices as appropriate in each row.
Response options: Checked (1), Not checked (2)
TC3G20A: Appointing or hiring teachers
TC3G20A1 Principal
TC3G20A2 Other members of the school management team
TC3G20A3 Teachers (not as a part of the school management team)
TC3G20A4 School <governing board>
TC3G20A5 <local, municipality/regional, state, or national/federal> authority
TC3G20B: Dismissing or suspending teachers from employment
TC3G20B1 Principal
TC3G20B2 Other members of the school management team
TC3G20B3 Teachers (not as a part of the school management team)
TC3G20B4 School <governing board>
TC3G20B5 <local, municipality/regional, state, or national/federal> authority

195
TALIS 2018 TECHNICAL REPORT © OECD 2019
T3PAUTB: School autonomy for budgeting
TC3G20: Regarding this school, who has a significant responsibility for the following tasks?
A “significant responsibility” is one where an active role is played in decision making.
Please mark as many choices as appropriate in each row.
Response options: Checked (1), Not checked (2)
TC3G20C: Establishing teachers’ starting salaries, including setting pay scales
TC3G20C1 Principal
TC3G20C2 Other members of the school management team
TC3G20C3 Teachers (not as a part of the school management team)
TC3G20C4 School <governing board>
TC3G20C5 <local, municipality/regional, state, or national/federal> authority
TC3G20D: Determining teachers’ salary increases
TC3G20D1 Principal
TC3G20D2 Other members of the school management team
TC3G20D3 Teachers (not as a part of the school management team)
TC3G20D4 School <governing board>
TC3G20D5 <local, municipality/regional, state, or national/federal> authority
TC3G20E: Deciding on budget allocations within the school
TC3G20E1 Principal
TC3G20E2 Other members of the school management team
TC3G20E3 Teachers (not as a part of the school management team)
TC3G20E4 School <governing board>
TC3G20E5 <local, municipality/regional, state, or national/federal> authority
T3PAUTP: School autonomy for educational policies
TC3G20: Regarding this school, who has a significant responsibility for the following tasks?
A “significant responsibility” is one where an active role is played in decision making.
Please mark as many choices as appropriate in each row.
Response options: Checked (1), Not checked (2)
TC3G20F: Establishing student disciplinary policies and procedures
TC3G20F1 Principal
TC3G20F2 Other members of the school management team
TC3G20F3 Teachers (not as a part of the school management team)
TC3G20F4 School <governing board>
TC3G20F5 <local, municipality/regional, state, or national/federal> authority
TC3G20G: Establishing student assessment policies, including <national/regional> assessments
TC3G20G1 Principal
TC3G20G2 Other members of the school management team
TC3G20G3 Teachers (not as a part of the school management team)
TC3G20G4 School <governing board>
TC3G20G5 <local, municipality/regional, state, or national/federal> authority
TC3G20H: Approving students for admission to the school
TC3G20H1 Principal
TC3G20H2 Other members of the school management team
TC3G20H3 Teachers (not as a part of the school management team)
TC3G20H4 School <governing board>
TC3G20H5 <local, municipality/regional, state, or national/federal> authority
T3PAUTI: School autonomy for instructional policies
TC3G20: Regarding this school, who has a significant responsibility for the following tasks?
A “significant responsibility” is one where an active role is played in decision making.
Please mark as many choices as appropriate in each row.
Response options: Checked (1), Not checked (2)
TC3G20F: Establishing student disciplinary policies and procedures
TC3G20F1 Principal
TC3G20F2 Other members of the school management team

196
TALIS 2018 TECHNICAL REPORT © OECD 2019
The indices were computed in the following way:
1. A new variable for each item was created (each item had five response options, one
for each decision maker). If at least one of the response options was checked, the
variable was coded as 0.
2. If, for a given item, from the first four response options (describing decision making
as being at the school level) none were checked, and the fifth response option
(indicating decision making being the responsibility of other authorities) was
TC3G20F3 Teachers (not as a part of the school management team)
TC3G20F4 School <governing board>
TC3G20F5 <local, municipality/regional, state, or national/federal> authority
TC3G20G: Establishing student assessment policies, including <national/regional> assessments
TC3G20G1 Principal
TC3G20G2 Other members of the school management team
TC3G20G3 Teachers (not as a part of the school management team)
TC3G20G4 School <governing board>
TC3G20G5 <local, municipality/regional, state, or national/federal> authority
TC3G20J: Determining course content, including <national/regional> curricula
TC3G20J1 Principal
TC3G20J2 Other members of the school management team
TC3G20J3 Teachers (not as a part of the school management team)
TC3G20J4 School <governing board>
TC3G20J5 <local, municipality/regional, state, or national/federal> authority
TC3G20K: Deciding which courses are offered
TC3G20K1 Principal
TC3G20K2 Other members of the school management team
TC3G20K3 Teachers (not as a part of the school management team)
TC3G20K4 School <governing board>
TC3G20K5 <local, municipality/regional, state, or national/federal> authority
T3PAUTC: School autonomy for curriculum
TC3G20: Regarding this school, who has a significant responsibility for the following tasks?
A “significant responsibility” is one where an active role is played in decision making.
Please mark as many choices as appropriate in each row.
Response options: Checked (1), Not checked (2)
TC3G20I: Choosing which learning materials are used
TC3G20I1 Principal
TC3G20I2 Other members of the school management team
TC3G20I3 Teachers (not as a part of the school management team)
TC3G20I4 School <governing board>
TC3G20I5 <local, municipality/regional, state, or national/federal> authority
TC3G20J: Determining course content, including <national/regional> curricula
TC3G20J1 Principal
TC3G20J2 Other members of the school management team
TC3G20J3 Teachers (not as a part of the school management team)
TC3G20J4 School <governing board>
TC3G20J5 <local, municipality/regional, state, or national/federal> authority
TC3G20K: Deciding which courses are offered
TC3G20K1 Principal
TC3G20K2 Other members of the school management team
TC3G20K3 Teachers (not as a part of the school management team)
TC3G20K4 School <governing board>
TC3G20K5 <local, municipality/regional, state, or national/federal> authority

197
TALIS 2018 TECHNICAL REPORT © OECD 2019
checked, then the new variable was coded as -1. Thus, if the principal checked only
the “other authority” response option, the task was considered to be an external
responsibility (not autonomous).
3. If the school principal checked response options from both groups (decision making
at the school level and decision making by other authorities), the responsibility was
considered to be shared, and the value remained 0 (see point 1).
4. If one of the first four response options (the decision making being at the school
level) was checked, and the fifth response option (decision making being other
authority responsibility) was not checked, the new variable was coded as +1.
Therefore, if the principal selected at least one of the four school-level
responsibility options and no other authority responsibility option, the task was
considered to be a school responsibility (autonomous).
5. The newly created variables were recoded: -1 was recoded to 1, 0 to 2, +1 to 3.
6. For each index, if more than half of the newly created variables were classified as
autonomous, the school was classified as autonomous. If more than half of the
corresponding tasks were classified as not autonomous, the school was classified
as not autonomous. If neither criterion was met, the school was classified as mixed.
The final indices were coded 1 for “no autonomy”, 2 for “mixed autonomy”, and 3
for “autonomy”.
School resources: Lack of pedagogical personnel (T3PLACPE); Lack of
resources (T3PLACRE); Lack of material resources (T3PLACMA)
To describe the level of resources available in schools, indices were derived from 10 items
in question TC3G29 of the principal questionnaire. The question asked school principals
to indicate the extent (“not at all”, “to some extent”, “quite a bit”, “a lot”) to which a
shortage or lack of resources in a range of areas hindered the school’s capacity to provide
quality instruction. Table 11.2 presents the corresponding items for the three indices: lack
of pedagogical personnel (T3PLACPE), lack of resources (T3PLACRE), and lack of
material resources (T3PLACMA).

198
TALIS 2018 TECHNICAL REPORT © OECD 2019
Table 11.2. Measured items for school resources
T3PLACPE: Lack of pedagogical personnel
TC3G29 To what extent is this school’s capacity to provide quality instruction currently hindered by any of the following issues?
Response options: “Not at all” (1), “To some extent” (2), “Quite a bit” (3), “A lot” (4)
TC3G29A Shortage of qualified teachers
TC3G29B Shortage of teachers with competence in teaching students with special needs
TC3G29C Shortage of vocational teachers
T3PLACRE: lack of resources
TC3G29 To what extent is this school’s capacity to provide quality instruction currently hindered by any of the following issues?
Response options: “Not at all” (1), “To some extent” (2), “Quite a bit” (3), “A lot” (4)
TC3G29D Shortage or inadequacy of instructional materials (e.g. textbooks)
TC3G29E Shortage or inadequacy of digital technology for instruction (e.g. software, computers, tablets, smart boards)
TC3G29F Insufficient Internet access
TC3G29G Shortage or inadequacy of library materials
TC3G29I Shortage or inadequacy of instructional space (e.g. classrooms)
TC3G29J Shortage or inadequacy of physical infrastructure (e.g. classroom furniture, school buildings, heating/cooling, and lighting)
TC3G29M Shortage or inadequacy of necessary materials to train vocational skills
T3PLACMA: lack of material resources
TC3G29 To what extent is this school’s capacity to provide quality instruction currently hindered by any of the following issues?
Response options: “Not at all” (1), “To some extent” (2), “Quite a bit” (3), “A lot” (4)
TC3G29D Shortage or inadequacy of instructional materials (e.g. textbooks)
TC3G29E Shortage or inadequacy of digital technology for instruction (e.g. software, computers, tablets, smart boards)
TC3G29F Insufficient Internet access
TC3G29G Shortage or inadequacy of library materials
Source: OECD, TALIS database.
The indices were computed in the following way:
1. The responses were recoded so that the first two (1 – “not at all” and 2 – “to some
extent”) and the last two (3 – “quite a bit” and 4 – “a lot”) response categories were
collapsed for all the items.
2. If all responses to the items included in the particular index were “not at all” or “to
some extent”, the index had a value of 1.
3. If all responses to the component variables for the particular index were “quite a
bit” or “a lot”, the index had a value of 3.
4. All other combinations were coded as 2.
The final indices were coded 1 for “not a problem”, 2 for “a bit of a problem”, and 3 for “a
problem”.
11.3. Scaling procedures
TALIS aims to collect robust and rich information about teachers’ and principals’
characteristics as well as about their schools. Many of the specific personal traits, for
instance, teachers’ attitudes and self-efficacy, cannot be observed directly, but only through
expressed opinions or intended and observed behaviour. Such traits are considered latent,
that is, not directly observable. In large-scale studies, sets of items drawn from the studies’
instruments are used to estimate these latent traits. The instruments used in the TALIS
surveys are the teacher and principal questionnaires, the items of which are designed to
reflect specific facets of the envisaged latent traits. The procedure used to combine

199
TALIS 2018 TECHNICAL REPORT © OECD 2019
responses to these questions into a single scale score representing the latent construct of
interest is called scaling.5
11.3.1. Scale development and methods
TALIS 2018 scale development work began with a theoretical identification of items that
seemed indicative of the specified latent constructs. These identifications were based on
lessons learned from prior TALIS cycles (particularly with respect to the repeated
constructs), research theories from the respective fields, and expert knowledge on item and
scale construction. These steps served as an initial validity check of the scales (Messick,
1995[2]). The data intended to represent constructs and to be used for scale score
computation were subjected to extensive quality checks that included the use of item-level
statistics to check the distribution of missing data, the number of responses per category
and the shape of response distributions and reliability analyses.
Field trial data were used to evaluate the latent constructs and then modify them for the
main survey. The TALIS International Consortium, the Questionnaire Expert Group (QEG)
and the OECD then used the results from these field trial analyses to make decisions about
item and scale modifications. In some instances, the decision was to not create scale scores,
but instead to report the values at the level of individual items only. In addition, some items
were removed from the instruments after the field trial to reduce the length of the
questionnaires (for details on this matter, see Chapter 3). All decisions considered the state
of instrument development at the time of the field trial and the low number of cases in the
field trial data.
Analysis of the main study data, items and scales involved another thorough evaluation of
the extent to which each scale measured its construct consistently (construct reliability)
(Lyubomirsky and Lepper, 1999[3]) and the extent to which the scale measured the same
construct across the participating countries/economies (construct invariance) (Cheung and
Rensvold, 2002[4]; Vandenberg and Lance, 2000[5]). The process used for scale evaluation
and scale score calculation in the main survey encompassed the following steps:
1. Descriptive and internal consistency analyses
a. Item analysis of missingness
b. Item analysis of distribution
c. Item analysis of item-total correlation
d. Initial reliability checks.
2. Model analysis: CFA
a. Model analysis of the predefined construct, involving a joint analysis of data
from all participating countries/economies (CFA on a pooled sample)6
b. Model analysis at the country/economy level (separate CFA for each analysed
ISCED population in each country/economy).
3. Measurement invariance testing
a. Comparability of the constructs within ISCED levels across countries/
economies (i.e. measurement invariance testing conducted across
countries/economies within each ISCED level)

200
TALIS 2018 TECHNICAL REPORT © OECD 2019
b. Comparability of the constructs within countries/economies across ISCED
levels (i.e. measurement invariance testing conducted across ISCED levels
within each country/economy).
4. Final scale modelling
a. Modelling of the constructs to account for the invariance levels evident for each
cross-country/economy within ISCED level and cross-ISCED level within
country/economy measurement invariance result7
b. Reliability analysis of the final models.
5. Scale score computation
a. Scale score estimation
b. Scale score standardisation
c. Composite scale scores
Each of the steps mentioned above is described in more detail in the following
(sub)sections. In the subsection titled Descriptive and internal consistency analyses, the
initial descriptive analysis is described together with the reliability analysis from Steps 1d
and 4b. The next subsections, Model analysis and Measurement invariance testing: across
countries/economies and across ISCED levels, describe procedures from the model
analysis (Steps 2a and 2b) and measurement invariance testing (Steps 3a and 3b)
respectively. The subsection Final scale modelling describes how initial analysis led to the
final models and parameter estimates (4a). The section Scale scores computation is divided
into three subsections. The first describes the scale score estimation from Step 5a, the
second the scale score standardisation from Step 5b, and the third describes the scale score
computation for special types of scales from Step 5c, namely composite scales.
11.3.2. Scale evaluation
Descriptive and internal consistency analyses
As initial checks, items were analysed in relation to missingness, distribution, and corrected
item-total correlation. In addition, Cronbach’s alpha, as an initial reliability check, was
calculated and evaluated. Where applicable, items were reverse coded, which meant that
the higher the value on an item the higher the level of the latent construct.
Scale reliability was tested by examining the internal consistency of the scale. The weighted
omega statistic was used to measure the reliability of the scales because it does not assume
equal factor loadings (tau-equivalent measurement model) in the measurement model
(Viladrich, Angulo-Brunet and Doval, 2017[6]; Zhang and Yuan, 2016[7]). Therefore,
compared with Cronbach’s alpha, the weighted omega is relatively unbiased when items
exhibit unequal factor loadings for a single scale, which is true of all scales in TALIS 2018.
The weighted omega value is equal to the square of factor score determinacy (FSD)
obtained from the final model, which is an estimated correlation between the latent variable
and the items (Beauducel, Harms and Hilger, 2016[8]). However, Mplus FSD is used only
to calculate models with no binary items. For scales measured by binary items, Cronbach’s
alpha obtained from initial reliability checks is reported (step 1d).
To estimate the reliability of multidimensional scales (composite scales were computed as
the mean of the standardised subscale; for details see the section Recommendation for

201
TALIS 2018 TECHNICAL REPORT © OECD 2019
analysis and interpretation), the omega coefficients from the scale’s subscales were used
to calculate the stratified coefficient alpha as follows:
𝛾𝑆𝑇𝑅𝐴𝑇,𝛼 = 1 −∑ 𝜎𝑖
2(1 − 𝛾𝑖)𝑖
𝜎𝑐2
where 𝛾𝑆𝑇𝑅𝐴𝑇,𝛼 is the reliability of the composite/multidimensional scale; 𝜎𝑖2 is the variance
of the ith subscale, or the variance of the standardised factor scores of this subscale; 𝛾𝑖 is
the reliability of the ith subscale or the omega for this subscale; and 𝜎𝑐2 is the variance of
the composite/multidimensional scale or the variance of the sum of the standardised factor
scores of the subscales (He, 2010[9]).
Model analysis
Confirmatory factor analysis (CFA) was conducted to evaluate how well the actual
empirical data reflected the predefined latent construct. CFA allows inference on the scale
from the scale items by establishing associations between the two. The association between
each item and the scale is described in a regression line (OECD, 2014[10]). Using the model
fit indices as evaluation criteria (for further details, see Table 11.3), the specified (or
theoretical) model of each scale is assessed with respect to its alignment to the empirical
data (Hu and Bentler, 1999[11]).
Various procedures can be used to estimate the scale scores, including computation of a
sum or mean score over all items that measure the same construct, computations based on
classical test theory (CTT), structural equation modelling (SEM) using CFA, and
computing person parameters based on item response theory (IRT). The results from these
methods are typically highly correlated but are not completely congruent, and each method
has its respective advantages and disadvantages.
In keeping with past TALIS cycles, scale score computation based on CFA was used during
the current cycle of TALIS (OECD, 2014[10]; OECD, 2010[12]), as it remains a method that
has a solid scientific basis and offers great flexibility, given the invariance results for
TALIS scales. Also, when employed with certain modelling software (Mplus8), this form
of computation is well equipped to deal with missing values.
Analysis during the TALIS 2018 cycle was based on the general SEM framework, where
CFA is a specific type of model classified within this framework (Schreiber et al., 2006[13]).
All constructs with ordinal response categories were scaled using continuous CFA
(estimated using robust full-information maximum likelihood estimator on the matrix of
Pearson’s correlations), while constructs9 with binary items were scaled using categorical
CFA modelling (estimated using robust WLSMV10 estimator on the pair-wise matrix of
tetrachoric correlations). Design weights and replicate weights were used for all analyses,
and weights were rescaled so that each country contributed equally to the estimates.11 Some
TALIS 2018 items had already been used in previous TALIS cycles to construct latent scale
scores. Item selection for TALIS 2018 was conducted to maximise the overlap of items
between TALIS 2018 and TALIS 2013 and thus allow for item level comparisons across
cycles.
Given the increased emphasis on measurement invariance testing during the TALIS 2018
cycle (see below) compared to the previous cycles of TALIS, model fit for the current cycle
was prioritised over comparability with the earlier cycles. Therefore, directly comparing
the scale scores from TALIS 2018 with those of the past cycles is not recommended.

202
TALIS 2018 TECHNICAL REPORT © OECD 2019
To evaluate overall performance, CFA was conducted on a pooled sample composed of
data from all countries/economies for ISCED level 2 (the TALIS core target population
surveyed by all participating countries/economies). The initial examination of the pooled
CFA models of each scale was based on the model fit indices12. The models that passed the
cut-off criteria (see Table 11.3) proceeded to further steps, while improvements were made
to the models of the scales that originally failed to pass the cut-off values. Model
improvements included, for example, changes to the model structure (e.g. item exclusion,
and inclusion of residual covariances between specific items). These modifications were
included in the models for all following steps.
Most pooled model improvements were suggested by the modification indices produced by
the CFA implementation software. These reflect the approximate change to χ2 if certain
fixed/constrained parameters are freely estimated (Brown, 2006, p. 119[14]). To maintain a
balance between improving the model and keeping the model as parsimonious as possible,
only selected model re-specification resulting in the biggest (or, for some cases, second
biggest) change to χ2 were implemented and tested. For the same reason, cross loadings in
multidimensional scales were implemented in rare cases but were generally avoided if other
alternatives could bring significant improvements to the model. In certain cases, additional
improvements were made to the models when testing for measurement invariance. Changes
were made programmatically to the model that (1) should not bias the results and (2) do
not change the content of the scale construct. These include, for example, fixing the
negative residual variance for items in some scales to be positive and close to zero.
Most of the χ2 based model modifications included correlations between single items
(residual covariance). All scale modifications were accompanied by plausibility checks
conducted by the scaling team, as well as by the QEG experts, thus acknowledging that
changes to the model structure had relevant implications for scale content. In other words,
items were only correlated if the content of the items reflected a plausible and substantive
correlation.
In cases where the model did not show acceptable fit, even after improvements, exploratory
factor analysis (EFA) was used to analyse scale dimensionality. If the analysis revealed
multidimensionality, one of the following modifications was applied: (1) reducing the
number of items in order to build a unidimensional construct as indicated by the pattern
matrix provided by the oblimin rotation of the principal axis factoring13 solution; (2)
splitting the scale into two constructs as indicated by the EFA results; or (3) keeping the
scale as unidimensional during further analysis if there were strong content-related or other
reasons for doing so. The latter was relevant in those instances where theoretical arguments
supportive of multidimensionality were absent. Multidimensional scales that were
originally treated as unidimensional were re-specified and re-evaluated. Constructs that
only marginally failed to pass the cut-off criteria were kept for further analysis but
eventually dismissed if additional scale modifications did not succeed (see Excluded
scale(s) sub-sections from the sections Complex scales from the teacher questionnaire and
Complex scales from the principal questionnaire). For the current cycle, the use of EFA
for model improvement did not provide any meaningful enhancement to the latent
constructs. Therefore, no improvements were undertaken as a result of EFA information.
Scales that could not be improved through modifications were dropped from the analysis.
If a scale was deleted it had a fragmented internal structure in which items did not fit
together, meaning that either the scale was composed of several factors or poorly defined.
In the latter case, it was assumed that the items failed to measure the predefined construct

203
TALIS 2018 TECHNICAL REPORT © OECD 2019
and that the content validity of the scale was therefore low. Decisions made at this stage
were discussed with the TALIS Consortium and the QEG.
During the second step, the CFA model was tested via use of country/economy-level data
in each of the analysed populations (in all countries/economies for ISCED levels 1, 2 and
3, as applicable14). Improvements implemented in the pooled models were applied to these
models. In total, 72 single-country/economy, single-ISCED level models were analysed for
each scale.15 The evaluation procedure for these models was very similar to that of the
pooled model. If a model at the single-country/economy, single-ISCED level failed to meet
the fit index cut-off criteria (Table 11.3), additional improvements for that specific
population were implemented. If one of these scale models could not be improved, then
that single-country/economy, single-ISCED level population was removed from further
parameter estimation and included for the scale score construction that used fixed
parameters from the final scale model.
Table 11.3 provides information on the cut-off criteria for the CFA model fit evaluation
(Brown, 2015[15]; Chen, 2007[16]; DeVellis, 2003, pp. 94-96[17]; Hoyle, 2014[18]). It is
important to stress that these statistical criteria were used for the decision-making process
that was based on an iterative process involving content-related considerations between the
IEA scaling team and the QEG members.
Table 11.3. Cut-offs for CFA model evaluation for TALIS 2018
Statistic/index Description Cut-offs
Missing total (%) The percentage of missing values (out of those administered). More than 80% of valid answers at the item level for each participating country/economy
Cronbach’s alpha Scale reliability index: internal consistency index. Higher values indicate greater internal consistency.
0.600-0.699 (acceptable)
≥0.700 (good)
Omega Scale reliability index: factor score determinacy (FSD) squared. Higher values suggest greater scale reliability.
0.600-0.699 (acceptable)
≥0.700 (good)
Stratified coefficient alpha Scale reliability index: internal consistency index for composite/multidimensional scales. Higher values indicate greater internal consistency.
0.600-0.699 (acceptable)
≥0.700 (good)
Corrected item-total correlation
Correlation between the responses to an item and the observed total scores on all other items in the scale (the sum of all the other items).
The correlation ranges between -1 and +1. Higher value suggests that the item has better discrimination power.
≥0.300 (acceptable)
CFI (comparative fit index) Index of the model-data goodness of fit.
This compares the targeted factor structure model and the baseline model (all relationships fixed to zero). Higher value indicates a better model fit.
≥ 0.900 (acceptable)
TLI (Tucker-Lewis index) Index of model-data goodness of fit.
This gives the distance between the targeted factor structure model and the baseline model as a proportion of the distance between the baseline and the target model. Higher value indicates a better model fit.
≥ 0.900 (acceptable)
RMSEA (root mean square error approximation)
Index of the model-data misfit.
The value indicates the degree of model misspecification. It approaches 0 as the fit of the model improves.
≤ 0.080 (acceptable)
SRMR (standardized root mean square residual)
Index of the model-data misfit.
The value indicates the degree of model misspecification in terms of the model average of squared residuals between the observed covariances and the model-implied covariances as well as differences in observed and model implied item intercepts. The value is provided in a standardised metric
≤0.060 (acceptable)

204
TALIS 2018 TECHNICAL REPORT © OECD 2019
Statistic/index Description Cut-offs
ranging from 0 to 1, with smaller values indicating better model fit.
WRMR (weighted root mean square residual)
Residual-based fit index (experimental fit statistic). This index is suitable for models with varying variances of sample statistics and when sample statistics are on different scales. It is also used with categorical outcomes and was used in TALIS as the model-data misfit for categorical CFA. Smaller values indicate a better model fit.
≤0.900 (acceptable)
Standardised factor loadings
These indicate the strength of the relationship between each item and the latent scale.
0.450-0.600 (moderate)
≥ 0.600 (strong)
Notes: Cronbach’s alpha, omega, and stratified coefficient alpha are all different estimators of the same
reliability/internal consistency; therefore, the criteria are the same.
The cut-off criterion for the SRMR was less strict in TALIS 2013 (SRMR≤.1). To enhance alignment with the
established cut-off criteria for model evaluation proposed in the literature (Hu and Bentler, 1999[11]; OECD,
2014[10]; Schermelleh-Engel, Moosbrugger and Müller, 2003[19]; Steiger, 1990[20]; Yu, 2002[21]), a stricter cut-
off of SRMR was applied during TALIS 2018. This cut-off was justified because the scale construction in
TALIS 2018 benefitted from prior TALIS cycles as well as from the field trial.
When the intercepts are fixed to either a very high or low value, the SRMR can be misleading. In these cases,
the variances may be very low, resulting in an extremely large SRMR value (Asparouhov and Muthén, 2018[22]).
Thus, decisions relating to the performance and the measurement invariance of the scale are primarily based on
CFI, TLI, and RMSEA. SRMR was used for model evaluation if other fit indices revealed inconsistent results
and in models with varying intercepts (configural and metric models).
Measurement invariance testing: across participating countries/economies and
across ISCED levels
The TALIS 2018 data were used for analysis directed towards a cross national perspective
focused on comparing results across the different participating countries/economies. Of
crucial importance during any comparison of scales across groups (such as education
systems, participating countries/economies, ISCED levels) is making sure that the scales
are equivalent in meaning in each of the groups being compared. The extent to which the
comparability of a scale among groups can be reached varies, and this has direct
implications for which statistical calculations (e.g. regression, correlation or mean
comparisons) should be used to analyse the scale score. The statistical procedure used to
analyse the comparability of latent scales in different groups is called measurement
invariance testing (Cheung, 1999[23]; Cheung and Rensvold, 2002[4]; Davidov, 2008[24];
Steenkamp and Baumgartner, 1998[25]; OECD, 2014[10]; Van de Vijver et al., 2019[26]). The
TALIS 2018 scales were evaluated with respect to their equivalence (comparability) across
participating countries/economies and ISCED levels, within the CFA framework. More
details on the measurement invariance testing within the CFA framework can be found in
(OECD, 2014[10])
It is important to remember that the construction of latent scales are based on associations
between several items and the underlying latent construct and the mean structure of the
items. The latent construct, including its indicators (items), is reflected within a specified
joint model, the measurement model. Specified within the CFA framework, the
measurement model contains different parameters that are estimated along with the model:
item factor loadings, intercepts (or thresholds in the case of categorical CFA) and residual
variances,16 as well as latent means and variances (Davidov et al., 2014[27]).
During the procedure involved in testing measurement invariance, different models are
specified and compared to one another. The models differ from one another in terms of
certain parameters being either unconstrained (i.e. freely estimated) between groups, which
assumes incomparability across groups, or constrained (i.e. to the same value) between

205
TALIS 2018 TECHNICAL REPORT © OECD 2019
groups, which assumes comparability across groups. The degree to which the stricter model
(i.e. a model that assumes equal parameters across groups), as compared to the less strict
model (i.e. a model that assumes some degree of flexibility of parameters between groups)
suits the data is evaluated via model fit indices and the direction (i.e. better or worse fit)
and degree of change between the fit indices of each model.
In the least restrictive model, all parameters are freely estimated for each group17 (e.g.
participating country/economy) separately, meaning that the parameters are unconstrained
and vary across these groups. The model implies that there is no comparability between
groups because all parameters are group-specific and therefore no statistical comparisons
are permitted. Additional models are estimated and become gradually more restrictive (i.e.
contain a greater number of parameters that are restricted to be equal across groups),
resulting in increasingly equal measurement models with greater levels of comparability
between the groups. As the models become more restrictive, the justification for statistical
comparability and analysis between the groups (e.g. correlation or mean comparisons)
increases. The levels of comparability are called measurement invariance levels and are
specifically defined by the parameters that are restricted in the model representing each of
the levels. The three most common levels of measurement invariance testing are (1)
configural, (2) metric and (3) scalar (Cheung, 1999[23]; Cheung and Rensvold, 2002[4];
Davidov, 2008[24]; Davidov et al., 2014[27]; Steenkamp and Baumgartner, 1998[25]; OECD,
2014[10]).
The lowest level of measurement invariance, the configural level, assumes that the
underlying latent construct is specified by a particular configuration of items in all analysed
groups in the same way. Configural level of measurement invariance applies when the
construct is measured by the same items. It implies that the structure of the construct
indicated by the configuration of items is equivalent across participating
countries/economies. If a scale reaches only the configural level of measurement
invariance, then any statistical method applied to compare the scale scores across groups
will violate the basic assumption of the comparability of the measured construct. The
comparability occurs at a conceptual level only, while score comparability is not achieved.
Therefore, results (e.g. correlations) from different groups can be discussed only through
reference to each specific group.
The meaning of the scale is defined by the content of the questions participants were asked
and that were used to create the scale. If the strength of the associations (i.e. the magnitude
of the regression parameters) is the same across groups, then the latent construct is assumed
to have the same meaning. This is the second level of measurement invariance, the metric
level. Metric level of measurement invariance applies when (1) the structure of the
construct is the same across groups, and (2) the strength of the associations between the
construct and the items (factor loadings) is equivalent across groups. Metric invariance
makes it possible to claim that one unit of change in the construct will lead to the same
amount of average change in the items that constitute the construct across different groups
(e.g. participating countries/economies). If a scale establishes the metric level of
invariance, it can be assumed that comparisons of correlational analyses (such as
correlation or regression analysis) are free of the cross-group bias. Of note, for scales with
binary indicators this level of measurement invariance testing was omitted as these models
have identification issues when using the Mplus software.
During TALIS 2018, the level of comparability was deemed sufficient if all parameters of
a model (except the residuals of the items18) were fixed to be the same across groups (e.g.
participating countries/economies). This approach is called the scalar level of measurement

206
TALIS 2018 TECHNICAL REPORT © OECD 2019
invariance. Scalar level of measurement invariance applies when (1) the structure of the
construct is the same across groups, (2) the strength of the associations between the
construct and the items (factor loadings) are equivalent, and (3) the intercepts/thresholds
for all items across groups are equivalent. If the intercepts of the items for all groups are
equivalent, then the expected value of the items becomes the same across groups when the
value of the construct is zero, meaning that the value/degree of the construct for a certain
value of the observed item can be claimed to be equivalent across different groups. In this
case, cross-group comparisons of scale means are justified, and the results can be assumed
to be free of cross-group bias (e.g. cross-cultural bias).
The current cycle of TALIS sought to use up-to-date and valid techniques with solid
analytical backgrounds for the scaling procedure to ensure the resulting model of each scale
was an accurate representation of teachers’ and principals’ characteristics in the
participating countries/economies. This aim resulted in an examination of the measurement
invariance across both participating countries/economies and ISCED levels.
The measurement invariance testing referred to as “cross-country/economy” examined
invariance within a single ISCED level. In other words, for the participating
countries/economies that participated at the ISCED 1 level, measurement invariance testing
was conducted considering each participating country/economy with an ISCED level 1
population was considered to be a separate group during the analysis. This same procedure
was followed for each ISCED level (ISCED 1, 2 and 3) separately. The measurement
invariance testing referred to as “cross-ISCED level” examined invariance within a single
country/economy across ISCED levels. Therefore, measurement invariance testing was
conducted for each participating country/economy that participated in the study at more
than one ISCED level, which meant that the invariance testing treated each ISCED level a
separate group during the analysis. The measurement invariance testing both cross-country
and cross-ISCED level was then used to develop each scale’s final model containing
parameter constraints as suggested by the results of both the cross-country and cross-
ISCED level measurement invariance testing conducted for that particular scale.
The modelling method chosen to investigate measurement invariance during TALIS 2018
was the same as that used during for TALIS 2013 and TALIS 2008, namely the multiple
group confirmatory factor analysis (MGCFA). During the cross-country measurement
invariance testing, the analysis evaluated whether the model was invariant/equal across
participating countries/economies within a certain ISCED level.19 These models were
compared at configural, metric, and scalar levels, and the purpose of the analyses was to
investigate if statistical analysis of the scale scores could be compared across participating
countries/economies within each ISCED level.
During the cross-ISCED level measurement invariance testing, the analysis evaluated
whether the model was invariant/equal across ISCED levels within a participating
country/economy. To be specific, for a certain country X, up to three20 CFA models were
created and compared at configural, metric, and scalar levels. The purpose of this analysis
was to investigate whether statistics obtained from the analysis of the scale scores could be
compared across ISCED levels within a single country/economy. The scale score
estimation was based on the evaluation of each scale’s results as described in the following
sections.
The changes to the model fit indices CFI, TLI, RMSEA and SRMR/WRMR21 were used to
evaluate the measurement invariance level of each scale, and the criteria used to conduct
the evaluation were as follows:

207
TALIS 2018 TECHNICAL REPORT © OECD 2019
● The configural level of invariance (no restriction on factor loadings or intercepts)
was established if the model passed the following criteria: CFI≥0.90 or TLI≥
0.90 and RMSEA≤0.08 or SRMR≤0.06/WRMR≤0.90.
● The metric level of invariance (with factor loadings set to be the same for different
groups) was established if the difference in fit indices between the metric and
configural model passed the following criteria: ΔCFI<0.010 or ΔTLI<0.015 and
ΔRMSEA>-0.015 or ΔSRMR>-0.03 (Chen, 2007[16]).
● The scalar level of invariance (factor loadings and intercepts set to be the same for
different groups) was established, if the difference in the fit indices between the
scalar and metric model passed the following criteria: ΔCFI<0.010 or ΔTLI<0.015
and ΔRMSEA>-0.015 or ΔSRMR>-0.01/ΔWRMR>-0.40 (Chen, 2007[16]).
There were some cases where the configural model was “just identified”, meaning that the
model fit could not be evaluated due to the lack of degrees of freedom. The fit indices
therefore indicated perfect model fit because the model was derived directly from the data
(Brown, 2006, p. 66[14]). These cases occur in unidimensional scales with three items,
resulting in a model that perfectly described the empirical structure of data. When
comparing the fit indices of a perfectly fitting configural invariant model with a metric
invariant model, differences are often greater than the recommended thresholds. Thus, in
the TALIS 2018 scale evaluation, the models with three indicators were considered to be
metrically invariant if the metric model fitted the data well (with the same criteria used for
the configural model used for the evaluation). The reason for these special evaluation
criteria is that the addition of constraints to a just identified model typically leads to worse
fit indices beyond the difference criterion between the metric and configural models
outlined above, with this worsening having the potential to influence the resulting level of
invariance.
Final scale modelling
The specification of parameters in the final model depended on the level of invariance
established in previous steps of the analysis both cross-country and cross-ISCED level. For
example, if for one scale, scalar invariance was established across participating
countries/economies within ISCED level 2, then the final model allowed equal factor
loadings and intercepts across participating countries/economies within ISCED level 2. If,
for the same scale, metric invariance had been established across participating
countries/economies within ISCED level 1, then the final model also allowed equal factor
loadings (while allowing intercepts to vary) across participating countries/economies
within ISCED level 1 in the same model. Similarly, for the same scale’s results of
measurement invariance testing in ISCED level 3, the model allowed for necessary
constraints for ISCED level 3 within the same model. Finally, the invariance testing results
of the same scale’s cross-ISCED levels within each participating country/economy were
also allowed the necessary constraints within the same model.
In sum, the measurement invariance testing results for all three ISCED levels across
participating countries/economies and all participating countries’/economies’ cross-ISCED
levels for a single scale were modelled together in the scale’s final model. Therefore, the
final scale models accounted for all invariance results both cross-country and cross-ISCED
level. The final scale models underwent MGCFA where each individual country/economy
and ISCED level was modelled. The final scale models underwent the same evaluation with
regard to their fit assessments and final model improvements were made if necessary.

208
TALIS 2018 TECHNICAL REPORT © OECD 2019
For those participating countries/economies that did not meet the TALIS 2018 technical
standards,14 those participating countries/economies with late data submission, and the
TALIS-PISA link countries/economies, their respective final scale models used fixed
parameters. The parameters were fixed according to the cross-country measurement
invariance results of ISCED level 2, the TALIS study’s target population. Therefore, if a
scale reached scalar invariance cross-country within the ISCED 2 level, then the factor
loadings and intercepts were constrained to be equal to those unstandardised parameters in
the final scale model; if metric invariance was reached, only factor loadings were
constrained; and if configural invariance was reached, then no constraints were imposed on
factor loadings and intercepts.17
Once the final scale models had been specified for all participating countries/economies
and ISCED levels, factor score determinacies from the model were used to calculate the
omega reliability coefficient as part of the evaluation of the scale. All parameters estimated
in these models are reported below in the section Results from scales evaluation and scale
score creation. For scales reaching metric or scalar levels of invariance within a certain
ISCED level, unstandardised factor loadings and intercepts are presented to show the
model’s equality restraints. In addition, standardised factor loadings are shown to aid in
interpretation of the reliability of the model.22
11.3.3. Scale scores computation
Scale score estimation
After completion of the scale evaluation, a scale score for each of the constructs was
created. Using scale scores instead of analysing single items or sum scores offers many
methodological and practical advantages. Although scale scores are not completely free of
measurement error, when compared to individual variables, this error is often minimised
thus increasing the reliability of these scores (Brown, 2006[14]; Hansen, Rosen and
Gustavson, 2006[28]). In practice, using a single score enhances the readability,
interpretation and implementation of analysis as compared to analysis based on a set of
variables. Another advantage of scale scores compared to simple sum scores is that the
former accounts for differences in the relative strength of the relationships between the
latent construct and the items (see, for example (Cheung and Rensvold, 1998[29]). In
addition, scale score computations account for missing data while still producing a score
for each observation, while this is more difficult to obtain using a simple sum score.
The computation of the scale scores in TALIS 2018 was based on the CFA models
previously established within the model evaluation. Thus, specification of the CFA models
includes the model modifications and considers the results of the measurement invariance
testing. This approach means that the model parameters in each scale are kept constant or
allowed to vary according to established levels of measurement invariance (i.e. it considers
both the cross-country and cross-ISCED level measurement invariance testing results). Use
of the CFA models allows development of scores known as factor scores. Within the
MGCFA framework, the parameters can be estimated separately, in the multiple group
models, for each single-country/economy, single-ISCED level. This approach makes it
possible to constrain or freely estimate the factor loadings and item intercepts/thresholds
depending on the measurement invariance results. The factor scores are specified as
continuous normally distributed. The program Mplus version 8 was used to compute the
scale scores used to represent the latent constructs.

209
TALIS 2018 TECHNICAL REPORT © OECD 2019
According to the SEM framework, an item 𝑦 is predicted from the latent factor 𝜂, which is
multiplied with the matrix of factor loadings 𝜦. The vector of item intercepts 𝝉 and the
vector of residuals 𝜀 are both added to the product. This is written as:
𝑦 = 𝝉𝑦 + 𝚲𝑦𝜂 + 𝜀
To estimate factor models from ordinal items, the MLR estimation procedure for
continuous latent constructs was used because it is robust to non-normality. Mplus uses the
maximum of the posterior distribution of the factor, which is known as the maximum a
posteriori method (Muthén and Muthén, 1998-2017[30]). This method is similar to the latent
regression approach (Skrondal and Laake, 2001[31]). If all 𝑦 items are continuous, the factor
score estimate 𝜂 for individual 𝑖 is based on a regression method with correlated factors
(Muthén, 1977[32]), where the factor score is computed from the mean vector of 𝑦 items,
denoted as 𝝁, the factor score coefficient matrix 𝑪, the vector of observations 𝒗𝑖, the vector
of intercepts 𝝉, and the matrix of factor loadings 𝜦 multiplied by the mean vector 𝝁:
�̂�𝑖 = 𝝁𝑦 + 𝑪(𝒗𝑖 − 𝝉𝑦 − 𝚲𝑦𝝁𝑦)
The factor score coefficient matrix, in turn, is based on the item covariance matrix 𝜮, the
matrix of factor loadings 𝜦, and the matrix of residual variances and covariances 𝜣:
𝐶 = 𝚺𝑦𝚲𝑦𝑇(𝚲𝑦𝚺𝑦𝚲𝑦
𝑇 + 𝚯𝑦)−1
These formulas imply that higher factor loadings on an item are associated with a stronger
influence of this item on the factor score estimate. Likewise, the larger the residual variance
of an item, the smaller its influence on the factor score estimate. The factor loadings, item
intercepts, the mean vector and the variance of the latent variable affect the estimated
scores.
The WLSMV estimation procedure was used to estimate factor models with scaled binary
items. This method produces weighted least square parameter estimates by using a diagonal
weight matrix, robust standard errors, and a mean- and variance-adjusted χ2 test statistic
(Brown, 2006, p. 388[14]). The method also takes a slightly different approach to estimating
factor scores. First, the probability of observed binary response 1 is defined as
𝑓𝑗(𝑦𝑖𝑗|𝜼𝑖) = Φ [(𝜁 − 𝝀𝑗′𝜼𝑖)𝜃𝑗𝑗
−12]
and the probability of observed categorical response 0 is therefore 1 − 𝑓𝑗(𝑦𝑖𝑗|𝜂𝑖), where 𝜁
is the item threshold based of an item 𝑗, 𝝀𝑗′is the 𝑗th row of the matrix of factor loadings
𝜦, and 𝜃𝑗 is the 𝑗th diagonal of the matrix of residual variances and covariances 𝜣, while 𝜼𝑖 is a vector of true factor scores.
The factor score estimates �̂�𝑖 are then found as the mode of the posterior distribution of 𝜼𝑖 by minimising, through use of quasi-Newton techniques, the following function 𝐹 with
respect to 𝜼𝑖:
𝐹 =1
2(𝜼𝑖 − 𝝁𝑖)
′𝚺−1(𝜼𝑖 − 𝝁𝑖) −∑ln𝑓𝑗(𝑦𝑖𝑗|𝜼𝑖)
𝑝
𝑗=1

210
TALIS 2018 TECHNICAL REPORT © OECD 2019
where 𝝁 is the mean vector of 𝑦 items. Contrary to the factor score estimation for models
with categorical items, this approach assumes uncorrelated residual variances even if
residual covariances are allowed.
For both continuous and categorical data, Mplus provides a model-based approach to
estimating parameters in a model with missing data. Model-based approaches account for
the missing data and estimate the missing parameters in one step (Lüdtke et al., 2007[33]),
and to do this Mplus uses the expectation maximisation algorithm. For a detailed
description see Dempster, Laird and Rubin (1977[34]). This procedure assumes that the data
are missing-at-random, meaning the probability of a missing observation depends not on
the true score of a person regarding the latent construct but can be correlated with other
covariates of the scale (Schafer and Graham, 2002[35]).
For each TALIS scale, the expectation maximisation algorithm was used to compute a scale
score for respondents who responded to at least one of the items belonging to the respective
scale. (The algorithm made it possible to deal with missing data and provide the appropriate
estimator for the continuous or categorical nature of the respective scales.) The residual
variances of the items were allowed to be freely estimated in all models.
Scale score standardisation
To enhance interpretation, the scale scores were standardised in such a way that the value
10 corresponds to the mid-point of the scale. Of note, this approach differs from
standardisations in which a specific value is set to be equal to the mean of the scale. Before
presenting the formula, the interpretation of the scale score values is explained referring to
the example presented in Figure 11.1. The Figure displays the questionnaire items which
were used to create the scale Personal utility motivation to teach (T3PERUT). The metric
of scale scores was transformed to indicate the relative midpoint of the original scale items’
categories. More specifically, T3PERUT is measured by responses to items A through D
(with variable names TT3G07A through TT3G07D) from question 7 in the teacher
questionnaire (additional items are greyed-out in the figure). These items contained the
responses “Not important at all”, “Of low importance”, “Of moderate importance” and “Of
high importance” coded 1 through 4, respectively.
Numerically, the midpoint for each item is 2.5, as shown in the figure. To calculate the item
midpoint value (IMV) for each individual, a simple average was calculated for all item
responses. Conceptually, if an individual’s IMV is less than 2.5 then this suggests that items
on average are considered as lesser importance. An IMV greater than 2.5 suggests the items
on average are of some or greater importance. A value of 2.5 suggests indifference.

211
TALIS 2018 TECHNICAL REPORT © OECD 2019
Figure 11.1. Illustration of the midpoint of a scale’s items
For the standardisation procedure of the scale score, the estimated scale scores were
standardised using data from the target population of the TALIS study, ISCED level 2 (with
the exception of participating countries/economies not meeting the technical standards and
participating countries/economies with late data collection; see Table 11.7). A metric with
a standard deviation of 2.0 and a mean of 10 was used to standardise the scale scores. The
mathematical transformation ensured that all or almost all values were positive, thus
allowing for a convenient interpretation.
Once the scores were adjusted with a standard deviation of 2.0 and mean of 10, a second
adjustment was made as follows. The average scale score for the set of those individuals
from ISCED level 2 whose IMV was equal to the midpoint of the scale items (in this
example, 2.5) was computed and then subtracted from 10, and this difference (�̅�𝑀∗ ) was
added to the scale score of each individual, resulting in the final standardised scores.
Mathematically, the standardisation is represented as follows:
𝑋𝑖 = 10 + 2𝐹𝑖 − �̅�
∗
𝜎𝐹∗+ �̅�𝑀
∗
where 𝑋𝑖 is the standardised scale score of individual 𝑖, 𝐹𝑖 is the raw estimated scale score
of that individual, �̅�∗ is the mean scale score of the ISCED level 2 level population, 𝜎𝐹∗ is
the standard deviation of the scale score of the ISCED level 2 population, and �̅�𝑀∗ is as
described above.
By adding �̅�𝑀∗ , standardised scale scores are shifted so that the scale score average is 10 for
those individuals from the target population with an IMV equal to the midpoint of the
response scale. This shifts the scale score mean to 10 plus the constant �̅�𝑀∗ and allows for
easy interpretation of scale score: scores above 10 suggest positive associations with the
scale (e.g. agreement, of more importance), scores below 10 suggest negative associations

212
TALIS 2018 TECHNICAL REPORT © OECD 2019
with the scale (e.g. disagreement, of lesser importance), while scores of exactly 10 suggest
indifference.
Table 11.4 provides an example of this procedure for the scale T3PERUT. The column on
the left shows all the possible IMVs for individuals when aggregating the responses to the
four items of the scale. The column on the right shows the mean factor score of individuals
from the target population with the corresponding IMV. As shown, individuals with an
IMV of 2.5 have an average scale score of 10. In general, these means rise as the IMV rises,
and fall as the IMV falls.23
Table 11.4. Items average scale score equivalent table for the scale T3PERUT
Item midpoint value (IMV)
Average scale score
1.00 6.17
1.25 6.71
1.33 7.20
1.50 7.35
1.67 8.31
1.75 8.12
2.00 8.72
2.25 9.29
2.33 9.57
2.50 10.00
2.67 10.34
2.75 10.59
3.00 10.93
3.25 11.50
3.33 11.59
3.50 12.16
3.67 12.32
3.75 12.72
4.00 13.06
Composite scale scores
Among the scales created for the TALIS 2018 dataset, there are also scores based on
multidimensional constructs that are defined as the combination of two or more
components (e.g. the teachers’ composite job satisfaction score is composed of two
subscales: teachers’ job satisfaction with work environment and teachers’ job satisfaction
with profession). These scales underwent identical model evaluation as outlined in the
section Scale development and methods and exhibited acceptable reliability and levels of
invariance.
As the final scale models and scale scores were created within a complex encoding system
(which takes into account different measurement invariance levels across participating
countries/economies and within them across ISCED levels), the computation of the scale
scores from multidimensional scales failed due to the complexity of the model.24 Therefore,
the scale scores for multidimensional scale’s subscales were calculated as other
unidimensional scale scores detailed in the above two subsection. Then, after the
multidimensional structure of the constructs had been evaluated, composite scores were
computed by taking a simple average of the corresponding standardised scores of the

213
TALIS 2018 TECHNICAL REPORT © OECD 2019
subscales. The computation of the composite scores for individual 𝑖 can be summarised as
follows:
𝑌𝑖 =∑ 𝑋𝑖𝑗𝑁𝑗=1
𝑁 ,
where 𝑌𝑖 are the composite scores for a certain multidimensional scale for individual 𝑖, 𝑋𝑖𝑗
are the raw scale scores of the subscale 𝑗 for individual 𝑖, and 𝑁 is the number of subscales
of this multidimensional scale. These scores were then standardised in the same manner as
described in sub-section Scale score standardisation.
Any analysis of the subscale scores and the composite scores needs to take into account the
following limitations: (1) the subscale scores should not be used in a correlation or
regression analysis simultaneously due to collinearity of these subscales; and (2) the
composite scores could be biased because of the weight of the subscale on the latent
construct not being taken into account (i.e. assumed to be equal for all subscales).
11.3.4. Recommendation for analysis and interpretation
Cross-country/economy comparability
An important consideration for anyone using the scale scores in analysis is that the results
not only from the scale reliability analyses but also the cross-country or ISCED-level
measurement invariance testing described above have major implications for (1) the
construction of scale scores, and (2) the use of the scale scores in further analysis.
To aid the user regarding the comparability of scale scores, the cross-country levels of
invariance are included in the variable labels of each scale in the international data sets. For
example, the scale with variable name T3CLASM has the label, “Classroom management
/ Metric (1) - Configural (2, 3)”, which indicates that the scale reached metric invariance
for ISCED 1 level and configural invariance for ISCED level 2 and 3. Table 11.5 shows
how many scales reached a particular level of invariance. For a more detailed look, Table
11.6 presents the specific invariance levels for each scale, listed by its variable name and
label found in the international database.
Table 11.5. Scale counts of the invariance levels for both populations
Invariance levels
Population Configural Metric Scalar
Teachers
ISCED 1 6 23 2
ISCED 2 8 22 1
ISCED 3 9 20 2
Principals
ISCED 1 5 6 1
ISCED 2 6 5 1
ISCED 3 5 6 1
Source: OECD, TALIS database.

214
TALIS 2018 TECHNICAL REPORT © OECD 2019
Table 11.6. Invariance level reached for each scale by ISCED level
Scale label Variable Name ISCED 1 ISCED 2 ISCED 3
Principal scales Academic pressure T3PACAD Metric Metric Metric Stakeholder involvement, partnership T3PCOM Metric Metric Metric School delinquency and violence T3PDELI Configural Configural Configural Diversity beliefs T3PDIVB Scalar Scalar Configural Job satisfaction, overall, teacher T3PJOBSA Configural Configural Configural Job satisfaction with work environment, principal T3PJSENV Configural Configural Configural Job satisfaction with profession, principal T3PJSPRO Configural Configural Metric Lack of special needs personnel T3PLACSN Metric Metric Metric Participation among stakeholders, principals T3PLEADP Metric Metric Metric School leadership T3PLEADS Metric Metric Scalar Organisational innovativeness T3PORGIN Configural Configural Configural Workload stress T3PWLOAD Metric Configural Metric
Teacher scales Clarity of instruction T3CLAIN Metric Metric Metric Classroom management T3CLASM Metric Configural Configural Cognitive activation T3COGAC Metric Metric Metric Professional collaboration in lessons among teachers T3COLES Metric Metric Metric Teacher cooperation, overall T3COOP Configural Configural Configural Teachers perceived disciplinary climate T3DISC Metric Metric Metric Diversity practices, teacher T3DIVP Configural Configural Configural
Effective professional development T3EFFPD Scalar Configural Scalar
Exchange and cooperation among teachers T3EXCH Configural Configural Configural
Job satisfaction, overall, teacher T3JOBSA Metric Metric Metric
Job satisfaction with work environment, teacher T3JSENV Metric Metric Metric
Job satisfaction with profession, teacher T3JSPRO Metric Metric Metric
Professional development barriers T3PDBAR Configural Configural Configural
Need prof. devel. for teaching for diversity T3PDIV Metric Metric Metric
Need prof. devel. in subject matter and pedagogy T3PDPED Metric Metric Metric
Personal utility value T3PERUT Metric Metric Metric
Satisfaction with target class autonomy T3SATAT Metric Metric Metric
Self-efficacy in classroom management T3SECLS Metric Metric Metric
Self-efficacy in student engagement T3SEENG Metric Metric Metric
Self-related efficacy in multicultural classrooms T3SEFE Metric Metric Metric
Self-efficacy in instruction T3SEINS Metric Metric Metric
Teacher self-efficacy, overall T3SELF Metric Metric Metric
Social utility value T3SOCUT Metric Metric Metric
Participation among stakeholders, teachers T3STAKE Metric Metric Metric
Student behaviour stress T3STBEH Configural Configural Configural
Teacher-student relations T3STUD Metric Metric Metric
Team innovativeness T3TEAM Scalar Scalar Scalar
Teaching practices, overall T3TPRA Metric Configural Configural
Perceptions of value and policy influence T3VALP Metric Metric Metric
Workplace well-being and stress T3WELS Configural Metric Configural
Clarity of instruction T3WLOAD Metric Metric Configural
In addition, recommendations for analysis based on the different levels of invariance are
provided below. The recommendations are specific to cross-country invariance (i.e. within
a single ISCED level) but may also be applied to cross-ISCED level invariance within a
single participating country/economy. Different levels of measurement invariance provide

215
TALIS 2018 TECHNICAL REPORT © OECD 2019
different potentials for the analysis of data and reporting. The proposed analyses for each
level of measurement invariance are:
Cross-country analysis of scales with only configural level of invariance:
o Recommendation for analysis: At the cross-national level, only qualitative
(descriptive) comparisons are statistically justified (e.g. “associations of
staff-beliefs and staff education is positive in country A and B, whereas
there is no significant association in country C”), which should be
presented together with the limitations concerning the interpretation of the
results, in particular concerning the differences between participating
countries/ economies with respect to the meaning of the construct.
o Limitation: If a scale only reaches configural invariance, the scale score is
constructed in such a way that the factor loadings and intercepts are
allowed to vary across participating countries/economies. Further analysis
aimed at cross-country comparisons can only be conducted at the
conceptual level meaning that no statistical methods of comparison (such
as t-tests) are applicable in such cases.
Cross-country analysis of scales with metric level of invariance:
o Recommendation for analysis: For such a scale, the strength of the
association between the scale and items is comparable across participating
countries/economies, and statistical methods such as correlation and
regression are applicable. Comparisons of associations between
participating countries/economies are justified (e.g. “The association of
staff-beliefs and level of education are significantly stronger in
countries/economies A and B than in country/economy C”). The metric
level of measurement invariance means scales can be used for analysis
based on correlation and linear regression.
o Limitation: If a scale reaches only the metric level of invariance the score
of the scale is created respectively with equal factor loadings but with
intercepts allowed to vary across participating countries/economies, and
therefore a mean score between participating countries/economies is not
possible.
Cross-country analysis of scales with scalar level of invariance:
o Recommendation for analysis: For these scales, the comparison of the
mean score of the scale is meaningful across groups. Scale mean can be
compared across participating countries/economies (e.g. “Staff-beliefs are
significantly higher in country A compared to countries/economies B
and C”).
Violating these assumptions or ignoring these recommendations may or will lead to biased
results and/or interpretations. For instance, if scale scores based on the assumption of
metric invariance are created and used to compare the country/economy means of that
scale, the differences between participating countries/economies will most likely be biased.
Thus, it is recommended that data users apply statistical procedures to analyse scale scores
accordingly to its invariance level reached.

216
TALIS 2018 TECHNICAL REPORT © OECD 2019
Enhancements of the methodological procedures in scale score validation and
creation
During the current cycle, and in accordance with the methodological developments of the
last decade, the TALIS 2018 consortium endeavoured to bring in scale score estimation
that was modified and more rigorous than the estimation used previous TALIS cycles. This
was done in order to more accurately represent the data received from teachers and
principals.
This approach resulted in a more comprehensive investigation of the invariance of each
scale and the creation of more fine-tuned models. Furthermore, the results of the
measurement invariance testing were incorporated into the final models and scales score
estimation. During the TALIS 2013 cycle, pooled CFA models were estimated for each
scale using all participating countries’/economies’ ISCED level 2 populations in a joint
analysis (a pooled analysis that disregarded the country’s/economy’s membership) and
then, for the score estimation, constrained the loadings and intercepts in each of the within-
country/economy samples (all ISCED populations) to the previously estimated pooled
values. In this way, the models estimated for the ISCED levels 1 and 3 populations
including their respective scale scores were restricted to the model parameters estimated
with the ISCED level 2 population, while neglecting the results for the measurement
invariance testing (OECD, 2014[10]).25 The model chosen in 2013 for the scale score
estimation assumed strict invariance, where the factor loadings, item means and residuals
were constrained so that they were equivalent across participating countries/economies.
This approach meant the estimated scale scores were fully equivalent across all
participating countries/economies despite the results of the measurement invariance
testing. However, the benefit of the cross-country comparability came with the strong risk
of introducing substantial bias to the scale scores (Davidov, 2008[24]; Steenkamp and
Baumgartner, 1998[25]). To avoid the risk of bias, during the current cycle the parameters
were estimated in each scale respective to the results from the measurement invariance
testing, a process similar to that employed during the TALIS 2008 cycle (OECD, 2010,
pp. 139-143[12]). However, although the 2008 cycle used only a chosen sub-sample (called
below “calibration sample”) to perform the cross-country invariance, the current cycle
performed cross-country measurement invariance within each ISCED level, that is, 1, 2,
and 3. In addition, the current cycle tested cross-ISCED level measurement invariance
within each participating country, something that was not done during the previous cycles.
Therefore, the scale score estimation during TALIS 2018 incorporated the results of both
measurement invariance tests. The cross-ISCED level test was applied in addition to the
cross-country/economy invariance testing because of the assumption that it is possible to
find greater similarity between two or three ISCED levels within an education system than
between all participating countries/economies within one ISCED level. This assumption
proved to be valid in many cases, thus, enhancing the statistical options for national
reporting on comparisons between ISCED levels. This approach during TALIS 2018 means
that the creation of scale scores for this cycle has (a) substantially reduced the risk of bias,
and (b) improved the possibilities for comparisons between ISCED levels within
participating countries/economies compared to TALIS 2013.
As with the 2013 cycle, weights were constructed for TALIS 2018 that allow each
participating country/economy to contribute equally to the analysis. This strategy replaced
the strategy applied during TALIS 2008 in which the selection of an equal number of cases
from each participating country/economy composed a “calibration sample” where all

217
TALIS 2018 TECHNICAL REPORT © OECD 2019
participating countries/economies contributed equally to the analysis – see the TALIS 2008
Technical Report 2008 (OECD, 2010, p. 139[12]).
11.4. Results from scales evaluation and scale score creation
11.4.1. Description of scales and their parameters
The remainder of this chapter presents the evaluation results of the scales. While we
comment in some detail on the results presented in table format for the first group of scales
on teacher motivation and perceptions, our comments on the remaining results are
relatively short and focus on the most important results. However, we also include
information complementary to these results.
The scales are grouped by questionnaire (teacher and principal) and by content (e.g. all
self-efficacy scales grouped under one heading), and these scale-specific sections are then
divided into several parts that present detailed results for each scale. Each scale description
begins with the items used as indicators to measure the latent constructs. These descriptions
include item names, item wording and response categories.
This part of the chapter also includes special item notes that indicate whether certain
questionnaire items were reverse coded for the purpose of the scale construction or were
removed from the scale. Reverse coding of an item ensures that responses align to the
continuum of the scale. Consequently, if the response to an item is positive (coded as a
higher integer numerically), then it corresponds to a positive association with the latent
construct.26 Item removal from a scale construct was applied in specific cases. Initially,
choice of scale items was based on theoretical considerations (see Chapter 3), with the
expectation that a latent construct measured by selected items would have certain statistical
properties that supported the construct (e.g. sufficiently high factor loadings). However, if
an empirical examination of the scales revealed (generally only occasionally), certain items
not exhibiting the expected properties, then it could be assumed that the empirical data did
not support the conceptual development of the construct. These items were removed and
the model was evaluated without them.
Each scale description also contains information on improvements (where applicable) to
the implemented model. Improvements either encompassed all participating
countries/economies or were country/economy specific and they typically occurred in those
instances where the initial model did not fit the data well, but where a minor improvement
(such as a correlation between two items) resulted in an acceptable model fit. These
improvements come from the results obtained in the model analysis steps of scale
evaluation (for details on scale evaluation, see the section Scale development and methods).
While all model fit calculations and tests conducted during all further steps included these
improvements, there were several instances where additional improvements were made to
the models during testing for measurement invariance. Changes were made
programmatically so that the models would be estimated in a way that neither biased the
results nor changed the content of the scale construct. These changes included, for example,
fixing the negative residual variance for items in some scales so that it was positive and
close to zero.
The next part of the description presents the reliabilities for each scale. The omega statistic
was used for scales based on continuous response options, the Cronbach’s alpha coefficient
for scales based on categorical response options, and the stratified Cronbach’s alpha for the

218
TALIS 2018 TECHNICAL REPORT © OECD 2019
composite multidimensional scales. Table 11.3 presents the criteria guiding interpretation
of each scale’s reliability.
The information on reliability is followed by a description of the scale-specific results from
the model estimation and comparisons. Confirmatory factor analysis (CFA) was used to
evaluate the theoretically developed scale models reflecting the study’s latent constructs,
while the model fit indices presented at this point were those obtained from the model
analysis conducted at the country/economy level for each scale (i.e. the CFA conducted
separately for each of the analysed populations at the country/economy level).27 The criteria
used for model evaluation and selection appear in the first part of the chapter (Table 11.3).
Not reported are the model fit indices for the scales based on three items.28
The results of the measurement invariance testing across participating countries/economies
within each ISCED level follows the section on reliabilities (a summary of the results from
the measurement invariance testing across ISCED levels within each participating
country/economy appear in the Annex I tables.) The results of the model comparisons of
measurement invariance testing were used to establish the invariance levels of each scale.
Bold font is used to denote the invariance level of each scale in the tables.
The next part of the scale description centres on the international unstandardised model
parameters that were estimated via the scales’ final models. The factor loadings and
intercepts (the parameters that were uniform across participating countries/economies) are
reported for the scales that reached scalar invariance. However, only the factor loadings are
reported for the metric invariant scales. For those scales that reached only configural
invariance unstandardised item parameters are country specific and, therefore, not reported.
In addition, the country-level standardised factor loadings are reported for each
participating country per ISCED level in a separate table because they were standardised
at the country level, meaning that these standardised parameters differed at the country
level even for the scalar invariant scales. The factor loadings indicate the strength of the
relationship between each item and the latent scale. The values were interpreted in
accordance with the cut-off criteria provided in Table 11.3. The standardised factor
loadings are presented next to the unstandardised intercepts. The intercepts indicate the
predicted values for an item when the value of the latent trait was zero.
Four multidimensional scales were included in the teacher population and one in the
principal population. The multidimensional scales were evaluated with the same model fit
criteria used for the unidimensional scales (Table 11.3). The fit indices indicated acceptable
model fits in all cases. The composite scales29 were computed by averaging the scores from
the subscales.30 Therefore, in addition to the overall model evaluation of the
multidimensional constructs, their respective subscales were evaluated separately. The
measurement invariance level for an averaged scale index was determined by the lowest
invariance level of its respective subscales.
The international parameters from the final scale models were used to estimate the scale
scores for: (1) those participating countries/economies that did not meet the requirements
determined in the TALIS technical standards (Australia and the Netherlands for
ISCED level 1 for all scales and, in addition, Australia, ISCED level 2, for principals
scales only;31 (2) those participating countries/economies that collected their data later than
the designated time; and (3) the TALIS-PISA link populations32 (Australia, Ciudad
Autónoma de Buenos Aires [Argentina], Colombia, the Czech Republic, Denmark,
Georgia, Malta, Turkey and Viet Nam). These parameters included fixed factor loadings in
the ISCED level 2 metric models, and fixed factor loadings and intercepts in the ISCED
level 2 scalar models. At times, additional participating countries/economies were excluded

219
TALIS 2018 TECHNICAL REPORT © OECD 2019
from the scale evaluation because of model non-convergence, instability or some other
issue (Table 11.7). Because these additional countries/economies were excluded during the
model analyses at the country/economy level from further evaluation, they did not
contribute to the final scale models and there are no scale scores for these scales. This case
only pertains to scales from the principal questionnaire. Reporting on these excluded
populations is provided, where applicable, in a separate section for excluded populations.
Table 11.7. Excluded populations from the estimation of the parameters of principal scales
Scale Excluded country/economy Reason for exclusion
T3PJSENV Sweden, ISCED level 3 Heywood case
T3JOBSA Sweden, ISCED level 3 Heywood case for T3PJSENV (subscale)
T3PWLOAD Portugal, ISCED level 2
Sweden, ISCED level 2
Model instability
Non-convergence
T3PCOM Denmark, ISCED level 1
Denmark, ISCED level 2
Denmark, ISCED level 3
Sweden, ISCED level 1
Sweden, ISCED level 2
Sweden, ISCED level 3
Non-convergence
11.4.2. Complex scales from the teacher questionnaire
Teacher motivation and perceptions: Personal utility motivation to teach
(T3PERUT); Social utility motivation to teach (T3SOCUT); Perceptions of value
and policy influence (T3VALP)
11.1. Measured items
Three scales concerning teacher motivation and perceptions were developed from the
following two question stems:
“How important were the following for you to become a teacher?” (TT3G07),
which was followed by items concerning the teaching profession and its role in
society.
“How strongly do you agree or disagree with the following statements?” (TT3G54),
which was followed by items about the perceived value and influence of teachers
in society.
Table 11.8 provides the item names, question stems, item statements and response options
for each scale.

220
TALIS 2018 TECHNICAL REPORT © OECD 2019
Table 11.8. Item wording for teacher motivation and perceptions scales
T3PERUT: Personal utility motivation to teach
TT3G07: How important were the following for you to become a teacher?
Response options: “Not important at all” (1), “Of low importance” (2), “0f moderate importance” (3), “Of high importance” (4)
TT3G07A Teaching offered a steady career path
TT3G07B Teaching provided a reliable income
TT3G07C Teaching was a secure job
TT3G07D The teaching schedule (e.g. hours, holidays, part-time positions) fit with responsibilities in my personal life
T3SOCUT: Social utility motivation to teach
TT3G07: How important were the following for you to become a teacher?
Response options: “Not important at all” (1), “Of low importance” (2), “Of moderate importance” (3), “Of high importance” (4)
TT3G07E Teaching allowed me to influence the development of children and young people
TT3G07F Teaching allowed me to benefit the socially disadvantaged
TT3G07G Teaching allowed me to provide a contribution to society
T3VALP: Perceptions of value and policy influence
TT3G54: How strongly do you agree or disagree with the following statements?
Response options: “Strongly disagree” (1), “Disagree” (2), “Agree” (3), “Strongly agree” (4)
TT3G54C Teachers’ views are valued by policymakers in this country/region
TT3G54D Teachers can influence educational policy in this country/region
TT3G54E Teachers are valued by the media in this country/region
Source: OECD, TALIS 2018 database.
11.2. Scale reliability
Table 11.9 presents the reliabilities for all populations. The scale T3PERUT has high
reliability in most of the populations, with the omega coefficients for all participating
countries above 0.700.
The reliability of the scale T3SOCUT is high for the majority of the populations, but the
coefficient is below 0.700 for Denmark and the Flemish Community in Belgium for ISCED
level 1, and Alberta (Canada) and Kazakhstan for ISCED level 2. The omega coefficient
for the scale T3VALP is below the critical value of 0.700 in Spain and Viet Nam for ISCED
level 1, in Brazil, the Netherlands and Viet Nam for ISCED level 2, and in Brazil for ISCED
level 3. Analysis using the scale scores must be interpreted with caution for these
populations because their omega coefficients indicate insufficient scale reliability. The
reliabilities for populations that did not contribute to the model parameters (i.e.
participating countries/economies that did not meet the technical standards, participating
countries/economies with delayed data collection, and the TALIS-PISA link populations)
can be deemed sufficiently high.
Table 11.9. Reliability coefficients for teacher motivation and perceptions scales
Participating countries/economies T3PERUT T3SOCUT T3VALP
Omega coefficient
ISCED level 2
Alberta (Canada) 0.906 0.689 0.867
Australia 0.925 0.783 0.869
Austria 0.899 0.704 0.769
Belgium 0.906 0.785 0.824
Flemish Community (Belgium) 0.901 0.769 0.776
Brazil 0.899 0.846 0.681

221
TALIS 2018 TECHNICAL REPORT © OECD 2019
Participating countries/economies T3PERUT T3SOCUT T3VALP
Omega coefficient
Bulgaria 0.776 0.766 0.832
Ciudad Autónoma de Buenos Aires (Argentina) 0.903 0.780 0.794
Chile 0.889 0.821 0.734
Colombia 0.927 0.812 0.746
Croatia 0.884 0.823 0.839
Cyprus3 0.914 0.837 0.826
Czech Republic 0.870 0.794 0.781
Denmark 0.901 0.738 0.808
England (United Kingdom) 0.914 0.781 0.876
Estonia 0.878 0.812 0.778
Finland 0.920 0.817 0.839
France 0.904 0.796 0.797
Georgia 0.792 0.790 0.808
Hungary 0.861 0.752 0.882
Iceland 0.814 0.850 0.728
Israel 0.874 0.808 0.755
Italy 0.899 0.760 0.711
Japan 0.887 0.787 0.891
Kazakhstan 0.738 0.664 0.801
Korea 0.889 0.867 0.867
Latvia 0.789 0.776 0.823
Lithuania 0.843 0.823 0.762
Malta 0.819 0.780 0.799
Mexico 0.859 0.711 0.755
Netherlands 0.929 0.780 0.679
New Zealand 0.887 0.803 0.815
Norway 0.904 0.780 0.832
Portugal 0.918 0.837 0.717
Romania 0.824 0.776 0.776
Russian Federation 0.796 0.817 0.859
Saudi Arabia 0.824 0.857 0.771
Shanghai (China) 0.876 0.852 0.893
Singapore 0.910 0.790 0.861
Slovak Republic 0.852 0.764 0.760
Slovenia 0.933 0.785 0.750
South Africa2 0.856 0.854 0.666
Spain 0.931 0.839 0.745
Sweden 0.839 0.845 0.828
Chinese Taipei 0.904 0.863 0.857
Turkey 0.792 0.812 0.780
United Arab Emirates 0.835 0.789 0.865
United States 0.897 0.773 0.834
Viet Nam 0.748 0.738 0.697
ISCED level 1
Australia1 0.912 0.823 0.854
Flemish Community (Belgium) 0.912 0.687 0.723
Ciudad Autónoma de Buenos Aires (Argentina) 0.912 0.757 0.774
Denmark 0.897 0.684 0.799
England (United Kingdom) 0.918 0.736 0.889
France 0.918 0.712 0.792
Japan 0.897 0.794 0.899

222
TALIS 2018 TECHNICAL REPORT © OECD 2019
Participating countries/economies T3PERUT T3SOCUT T3VALP
Omega coefficient
Korea 0.893 0.885 0.856
Netherlands1 0.895 0.717 0.764
Spain 0.935 0.824 0.691
Sweden 0.852 0.823 0.850
Chinese Taipei 0.893 0.869 0.861
Turkey 0.814 0.835 0.760
United Arab Emirates 0.837 0.773 0.863
Viet Nam 0.746 0.738 0.682
ISCED level 3
Alberta (Canada) 0.893 0.738 0.846
Brazil 0.889 0.845 0.658
Croatia 0.887 0.824 0.823
Denmark 0.876 0.736 0.834
Portugal 0.920 0.823 0.728
Slovenia 0.922 0.789 0.780
Sweden 0.854 0.814 0.828
Chinese Taipei 0.899 0.848 0.846
Turkey 0.787 0.808 0.781
United Arab Emirates 0.848 0.792 0.870
Viet Nam 0.773 0.736 0.717
TALIS-PISA link
Australia 0.927 0.815 0.850
Ciudad Autónoma de Buenos Aires (Argentina) 0.863 0.757 0.815
Colombia 0.897 0.920 0.728
Czech Republic 0.865 0.759 0.835
Denmark 0.878 0.696 0.848
Georgia 0.867 0.880 0.796
Malta 0.863 0.812 0.781
Turkey 0.828 0.901 0.701
Viet Nam 0.885 0.850 0.832
1. Data from the participating country/economy were rated as insufficient during the adjudication process.
2. Participating country/economy with late data collection.
3. Note by Turkey
The information in this document with reference to “Cyprus” relates to the southern part of the Island. There is
no single authority representing both Turkish and Greek Cypriot people on the Island. Turkey recognises the
Turkish Republic of Northern Cyprus (TRNC). Until a lasting and equitable solution is found within the context
of the United Nations, Turkey shall preserve its position concerning the “Cyprus issue”.
Note by all the European Union Member States of the OECD and the European Union
The Republic of Cyprus is recognised by all members of the United Nations with the exception of Turkey. The
information in this document relates to the area under the effective control of the Government of the Republic
of Cyprus.
Source: OECD, TALIS 2018 database.
11.3. Model fits
Tables 11.10, 11.11 and 11.12 present the model fit for each Teacher motivation and
perceptions scale for all ISCED levels and the TALIS-PISA link populations.
As can be observed from Table 11.10, the CFI for T3PERUT is above the cut-off criterion
for all populations except Viet Nam’s TALIS-PISA link population. The TLI is below the
cut-off criterion in Georgia, Japan, Malta and the Russian Federation for ISCED level 2,
and in Georgia and Viet Nam for the TALIS-PISA link populations. The RMSEA is below

223
TALIS 2018 TECHNICAL REPORT © OECD 2019
the cut-off value for all populations except Bulgaria, Georgia, Hungary, Japan, Korea,
Lithuania, Malta, the Russian Federation and the Slovak Republic for ISCED level 2, Japan
and the Netherlands for ISCED level 1, and Denmark, Malta and Viet Nam for the TALIS-
PISA link populations. Finally, the SRMR is above the cut-off criterion in South Africa for
ISCED level 2, Australia and the Netherlands for ISCED level 1, and for all the TALIS-
PISA link populations except those in Australia and the Czech Republic.
The scales T3SOCUT and T3VALP were both constructed from only three items, which
means the model fit indices for them are not reported here (see endnote 28). The only
exceptions where the model fit statistics of models with three items could be estimated
pertained to those populations for which model parameters were fixed, specifically, those
countries that did not meet the TALIS technical standards. These countries were Australia
and the Netherlands for ISCED level 1, South Africa for ISCED level 2 because of the
delay in its data submission, and all TALIS-PISA link populations. Because the models in
these populations were specified by fixing the estimation parameters to be equal to the
international parameters, it was possible to estimate model fit.33 As evident in Table 11.11
and Table 11.12, the model fit statistic for these populations is inconsistent: in some
populations the scale models perform well (e.g. the Netherlands’ ISCED level 1 population
for the scale T3SOCUT), whereas others do not meet some of the fit statistic cut-off criteria
(e.g. Australia’s ISCED level 1 population for the scale T3SOCUT).
Table 11.10. CFA model-data fits for scale T3PERUT
Personal utility motivation to teach
Participating countries/economies CFI TLI RMSEA SRMR
ISCED level 2
Alberta (Canada) 0.988 0.963 0.065 0.014
Australia 1.000 1.001 0.000 0.002
Austria 0.997 0.990 0.039 0.009
Belgium 0.997 0.990 0.033 0.008
Flemish Community (Belgium) 0.993 0.979 0.048 0.013
Brazil 0.998 0.995 0.024 0.006
Bulgaria 0.952 0.855 0.102 0.029
Ciudad Autónoma de Buenos Aires (Argentina) 0.995 0.986 0.044 0.010
Chile 0.997 0.992 0.040 0.009
Colombia 1.000 0.999 0.010 0.005
Croatia 0.998 0.994 0.025 0.007
Cyprus 0.999 0.996 0.028 0.008
Czech Republic 0.997 0.991 0.034 0.010
Denmark 0.999 0.997 0.022 0.006
England (United Kingdom) 1.000 1.001 0.000 0.003
Estonia 0.992 0.977 0.066 0.012
Finland 1.000 0.999 0.011 0.004
France 0.998 0.993 0.035 0.009
Georgia 0.925 0.775 0.129 0.031
Hungary 0.982 0.947 0.086 0.020
Iceland 0.993 0.978 0.056 0.013
Israel 1.000 1.000 0.000 0.004
Italy 0.999 0.997 0.021 0.005
Japan 0.942 0.827 0.147 0.052
Kazakhstan 0.997 0.990 0.021 0.009
Korea 0.978 0.934 0.098 0.019

224
TALIS 2018 TECHNICAL REPORT © OECD 2019
Participating countries/economies CFI TLI RMSEA SRMR
Latvia 0.990 0.970 0.041 0.015
Lithuania 0.974 0.923 0.090 0.020
Malta 0.965 0.894 0.099 0.024
Mexico 0.993 0.980 0.056 0.013
Netherlands 0.995 0.985 0.043 0.012
New Zealand 1.000 1.003 0.000 0.004
Norway 0.997 0.990 0.039 0.008
Portugal 0.997 0.990 0.045 0.008
Romania 0.998 0.993 0.023 0.009
Russian Federation 0.942 0.825 0.106 0.025
Saudi Arabia 0.973 0.920 0.064 0.024
Shanghai (China) 1.000 1.000 0.004 0.004
Singapore 0.997 0.992 0.036 0.010
Slovak Republic 0.973 0.920 0.117 0.022
Slovenia 0.998 0.994 0.037 0.007
South Africa2 0.984 0.984 0.041 0.167
Spain 1.000 1.000 0.000 0.002
Sweden 0.995 0.985 0.034 0.011
Chinese Taipei 0.994 0.982 0.049 0.011
Turkey 0.998 0.993 0.022 0.008
United Arab Emirates 1.000 1.000 0.002 0.003
United States 0.997 0.990 0.037 0.011
Viet Nam 0.996 0.987 0.035 0.013
ISCED level 1
Australia1 0.996 0.996 0.023 0.064
Flemish Community (Belgium) 0.992 0.975 0.067 0.014
Ciudad Autónoma de Buenos Aires (Argentina) 0.991 0.973 0.058 0.013
Denmark 0.999 0.998 0.017 0.006
England (United Kingdom) 0.996 0.989 0.044 0.013
France 0.999 0.996 0.027 0.007
Japan 0.975 0.925 0.101 0.035
Korea 0.988 0.965 0.074 0.016
Netherlands1 0.950 0.950 0.094 0.157
Spain 0.996 0.989 0.042 0.009
Sweden 0.991 0.972 0.058 0.015
Chinese Taipei 0.998 0.993 0.030 0.008
Turkey 0.995 0.984 0.033 0.015
United Arab Emirates 1.000 0.999 0.010 0.004
Viet Nam 0.997 0.991 0.031 0.009
ISCED level 3
Alberta (Canada) 0.991 0.974 0.061 0.016
Brazil 0.999 0.998 0.015 0.006
Croatia 0.998 0.994 0.026 0.007
Denmark 0.995 0.986 0.043 0.011
Portugal 0.999 0.996 0.027 0.006
Slovenia 1.000 1.000 0.000 0.004
Sweden 0.996 0.988 0.035 0.013
Chinese Taipei 0.994 0.982 0.049 0.012
Turkey 0.994 0.982 0.026 0.012
United Arab Emirates 1.000 1.001 0.000 0.003
Viet Nam 0.994 0.981 0.041 0.011
TALIS-PISA link

225
TALIS 2018 TECHNICAL REPORT © OECD 2019
Participating countries/economies CFI TLI RMSEA SRMR
Australia 1.000 1.001 0.000 0.025
Ciudad Autónoma de Buenos Aires (Argentina) 0.962 0.962 0.080 0.191
Colombia 0.986 0.986 0.039 0.114
Czech Republic 0.995 0.995 0.022 0.045
Denmark 0.959 0.959 0.093 0.165
Georgia 0.881 0.881 0.067 0.454
Malta 0.927 0.927 0.091 0.211
Turkey 0.976 0.976 0.039 0.121
Viet Nam 0.702 0.702 0.109 0.642
1. Data from the participating country/economy were rated as insufficient during the adjudication process.
2. Participating country/economy with late data collection.
Source: OECD, TALIS 2018 database.
Table 11.11. CFA model-data fit for scale T3SOCUT
Social utility motivation to teach
Participating countries/economies CFI TLI RMSEA SRMR
ISCED level 1
Australia1 0.873 0.873 0.113 0.529
Netherlands1 0.973 0.973 0.065 0.086
TALIS-PISA link
Australia 0.995 0.995 0.025 0.071
Ciudad Autónoma de Buenos Aires (Argentina) 0.977 0.977 0.034 0.077
Colombia 0.827 0.827 0.105 1.747
Czech Republic 0.947 0.947 0.092 0.189
Denmark 0.982 0.982 0.051 0.095
Georgia 0.867 0.867 0.060 0.626
Malta 0.991 0.991 0.041 0.081
Turkey 1.000 1.000 0.017 0.424
Viet Nam 0.792 0.792 0.091 0.731
1. Data from the participating country/economy were rated as insufficient during the adjudication process.
Source: OECD, TALIS 2018 database.
Table 11.12. CFA model-data fit for scale T3VALP
Perceptions of value and policy influence
1. Data from the participating country/economy were rated as insufficient during the adjudication process.
Source: OECD, TALIS 2018 database.
Participating countries/economies CFI TLI RMSEA SRMR
ISCED level 1
Australia1 0.985 0.985 0.052 0.116
Netherlands1 0.696 0.696 0.124 0.251
TALIS-PISA link
Australia 0.980 0.980 0.058 0.122
Ciudad Autónoma de Buenos Aires (Argentina) 0.897 0.897 0.082 0.088
Colombia 0.975 0.975 0.045 0.066
Czech Republic 0.962 0.962 0.059 0.159
Denmark 0.946 0.946 0.074 0.116
Georgia 0.985 0.985 0.034 0.076
Malta 0.969 0.969 0.062 0.099
Turkey 0.891 0.891 0.048 0.099
Viet Nam 0.874 0.874 0.072 0.395

226
TALIS 2018 TECHNICAL REPORT © OECD 2019
11.4. Invariance testing
Table 11.13 provides the results from the invariance testing for T3PERUT for each ISCED
level (see also subsection Measurement invariance testing: across countries/economies
and across ISCED levels above for a refresher on invariance testing procedures). Because
the degree of change in the TLI and the RMSEA between the configural and metric models
for the ISCED level 1 and ISCED level 2 populations are within the cut-off criteria,
T3PERUT can be considered metric invariant for these two ISCED levels. Although, for
ISCED level 3, the differences in the model fit indices between the configural and metric
levels exceed the cut-off criteria, T3PERUT at the ISCED 3 level can be considered metric
invariant not only because the configural model fit is very high and even almost perfect for
some of the fit indices but also because the metric model performs very well.
Tables 11.14 and 11.15 present the results of the measurement invariance testing for the
scales T3SOCUT and T3VALP respectively. The model fit differences between the
configural and metric models exceed the cut-off criteria. However, because the configural
models of the two scales for all populations are just identified and the metric models
perform well, the scales can be treated as metric invariant in all populations.
Table 11.13. Invariance tests results for scale T3PERUT
CFI TLI RMSEA SRMR Δ CFI Δ TLI Δ RMSEA Δ SRMR
Invariance level of ISCED level 2
Configural 0.993 0.98 0.051 0.015
Metric 0.975 0.969 0.063 0.079 0.018 0.011 0.012 0.064
Scalar 0.792 0.841 0.143 0.148 0.183 0.128 0.080 0.069
Invariance level of ISCED level 1
Configural 0.994 0.982 0.047 0.014
Metric 0.978 0.972 0.059 0.079 0.016 0.010 0.012 0.065
Scalar 0.779 0.824 0.147 0.159 0.199 0.148 0.088 0.080
Invariance level of ISCED level 3
Configural 0.997 0.991 0.031 0.01
Metric 0.973 0.966 0.059 0.083 0.024 0.025 0.028 0.073
Scalar 0.809 0.846 0.126 0.136 0.164 0.120 0.067 0.053
Note: See endnote 34.
Source: OECD, TALIS 2018 database.

227
TALIS 2018 TECHNICAL REPORT © OECD 2019
Table 11.14: Invariance tests results for scale T3SOCUT
CFI TLI RMSEA SRMR Δ CFI Δ TLI Δ RMSEA Δ SRMR
Invariance level of ISCED level 2
Configural 1.000 1.000 0.000 0.000
Metric 0.983 0.974 0.054 0.084 0.017 0.026 0.054 0.084
Scalar 0.858 0.891 0.110 0.132 0.125 0.083 0.056 0.048
Invariance level of ISCED level 1
Configural 1.000 1.000 0.000 0.000
Metric 0.975 0.959 0.061 0.121 0.025 0.041 0.061 0.121
Scalar 0.858 0.885 0.102 0.214 0.117 0.074 0.041 0.093
Invariance level of ISCED level 3
Configural 1.000 1.000 0.000 0.000
Metric 0.987 0.979 0.041 0.058 0.013 0.021 0.041 0.058
Scalar 0.84 0.868 0.103 0.106 0.147 0.111 0.062 0.048
Note: See endnote 34.
Source: OECD, TALIS 2018 database.
Table 11.15. Invariance tests results for scale T3VALP
CFI TLI RMSEA SRMR Δ CFI Δ TLI Δ RMSEA Δ SRMR
Invariance level of ISCED level 2
Configural 1.000 1.000 0.000 0.000
Metric 0.981 0.971 0.060 0.052 0.019 0.029 -0.060 -0.052
Scalar 0.734 0.796 0.158 0.164 0.247 0.175 -0.098 -0.112
Invariance level of ISCED level 1
Configural 1.000 1.000 0.000 0.000
Metric 0.991 0.985 0.036 0.040 0.009 0.015 -0.036 -0.040
Scalar 0.754 0.800 0.132 0.124 0.237 0.185 -0.096 -0.084
Invariance level of ISCED level 3
Configural 1.000 1.000 0.000 0.000
Metric 0.983 0.972 0.052 0.042 0.017 0.028 -0.052 -0.042
Scalar 0.611 0.679 0.178 0.166 0.372 0.293 -0.126 -0.124
Note: See endnote 34.
Source: OECD, TALIS 2018 database.
11.5. Item parameters
As mentioned above, the three scales were all metric invariant for all ISCED levels, which
indicates that the unstandardised factor loadings were the same across populations and that
the intercepts needed to be estimated separately for each population. Table 11.16 presents
the unstandardised factor loadings of the three scales for all populations.
Table 11.16. Unstandardised factor loadings for T3PERUT, T3SOCUT and T3VALP
for all countries for all populations
T3PERUT (metric) T3SOCUT (metric) T3VALP (metric)
TT3G07A 0.668 TT3G07E 0.458 TT3G54C 0.571
TT3G07B 0.728 TT3G07F 0.607 TT3G54D 0.559
TT3G07C 0.724 TT3G07G 0.535 TT3G54E 0.502
TT3G07D 0.522
Source: OECD, TALIS 2018 database.

228
TALIS 2018 TECHNICAL REPORT © OECD 2019
The item parameters in the next three tables are reported for each scale per participating
country/economy. The standardised factor loadings indicate the strength of the relationship
between each item and the scale construct (see the section Description of scales and their
parameters). As presented in Table 11.17, the standardised factor loadings for the scale
T3PERUT are above 0.450 for all populations, which indicate at least a moderate
relationship between the items and the latent construct. More specifically, most values for
items TT3G07A, TT3G07B and TT3G07C are above 0.600, and the lowest item loadings
found for item TT3G07D are still above 0.450 for all populations.
The standardised factor loadings for the scale T3SOCUT presented in Table 11.18 were all
above 0.450. In most populations and for most items, the loadings were above 0.700,
indicating a strong relationship between items and the latent construct.
All factor loadings for all items in the scale T3VALP (Table 11.19 were greater than 0.450.
The only exception was item TT3G54D in Brazil, ISCED levels 1 and 3.
Table 11.17. Standardised factor loadings and unstandardised intercepts for scale T3PERUT
Participating countries/economies
Standardised factor loadings Unstandardised intercepts
TT3G07A TT3G07B TT3G07C TT3G07D TT3G07A TT3G07B TT3G07C TT3G07D
ISCED level 2
Alberta (Canada) 0.829 0.893 0.874 0.498 3.323 3.331 3.318 2.919
Australia 0.810 0.918 0.907 0.560 3.100 3.152 3.203 2.861
Austria 0.731 0.899 0.867 0.575 2.038 2.589 2.641 2.449
Belgium 0.852 0.893 0.853 0.585 2.793 2.854 2.763 2.736
Flemish Community (Belgium) 0.838 0.902 0.811 0.571 2.888 2.993 2.751 2.716
Brazil 0.813 0.871 0.874 0.576 3.055 2.843 2.989 2.834
Bulgaria 0.653 0.735 0.742 0.489 2.582 2.308 2.829 2.818
Ciudad Autónoma de Buenos Aires (Argentina)
0.804 0.893 0.862 0.588 2.317 2.199 2.065 2.136
Chile 0.776 0.869 0.861 0.618 2.574 2.316 2.515 2.583
Colombia 0.833 0.924 0.895 0.594 3.060 2.932 2.920 2.783
Croatia 0.638 0.883 0.863 0.582 2.627 2.626 2.707 2.562
Cyprus 0.820 0.910 0.871 0.640 3.237 3.219 3.206 3.216
Czech Republic 0.770 0.852 0.826 0.553 2.547 2.642 2.638 2.894
Denmark 0.782 0.879 0.884 0.555 2.059 2.337 2.303 2.716
England (United Kingdom) 0.774 0.907 0.897 0.509 3.116 3.208 3.270 2.772
Estonia 0.687 0.865 0.861 0.581 2.714 3.080 3.176 3.209
Finland 0.849 0.917 0.869 0.532 2.913 2.931 2.852 2.905
France 0.850 0.897 0.835 0.554 2.881 2.822 2.744 2.658
Georgia 0.618 0.719 0.794 0.548 3.399 3.388 3.633 3.546
Hungary 0.720 0.859 0.808 0.556 2.007 2.435 2.705 2.724
Iceland 0.696 0.778 0.780 0.506 1.960 2.111 2.608 2.862
Israel 0.790 0.776 0.870 0.619 2.991 2.412 2.924 3.092
Italy 0.817 0.858 0.884 0.573 2.602 2.538 2.532 2.531
Japan 0.579 0.891 0.872 0.499 2.452 3.130 3.185 2.677
Kazakhstan 0.528 0.692 0.740 0.479 2.762 3.112 3.203 2.954
Korea 0.707 0.864 0.878 0.635 2.975 3.132 3.359 3.287
Latvia 0.566 0.754 0.787 0.486 2.943 3.406 3.602 3.340
Lithuania 0.705 0.826 0.798 0.572 2.637 2.922 3.236 3.079
Malta 0.711 0.711 0.823 0.537 3.181 2.864 3.291 3.250
Mexico 0.752 0.852 0.798 0.539 3.287 3.063 3.132 3.066
Netherlands 0.884 0.932 0.850 0.570 2.232 2.305 2.224 2.209

229
TALIS 2018 TECHNICAL REPORT © OECD 2019
New Zealand 0.737 0.874 0.867 0.518 2.954 3.080 3.129 2.865
Norway 0.734 0.887 0.898 0.563 2.479 2.741 2.907 2.829
Portugal 0.856 0.888 0.897 0.622 2.903 2.811 2.839 2.738
Romania 0.696 0.786 0.794 0.563 3.252 2.984 2.969 3.163
Russian Federation 0.611 0.757 0.776 0.549 2.591 2.968 3.312 3.176
Saudi Arabia 0.693 0.812 0.774 0.496 3.475 3.582 3.574 3.324
Shanghai (China) 0.791 0.812 0.864 0.597 3.520 3.369 3.454 3.374
Singapore 0.768 0.906 0.886 0.548 3.132 3.291 3.255 3.036
Slovak Republic 0.713 0.824 0.821 0.581 2.076 2.506 2.919 2.917
Slovenia 0.875 0.919 0.904 0.607 2.520 2.492 2.577 2.268
South Africa2 0.751 0.762 0.777 0.525 3.320 3.013 3.216 3.069
Spain 0.856 0.933 0.885 0.612 2.831 2.758 2.676 2.705
Sweden 0.702 0.816 0.809 0.524 2.443 2.743 2.779 2.722
Chinese Taipei 0.837 0.890 0.854 0.600 3.576 3.599 3.542 3.503
Turkey 0.572 0.784 0.752 0.549 2.802 3.202 3.282 3.277
United Arab Emirates 0.756 0.770 0.807 0.530 3.477 3.240 3.401 3.309
United States 0.779 0.872 0.881 0.557 3.174 3.110 3.169 3.129
Viet Nam 0.698 0.681 0.657 0.527 3.576 3.138 3.175 3.414
ISCED level 1
Australia1 0.810 0.911 0.895 0.565 3.102 3.088 3.157 2.683
Flemish Community (Belgium) 0.867 0.909 0.823 0.590 2.888 2.993 2.751 2.716
Ciudad Autónoma de Buenos Aires (Argentina)
0.817 0.897 0.886 0.628 2.317 2.199 2.065 2.136
Denmark 0.785 0.877 0.875 0.566 2.059 2.337 2.303 2.716
England (United Kingdom) 0.772 0.911 0.906 0.508 3.116 3.208 3.270 2.772
France 0.863 0.906 0.868 0.583 2.881 2.822 2.744 2.658
Japan 0.563 0.893 0.894 0.515 2.452 3.130 3.185 2.677
Korea 0.666 0.853 0.900 0.628 2.975 3.132 3.359 3.287
Netherlands1 0.873 0.912 0.859 0.615 2.048 2.069 1.984 1.890
Spain 0.870 0.936 0.889 0.651 2.831 2.758 2.676 2.705
Sweden 0.709 0.838 0.813 0.538 2.443 2.743 2.779 2.722
Chinese Taipei 0.820 0.878 0.841 0.603 3.576 3.599 3.542 3.503
Turkey 0.572 0.793 0.786 0.593 2.802 3.202 3.282 3.277
United Arab Emirates 0.769 0.756 0.814 0.537 3.477 3.240 3.401 3.309
Viet Nam 0.700 0.673 0.653 0.543 3.576 3.138 3.175 3.414
ISCED level 3
Alberta (Canada) 0.814 0.895 0.820 0.472 3.323 3.331 3.318 2.919
Brazil 0.803 0.861 0.863 0.549 3.055 2.843 2.989 2.834
Croatia 0.613 0.883 0.874 0.560 2.627 2.626 2.707 2.562
Denmark 0.753 0.849 0.859 0.539 2.059 2.337 2.303 2.716
Portugal 0.855 0.890 0.901 0.611 2.903 2.811 2.839 2.738
Slovenia 0.845 0.894 0.908 0.591 2.525 2.541 2.556 2.470
Sweden 0.729 0.840 0.815 0.514 2.443 2.743 2.779 2.722
Chinese Taipei 0.841 0.885 0.834 0.603 3.576 3.599 3.542 3.503
Turkey 0.587 0.775 0.740 0.556 2.802 3.202 3.282 3.277
United Arab Emirates 0.773 0.786 0.819 0.539 3.477 3.240 3.401 3.309
Viet Nam 0.730 0.701 0.683 0.545 3.576 3.138 3.175 3.414
TALIS-PISA link
Australia 0.802 0.918 0.914 0.543 3.125 3.167 3.198 2.891
Ciudad Autónoma de Buenos Aires (Argentina)
0.821 0.899 0.855 0.587 2.381 2.265 2.107 2.228
Colombia 0.827 0.904 0.872 0.568 3.102 2.961 2.968 2.825
Czech Republic 0.756 0.835 0.828 0.545 2.594 2.665 2.652 2.933

230
TALIS 2018 TECHNICAL REPORT © OECD 2019
Denmark 0.800 0.913 0.864 0.577 2.168 2.393 2.362 2.709
Georgia 0.622 0.703 0.752 0.581 3.412 3.391 3.599 3.572
Malta 0.694 0.714 0.820 0.530 3.081 2.801 3.212 3.227
Turkey 0.594 0.786 0.755 0.559 2.742 3.097 3.203 3.182
Viet Nam 0.707 0.705 0.690 0.530 3.518 3.069 3.089 3.360
1. Data from the participating country/economy were rated as insufficient during the adjudication process.
2. Participating country/economy with late data collection.
Source: OECD, TALIS 2018 database.
Table 11.18. Standardised factor loadings and unstandardised intercepts for scale T3SOCUT
Participating countries/economies Standardised factor loadings Unstandardised intercepts
TT3G07E TT3G07F TT3G07G TT3G07E TT3G07F TT3G07G
ISCED level 2
Alberta (Canada) 0.716 0.554 0.645 3.778 3.110 3.643
Australia 0.736 0.701 0.773 3.687 3.150 3.569
Austria 0.691 0.653 0.646 3.694 3.065 3.400
Belgium 0.756 0.719 0.746 3.601 2.942 3.328
Flemish Community (Belgium) 0.743 0.679 0.745 3.732 3.109 3.492
Brazil 0.671 0.794 0.865 3.632 3.598 3.788
Bulgaria 0.695 0.652 0.783 3.431 2.674 3.330
Ciudad Autónoma de Buenos Aires (Argentina) 0.583 0.717 0.815 3.431 3.174 3.578
Chile 0.650 0.739 0.853 3.740 3.667 3.842
Colombia 0.693 0.681 0.847 3.835 3.676 3.874
Croatia 0.783 0.734 0.808 3.612 3.090 3.525
Cyprus 0.708 0.759 0.856 3.692 3.408 3.677
Czech Republic 0.738 0.724 0.781 3.475 2.833 3.359
Denmark 0.722 0.709 0.649 3.618 2.823 3.044
England (United Kingdom) 0.727 0.711 0.766 3.710 3.200 3.504
Estonia 0.746 0.786 0.770 3.304 2.745 3.158
Finland 0.766 0.816 0.717 3.192 2.708 2.807
France 0.725 0.780 0.743 3.405 2.911 3.182
Georgia 0.725 0.619 0.819 3.782 3.360 3.761
Hungary 0.702 0.727 0.695 3.457 2.888 3.246
Iceland 0.738 0.844 0.817 3.011 2.648 3.091
Israel 0.745 0.729 0.802 3.782 3.565 3.755
Italy 0.485 0.765 0.769 3.072 3.257 3.540
Japan 0.639 0.799 0.740 3.301 2.794 3.097
Kazakhstan 0.576 0.652 0.651 3.341 2.914 3.324
Korea 0.763 0.853 0.843 3.318 2.947 3.122
Latvia 0.694 0.732 0.760 3.465 3.120 3.450
Lithuania 0.758 0.795 0.783 3.471 2.957 3.330
Malta 0.722 0.720 0.761 3.667 3.229 3.531
Mexico 0.680 0.579 0.723 3.863 3.569 3.828
Netherlands 0.697 0.724 0.773 3.337 2.295 3.123
New Zealand 0.729 0.743 0.795 3.650 3.168 3.522
Norway 0.727 0.752 0.725 3.437 2.771 3.141
Portugal 0.711 0.849 0.776 3.534 3.410 3.543
Romania 0.712 0.728 0.753 3.648 3.314 3.560
Russian Federation 0.715 0.807 0.781 3.387 3.180 3.446
Saudi Arabia 0.744 0.857 0.816 3.651 3.555 3.632
Shanghai (China) 0.743 0.809 0.851 3.521 3.198 3.481
Singapore 0.731 0.723 0.777 3.689 3.308 3.580

231
TALIS 2018 TECHNICAL REPORT © OECD 2019
Participating countries/economies Standardised factor loadings Unstandardised intercepts
TT3G07E TT3G07F TT3G07G TT3G07E TT3G07F TT3G07G
Slovak Republic 0.705 0.665 0.768 3.494 2.706 3.483
Slovenia 0.700 0.769 0.743 3.278 2.692 3.273
South Africa2 0.748 0.614 0.790 3.784 3.385 3.760
Spain 0.683 0.816 0.838 3.377 3.164 3.468
Sweden 0.784 0.823 0.799 3.465 3.074 3.287
Chinese Taipei 0.744 0.852 0.838 3.515 3.318 3.519
Turkey 0.710 0.588 0.857 3.811 3.503 3.831
United Arab Emirates 0.717 0.655 0.811 3.783 3.475 3.761
United States 0.754 0.609 0.772 3.804 3.326 3.707
Viet Nam 0.650 0.688 0.736 3.731 3.485 3.720
ISCED level 1
Australia1 0.706 0.665 0.749 3.777 3.268 3.616
Flemish Community (Belgium) 0.706 0.593 0.631 3.732 3.109 3.492
Ciudad Autónoma de Buenos Aires (Argentina) 0.595 0.695 0.787 3.431 3.174 3.578
Denmark 0.704 0.624 0.594 3.671 2.900 3.062
England (United Kingdom) 0.726 0.668 0.681 3.710 3.200 3.504
France 0.659 0.677 0.682 3.405 2.911 3.182
Japan 0.642 0.810 0.746 3.301 2.794 3.097
Korea 0.792 0.872 0.861 3.318 2.947 3.122
Netherlands1 0.685 0.636 0.741 3.546 2.430 3.337
Spain 0.669 0.805 0.821 3.527 3.356 3.558
Sweden 0.753 0.807 0.770 3.558 3.251 3.342
Chinese Taipei 0.759 0.856 0.848 3.515 3.318 3.519
Turkey 0.732 0.619 0.877 3.811 3.503 3.831
United Arab Emirates 0.697 0.634 0.799 3.783 3.475 3.761
Viet Nam 0.592 0.673 0.769 3.731 3.485 3.720
ISCED level 3
Alberta (Canada) 0.739 0.582 0.722 3.778 3.110 3.643
Brazil 0.634 0.786 0.871 3.632 3.598 3.788
Croatia 0.763 0.725 0.830 3.612 3.090 3.525
Denmark 0.688 0.712 0.681 3.413 2.276 2.968
Portugal 0.692 0.830 0.774 3.534 3.410 3.543
Slovenia 0.706 0.751 0.770 3.278 2.692 3.273
Sweden 0.755 0.771 0.779 3.408 2.951 3.263
Chinese Taipei 0.725 0.832 0.831 3.515 3.318 3.519
Turkey 0.732 0.619 0.843 3.811 3.503 3.831
United Arab Emirates 0.725 0.658 0.814 3.783 3.475 3.761
Viet Nam 0.648 0.674 0.743 3.731 3.485 3.720
TALIS-PISA link
Australia 0.737 0.738 0.814 3.640 3.195 3.573
Ciudad Autónoma de Buenos Aires (Argentina) 0.622 0.727 0.791 3.410 3.171 3.604
Colombia 0.601 0.662 0.860 3.832 3.719 3.895
Czech Republic 0.736 0.734 0.782 3.428 2.840 3.306
Denmark 0.709 0.664 0.630 3.612 2.702 2.993
Georgia 0.766 0.614 0.822 3.823 3.464 3.796
Malta 0.746 0.748 0.819 3.611 3.159 3.488
Turkey 0.801 0.692 0.885 3.814 3.505 3.814
Viet Nam 0.659 0.679 0.732 3.704 3.396 3.678
1. Data from the participating country/economy were rated as insufficient during the adjudication process.
2. Participating country/economy with late data collection.
Source: OECD, TALIS 2018 database.

232
TALIS 2018 TECHNICAL REPORT © OECD 2019
Table 11.19. Standardised factor loadings and unstandardised intercepts for scale T3VALP
Participating countries/economies Standardised factor loadings Unstandardised intercepts
TT3G54C TT3G54D TT3G54C TT3G54D TT3G54C TT3G54D
ISCED level 2
Alberta (Canada) 0.872 0.833 0.710 2.258 2.309 2.349
Australia 0.875 0.830 0.732 2.114 2.194 2.136
Austria 0.722 0.737 0.717 1.928 1.635 1.622
Belgium 0.842 0.750 0.696 1.755 1.818 1.803
Flemish Community (Belgium) 0.807 0.690 0.640 1.970 2.059 2.112
Brazil 0.750 0.437 0.613 1.514 2.552 1.704
Bulgaria 0.832 0.787 0.722 1.884 1.880 1.817
Ciudad Autónoma de Buenos Aires (Argentina) 0.833 0.599 0.708 1.576 1.962 1.596
Chile 0.754 0.461 0.736 1.576 2.324 1.527
Colombia 0.775 0.580 0.694 1.828 2.471 1.951
Croatia 0.863 0.710 0.754 1.395 1.663 1.536
Cyprus 0.843 0.750 0.712 2.087 2.190 1.984
Czech Republic 0.793 0.737 0.642 1.748 1.762 1.934
Denmark 0.819 0.745 0.695 1.454 1.676 1.661
England (United Kingdom) 0.876 0.855 0.715 1.701 1.701 1.796
Estonia 0.770 0.744 0.668 2.026 2.120 2.055
Finland 0.829 0.827 0.676 2.043 2.056 2.416
France 0.788 0.753 0.706 1.589 1.596 1.542
Georgia 0.799 0.766 0.713 2.304 2.256 2.227
Hungary 0.864 0.873 0.750 1.732 1.699 1.642
Iceland 0.773 0.543 0.662 1.543 2.023 1.554
Israel 0.797 0.551 0.692 1.851 2.396 1.911
Italy 0.745 0.547 0.661 1.555 2.059 1.690
Japan 0.880 0.882 0.739 1.788 1.736 1.667
Kazakhstan 0.789 0.766 0.697 2.220 2.385 2.604
Korea 0.847 0.854 0.752 1.978 1.863 1.815
Latvia 0.803 0.822 0.652 1.802 1.844 2.094
Lithuania 0.795 0.715 0.556 1.518 1.671 1.883
Malta 0.826 0.665 0.715 1.763 1.985 1.704
Mexico 0.796 0.517 0.703 1.580 2.392 1.714
Netherlands 0.702 0.630 0.571 1.934 2.106 2.203
New Zealand 0.847 0.713 0.674 1.834 2.092 1.964
Norway 0.834 0.802 0.680 2.053 2.046 2.017
Portugal 0.766 0.473 0.672 1.451 2.120 1.575
Romania 0.772 0.687 0.721 1.989 2.166 2.045
Russian Federation 0.826 0.851 0.759 2.052 2.023 2.058
Saudi Arabia 0.783 0.654 0.714 2.060 2.500 2.234
Shanghai (China) 0.895 0.818 0.830 2.492 2.387 2.524
Singapore 0.857 0.835 0.727 2.424 2.322 2.518
Slovak Republic 0.786 0.702 0.607 1.521 1.734 1.858
Slovenia 0.793 0.591 0.655 1.506 1.786 1.606
South Africa2 0.713 0.677 0.724 2.119 2.444 2.017
Spain 0.796 0.592 0.630 1.512 1.757 1.785
Sweden 0.822 0.822 0.630 1.750 1.715 1.830
Chinese Taipei 0.812 0.870 0.709 1.885 1.780 1.944
Turkey 0.803 0.591 0.737 1.750 2.311 1.721
United Arab Emirates 0.854 0.831 0.770 2.705 2.635 2.826
United States 0.844 0.769 0.722 1.907 2.212 2.102
Viet Nam 0.678 0.656 0.643 2.852 2.998 3.077
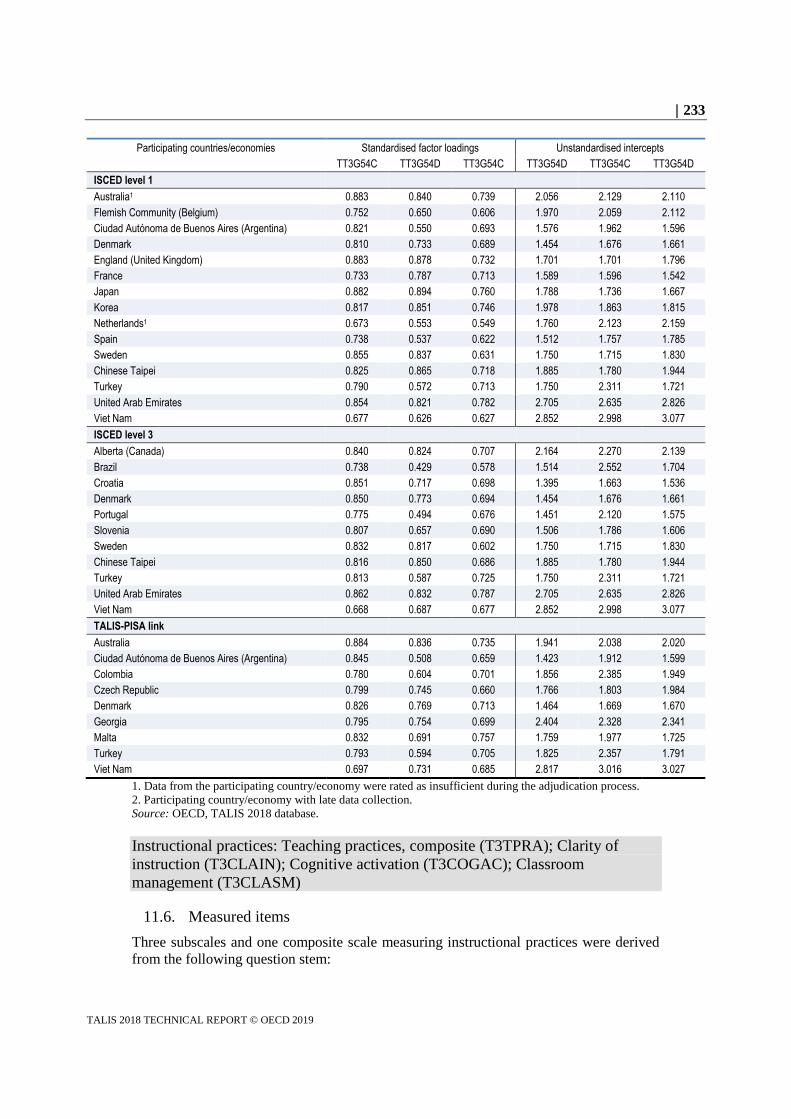
233
TALIS 2018 TECHNICAL REPORT © OECD 2019
Participating countries/economies Standardised factor loadings Unstandardised intercepts
TT3G54C TT3G54D TT3G54C TT3G54D TT3G54C TT3G54D
ISCED level 1
Australia1 0.883 0.840 0.739 2.056 2.129 2.110
Flemish Community (Belgium) 0.752 0.650 0.606 1.970 2.059 2.112
Ciudad Autónoma de Buenos Aires (Argentina) 0.821 0.550 0.693 1.576 1.962 1.596
Denmark 0.810 0.733 0.689 1.454 1.676 1.661
England (United Kingdom) 0.883 0.878 0.732 1.701 1.701 1.796
France 0.733 0.787 0.713 1.589 1.596 1.542
Japan 0.882 0.894 0.760 1.788 1.736 1.667
Korea 0.817 0.851 0.746 1.978 1.863 1.815
Netherlands1 0.673 0.553 0.549 1.760 2.123 2.159
Spain 0.738 0.537 0.622 1.512 1.757 1.785
Sweden 0.855 0.837 0.631 1.750 1.715 1.830
Chinese Taipei 0.825 0.865 0.718 1.885 1.780 1.944
Turkey 0.790 0.572 0.713 1.750 2.311 1.721
United Arab Emirates 0.854 0.821 0.782 2.705 2.635 2.826
Viet Nam 0.677 0.626 0.627 2.852 2.998 3.077
ISCED level 3
Alberta (Canada) 0.840 0.824 0.707 2.164 2.270 2.139
Brazil 0.738 0.429 0.578 1.514 2.552 1.704
Croatia 0.851 0.717 0.698 1.395 1.663 1.536
Denmark 0.850 0.773 0.694 1.454 1.676 1.661
Portugal 0.775 0.494 0.676 1.451 2.120 1.575
Slovenia 0.807 0.657 0.690 1.506 1.786 1.606
Sweden 0.832 0.817 0.602 1.750 1.715 1.830
Chinese Taipei 0.816 0.850 0.686 1.885 1.780 1.944
Turkey 0.813 0.587 0.725 1.750 2.311 1.721
United Arab Emirates 0.862 0.832 0.787 2.705 2.635 2.826
Viet Nam 0.668 0.687 0.677 2.852 2.998 3.077
TALIS-PISA link
Australia 0.884 0.836 0.735 1.941 2.038 2.020
Ciudad Autónoma de Buenos Aires (Argentina) 0.845 0.508 0.659 1.423 1.912 1.599
Colombia 0.780 0.604 0.701 1.856 2.385 1.949
Czech Republic 0.799 0.745 0.660 1.766 1.803 1.984
Denmark 0.826 0.769 0.713 1.464 1.669 1.670
Georgia 0.795 0.754 0.699 2.404 2.328 2.341
Malta 0.832 0.691 0.757 1.759 1.977 1.725
Turkey 0.793 0.594 0.705 1.825 2.357 1.791
Viet Nam 0.697 0.731 0.685 2.817 3.016 3.027
1. Data from the participating country/economy were rated as insufficient during the adjudication process.
2. Participating country/economy with late data collection.
Source: OECD, TALIS 2018 database.
Instructional practices: Teaching practices, composite (T3TPRA); Clarity of
instruction (T3CLAIN); Cognitive activation (T3COGAC); Classroom
management (T3CLASM)
11.6. Measured items
Three subscales and one composite scale measuring instructional practices were derived
from the following question stem:

234
TALIS 2018 TECHNICAL REPORT © OECD 2019
“Thinking about your teaching in the <target class>, how often do you do the
following?” (TT3G42), which was followed by items on instruction that were used
for the subscale Clarity of instruction (T3CLAIN), items on student tasks for the
subscale Cognitive activation (T3COGAC), and items on engaging students in the
lesson for the subscale Classroom management (T3CLASM), as presented in Table
11.20.
These three subscales formed the multidimensional scale Teaching practices, composite
(T3TPRA).
Table 11.20. Item wording for instructional practices scale items
T3TPRA: Teaching practices, composite
T3CLAIN: Clarity of instruction (subscale)
TT3G42: Thinking about your teaching in the <target class>, how often do you do the following?
Response options: “Never or almost never” (1), “Occasionally” (2), “Frequently” (3), “Always” (4)
TT3G42A I present a summary of recently learned content
TT3G42B I set goals at the beginning of instruction
TT3G42C I explain what I expect the students to learn
TT3G42D I explain how new and old topics are related
T3COGAC: Cognitive activation (subscale)
TT3G42: Thinking about your teaching in the <target class>, how often do you do the following?
Response options: “Never or almost never” (1), “Occasionally” (2), “Frequently” (3), “Always” (4)
TT3G42E I present tasks for which there is no obvious solution
TT3G42F I give tasks that require students to think critically
TT3G42G I have students work in small groups to come up with a joint solution to a problem or task
TT3G42H I ask students to decide on their own procedures for solving complex tasks
T3CLASM: Classroom management (subscale)
TT3G42: Thinking about your teaching in the <target class>, how often do you do the following?
Response options: “Never or almost never” (1), “Occasionally” (2), “Frequently” (3), “Always” (4)
TT3G42I I tell students to follow classroom rules
TT3G42J I tell students to listen to what I say
TT3G42K I calm students who are disruptive
TT3G42L When the lesson begins, I tell students to quieten down quickly
Source: OECD, TALIS 2018 database.
11.7. Model improvements
Each scale was improved by one or more modifications. A correlation between items
TT3G42B and TT3G42D was added to the model for T3CLAIN, which meant that this
addition was implemented for all populations. A correlation between items TT3G42G and
TT3G42H was added to the model for T3COGAC, and a correlation between items
TT3G42K and TT3G42L was added to the model for T3CLASM. These improvements
persisted in all subsequent analyses of the scales.
11.8. Scale reliability
Table 11.21 presents the reliability coefficients (omega for the subscales, stratified
Cronbach’s alpha for T3TPRA) for all populations for each scale. As can be seen, reliability
is generally high for the subscales T3CLAIN and T3CLASM. The reliabilities for
T3COGAC are also generally high. Exceptions include the ISCED level 2 populations in
Belgium and the Flemish Community (Belgium) for T3CLAIN, and the ISCED level 1

235
TALIS 2018 TECHNICAL REPORT © OECD 2019
population in Viet Nam for T3CLASM. However, low omega values are evident in many
participating countries for the scale T3COGAC, especially with respect to the ISCED level
2 population and for the ISCED level 1 and ISCED level 3 populations. The coefficients
for the composite scale T3TPRA indicate a high level of reliability in all populations.
Table 11.21. Reliability coefficients for instructional practices scales
Participating countries/economies
T3CLAIN T3COGAC T3CLASM T3TPRA
Omega coefficient3 Stratified Cronbach’s
alpha
ISCED level 2
Alberta (Canada) 0.870 0.740 0.889 0.884
Australia 0.876 0.726 0.876 0.871
Austria 0.724 0.578 0.895 0.827
Belgium 0.669 0.651 0.893 0.803
Flemish Community (Belgium) 0.619 0.707 0.904 0.803
Brazil 0.815 0.646 0.830 0.852
Bulgaria 0.776 0.599 0.867 0.834
Ciudad Autónoma de Buenos Aires (Argentina) 0.901 0.726 0.872 0.877
Chile 0.878 0.707 0.889 0.866
Colombia 0.850 0.736 0.867 0.885
Croatia 0.752 0.624 0.904 0.838
Cyprus 0.910 0.666 0.884 0.881
Czech Republic 0.893 0.566 0.872 0.860
Denmark 0.808 0.743 0.935 0.882
England (United Kingdom) 0.843 0.699 0.901 0.864
Estonia 0.824 0.638 0.901 0.848
Finland 0.839 0.767 0.922 0.884
France 0.712 0.567 0.899 0.818
Georgia 0.918 0.750 0.895 0.890
Hungary 0.781 0.645 0.852 0.828
Iceland 0.865 0.664 0.897 0.883
Israel 0.897 0.776 0.897 0.891
Italy 0.821 0.672 0.869 0.844
Japan 0.876 0.687 0.897 0.886
Kazakhstan 0.859 0.776 0.869 0.881
Korea 0.897 0.834 0.893 0.908
Latvia 0.854 0.707 0.824 0.864
Lithuania 0.846 0.615 0.895 0.849
Malta 0.916 0.760 0.861 0.889
Mexico 0.821 0.599 0.790 0.819
Netherlands 0.741 0.787 0.885 0.846
New Zealand 0.814 0.664 0.857 0.838
Norway 0.790 0.723 0.889 0.853
Portugal 0.740 0.717 0.887 0.853
Romania 0.857 0.706 0.882 0.868
Russian Federation 0.893 0.767 0.904 0.884
Saudi Arabia 0.931 0.845 0.859 0.931
Shanghai (China) 0.908 0.830 0.880 0.911
Singapore 0.916 0.808 0.848 0.908
Slovak Republic 0.837 0.687 0.916 0.870
Slovenia 0.789 0.635 0.878 0.850
South Africa2 0.821 0.702 0.867 0.883

236
TALIS 2018 TECHNICAL REPORT © OECD 2019
Participating countries/economies
T3CLAIN T3COGAC T3CLASM T3TPRA
Omega coefficient3 Stratified Cronbach’s
alpha
Spain 0.781 0.716 0.897 0.849
Sweden 0.810 0.585 0.920 0.863
Chinese Taipei 0.935 0.774 0.910 0.914
Turkey 0.925 0.771 0.880 0.899
United Arab Emirates 0.899 0.799 0.880 0.901
United States 0.920 0.711 0.882 0.895
Viet Nam 0.903 0.721 0.748 0.897
ISCED level 1
Australia1 0.870 0.774 0.889 0.886
Flemish Community (Belgium) 0.740 0.734 0.885 0.826
Ciudad Autónoma de Buenos Aires (Argentina) 0.910 0.731 0.843 0.888
Denmark 0.832 0.748 0.935 0.876
England (United Kingdom) 0.790 0.762 0.901 0.870
France 0.821 0.671 0.872 0.842
Japan 0.863 0.706 0.904 0.871
Korea 0.912 0.845 0.916 0.912
Netherlands1 0.912 0.794 0.899 0.899
Spain 0.808 0.734 0.897 0.865
Sweden 0.845 0.619 0.904 0.857
Chinese Taipei 0.897 0.778 0.899 0.902
Turkey 0.922 0.817 0.874 0.913
United Arab Emirates 0.880 0.817 0.859 0.903
Viet Nam 0.850 0.599 0.659 0.841
ISCED level 3
Alberta (Canada) 0.887 0.666 0.899 0.883
Brazil 0.865 0.623 0.832 0.865
Croatia 0.796 0.672 0.904 0.845
Denmark 0.826 0.664 0.918 0.864
Portugal 0.752 0.723 0.876 0.861
Slovenia 0.834 0.654 0.865 0.857
Sweden 0.821 0.575 0.891 0.849
Chinese Taipei 0.912 0.759 0.916 0.911
Turkey 0.933 0.787 0.874 0.906
United Arab Emirates 0.925 0.790 0.880 0.905
Viet Nam 0.843 0.691 0.729 0.849
TALIS-PISA link
Australia 0.859 0.734 0.885 0.872
Ciudad Autónoma de Buenos Aires (Argentina) 0.856 0.677 0.895 0.865
Colombia 0.880 0.729 0.852 0.886
Czech Republic 0.835 0.724 0.872 0.859
Denmark 0.801 0.766 0.941 0.879
Georgia 0.916 0.755 0.891 0.894
Malta 0.887 0.721 0.887 0.880
Turkey 0.924 0.702 0.867 0.884
Viet Nam 0.904 0.721 0.812 0.893
1. Data from the participating country/economy were rated as insufficient during the adjudication process.
2. Participating country/economy with late data collection.
3. Calculation of the omega coefficient was based on the unidimensional models for every single subscale of the multidimensional construct.
Source: OECD, TALIS 2018 database.

237
TALIS 2018 TECHNICAL REPORT © OECD 2019
11.9. Model fits
Table 11.22 presents the model fits for the subscale T3CLAIN. The table shows that the
CFI is acceptable for all populations. Although the TLI, RMSEA and SRMR do not reach
the cut-off criteria in some populations, they are acceptable in most populations. The model
fit indices are also acceptable for most of the populations that were excluded from the
parameter estimation.
The model fits for T3COGAC are acceptable for all populations, with the exception of the
ISCED level 2 population in Brazil (see Table 11.23). However, the CFI and TLI are below
the cut-off criteria for the TALIS-PISA link populations in the Czech Republic and
Denmark.
The subscale T3CLASM performed well in all populations, as evident from the model fits
presented in Table 11.24.
Table 11.22. CFA model-data fit for scale T3CLAIN
Clarity of instruction
Participating countries/economies CFI TLI RMSEA SRMR
ISCED level 2
Alberta (Canada) 0.907 0.440 0.239 0.044
Australia 0.988 0.930 0.068 0.019
Austria 0.987 0.920 0.065 0.018
Belgium 0.991 0.947 0.043 0.012
Flemish Community (Belgium) 0.994 0.962 0.037 0.011
Brazil 0.999 0.995 0.016 0.007
Bulgaria 1.000 0.998 0.008 0.006
Ciudad Autónoma de Buenos Aires (Argentina) 0.998 0.989 0.025 0.009
Chile 0.967 0.804 0.127 0.032
Colombia 1.000 1.009 0.000 0.000
Croatia 0.993 0.955 0.043 0.013
Cyprus 0.998 0.987 0.030 0.012
Czech Republic 0.990 0.940 0.073 0.015
Denmark 0.985 0.909 0.077 0.017
England (United Kingdom) 0.993 0.958 0.055 0.017
Estonia 0.996 0.978 0.048 0.012
Finland 0.972 0.832 0.141 0.027
France 1.000 1.005 0.000 0.003
Georgia 0.994 0.962 0.066 0.012
Hungary 0.996 0.977 0.039 0.011
Iceland 0.998 0.989 0.038 0.009
Israel 0.975 0.847 0.094 0.022
Italy 0.976 0.854 0.100 0.023
Japan 0.977 0.861 0.105 0.024
Kazakhstan 0.985 0.910 0.061 0.019
Korea 1.000 0.998 0.014 0.005
Latvia 0.999 0.993 0.021 0.006
Lithuania 0.975 0.851 0.099 0.027
Malta 0.995 0.968 0.060 0.012
Mexico 1.000 1.003 0.000 0.003
Netherlands 0.984 0.902 0.080 0.017
New Zealand 0.998 0.989 0.026 0.011
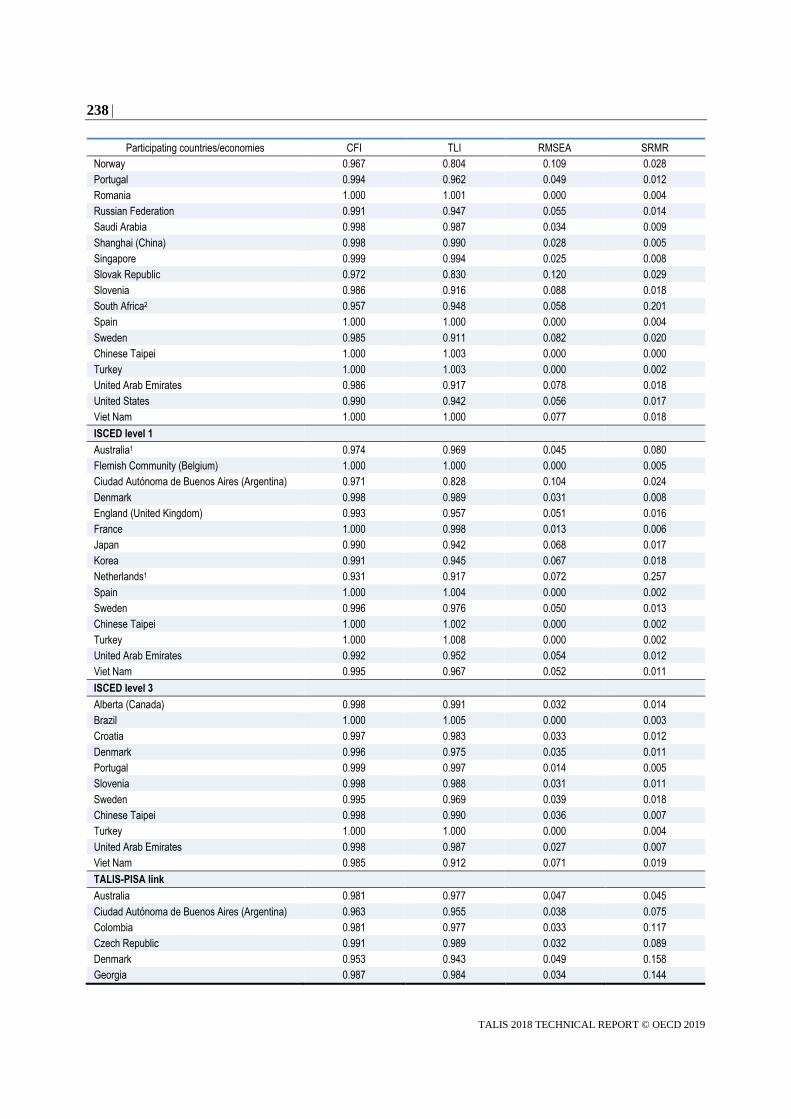
238
TALIS 2018 TECHNICAL REPORT © OECD 2019
Participating countries/economies CFI TLI RMSEA SRMR
Norway 0.967 0.804 0.109 0.028
Portugal 0.994 0.962 0.049 0.012
Romania 1.000 1.001 0.000 0.004
Russian Federation 0.991 0.947 0.055 0.014
Saudi Arabia 0.998 0.987 0.034 0.009
Shanghai (China) 0.998 0.990 0.028 0.005
Singapore 0.999 0.994 0.025 0.008
Slovak Republic 0.972 0.830 0.120 0.029
Slovenia 0.986 0.916 0.088 0.018
South Africa2 0.957 0.948 0.058 0.201
Spain 1.000 1.000 0.000 0.004
Sweden 0.985 0.911 0.082 0.020
Chinese Taipei 1.000 1.003 0.000 0.000
Turkey 1.000 1.003 0.000 0.002
United Arab Emirates 0.986 0.917 0.078 0.018
United States 0.990 0.942 0.056 0.017
Viet Nam 1.000 1.000 0.077 0.018
ISCED level 1
Australia1 0.974 0.969 0.045 0.080
Flemish Community (Belgium) 1.000 1.000 0.000 0.005
Ciudad Autónoma de Buenos Aires (Argentina) 0.971 0.828 0.104 0.024
Denmark 0.998 0.989 0.031 0.008
England (United Kingdom) 0.993 0.957 0.051 0.016
France 1.000 0.998 0.013 0.006
Japan 0.990 0.942 0.068 0.017
Korea 0.991 0.945 0.067 0.018
Netherlands1 0.931 0.917 0.072 0.257
Spain 1.000 1.004 0.000 0.002
Sweden 0.996 0.976 0.050 0.013
Chinese Taipei 1.000 1.002 0.000 0.002
Turkey 1.000 1.008 0.000 0.002
United Arab Emirates 0.992 0.952 0.054 0.012
Viet Nam 0.995 0.967 0.052 0.011
ISCED level 3
Alberta (Canada) 0.998 0.991 0.032 0.014
Brazil 1.000 1.005 0.000 0.003
Croatia 0.997 0.983 0.033 0.012
Denmark 0.996 0.975 0.035 0.011
Portugal 0.999 0.997 0.014 0.005
Slovenia 0.998 0.988 0.031 0.011
Sweden 0.995 0.969 0.039 0.018
Chinese Taipei 0.998 0.990 0.036 0.007
Turkey 1.000 1.000 0.000 0.004
United Arab Emirates 0.998 0.987 0.027 0.007
Viet Nam 0.985 0.912 0.071 0.019
TALIS-PISA link
Australia 0.981 0.977 0.047 0.045
Ciudad Autónoma de Buenos Aires (Argentina) 0.963 0.955 0.038 0.075
Colombia 0.981 0.977 0.033 0.117
Czech Republic 0.991 0.989 0.032 0.089
Denmark 0.953 0.943 0.049 0.158
Georgia 0.987 0.984 0.034 0.144

239
TALIS 2018 TECHNICAL REPORT © OECD 2019
Participating countries/economies CFI TLI RMSEA SRMR
Malta 0.856 0.827 0.129 0.211
Turkey 0.996 0.996 0.012 0.051
Viet Nam 0.998 0.998 0.022 0.065
1. Data from the participating country/economy were rated as insufficient during the adjudication process.
2. Participating country/economy with late data collection.
Source: OECD, TALIS 2018 database.
Table 11.23. CFA model-data fit for scale T3COGAC
Cognitive activation
Participating countries/economies CFI TLI RMSEA SRMR
ISCED level 2
Alberta (Canada) 1.000 1.021 0.000 0.001
Australia 1.000 1.002 0.000 0.003
Austria 1.000 1.002 0.000 0.002
Belgium 0.989 0.937 0.059 0.011
Flemish Community (Belgium) 1.000 1.004 0.000 0.002
Brazil 0.863 0.175 0.207 0.031
Bulgaria 0.995 0.967 0.043 0.011
Ciudad Autónoma de Buenos Aires (Argentina) 0.993 0.959 0.044 0.008
Chile 0.999 0.995 0.021 0.006
Colombia 0.993 0.955 0.061 0.010
Croatia 0.998 0.987 0.025 0.009
Cyprus 0.986 0.913 0.066 0.017
Czech Republic 1.000 1.002 0.000 0.003
Denmark 1.000 1.006 0.000 0.001
England (United Kingdom) 1.000 1.002 0.000 0.003
Estonia 1.000 1.005 0.000 0.002
Finland 0.997 0.980 0.046 0.009
France 0.986 0.917 0.066 0.016
Georgia 0.993 0.960 0.053 0.008
Hungary 0.994 0.966 0.045 0.010
Iceland 1.000 1.006 0.000 0.006
Israel 1.000 1.005 0.000 0.001
Italy 0.998 0.990 0.028 0.006
Japan 1.000 0.997 0.015 0.004
Kazakhstan 1.000 1.002 0.000 0.001
Korea 0.998 0.989 0.036 0.006
Latvia 0.972 0.834 0.100 0.020
Lithuania 0.995 0.969 0.031 0.009
Malta 1.000 1.006 0.000 0.002
Mexico 0.996 0.979 0.032 0.007
New Zealand 1.000 1.015 0.000 0.001
Norway 0.999 0.995 0.018 0.005
Portugal 0.998 0.986 0.036 0.007
Romania 0.962 0.774 0.106 0.023
Russian Federation 0.995 0.973 0.039 0.011
Saudi Arabia 0.992 0.951 0.073 0.013
Shanghai (China) 0.995 0.972 0.054 0.007
Singapore 0.992 0.952 0.078 0.011
Slovak Republic 0.985 0.912 0.083 0.015

240
TALIS 2018 TECHNICAL REPORT © OECD 2019
Participating countries/economies CFI TLI RMSEA SRMR
Slovenia 0.997 0.980 0.038 0.009
South Africa2 0.943 0.931 0.061 0.070
Spain 0.999 0.995 0.016 0.004
Sweden 1.000 1.022 0.000 0.001
Chinese Taipei 1.000 0.998 0.013 0.003
Turkey 1.000 1.001 0.000 0.002
United Arab Emirates 0.998 0.989 0.035 0.006
United States 0.999 0.994 0.013 0.008
Viet Nam 1.000 1.007 0.000 0.002
ISCED level 1
Australia1 0.982 0.979 0.047 0.059
Flemish Community (Belgium) 1.000 1.002 0.000 0.003
Ciudad Autónoma de Buenos Aires (Argentina) 0.996 0.979 0.040 0.008
Denmark 0.999 0.997 0.016 0.006
England (United Kingdom) 1.000 1.003 0.000 0.003
France 1.000 1.022 0.000 0.000
Japan 0.999 0.996 0.019 0.004
Korea 1.000 1.001 0.000 0.002
Netherlands1 0.956 0.947 0.069 0.194
Spain 0.999 0.993 0.017 0.006
Sweden 1.000 1.013 0.000 0.001
Chinese Taipei 0.997 0.979 0.045 0.009
Turkey 1.000 1.005 0.000 0.001
United Arab Emirates 0.991 0.946 0.072 0.014
Viet Nam 1.000 0.999 0.009 0.006
ISCED level 3
Alberta (Canada) 1.000 1.006 0.000 0.005
Brazil 0.931 0.587 0.127 0.030
Croatia 0.990 0.939 0.063 0.014
Denmark 1.000 1.008 0.000 0.004
Portugal 1.000 1.001 0.000 0.002
Slovenia 0.998 0.986 0.030 0.008
Sweden 0.990 0.939 0.042 0.011
Chinese Taipei 0.999 0.996 0.021 0.004
Turkey 1.000 1.002 0.000 0.000
United Arab Emirates 0.982 0.891 0.095 0.017
Viet Nam 1.000 0.999 0.009 0.007
TALIS-PISA link
Australia 1.000 1.001 0.000 0.021
Ciudad Autónoma de Buenos Aires (Argentina) 0.966 0.959 0.040 0.056
Colombia 0.956 0.947 0.052 0.086
Czech Republic 0.801 0.761 0.071 0.176
Denmark 0.870 0.844 0.071 0.237
Georgia 0.987 0.984 0.022 0.057
Malta 0.982 0.979 0.051 0.082
Turkey 0.937 0.925 0.082 0.142
Viet Nam 0.973 0.968 0.051 0.091
1. Data from the participating country/economy were rated as insufficient during the adjudication process.
2. Participating country/economy with late data collection.
Source: OECD, TALIS 2018 database.

241
TALIS 2018 TECHNICAL REPORT © OECD 2019
Table 11.24. CFA model-data fit for scale T3CLASM
Classroom management
Participating countries/economies CFI TLI RMSEA SRMR
ISCED level 2
Alberta (Canada) 1.000 1.001 0.000 0.005
Australia 0.998 0.990 0.033 0.005
Austria 0.996 0.978 0.057 0.007
Belgium 0.998 0.990 0.036 0.005
Flemish Community (Belgium) 0.999 0.992 0.037 0.005
Brazil 1.000 1.007 0.000 0.001
Bulgaria 0.998 0.987 0.037 0.007
Ciudad Autónoma de Buenos Aires (Argentina) 0.998 0.986 0.041 0.006
Chile 0.999 0.995 0.024 0.006
Colombia 1.000 1.007 0.000 0.001
Croatia 1.000 0.998 0.022 0.004
Cyprus 0.989 0.935 0.092 0.011
Czech Republic 1.000 1.001 0.000 0.002
Denmark 1.000 1.002 0.000 0.002
England (United Kingdom) 0.995 0.971 0.072 0.007
Estonia 1.000 1.002 0.000 0.001
Finland 0.994 0.962 0.092 0.007
France 1.000 1.003 0.000 0.000
Georgia 0.999 0.991 0.033 0.005
Hungary 0.985 0.909 0.103 0.015
Iceland 1.000 1.007 0.000 0.002
Israel 0.999 0.997 0.018 0.004
Italy 0.995 0.969 0.071 0.009
Japan 0.999 0.996 0.031 0.003
Kazakhstan 0.999 0.995 0.021 0.004
Korea 1.000 0.999 0.014 0.003
Latvia 1.000 1.007 0.000 0.001
Lithuania 0.999 0.991 0.034 0.004
Malta 0.993 0.961 0.096 0.012
Mexico 1.000 1.003 0.000 0.001
Netherlands 1.000 1.002 0.000 0.002
New Zealand 1.000 1.000 0.000 0.003
Norway 1.000 1.002 0.000 0.000
Portugal 1.000 1.002 0.000 0.002
Romania 1.000 0.999 0.011 0.003
Russian Federation 0.995 0.970 0.062 0.005
Saudi Arabia 0.999 0.994 0.018 0.006
Shanghai (China) 1.000 1.002 0.000 0.001
Singapore 1.000 1.003 0.000 0.001
Slovak Republic 1.000 1.003 0.000 0.000
Slovenia 1.000 0.998 0.018 0.003
South Africa2 0.984 0.907 0.075 0.018
Spain 1.000 1.001 0.000 0.001
Sweden 1.000 1.002 0.000 0.002
Chinese Taipei 1.000 1.002 0.000 0.000
Turkey 0.996 0.975 0.049 0.006
United Arab Emirates 0.998 0.988 0.034 0.005
United States 0.999 0.994 0.020 0.006
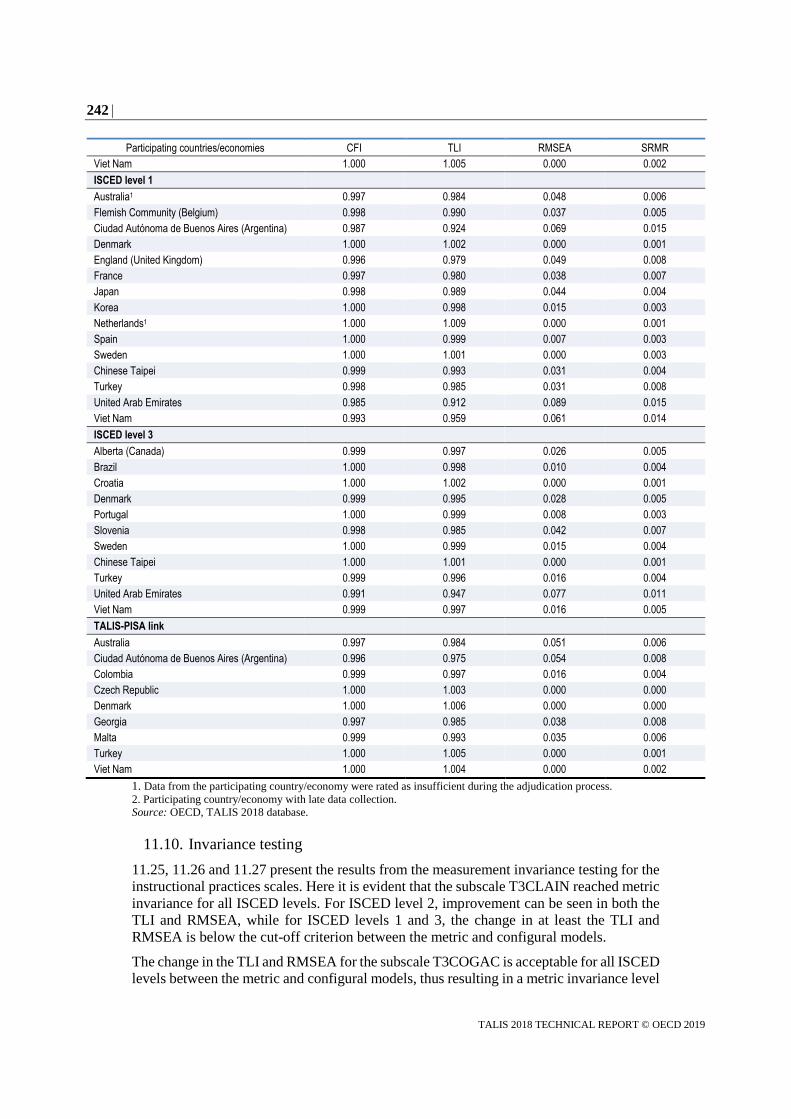
242
TALIS 2018 TECHNICAL REPORT © OECD 2019
Participating countries/economies CFI TLI RMSEA SRMR
Viet Nam 1.000 1.005 0.000 0.002
ISCED level 1
Australia1 0.997 0.984 0.048 0.006
Flemish Community (Belgium) 0.998 0.990 0.037 0.005
Ciudad Autónoma de Buenos Aires (Argentina) 0.987 0.924 0.069 0.015
Denmark 1.000 1.002 0.000 0.001
England (United Kingdom) 0.996 0.979 0.049 0.008
France 0.997 0.980 0.038 0.007
Japan 0.998 0.989 0.044 0.004
Korea 1.000 0.998 0.015 0.003
Netherlands1 1.000 1.009 0.000 0.001
Spain 1.000 0.999 0.007 0.003
Sweden 1.000 1.001 0.000 0.003
Chinese Taipei 0.999 0.993 0.031 0.004
Turkey 0.998 0.985 0.031 0.008
United Arab Emirates 0.985 0.912 0.089 0.015
Viet Nam 0.993 0.959 0.061 0.014
ISCED level 3
Alberta (Canada) 0.999 0.997 0.026 0.005
Brazil 1.000 0.998 0.010 0.004
Croatia 1.000 1.002 0.000 0.001
Denmark 0.999 0.995 0.028 0.005
Portugal 1.000 0.999 0.008 0.003
Slovenia 0.998 0.985 0.042 0.007
Sweden 1.000 0.999 0.015 0.004
Chinese Taipei 1.000 1.001 0.000 0.001
Turkey 0.999 0.996 0.016 0.004
United Arab Emirates 0.991 0.947 0.077 0.011
Viet Nam 0.999 0.997 0.016 0.005
TALIS-PISA link
Australia 0.997 0.984 0.051 0.006
Ciudad Autónoma de Buenos Aires (Argentina) 0.996 0.975 0.054 0.008
Colombia 0.999 0.997 0.016 0.004
Czech Republic 1.000 1.003 0.000 0.000
Denmark 1.000 1.006 0.000 0.000
Georgia 0.997 0.985 0.038 0.008
Malta 0.999 0.993 0.035 0.006
Turkey 1.000 1.005 0.000 0.001
Viet Nam 1.000 1.004 0.000 0.002
1. Data from the participating country/economy were rated as insufficient during the adjudication process.
2. Participating country/economy with late data collection.
Source: OECD, TALIS 2018 database.
11.10. Invariance testing
11.25, 11.26 and 11.27 present the results from the measurement invariance testing for the
instructional practices scales. Here it is evident that the subscale T3CLAIN reached metric
invariance for all ISCED levels. For ISCED level 2, improvement can be seen in both the
TLI and RMSEA, while for ISCED levels 1 and 3, the change in at least the TLI and
RMSEA is below the cut-off criterion between the metric and configural models.
The change in the TLI and RMSEA for the subscale T3COGAC is acceptable for all ISCED
levels between the metric and configural models, thus resulting in a metric invariance level

243
TALIS 2018 TECHNICAL REPORT © OECD 2019
for all ISCED levels. Although the subscale T3CLASM reaches configural invariance for
ISCED levels 2 and 3 only, it meets the criteria for metric invariance for ISCED level 1.
Based on the lowest invariance level of its subscales, the composite scale T3TPRA can be
considered metric invariant for ISCED level 1 and configural invariant for ISCED levels 2
and 3.
Table 11.25. Invariance test results for scale T3CLAIN
CFI TLI RMSEA SRMR Δ CFI Δ TLI Δ RMSEA Δ SRMR
Invariance level of ISCED level 2
Configural 0.991 0.947 0.061 0.016
Metric 0.979 0.968 0.048 0.058 0.012 -0.021 0.013 -0.042
Scalar 0.744 0.777 0.126 0.132 0.235 0.191 -0.078 -0.074
Invariance level of ISCED level 1
Configural 0.995 0.973 0.043 0.012
Metric 0.982 0.971 0.044 0.057 0.013 0.002 -0.001 -0.045
Scalar 0.718 0.741 0.134 0.168 0.264 0.230 -0.090 -0.111
Invariance level of ISCED level 3
Configural 0.998 0.989 0.028 0.010
Metric 0.991 0.986 0.031 0.037 0.007 0.003 -0.003 -0.027
Scalar 0.814 0.827 0.109 0.115 0.177 0.159 -0.078 -0.078
Source: OECD, TALIS 2018 database.
Table 11.26. Invariance test results for scale T3COGAC
CFI TLI RMSEA SRMR Δ CFI Δ TLI Δ RMSEA Δ SRMR
Invariance level of ISCED level 2
Configural 0.996 0.976 0.042 0.009
Metric 0.975 0.962 0.052 0.053 0.021 0.014 -0.010 -0.044
Scalar 0.644 0.689 0.148 0.152 0.331 0.273 -0.096 -0.099
Invariance level of ISCED level 1
Configural 0.998 0.986 0.033 0.008
Metric 0.983 0.973 0.046 0.051 0.015 0.013 -0.013 -0.043
Scalar 0.778 0.797 0.126 0.127 0.205 0.176 -0.080 -0.076
Invariance level of ISCED level 3
Configural 0.994 0.962 0.053 0.012
Metric 0.974 0.958 0.056 0.053 0.020 0.004 -0.003 -0.041
Scalar 0.544 0.576 0.177 0.202 0.430 0.382 -0.121 -0.149
Note: See endnote 34.
Source: OECD, TALIS 2018 database.

244
TALIS 2018 TECHNICAL REPORT © OECD 2019
Table 11.27. Invariance test results for scale T3CLASM
CFI TLI RMSEA SRMR Δ CFI Δ TLI Δ RMSEA Δ SRMR
Invariance level of ISCED level 2
Configural 0.999 0.993 0.030 0.005
Metric 0.981 0.971 0.060 0.080 0.018 0.022 -0.030 -0.075
Scalar 0.858 0.876 0.123 0.136 0.123 0.095 -0.063 -0.056
Invariance level of ISCED level 1
Configural 0.995 0.972 0.053 0.009
Metric 0.978 0.965 0.059 0.076 0.017 0.007 -0.006 -0.067
Scalar 0.846 0.858 0.119 0.124 0.132 0.107 -0.060 -0.048
Invariance level of ISCED level 3
Configural 0.998 0.988 0.037 0.006
Metric 0.970 0.952 0.073 0.099 0.028 0.036 -0.036 -0.093
Scalar 0.849 0.859 0.126 0.125 0.121 0.093 -0.053 -0.026
Note: See endnote 34.
Source: OECD, TALIS 2018 database.
11.11. Item parameters
Table 11.28 reports the unstandardised item parameters for the subscales that reached
metric invariance (T3CLAIN and T2COGAC).
Table 11.28. Unstandardised factor loadings for T3CLAIN and T3COGAC
for all countries for all populations
T3CLAIN (metric) T3COGAC (metric)
TT3G42A 0.352 TT3G42E 0.484
TT3G42B 0.549 TT3G42F 0.534
TT3G42C 0.436 TT3G42G 0.360
TT3G42D 0.480 TT3G42H 0.428
Source: OECD, TALIS 2018 database.
Tables 11.29, 11.30 and 11.31 present the standardised factor loadings and unstandardised
intercepts for the subscales T3CLAIN, T3COGAC and T3CLASM respectively. For
T3CLAIN, the factor loadings for items TT3G42B, TT3G42C and TT3G42D are generally
high and all above 0.450. However, item TT3G42BA shows lower factor loadings in many
participating countries (also seen in Table 11.28 above), suggesting that this item is only
weakly related to the scale construct.
In general, the factor loadings for items included in the subscale T3COGAC are above
0.450 in most populations. The strongest relationship observed is that between item
TT3G42F and the latent construct, whereas most of the factor loadings for item TT3G42G
are between 0.450 and 0.600.
In most populations, the factor loadings for T3CLASM for all items are higher than 0.600,
indicating a strong relationship between the items and the latent construct. However,
several populations exhibit lower loadings for items TT3G42K and TT3G42L, as observed
in Latvia for ISCED level 2, and for item TT3G42L in Portugal for ISCED levels 2 and 3.
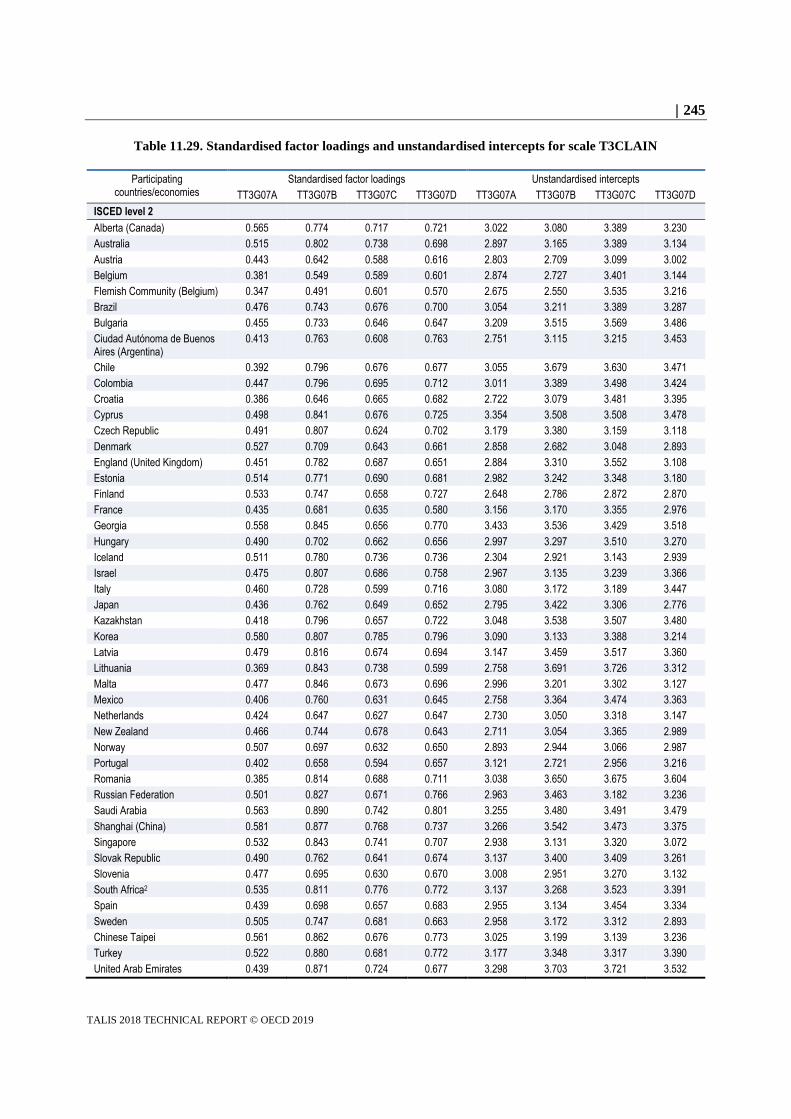
245
TALIS 2018 TECHNICAL REPORT © OECD 2019
Table 11.29. Standardised factor loadings and unstandardised intercepts for scale T3CLAIN
Participating countries/economies
Standardised factor loadings Unstandardised intercepts
TT3G07A TT3G07B TT3G07C TT3G07D TT3G07A TT3G07B TT3G07C TT3G07D
ISCED level 2
Alberta (Canada) 0.565 0.774 0.717 0.721 3.022 3.080 3.389 3.230
Australia 0.515 0.802 0.738 0.698 2.897 3.165 3.389 3.134
Austria 0.443 0.642 0.588 0.616 2.803 2.709 3.099 3.002
Belgium 0.381 0.549 0.589 0.601 2.874 2.727 3.401 3.144
Flemish Community (Belgium) 0.347 0.491 0.601 0.570 2.675 2.550 3.535 3.216
Brazil 0.476 0.743 0.676 0.700 3.054 3.211 3.389 3.287
Bulgaria 0.455 0.733 0.646 0.647 3.209 3.515 3.569 3.486
Ciudad Autónoma de Buenos Aires (Argentina)
0.413 0.763 0.608 0.763 2.751 3.115 3.215 3.453
Chile 0.392 0.796 0.676 0.677 3.055 3.679 3.630 3.471
Colombia 0.447 0.796 0.695 0.712 3.011 3.389 3.498 3.424
Croatia 0.386 0.646 0.665 0.682 2.722 3.079 3.481 3.395
Cyprus 0.498 0.841 0.676 0.725 3.354 3.508 3.508 3.478
Czech Republic 0.491 0.807 0.624 0.702 3.179 3.380 3.159 3.118
Denmark 0.527 0.709 0.643 0.661 2.858 2.682 3.048 2.893
England (United Kingdom) 0.451 0.782 0.687 0.651 2.884 3.310 3.552 3.108
Estonia 0.514 0.771 0.690 0.681 2.982 3.242 3.348 3.180
Finland 0.533 0.747 0.658 0.727 2.648 2.786 2.872 2.870
France 0.435 0.681 0.635 0.580 3.156 3.170 3.355 2.976
Georgia 0.558 0.845 0.656 0.770 3.433 3.536 3.429 3.518
Hungary 0.490 0.702 0.662 0.656 2.997 3.297 3.510 3.270
Iceland 0.511 0.780 0.736 0.736 2.304 2.921 3.143 2.939
Israel 0.475 0.807 0.686 0.758 2.967 3.135 3.239 3.366
Italy 0.460 0.728 0.599 0.716 3.080 3.172 3.189 3.447
Japan 0.436 0.762 0.649 0.652 2.795 3.422 3.306 2.776
Kazakhstan 0.418 0.796 0.657 0.722 3.048 3.538 3.507 3.480
Korea 0.580 0.807 0.785 0.796 3.090 3.133 3.388 3.214
Latvia 0.479 0.816 0.674 0.694 3.147 3.459 3.517 3.360
Lithuania 0.369 0.843 0.738 0.599 2.758 3.691 3.726 3.312
Malta 0.477 0.846 0.673 0.696 2.996 3.201 3.302 3.127
Mexico 0.406 0.760 0.631 0.645 2.758 3.364 3.474 3.363
Netherlands 0.424 0.647 0.627 0.647 2.730 3.050 3.318 3.147
New Zealand 0.466 0.744 0.678 0.643 2.711 3.054 3.365 2.989
Norway 0.507 0.697 0.632 0.650 2.893 2.944 3.066 2.987
Portugal 0.402 0.658 0.594 0.657 3.121 2.721 2.956 3.216
Romania 0.385 0.814 0.688 0.711 3.038 3.650 3.675 3.604
Russian Federation 0.501 0.827 0.671 0.766 2.963 3.463 3.182 3.236
Saudi Arabia 0.563 0.890 0.742 0.801 3.255 3.480 3.491 3.479
Shanghai (China) 0.581 0.877 0.768 0.737 3.266 3.542 3.473 3.375
Singapore 0.532 0.843 0.741 0.707 2.938 3.131 3.320 3.072
Slovak Republic 0.490 0.762 0.641 0.674 3.137 3.400 3.409 3.261
Slovenia 0.477 0.695 0.630 0.670 3.008 2.951 3.270 3.132
South Africa2 0.535 0.811 0.776 0.772 3.137 3.268 3.523 3.391
Spain 0.439 0.698 0.657 0.683 2.955 3.134 3.454 3.334
Sweden 0.505 0.747 0.681 0.663 2.958 3.172 3.312 2.893
Chinese Taipei 0.561 0.862 0.676 0.773 3.025 3.199 3.139 3.236
Turkey 0.522 0.880 0.681 0.772 3.177 3.348 3.317 3.390
United Arab Emirates 0.439 0.871 0.724 0.677 3.298 3.703 3.721 3.532

246
TALIS 2018 TECHNICAL REPORT © OECD 2019
Participating countries/economies
Standardised factor loadings Unstandardised intercepts
TT3G07A TT3G07B TT3G07C TT3G07D TT3G07A TT3G07B TT3G07C TT3G07D
United States 0.503 0.824 0.687 0.770 2.902 3.208 3.353 3.190
Viet Nam 0.562 0.835 0.654 0.785 3.014 3.243 3.118 3.192
ISCED level 1
Australia1 0.458 0.814 0.730 0.682 2.944 3.234 3.488 3.134
Flemish Community (Belgium) 0.464 0.648 0.612 0.663 2.768 2.669 3.248 2.954
Ciudad Autónoma de Buenos Aires (Argentina)
0.431 0.794 0.617 0.756 2.717 3.180 3.118 3.334
Denmark 0.542 0.728 0.673 0.684 2.886 2.732 3.095 2.829
England (United Kingdom) 0.403 0.759 0.707 0.616 2.884 3.310 3.552 3.108
France 0.510 0.784 0.702 0.667 3.156 3.170 3.355 2.976
Japan 0.410 0.810 0.590 0.617 2.798 3.659 3.320 2.815
Korea 0.518 0.876 0.796 0.743 3.160 3.468 3.570 3.362
Netherlands1 0.456 0.768 0.642 0.647 2.983 3.516 3.455 3.119
Spain 0.449 0.733 0.631 0.709 2.955 3.134 3.454 3.334
Sweden 0.553 0.783 0.723 0.709 2.936 2.947 3.174 2.737
Chinese Taipei 0.525 0.846 0.663 0.741 3.025 3.199 3.139 3.236
Turkey 0.529 0.875 0.657 0.774 3.177 3.348 3.317 3.390
United Arab Emirates 0.434 0.869 0.728 0.681 3.298 3.703 3.721 3.532
Viet Nam 0.488 0.792 0.601 0.739 3.014 3.243 3.118 3.192
ISCED level 3
Alberta (Canada) 0.543 0.763 0.698 0.728 3.022 3.080 3.389 3.230
Brazil 0.513 0.796 0.681 0.736 3.054 3.211 3.389 3.287
Croatia 0.433 0.689 0.685 0.719 2.722 3.079 3.481 3.395
Denmark 0.497 0.704 0.642 0.704 2.923 2.943 3.091 3.047
Portugal 0.418 0.675 0.596 0.657 3.121 2.721 2.956 3.216
Slovenia 0.520 0.729 0.636 0.719 3.065 2.879 3.197 3.176
Sweden 0.488 0.731 0.665 0.677 2.935 3.054 3.231 2.989
Chinese Taipei 0.562 0.866 0.692 0.774 3.025 3.199 3.139 3.236
Turkey 0.533 0.887 0.684 0.769 3.177 3.348 3.317 3.390
United Arab Emirates 0.435 0.885 0.725 0.690 3.298 3.703 3.721 3.532
Viet Nam 0.491 0.772 0.616 0.723 3.014 3.243 3.118 3.192
TALIS-PISA link
Australia 0.526 0.777 0.724 0.715 2.950 3.191 3.400 3.172
Ciudad Autónoma de Buenos Aires (Argentina)
0.389 0.692 0.614 0.729 2.776 3.123 3.265 3.478
Colombia 0.444 0.763 0.672 0.703 3.005 3.360 3.491 3.444
Czech Republic 0.494 0.805 0.645 0.725 3.175 3.336 3.152 3.120
Denmark 0.480 0.627 0.583 0.641 2.921 2.750 3.114 3.009
Georgia 0.523 0.825 0.645 0.760 3.450 3.606 3.487 3.596
Malta 0.481 0.859 0.693 0.697 3.001 3.199 3.286 3.233
Turkey 0.539 0.854 0.683 0.760 3.194 3.324 3.335 3.425
Viet Nam 0.536 0.841 0.663 0.799 3.028 3.284 3.124 3.229
1. Data from the participating country/economy were rated as insufficient during the adjudication process.
2. Participating country/economy with late data collection.
Source: OECD, TALIS 2018 database.

247
TALIS 2018 TECHNICAL REPORT © OECD 2019
Table 11.30. Standardised factor loadings and unstandardised intercepts for
scale T3COGAC
Participating countries/economies
Standardised factor loadings Unstandardised intercepts
TT3G42E TT3G42F TT3G42G TT3G42H TT3G42E TT3G42F TT3G42G TT3G42H
ISCED level 2
Alberta (Canada) 0.556 0.789 0.501 0.586 2.144 2.927 2.612 2.566
Australia 0.558 0.785 0.469 0.562 2.071 2.786 2.520 2.410
Austria 0.508 0.623 0.418 0.458 1.711 2.475 2.401 2.275
Belgium 0.583 0.676 0.434 0.523 2.147 2.399 2.204 2.008
Flemish Community (Belgium)
0.610 0.732 0.496 0.575 1.960 2.336 2.344 2.054
Brazil 0.437 0.737 0.445 0.443 2.343 3.089 2.601 2.261
Bulgaria 0.481 0.645 0.460 0.507 1.828 2.685 2.499 2.556
Ciudad Autónoma de Buenos Aires (Argentina)
0.558 0.785 0.510 0.541 2.638 3.066 2.803 2.617
Chile 0.571 0.753 0.505 0.580 2.624 2.889 2.929 2.831
Colombia 0.547 0.789 0.552 0.559 2.744 3.221 3.118 2.807
Croatia 0.473 0.678 0.455 0.504 2.104 2.659 2.280 2.021
Cyprus 0.472 0.749 0.424 0.495 1.985 2.883 2.543 2.414
Czech Republic 0.501 0.607 0.416 0.430 1.672 2.378 2.191 2.235
Denmark 0.671 0.759 0.538 0.552 2.501 2.635 2.889 2.506
England (United Kingdom) 0.589 0.746 0.449 0.549 2.202 2.775 2.519 2.399
Estonia 0.497 0.685 0.464 0.520 1.755 2.458 2.367 2.191
Finland 0.668 0.799 0.467 0.601 2.233 2.320 2.403 2.093
France 0.493 0.618 0.371 0.463 2.012 2.535 2.479 2.052
Georgia 0.545 0.804 0.522 0.605 2.405 2.911 2.696 2.788
Hungary 0.524 0.694 0.488 0.509 2.119 2.607 2.331 2.300
Iceland 0.536 0.712 0.428 0.552 1.857 2.512 2.399 2.529
Israel 0.663 0.802 0.554 0.639 2.196 2.539 2.314 2.293
Italy 0.568 0.711 0.485 0.530 2.363 2.771 2.434 2.358
Japan 0.613 0.733 0.389 0.510 1.731 1.738 2.405 2.044
Kazakhstan 0.601 0.806 0.583 0.644 2.724 3.031 3.043 2.946
Korea 0.736 0.865 0.568 0.653 2.268 2.454 2.712 2.538
Latvia 0.503 0.770 0.510 0.533 2.674 2.853 2.475 2.473
Lithuania 0.453 0.683 0.405 0.493 1.693 2.858 2.532 2.758
Malta 0.572 0.820 0.483 0.592 2.096 2.674 2.383 2.347
Mexico 0.482 0.652 0.455 0.491 2.195 2.796 2.862 2.812
Netherlands 0.644 0.843 0.442 0.558 2.317 2.566 2.434 2.305
New Zealand 0.520 0.725 0.448 0.523 2.050 2.791 2.631 2.502
Norway 0.651 0.750 0.470 0.528 2.549 2.524 2.661 2.543
Portugal 0.657 0.748 0.434 0.552 2.758 2.778 2.545 2.424
Romania 0.528 0.743 0.531 0.551 1.869 2.815 2.582 2.409
Russian Federation 0.618 0.811 0.541 0.596 2.604 2.665 2.421 2.438
Saudi Arabia 0.651 0.888 0.571 0.666 2.434 2.845 3.082 2.755
Shanghai (China) 0.626 0.864 0.635 0.707 2.391 2.663 2.891 2.843
Singapore 0.651 0.853 0.548 0.625 2.224 2.618 2.473 2.283
Slovak Republic 0.522 0.738 0.496 0.531 2.138 2.624 2.379 2.503
Slovenia 0.490 0.691 0.455 0.519 2.172 2.647 2.181 2.151
South Africa2 0.500 0.807 0.444 0.511 2.481 3.065 2.617 2.601
Spain 0.586 0.773 0.471 0.523 2.373 2.758 2.436 2.326
Sweden 0.516 0.619 0.398 0.472 2.012 2.499 2.478 2.416
Chinese Taipei 0.652 0.815 0.505 0.620 2.296 2.546 2.395 2.341

248
TALIS 2018 TECHNICAL REPORT © OECD 2019
Participating countries/economies
Standardised factor loadings Unstandardised intercepts
TT3G42E TT3G42F TT3G42G TT3G42H TT3G42E TT3G42F TT3G42G TT3G42H
Turkey 0.599 0.804 0.575 0.664 1.869 2.652 2.471 2.643
United Arab Emirates 0.536 0.850 0.592 0.634 2.425 3.142 3.211 2.936
United States 0.524 0.783 0.436 0.534 2.021 2.947 2.633 2.436
Viet Nam 0.646 0.716 0.546 0.613 2.855 2.368 2.821 2.639
ISCED level 1
Australia1 0.598 0.810 0.522 0.595 2.193 2.701 2.680 2.516
Flemish Community (Belgium)
0.644 0.763 0.515 0.580 2.081 2.383 2.652 2.425
Ciudad Autónoma de Buenos Aires (Argentina)
0.562 0.785 0.518 0.572 2.616 3.107 2.885 2.934
Denmark 0.668 0.773 0.512 0.552 2.301 2.294 2.561 2.256
England (United Kingdom) 0.627 0.805 0.539 0.591 2.391 2.756 2.755 2.622
France 0.622 0.691 0.442 0.505 2.003 2.187 2.493 2.388
Japan 0.622 0.752 0.438 0.523 1.742 1.745 2.582 2.310
Korea 0.722 0.876 0.613 0.662 2.325 2.522 2.956 2.605
Netherlands1 0.641 0.751 0.507 0.556 2.293 2.592 2.748 2.598
Spain 0.594 0.786 0.499 0.563 2.396 2.753 2.710 2.581
Sweden 0.555 0.660 0.424 0.463 1.996 2.291 2.479 2.332
Chinese Taipei 0.646 0.814 0.532 0.621 2.370 2.599 2.625 2.452
Turkey 0.600 0.858 0.602 0.690 1.869 2.652 2.471 2.643
United Arab Emirates 0.546 0.866 0.623 0.652 2.425 3.142 3.211 2.936
Viet Nam 0.517 0.591 0.508 0.529 2.734 2.345 3.047 2.765
ISCED level 3
Alberta (Canada) 0.505 0.739 0.409 0.519 2.144 2.927 2.612 2.566
Brazil 0.436 0.716 0.423 0.436 2.343 3.089 2.601 2.261
Croatia 0.506 0.723 0.481 0.545 2.104 2.659 2.280 2.021
Denmark 0.584 0.673 0.503 0.510 2.439 2.627 2.929 2.416
Portugal 0.664 0.757 0.428 0.543 2.758 2.778 2.545 2.424
Slovenia 0.504 0.716 0.449 0.523 2.172 2.647 2.181 2.151
Sweden 0.483 0.617 0.420 0.455 2.029 2.652 2.522 2.411
Chinese Taipei 0.641 0.794 0.523 0.624 2.289 2.531 2.387 2.370
Turkey 0.629 0.819 0.562 0.672 1.869 2.652 2.471 2.643
United Arab Emirates 0.527 0.845 0.584 0.620 2.425 3.142 3.211 2.936
Viet Nam 0.604 0.690 0.532 0.596 2.902 2.480 2.743 2.659
TALIS-PISA link
Australia 0.562 0.793 0.479 0.559 2.100 2.818 2.479 2.408
Ciudad Autónoma de Buenos Aires (Argentina)
0.530 0.713 0.464 0.512 2.597 3.082 2.816 2.643
Colombia 0.497 0.753 0.498 0.506 2.697 3.222 3.094 2.781
Czech Republic 0.510 0.640 0.406 0.433 1.675 2.360 2.177 2.275
Denmark 0.627 0.705 0.537 0.530 2.539 2.690 2.916 2.587
Georgia 0.522 0.803 0.534 0.593 2.475 2.977 2.754 2.814
Malta 0.599 0.804 0.486 0.616 2.061 2.709 2.339 2.381
Turkey 0.616 0.792 0.552 0.657 1.799 2.548 2.335 2.533
Viet Nam 0.643 0.719 0.545 0.656 2.924 2.382 2.820 2.646
1. Data from the participating country/economy were rated as insufficient during the adjudication process.
2. Participating country/economy with late data collection.
Source: OECD, TALIS 2018 database.

249
TALIS 2018 TECHNICAL REPORT © OECD 2019
Table 11.31. Standardised factor loadings and unstandardised intercepts for
scale T3CLASM
Participating countries/economies
Standardised factor loadings Unstandardised intercepts
TT3G42I TT3G42J TT3G42K TT3G42L TT3G42I TT3G42J TT3G42K TT3G42L
ISCED level 2
Alberta (Canada) 0.872 0.870 0.729 0.682 2.694 2.614 2.724 2.716
Australia 0.851 0.873 0.674 0.616 2.726 2.749 2.715 2.886
Austria 0.818 0.902 0.789 0.639 2.775 2.835 2.769 2.744
Belgium 0.857 0.902 0.702 0.554 3.160 3.153 3.203 3.278
Flemish Community (Belgium) 0.876 0.907 0.722 0.646 3.185 3.169 3.274 3.358
Brazil 0.635 0.867 0.663 0.596 3.362 3.434 3.251 3.065
Bulgaria 0.833 0.864 0.698 0.618 3.304 3.217 3.038 2.908
Ciudad Autónoma de Buenos Aires (Argentina)
0.809 0.884 0.714 0.625 3.319 3.237 3.086 2.935
Chile 0.728 0.921 0.732 0.632 3.483 3.446 3.380 3.125
Colombia 0.717 0.893 0.723 0.642 3.368 3.336 3.319 3.004
Croatia 0.804 0.930 0.723 0.632 2.624 2.599 2.448 2.117
Cyprus 0.853 0.890 0.684 0.576 3.359 3.322 3.301 3.101
Czech Republic 0.742 0.905 0.689 0.583 2.552 2.635 2.492 2.221
Denmark 0.852 0.952 0.782 0.701 2.642 2.721 2.820 2.873
England (United Kingdom) 0.849 0.910 0.702 0.692 2.990 3.000 2.852 3.148
Estonia 0.852 0.916 0.661 0.650 2.394 2.259 2.307 1.902
Finland 0.878 0.931 0.759 0.689 2.744 2.876 2.752 2.818
France 0.849 0.911 0.703 0.639 3.206 3.167 3.047 2.980
Georgia 0.669 0.930 0.695 0.679 2.761 2.363 2.316 2.260
Hungary 0.606 0.882 0.716 0.707 3.427 3.138 3.087 2.909
Iceland 0.729 0.928 0.694 0.569 2.878 3.104 3.019 2.579
Israel 0.761 0.925 0.727 0.647 3.433 3.365 3.216 3.020
Italy 0.759 0.899 0.698 0.561 3.207 3.098 2.927 2.548
Japan 0.849 0.913 0.708 0.641 2.895 2.904 2.471 2.266
Kazakhstan 0.802 0.881 0.736 0.606 2.839 2.771 2.403 2.392
Korea 0.779 0.918 0.749 0.641 3.069 3.124 2.996 2.876
Latvia 0.615 0.889 0.414 0.410 3.543 3.525 2.600 2.822
Lithuania 0.850 0.909 0.717 0.632 3.048 2.938 2.755 2.288
Malta 0.812 0.845 0.742 0.686 3.129 3.117 2.966 3.123
Mexico 0.596 0.828 0.654 0.584 3.257 3.381 3.301 2.896
Netherlands 0.846 0.894 0.712 0.533 3.285 3.405 3.197 3.162
New Zealand 0.798 0.866 0.659 0.632 2.716 2.683 2.740 2.781
Norway 0.808 0.907 0.729 0.712 2.584 2.705 2.795 2.873
Portugal 0.894 0.879 0.541 0.125 3.740 3.744 3.389 3.113
Romania 0.757 0.915 0.667 0.566 3.483 3.409 3.218 2.879
Russian Federation 0.893 0.893 0.769 0.688 2.513 2.503 2.133 2.032
Saudi Arabia 0.679 0.888 0.724 0.714 3.447 3.495 3.439 3.347
Shanghai (China) 0.822 0.858 0.817 0.722 2.933 2.637 2.702 2.817
Singapore 0.805 0.845 0.665 0.659 3.040 2.997 2.797 3.089
Slovak Republic 0.844 0.936 0.744 0.645 3.088 3.045 2.943 2.721
Slovenia 0.792 0.898 0.651 0.678 2.786 2.814 2.940 2.482
South Africa2 0.763 0.899 0.675 0.525 3.427 3.449 3.378 3.385
Spain 0.846 0.909 0.707 0.599 3.337 3.348 3.229 2.992
Sweden 0.859 0.932 0.779 0.650 2.816 2.969 2.812 2.751
Chinese Taipei 0.866 0.922 0.709 0.659 3.272 3.230 2.959 3.062
Turkey 0.830 0.890 0.700 0.605 3.254 3.349 3.122 2.873

250
TALIS 2018 TECHNICAL REPORT © OECD 2019
Participating countries/economies
Standardised factor loadings Unstandardised intercepts
TT3G42I TT3G42J TT3G42K TT3G42L TT3G42I TT3G42J TT3G42K TT3G42L
United Arab Emirates 0.841 0.879 0.695 0.683 3.506 3.382 3.319 3.326
United States 0.864 0.872 0.686 0.651 2.842 2.736 2.728 2.763
Viet Nam 0.743 0.704 0.613 0.557 3.253 2.644 2.879 3.027
ISCED level 1
Australia1 0.860 0.891 0.682 0.663 2.916 2.838 2.883 2.851
Flemish Community (Belgium) 0.837 0.896 0.691 0.609 3.185 3.169 3.274 3.358
Ciudad Autónoma de Buenos Aires (Argentina)
0.818 0.830 0.680 0.558 3.623 3.492 3.481 3.223
Denmark 0.859 0.950 0.818 0.703 3.092 3.141 3.206 3.245
England (United Kingdom) 0.848 0.913 0.687 0.676 3.112 3.054 2.869 3.042
France 0.823 0.886 0.673 0.574 3.323 3.220 3.108 2.805
Japan 0.859 0.921 0.696 0.612 3.216 3.134 2.751 2.470
Korea 0.832 0.936 0.756 0.636 3.271 3.288 3.196 2.955
Netherlands1 0.869 0.907 0.663 0.621 3.574 3.571 3.316 3.467
Spain 0.861 0.907 0.694 0.574 3.337 3.348 3.229 2.992
Sweden 0.829 0.921 0.753 0.634 2.816 2.969 2.812 2.751
Chinese Taipei 0.854 0.912 0.679 0.630 3.272 3.230 2.959 3.062
Turkey 0.834 0.875 0.703 0.615 3.254 3.349 3.122 2.873
United Arab Emirates 0.830 0.843 0.689 0.663 3.506 3.382 3.319 3.326
Viet Nam 0.675 0.584 0.526 0.522 3.253 2.644 2.879 3.027
ISCED level 3
Alberta (Canada) 0.878 0.897 0.672 0.657 2.694 2.614 2.724 2.716
Brazil 0.662 0.861 0.689 0.638 3.362 3.434 3.251 3.065
Croatia 0.788 0.930 0.734 0.647 2.624 2.599 2.448 2.117
Denmark 0.818 0.938 0.767 0.690 2.237 2.347 2.474 2.410
Portugal 0.868 0.882 0.522 0.151 3.599 3.651 3.066 3.226
Slovenia 0.766 0.889 0.620 0.664 2.786 2.814 2.940 2.482
Sweden 0.804 0.905 0.748 0.645 2.816 2.969 2.812 2.751
Chinese Taipei 0.865 0.930 0.726 0.697 3.272 3.230 2.959 3.062
Turkey 0.827 0.873 0.727 0.632 3.254 3.349 3.122 2.873
United Arab Emirates 0.837 0.880 0.707 0.688 3.506 3.382 3.319 3.326
Viet Nam 0.709 0.706 0.577 0.558 3.253 2.644 2.879 3.027
TALIS-PISA link
Australia 0.842 0.894 0.675 0.639 2.701 2.716 2.719 2.897
Ciudad Autónoma de Buenos Aires (Argentina)
0.808 0.916 0.709 0.608 3.281 3.185 3.007 2.888
Colombia 0.724 0.870 0.743 0.629 3.392 3.368 3.305 2.997
Czech Republic 0.742 0.903 0.713 0.599 2.470 2.568 2.439 2.206
Denmark 0.827 0.961 0.769 0.683 2.490 2.549 2.645 2.717
Georgia 0.725 0.914 0.747 0.762 2.634 2.276 2.194 2.190
Malta 0.770 0.913 0.690 0.681 2.928 2.945 2.824 2.932
Turkey 0.839 0.836 0.731 0.664 3.058 3.183 2.956 2.725
Viet Nam 0.816 0.560 0.753 0.728 3.172 2.519 2.776 2.966
1. Data from the participating country/economy were rated as insufficient during the adjudication process.
2. Participating country/economy with late data collection.
Source: OECD, TALIS 2018 database.

251
TALIS 2018 TECHNICAL REPORT © OECD 2019
Professional practices: Teacher co-operation, composite (T3COOP); Exchange
and co-ordination among teachers (T3EXCH); Professional collaboration in
lessons among teachers (T3COLES)
11.12. Measured items
Table 11.32 presents two subscales and one composite scale developed from the question
stem:
“On average, how often do you do the following in this school?” (TT3G33), which
was followed by items regarding interactions with other teachers. These items
formed the subscale Exchange and co-ordination among teachers (T3EXCH),
while items concerning collaboration with other teachers formed the subscale
Professional collaboration in lessons among teachers (T3COLES).
These two subscales formed the multidimensional scale Teacher co-operation, composite
(T3COOP).
11.13. Scale reliability
Table 11.33 presents the reliability coefficients (omega for the subscales and stratified
Cronbach’s alpha for T3COOP) for all populations for each scale. The reliabilities for
T3EXCH are generally high (above 0.700), while they are acceptable for T3COLES, that
is, mostly above 0.600. The reliabilities for the composite scale T3COOP are also high in
all populations. Of note, the coefficients for T3EXCH are slightly lower for the Estonia,
France, Netherlands and Viet Nam ISCED level 2 populations, and for the Denmark and
Viet Nam ISCED level 1 populations. In contrast, the omega values for T3COLES are
lower in considerably more populations.
11.14. Model fits
The subscale T3EXCH performed well for nearly all populations for a majority of the fit
indices, with the exception of the Korea ISCED level 1 population, as presented in Table
11.34. Most of the fit indices of subscale T3COLES also performed well for a majority of
populations, with the exception of the ISCED level 2 populations in Italy and Shanghai
(China), the ISCED level 1 populations of the Netherlands and Viet Nam, and the TALIS-
PISA link populations in Denmark and Viet Nam, as presented in Table 11.35.
11.15. Invariance testing
The results from the measurement invariance testing for the subscale T3EXCH appear in
Table 11.36 and show that this subscale reached only configural invariance for all ISCED
levels. Table 11.37 presents the results for the subscale T3COLES, which reached the
metric invariance level for all ISCED populations. Because of the invariance results for the
subscales, the composite scale T3COOP was considered configural invariant for all ISCED
levels.
11.16. Item parameters
Table 11.38 presents the unstandardised factor loadings for the subscale T3COLES, as it
was the only subscale to reach metric invariance.
The standardised factor loadings and unstandardised intercepts for the subscales T3EXCH
and T3COLES are set out in Tables 11.39 and 11.40 respectively. The factor loadings for

252
TALIS 2018 TECHNICAL REPORT © OECD 2019
items TT3G33D, TT3G33E and TT3G33F of subscale T3EXCH are mostly above 0.600,
but this is not the case for item TT3G33G, where most of the factor loadings are below
0.600 but still above 0.450. Although most factor loadings for subscale T3COLES are only
moderate, they are still above the cut-off criterion for all items.
Table 11.32. Item wording for professional practices scale
T3COOP: Teacher co-operation, composite
T3EXCH: Exchange and co-ordination among teachers (subscale)
TT3G33: On average, how often do you do the following in this school?
Response options: “Never” (1), “Once a year or less” (2), “2-4 times a year” (3), “5-10 times a year” (4), “1-3 times a month” (5), “Once a week or more” (6)
TT3G33D Exchange or develop teaching materials with colleagues
TT3G33E Discuss the learning development of specific students
TT3G33F Work with other teachers in this school to ensure common standards in evaluations for assessing student progress
TT3G33G Attend team conferences
T3COLES: Professional collaboration in lessons among teachers (subscale)
TT3G33: On average, how often do you do the following in this school?
Response options: “Never” (1), “Once a year or less” (2), “2-4 times a year” (3), “5-10 times a year” (4), “1-3 times a month” (5), “Once a week or more” (6)
TT3G33A Teach jointly as a team in the same class
TT3G33B Provide feedback to other teachers about their practice
TT3G33C Engage in joint activities across different classes and age groups (e.g. projects)
TT3G33H Participate in collaborative professional learning
Source: OECD, TALIS 2018 database.
Table 11.33. Reliability coefficients for professional practices scales
Participating countries/economies T3EXCH T3COLES T3COOP
Omega coefficient3 Stratified Cronbach’s alpha
ISCED level 2
Alberta (Canada) 0.771 0.637 0.805
Australia 0.734 0.661 0.786
Austria 0.785 0.638 0.817
Belgium 0.714 0.593 0.770
Flemish Community (Belgium) 0.714 0.642 0.782
Brazil 0.843 0.738 0.862
Bulgaria 0.778 0.570 0.775
Ciudad Autónoma de Buenos Aires (Argentina) 0.815 0.716 0.842
Chile 0.787 0.669 0.823
Colombia 0.794 0.729 0.846
Croatia 0.801 0.621 0.821
Cyprus 0.824 0.736 0.836
Czech Republic 0.792 0.650 0.810
Denmark 0.745 0.638 0.792
England (United Kingdom) 0.724 0.615 0.768
Estonia 0.699 0.663 0.780
Finland 0.745 0.661 0.802
France 0.684 0.594 0.768
Georgia 0.789 0.740 0.853
Hungary 0.760 0.687 0.828
Iceland 0.748 0.621 0.787

253
TALIS 2018 TECHNICAL REPORT © OECD 2019
Participating countries/economies T3EXCH T3COLES T3COOP
Omega coefficient3 Stratified Cronbach’s alpha
Israel 0.832 0.612 0.813
Italy 0.745 0.635 0.796
Japan 0.736 0.651 0.796
Kazakhstan 0.778 0.672 0.822
Korea 0.806 0.759 0.862
Latvia 0.743 0.699 0.816
Lithuania 0.771 0.692 0.825
Malta 0.787 0.712 0.821
Mexico 0.778 0.643 0.814
Netherlands 0.691 0.687 0.783
New Zealand 0.733 0.653 0.789
Norway 0.721 0.563 0.739
Portugal 0.787 0.587 0.788
Romania 0.824 0.697 0.843
Russian Federation 0.781 0.701 0.829
Saudi Arabia 0.867 0.769 0.885
Shanghai (China) 0.850 0.712 0.870
Singapore 0.799 0.585 0.790
Slovak Republic 0.810 0.560 0.807
Slovenia 0.783 0.543 0.784
South Africa2 0.839 0.692 0.829
Spain 0.726 0.634 0.760
Sweden 0.731 0.560 0.761
Chinese Taipei 0.796 0.755 0.852
Turkey 0.872 0.766 0.875
United Arab Emirates 0.837 0.771 0.867
United States 0.767 0.638 0.796
Viet Nam 0.686 0.513 0.759
ISCED level 1
Australia1 0.799 0.585 0.794
Flemish Community (Belgium) 0.714 0.591 0.774
Ciudad Autónoma de Buenos Aires (Argentina) 0.799 0.736 0.844
Denmark 0.687 0.576 0.745
England (United Kingdom) 0.738 0.599 0.762
France 0.740 0.539 0.772
Japan 0.753 0.608 0.790
Korea 0.759 0.704 0.818
Netherlands1 0.746 0.721 0.814
Spain 0.743 0.642 0.764
Sweden 0.766 0.573 0.785
Chinese Taipei 0.828 0.762 0.868
Turkey 0.863 0.787 0.886
United Arab Emirates 0.843 0.752 0.858
Viet Nam 0.664 0.449 0.742
ISCED level 3
Alberta (Canada) 0.766 0.656 0.802
Brazil 0.843 0.740 0.866
Croatia 0.834 0.656 0.842
Denmark 0.717 0.621 0.782
Portugal 0.799 0.613 0.804
Slovenia 0.790 0.521 0.799

254
TALIS 2018 TECHNICAL REPORT © OECD 2019
Participating countries/economies T3EXCH T3COLES T3COOP
Omega coefficient3 Stratified Cronbach’s alpha
Sweden 0.709 0.591 0.759
Chinese Taipei 0.821 0.745 0.858
Turkey 0.870 0.745 0.871
United Arab Emirates 0.843 0.760 0.863
Viet Nam 0.733 0.576 0.796
TALIS-PISA link
Australia 0.771 0.653 0.796
Ciudad Autónoma de Buenos Aires (Argentina) 0.850 0.593 0.807
Colombia 0.787 0.602 0.796
Czech Republic 0.797 0.707 0.824
Denmark 0.734 0.650 0.784
Georgia 0.723 0.651 0.801
Malta 0.799 0.741 0.834
Turkey 0.869 0.651 0.836
Viet Nam 0.712 0.691 0.807
1. Data from the participating country/economy were rated as insufficient during the adjudication process.
2. Participating country/economy with late data collection.
3. Omega coefficient was calculated based on unidimensional models for every single subscale of the
multidimensional construct.
Source: OECD, TALIS 2018 database.
Table 11.34. CFA model-data fit for scale T3EXCH
Exchange and co-operation among teachers
Participating countries/economies CFI TLI RMSEA SRMR
ISCED level 2
Alberta (Canada) 1.000 1.005 0.000 0.008
Australia 0.968 0.903 0.077 0.024
Austria 0.978 0.935 0.069 0.020
Belgium 0.991 0.974 0.040 0.013
Flemish Community (Belgium) 0.999 0.998 0.010 0.008
Brazil 0.990 0.969 0.059 0.017
Bulgaria 0.999 0.997 0.014 0.007
Ciudad Autónoma de Buenos Aires (Argentina) 0.990 0.969 0.053 0.015
Chile 0.997 0.992 0.026 0.011
Colombia 0.988 0.963 0.048 0.018
Croatia 0.992 0.977 0.047 0.015
Cyprus 0.995 0.984 0.036 0.016
Czech Republic 0.999 0.996 0.020 0.008
Denmark 1.000 1.000 0.005 0.007
England (United Kingdom) 0.956 0.869 0.100 0.029
Estonia 0.997 0.990 0.023 0.009
Finland 0.992 0.977 0.042 0.015
France 0.965 0.896 0.091 0.024
Georgia 0.993 0.980 0.039 0.014
Hungary 1.000 1.002 0.000 0.004
Iceland 0.999 0.997 0.018 0.009
Israel 0.991 0.973 0.052 0.014
Italy 0.999 0.996 0.017 0.007
Japan 0.988 0.965 0.054 0.016

255
TALIS 2018 TECHNICAL REPORT © OECD 2019
Participating countries/economies CFI TLI RMSEA SRMR
Kazakhstan 0.972 0.916 0.065 0.022
Korea 0.994 0.981 0.042 0.014
Latvia 0.970 0.909 0.079 0.025
Lithuania 0.991 0.974 0.039 0.013
Malta 0.998 0.995 0.022 0.008
Mexico 0.993 0.979 0.038 0.014
Netherlands 0.970 0.911 0.069 0.024
New Zealand 0.998 0.993 0.020 0.009
Norway 0.997 0.991 0.021 0.011
Portugal 1.000 1.000 0.000 0.004
Romania 0.991 0.972 0.049 0.016
Russian Federation 0.975 0.925 0.062 0.024
Saudi Arabia 0.972 0.916 0.100 0.026
Shanghai (China) 0.998 0.993 0.030 0.010
Singapore 0.996 0.989 0.030 0.011
Slovak Republic 0.998 0.993 0.027 0.010
Slovenia 0.998 0.994 0.025 0.008
South Africa2 0.998 0.994 0.021 0.011
Spain 0.965 0.896 0.044 0.018
Sweden 0.998 0.995 0.016 0.010
Chinese Taipei 1.000 1.002 0.000 0.003
Turkey 0.996 0.988 0.036 0.010
United Arab Emirates 0.953 0.858 0.097 0.031
United States 0.998 0.995 0.011 0.012
Viet Nam 0.998 0.993 0.016 0.009
ISCED level 1
Australia1 0.987 0.960 0.054 0.017
Flemish Community (Belgium) 1.000 1.000 0.000 0.006
Ciudad Autónoma de Buenos Aires (Argentina) 1.000 0.999 0.010 0.007
Denmark 0.983 0.948 0.050 0.020
England (United Kingdom) 0.950 0.849 0.089 0.028
France 0.993 0.979 0.033 0.012
Japan 1.000 1.003 0.000 0.002
Korea 0.841 0.522 0.222 0.057
Netherlands1 0.991 0.973 0.047 0.015
Spain 0.991 0.972 0.023 0.018
Sweden 0.994 0.983 0.033 0.012
Chinese Taipei 0.999 0.996 0.024 0.007
Turkey 0.998 0.994 0.020 0.009
United Arab Emirates 0.983 0.949 0.061 0.017
Viet Nam 0.995 0.984 0.032 0.011
ISCED level 3
Alberta (Canada) 0.943 0.830 0.122 0.036
Brazil 0.988 0.964 0.054 0.014
Croatia 0.996 0.989 0.039 0.012
Denmark 0.970 0.911 0.079 0.025
Portugal 0.998 0.994 0.024 0.008
Slovenia 0.998 0.994 0.025 0.009
Chinese Taipei 0.998 0.995 0.022 0.008
Turkey 0.997 0.990 0.023 0.011
United Arab Emirates 0.978 0.933 0.070 0.023
Viet Nam 0.999 0.997 0.018 0.007

256
TALIS 2018 TECHNICAL REPORT © OECD 2019
Participating countries/economies CFI TLI RMSEA SRMR
TALIS-PISA link
Australia 0.964 0.891 0.097 0.026
Ciudad Autónoma de Buenos Aires (Argentina) 1.000 1.002 0.000 0.007
Colombia 0.992 0.976 0.036 0.014
Czech Republic 0.988 0.965 0.040 0.014
Denmark 1.000 1.018 0.000 0.008
Georgia 0.984 0.952 0.035 0.024
Malta 1.000 1.004 0.000 0.007
Turkey 0.990 0.969 0.033 0.013
Viet Nam 1.000 1.007 0.000 0.007
1. Data from the participating country/economy were rated as insufficient during the adjudication process.
2. Participating country/economy with late data collection.
Source: OECD, TALIS 2018 database.
Table 11.35. CFA model-data fit for scale T3COLES
Professional collaboration in lessons among teachers
Participating countries/economies CFI TLI RMSEA SRMR
ISCED level 2
Alberta (Canada) 0.970 0.911 0.051 0.028
Australia 0.985 0.955 0.044 0.014
Austria 0.989 0.966 0.040 0.015
Belgium 0.987 0.962 0.036 0.015
Flemish Community (Belgium) 0.984 0.953 0.048 0.019
Brazil 0.996 0.989 0.030 0.010
Bulgaria 0.969 0.907 0.048 0.023
Ciudad Autónoma de Buenos Aires (Argentina) 0.946 0.837 0.085 0.022
Chile 1.000 1.004 0.000 0.005
Colombia 0.998 0.994 0.016 0.011
Croatia 0.967 0.901 0.043 0.022
Cyprus 0.972 0.915 0.086 0.027
Czech Republic 0.958 0.873 0.083 0.025
Denmark 0.998 0.995 0.017 0.009
England (United Kingdom) 0.971 0.912 0.057 0.021
Estonia 1.000 0.999 0.007 0.007
Finland 0.962 0.886 0.080 0.022
France 1.000 1.004 0.000 0.005
Georgia 1.000 0.999 0.010 0.007
Hungary 1.000 1.003 0.000 0.004
Iceland 0.993 0.979 0.034 0.012
Israel 0.972 0.915 0.051 0.022
Italy 0.875 0.625 0.163 0.042
Japan 1.000 1.003 0.000 0.004
Kazakhstan 0.996 0.989 0.021 0.011
Korea 0.994 0.983 0.038 0.010
Latvia 0.982 0.946 0.043 0.016
Lithuania 0.967 0.901 0.064 0.025
Malta 0.978 0.935 0.059 0.021
Mexico 0.982 0.946 0.051 0.017
Netherlands 1.000 1.000 0.000 0.009
New Zealand 0.990 0.971 0.032 0.019

257
TALIS 2018 TECHNICAL REPORT © OECD 2019
Participating countries/economies CFI TLI RMSEA SRMR
Norway 0.989 0.968 0.026 0.013
Portugal 0.946 0.837 0.083 0.028
Romania 0.998 0.995 0.015 0.008
Russian Federation 0.991 0.972 0.033 0.013
Saudi Arabia 0.972 0.916 0.073 0.027
Shanghai (China) 0.763 0.288 0.269 0.045
Singapore 0.992 0.975 0.031 0.011
Slovak Republic 0.972 0.917 0.051 0.020
Slovenia 0.996 0.988 0.022 0.010
South Africa2 0.978 0.978 0.029 0.043
Spain 0.890 0.670 0.096 0.035
Sweden 0.987 0.961 0.033 0.016
Chinese Taipei 0.953 0.859 0.093 0.026
Turkey 1.000 1.000 0.002 0.005
United Arab Emirates 0.999 0.997 0.015 0.006
United States 1.000 1.000 0.000 0.016
Viet Nam 0.941 0.823 0.053 0.023
ISCED level 1
Australia1 0.920 0.920 0.064 0.071
Flemish Community (Belgium) 0.990 0.969 0.037 0.014
Ciudad Autónoma de Buenos Aires (Argentina) 1.000 1.006 0.000 0.002
Denmark 0.999 0.997 0.012 0.009
England (United Kingdom) 0.989 0.966 0.032 0.016
France 1.000 1.002 0.000 0.012
Japan 0.989 0.968 0.035 0.013
Korea 1.000 1.005 0.000 0.003
Netherlands1 0.418 0.418 0.119 0.225
Spain 0.992 0.976 0.029 0.012
Sweden 0.955 0.865 0.078 0.026
Chinese Taipei 0.982 0.946 0.066 0.019
Turkey 0.999 0.998 0.009 0.007
United Arab Emirates 0.993 0.978 0.039 0.013
Viet Nam3 0.514 - 0.229 0.041
ISCED level 3
Alberta (Canada) 1.000 1.011 0.000 0.006
Brazil 0.992 0.976 0.035 0.013
Croatia 0.980 0.940 0.049 0.024
Denmark 0.992 0.975 0.029 0.015
Portugal 0.932 0.795 0.091 0.030
Slovenia 0.986 0.957 0.034 0.015
Sweden 0.997 0.990 0.016 0.010
Chinese Taipei 0.953 0.858 0.092 0.028
Turkey 0.989 0.966 0.033 0.013
United Arab Emirates 0.996 0.988 0.026 0.010
Viet Nam 0.986 0.959 0.034 0.015
TALIS-PISA link
Australia 0.954 0.954 0.055 0.057
Ciudad Autónoma de Buenos Aires (Argentina) 0.885 0.885 0.062 0.114
Colombia 0.881 0.881 0.071 0.129
Czech Republic 0.918 0.918 0.049 0.087
Denmark 0.865 0.865 0.087 0.106
Georgia 0.964 0.964 0.024 0.084

258
TALIS 2018 TECHNICAL REPORT © OECD 2019
Participating countries/economies CFI TLI RMSEA SRMR
Malta 0.980 0.980 0.034 0.048
Turkey 0.939 0.939 0.042 0.101
Viet Nam 0.539 0.539 0.082 0.235
1. Data from the participating country/economy were rated as insufficient during the adjudication process.
2. Participating country/economy with late data collection.
3. The poor fit of the model affected the TLI calculation, which is not reported.
Source: OECD, TALIS 2018 database.
Table 11.36. Invariance test results for scale T3EXCH
CFI TLI RMSEA SRMR Δ CFI Δ TLI Δ RMSEA Δ SRMR
Invariance level of ISCED level 2
Configural 0.988 0.964 0.050 0.017
Metric 0.956 0.947 0.061 0.074 0.032 0.017 -0.011 -0.057
Scalar 0.415 0.554 0.177 0.348 0.541 0.393 -0.116 -0.274
Invariance level of ISCED level 1
Configural 0.984 0.952 0.052 0.020
Metric 0.944 0.930 0.063 0.083 0.040 0.022 -0.011 -0.063
Scalar 0.390 0.514 0.167 0.297 0.554 0.416 -0.104 -0.214
Invariance level of ISCED level 3
Configural 0.992 0.976 0.046 0.015
Metric 0.966 0.957 0.062 0.070 0.026 0.019 -0.016 -0.055
Scalar 0.497 0.595 0.189 0.388 0.469 0.362 -0.127 -0.318
Note: See endnote 34.
Source: OECD, TALIS 2018 database.
Table 11.37. Invariance test results for scale T3COLES
CFI TLI RMSEA SRMR Δ CFI Δ TLI Δ RMSEA Δ SRMR
Invariance level of ISCED level 2
Configural 0.980 0.939 0.052 0.020
Metric 0.935 0.921 0.059 0.055 0.045 0.018 -0.007 -0.035
Scalar 0.000 0.232 0.185 0.271 0.935 0.689 -0.126 -0.216
Invariance level of ISCED level 1
Configural 0.987 0.962 0.044 0.017
Metric 0.945 0.931 0.059 0.051 0.042 0.031 -0.015 -0.034
Scalar 0.000 0.091 0.216 0.246 0.945 0.84 -0.157 -0.195
Invariance level of ISCED level 3
Configural 0.985 0.955 0.045 0.017
Metric 0.938 0.921 0.060 0.061 0.047 0.034 -0.015 -0.044
Scalar 0.219 0.371 0.168 0.658 0.719 0.550 -0.108 -0.597
Note: Although the change in TLI slightly exceeded the cut-off criterion, a decision was made to accept the
metric level of measurement invariance because the fit indices for the metric model were acceptable and the
change in RMSEA met the cut-off criterion.
Source: OECD, TALIS 2018 database.

259
TALIS 2018 TECHNICAL REPORT © OECD 2019
Table 11.38. Unstandardised factor loadings for T3COLES for all countries for all
populations
T3COLES (Metric)
TT3G33A 0.934
TT3G33B 0.763
TT3G33C 0.853
TT3G33H 0.658
Source: OECD, TALIS 2018 database.
Table 11.39. Standardised factor loadings and unstandardised intercepts for scale T3EXCH
Participating countries/economies
Standardised factor loadings Unstandardised intercepts
TT3G33D TT3G33E TT3G33F TT3G33G TT3G33D TT3G33E TT3G33F TT3G33G
ISCED level 2
Alberta (Canada) 0.715 0.605 0.775 0.447 4.310 5.057 3.965 3.495
Australia 0.629 0.694 0.696 0.437 5.174 5.209 4.598 4.096
Austria 0.655 0.707 0.760 0.586 4.875 4.920 3.924 4.097
Belgium 0.569 0.562 0.721 0.567 4.268 4.187 3.283 3.847
Flemish Community (Belgium) 0.527 0.609 0.694 0.609 4.530 3.862 3.247 4.036
Brazil 0.628 0.815 0.812 0.661 3.409 4.250 3.782 4.462
Bulgaria 0.608 0.678 0.798 0.493 3.903 4.614 3.939 4.494
Ciudad Autónoma de Buenos Aires (Argentina)
0.727 0.723 0.799 0.542 3.585 4.295 3.568 3.638
Chile 0.643 0.719 0.793 0.413 3.588 3.861 3.356 2.368
Colombia 0.656 0.717 0.784 0.556 3.553 4.139 3.592 3.059
Croatia 0.551 0.722 0.790 0.677 3.400 4.342 3.606 3.718
Cyprus 0.670 0.810 0.802 0.379 4.547 4.709 4.361 3.574
Czech Republic 0.609 0.797 0.737 0.473 3.972 4.968 4.197 4.655
Denmark 0.645 0.743 0.650 0.451 4.564 4.890 3.839 5.021
England (United Kingdom) 0.589 0.718 0.671 0.412 4.819 5.001 4.129 3.310
Estonia 0.454 0.674 0.685 0.502 3.477 4.939 3.983 4.583
Finland 0.610 0.633 0.762 0.455 3.902 5.002 3.757 4.527
France 0.589 0.483 0.678 0.569 3.524 5.070 3.187 4.015
Georgia 0.712 0.750 0.708 0.537 3.705 3.724 3.576 2.795
Hungary 0.454 0.768 0.696 0.587 3.322 3.717 2.817 3.968
Iceland 0.641 0.685 0.713 0.511 3.703 4.841 3.955 4.756
Israel 0.647 0.835 0.792 0.437 4.590 4.724 4.353 3.201
Italy 0.638 0.725 0.680 0.457 4.164 4.864 3.998 4.471
Japan 0.636 0.664 0.735 0.373 4.202 4.177 3.298 4.430
Kazakhstan 0.640 0.748 0.752 0.437 4.663 4.924 4.452 3.347
Korea 0.667 0.615 0.834 0.570 3.208 3.755 3.139 2.259
Latvia 0.605 0.699 0.737 0.382 3.703 4.758 3.979 2.717
Lithuania 0.632 0.782 0.699 0.397 3.467 3.852 3.340 4.421
Malta 0.674 0.741 0.774 0.370 3.916 4.393 3.916 2.710
Mexico 0.588 0.704 0.770 0.590 3.303 4.210 3.737 4.379
Netherlands 0.475 0.646 0.698 0.463 4.098 4.224 3.545 4.581
New Zealand 0.676 0.677 0.669 0.443 4.730 5.105 4.287 3.780
Norway 0.672 0.609 0.704 0.389 4.845 5.487 4.599 5.641
Portugal 0.701 0.694 0.796 0.278 4.446 4.465 4.040 2.234
Romania 0.599 0.762 0.830 0.598 3.541 4.663 4.407 4.300
Russian Federation 0.620 0.704 0.796 0.437 3.524 4.858 4.149 3.097
Saudi Arabia 0.774 0.810 0.854 0.554 3.265 3.810 3.295 2.346

260
TALIS 2018 TECHNICAL REPORT © OECD 2019
Participating countries/economies
Standardised factor loadings Unstandardised intercepts
TT3G33D TT3G33E TT3G33F TT3G33G TT3G33D TT3G33E TT3G33F TT3G33G
Shanghai (China) 0.676 0.752 0.864 0.607 4.404 3.385 3.873 4.331
Singapore 0.691 0.763 0.762 0.458 4.608 4.702 4.435 4.614
Slovak Republic 0.584 0.780 0.819 0.386 3.996 3.719 3.761 2.117
Slovenia 0.634 0.676 0.760 0.654 4.214 4.863 4.185 4.561
South Africa2 0.669 0.740 0.866 0.427 4.143 4.131 4.123 2.941
Spain 0.578 0.585 0.766 0.415 4.056 4.997 4.105 5.093
Sweden 0.597 0.715 0.702 0.353 4.506 5.290 4.399 5.569
Chinese Taipei 0.670 0.680 0.788 0.608 3.248 3.704 3.262 3.705
Turkey 0.582 0.829 0.882 0.628 3.445 4.020 3.814 3.410
United Arab Emirates 0.725 0.821 0.797 0.443 4.621 4.693 4.510 4.662
United States 0.742 0.624 0.725 0.497 4.198 4.869 3.791 3.694
Viet Nam 0.553 0.549 0.635 0.621 4.782 2.901 3.940 3.615
ISCED level 1
Australia1 0.732 0.685 0.786 0.511 5.132 5.426 4.683 4.569
Flemish Community (Belgium) 0.472 0.761 0.622 0.414 4.639 4.039 3.229 4.764
Ciudad Autónoma de Buenos Aires (Argentina)
0.698 0.733 0.771 0.542 3.585 4.295 3.568 3.638
Denmark 0.587 0.707 0.555 0.424 4.586 5.052 3.695 5.355
England (United Kingdom) 0.544 0.743 0.708 0.356 4.819 5.001 4.129 3.310
France 0.714 0.701 0.622 0.405 4.152 5.211 3.561 5.032
Japan 0.680 0.708 0.700 0.426 4.202 4.177 3.298 4.430
Korea 0.665 0.668 0.737 0.514 4.177 4.598 3.423 2.429
Netherlands1 0.660 0.710 0.703 0.388 4.320 4.274 3.839 4.762
Spain 0.571 0.586 0.787 0.452 4.690 5.148 4.617 5.426
Sweden 0.622 0.766 0.713 0.377 4.506 5.290 4.399 5.569
Chinese Taipei 0.704 0.730 0.822 0.617 3.248 3.704 3.262 3.705
Turkey 0.654 0.819 0.860 0.624 4.106 3.814 3.751 3.355
United Arab Emirates 0.714 0.825 0.812 0.463 4.621 4.693 4.510 4.662
Viet Nam 0.560 0.520 0.635 0.566 4.782 2.901 3.940 3.615
ISCED level 3
Alberta (Canada) 0.725 0.587 0.763 0.438 4.310 5.057 3.965 3.495
Brazil 0.630 0.812 0.820 0.641 3.409 4.250 3.782 4.462
Croatia 0.600 0.738 0.836 0.691 3.400 4.342 3.606 3.718
Denmark 0.635 0.675 0.659 0.451 4.356 4.527 3.224 3.889
Portugal 0.720 0.708 0.801 0.292 4.446 4.465 4.040 2.234
Slovenia 0.648 0.637 0.785 0.656 4.214 4.863 4.185 4.561
Sweden 0.604 0.671 0.695 0.304 4.506 5.290 4.399 5.569
Chinese Taipei 0.702 0.749 0.806 0.576 3.248 3.704 3.262 3.705
Turkey 0.593 0.828 0.878 0.632 3.294 3.787 3.649 3.358
United Arab Emirates 0.735 0.826 0.797 0.452 4.621 4.693 4.510 4.662
Viet Nam 0.586 0.616 0.680 0.654 4.782 2.901 3.940 3.615
TALIS-PISA link
Australia 0.662 0.697 0.751 0.501 5.114 5.204 4.539 4.027
Ciudad Autónoma de Buenos Aires (Argentina)
0.758 0.755 0.834 0.647 3.658 4.377 3.806 3.910
Colombia 0.613 0.738 0.768 0.565 3.555 4.232 3.694 3.071
Czech Republic 0.594 0.779 0.786 0.423 3.762 4.802 3.975 4.617
Denmark 0.623 0.757 0.601 0.426 4.664 4.950 3.889 4.971
Georgia 0.557 0.727 0.662 0.447 3.721 3.810 3.590 2.832
Malta 0.680 0.705 0.813 0.399 3.969 4.469 3.944 2.668
Turkey 0.579 0.838 0.872 0.594 3.388 3.880 3.741 3.390

261
TALIS 2018 TECHNICAL REPORT © OECD 2019
Participating countries/economies
Standardised factor loadings Unstandardised intercepts
TT3G33D TT3G33E TT3G33F TT3G33G TT3G33D TT3G33E TT3G33F TT3G33G
Viet Nam 0.586 0.553 0.705 0.588 4.737 2.733 3.900 3.515
1. Data from the participating country/economy were rated as insufficient during the adjudication process.
2. Participating country/economy with late data collection
Source: OECD, TALIS 2018 database.
Table 11.40. Standardised factor loadings and unstandardised intercepts for scale T3COLES
Participating countries/economies
Standardised factor loadings Unstandardised intercepts
TT3G33A TT3G33B TT3G33C TT3G33H TT3G33A TT3G33B TT3G33C TT3G33H
ISCED level 2
Alberta (Canada) 0.519 0.587 0.583 0.509 2.546 1.979 2.791 3.730
Australia 0.556 0.614 0.608 0.490 2.871 2.687 2.581 4.000
Austria 0.427 0.505 0.691 0.467 4.406 2.013 3.089 2.659
Belgium 0.414 0.553 0.588 0.468 2.501 1.587 2.861 2.081
Flemish Community (Belgium)
0.444 0.615 0.628 0.471 2.333 1.625 2.968 1.938
Brazil 0.642 0.662 0.711 0.481 2.731 1.669 3.055 3.246
Bulgaria 0.558 0.543 0.443 0.417 1.724 2.094 3.291 3.316
Ciudad Autónoma de Buenos Aires (Argentina)
0.583 0.653 0.690 0.510 2.840 1.628 2.497 2.729
Chile 0.515 0.651 0.632 0.457 2.741 1.714 2.545 3.089
Colombia 0.600 0.651 0.698 0.556 2.813 2.076 3.238 2.974
Croatia 0.622 0.553 0.532 0.388 1.604 1.433 2.559 3.041
Cyprus 0.694 0.669 0.658 0.469 1.889 2.205 2.360 2.710
Czech Republic 0.573 0.519 0.668 0.406 1.830 2.338 2.758 3.346
Denmark 0.526 0.503 0.651 0.483 3.677 2.123 3.103 2.984
England (United Kingdom) 0.527 0.530 0.618 0.414 2.177 2.833 2.061 3.491
Estonia 0.489 0.604 0.668 0.464 2.745 2.116 2.893 3.235
Finland 0.462 0.555 0.698 0.468 3.377 1.661 2.849 2.429
France 0.488 0.418 0.588 0.542 2.313 2.390 2.998 2.276
Georgia 0.705 0.638 0.673 0.508 3.358 3.390 3.350 3.345
Hungary 0.495 0.617 0.690 0.511 2.688 2.491 2.908 2.837
Iceland 0.459 0.555 0.632 0.458 2.846 1.922 2.835 3.721
Israel 0.479 0.590 0.597 0.396 2.492 1.946 3.070 3.377
Italy 0.522 0.480 0.632 0.538 4.346 2.470 3.400 2.914
Japan 0.443 0.655 0.571 0.527 4.247 3.295 2.752 2.671
Kazakhstan 0.589 0.606 0.618 0.496 2.735 4.556 3.621 3.654
Korea 0.535 0.765 0.712 0.474 2.787 2.905 2.204 2.778
Latvia 0.519 0.619 0.702 0.512 2.641 2.758 2.935 3.051
Lithuania 0.657 0.603 0.616 0.487 2.357 2.584 2.814 3.180
Malta 0.648 0.681 0.625 0.447 1.806 1.512 2.188 2.772
Mexico 0.489 0.599 0.611 0.502 3.922 1.910 2.841 3.712
Netherlands 0.501 0.590 0.693 0.535 2.056 2.407 2.796 3.347
New Zealand 0.563 0.620 0.574 0.483 2.697 2.774 2.774 4.107
Norway 0.409 0.498 0.599 0.406 3.264 2.258 2.703 4.008
Portugal 0.448 0.526 0.551 0.511 2.581 1.798 2.825 2.301
Romania 0.575 0.610 0.671 0.531 2.314 2.731 3.107 2.827
Russian Federation 0.705 0.510 0.626 0.517 2.113 2.966 2.967 3.284
Saudi Arabia 0.686 0.728 0.695 0.520 2.363 2.550 3.276 3.735
Shanghai (China) 0.641 0.660 0.600 0.554 2.613 4.133 2.995 4.737
Singapore 0.443 0.564 0.574 0.418 3.459 2.647 2.560 4.150
Slovak Republic 0.408 0.518 0.508 0.513 3.523 2.423 2.896 1.620
Slovenia 0.359 0.598 0.520 0.315 2.444 1.788 2.881 3.283

262
TALIS 2018 TECHNICAL REPORT © OECD 2019
Participating countries/economies
Standardised factor loadings Unstandardised intercepts
TT3G33A TT3G33B TT3G33C TT3G33H TT3G33A TT3G33B TT3G33C TT3G33H
South Africa2 0.672 0.653 0.637 0.505 2.164 2.531 2.459 2.808
Spain 0.498 0.636 0.586 0.407 2.436 1.375 2.381 3.066
Sweden 0.459 0.488 0.542 0.467 3.602 2.371 2.604 4.153
Chinese Taipei 0.679 0.731 0.667 0.472 1.991 2.482 2.210 3.259
Turkey 0.657 0.629 0.765 0.548 2.769 2.175 2.580 3.497
United Arab Emirates 0.644 0.685 0.747 0.579 2.892 3.328 3.458 4.362
United States 0.492 0.619 0.604 0.443 2.405 2.017 2.286 3.717
Viet Nam 0.431 0.560 0.416 0.365 1.984 4.913 2.768 3.375
ISCED level 1
Australia1 0.543 0.588 0.586 0.548 3.510 2.655 3.601 4.590
Flemish Community (Belgium)
0.398 0.569 0.608 0.406 3.823 1.610 3.402 2.424
Ciudad Autónoma de Buenos Aires (Argentina)
0.623 0.645 0.708 0.548 2.840 1.628 2.497 2.729
Denmark 0.477 0.451 0.595 0.455 3.999 2.214 3.251 2.992
England (United Kingdom) 0.508 0.569 0.569 0.398 2.489 2.604 2.937 3.943
France 0.429 0.375 0.538 0.522 2.214 2.590 3.655 2.856
Japan 0.396 0.679 0.473 0.428 4.542 3.806 3.683 3.279
Korea 0.466 0.750 0.622 0.393 2.878 2.971 2.641 3.071
Netherlands1 0.480 0.472 0.458 0.417 1.460 2.074 3.126 3.616
Spain 0.548 0.558 0.614 0.482 2.436 1.375 2.381 3.066
Sweden 0.480 0.478 0.548 0.490 4.161 2.498 3.233 4.395
Chinese Taipei 0.650 0.730 0.695 0.531 1.991 2.482 2.210 3.259
Turkey 0.686 0.637 0.787 0.578 2.769 2.175 2.580 3.497
United Arab Emirates 0.636 0.664 0.725 0.555 2.892 3.328 3.458 4.362
Viet Nam 0.334 0.539 0.356 0.342 2.293 5.038 3.068 4.075
ISCED level 3
Alberta (Canada) 0.582 0.597 0.595 0.475 2.200 1.939 2.418 3.895
Brazil 0.664 0.684 0.685 0.465 2.731 1.669 3.055 3.246
Croatia 0.643 0.556 0.572 0.457 1.619 1.767 2.361 2.873
Denmark 0.548 0.473 0.601 0.512 2.823 2.020 2.584 2.970
Portugal 0.473 0.547 0.577 0.521 2.581 1.798 2.825 2.301
Slovenia 0.404 0.563 0.490 0.320 2.385 1.596 2.663 2.848
Sweden 0.504 0.544 0.543 0.459 3.345 2.278 2.706 3.742
Chinese Taipei 0.632 0.746 0.641 0.491 1.991 2.482 2.210 3.259
Turkey 0.622 0.643 0.737 0.530 2.769 2.175 2.580 3.497
United Arab Emirates 0.640 0.671 0.740 0.561 2.892 3.328 3.458 4.362
Viet Nam 0.501 0.560 0.525 0.399 2.076 4.663 2.560 3.102
TALIS-PISA link
Australia 0.582 0.620 0.639 0.505 2.661 2.645 2.538 4.023
Ciudad Autónoma de Buenos Aires (Argentina)
0.593 0.656 0.643 0.538 2.931 1.836 2.613 2.867
Colombia 0.588 0.654 0.687 0.556 2.831 2.015 3.283 2.995
Czech Republic 0.570 0.554 0.664 0.420 1.926 2.253 2.637 3.295
Denmark 0.563 0.491 0.673 0.522 3.693 2.220 3.316 3.028
Georgia 0.647 0.603 0.658 0.493 3.420 3.587 3.438 3.456
Malta 0.645 0.657 0.681 0.469 1.889 1.599 2.172 2.814
Turkey 0.631 0.620 0.725 0.530 2.768 2.045 2.534 3.507
Viet Nam 0.469 0.545 0.466 4.738 2.574 3.291
1. Data from the participating country/economy were rated as insufficient during the adjudication process.
2. Participating country/economy with late data collection.
Source: OECD, TALIS 2018 database.

263
TALIS 2018 TECHNICAL REPORT © OECD 2019
Feedback and development: Effective professional development (T3EFFPD);
Needs for professional development in subject matter and pedagogy (T3PDPED);
Needs for professional development for teaching for diversity (T3PDIV);
Professional development barriers (T3PDBAR)
11.17. Measured items
Four scales were composed of the following questions that gathered information about
teacher feedback and development.
“Thinking of the professional development activity that had the greatest positive
impact on your teaching during the last 12 months, did it have any of the following
characteristics?” (TT3G26). The question contained items about certain
characteristics of professional development activities that together made up the
scale Effective professional development (T3EFFPD).
“For each of the areas listed below, please indicate the extent to which you
currently need professional development” (TT3G27). This question was followed
by items concerning teaching subjects and pedagogy that formed the scale Needs
for professional development in subject matter and pedagogy (T3PDPED) as well
as items about teaching in diverse classrooms that formed the scale Needs for
professional development for teaching and diversity (T3PDIV).
“How strongly do you agree or disagree that the following present barriers to your
participation in professional development?” (TT3G28). This question contained
items regarding challenges to participating in professional development that formed
the scale Professional development barriers (T3PDBAR).
These scales are presented in detail in Table 11.41.
11.18. Model improvements
Two scales included improvements. A correlation between items TT3G27A and TT3G27B
was added for T3PDPED, and items D and G were removed from T3PDBAR. In addition,
a correlation between items TT3G28E and TT3G28F was added for T3PDBAR.
11.19. Scale reliability
Table 11.42 presents the reliability coefficients (omega for T3PDPED, T3PDIV and
T3PDBAR, and Cronbach’s alpha for T3EFFPD because it has dichotomous response
options) for all populations for each scale. The reliabilities for T3EFFPD in many
populations are between 0.450 and 0.600, suggesting overall weak reliability.
Scales T3PDPED and T3PDIV have high reliabilities in almost all populations, while the
reliabilities for T3PDBAR are higher than 0.600 in most populations, indicating poor but
acceptable reliability.
11.20. Model fits
Model fit indices for scale T3EFFPD are presented in Table 11.43, which shows that most
populations exhibited acceptable fit, with notable exceptions, specifically the Belgium and
Bulgaria ISCED level 2 populations.
Table 11.44 presents the fit indices for T3PDPED. The overall model fit was acceptable in
all populations except for Finland, the Flemish Community (Belgium) and Netherlands

264
TALIS 2018 TECHNICAL REPORT © OECD 2019
ISCED level 2 populations. Model fit was also poor for the Flemish Community (Belgium)
ISCED level 1 population and the Czech Republic and Georgia TALIS-PISA link
populations.
The model fit results for the scale T3PDIV presented in Table 11.45 suggest a perfect model
fit for most populations, as this scale was measured by just three items. However, model
fit was poor for the Netherlands ISCED level 1 population and the Columbia, Turkey and
Viet Nam TALIS-PISA link populations.
The results for the scale T3PDBAR presented in Table 11.46 exhibit acceptable fit for many
populations. However, compared to other Feedback and development scales, the model fit
for this scale was poor for the following populations: Bulgaria, Columbia, Cyprus,
Denmark, Malta, Norway and Saudi Arabia ISCED level 2; Denmark ISCED level 1; Brazil
ISCED level 3; and Columbia TALIS-PISA link.
11.21. Invariance testing
Table 11.47 presents the results from the invariance testing analyses for scale T3EFFPD.
Because the scale was based on items with categorical response options, it has no metric
model. The procedure applied to this scale provides a good example of the analytic
considerations that determine the variance level of a scale.
As the data in Table 11.47 show, no scale met the cut-off criteria for scalar invariance.
However, recall that the invariance testing examined cross-ISCED level invariance within
each country with populations in either ISCED levels 1 and 3 or both of these levels. Scale
T3EFFPD proved to be scalar invariant for all of those countries and because CFI, TLI and
RMSEA showed an acceptable fit for the scalar model for ISCED levels 1 and 3, T3EFFPD
was considered scalar invariant for those two populations. However, the TLI was not
acceptable for ISCED level 2, which means the scale was deemed only configural invariant
for ISCED level 2.
Table 11.48 presents the results for scale T3PDPED. Metric invariance was established for
all ISCED levels because both the TLI and RMSEA improved from the configural to the
metric models. T3PDIV also reached metric invariance for all ISCED levels. As evident in
Table 11.49, the configural models were perfect and the metric models had acceptable fit
indices. The scale T3PDBAR reached configural invariance for all ISCED levels, as shown
in Table 11.50.
11.22. Item parameters
Table 11.51 presents the unstandardised item parameters for scales T3PDPED and
T3PDIV, which are metric invariant for ISCED level 2.
The standardised factor loadings and unstandardised intercepts for scales T3EFFPD,
T3PDPED, T3PDIV and T3PDBAR appear in Tables 11.52, 11.53, 11.54 and 11.55
respectively. Most factor loadings for the items in T3EFFPD and T3PDIV are above 0.450,
suggesting at least moderately strong relationships. Almost all factor loadings for items in
T3PDPED are above 0.600, suggesting strong relationships. Many of the factor loadings
for items TT3G28A, TT3G28E and TT3G28F in the T3PDBAR scale are lower than 0.450,
indicating a weak but still sufficient relationship between these items and the scale.
Because, in many cases, the loadings above 0.450 in these items are still below 0.600, they
suggest, at best, a moderate relationship between the items and the latent construct.

265
TALIS 2018 TECHNICAL REPORT © OECD 2019
Table 11.41. Item wording for feedback and development scales
T3EFFPD: Effective professional development
TT3G26: Thinking of the professional development activity that had the greatest positive impact on your teaching during the last 12 months, did it have any of the following characteristics?
Response options: “Yes” (1) and “No” (2).
TT3G26A* It built on my prior knowledge.
TT3G26B* It adapted to my personal development needs
TT3G26C* It had a coherent structure
TT3G26D* It appropriately focused on content needed to teach my subjects
T3PDPED: Needs for professional development in subject matter and pedagogy
TT3G27: For each of the areas listed below, please indicate the extent to which you currently need professional development.
Response options: “No need at present” (1), “Low level of need (2)”, “Moderate level of need” (3), “High level of need” (4).
TT3G27A Knowledge and understanding of my subject field(s)
TT3G27B Pedagogical competencies in teaching my subject field(s)
TT3G27C Knowledge of the curriculum
TT3G27D Student assessment practices
TT3G27F Student behaviour and classroom management
T3PDIV: Needs for professional development for teaching for diversity
TT3G27: For each of the areas listed below, please indicate the extent to which you currently need professional development.
Response options: “No need at present” (1), “Low level of need (2)”, “Moderate level of need” (3), “High level of need” (4).
TT3G27H Approaches to individualised learning
TT3G27I Teaching students with special needs
TT3G27J Teaching in a multicultural or multilingual setting
T3PDBAR: Professional development barriers
TT3G28: How strongly do you agree or disagree that the following present barriers to your participation in professional development?
Response options: “Strongly disagree” (1), “Disagree” (2), “Agree” (3), “Strongly agree” (4).
TT3G28A I do not have the pre-requisites (e.g. qualifications, experience, seniority)
TT3G28B Professional development is too expensive
TT3G28C There is a lack of employer support
TT3G28D1 Professional development conflicts with my work schedule
TT3G28E I do not have time because of family responsibilities
TT3G28F There is no relevant professional development offered
TT3G28G1 There are no incentives for participating in professional development
* Items were reverse coded.
1. Item was deleted and is not included in any results presented for this scale.
Source: OECD, TALIS 2018 database.
Table 11.42. Reliability coefficients for feedback and development scales
Participating countries/economies T3EFFPD T3PDPED T3PDIV T3PDBAR
Cronbach’s alpha Omega coefficient
ISCED level 2
Alberta (Canada) 0.450 0.846 0.762 0.687
Australia 0.430 0.834 0.834 0.694
Austria 0.471 0.736 0.755 0.659
Belgium 0.426 0.773 0.796 0.623
Flemish Community (Belgium) 0.529 0.839 0.808 0.615
Brazil 0.456 0.884 0.745 0.714
Bulgaria 0.643 0.908 0.773 0.619

266
TALIS 2018 TECHNICAL REPORT © OECD 2019
Participating countries/economies T3EFFPD T3PDPED T3PDIV T3PDBAR
Cronbach’s alpha Omega coefficient
Ciudad Autónoma de Buenos Aires (Argentina) 0.581 0.817 0.767 0.624
Chile 0.562 0.850 0.805 0.692
Colombia 0.617 0.887 0.797 0.621
Croatia 0.513 0.865 0.872 0.663
Cyprus 0.548 0.856 0.781 0.671
Czech Republic 0.546 0.799 0.828 0.602
Denmark 0.499 0.774 0.755 0.607
England (United Kingdom) 0.520 0.814 0.821 0.707
Estonia 0.518 0.841 0.729 0.699
Finland 0.490 0.789 0.835 0.714
France 0.451 0.774 0.837 0.696
Georgia 0.643 0.903 0.764 0.764
Hungary 0.539 0.854 0.711 0.663
Iceland 0.555 0.773 0.901 0.674
Israel 0.528 0.880 0.748 0.691
Italy 0.532 0.821 0.865 0.594
Japan 0.538 0.789 0.783 0.774
Kazakhstan 0.582 0.908 0.702 0.707
Korea 0.624 0.908 0.904 0.741
Latvia 0.445 0.861 0.736 0.679
Lithuania 0.530 0.852 0.691 0.648
Malta 0.487 0.790 0.857 0.651
Mexico 0.513 0.891 0.773 0.746
Netherlands 0.471 0.764 0.674 0.731
New Zealand 0.428 0.861 0.794 0.667
Norway 0.485 0.776 0.814 0.757
Portugal 0.448 0.806 0.753 0.666
Romania 0.686 0.906 0.817 0.575
Russian Federation 0.494 0.925 0.760 0.661
Saudi Arabia 0.674 0.937 0.757 0.746
Shanghai (China) 0.550 0.927 0.796 0.878
Singapore 0.534 0.872 0.723 0.721
Slovak Republic 0.583 0.843 0.826 0.561
Slovenia 0.504 0.846 0.746 0.610
South Africa2 0.506 0.865 0.704 0.635
Spain 0.554 0.826 0.799 0.548
Sweden 0.560 0.819 0.901 0.801
Chinese Taipei 0.608 0.912 0.824 0.759
Turkey 0.652 0.904 0.899 0.762
United Arab Emirates 0.585 0.887 0.805 0.743
United States 0.521 0.856 0.839 0.654
Viet Nam 0.410 0.899 0.669 0.778
ISCED level 1
Australia1 0.487 0.891 0.832 0.699
Flemish Community (Belgium) 0.506 0.835 0.764 0.637
Ciudad Autónoma de Buenos Aires (Argentina) 0.532 0.846 0.762 0.623
Denmark 0.532 0.766 0.734 0.497
England (United Kingdom) 0.509 0.859 0.801 0.746
France 0.482 0.733 0.799 0.686
Japan 0.566 0.797 0.832 0.766
Korea 0.579 0.916 0.848 0.746

267
TALIS 2018 TECHNICAL REPORT © OECD 2019
Participating countries/economies T3EFFPD T3PDPED T3PDIV T3PDBAR
Cronbach’s alpha Omega coefficient
Netherlands1 0.399 0.845 0.787 0.748
Spain 0.515 0.843 0.803 0.598
Sweden 0.525 0.796 0.857 0.821
Chinese Taipei 0.563 0.910 0.824 0.733
Turkey 0.713 0.914 0.910 0.769
United Arab Emirates 0.603 0.899 0.815 0.753
Viet Nam 0.533 0.918 0.656 0.803
ISCED level 3
Alberta (Canada) 0.438 0.850 0.799 0.664
Brazil 0.454 0.884 0.759 0.707
Croatia 0.584 0.867 0.808 0.634
Denmark 0.479 0.789 0.812 0.638
Portugal 0.495 0.810 0.755 0.630
Slovenia 0.469 0.854 0.781 0.607
Sweden 0.574 0.805 0.887 0.819
Chinese Taipei 0.637 0.899 0.835 0.734
Turkey 0.704 0.893 0.863 0.755
United Arab Emirates 0.620 0.884 0.774 0.776
Viet Nam 0.459 0.893 0.696 0.757
TALIS-PISA link
Australia 0.411 0.869 0.869 0.728
Ciudad Autónoma de Buenos Aires (Argentina) 0.567 0.846 0.745 0.656
Colombia 0.584 0.884 0.843 0.602
Czech Republic 0.610 0.837 0.806 0.648
Denmark 0.529 0.835 0.748 0.927
Georgia 0.640 0.824 0.711 0.760
Malta 0.489 0.837 0.826 0.692
Turkey 0.652 0.891 0.814 0.717
Viet Nam 0.312 0.939 0.723 0.746
1. Data from the participating country/economy were rated as insufficient during the adjudication process.
2. Participating country/economy with late data collection.
Source: OECD, TALIS 2018 database.
Table 11.43. CFA model-data fit for scale T3EFFPD
Effective professional development
Participating countries/economies CFI TLI RMSEA WRMR
ISCED level 2
Alberta (Canada) 1.000 1.031 0.000 0.206
Australia 0.977 0.931 0.042 0.988
Austria 1.000 0.999 0.006 0.399
Belgium 0.820 0.460 0.125 3.402
Flemish Community (Belgium) 0.964 0.891 0.072 1.504
Brazil 0.990 0.969 0.029 0.509
Bulgaria 0.975 0.925 0.081 1.401
Ciudad Autónoma de Buenos Aires (Argentina) 0.990 0.971 0.034 0.514
Chile 0.984 0.952 0.045 0.767
Colombia 0.983 0.948 0.044 0.622
Croatia 0.972 0.915 0.054 1.252
Cyprus 1.000 1.006 0.000 0.280

268
TALIS 2018 TECHNICAL REPORT © OECD 2019
Participating countries/economies CFI TLI RMSEA WRMR
Czech Republic 0.996 0.988 0.026 0.601
Denmark 0.984 0.953 0.046 0.682
England (United Kingdom) 0.984 0.953 0.045 0.830
Estonia 0.993 0.979 0.032 0.713
Finland 0.999 0.998 0.007 0.398
France 0.965 0.896 0.046 0.731
Georgia 0.995 0.986 0.036 0.675
Hungary 0.984 0.952 0.046 0.827
Iceland 0.994 0.981 0.038 0.458
Israel 0.984 0.952 0.046 0.975
Italy 0.998 0.993 0.019 0.510
Japan 1.000 1.000 0.000 0.415
Kazakhstan 0.978 0.933 0.049 1.427
Korea 0.995 0.985 0.036 0.812
Latvia 0.953 0.860 0.053 0.887
Lithuania 0.996 0.988 0.020 0.612
Malta 0.985 0.956 0.047 0.724
Mexico 0.981 0.944 0.045 0.844
Netherlands 0.997 0.991 0.017 0.529
New Zealand 0.992 0.977 0.022 0.514
Norway 0.994 0.982 0.023 0.681
Portugal 0.988 0.963 0.034 0.778
Romania 0.992 0.977 0.046 0.825
Russian Federation 0.995 0.986 0.015 0.514
Saudi Arabia 0.998 0.995 0.024 0.410
Shanghai (China) 0.996 0.987 0.026 0.670
Singapore 0.994 0.982 0.027 0.763
Slovak Republic 0.994 0.982 0.033 0.692
Slovenia 0.981 0.944 0.051 0.900
South Africa2 1.000 1.006 0.000 0.336
Spain 0.981 0.942 0.036 1.003
Sweden 1.000 1.009 0.000 0.162
Chinese Taipei 0.994 0.982 0.037 0.919
Turkey 1.000 1.003 0.000 0.210
United Arab Emirates 1.000 1.000 0.004 0.386
United States 0.999 0.998 0.005 0.330
Viet Nam 0.990 0.970 0.021 0.531
ISCED level 1
Australia1 0.996 0.989 0.019 0.556
Flemish Community (Belgium) 0.992 0.977 0.028 0.573
Ciudad Autónoma de Buenos Aires (Argentina) 0.984 0.952 0.045 0.933
Denmark 1.000 1.015 0.000 0.140
England (United Kingdom) 0.973 0.918 0.057 0.946
France 1.000 1.013 0.000 0.353
Japan 0.996 0.987 0.030 0.791
Korea 0.990 0.970 0.044 1.073
Netherlands1 1.000 1.043 0.000 0.113
Spain 0.998 0.993 0.013 0.570
Sweden 0.957 0.870 0.067 0.913
Chinese Taipei 0.976 0.928 0.070 1.604
Turkey 0.993 0.978 0.041 0.656
United Arab Emirates 0.997 0.990 0.023 0.693

269
TALIS 2018 TECHNICAL REPORT © OECD 2019
Participating countries/economies CFI TLI RMSEA WRMR
Viet Nam 0.977 0.930 0.057 1.138
ISCED level 3
Alberta (Canada) 1.000 1.001 0.000 0.371
Brazil 0.996 0.988 0.015 0.446
Croatia 0.992 0.977 0.037 0.714
Denmark 0.991 0.974 0.030 0.574
Portugal 1.000 1.007 0.000 0.229
Slovenia 0.978 0.933 0.048 0.894
Sweden 0.995 0.985 0.029 0.564
Chinese Taipei 0.995 0.986 0.035 0.547
Turkey 1.000 1.001 0.000 0.250
United Arab Emirates 0.998 0.994 0.018 0.527
Viet Nam 1.000 1.005 0.000 0.320
TALIS-PISA link
Australia 0.974 0.922 0.039 0.828
Ciudad Autónoma de Buenos Aires (Argentina) 0.998 0.995 0.015 0.433
Colombia 1.000 1.009 0.000 0.192
Czech Republic 0.993 0.979 0.036 0.707
Denmark 1.000 1.004 0.000 0.362
Georgia 0.993 0.979 0.035 0.593
Malta 0.982 0.947 0.051 0.587
Turkey 0.999 0.998 0.009 0.412
Viet Nam 1.000 1.046 0.000 0.227
1. Data from participating country/economy were rated as insufficient during the adjudication process.
2. Participating country/economy with late data collection
Source: OECD, TALIS 2018 database.
Table 11.44. CFA model-data fit for scale T3PDPED
Needs for professional development in subject matter and pedagogy
Participating countries/economies CFI TLI RMSEA SRMR
ISCED level 2
Alberta (Canada) 0.967 0.918 0.084 0.027
Australia 0.960 0.901 0.091 0.029
Austria 0.953 0.884 0.091 0.034
Belgium 0.912 0.780 0.119 0.041
Flemish Community (Belgium) 0.878 0.696 0.158 0.074
Brazil 0.982 0.956 0.070 0.021
Bulgaria 0.963 0.907 0.121 0.028
Ciudad Autónoma de Buenos Aires (Argentina) 0.984 0.959 0.056 0.019
Chile 0.991 0.977 0.051 0.015
Colombia 0.992 0.980 0.042 0.013
Croatia 0.934 0.835 0.130 0.040
Cyprus 0.971 0.927 0.078 0.025
Czech Republic 0.979 0.948 0.068 0.024
Denmark 0.978 0.945 0.075 0.024
England (United Kingdom) 0.918 0.795 0.140 0.036
Estonia 0.976 0.939 0.091 0.023
Finland 0.898 0.746 0.170 0.061
France 0.948 0.871 0.102 0.035
Georgia 0.995 0.987 0.048 0.012

270
TALIS 2018 TECHNICAL REPORT © OECD 2019
Participating countries/economies CFI TLI RMSEA SRMR
Hungary 0.937 0.843 0.154 0.037
Iceland 0.986 0.965 0.071 0.028
Israel 0.977 0.942 0.086 0.021
Italy 0.979 0.948 0.078 0.023
Japan 0.984 0.960 0.063 0.021
Kazakhstan 0.996 0.991 0.039 0.010
Korea 0.972 0.931 0.084 0.018
Latvia 0.972 0.931 0.089 0.023
Lithuania 0.979 0.948 0.080 0.022
Malta 0.944 0.860 0.121 0.035
Mexico 0.982 0.956 0.085 0.019
Netherlands 0.804 0.509 0.154 0.053
New Zealand 0.997 0.991 0.032 0.011
Norway 0.990 0.975 0.045 0.016
Portugal 0.956 0.889 0.109 0.031
Romania 0.974 0.935 0.098 0.022
Russian Federation 0.989 0.972 0.051 0.013
Saudi Arabia 0.976 0.940 0.078 0.024
Shanghai (China) 0.964 0.909 0.115 0.027
Singapore 0.959 0.897 0.113 0.027
Slovak Republic 0.988 0.969 0.062 0.018
Slovenia 0.962 0.906 0.118 0.030
South Africa2 0.910 0.900 0.102 0.169
Spain 0.934 0.836 0.090 0.030
Sweden 0.980 0.951 0.066 0.021
Chinese Taipei 0.953 0.882 0.133 0.033
Turkey 0.980 0.951 0.076 0.020
United Arab Emirates 0.971 0.927 0.088 0.022
United States 0.932 0.830 0.086 0.035
Viet Nam 0.978 0.944 0.067 0.023
ISCED level 1
Australia1 0.973 0.970 0.057 0.130
Flemish Community (Belgium) 0.893 0.732 0.164 0.058
Ciudad Autónoma de Buenos Aires (Argentina) 0.964 0.911 0.085 0.030
Denmark 0.959 0.898 0.104 0.030
England (United Kingdom) 0.988 0.970 0.058 0.014
France 0.935 0.838 0.111 0.039
Japan 0.985 0.963 0.072 0.022
Korea 0.968 0.920 0.105 0.018
Netherlands1 0.851 0.835 0.120 0.184
Spain 0.980 0.951 0.057 0.020
Sweden 0.958 0.895 0.106 0.031
Chinese Taipei 0.955 0.888 0.133 0.031
Turkey 0.993 0.981 0.036 0.011
United Arab Emirates 0.986 0.964 0.061 0.017
Viet Nam 0.982 0.954 0.058 0.017
ISCED level 3
Alberta (Canada) 0.969 0.922 0.091 0.026
Brazil 0.989 0.974 0.051 0.015
Croatia 0.937 0.841 0.130 0.034
Denmark 0.910 0.774 0.128 0.041
Portugal 0.970 0.924 0.084 0.030

271
TALIS 2018 TECHNICAL REPORT © OECD 2019
Participating countries/economies CFI TLI RMSEA SRMR
Slovenia 0.980 0.950 0.080 0.023
Sweden 0.963 0.908 0.086 0.028
Chinese Taipei 0.956 0.891 0.124 0.038
Turkey 0.972 0.930 0.058 0.020
United Arab Emirates 0.958 0.896 0.100 0.028
Viet Nam 0.963 0.908 0.078 0.026
TALIS-PISA link
Australia 0.907 0.897 0.093 0.141
Ciudad Autónoma de Buenos Aires (Argentina) 0.923 0.914 0.066 0.114
Colombia 0.979 0.976 0.058 0.094
Czech Republic 0.893 0.882 0.091 0.122
Denmark 0.953 0.948 0.058 0.156
Georgia 0.884 0.871 0.095 0.222
Malta 0.985 0.983 0.047 0.051
Turkey 0.954 0.948 0.052 0.076
Viet Nam 0.967 0.964 0.045 0.523
1. Data from participating country/economy were rated as insufficient during the adjudication process.
2. Participating country/economy with late data collection.
Source: OECD, TALIS 2018 database.
Table 11.45. CFA model-data fit for scale T3PDIV
Needs for professional development for teaching for diversity
Participating countries/economies CFI TLI RMSEA SRMR
ISCED level 2
South Africa2 0.925 0.925 0.070 0.076
ISCED level 1
Australia1 0.970 0.970 0.060 0.090
Netherlands1 0.854 0.854 0.124 0.180
TALIS-PISA link
Australia 0.971 0.971 0.062 0.077
Ciudad Autónoma de Buenos Aires (Argentina) 0.939 0.939 0.069 0.088
Colombia 0.897 0.897 0.094 0.223
Czech Republic 0.963 0.963 0.051 0.074
Denmark 0.908 0.908 0.074 0.095
Georgia 0.995 0.995 0.016 0.056
Malta 0.974 0.974 0.075 0.105
Turkey 0.886 0.886 0.085 0.160
Viet Nam 0.886 0.886 0.063 0.091
1. Data from participating country/economy were rated as insufficient during the adjudication process.
2. Participating country/economy with late data collection.
Source: OECD, TALIS 2018 database.
Table 11.46. CFA model-data fit for the scale T3PDBAR
Professional development barriers
Participating countries/economies CFI TLI RMSEA SRMR
ISCED level 2
Alberta (Canada) 0.992 0.979 0.022 0.019
Australia 0.988 0.969 0.029 0.016

272
TALIS 2018 TECHNICAL REPORT © OECD 2019
Participating countries/economies CFI TLI RMSEA SRMR
Austria 0.994 0.985 0.017 0.010
Belgium 0.968 0.919 0.044 0.019
Flemish Community (Belgium) 0.942 0.854 0.062 0.024
Brazil 0.913 0.781 0.088 0.037
Bulgaria 0.851 0.627 0.095 0.043
Ciudad Autónoma de Buenos Aires (Argentina) 0.956 0.889 0.047 0.024
Chile 0.965 0.912 0.063 0.024
Colombia 0.892 0.731 0.064 0.044
Croatia 0.977 0.942 0.038 0.019
Cyprus 0.868 0.671 0.115 0.037
Czech Republic 0.983 0.958 0.031 0.015
Denmark 0.796 0.490 0.104 0.054
England (United Kingdom) 0.973 0.933 0.053 0.023
Estonia 0.957 0.892 0.064 0.028
Finland 0.984 0.960 0.038 0.019
France 0.997 0.992 0.017 0.010
Georgia 0.984 0.960 0.042 0.018
Hungary 0.979 0.946 0.042 0.020
Iceland 0.949 0.873 0.059 0.026
Israel 0.976 0.939 0.043 0.023
Italy 0.987 0.967 0.027 0.013
Japan 0.978 0.946 0.053 0.024
Kazakhstan 0.995 0.987 0.018 0.014
Korea 0.965 0.911 0.062 0.027
Latvia 0.996 0.990 0.017 0.011
Lithuania 0.963 0.908 0.050 0.026
Malta 0.871 0.679 0.109 0.035
Mexico 0.965 0.913 0.064 0.025
Netherlands 0.913 0.783 0.070 0.040
New Zealand 0.970 0.926 0.043 0.025
Norway 0.878 0.696 0.083 0.047
Portugal 0.945 0.864 0.071 0.023
Romania 0.950 0.876 0.047 0.027
Russian Federation 0.955 0.887 0.038 0.021
Saudi Arabia 0.883 0.707 0.117 0.046
Shanghai (China) 0.911 0.777 0.145 0.048
Singapore 0.976 0.939 0.045 0.020
Slovak Republic 0.924 0.810 0.057 0.028
Slovenia 0.970 0.924 0.044 0.021
South Africa2 0.951 0.877 0.050 0.025
Spain 0.903 0.758 0.049 0.026
Sweden 0.963 0.907 0.047 0.028
Chinese Taipei 0.944 0.860 0.084 0.029
Turkey 0.983 0.957 0.041 0.019
United Arab Emirates 0.957 0.891 0.068 0.025
United States 0.977 0.943 0.022 0.025
Viet Nam 0.984 0.960 0.040 0.018
ISCED level 1
Australia1 0.963 0.908 0.058 0.024
Flemish Community (Belgium) 0.956 0.889 0.058 0.023
Ciudad Autónoma de Buenos Aires (Argentina) 0.993 0.982 0.020 0.014
Denmark 0.856 0.641 0.061 0.032

273
TALIS 2018 TECHNICAL REPORT © OECD 2019
Participating countries/economies CFI TLI RMSEA SRMR
England (United Kingdom) 0.975 0.937 0.051 0.023
France 0.933 0.832 0.069 0.030
Japan 0.960 0.899 0.070 0.031
Korea 0.973 0.933 0.051 0.023
Netherlands1 0.969 0.922 0.056 0.028
Spain 0.956 0.891 0.039 0.018
Sweden 0.968 0.920 0.041 0.024
Chinese Taipei 0.944 0.859 0.074 0.029
Turkey 0.925 0.812 0.070 0.034
United Arab Emirates 0.958 0.894 0.069 0.024
Viet Nam 0.979 0.947 0.065 0.022
ISCED level 3
Alberta (Canada) 0.951 0.878 0.063 0.024
Brazil 0.887 0.719 0.088 0.042
Croatia 0.940 0.850 0.062 0.027
Denmark 0.980 0.950 0.030 0.021
Portugal 0.933 0.832 0.067 0.026
Slovenia 0.972 0.929 0.042 0.020
Sweden 0.991 0.977 0.024 0.015
Chinese Taipei 0.985 0.962 0.040 0.018
Turkey 0.968 0.919 0.041 0.029
United Arab Emirates 0.969 0.923 0.063 0.023
Viet Nam 0.990 0.974 0.038 0.016
TALIS-PISA link
Australia 0.970 0.926 0.060 0.021
Ciudad Autónoma de Buenos Aires (Argentina) 0.998 0.995 0.011 0.015
Colombia 0.789 0.474 0.097 0.054
Czech Republic 0.991 0.977 0.021 0.014
Denmark3 - - - 0.050
Georgia 0.928 0.819 0.049 0.029
Malta 0.940 0.849 0.086 0.029
Turkey 0.953 0.884 0.042 0.032
Viet Nam 0.971 0.928 0.046 0.026
1. Data from the participating country/economy were rated as insufficient during the adjudication process.
2. Participating country/economy with late data collection.
3. As the correction factor for this country/economy was negative, only the SRMR is reported.
Source: OECD, TALIS 2018 database.
Table 11.47. Invariance test results for scale T3EFFPD
CFI TLI RMSEA WRMR Δ CFI Δ TLI Δ RMSEA Δ WRMR
Invariance level of ISCED level 2
Configural 0.987 0.960 0.042 6.114
Scalar 0.916 0.873 0.076 15.700 0.071 0.087 -0.034 -9.586
Invariance level of ISCED level 1
Configural 0.989 0.968 0.039 3.160
Scalar 0.941 0.907 0.067 7.988 0.048 0.061 -0.028 -4.828
Invariance level of ISCED level 3
Configural 0.998 0.993 0.019 1.688
Scalar 0.966 0.946 0.053 5.248 0.032 0.047 -0.034 -3.56
Source: OECD, TALIS 2018 database.

274
TALIS 2018 TECHNICAL REPORT © OECD 2019
Table 11.48. Invariance test results for scale T3PDPED
CFI TLI RMSEA WRMR Δ CFI Δ TLI Δ RMSEA Δ SRMR
Invariance level of ISCED level 2
Configural 0.968 0.920 0.092 0.029
Metric 0.948 0.934 0.083 0.066 0.020 -0.014 0.009 -0.037
Scalar 0.860 0.882 0.112 0.117 0.088 0.052 -0.029 -0.051
Invariance level of ISCED level 1
Configural 0.975 0.938 0.082 0.026
Metric 0.965 0.955 0.070 0.056 0.010 -0.017 0.012 -0.030
Scalar 0.889 0.903 0.103 0.111 0.076 0.052 -0.033 -0.055
Invariance level of ISCED level 3
Configural 0.965 0.912 0.090 0.027
Metric 0.949 0.934 0.078 0.059 0.016 -0.022 0.012 -0.032
Scalar 0.870 0.884 0.104 0.107 0.079 0.050 -0.026 -0.048
Note: See endnote 34.
Source: OECD, TALIS 2018 database.
Table 11.49. Invariance test results for scale T3PDIV
CFI TLI RMSEA SRMR Δ CFI Δ TLI Δ RMSEA Δ SRMR
Invariance level of ISCED level 2
Configural 1.000 1.000 0.000 0.001
Metric 0.964 0.945 0.074 0.071 0.036 0.055 -0.074 -0.070
Scalar 0.681 0.756 0.156 0.153 0.283 0.189 -0.082 -0.082
Invariance level of ISCED level 1
Configural 1.000 1.000 0.000 0.000
Metric 0.978 0.964 0.062 0.060 0.022 0.036 -0.062 -0.060
Scalar 0.731 0.781 0.152 0.126 0.247 0.183 -0.090 -0.066
Invariance level of ISCED level 3
Configural 1.000 1.000 0.000 0.000
Metric 0.980 0.968 0.057 0.052 0.020 0.032 -0.057 -0.052
Scalar 0.675 0.732 0.164 0.199 0.305 0.236 -0.107 -0.147
Note: See endnote 34.
Source: OECD, TALIS 2018 database.

275
TALIS 2018 TECHNICAL REPORT © OECD 2019
Table 11.50. Invariance test results for scale T3PDBAR
CFI TLI RMSEA SRMR Δ CFI Δ TLI Δ RMSEA Δ SRMR
Invariance level of ISCED level 2
Configural 0.957 0.893 0.057 0.027
Metric 0.897 0.869 0.063 0.060 0.060 0.024 -0.006 -0.033
Scalar 0.407 0.499 0.123 0.147 0.490 0.370 -0.060 -0.087
Invariance level of ISCED level 1
Configural 0.961 0.901 0.059 0.025
Metric 0.916 0.890 0.063 0.057 0.045 0.011 -0.004 -0.032
Scalar 0.475 0.538 0.128 0.134 0.441 0.352 -0.065 -0.077
Invariance level of ISCED level 3
Configural 0.967 0.918 0.054 0.025
Metric 0.914 0.887 0.064 0.059 0.053 0.031 -0.010 -0.034
Scalar 0.649 0.689 0.105 0.127 0.265 0.198 -0.041 -0.068
Source: OECD, TALIS 2018 database.
Table 11.51. Unstandardised factor loadings for T3PDPED and T3PDIV for all countries for
all populations
T3PDPED (Metric) T3PDIV (Metric)
TT3G27A 0.651 TT3G27H 0.629
TT3G27B 0.684 TT3G27I 0.792
TT3G27C 0.707 TT3G27J 0.615
TT3G27D 0.688
TT3G27F 0.622
Source: OECD, TALIS 2018 database.
Table 11.52. Standardised factor loadings and unstandardised intercepts for scale T3EFFPD
Participating countries/economies
Standardised factor loadings Unstandardised intercepts
TT3G26A TT3G26B TT3G26A TT3G26B TT3G26A TT3G26B TT3G26A TT3G26B
ISCED level 2
Alberta (Canada) 0.732 0.539 0.760 0.555 -1.986 -0.893 -0.927 -0.832
Australia 0.824 0.620 0.609 0.541 -1.953 -0.587 -0.983 -0.631
Austria 0.593 0.734 0.702 0.557 -1.347 -1.505 -1.033 -0.414
Belgium 0.474 0.757 0.464 0.535 -0.865 -0.945 -0.498 -0.255
Flemish Community (Belgium) 0.480 0.796 0.691 0.598 -1.986 -0.893 -0.927 -0.832
Brazil 0.470 0.363 0.893 0.621 -1.986 -0.893 -0.927 -0.832
Bulgaria 0.596 0.784 0.850 0.615 -0.286 -0.562 -0.205 -0.590
Ciudad Autónoma de Buenos Aires (Argentina)
0.588 0.672 0.996 0.585 -1.986 -0.893 -0.927 -0.832
Chile 0.657 0.646 0.839 0.668 -1.217 -1.325 -1.302 -0.995
Colombia 0.883 0.789 0.769 0.655 -1.504 -1.075 -1.551 -0.937
Croatia 0.600 0.605 0.714 0.720 -1.986 -0.893 -0.927 -0.832
Cyprus 0.522 0.569 0.761 0.761 -1.575 -0.604 -0.722 -0.665
Czech Republic 0.610 0.636 0.805 0.590 -1.119 -0.351 -1.052 -0.638
Denmark 0.594 0.508 0.806 0.628 -1.986 -0.893 -0.927 -0.832
England (United Kingdom) 0.895 0.465 0.737 0.540 -1.986 -0.893 -0.927 -0.832
Estonia 0.436 0.706 0.798 0.710 -1.475 -1.333 -1.256 -0.806
Finland 0.498 0.667 0.719 0.664 -1.626 -1.262 -0.754 -0.410
France 0.297 0.661 0.859 0.316 -1.986 -0.893 -0.927 -0.832

276
TALIS 2018 TECHNICAL REPORT © OECD 2019
Participating countries/economies
Standardised factor loadings Unstandardised intercepts
TT3G26A TT3G26B TT3G26A TT3G26B TT3G26A TT3G26B TT3G26A TT3G26B
Georgia 0.784 0.811 0.831 0.803 -1.562 -1.670 -1.084 -0.829
Hungary 0.666 0.592 0.763 0.677 -1.242 -0.752 -1.242 -0.482
Iceland 0.568 0.759 0.648 0.768 -1.830 0.016 -0.873 -0.347
Israel 0.515 0.755 0.637 0.736 -1.036 -1.290 -1.005 -0.525
Italy 0.701 0.675 0.742 0.587 -1.579 -0.893 -0.742 -0.263
Japan 0.588 0.651 0.755 0.631 -1.986 -0.893 -0.927 -0.832
Kazakhstan 0.665 0.760 0.783 0.678 -1.462 -0.898 -1.181 -1.256
Korea 0.599 0.944 0.583 0.844 -1.986 -0.893 -0.927 -0.832
Latvia 0.350 0.580 0.762 0.539 -1.960 -0.601 -0.304 -0.589
Lithuania 0.653 0.714 0.809 0.666 -1.837 -1.352 -0.292 -0.412
Malta 0.614 0.691 0.664 0.555 -1.818 -0.695 -0.479 -0.270
Mexico 0.440 0.694 0.815 0.628 -1.058 -1.198 -1.146 -0.881
Netherlands 0.536 0.688 0.731 0.603 -1.695 -1.319 -0.128 -0.432
New Zealand 0.637 0.464 0.586 0.683 -1.776 -0.206 -0.796 -0.547
Norway 0.575 0.617 0.673 0.545 -1.451 -0.387 -0.548 -0.745
Portugal 0.333 0.770 0.842 0.534 -1.986 -0.893 -0.927 -0.832
Romania 0.795 0.792 0.789 0.746 -1.122 -1.017 -0.713 -0.570
Russian Federation 0.463 0.668 0.673 0.624 -1.641 -0.754 -0.556 -0.726
Saudi Arabia 0.743 0.884 0.861 0.763 -1.841 -1.195 -0.888 -0.972
Shanghai (China) 0.672 0.716 0.898 0.669 -1.720 -1.686 -1.074 -1.539
Singapore 0.693 0.691 0.764 0.618 -1.787 -1.053 -0.875 -0.867
Slovak Republic 0.593 0.671 0.797 0.617 -1.152 -0.427 -0.286 -0.714
Slovenia 0.692 0.608 0.697 0.567 -1.986 -0.893 -0.927 -0.832
South Africa2 0.675 0.646 0.689 0.822 -2.092 -1.183 -1.123 -1.392
Spain 0.455 0.672 0.963 0.461 -1.986 -0.893 -0.927 -0.832
Sweden 0.807 0.472 0.712 0.682 -1.986 -0.893 -0.927 -0.832
Chinese Taipei 0.576 0.784 0.792 0.784 -1.986 -0.893 -0.927 -0.832
Turkey 0.653 0.779 0.972 0.650 -1.986 -0.893 -0.927 -0.832
United Arab Emirates 0.559 0.777 0.857 0.666 -1.986 -0.893 -0.927 -0.832
United States 0.564 0.796 0.625 0.625 -1.809 -0.663 -0.769 -0.579
Viet Nam 0.583 0.463 0.717 0.895 -1.986 -0.893 -0.927 -0.832
ISCED level 1
Australia1 0.738 0.619 0.651 0.483 -2.015 -0.595 -0.886 -0.605
Flemish Community (Belgium) 0.532 0.767 0.743 0.547 -1.986 -0.893 -0.927 -0.832
Ciudad Autónoma de Buenos Aires (Argentina)
0.682 0.645 0.994 0.625 -1.986 -0.893 -0.927 -0.832
Denmark 0.624 0.572 0.722 0.679 -1.986 -0.893 -0.927 -0.832
England (United Kingdom) 0.803 0.444 0.869 0.658 -1.986 -0.893 -0.927 -0.832
France 0.330 0.602 0.948 0.330 -1.986 -0.893 -0.927 -0.832
Japan 0.620 0.667 0.727 0.752 -1.986 -0.893 -0.927 -0.832
Korea 0.633 0.909 0.553 0.828 -1.986 -0.893 -0.927 -0.832
Netherlands1 0.426 0.463 0.748 0.632 -1.967 -1.470 -0.374 -0.713
Spain 0.479 0.706 0.927 0.477 -1.986 -0.893 -0.927 -0.832
Sweden 0.671 0.425 0.863 0.630 -1.986 -0.893 -0.927 -0.832
Chinese Taipei 0.645 0.813 0.792 0.681 -1.986 -0.893 -0.927 -0.832
Turkey 0.754 0.870 0.984 0.708 -1.986 -0.893 -0.927 -0.832
United Arab Emirates 0.556 0.801 0.864 0.709 -1.986 -0.893 -0.927 -0.832
Viet Nam 0.710 0.570 0.857 0.977 -1.986 -0.893 -0.927 -0.832
ISCED level 3
Alberta (Canada) 0.848 0.544 0.686 0.491 -1.986 -0.893 -0.927 -0.832
Brazil 0.451 0.371 0.947 0.615 -1.986 -0.893 -0.927 -0.832

277
TALIS 2018 TECHNICAL REPORT © OECD 2019
Participating countries/economies
Standardised factor loadings Unstandardised intercepts
TT3G26A TT3G26B TT3G26A TT3G26B TT3G26A TT3G26B TT3G26A TT3G26B
Croatia 0.547 0.636 0.945 0.681 -1.986 -0.893 -0.927 -0.832
Denmark 0.470 0.537 0.789 0.575 -1.986 -0.893 -0.927 -0.832
Portugal 0.362 0.766 0.867 0.602 -1.986 -0.893 -0.927 -0.832
Slovenia 0.695 0.522 0.720 0.514 -1.986 -0.893 -0.927 -0.832
Sweden 0.684 0.589 0.726 0.755 -1.986 -0.893 -0.927 -0.832
Chinese Taipei 0.723 0.870 0.725 0.779 -1.986 -0.893 -0.927 -0.832
Turkey 0.708 0.833 0.925 0.712 -1.986 -0.893 -0.927 -0.832
United Arab Emirates 0.583 0.801 0.892 0.690 -1.986 -0.893 -0.927 -0.832
Viet Nam 0.627 0.489 0.696 0.892 -1.986 -0.893 -0.927 -0.832
TALIS-PISA link
Australia 0.745 0.576 0.798 0.649 -2.176 -0.878 -0.994 -0.946
Ciudad Autónoma de Buenos Aires (Argentina)
0.524 0.858 0.707 0.612 -1.499 -0.877 -0.996 -0.700
Colombia 0.802 0.684 0.841 0.647 -1.542 -1.172 -1.515 -1.108
Czech Republic 0.704 0.654 0.819 0.692 -1.199 -0.343 -0.961 -0.712
Denmark 0.631 0.821 0.616 0.528 -1.493 -0.417 -0.313 -0.718
Georgia 0.897 0.862 0.810 0.805 -1.819 -1.767 -1.155 -0.912
Malta 0.661 0.721 0.635 0.517 -1.680 -0.613 -0.342 -0.316
Turkey 0.573 0.794 0.808 0.831 -1.318 -1.026 -1.021 -0.616
Viet Nam 0.384 0.530 0.734 0.621 -1.943 -0.945 -1.317 -2.000
1. Data from participating country/economy were rated as insufficient during the adjudication process.
2. Participating country/economy with late data collection.
Source: OECD, TALIS 2018 database.
Table 11.53. Standardised factor loadings and unstandardised intercepts for scale T3PDPED
Participating countries/economies
Standardised factor loadings Unstandardised intercepts
TT3G27A TT3G27B TT3G27C TT3G27D TT3G27F TT3G27A TT3G27B TT3G27C TT3G27D TT3G27F
ISCED level 2
Alberta (Canada) 0.733 0.775 0.808 0.714 0.614 2.011 2.031 1.879 2.356 1.949
Australia 0.719 0.754 0.758 0.738 0.607 2.020 2.088 2.112 2.295 1.998
Austria 0.600 0.655 0.667 0.594 0.517 2.006 2.164 1.808 2.244 2.411
Belgium 0.664 0.702 0.680 0.629 0.532 1.865 2.041 1.891 2.359 2.127
Flemish Community (Belgium)
0.758 0.727 0.776 0.610 0.542 1.866 2.050 1.722 2.358 2.281
Brazil 0.771 0.823 0.824 0.803 0.682 2.288 2.242 2.158 2.307 2.538
Bulgaria 0.820 0.862 0.854 0.846 0.735 2.341 2.349 2.103 2.414 2.663
Ciudad Autónoma de Buenos Aires (Argentina)
0.686 0.739 0.724 0.706 0.607 1.897 1.994 1.837 2.033 2.165
Chile 0.736 0.787 0.785 0.742 0.643 2.107 2.252 2.174 2.479 2.460
Colombia 0.736 0.810 0.828 0.827 0.734 2.537 2.753 2.603 2.759 2.757
Croatia 0.727 0.795 0.785 0.784 0.664 2.245 2.491 2.079 2.556 2.683
Cyprus 0.754 0.762 0.795 0.763 0.635 1.573 1.858 1.710 2.018 2.098
Czech Republic 0.584 0.687 0.741 0.727 0.584 2.338 2.174 1.838 2.166 2.511
Denmark 0.591 0.672 0.710 0.678 0.619 2.332 2.250 1.836 2.233 2.054
England (United Kingdom)
0.677 0.744 0.730 0.689 0.608 1.814 1.831 1.857 2.044 1.770
Estonia 0.672 0.747 0.791 0.775 0.647 2.358 2.351 2.300 2.495 2.584
Finland 0.631 0.706 0.719 0.695 0.581 2.194 2.128 2.388 2.612 2.238
France 0.634 0.686 0.697 0.653 0.526 1.961 2.342 1.862 2.530 2.246
Georgia 0.760 0.802 0.861 0.858 0.770 2.559 2.661 2.611 2.655 2.517

278
TALIS 2018 TECHNICAL REPORT © OECD 2019
Participating countries/economies
Standardised factor loadings Unstandardised intercepts
TT3G27A TT3G27B TT3G27C TT3G27D TT3G27F TT3G27A TT3G27B TT3G27C TT3G27D TT3G27F
Hungary 0.753 0.766 0.791 0.740 0.665 2.106 2.245 1.752 2.139 2.390
Iceland 0.602 0.638 0.723 0.726 0.559 2.447 2.385 2.479 2.818 2.625
Israel 0.761 0.812 0.825 0.802 0.693 2.386 2.497 2.153 2.423 2.457
Italy 0.662 0.710 0.768 0.749 0.607 2.231 2.436 2.147 2.411 2.504
Japan 0.701 0.745 0.647 0.723 0.610 3.492 3.552 3.065 3.334 3.352
Kazakhstan 0.802 0.838 0.867 0.844 0.759 2.744 2.765 2.743 2.872 2.631
Korea 0.802 0.840 0.855 0.852 0.756 2.739 2.867 2.705 2.853 2.908
Latvia 0.735 0.787 0.778 0.807 0.686 2.300 2.346 2.477 2.510 2.599
Lithuania 0.716 0.789 0.798 0.752 0.632 2.571 2.610 2.404 2.749 2.657
Malta 0.687 0.733 0.717 0.652 0.582 1.831 2.055 2.062 2.541 2.271
Mexico 0.794 0.837 0.780 0.817 0.718 2.191 2.435 2.270 2.330 2.327
Netherlands 0.578 0.662 0.706 0.582 0.580 2.312 2.206 2.096 2.403 2.298
New Zealand 0.729 0.758 0.833 0.751 0.626 2.020 2.072 1.923 2.216 1.973
Norway 0.620 0.677 0.674 0.717 0.599 2.497 2.570 2.429 2.689 2.479
Portugal 0.657 0.735 0.720 0.722 0.587 2.466 2.519 2.132 2.565 2.711
Romania 0.796 0.846 0.862 0.848 0.737 2.089 2.283 2.155 2.353 2.546
Russian Federation 0.821 0.853 0.893 0.872 0.807 2.405 2.437 2.168 2.257 2.210
Saudi Arabia 0.857 0.899 0.919 0.835 0.783 1.932 1.878 1.840 2.101 2.042
Shanghai (China) 0.843 0.884 0.902 0.841 0.745 2.941 3.052 2.956 3.037 2.939
Singapore 0.772 0.802 0.829 0.743 0.622 2.252 2.518 2.293 2.681 2.321
Slovak Republic 0.668 0.757 0.743 0.805 0.663 2.408 2.413 2.378 2.429 2.611
Slovenia 0.722 0.774 0.809 0.740 0.601 1.837 1.977 1.720 2.116 2.498
South Africa2 0.790 0.808 0.863 0.867 0.693 2.185 2.269 2.165 2.261 2.429
Spain 0.691 0.732 0.745 0.715 0.604 1.983 2.344 2.051 2.412 2.485
Sweden 0.632 0.712 0.780 0.735 0.613 2.113 2.131 1.983 2.333 2.138
Chinese Taipei 0.844 0.836 0.893 0.802 0.701 2.673 2.805 2.641 2.624 2.772
Turkey 0.812 0.839 0.829 0.825 0.741 1.609 1.723 1.657 1.737 1.703
United Arab Emirates 0.800 0.814 0.834 0.789 0.708 1.668 1.845 1.738 1.998 1.833
United States 0.765 0.780 0.819 0.688 0.606 1.805 1.934 1.869 2.153 1.978
Viet Nam 0.832 0.854 0.831 0.801 0.721 3.749 3.728 3.657 3.617 3.608
ISCED level 1
Australia1 0.782 0.801 0.813 0.739 0.633 1.989 2.018 2.040 2.296 2.025
Flemish Community (Belgium)
0.760 0.705 0.814 0.590 0.513 1.866 2.050 1.722 2.358 2.281
Ciudad Autónoma de Buenos Aires (Argentina)
0.704 0.777 0.766 0.766 0.610 1.897 1.994 1.837 2.033 2.165
Denmark 0.601 0.670 0.713 0.670 0.573 2.330 2.241 1.824 2.280 2.211
England (United Kingdom)
0.759 0.773 0.829 0.714 0.680 1.814 1.831 1.857 2.044 1.770
France 0.622 0.646 0.666 0.622 0.483 1.961 2.342 1.862 2.530 2.246
Japan 0.715 0.752 0.652 0.730 0.631 3.492 3.552 3.065 3.334 3.352
Korea 0.838 0.858 0.874 0.853 0.749 2.739 2.867 2.705 2.853 2.908
Netherlands1 0.638 0.666 0.708 0.656 0.570 2.313 2.177 2.292 2.175 2.463
Spain 0.720 0.772 0.765 0.741 0.646 1.983 2.344 2.051 2.412 2.485
Sweden 0.657 0.713 0.742 0.676 0.609 2.113 2.131 1.983 2.333 2.138
Chinese Taipei 0.834 0.845 0.889 0.822 0.687 2.673 2.805 2.641 2.624 2.772
Turkey 0.845 0.856 0.839 0.849 0.776 1.609 1.723 1.657 1.737 1.703
United Arab Emirates 0.817 0.830 0.854 0.802 0.720 1.668 1.845 1.738 1.998 1.833
Viet Nam 0.848 0.886 0.847 0.841 0.758 3.749 3.728 3.657 3.617 3.608
ISCED level 3
Alberta (Canada) 0.723 0.775 0.815 0.703 0.629 2.011 2.031 1.879 2.356 1.949

279
TALIS 2018 TECHNICAL REPORT © OECD 2019
Participating countries/economies
Standardised factor loadings Unstandardised intercepts
TT3G27A TT3G27B TT3G27C TT3G27D TT3G27F TT3G27A TT3G27B TT3G27C TT3G27D TT3G27F
Brazil 0.772 0.815 0.829 0.811 0.693 2.288 2.242 2.158 2.307 2.538
Croatia 0.705 0.806 0.799 0.791 0.667 2.245 2.491 2.079 2.556 2.683
Denmark 0.614 0.697 0.626 0.709 0.648 2.114 2.149 2.183 2.099 1.998
Portugal 0.658 0.747 0.715 0.732 0.579 2.466 2.519 2.132 2.565 2.711
Slovenia 0.675 0.756 0.815 0.792 0.622 2.024 2.071 1.732 1.967 2.381
Sweden 0.597 0.689 0.754 0.721 0.622 2.113 2.131 1.983 2.333 2.138
Chinese Taipei 0.816 0.838 0.871 0.785 0.683 2.673 2.805 2.641 2.624 2.772
Turkey 0.784 0.826 0.816 0.813 0.755 1.609 1.723 1.657 1.737 1.703
United Arab Emirates 0.804 0.797 0.839 0.755 0.687 1.668 1.845 1.738 1.998 1.833
Viet Nam 0.819 0.835 0.830 0.795 0.718 3.749 3.728 3.657 3.617 3.608
TALIS-PISA link
Australia 0.714 0.768 0.740 0.736 0.608 1.982 2.043 2.116 2.249 1.978
Ciudad Autónoma de Buenos Aires (Argentina)
0.654 0.753 0.727 0.749 0.641 1.835 2.048 1.818 2.056 2.138
Colombia 0.770 0.826 0.851 0.836 0.762 2.520 2.717 2.542 2.726 2.681
Czech Republic 0.587 0.714 0.732 0.754 0.615 2.444 2.194 1.863 2.111 2.399
Denmark 0.582 0.658 0.729 0.685 0.611 2.244 2.175 1.804 2.196 2.030
Georgia 0.753 0.808 0.847 0.832 0.749 2.524 2.607 2.515 2.615 2.465
Malta 0.716 0.751 0.756 0.699 0.629 1.791 2.036 1.970 2.403 2.126
Turkey 0.782 0.824 0.795 0.780 0.751 1.620 1.709 1.604 1.726 1.646
Viet Nam 0.822 0.861 0.841 0.813 0.746 3.712 3.696 3.629 3.576 3.566
1. Data from participating country/economy were rated as insufficient during the adjudication process.
2. Participating country/economy with late data collection.
Source: OECD, TALIS 2018 database.
Table 11.54. Standardised factor loadings and unstandardised intercepts for scale T3PDIV
Participating countries/economies Standardised factor loadings Unstandardised intercepts
TT3G27H TT3G27I TT3G27J TT3G27H TT3G27I TT3G27J
ISCED level 2
Alberta (Canada) 0.704 0.793 0.588 2.355 2.483 2.247
Australia 0.726 0.874 0.623 2.424 2.515 2.123
Austria 0.654 0.792 0.627 2.483 2.278 2.152
Belgium 0.670 0.842 0.633 2.318 2.535 1.972
Flemish Community (Belgium) 0.648 0.853 0.666 2.165 2.411 1.914
Brazil 0.593 0.805 0.591 2.504 3.350 3.080
Bulgaria 0.652 0.817 0.628 2.515 2.803 2.586
Ciudad Autónoma de Buenos Aires (Argentina) 0.660 0.808 0.624 2.272 2.886 2.532
Chile 0.703 0.850 0.595 2.583 3.010 2.817
Colombia 0.639 0.851 0.627 2.863 3.378 3.196
Croatia 0.769 0.913 0.518 2.891 3.052 2.243
Cyprus 0.694 0.801 0.679 2.237 2.670 2.455
Czech Republic 0.725 0.869 0.612 2.340 2.536 1.918
Denmark 0.657 0.795 0.612 2.186 2.592 2.109
England (United Kingdom) 0.706 0.865 0.621 2.074 2.230 1.935
Estonia 0.617 0.783 0.578 2.401 2.888 2.260
Finland 0.737 0.875 0.624 2.383 2.493 2.115
France 0.708 0.887 0.539 2.748 2.972 2.122
Georgia 0.673 0.793 0.646 2.636 2.511 2.120
Hungary 0.652 0.757 0.525 2.297 2.626 1.919

280
TALIS 2018 TECHNICAL REPORT © OECD 2019
Participating countries/economies Standardised factor loadings Unstandardised intercepts
TT3G27H TT3G27I TT3G27J TT3G27H TT3G27I TT3G27J
Iceland 0.744 0.935 0.673 2.576 2.729 2.705
Israel 0.648 0.787 0.618 2.102 2.590 2.196
Italy 0.740 0.907 0.586 2.453 2.671 2.507
Japan 0.702 0.832 0.532 3.344 3.345 2.700
Kazakhstan 0.621 0.735 0.600 2.651 2.403 2.381
Korea 0.688 0.935 0.787 2.809 2.460 2.529
Latvia 0.675 0.764 0.598 2.668 2.498 2.109
Lithuania 0.637 0.730 0.538 2.744 2.656 1.991
Malta 0.693 0.901 0.670 2.408 2.731 2.600
Mexico 0.610 0.838 0.562 2.581 3.326 3.108
Netherlands 0.543 0.727 0.591 2.684 2.466 1.878
New Zealand 0.725 0.795 0.714 2.422 2.496 2.266
Norway 0.717 0.856 0.606 2.240 2.670 2.326
Portugal 0.636 0.813 0.538 2.690 3.065 2.789
Romania 0.689 0.861 0.634 2.708 2.946 2.644
Russian Federation 0.642 0.811 0.591 2.285 2.386 2.073
Saudi Arabia 0.663 0.769 0.683 2.106 2.454 2.439
Shanghai (China) 0.738 0.820 0.630 3.087 2.685 2.556
Singapore 0.648 0.750 0.611 2.643 2.744 2.137
Slovak Republic 0.728 0.867 0.614 2.540 2.837 2.149
Slovenia 0.650 0.807 0.510 2.286 2.774 2.158
South Africa2 0.643 0.716 0.619 2.507 2.902 2.479
Spain 0.678 0.848 0.600 2.601 2.964 2.656
Sweden 0.806 0.932 0.627 2.339 2.578 2.281
Chinese Taipei 0.726 0.857 0.666 2.716 2.586 2.485
Turkey 0.764 0.933 0.637 2.094 2.422 2.464
United Arab Emirates 0.736 0.821 0.680 2.025 2.433 2.056
United States 0.726 0.877 0.655 2.289 2.332 2.110
Viet Nam 0.664 0.692 0.488 3.178 2.690 2.259
ISCED level 1
Australia1 0.695 0.851 0.605 2.321 2.445 2.085
Flemish Community (Belgium) 0.641 0.819 0.575 2.165 2.411 1.914
Ciudad Autónoma de Buenos Aires (Argentina) 0.638 0.813 0.603 2.272 2.886 2.532
Denmark 0.663 0.770 0.584 2.239 2.790 2.178
England (United Kingdom) 0.722 0.840 0.588 1.963 2.205 1.922
France 0.697 0.856 0.475 2.748 2.972 2.122
Japan 0.715 0.882 0.525 3.344 3.345 2.700
Korea 0.699 0.884 0.719 2.809 2.460 2.529
Netherlands1 0.616 0.761 0.557 2.634 2.799 1.891
Spain 0.689 0.849 0.601 2.601 2.964 2.656
Sweden 0.749 0.898 0.591 2.339 2.578 2.281
Chinese Taipei 0.742 0.855 0.660 2.716 2.586 2.485
Turkey 0.781 0.941 0.662 2.094 2.422 2.464
United Arab Emirates 0.738 0.834 0.692 2.025 2.433 2.056
Viet Nam 0.668 0.680 0.443 3.339 3.032 2.349
ISCED level 3
Alberta (Canada) 0.695 0.839 0.631 2.355 2.483 2.247
Brazil 0.589 0.818 0.608 2.504 3.350 3.080
Croatia 0.742 0.842 0.592 2.891 3.052 2.243
Denmark 0.659 0.846 0.712 2.048 2.092 1.897
Portugal 0.641 0.807 0.586 2.690 3.065 2.789

281
TALIS 2018 TECHNICAL REPORT © OECD 2019
Participating countries/economies Standardised factor loadings Unstandardised intercepts
TT3G27H TT3G27I TT3G27J TT3G27H TT3G27I TT3G27J
Slovenia 0.678 0.828 0.589 2.286 2.774 2.158
Sweden 0.777 0.920 0.663 2.339 2.578 2.281
Chinese Taipei 0.723 0.873 0.657 2.716 2.586 2.485
Turkey 0.744 0.901 0.647 2.094 2.422 2.464
United Arab Emirates 0.700 0.795 0.655 2.025 2.433 2.056
Viet Nam 0.678 0.711 0.539 3.078 2.488 2.264
TALIS-PISA link
Australia 0.737 0.897 0.641 2.385 2.420 2.131
Ciudad Autónoma de Buenos Aires (Argentina) 0.663 0.826 0.612 2.352 2.936 2.506
Colombia 0.610 0.840 0.612 2.832 3.401 3.183
Czech Republic 0.711 0.845 0.620 2.254 2.431 1.865
Denmark 0.619 0.763 0.596 2.117 2.475 1.977
Georgia 0.671 0.771 0.623 2.648 2.474 2.047
Malta 0.727 0.896 0.675 2.424 2.699 2.541
Turkey 0.744 0.917 0.667 2.035 2.341 2.364
Viet Nam 0.672 0.750 0.548 3.081 2.564 2.295
1. Data from participating country/economy were rated as insufficient during the adjudication process.
2. Participating country/economy with late data collection.
Source: OECD, TALIS 2018 database.
Table 11.55. Standardised factor loadings and unstandardised intercepts for scale T3PDBAR
Participating countries/economies
Standardised factor loadings Unstandardised intercepts
TT3G28A TT3G28B TT3G28C TT3G28E TT3G28F TT3G28A TT3G28B TT3G28C TT3G28E TT3G28F
ISCED level 2
Alberta (Canada) 0.329 0.641 0.737 0.256 0.341 1.449 2.290 1.869 2.293 2.182
Australia 0.381 0.670 0.702 0.305 0.442 1.509 2.322 1.983 2.094 1.965
Austria 0.329 0.752 0.552 0.240 0.128 1.237 1.525 1.496 1.856 2.450
Belgium 0.480 0.658 0.541 0.335 0.261 1.556 2.000 1.844 2.258 2.268
Flemish Community (Belgium)
0.345 0.539 0.664 0.308 0.405 1.394 1.947 1.827 2.132 2.134
Brazil 0.163 0.544 0.768 0.294 0.583 1.388 2.552 2.841 2.057 2.378
Bulgaria 0.464 0.416 0.658 0.391 0.451 1.486 2.602 1.697 1.958 2.297
Ciudad Autónoma de Buenos Aires (Argentina)
0.320 0.621 0.616 0.251 0.455 1.603 2.388 2.264 2.593 2.423
Chile 0.172 0.547 0.685 0.331 0.682 1.669 3.055 2.771 2.493 2.747
Colombia 0.233 0.629 0.642 0.214 0.403 1.653 3.053 2.814 2.004 2.354
Croatia 0.322 0.694 0.635 0.302 0.407 1.348 2.197 1.904 2.016 2.273
Cyprus 0.337 0.566 0.692 0.368 0.529 1.512 2.242 2.344 2.520 2.392
Czech Republic 0.375 0.646 0.567 0.303 0.271 1.456 2.103 1.834 2.209 2.050
Denmark 0.228 0.568 0.702 0.051 0.195 1.441 2.487 1.920 1.902 2.273
England (United Kingdom)
0.294 0.551 0.763 0.267 0.554 1.553 2.565 2.107 2.111 2.133
Estonia 0.340 0.707 0.650 0.394 0.495 1.446 2.120 1.780 1.999 2.141
Finland 0.212 0.735 0.733 0.103 0.303 1.308 2.195 2.040 2.193 2.320
France 0.465 0.741 0.633 0.293 0.224 1.528 1.906 1.744 2.303 2.255
Georgia 0.549 0.682 0.689 0.524 0.648 1.653 2.078 1.820 1.966 2.040
Hungary 0.217 0.723 0.624 0.321 0.293 1.329 2.612 1.846 2.049 2.137
Iceland 0.236 0.763 0.510 0.346 0.359 1.352 2.200 1.763 2.359 2.331
Israel 0.459 0.694 0.682 0.314 0.302 1.376 1.798 1.897 2.477 2.046

282
TALIS 2018 TECHNICAL REPORT © OECD 2019
Participating countries/economies
Standardised factor loadings Unstandardised intercepts
TT3G28A TT3G28B TT3G28C TT3G28E TT3G28F TT3G28A TT3G28B TT3G28C TT3G28E TT3G28F
Italy 0.348 0.558 0.645 0.214 0.339 1.716 2.529 2.248 2.275 2.398
Japan 0.486 0.787 0.729 0.363 0.440 2.119 2.670 2.619 2.869 2.282
Kazakhstan 0.435 0.627 0.695 0.510 0.496 1.843 2.239 2.226 2.336 2.036
Korea 0.428 0.779 0.660 0.395 0.383 2.302 2.625 2.869 2.807 2.341
Latvia 0.393 0.624 0.629 0.494 0.510 1.417 2.227 1.752 1.980 1.998
Lithuania 0.337 0.617 0.614 0.432 0.463 1.330 2.504 1.979 1.800 2.367
Malta 0.358 0.689 0.584 0.370 0.365 1.536 2.060 2.142 2.628 2.221
Mexico 0.250 0.609 0.790 0.334 0.603 1.945 2.607 2.830 2.113 2.574
Netherlands 0.284 0.594 0.753 0.243 0.650 1.456 1.959 2.055 1.964 2.197
New Zealand 0.336 0.633 0.689 0.300 0.427 1.534 2.364 2.020 2.123 2.259
Norway 0.197 0.844 0.606 0.047 0.059 1.513 2.320 2.109 2.049 1.886
Portugal 0.195 0.704 0.639 0.319 0.398 1.509 2.744 3.221 2.526 2.736
Romania 0.352 0.542 0.593 0.344 0.371 1.620 2.850 1.956 2.244 2.048
Russian Federation 0.305 0.624 0.612 0.477 0.509 1.739 2.255 2.064 2.349 2.049
Saudi Arabia 0.410 0.639 0.725 0.482 0.637 1.969 2.445 2.896 2.574 2.787
Shanghai (China) 0.502 0.672 0.896 0.533 0.800 1.882 2.059 2.074 2.290 2.107
Singapore 0.521 0.700 0.685 0.305 0.469 1.822 2.021 2.028 2.346 2.064
Slovak Republic 0.368 0.633 0.440 0.377 0.229 1.499 2.341 1.774 2.260 2.361
Slovenia 0.309 0.640 0.608 0.237 0.334 1.325 2.388 1.857 2.093 2.187
South Africa2 0.348 0.580 0.625 0.401 0.487 1.712 2.313 2.510 2.006 2.157
Spain 0.364 0.599 0.501 0.225 0.338 1.428 2.280 2.086 2.643 2.575
Sweden 0.061 0.496 0.883 0.056 0.372 1.278 2.411 2.125 1.731 2.245
Chinese Taipei 0.561 0.798 0.617 0.343 0.428 1.850 2.186 2.154 2.615 2.353
Turkey 0.237 0.640 0.812 0.302 0.556 1.497 2.317 2.567 2.216 2.512
United Arab Emirates 0.329 0.603 0.763 0.460 0.618 1.416 2.264 2.154 2.135 2.162
United States 0.384 0.643 0.641 0.291 0.460 1.530 2.203 1.898 2.331 2.081
Viet Nam 0.491 0.738 0.728 0.550 0.610 1.859 2.220 2.316 2.052 2.109
ISCED level 1
Australia1 0.398 0.624 0.724 0.342 0.466 1.605 2.474 2.009 2.114 1.950
Flemish Community (Belgium)
0.356 0.513 0.687 0.325 0.465 1.381 2.171 1.842 2.109 1.942
Ciudad Autónoma de Buenos Aires (Argentina)
0.302 0.602 0.624 0.256 0.486 1.760 2.620 2.243 2.731 2.384
Denmark 0.189 0.505 0.605 0.047 0.174 1.482 2.602 2.007 1.836 2.281
England (United Kingdom)
0.311 0.578 0.795 0.278 0.604 1.553 2.565 2.107 2.111 2.133
France 0.464 0.746 0.577 0.315 0.240 1.668 2.006 2.188 2.519 2.427
Japan 0.480 0.771 0.729 0.361 0.436 2.119 2.670 2.619 2.869 2.282
Korea 0.415 0.793 0.652 0.391 0.374 2.302 2.625 2.869 2.807 2.341
Netherlands1 0.340 0.604 0.775 0.251 0.643 1.502 2.112 2.029 2.074 2.133
Spain 0.381 0.619 0.574 0.241 0.371 1.523 2.426 1.923 2.614 2.330
Sweden 0.063 0.479 0.897 0.052 0.374 1.278 2.411 2.125 1.731 2.245
Chinese Taipei 0.541 0.766 0.620 0.329 0.420 1.850 2.186 2.154 2.615 2.353
Turkey 0.229 0.634 0.821 0.300 0.572 1.497 2.317 2.567 2.216 2.512
United Arab Emirates 0.324 0.606 0.781 0.450 0.622 1.416 2.264 2.154 2.135 2.162
Viet Nam 0.511 0.753 0.767 0.569 0.646 1.859 2.220 2.316 2.052 2.109
ISCED level 3
Alberta (Canada) 0.335 0.646 0.701 0.254 0.328 1.449 2.290 1.869 2.293 2.182
Brazil 0.154 0.548 0.767 0.290 0.564 1.388 2.552 2.841 2.057 2.378
Croatia 0.325 0.674 0.597 0.304 0.378 1.348 2.197 1.904 2.016 2.273
Denmark 0.251 0.636 0.702 0.053 0.202 1.316 2.131 1.880 1.828 2.128

283
TALIS 2018 TECHNICAL REPORT © OECD 2019
Participating countries/economies
Standardised factor loadings Unstandardised intercepts
TT3G28A TT3G28B TT3G28C TT3G28E TT3G28F TT3G28A TT3G28B TT3G28C TT3G28E TT3G28F
Portugal 0.186 0.674 0.607 0.314 0.377 1.509 2.744 3.221 2.526 2.736
Slovenia 0.347 0.640 0.603 0.249 0.301 1.251 2.204 1.886 2.011 2.462
Sweden 0.072 0.511 0.895 0.057 0.385 1.278 2.411 2.125 1.731 2.245
Chinese Taipei 0.556 0.771 0.589 0.346 0.438 1.850 2.186 2.154 2.615 2.353
Turkey 0.230 0.651 0.802 0.299 0.553 1.497 2.317 2.567 2.216 2.512
United Arab Emirates 0.359 0.629 0.801 0.483 0.644 1.416 2.264 2.154 2.135 2.162
Viet Nam 0.475 0.684 0.733 0.507 0.607 1.859 2.220 2.316 2.052 2.109
TALIS-PISA link
Australia 0.377 0.699 0.751 0.275 0.416 1.526 2.325 2.037 2.175 2.063
Ciudad Autónoma de Buenos Aires (Argentina)
0.230 0.579 0.648 0.281 0.598 1.578 2.484 2.282 2.593 2.421
Colombia 0.233 0.592 0.654 0.167 0.370 1.631 3.107 2.801 2.092 2.352
Czech Republic 0.365 0.674 0.625 0.382 0.260 1.452 2.140 1.877 2.190 2.078
Denmark 0.160 0.427 0.953 -0.023 0.107 1.428 2.461 1.991 1.866 2.214
Georgia 0.542 0.589 0.755 0.530 0.600 1.598 2.065 1.780 1.908 1.949
Malta 0.359 0.756 0.590 0.392 0.300 1.481 2.052 2.074 2.630 2.298
Turkey 0.252 0.567 0.771 0.363 0.550 1.456 2.289 2.492 2.183 2.438
Viet Nam 0.460 0.729 0.692 0.434 0.581 1.859 2.250 2.350 2.051 2.119
1. Data from participating country/economy were rated as insufficient during the adjudication process.
2. Participating country/economy with late data collection.
Source: OECD, TALIS 2018 database.
Self-efficacy: Teacher self-efficacy, composite (T3SELF); Self-efficacy in
classroom management (T3SECLS); Self-efficacy in instruction (T3SEINS);
Self-efficacy in student engagement (T3SEENG)
11.23. Measured items
Three subscales and one composite scale measuring teacher self-efficacy were developed
from the following question stem:
“In your teaching, to what extent can you do the following?” (TT3G34). The
question contained items on managing student behaviour, which were used to form
the subscale Self-efficacy in classroom management (T3SECLS), items on flexible
instruction strategies, used to form the subscale Self-efficacy in instruction
(T3SEINS), and items on engaging students in the lessons, used for the subscale
Self-efficacy in student engagement (T3SEENG).
These three subscales, presented in Table 11.56, formed the multidimensional scale
Teacher self-efficacy, composite (T3SELF).
11.24. Model improvements
Subscale T3SECLS was improved by adding a correlation between items TT3G34D and
TT3G34I, and the subscale T3SEENG by adding a correlation between items TT3G34A
and TT3G34B.
11.25. Scale reliability
Table 11.57 presents the reliability coefficients (omega for the subscales, stratified
Cronbach’s alpha for T3SELF) for all populations for each scale. In general, as evident

284
TALIS 2018 TECHNICAL REPORT © OECD 2019
from the table, the subscales T3SECLS, T3SEINS and T3SEENG have high reliabilities
for most populations. The reliability coefficients are slightly lower (below 0.700),
however, in the Netherlands ISCED level 2 population for the scale T3SEINS, while some
of the omega values for scale T3SEENG are below 0.700 for several populations: Austria,
the Czech Republic, the Netherlands and Norway for ISCED level 2; and Denmark and
Sweden for ISCED level 3.
11.26. Model fits
The model fit indices for the subscales T3SECLS, T3SEINS and T3SEENG are presented
in Tables 11.58, 11.59 and 11.60 respectively. All populations exhibit an acceptable fit for
both T3SECLS and T3SEINS, with the exception of the Columbia TALIS-PISA link
population. The fit indices for T3SEENG are acceptable for all populations except the
Netherlands ISCED level 1 and the TALIS-PISA link populations in Columbia and
Viet Nam.
11.27. Invariance testing
Tables 11.61, 11.62 and 11.63 present the invariance results for the subscales T3SECLS,
T3SEINS and T3SEENG respectively. All three subscales reached metric invariance for
all ISCED levels. Because, for T3SEENG, the configural model shows an almost perfect
fit and the metric model fit is good, the criteria for establishing metric invariance were
relaxed slightly. In such instances, when the model fit of the liberal model is almost perfect,
it is common that the more restrictive model causes changes in the fit indices, resulting in
model rejection. Therefore, the absolute fit of the more restrictive (i.e. metric) model
should be considered as an evaluation criterion. Accordingly, the invariance level of
T3SELF is considered as metric for all ISCED levels.
11.28. Item parameters
Table 11.64 presents the unstandardised factor loadings for the self-efficacy subscales.
Because T3SELF was computed as an average of the subscales, there are no item
parameters for this scale.
The standardised factor loadings and unstandardised intercepts for the self-efficacy
subscales are presented in Tables 11.65, 11.66 and 11.67 for T3SECLS, T3SEINS and
T3SEENG respectively. The factor loadings of items in subscale T3SECLS are high for all
items for almost all populations. The same is true for subscale T3SEINS, with the
exception of item TT3G34C, which has the most factor loadings between 0.450 and 0.600,
and subscale T3SEENG, with the exception of item TT3G34G, which has a number of
populations with factor loadings between 0.450 and 0.600.

285
TALIS 2018 TECHNICAL REPORT © OECD 2019
Table 11.56. Item wording for teacher self-efficacy scales
T3SELF: Teacher self-efficacy, composite
T3SECLS: Self-efficacy in classroom management (subscale)
TT3G34: In your teaching, to what extent can you do the following?
Response options: “Not at all” (1), “To some extent” (2), “Quite a bit” (3), “A lot” (4).
TT2G34D Control disruptive behaviour in the classroom
TT2G34F Make my expectations about student behaviour clear
TT2G34H Get students to follow classroom rules
TT2G34I Calm a student who is disruptive or noisy
T3SEINS: Self-efficacy in instruction (subscale)
TT3G34: In your teaching, to what extent can you do the following?
Response options: “Not at all” (1), “To some extent” (2), “Quite a bit” (3), “A lot” (4).
TT2G34C Craft good questions for students
TT2G34J Use a variety of assessment strategies
TT2G34K Provide an alternative explanation, for example when students are confused
TT2G34L Vary instructional strategies in my classroom
T3SEENG: Self-efficacy in student engagement (subscale)
TT3G34: In your teaching, to what extent can you do the following?
Response options: “Not at all” (1), “To some extent” (2), “Quite a bit” (3), “A lot” (4).
TT2G34A Get students to believe they can do well in school work
TT2G34B Help students value learning
TT2G34E Motivate students who show low interest in school work
TT2G34G Help students think critically
Source: OECD, TALIS 2018 database.
Table 11.57. Reliability coefficients for teacher self-efficacy scales
Participating countries/economies T3SECLS T3SEINS T3SEENG T3SELF
Omega coefficient3 Stratified Cronbach’s alpha
ISCED level 2
Alberta (Canada) 0.854 0.797 0.767 0.902
Australia 0.846 0.787 0.776 0.904
Austria 0.801 0.745 0.664 0.868
Belgium 0.856 0.762 0.759 0.898
Flemish Community (Belgium) 0.859 0.726 0.762 0.891
Brazil 0.837 0.826 0.797 0.920
Bulgaria 0.757 0.789 0.717 0.881
Ciudad Autónoma de Buenos Aires (Argentina) 0.845 0.783 0.738 0.899
Chile 0.861 0.826 0.776 0.921
Colombia 0.812 0.771 0.774 0.902
Croatia 0.848 0.789 0.748 0.902
Cyprus 0.852 0.819 0.796 0.922
Czech Republic 0.803 0.711 0.697 0.868
Denmark 0.805 0.753 0.711 0.881
England (United Kingdom) 0.856 0.778 0.773 0.905
Estonia 0.764 0.771 0.734 0.885
Finland 0.874 0.792 0.766 0.913
France 0.839 0.734 0.731 0.887
Georgia 0.812 0.830 0.760 0.917
Hungary 0.806 0.728 0.721 0.878

286
TALIS 2018 TECHNICAL REPORT © OECD 2019
Participating countries/economies T3SECLS T3SEINS T3SEENG T3SELF
Omega coefficient3 Stratified Cronbach’s alpha
Iceland 0.803 0.794 0.748 0.897
Israel 0.880 0.823 0.797 0.926
Italy 0.781 0.778 0.729 0.890
Japan 0.876 0.797 0.724 0.913
Kazakhstan 0.792 0.801 0.729 0.901
Korea 0.884 0.874 0.801 0.941
Latvia 0.801 0.773 0.746 0.884
Lithuania 0.850 0.801 0.723 0.903
Malta 0.837 0.801 0.805 0.915
Mexico 0.815 0.787 0.728 0.896
Netherlands 0.812 0.682 0.684 0.860
New Zealand 0.843 0.774 0.776 0.904
Norway 0.814 0.706 0.642 0.856
Portugal 0.870 0.717 0.702 0.888
Romania 0.826 0.837 0.799 0.920
Russian Federation 0.843 0.841 0.762 0.919
Saudi Arabia 0.874 0.884 0.834 0.944
Shanghai (China) 0.945 0.910 0.882 0.965
Singapore 0.854 0.835 0.810 0.927
Slovak Republic 0.817 0.781 0.733 0.899
Slovenia 0.814 0.752 0.746 0.886
South Africa2 0.837 0.805 0.796 0.920
Spain 0.848 0.759 0.753 0.898
Sweden 0.837 0.787 0.731 0.896
Chinese Taipei 0.885 0.839 0.771 0.925
Turkey 0.882 0.826 0.814 0.933
United Arab Emirates 0.857 0.852 0.812 0.932
United States 0.845 0.821 0.801 0.911
Viet Nam 0.743 0.787 0.709 0.888
ISCED level 1
Australia1 0.856 0.826 0.781 0.916
Flemish Community (Belgium) 0.848 0.753 0.728 0.891
Ciudad Autónoma de Buenos Aires (Argentina) 0.828 0.797 0.729 0.901
Denmark 0.817 0.719 0.706 0.882
England (United Kingdom) 0.834 0.806 0.773 0.909
France 0.803 0.736 0.711 0.882
Japan 0.865 0.832 0.762 0.923
Korea 0.904 0.874 0.810 0.945
Netherlands1 0.869 0.796 0.806 0.912
Spain 0.845 0.796 0.766 0.910
Sweden 0.845 0.783 0.736 0.902
Chinese Taipei 0.878 0.852 0.783 0.930
Turkey 0.867 0.854 0.821 0.938
United Arab Emirates 0.845 0.861 0.805 0.932
Viet Nam 0.757 0.792 0.704 0.893
ISCED level 3
Alberta (Canada) 0.845 0.769 0.773 0.898
Brazil 0.834 0.817 0.794 0.918
Croatia 0.843 0.769 0.759 0.900
Denmark 0.817 0.719 0.689 0.873
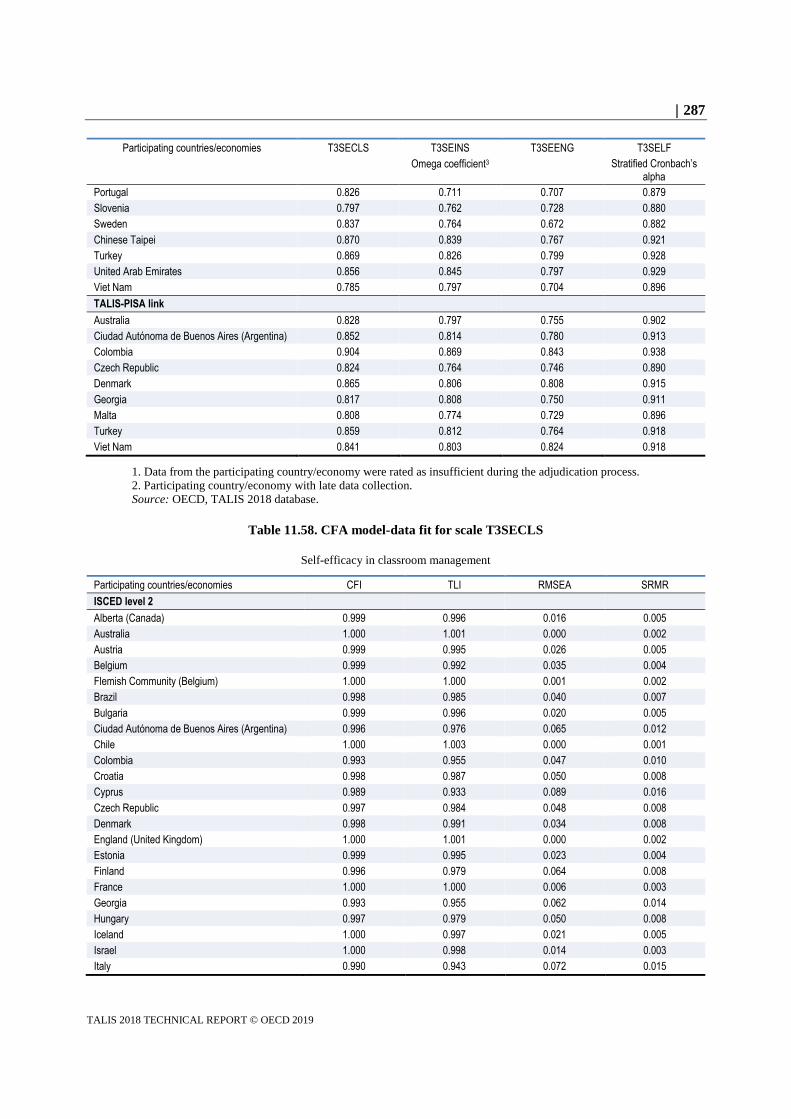
287
TALIS 2018 TECHNICAL REPORT © OECD 2019
Participating countries/economies T3SECLS T3SEINS T3SEENG T3SELF
Omega coefficient3 Stratified Cronbach’s alpha
Portugal 0.826 0.711 0.707 0.879
Slovenia 0.797 0.762 0.728 0.880
Sweden 0.837 0.764 0.672 0.882
Chinese Taipei 0.870 0.839 0.767 0.921
Turkey 0.869 0.826 0.799 0.928
United Arab Emirates 0.856 0.845 0.797 0.929
Viet Nam 0.785 0.797 0.704 0.896
TALIS-PISA link
Australia 0.828 0.797 0.755 0.902
Ciudad Autónoma de Buenos Aires (Argentina) 0.852 0.814 0.780 0.913
Colombia 0.904 0.869 0.843 0.938
Czech Republic 0.824 0.764 0.746 0.890
Denmark 0.865 0.806 0.808 0.915
Georgia 0.817 0.808 0.750 0.911
Malta 0.808 0.774 0.729 0.896
Turkey 0.859 0.812 0.764 0.918
Viet Nam 0.841 0.803 0.824 0.918
1. Data from the participating country/economy were rated as insufficient during the adjudication process.
2. Participating country/economy with late data collection.
Source: OECD, TALIS 2018 database.
Table 11.58. CFA model-data fit for scale T3SECLS
Self-efficacy in classroom management
Participating countries/economies CFI TLI RMSEA SRMR
ISCED level 2
Alberta (Canada) 0.999 0.996 0.016 0.005
Australia 1.000 1.001 0.000 0.002
Austria 0.999 0.995 0.026 0.005
Belgium 0.999 0.992 0.035 0.004
Flemish Community (Belgium) 1.000 1.000 0.001 0.002
Brazil 0.998 0.985 0.040 0.007
Bulgaria 0.999 0.996 0.020 0.005
Ciudad Autónoma de Buenos Aires (Argentina) 0.996 0.976 0.065 0.012
Chile 1.000 1.003 0.000 0.001
Colombia 0.993 0.955 0.047 0.010
Croatia 0.998 0.987 0.050 0.008
Cyprus 0.989 0.933 0.089 0.016
Czech Republic 0.997 0.984 0.048 0.008
Denmark 0.998 0.991 0.034 0.008
England (United Kingdom) 1.000 1.001 0.000 0.002
Estonia 0.999 0.995 0.023 0.004
Finland 0.996 0.979 0.064 0.008
France 1.000 1.000 0.006 0.003
Georgia 0.993 0.955 0.062 0.014
Hungary 0.997 0.979 0.050 0.008
Iceland 1.000 0.997 0.021 0.005
Israel 1.000 0.998 0.014 0.003
Italy 0.990 0.943 0.072 0.015

288
TALIS 2018 TECHNICAL REPORT © OECD 2019
Participating countries/economies CFI TLI RMSEA SRMR
Japan 0.992 0.954 0.090 0.011
Kazakhstan 0.983 0.896 0.072 0.020
Korea 0.998 0.985 0.053 0.006
Latvia 0.999 0.992 0.025 0.006
Lithuania 0.981 0.884 0.110 0.015
Malta 0.999 0.996 0.022 0.005
Mexico 1.000 1.001 0.000 0.002
Netherlands 1.000 1.003 0.000 0.000
New Zealand 0.996 0.976 0.047 0.009
Norway 1.000 0.999 0.011 0.003
Portugal 0.996 0.974 0.064 0.012
Romania 0.994 0.964 0.056 0.009
Russian Federation 0.969 0.812 0.110 0.033
Saudi Arabia 0.975 0.851 0.127 0.028
Shanghai (China) 0.983 0.900 0.137 0.017
Singapore 0.998 0.987 0.039 0.007
Slovak Republic 0.994 0.964 0.075 0.012
Slovenia 0.992 0.950 0.083 0.013
South Africa2 0.994 0.993 0.021 0.073
Spain 1.000 1.001 0.000 0.002
Sweden 1.000 1.003 0.000 0.002
Chinese Taipei 0.992 0.954 0.077 0.012
Turkey 0.996 0.973 0.056 0.012
United Arab Emirates 0.997 0.985 0.036 0.008
United States 0.993 0.958 0.056 0.013
Viet Nam 0.968 0.806 0.104 0.022
ISCED level 1
Australia1 0.991 0.989 0.036 0.133
Flemish Community (Belgium) 1.000 1.000 0.000 0.003
Ciudad Autónoma de Buenos Aires (Argentina) 0.995 0.973 0.048 0.011
Denmark 0.997 0.984 0.042 0.007
England (United Kingdom) 0.999 0.992 0.029 0.005
France 0.997 0.983 0.037 0.009
Japan 0.993 0.959 0.083 0.012
Korea 0.995 0.971 0.069 0.010
Netherlands1 0.953 0.944 0.086 0.455
Spain 0.999 0.996 0.018 0.004
Sweden 0.997 0.984 0.045 0.008
Chinese Taipei 0.992 0.954 0.082 0.012
Turkey 0.995 0.967 0.041 0.008
United Arab Emirates 0.996 0.976 0.040 0.011
Viet Nam 0.988 0.930 0.073 0.012
ISCED level 3
Alberta (Canada) 1.000 1.001 0.000 0.004
Brazil 1.000 1.003 0.000 0.001
Croatia 0.994 0.966 0.058 0.009
Denmark 0.999 0.995 0.021 0.006
Portugal 0.993 0.957 0.053 0.011
Slovenia 0.991 0.948 0.081 0.015
Sweden 0.999 0.997 0.018 0.004
Chinese Taipei 0.998 0.985 0.048 0.008
Turkey 0.993 0.959 0.049 0.012

289
TALIS 2018 TECHNICAL REPORT © OECD 2019
Participating countries/economies CFI TLI RMSEA SRMR
United Arab Emirates 0.993 0.960 0.054 0.011
Viet Nam 0.985 0.910 0.083 0.018
TALIS-PISA link
Australia 0.983 0.979 0.044 0.099
Ciudad Autónoma de Buenos Aires (Argentina) 0.985 0.982 0.041 0.099
Colombia 0.782 0.739 0.108 0.969
Czech Republic 0.994 0.993 0.028 0.080
Denmark 0.971 0.965 0.042 0.317
Georgia 0.962 0.954 0.045 0.146
Malta 0.940 0.928 0.104 0.138
Turkey 0.998 0.998 0.020 0.067
Viet Nam 0.969 0.963 0.077 0.401
1. Data from the participating country/economy were rated as insufficient during the adjudication process.
2. Participating country/economy with late data collection.
Source: OECD, TALIS 2018 database.
Table 11.59. CFA model-data fit for scale T3SEINS
Self-efficacy in instruction
Participating countries/economies CFI TLI RMSEA SRMR
ISCED level 2
Alberta (Canada) 0.978 0.934 0.082 0.023
Australia 0.995 0.984 0.035 0.012
Austria 0.997 0.992 0.026 0.009
Belgium 0.973 0.920 0.082 0.023
Flemish Community (Belgium) 0.962 0.885 0.086 0.024
Brazil 0.990 0.970 0.058 0.016
Bulgaria 0.987 0.962 0.061 0.018
Ciudad Autónoma de Buenos Aires (Argentina) 0.997 0.991 0.041 0.011
Chile 0.995 0.986 0.037 0.012
Colombia 0.994 0.983 0.032 0.013
Croatia 0.996 0.989 0.028 0.008
Cyprus 0.982 0.945 0.086 0.017
Czech Republic 1.000 1.001 0.000 0.005
Denmark 1.000 1.000 0.000 0.006
England (United Kingdom) 0.967 0.900 0.101 0.027
Estonia 1.000 1.001 0.000 0.004
Finland 0.990 0.971 0.058 0.016
France 0.941 0.824 0.128 0.028
Georgia 0.991 0.974 0.049 0.016
Hungary 0.992 0.977 0.041 0.013
Iceland 0.985 0.955 0.076 0.019
Israel 0.956 0.867 0.116 0.028
Italy 0.985 0.955 0.072 0.019
Japan 0.995 0.986 0.042 0.012
Kazakhstan 0.994 0.982 0.031 0.012
Korea 0.984 0.952 0.094 0.017
Latvia 1.000 1.004 0.000 0.003
Lithuania 0.993 0.980 0.045 0.013
Malta 0.993 0.978 0.051 0.015
Mexico 0.994 0.982 0.044 0.011

290
TALIS 2018 TECHNICAL REPORT © OECD 2019
Participating countries/economies CFI TLI RMSEA SRMR
Netherlands 0.975 0.924 0.061 0.021
New Zealand 0.988 0.963 0.057 0.017
Norway 0.996 0.987 0.032 0.010
Portugal 0.995 0.985 0.032 0.012
Romania 0.988 0.964 0.056 0.014
Russian Federation 0.998 0.995 0.017 0.009
Saudi Arabia 0.986 0.957 0.072 0.019
Shanghai (China) 1.000 1.000 0.005 0.003
Singapore 0.988 0.964 0.069 0.015
Slovak Republic 1.000 1.003 0.000 0.002
Slovenia 0.984 0.952 0.069 0.019
South Africa2 0.993 0.993 0.020 0.070
Spain 0.986 0.959 0.041 0.017
Sweden 0.988 0.965 0.059 0.016
Chinese Taipei 0.990 0.970 0.067 0.016
Turkey 0.992 0.977 0.049 0.013
United Arab Emirates 0.994 0.983 0.038 0.011
United States 0.902 0.706 0.141 0.028
Viet Nam 1.000 1.001 0.000 0.004
ISCED level 1
Australia1 0.989 0.989 0.034 0.055
Flemish Community (Belgium) 0.955 0.866 0.112 0.027
Ciudad Autónoma de Buenos Aires (Argentina) 0.979 0.938 0.078 0.024
Denmark 0.984 0.952 0.056 0.018
England (United Kingdom) 0.989 0.966 0.047 0.020
France 0.960 0.881 0.095 0.027
Japan 0.995 0.986 0.045 0.012
Korea 0.987 0.962 0.077 0.017
Netherlands1 0.966 0.966 0.054 0.191
Spain 0.993 0.979 0.032 0.013
Sweden 0.988 0.963 0.061 0.016
Chinese Taipei 0.995 0.986 0.043 0.010
Turkey 1.000 1.005 0.000 0.002
United Arab Emirates 0.992 0.977 0.044 0.012
Viet Nam 1.000 0.999 0.011 0.005
ISCED level 3
Alberta (Canada) 0.942 0.826 0.115 0.031
Brazil 0.990 0.971 0.049 0.018
Croatia 0.989 0.966 0.056 0.015
Denmark 0.995 0.984 0.033 0.013
Portugal 0.998 0.993 0.020 0.009
Slovenia 0.991 0.973 0.052 0.013
Sweden 0.978 0.933 0.070 0.025
Chinese Taipei 0.984 0.951 0.086 0.019
Turkey 0.996 0.989 0.025 0.011
United Arab Emirates 0.995 0.985 0.033 0.012
Viet Nam 0.999 0.996 0.020 0.007
TALIS-PISA link
Australia 0.980 0.980 0.049 0.047
Ciudad Autónoma de Buenos Aires (Argentina) 0.963 0.963 0.047 0.240
Colombia 0.566 0.566 0.125 0.961
Czech Republic 0.957 0.957 0.043 0.157

291
TALIS 2018 TECHNICAL REPORT © OECD 2019
Participating countries/economies CFI TLI RMSEA SRMR
Denmark 0.995 0.995 0.027 0.144
Georgia 0.984 0.984 0.028 0.089
Malta 0.954 0.954 0.079 0.131
Turkey 0.991 0.991 0.033 0.188
Viet Nam 0.946 0.946 0.046 0.178
1. Data from participating country/economy were rated as insufficient during the adjudication process.
2. Participating country/economy with late data collection.
Source: OECD, TALIS 2018 database.
Table 11.60. CFA model-data fit for scale T3SEENG
Self-efficacy in student engagement
Participating countries/economies CFI TLI RMSEA SRMR
ISCED level 2
Alberta (Canada) 0.984 0.901 0.100 0.013
Australia 1.000 1.000 0.000 0.002
Austria 0.994 0.963 0.049 0.011
Belgium 1.000 1.002 0.000 0.000
Flemish Community (Belgium) 1.000 1.001 0.000 0.002
Brazil 1.000 1.001 0.000 0.003
Bulgaria 0.999 0.997 0.015 0.005
Ciudad Autónoma de Buenos Aires (Argentina) 1.000 1.006 0.000 0.002
Chile 1.000 1.003 0.000 0.001
Colombia 1.000 1.000 0.000 0.003
Croatia 1.000 1.001 0.000 0.002
Cyprus 0.998 0.990 0.032 0.006
Czech Republic 1.000 1.001 0.000 0.002
Denmark 0.996 0.976 0.044 0.008
England (United Kingdom) 1.000 0.998 0.023 0.003
Estonia 1.000 1.002 0.000 0.002
Finland 1.000 1.002 0.000 0.001
France 1.000 1.001 0.000 0.002
Georgia 0.998 0.990 0.030 0.006
Hungary 1.000 1.001 0.000 0.002
Iceland 0.997 0.980 0.058 0.008
Israel 1.000 0.999 0.015 0.004
Italy 1.000 0.998 0.016 0.004
Japan 1.000 0.999 0.008 0.003
Kazakhstan 0.999 0.996 0.014 0.005
Korea 0.999 0.995 0.027 0.004
Latvia 0.996 0.977 0.050 0.012
Lithuania 0.999 0.991 0.031 0.007
Malta 0.999 0.995 0.037 0.006
Mexico 1.000 1.003 0.000 0.002
Netherlands 0.995 0.972 0.053 0.012
New Zealand 1.000 1.002 0.000 0.002
Norway 0.999 0.993 0.024 0.006
Portugal 0.999 0.993 0.023 0.005
Romania 1.000 1.001 0.000 0.002

292
TALIS 2018 TECHNICAL REPORT © OECD 2019
Participating countries/economies CFI TLI RMSEA SRMR
Russian Federation 0.992 0.950 0.059 0.012
Saudi Arabia 1.000 1.001 0.000 0.002
Shanghai (China) 1.000 1.001 0.000 0.001
Singapore 0.999 0.992 0.040 0.005
Slovak Republic 1.000 1.001 0.000 0.003
Slovenia 0.999 0.994 0.031 0.005
South Africa2 0.990 0.988 0.034 0.184
Spain 0.996 0.974 0.043 0.008
Sweden 0.996 0.978 0.048 0.009
Chinese Taipei 1.000 1.001 0.000 0.001
Turkey 1.000 1.001 0.000 0.001
United Arab Emirates 0.996 0.978 0.041 0.007
United States 1.000 1.000 0.000 0.003
Viet Nam 0.999 0.992 0.022 0.006
ISCED level 1
Australia1 0.991 0.989 0.045 0.053
Flemish Community (Belgium) 0.993 0.957 0.070 0.014
Ciudad Autónoma de Buenos Aires (Argentina) 1.000 1.005 0.000 0.002
Denmark 1.000 1.001 0.000 0.003
England (United Kingdom) 0.997 0.980 0.051 0.007
France 0.998 0.987 0.032 0.009
Japan 1.000 1.001 0.000 0.002
Korea 1.000 1.002 0.000 0.001
Netherlands1 0.850 0.821 0.114 0.477
Spain 1.000 1.002 0.000 0.000
Sweden 0.998 0.988 0.038 0.007
Chinese Taipei 1.000 1.002 0.000 0.000
Turkey 0.998 0.987 0.029 0.007
United Arab Emirates 1.000 1.001 0.000 0.001
Viet Nam 0.990 0.937 0.073 0.013
ISCED level 3
Alberta (Canada) 0.999 0.992 0.041 0.008
Brazil 1.000 1.002 0.000 0.002
Croatia 1.000 1.003 0.000 0.000
Denmark 1.000 1.007 0.000 0.002
Portugal 1.000 1.001 0.000 0.002
Slovenia 0.999 0.993 0.028 0.006
Sweden 0.996 0.979 0.040 0.007
Chinese Taipei 1.000 0.999 0.014 0.003
Turkey 0.999 0.995 0.019 0.004
United Arab Emirates 0.998 0.987 0.032 0.006
Viet Nam 0.999 0.996 0.018 0.004
TALIS-PISA link
Australia 0.985 0.982 0.057 0.143
Ciudad Autónoma de Buenos Aires (Argentina) 0.960 0.952 0.057 0.189
Colombia 0.832 0.799 0.099 0.660
Czech Republic 0.989 0.987 0.029 0.092
Denmark 0.920 0.904 0.104 0.336

293
TALIS 2018 TECHNICAL REPORT © OECD 2019
Participating countries/economies CFI TLI RMSEA SRMR
Georgia 0.991 0.989 0.022 0.091
Malta 0.992 0.990 0.043 0.120
Turkey 0.996 0.995 0.022 0.096
Viet Nam 0.881 0.857 0.105 0.499
1. Data from participating country/economy were rated as insufficient during the adjudication process.
2. Participating country/economy with late data collection.
Source: OECD, TALIS 2018 database.
Table 11.61. Invariance test results for scale T3SECLS
CFI TLI RMSEA SRMR Δ CFI Δ TLI Δ RMSEA Δ SRMR
Invariance level of ISCED level 2
Configural 0.994 0.966 0.062 0.012
Metric 0.986 0.979 0.049 0.065 0.008 -0.013 0.013 -0.053
Scalar 0.894 0.907 0.103 0.105 0.092 0.072 -0.054 -0.040
Invariance level of ISCED level 1
Configural 0.996 0.975 0.050 0.009
Metric 0.989 0.982 0.043 0.070 0.007 -0.007 0.007 -0.061
Scalar 0.922 0.928 0.085 0.122 0.067 0.054 -0.042 -0.052
Invariance level of ISCED level 3
Configural 0.995 0.968 0.054 0.011
Metric 0.988 0.981 0.042 0.057 0.007 -0.013 0.012 -0.046
Scalar 0.907 0.914 0.089 0.094 0.081 0.067 -0.047 -0.037
Note: See endnote 34.
Source: OECD, TALIS 2018 database.
Table 11.62. Invariance test results for scale T3SEINS
CFI TLI RMSEA SRMR Δ CFI Δ TLI Δ RMSEA Δ SRMR
Invariance level of ISCED level 2
Configural 0.990 0.970 0.054 0.015
Metric 0.978 0.974 0.050 0.072 0.012 -0.004 0.004 -0.057
Scalar 0.864 0.896 0.099 0.127 0.114 0.078 -0.049 -0.055
Invariance level of ISCED level 1
Configural 0.991 0.973 0.049 0.015
Metric 0.979 0.973 0.049 0.077 0.012 0.000 0.000 -0.062
Scalar 0.882 0.906 0.092 0.157 0.097 0.067 -0.043 -0.080
Invariance Level of ISCED level 3
Configural 0.992 0.976 0.045 0.015
Metric 0.981 0.976 0.045 0.072 0.011 0.000 0.000 -0.057
Scalar 0.895 0.916 0.085 0.121 0.086 0.060 -0.040 -0.049
Note: See endnote 34.
Source: OECD, TALIS 2018 database.

294
TALIS 2018 TECHNICAL REPORT © OECD 2019
Table 11.63. Invariance test results for scale T3SEENG
CFI TLI RMSEA SRMR Δ CFI Δ TLI Δ RMSEA Δ SRMR
Invariance level of ISCED level 2
Configural 0.999 0.993 0.027 0.006
Metric 0.991 0.986 0.039 0.051 0.008 0.007 -0.012 -0.045
Scalar 0.875 0.891 0.110 0.113 0.116 0.095 -0.071 -0.062
Invariance level of ISCED level 1
Configural 0.999 0.993 0.027 0.006
Metric 0.986 0.978 0.048 0.074 0.013 0.015 -0.021 -0.068
Scalar 0.868 0.878 0.112 0.155 0.118 0.100 -0.064 -0.081
Invariance level of ISCED level 3
Configural 0.999 0.996 0.021 0.004
Metric 0.991 0.985 0.040 0.057 0.008 0.011 -0.019 -0.053
Scalar 0.880 0.888 0.110 0.117 0.111 0.097 -0.070 -0.060
Note: See endnote 34.
Source: OECD, TALIS 2018 database.
Table 11.64. Unstandardised factor loadings for T3SECLS, T3SEINS and T3SEENG
for all countries for all populations
T3SECLS (Metric) T3SEINS (Metric) T3SEENG (Metric)
TT2G34D 0.510 TT2G34C 0.367 TT2G34A 0.432
TT2G34F 0.394 TT2G34J 0.485 TT2G34B 0.476
TT2G34H 0.529 TT2G34K 0.432 TT2G34E 0.527
TT2G34I 0.535 TT2G34L 0.520 TT2G34G 0.443
Source: OECD, TALIS 2018 database.
Table 11.65. Standardised factor loadings and unstandardised intercepts for scale T3SECLS
Participating countries/economies Standardised factor loadings Unstandardised intercepts
TT2G34D TT2G34F TT2G34H TT2G34I TT2G34D TT2G34F TT2G34H TT2G34I
ISCED level 2
Alberta (Canada) 0.772 0.659 0.845 0.761 3.319 3.546 3.362 3.197
Australia 0.742 0.695 0.848 0.752 3.221 3.519 3.347 3.165
Austria 0.713 0.571 0.772 0.747 3.183 3.427 3.171 3.117
Belgium 0.757 0.674 0.852 0.799 3.211 3.432 3.332 3.252
Flemish Community (Belgium) 0.765 0.666 0.853 0.799 3.408 3.550 3.502 3.435
Brazil 0.737 0.665 0.806 0.773 3.296 3.493 3.357 3.285
Bulgaria 0.578 0.602 0.787 0.626 3.220 3.647 3.609 3.274
Ciudad Autónoma de Buenos Aires (Argentina)
0.745 0.622 0.797 0.783 3.269 3.533 3.367 3.257
Chile 0.762 0.661 0.848 0.769 3.265 3.452 3.305 3.164
Colombia 0.746 0.604 0.762 0.715 3.754 3.748 3.696 3.680
Croatia 0.759 0.674 0.832 0.801 3.140 3.349 3.096 3.159
Cyprus 0.772 0.657 0.829 0.767 3.455 3.612 3.472 3.356
Czech Republic 0.706 0.573 0.786 0.753 3.208 3.029 3.110 3.171
Denmark 0.720 0.634 0.733 0.749 3.540 3.708 3.384 3.540
England (United Kingdom) 0.740 0.699 0.869 0.725 3.327 3.630 3.478 3.233
Estonia 0.658 0.607 0.753 0.673 3.085 3.269 3.182 2.967
Finland 0.784 0.678 0.874 0.803 3.175 3.369 3.165 3.037
France 0.734 0.647 0.844 0.767 2.923 3.332 3.250 3.014

295
TALIS 2018 TECHNICAL REPORT © OECD 2019
Participating countries/economies Standardised factor loadings Unstandardised intercepts
TT2G34D TT2G34F TT2G34H TT2G34I TT2G34D TT2G34F TT2G34H TT2G34I
Georgia 0.696 0.625 0.793 0.738 3.284 3.442 3.471 3.301
Hungary 0.706 0.694 0.774 0.754 3.422 3.727 3.520 3.468
Iceland 0.714 0.567 0.781 0.758 3.301 3.283 3.307 3.186
Israel 0.781 0.692 0.859 0.823 3.211 3.465 3.262 3.168
Italy 0.715 0.532 0.767 0.730 3.306 3.315 3.422 3.222
Japan 0.792 0.609 0.863 0.840 2.748 2.730 2.722 2.698
Kazakhstan 0.646 0.554 0.752 0.725 2.962 3.103 3.276 3.163
Korea 0.823 0.659 0.868 0.844 3.094 3.072 3.139 3.035
Latvia 0.704 0.614 0.791 0.710 3.174 3.391 3.331 3.081
Lithuania 0.762 0.604 0.830 0.798 3.181 3.014 3.182 3.149
Malta 0.734 0.649 0.828 0.759 3.234 3.460 3.354 3.187
Mexico 0.709 0.574 0.796 0.730 3.305 3.283 3.307 3.192
Netherlands 0.742 0.671 0.784 0.706 3.434 3.641 3.398 3.377
New Zealand 0.747 0.682 0.833 0.755 3.259 3.508 3.321 3.182
Norway 0.724 0.591 0.805 0.762 2.991 3.217 3.041 3.001
Portugal 0.774 0.570 0.834 0.817 3.532 3.620 3.534 3.437
Romania 0.747 0.638 0.778 0.789 3.389 3.447 3.356 3.379
Russian Federation 0.641 0.561 0.831 0.808 3.162 3.322 3.575 3.475
Saudi Arabia 0.756 0.508 0.803 0.814 3.457 3.202 3.601 3.592
Shanghai (China) 0.861 0.724 0.925 0.918 3.384 3.439 3.442 3.415
Singapore 0.744 0.690 0.857 0.771 3.164 3.414 3.283 3.102
Slovak Republic 0.697 0.628 0.808 0.760 3.063 3.327 3.255 3.111
Slovenia 0.707 0.599 0.789 0.768 3.179 3.468 3.140 3.160
South Africa2 0.718 0.627 0.850 0.773 3.522 3.625 3.604 3.563
Spain 0.762 0.602 0.828 0.776 3.074 3.270 3.107 2.965
Sweden 0.760 0.616 0.827 0.755 3.170 3.272 3.200 3.145
Chinese Taipei 0.795 0.650 0.883 0.829 3.175 3.277 3.291 3.196
Turkey 0.791 0.626 0.847 0.831 3.359 3.299 3.410 3.314
United Arab Emirates 0.748 0.666 0.847 0.776 3.531 3.651 3.634 3.541
United States 0.758 0.660 0.845 0.747 3.224 3.473 3.309 3.124
Viet Nam 0.613 0.500 0.766 0.619 3.496 3.462 3.692 3.450
ISCED level 1
Australia1 0.719 0.699 0.850 0.701 3.413 3.668 3.554 3.349
Flemish Community (Belgium) 0.724 0.643 0.853 0.773 3.408 3.550 3.502 3.435
Ciudad Autónoma de Buenos Aires (Argentina)
0.723 0.596 0.784 0.762 3.269 3.533 3.367 3.257
Denmark 0.731 0.662 0.761 0.729 3.483 3.716 3.411 3.464
England (United Kingdom) 0.682 0.740 0.846 0.669 3.327 3.630 3.478 3.233
France 0.696 0.595 0.812 0.743 2.923 3.332 3.250 3.014
Japan 0.783 0.600 0.843 0.826 2.748 2.730 2.722 2.698
Korea 0.842 0.677 0.892 0.852 3.094 3.072 3.139 3.035
Netherlands1 0.703 0.705 0.783 0.689 3.508 3.780 3.624 3.486
Spain 0.755 0.607 0.830 0.767 3.074 3.270 3.107 2.965
Sweden 0.761 0.630 0.830 0.784 3.170 3.272 3.200 3.145
Chinese Taipei 0.782 0.665 0.873 0.823 3.175 3.277 3.291 3.196
Turkey 0.777 0.640 0.842 0.813 3.359 3.299 3.410 3.314
United Arab Emirates 0.715 0.659 0.849 0.753 3.531 3.651 3.634 3.541
Viet Nam 0.641 0.536 0.780 0.607 3.496 3.462 3.692 3.450
ISCED level 3
Alberta (Canada) 0.739 0.691 0.853 0.731 3.319 3.546 3.362 3.197
Brazil 0.731 0.651 0.801 0.766 3.296 3.493 3.357 3.285

296
TALIS 2018 TECHNICAL REPORT © OECD 2019
Participating countries/economies Standardised factor loadings Unstandardised intercepts
TT2G34D TT2G34F TT2G34H TT2G34I TT2G34D TT2G34F TT2G34H TT2G34I
Croatia 0.762 0.641 0.820 0.790 3.140 3.349 3.096 3.159
Denmark 0.749 0.606 0.746 0.758 3.464 3.537 3.251 3.518
Portugal 0.735 0.557 0.807 0.771 3.532 3.620 3.534 3.437
Slovenia 0.678 0.588 0.783 0.748 3.179 3.468 3.140 3.160
Sweden 0.764 0.617 0.812 0.764 3.170 3.272 3.200 3.145
Chinese Taipei 0.781 0.648 0.863 0.815 3.175 3.277 3.291 3.196
Turkey 0.788 0.610 0.812 0.813 3.359 3.299 3.410 3.314
United Arab Emirates 0.748 0.667 0.846 0.776 3.531 3.651 3.634 3.541
Viet Nam 0.678 0.548 0.786 0.683 3.496 3.462 3.692 3.450
TALIS-PISA link
Australia 0.747 0.686 0.829 0.753 3.252 3.520 3.366 3.168
Ciudad Autónoma de Buenos Aires (Argentina)
0.735 0.618 0.793 0.797 3.254 3.507 3.302 3.210
Colombia 0.695 0.558 0.740 0.708 3.750 3.769 3.739 3.729
Czech Republic 0.735 0.598 0.823 0.799 3.155 2.993 3.134 3.188
Denmark 0.740 0.661 0.728 0.734 3.566 3.705 3.407 3.516
Georgia 0.644 0.601 0.793 0.738 3.265 3.434 3.471 3.317
Malta 0.741 0.650 0.826 0.761 3.242 3.418 3.312 3.123
Turkey 0.777 0.625 0.818 0.819 3.324 3.249 3.350 3.268
Viet Nam 0.670 0.516 0.759 0.648 3.434 3.402 3.649 3.422
1. Data from participating country/economy were rated as insufficient during the adjudication process.
2. Participating country/economy with late data collection.
Source: OECD, TALIS 2018 database.
Table 11.66. Standardised factor loadings and unstandardised intercepts for scale T3SEINS
Participating countries/economies
Standardised factor loadings Unstandardised intercepts
TT2G34C TT2G34J TT2G34K TT2G34L TT2G34C TT2G34J TT2G34K TT2G34L
ISCED level 2
Alberta (Canada) 0.549 0.713 0.730 0.758 3.262 3.266 3.544 3.326
Australia 0.537 0.668 0.719 0.765 3.228 3.203 3.507 3.282
Austria 0.523 0.605 0.667 0.732 3.099 2.843 3.336 3.142
Belgium 0.521 0.642 0.688 0.742 3.234 2.899 3.434 3.138
Flemish Community (Belgium)
0.499 0.595 0.658 0.708 3.439 2.976 3.551 3.349
Brazil 0.624 0.740 0.750 0.785 3.428 3.268 3.476 3.304
Bulgaria 0.529 0.718 0.699 0.754 3.104 3.375 3.570 3.269
Ciudad Autónoma de Buenos Aires (Argentina)
0.545 0.687 0.726 0.735 3.346 3.295 3.597 3.438
Chile 0.571 0.709 0.757 0.809 3.256 3.260 3.482 3.325
Colombia 0.532 0.682 0.706 0.725 3.672 3.657 3.812 3.667
Croatia 0.582 0.710 0.684 0.756 3.097 2.994 3.411 3.076
Cyprus 0.609 0.696 0.759 0.788 3.460 3.304 3.603 3.346
Czech Republic 0.498 0.630 0.606 0.686 2.978 2.937 3.262 3.142
Denmark 0.531 0.600 0.699 0.730 3.401 3.015 3.557 3.407
England (United Kingdom) 0.544 0.681 0.725 0.727 3.463 3.311 3.552 3.322
Estonia 0.523 0.683 0.662 0.758 3.006 2.901 3.113 2.999
Finland 0.604 0.715 0.667 0.760 3.409 2.968 3.121 3.161
France 0.504 0.665 0.663 0.678 2.971 2.966 3.287 2.847
Georgia 0.607 0.758 0.713 0.809 3.454 3.296 3.433 3.350
Hungary 0.551 0.547 0.674 0.702 3.629 3.088 3.653 3.549

297
TALIS 2018 TECHNICAL REPORT © OECD 2019
Participating countries/economies
Standardised factor loadings Unstandardised intercepts
TT2G34C TT2G34J TT2G34K TT2G34L TT2G34C TT2G34J TT2G34K TT2G34L
Iceland 0.601 0.692 0.722 0.748 3.479 3.258 3.355 3.217
Israel 0.605 0.713 0.767 0.784 3.317 3.035 3.414 3.160
Italy 0.571 0.659 0.707 0.747 3.254 3.158 3.540 3.348
Japan 0.603 0.708 0.703 0.762 2.543 2.283 2.733 2.547
Kazakhstan 0.575 0.724 0.696 0.775 3.306 3.274 3.247 3.124
Korea 0.664 0.810 0.777 0.854 3.144 2.973 3.261 3.108
Latvia 0.549 0.684 0.649 0.758 3.292 3.207 3.245 3.307
Lithuania 0.553 0.714 0.699 0.785 3.210 3.231 3.384 3.286
Malta 0.580 0.646 0.730 0.791 3.370 3.034 3.533 3.289
Mexico 0.539 0.685 0.696 0.769 3.173 3.110 3.396 3.206
Netherlands 0.491 0.583 0.626 0.632 3.395 3.072 3.579 3.193
New Zealand 0.539 0.638 0.689 0.766 3.208 3.103 3.472 3.304
Norway 0.546 0.610 0.623 0.654 2.817 2.882 3.076 2.830
Portugal 0.471 0.638 0.686 0.634 3.573 3.596 3.789 3.482
Romania 0.604 0.770 0.760 0.797 3.394 3.365 3.629 3.411
Russian Federation 0.609 0.759 0.754 0.819 3.478 3.454 3.553 3.437
Saudi Arabia 0.673 0.834 0.784 0.860 3.579 3.363 3.495 3.361
Shanghai (China) 0.699 0.802 0.840 0.911 3.302 3.175 3.376 3.330
Singapore 0.612 0.755 0.734 0.817 3.199 3.011 3.355 3.102
Slovak Republic 0.574 0.694 0.664 0.758 3.181 3.013 3.162 3.200
Slovenia 0.552 0.683 0.625 0.721 3.158 3.209 3.327 3.028
South Africa2 0.613 0.752 0.746 0.742 3.512 3.535 3.670 3.454
Spain 0.533 0.663 0.685 0.720 3.194 3.124 3.471 3.228
Sweden 0.539 0.711 0.687 0.759 3.048 3.117 3.379 3.196
Chinese Taipei 0.611 0.741 0.738 0.829 2.964 2.874 3.179 2.970
Turkey 0.619 0.732 0.740 0.799 3.345 3.190 3.458 3.211
United Arab Emirates 0.590 0.764 0.778 0.836 3.529 3.526 3.671 3.591
United States 0.567 0.722 0.727 0.808 3.219 3.118 3.458 3.284
Viet Nam 0.600 0.694 0.692 0.749 3.525 3.211 3.359 3.244
ISCED level 1
Australia1 0.575 0.701 0.746 0.818 3.309 3.285 3.513 3.445
Flemish Community (Belgium)
0.520 0.590 0.697 0.739 3.439 2.976 3.551 3.349
Ciudad Autónoma de Buenos Aires (Argentina)
0.545 0.642 0.738 0.784 3.346 3.295 3.597 3.438
Denmark 0.505 0.553 0.651 0.714 3.369 2.961 3.563 3.461
England (United Kingdom) 0.582 0.682 0.735 0.786 3.463 3.311 3.552 3.322
France 0.537 0.660 0.646 0.688 2.892 2.675 3.126 2.879
Japan 0.635 0.751 0.731 0.804 2.543 2.283 2.733 2.547
Korea 0.650 0.772 0.801 0.866 3.144 2.973 3.261 3.108
Netherlands1 0.539 0.623 0.675 0.704 3.347 3.132 3.559 3.346
Spain 0.556 0.673 0.729 0.772 3.194 3.124 3.471 3.228
Sweden 0.535 0.690 0.692 0.761 3.048 3.117 3.379 3.196
Chinese Taipei 0.625 0.749 0.747 0.850 2.964 2.874 3.179 2.970
Turkey 0.647 0.763 0.764 0.835 3.345 3.190 3.458 3.211
United Arab Emirates 0.582 0.748 0.790 0.856 3.529 3.526 3.671 3.591
Viet Nam 0.633 0.709 0.677 0.753 3.525 3.211 3.359 3.244
ISCED level 3
Alberta (Canada) 0.518 0.688 0.695 0.729 3.262 3.266 3.544 3.326
Brazil 0.624 0.718 0.732 0.786 3.428 3.268 3.476 3.304
Croatia 0.569 0.699 0.672 0.723 3.097 2.994 3.411 3.076

298
TALIS 2018 TECHNICAL REPORT © OECD 2019
Participating countries/economies
Standardised factor loadings Unstandardised intercepts
TT2G34C TT2G34J TT2G34K TT2G34L TT2G34C TT2G34J TT2G34K TT2G34L
Denmark 0.549 0.566 0.656 0.688 3.583 3.043 3.633 3.463
Portugal 0.468 0.628 0.673 0.641 3.573 3.596 3.789 3.482
Slovenia 0.551 0.704 0.638 0.721 3.158 3.209 3.327 3.028
Sweden 0.527 0.683 0.662 0.737 3.048 3.117 3.379 3.196
Chinese Taipei 0.612 0.747 0.734 0.830 2.964 2.874 3.179 2.970
Turkey 0.609 0.744 0.734 0.797 3.345 3.190 3.458 3.211
United Arab Emirates 0.580 0.746 0.769 0.830 3.529 3.526 3.671 3.591
Viet Nam 0.611 0.706 0.687 0.769 3.525 3.211 3.359 3.244
TALIS-PISA link
Australia 0.567 0.712 0.725 0.774 3.239 3.233 3.497 3.292
Ciudad Autónoma de Buenos Aires (Argentina)
0.533 0.646 0.705 0.721 3.371 3.306 3.596 3.417
Colombia 0.468 0.629 0.682 0.664 3.694 3.677 3.824 3.689
Czech Republic 0.512 0.624 0.597 0.677 2.973 2.941 3.262 3.118
Denmark 0.555 0.621 0.704 0.753 3.489 3.012 3.562 3.427
Georgia 0.615 0.737 0.683 0.783 3.467 3.333 3.423 3.403
Malta 0.587 0.658 0.751 0.783 3.368 2.984 3.474 3.251
Turkey 0.636 0.775 0.758 0.830 3.288 3.089 3.397 3.116
Viet Nam 0.599 0.692 0.662 0.748 3.494 3.151 3.343 3.219
1. Data from participating country/economy were rated as insufficient during the adjudication process.
2. Participating country/economy with late data collection.
Source: OECD, TALIS 2018 database.
Table 11.67. Standardised factor loadings and unstandardised intercepts for scale T3SEENG
Participating countries/economies
Standardised factor loadings Unstandardised intercepts
TT2G34A TT2G34B TT2G34E TT2G34G TT2G34A TT2G34B TT2G34E TT2G34G
ISCED level 2
Alberta (Canada) 0.691 0.728 0.721 0.671 3.294 3.191 2.871 3.214
Australia 0.685 0.725 0.750 0.668 3.307 3.198 2.899 3.086
Austria 0.560 0.604 0.642 0.541 3.187 3.376 2.724 3.187
Belgium 0.661 0.699 0.745 0.630 3.175 3.015 2.772 3.056
Flemish Community (Belgium)
0.684 0.682 0.739 0.638 3.403 3.197 2.986 3.180
Brazil 0.721 0.766 0.723 0.705 3.446 3.467 3.224 3.457
Bulgaria 0.640 0.699 0.645 0.563 3.322 3.399 2.926 3.129
Ciudad Autónoma de Buenos Aires (Argentina)
0.667 0.677 0.660 0.662 3.347 3.336 3.083 3.464
Chile 0.669 0.731 0.732 0.685 3.279 3.308 3.166 3.296
Colombia 0.680 0.748 0.660 0.682 3.688 3.705 3.614 3.704
Croatia 0.652 0.688 0.727 0.621 2.748 2.521 2.552 2.913
Cyprus 0.695 0.750 0.737 0.690 3.439 3.430 3.230 3.418
Czech Republic 0.586 0.629 0.698 0.576 2.822 2.663 2.433 2.770
Denmark 0.645 0.671 0.660 0.574 3.597 3.448 3.000 3.313
England (United Kingdom) 0.690 0.723 0.758 0.653 3.411 3.284 3.003 3.118
Estonia 0.623 0.697 0.711 0.593 3.204 3.240 3.005 3.073
Finland 0.673 0.723 0.734 0.671 3.233 3.138 2.829 3.017
France 0.638 0.657 0.725 0.609 2.955 2.867 2.555 2.954
Georgia 0.658 0.711 0.710 0.644 3.350 3.362 3.043 3.321
Hungary 0.642 0.655 0.693 0.588 3.344 3.181 3.076 3.258
Iceland 0.644 0.689 0.732 0.652 3.296 3.141 2.932 2.973

299
TALIS 2018 TECHNICAL REPORT © OECD 2019
Participating countries/economies
Standardised factor loadings Unstandardised intercepts
TT2G34A TT2G34B TT2G34E TT2G34G TT2G34A TT2G34B TT2G34E TT2G34G
Israel 0.714 0.742 0.777 0.645 3.422 3.267 3.100 3.117
Italy 0.651 0.681 0.676 0.588 3.408 3.332 3.181 3.366
Japan 0.652 0.680 0.712 0.525 2.251 2.339 2.304 2.080
Kazakhstan 0.528 0.663 0.705 0.625 2.872 3.214 3.129 3.211
Korea 0.703 0.767 0.766 0.713 3.221 3.197 2.830 2.978
Latvia 0.677 0.673 0.697 0.632 3.209 3.032 2.862 3.098
Lithuania 0.641 0.663 0.674 0.635 3.217 3.105 2.788 2.965
Malta 0.702 0.754 0.782 0.698 3.395 3.332 3.088 3.212
Mexico 0.629 0.694 0.651 0.631 3.324 3.323 3.124 3.264
Netherlands 0.599 0.629 0.648 0.561 3.520 3.169 2.905 3.187
New Zealand 0.700 0.734 0.733 0.660 3.367 3.266 2.966 3.116
Norway 0.547 0.590 0.658 0.492 2.806 2.562 2.336 2.745
Portugal 0.583 0.692 0.648 0.563 3.643 3.722 3.441 3.573
Romania 0.689 0.750 0.771 0.693 3.185 3.136 3.006 3.188
Russian Federation 0.624 0.682 0.761 0.646 3.305 3.178 3.074 3.248
Saudi Arabia 0.725 0.790 0.830 0.633 3.517 3.528 3.472 3.225
Shanghai (China) 0.769 0.814 0.886 0.768 3.253 3.201 3.193 3.208
Singapore 0.704 0.758 0.792 0.696 3.309 3.253 2.998 3.033
Slovak Republic 0.615 0.673 0.709 0.656 3.091 3.054 2.892 3.031
Slovenia 0.636 0.659 0.720 0.673 3.012 2.986 2.837 3.192
South Africa2 0.748 0.784 0.790 0.746 3.606 3.587 3.507 3.528
Spain 0.642 0.709 0.724 0.645 2.985 2.995 2.697 3.099
Sweden 0.678 0.662 0.686 0.585 3.292 2.957 2.801 2.993
Chinese Taipei 0.679 0.738 0.759 0.608 3.062 3.122 2.918 2.871
Turkey 0.715 0.753 0.789 0.718 3.282 3.321 3.187 3.256
United Arab Emirates 0.710 0.769 0.770 0.689 3.621 3.646 3.522 3.505
United States 0.709 0.724 0.783 0.705 3.229 3.068 2.862 3.101
Viet Nam 0.594 0.687 0.678 0.514 3.561 3.688 3.528 3.292
ISCED level 1
Australia1 0.732 0.770 0.746 0.645 3.548 3.508 3.177 3.096
Flemish Community (Belgium)
0.657 0.685 0.681 0.582 3.403 3.197 2.986 3.180
Ciudad Autónoma de Buenos Aires (Argentina)
0.639 0.705 0.644 0.630 3.574 3.582 3.356 3.528
Denmark 0.653 0.686 0.662 0.537 3.627 3.532 3.093 3.177
England (United Kingdom) 0.732 0.754 0.732 0.611 3.680 3.619 3.326 3.225
France 0.612 0.665 0.697 0.570 3.098 3.149 2.697 2.774
Japan 0.669 0.707 0.761 0.571 2.251 2.339 2.304 2.080
Korea 0.730 0.782 0.770 0.708 3.221 3.197 2.830 2.978
Netherlands1 0.616 0.588 0.623 0.535 3.716 3.373 3.197 3.321
Spain 0.655 0.727 0.732 0.655 3.268 3.317 3.129 3.209
Sweden 0.697 0.668 0.693 0.568 3.412 3.125 2.951 2.854
Chinese Taipei 0.681 0.740 0.778 0.601 3.062 3.122 2.918 2.871
Turkey 0.720 0.774 0.788 0.716 3.282 3.321 3.187 3.256
United Arab Emirates 0.704 0.775 0.766 0.652 3.621 3.646 3.522 3.505
Viet Nam 0.588 0.705 0.659 0.493 3.561 3.688 3.528 3.292
ISCED level 3
Alberta (Canada) 0.711 0.723 0.725 0.671 3.294 3.191 2.871 3.214
Brazil 0.718 0.764 0.724 0.694 3.446 3.467 3.224 3.457
Croatia 0.660 0.707 0.726 0.627 2.748 2.521 2.552 2.913
Denmark 0.622 0.667 0.630 0.556 3.570 3.444 2.909 3.343

300
TALIS 2018 TECHNICAL REPORT © OECD 2019
Participating countries/economies
Standardised factor loadings Unstandardised intercepts
TT2G34A TT2G34B TT2G34E TT2G34G TT2G34A TT2G34B TT2G34E TT2G34G
Portugal 0.591 0.704 0.650 0.579 3.643 3.722 3.441 3.573
Slovenia 0.615 0.651 0.720 0.622 3.012 2.986 2.837 3.192
Sweden 0.622 0.611 0.634 0.543 3.234 2.938 2.741 3.009
Chinese Taipei 0.669 0.729 0.759 0.593 3.062 3.122 2.918 2.871
Turkey 0.686 0.722 0.794 0.690 3.282 3.321 3.187 3.256
United Arab Emirates 0.683 0.767 0.761 0.664 3.621 3.646 3.522 3.505
Viet Nam 0.599 0.681 0.680 0.549 3.561 3.688 3.528 3.292
TALIS-PISA link
Australia 0.704 0.747 0.766 0.689 3.283 3.171 2.869 3.114
Ciudad Autónoma de Buenos Aires (Argentina)
0.616 0.671 0.688 0.638 3.368 3.368 3.129 3.511
Colombia 0.621 0.679 0.618 0.626 3.681 3.708 3.654 3.708
Czech Republic 0.589 0.647 0.701 0.571 2.784 2.665 2.419 2.735
Denmark 0.669 0.677 0.643 0.581 3.646 3.509 3.003 3.345
Georgia 0.600 0.656 0.694 0.632 3.293 3.326 3.019 3.396
Malta 0.660 0.723 0.769 0.656 3.424 3.353 3.130 3.179
Turkey 0.677 0.718 0.781 0.693 3.214 3.289 3.166 3.238
Viet Nam 0.602 0.694 0.678 0.525 3.535 3.666 3.513 3.258
1. Data from the participating country/economy were rated as insufficient during the adjudication process.
2. Participating country/economy with late data collection.
Source: OECD, TALIS 2018 database.
Job satisfaction: Job satisfaction, composite (T3JOBSA); Job satisfaction with
work environment (T3JSENV); Job satisfaction with profession (T3JSPRO);
Satisfaction with target class autonomy (T3SATAT).
11.29. Measured items
Two subscales and one composite scale measuring teacher job satisfaction were derived
from this question stem:
“We would like to know how you generally feel about your job. How strongly do
you agree or disagree with the following statements?” (TT3G53). The items about
the school following this question were used to form the subscale Job satisfaction
with work environment (T3JSENV), while the items on the teaching profession
were used to form the subscale Job satisfaction with profession (T3JSPRO).
These two subscales formed the multidimensional scale Job satisfaction, composite
(T3JOBSA).
An additional scale related to job satisfaction was developed from the following question
stem:
“How strongly do you agree or disagree that you have control over the following
areas of your planning and teaching in this <target class>?” (TT3G40). The
question’s items on teachers’ freedom to make decisions were used for the scale
Satisfaction with target class autonomy (T3SATAT).
The scales are presented in Table 11.68.

301
TALIS 2018 TECHNICAL REPORT © OECD 2019
11.30. Model improvements
Two correlations were added as model improvements: between items TT3G53D and
TT3G53F for subscale T3JSPRO, and between items TT3G40E and TT3G40D for scale
T3SATAT.
11.31. Scale reliability
Table 11.69, which presents the coefficients (omega for the scale and subscales, stratified
Cronbach’s alpha for T3JOBSA) for all populations for each scale, show high reliabilities
for all populations for both the scale and the subscales. A few exceptions can be found for
the subscale T3JSPRO. Here, omega is moderate for the Mexico and Viet Nam ISCED
level 2 populations and low for the Lithuania ISCED level 2 population.
11.32. Model fits
Table 11.70 presents the model fit for subscale T3JSENV. Most populations exhibit
acceptable fit, with the exception of the South Africa ISCED level 2 and Georgia TALIS-
PISA link populations. The same is true for subscale T3JSPRO, with the exception of the
TALIS-PISA link populations in Columbia, Georgia and Viet Nam, and for the scale
T3SATAT, with the exceptions of the Portugal ISCED level 2, the Netherlands and the
Flemish Community (Belgium) ISCED level 1, Portugal ISCED level 3, and Australia
TALIS-PISA link populations, as observed in Tables 11.71 and 11.72 respectively.
11.33. Invariance testing
The invariance results for subscales T3JSENV, T3JSPRO and the T3SATAT scale
presented in Tables 11.73, 11.74, and 11.75 respectively, show metric invariance for all
ISCED levels for the subscales and the scale. In the case of T3JSPRO, the configural model
is near perfect for ISECD levels 2 and 3, and the metric model is acceptable, resulting in
metric invariant models. Because both subscales are metric invariant for all ISCED levels,
T3JOBSA is also metric invariant for all levels.
11.34. Item parameters
Table 11.76 presents the unstandardised factor loadings for the job satisfaction subscales
and T3SATAT. The standardised factor loadings and unstandardised intercepts for the job
satisfaction subscales T3JSENV and T3JSPRO are presented in Tables 11.77 and 11.78
respectively, and for the scale T3SATAT in Table 11.79.
The factor loadings for items TT3G53E and TT3G53G from subscale T3JSENV are above
0.600 in all populations, while most of those for items TT3G53C and TT3G53J are
between 0.450 and 0.600. The factor loadings of the items making up T3JSPRO are above
0.450 for all populations except the ISCED level 2 population in Mexico for item
TT3G53A and for the ISCED level 2 population in Lithuania, for items TT3G53D and
TT3G53F.
The factor loadings of items in subscale T3SATAT are mostly above 0.600. Factor
loadings below 0.450 can be observed not only for item TT3G40A for the ISCED level 2
populations in Bulgaria and Portugal, the ISCED level 3 population in Portugal and the
TALIS-PISA link population in Malta but also for item TT3G40D for the ISCED level 3
population in Sweden.

302
TALIS 2018 TECHNICAL REPORT © OECD 2019
Table 11.68. Item wording for job satisfaction scales
T3JOBSA: Job satisfaction, composite
T3JSENV: Job satisfaction with work environment (subscale)
TT3G53: We would like to know how you generally feel about your job. How strongly do you agree or disagree with the following statements?
Response options: “Strongly disagree” (1), “Disagree” (2), “Agree” (3), “Strongly agree” (4).
TT3G53C* I would like to change to another school if that were possible
TT3G53E I enjoy working at this school
TT3G53G I would recommend this school as a good place to work
TT3G53J All in all, I am satisfied with my job
T3JSPRO: Job satisfaction with profession (subscale)
TT3G53: We would like to know how you generally feel about your job. How strongly do you agree or disagree with the following statements?
Response options: “Strongly disagree” (1), “Disagree” (2), “Agree” (3), “Strongly agree” (4).
TT3G53A The advantages of being a teacher clearly outweigh the disadvantages
TT3G53B If I could decide again, I would still choose to work as a teacher.
TT3G53D* I regret that I decided to become a teacher
TT3G53F* I wonder whether it would have been better to choose another profession
T3SATAT: Satisfaction with target class autonomy
TT3G40: How strongly do you agree or disagree that you have control over the following areas of your planning and teaching in this <target class>?
Response options: “Strongly disagree” (1), “Disagree” (2), “Agree” (3), “Strongly agree” (4).
TT3G40A Determining course content
TT3G40B Selecting teaching methods
TT3G40C Assessing students’ learning
TT3G40D Disciplining students
TT3G40E Determining the amount of homework to be assigned
* Items were reverse coded.
Source: OECD, TALIS 2018 database.
Table 11.69. Reliability coefficients for job satisfaction scales
Participating countries/economies
T3JSENV T3JSPRO T3SATAT T3JOBSA
Omega coefficient3 Stratified Cronbach’s alpha
ISCED level 2
Alberta (Canada) 0.869 0.943 0.885 0.934
Australia 0.880 0.920 0.797 0.932
Austria 0.839 0.815 0.815 0.880
Belgium 0.870 0.845 0.823 0.903
Flemish Community (Belgium) 0.878 0.857 0.841 0.911
Brazil 0.797 0.815 0.882 0.863
Bulgaria 0.814 0.924 0.810 0.917
Ciudad Autónoma de Buenos Aires (Argentina) 0.796 0.801 0.914 0.857
Chile 0.778 0.810 0.885 0.847
Colombia 0.814 0.760 0.848 0.860
Croatia 0.861 0.874 0.835 0.914
Cyprus 0.848 0.918 0.845 0.919
Czech Republic 0.826 0.882 0.865 0.902
Denmark 0.845 0.889 0.895 0.912
England (United Kingdom) 0.882 0.906 0.815 0.931
Estonia 0.806 0.826 0.874 0.876

303
TALIS 2018 TECHNICAL REPORT © OECD 2019
Participating countries/economies
T3JSENV T3JSPRO T3SATAT T3JOBSA
Omega coefficient3 Stratified Cronbach’s alpha
Finland 0.834 0.912 0.872 0.921
France 0.850 0.830 0.865 0.887
Georgia 0.743 0.801 0.887 0.849
Hungary 0.843 0.885 0.861 0.904
Iceland 0.837 0.861 0.856 0.890
Israel 0.882 0.837 0.850 0.907
Italy 0.845 0.841 0.904 0.887
Japan 0.769 0.801 0.867 0.859
Kazakhstan 0.745 0.709 0.837 0.813
Korea 0.843 0.874 0.920 0.907
Latvia 0.776 0.774 0.857 0.843
Lithuania 0.835 0.599 0.891 0.836
Malta 0.832 0.863 0.832 0.897
Mexico 0.750 0.642 0.830 0.794
Netherlands 0.826 0.810 0.821 0.879
New Zealand 0.872 0.865 0.821 0.909
Norway 0.854 0.885 0.865 0.913
Portugal 0.859 0.843 0.767 0.889
Romania 0.834 0.814 0.904 0.877
Russian Federation 0.790 0.803 0.884 0.867
Saudi Arabia 0.803 0.810 0.891 0.870
Shanghai (China) 0.792 0.824 0.937 0.882
Singapore 0.872 0.870 0.843 0.913
Slovak Republic 0.803 0.843 0.882 0.884
Slovenia 0.799 0.865 0.808 0.895
South Africa2 0.762 0.701 0.837 0.818
Spain 0.839 0.891 0.848 0.908
Sweden 0.846 0.876 0.846 0.905
Chinese Taipei 0.835 0.837 0.951 0.888
Turkey 0.861 0.863 0.901 0.899
United Arab Emirates 0.846 0.841 0.867 0.891
United States4 0.891 - 0.884 -
Viet Nam 0.771 0.699 0.914 0.832
ISCED level 1
Australia1 0.874 0.895 0.817 0.920
Flemish Community (Belgium) 0.867 0.865 0.773 0.906
Ciudad Autónoma de Buenos Aires (Argentina) 0.792 0.810 0.918 0.857
Denmark 0.854 0.903 0.884 0.919
England (United Kingdom) 0.897 0.947 0.839 0.948
France 0.870 0.801 0.819 0.882
Japan 0.767 0.814 0.859 0.864
Korea 0.856 0.863 0.895 0.908
Netherlands1 0.865 0.846 0.815 0.900
Spain 0.846 0.854 0.846 0.892
Sweden 0.832 0.869 0.859 0.897
Chinese Taipei 0.824 0.834 0.939 0.880
Turkey 0.856 0.843 0.897 0.891
United Arab Emirates 0.861 0.852 0.870 0.898
Viet Nam 0.819 0.702 0.887 0.855
ISCED level 3

304
TALIS 2018 TECHNICAL REPORT © OECD 2019
Participating countries/economies
T3JSENV T3JSPRO T3SATAT T3JOBSA
Omega coefficient3 Stratified Cronbach’s alpha
Alberta (Canada) 0.893 0.910 0.880 0.932
Brazil 0.828 0.841 0.869 0.880
Croatia 0.856 0.889 0.839 0.916
Denmark 0.850 0.891 0.834 0.917
Portugal 0.882 0.845 0.773 0.897
Slovenia 0.806 0.852 0.834 0.891
Sweden 0.848 0.901 0.832 0.914
Chinese Taipei 0.850 0.783 0.941 0.880
Turkey 0.859 0.850 0.882 0.894
United Arab Emirates 0.850 0.863 0.856 0.902
Viet Nam 0.839 0.773 0.889 0.877
TALIS-PISA link
Australia 0.872 0.880 0.814 0.916
Ciudad Autónoma de Buenos Aires (Argentina) 0.846 0.916 0.884 0.915
Colombia 0.806 0.876 0.856 0.889
Czech Republic 0.859 0.899 0.895 0.918
Denmark 0.865 0.872 0.863 0.911
Georgia 0.815 0.834 0.901 0.882
Malta 0.848 0.854 0.806 0.896
Turkey 0.817 0.805 0.848 0.860
Viet Nam 0.865 0.857 0.906 0.911
1. Data from the participating country/economy were rated as insufficient during the adjudication process.
2. Participating country/economy with late data collection.
3. Omega coefficient was calculated based on unidimensional models for every single subscale of the
multidimensional construct.
4. These participating countries’/economies’ reliability coefficient estimation failed in the final scale model
due to a negative residual variance for one or more items that could not be corrected; when this occurs for a
subscale of a multidimensional scale, the multidimensional scale reliability coefficient is also missing; these
countries/economies have untrustworthy scale scores for the corresponding ISCED level.
Source: OECD, TALIS 2018 database.
Table 11.70. CFA model-data fit for scale T3JSENV
Job satisfaction with work environment
Participating countries/economies CFI TLI RMSEA SRMR
ISCED level 2
Alberta (Canada) 0.997 0.992 0.026 0.011
Australia 0.995 0.984 0.039 0.009
Austria 0.992 0.975 0.049 0.014
Belgium 0.997 0.991 0.035 0.009
Flemish Community (Belgium) 0.995 0.986 0.045 0.011
Brazil 0.995 0.985 0.029 0.010
Bulgaria 0.994 0.981 0.037 0.013
Ciudad Autónoma de Buenos Aires (Argentina) 0.956 0.867 0.068 0.020
Chile 0.997 0.991 0.025 0.010
Colombia 0.942 0.826 0.073 0.023
Croatia 0.988 0.965 0.064 0.018
Cyprus 0.991 0.973 0.055 0.015
Czech Republic 0.972 0.916 0.096 0.025
Denmark 0.983 0.950 0.070 0.017

305
TALIS 2018 TECHNICAL REPORT © OECD 2019
Participating countries/economies CFI TLI RMSEA SRMR
England (United Kingdom) 0.995 0.984 0.057 0.012
Estonia 0.977 0.931 0.075 0.020
Finland 0.937 0.811 0.174 0.035
France 0.994 0.983 0.048 0.012
Georgia 0.992 0.977 0.034 0.012
Hungary 0.998 0.995 0.028 0.009
Iceland 0.993 0.980 0.038 0.013
Israel 0.983 0.949 0.081 0.020
Italy 0.988 0.965 0.071 0.016
Japan 0.937 0.812 0.139 0.034
Kazakhstan 0.992 0.975 0.030 0.012
Korea 0.984 0.953 0.076 0.020
Latvia 0.972 0.916 0.064 0.027
Lithuania 0.988 0.964 0.063 0.017
Malta 0.987 0.961 0.057 0.019
Mexico 0.986 0.958 0.043 0.019
Netherlands 0.957 0.872 0.104 0.029
New Zealand 0.999 0.996 0.026 0.007
Norway 0.999 0.998 0.014 0.007
Portugal 0.999 0.998 0.014 0.006
Romania 0.999 0.996 0.017 0.007
Russian Federation 0.998 0.995 0.014 0.010
Saudi Arabia 0.941 0.822 0.114 0.038
Shanghai (China) 1.000 1.001 0.000 0.005
Singapore 0.985 0.955 0.082 0.019
Slovak Republic 0.968 0.905 0.080 0.026
Slovenia 0.933 0.799 0.143 0.037
South Africa2 0.897 0.897 0.087 0.236
Spain 0.987 0.961 0.051 0.018
Sweden 0.999 0.998 0.012 0.009
Chinese Taipei 0.996 0.988 0.035 0.012
Turkey 0.988 0.965 0.053 0.018
United Arab Emirates 0.985 0.954 0.062 0.021
United States 0.997 0.991 0.023 0.008
Viet Nam 0.988 0.965 0.039 0.015
ISCED level 1
Australia1 0.977 0.977 0.052 0.167
Flemish Community (Belgium) 0.992 0.977 0.046 0.014
Ciudad Autónoma de Buenos Aires (Argentina) 0.944 0.831 0.097 0.029
Denmark 0.993 0.979 0.045 0.013
England (United Kingdom) 0.988 0.964 0.073 0.015
France 0.999 0.998 0.013 0.007
Japan 0.904 0.712 0.147 0.042
Korea 0.958 0.874 0.120 0.028
Netherlands1 0.914 0.914 0.088 0.246
Spain 0.972 0.916 0.065 0.023
Sweden 0.996 0.987 0.029 0.012
Chinese Taipei 0.995 0.986 0.034 0.010
Turkey 0.984 0.951 0.047 0.021
United Arab Emirates 0.977 0.931 0.077 0.018
Viet Nam 0.991 0.974 0.035 0.012
ISCED level 3

306
TALIS 2018 TECHNICAL REPORT © OECD 2019
Participating countries/economies CFI TLI RMSEA SRMR
Alberta (Canada) 0.999 0.996 0.034 0.011
Brazil 0.985 0.956 0.051 0.016
Croatia 0.975 0.925 0.096 0.022
Denmark 0.996 0.988 0.036 0.012
Portugal 1.000 1.000 0.000 0.005
Slovenia 0.945 0.835 0.120 0.030
Sweden 0.984 0.953 0.061 0.020
Chinese Taipei 0.995 0.984 0.051 0.012
Turkey 0.992 0.976 0.036 0.016
United Arab Emirates 0.980 0.940 0.072 0.019
Viet Nam 0.998 0.995 0.018 0.008
TALIS-PISA link
Australia 0.982 0.982 0.052 0.115
Ciudad Autónoma de Buenos Aires (Argentina) 0.978 0.978 0.043 0.246
Colombia 0.986 0.986 0.020 0.103
Czech Republic 0.956 0.956 0.054 0.165
Denmark 0.976 0.976 0.042 0.146
Georgia 0.761 0.761 0.090 0.313
Malta 0.968 0.968 0.054 0.112
Turkey 0.962 0.962 0.051 0.196
Viet Nam 0.950 0.950 0.047 0.171
1. Data from the participating country/economy were rated as insufficient during the adjudication process.
2. Participating country/economy with late data collection.
Source: OECD, TALIS 2018 database.
Table 11.71. CFA model-data fit for scale T3JSPRO
Job satisfaction with profession
Participating countries/economies CFI TLI RMSEA SRMR
ISCED level 2
Alberta (Canada) 0.996 0.977 0.051 0.008
Australia 0.996 0.974 0.060 0.008
Austria 0.997 0.984 0.036 0.006
Belgium 1.000 1.002 0.000 0.001
Flemish Community (Belgium) 1.000 1.003 0.000 0.000
Brazil 1.000 1.000 0.006 0.003
Bulgaria 0.993 0.960 0.075 0.011
Ciudad Autónoma de Buenos Aires (Argentina) 0.993 0.958 0.036 0.009
Chile 0.993 0.960 0.064 0.010
Colombia 1.000 1.013 0.000 0.004
Croatia 1.000 1.005 0.000 0.001
Cyprus 1.000 1.003 0.000 0.002
Czech Republic 1.000 1.001 0.000 0.001
Denmark 1.000 1.000 0.001 0.003
England (United Kingdom) 1.000 1.003 0.000 0.001
Estonia 1.000 1.003 0.000 0.000
Finland 0.993 0.958 0.078 0.010
France 0.999 0.997 0.019 0.003
Georgia 0.998 0.990 0.024 0.006
Hungary 0.999 0.993 0.035 0.006
Iceland 1.000 1.004 0.000 0.003

307
TALIS 2018 TECHNICAL REPORT © OECD 2019
Participating countries/economies CFI TLI RMSEA SRMR
Israel 1.000 1.004 0.000 0.001
Italy 1.000 1.002 0.000 0.001
Japan 0.995 0.972 0.067 0.009
Kazakhstan 1.000 1.003 0.000 0.001
Korea 0.993 0.960 0.078 0.012
Latvia 1.000 1.001 0.000 0.007
Lithuania 1.000 1.003 0.000 0.002
Malta 0.996 0.977 0.064 0.009
Mexico 1.000 1.008 0.000 0.002
Netherlands 1.000 1.005 0.000 0.002
New Zealand 1.000 1.004 0.000 0.001
Norway 0.997 0.985 0.039 0.006
Portugal 1.000 0.999 0.013 0.002
Romania 0.999 0.997 0.014 0.004
Russian Federation 0.991 0.947 0.055 0.011
Saudi Arabia 1.000 1.004 0.000 0.001
Shanghai (China) 1.000 1.002 0.000 0.002
Singapore 1.000 0.999 0.012 0.003
Slovak Republic 0.999 0.995 0.021 0.005
Slovenia 1.000 1.003 0.000 0.002
South Africa2 0.948 0.937 0.058 0.072
Spain 0.999 0.996 0.015 0.004
Sweden 0.995 0.971 0.063 0.010
Chinese Taipei 0.996 0.975 0.046 0.010
Turkey 1.000 1.001 0.000 0.002
United Arab Emirates 0.999 0.993 0.024 0.005
United States 0.996 0.979 0.035 0.006
Viet Nam 0.996 0.978 0.031 0.008
ISCED level 1
Australia1 0.984 0.981 0.044 0.088
Flemish Community (Belgium) 0.997 0.983 0.043 0.009
Ciudad Autónoma de Buenos Aires (Argentina) 1.000 1.007 0.000 0.001
Denmark 1.000 1.004 0.000 0.000
England (United Kingdom) 1.000 1.001 0.000 0.003
France 0.996 0.978 0.037 0.007
Japan 0.997 0.982 0.048 0.008
Korea 0.952 0.712 0.166 0.023
Netherlands1 0.992 0.990 0.035 0.070
Spain 1.000 1.004 0.000 0.001
Sweden 1.000 1.003 0.000 0.000
Chinese Taipei 1.000 1.004 0.000 0.001
Turkey 0.986 0.916 0.060 0.015
United Arab Emirates 1.000 1.002 0.000 0.000
Viet Nam 0.993 0.956 0.044 0.013
ISCED level 3
Alberta (Canada) 1.000 1.004 0.000 0.002
Brazil 1.000 1.005 0.000 0.000
Croatia 1.000 1.002 0.000 0.002
Denmark 0.999 0.992 0.026 0.005
Portugal 1.000 1.003 0.000 0.000
Slovenia 1.000 0.997 0.016 0.004
Sweden 0.987 0.920 0.099 0.013

308
TALIS 2018 TECHNICAL REPORT © OECD 2019
Participating countries/economies CFI TLI RMSEA SRMR
Chinese Taipei 0.998 0.987 0.029 0.009
Turkey 1.000 1.001 0.000 0.002
United Arab Emirates 1.000 1.002 0.000 0.000
Viet Nam 0.995 0.972 0.035 0.011
TALIS-PISA link
Australia 0.975 0.970 0.063 0.104
Ciudad Autónoma de Buenos Aires (Argentina) 0.904 0.885 0.085 0.440
Colombia 0.882 0.859 0.063 0.296
Czech Republic 0.995 0.994 0.022 0.062
Denmark 1.000 1.007 0.000 0.081
Georgia 0.872 0.847 0.057 0.209
Malta 0.965 0.958 0.081 0.167
Turkey 0.972 0.966 0.032 0.119
Viet Nam 0.875 0.850 0.061 0.313
1. Data from the participating country/economy were rated as insufficient during the adjudication process.
2. Participating country/economy with late data collection.
Source: OECD, TALIS 2018 database.
Table 11.72. CFA model-data fit for scale T3SATAT
Satisfaction with target class autonomy
Participating countries/economies CFI TLI RMSEA SRMR
ISCED level 2
Alberta (Canada) 1.000 1.005 0.000 0.015
Australia 0.906 0.764 0.108 0.045
Austria 0.992 0.980 0.036 0.015
Belgium 0.976 0.940 0.057 0.026
Flemish Community (Belgium) 0.985 0.963 0.046 0.019
Brazil 0.980 0.951 0.056 0.019
Bulgaria 0.919 0.797 0.093 0.044
Ciudad Autónoma de Buenos Aires (Argentina) 0.996 0.989 0.027 0.012
Chile 0.996 0.991 0.026 0.010
Colombia 0.989 0.973 0.033 0.014
Croatia 0.982 0.955 0.047 0.021
Cyprus 0.985 0.964 0.042 0.022
Czech Republic 0.957 0.892 0.104 0.028
Denmark 0.994 0.986 0.035 0.012
England (United Kingdom) 0.968 0.921 0.087 0.028
Estonia 0.996 0.990 0.027 0.013
Finland 0.961 0.902 0.088 0.025
France 0.992 0.979 0.039 0.013
Georgia 0.981 0.953 0.060 0.018
Hungary 0.981 0.952 0.056 0.020
Iceland 0.980 0.949 0.070 0.023
Israel 0.980 0.951 0.057 0.021
Italy 0.986 0.966 0.059 0.017
Japan 0.985 0.961 0.061 0.017
Kazakhstan 0.990 0.975 0.032 0.015
Korea 0.974 0.934 0.064 0.021
Latvia 0.992 0.980 0.039 0.018
Lithuania 0.991 0.978 0.048 0.015

309
TALIS 2018 TECHNICAL REPORT © OECD 2019
Participating countries/economies CFI TLI RMSEA SRMR
Malta 0.986 0.964 0.058 0.022
Mexico 0.993 0.983 0.033 0.012
Netherlands 0.987 0.967 0.055 0.024
New Zealand 0.910 0.774 0.121 0.042
Norway 0.977 0.944 0.074 0.021
Portugal 0.877 0.693 0.126 0.050
Romania 0.989 0.973 0.047 0.014
Russian Federation 0.973 0.932 0.052 0.023
Saudi Arabia 0.986 0.964 0.056 0.019
Shanghai (China) 0.990 0.976 0.041 0.013
Singapore 0.990 0.974 0.044 0.017
Slovak Republic 0.994 0.985 0.040 0.013
Slovenia 0.977 0.942 0.065 0.026
South Africa2 0.918 0.909 0.052 0.166
Spain 0.974 0.935 0.062 0.026
Sweden 0.978 0.946 0.058 0.022
Chinese Taipei 0.993 0.981 0.043 0.010
Turkey 0.987 0.967 0.048 0.016
United Arab Emirates 0.998 0.996 0.016 0.008
United States 0.987 0.966 0.027 0.018
Viet Nam 1.000 1.000 0.071 0.019
ISCED level 1
Australia1 0.963 0.959 0.051 0.093
Flemish Community (Belgium) 0.861 0.651 0.144 0.051
Ciudad Autónoma de Buenos Aires (Argentina) 1.000 0.999 0.007 0.007
Denmark 0.998 0.995 0.024 0.011
England (United Kingdom) 0.956 0.891 0.094 0.029
France 1.000 1.006 0.000 0.007
Japan 0.935 0.838 0.125 0.036
Korea 0.969 0.922 0.073 0.023
Netherlands1 0.880 0.867 0.098 0.293
Spain 0.986 0.965 0.035 0.020
Sweden 0.965 0.914 0.082 0.031
Chinese Taipei 0.991 0.977 0.047 0.011
Turkey 0.980 0.950 0.048 0.017
United Arab Emirates 0.992 0.981 0.034 0.013
Viet Nam 0.998 0.995 0.023 0.009
ISCED level 3
Alberta (Canada) 0.974 0.935 0.087 0.019
Brazil 0.981 0.953 0.056 0.021
Croatia 0.966 0.914 0.075 0.027
Denmark 0.965 0.911 0.073 0.029
Portugal 0.883 0.708 0.132 0.054
Slovenia 0.981 0.952 0.057 0.021
Sweden 0.970 0.925 0.059 0.025
Chinese Taipei 0.988 0.970 0.054 0.014
Turkey 0.985 0.962 0.040 0.018
United Arab Emirates 0.993 0.983 0.029 0.014
Viet Nam 0.977 0.943 0.060 0.024
TALIS-PISA link
Australia 0.867 0.853 0.115 0.100
Ciudad Autónoma de Buenos Aires (Argentina) 0.985 0.983 0.028 0.163

310
TALIS 2018 TECHNICAL REPORT © OECD 2019
Participating countries/economies CFI TLI RMSEA SRMR
Colombia 0.996 0.996 0.015 0.091
Czech Republic 0.961 0.956 0.054 0.167
Denmark 1.000 1.006 0.000 0.055
Georgia 0.991 0.990 0.022 0.121
Malta 0.933 0.925 0.077 0.081
Turkey 0.967 0.963 0.042 0.174
Viet Nam 0.985 0.983 0.042 0.169
1. Data from the participating country/economy were rated as insufficient during the adjudication process.
2. Participating country/economy with late data collection.
Source: OECD, TALIS 2018 database.
Table 11.73. Invariance test results for scale T3JSENV
CFI TLI RMSEA SRMR Δ CFI Δ TLI Δ RMSEA Δ SRMR
Invariance level of ISCED level 2
Configural 0.986 0.957 0.060
Metric 0.969 0.962 0.056 0.092 0.017 -0.005 0.004 -0.074
Scalar 0.878 0.907 0.088 0.133 0.091 0.055 -0.032 -0.041
Invariance level of ISCED level 1
Configural 0.981 0.942 0.071 0.022
Metric 0.963 0.953 0.064 0.103 0.018 -0.011 0.007 -0.081
Scalar 0.887 0.910 0.089 0.141 0.076 0.043 -0.025 -0.038
Invariance level of ISCED level 3
Configural 0.988 0.965 0.057 0.017
Metric 0.970 0.962 0.060 0.102 0.018 0.003 -0.003 -0.085
Scalar 0.913 0.930 0.081 0.118 0.057 0.032 -0.021 -0.016
Note: See endnote 34.
Source: OECD, TALIS 2018 database.
Table 11.74. Invariance test results for scale T3JSPRO
CFI TLI RMSEA SRMR Δ CFI Δ TLI Δ RMSEA Δ SRMR
Invariance level of ISCED level 2
Configural 0.998 0.989 0.031 0.006
Metric 0.961 0.940 0.071 0.088 0.037 0.049 -0.040 -0.082
Scalar 0.791 0.817 0.124 0.127 0.170 0.123 -0.053 -0.039
Invariance level of ISCED level 1
Configural 0.995 0.973 0.045 0.009
Metric 0.979 0.967 0.049 0.067 0.016 0.006 -0.004 -0.058
Scalar 0.812 0.827 0.113 0.120 0.167 0.140 -0.064 -0.053
Invariance level of ISCED level 3
Configural 0.999 0.993 0.023 0.006
Metric 0.980 0.968 0.051 0.065 0.019 0.025 -0.028 -0.059
Scalar 0.876 0.885 0.098 0.098 0.104 0.083 -0.047 -0.033
Note: See endnote 34.
Source: OECD, TALIS 2018 database.

311
TALIS 2018 TECHNICAL REPORT © OECD 2019
Table 11.75. Invariance test results for scale T3SATAT
CFI TLI RMSEA SRMR Δ CFI Δ TLI Δ RMSEA Δ SRMR
Invariance level of ISCED level 2
Configural 0.982 0.954 0.056 0.022
Metric 0.968 0.960 0.053 0.073 0.014 -0.006 0.003 -0.051
Scalar 0.843 0.867 0.096 0.112 0.125 0.093 -0.043 -0.039
Invariance level of ISCED level 1
Configural 0.980 0.949 0.058 0.022
Metric 0.968 0.958 0.053 0.070 0.012 -0.009 0.005 -0.048
Scalar 0.854 0.872 0.092 0.112 0.114 0.086 -0.039 -0.042
Invariance level of ISCED level 3
Configural 0.977 0.943 0.060 0.026
Metric 0.966 0.956 0.053 0.066 0.011 -0.013 0.007 -0.040
Scalar 0.825 0.845 0.099 0.121 0.141 0.111 -0.046 -0.055
Note: See endnote 34.
Source: OECD, TALIS 2018 database.
Table 11.76. Unstandardised factor loadings for T3JSENV, T3JSPRO and T3SATAT
for all countries for all populations
T3JSENV (Metric) T3JSPRO (Metric) T3SATAT (Metric)
TT3G53C 0.484 TT3G53A 0.436 TT3G40A 0.488
TT3G53E 0.559 TT3G53B 0.728 TT3G40B 0.499
TT3G53G 0.579 TT3G53D 0.423 TT3G40C 0.505
TT3G53J 0.337 TT3G53F 0.566 TT3G40D 0.421
TT3G40E 0.448
Source: OECD, TALIS 2018 database.
Table 11.77. Standardised factor loadings and unstandardised intercepts for scale T3JSENV
Participating countries/economies Standardised factor loadings Unstandardised intercepts
TT3G53C TT3G53E TT3G53G TT3G53J TT3G53C TT3G53E TT3G53G TT3G53J
ISCED level 2
Alberta (Canada) 0.592 0.878 0.830 0.581 3.025 3.353 3.214 3.247
Australia 0.611 0.881 0.849 0.625 3.002 3.277 3.128 3.162
Austria 0.628 0.855 0.771 0.539 3.556 3.583 3.374 3.452
Belgium 0.654 0.883 0.813 0.572 3.308 3.332 3.118 3.125
Flemish Community (Belgium) 0.666 0.883 0.831 0.605 3.340 3.322 3.140 3.205
Brazil 0.590 0.776 0.784 0.474 3.243 3.344 3.232 3.101
Bulgaria 0.550 0.798 0.800 0.540 3.178 3.278 3.192 3.139
Ciudad Autónoma de Buenos Aires (Argentina)
0.567 0.798 0.751 0.517 3.277 3.406 3.297 3.390
Chile 0.574 0.751 0.751 0.541 3.063 3.342 3.144 3.380
Colombia 0.509 0.815 0.780 0.568 3.078 3.445 3.373 3.591
Croatia 0.663 0.856 0.824 0.606 3.183 3.070 3.050 3.146
Cyprus 0.619 0.833 0.833 0.550 2.946 3.014 2.938 3.196
Czech Republic 0.605 0.835 0.758 0.591 3.272 3.140 3.072 3.033
Denmark 0.629 0.856 0.790 0.532 3.344 3.434 3.242 3.189
England (United Kingdom) 0.644 0.894 0.836 0.579 2.989 3.155 3.058 2.905
Estonia 0.604 0.794 0.762 0.587 3.171 3.056 3.015 3.110
Finland 0.569 0.849 0.771 0.569 3.099 3.142 3.068 3.088

312
TALIS 2018 TECHNICAL REPORT © OECD 2019
Participating countries/economies Standardised factor loadings Unstandardised intercepts
TT3G53C TT3G53E TT3G53G TT3G53J TT3G53C TT3G53E TT3G53G TT3G53J
France 0.570 0.869 0.793 0.540 3.042 3.247 3.056 2.998
Georgia 0.522 0.684 0.751 0.506 3.266 3.285 3.284 3.217
Hungary 0.646 0.836 0.807 0.571 3.242 3.271 3.043 3.049
Iceland 0.585 0.825 0.821 0.534 3.239 3.351 3.250 3.184
Israel 0.657 0.886 0.842 0.608 3.253 3.236 3.179 3.220
Italy 0.606 0.848 0.808 0.537 3.099 3.229 3.089 3.260
Japan 0.546 0.772 0.704 0.561 2.836 2.913 2.690 2.932
Kazakhstan 0.527 0.727 0.724 0.481 3.072 3.183 3.065 3.118
Korea 0.634 0.840 0.796 0.596 2.746 2.860 2.751 3.133
Latvia 0.541 0.768 0.746 0.519 3.152 3.256 3.089 3.049
Lithuania 0.602 0.841 0.797 0.521 3.172 3.212 3.023 2.975
Malta 0.596 0.840 0.789 0.493 3.260 3.277 3.165 3.048
Mexico 0.452 0.759 0.705 0.535 3.041 3.441 3.255 3.577
Netherlands 0.582 0.846 0.733 0.592 3.152 3.310 3.068 3.188
New Zealand 0.622 0.880 0.829 0.590 2.987 3.246 3.100 3.039
Norway 0.597 0.862 0.809 0.583 3.264 3.371 3.266 3.174
Portugal 0.569 0.867 0.828 0.530 2.937 3.185 3.057 3.174
Romania 0.604 0.818 0.805 0.608 3.293 3.339 3.198 3.238
Russian Federation 0.587 0.765 0.771 0.524 3.177 3.170 3.027 3.064
Saudi Arabia 0.527 0.816 0.760 0.505 2.584 2.967 2.876 3.190
Shanghai (China) 0.577 0.776 0.761 0.550 2.807 2.857 2.796 3.111
Singapore 0.633 0.888 0.800 0.631 2.673 2.997 2.769 3.036
Slovak Republic 0.610 0.794 0.753 0.559 3.164 3.149 2.999 3.030
Slovenia 0.544 0.799 0.757 0.566 3.170 3.102 2.995 3.112
South Africa2 0.611 0.848 0.820 0.556 2.620 2.927 2.868 2.983
Spain 0.593 0.840 0.803 0.567 3.132 3.291 3.183 3.362
Sweden 0.581 0.867 0.784 0.527 3.175 3.283 3.095 3.219
Chinese Taipei 0.562 0.842 0.787 0.595 2.706 2.997 2.843 3.009
Turkey 0.638 0.855 0.836 0.560 2.717 3.005 2.890 3.160
United Arab Emirates 0.569 0.837 0.833 0.563 2.789 3.102 3.029 3.197
United States 0.642 0.909 0.828 0.599 3.120 3.351 3.223 3.205
Viet Nam 0.497 0.715 0.792 0.490 3.045 3.205 3.199 3.264
ISCED level 1
Australia1 0.626 0.907 0.860 0.609 3.057 3.342 3.221 3.198
Flemish Community (Belgium) 0.670 0.872 0.821 0.561 3.340 3.322 3.140 3.205
Ciudad Autónoma de Buenos Aires (Argentina)
0.562 0.795 0.749 0.517 3.277 3.406 3.297 3.390
Denmark 0.655 0.869 0.787 0.535 3.344 3.434 3.242 3.189
England (United Kingdom) 0.660 0.888 0.887 0.572 2.989 3.155 3.058 2.905
France 0.624 0.882 0.825 0.563 3.042 3.247 3.056 2.998
Japan 0.566 0.765 0.690 0.582 2.836 2.913 2.690 2.932
Korea 0.654 0.860 0.800 0.601 2.746 2.860 2.751 3.133
Netherlands1 0.594 0.828 0.775 0.547 3.259 3.360 3.232 3.130
Spain 0.603 0.856 0.795 0.563 3.132 3.291 3.183 3.362
Sweden 0.595 0.842 0.783 0.536 3.175 3.283 3.095 3.219
Chinese Taipei 0.560 0.823 0.783 0.597 2.706 2.997 2.843 3.009
Turkey 0.606 0.848 0.834 0.574 2.717 3.005 2.890 3.160
United Arab Emirates 0.578 0.849 0.849 0.573 2.789 3.102 3.029 3.197
Viet Nam 0.522 0.757 0.840 0.541 3.045 3.205 3.199 3.264
ISCED level 3
Alberta (Canada) 0.619 0.905 0.842 0.638 3.025 3.353 3.214 3.247

313
TALIS 2018 TECHNICAL REPORT © OECD 2019
Participating countries/economies Standardised factor loadings Unstandardised intercepts
TT3G53C TT3G53E TT3G53G TT3G53J TT3G53C TT3G53E TT3G53G TT3G53J
Brazil 0.591 0.828 0.800 0.489 3.243 3.344 3.232 3.101
Croatia 0.660 0.843 0.821 0.609 3.183 3.070 3.050 3.146
Denmark 0.634 0.855 0.796 0.587 3.344 3.434 3.242 3.189
Portugal 0.584 0.893 0.846 0.540 2.937 3.185 3.057 3.174
Slovenia 0.578 0.789 0.776 0.584 3.170 3.102 2.995 3.112
Sweden 0.622 0.861 0.788 0.564 3.175 3.283 3.095 3.219
Chinese Taipei 0.567 0.850 0.817 0.603 2.706 2.997 2.843 3.009
Turkey 0.636 0.846 0.841 0.572 2.717 3.005 2.890 3.160
United Arab Emirates 0.578 0.839 0.837 0.564 2.789 3.102 3.029 3.197
Viet Nam 0.528 0.767 0.864 0.546 3.045 3.205 3.199 3.264
TALIS-PISA link
Australia 0.597 0.900 0.809 0.604 3.043 3.292 3.147 3.123
Ciudad Autónoma de Buenos Aires (Argentina)
0.551 0.784 0.781 0.498 3.372 3.476 3.398 3.395
Colombia 0.486 0.758 0.765 0.564 3.059 3.416 3.376 3.580
Czech Republic 0.627 0.839 0.779 0.601 3.283 3.141 3.086 3.030
Denmark 0.643 0.876 0.775 0.536 3.383 3.407 3.247 3.202
Georgia 0.536 0.694 0.761 0.501 3.274 3.300 3.341 3.232
Malta 0.610 0.825 0.812 0.490 3.250 3.254 3.185 3.073
Turkey 0.633 0.841 0.857 0.577 2.761 3.010 2.936 3.194
Viet Nam 0.529 0.803 0.849 0.578 2.985 3.151 3.166 3.274
1. Data from participating country/economy were rated as insufficient during the adjudication process.
2. Participating country/economy with late data collection.
Source: OECD, TALIS 2018 database.
Table 11.78. Standardised factor loadings and unstandardised intercepts for scale T3JSPRO
Participating countries/economies
Standardised factor loadings Unstandardised intercepts
TT3G53A TT3G53B TT3G53D TT3G53F TT3G53A TT3G53B TT3G53D TT3G53F
ISCED level 2
Alberta (Canada) 0.665 0.967 0.670 0.655 3.249 3.228 3.539 2.951
Australia 0.678 0.951 0.639 0.647 3.157 3.132 3.482 2.927
Austria 0.538 0.849 0.699 0.692 3.217 3.291 3.763 3.506
Belgium 0.556 0.892 0.641 0.665 2.658 3.059 3.458 3.031
Flemish Community (Belgium)
0.562 0.902 0.665 0.663 2.771 3.099 3.503 3.029
Brazil 0.553 0.869 0.568 0.656 2.692 2.950 3.334 3.012
Bulgaria 0.652 0.954 0.624 0.698 2.584 2.785 3.229 2.725
Ciudad Autónoma de Buenos Aires (Argentina)
0.483 0.861 0.587 0.601 2.995 3.416 3.661 3.318
Chile 0.553 0.860 0.611 0.637 2.803 3.177 3.518 3.046
Colombia 0.471 0.833 0.521 0.557 3.169 3.447 3.675 3.347
Croatia 0.612 0.915 0.641 0.667 2.799 2.972 3.441 2.867
Cyprus 0.640 0.951 0.596 0.674 3.035 3.081 3.357 2.904
Czech Republic 0.577 0.924 0.617 0.699 2.605 2.869 3.379 2.990
Denmark 0.662 0.927 0.624 0.654 2.977 2.880 3.422 2.717
England (United Kingdom)
0.668 0.940 0.660 0.689 2.835 2.798 3.240 2.600
Estonia 0.606 0.873 0.602 0.651 2.922 2.912 3.374 2.914
Finland 0.728 0.943 0.648 0.667 3.284 3.064 3.476 2.900
France 0.559 0.876 0.649 0.684 2.537 2.979 3.476 3.155

314
TALIS 2018 TECHNICAL REPORT © OECD 2019
Participating countries/economies
Standardised factor loadings Unstandardised intercepts
TT3G53A TT3G53B TT3G53D TT3G53F TT3G53A TT3G53B TT3G53D TT3G53F
Georgia 0.537 0.866 0.504 0.554 3.051 3.145 3.350 2.787
Hungary 0.629 0.923 0.658 0.675 2.661 2.885 3.390 2.665
Iceland 0.692 0.903 0.592 0.631 3.095 2.715 3.254 2.562
Israel 0.570 0.890 0.563 0.625 2.898 3.028 3.380 2.946
Italy 0.534 0.892 0.602 0.663 2.820 3.207 3.500 3.300
Japan 0.613 0.838 0.633 0.670 2.882 2.571 3.395 2.944
Kazakhstan 0.480 0.776 0.487 0.598 2.761 2.753 3.090 2.844
Korea 0.713 0.912 0.567 0.680 3.114 2.806 3.117 2.744
Latvia 0.544 0.831 0.561 0.608 2.580 2.739 3.239 2.785
Lithuania 0.452 0.600 0.418 0.383 2.889 2.772 3.158 2.376
Malta 0.603 0.904 0.621 0.692 2.573 2.715 3.114 2.404
Mexico 0.369 0.721 0.500 0.515 2.900 3.458 3.760 3.400
Netherlands 0.607 0.857 0.600 0.637 3.001 3.059 3.482 3.136
New Zealand 0.643 0.905 0.648 0.676 2.972 2.926 3.393 2.733
Norway 0.682 0.924 0.623 0.648 3.158 2.969 3.387 2.899
Portugal 0.647 0.882 0.599 0.712 2.696 2.752 3.107 2.633
Romania 0.551 0.866 0.584 0.652 2.791 3.101 3.475 3.138
Russian Federation 0.494 0.862 0.556 0.669 2.699 2.905 3.267 3.048
Saudi Arabia 0.563 0.867 0.525 0.638 2.685 2.751 3.046 2.558
Shanghai (China) 0.562 0.882 0.546 0.593 2.882 2.913 3.118 2.728
Singapore 0.641 0.916 0.572 0.593 3.019 3.027 3.305 2.588
Slovak Republic 0.559 0.895 0.581 0.624 2.744 2.926 3.296 2.695
Slovenia 0.639 0.906 0.614 0.676 2.966 3.006 3.489 3.076
South Africa2 0.530 0.771 0.542 0.622 2.826 2.771 3.200 2.575
Spain 0.596 0.932 0.615 0.646 3.148 3.344 3.630 3.309
Sweden 0.688 0.912 0.660 0.671 2.961 2.715 3.327 2.755
Chinese Taipei 0.571 0.894 0.552 0.546 2.821 2.939 3.207 2.391
Turkey 0.603 0.908 0.592 0.656 2.856 2.997 3.258 2.664
United Arab Emirates 0.602 0.892 0.541 0.646 2.978 2.993 3.278 2.755
United States 0.689 1.001 0.658 0.679 3.173 3.134 3.414 2.840
Viet Nam 0.518 0.771 0.466 0.507 3.073 3.106 3.373 2.919
ISCED level 1
Australia1 0.665 0.936 0.650 0.651 3.153 3.167 3.521 3.019
Flemish Community (Belgium)
0.585 0.903 0.690 0.688 2.771 3.099 3.503 3.029
Ciudad Autónoma de Buenos Aires (Argentina)
0.471 0.875 0.570 0.579 2.995 3.416 3.661 3.318
Denmark 0.683 0.937 0.639 0.653 2.977 2.880 3.422 2.717
England (United Kingdom)
0.683 0.970 0.650 0.683 2.835 2.798 3.240 2.600
France 0.546 0.855 0.617 0.634 2.537 2.979 3.476 3.155
Japan 0.650 0.845 0.644 0.681 2.882 2.571 3.395 2.944
Korea 0.702 0.901 0.597 0.686 3.114 2.806 3.117 2.744
Netherlands1 0.616 0.881 0.667 0.690 2.833 2.909 3.418 3.043
Spain 0.520 0.907 0.581 0.622 3.148 3.344 3.630 3.309
Sweden 0.698 0.904 0.653 0.672 2.961 2.715 3.327 2.755
Chinese Taipei 0.557 0.892 0.537 0.538 2.821 2.939 3.207 2.391
Turkey 0.584 0.892 0.568 0.644 2.856 2.997 3.258 2.664
United Arab Emirates 0.616 0.899 0.564 0.652 2.978 2.993 3.278 2.755
Viet Nam 0.469 0.784 0.462 0.502 3.073 3.106 3.373 2.919
ISCED level 3

315
TALIS 2018 TECHNICAL REPORT © OECD 2019
Participating countries/economies
Standardised factor loadings Unstandardised intercepts
TT3G53A TT3G53B TT3G53D TT3G53F TT3G53A TT3G53B TT3G53D TT3G53F
Alberta (Canada) 0.671 0.945 0.664 0.631 3.249 3.228 3.539 2.951
Brazil 0.572 0.890 0.582 0.681 2.692 2.950 3.334 3.012
Croatia 0.604 0.927 0.658 0.678 2.799 2.972 3.441 2.867
Denmark 0.659 0.931 0.637 0.601 2.977 2.880 3.422 2.717
Portugal 0.647 0.887 0.599 0.681 2.696 2.752 3.107 2.633
Slovenia 0.630 0.894 0.618 0.670 2.966 3.006 3.489 3.076
Sweden 0.703 0.934 0.666 0.670 2.961 2.715 3.327 2.755
Chinese Taipei 0.525 0.847 0.518 0.537 2.821 2.939 3.207 2.391
Turkey 0.604 0.896 0.588 0.659 2.856 2.997 3.258 2.664
United Arab Emirates 0.639 0.908 0.568 0.650 2.978 2.993 3.278 2.755
Viet Nam 0.572 0.839 0.479 0.526 3.073 3.106 3.373 2.919
TALIS-PISA link
Australia 0.666 0.928 0.627 0.650 3.069 3.033 3.431 2.848
Ciudad Autónoma de Buenos Aires (Argentina)
0.428 0.872 0.598 0.566 3.007 3.427 3.714 3.328
Colombia 0.525 0.857 0.535 0.567 3.230 3.470 3.689 3.366
Czech Republic 0.569 0.927 0.613 0.692 2.635 2.880 3.378 2.975
Denmark 0.665 0.933 0.619 0.652 3.003 2.916 3.438 2.764
Georgia 0.502 0.814 0.491 0.538 3.033 3.136 3.383 2.769
Malta 0.628 0.936 0.632 0.665 2.640 2.736 3.146 2.474
Turkey 0.605 0.898 0.594 0.650 2.898 3.004 3.292 2.731
Viet Nam 0.513 0.809 0.497 0.543 3.107 3.140 3.426 2.909
1. Data from the participating country/economy were rated as insufficient during the adjudication process.
2. Participating country/economy with late data collection.
Source: OECD, TALIS 2018 database.
Table 11.79. Standardised factor loadings and unstandardised intercepts for scale T3SATAT
Participating countries/economies
Standardised factor loadings Unstandardised intercepts
TT3G40A TT3G40B TT3G40C TT3G40D TT3G40E TT3G40A TT3G40B TT3G40C TT3G40D TT3G40E
ISCED level 2
Alberta (Canada) 0.510 0.870 0.865 0.656 0.665 2.876 3.591 3.497 3.314 3.523
Australia 0.547 0.785 0.679 0.623 0.640 2.989 3.541 3.224 3.354 3.418
Austria 0.557 0.805 0.771 0.560 0.504 3.249 3.669 3.520 3.398 3.434
Belgium 0.546 0.792 0.784 0.593 0.628 3.201 3.455 3.373 3.280 3.416
Flemish Community (Belgium)
0.582 0.798 0.817 0.610 0.638 3.327 3.495 3.422 3.286 3.415
Brazil 0.735 0.856 0.837 0.615 0.650 3.393 3.366 3.336 3.139 3.221
Bulgaria 0.446 0.777 0.787 0.461 0.617 2.809 3.398 3.427 2.898 3.337
Ciudad Autónoma de Buenos Aires (Argentina)
0.648 0.895 0.897 0.719 0.721 3.305 3.497 3.433 3.419 3.361
Chile 0.696 0.857 0.866 0.664 0.468 3.361 3.405 3.407 3.260 2.863
Colombia 0.637 0.796 0.816 0.642 0.671 3.361 3.486 3.451 3.330 3.380
Croatia 0.512 0.803 0.806 0.603 0.600 3.226 3.480 3.458 3.303 3.380
Cyprus 0.550 0.809 0.806 0.641 0.673 3.154 3.381 3.347 3.302 3.316
Czech Republic 0.655 0.839 0.824 0.603 0.672 3.412 3.500 3.406 3.151 3.353
Denmark 0.778 0.899 0.776 0.709 0.633 3.527 3.631 3.407 3.571 3.472
England (United Kingdom)
0.545 0.787 0.742 0.659 0.579 2.870 3.457 3.127 3.331 2.965
Estonia 0.665 0.849 0.839 0.630 0.662 3.381 3.503 3.477 3.335 3.381

316
TALIS 2018 TECHNICAL REPORT © OECD 2019
Participating countries/economies
Standardised factor loadings Unstandardised intercepts
TT3G40A TT3G40B TT3G40C TT3G40D TT3G40E TT3G40A TT3G40B TT3G40C TT3G40D TT3G40E
Finland 0.575 0.865 0.779 0.629 0.754 3.245 3.650 3.495 3.411 3.663
France 0.712 0.842 0.810 0.594 0.625 3.593 3.629 3.560 3.448 3.563
Georgia 0.675 0.852 0.852 0.726 0.702 3.304 3.362 3.372 3.350 3.319
Hungary 0.631 0.834 0.806 0.683 0.659 3.421 3.623 3.553 3.545 3.523
Iceland 0.767 0.842 0.750 0.608 0.462 3.510 3.496 3.330 3.232 3.127
Israel 0.697 0.848 0.732 0.608 0.636 3.541 3.625 3.436 3.439 3.547
Italy 0.822 0.864 0.850 0.726 0.722 3.302 3.338 3.263 3.226 3.221
Japan 0.602 0.811 0.849 0.669 0.641 2.938 3.325 3.360 3.291 3.148
Kazakhstan 0.704 0.774 0.771 0.590 0.689 3.155 3.214 3.258 3.198 3.181
Korea 0.824 0.908 0.848 0.716 0.747 3.533 3.592 3.482 3.445 3.484
Latvia 0.625 0.815 0.823 0.634 0.681 3.134 3.474 3.311 3.238 3.248
Lithuania 0.668 0.866 0.847 0.714 0.723 3.244 3.550 3.432 3.419 3.397
Malta 0.478 0.814 0.767 0.624 0.663 2.701 3.353 3.156 3.130 3.263
Mexico 0.577 0.782 0.798 0.587 0.659 3.259 3.365 3.415 3.168 3.253
Netherlands 0.728 0.631 0.776 0.679 0.676 3.521 3.240 3.334 3.458 3.505
New Zealand 0.620 0.820 0.663 0.649 0.636 3.193 3.560 3.162 3.473 3.438
Norway 0.739 0.838 0.794 0.647 0.655 3.536 3.538 3.389 3.359 3.419
Portugal 0.407 0.756 0.675 0.623 0.563 2.362 3.416 3.271 3.434 3.415
Romania 0.721 0.880 0.888 0.639 0.643 3.319 3.466 3.451 3.263 3.220
Russian Federation 0.553 0.841 0.868 0.670 0.739 3.053 3.386 3.434 3.337 3.372
Saudi Arabia 0.735 0.841 0.853 0.737 0.703 3.260 3.319 3.309 3.437 3.256
Shanghai (China) 0.770 0.928 0.911 0.761 0.792 3.352 3.455 3.393 3.383 3.371
Singapore 0.568 0.807 0.785 0.639 0.682 2.952 3.416 3.220 3.249 3.206
Slovak Republic 0.627 0.848 0.869 0.486 0.720 3.224 3.445 3.401 2.891 3.338
Slovenia 0.499 0.789 0.767 0.566 0.578 3.132 3.547 3.447 3.297 3.436
South Africa2 0.602 0.777 0.763 0.585 0.677 3.185 3.327 3.293 3.225 3.289
Spain 0.509 0.815 0.813 0.624 0.694 2.960 3.412 3.398 3.230 3.451
Sweden 0.739 0.837 0.765 0.471 0.541 3.661 3.720 3.623 3.314 3.556
Chinese Taipei 0.807 0.936 0.944 0.749 0.803 3.354 3.473 3.431 3.302 3.367
Turkey 0.596 0.851 0.894 0.690 0.751 2.982 3.353 3.368 3.282 3.315
United Arab Emirates 0.590 0.831 0.836 0.649 0.693 3.094 3.454 3.381 3.405 3.297
United States 0.610 0.880 0.841 0.599 0.653 3.187 3.553 3.451 3.241 3.434
Viet Nam 0.735 0.886 0.889 0.608 0.789 3.091 3.290 3.272 2.898 3.190
ISCED level 1
Australia1 0.603 0.790 0.786 0.684 0.538 2.938 3.412 3.233 3.321 3.025
Flemish Community (Belgium)
0.559 0.610 0.768 0.636 0.532 3.170 3.149 3.340 3.372 3.255
Ciudad Autónoma de Buenos Aires (Argentina)
0.763 0.907 0.878 0.729 0.726 3.305 3.497 3.433 3.419 3.361
Denmark 0.802 0.884 0.716 0.679 0.571 3.546 3.607 3.338 3.540 3.398
England (United Kingdom)
0.661 0.799 0.726 0.716 0.587 2.870 3.457 3.127 3.331 2.965
France 0.581 0.796 0.756 0.654 0.531 3.148 3.463 3.306 3.377 3.214
Japan 0.583 0.810 0.851 0.709 0.544 2.938 3.325 3.360 3.291 3.148
Korea 0.694 0.897 0.794 0.743 0.709 3.528 3.700 3.587 3.658 3.635
Netherlands1 0.641 0.596 0.640 0.640 0.594 3.246 2.881 3.067 3.395 3.195
Spain 0.546 0.805 0.814 0.696 0.629 2.954 3.342 3.347 3.314 3.296
Sweden 0.761 0.860 0.742 0.520 0.538 3.661 3.720 3.623 3.314 3.556
Chinese Taipei 0.781 0.929 0.919 0.750 0.735 3.354 3.473 3.431 3.302 3.367
Turkey 0.556 0.844 0.900 0.668 0.732 2.982 3.353 3.368 3.282 3.315
United Arab Emirates 0.642 0.822 0.838 0.701 0.649 3.094 3.454 3.381 3.405 3.297

317
TALIS 2018 TECHNICAL REPORT © OECD 2019
Participating countries/economies
Standardised factor loadings Unstandardised intercepts
TT3G40A TT3G40B TT3G40C TT3G40D TT3G40E TT3G40A TT3G40B TT3G40C TT3G40D TT3G40E
Viet Nam 0.714 0.885 0.859 0.463 0.506 3.120 3.347 3.322 2.626 2.791
ISCED level 3
Alberta (Canada) 0.478 0.875 0.839 0.595 0.750 2.876 3.591 3.497 3.314 3.523
Brazil 0.727 0.839 0.815 0.620 0.644 3.393 3.366 3.336 3.139 3.221
Croatia 0.544 0.805 0.817 0.613 0.593 3.226 3.480 3.458 3.303 3.380
Denmark 0.564 0.835 0.761 0.615 0.545 3.374 3.707 3.531 3.572 3.413
Portugal 0.397 0.774 0.692 0.622 0.557 2.362 3.416 3.271 3.434 3.415
Slovenia 0.556 0.819 0.786 0.593 0.613 3.132 3.547 3.447 3.297 3.436
Sweden 0.695 0.833 0.745 0.434 0.549 3.661 3.720 3.623 3.314 3.556
Chinese Taipei 0.800 0.930 0.921 0.689 0.793 3.354 3.473 3.431 3.302 3.367
Turkey 0.589 0.832 0.864 0.705 0.741 2.982 3.353 3.368 3.282 3.315
United Arab Emirates 0.534 0.816 0.822 0.655 0.699 3.094 3.454 3.381 3.405 3.297
Viet Nam 0.706 0.850 0.854 0.573 0.776 3.170 3.303 3.283 2.984 3.197
TALIS-PISA link
Australia 0.547 0.813 0.678 0.602 0.661 2.968 3.547 3.213 3.331 3.421
Ciudad Autónoma de Buenos Aires (Argentina)
0.615 0.885 0.884 0.692 0.710 3.118 3.490 3.438 3.400 3.336
Colombia 0.637 0.813 0.837 0.672 0.700 3.281 3.474 3.416 3.369 3.363
Czech Republic 0.671 0.853 0.842 0.581 0.709 3.396 3.476 3.415 3.115 3.360
Denmark 0.676 0.872 0.759 0.681 0.664 3.495 3.644 3.424 3.592 3.518
Georgia 0.684 0.846 0.857 0.750 0.724 3.296 3.329 3.355 3.311 3.307
Malta 0.428 0.789 0.711 0.578 0.632 2.719 3.384 3.166 3.173 3.279
Turkey 0.573 0.839 0.846 0.698 0.743 2.953 3.322 3.323 3.261 3.279
Viet Nam 0.756 0.881 0.891 0.600 0.810 3.084 3.263 3.211 2.864 3.151
1. Data from the participating country/economy were rated as insufficient during the adjudication process.
2. Participating country/economy with late data collection.
Source: OECD, TALIS 2018 database.
Work stress and well-being: Workplace well-being and stress (T3WELS);
Workload stress (T3WLOAD); Student behaviour stress (T3STBEH)
11.35. Measured items
The three scales measuring latent concepts regarding workplace well-being and stress were
developed from two question stems:
“In your experience as a teacher at this school, to what extent do the following
occur?” (TT3G51). The question was followed by items on how the teaching
profession affects other areas of life, and these were used to form the scale
Workplace well-being and stress (T3WELS).
“Thinking about your job at this school, to what extent are the following sources of
stress in your work?” (TT3G52). The items about teacher workload that followed
this question were used to form the scale Workload stress (T3WLOAD), while the
items regarding student interaction were used for the scale Student behaviour stress
(T3STBEH).
These scales are presented in Table 11.80.
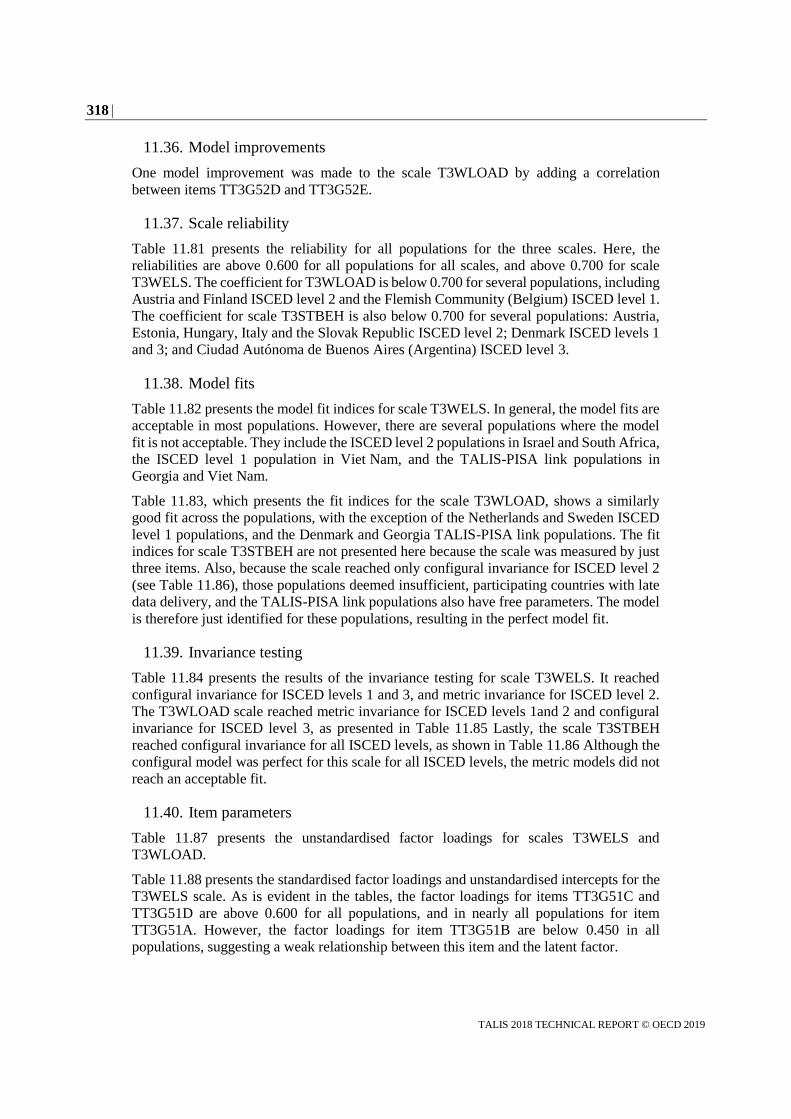
318
TALIS 2018 TECHNICAL REPORT © OECD 2019
11.36. Model improvements
One model improvement was made to the scale T3WLOAD by adding a correlation
between items TT3G52D and TT3G52E.
11.37. Scale reliability
Table 11.81 presents the reliability for all populations for the three scales. Here, the
reliabilities are above 0.600 for all populations for all scales, and above 0.700 for scale
T3WELS. The coefficient for T3WLOAD is below 0.700 for several populations, including
Austria and Finland ISCED level 2 and the Flemish Community (Belgium) ISCED level 1.
The coefficient for scale T3STBEH is also below 0.700 for several populations: Austria,
Estonia, Hungary, Italy and the Slovak Republic ISCED level 2; Denmark ISCED levels 1
and 3; and Ciudad Autónoma de Buenos Aires (Argentina) ISCED level 3.
11.38. Model fits
Table 11.82 presents the model fit indices for scale T3WELS. In general, the model fits are
acceptable in most populations. However, there are several populations where the model
fit is not acceptable. They include the ISCED level 2 populations in Israel and South Africa,
the ISCED level 1 population in Viet Nam, and the TALIS-PISA link populations in
Georgia and Viet Nam.
Table 11.83, which presents the fit indices for the scale T3WLOAD, shows a similarly
good fit across the populations, with the exception of the Netherlands and Sweden ISCED
level 1 populations, and the Denmark and Georgia TALIS-PISA link populations. The fit
indices for scale T3STBEH are not presented here because the scale was measured by just
three items. Also, because the scale reached only configural invariance for ISCED level 2
(see Table 11.86), those populations deemed insufficient, participating countries with late
data delivery, and the TALIS-PISA link populations also have free parameters. The model
is therefore just identified for these populations, resulting in the perfect model fit.
11.39. Invariance testing
Table 11.84 presents the results of the invariance testing for scale T3WELS. It reached
configural invariance for ISCED levels 1 and 3, and metric invariance for ISCED level 2.
The T3WLOAD scale reached metric invariance for ISCED levels 1and 2 and configural
invariance for ISCED level 3, as presented in Table 11.85 Lastly, the scale T3STBEH
reached configural invariance for all ISCED levels, as shown in Table 11.86 Although the
configural model was perfect for this scale for all ISCED levels, the metric models did not
reach an acceptable fit.
11.40. Item parameters
Table 11.87 presents the unstandardised factor loadings for scales T3WELS and
T3WLOAD.
Table 11.88 presents the standardised factor loadings and unstandardised intercepts for the
T3WELS scale. As is evident in the tables, the factor loadings for items TT3G51C and
TT3G51D are above 0.600 for all populations, and in nearly all populations for item
TT3G51A. However, the factor loadings for item TT3G51B are below 0.450 in all
populations, suggesting a weak relationship between this item and the latent factor.

319
TALIS 2018 TECHNICAL REPORT © OECD 2019
The results for the scale T3WLOAD are presented in Table 11.89. Here, the factor loadings
for item TT3G52B are above 0.600 for all populations, and the same can be said for items
TT3G52A and TT3G52C for most populations. While the factor loadings for item
TT3G52D are above 0.450 for most populations, the factor loading is lower for a good
number of populations. The factor loadings for item TT3G52E are weak for almost all
populations, suggesting a weak relationship between this item and the latent construct.
The factor loadings for the scale T3STBEH item TT3G52G are above 0.600 in all
populations, as depicted in Table 11.80. However, the factor loadings for item TT3G52H
are moderate (between 0.450 and 0.600) in many populations and below 0.450 in some
populations, while the factor loadings for item TT3G52F are below 0.450 for nearly half
the populations. These results suggest the scale is a weak construct in a fair number of
populations.
Table 11.80. Item wording for workplace well-being and stress scales
T3WELS: Workplace well-being and stress
TT3G51: In your experience as a teacher at this school, to what extent do the following occur?
Response options: “Not at all” (1), “To some extent” (2), “Quite a bit” (3), “A lot” (4).
TT3G51A I experience stress in my work
TT3G51B* My job leaves me time for my personal life
TT3G51C My job negatively impacts my mental health
TT3G51D My job negatively impacts my physical health
T3WLOAD: Workload stress
TT3G52: Thinking about your job at this school, to what extent are the following sources of stress in your work?
Response options: “Not at all” (1), “To some extent” (2), “Quite a bit” (3), “A lot” (4).
TT3G52A Having too much lesson preparation
TT3G52B Having too many lessons to teach
TT3G52C Having too much marking
TT3G52D Having too much administrative work to do (e.g. filling out forms)
TT3G52E Having extra duties due to absent teachers
T3STBEH: Student behaviour stress
TT3G52: Thinking about your job at this school, to what extent are the following sources of stress in your work?
Response options: “Not at all” (1), “To some extent” (2), “Quite a bit” (3), “A lot” (4).
TT3G52F Being held responsible for students’ achievement
TT3G52G Maintaining classroom discipline
TT3G52H Being intimidated or verbally abused by students
* Item was reverse coded
Source: OECD, TALIS 2018 database.
Table 11.81. Omega coefficients for workplace well-being and stress scales
Participating countries/economies T3WELS T3WLOAD T3STBEH
Omega coefficient
ISCED level 2
Alberta (Canada) 0.872 0.773 0.901
Australia 0.874 0.783 0.771
Austria 0.865 0.682 0.671
Belgium 0.852 0.762 0.759
Flemish Community (Belgium) 0.854 0.717 0.792
Brazil 0.910 0.884 0.773
Bulgaria 0.880 0.933 0.767

320
TALIS 2018 TECHNICAL REPORT © OECD 2019
Participating countries/economies T3WELS T3WLOAD T3STBEH
Omega coefficient
Ciudad Autónoma de Buenos Aires (Argentina)
0.885 0.750 0.706
Chile 0.895 0.817 0.743
Colombia3 0.872 0.856 -
Croatia 0.889 0.785 0.826
Cyprus 0.887 0.839 0.803
Czech Republic 0.857 0.755 0.828
Denmark 0.884 0.887 0.719
England (United Kingdom)3 0.872 0.767 -
Estonia 0.841 0.824 0.676
Finland 0.797 0.694 0.769
France 0.810 0.771 0.805
Georgia 0.845 0.806 0.956
Hungary 0.859 0.843 0.646
Iceland 0.906 0.792 0.712
Israel3 0.882 0.797 -
Italy 0.850 0.876 0.661
Japan3 0.899 0.814 -
Kazakhstan 0.874 0.846 0.741
Korea 0.924 0.824 0.830
Latvia 0.843 0.785 0.755
Lithuania 0.884 0.762 0.721
Malta 0.863 0.814 0.766
Mexico 0.857 0.796 0.882
Netherlands3 0.859 0.740 -
New Zealand 0.887 0.781 0.824
Norway 0.815 0.764 0.757
Portugal 0.861 0.854 0.856
Romania 0.832 0.906 0.984
Russian Federation 0.878 0.801 0.903
Saudi Arabia 0.906 0.899 0.778
Shanghai (China) 0.865 0.834 0.801
Singapore 0.865 0.812 0.845
Slovak Republic 0.850 0.797 0.681
Slovenia 0.897 0.740 0.797
South Africa2 0.852 0.759 0.764
Spain 0.869 0.817 0.872
Sweden 0.874 0.741 0.810
Chinese Taipei 0.895 0.785 0.910
Turkey 0.835 0.769 0.733
United Arab Emirates 0.904 0.872 0.869
United States3 0.867 0.797 -
Viet Nam 0.859 0.889 0.776
ISCED level 1
Australia1 0.882 0.792 0.857
Flemish Community (Belgium) 0.867 0.696 0.719
Ciudad Autónoma de Buenos Aires (Argentina)
0.885 0.759 0.717
Denmark 0.857 0.839 0.669
England (United Kingdom) 0.869 0.789 0.835
France 0.819 0.762 0.787

321
TALIS 2018 TECHNICAL REPORT © OECD 2019
Participating countries/economies T3WELS T3WLOAD T3STBEH
Omega coefficient
Japan3 0.901 0.854 -
Korea 0.920 0.810 0.815
Netherlands1 0.885 0.797 0.978
Spain 0.876 0.824 0.828
Sweden 0.870 0.752 0.709
Chinese Taipei 0.884 0.785 0.908
Turkey 0.859 0.762 0.760
United Arab Emirates 0.906 0.859 0.865
Viet Nam 0.872 0.893 0.796
ISCED level 3
Alberta (Canada) 0.895 0.785 0.823
Brazil 0.895 0.876 0.767
Croatia 0.867 0.796 0.861
Denmark 0.872 0.878 0.642
Portugal 0.870 0.859 0.846
Slovenia 0.880 0.753 0.769
Sweden 0.852 0.760 0.723
Chinese Taipei 0.901 0.796 0.880
Turkey 0.832 0.776 0.778
United Arab Emirates 0.908 0.887 0.891
Viet Nam 0.845 0.876 0.760
TALIS-PISA link
Australia 0.863 0.785 0.794
Ciudad Autónoma de Buenos Aires (Argentina)
0.891 0.812 0.658
Colombia3 0.854 0.823
Czech Republic 0.861 0.817 0.837
Denmark 0.863 0.828 0.709
Georgia 0.947 0.884 0.738
Malta 0.845 0.778 0.857
Turkey 0.880 0.821 0.771
Viet Nam 0.922 0.856 0.850
1. Data from the participating country/economy were rated as insufficient during the adjudication process.
2. Participating country/economy with late data collection.
3. These participating countries’/economies’ reliability coefficient estimation failed in the final scale model
due to a negative residual variance for one or more items that could not be corrected; these countries/economies
have untrustworthy scale scores for the corresponding ISCED level.
Source: OECD, TALIS 2018 database.
Table 11.82. CFA model-data fit for scale T3WELS
Workplace well-being and stress
Participating countries/economies CFI TLI RMSEA SRMR
ISCED level 2
Alberta (Canada) 0.960 0.880 0.128 0.027
Australia 0.971 0.913 0.108 0.024
Austria 0.954 0.863 0.140 0.038
Belgium 0.964 0.891 0.112 0.033
Flemish Community (Belgium) 0.964 0.892 0.126 0.032
Brazil 0.994 0.983 0.051 0.010
Bulgaria 0.980 0.940 0.091 0.024

322
TALIS 2018 TECHNICAL REPORT © OECD 2019
Participating countries/economies CFI TLI RMSEA SRMR
Ciudad Autónoma de Buenos Aires (Argentina) 0.994 0.982 0.048 0.014
Chile 0.993 0.978 0.064 0.018
Colombia 0.996 0.987 0.036 0.018
Croatia 0.988 0.963 0.081 0.023
Cyprus 0.961 0.884 0.122 0.033
Czech Republic 0.985 0.956 0.091 0.021
Denmark 0.992 0.977 0.060 0.015
England (United Kingdom) 0.985 0.955 0.100 0.020
Estonia 0.982 0.945 0.079 0.019
Finland 0.972 0.915 0.101 0.026
France 0.984 0.953 0.073 0.019
Georgia 0.996 0.988 0.029 0.009
Hungary 0.990 0.969 0.070 0.020
Iceland 0.981 0.942 0.115 0.025
Israel 0.893 0.680 0.186 0.054
Italy 0.982 0.947 0.080 0.019
Japan 0.988 0.963 0.080 0.019
Kazakhstan 0.994 0.983 0.031 0.011
Korea 0.990 0.969 0.079 0.018
Latvia 0.984 0.951 0.057 0.015
Lithuania 0.991 0.973 0.062 0.014
Malta 0.976 0.927 0.117 0.028
Mexico 1.000 1.000 0.002 0.006
Netherlands 0.978 0.933 0.080 0.026
New Zealand 0.980 0.941 0.098 0.024
Norway 0.988 0.964 0.065 0.016
Portugal 0.996 0.989 0.040 0.010
Romania 0.992 0.977 0.039 0.016
Russian Federation 1.000 1.003 0.000 0.003
Saudi Arabia 0.974 0.923 0.096 0.032
Shanghai (China) 0.993 0.979 0.052 0.015
Singapore 0.986 0.958 0.076 0.022
Slovak Republic 0.990 0.969 0.056 0.016
Slovenia 0.997 0.990 0.050 0.010
South Africa2 0.850 0.850 0.093 0.157
Spain 0.971 0.913 0.077 0.025
Sweden 0.969 0.908 0.110 0.026
Chinese Taipei 0.992 0.977 0.056 0.012
Turkey 0.999 0.996 0.018 0.007
United Arab Emirates 0.980 0.941 0.092 0.028
United States 0.989 0.968 0.041 0.019
Viet Nam 0.954 0.862 0.164 0.036
ISCED level 1
Australia1 0.966 0.966 0.073 0.071
Flemish Community (Belgium) 0.974 0.921 0.109 0.027
Ciudad Autónoma de Buenos Aires (Argentina) 0.992 0.976 0.065 0.020
Denmark 0.981 0.944 0.087 0.020
England (United Kingdom) 0.965 0.896 0.109 0.029
France 0.982 0.946 0.064 0.023
Japan 0.989 0.967 0.071 0.017
Korea 0.995 0.986 0.041 0.011
Netherlands1 0.946 0.946 0.090 0.122

323
TALIS 2018 TECHNICAL REPORT © OECD 2019
Participating countries/economies CFI TLI RMSEA SRMR
Spain 0.976 0.929 0.072 0.026
Sweden 0.958 0.873 0.140 0.029
Chinese Taipei 0.994 0.981 0.050 0.012
Turkey 0.996 0.988 0.027 0.013
United Arab Emirates 0.988 0.963 0.069 0.024
Viet Nam 0.892 0.677 0.249 0.044
ISCED level 3
Alberta (Canada) 0.977 0.932 0.110 0.023
Brazil 0.999 0.997 0.017 0.007
Croatia 0.988 0.965 0.059 0.017
Denmark 0.985 0.954 0.086 0.018
Portugal 0.995 0.986 0.043 0.010
Slovenia 0.991 0.974 0.062 0.015
Sweden 0.963 0.890 0.112 0.026
Chinese Taipei 0.982 0.947 0.106 0.021
Turkey 1.000 0.999 0.009 0.005
United Arab Emirates 0.984 0.951 0.083 0.025
Viet Nam 0.945 0.836 0.151 0.034
TALIS-PISA link
Australia 0.957 0.957 0.089 0.090
Ciudad Autónoma de Buenos Aires (Argentina) 0.980 0.980 0.052 0.089
Colombia 0.991 0.991 0.029 0.079
Czech Republic 0.971 0.971 0.047 0.090
Denmark 0.979 0.979 0.054 0.043
Georgia 0.703 0.703 0.107 0.556
Malta 0.960 0.960 0.079 0.069
Turkey 0.936 0.936 0.053 0.183
Viet Nam 0.367 0.367 0.267 0.513
1. Data from the participating country/economy were rated as insufficient during the adjudication process.
2. Participating country/economy with late data collection.
Source: OECD, TALIS 2018 database.
Table 11.83. CFA model-data fit for scale T3WLOAD
Workload stress
Participating countries/economies CFI TLI RMSEA SRMR
ISCED level 2
Alberta (Canada) 0.970 0.925 0.062 0.024
Australia 0.980 0.950 0.053 0.020
Austria 0.933 0.833 0.103 0.037
Belgium 0.946 0.864 0.096 0.031
Flemish Community (Belgium) 0.953 0.882 0.082 0.027
Brazil 0.973 0.933 0.079 0.021
Bulgaria 0.957 0.893 0.106 0.043
Ciudad Autónoma de Buenos Aires (Argentina) 0.971 0.927 0.056 0.023
Chile 0.988 0.969 0.052 0.015
Colombia 0.994 0.984 0.033 0.011
Croatia 0.986 0.966 0.050 0.019
Cyprus 0.997 0.994 0.025 0.010
Czech Republic 0.960 0.901 0.084 0.027
Denmark 0.976 0.939 0.086 0.029

324
TALIS 2018 TECHNICAL REPORT © OECD 2019
Participating countries/economies CFI TLI RMSEA SRMR
England (United Kingdom) 0.956 0.891 0.089 0.030
Estonia 0.990 0.974 0.049 0.015
Finland 0.992 0.979 0.034 0.014
France 0.965 0.912 0.081 0.028
Georgia 0.976 0.939 0.066 0.023
Hungary 0.976 0.940 0.080 0.022
Iceland 0.939 0.847 0.116 0.033
Israel 0.987 0.966 0.051 0.018
Italy 0.956 0.891 0.104 0.033
Japan 0.986 0.965 0.053 0.017
Kazakhstan 0.991 0.976 0.042 0.015
Korea 0.991 0.977 0.043 0.014
Latvia 0.991 0.977 0.039 0.014
Lithuania 0.993 0.982 0.033 0.015
Malta 0.971 0.927 0.082 0.026
Mexico 0.969 0.922 0.080 0.022
Netherlands 0.982 0.955 0.047 0.022
New Zealand 0.953 0.884 0.081 0.029
Norway 0.956 0.889 0.085 0.028
Portugal 0.980 0.949 0.072 0.025
Romania 0.970 0.926 0.084 0.040
Russian Federation 0.979 0.948 0.044 0.020
Saudi Arabia 0.976 0.941 0.078 0.030
Shanghai (China) 0.997 0.992 0.026 0.009
Singapore 0.978 0.945 0.066 0.021
Slovak Republic 0.968 0.920 0.085 0.024
Slovenia 0.981 0.951 0.059 0.020
South Africa2 0.905 0.894 0.069 0.112
Spain 0.971 0.927 0.058 0.022
Sweden 0.938 0.845 0.081 0.037
Chinese Taipei 0.996 0.990 0.027 0.009
Turkey 0.989 0.972 0.041 0.014
United Arab Emirates 0.974 0.934 0.080 0.021
United States 0.984 0.959 0.026 0.017
Viet Nam 0.991 0.977 0.050 0.014
ISCED level 1
Australia1 0.949 0.943 0.065 0.064
Flemish Community (Belgium) 0.966 0.916 0.072 0.025
Ciudad Autónoma de Buenos Aires (Argentina) 0.904 0.759 0.105 0.045
Denmark 0.958 0.895 0.095 0.043
England (United Kingdom) 0.981 0.953 0.056 0.020
France 0.987 0.967 0.041 0.019
Japan 0.984 0.960 0.062 0.019
Korea 0.968 0.920 0.076 0.028
Netherlands1 0.895 0.884 0.091 0.103
Spain 0.981 0.952 0.050 0.021
Sweden 0.865 0.663 0.155 0.048
Chinese Taipei 0.996 0.991 0.024 0.011
Turkey 0.992 0.981 0.026 0.015
United Arab Emirates 0.983 0.957 0.062 0.017
Viet Nam 0.995 0.987 0.043 0.011
ISCED level 3

325
TALIS 2018 TECHNICAL REPORT © OECD 2019
Participating countries/economies CFI TLI RMSEA SRMR
Alberta (Canada) 0.990 0.974 0.041 0.021
Brazil 0.979 0.948 0.069 0.020
Croatia 0.992 0.979 0.045 0.015
Denmark 0.964 0.910 0.082 0.033
Portugal 0.985 0.964 0.055 0.019
Slovenia 0.947 0.868 0.094 0.033
Sweden 0.947 0.868 0.092 0.032
Chinese Taipei 0.999 0.997 0.014 0.008
Turkey 0.976 0.939 0.045 0.019
United Arab Emirates 0.985 0.961 0.064 0.017
Viet Nam 0.990 0.975 0.048 0.014
TALIS-PISA link
Australia 0.974 0.971 0.053 0.033
Ciudad Autónoma de Buenos Aires (Argentina) 0.901 0.890 0.070 0.114
Colombia 0.986 0.984 0.034 0.084
Czech Republic 0.946 0.940 0.049 0.126
Denmark 0.889 0.877 0.107 0.184
Georgia 0.805 0.783 0.077 0.292
Malta 0.977 0.974 0.050 0.056
Turkey 0.908 0.897 0.052 0.138
Viet Nam 0.951 0.945 0.061 0.111
1. Data from the participating country/economy were rated as insufficient during the adjudication process.
2. Participating country/economy with late data collection.
Source: OECD, TALIS 2018 database.
Table 11.84. Invariance test results for scale T3WELS
CFI TLI RMSEA SRMR Δ CFI Δ TLI Δ RMSEA Δ SRMR
Invariance level of ISCED level 2
Configural 0.983 0.948 0.080 0.022
Metric 0.948 0.936 0.088 0.090 0.035 0.012 -0.008 -0.068
Scalar 0.710 0.779 0.164 0.211 0.238 0.157 -0.076 -0.121
Invariance level of ISCED level 1
Configural 0.977 0.932 0.091 0.025
Metric 0.904 0.879 0.121 0.133 0.073 0.053 -0.030 -0.108
Scalar 0.724 0.780 0.164 0.264 0.180 0.099 -0.043 -0.131
Invariance level of ISCED level 3
Configural 0.984 0.953 0.077 0.020
Metric 0.904 0.879 0.124 0.138 0.080 0.074 -0.047 -0.118
Scalar 0.746 0.796 0.161 0.283 0.158 0.083 -0.037 -0.145
Note: See endnote 34.
Source: OECD, TALIS 2018 database.

326
TALIS 2018 TECHNICAL REPORT © OECD 2019
Table 11.85. Invariance test results for scale T3WLOAD
CFI TLI RMSEA SRMR Δ CFI Δ TLI Δ RMSEA Δ SRMR
Invariance level of ISCED level 2
Configural 0.976 0.939 0.067 0.024
Metric 0.949 0.936 0.068 0.069 0.027 0.003 -0.001 -0.045
Scalar 0.762 0.799 0.121 0.136 0.187 0.137 -0.053 -0.067
Invariance level of ISCED level 1
Configural 0.977 0.943 0.062 0.025
Metric 0.954 0.940 0.064 0.064 0.023 0.003 -0.002 -0.039
Scalar 0.714 0.749 0.131 0.155 0.240 0.191 -0.067 -0.091
Invariance level of ISCED level 3
Configural 0.980 0.951 0.062 0.021
Metric 0.938 0.919 0.080 0.087 0.042 0.032 -0.018 -0.066
Scalar 0.815 0.836 0.113 0.120 0.123 0.083 -0.033 -0.033
Note: See endnote 34.
Source: OECD, TALIS 2018 database.
Table 11.86. Invariance test results for scale T3STBEH
CFI TLI RMSEA SRMR Δ CFI Δ TLI Δ RMSEA Δ SRMR
Invariance level of ISCED level 2
Configural 1.000 1.000 0.000 0.000
Metric 0.934 0.899 0.096 0.082 0.066 0.101 -0.096 -0.082
Scalar 0.706 0.775 0.144 0.163 0.228 0.124 -0.048 -0.081
Invariance level of ISCED level 1
Configural 1.000 1.000 0.000 0.000
Metric 0.929 0.885 0.100 0.103 0.071 0.115 -0.100 -0.103
Scalar 0.739 0.788 0.136 0.159 0.190 0.097 -0.036 -0.056
Invariance level of ISCED level 3
Configural 1.000 1.000 0.000 0.000
Metric 0.915 0.860 0.114 0.101 0.085 0.140 -0.114 -0.101
Scalar 0.739 0.785 0.141 0.137 0.176 0.075 -0.027 -0.036
Note: See endnote 34.
Source: OECD, TALIS 2018 database.
Table 11.87. Unstandardised factor loadings for T3WELS, T3WLOAD and T3STBEH for all
countries for all populations
T3WELS (Metric) T3WLOAD (Metric)
TT3G51A 0.561 TT3G52A 0.629
TT3G51B 0.209 TT3G52B 0.707
TT3G51C 0.767 TT3G52C 0.685
TT3G51D 0.692 TT3G52D 0.464
TT3G52E 0.352
Source: OECD, TALIS 2018 database.

327
TALIS 2018 TECHNICAL REPORT © OECD 2019
Table 11.88. Standardised factor loadings and unstandardised intercepts for scale T3WELS
Participating countries/economies
Standardised factor loadings Unstandardised intercepts
TT3G51A TT3G51B TT3G51C TT3G51D TT3G51A TT3G51B TT3G51C TT3G51D
ISCED level 2
Alberta (Canada) 0.673 0.331 0.899 0.794 2.814 2.748 2.085 1.957
Australia 0.716 0.315 0.894 0.800 2.794 2.685 2.078 1.914
Austria 0.651 0.278 0.880 0.827 2.464 2.317 1.743 1.676
Belgium 0.685 0.317 0.879 0.758 2.790 2.113 2.208 2.057
Flemish Community (Belgium)
0.700 0.314 0.875 0.773 2.947 2.208 2.130 1.848
Brazil 0.680 0.336 0.928 0.862 2.354 2.607 2.019 2.050
Bulgaria 0.689 0.300 0.893 0.836 2.710 2.752 2.192 1.932
Ciudad Autónoma de Buenos Aires (Argentina)
0.607 0.261 0.918 0.801 2.155 2.643 1.479 1.618
Chile 0.671 0.318 0.913 0.846 2.607 2.778 1.924 1.842
Colombia 0.677 0.332 0.891 0.816 2.501 1.806 1.870 2.065
Croatia 0.674 0.291 0.909 0.834 2.214 2.409 1.639 1.619
Cyprus 0.646 0.303 0.908 0.837 2.578 2.622 2.113 1.981
Czech Republic 0.674 0.266 0.878 0.797 2.307 2.355 1.983 1.717
Denmark 0.710 0.330 0.904 0.810 2.619 1.918 2.078 1.715
England (United Kingdom)
0.721 0.334 0.895 0.781 3.052 2.856 2.273 2.069
Estonia 0.650 0.274 0.864 0.775 2.707 2.484 1.952 1.764
Finland 0.617 0.258 0.828 0.716 2.507 2.376 1.747 1.581
France 0.629 0.303 0.834 0.743 2.440 2.136 2.024 2.115
Georgia 0.591 0.171 0.877 0.773 1.351 2.659 1.256 1.261
Hungary 0.687 0.328 0.864 0.828 2.941 2.095 1.932 2.046
Iceland 0.668 0.279 0.931 0.828 2.688 2.974 1.928 1.825
Israel 0.569 0.304 0.908 0.829 2.492 2.738 1.825 1.818
Italy 0.609 0.294 0.874 0.799 2.206 2.275 1.555 1.645
Japan 0.696 0.310 0.921 0.828 2.573 2.817 2.070 1.992
Kazakhstan 0.673 0.246 0.898 0.804 1.653 2.705 1.649 1.679
Korea 0.725 0.300 0.941 0.871 2.528 2.891 2.307 2.180
Latvia 0.662 0.302 0.858 0.790 2.806 2.299 2.342 2.250
Lithuania 0.726 0.307 0.902 0.821 2.339 2.478 2.158 1.971
Malta 0.689 0.298 0.878 0.812 2.884 2.603 2.037 1.916
Mexico 0.593 0.224 0.885 0.801 2.171 2.530 1.541 1.562
Netherlands 0.600 0.248 0.893 0.782 2.268 2.401 1.631 1.504
New Zealand 0.696 0.323 0.914 0.798 2.827 2.705 2.091 1.923
Norway 0.581 0.244 0.842 0.765 2.528 2.135 1.712 1.484
Portugal 0.744 0.326 0.869 0.800 3.215 2.419 2.724 2.636
Romania 0.602 0.237 0.850 0.793 1.994 2.497 1.495 1.572
Russian Federation 0.708 0.247 0.903 0.799 2.010 2.778 1.914 1.824
Saudi Arabia 0.691 0.292 0.928 0.841 2.235 2.718 2.154 2.229
Shanghai (China) 0.650 0.326 0.885 0.812 2.470 2.812 1.759 1.975
Singapore 0.674 0.313 0.882 0.809 2.822 2.729 1.993 2.057
Slovak Republic 0.674 0.283 0.869 0.791 2.455 2.464 1.999 1.759
Slovenia 0.695 0.318 0.921 0.823 2.561 2.512 1.931 1.855
South Africa2 0.680 0.278 0.917 0.849 2.794 2.718 2.055 2.074
Spain 0.647 0.281 0.890 0.820 2.313 2.448 1.685 1.656
Sweden 0.680 0.292 0.902 0.792 2.530 2.496 2.012 1.729
Chinese Taipei 0.696 0.300 0.912 0.849 2.444 2.612 2.045 2.097

328
TALIS 2018 TECHNICAL REPORT © OECD 2019
Participating countries/economies
Standardised factor loadings Unstandardised intercepts
TT3G51A TT3G51B TT3G51C TT3G51D TT3G51A TT3G51B TT3G51C TT3G51D
Turkey 0.649 0.266 0.856 0.780 2.135 2.469 1.724 1.865
United Arab Emirates 0.705 0.306 0.921 0.857 2.823 2.448 2.192 2.234
United States 0.632 0.286 0.887 0.818 2.757 2.494 1.862 1.711
Viet Nam 0.603 0.185 0.886 0.803 2.100 3.227 1.491 1.555
ISCED level 1
Australia1 0.688 0.309 0.913 0.807 2.765 2.707 2.078 1.902
Flemish Community (Belgium)
0.714 0.330 0.891 0.778 2.947 2.208 2.130 1.848
Ciudad Autónoma de Buenos Aires (Argentina)
0.644 0.317 0.903 0.848 2.155 2.643 1.479 1.618
Denmark 0.714 0.319 0.877 0.781 2.619 1.918 2.078 1.715
England (United Kingdom)
0.696 0.318 0.892 0.790 3.052 2.856 2.273 2.069
France 0.673 0.328 0.829 0.761 2.440 2.136 2.024 2.115
Japan 0.686 0.312 0.924 0.827 2.573 2.817 2.070 1.992
Korea 0.736 0.280 0.936 0.874 2.528 2.891 2.307 2.180
Netherlands1 0.648 0.277 0.882 0.811 2.377 2.492 1.733 1.574
Spain 0.619 0.270 0.904 0.809 2.313 2.448 1.685 1.656
Sweden 0.685 0.295 0.897 0.786 2.530 2.496 2.012 1.729
Chinese Taipei 0.703 0.297 0.900 0.835 2.444 2.612 2.045 2.097
Turkey 0.669 0.280 0.881 0.801 2.135 2.469 1.724 1.865
United Arab Emirates 0.717 0.315 0.924 0.857 2.823 2.448 2.192 2.234
Viet Nam 0.585 0.182 0.900 0.816 2.100 3.227 1.491 1.555
ISCED level 3
Alberta (Canada) 0.675 0.328 0.924 0.798 2.814 2.748 2.085 1.957
Brazil 0.675 0.332 0.913 0.850 2.354 2.607 2.019 2.050
Croatia 0.641 0.266 0.894 0.797 2.214 2.409 1.639 1.619
Denmark 0.709 0.320 0.891 0.805 2.619 1.918 2.078 1.715
Portugal 0.742 0.338 0.878 0.814 3.215 2.419 2.724 2.636
Slovenia 0.674 0.291 0.905 0.808 2.561 2.512 1.931 1.855
Sweden 0.678 0.286 0.871 0.791 2.530 2.496 2.012 1.729
Chinese Taipei 0.709 0.324 0.915 0.858 2.444 2.612 2.045 2.097
Turkey 0.659 0.262 0.850 0.772 2.135 2.469 1.724 1.865
United Arab Emirates 0.712 0.306 0.925 0.859 2.823 2.448 2.192 2.234
Viet Nam 0.617 0.185 0.875 0.777 2.100 3.227 1.491 1.555
TALIS-PISA link
Australia 0.697 0.316 0.905 0.794 2.857 2.735 2.184 1.986
Ciudad Autónoma de Buenos Aires (Argentina)
0.615 0.277 0.893 0.837 2.236 2.706 1.565 1.662
Colombia 0.681 0.327 0.894 0.811 2.474 1.817 1.821 2.004
Czech Republic 0.661 0.250 0.855 0.785 2.292 2.318 1.961 1.684
Denmark 0.685 0.311 0.871 0.819 2.567 1.889 2.039 1.700
Georgia 0.621 0.180 0.889 0.830 1.331 2.668 1.252 1.243
Malta 0.685 0.309 0.880 0.816 2.857 2.626 2.010 1.918
Turkey 0.631 0.249 0.854 0.741 2.076 2.502 1.610 1.761
Viet Nam 0.610 0.181 0.885 0.785 2.094 3.234 1.462 1.520
1. Data from participating country/economy rated as insufficient during the adjudication process.
2. Participating country/economy with late data collection.
Source: OECD, TALIS 2018 database.

329
TALIS 2018 TECHNICAL REPORT © OECD 2019
Table 11.89. Standardised factor loadings and unstandardised intercepts for
scale T3WLOAD
Participating countries/economies
Standardised factor loadings Unstandardised intercepts
TT3G52A TT3G52B TT3G52C TT3G52D TT3G52E TT3G52A TT3G52B TT3G52C TT3G52D TT3G52E
ISCED level 2
Alberta (Canada) 0.715 0.746 0.651 0.453 0.387 2.201 2.040 2.428 2.191 1.583
Australia 0.707 0.749 0.697 0.475 0.382 2.145 1.937 2.426 2.672 1.958
Austria 0.613 0.685 0.557 0.378 0.315 2.046 1.649 2.209 2.494 2.192
Belgium 0.678 0.743 0.671 0.453 0.353 2.408 1.879 2.533 2.838 2.189
Flemish Community (Belgium)
0.592 0.736 0.599 0.422 0.304 2.259 1.568 2.433 2.978 2.230
Brazil 0.830 0.863 0.806 0.550 0.454 2.144 2.241 2.529 2.271 1.789
Bulgaria 0.891 0.945 0.741 0.514 0.446 2.040 2.042 2.073 2.712 1.910
Ciudad Autónoma de Buenos Aires (Argentina)
0.721 0.696 0.600 0.454 0.436 1.637 1.704 2.215 1.772 1.308
Chile 0.743 0.784 0.748 0.507 0.370 2.348 2.344 2.565 2.616 2.266
Colombia 0.776 0.824 0.809 0.520 0.412 2.401 2.236 2.628 2.478 2.240
Croatia 0.723 0.722 0.720 0.468 0.411 2.176 1.774 2.196 2.677 1.775
Cyprus 0.780 0.764 0.802 0.539 0.431 2.312 2.249 2.498 2.252 2.064
Czech Republic 0.658 0.727 0.695 0.410 0.345 1.932 1.703 2.004 2.794 2.104
Denmark 0.847 0.873 0.770 0.566 0.449 2.743 2.690 2.574 2.543 2.070
England (United Kingdom)
0.692 0.699 0.708 0.515 0.350 2.345 2.269 2.998 2.860 2.083
Estonia 0.744 0.795 0.747 0.536 0.439 2.079 1.861 2.055 2.146 1.920
Finland 0.609 0.690 0.587 0.374 0.352 1.962 1.537 1.912 2.175 1.572
France 0.689 0.748 0.665 0.470 0.411 2.580 2.106 2.724 2.664 1.662
Georgia 0.679 0.795 0.729 0.444 0.469 1.605 1.417 1.476 1.730 1.351
Hungary 0.735 0.781 0.822 0.561 0.424 2.068 2.362 2.185 2.826 2.468
Iceland 0.728 0.749 0.719 0.458 0.357 1.930 1.948 2.008 2.364 2.107
Israel 0.720 0.766 0.712 0.489 0.400 2.254 2.204 2.515 2.205 1.949
Italy 0.823 0.885 0.701 0.480 0.413 2.108 1.990 2.287 2.294 1.820
Japan 0.756 0.759 0.748 0.480 0.398 2.109 1.926 1.988 2.656 1.752
Kazakhstan 0.750 0.825 0.786 0.505 0.450 2.097 1.882 2.030 2.196 1.715
Korea 0.775 0.768 0.757 0.455 0.431 1.921 2.074 1.844 2.585 1.638
Latvia 0.660 0.725 0.759 0.492 0.401 2.684 2.014 2.033 2.339 2.041
Lithuania 0.699 0.739 0.645 0.454 0.350 2.441 1.940 2.280 2.581 1.965
Malta 0.752 0.770 0.729 0.534 0.393 2.729 2.514 2.682 2.493 2.306
Mexico 0.703 0.793 0.701 0.396 0.375 1.750 1.519 1.957 2.167 1.506
Netherlands 0.677 0.671 0.671 0.471 0.350 1.825 1.787 2.090 2.451 1.918
New Zealand 0.720 0.736 0.687 0.493 0.380 2.160 1.928 2.513 2.848 1.890
Norway 0.718 0.717 0.659 0.457 0.356 2.273 2.021 2.485 2.484 2.032
Portugal 0.798 0.830 0.769 0.493 0.377 2.918 2.880 3.144 3.088 2.027
Romania 0.876 0.912 0.732 0.471 0.393 1.855 1.836 2.008 2.381 1.850
Russian Federation 0.689 0.788 0.722 0.426 0.428 1.789 1.742 1.911 2.253 1.575
Saudi Arabia 0.828 0.894 0.830 0.567 0.437 2.701 2.779 2.845 2.287 2.418
Shanghai (China) 0.803 0.797 0.715 0.464 0.456 2.111 2.140 2.184 1.886 1.618
Singapore 0.757 0.784 0.694 0.502 0.398 2.242 2.088 2.496 2.625 2.016
Slovak Republic 0.704 0.755 0.747 0.465 0.389 2.094 1.796 1.927 2.606 2.041
Slovenia 0.666 0.698 0.660 0.445 0.352 2.154 1.744 2.111 2.721 2.213
South Africa2 0.712 0.778 0.754 0.527 0.364 2.553 2.573 3.133 2.851 2.210
Spain 0.752 0.769 0.747 0.483 0.426 2.238 2.178 2.468 2.452 1.736
Sweden 0.680 0.679 0.668 0.478 0.314 2.167 2.301 2.560 2.884 2.437

330
TALIS 2018 TECHNICAL REPORT © OECD 2019
Participating countries/economies
Standardised factor loadings Unstandardised intercepts
TT3G52A TT3G52B TT3G52C TT3G52D TT3G52E TT3G52A TT3G52B TT3G52C TT3G52D TT3G52E
Chinese Taipei 0.735 0.732 0.710 0.379 0.408 1.936 2.017 2.017 2.259 1.849
Turkey 0.728 0.724 0.668 0.442 0.354 1.842 1.928 2.036 2.188 1.797
United Arab Emirates 0.799 0.834 0.824 0.584 0.463 2.529 2.547 2.628 2.421 2.448
United States 0.729 0.775 0.682 0.472 0.397 2.093 1.896 2.211 2.064 1.586
Viet Nam 0.814 0.874 0.822 0.566 0.527 2.338 2.117 2.166 2.110 1.649
ISCED level 1
Australia1 0.724 0.760 0.738 0.498 0.420 2.333 2.047 2.164 2.512 1.589
Flemish Community (Belgium)
0.602 0.696 0.576 0.430 0.294 2.259 1.568 2.433 2.978 2.230
Ciudad Autónoma de Buenos Aires (Argentina)
0.721 0.725 0.633 0.461 0.308 1.673 1.661 2.025 1.807 1.953
Denmark 0.799 0.809 0.717 0.529 0.411 2.874 2.804 2.237 2.631 2.135
England (United Kingdom)
0.727 0.736 0.700 0.516 0.378 2.449 2.002 2.599 2.729 1.809
France 0.681 0.721 0.692 0.469 0.356 2.876 2.163 2.597 2.742 1.950
Japan 0.815 0.811 0.764 0.540 0.403 2.109 1.926 1.988 2.656 1.752
Korea 0.749 0.738 0.776 0.368 0.392 1.921 2.074 1.844 2.585 1.638
Netherlands1 0.679 0.685 0.679 0.475 0.311 1.908 1.815 2.029 3.078 1.890
Spain 0.773 0.784 0.742 0.471 0.427 2.238 2.178 2.468 2.452 1.736
Sweden 0.675 0.699 0.694 0.454 0.314 2.059 2.033 2.345 2.749 2.536
Chinese Taipei 0.751 0.765 0.629 0.381 0.415 1.863 1.838 2.026 2.339 1.470
Turkey 0.714 0.696 0.684 0.445 0.401 1.842 1.928 2.036 2.188 1.797
United Arab Emirates 0.801 0.813 0.800 0.576 0.444 2.529 2.547 2.628 2.421 2.448
Viet Nam 0.843 0.873 0.809 0.611 0.548 2.338 2.117 2.166 2.110 1.649
ISCED level 3
Alberta (Canada) 0.724 0.771 0.647 0.449 0.385 2.201 2.040 2.428 2.191 1.583
Brazil 0.813 0.849 0.816 0.532 0.437 2.144 2.241 2.529 2.271 1.789
Croatia 0.712 0.772 0.710 0.462 0.422 2.176 1.774 2.196 2.677 1.775
Denmark 0.850 0.877 0.674 0.520 0.429 2.666 2.628 2.684 2.281 1.936
Portugal 0.813 0.835 0.764 0.502 0.398 2.918 2.880 3.144 3.088 2.027
Slovenia 0.713 0.675 0.670 0.459 0.374 2.046 1.933 2.198 2.485 2.147
Sweden 0.702 0.711 0.671 0.477 0.352 2.125 2.248 2.582 2.724 1.893
Chinese Taipei 0.738 0.744 0.731 0.386 0.426 2.016 2.081 2.076 2.341 1.743
Turkey 0.723 0.740 0.675 0.444 0.368 1.842 1.928 2.036 2.188 1.797
United Arab Emirates 0.819 0.852 0.846 0.592 0.474 2.529 2.547 2.628 2.421 2.448
Viet Nam 0.805 0.850 0.813 0.552 0.537 2.338 2.117 2.166 2.110 1.649
TALIS-PISA link
Australia 0.724 0.752 0.697 0.489 0.381 2.175 1.983 2.546 2.815 1.940
Ciudad Autónoma de Buenos Aires (Argentina)
0.730 0.738 0.651 0.460 0.421 1.734 1.793 2.375 1.921 1.385
Colombia 0.781 0.812 0.792 0.521 0.396 2.368 2.207 2.613 2.444 2.153
Czech Republic 0.662 0.729 0.700 0.404 0.344 1.934 1.762 2.017 2.693 2.034
Denmark 0.838 0.861 0.735 0.552 0.436 2.793 2.669 2.692 2.568 2.063
Georgia 0.642 0.786 0.718 0.414 0.443 1.607 1.371 1.443 1.730 1.340
Malta 0.755 0.750 0.704 0.516 0.385 2.694 2.527 2.760 2.577 2.344
Turkey 0.729 0.749 0.670 0.440 0.369 1.777 1.852 2.066 2.109 1.806
Viet Nam 0.816 0.860 0.818 0.595 0.519 2.382 2.121 2.199 2.176 1.657
1. Data from the participating country/economy were rated as insufficient during the adjudication process.
2. Participating country/economy with late data collection.
Source: OECD, TALIS 2018 database.

331
TALIS 2018 TECHNICAL REPORT © OECD 2019
Table 11.90. Standardised factor loadings and unstandardised intercepts for scale T3STBEH
Participating countries/economies Standardised factor loadings Unstandardised intercepts
TT3G52F TT3G52G TT3G52H TT3G52F TT3G52G TT3G52H
ISCED level 2
Alberta (Canada) 0.349 0.946 0.539 2.327 2.096 1.428
Australia 0.356 0.824 0.724 2.268 2.047 1.527
Austria 0.483 0.677 0.686 2.050 2.274 1.357
Belgium 0.389 0.804 0.729 2.495 2.517 1.858
Flemish Community (Belgium) 0.378 0.857 0.682 2.458 2.322 1.648
Brazil 0.685 0.825 0.531 2.603 2.593 2.180
Bulgaria 0.556 0.849 0.460 2.761 2.872 1.866
Ciudad Autónoma de Buenos Aires (Argentina) 0.588 0.727 0.653 1.723 2.051 1.391
Chile 0.580 0.818 0.508 2.697 2.462 1.647
Colombia 0.622 1.022 0.431 2.683 2.485 2.060
Croatia 0.373 0.901 0.481 2.588 2.184 1.409
Cyprus 0.425 0.870 0.652 2.567 2.321 1.857
Czech Republic 0.366 0.901 0.515 2.367 2.159 1.344
Denmark 0.448 0.789 0.633 2.084 2.028 1.451
England (United Kingdom) 0.338 1.039 0.530 2.978 2.118 1.549
Estonia 0.378 0.775 0.538 2.480 2.134 1.628
Finland 0.359 0.833 0.694 2.006 2.096 1.555
France 0.434 0.877 0.591 2.522 2.649 1.894
Georgia 0.612 0.978 0.246 1.793 1.685 1.131
Hungary 0.537 0.689 0.584 1.781 2.444 1.307
Iceland 0.454 0.795 0.578 1.976 2.238 1.617
Israel 0.526 1.016 0.307 2.742 2.628 1.392
Italy 0.466 0.731 0.584 2.165 2.313 1.390
Japan 0.516 1.031 0.346 2.337 2.187 1.402
Kazakhstan 0.613 0.790 0.614 2.105 1.850 1.507
Korea 0.559 0.891 0.611 2.109 2.456 2.030
Latvia 0.341 0.851 0.503 3.052 2.685 1.711
Lithuania 0.333 0.778 0.694 2.945 2.417 1.963
Malta 0.423 0.822 0.703 2.394 2.524 1.815
Mexico 0.606 0.933 0.425 2.133 1.884 1.399
Netherlands 0.356 1.044 0.491 2.163 1.836 1.294
New Zealand 0.403 0.890 0.648 2.460 2.110 1.522
Norway 0.419 0.846 0.527 1.934 1.776 1.338
Portugal 0.369 0.915 0.635 3.119 3.013 2.269
Romania 0.525 0.992 0.520 2.383 2.140 1.514
Russian Federation 0.340 0.948 0.476 2.317 1.748 1.333
Saudi Arabia 0.692 0.845 0.312 2.913 2.838 1.563
Shanghai (China) 0.309 0.886 0.439 2.677 1.902 1.262
Singapore 0.413 0.908 0.601 2.616 2.180 1.482
Slovak Republic 0.470 0.739 0.624 2.430 2.361 1.459
Slovenia 0.355 0.882 0.459 2.570 2.445 1.355
South Africa2 0.398 0.833 0.663 3.153 2.757 2.154
Spain 0.433 0.930 0.440 2.320 2.414 1.536
Sweden 0.416 0.886 0.533 2.336 1.989 1.499
Chinese Taipei 0.533 0.951 0.415 2.439 2.216 1.401
Turkey 0.522 0.820 0.482 2.336 2.174 1.398
United Arab Emirates 0.613 0.923 0.447 2.572 2.373 1.482
United States 0.291 1.095 0.489 2.233 2.163 1.496
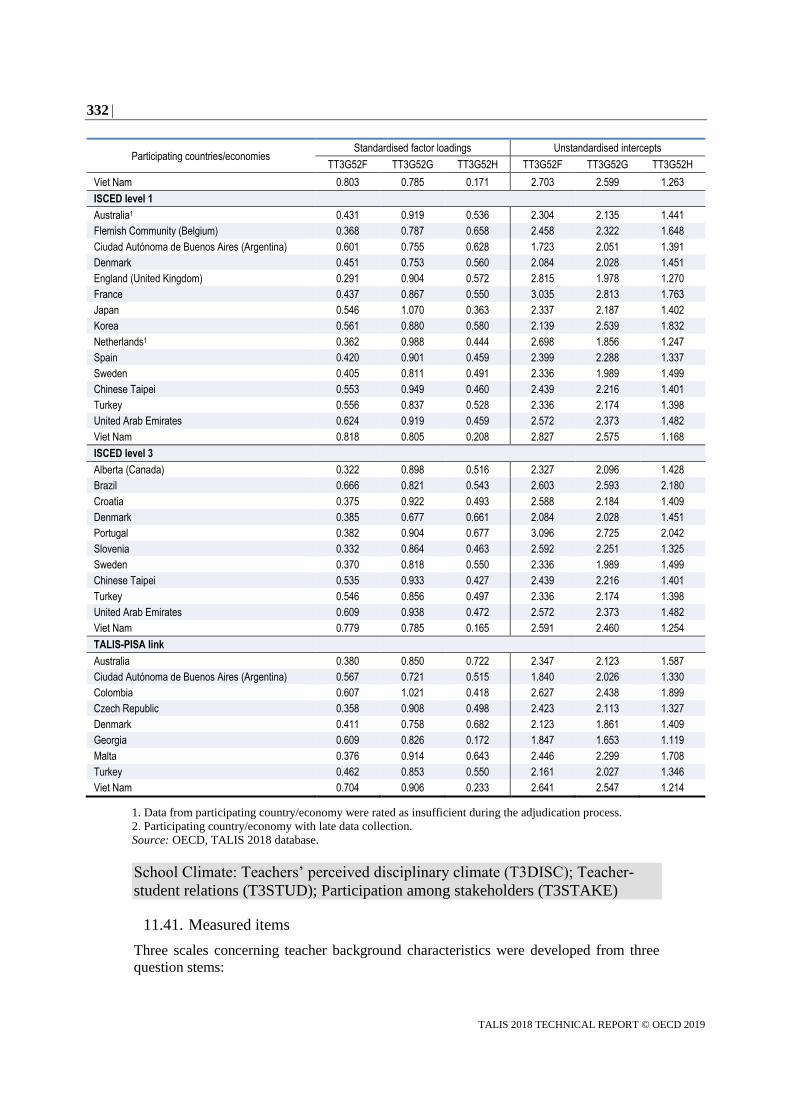
332
TALIS 2018 TECHNICAL REPORT © OECD 2019
Participating countries/economies Standardised factor loadings Unstandardised intercepts
TT3G52F TT3G52G TT3G52H TT3G52F TT3G52G TT3G52H
Viet Nam 0.803 0.785 0.171 2.703 2.599 1.263
ISCED level 1
Australia1 0.431 0.919 0.536 2.304 2.135 1.441
Flemish Community (Belgium) 0.368 0.787 0.658 2.458 2.322 1.648
Ciudad Autónoma de Buenos Aires (Argentina) 0.601 0.755 0.628 1.723 2.051 1.391
Denmark 0.451 0.753 0.560 2.084 2.028 1.451
England (United Kingdom) 0.291 0.904 0.572 2.815 1.978 1.270
France 0.437 0.867 0.550 3.035 2.813 1.763
Japan 0.546 1.070 0.363 2.337 2.187 1.402
Korea 0.561 0.880 0.580 2.139 2.539 1.832
Netherlands1 0.362 0.988 0.444 2.698 1.856 1.247
Spain 0.420 0.901 0.459 2.399 2.288 1.337
Sweden 0.405 0.811 0.491 2.336 1.989 1.499
Chinese Taipei 0.553 0.949 0.460 2.439 2.216 1.401
Turkey 0.556 0.837 0.528 2.336 2.174 1.398
United Arab Emirates 0.624 0.919 0.459 2.572 2.373 1.482
Viet Nam 0.818 0.805 0.208 2.827 2.575 1.168
ISCED level 3
Alberta (Canada) 0.322 0.898 0.516 2.327 2.096 1.428
Brazil 0.666 0.821 0.543 2.603 2.593 2.180
Croatia 0.375 0.922 0.493 2.588 2.184 1.409
Denmark 0.385 0.677 0.661 2.084 2.028 1.451
Portugal 0.382 0.904 0.677 3.096 2.725 2.042
Slovenia 0.332 0.864 0.463 2.592 2.251 1.325
Sweden 0.370 0.818 0.550 2.336 1.989 1.499
Chinese Taipei 0.535 0.933 0.427 2.439 2.216 1.401
Turkey 0.546 0.856 0.497 2.336 2.174 1.398
United Arab Emirates 0.609 0.938 0.472 2.572 2.373 1.482
Viet Nam 0.779 0.785 0.165 2.591 2.460 1.254
TALIS-PISA link
Australia 0.380 0.850 0.722 2.347 2.123 1.587
Ciudad Autónoma de Buenos Aires (Argentina) 0.567 0.721 0.515 1.840 2.026 1.330
Colombia 0.607 1.021 0.418 2.627 2.438 1.899
Czech Republic 0.358 0.908 0.498 2.423 2.113 1.327
Denmark 0.411 0.758 0.682 2.123 1.861 1.409
Georgia 0.609 0.826 0.172 1.847 1.653 1.119
Malta 0.376 0.914 0.643 2.446 2.299 1.708
Turkey 0.462 0.853 0.550 2.161 2.027 1.346
Viet Nam 0.704 0.906 0.233 2.641 2.547 1.214
1. Data from participating country/economy were rated as insufficient during the adjudication process.
2. Participating country/economy with late data collection.
Source: OECD, TALIS 2018 database.
School Climate: Teachers’ perceived disciplinary climate (T3DISC); Teacher-
student relations (T3STUD); Participation among stakeholders (T3STAKE)
11.41. Measured items
Three scales concerning teacher background characteristics were developed from three
question stems:

333
TALIS 2018 TECHNICAL REPORT © OECD 2019
“How strongly do you agree or disagree with the following statements about this
<target class>?” (TT3G41). The stem was followed by items regarding student
behaviour that were used to form the scale Teacher’s perceived disciplinary climate
(T3DISC).
“How strongly do you agree or disagree with the following statements about what
happens in this school?” (TT3G49). Items about teacher-student interaction
following this question were used to form the scale Teacher-student relation
(T3STUD).
“How strongly do you agree or disagree with these statements, as applied to this
school?” (TT3G48), followed by items concerning school decision making that
were used to form the scale Participation among stakeholders (T3STAKE).
These scales are presented in Table 11.91.
11.42. Model improvements
Model improvements were included for scale T3STAKE by initially adding a correlation
between items TT3G48D and TT3G48E. After the analysis of each country’s/economy’s
model, a correlation between items TT3G48B and TT3G48C was added, as this
improvement was needed for nearly all populations to improve the overall fit of the models.
11.43. Scale reliability
Table 11.92, which presents the reliabilities for all populations for the three scales, shows
that all scales have high reliability in all populations.
11.44. Model fits
The model fit indices presented for scale T3DISC in Table 11.93 show acceptable fit for
all populations except the TALIS-PISA link population in Viet Nam. All populations
exhibit an acceptable fit for scale T3STUD (Table 11.94), and all except the Netherlands
ISCED level 1 population for scale T3STAKE (Table 11.95).
11.45. Invariance testing
r present the invariance results for scales T3DISC, T3STUD and T3STAKE respectively.
All the scales reached metric invariance for all ISCED levels. The configural models are
near perfect for scale T3DISC, and the metric models exhibit acceptable fit, leading to a
metric invariant scale.
11.46. Item parameters
Table 11.99 presents the unstandardised factor loadings for the school climate scales, while
Table 11.100 presents the standardised factor loadings and unstandardised intercepts for
scale T3DISC.
The tables show that the factor loadings for items TT3G41A, TT3G41C and TT3G41D are
above 0.600 in all populations. However, the majority of factor loadings for item TT3G41B
are between 0.450 and 0.600, suggesting a moderately strong relationship between this
item and the latent factor.
Most factor loadings for scale T3STUD presented in Table 11.101 are above 0.600 for
items TT3G49A, TT3G49B and TT3G49C. The factor loading for item TT3G49D is

334
TALIS 2018 TECHNICAL REPORT © OECD 2019
between 0.450 and 0.600 in a fair number of populations, while the loading for the
Denmark ISCED level 2 population is below 0.450.
Lastly, for scale T3STAKE, presented in Table 11.102, most factor loadings for all items
are above 0.600, with notable exceptions for several items for a number of ISCED level 1
populations and for item TT3G48E for some populations.
Table 11.91. Item wording for school climate scales
T3DISC: Teachers’ perceived disciplinary climate
TT3G41: How strongly do you agree or disagree with the following statements about this <target class>?
Response options: “Strongly disagree” (1), “Disagree” (2), “Agree” (3), “Strongly agree” (4).
TT3G41A When the lesson begins, I have to wait quite a long time for students to quieten down
TT3G41B* Students in this class take care to create a pleasant learning atmosphere
TT3G41C I lose quite a lot of time because of students interrupting the lesson
TT3G41D There is much disruptive noise in this classroom
T3STUD: Teacher-student relations
TT3G49: How strongly do you agree or disagree with the following statements about what happens in this school?
Response options: “Strongly disagree” (1), “Disagree” (2), “Agree” (3), “Strongly agree” (4).
TT3G49A Teachers and students usually get on well with each other.
TT3G49B Most teachers believe that the students’ well-being is important.
TT3G49C Most teachers are interested in what students have to say.
TT3G49D If a student needs extra assistance, the school provides it.
T3STAKE: Participation among stakeholders, teachers
TT3G48: How strongly do you agree or disagree with these statements, as applied to this school?
Response options: “Strongly disagree” (1), “Disagree” (2), “Agree” (3), “Strongly agree” (4).
TT3G48A This school provides staff with opportunities to actively participate in school decisions.
TT3G48B This school provides parents or guardians with opportunities to actively participate in school decisions.
TT3G48C This school provides students with opportunities to actively participate in school decisions.
TT3G48D This school has a culture of shared responsibility for school issues.
TT3G48E There is a collaborative school culture which is characterised by mutual support.
* Item was reverse coded.
Source: OECD, TALIS 2018 database.
Table 11.92. Omega coefficients for populations of each participating country/economy
Participating countries/economies T3DISC T3STUD T3STAKE
Omega coefficient
ISCED level 2
Alberta (Canada) 0.901 0.848 0.869
Australia 0.927 0.843 0.834
Austria 0.872 0.808 0.830
Belgium 0.906 0.821 0.812
Flemish Community (Belgium) 0.916 0.819 0.799
Brazil 0.901 0.812 0.880
Bulgaria 0.841 0.857 0.846
Ciudad Autónoma de Buenos Aires (Argentina) 0.861 0.856 0.845
Chile 0.904 0.837 0.882
Colombia 0.869 0.839 0.895
Croatia 0.918 0.823 0.867
Cyprus 0.899 0.815 0.828
Czech Republic 0.910 0.789 0.792

335
TALIS 2018 TECHNICAL REPORT © OECD 2019
Participating countries/economies T3DISC T3STUD T3STAKE
Omega coefficient
Denmark 0.874 0.799 0.762
England (United Kingdom) 0.924 0.843 0.854
Estonia 0.910 0.817 0.852
Finland 0.924 0.843 0.803
France 0.889 0.835 0.792
Georgia 0.834 0.863 0.887
Hungary 0.901 0.830 0.837
Iceland 0.876 0.830 0.856
Israel 0.920 0.845 0.806
Italy 0.880 0.803 0.776
Japan 0.885 0.870 0.774
Kazakhstan 0.774 0.734 0.764
Korea 0.897 0.887 0.893
Latvia 0.863 0.823 0.850
Lithuania 0.882 0.819 0.884
Malta 0.906 0.824 0.837
Mexico 0.814 0.805 0.832
Netherlands 0.878 0.812 0.806
New Zealand 0.901 0.850 0.865
Norway 0.901 0.821 0.783
Portugal 0.903 0.803 0.846
Romania 0.891 0.861 0.826
Russian Federation 0.880 0.835 0.821
Saudi Arabia 0.823 0.870 0.870
Shanghai (China) 0.876 0.920 0.927
Singapore 0.920 0.832 0.835
Slovak Republic 0.901 0.753 0.773
Slovenia 0.884 0.767 0.801
South Africa2 0.867 0.776 0.819
Spain 0.903 0.834 0.882
Sweden 0.908 0.814 0.814
Chinese Taipei 0.889 0.861 0.799
Turkey 0.901 0.889 0.904
United Arab Emirates 0.895 0.869 0.882
United States 0.920 0.848 0.845
Viet Nam 0.812 0.796 0.712
ISCED level 1
Australia1 0.889 0.852 0.848
Flemish Community (Belgium) 0.899 0.837 0.790
Ciudad Autónoma de Buenos Aires (Argentina) 0.870 0.869 0.780
Denmark 0.889 0.771 0.799
England (United Kingdom) 0.914 0.878 0.859
France 0.876 0.882 0.731
Japan 0.882 0.880 0.767
Korea 0.872 0.899 0.899
Netherlands1 0.891 0.857 0.870
Spain 0.884 0.850 0.869
Sweden 0.889 0.810 0.796
Chinese Taipei 0.867 0.870 0.773
Turkey 0.897 0.914 0.912
United Arab Emirates 0.882 0.872 0.884

336
TALIS 2018 TECHNICAL REPORT © OECD 2019
Participating countries/economies T3DISC T3STUD T3STAKE
Omega coefficient
Viet Nam 0.780 0.834 0.729
ISCED level 3
Alberta (Canada) 0.891 0.850 0.859
Brazil 0.895 0.824 0.889
Croatia 0.903 0.828 0.870
Denmark 0.895 0.790 0.797
Portugal 0.908 0.815 0.869
Slovenia 0.878 0.774 0.823
Sweden 0.908 0.835 0.846
Chinese Taipei 0.899 0.843 0.830
Turkey 0.901 0.889 0.908
United Arab Emirates 0.891 0.870 0.887
Viet Nam 0.830 0.794 0.752
TALIS-PISA link
Australia 0.901 0.845 0.848
Ciudad Autónoma de Buenos Aires (Argentina) 0.861 0.812 0.805
Colombia 0.865 0.799 0.863
Czech Republic 0.914 0.846 0.863
Denmark 0.897 0.834 0.808
Georgia 0.908 0.859 0.906
Malta 0.895 0.835 0.828
Turkey 0.893 0.850 0.869
Viet Nam 0.920 0.826 0.865
1. Data from participating country/economy were rated as insufficient during the adjudication process.
2. Participating country/economy with late data collection.
Source: OECD, TALIS 2018 database.
Table 11.93. CFA model-data fit for scale T3DISC
Teachers perceived disciplinary climate
Participating countries/economies CFI TLI RMSEA SRMR
ISCED level 2
Alberta (Canada) 1.000 1.007 0.000 0.005
Australia 1.000 1.000 0.008 0.004
Austria 1.000 1.001 0.000 0.003
Belgium 0.999 0.998 0.016 0.004
Flemish Community (Belgium) 1.000 1.000 0.000 0.004
Brazil 1.000 1.000 0.005 0.005
Bulgaria 0.999 0.997 0.017 0.009
Ciudad Autónoma de Buenos Aires (Argentina) 1.000 1.004 0.000 0.005
Chile 1.000 1.000 0.000 0.005
Colombia 1.000 1.003 0.000 0.005
Croatia 0.999 0.998 0.028 0.007
Cyprus 0.998 0.994 0.027 0.008
Czech Republic 1.000 1.000 0.000 0.003
Denmark 0.999 0.998 0.015 0.007
England (United Kingdom) 0.994 0.983 0.062 0.011
Estonia 1.000 1.001 0.000 0.003
Finland 1.000 0.999 0.017 0.004
France 0.998 0.993 0.041 0.008

337
TALIS 2018 TECHNICAL REPORT © OECD 2019
Participating countries/economies CFI TLI RMSEA SRMR
Georgia 0.996 0.989 0.030 0.009
Hungary 0.998 0.994 0.028 0.007
Iceland 0.998 0.994 0.026 0.010
Israel 0.997 0.992 0.038 0.010
Italy 0.996 0.989 0.042 0.010
Japan 0.999 0.997 0.027 0.006
Kazakhstan 0.995 0.985 0.024 0.011
Korea 0.998 0.994 0.030 0.008
Latvia 1.000 1.005 0.000 0.004
Lithuania 0.999 0.996 0.019 0.005
Malta 1.000 0.999 0.015 0.007
Mexico 1.000 1.000 0.000 0.006
Netherlands 1.000 1.000 0.000 0.006
New Zealand 1.000 1.002 0.000 0.004
Norway 1.000 0.999 0.009 0.004
Portugal 1.000 1.000 0.011 0.003
Romania 0.999 0.998 0.017 0.006
Russian Federation 0.998 0.994 0.019 0.007
Saudi Arabia 0.977 0.932 0.075 0.022
Shanghai (China) 1.000 1.003 0.000 0.002
Singapore 1.000 1.001 0.000 0.002
Slovak Republic 0.995 0.984 0.047 0.010
Slovenia 1.000 1.000 0.010 0.004
South Africa2 0.985 0.985 0.039 0.118
Spain 0.997 0.991 0.034 0.008
Sweden 1.000 1.002 0.000 0.003
Chinese Taipei 0.994 0.983 0.046 0.012
Turkey 0.996 0.987 0.040 0.011
United Arab Emirates 0.996 0.988 0.031 0.009
United States 0.998 0.993 0.033 0.007
Viet Nam 0.975 0.924 0.059 0.018
ISCED level 1
Australia1 0.993 0.993 0.029 0.042
Flemish Community (Belgium) 0.999 0.997 0.020 0.006
Ciudad Autónoma de Buenos Aires (Argentina) 1.000 1.003 0.000 0.002
Denmark 0.999 0.997 0.019 0.007
England (United Kingdom) 1.000 1.002 0.000 0.004
France 0.997 0.992 0.038 0.008
Japan 1.000 1.000 0.000 0.003
Korea 0.999 0.998 0.017 0.006
Netherlands1 0.992 0.992 0.036 0.110
Spain 1.000 1.002 0.000 0.002
Sweden 1.000 1.002 0.000 0.005
Chinese Taipei 0.999 0.997 0.019 0.007
Turkey 0.990 0.970 0.041 0.017
United Arab Emirates 1.000 1.000 0.000 0.003
Viet Nam 1.000 1.002 0.000 0.006
ISCED level 3
Alberta (Canada) 1.000 1.005 0.000 0.006
Brazil 0.999 0.998 0.015 0.006
Croatia 1.000 1.004 0.000 0.001
Denmark 0.999 0.996 0.022 0.007

338
TALIS 2018 TECHNICAL REPORT © OECD 2019
Participating countries/economies CFI TLI RMSEA SRMR
Portugal 0.998 0.993 0.030 0.008
Slovenia 0.999 0.997 0.020 0.007
Sweden 1.000 1.001 0.000 0.003
Chinese Taipei 0.995 0.986 0.043 0.012
Turkey 0.997 0.991 0.023 0.010
United Arab Emirates 0.999 0.997 0.017 0.004
Viet Nam 0.998 0.994 0.019 0.009
TALIS-PISA link
Australia 0.973 0.973 0.070 0.129
Ciudad Autónoma de Buenos Aires (Argentina) 0.981 0.981 0.036 0.046
Colombia 0.965 0.965 0.046 0.150
Czech Republic 0.988 0.988 0.028 0.091
Denmark 0.992 0.992 0.031 0.097
Georgia 0.917 0.917 0.069 0.328
Malta 0.992 0.992 0.037 0.070
Turkey 1.000 1.000 0.000 0.049
Viet Nam 0.671 0.671 0.112 0.448
1. Data from participating country/economy were rated as insufficient during the adjudication process.
2. Participating country/economy with late data collection.
Source: OECD, TALIS 2018 database.
Table 11.94. CFA model-data fit for scale T3STUD
Teacher-student relations
Participating countries/economies CFI TLI RMSEA SRMR
ISCED level 2
Alberta (Canada) 0.991 0.974 0.052 0.013
Australia 0.999 0.998 0.015 0.006
Austria 0.986 0.957 0.072 0.017
Belgium 0.999 0.997 0.018 0.007
Flemish Community (Belgium) 0.998 0.994 0.025 0.008
Brazil 0.982 0.945 0.064 0.018
Bulgaria 0.993 0.979 0.041 0.012
Ciudad Autónoma de Buenos Aires (Argentina) 0.990 0.969 0.076 0.019
Chile 0.996 0.987 0.038 0.012
Colombia 0.993 0.979 0.047 0.016
Croatia 1.000 1.000 0.000 0.006
Cyprus 0.998 0.994 0.018 0.010
Czech Republic 0.998 0.995 0.025 0.008
Denmark 0.985 0.954 0.092 0.025
England (United Kingdom) 0.999 0.997 0.029 0.007
Estonia 0.999 0.998 0.014 0.006
Finland 0.998 0.993 0.033 0.009
France 1.000 1.000 0.000 0.005
Georgia 0.989 0.967 0.053 0.014
Hungary 0.994 0.982 0.038 0.011
Iceland 0.986 0.958 0.079 0.023
Israel 0.993 0.979 0.050 0.016
Italy 0.997 0.990 0.029 0.010
Japan 0.994 0.982 0.057 0.013
Kazakhstan 1.000 1.004 0.000 0.002

339
TALIS 2018 TECHNICAL REPORT © OECD 2019
Participating countries/economies CFI TLI RMSEA SRMR
Korea 0.999 0.997 0.018 0.006
Latvia 0.998 0.995 0.019 0.008
Lithuania 1.000 0.999 0.013 0.006
Malta 1.000 1.003 0.000 0.004
Mexico 0.988 0.963 0.061 0.017
Netherlands 0.995 0.984 0.040 0.017
New Zealand 0.989 0.967 0.043 0.016
Norway 0.993 0.978 0.060 0.014
Portugal 0.999 0.997 0.018 0.006
Romania 0.991 0.974 0.063 0.016
Russian Federation 0.996 0.988 0.030 0.011
Saudi Arabia 0.989 0.968 0.059 0.016
Shanghai (China) 0.986 0.958 0.077 0.013
Singapore 0.994 0.983 0.042 0.011
Slovak Republic 0.979 0.937 0.059 0.021
Slovenia 0.996 0.989 0.033 0.011
South Africa2 0.970 0.970 0.039 0.104
Spain 0.993 0.978 0.039 0.013
Sweden 0.998 0.995 0.022 0.009
Chinese Taipei 0.995 0.986 0.047 0.012
Turkey 0.989 0.966 0.054 0.014
United Arab Emirates 0.994 0.982 0.045 0.011
United States 1.000 1.003 0.000 0.007
Viet Nam 0.992 0.976 0.034 0.015
ISCED level 1
Australia1 0.963 0.963 0.061 0.184
Flemish Community (Belgium) 1.000 1.000 0.007 0.005
Ciudad Autónoma de Buenos Aires (Argentina) 0.994 0.983 0.048 0.012
Denmark 0.989 0.966 0.068 0.017
England (United Kingdom) 0.999 0.997 0.021 0.009
France 1.000 1.003 0.000 0.006
Japan 0.994 0.983 0.049 0.014
Korea 0.997 0.991 0.031 0.009
Netherlands1 0.922 0.922 0.091 0.310
Spain 0.996 0.988 0.031 0.010
Sweden 0.991 0.973 0.056 0.017
Chinese Taipei 1.000 1.000 0.004 0.004
Turkey 0.991 0.973 0.041 0.012
United Arab Emirates 0.986 0.957 0.063 0.017
Viet Nam 0.975 0.925 0.093 0.020
ISCED level 3
Alberta (Canada) 0.999 0.998 0.021 0.008
Brazil 0.985 0.955 0.056 0.019
Croatia 1.000 0.999 0.008 0.005
Denmark 0.962 0.886 0.080 0.026
Portugal 0.995 0.985 0.036 0.012
Slovenia 0.998 0.993 0.023 0.008
Sweden 0.993 0.978 0.050 0.014
Chinese Taipei 0.987 0.961 0.056 0.017
Turkey 0.988 0.964 0.050 0.015
United Arab Emirates 0.997 0.991 0.029 0.007
Viet Nam 0.996 0.987 0.033 0.012

340
TALIS 2018 TECHNICAL REPORT © OECD 2019
Participating countries/economies CFI TLI RMSEA SRMR
TALIS-PISA link
Australia 1.000 1.001 0.000 0.038
Ciudad Autónoma de Buenos Aires (Argentina) 0.966 0.966 0.043 0.080
Colombia 0.980 0.980 0.041 0.165
Czech Republic 0.964 0.964 0.049 0.300
Denmark 0.930 0.930 0.071 0.247
Georgia 0.969 0.969 0.039 0.205
Malta 1.000 1.000 0.000 0.050
Turkey 0.939 0.939 0.057 0.351
Viet Nam 0.959 0.959 0.049 0.138
1. Data from participating country/economy were rated as insufficient during the adjudication process.
2. Participating country/economy with late data collection.
Source: OECD, TALIS 2018 database.
Table 11.95. CFA model-data fit for scale T3STAKE
Participation among stakeholders
Participating countries/economies CFI TLI RMSEA SRMR
ISCED level 2
Alberta (Canada) 0.991 0.968 0.057 0.016
Australia 0.992 0.975 0.048 0.014
Austria 0.995 0.985 0.044 0.010
Belgium 0.996 0.987 0.037 0.013
Flemish Community (Belgium) 0.994 0.979 0.038 0.012
Brazil 0.993 0.978 0.047 0.010
Bulgaria 0.992 0.975 0.050 0.014
Ciudad Autónoma de Buenos Aires (Argentina) 0.993 0.976 0.053 0.013
Chile 0.996 0.986 0.048 0.009
Colombia 1.000 1.006 0.000 0.001
Croatia 0.979 0.931 0.079 0.019
Cyprus 0.998 0.992 0.024 0.009
Czech Republic 0.979 0.931 0.075 0.023
Denmark 1.000 1.000 0.005 0.007
England (United Kingdom) 0.994 0.981 0.055 0.012
Estonia 0.992 0.972 0.050 0.015
Finland 0.998 0.994 0.026 0.008
France 0.983 0.945 0.077 0.021
Georgia 0.988 0.960 0.057 0.013
Hungary 0.998 0.994 0.025 0.007
Iceland 0.993 0.977 0.054 0.015
Israel 0.998 0.992 0.030 0.009
Italy 0.995 0.982 0.035 0.012
Japan 0.987 0.956 0.069 0.018
Kazakhstan 0.988 0.959 0.039 0.015
Korea 0.994 0.980 0.052 0.010
Latvia 1.000 0.999 0.007 0.006
Lithuania 0.998 0.992 0.030 0.007
Malta 1.000 0.999 0.011 0.005
Mexico 0.998 0.994 0.028 0.008
Netherlands 0.998 0.992 0.031 0.014
New Zealand 0.999 0.997 0.019 0.009

341
TALIS 2018 TECHNICAL REPORT © OECD 2019
Participating countries/economies CFI TLI RMSEA SRMR
Norway 0.989 0.963 0.054 0.016
Portugal 0.996 0.988 0.041 0.008
Romania 0.995 0.983 0.037 0.010
Russian Federation 0.996 0.987 0.027 0.010
Saudi Arabia 0.993 0.976 0.054 0.009
Shanghai (China) 0.998 0.994 0.025 0.004
Singapore 0.994 0.980 0.045 0.011
Slovak Republic 0.981 0.935 0.064 0.023
Slovenia 0.992 0.973 0.052 0.013
South Africa2 0.960 0.950 0.060 0.313
Spain 0.996 0.986 0.027 0.010
Sweden 0.989 0.964 0.061 0.016
Chinese Taipei 0.997 0.989 0.032 0.009
Turkey 1.000 1.000 0.000 0.002
United Arab Emirates 0.997 0.989 0.032 0.006
United States 0.990 0.966 0.041 0.013
Viet Nam 0.963 0.878 0.073 0.026
ISCED level 1
Australia1 0.990 0.988 0.038 0.060
Flemish Community (Belgium) 0.980 0.932 0.080 0.020
Ciudad Autónoma de Buenos Aires (Argentina) 0.975 0.917 0.072 0.022
Denmark 0.993 0.978 0.045 0.010
England (United Kingdom) 0.992 0.973 0.057 0.014
France 0.981 0.936 0.069 0.021
Japan 0.986 0.953 0.060 0.017
Korea 0.993 0.977 0.053 0.009
Netherlands1 0.831 0.788 0.126 0.604
Spain 0.993 0.978 0.041 0.011
Sweden 0.986 0.954 0.058 0.018
Chinese Taipei 0.996 0.987 0.032 0.011
Turkey 0.996 0.988 0.026 0.007
United Arab Emirates 1.000 0.999 0.010 0.003
Viet Nam 0.982 0.940 0.062 0.018
ISCED level 3
Alberta (Canada) 0.989 0.964 0.060 0.010
Brazil 0.997 0.988 0.035 0.007
Croatia 0.984 0.946 0.063 0.014
Denmark 0.998 0.992 0.039 0.013
Portugal 1.000 0.999 0.013 0.004
Slovenia 1.000 1.002 0.000 0.004
Sweden 0.995 0.982 0.042 0.012
Chinese Taipei 0.991 0.971 0.051 0.014
Turkey 0.997 0.990 0.029 0.007
United Arab Emirates 0.998 0.992 0.029 0.005
Viet Nam 0.958 0.860 0.082 0.024
TALIS-PISA link
Australia 0.995 0.994 0.034 0.079
Ciudad Autónoma de Buenos Aires (Argentina) 0.941 0.926 0.074 0.185
Colombia 0.993 0.991 0.045 0.196
Czech Republic 0.981 0.976 0.039 0.160
Denmark 0.990 0.987 0.029 0.138
Georgia 0.966 0.957 0.044 0.284

342
TALIS 2018 TECHNICAL REPORT © OECD 2019
Participating countries/economies CFI TLI RMSEA SRMR
Malta 0.986 0.983 0.050 0.059
Turkey 0.962 0.952 0.066 0.336
Viet Nam 0.952 0.940 0.059 0.331
1. Data from participating country/economy were rated as insufficient during the adjudication process.
2. Participating country/economy with late data collection.
Source: OECD, TALIS 2018 database.
Table 11.96. Invariance test results for scale T3DISC
CFI TLI RMSEA SRMR Δ CFI Δ TLI Δ RMSEA Δ SRMR
Invariance level of ISCED level 2
Configural 0.998 0.995 0.025 0.008
Metric 0.985 0.982 0.048 0.066 0.013 0.013 -0.023 -0.058
Scalar 0.933 0.949 0.081 0.083 0.052 0.033 -0.033 -0.017
Invariance level of ISCED level 1
Configural 0.999 0.998 0.016 0.006
Metric 0.988 0.984 0.041 0.056 0.011 0.014 -0.025 -0.05
Scalar 0.921 0.937 0.083 0.068 0.067 0.047 -0.042 -0.012
Invariance Level of ISCED level 3
Configural 0.998 0.995 0.023 0.008
Metric 0.985 0.98 0.046 0.068 0.013 0.015 -0.023 -0.06
Scalar 0.923 0.938 0.082 0.075 0.062 0.042 -0.036 -0.007
Source: OECD, TALIS 2018 database.
Table 11.97. Invariance test results for scale T3STUD
CFI TLI RMSEA SRMR Δ CFI Δ TLI Δ RMSEA Δ SRMR
Invariance level of ISCED level 2
Configural 0.994 0.982 0.042 0.012
Metric 0.979 0.975 0.050 0.100 0.015 0.007 -0.008 -0.088
Scalar 0.871 0.902 0.099 0.137 0.108 0.073 -0.049 -0.037
Invariance level of ISCED level 1
Configural 0.993 0.978 0.048 0.013
Metric 0.978 0.972 0.054 0.102 0.015 0.006 -0.006 -0.089
Scalar 0.867 0.894 0.104 0.142 0.111 0.078 -0.050 -0.040
Invariance Level of ISCED level 3
Configural 0.992 0.976 0.048 0.014
Metric 0.981 0.976 0.048 0.080 0.011 0.000 0.000 -0.066
Scalar 0.897 0.917 0.089 0.111 0.084 0.059 -0.041 -0.031
Note: See endnote 34.
Source: OECD, TALIS 2018 database.

343
TALIS 2018 TECHNICAL REPORT © OECD 2019
Table 11.98. Invariance test results for scale T3STAKE
CFI TLI RMSEA SRMR Δ CFI Δ TLI Δ RMSEA Δ SRMR
Invariance level of ISCED level 2
Configural 0.994 0.980 0.043 0.013
Metric 0.982 0.975 0.049 0.079 0.012 0.005 -0.006 -0.066
Scalar 0.914 0.921 0.086 0.123 0.068 0.054 -0.037 -0.044
Invariance Level of ISCED level 1
Configural 0.993 0.977 0.044 0.013
Metric 0.985 0.978 0.043 0.063 0.008 -0.001 0.001 -0.050
Scalar 0.892 0.896 0.093 0.121 0.093 0.082 -0.050 -0.058
Invariance Level of ISCED level 3
Configural 0.995 0.982 0.044 0.011
Metric 0.984 0.976 0.051 0.074 0.011 0.006 -0.007 -0.063
Scalar 0.897 0.900 0.104 0.146 0.087 0.076 -0.053 -0.072
Note: See endnote 34.
Source: OECD, TALIS 2018 database.
Table 11.99. Unstandardised factor loadings for T3DISC, T3STUD and T3STAKE
for all countries for all populations
T3DISC (Metric) T3STUD (Metric) T3STAKE (Metric)
TT3G41A 0.613 TT3G49A 0.359 TT3G48A 0.585
TT3G41B 0.395 TT3G49B 0.440 TT3G48B 0.447
TT3G41C 0.704 TT3G49C 0.448 TT3G48C 0.479
TT3G41D 0.680 TT3G49D 0.374 TT3G48D 0.483
TT3G48E 0.446
Source: OECD, TALIS 2018 database.
Table 11.100. Standardised factor loadings and unstandardised intercepts for scale T3DISC
Participating countries/economies Standardised factor loadings Unstandardised intercepts
TT3G41A TT3G41B TT3G41C TT3G41D TT3G41A TT3G41B TT3G41C TT3G41D
ISCED level 2
Alberta (Canada) 0.772 0.560 0.890 0.877 2.052 2.115 2.094 2.069
Australia 0.820 0.614 0.917 0.910 2.042 2.192 2.089 2.011
Austria 0.780 0.508 0.853 0.835 1.937 2.132 2.005 1.890
Belgium 0.790 0.600 0.894 0.884 2.316 2.290 2.364 2.245
Flemish Community (Belgium) 0.786 0.585 0.899 0.907 2.306 2.268 2.350 2.225
Brazil 0.767 0.571 0.893 0.873 2.568 2.414 2.530 2.569
Bulgaria 0.763 0.501 0.818 0.783 1.986 2.291 2.198 1.841
Ciudad Autónoma de Buenos Aires (Argentina)
0.741 0.540 0.872 0.766 2.293 2.150 2.248 2.228
Chile 0.771 0.553 0.908 0.860 2.391 2.304 2.323 2.311
Colombia 0.748 0.527 0.885 0.762 1.977 2.033 2.010 2.148
Croatia 0.804 0.558 0.913 0.890 1.815 2.117 1.883 1.840
Cyprus 0.771 0.558 0.883 0.878 2.016 2.281 2.137 2.019
Czech Republic 0.778 0.555 0.908 0.878 1.910 2.113 1.918 1.960
Denmark 0.737 0.516 0.851 0.860 1.877 1.963 1.950 1.883
England (United Kingdom) 0.818 0.587 0.904 0.916 1.934 2.102 2.046 1.964
Estonia 0.796 0.563 0.907 0.873 1.870 2.231 1.835 1.860
Finland 0.806 0.600 0.923 0.892 2.191 2.355 2.137 2.189

344
TALIS 2018 TECHNICAL REPORT © OECD 2019
Participating countries/economies Standardised factor loadings Unstandardised intercepts
TT3G41A TT3G41B TT3G41C TT3G41D TT3G41A TT3G41B TT3G41C TT3G41D
France 0.796 0.583 0.860 0.866 2.238 2.189 2.313 2.180
Georgia 0.693 0.413 0.828 0.794 1.738 2.012 1.710 1.583
Hungary 0.781 0.523 0.895 0.868 1.926 2.196 1.999 1.970
Iceland 0.720 0.573 0.883 0.811 2.354 2.254 2.322 2.137
Israel 0.796 0.594 0.915 0.896 2.156 2.149 2.136 2.074
Italy 0.769 0.531 0.875 0.827 2.007 2.146 2.070 1.823
Japan 0.771 0.488 0.891 0.821 1.643 1.918 1.506 1.660
Kazakhstan 0.662 0.418 0.754 0.729 1.814 2.041 1.773 1.725
Korea 0.793 0.484 0.890 0.860 2.260 2.048 2.300 2.153
Latvia 0.721 0.532 0.856 0.822 2.001 2.216 1.969 2.064
Lithuania 0.725 0.566 0.883 0.834 2.023 2.023 1.856 1.859
Malta 0.789 0.559 0.907 0.866 2.251 2.278 2.273 2.072
Mexico 0.671 0.435 0.823 0.739 1.937 2.056 1.974 1.952
Netherlands 0.713 0.604 0.865 0.850 2.655 2.106 2.273 2.152
New Zealand 0.784 0.583 0.878 0.886 2.065 2.183 2.168 2.055
Norway 0.758 0.529 0.897 0.876 1.864 2.234 2.032 1.952
Portugal 0.793 0.609 0.894 0.867 2.440 2.270 2.405 2.231
Romania 0.775 0.520 0.885 0.851 1.899 1.968 1.936 1.879
Russian Federation 0.774 0.534 0.879 0.822 1.839 2.097 1.750 1.965
Saudi Arabia 0.632 0.439 0.815 0.798 1.900 2.107 2.041 1.831
Shanghai (China) 0.759 0.462 0.859 0.853 1.641 1.824 1.748 1.649
Singapore 0.803 0.584 0.913 0.899 2.202 2.267 2.201 2.171
Slovak Republic 0.772 0.550 0.897 0.869 2.033 2.226 2.200 2.151
Slovenia 0.766 0.575 0.886 0.822 2.147 2.216 2.163 2.042
South Africa2 0.743 0.536 0.887 0.863 2.360 2.351 2.330 2.243
Spain 0.785 0.610 0.897 0.866 2.434 2.346 2.456 2.377
Sweden 0.804 0.565 0.906 0.865 1.997 2.257 2.045 2.118
Chinese Taipei 0.777 0.479 0.884 0.853 1.837 2.033 2.026 1.993
Turkey 0.774 0.526 0.905 0.851 2.064 2.316 2.190 2.172
United Arab Emirates 0.749 0.549 0.889 0.865 1.947 2.000 2.004 1.863
United States 0.792 0.587 0.914 0.897 2.011 2.214 2.072 2.007
Viet Nam 0.689 0.397 0.810 0.755 1.837 1.842 1.919 1.670
ISCED level 1
Australia1 0.794 0.586 0.873 0.866 1.984 2.052 2.190 2.022
Flemish Community (Belgium) 0.785 0.572 0.869 0.887 2.220 2.103 2.370 2.262
Ciudad Autónoma de Buenos Aires (Argentina)
0.749 0.538 0.879 0.788 2.293 2.150 2.248 2.228
Denmark 0.765 0.572 0.846 0.886 2.062 2.033 2.406 2.216
England (United Kingdom) 0.780 0.575 0.891 0.907 1.934 2.102 2.046 1.964
France 0.796 0.582 0.837 0.844 2.203 2.091 2.414 2.330
Japan 0.771 0.540 0.869 0.847 1.840 1.896 1.659 1.843
Korea 0.773 0.484 0.840 0.851 2.240 1.922 2.387 2.167
Netherlands1 0.693 0.568 0.855 0.849 2.345 2.005 2.301 2.111
Spain 0.770 0.596 0.874 0.837 2.332 2.103 2.416 2.329
Sweden 0.768 0.531 0.883 0.856 1.997 2.257 2.045 2.118
Chinese Taipei 0.754 0.485 0.855 0.825 1.827 1.947 2.078 2.032
Turkey 0.776 0.538 0.892 0.860 2.064 2.316 2.190 2.172
United Arab Emirates 0.745 0.532 0.873 0.851 1.947 2.000 2.004 1.863
Viet Nam 0.674 0.398 0.767 0.721 1.837 1.842 1.919 1.670
ISCED level 3
Alberta (Canada) 0.747 0.532 0.889 0.856 2.052 2.115 2.094 2.069
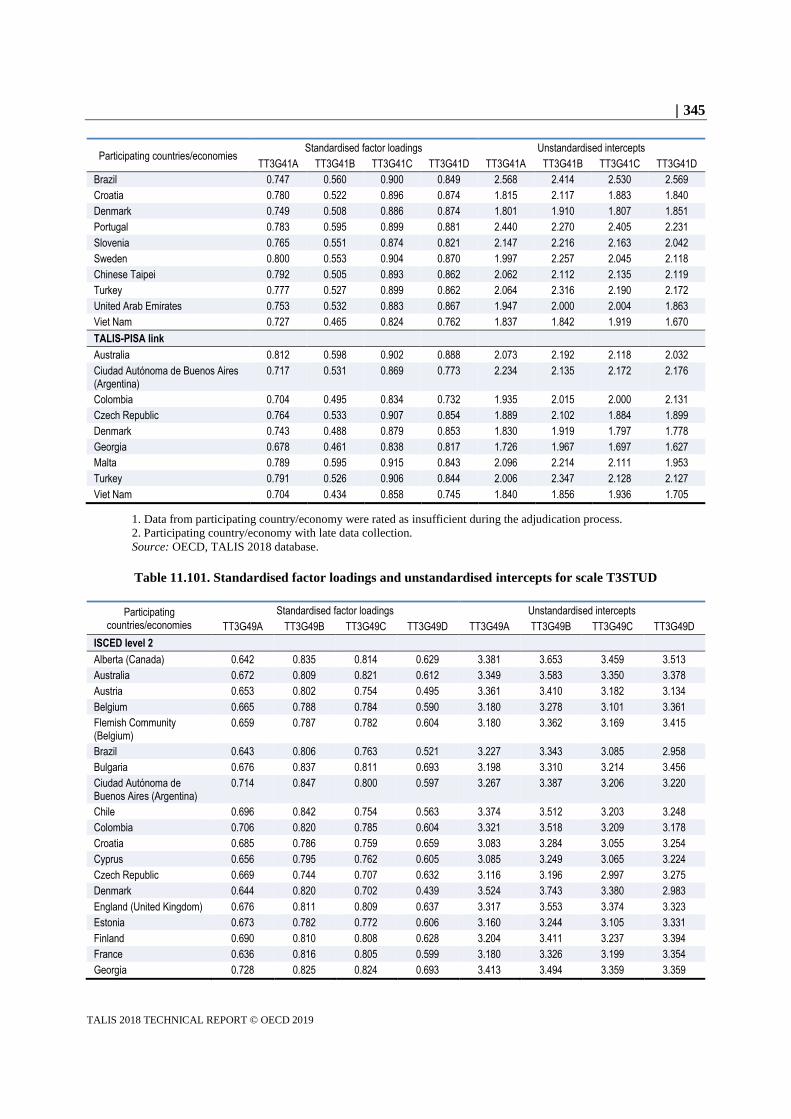
345
TALIS 2018 TECHNICAL REPORT © OECD 2019
Participating countries/economies Standardised factor loadings Unstandardised intercepts
TT3G41A TT3G41B TT3G41C TT3G41D TT3G41A TT3G41B TT3G41C TT3G41D
Brazil 0.747 0.560 0.900 0.849 2.568 2.414 2.530 2.569
Croatia 0.780 0.522 0.896 0.874 1.815 2.117 1.883 1.840
Denmark 0.749 0.508 0.886 0.874 1.801 1.910 1.807 1.851
Portugal 0.783 0.595 0.899 0.881 2.440 2.270 2.405 2.231
Slovenia 0.765 0.551 0.874 0.821 2.147 2.216 2.163 2.042
Sweden 0.800 0.553 0.904 0.870 1.997 2.257 2.045 2.118
Chinese Taipei 0.792 0.505 0.893 0.862 2.062 2.112 2.135 2.119
Turkey 0.777 0.527 0.899 0.862 2.064 2.316 2.190 2.172
United Arab Emirates 0.753 0.532 0.883 0.867 1.947 2.000 2.004 1.863
Viet Nam 0.727 0.465 0.824 0.762 1.837 1.842 1.919 1.670
TALIS-PISA link
Australia 0.812 0.598 0.902 0.888 2.073 2.192 2.118 2.032
Ciudad Autónoma de Buenos Aires (Argentina)
0.717 0.531 0.869 0.773 2.234 2.135 2.172 2.176
Colombia 0.704 0.495 0.834 0.732 1.935 2.015 2.000 2.131
Czech Republic 0.764 0.533 0.907 0.854 1.889 2.102 1.884 1.899
Denmark 0.743 0.488 0.879 0.853 1.830 1.919 1.797 1.778
Georgia 0.678 0.461 0.838 0.817 1.726 1.967 1.697 1.627
Malta 0.789 0.595 0.915 0.843 2.096 2.214 2.111 1.953
Turkey 0.791 0.526 0.906 0.844 2.006 2.347 2.128 2.127
Viet Nam 0.704 0.434 0.858 0.745 1.840 1.856 1.936 1.705
1. Data from participating country/economy were rated as insufficient during the adjudication process.
2. Participating country/economy with late data collection.
Source: OECD, TALIS 2018 database.
Table 11.101. Standardised factor loadings and unstandardised intercepts for scale T3STUD
Participating countries/economies
Standardised factor loadings Unstandardised intercepts
TT3G49A TT3G49B TT3G49C TT3G49D TT3G49A TT3G49B TT3G49C TT3G49D
ISCED level 2
Alberta (Canada) 0.642 0.835 0.814 0.629 3.381 3.653 3.459 3.513
Australia 0.672 0.809 0.821 0.612 3.349 3.583 3.350 3.378
Austria 0.653 0.802 0.754 0.495 3.361 3.410 3.182 3.134
Belgium 0.665 0.788 0.784 0.590 3.180 3.278 3.101 3.361
Flemish Community (Belgium)
0.659 0.787 0.782 0.604 3.180 3.362 3.169 3.415
Brazil 0.643 0.806 0.763 0.521 3.227 3.343 3.085 2.958
Bulgaria 0.676 0.837 0.811 0.693 3.198 3.310 3.214 3.456
Ciudad Autónoma de Buenos Aires (Argentina)
0.714 0.847 0.800 0.597 3.267 3.387 3.206 3.220
Chile 0.696 0.842 0.754 0.563 3.374 3.512 3.203 3.248
Colombia 0.706 0.820 0.785 0.604 3.321 3.518 3.209 3.178
Croatia 0.685 0.786 0.759 0.659 3.083 3.284 3.055 3.254
Cyprus 0.656 0.795 0.762 0.605 3.085 3.249 3.065 3.224
Czech Republic 0.669 0.744 0.707 0.632 3.116 3.196 2.997 3.275
Denmark 0.644 0.820 0.702 0.439 3.524 3.743 3.380 2.983
England (United Kingdom) 0.676 0.811 0.809 0.637 3.317 3.553 3.374 3.323
Estonia 0.673 0.782 0.772 0.606 3.160 3.244 3.105 3.331
Finland 0.690 0.810 0.808 0.628 3.204 3.411 3.237 3.394
France 0.636 0.816 0.805 0.599 3.180 3.326 3.199 3.354
Georgia 0.728 0.825 0.824 0.693 3.413 3.494 3.359 3.359

346
TALIS 2018 TECHNICAL REPORT © OECD 2019
Participating countries/economies
Standardised factor loadings Unstandardised intercepts
TT3G49A TT3G49B TT3G49C TT3G49D TT3G49A TT3G49B TT3G49C TT3G49D
Hungary 0.704 0.745 0.808 0.662 3.217 3.150 3.200 3.305
Iceland 0.651 0.819 0.802 0.483 3.357 3.665 3.466 3.136
Israel 0.695 0.794 0.822 0.649 3.151 3.251 3.172 3.302
Italy 0.672 0.761 0.763 0.576 3.172 3.318 3.124 3.153
Japan 0.702 0.820 0.856 0.693 3.126 3.222 3.183 3.203
Kazakhstan 0.603 0.541 0.736 0.611 3.265 2.968 3.151 3.198
Korea 0.716 0.848 0.879 0.677 3.246 3.170 3.200 3.067
Latvia 0.678 0.776 0.792 0.605 3.090 3.223 3.110 3.374
Lithuania 0.660 0.778 0.785 0.619 3.162 3.318 3.134 3.360
Malta 0.637 0.792 0.787 0.640 3.246 3.501 3.280 3.398
Mexico 0.657 0.783 0.756 0.554 3.161 3.397 3.067 3.036
Netherlands 0.658 0.779 0.778 0.573 3.364 3.472 3.245 3.264
New Zealand 0.672 0.826 0.820 0.618 3.345 3.561 3.342 3.339
Norway 0.639 0.816 0.776 0.516 3.428 3.688 3.445 3.149
Portugal 0.661 0.774 0.750 0.576 3.268 3.396 3.120 3.292
Romania 0.747 0.834 0.801 0.670 3.233 3.346 3.162 3.249
Russian Federation 0.708 0.782 0.788 0.674 3.146 3.137 3.057 3.164
Saudi Arabia 0.751 0.839 0.826 0.689 3.429 3.497 3.326 3.315
Shanghai (China) 0.815 0.866 0.914 0.778 3.348 3.471 3.342 3.270
Singapore 0.696 0.785 0.779 0.682 3.231 3.381 3.144 3.302
Slovak Republic 0.627 0.690 0.718 0.554 3.087 2.988 2.992 3.256
Slovenia 0.662 0.721 0.701 0.571 3.166 3.280 3.044 3.452
South Africa2 0.583 0.779 0.710 0.571 2.991 3.313 3.014 3.164
Spain 0.680 0.817 0.785 0.589 3.242 3.379 3.163 3.199
Sweden 0.648 0.811 0.769 0.465 3.376 3.578 3.329 2.999
Chinese Taipei 0.733 0.816 0.832 0.666 3.138 3.160 3.069 3.138
Turkey 0.730 0.876 0.859 0.665 3.170 3.213 3.175 3.165
United Arab Emirates 0.702 0.829 0.850 0.673 3.413 3.449 3.360 3.335
United States 0.675 0.815 0.812 0.681 3.226 3.551 3.274 3.397
Viet Nam 0.613 0.742 0.737 0.682 3.281 3.277 3.104 3.291
ISCED level 1
Australia1 0.656 0.818 0.818 0.565 3.425 3.683 3.481 3.336
Flemish Community (Belgium)
0.656 0.814 0.805 0.619 3.313 3.573 3.381 3.475
Ciudad Autónoma de Buenos Aires (Argentina)
0.698 0.862 0.824 0.624 3.267 3.387 3.206 3.220
Denmark 0.590 0.798 0.689 0.386 3.490 3.757 3.382 2.791
England (United Kingdom) 0.670 0.870 0.854 0.615 3.317 3.553 3.374 3.323
France 0.657 0.872 0.858 0.655 3.327 3.521 3.409 3.350
Japan 0.694 0.830 0.874 0.693 3.126 3.222 3.183 3.203
Korea 0.755 0.865 0.889 0.667 3.246 3.170 3.200 3.067
Netherlands1 0.617 0.816 0.770 0.553 3.457 3.722 3.523 3.362
Spain 0.676 0.841 0.796 0.631 3.242 3.379 3.163 3.199
Sweden 0.650 0.802 0.772 0.450 3.386 3.647 3.406 2.968
Chinese Taipei 0.716 0.827 0.851 0.670 3.138 3.160 3.069 3.138
Turkey 0.777 0.897 0.896 0.673 3.170 3.213 3.175 3.165
United Arab Emirates 0.719 0.841 0.854 0.626 3.413 3.449 3.360 3.335
Viet Nam 0.659 0.795 0.769 0.718 3.281 3.277 3.104 3.291
ISCED level 3
Alberta (Canada) 0.658 0.826 0.821 0.643 3.381 3.653 3.459 3.513
Brazil 0.677 0.818 0.767 0.519 3.227 3.343 3.085 2.958

347
TALIS 2018 TECHNICAL REPORT © OECD 2019
Participating countries/economies
Standardised factor loadings Unstandardised intercepts
TT3G49A TT3G49B TT3G49C TT3G49D TT3G49A TT3G49B TT3G49C TT3G49D
Croatia 0.694 0.796 0.771 0.639 3.083 3.284 3.055 3.254
Denmark 0.617 0.797 0.712 0.528 3.584 3.687 3.353 3.314
Portugal 0.688 0.782 0.765 0.599 3.268 3.396 3.120 3.292
Slovenia 0.675 0.732 0.704 0.559 3.166 3.280 3.044 3.452
Sweden 0.685 0.834 0.780 0.508 3.426 3.524 3.291 3.148
Chinese Taipei 0.684 0.804 0.820 0.600 3.138 3.160 3.069 3.138
Turkey 0.718 0.878 0.860 0.667 3.170 3.213 3.175 3.165
United Arab Emirates 0.723 0.840 0.836 0.688 3.413 3.449 3.360 3.335
Viet Nam 0.585 0.742 0.751 0.670 3.281 3.277 3.104 3.291
TALIS-PISA link
Australia 0.689 0.805 0.829 0.624 3.282 3.513 3.288 3.338
Ciudad Autónoma de Buenos Aires (Argentina)
0.677 0.802 0.727 0.603 3.293 3.364 3.143 3.326
Colombia 0.694 0.811 0.784 0.597 3.352 3.512 3.221 3.172
Czech Republic 0.669 0.757 0.715 0.638 3.133 3.214 2.986 3.274
Denmark 0.651 0.821 0.714 0.450 3.579 3.743 3.387 3.084
Georgia 0.749 0.825 0.842 0.741 3.416 3.521 3.382 3.419
Malta 0.689 0.806 0.801 0.643 3.302 3.489 3.280 3.361
Turkey 0.703 0.889 0.876 0.682 3.081 3.136 3.108 3.167
Viet Nam 0.614 0.796 0.757 0.686 3.242 3.284 3.102 3.340
1. Data from the participating country/economy were rated as insufficient during the adjudication process.
2. Participating country/economy with late data collection.
Source: OECD, TALIS 2018 database.
Table 11.102. Standardised factor loadings and unstandardised intercepts for
scale T3STAKE
Participating countries/economies
Standardised factor loadings Unstandardised intercepts
TT3G48A TT3G48B TT3G48C TT3G48D TT3G48E TT3G48A TT3G48B TT3G48C TT3G48D TT3G48E
ISCED level 2
Alberta (Canada) 0.870 0.739 0.747 0.766 0.668 2.969 3.077 2.878 2.939 3.049
Australia 0.837 0.686 0.705 0.722 0.639 2.702 2.761 2.672 2.759 2.876
Austria 0.845 0.671 0.666 0.708 0.649 3.103 2.930 2.816 3.126 3.129
Belgium 0.828 0.605 0.661 0.691 0.620 2.701 2.618 2.670 2.647 2.831
Flemish Community (Belgium)
0.783 0.629 0.707 0.678 0.605 2.827 2.880 2.951 2.746 2.841
Brazil 0.868 0.748 0.748 0.796 0.724 2.907 2.925 2.799 2.895 2.891
Bulgaria 0.879 0.708 0.677 0.632 0.586 3.128 3.086 2.926 2.980 3.010
Ciudad Autónoma de Buenos Aires (Argentina)
0.846 0.694 0.711 0.721 0.664 2.675 2.628 2.447 2.900 3.041
Chile 0.865 0.743 0.807 0.794 0.716 2.589 2.640 2.518 2.628 2.790
Colombia 0.909 0.775 0.809 0.703 0.669 2.979 3.073 3.010 2.893 2.934
Croatia 0.883 0.724 0.727 0.702 0.662 2.924 3.002 2.838 2.817 2.883
Cyprus 0.823 0.620 0.714 0.739 0.674 2.722 2.868 2.802 2.782 2.854
Czech Republic 0.776 0.666 0.650 0.655 0.591 2.962 2.997 2.891 2.842 3.059
Denmark 0.727 0.583 0.661 0.659 0.611 2.872 2.709 2.659 2.952 3.045
England (United Kingdom)
0.845 0.714 0.754 0.736 0.656 2.622 2.666 2.773 2.747 2.846
Estonia 0.850 0.741 0.734 0.669 0.662 3.050 3.074 3.030 2.856 2.975
Finland 0.788 0.626 0.698 0.696 0.590 2.867 2.712 2.861 2.893 2.930
France 0.819 0.642 0.657 0.615 0.545 2.848 2.778 2.616 2.606 2.813

348
TALIS 2018 TECHNICAL REPORT © OECD 2019
Participating countries/economies
Standardised factor loadings Unstandardised intercepts
TT3G48A TT3G48B TT3G48C TT3G48D TT3G48E TT3G48A TT3G48B TT3G48C TT3G48D TT3G48E
Georgia 0.898 0.770 0.742 0.759 0.705 3.225 3.195 3.166 3.236 3.268
Hungary 0.852 0.706 0.695 0.667 0.656 3.099 3.034 2.875 2.925 2.999
Iceland 0.835 0.692 0.737 0.774 0.656 2.921 2.823 2.809 2.900 3.064
Israel 0.802 0.620 0.691 0.697 0.674 2.734 2.718 2.639 2.854 2.998
Italy 0.776 0.630 0.575 0.675 0.550 2.774 2.856 2.390 2.906 2.926
Japan 0.784 0.607 0.627 0.637 0.594 2.837 2.699 2.574 2.734 2.995
Kazakhstan 0.753 0.613 0.585 0.632 0.582 2.982 2.963 2.794 3.000 3.189
Korea 0.887 0.767 0.796 0.795 0.774 2.862 3.048 2.886 2.842 2.915
Latvia 0.841 0.715 0.730 0.709 0.704 3.082 3.180 3.052 3.053 3.103
Lithuania 0.881 0.764 0.777 0.768 0.733 3.016 3.139 3.098 3.133 3.081
Malta 0.828 0.663 0.723 0.745 0.670 2.779 2.660 2.714 2.833 2.904
Mexico 0.823 0.708 0.704 0.715 0.661 2.836 2.849 2.576 2.964 2.880
Netherlands 0.833 0.686 0.680 0.600 0.562 2.884 2.897 2.825 2.811 2.871
New Zealand 0.861 0.727 0.746 0.750 0.668 2.801 2.826 2.798 2.790 2.883
Norway 0.740 0.642 0.702 0.670 0.544 3.014 2.912 2.900 2.878 3.281
Portugal 0.854 0.694 0.736 0.707 0.646 2.792 2.984 2.875 2.765 2.822
Romania 0.848 0.688 0.644 0.678 0.641 3.067 2.971 2.785 3.142 3.239
Russian Federation 0.841 0.681 0.659 0.646 0.643 2.998 3.013 2.894 3.043 3.050
Saudi Arabia 0.864 0.729 0.766 0.781 0.715 2.787 2.626 2.610 2.808 2.974
Shanghai (China) 0.924 0.854 0.852 0.841 0.813 2.973 3.026 2.938 3.083 3.121
Singapore 0.835 0.629 0.711 0.738 0.673 2.725 2.701 2.710 2.818 2.914
Slovak Republic 0.756 0.659 0.605 0.597 0.609 2.842 2.872 2.566 2.709 2.886
Slovenia 0.787 0.661 0.678 0.700 0.643 3.008 3.113 2.924 3.074 3.083
South Africa2 0.848 0.797 0.776 0.802 0.771 2.721 2.947 2.717 2.804 2.793
Spain 0.892 0.755 0.753 0.753 0.695 2.863 2.881 2.689 2.823 2.891
Sweden 0.795 0.597 0.724 0.708 0.596 2.910 2.707 2.838 2.782 2.966
Chinese Taipei 0.798 0.634 0.638 0.710 0.660 2.779 2.653 2.452 2.854 2.853
Turkey 0.910 0.766 0.791 0.820 0.792 2.938 2.938 2.847 2.962 2.906
United Arab Emirates 0.865 0.755 0.783 0.805 0.757 2.756 3.009 2.834 2.986 3.051
United States 0.846 0.650 0.700 0.774 0.697 2.900 2.815 2.670 2.803 2.896
Viet Nam 0.694 0.482 0.455 0.644 0.644 3.172 2.894 2.638 3.006 3.126
ISCED level 1
Australia1 0.839 0.743 0.743 0.772 0.667 2.941 2.980 2.766 2.945 3.034
Flemish Community (Belgium)
0.792 0.631 0.588 0.685 0.590 3.094 2.982 2.843 2.926 3.038
Ciudad Autónoma de Buenos Aires (Argentina)
0.748 0.589 0.667 0.692 0.626 2.675 2.628 2.447 2.900 3.041
Denmark 0.772 0.660 0.684 0.680 0.634 2.790 2.778 2.604 2.897 2.999
England (United Kingdom)
0.843 0.704 0.779 0.771 0.686 2.622 2.666 2.773 2.747 2.846
France 0.719 0.607 0.571 0.599 0.547 3.088 2.789 2.473 2.798 3.095
Japan 0.775 0.609 0.573 0.645 0.576 2.837 2.699 2.574 2.734 2.995
Korea 0.888 0.782 0.797 0.812 0.783 2.862 3.048 2.886 2.842 2.915
Netherlands1 0.757 0.630 0.494 0.566 0.501 3.186 3.024 2.764 3.165 3.171
Spain 0.859 0.748 0.699 0.785 0.711 2.863 2.881 2.689 2.823 2.891
Sweden 0.771 0.574 0.708 0.697 0.584 2.950 2.773 2.874 2.848 3.023
Chinese Taipei 0.783 0.588 0.584 0.676 0.628 2.868 2.757 2.415 2.936 2.948
Turkey 0.918 0.768 0.781 0.835 0.793 2.938 2.938 2.847 2.962 2.906
United Arab Emirates 0.874 0.738 0.777 0.799 0.759 2.756 3.009 2.834 2.986 3.051
Viet Nam 0.719 0.493 0.457 0.658 0.658 3.172 2.894 2.638 3.006 3.126
ISCED level 3
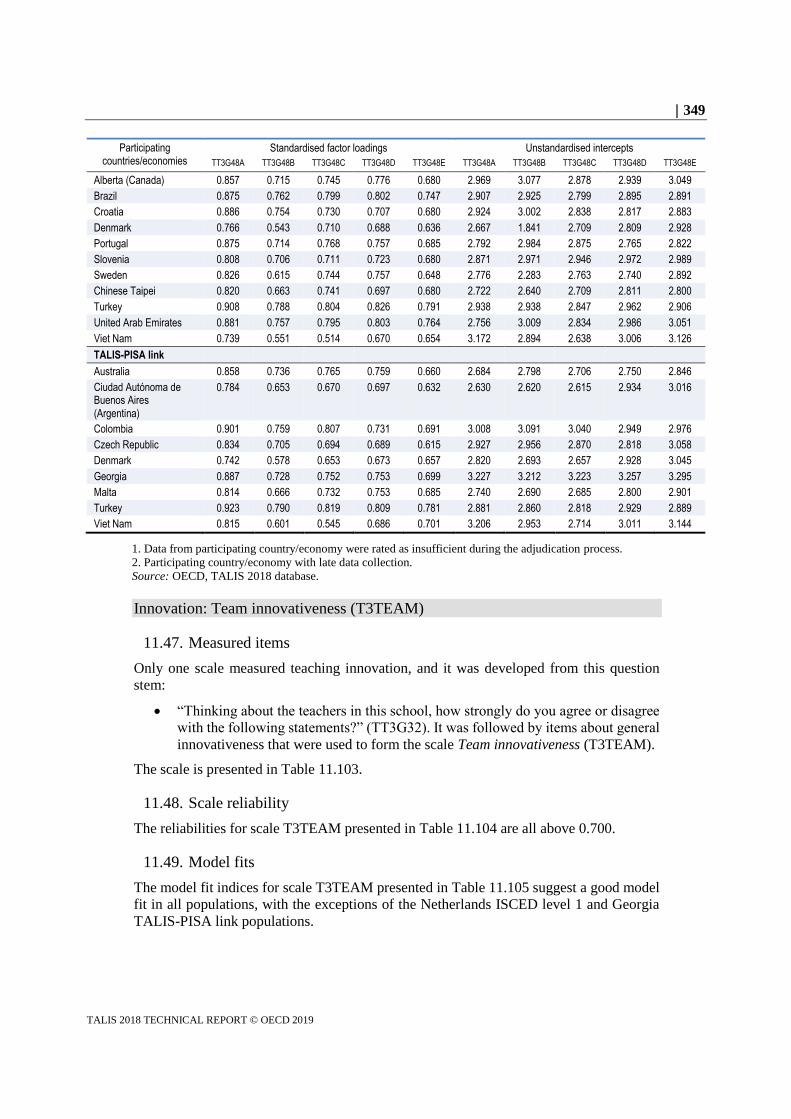
349
TALIS 2018 TECHNICAL REPORT © OECD 2019
Participating countries/economies
Standardised factor loadings Unstandardised intercepts
TT3G48A TT3G48B TT3G48C TT3G48D TT3G48E TT3G48A TT3G48B TT3G48C TT3G48D TT3G48E
Alberta (Canada) 0.857 0.715 0.745 0.776 0.680 2.969 3.077 2.878 2.939 3.049
Brazil 0.875 0.762 0.799 0.802 0.747 2.907 2.925 2.799 2.895 2.891
Croatia 0.886 0.754 0.730 0.707 0.680 2.924 3.002 2.838 2.817 2.883
Denmark 0.766 0.543 0.710 0.688 0.636 2.667 1.841 2.709 2.809 2.928
Portugal 0.875 0.714 0.768 0.757 0.685 2.792 2.984 2.875 2.765 2.822
Slovenia 0.808 0.706 0.711 0.723 0.680 2.871 2.971 2.946 2.972 2.989
Sweden 0.826 0.615 0.744 0.757 0.648 2.776 2.283 2.763 2.740 2.892
Chinese Taipei 0.820 0.663 0.741 0.697 0.680 2.722 2.640 2.709 2.811 2.800
Turkey 0.908 0.788 0.804 0.826 0.791 2.938 2.938 2.847 2.962 2.906
United Arab Emirates 0.881 0.757 0.795 0.803 0.764 2.756 3.009 2.834 2.986 3.051
Viet Nam 0.739 0.551 0.514 0.670 0.654 3.172 2.894 2.638 3.006 3.126
TALIS-PISA link
Australia 0.858 0.736 0.765 0.759 0.660 2.684 2.798 2.706 2.750 2.846
Ciudad Autónoma de Buenos Aires (Argentina)
0.784 0.653 0.670 0.697 0.632 2.630 2.620 2.615 2.934 3.016
Colombia 0.901 0.759 0.807 0.731 0.691 3.008 3.091 3.040 2.949 2.976
Czech Republic 0.834 0.705 0.694 0.689 0.615 2.927 2.956 2.870 2.818 3.058
Denmark 0.742 0.578 0.653 0.673 0.657 2.820 2.693 2.657 2.928 3.045
Georgia 0.887 0.728 0.752 0.753 0.699 3.227 3.212 3.223 3.257 3.295
Malta 0.814 0.666 0.732 0.753 0.685 2.740 2.690 2.685 2.800 2.901
Turkey 0.923 0.790 0.819 0.809 0.781 2.881 2.860 2.818 2.929 2.889
Viet Nam 0.815 0.601 0.545 0.686 0.701 3.206 2.953 2.714 3.011 3.144
1. Data from participating country/economy were rated as insufficient during the adjudication process.
2. Participating country/economy with late data collection.
Source: OECD, TALIS 2018 database.
Innovation: Team innovativeness (T3TEAM)
11.47. Measured items
Only one scale measured teaching innovation, and it was developed from this question
stem:
“Thinking about the teachers in this school, how strongly do you agree or disagree
with the following statements?” (TT3G32). It was followed by items about general
innovativeness that were used to form the scale Team innovativeness (T3TEAM).
The scale is presented in Table 11.103.
11.48. Scale reliability
The reliabilities for scale T3TEAM presented in Table 11.104 are all above 0.700.
11.49. Model fits
The model fit indices for scale T3TEAM presented in Table 11.105 suggest a good model
fit in all populations, with the exceptions of the Netherlands ISCED level 1 and Georgia
TALIS-PISA link populations.

350
TALIS 2018 TECHNICAL REPORT © OECD 2019
11.50. Invariance testing
Table 11.106 presents the results from the invariance testing for scale T3TEAM. The scale
reached scalar invariance for all ISCED levels. Although a comparison of the metric and
scalar models revealed the cut-off criteria were not met, the scalar models themselves
exhibited acceptable model fit.
11.51. Item parameters
The unstandardised item parameters for scale T3TEAM presented in Table 11.107 include
both factor loadings and intercepts because the scale reached scalar invariance for the
ISCED level 2 population.
Table 11.108 presents the standardised factor loadings. The unstandardised intercepts are
not presented for the countries and economies because the scale was scalar invariant, which
means the intercepts are the same for all populations (the values are presented in Table
11.107). The factor loadings for all the items in all populations are above 0.700, suggesting
a strong relationship between all items and the latent construct.
Table 11.103. Item wording for the team innovativeness scale
T3TEAM: Team innovativeness
TT3G32: Thinking about the teachers in this school, how strongly do you agree or disagree with the following statements?
Response options: “Strongly disagree” (1), “Disagree” (2), “Agree” (3), “Strongly agree” (4).
TT3G32A Most teachers in this school strive to develop new ideas for teaching and learning.
TT3G32B Most teachers in this school are open to change.
TT3G32C Most teachers in this school search for new ways to solve problems.
TT3G32D Most teachers in this school provide practical support to each other for the application of new ideas.
Table 11.104. Omega coefficients for the populations in each participating country/economy
Participating countries/economies T3TEAM
Omega coefficient
ISCED level 2
Alberta (Canada) 0.912
Australia 0.895
Austria 0.887
Belgium 0.882
Flemish Community (Belgium) 0.876
Brazil 0.933
Bulgaria 0.918
Ciudad Autónoma de Buenos Aires (Argentina) 0.920
Chile 0.925
Colombia 0.935
Croatia 0.931
Cyprus 0.897
Czech Republic 0.882
Denmark 0.887
England (United Kingdom) 0.880
Estonia 0.880
Finland 0.882
France 0.878
Georgia 0.903

351
TALIS 2018 TECHNICAL REPORT © OECD 2019
Participating countries/economies T3TEAM
Omega coefficient
Hungary 0.922
Iceland 0.903
Israel 0.903
Italy 0.916
Japan 0.901
Kazakhstan 0.812
Korea 0.920
Latvia 0.924
Lithuania 0.910
Malta 0.865
Mexico 0.920
Netherlands 0.821
New Zealand 0.893
Norway 0.794
Portugal 0.901
Romania 0.939
Russian Federation 0.880
Saudi Arabia 0.908
Shanghai (China) 0.953
Singapore 0.904
Slovak Republic 0.906
Slovenia 0.912
South Africa2 0.876
Spain 0.916
Sweden 0.891
Chinese Taipei 0.916
Turkey 0.956
United Arab Emirates 0.920
United States 0.889
Viet Nam 0.920
ISCED level 1
Australia1 0.906
Flemish Community (Belgium) 0.891
Ciudad Autónoma de Buenos Aires (Argentina) 0.941
Denmark 0.882
England (United Kingdom) 0.922
France 0.918
Japan 0.906
Korea 0.925
Netherlands1 0.899
Spain 0.931
Sweden 0.908
Chinese Taipei 0.908
Turkey 0.958
United Arab Emirates 0.922
Viet Nam 0.941
ISCED level 3
Alberta (Canada) 0.906
Brazil 0.937
Croatia 0.929
Denmark 0.874

352
TALIS 2018 TECHNICAL REPORT © OECD 2019
Participating countries/economies T3TEAM
Omega coefficient
Portugal 0.910
Slovenia 0.899
Sweden 0.901
Chinese Taipei 0.918
Turkey 0.951
United Arab Emirates 0.925
Viet Nam 0.912
TALIS-PISA link
Australia 0.903
Ciudad Autónoma de Buenos Aires (Argentina) 0.914
Colombia 0.910
Czech Republic 0.904
Denmark 0.891
Georgia 0.927
Malta 0.889
Turkey 0.929
Viet Nam 0.916
1. Data from participating country/economy were rated as insufficient during the
adjudication process.
2. Participating country/economy with late data collection. Source: OECD, TALIS 2018 database.
Table 11.105. CFA model-data fit for scale T3TEAM
Team innovativeness
Participating countries/economies CFI TLI RMSEA SRMR
ISCED level 2
Alberta (Canada) 1.000 1.006 0.000 0.002
Australia 0.996 0.988 0.041 0.009
Austria 0.999 0.997 0.024 0.005
Belgium 0.999 0.997 0.022 0.005
Flemish Community (Belgium) 0.999 0.998 0.018 0.005
Brazil 0.997 0.990 0.036 0.007
Bulgaria 0.999 0.997 0.020 0.005
Ciudad Autónoma de Buenos Aires (Argentina) 0.998 0.994 0.032 0.007
Chile 1.000 1.002 0.000 0.000
Colombia 0.997 0.990 0.033 0.008
Croatia 0.998 0.995 0.029 0.006
Cyprus 1.000 1.003 0.000 0.001
Czech Republic 0.998 0.994 0.039 0.009
Denmark 0.996 0.989 0.047 0.010
England (United Kingdom) 0.997 0.990 0.050 0.011
Estonia 0.999 0.997 0.025 0.007
Finland 1.000 1.001 0.000 0.001
France 1.000 1.001 0.000 0.001
Georgia 0.996 0.987 0.037 0.009
Hungary 0.998 0.995 0.034 0.007
Iceland 0.999 0.998 0.019 0.005
Israel 0.996 0.988 0.044 0.010
Italy 0.996 0.988 0.045 0.008

353
TALIS 2018 TECHNICAL REPORT © OECD 2019
Participating countries/economies CFI TLI RMSEA SRMR
Japan 0.999 0.996 0.032 0.006
Kazakhstan 0.985 0.954 0.059 0.020
Korea 0.999 0.996 0.031 0.005
Latvia 0.998 0.994 0.033 0.009
Lithuania 0.998 0.993 0.035 0.009
Malta 1.000 0.999 0.016 0.007
Mexico 0.999 0.998 0.020 0.005
Netherlands 0.999 0.998 0.017 0.009
New Zealand 0.995 0.985 0.051 0.012
Norway 0.975 0.926 0.109 0.031
Portugal 0.999 0.997 0.025 0.005
Romania 0.997 0.990 0.041 0.008
Russian Federation 1.000 1.001 0.000 0.004
Saudi Arabia 0.980 0.939 0.084 0.015
Shanghai (China) 0.997 0.990 0.037 0.006
Singapore 0.999 0.998 0.019 0.005
Slovak Republic 0.995 0.986 0.048 0.010
Slovenia 0.992 0.976 0.070 0.011
South Africa2 0.918 0.951 0.074 0.115
Spain 0.997 0.992 0.031 0.007
Sweden 1.000 1.002 0.000 0.003
Chinese Taipei 0.990 0.970 0.072 0.014
Turkey 0.995 0.986 0.049 0.006
United Arab Emirates 0.998 0.994 0.029 0.005
United States 1.000 1.004 0.000 0.006
Viet Nam 0.995 0.985 0.049 0.008
ISCED level 1
Australia1 0.883 0.930 0.114 0.182
Flemish Community (Belgium) 0.996 0.989 0.045 0.008
Ciudad Autónoma de Buenos Aires (Argentina) 0.996 0.988 0.056 0.008
Denmark 0.996 0.988 0.046 0.011
England (United Kingdom) 0.996 0.987 0.052 0.009
France 0.994 0.983 0.087 0.014
Japan 1.000 1.002 0.000 0.001
Korea 1.000 1.000 0.003 0.003
Netherlands1 0.832 0.899 0.108 0.466
Spain 0.999 0.996 0.031 0.006
Sweden 0.998 0.994 0.032 0.008
Chinese Taipei 0.979 0.938 0.087 0.017
Turkey 0.997 0.991 0.028 0.006
United Arab Emirates 1.000 0.999 0.013 0.003
Viet Nam 0.998 0.993 0.037 0.006
ISCED level 3
Alberta (Canada) 1.000 1.000 0.007 0.005
Brazil 0.996 0.989 0.039 0.007
Croatia 0.997 0.992 0.039 0.007
Denmark 0.997 0.991 0.032 0.010
Portugal 1.000 1.000 0.006 0.003
Slovenia 0.995 0.984 0.052 0.010
Sweden 0.995 0.984 0.052 0.010
Chinese Taipei 0.993 0.979 0.066 0.012
Turkey 0.988 0.964 0.056 0.010

354
TALIS 2018 TECHNICAL REPORT © OECD 2019
Participating countries/economies CFI TLI RMSEA SRMR
United Arab Emirates 0.998 0.993 0.027 0.006
Viet Nam 0.995 0.984 0.047 0.009
TALIS-PISA link
Australia 0.930 0.958 0.113 0.161
Ciudad Autónoma de Buenos Aires (Argentina) 0.948 0.969 0.061 0.158
Colombia 0.963 0.978 0.072 0.318
Czech Republic 0.899 0.940 0.085 0.121
Denmark 0.933 0.960 0.095 0.200
Georgia 0.727 0.836 0.092 0.546
Malta 0.879 0.927 0.102 0.136
Turkey 0.912 0.947 0.073 0.400
Viet Nam 0.861 0.917 0.096 0.108
1. Data from participating country/economy were rated as insufficient during the adjudication process.
2. Participating country/economy with late data collection.
Source: OECD, TALIS 2018 database.
Table 11.106. Invariance test results for scale T3TEAM
CFI TLI RMSEA SRMR Δ CFI Δ TLI Δ RMSEA Δ SRMR
Invariance level of ISCED level 2
Configural 0.997 0.990 0.040 0.010
Metric 0.992 0.990 0.039 0.052 0.005 0.000 0.001 -0.042
Scalar 0.958 0.968 0.071 0.082 0.034 0.022 -0.032 -0.030
Invariance level of ISCED level 1
Configural 0.997 0.991 0.039 0.008
Metric 0.992 0.990 0.042 0.055 0.005 0.001 -0.003 -0.047
Scalar 0.968 0.975 0.065 0.076 0.024 0.015 -0.023 -0.021
Invariance level of ISCED level 3
Configural 0.994 0.983 0.051 0.008
Metric 0.989 0.986 0.046 0.047 0.005 -0.003 0.005 -0.039
Scalar 0.967 0.973 0.064 0.070 0.022 0.013 -0.018 -0.023
Source: OECD, TALIS 2018 database.
Table 11.107. Unstandardised factor loadings and intercepts for T3TEAM for all countries
for all populations
T3TEAM (Scalar)
Unstandardised factor loadings Unstandardised intercepts
TT3G32A 0.574 2.990
TT3G32B 0.592 2.900
TT3G32C 0.598 2.951
TT3G32D 0.559 2.979
Source: OECD, TALIS 2018 database.
Table 11.108. Standardised factor loadings for scale T3TEAM
Participating countries/economies Standardised factor loadings
TT3G32A TT3G32B TT3G32C TT3G32D
ISCED level 2
Alberta (Canada) 0.837 0.858 0.885 0.781

355
TALIS 2018 TECHNICAL REPORT © OECD 2019
Participating countries/economies Standardised factor loadings
TT3G32A TT3G32B TT3G32C TT3G32D
Australia 0.802 0.841 0.869 0.740
Austria 0.801 0.840 0.843 0.744
Belgium 0.779 0.803 0.863 0.741
Flemish Community (Belgium) 0.789 0.787 0.858 0.711
Brazil 0.846 0.885 0.919 0.845
Bulgaria 0.852 0.870 0.882 0.810
Ciudad Autónoma de Buenos Aires (Argentina) 0.806 0.843 0.908 0.840
Chile 0.829 0.883 0.913 0.796
Colombia 0.826 0.884 0.931 0.820
Croatia 0.856 0.895 0.911 0.819
Cyprus 0.774 0.861 0.864 0.751
Czech Republic 0.780 0.832 0.847 0.724
Denmark 0.783 0.830 0.845 0.776
England (United Kingdom) 0.783 0.827 0.845 0.716
Estonia 0.756 0.814 0.857 0.740
Finland 0.790 0.819 0.850 0.736
France 0.789 0.809 0.856 0.697
Georgia 0.807 0.846 0.872 0.788
Hungary 0.853 0.877 0.898 0.770
Iceland 0.802 0.850 0.876 0.786
Israel 0.833 0.848 0.863 0.766
Italy 0.814 0.877 0.897 0.769
Japan 0.833 0.826 0.872 0.779
Kazakhstan 0.705 0.719 0.754 0.695
Korea 0.824 0.847 0.911 0.814
Latvia 0.849 0.897 0.893 0.775
Lithuania 0.837 0.875 0.876 0.725
Malta 0.709 0.796 0.857 0.693
Mexico 0.840 0.869 0.905 0.778
Netherlands 0.711 0.751 0.771 0.667
New Zealand 0.795 0.828 0.875 0.737
Norway 0.604 0.745 0.735 0.675
Portugal 0.808 0.847 0.876 0.767
Romania 0.864 0.908 0.920 0.842
Russian Federation 0.734 0.820 0.865 0.731
Saudi Arabia 0.825 0.854 0.874 0.804
Shanghai (China) 0.892 0.900 0.939 0.901
Singapore 0.817 0.855 0.874 0.777
Slovak Republic 0.819 0.879 0.859 0.752
Slovenia 0.829 0.882 0.873 0.770
South Africa2 0.649 0.833 0.864 0.808
Spain 0.841 0.866 0.896 0.779
Sweden 0.805 0.854 0.847 0.736
Chinese Taipei 0.838 0.853 0.887 0.830
Turkey 0.904 0.933 0.936 0.886
United Arab Emirates 0.819 0.872 0.898 0.819
United States 0.789 0.825 0.868 0.740
Viet Nam 0.822 0.824 0.901 0.862
ISCED level 1
Australia1 0.818 0.857 0.878 0.787
Flemish Community (Belgium) 0.788 0.830 0.871 0.736

356
TALIS 2018 TECHNICAL REPORT © OECD 2019
Participating countries/economies Standardised factor loadings
TT3G32A TT3G32B TT3G32C TT3G32D
Ciudad Autónoma de Buenos Aires (Argentina) 0.850 0.880 0.928 0.887
Denmark 0.769 0.815 0.852 0.769
England (United Kingdom) 0.846 0.878 0.895 0.804
France 0.874 0.861 0.882 0.768
Japan 0.838 0.814 0.884 0.798
Korea 0.837 0.846 0.914 0.852
Netherlands1 0.714 0.778 0.818 0.673
Spain 0.860 0.892 0.908 0.815
Sweden 0.813 0.871 0.878 0.764
Chinese Taipei 0.833 0.837 0.869 0.826
Turkey 0.908 0.934 0.943 0.875
United Arab Emirates 0.821 0.858 0.910 0.821
Viet Nam 0.860 0.853 0.928 0.900
ISCED level 3
Alberta (Canada) 0.837 0.831 0.885 0.766
Brazil 0.840 0.898 0.926 0.836
Croatia 0.856 0.898 0.899 0.815
Denmark 0.772 0.825 0.824 0.737
Portugal 0.818 0.861 0.883 0.782
Slovenia 0.815 0.846 0.866 0.760
Sweden 0.815 0.857 0.872 0.739
Chinese Taipei 0.828 0.849 0.894 0.835
Turkey 0.886 0.926 0.929 0.878
United Arab Emirates 0.832 0.874 0.908 0.823
Viet Nam 0.792 0.827 0.893 0.846
TALIS-PISA link
Australia 0.805 0.826 0.866 0.735
Ciudad Autónoma de Buenos Aires (Argentina) 0.827 0.829 0.928 0.864
Colombia 0.867 0.899 0.927 0.848
Czech Republic 0.813 0.846 0.866 0.755
Denmark 0.775 0.806 0.829 0.763
Georgia 0.824 0.837 0.877 0.791
Malta 0.678 0.788 0.876 0.706
Turkey 0.894 0.925 0.931 0.882
Viet Nam 0.829 0.838 0.911 0.871
1. Data from participating country/economy were rated as insufficient during the adjudication process.
2. Participating country/economy with late data collection.
Source: OECD, TALIS 2018 database.
Equity and diversity: Self-related efficacy in multicultural classrooms (T3SEFE);
Diversity practices (T3DIVP)
11.52. Measured items
Two scales gathering information about Equity and diversity were derived from the
following two question stems:
“In teaching a culturally diverse class, to what extent can you do the following?”
(TT3G45). The question included items concerning diversity in the classroom that
were used to form the scale Self-related efficacy in multicultural classrooms
(T3SEFE).

357
TALIS 2018 TECHNICAL REPORT © OECD 2019
“In this school, are the following practices in relation to diversity implemented?”
(TT3G47), followed by items regarding schools and diversity that were used to
form the scale Teacher diversity practices (T3DIVP).
Table 11.109 provides information on each scale.
11.53. Model improvements
Model improvements were included for both scales. A correlation between items
TT3G45A and TT3G45B was added for scale T3SEFE, and a correlation between items
TT3G47A and TT3G47B was added for scale T3DIVP.
11.54. Scale reliability
Table 11.110, which presents the reliabilities for each scale, shows the coefficients for
T3SEFE as higher than 0.700 for most populations, with a few populations exhibiting
acceptable reliability and only the Italy ISCED level 2 population with low reliability. The
reliability coefficients for T3DIVP are mostly between 0.600 and 0.700 for many
populations, while a few exhibit low reliabilities.
11.55. Model fits
Tables 11.111 and 11.112 present the model fit indices for the scales T3SEFSE and
T3DIVP respectively. As is evident from the tables, all populations exhibit acceptable fit
indices for scale T3SEFE, with the exception of the Shanghai (China) ISCED level 2
populations, and all populations exhibit acceptable fit for the scale T3DIVP.
11.56. Invariance testing
The results from the invariance analyses scales of T3SEFSE and T3DIVP are presented in
Tables 11.113 and 11.114 respectively. Here, T3SEFE is metric invariant in all
populations, and although this scale did not meet the cut-off criteria for metric invariance,
the configural models were near perfect and the metric models exhibited acceptable fit
indices. T3DIVP reached configural invariance for all ISCED levels. The scalar models
did not converge, however, this outcome does not affect the configural models.
11.57. Item parameters
Table 11.115 presents the unstandardised factor loadings for scale T3SEFE. Tables 11.116
and 11.117 present the standardised factor loadings and unstandardised intercepts for
T3SEFE and T3DIVP respectively.
Most of the factor loadings for T3SEFSE are strong, and many are moderate; the only weak
loading is that for item TT3G45C for the Italy ISCED level 2 population. Most factor
loadings are strong for items TT3G47C and TT3G47D in scale T3DIVP. While the same
is true for item TT3G47A, more populations exhibit only a moderate factor loading for this
item. Finally, item TT3G47B exhibits mostly moderate strength with the latent factor, but
the strength is low for the Latvia and Slovenia ISCED level 2 populations. Of particular
note is the France ISCED level 1 population, where the factor loadings for items TT3G47A,
TT3G47B and TT3G47D are weak.

358
TALIS 2018 TECHNICAL REPORT © OECD 2019
Table 11.109. Item wording for equity and diversity scales
T3SEFE: Self-related efficacy in multicultural classrooms
TT3G45: In teaching a culturally diverse class, to what extent can you do the following?
Response options: “Not at all” (1), “To some extent” (2), “Quite a bit” (3), “A lot” (4).
TT3G45A Cope with the challenges of a multicultural classroom
TT3G45B Adapt my teaching to the cultural diversity of students
TT3G45C Ensure that students with and without a migrant background work together
TT3G45D Raise awareness for cultural differences amongst students
TT3G45E Reduce ethnic stereotyping amongst students
T3DIVP: Diversity practices
TT3G47: In this school, are the following practices in relation to diversity implemented?
Response options: “Yes” (1), “No” (2).
TT3G47A* Supporting activities or organisations that encourage students’ expression of diverse ethnic and cultural identities (e.g. artistic groups)
TT3G47B* Organising multicultural events (e.g. cultural diversity day)
TT3G47C* Teaching students how to deal with ethnic and cultural discrimination
TT3G47D* Adopting teaching and learning practices that integrate global issues throughout the curriculum
* Items were reverse coded.
Source: OECD, TALIS 2018 database.
Table 11.110. Reliability coefficients for the populations of participating each
country/economy
Participating countries/economies T3SEFE T3DIVP
Omega coefficient Cronbach’s alpha
ISCED level 2
Alberta (Canada) 0.823 0.650
Australia 0.812 0.666
Austria 0.748 0.607
Belgium 0.736 0.669
Flemish Community (Belgium) 0.790 0.684
Brazil 0.773 0.703
Bulgaria 0.746 0.713
Ciudad Autónoma de Buenos Aires (Argentina) 0.696 0.679
Chile 0.792 0.691
Colombia 0.760 0.699
Croatia 0.801 0.676
Cyprus 0.805 0.716
Czech Republic 0.810 0.597
Denmark 0.723 0.660
England (United Kingdom) 0.785 0.663
Estonia 0.771 0.667
Finland 0.716 0.620
France 0.650 0.586
Georgia 0.821 0.712
Hungary 0.733 0.649
Iceland 0.839 0.624
Israel 0.759 0.685
Italy 0.563 0.636
Japan 0.808 0.665
Kazakhstan 0.824 0.624
Korea 0.880 0.737

359
TALIS 2018 TECHNICAL REPORT © OECD 2019
Participating countries/economies T3SEFE T3DIVP
Omega coefficient Cronbach’s alpha
Latvia 0.753 0.606
Lithuania 0.834 0.690
Malta 0.771 0.672
Mexico 0.743 0.688
Netherlands 0.799 0.628
New Zealand 0.787 0.449
Norway 0.787 0.594
Portugal 0.667 0.691
Romania 0.774 0.600
Russian Federation 0.815 0.690
Saudi Arabia 0.848 0.751
Shanghai (China) 0.869 0.714
Singapore 0.861 0.635
Slovak Republic 0.733 0.640
Slovenia 0.661 0.563
South Africa2 0.721 0.698
Spain 0.719 0.677
Sweden 0.741 0.585
Chinese Taipei 0.841 0.691
Turkey 0.766 0.790
United Arab Emirates 0.806 0.738
United States 0.805 0.702
Viet Nam 0.699 0.566
ISCED level 1
Australia1 0.801 0.639
Flemish Community (Belgium) 0.781 0.624
Ciudad Autónoma de Buenos Aires (Argentina) 0.753 0.662
Denmark 0.766 0.632
England (United Kingdom) 0.812 0.619
France 0.623 0.476
Japan 0.812 0.665
Korea 0.876 0.606
Netherlands1 0.828 0.609
Spain 0.750 0.687
Sweden 0.740 0.616
Chinese Taipei 0.841 0.665
Turkey 0.753 0.815
United Arab Emirates 0.774 0.732
Viet Nam 0.789 0.529
ISCED level 3
Alberta (Canada) 0.796 0.625
Brazil 0.787 0.710
Croatia 0.780 0.690
Denmark 0.746 0.630
Portugal 0.686 0.715
Slovenia 0.691 0.608
Sweden 0.736 0.628
Chinese Taipei 0.845 0.718
Turkey 0.773 0.812
United Arab Emirates 0.812 0.769
Viet Nam 0.634 0.602

360
TALIS 2018 TECHNICAL REPORT © OECD 2019
Participating countries/economies T3SEFE T3DIVP
Omega coefficient Cronbach’s alpha
TALIS-PISA link
Australia 0.801 0.637
Ciudad Autónoma de Buenos Aires (Argentina) 0.736 0.641
Colombia 0.830 0.704
Czech Republic 0.790 0.652
Denmark 0.778 0.628
Georgia 0.783 0.752
Malta 0.757 0.711
Turkey 0.780 0.787
Viet Nam 0.691 0.555
1. Data from participating country/economy rated as insufficient during the adjudication process.
2. Participating country/economy with late data collection.
Source: OECD, TALIS 2018 database.
Table 11.111. CFA model-data fit for scale T3SEFE
Self-related efficacy in multicultural classrooms
Participating countries/economies CFI TLI RMSEA SRMR
ISCED level 2
Alberta (Canada) 0.998 0.992 0.028 0.010
Australia 0.991 0.970 0.044 0.011
Austria 0.965 0.883 0.104 0.023
Belgium 0.992 0.973 0.051 0.014
Flemish Community (Belgium) 0.991 0.968 0.067 0.015
Brazil 1.000 1.010 0.000 0.005
Bulgaria 0.997 0.990 0.027 0.009
Ciudad Autónoma de Buenos Aires (Argentina) 1.000 0.999 0.010 0.007
Chile 1.000 1.010 0.000 0.001
Colombia 1.000 1.015 0.000 0.006
Croatia 0.994 0.981 0.046 0.010
Cyprus 0.988 0.960 0.054 0.011
Czech Republic 0.994 0.980 0.045 0.011
Denmark 0.994 0.980 0.042 0.013
England (United Kingdom) 0.983 0.945 0.074 0.016
Estonia 0.987 0.955 0.055 0.018
Finland 0.972 0.906 0.086 0.025
France 0.964 0.879 0.098 0.028
Georgia 0.993 0.976 0.044 0.015
Hungary 0.992 0.975 0.040 0.015
Iceland 1.000 1.003 0.000 0.005
Israel 0.999 0.998 0.013 0.007
Italy 0.996 0.985 0.030 0.009
Japan 0.997 0.989 0.040 0.009
Kazakhstan 0.999 0.996 0.014 0.006
Korea 1.000 1.009 0.000 0.002
Latvia 1.000 1.006 0.000 0.007
Lithuania 0.994 0.979 0.038 0.010
Malta 0.963 0.876 0.119 0.021
Mexico 1.000 1.007 0.000 0.006
Netherlands 0.971 0.904 0.108 0.019

361
TALIS 2018 TECHNICAL REPORT © OECD 2019
Participating countries/economies CFI TLI RMSEA SRMR
New Zealand 0.998 0.992 0.026 0.007
Norway 0.988 0.959 0.069 0.015
Portugal 1.000 1.005 0.000 0.003
Romania 0.998 0.994 0.022 0.009
Russian Federation 1.000 1.003 0.000 0.004
Saudi Arabia 0.994 0.982 0.039 0.008
Shanghai (China) 0.812 0.372 0.252 0.057
Singapore 0.996 0.985 0.042 0.007
Slovak Republic 1.000 1.000 0.005 0.006
Slovenia 1.000 1.000 0.000 0.006
South Africa2 0.980 0.976 0.037 0.067
Spain 0.977 0.924 0.058 0.017
Sweden 0.987 0.957 0.060 0.013
Chinese Taipei 0.999 0.997 0.021 0.004
Turkey 1.000 1.000 0.000 0.006
United Arab Emirates 0.997 0.990 0.026 0.006
United States 0.985 0.951 0.049 0.011
Viet Nam 1.000 1.012 0.000 0.006
ISCED level 1
Australia1 0.986 0.982 0.042 0.078
Flemish Community (Belgium) 0.988 0.960 0.069 0.015
Ciudad Autónoma de Buenos Aires (Argentina) 1.000 1.000 0.000 0.006
Denmark 0.990 0.967 0.054 0.014
England (United Kingdom) 0.997 0.989 0.036 0.008
France 0.961 0.868 0.090 0.028
Japan 0.998 0.995 0.027 0.008
Korea 0.999 0.995 0.024 0.005
Netherlands1 0.992 0.990 0.038 0.069
Spain 1.000 0.998 0.009 0.007
Sweden 0.975 0.915 0.074 0.022
Chinese Taipei 0.995 0.984 0.045 0.008
Turkey 0.997 0.990 0.019 0.010
United Arab Emirates 0.999 0.996 0.016 0.006
Viet Nam 0.987 0.958 0.062 0.021
ISCED level 3
Alberta (Canada) 0.987 0.958 0.072 0.014
Brazil 0.999 0.997 0.016 0.009
Croatia 1.000 1.010 0.000 0.010
Denmark 0.978 0.928 0.065 0.026
Portugal 0.991 0.971 0.041 0.012
Slovenia 0.999 0.996 0.016 0.007
Sweden 0.972 0.905 0.090 0.023
Chinese Taipei 1.000 1.003 0.000 0.003
Turkey 0.994 0.979 0.029 0.011
United Arab Emirates 0.997 0.990 0.025 0.006
Viet Nam 0.999 0.997 0.011 0.011
TALIS-PISA link
Australia 0.978 0.972 0.062 0.109
Ciudad Autónoma de Buenos Aires (Argentina) 1.000 1.019 0.000 0.013
Colombia 0.960 0.950 0.047 0.249
Czech Republic 0.987 0.984 0.040 0.081
Denmark 0.968 0.960 0.047 0.116

362
TALIS 2018 TECHNICAL REPORT © OECD 2019
Participating countries/economies CFI TLI RMSEA SRMR
Georgia 0.945 0.931 0.046 0.136
Malta 0.992 0.990 0.033 0.068
Turkey 0.998 0.997 0.013 0.053
Viet Nam 0.940 0.924 0.040 0.119
1. Data from participating country/economy rated as insufficient during the adjudication process.
2. Participating country/economy with late data collection.
Source: OECD, TALIS 2018 database.
Table 11.112. CFA model-data fit for scale T3DIVP
Diversity practices
Participating countries/economies CFI TLI RMSEA WRMR
ISCED level 2
Alberta (Canada) 1.000 1.003 0.000 0.173
Australia 1.000 0.997 0.015 0.280
Austria 1.000 1.002 0.000 0.139
Belgium 1.000 1.000 0.005 0.247
Flemish Community (Belgium) 1.000 1.001 0.000 0.191
Brazil 0.998 0.987 0.035 0.356
Bulgaria 1.000 0.997 0.019 0.294
Ciudad Autónoma de Buenos Aires (Argentina) 0.999 0.994 0.023 0.332
Chile 1.000 1.001 0.000 0.172
Colombia 0.998 0.986 0.044 0.357
Croatia 1.000 0.998 0.012 0.286
Cyprus 1.000 0.999 0.012 0.159
Czech Republic 0.996 0.977 0.038 0.495
Denmark 0.993 0.959 0.065 0.493
England (United Kingdom) 0.997 0.981 0.050 0.558
Estonia 0.996 0.978 0.048 0.496
Finland 0.998 0.987 0.036 0.373
France 1.000 1.003 0.000 0.159
Georgia 0.994 0.963 0.082 0.608
Hungary 1.000 1.000 0.003 0.213
Iceland 0.994 0.966 0.055 0.471
Israel 1.000 1.004 0.000 0.173
Italy 1.000 1.001 0.000 0.212
Japan 0.998 0.991 0.029 0.319
Kazakhstan 0.998 0.987 0.025 0.435
Korea 1.000 1.000 0.009 0.229
Latvia 0.996 0.979 0.039 0.453
Lithuania 1.000 1.000 0.007 0.270
Malta 1.000 0.999 0.015 0.203
Mexico 0.998 0.988 0.044 0.268
Netherlands 1.000 1.002 0.000 0.272
New Zealand 0.967 0.805 0.068 0.728
Norway 1.000 0.999 0.006 0.225
Portugal 1.000 1.002 0.000 0.100
Romania 0.998 0.991 0.022 0.356
Russian Federation 0.997 0.985 0.036 0.488
Saudi Arabia 1.000 1.000 0.000 0.235
Shanghai (China) 0.999 0.994 0.035 0.338

363
TALIS 2018 TECHNICAL REPORT © OECD 2019
Participating countries/economies CFI TLI RMSEA WRMR
Singapore 1.000 1.001 0.000 0.207
Slovak Republic 0.998 0.988 0.037 0.382
Slovenia 1.000 1.007 0.000 0.164
South Africa2 0.998 0.990 0.031 0.297
Spain 1.000 0.999 0.006 0.211
Sweden 0.997 0.983 0.033 0.279
Chinese Taipei 0.998 0.988 0.041 0.560
Turkey 1.000 1.001 0.000 0.111
United Arab Emirates 1.000 1.001 0.000 0.102
United States 0.991 0.945 0.060 0.311
Viet Nam 0.970 0.819 0.091 0.658
ISCED level 1
Australia1 0.998 0.986 0.036 0.379
Flemish Community (Belgium) 1.000 1.003 0.000 0.114
Ciudad Autónoma de Buenos Aires (Argentina) 1.000 1.003 0.000 0.149
Denmark 0.999 0.993 0.026 0.377
England (United Kingdom) 1.000 1.001 0.000 0.258
France 0.975 0.852 0.081 0.568
Japan 1.000 1.002 0.000 0.164
Korea 0.990 0.942 0.065 0.772
Netherlands1 0.999 0.996 0.019 0.289
Spain 1.000 1.001 0.000 0.105
Sweden 1.000 0.999 0.009 0.260
Chinese Taipei 1.000 0.999 0.013 0.267
Turkey 1.000 1.000 0.000 0.155
United Arab Emirates 1.000 0.999 0.013 0.335
Viet Nam 0.996 0.977 0.033 0.393
ISCED level 3
Alberta (Canada) 0.983 0.900 0.093 0.720
Brazil 1.000 1.001 0.000 0.200
Croatia 1.000 1.002 0.000 0.175
Denmark 0.991 0.945 0.065 0.441
Portugal 1.000 1.001 0.000 0.191
Slovenia 1.000 1.004 0.000 0.141
Sweden 0.999 0.991 0.030 0.443
Chinese Taipei 1.000 0.999 0.013 0.261
Turkey 1.000 1.001 0.000 0.111
United Arab Emirates 1.000 1.000 0.000 0.158
Viet Nam 0.990 0.939 0.054 0.612
TALIS-PISA link
Australia 0.996 0.979 0.047 0.610
Ciudad Autónoma de Buenos Aires (Argentina) 1.000 1.006 0.000 0.151
Colombia 1.000 1.001 0.000 0.175
Czech Republic 1.000 1.008 0.000 0.020
Denmark 0.990 0.941 0.064 0.611
Georgia 0.996 0.974 0.051 0.421
Malta 1.000 1.007 0.000 0.066
Turkey 1.000 1.002 0.000 0.061
Viet Nam 1.000 1.012 0.000 0.164
1. Data from participating country/economy rated as insufficient during the adjudication process.
2. Participating country/economy with late data collection.
Source: OECD, TALIS 2018 database.

364
TALIS 2018 TECHNICAL REPORT © OECD 2019
Table 11.113. Invariance test results for scale T3SEFE
CFI TLI RMSEA SRMR Δ CFI Δ TLI Δ RMSEA Δ SRMR
Invariance level of ISCED level 2
Configural 0.999 0.993 0.027 0.006
Metric 0.991 0.986 0.039 0.051 0.013 0.015 -0.021 -0.068
Scalar 0.875 0.891 0.11 0.113 0.118 0.1 -0.064 -0.081
Invariance level of ISCED level 1
Configural 0.999 0.993 0.027 0.006
Metric 0.986 0.978 0.048 0.074 0.008 0.007 -0.012 -0.045
Scalar 0.868 0.878 0.112 0.155 0.116 0.095 -0.071 -0.062
Invariance level of ISCED level 3
Configural 0.999 0.996 0.021 0.004
Metric 0.991 0.985 0.04 0.057 0.008 0.011 -0.019 -0.053
Scalar 0.88 0.888 0.11 0.117 0.111 0.097 -0.07 -0.06
Note: See endote 34.
Source: OECD, TALIS 2018 database.
Table 11.114. Invariance test results for scale T3DIVP
CFI TLI RMSEA WRMR Δ CFI Δ TLI Δ RMSEA Δ WRMR
Invariance level of ISCED level 2
Configural 0.999 0.997 0.019 2.044 0.001 0.001 -0.006 -1.005
Metric
Scalar
Invariance level of ISCED level 1
Configural 1.000 0.998 0.013 1.039
Metric
Scalar
Invariance Level of ISCED level 3
Configural 0.999 0.997 0.022 1.082 0.000 0.000 -0.003 0.962
Metric
Scalar
Note: See endnote 34.
Source: OECD, TALIS 2018 database.
Table 11.115. Unstandardised factor loadings for T3SEFE for all countries for ISCED level 2
T3SEFE (Metric)
TT3G45A 0.482
TT3G45B 0.519
TT3G45C 0.583
TT3G45D 0.544
TT3G45E 0.522
Source: OECD, TALIS 2018 database.

365
TALIS 2018 TECHNICAL REPORT © OECD 2019
Table 11.116. Standardised factor loadings and unstandardised intercepts for T3SEFE
Participating countries/economies
Standardised factor loadings Unstandardised intercepts
TT3G45A TT3G45B TT3G45C TT3G45D TT3G45E TT3G45A TT3G45B TT3G45C TT3G45D TT3G45E
ISCED level 2
Alberta (Canada) 0.675 0.746 0.781 0.733 0.701 2.923 2.792 2.903 2.844 3.015
Australia 0.681 0.736 0.757 0.708 0.699 2.942 2.826 2.954 2.866 3.045
Austria 0.634 0.626 0.694 0.650 0.609 2.918 2.566 3.091 2.919 2.729
Belgium 0.644 0.601 0.684 0.640 0.607 2.974 2.761 3.212 3.003 3.093
Flemish Community (Belgium)
0.697 0.664 0.724 0.712 0.665 2.903 2.677 3.170 2.956 2.904
Brazil 0.634 0.675 0.698 0.729 0.598 2.991 3.029 3.020 3.321 3.279
Bulgaria 0.646 0.666 0.591 0.681 0.642 3.040 2.905 2.519 2.797 2.866
Ciudad Autónoma de Buenos Aires (Argentina)
0.582 0.614 0.605 0.654 0.608 2.869 2.851 2.979 3.234 3.289
Chile 0.596 0.673 0.757 0.754 0.691 2.614 2.814 2.977 3.220 3.249
Colombia 0.584 0.614 0.649 0.770 0.582 3.316 3.384 3.510 3.670 3.557
Croatia 0.698 0.703 0.691 0.735 0.721 3.056 2.901 2.954 3.062 3.135
Cyprus 0.651 0.678 0.798 0.683 0.671 2.910 2.833 2.981 3.169 3.225
Czech Republic 0.633 0.707 0.751 0.730 0.702 2.776 2.559 2.738 2.643 2.669
Denmark 0.617 0.598 0.677 0.618 0.605 3.100 2.797 3.223 3.057 3.141
England (United Kingdom)
0.662 0.713 0.726 0.672 0.676 2.991 2.794 2.971 2.795 3.067
Estonia 0.648 0.646 0.647 0.686 0.620 2.858 2.541 2.776 2.844 3.113
Finland 0.620 0.643 0.594 0.609 0.577 2.854 2.430 2.920 2.474 2.744
France 0.512 0.510 0.660 0.512 0.532 2.706 2.674 3.453 2.900 3.123
Georgia 0.653 0.748 0.620 0.789 0.680 2.939 3.098 2.633 3.178 3.032
Hungary 0.641 0.682 0.480 0.632 0.661 3.066 2.960 2.314 3.021 3.166
Iceland 0.714 0.718 0.803 0.749 0.720 2.784 2.595 2.958 2.812 2.929
Israel 0.670 0.681 0.675 0.674 0.675 2.789 2.695 2.538 2.641 2.900
Italy 0.503 0.532 0.404 0.573 0.451 2.905 2.932 2.965 3.489 3.391
Japan 0.731 0.769 0.684 0.726 0.707 2.024 2.072 2.048 2.276 2.210
Kazakhstan 0.633 0.693 0.699 0.782 0.731 2.905 2.811 2.578 2.843 2.832
Korea 0.805 0.794 0.855 0.813 0.773 2.318 2.229 2.308 2.573 2.593
Latvia 0.649 0.656 0.653 0.694 0.631 3.091 3.032 2.994 3.086 3.111
Lithuania 0.678 0.747 0.746 0.788 0.723 2.747 2.806 2.813 3.003 2.994
Malta 0.629 0.664 0.749 0.649 0.657 2.829 2.793 3.118 2.969 3.127
Mexico 0.622 0.649 0.639 0.711 0.621 2.722 2.874 2.915 3.260 3.195
Netherlands 0.675 0.683 0.746 0.700 0.666 2.812 2.516 2.922 2.764 2.777
New Zealand 0.657 0.712 0.717 0.706 0.670 2.987 2.839 2.870 2.895 3.060
Norway 0.658 0.713 0.718 0.677 0.636 2.664 2.468 2.817 2.517 2.669
Portugal 0.597 0.596 0.562 0.548 0.566 3.180 3.119 3.278 3.371 3.519
Romania 0.683 0.723 0.607 0.732 0.656 2.945 2.977 2.349 2.904 3.002
Russian Federation 0.719 0.723 0.776 0.711 0.689 2.978 2.912 2.944 2.864 2.821
Saudi Arabia 0.655 0.707 0.851 0.760 0.701 3.113 3.157 3.414 3.368 3.454
Shanghai (China) 0.736 0.805 0.700 0.830 0.701 2.515 2.646 2.222 2.569 2.490
Singapore 0.689 0.770 0.826 0.810 0.771 2.824 2.797 2.887 2.945 2.966
Slovak Republic 0.652 0.666 0.626 0.648 0.644 2.737 2.696 2.539 2.771 2.734
Slovenia 0.584 0.610 0.539 0.589 0.590 2.697 2.378 2.852 2.933 3.093
South Africa2 0.595 0.640 0.641 0.611 0.636 3.138 3.178 3.054 3.187 3.383
Spain 0.587 0.601 0.708 0.584 0.618 2.590 2.590 3.036 2.998 3.164
Sweden 0.629 0.637 0.693 0.641 0.613 2.835 2.615 2.932 2.685 2.808
Chinese Taipei 0.741 0.762 0.745 0.804 0.723 2.294 2.246 2.197 2.443 2.630

366
TALIS 2018 TECHNICAL REPORT © OECD 2019
Participating countries/economies
Standardised factor loadings Unstandardised intercepts
TT3G45A TT3G45B TT3G45C TT3G45D TT3G45E TT3G45A TT3G45B TT3G45C TT3G45D TT3G45E
Turkey 0.598 0.662 0.661 0.685 0.666 2.629 2.601 2.711 2.782 3.109
United Arab Emirates 0.667 0.754 0.744 0.708 0.673 3.454 3.488 3.471 3.444 3.457
United States 0.666 0.738 0.723 0.732 0.701 2.857 2.768 2.792 2.760 2.949
Viet Nam 0.613 0.671 0.515 0.609 0.580 2.490 2.772 2.270 2.788 3.249
ISCED level 1
Australia1 0.692 0.734 0.770 0.754 0.700 2.972 2.907 3.123 3.115 3.123
Flemish Community (Belgium)
0.646 0.636 0.751 0.711 0.656 2.903 2.677 3.170 2.956 2.904
Ciudad Autónoma de Buenos Aires (Argentina)
0.631 0.651 0.636 0.728 0.681 2.869 2.851 2.979 3.234 3.289
Denmark 0.649 0.633 0.712 0.667 0.643 3.121 2.893 3.298 3.180 3.259
England (United Kingdom)
0.688 0.742 0.728 0.749 0.722 2.976 2.894 3.111 3.107 3.166
France 0.467 0.470 0.658 0.486 0.486 2.706 2.674 3.453 2.900 3.123
Japan 0.737 0.753 0.649 0.746 0.715 2.024 2.072 2.048 2.276 2.210
Korea 0.778 0.778 0.848 0.831 0.785 2.318 2.229 2.308 2.573 2.593
Netherlands1 0.684 0.709 0.813 0.767 0.734 2.937 2.750 3.133 3.062 3.004
Spain 0.573 0.598 0.734 0.635 0.665 2.590 2.590 3.036 2.998 3.164
Sweden 0.633 0.647 0.694 0.621 0.603 2.875 2.690 3.192 2.853 2.942
Chinese Taipei 0.733 0.774 0.739 0.802 0.727 2.294 2.246 2.197 2.443 2.630
Turkey 0.588 0.652 0.652 0.684 0.652 2.629 2.601 2.711 2.782 3.109
United Arab Emirates 0.649 0.717 0.726 0.669 0.636 3.454 3.488 3.471 3.444 3.457
Viet Nam 0.645 0.711 0.597 0.761 0.626 2.521 2.819 2.175 2.862 3.028
ISCED level 3
Alberta (Canada) 0.659 0.726 0.742 0.685 0.665 2.923 2.792 2.903 2.844 3.015
Brazil 0.648 0.695 0.680 0.762 0.652 2.991 3.029 3.020 3.321 3.279
Croatia 0.665 0.676 0.667 0.727 0.677 3.056 2.901 2.954 3.062 3.135
Denmark 0.649 0.632 0.707 0.582 0.591 3.054 2.550 3.113 2.608 2.841
Portugal 0.618 0.605 0.588 0.568 0.564 3.180 3.119 3.278 3.371 3.519
Slovenia 0.610 0.639 0.553 0.602 0.598 2.697 2.378 2.852 2.933 3.093
Sweden 0.670 0.634 0.665 0.615 0.606 3.014 2.681 2.997 2.686 2.833
Chinese Taipei 0.742 0.771 0.759 0.791 0.721 2.294 2.246 2.197 2.443 2.630
Turkey 0.586 0.669 0.645 0.707 0.679 2.629 2.601 2.711 2.782 3.109
United Arab Emirates 0.677 0.751 0.760 0.689 0.693 3.454 3.488 3.471 3.444 3.457
Viet Nam 0.540 0.590 0.495 0.540 0.542 2.197 2.563 2.248 2.560 3.084
TALIS-PISA link
Australia 0.697 0.765 0.788 0.729 0.711 2.926 2.801 2.939 2.859 3.038
Ciudad Autónoma de Buenos Aires (Argentina)
0.623 0.648 0.623 0.678 0.678 2.873 2.844 3.031 3.240 3.320
Colombia 0.574 0.619 0.635 0.776 0.592 3.269 3.314 3.457 3.642 3.498
Czech Republic 0.645 0.714 0.750 0.750 0.719 2.809 2.579 2.765 2.667 2.634
Denmark 0.597 0.605 0.700 0.669 0.609 3.067 2.707 3.227 2.988 3.125
Georgia 0.680 0.708 0.639 0.832 0.694 3.005 3.048 2.610 3.150 3.054
Malta 0.631 0.680 0.760 0.668 0.679 2.838 2.732 3.059 2.889 3.013
Turkey 0.635 0.671 0.647 0.744 0.680 2.738 2.716 2.665 2.838 3.185
Viet Nam 0.488 0.556 0.442 0.504 0.529 2.338 2.690 2.199 2.643 3.237
1. Data from participating country/economy rated as insufficient during the adjudication process.
2. Participating country/economy with late data collection.
Source: OECD, TALIS 2018 database.

367
TALIS 2018 TECHNICAL REPORT © OECD 2019
Table 11.117. Standardised factor loadings and unstandardised intercepts for T3DIVP
Participating countries/economies
Standardised factor loadings Unstandardised intercepts
TT3G47A TT3G47B TT3G47C TT3G47D TT3G47A TT3G47B TT3G47C TT3G47D
ISCED level 2
Alberta (Canada) 0.565 0.520 0.890 0.760 -0.709 -0.287 -0.725 -1.164
Australia 0.696 0.565 0.788 0.817 -0.879 -0.666 -0.474 -0.934
Austria 0.564 0.497 0.835 0.742 0.019 0.350 -0.682 -1.129
Belgium 0.696 0.584 0.813 0.727 -0.044 -0.015 -0.692 -0.249
Flemish Community (Belgium)
0.700 0.590 0.818 0.756 0.009 -0.028 -0.639 -0.360
Brazil 0.695 0.697 0.851 0.812 -0.717 -0.902 -0.866 -1.065
Bulgaria 0.574 0.645 0.893 0.757 -0.555 -0.262 -0.282 -0.496
Ciudad Autónoma de Buenos Aires (Argentina)
0.772 0.620 0.798 0.796 -0.604 -0.451 -1.263 -0.895
Chile 0.728 0.613 0.746 0.874 -0.706 -0.401 -1.047 -0.674
Colombia 0.737 0.775 0.827 0.774 -0.885 -0.797 -1.209 -1.011
Croatia 0.585 0.568 0.876 0.789 0.103 0.394 -0.499 -0.297
Cyprus 0.624 0.607 0.891 0.829 -0.642 -0.252 -0.446 -0.369
Czech Republic 0.562 0.452 0.794 0.771 0.326 0.565 -0.485 -0.677
Denmark 0.630 0.681 0.877 0.742 0.764 0.982 0.648 -0.092
England (United Kingdom)
0.616 0.611 0.859 0.810 -0.458 -0.142 -0.967 -0.857
Estonia 0.654 0.644 0.806 0.706 -0.446 -0.199 -0.365 -0.606
Finland 0.593 0.531 0.770 0.820 0.549 0.294 -0.585 -0.703
France 0.515 0.463 0.842 0.656 -0.071 0.489 -0.830 -0.524
Georgia 0.661 0.623 0.794 0.879 -0.543 -0.329 -0.879 -0.828
Hungary 0.558 0.496 0.849 0.763 0.042 0.309 -0.358 -0.257
Iceland 0.675 0.530 0.700 0.764 0.012 0.390 -0.120 0.611
Israel 0.617 0.607 0.852 0.759 -0.288 -0.671 -0.454 -0.148
Italy 0.589 0.526 0.795 0.749 -0.175 0.437 -0.457 -0.707
Japan 0.625 0.533 0.827 0.792 0.541 0.518 -0.041 0.266
Kazakhstan 0.685 0.674 0.746 0.847 -1.099 -1.404 -0.963 -0.510
Korea 0.779 0.657 0.854 0.823 0.185 0.303 -0.533 0.209
Latvia 0.464 0.411 0.900 0.737 -0.174 -0.117 -0.648 -0.754
Lithuania 0.652 0.580 0.909 0.708 -0.356 -0.475 -0.722 -0.525
Malta 0.609 0.506 0.888 0.757 -0.579 -0.147 -0.520 -0.541
Mexico 0.735 0.590 0.811 0.802 -0.370 0.216 -0.954 -0.729
Netherlands 0.624 0.583 0.790 0.699 0.235 0.536 -0.467 -0.001
New Zealand 0.451 0.481 0.825 0.575 -1.973 -0.940 -0.435 -1.026
Norway 0.511 0.489 0.828 0.796 0.748 0.863 -0.167 -0.768
Portugal 0.667 0.604 0.875 0.795 -0.003 0.213 -0.771 -0.638
Romania 0.641 0.619 0.586 0.705 -0.722 -0.459 -0.951 -0.700
Russian Federation 0.681 0.581 0.745 0.836 -0.439 -0.339 -0.658 -0.163
Saudi Arabia 0.729 0.857 0.800 0.792 -0.450 -0.036 -0.381 0.024
Shanghai (China) 0.760 0.650 0.889 0.846 -1.174 -1.143 -0.752 -0.615
Singapore 0.734 0.668 0.783 0.826 -1.430 -1.595 -1.128 -1.193
Slovak Republic 0.489 0.527 0.855 0.749 -0.173 0.340 -0.543 -0.508
Slovenia 0.587 0.404 0.744 0.764 0.128 0.286 -1.110 -0.389
South Africa2 0.710 0.670 0.940 0.736 -0.984 -0.647 -0.879 -0.912
Spain 0.702 0.593 0.876 0.718 -0.320 0.115 -0.780 -0.592
Sweden 0.464 0.499 0.875 0.747 0.632 0.639 -0.498 -0.817
Chinese Taipei 0.675 0.632 0.859 0.815 -0.744 -0.145 -0.832 -0.437

368
TALIS 2018 TECHNICAL REPORT © OECD 2019
Participating countries/economies
Standardised factor loadings Unstandardised intercepts
TT3G47A TT3G47B TT3G47C TT3G47D TT3G47A TT3G47B TT3G47C TT3G47D
Turkey 0.753 0.812 0.871 0.855 0.232 0.597 -0.098 -0.011
United Arab Emirates 0.815 0.733 0.886 0.819 -1.120 -1.231 -0.992 -1.140
United States 0.607 0.538 0.922 0.750 -0.606 -0.052 -0.321 -0.434
Viet Nam 0.672 0.687 0.745 0.792 -1.497 -0.586 -1.275 -1.335
ISCED level 1
Australia1 0.616 0.512 0.850 0.752 -0.646 -0.808 -0.459 -0.890
Flemish Community (Belgium)
0.506 0.487 0.790 0.851 0.009 -0.028 -0.639 -0.360
Ciudad Autónoma de Buenos Aires (Argentina)
0.668 0.652 0.844 0.799 -0.604 -0.451 -1.263 -0.895
Denmark 0.668 0.607 0.870 0.737 1.050 1.153 0.905 0.192
England (United Kingdom)
0.562 0.623 0.689 0.837 -0.458 -0.142 -0.967 -0.857
France 0.377 0.284 0.975 0.372 -0.071 0.489 -0.830 -0.524
Japan 0.639 0.551 0.797 0.753 0.541 0.518 -0.041 0.266
Korea 0.735 0.605 0.800 0.655 -0.213 -0.307 -1.276 -0.035
Netherlands1 0.588 0.495 0.700 0.838 0.439 0.696 -0.769 -0.128
Spain 0.711 0.639 0.818 0.826 -0.320 0.115 -0.780 -0.592
Sweden 0.462 0.450 0.954 0.727 0.632 0.639 -0.498 -0.817
Chinese Taipei 0.735 0.644 0.867 0.746 -0.744 -0.145 -0.832 -0.437
Turkey 0.799 0.823 0.915 0.893 0.232 0.597 -0.098 -0.011
United Arab Emirates 0.829 0.748 0.884 0.805 -1.120 -1.231 -0.992 -1.140
Viet Nam 0.622 0.705 0.745 0.726 -1.497 -0.586 -1.275 -1.335
ISCED level 3
Alberta (Canada) 0.645 0.518 0.901 0.754 -0.709 -0.287 -0.725 -1.164
Brazil 0.728 0.663 0.853 0.793 -0.717 -0.902 -0.866 -1.065
Croatia 0.657 0.533 0.847 0.855 0.103 0.394 -0.499 -0.297
Denmark 0.698 0.707 0.748 0.774 0.991 0.869 1.192 -0.196
Portugal 0.696 0.636 0.882 0.799 -0.003 0.213 -0.771 -0.638
Slovenia 0.520 0.506 0.701 0.795 0.128 0.286 -1.110 -0.389
Sweden 0.545 0.456 0.818 0.744 0.632 0.639 -0.498 -0.817
Chinese Taipei 0.719 0.732 0.814 0.831 -0.744 -0.145 -0.832 -0.437
Turkey 0.795 0.840 0.890 0.882 0.232 0.597 -0.098 -0.011
United Arab Emirates 0.841 0.759 0.887 0.872 -1.120 -1.231 -0.992 -1.140
Viet Nam 0.792 0.698 0.759 0.723 -1.497 -0.586 -1.275 -1.335
TALIS-PISA link
Australia 0.652 0.475 0.887 0.684 -0.945 -0.767 -0.579 -0.966
Ciudad Autónoma de Buenos Aires (Argentina)
0.727 0.533 0.769 0.824 -0.632 -0.327 -1.300 -0.973
Colombia 0.774 0.636 0.913 0.780 -0.744 -0.675 -1.221 -0.996
Czech Republic 0.545 0.589 0.840 0.797 0.287 0.500 -0.348 -0.551
Denmark 0.823 0.797 0.797 0.612 0.968 1.071 0.853 -0.146
Georgia 0.713 0.718 0.820 0.912 -0.594 -0.332 -0.711 -0.867
Malta 0.678 0.588 0.842 0.813 -0.399 0.075 -0.414 -0.428
Turkey 0.771 0.874 0.864 0.852 0.191 0.659 -0.138 -0.090
Viet Nam 0.589 0.555 0.813 0.785 -1.632 -0.520 -1.195 -1.167
1. Data from participating country/economy were rated as insufficient during the adjudication process.
2. Participating country/economy with late data collection.
Source: OECD, TALIS 2018 database.

369
TALIS 2018 TECHNICAL REPORT © OECD 2019
Excluded scale: Teaching practices
One scale was excluded from the teacher population. This was due to poor model fit of the
pooled model, as well as at the country/economy level. Table 11.118 presents the item
wording for this scale.
Table 11.118. Item wording for teaching practices
Teaching practices
How often do you use the following methods of assessing student learning in the <target class>?
Response options: “Never or almost never” (1), “Occasionally” (2), “Frequently” (3), “Always” (4)
TT3G43A I administer my own assessment
TT3G43B I provide written feedback on student work in addition to a <mark, i.e. numeric score or letter grade>
TT3G43C I let students evaluate their own progress
TT3G43D I observe students when working on particular tasks and provide immediate feedback
11.4.1. Complex scales from the principal questionnaire
Job satisfaction: Job satisfaction, composite (T3PJOBSA); Job satisfaction with
work environment (T3PJSENV); Job satisfaction with profession (T3PJSPRO);
Workload stress (T3PWLOAD)
11.58. Measured items
Two subscales and one composite scale measuring teacher job satisfaction were derived
from the following question stem:
“We would like to know how you generally feel about your job. How strongly do
you agree or disagree with the following statements?” (TC3G44), which was
followed by items about the school used for the subscale Job satisfaction with work
environment (T3PJSENV), and items on the principal profession used for the
subscale Job satisfaction with profession (T3PJSPRO).
These two subscales formed the multidimensional scale Job satisfaction, composite
(T3PJOBSA).
An additional scale related to job satisfaction was developed from the question stem:
“Thinking about your job at this school, to what extent are the following sources of
stress in your work?” (TC3G43). The question was followed with items about
principal workload that were used the scale Workload stress (T3PWLOAD).
These scales are presented in Table 11.119.
11.59. Model improvements
Model improvements were included for both subscales. A correlation between items
TC3G44I and TC3G44J was added for T3PJSENV, while a correlation between items
TC3G44D and TC3G44F was added for T3PJSPRO.
11.60. Excluded populations
The Sweden ISCED level 3 population was excluded for the subscale T3PJSENV because,
during the model analysis at the country/economy level, it produced a Heywood case (the
estimated residual variance of an item was negative; for more information see Heywood

370
TALIS 2018 TECHNICAL REPORT © OECD 2019
(1931[36])). As a consequence, there is not a reliability coefficient for this population for
this scale in Table 11.120, nor are there standardised parameters in Table 11.121.
The Portugal ISCED level 2 population was excluded from the final scale modelling for
the scale T3PWLOAD because specific parameters within each of these populations caused
model instability. Sweden’s ISCED level 2 population was excluded from the model after
model analysis at the country/economy level due to a non-converge issue. These
populations, therefore, do not have reliability coefficients for this scale in XX11.2 or
standardised parameters in XX11.11. In addition, XX11.5 does not have fit statistics for
Sweden ISCED level 2.
11.61. Scale reliability
Table 11.120 presents the reliabilities for all populations in each of the four scales. Here it
can be seen that the reliability coefficients for the subscales T3PJSENV and T3PJSPRO
are mostly above 0.700, suggesting high reliability, while acceptable reliability can be
observed for T3PJSENV for Kazakhstan and the Slovak Republic ISCED level 2
populations, and the Korea ISCED level 1 population. Most coefficients for the scale
T3PWLOAD exhibit acceptable to high reliability, while reliabilities are low in the Iceland
and Latvia ISCED level 2 populations, and the France ISCED level 1 population.
11.62. Model fits
Tables 11.121 and 11.122 present the model fit indices for the subscales T3PJSENV and
T3PJSPRO respectively. The model fit for T3PJSENV is acceptable for most populations,
with the exception of Colombia at the ISCED level 2. Although the model fails at the
ISCED level 2 level in Bulgaria and Iceland, Sweden ISCED level 1, as well as at the
ISCED level 3 level and for the TALIS-PISA link population in Turkey, when these
participating countries/economies were included in the respective cross-country
measurement invariance testing, the models worked well because the addition of the other
groups benefited the overall model.
Model fits for T3PJSPRO were almost perfect in almost all participating
countries/economies as evident in Table 11.122, and were also acceptable in all
participating countries/economies.
The fit indices for the scale T3PWLOAD are not presented because the scale was based on
three items. In addition, because the scale reached only configural invariance for ISCED
level 2 (see Table 11.125), the populations from the participating countries/economies that
did not meet the technical standards, the participating countries/economies with late data
delivery, and the TALIS-PISA link populations also had free parameters, which meant the
model was just identified for those populations, resulting in a perfect model fit.
11.63. Invariance testing
Table 11.123 presents the results from the invariance analyses for the subscale T3PJSENV.
Configural invariance was established for all population levels. The difference for the
ISCED level 1 and 2 levels between the configural and metric models was above the cut-
off criteria. For ISCED level 3, the configural model did not converge, as it was under-
identified. However, because the metric model did not exhibit acceptable fit indices, the
model was considered configural invariant only.
The measurement invariance results for the subscale T3PJSPRO presented in Table 11.124
show that this scale was configural invariant at the ISCED level 1 and 2 levels, and metric

371
TALIS 2018 TECHNICAL REPORT © OECD 2019
invariant at the ISCED level 3 level. Therefore, the invariance level for the composite scale
T3PJOBSA was configural for all ISCED levels.
Finally, Table 11.125 presents the invariance results for the scale T3PWLOAD. It reached
configural invariance for ISCED level 2 and metric invariance for ISCED levels 1 and 3.
Because the configural models were perfect, if the metric model exhibited acceptable fit,
the model was considered metric invariant.
11.64. Item parameters
The unstandardised item parameters are not reported because the scales all reached
configural invariance for the ISCED level 2 populations and the item parameters were
country-specific.
Table 11.126 presents the standardised factor loadings and unstandardised intercepts for
subscale T3PJSENV. Most factor loadings for items TC3G44E and TC3G44G are above
0.600, while item TC3G44E is below 0.450 in the Viet Nam TALIS-PISA link population.
Most of the factor loadings for item TC3G44J suggest moderate strength between the item
and the latent construct, while the relationship is weak in a good number of populations.
Item TC3G44I has many low and moderate factor loadings. These results suggest the scale
does not work well for several populations, especially for the Austria ISCED level 2
population.Table 11.127 presents similar results for subscale T3PJSPRO. Item TC3G44B
exhibits the strongest factor loadings. Although most factor loadings for item TC3G44A
are above 0.600, a good number of loadings are between 0.450 and 0.600, with the loadings
for the Columbia, Kazakhstan, Latvia and Romania ISCED level 2 populations particularly
weak. The factor loadings for both items TC3G44D and TC3G44F are moderate for most
populations, but also weak for a fair number of populations. Of note, the factor loading for
item TC3G44F for Lithuania’s ISCED level 2 population is negative, suggesting a negative
relationship with the latent factor.
Table 11.128 presents the standardised factor loadings and unstandardised intercepts for
scale T3PWLOAD. While item TC3G43B has strong factor loadings for most populations,
moderate and even weak factor loading are also present. In comparison, item TC3G43A
has more moderate and weak factor loadings, while item TC3G44C has mostly moderate
and weak factor loadings.

372
TALIS 2018 TECHNICAL REPORT © OECD 2019
Table 11.119. Item wording for job satisfaction scales
T3PJOBSA: Job satisfaction, composite
T3PJSENV: Job satisfaction with work environment (subscale)
TC3G44: We would like to know how you generally feel about your job. How strongly do you agree or disagree with the following statements?
Response options: “Strongly disagree” (1), “Disagree” (2), “Agree” (3), “Strongly agree” (4).
TC3G44E I enjoy working at this school
TC3G44G I would recommend this school as a good place to work
TC3G44I I am satisfied with my performance in this school
TC3G44J All in all, I am satisfied with my job
T3PJSPRO: Job satisfaction with profession (subscale)
TC3G44: We would like to know how you generally feel about your job. How strongly do you agree or disagree with the following statements?
Response options: “Strongly disagree” (1), “Disagree” (2), “Agree” (3), “Strongly agree” (4).
TC3G44A The advantages of this profession clearly outweigh the disadvantages
TC3G44B If I could decide again, I would still choose this job/position
TC3G44D* I regret that I decided to become a principal
TC3G44F* I wonder whether it would have been better to choose another profession
T3PWLOAD: Workload stress
TC3G43: Thinking about your job at this school, to what extent are the following sources of stress in your work?
Response options: “Not at all” (1), “To some extent” (2), “Quite a bit” (3), “A lot” (4).
TC3G43A Having too much teacher appraisal and feedback work to do
TC3G43B Having too much administrative work to do (e.g. filling out forms)
TC3G43C Having extra duties due to absent school staff
* The response options for these items were reverse coded.
Source: OECD, TALIS 2018 database.
Table 11.120 Reliability coefficients for job satisfaction scales
Participating countries/economies
T3PJSENV T3PJSPRO T3PJOBSA T3PWLOAD
Omega coefficient3 Stratified Cronbach’s
alpha Omega coefficient
ISCED level 2
Alberta (Canada)4 0.861 - - 0.986
Australia1 0.769 0.839 0.873 0.659
Austria 0.964 0.876 0.942 0.585
Belgium 0.740 0.799 0.837 0.717
Flemish Community (Belgium) 0.774 0.778 0.852 0.551
Brazil 0.760 0.797 0.857 0.869
Bulgaria 0.796 0.970 0.913 0.624
Ciudad Autónoma de Buenos Aires (Argentina)
0.686 0.976 0.881 0.679
Chile 0.752 0.682 0.801 0.726
Colombia4 0.962 - - 0.771
Croatia 0.771 0.854 0.865 0.982
Cyprus4 0.929 - - 0.745
Czech Republic 0.843 0.724 0.863 0.464
Denmark 0.901 0.953 0.948 0.563
England (United Kingdom) 0.760 0.893 0.893 0.686
Estonia 0.801 0.753 0.859 0.759
Finland 0.769 0.960 0.918 0.893
France 0.834 0.839 0.889 0.984

373
TALIS 2018 TECHNICAL REPORT © OECD 2019
Participating countries/economies
T3PJSENV T3PJSPRO T3PJOBSA T3PWLOAD
Omega coefficient3 Stratified Cronbach’s
alpha Omega coefficient
Georgia 0.832 0.769 0.867 0.869
Hungary4 0.746 - - 0.593
Iceland 0.731 0.850 0.868 0.432
Israel 0.846 0.733 0.873 0.607
Italy 0.861 0.846 0.890 0.581
Japan 0.790 0.808 0.866 0.986
Kazakhstan 0.598 0.654 0.748 0.689
Korea 0.830 0.949 0.925 0.988
Latvia 0.666 0.794 0.772 0.444
Lithuania4 0.712 - - 0.745
Malta 0.937 0.846 0.939 0.484
Mexico 0.760 0.819 0.863 0.854
Netherlands4 0.852 - - 0.604
New Zealand 0.984 0.821 0.921 0.797
Norway 0.723 0.885 0.867 0.548
Portugal5 0.785 0.805 0.849 -
Romania 0.845 0.897 0.910 0.796
Russian Federation 0.699 0.953 0.886 0.752
Saudi Arabia 0.757 0.801 0.848 0.771
Shanghai (China) 0.796 0.908 0.910 0.554
Singapore 0.817 0.711 0.860 0.738
Slovak Republic 0.590 0.674 0.740 0.543
Slovenia 0.682 0.803 0.832 0.728
South Africa2,4 - 0.689 - 0.545
Spain4 0.711 - - 0.591
Sweden5 0.815 0.951 0.930 -
Chinese Taipei 0.810 0.872 0.892 0.702
Turkey 0.774 0.789 0.856 0.745
United Arab Emirates 0.808 0.916 0.916 0.724
United States 0.755 0.876 0.892 0.988
Viet Nam 0.812 0.872 0.880 0.752
ISCED level 1
Australia1 0.819 0.897 0.912 0.638
Flemish Community (Belgium) 0.799 0.835 0.876 0.458
Ciudad Autónoma de Buenos Aires (Argentina)
0.774 0.874 0.874 0.599
Denmark 0.752 0.955 0.893 0.709
England (United Kingdom) 0.824 0.845 0.892 0.687
France 0.792 0.792 0.845 0.372
Japan 0.654 0.776 0.808 0.988
Korea 0.594 0.801 0.811 0.806
Netherlands1 0.714 0.796 0.852 0.679
Spain4 0.666 - - 0.494
Sweden 0.712 0.929 0.899 0.608
Chinese Taipei 0.841 0.962 0.928 0.704
Turkey 0.817 0.912 0.912 0.794
United Arab Emirates 0.753 0.887 0.885 0.674
Viet Nam 0.781 0.773 0.850 0.776
ISCED level 3
Alberta (Canada) 0.733 0.880 0.868 0.569

374
TALIS 2018 TECHNICAL REPORT © OECD 2019
Participating countries/economies
T3PJSENV T3PJSPRO T3PJOBSA T3PWLOAD
Omega coefficient3 Stratified Cronbach’s
alpha Omega coefficient
Brazil 0.759 0.803 0.850 0.988
Croatia 0.835 0.903 0.912 0.487
Denmark 0.914 0.885 0.941 0.686
Portugal 0.615 0.884 0.832 0.984
Slovenia 0.806 0.776 0.870 0.984
Sweden6 - 0.837 - 0.526
Chinese Taipei 0.767 0.924 0.906 0.677
Turkey 0.740 0.711 0.824 0.646
United Arab Emirates 0.748 0.901 0.898 0.724
Viet Nam 0.796 0.663 0.831 0.651
TALIS-PISA link
Australia 0.885 0.947 0.943 0.627
Ciudad Autónoma de Buenos Aires (Argentina)
0.814 0.755 0.868 0.534
Colombia 0.841 0.863 0.902 0.808
Czech Republic4 0.824 - - 0.539
Denmark 0.922 0.912 0.947 0.646
Georgia4 0.823 - - 0.872
Malta 0.837 0.824 0.901 0.540
Turkey 0.719 0.895 0.868 0.814
Viet Nam4 0.707 - - 0.776
1. Data from the participating country/economy was rated as insufficient during the adjudication process.
2. Participating country/economy with late data collection.
3. Omega coefficient was calculated based on unidimensional models for every single subscale of the
multidimensional construct.
4. These participating countries’/economies’ reliability coefficient estimation failed in the final scale model
due to a negative residual variance for one or more items that could not be corrected; when this occurs for a
subscale of a multidimensional scale, the multidimensional scale reliability coefficient is also missing; these
countries/economies have untrustworthy scale scores for the corresponding ISCED level.
5. This participating country/economy was excluded from this scale.
Source: OECD, TALIS 2018 database.
Table 11.121. CFA model-data fit for scale T3PJSENV
Job satisfaction with work environment
Participating countries/economies CFI TLI RMSEA SRMR
ISCED level 2
Alberta (Canada) 0.999 0.994 0.027 0.012
Australia1 1.000 1.135 0.000 0.002
Austria3 0.985 0.911 0.064 0.029
Belgium 1.000 1.070 0.000 0.002
Flemish Community (Belgium) 1.000 1.112 0.000 0.000
Brazil 1.000 1.019 0.000 0.006
Bulgaria5 - - - -
Ciudad Autónoma de Buenos Aires (Argentina) 1.000 1.008 0.000 0.013
Chile 0.983 0.898 0.084 0.009
Colombia3 0.882 0.290 0.188 0.054
Croatia 1.000 1.022 0.000 0.007
Cyprus 1.000 1.056 0.000 0.003
Czech Republic 0.945 0.670 0.167 0.032

375
TALIS 2018 TECHNICAL REPORT © OECD 2019
Participating countries/economies CFI TLI RMSEA SRMR
Denmark 1.000 0.999 0.009 0.015
England (United Kingdom) 1.000 1.043 0.000 0.008
Estonia 1.000 1.033 0.000 0.005
Finland 0.985 0.913 0.110 0.019
France 0.993 0.957 0.071 0.012
Georgia 0.998 0.986 0.060 0.013
Hungary 0.991 0.947 0.073 0.013
Iceland5 - - - -
Israel 1.000 1.023 0.000 0.004
Italy 0.955 0.729 0.178 0.023
Japan 1.000 1.023 0.000 0.010
Kazakhstan 1.000 1.033 0.000 0.007
Korea 0.967 0.800 0.117 0.016
Latvia 1.000 1.104 0.000 0.005
Lithuania 0.961 0.764 0.124 0.019
Malta 1.000 1.156 0.000 0.003
Mexico 1.000 1.042 0.000 0.004
Netherlands 0.986 0.919 0.127 0.012
New Zealand 1.000 1.011 0.000 0.015
Norway 1.000 1.213 0.000 0.001
Portugal 1.000 1.009 0.000 0.006
Romania 1.000 1.027 0.000 0.004
Russian Federation 1.000 1.146 0.000 0.001
Saudi Arabia 1.000 1.027 0.000 0.015
Shanghai (China) 0.984 0.902 0.129 0.014
Singapore 0.993 0.957 0.080 0.010
Slovak Republic 0.997 0.984 0.026 0.016
Slovenia 1.000 1.101 0.000 0.015
South Africa2 1.000 1.000 0.000 0.000
Spain 1.000 1.031 0.000 0.002
Sweden 0.961 0.766 0.171 0.024
Chinese Taipei 1.000 1.046 0.000 0.004
Turkey 1.000 1.033 0.000 0.003
United Arab Emirates 0.992 0.951 0.064 0.016
United States 1.000 1.090 0.000 0.001
Viet Nam 1.000 1.045 0.000 0.001
ISCED level 1
Australia1 1.000 1.068 0.000 0.002
Flemish Community (Belgium) 1.000 1.059 0.000 0.004
Ciudad Autónoma de Buenos Aires (Argentina) 1.000 1.060 0.000 0.000
Denmark 0.961 0.764 0.115 0.032
England (United Kingdom) 1.000 1.090 0.000 0.005
France 0.964 0.781 0.126 0.023
Japan 0.937 0.621 0.136 0.024
Korea 1.000 1.156 0.000 0.009
Netherlands1 1.000 1.057 0.000 0.004
Spain 1.000 1.061 0.000 0.003
Sweden4 - - - 0.018
Chinese Taipei 1.000 1.021 0.000 0.003
Turkey 0.952 0.710 0.139 0.024
United Arab Emirates 0.983 0.897 0.106 0.011
Viet Nam 0.997 0.983 0.035 0.009

376
TALIS 2018 TECHNICAL REPORT © OECD 2019
Participating countries/economies CFI TLI RMSEA SRMR
ISCED level 3
Alberta (Canada) 0.975 0.851 0.126 0.017
Brazil 1.000 1.074 0.000 0.001
Croatia 0.991 0.943 0.122 0.009
Denmark 0.994 0.965 0.087 0.024
Portugal4 - - - 0.025
Slovenia 1.000 1.089 0.000 0.002
Sweden6 - - - -
Chinese Taipei 0.908 0.451 0.244 0.030
Turkey5 - - - -
United Arab Emirates 0.976 0.856 0.112 0.020
Viet Nam 1.000 1.042 0.000 0.001
TALIS-PISA link
Australia 1.000 1.014 0.000 0.008
Ciudad Autónoma de Buenos Aires (Argentina) 1.000 1.098 0.000 0.001
Colombia 1.000 1.092 0.000 0.010
Czech Republic 1.000 1.069 0.000 0.001
Denmark 1.000 1.012 0.000 0.007
Georgia 1.000 1.037 0.000 0.013
Malta 1.000 1.073 0.000 0.011
Turkey5 - - - -
Viet Nam 1.000 1.125 0.000 0.008
1. Data from the participating country/economy was rated as insufficient during the adjudication process.
2. Participating country/economy with late data collection.
3. These participating country/economy had a negative residual variance on item TC3G44E in the initial model,
resulting in the failure of the software to produce fit statistics for CFI, TLI and RMSEA. Several corrections
attempted to fix this issue, and eventually resulted in the residual variance of item TC3G44E being set to greater
than 0.01.
4. As the correction factor for this participating country/economy was negative, only the SRMR is reported.
5. Scale modelling failed in this participating country/economy.
6. This participating country/economy was excluded from this scale.
Source: OECD, TALIS 2018 database.
Table 11.122. CFA model-data fit for scale T3PJSPRO
Job satisfaction with profession
Participating countries/economies CFI TLI RMSEA SRMR
ISCED level 2
Alberta (Canada) 0.998 0.990 0.043 0.011
Australia1 1.000 1.106 0.000 0.003
Austria 1.000 0.999 0.007 0.014
Belgium 1.000 1.043 0.000 0.003
Flemish Community (Belgium) 1.000 1.035 0.000 0.007
Brazil 1.000 1.103 0.000 0.012
Bulgaria 0.999 0.996 0.023 0.009
Ciudad Autónoma de Buenos Aires (Argentina) 1.000 1.007 0.000 0.012
Chile 1.000 1.117 0.000 0.015
Colombia 1.000 1.302 0.000 0.006
Croatia 0.969 0.815 0.124 0.022
Cyprus 1.000 1.125 0.000 0.002
Czech Republic 1.000 1.001 0.000 0.011
Denmark 1.000 1.039 0.000 0.006

377
TALIS 2018 TECHNICAL REPORT © OECD 2019
Participating countries/economies CFI TLI RMSEA SRMR
England (United Kingdom) 1.000 1.064 0.000 0.003
Estonia 0.986 0.916 0.070 0.018
Finland 1.000 1.055 0.000 0.007
France 0.999 0.991 0.030 0.009
Georgia 0.991 0.945 0.057 0.010
Hungary 1.000 1.040 0.000 0.010
Iceland 0.993 0.955 0.090 0.012
Israel 1.000 1.039 0.000 0.006
Italy 0.988 0.931 0.118 0.016
Japan 0.984 0.901 0.107 0.021
Kazakhstan 1.000 1.095 0.000 0.009
Korea 1.000 1.018 0.000 0.003
Latvia 0.905 0.432 0.148 0.032
Lithuania 1.000 1.043 0.000 0.002
Malta 1.000 1.099 0.000 0.006
Mexico 0.955 0.732 0.118 0.015
Netherlands 1.000 1.107 0.000 0.001
New Zealand 0.998 0.986 0.034 0.017
Norway 1.000 1.034 0.000 0.006
Portugal 1.000 1.060 0.000 0.003
Romania 0.973 0.836 0.127 0.035
Russian Federation 0.968 0.808 0.077 0.038
Saudi Arabia 1.000 1.095 0.000 0.003
Shanghai (China) 1.000 1.086 0.000 0.002
Singapore 1.000 1.026 0.000 0.012
Slovak Republic 1.000 1.112 0.000 0.003
Slovenia 0.962 0.775 0.134 0.026
South Africa2 1.000 1.007 0.000 0.011
Spain 1.000 1.020 0.000 0.009
Sweden 0.978 0.870 0.186 0.011
Chinese Taipei 1.000 1.028 0.000 0.011
Turkey 0.989 0.932 0.066 0.019
United Arab Emirates 0.990 0.937 0.071 0.010
United States 0.977 0.860 0.090 0.030
Viet Nam 1.000 1.097 0.000 0.002
ISCED level 1
Australia1 0.970 0.822 0.129 0.015
Flemish Community (Belgium) 1.000 1.045 0.000 0.001
Ciudad Autónoma de Buenos Aires (Argentina) 0.974 0.845 0.137 0.029
Denmark 0.955 0.730 0.179 0.030
England (United Kingdom) 1.000 1.056 0.000 0.005
France 1.000 1.065 0.000 0.012
Japan 1.000 1.059 0.000 0.001
Korea 1.000 1.036 0.000 0.011
Netherlands1 1.000 1.065 0.000 0.005
Spain 1.000 1.026 0.000 0.011
Sweden 1.000 1.019 0.000 0.005
Chinese Taipei 0.980 0.878 0.117 0.026
Turkey 1.000 1.049 0.000 0.010
United Arab Emirates 0.976 0.856 0.109 0.014
Viet Nam 1.000 1.083 0.000 0.005
ISCED level 3

378
TALIS 2018 TECHNICAL REPORT © OECD 2019
Participating countries/economies CFI TLI RMSEA SRMR
Alberta (Canada) 0.995 0.971 0.061 0.013
Brazil 1.000 1.108 0.000 0.003
Croatia 1.000 1.050 0.000 0.002
Denmark 0.953 0.719 0.197 0.019
Portugal 0.994 0.962 0.063 0.015
Slovenia 0.944 0.663 0.166 0.016
Sweden 0.994 0.964 0.044 0.012
Chinese Taipei 1.000 1.046 0.000 0.006
Turkey 0.985 0.911 0.045 0.026
United Arab Emirates 1.000 1.032 0.000 0.002
Viet Nam 0.994 0.965 0.035 0.017
TALIS-PISA link
Australia3 - - - 0.048
Ciudad Autónoma de Buenos Aires (Argentina) 0.936 0.618 0.151 0.024
Colombia 1.000 1.052 0.000 0.009
Czech Republic 1.000 1.056 0.000 0.010
Denmark 1.000 1.089 0.000 0.005
Georgia 0.913 0.479 0.183 0.029
Malta 1.000 1.098 0.000 0.015
Turkey 1.000 1.013 0.000 0.007
Viet Nam 1.000 1.023 0.000 0.005
1. Data from the participating country/economy was rated as insufficient during the adjudication process.
2. Participating country/economy with late data collection.
3. As the correction factor for this participating country/economy was negative, only the SRMR is reported.
Source: OECD, TALIS 2018 database.
Table 11.123. Invariance test results for scale T3PJSENV
CFI TLI RMSEA SRMR Δ CFI Δ TLI Δ RMSEA Δ SRMR
Invariance level for ISCED level 2
Configural 0.993 0.958 0.063 0.016
Metric 0.957 0.935 0.079 0.170 0.036 0.023 -0.016 -0.154
Scalar 0.795 0.821 0.131 0.228 0.162 0.114 -0.052 -0.058
Invariance level for ISCED level 1
Configural 0.997 0.984 0.033 0.015
Metric 0.974 0.959 0.053 0.132 0.023 0.025 -0.020 -0.117
Scalar 0.748 0.769 0.126 0.213 0.226 0.190 -0.073 -0.081
Invariance level for ISCED level 3
Configural - - - -
Metric 0.928 0.884 0.102 0.155 - - - -
Scalar 0.851 0.862 0.112 0.165 0.077 0.022 -0.010 -0.010
Source: OECD, TALIS 2018 database.

379
TALIS 2018 TECHNICAL REPORT © OECD 2019
Table 11.124. Invariance test results for scale T3PJSPRO
CFI TLI RMSEA SRMR Δ CFI Δ TLI Δ RMSEA Δ SRMR
Invariance level for ISCED level 2
Configural 0.997 0.980 0.040 0.015
Metric 0.944 0.914 0.081 0.131 0.053 0.066 -0.041 -0.116
Scalar 0.681 0.721 0.146 0.241 0.263 0.193 -0.065 -0.110
Invariance level for ISCED level 1
Configural 0.997 0.984 0.037 0.015
Metric 0.938 0.901 0.092 0.151 0.059 0.083 -0.055 -0.136
Scalar 0.701 0.726 0.153 0.226 0.237 0.175 -0.061 -0.075
Invariance level for ISCED level 3
Configural 0.996 0.976 0.041 0.015
Metric 0.984 0.975 0.042 0.088 0.012 0.001 -0.001 -0.073
Scalar 0.831 0.843 0.105 0.120 0.153 0.132 -0.063 -0.032
Source: OECD, TALIS 2018 database.
Table 11.125. Invariance test results for scale T3PWLOAD
CFI TLI RMSEA SRMR Δ CFI Δ TLI Δ RMSEA Δ SRMR
Invariance level for ISCED level 2
Configural 1.000 1.000 0.000 0.004
Metric 0.924 0.883 0.097 0.086 0.076 0.117 -0.097 -0.082
Scalar 0.283 0.450 0.209 0.204 0.641 0.433 -0.112 -0.118
Invariance level for ISCED level 1
Configural 1.000 1.000 0.000 0.000
Metric 0.968 0.948 0.064 0.057 0.032 0.052 -0.064 -0.057
Scalar 0.203 0.353 0.228 0.204 0.765 0.595 -0.164 -0.147
Invariance level for ISCED level 3
Configural 1.000 1.000 0.000 0.000
Metric 0.947 0.913 0.080 0.070 0.053 0.087 -0.080 -0.070
Scalar 0.530 0.612 0.168 0.112 0.417 0.301 -0.088 -0.042
Source: OECD, TALIS 2018 database.
Table 11.126. Standardised factor loadings and unstandardised intercepts for
scale T3PJSENV
Participating countries/economies
Standardised factor loadings Unstandardised intercepts
TC3G44E TC3G44G TC3G44I TC3G44J TC3G44E TC3G44G TC3G44I TC3G44J
ISCED level 2
Alberta (Canada) 0.880 0.830 0.453 0.595 3.526 3.528 3.265 3.279
Australia1 0.508 0.846 0.343 0.554 3.584 3.596 3.168 3.337
Austria 0.982 0.410 0.299 0.366 3.821 3.554 3.385 3.497
Belgium 0.805 0.604 0.493 0.422 3.496 3.433 2.962 3.157
Flemish Community (Belgium)
0.831 0.676 0.399 0.456 3.427 3.479 2.989 3.136
Brazil 0.761 0.747 0.459 0.588 3.613 3.539 3.215 3.305
Bulgaria 0.773 0.755 0.580 0.707 3.420 3.381 3.227 3.195
Ciudad Autónoma de Buenos Aires (Argentina)
0.708 0.687 0.355 0.465 3.527 3.513 3.291 3.348
Chile 0.695 0.771 0.499 0.614 3.640 3.647 3.378 3.546
Colombia 0.980 0.454 0.339 0.457 3.755 3.778 3.607 3.750

380
TALIS 2018 TECHNICAL REPORT © OECD 2019
Participating countries/economies
Standardised factor loadings Unstandardised intercepts
TC3G44E TC3G44G TC3G44I TC3G44J TC3G44E TC3G44G TC3G44I TC3G44J
Croatia 0.798 0.720 0.499 0.563 3.435 3.518 3.228 3.314
Cyprus 0.958 0.731 0.416 0.603 3.297 3.299 3.282 3.404
Czech Republic 0.901 0.591 0.308 0.562 3.498 3.522 3.108 3.191
Denmark 0.941 0.651 0.200 0.592 3.718 3.725 3.451 3.554
England (United Kingdom)
0.782 0.746 0.231 0.499 3.652 3.693 3.197 3.273
Estonia 0.844 0.723 0.408 0.534 3.422 3.498 2.982 3.249
Finland 0.799 0.697 0.465 0.601 3.281 3.482 3.176 3.201
France 0.861 0.796 0.349 0.543 3.378 3.302 3.100 3.212
Georgia 0.688 0.861 0.517 0.736 3.445 3.306 3.022 3.224
Hungary 0.737 0.784 0.216 0.376 3.764 3.580 3.110 3.184
Iceland 0.678 0.799 0.212 0.279 3.538 3.624 3.183 3.237
Israel 0.790 0.866 0.522 0.648 3.615 3.575 3.380 3.507
Italy 0.743 0.905 0.539 0.331 3.354 3.182 3.105 3.137
Japan 0.779 0.642 0.480 0.771 3.109 3.210 2.651 3.092
Kazakhstan 0.506 0.625 0.573 0.490 3.514 3.335 3.153 3.263
Korea 0.791 0.784 0.702 0.708 3.377 3.305 3.285 3.408
Latvia 0.750 0.601 0.358 0.224 3.677 3.409 3.058 3.116
Lithuania 0.707 0.738 0.319 0.461 3.643 3.475 3.135 3.249
Malta 0.965 0.577 0.421 0.622 3.400 3.616 3.247 3.265
Mexico 0.767 0.696 0.559 0.664 3.660 3.558 3.567 3.664
Netherlands 0.859 0.814 0.515 0.698 3.622 3.487 3.227 3.420
New Zealand 0.862 0.991 0.146 0.044 3.395 3.394 3.135 3.250
Norway 0.780 0.618 0.251 0.539 3.629 3.613 3.023 3.308
Portugal 0.686 0.848 0.377 0.386 3.734 3.697 3.278 3.292
Romania 0.707 0.880 0.484 0.701 3.614 3.493 3.327 3.355
Russian Federation 0.729 0.714 0.331 0.277 3.531 3.423 2.978 3.160
Saudi Arabia 0.843 0.529 0.269 0.456 3.158 3.066 3.472 3.364
Shanghai (China) 0.757 0.686 0.637 0.790 3.050 3.313 3.280 3.252
Singapore 0.789 0.803 0.538 0.705 3.651 3.535 3.389 3.595
Slovak Republic 0.491 0.676 0.430 0.369 3.459 3.455 3.036 3.114
Slovenia 0.694 0.693 0.175 0.481 3.323 3.411 3.179 3.279
South Africa2 1.008 0.605 0.600 0.400 3.276 3.150 2.969 3.132
Spain 0.752 0.642 0.434 0.557 3.688 3.750 3.355 3.459
Sweden 0.838 0.780 0.386 0.581 3.622 3.589 3.285 3.281
Chinese Taipei 0.815 0.753 0.647 0.664 3.338 3.363 3.199 3.247
Turkey 0.744 0.767 0.443 0.655 3.277 3.144 3.333 3.241
United Arab Emirates 0.770 0.768 0.591 0.747 3.524 3.407 3.417 3.459
United States 0.604 0.709 0.486 0.771 3.724 3.542 3.274 3.389
Viet Nam 0.745 0.853 0.480 0.496 3.333 3.332 3.240 3.315
ISCED level 1
Australia1 0.816 0.785 0.548 0.648 3.516 3.612 3.262 3.379
Flemish Community (Belgium)
0.861 0.652 0.408 0.477 3.427 3.479 2.989 3.136
Ciudad Autónoma de Buenos Aires (Argentina)
0.748 0.793 0.413 0.567 3.527 3.513 3.291 3.348
Denmark 0.814 0.585 0.182 0.589 3.718 3.725 3.451 3.554
England (United Kingdom)
0.848 0.786 0.302 0.579 3.652 3.693 3.197 3.273
France 0.806 0.778 0.341 0.528 3.547 3.455 3.070 3.043
Japan 0.598 0.561 0.438 0.667 3.109 3.210 2.651 3.092
Korea 0.562 0.553 0.567 0.515 3.391 3.026 3.386 3.380

381
TALIS 2018 TECHNICAL REPORT © OECD 2019
Participating countries/economies
Standardised factor loadings Unstandardised intercepts
TC3G44E TC3G44G TC3G44I TC3G44J TC3G44E TC3G44G TC3G44I TC3G44J
Netherlands1 0.710 0.613 0.478 0.677 3.531 3.535 3.143 3.311
Spain 0.735 0.518 0.455 0.555 3.634 3.597 3.465 3.469
Sweden 0.734 0.666 0.380 0.534 3.622 3.589 3.285 3.281
Chinese Taipei 0.801 0.840 0.631 0.703 3.338 3.363 3.199 3.247
Turkey 0.780 0.816 0.474 0.684 3.277 3.144 3.333 3.241
United Arab Emirates 0.721 0.704 0.553 0.705 3.524 3.407 3.417 3.459
Viet Nam 0.735 0.807 0.558 0.542 3.333 3.332 3.240 3.315
ISCED level 3
Alberta (Canada) 0.766 0.724 0.310 0.413 3.526 3.528 3.265 3.279
Brazil 0.758 0.758 0.429 0.540 3.613 3.539 3.215 3.305
Croatia 0.764 0.842 0.593 0.734 3.435 3.518 3.228 3.314
Denmark 0.926 0.842 0.252 0.826 3.718 3.725 3.451 3.554
Portugal 0.558 0.699 0.382 0.348 3.734 3.697 3.278 3.292
Slovenia 0.794 0.793 0.247 0.650 3.323 3.411 3.179 3.279
Sweden3 - - - - - - - -
Chinese Taipei 0.718 0.769 0.574 0.617 3.338 3.363 3.199 3.247
Turkey 0.713 0.689 0.447 0.690 3.277 3.144 3.333 3.241
United Arab Emirates 0.694 0.696 0.556 0.721 3.524 3.407 3.417 3.459
Viet Nam 0.788 0.796 0.523 0.545 3.333 3.332 3.240 3.315
TALIS-PISA link
Australia 0.916 0.783 0.350 0.696 3.657 3.657 3.292 3.358
Ciudad Autónoma de Buenos Aires (Argentina)
0.878 0.679 0.318 0.387 3.639 3.709 3.350 3.403
Colombia 0.702 0.726 0.823 0.744 3.734 3.730 3.512 3.763
Czech Republic 0.890 0.538 0.295 0.538 3.483 3.327 3.054 3.128
Denmark 0.919 0.897 0.333 0.822 3.595 3.610 3.288 3.398
Georgia 0.679 0.883 0.224 0.433 3.508 3.512 3.105 3.291
Malta 0.888 0.533 0.470 0.704 3.461 3.668 3.242 3.311
Turkey 0.731 0.489 0.661 0.565 3.550 3.269 3.570 3.413
Viet Nam 0.137 0.790 0.596 0.635 3.253 3.276 3.211 3.377
1. Data from the participating country/economy was rated as insufficient during the adjudication process.
2. Participating country/economy with late data collection.
3. This participating country/economy was excluded from this scale.
Source: OECD, TALIS 2018 database.
Table 11.127. Standardised factor loadings and unstandardised intercepts for
scale T3PJSPRO
Participating countries/economies
Standardised factor loadings Unstandardised intercepts
TC3G44A TC3G44B TC3G44D TC3G44F TC3G44A TC3G44B TC3G44D TC3G44F
ISCED level 2
Alberta (Canada) 0.810 1.031 0.293 0.576 3.383 3.395 3.514 3.186
Australia1 0.692 0.887 0.578 0.338 3.451 3.408 3.552 3.425
Austria 0.717 0.913 0.577 0.514 3.353 3.383 3.582 3.703
Belgium 0.493 0.846 0.692 0.540 2.525 3.080 3.414 3.202
Flemish Community (Belgium)
0.544 0.780 0.726 0.641 2.639 3.061 3.420 3.064
Brazil 0.636 0.860 0.417 0.439 2.927 3.336 3.571 3.308
Bulgaria 0.536 0.984 0.652 0.629 2.280 2.720 3.102 2.821
Ciudad Autónoma de Buenos Aires (Argentina)
0.755 0.988 0.595 0.536 3.173 3.427 3.555 3.513

382
TALIS 2018 TECHNICAL REPORT © OECD 2019
Participating countries/economies
Standardised factor loadings Unstandardised intercepts
TC3G44A TC3G44B TC3G44D TC3G44F TC3G44A TC3G44B TC3G44D TC3G44F
Chile 0.764 0.531 0.461 0.338 3.344 3.583 3.694 3.668
Colombia 0.335 1.536 0.206 0.171 3.550 3.752 3.697 3.518
Croatia 0.627 0.910 0.449 0.412 2.828 3.052 3.441 3.152
Cyprus 0.569 1.164 0.335 0.418 3.287 3.318 3.342 3.267
Czech Republic 0.701 0.638 0.607 0.559 2.751 3.177 3.555 3.241
Denmark 0.744 0.974 0.514 0.476 3.548 3.519 3.713 3.322
England (United Kingdom)
0.809 0.919 0.578 0.657 3.148 3.208 3.355 3.020
Estonia 0.529 0.820 0.493 0.475 3.074 3.227 3.786 3.370
Finland 0.720 0.978 0.510 0.606 3.335 3.253 3.541 3.135
France 0.545 0.887 0.638 0.694 2.709 3.271 3.613 3.378
Georgia 0.696 0.837 0.247 0.099 3.189 3.262 3.389 2.884
Hungary 0.626 1.009 0.477 0.360 3.112 3.246 3.605 3.149
Iceland 0.863 0.793 0.677 0.634 3.387 3.108 3.441 3.043
Israel 0.738 0.631 0.610 0.601 3.382 3.406 3.597 3.400
Italy 0.664 0.870 0.755 0.735 2.546 3.070 3.304 3.106
Japan 0.543 0.874 0.543 0.512 2.714 2.697 3.539 3.275
Kazakhstan 0.293 0.591 0.371 0.738 2.937 3.124 3.383 3.301
Korea 0.843 0.968 0.646 0.570 3.145 3.195 3.422 3.218
Latvia 0.436 0.848 0.624 0.599 2.653 3.092 3.373 3.051
Lithuania 0.657 1.007 0.538 -0.424 3.278 3.186 3.444 1.973
Malta 0.704 0.764 0.772 0.726 2.694 3.045 3.329 2.799
Mexico 0.768 0.858 0.336 0.410 3.473 3.675 3.715 3.552
Netherlands 0.679 1.021 0.459 0.442 3.403 3.327 3.706 3.445
New Zealand 0.715 0.762 0.668 0.746 3.033 3.129 3.429 3.014
Norway 0.832 0.902 0.275 0.708 3.195 3.261 3.388 3.121
Portugal 0.644 0.862 0.489 0.490 3.020 3.208 3.555 3.228
Romania 0.447 0.942 0.615 0.363 2.557 3.032 3.425 3.431
Russian Federation 0.504 0.975 0.567 0.474 2.904 3.112 3.362 3.498
Saudi Arabia 0.556 0.872 0.468 0.435 2.475 2.724 2.980 2.559
Shanghai (China) 0.527 0.950 0.508 0.360 2.570 2.822 3.209 3.087
Singapore 0.728 0.614 0.358 0.641 3.655 3.635 3.683 3.434
Slovak Republic 0.484 0.702 0.604 0.484 2.556 3.175 3.355 2.995
Slovenia 0.636 0.867 0.420 0.439 2.992 3.175 3.470 3.319
South Africa2 0.744 0.649 0.372 0.356 2.964 2.902 3.405 2.769
Spain 0.612 1.090 0.303 0.298 3.233 3.393 3.514 3.612
Sweden 0.882 0.968 0.572 0.534 3.250 3.170 3.625 3.118
Chinese Taipei 0.623 0.923 0.459 0.426 2.873 3.091 3.347 2.712
Turkey 0.692 0.836 0.363 0.536 2.867 3.123 3.225 2.907
United Arab Emirates 0.765 0.948 0.458 0.523 3.291 3.333 3.614 3.341
United States 0.769 0.915 0.506 0.357 3.231 3.300 3.750 3.438
Viet Nam 0.552 0.926 0.453 0.375 3.112 3.351 3.587 3.282
ISCED level 1
Australia1 0.798 0.929 0.400 0.541 3.399 3.419 3.540 3.180
Flemish Community (Belgium)
0.505 0.793 0.813 0.604 2.639 3.061 3.420 3.064
Ciudad Autónoma de Buenos Aires (Argentina)
0.480 0.847 0.677 0.846 3.113 3.460 3.508 3.472
Denmark 0.794 0.975 0.537 0.420 3.548 3.519 3.713 3.322
England (United Kingdom)
0.758 0.879 0.564 0.521 3.148 3.208 3.355 3.020
France 0.545 0.836 0.567 0.621 2.709 3.271 3.613 3.378

383
TALIS 2018 TECHNICAL REPORT © OECD 2019
Participating countries/economies
Standardised factor loadings Unstandardised intercepts
TC3G44A TC3G44B TC3G44D TC3G44F TC3G44A TC3G44B TC3G44D TC3G44F
Japan 0.537 0.842 0.580 0.486 2.714 2.697 3.539 3.275
Korea 0.697 0.850 0.539 0.410 3.145 3.195 3.422 3.218
Netherlands1 0.755 0.777 0.492 0.682 3.198 3.134 3.576 3.312
Spain 0.629 1.086 0.311 0.347 3.233 3.393 3.514 3.612
Sweden 0.882 0.947 0.619 0.565 3.250 3.170 3.625 3.118
Chinese Taipei 0.649 0.980 0.500 0.410 2.873 3.091 3.347 2.712
Turkey 0.679 0.949 0.420 0.500 2.867 3.123 3.225 2.907
United Arab Emirates 0.755 0.926 0.475 0.497 3.291 3.333 3.614 3.341
Viet Nam 0.509 0.854 0.436 0.419 3.112 3.351 3.587 3.282
ISCED level 3
Alberta (Canada) 0.731 0.923 0.510 0.445 3.383 3.395 3.514 3.186
Brazil 0.589 0.868 0.480 0.440 2.927 3.336 3.571 3.308
Croatia 0.677 0.942 0.469 0.490 2.828 3.052 3.441 3.152
Denmark 0.837 0.907 0.634 0.509 3.548 3.519 3.713 3.322
Portugal 0.676 0.928 0.458 0.509 3.020 3.208 3.555 3.228
Slovenia 0.715 0.822 0.356 0.478 2.992 3.175 3.470 3.319
Sweden 0.813 0.854 0.536 0.394 3.250 3.170 3.625 3.118
Chinese Taipei 0.701 0.956 0.509 0.464 2.873 3.091 3.347 2.712
Turkey 0.552 0.795 0.356 0.418 2.867 3.123 3.225 2.907
United Arab Emirates 0.747 0.938 0.476 0.519 3.291 3.333 3.614 3.341
Viet Nam 0.457 0.768 0.367 0.369 3.112 3.351 3.587 3.282
TALIS-PISA link
Australia 0.729 0.970 0.486 0.461 3.438 3.429 3.533 3.205
Ciudad Autónoma de Buenos Aires (Argentina)
0.729 0.763 0.404 0.528 3.160 3.548 3.626 3.439
Colombia 0.628 0.901 0.518 0.741 3.550 3.688 3.768 3.705
Czech Republic 0.477 1.188 0.328 0.381 2.811 3.168 3.549 3.273
Denmark 0.742 0.944 0.627 0.585 3.504 3.444 3.603 3.227
Georgia 0.565 1.183 0.304 0.318 3.338 3.319 3.466 3.051
Malta 0.662 0.724 0.762 0.684 2.778 3.140 3.380 2.942
Turkey 0.731 0.926 0.689 0.655 2.897 3.347 3.389 3.165
Viet Nam 0.691 1.014 0.626 0.659 3.129 3.379 3.509 3.364
1. Data from the participating country/economy was rated as insufficient during the adjudication process.
2. Participating country/economy with late data collection.
Source: OECD, TALIS 2018 database.
Table 11.128. Standardised factor loadings and unstandardised intercepts for the scale
T3PWLOAD
Participating countries/economies Standardised factor loadings Unstandardised intercepts
TC3G43A TC3G43B TC3G43C TC3G43A TC3G43B TC3G43C
ISCED level 2
Alberta (Canada) 0.611 0.993 0.448 1.856 2.546 1.825
Australia1 0.703 0.619 0.504 1.745 2.985 1.684
Austria 0.523 0.616 0.547 1.977 3.324 2.300
Belgium 0.231 0.830 0.450 2.328 3.281 2.725
Flemish Community (Belgium) 0.370 0.701 0.306 2.440 3.508 2.830
Brazil 0.606 0.922 0.484 2.454 2.777 2.869
Bulgaria 0.595 0.582 0.613 2.096 3.149 2.079
Ciudad Autónoma de Buenos Aires (Argentina)
0.536 0.766 0.474 2.008 2.661 2.427

384
TALIS 2018 TECHNICAL REPORT © OECD 2019
Participating countries/economies Standardised factor loadings Unstandardised intercepts
TC3G43A TC3G43B TC3G43C TC3G43A TC3G43B TC3G43C
Chile 0.482 0.760 0.702 2.055 2.766 2.287
Colombia 0.696 0.749 0.729 2.587 2.933 3.068
Croatia 0.512 0.991 0.466 2.177 3.252 2.453
Cyprus 0.600 0.816 0.510 2.401 2.775 2.275
Czech Republic 0.610 0.254 0.413 1.939 3.632 2.271
Denmark 0.507 0.659 0.385 1.886 2.970 2.235
England (United Kingdom) 0.603 0.769 0.373 1.934 2.956 2.273
Estonia 0.614 0.805 0.638 1.928 2.692 2.267
Finland 0.429 0.943 0.378 1.671 2.908 2.333
France 0.509 0.992 0.425 2.037 3.241 2.826
Georgia 0.918 0.696 0.468 2.115 2.290 1.845
Hungary 0.683 0.534 0.396 1.954 3.256 1.923
Iceland 0.572 0.373 0.313 1.595 2.815 2.935
Israel 0.550 0.665 0.490 2.494 2.978 2.513
Italy 0.491 0.431 0.676 2.132 3.420 2.418
Japan 0.587 0.993 0.500 2.432 2.547 1.615
Kazakhstan 0.621 0.735 0.544 1.744 2.403 1.754
Korea 0.677 0.994 0.602 2.203 2.487 1.779
Latvia 0.466 0.520 0.361 2.672 3.185 2.614
Lithuania 0.824 0.603 0.425 2.252 2.967 2.325
Malta 0.456 0.531 0.471 2.254 3.154 1.945
Mexico 0.481 0.562 0.914 1.732 2.543 2.330
Netherlands 0.534 0.711 0.311 1.538 2.513 1.675
New Zealand 0.484 0.877 0.463 1.978 2.823 1.854
Norway 0.294 0.669 0.481 2.038 2.850 2.184
Portugal
Romania 0.630 0.839 0.682 2.241 2.984 2.585
Russian Federation 0.465 0.742 0.778 1.845 2.746 2.132
Saudi Arabia 0.658 0.698 0.789 2.338 3.042 2.659
Shanghai (China) 0.547 0.644 0.308 2.665 2.743 1.782
Singapore 0.702 0.781 0.474 1.746 1.980 1.396
Slovak Republic 0.297 0.699 0.348 2.310 3.319 2.238
Slovenia 0.529 0.814 0.496 2.245 3.221 2.516
South Africa2 0.579 0.545 0.462 2.395 3.186 2.496
Spain 0.435 0.720 0.346 2.079 3.317 1.961
Sweden
Chinese Taipei 0.595 0.776 0.478 2.102 2.543 1.770
Turkey 0.608 0.822 0.451 2.120 2.580 1.832
United Arab Emirates 0.518 0.816 0.454 2.004 2.250 1.914
United States 0.677 0.994 0.103 2.453 2.740 1.767
Viet Nam 0.606 0.824 0.494 2.372 2.741 2.165
ISCED level 1
Australia1 0.689 0.528 0.570 2.009 3.122 1.940
Flemish Community (Belgium) 0.328 0.626 0.276 2.440 3.508 2.830
Ciudad Autónoma de Buenos Aires (Argentina)
0.488 0.707 0.392 1.773 2.588 2.640
Denmark 0.534 0.799 0.460 1.886 2.970 2.235
England (United Kingdom) 0.510 0.792 0.373 1.934 2.956 2.273
France 0.235 0.573 0.207 1.797 3.473 2.724
Japan 0.604 0.994 0.493 2.432 2.547 1.615
Korea 0.600 0.870 0.574 2.203 2.487 1.779

385
TALIS 2018 TECHNICAL REPORT © OECD 2019
Participating countries/economies Standardised factor loadings Unstandardised intercepts
TC3G43A TC3G43B TC3G43C TC3G43A TC3G43B TC3G43C
Netherlands1 0.223 0.803 0.442 1.661 2.922 2.016
Spain 0.377 0.645 0.305 2.079 3.317 1.961
Sweden 0.436 0.739 0.327 1.919 3.270 2.481
Chinese Taipei 0.615 0.770 0.486 2.102 2.543 1.770
Turkey 0.629 0.857 0.544 2.120 2.580 1.832
United Arab Emirates 0.509 0.772 0.441 2.004 2.250 1.914
Viet Nam 0.567 0.851 0.512 2.372 2.741 2.165
ISCED level 3
Alberta (Canada) 0.477 0.683 0.360 2.047 2.611 2.060
Brazil 0.583 0.994 0.489 2.510 2.933 2.852
Croatia 0.381 0.625 0.351 2.325 3.041 2.323
Denmark 0.685 0.714 0.448 1.886 2.970 2.235
Portugal 0.547 0.992 0.462 2.557 3.366 2.793
Slovenia 0.571 0.992 0.482 2.245 3.221 2.516
Sweden 0.469 0.646 0.313 2.044 2.991 2.316
Chinese Taipei 0.587 0.751 0.467 2.102 2.543 1.770
Turkey 0.568 0.715 0.482 2.120 2.580 1.832
United Arab Emirates 0.519 0.816 0.452 2.004 2.250 1.914
Viet Nam 0.496 0.753 0.433 2.372 2.741 2.165
TALIS-PISA link
Australia 0.628 0.660 0.450 1.928 3.080 1.818
Ciudad Autónoma de Buenos Aires (Argentina)
0.564 0.484 0.523 1.892 2.780 2.059
Colombia 0.675 0.866 0.528 2.609 3.153 3.007
Czech Republic 0.389 0.681 0.329 1.916 3.589 2.263
Denmark 0.683 0.445 0.643 2.100 2.669 2.230
Georgia 0.786 0.911 0.488 2.072 2.237 1.763
Malta 0.397 0.646 0.462 2.316 3.138 1.983
Turkey 0.889 0.496 0.457 2.246 2.656 1.782
Viet Nam 0.750 0.725 0.721 2.248 2.559 2.020
1. Data from the participating country/economy was rated as insufficient during the adjudication process.
2. Participating country/economy with late data collection.
Source: OECD, TALIS 2018 database.
School leadership: School leadership (T3PLEADS); Participation among
stakeholders (T3PLEADP)
11.65. Measured items
Two scales concerning school leadership were developed from these question stems:
“Please indicate how frequently you engaged in the following activities in this
school during the last 12 months” (TC3G22), which was followed by items
regarding principals’ actions that were used to form the scale School leadership
(T3PLEADS).
“How strongly do you agree or disagree with these statements as applied to this
school?” (TC3G26), which was followed by items about school decision making
that were used for the scale Participation among stakeholders (T3PLEADP).
Table 11.129 provides information on these scales.

386
TALIS 2018 TECHNICAL REPORT © OECD 2019
11.66. Scale reliability
Table 11.130 presents the reliability for each scale, both of which show high reliability
coefficients for nearly all populations. The Hungary ISCED level 2 population is the only
population with a low omega coefficient for the scale T3PLEADS. Acceptable reliability
is evident for the T3PLEADP scale for the following populations: the Czech Republic,
Denmark, Finland, Italy, Singapore, the Slovak Republic and Sweden ISCED level 2;
Denmark, France, and the Netherlands ISCED level 1; Denmark and Sweden ISCED level
3; and Turkey TALIS-PISA link. The Japan ISCED level 2 and the Flemish Community
(Belgium) ISCED level 1 populations exhibit low reliability for this scale.
11.67. Model fits
Table 11.131 presents the model fit indices for the scale T3PLEADS. Because this scale
has just three items, all populations not receiving fixed parameters exhibit a perfect model
fit. The fit is poor, however, for the Australia ISCED level 1 population and the Georgia,
Turkey and Viet Nam TALIS-PISA link populations.
The results for the scale T3PLEADP are presented in Table 11.132. Here, a fair number of
populations exhibit poor model fit, including the Australia, Columbia, Cyprus,Error!
Bookmark not defined. Czech Republic, Denmark, Iceland, Italy, Mexico, Singapore and
Slovak Republic ISCED level 2 populations; the Denmark, France, Netherlands, Turkey
and Viet Nam ISCED level 1 populations; and the Slovenia ISCED level 3 and the Ciudad
Autónoma de Buenos Aires (Argentina), Columbia, Czech Republic, Denmark and Georgia
TALIS-PISA link populations.
11.68. Invariance testing
As is evident in Table 11.133, the T3PLEADS scale reached the metric invariance level for
ISCED levels 1 and 2 and scalar invariance for ISCED level 3. ISCED level 3 can be
deemed scalar invariant because the fit indices are acceptable. Many within-country
invariance results are also scalar (see, for comparative purposes, scale T3EFFPD from the
teacher questionnaire).
Table 11.134 presents the results from the measurement invariance testing for the scale
T3PLEADP. Here it can be seen that the scale reaches metric invariance for all ISCED
levels because the metric model fit indices are more favourable than those in the configural
model.
11.69. Item parameters
Table 11.135 presents the unstandardised factor loadings for scales T3PLEADS and
T3PLEADP, while Table 11.136 presents the standardised factor loadings and the
unstandardised intercepts for scale T3PLEADS. Most of the factor loadings are strong for
each item in all populations. While item TC3G22D has the largest number of moderate
strength factor loadings, they are nonetheless few.
Table 11.137 presents the standardised factor loadings and unstandardised intercepts for
the scale T3PLEADP. The factor loadings for items TC3G26B and TC3G26C are strong
in almost all populations, but one weak factor loading is evident for the Netherlands ISCED
level 1 population on item TC3G26B. A mix of moderate to strong factor loadings can be
observed for item TC3G26A. Factor loadings for item TC3G26D are moderate to low in
many populations. Nearly all the factor loadings for item TC3G26F are weak. The
Shanghai (China) ISCED level 2 and Turkey ISCED level 1 and 2 populations are the only

387
TALIS 2018 TECHNICAL REPORT © OECD 2019
ones to exhibit factor loadings above 0.450, a pattern that suggests only a moderate
relationship with the latent construct.
Table 11.129. Item wording for school leadership
T3PLEADS: School leadership
TC3G22: Please indicate how frequently you engaged in the following activities in this school during the last 12 months.
Response options: “Never or rarely” (1), “Sometimes” (2), “Often” (3), Very often” (4).
TC3G22D I took actions to support co-operation among teachers to develop new teaching practices
TC3G22E I took actions to ensure that teachers take responsibility for improving their teaching skills
TC3G22F I took actions to ensure that teachers feel responsible for their students’ learning outcomes
T3PLEADP: Participation among stakeholders, principals
TC3G26: How strongly do you agree or disagree with these statements as applied to this school?
Response options: “Strongly disagree” (1), “Disagree” (2), “Agree” (3), “Strongly agree” (4).
TC3G26A This school provides staff with opportunities to actively participate in school decisions
TC3G26B This school provides parents or guardians with opportunities to actively participate in school decisions
TC3G26C This school provides students with opportunities to actively participate in school decisions
TC3G26D This school has a culture of shared responsibility for school issues
TC3G26F There is a collaborative school culture which is characterised by mutual support
Source: OECD, TALIS 2018 database.
Table 11.130. Omega coefficients for the school leadership scales
Participating countries/economies T3PLEADS T3PLEADP
Omega coefficient
ISCED level 2
Alberta (Canada) 0.929 0.796
Australia1 0.962 0.852
Austria 0.846 0.753
Belgium 0.778 0.803
Flemish Community (Belgium) 0.835 0.781
Brazil 0.859 0.884
Bulgaria 0.771 0.709
Ciudad Autónoma de Buenos Aires (Argentina) 0.828 0.815
Chile 0.867 0.887
Colombia 0.906 0.887
Croatia 0.823 0.887
Cyprus 0.899 0.874
Czech Republic 0.736 0.650
Denmark 0.910 0.663
England (United Kingdom) 0.943 0.726
Estonia 0.834 0.805
Finland 0.755 0.696
France 0.819 0.854
Georgia 0.780 0.887
Hungary 0.558 0.845
Iceland 0.841 0.701
Israel 0.912 0.778
Italy 0.884 0.681
Japan 0.746 0.599
Kazakhstan 0.702 0.752
Korea 0.916 0.828

388
TALIS 2018 TECHNICAL REPORT © OECD 2019
Participating countries/economies T3PLEADS T3PLEADP
Omega coefficient
Latvia 0.728 0.797
Lithuania 0.743 0.874
Malta 0.916 0.773
Mexico 0.835 0.774
Netherlands 0.845 0.755
New Zealand 0.884 0.778
Norway 0.814 0.769
Portugal 0.856 0.852
Romania 0.865 0.878
Russian Federation 0.750 0.927
Saudi Arabia 0.848 0.839
Shanghai (China) 0.922 0.899
Singapore 0.889 0.663
Slovak Republic 0.790 0.656
Slovenia 0.821 0.805
South Africa2, 3 0.819 -
Spain 0.817 0.908
Sweden 0.810 0.602
Chinese Taipei 0.814 0.701
Turkey 0.826 0.885
United Arab Emirates 0.901 0.889
United States 0.920 0.736
Viet Nam 0.733 0.796
ISCED level 1
Australia1 0.920 0.835
Flemish Community (Belgium) 0.870 0.561
Ciudad Autónoma de Buenos Aires (Argentina) 0.867 0.812
Denmark 0.880 0.621
England (United Kingdom) 0.914 0.814
France 0.895 0.669
Japan 0.714 0.712
Korea 0.978 0.835
Netherlands1 0.801 0.677
Spain 0.823 0.794
Sweden 0.776 0.834
Chinese Taipei 0.874 0.755
Turkey 0.876 0.922
United Arab Emirates 0.914 0.854
Viet Nam 0.746 0.740
ISCED level 3
Alberta (Canada) 0.856 0.785
Brazil 0.885 0.870
Croatia 0.906 0.845
Denmark 0.906 0.616
Portugal 0.854 0.738
Slovenia 0.778 0.759
Sweden 0.741 0.635
Chinese Taipei 0.803 0.856
Turkey 0.808 0.848
United Arab Emirates 0.914 0.863
Viet Nam 0.704 0.778

389
TALIS 2018 TECHNICAL REPORT © OECD 2019
Participating countries/economies T3PLEADS T3PLEADP
Omega coefficient
TALIS-PISA link
Australia 0.933 0.806
Ciudad Autónoma de Buenos Aires (Argentina) 0.812 0.712
Colombia 0.870 0.912
Czech Republic 0.815 0.846
Denmark 0.845 0.740
Georgia 0.841 0.882
Malta 0.897 0.787
Turkey 0.880 0.682
Viet Nam 0.884 0.960
1. Data from the participating country/economy was rated as insufficient during the adjudication process.
2. Participating country/economy with late data collection.
3. This participating country/economy’s reliability coefficient estimation failed in the final scale model due to
a negative residual variance for one or more items that could not be corrected; this country/economy has
untrustworthy scale scores for the corresponding ISCED level.
Source: OECD, TALIS 2018 database.
Table 11.131. CFA model-data fit for scale T3PLEADS
School leadership
Participating countries/economies CFI TLI RMSEA SRMR
ISCED level 2
Australia1 0.994 0.994 0.024 0.180
ISCED level 1
Australia1 0.880 0.880 0.131 0.314
Netherlands1 1.000 1.008 0.000 0.137
TALIS-PISA link
Australia 0.999 0.999 0.013 0.079
Ciudad Autónoma de Buenos Aires (Argentina) 0.982 0.982 0.054 0.169
Colombia 1.000 1.025 0.000 0.118
Czech Republic 1.000 1.036 0.000 0.133
Denmark 0.981 0.981 0.093 0.177
Georgia 0.828 0.828 0.114 0.340
Malta 1.000 1.099 0.000 0.074
Turkey 0.896 0.896 0.113 0.446
Viet Nam 0.352 0.352 0.213 1.357
1. Data from the participating country/economy was rated as insufficient during the adjudication process.
Source: OECD, TALIS 2018 database.
Table 11.132. CFA model-data fit for scale T3PLEADP
Participation among stakeholders
Participating countries/economies CFI TLI RMSEA SRMR
ISCED level 2
Alberta (Canada) 0.947 0.868 0.111 0.039
Australia1 0.877 0.846 0.072 0.138
Austria 0.999 0.999 0.011 0.025
Belgium 0.940 0.851 0.115 0.044
Flemish Community (Belgium) 0.934 0.834 0.109 0.046

390
TALIS 2018 TECHNICAL REPORT © OECD 2019
Participating countries/economies CFI TLI RMSEA SRMR
Brazil 1.000 1.024 0.000 0.010
Bulgaria 0.953 0.882 0.075 0.040
Ciudad Autónoma de Buenos Aires (Argentina) 0.950 0.876 0.110 0.049
Chile 0.997 0.991 0.032 0.022
Colombia 0.888 0.719 0.144 0.045
Croatia 0.991 0.978 0.054 0.029
Cyprus 0.892 0.730 0.198 0.088
Czech Republic3 0.546 - 0.255 0.080
Denmark 0.877 0.693 0.141 0.058
England (United Kingdom) 0.983 0.956 0.053 0.030
Estonia 0.969 0.922 0.086 0.030
Finland 0.995 0.987 0.031 0.031
France 0.920 0.801 0.140 0.046
Georgia 0.961 0.902 0.104 0.036
Hungary 0.967 0.919 0.094 0.048
Iceland 0.840 0.600 0.189 0.062
Israel 1.000 1.061 0.000 0.016
Italy 0.859 0.648 0.138 0.050
Japan 0.972 0.929 0.048 0.047
Kazakhstan 0.949 0.873 0.075 0.043
Korea 0.972 0.929 0.080 0.038
Latvia 1.000 1.063 0.000 0.024
Lithuania 0.973 0.931 0.088 0.027
Malta 0.982 0.956 0.063 0.068
Mexico 0.792 0.479 0.193 0.054
Netherlands 0.992 0.980 0.045 0.022
New Zealand 0.957 0.891 0.062 0.037
Norway 0.928 0.820 0.084 0.055
Portugal 1.000 1.007 0.000 0.021
Romania 0.960 0.899 0.103 0.043
Russian Federation 0.921 0.803 0.142 0.061
Saudi Arabia 0.991 0.977 0.039 0.040
Shanghai (China) 0.988 0.970 0.066 0.022
Singapore3 0.502 - 0.234 0.057
Slovak Republic 0.690 0.224 0.181 0.074
Slovenia 0.981 0.952 0.068 0.040
South Africa2 0.998 0.997 0.015 0.131
Spain 0.929 0.822 0.078 0.038
Sweden 0.947 0.867 0.057 0.047
Chinese Taipei 0.939 0.849 0.104 0.050
Turkey 0.985 0.962 0.056 0.026
United Arab Emirates 0.960 0.900 0.120 0.039
United States 1.000 1.000 0.000 0.038
Viet Nam 0.922 0.805 0.133 0.050
ISCED level 1
Australia1 0.936 0.920 0.085 0.110
Flemish Community (Belgium) 0.919 0.797 0.082 0.044
Ciudad Autónoma de Buenos Aires (Argentina) 0.913 0.781 0.144 0.064
Denmark 0.849 0.623 0.162 0.082
England (United Kingdom) 0.973 0.932 0.093 0.026
France 0.819 0.548 0.148 0.057
Japan 0.921 0.803 0.107 0.047

391
TALIS 2018 TECHNICAL REPORT © OECD 2019
Participating countries/economies CFI TLI RMSEA SRMR
Korea 0.991 0.976 0.033 0.036
Netherlands1 0.383 0.229 0.162 0.397
Spain 0.987 0.968 0.032 0.025
Sweden 0.921 0.801 0.111 0.045
Chinese Taipei 0.929 0.822 0.118 0.044
Turkey 0.827 0.566 0.221 0.094
United Arab Emirates 0.977 0.944 0.091 0.031
Viet Nam 0.811 0.527 0.209 0.079
ISCED level 3
Alberta (Canada) 0.905 0.762 0.146 0.046
Brazil 0.952 0.880 0.099 0.038
Croatia 0.933 0.832 0.127 0.062
Denmark 1.000 1.015 0.000 0.045
Portugal 1.000 1.026 0.000 0.022
Slovenia 0.866 0.665 0.140 0.069
Sweden 0.979 0.948 0.040 0.035
Chinese Taipei 0.969 0.923 0.091 0.049
Turkey 0.920 0.799 0.092 0.045
United Arab Emirates 0.983 0.958 0.072 0.028
Viet Nam 0.960 0.899 0.082 0.032
TALIS-PISA link
Australia 0.940 0.933 0.072 0.202
Ciudad Autónoma de Buenos Aires (Argentina) 0.839 0.821 0.113 0.179
Colombia 0.876 0.862 0.124 0.215
Czech Republic 0.812 0.791 0.104 0.224
Denmark 0.271 0.190 0.206 0.466
Georgia 0.616 0.574 0.154 0.329
Malta 1.000 1.043 0.000 0.128
Turkey 1.000 1.042 0.000 0.143
Viet Nam 1.000 1.220 0.000 0.183
1. Data from the participating country/economy was rated as insufficient during the adjudication process.
2. Participating country/economy with late data collection.
3. The poor fit of the model affected the TLI calculation, which is not reported.
Source: OECD, TALIS 2018 database.
Table 11.133. Invariance test results for scale T3PLEADS
CFI TLI RMSEA SRMR Δ CFI Δ TLI Δ RMSEA Δ SRMR
Invariance level for ISCED level 2
Configural 1.000 1.000 0.000 0.000
Metric 0.993 0.989 0.044 0.088 0.007 0.011 -0.044 -0.088
Scalar 0.880 0.908 0.125 0.132 0.113 0.081 -0.081 -0.044
Invariance level for ISCED level 1
Configural 1.000 1.000 0.000 0.000
Metric 0.997 0.995 0.032 0.080 0.003 0.005 -0.032 -0.080
Scalar 0.910 0.927 0.120 0.125 0.087 0.068 -0.088 -0.045
Invariance level for ISCED level 3
Configural 1.000 1.000 0.000 0.000
Metric 0.996 0.994 0.035 0.076 0.004 0.006 -0.035 -0.076
Scalar 0.966 0.972 0.077 0.099 0.030 0.022 -0.042 -0.023
Source: OECD, TALIS 2018 database.

392
TALIS 2018 TECHNICAL REPORT © OECD 2019
Table 11.134. Invariance test results for scale T3PLEADP
CFI TLI RMSEA SRMR Δ CFI Δ TLI Δ RMSEA Δ SRMR
Invariance level for ISCED level 2
Configural 0.953 0.883 0.096 0.044
Metric 0.933 0.915 0.082 0.138 0.020 -0.032 0.014 -0.094
Scalar 0.744 0.784 0.131 0.199 0.189 0.131 -0.049 -0.061
Invariance level for ISCED level 1
Configural 0.928 0.819 0.115 0.051
Metric 0.905 0.876 0.096 0.130 0.023 -0.057 0.019 -0.079
Scalar 0.680 0.719 0.144 0.190 0.225 0.157 -0.048 -0.060
Invariance level for ISCED level 3
Configural 0.960 0.899 0.089 0.042
Metric 0.933 0.912 0.083 0.134 0.027 -0.013 0.006 -0.092
Scalar 0.727 0.757 0.138 0.214 0.206 0.155 -0.055 -0.080
Source: OECD, TALIS 2018 database.
Table 11.135. Unstandardised factor loadings for school leadership scales for all
participating countries/economies for all populations
T3PLEADS T3PLEADP
TC3G22D 0.476 TC3G26A 0.329
TC3G22E 0.597 TC3G26B 0.454
TC3G22F 0.499 TC3G26C 0.436
TC3G26D 0.282
TC3G26F 0.195
Source: OECD, TALIS 2018 database.
Table 11.136. Standardised factor loadings and unstandardised intercepts for
scale T3PLEADS
Participating countries/economies Standardised factor loadings Unstandardised intercepts
TC3G22D TC3G22E TC3G22F TC3G22D TC3G22E TC3G22F
ISCED level 2
Alberta (Canada) 0.790 0.949 0.842 2.798 2.801 2.929
Australia1 0.695 0.980 0.743 2.697 2.938 2.947
Austria 0.704 0.879 0.724 2.709 2.577 2.679
Belgium 0.608 0.822 0.677 2.554 2.516 2.545
Flemish Community (Belgium) 0.663 0.875 0.710 2.569 2.511 2.595
Brazil 0.736 0.887 0.746 2.798 2.801 2.929
Bulgaria 0.509 0.831 0.664 2.734 3.030 3.225
Ciudad Autónoma de Buenos Aires (Argentina)
0.723 0.849 0.729 2.748 2.741 2.784
Chile 0.757 0.890 0.761 3.049 3.107 3.182
Colombia 0.705 0.930 0.831 3.157 3.074 3.186
Croatia 0.695 0.845 0.735 2.798 2.801 2.929
Cyprus 0.766 0.917 0.829 2.699 2.699 2.783
Czech Republic 0.558 0.803 0.584 2.664 2.753 2.775
Denmark 0.704 0.939 0.785 2.798 2.801 2.929
England (United Kingdom) 0.711 0.965 0.805 2.648 2.829 3.043
Estonia 0.632 0.881 0.684 2.413 2.499 2.548

393
TALIS 2018 TECHNICAL REPORT © OECD 2019
Participating countries/economies Standardised factor loadings Unstandardised intercepts
TC3G22D TC3G22E TC3G22F TC3G22D TC3G22E TC3G22F
Finland 0.646 0.798 0.620 2.736 2.517 2.295
France 0.744 0.814 0.752 2.615 2.554 2.642
Georgia 0.599 0.832 0.648 2.819 2.977 3.159
Hungary 0.504 0.566 0.556 2.631 2.615 2.804
Iceland 0.632 0.887 0.693 2.591 2.591 2.667
Israel 0.655 0.945 0.758 2.812 2.858 2.991
Italy 0.717 0.919 0.712 2.765 2.683 2.680
Japan 0.620 0.767 0.687 2.302 2.454 2.287
Kazakhstan 0.520 0.740 0.663 3.211 3.201 3.392
Korea 0.682 0.942 0.825 2.583 2.694 2.709
Latvia 0.508 0.751 0.712 2.818 2.914 3.034
Lithuania 0.557 0.793 0.652 2.685 2.934 3.092
Malta 0.693 0.948 0.720 2.604 2.677 2.728
Mexico 0.724 0.851 0.760 2.899 3.062 3.248
Netherlands 0.556 0.891 0.725 2.294 2.891 2.941
New Zealand 0.705 0.914 0.781 2.664 2.796 2.916
Norway 0.654 0.846 0.719 2.727 2.511 2.844
Portugal 0.677 0.886 0.768 2.798 2.801 2.929
Romania 0.694 0.894 0.774 3.051 3.091 3.210
Russian Federation 0.556 0.795 0.673 2.366 3.013 3.108
Saudi Arabia 0.695 0.864 0.791 2.975 2.933 3.139
Shanghai (China) 0.751 0.945 0.817 3.133 3.185 3.214
Singapore 0.670 0.926 0.727 2.565 2.880 3.031
Slovak Republic 0.502 0.840 0.712 2.762 2.900 2.945
Slovenia 0.627 0.868 0.690 2.798 2.801 2.929
South Africa2 0.675 0.823 0.785 2.873 3.041 3.238
Spain 0.705 0.856 0.649 2.799 2.605 2.808
Sweden 0.616 0.862 0.660 2.798 2.801 2.929
Chinese Taipei 0.626 0.831 0.773 2.798 2.801 2.929
Turkey 0.658 0.853 0.756 2.798 2.801 2.929
United Arab Emirates 0.700 0.931 0.790 2.798 2.801 2.929
United States 0.735 0.937 0.866 2.688 2.778 2.899
Viet Nam 0.514 0.791 0.641 2.798 2.801 2.929
ISCED level 1
Australia1 0.650 0.949 0.783 2.841 2.960 3.073
Flemish Community (Belgium) 0.623 0.906 0.777 2.569 2.511 2.595
Ciudad Autónoma de Buenos Aires (Argentina)
0.696 0.896 0.770 2.748 2.741 2.784
Denmark 0.665 0.905 0.815 2.798 2.801 2.929
England (United Kingdom) 0.704 0.943 0.776 2.648 2.829 3.043
France 0.723 0.925 0.766 2.295 1.782 1.788
Japan 0.586 0.757 0.625 2.302 2.454 2.287
Korea 0.651 0.989 0.792 2.583 2.694 2.709
Netherlands1 0.607 0.843 0.708 2.547 2.849 2.942
Spain 0.729 0.840 0.720 2.799 2.605 2.808
Sweden 0.660 0.817 0.636 2.798 2.801 2.929
Chinese Taipei 0.724 0.892 0.815 2.798 2.801 2.929
Turkey 0.772 0.898 0.767 2.798 2.801 2.929
United Arab Emirates 0.724 0.939 0.815 2.798 2.801 2.929
Viet Nam 0.616 0.779 0.662 2.798 2.801 2.929
ISCED level 3
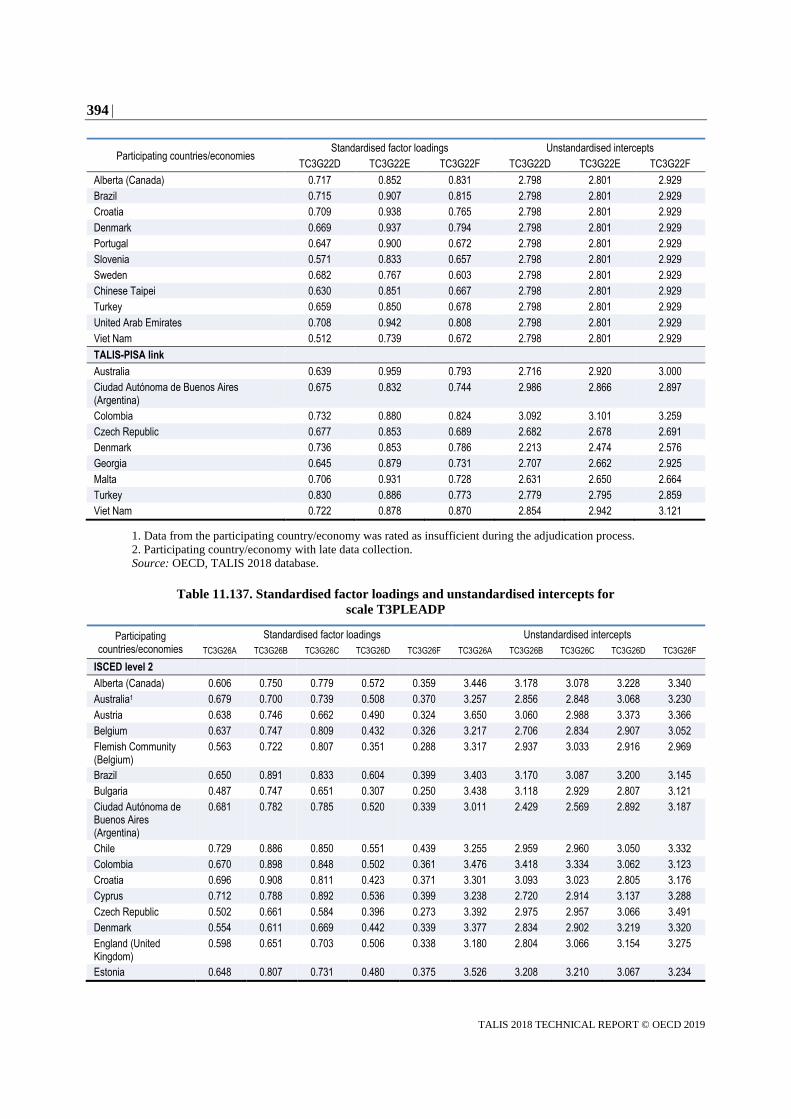
394
TALIS 2018 TECHNICAL REPORT © OECD 2019
Participating countries/economies Standardised factor loadings Unstandardised intercepts
TC3G22D TC3G22E TC3G22F TC3G22D TC3G22E TC3G22F
Alberta (Canada) 0.717 0.852 0.831 2.798 2.801 2.929
Brazil 0.715 0.907 0.815 2.798 2.801 2.929
Croatia 0.709 0.938 0.765 2.798 2.801 2.929
Denmark 0.669 0.937 0.794 2.798 2.801 2.929
Portugal 0.647 0.900 0.672 2.798 2.801 2.929
Slovenia 0.571 0.833 0.657 2.798 2.801 2.929
Sweden 0.682 0.767 0.603 2.798 2.801 2.929
Chinese Taipei 0.630 0.851 0.667 2.798 2.801 2.929
Turkey 0.659 0.850 0.678 2.798 2.801 2.929
United Arab Emirates 0.708 0.942 0.808 2.798 2.801 2.929
Viet Nam 0.512 0.739 0.672 2.798 2.801 2.929
TALIS-PISA link
Australia 0.639 0.959 0.793 2.716 2.920 3.000
Ciudad Autónoma de Buenos Aires (Argentina)
0.675 0.832 0.744 2.986 2.866 2.897
Colombia 0.732 0.880 0.824 3.092 3.101 3.259
Czech Republic 0.677 0.853 0.689 2.682 2.678 2.691
Denmark 0.736 0.853 0.786 2.213 2.474 2.576
Georgia 0.645 0.879 0.731 2.707 2.662 2.925
Malta 0.706 0.931 0.728 2.631 2.650 2.664
Turkey 0.830 0.886 0.773 2.779 2.795 2.859
Viet Nam 0.722 0.878 0.870 2.854 2.942 3.121
1. Data from the participating country/economy was rated as insufficient during the adjudication process.
2. Participating country/economy with late data collection.
Source: OECD, TALIS 2018 database.
Table 11.137. Standardised factor loadings and unstandardised intercepts for
scale T3PLEADP
Participating countries/economies
Standardised factor loadings Unstandardised intercepts
TC3G26A TC3G26B TC3G26C TC3G26D TC3G26F TC3G26A TC3G26B TC3G26C TC3G26D TC3G26F
ISCED level 2
Alberta (Canada) 0.606 0.750 0.779 0.572 0.359 3.446 3.178 3.078 3.228 3.340
Australia1 0.679 0.700 0.739 0.508 0.370 3.257 2.856 2.848 3.068 3.230
Austria 0.638 0.746 0.662 0.490 0.324 3.650 3.060 2.988 3.373 3.366
Belgium 0.637 0.747 0.809 0.432 0.326 3.217 2.706 2.834 2.907 3.052
Flemish Community (Belgium)
0.563 0.722 0.807 0.351 0.288 3.317 2.937 3.033 2.916 2.969
Brazil 0.650 0.891 0.833 0.604 0.399 3.403 3.170 3.087 3.200 3.145
Bulgaria 0.487 0.747 0.651 0.307 0.250 3.438 3.118 2.929 2.807 3.121
Ciudad Autónoma de Buenos Aires (Argentina)
0.681 0.782 0.785 0.520 0.339 3.011 2.429 2.569 2.892 3.187
Chile 0.729 0.886 0.850 0.551 0.439 3.255 2.959 2.960 3.050 3.332
Colombia 0.670 0.898 0.848 0.502 0.361 3.476 3.418 3.334 3.062 3.123
Croatia 0.696 0.908 0.811 0.423 0.371 3.301 3.093 3.023 2.805 3.176
Cyprus 0.712 0.788 0.892 0.536 0.399 3.238 2.720 2.914 3.137 3.288
Czech Republic 0.502 0.661 0.584 0.396 0.273 3.392 2.975 2.957 3.066 3.491
Denmark 0.554 0.611 0.669 0.442 0.339 3.377 2.834 2.902 3.219 3.320
England (United Kingdom)
0.598 0.651 0.703 0.506 0.338 3.180 2.804 3.066 3.154 3.275
Estonia 0.648 0.807 0.731 0.480 0.375 3.526 3.208 3.210 3.067 3.234

395
TALIS 2018 TECHNICAL REPORT © OECD 2019
Participating countries/economies
Standardised factor loadings Unstandardised intercepts
TC3G26A TC3G26B TC3G26C TC3G26D TC3G26F TC3G26A TC3G26B TC3G26C TC3G26D TC3G26F
Finland 0.575 0.648 0.663 0.468 0.273 3.254 2.711 2.954 3.195 3.174
France 0.684 0.870 0.792 0.441 0.300 3.233 3.001 2.861 2.745 2.956
Georgia 0.639 0.905 0.831 0.541 0.388 3.392 3.258 3.243 3.322 3.353
Hungary 0.651 0.868 0.744 0.537 0.340 3.550 3.146 2.962 3.175 3.327
Iceland 0.514 0.711 0.642 0.415 0.310 3.457 2.989 2.957 3.011 3.275
Israel 0.690 0.668 0.753 0.566 0.371 3.201 2.697 2.811 3.168 3.282
Italy 0.588 0.727 0.495 0.356 0.280 3.147 2.930 2.181 3.003 3.115
Japan 0.508 0.572 0.556 0.380 0.297 3.112 2.394 2.292 2.965 3.256
Kazakhstan 0.630 0.702 0.685 0.552 0.369 3.263 3.144 2.896 3.190 3.405
Korea 0.624 0.810 0.802 0.524 0.382 3.679 3.409 3.245 3.373 3.538
Latvia 0.561 0.792 0.785 0.338 0.335 3.423 3.273 3.157 2.590 3.186
Lithuania 0.681 0.889 0.807 0.548 0.408 3.507 3.278 3.319 3.283 3.326
Malta 0.571 0.780 0.697 0.539 0.325 3.411 2.849 2.949 3.242 3.238
Mexico 0.594 0.718 0.762 0.546 0.386 3.367 3.049 2.889 3.312 3.248
Netherlands 0.624 0.753 0.693 0.393 0.307 3.120 2.889 2.855 2.872 2.983
New Zealand 0.529 0.740 0.769 0.554 0.284 3.368 3.117 3.031 3.157 3.350
Norway 0.426 0.714 0.803 0.414 0.246 3.497 2.927 2.971 2.990 3.465
Portugal 0.636 0.862 0.798 0.519 0.350 3.353 3.065 3.030 3.177 3.165
Romania 0.692 0.904 0.759 0.530 0.362 3.474 3.217 2.929 3.241 3.525
Russian Federation 0.765 0.941 0.861 0.590 0.416 3.494 3.274 3.175 3.330 3.185
Saudi Arabia 0.629 0.844 0.796 0.473 0.348 3.223 2.829 2.817 3.138 3.348
Shanghai (China) 0.739 0.898 0.854 0.651 0.457 3.458 3.253 3.172 3.393 3.409
Singapore 0.580 0.552 0.648 0.459 0.288 3.233 2.536 2.848 3.161 3.347
Slovak Republic 0.511 0.696 0.516 0.340 0.327 3.325 2.956 2.638 2.594 3.152
Slovenia 0.536 0.793 0.790 0.469 0.400 3.496 3.136 2.992 3.282 3.292
South Africa2 0.607 0.947 0.808 0.528 0.440 3.476 3.270 3.108 3.272 3.194
Spain 0.731 0.927 0.825 0.539 0.391 3.450 3.154 3.072 3.086 3.263
Sweden 0.502 0.534 0.599 0.415 0.218 3.333 2.651 2.849 3.031 3.145
Chinese Taipei 0.513 0.704 0.669 0.399 0.285 3.385 2.926 2.794 3.132 3.206
Turkey 0.681 0.886 0.847 0.601 0.456 3.473 3.124 3.108 3.273 3.250
United Arab Emirates 0.708 0.883 0.868 0.544 0.412 3.284 3.098 3.060 3.355 3.449
United States 0.640 0.756 0.564 0.473 0.311 3.220 2.844 2.946 3.177 3.236
Viet Nam 0.612 0.807 0.693 0.556 0.380 3.460 2.938 2.664 3.142 3.273
ISCED level 1
Australia1 0.656 0.864 0.713 0.497 0.322 3.410 3.107 2.918 3.139 3.300
Flemish Community (Belgium)
0.419 0.597 0.523 0.331 0.219 3.423 2.920 2.808 3.104 3.200
Ciudad Autónoma de Buenos Aires (Argentina)
0.600 0.763 0.811 0.477 0.383 3.138 2.432 2.463 3.034 3.345
Denmark 0.531 0.621 0.651 0.405 0.288 3.451 2.873 2.785 3.154 3.237
England (United Kingdom)
0.644 0.766 0.805 0.524 0.357 3.180 2.804 3.066 3.154 3.275
France 0.538 0.693 0.611 0.364 0.293 3.341 2.802 2.638 2.779 3.318
Japan 0.581 0.697 0.590 0.532 0.338 3.247 2.634 2.333 2.992 3.519
Korea 0.699 0.863 0.677 0.425 0.365 3.679 3.409 3.245 3.373 3.538
Netherlands1 0.608 0.432 0.692 0.489 0.424 3.327 2.875 2.627 3.213 3.201
Spain 0.678 0.813 0.639 0.494 0.348 3.532 3.235 2.825 3.214 3.272
Sweden 0.648 0.708 0.862 0.501 0.355 3.486 2.667 3.050 3.081 3.243
Chinese Taipei 0.573 0.777 0.656 0.480 0.327 3.410 2.955 2.545 3.229 3.318
Turkey 0.676 0.867 0.936 0.611 0.485 3.473 3.124 3.108 3.273 3.250
United Arab Emirates 0.679 0.864 0.786 0.532 0.385 3.284 3.098 3.060 3.355 3.449

396
TALIS 2018 TECHNICAL REPORT © OECD 2019
Participating countries/economies
Standardised factor loadings Unstandardised intercepts
TC3G26A TC3G26B TC3G26C TC3G26D TC3G26F TC3G26A TC3G26B TC3G26C TC3G26D TC3G26F
Viet Nam 0.610 0.730 0.628 0.518 0.428 3.460 2.938 2.664 3.142 3.273
ISCED level 3
Alberta (Canada) 0.617 0.803 0.681 0.499 0.322 3.446 3.178 3.078 3.228 3.340
Brazil 0.678 0.848 0.862 0.551 0.339 3.403 3.170 3.087 3.200 3.145
Croatia 0.596 0.856 0.799 0.385 0.431 3.301 3.093 3.023 2.805 3.176
Denmark 0.424 0.423 0.702 0.356 0.286 3.252 1.849 3.072 3.175 3.258
Portugal 0.536 0.730 0.709 0.456 0.309 3.353 3.065 3.030 3.177 3.165
Slovenia 0.500 0.760 0.748 0.368 0.283 3.340 3.117 3.184 3.291 3.301
Sweden 0.454 0.480 0.711 0.357 0.226 3.422 2.277 3.035 3.175 3.238
Chinese Taipei 0.632 0.863 0.813 0.503 0.383 3.257 2.910 2.886 3.224 3.175
Turkey 0.688 0.828 0.819 0.541 0.409 3.473 3.124 3.108 3.273 3.250
United Arab Emirates 0.661 0.863 0.833 0.505 0.377 3.284 3.098 3.060 3.355 3.449
Viet Nam 0.526 0.796 0.683 0.546 0.410 3.460 2.938 2.664 3.142 3.273
TALIS-PISA link
Australia 0.685 0.765 0.765 0.519 0.381 3.252 3.050 3.021 3.050 3.237
Ciudad Autónoma de Buenos Aires (Argentina)
0.581 0.662 0.682 0.458 0.329 3.086 2.608 2.712 3.040 3.143
Colombia 0.720 0.899 0.909 0.458 0.340 3.545 3.386 3.397 3.103 3.091
Czech Republic 0.688 0.871 0.710 0.505 0.386 3.316 3.047 2.957 3.115 3.434
Denmark 0.562 0.617 0.785 0.352 0.305 3.548 2.672 2.763 2.961 3.154
Georgia 0.702 0.889 0.834 0.502 0.428 3.371 3.228 3.223 3.366 3.301
Malta 0.597 0.790 0.716 0.534 0.344 3.432 2.891 2.964 3.256 3.189
Turkey 0.626 0.722 0.709 0.442 0.363 3.425 3.121 3.156 3.306 3.277
Viet Nam 0.646 0.876 0.589 0.472 0.390 3.629 3.106 2.751 3.125 3.361
1. Data from the participating country/economy was rated as insufficient during the adjudication process.
2. Participating country/economy with late data collection.
Source: OECD, TALIS 2018 database.
School climate: Academic pressure (T3PACAD); Stakeholder involvement,
partnership (T3PCOM); Lack of special needs personnel (T3PLACSN); School
delinquency and violence (T3PDELI)
11.70. Measured items
Four scales concerning school climate were derived from these question stems:
“To what extent do the following statements apply to this school?” (TC3G27),
followed by items concerning curriculum and student achievement that were used
for the scale Academic Pressure (T3PACAD), and items about community
involvement in education for the scale Stakeholder involvement, partnership
(T3PCOM).
“To what extent is this school’s capacity to provide quality instruction currently
hindered by any of the following issues?” (TC3G29), followed by items regarding
lack of specific teacher competencies that were used for the scale Lack of special
needs personnel (T3PLACSN).
“In this school, how often do the following occur amongst students?” (TC3G30),
which was followed by items about student delinquencies that were used to form
the scale School delinquency and violence (T3PDELI).

397
TALIS 2018 TECHNICAL REPORT © OECD 2019
The scales are presented in Table 11.138.
11.71. Excluded populations
The ISCED levels 1, 2 and 3 populations from Denmark and Sweden were excluded from
the scale T3PCOM due to non-convergence during the measurement invariance testing
across participating countries/economies within each ISCED level. Therefore, these
populations do not have reliability coefficients for this scale in Table 11.139 or item
parameters in Table 11.150.
11.72. Scale reliability
Table 11.139, which presents the reliability coefficients for all populations for each scale,
shows that most of the coefficients are high for all scales, with a few acceptable results as
well. However, a low reliability coefficient can be observed for the Croatia ISCED level 3
population in the T3PACAD scale. Coefficients below 0.600 are evident in the scale
T3PCOM for the Czech Republic, Italy, Latvia and Slovenia ISCED level 2 populations,
and for the Japan ISCED level 1 and Slovenia ISCED level 3 populations. The reliabilities
in the scale T3PLACSN are low for the Finland and Norway ISCED level 2 populations
and for the France ISCED level 1 population.
11.73. Model fits
The scale T3PACAD has only three items, which resulted in a perfect model fit for most
populations, as evident in Table 11.140. However, a poor fit can be observed for several
populations with fixed parameters, including the South Africa ISCED level 2, Australia
ISECD level 1 and Georgia and Viet Nam TALIS-PISA link populations.
Similarly, as seen in Table 11.141, the scale T3PCOM contains just three items, resulting
in a perfect model fit for most populations, and an acceptable fit in all populations with
fixed parameters.
Again, perfect model fits are evident for the scale T3PLACSN, which also has only
three items, as seen in Table 11.142. However, the fit is poor for Australia and the
Netherlands ISCED level 2 populations and for the Ciudad Autónoma de Buenos Aires
(Argentina), Columbia, Malta and Viet Nam TALIS-PISA link populations.
Table 11.143 presents the fit indices for the scale T3PDELI. The model fits are perfect for
approximately half the populations and acceptable for the other half. However, a poor fit
can be observed for the Columbia, Czech Republic, Singapore and Viet Nam ISCED level
2 populations, and for the Czech Republic, Turkey and Viet Nam TALIS-PISA link
populations.
11.74. Invariance testing
Table 11.144 presents the invariance results for the scale T3PACAD. The scale reached
metric invariance for all three ISCED levels because the configural models are perfect and
the metric models acceptable (or just below acceptable for ISCED level 2).
The same can be said for the scales T3PCOM and T3PLACSN, presented in
Table 11.145 and 11.146 respectively. The scales were metric invariant for all the ISCED
levels for the same reason, with the exception of the ISCED level 1 and 3 levels of
T3PCOM, where the configural model did not converge but the metric model was just
below acceptable, and the ISCED level 3 level of T3PLACSN, where the metric model was

398
TALIS 2018 TECHNICAL REPORT © OECD 2019
just below acceptable. Since the metric models were very near acceptable fit, each of these
cases was considered metric invariant. Lastly, Table 11.147 presents the results for the
scale T3PDELI, which reached configural invariance for all ISCED levels.
11.75. Item parameters
Table 11.148 presents the unstandardised factor loadings for scales T3PACAD, T3PCOM
and T3PLACSN, while Tables 11.149, 11.150, 11.151 and 11.152 present the standardised
factor loadings and the unstandardised intercepts for the scales T3PACAD, T3PCOM,
T3PLACSN and T3PDELI respectively.
The factor loadings for items TC3G27A and TC3G27B are above 0.600 in most
populations, with moderate strength observed for a few populations. Item TC3G27C
exhibits only moderate factor loadings for most populations, while the Austria, Bulgaria,
Hungary, Lithuania, Norway and Viet Nam ISCED level 2 populations, the Croatia ISCED
level 3 population and the Denmark TALIS-PISA link population exhibit weak factor
loadings for this item.
Factor loadings for item TC3G27E in scale T3PSOM are mostly strong. Although item
TC3G27D also exhibits mostly strong factor loadings, there are more moderate and some
weak loadings. Item TC3G27G, however, exhibits weak loadings in most populations,
which suggests that the overall scale, with just three items, does not function well in these
populations.
Factor loadings for the T3PLACSN scale items TC3G29K and TC3G29L are mostly
strong, with a few moderate cases and one weak factor loading for the Australia ISCED
level 2 population for TC3G29K. In comparison, factor loadings for item TC3G29B are
mostly of moderate strength or weak in the following populations: Croatia, the
Czech Republic, Finland, Hungary, Latvia, Malta, Mexico, Norway, Singapore, Slovenia,
South Africa and Turkey ISCED level 2; Ciudad Autónoma de Buenos Aires (Argentina),
France, Chinese Taipei, and Turkey ISCED level 1, and Croatia, Sweden and Chinese
Taipei ISCED level 3.
Items TC3G30B and TC3G30C for the scale T3PDELI exhibit mostly strong relationships,
with the latent construct having a few factor loadings of moderate strength and weak
relationships for the Lithuania ISCED level 2 and the Netherlands ISCED level 1
populations for item TC3G30B, and the Viet Nam ISCED levels 2 and 1 populations for
TC3G30C. In comparison, item TC3G30A exhibits strong yet more moderate relationships,
with weak factor loadings in the Belgium and Columbia ISCED level 2 and the Viet Nam
ISCED level 1 populations. Item TC3G30D exhibits strong and moderate relationships, but
the largest number of weak relationships compared to other items in the scale are those
observed for the following populations: Alberta (Canada), Chile, the Czech Republic,
Georgia, Israel, Kazakhstan, Mexico and Viet Nam ISCED level 2; Chinese Taipei and
Viet Nam ISCED level 1; Alberta (Canada) ISCED level 3; and Georgia TALIS-PISA link.

399
TALIS 2018 TECHNICAL REPORT © OECD 2019
Table 11.138. Item wording for school climate scale items
T3PACAD: Academic pressure
TC3G27: To what extent do the following statements apply to this school?
Response options: “Not at all” (1), “To some extent” (2), “Quite a bit” (3), “A lot” (4).
TC3G27A Teachers understand the school’s curricular goals
TC3G27B Teachers succeed in implementing the school’s curriculum
TC3G27C Teachers hold high expectations for student achievement
TC3G27F* Students have a desire to do well in school
T3PCOM: Stakeholder involvement, partnership
TC3G27: To what extent do the following statements apply to this school?
Response options: “Not at all” (1), “To some extent” (2), “Quite a bit” (3), “A lot” (4).
TC3G27D Parents or guardians support student achievement
TC3G27E Parents or guardians are involved in school activities
TC3G27G The school co-operates with the local community
T3PLACSN: Lack of special needs personnel
TC3G29: To what extent is this school’s capacity to provide quality instruction currently hindered by any of the following issues?
Response options: “Not at all” (1), “To some extent” (2), “Quite a bit” (3), “A lot” (4).
TC3G29B Shortage of teachers with competence in teaching students with special needs
TC3G29K Shortage of teachers with competence in teaching students in a multicultural or multilingual setting
TC3G29L Shortage of teachers with competence in teaching students from <socio-economically disadvantaged homes>
T3PDELI: School delinquency and violence
TC3G30: In this school, how often do the following occur amongst students?
Response options: “Never” (1), “Less than monthly” (2), “Monthly” (3), “Weekly” (4), “Daily” (5).
TC3G30A Vandalism and theft
TC3G30B Intimidation or bullying among students (or other forms of verbal abuse)
TC3G30C Physical injury caused by violence among students
TC3G30D Intimidation or verbal abuse of teachers or staff
* This item was deleted from the scale and is not included in any of the results presented for this scale.
Source: OECD, TALIS 2018 database.
Table 11.139. Omega coefficients for school climate scales
Participating countries/economies T3PACAD T3PCOM T3PLACSN T3PDELI
Omega coefficient
ISCED level 2
Alberta (Canada) 0.854 0.863 0.760 0.702
Australia1 0.787 0.771 0.982 0.882
Austria 0.663 0.676 0.837 0.699
Belgium 0.769 0.741 0.891 0.740
Flemish Community (Belgium) 0.815 0.830 0.901 0.755
Brazil 0.745 0.828 0.805 0.897
Bulgaria 0.684 0.893 0.895 0.852
Ciudad Autónoma de Buenos Aires (Argentina) 0.901 0.895 0.823 0.837
Chile 0.806 0.916 0.769 0.760
Colombia 0.839 0.837 0.783 0.897
Croatia 0.707 0.787 0.738 0.709
Cyprus 0.819 0.783 0.901 0.859
Czech Republic 0.689 0.501 0.769 0.721
Denmark3 0.776 - 0.837 0.815

400
TALIS 2018 TECHNICAL REPORT © OECD 2019
Participating countries/economies T3PACAD T3PCOM T3PLACSN T3PDELI
Omega coefficient
England (United Kingdom) 0.845 0.776 0.766 0.810
Estonia 0.711 0.659 0.780 0.748
Finland 0.789 0.686 0.496 0.792
France 0.640 0.671 0.623 0.719
Georgia 0.759 0.976 0.621 0.789
Hungary 0.699 0.740 0.712 0.796
Iceland 0.810 0.893 0.812 0.814
Israel 0.774 0.867 0.814 0.830
Italy 0.776 0.434 0.803 0.736
Japan 0.640 0.717 0.712 0.821
Kazakhstan 0.776 0.832 0.797 0.854
Korea 0.897 0.941 0.869 0.854
Latvia 0.771 0.524 0.689 0.848
Lithuania 0.638 0.719 0.787 0.686
Malta 0.841 0.734 0.702 0.830
Mexico 0.794 0.663 0.692 0.897
Netherlands 0.863 0.711 0.850 0.801
New Zealand 0.899 0.728 0.887 0.839
Norway 0.728 0.764 0.524 0.699
Portugal 0.651 0.646 0.745 0.808
Romania 0.867 0.951 0.931 0.797
Russian Federation 0.865 0.978 0.717 0.976
Saudi Arabia 0.861 0.850 0.878 0.889
Shanghai (China) 0.743 0.895 0.719 0.759
Singapore 0.843 0.835 0.711 0.706
Slovak Republic 0.839 0.759 0.815 0.750
Slovenia 0.773 0.590 0.797 0.750
South Africa2 0.626 0.704 0.612 0.865
Spain 0.845 0.785 0.741 0.778
Sweden3 0.882 - 0.773 0.764
Chinese Taipei 0.880 0.857 0.604 0.815
Turkey 0.943 0.867 0.640 0.837
United Arab Emirates 0.893 0.897 0.878 0.799
United States 0.882 0.914 0.723 0.846
Viet Nam 0.607 0.794 0.796 0.661
ISCED level 1
Australia1 0.824 0.757 0.824 0.882
Flemish Community (Belgium) 0.781 0.734 0.876 0.790
Ciudad Autónoma de Buenos Aires (Argentina) 0.806 0.681 0.760 0.834
Denmark3 0.808 - 0.783 0.837
England (United Kingdom) 0.867 0.861 0.752 0.821
France 0.689 0.814 0.537 0.766
Japan 0.780 0.593 0.726 0.789
Korea 0.904 0.986 0.723 0.810
Netherlands1 0.916 0.752 0.872 0.743
Spain 0.843 0.924 0.745 0.740
Sweden3 0.889 - 0.759 0.835
Chinese Taipei 0.810 0.935 0.731 0.778
Turkey 0.846 0.931 0.659 0.714
United Arab Emirates 0.878 0.925 0.878 0.817
Viet Nam 0.908 0.953 0.819 0.955

401
TALIS 2018 TECHNICAL REPORT © OECD 2019
Participating countries/economies T3PACAD T3PCOM T3PLACSN T3PDELI
Omega coefficient
ISCED level 3
Alberta (Canada) 0.885 0.863 0.794 0.741
Brazil 0.764 0.925 0.803 0.863
Croatia 0.557 0.605 0.797 0.721
Denmark3 0.778 - 0.857 0.810
Portugal 0.724 0.650 0.808 0.796
Slovenia 0.714 0.537 0.839 0.745
Sweden3 0.856 - 0.694 0.835
Chinese Taipei 0.872 0.785 0.699 0.828
Turkey 0.846 0.980 0.724 0.850
United Arab Emirates 0.848 0.901 0.880 0.773
Viet Nam 0.629 0.852 0.646 0.712
TALIS-PISA link
Australia 0.760 0.823 0.792 0.856
Ciudad Autónoma de Buenos Aires (Argentina) 0.841 0.891 0.821 0.792
Colombia 0.880 0.908 0.646 0.839
Czech Republic 0.709 0.692 0.878 0.667
Denmark 0.962 0.832 0.817 0.941
Georgia 0.821 0.872 0.806 0.850
Malta 0.821 0.785 0.819 0.815
Turkey 0.812 0.974 0.850 0.869
Viet Nam 0.867 0.974 0.687 0.846
1. Data from the participating country/economy was rated as insufficient during the adjudication process.
2. Participating country/economy with late data collection.
3. This participating country/economy was excluded from the scale.
Source: OECD, TALIS 2018 database.
Table 11.140. CFA model-data fit for scale T3PACAD
Academic pressure
Participating countries/economies CFI TLI RMSEA SRMR
ISCED level 2
Australia1 1.000 1.049 0.000 0.051
South Africa2 0.943 0.914 0.091 0.217
ISCED level 1
Australia1 0.855 0.855 0.196 0.387
Netherlands1 1.000 1.002 0.000 0.145
TALIS-PISA link
Australia 1.000 1.060 0.000 0.107
Ciudad Autónoma de Buenos Aires (Argentina) 0.944 0.944 0.107 0.289
Colombia 1.000 1.098 0.000 0.158
Czech Republic 1.000 1.017 0.000 0.094
Denmark 1.000 1.059 0.000 0.184
Georgia 0.902 0.902 0.094 0.405
Malta 1.000 1.060 0.000 0.158
Turkey 0.937 0.937 0.073 0.247
Viet Nam 0.670 0.670 0.194 0.649
1. Data from the participating country/economy was rated as insufficient during the adjudication process.
2. Participating country/economy with late data collection.
Source: OECD, TALIS 2018 database.

402
TALIS 2018 TECHNICAL REPORT © OECD 2019
Table 11.141. CFA model-data fit for scale T3PCOM
Stakeholder involvement
Participating countries/economies CFI TLI RMSEA SRMR
ISCED level 2
Australia1 1.000 1.006 0.000 0.151
Italy3 0.916 1.000 0.000 0.023
Lithuania3 0.878 1.000 0.000 0.043
South Africa2 0.998 0.995 0.033 0.039
ISCED level 1
Australia1 1.000 1.021 0.000 0.078
Netherlands1 1.000 1.073 0.000 0.034
ISCED level 3
Croatia3 0.944 0.831 0.067 0.032
TALIS-PISA link
Australia 0.995 0.995 0.024 0.163
Ciudad Autónoma de Buenos Aires (Argentina) 1.000 1.037 0.000 0.129
Colombia 1.000 1.023 0.000 0.204
Czech Republic 0.947 0.947 0.042 0.168
Denmark 0.984 0.984 0.038 0.201
Georgia 0.938 0.938 0.080 0.153
Malta 1.000 1.237 0.000 0.075
Turkey 1.000 1.028 0.000 0.128
Viet Nam 0.958 0.969 0.077 0.421
1. Data from the participating country/economy was rated as insufficient during the adjudication process.
2. Participating country/economy with late data collection.
3. Models in this county/economy included programmatic modifications.
Source: OECD, TALIS 2018 database.
Table 11.142. CFA model-data fit for scale T3PLACSN
Lack of special needs personnel
Participating countries/economies CFI TLI RMSEA SRMR
ISCED level 2
Australia1 0.957 0.935 0.063 0.076
South Africa2 1.000 1.007 0.000 0.052
ISCED level 1
Australia1 0.914 0.914 0.102 0.179
Netherlands1 0.930 0.930 0.088 0.238
TALIS-PISA link
Australia 0.981 0.981 0.051 0.102
Ciudad Autónoma de Buenos Aires (Argentina) 0.809 0.809 0.124 0.285
Colombia 0.607 0.607 0.204 0.286
Czech Republic 0.974 0.974 0.049 0.123
Denmark 0.973 0.973 0.052 0.159
Georgia 1.000 1.159 0.000 0.181
Malta 0.911 0.911 0.092 0.245
Turkey 1.000 1.111 0.000 0.067
Viet Nam 0.885 0.885 0.122 0.226
1. Data from the participating country/economy was rated as insufficient during the adjudication process.
2. Participating country/economy with late data collection.
Source: OECD, TALIS 2018 database.

403
TALIS 2018 TECHNICAL REPORT © OECD 2019
Table 11.143. CFA model-data fit for scale T3PDELI
School delinquency and violence
Participating countries/economies CFI TLI RMSEA SRMR
ISCED level 2
Alberta (Canada) 1.000 1.001 0.000 0.030
Australia1 0.991 0.972 0.068 0.019
Austria 1.000 1.017 0.000 0.016
Belgium 0.984 0.951 0.066 0.026
Flemish Community (Belgium) 0.990 0.971 0.059 0.022
Brazil 1.000 1.021 0.000 0.005
Bulgaria 0.997 0.990 0.043 0.017
Ciudad Autónoma de Buenos Aires (Argentina) 0.993 0.980 0.062 0.020
Chile 1.000 1.086 0.000 0.008
Colombia 0.850 0.549 0.296 0.074
Croatia 0.972 0.916 0.058 0.039
Cyprus 1.000 1.021 0.000 0.014
Czech Republic 0.757 0.271 0.237 0.063
Denmark 1.000 1.048 0.000 0.004
England (United Kingdom) 1.000 1.030 0.000 0.012
Estonia 0.985 0.955 0.076 0.025
Finland 1.000 1.056 0.000 0.011
France 0.947 0.842 0.122 0.034
Georgia 1.000 1.047 0.000 0.013
Hungary 1.000 1.022 0.000 0.015
Iceland 1.000 1.048 0.000 0.010
Israel 1.000 1.042 0.000 0.012
Italy 1.000 1.048 0.000 0.008
Japan 1.000 1.042 0.000 0.002
Kazakhstan 1.000 1.052 0.000 0.009
Korea 0.982 0.947 0.082 0.029
Latvia 0.982 0.946 0.086 0.027
Lithuania 0.991 0.974 0.029 0.036
Malta 1.000 1.026 0.000 0.018
Mexico 0.980 0.941 0.111 0.023
Netherlands 1.000 1.046 0.000 0.004
New Zealand 1.000 1.147 0.000 0.010
Norway 1.000 1.119 0.000 0.004
Portugal 1.000 1.042 0.000 0.004
Romania 0.991 0.974 0.055 0.025
Russian Federation 1.000 1.029 0.000 0.023
Saudi Arabia3 - - - 0.055
Shanghai (China) 0.982 0.946 0.058 0.029
Singapore 0.887 0.662 0.185 0.039
Slovak Republic 1.000 1.025 0.000 0.016
Slovenia 0.980 0.939 0.066 0.032
South Africa2 0.992 0.977 0.064 0.019
Spain 1.000 1.027 0.000 0.006
Sweden 1.000 1.094 0.000 0.007
Chinese Taipei 1.000 1.012 0.000 0.013
Turkey 1.000 1.039 0.000 0.012
United Arab Emirates 1.000 1.006 0.000 0.009
United States3 - - - 0.122

404
TALIS 2018 TECHNICAL REPORT © OECD 2019
Participating countries/economies CFI TLI RMSEA SRMR
Viet Nam 0.880 0.641 0.097 0.060
ISCED level 1
Australia1 0.997 0.990 0.045 0.015
Flemish Community (Belgium) 0.995 0.984 0.038 0.021
Ciudad Autónoma de Buenos Aires (Argentina) 0.981 0.942 0.070 0.028
Denmark 0.994 0.982 0.050 0.021
England (United Kingdom) 0.972 0.915 0.098 0.039
France 1.000 1.050 0.000 0.010
Japan 1.000 1.042 0.000 0.008
Korea 0.998 0.995 0.028 0.019
Netherlands1 0.953 0.720 0.176 0.021
Spain 0.995 0.984 0.027 0.023
Sweden 0.996 0.989 0.043 0.018
Chinese Taipei 1.000 1.014 0.000 0.017
Turkey 1.000 1.150 0.000 0.015
United Arab Emirates 0.999 0.996 0.022 0.011
Viet Nam 0.961 0.884 0.038 0.038
ISCED level 3
Alberta (Canada) 1.000 1.135 0.000 0.014
Brazil 1.000 1.027 0.000 0.009
Croatia 0.942 0.825 0.118 0.047
Denmark 0.940 0.820 0.192 0.039
Portugal 0.988 0.964 0.072 0.021
Slovenia 0.990 0.969 0.068 0.021
Sweden 0.954 0.863 0.203 0.031
Chinese Taipei 0.979 0.938 0.088 0.026
Turkey 1.000 1.020 0.000 0.012
United Arab Emirates 0.989 0.966 0.064 0.018
Viet Nam 0.968 0.904 0.091 0.027
TALIS-PISA link
Australia 0.990 0.970 0.077 0.025
Ciudad Autónoma de Buenos Aires (Argentina) 0.927 0.780 0.178 0.055
Colombia 0.978 0.935 0.096 0.024
Czech Republic 0.866 0.597 0.131 0.042
Denmark 1.000 1.102 0.000 0.013
Georgia 0.943 0.830 0.109 0.052
Malta 0.968 0.903 0.137 0.031
Turkey 0.887 0.660 0.203 0.034
Viet Nam 0.697 0.091 0.369 0.058
1. Data from the participating country/economy was rated as insufficient during the adjudication process.
2. Participating country/economy with late data collection.
3. As the correction factor for this country/economy was negative, only the SRMR is reported.
Source: OECD, TALIS 2018 database.

405
TALIS 2018 TECHNICAL REPORT © OECD 2019
Table 11.144. Invariance test results for scale T3PACAD
CFI TLI RMSEA SRMR Δ CFI Δ TLI Δ RMSEA Δ SRMR
Invariance level for ISCED level 2
Configural 1.000 1.000 0.000 0.000
Metric 0.966 0.947 0.085 0.137 0.034 0.053 -0.085 -0.137
Scalar 0.774 0.827 0.154 0.217 0.192 0.120 -0.069 -0.080
Invariance level for ISCED level 1
Configural 1.000 1.000 0.000 0.000
Metric 0.973 0.955 0.079 0.134 0.027 0.045 -0.079 -0.134
Scalar 0.823 0.856 0.142 0.241 0.15 0.099 -0.063 -0.107
Invariance level for ISCED level 3
Configural 1.000 1.000 0.000 0.000
Metric 0.993 0.989 0.039 0.099 0.007 0.011 -0.039 -0.099
Scalar 0.825 0.856 0.142 0.152 0.168 0.133 -0.103 -0.053
Source: OECD, TALIS 2018 database.
Table 11.145. Invariance test results for scale T3PCOM
CFI TLI RMSEA SRMR Δ CFI Δ TLI Δ RMSEA Δ SRMR
Invariance level for ISCED level 2
Configural 1.000 1.000 0.000 0.001
Metric 0.970 0.954 0.068 0.095 0.030 0.046 -0.068 -0.094
Scalar 0.468 0.592 0.204 0.329 0.502 0.362 -0.136 -0.234
Invariance level for ISCED level 1
Configural - - - -
Metric 0.960 0.935 0.085 0.093 - - - -
Scalar 0.611 0.684 0.188 0.220 0.349 0.251 -0.103 -0.127
Invariance level for ISCED level 3
Configural - - - -
Metric 0.945 0.909 0.103 0.148 - - - -
Scalar 0.496 0.584 0.220 0.529 0.449 0.325 -0.117 -0.381
Source: OECD, TALIS 2018 database.
Table 11.146. Invariance test results for scale T3PLACSN
CFI TLI RMSEA SRMR Δ CFI Δ TLI Δ RMSEA Δ SRMR
Invariance level for ISCED level 2
Configural 1.000 1.000 0.000 0.000
Metric 0.981 0.971 0.059 0.068 0.019 0.029 -0.059 -0.068
Scalar 0.728 0.792 0.156 0.165 0.253 0.179 -0.097 -0.097
Invariance level for ISCED level 1
Configural 1.000 1.000 0.000 0.000
Metric 0.983 0.972 0.051 0.063 0.017 0.028 -0.051 -0.063
Scalar 0.732 0.782 0.142 0.150 0.251 0.190 -0.091 -0.087
Invariance level for ISCED level 3
Configural 1.000 1.000 0.000 0.000
Metric 0.959 0.932 0.086 0.078 0.041 0.068 -0.086 -0.078
Scalar 0.869 0.892 0.108 0.116 0.090 0.040 -0.022 -0.038
Source: OECD, TALIS 2018 database.

406
TALIS 2018 TECHNICAL REPORT © OECD 2019
Table 11.147. Invariance test results for scale T3PDELI
CFI TLI RMSEA SRMR Δ CFI Δ TLI Δ RMSEA Δ SRMR
Invariance level for ISCED level 2
Configural 0.971 0.913 0.092 0.031
Metric 0.895 0.872 0.111 0.143 0.076 0.041 -0.019 -0.112
Scalar 0.650 0.733 0.161 0.194 0.245 0.139 -0.050 -0.051
Invariance level for ISCED level 1
Configural 0.998 0.993 0.025 0.022
Metric 0.945 0.931 0.075 0.106 0.053 0.062 -0.050 -0.084
Scalar 0.727 0.783 0.133 0.164 0.218 0.148 -0.058 -0.058
Invariance level for ISCED level 3
Configural 0.990 0.970 0.059 0.024
Metric 0.961 0.950 0.077 0.099 0.029 0.02 -0.018 -0.075
Scalar 0.825 0.859 0.129 0.131 0.136 0.091 -0.052 -0.032
Source: OECD, TALIS 2018 database.
Table 11.148. Unstandardised factor loadings for school climate scales for all participating
countries/economies for all populations
T3PACAD T3PCOM T3PLACSN
TC3G27A 0.417 TC3G27D 0.441 TC3G29B 0.454
TC3G27B 0.497 TC3G27E 0.602 TC3G29K 0.608
TC3G27C 0.379 TC3G27G 0.261 TC3G29L 0.648
Source: OECD, TALIS 2018 database.
Table 11.149. Standardised factor loadings and unstandardised intercepts for
scale T3PACAD
Participating countries/economies Standardised factor loadings Unstandardised intercepts
TC3G27A TC3G27B TC3G27C TC3G27A TC3G27B TC3G27C
ISCED level 2
Alberta (Canada) 0.726 0.896 0.622 3.342 3.433 3.591
Australia1 0.614 0.849 0.582 3.184 3.159 3.227
Austria 0.581 0.743 0.423 3.410 3.223 3.258
Belgium 0.699 0.819 0.503 3.362 3.325 3.384
Flemish Community (Belgium) 0.744 0.861 0.498 3.360 3.254 3.251
Brazil 0.675 0.790 0.543 3.466 3.279 3.290
Bulgaria 0.600 0.758 0.449 3.363 2.981 2.579
Ciudad Autónoma de Buenos Aires (Argentina)
0.762 0.937 0.607 3.125 3.056 2.872
Chile 0.772 0.825 0.606 3.326 3.074 3.078
Colombia 0.712 0.888 0.540 3.655 3.402 3.538
Croatia 0.585 0.786 0.474 3.154 3.313 2.804
Cyprus 0.744 0.856 0.593 3.430 3.363 3.191
Czech Republic 0.578 0.765 0.488 3.377 3.238 2.960
Denmark 0.682 0.823 0.578 3.459 3.217 3.463
England (United Kingdom) 0.657 0.890 0.677 3.600 3.611 3.561
Estonia 0.629 0.776 0.476 3.197 3.263 2.983
Finland 0.667 0.851 0.493 3.129 3.111 2.950
France 0.565 0.712 0.467 3.418 3.568 3.550
Georgia 0.712 0.798 0.522 3.156 2.973 2.863

407
TALIS 2018 TECHNICAL REPORT © OECD 2019
Participating countries/economies Standardised factor loadings Unstandardised intercepts
TC3G27A TC3G27B TC3G27C TC3G27A TC3G27B TC3G27C
Hungary 0.633 0.765 0.438 3.369 3.314 2.905
Iceland 0.641 0.874 0.509 3.129 2.978 3.183
Israel 0.692 0.831 0.479 3.239 3.170 3.268
Italy 0.729 0.811 0.541 3.247 3.166 3.089
Japan 0.600 0.700 0.453 3.026 3.168 2.785
Kazakhstan 0.673 0.829 0.553 3.328 3.202 3.098
Korea 0.816 0.924 0.673 3.326 3.298 3.128
Latvia 0.700 0.824 0.480 3.652 3.662 3.355
Lithuania 0.562 0.728 0.382 3.330 3.242 3.112
Malta 0.744 0.880 0.630 3.367 3.389 3.477
Mexico 0.733 0.818 0.636 3.250 2.872 2.831
Netherlands 0.788 0.898 0.574 2.932 2.769 2.607
New Zealand 0.796 0.922 0.776 3.424 3.328 3.484
Norway 0.565 0.814 0.436 3.073 2.922 3.014
Portugal 0.599 0.710 0.472 3.347 3.421 3.170
Romania 0.767 0.907 0.573 3.536 3.482 3.064
Russian Federation 0.736 0.909 0.548 3.483 3.398 2.930
Saudi Arabia 0.704 0.910 0.558 3.654 3.616 3.268
Shanghai (China) 0.705 0.781 0.504 3.344 3.262 3.242
Singapore 0.765 0.872 0.661 3.446 3.382 3.424
Slovak Republic 0.716 0.886 0.576 3.272 3.189 2.765
Slovenia 0.648 0.837 0.500 3.269 3.299 3.088
South Africa2 0.610 0.714 0.504 3.466 3.380 3.387
Spain 0.712 0.890 0.613 3.198 2.992 2.845
Sweden 0.729 0.921 0.651 3.428 3.227 3.210
Chinese Taipei 0.811 0.909 0.619 3.017 3.002 3.093
Turkey 0.837 0.965 0.606 3.286 3.245 2.945
United Arab Emirates 0.773 0.929 0.625 3.534 3.460 3.174
United States 0.763 0.912 0.729 3.227 3.087 3.132
Viet Nam 0.624 0.637 0.426 3.794 3.705 3.438
ISCED level 1
Australia1 0.653 0.879 0.600 3.369 3.315 3.283
Flemish Community (Belgium) 0.748 0.811 0.531 3.360 3.254 3.251
Ciudad Autónoma de Buenos Aires (Argentina)
0.722 0.854 0.509 3.125 3.056 2.872
Denmark 0.743 0.849 0.541 3.459 3.217 3.463
England (United Kingdom) 0.763 0.899 0.688 3.600 3.611 3.561
France 0.618 0.749 0.488 3.542 3.452 3.575
Japan 0.673 0.834 0.548 3.026 3.168 2.785
Korea 0.708 0.943 0.587 3.326 3.298 3.128
Netherlands1 0.710 0.950 0.547 3.244 3.100 3.116
Spain 0.702 0.890 0.601 3.198 2.992 2.845
Sweden 0.726 0.928 0.625 3.428 3.227 3.210
Chinese Taipei 0.719 0.850 0.604 3.017 3.002 3.093
Turkey 0.801 0.875 0.540 3.286 3.245 2.945
United Arab Emirates 0.778 0.913 0.627 3.534 3.460 3.174
Viet Nam 0.835 0.934 0.637 3.794 3.705 3.438
ISCED level 3
Alberta (Canada) 0.758 0.917 0.711 3.533 3.535 3.474
Brazil 0.617 0.837 0.472 3.466 3.279 3.290
Croatia 0.520 0.656 0.342 3.154 3.313 2.804

408
TALIS 2018 TECHNICAL REPORT © OECD 2019
Participating countries/economies Standardised factor loadings Unstandardised intercepts
TC3G27A TC3G27B TC3G27C TC3G27A TC3G27B TC3G27C
Denmark 0.775 0.791 0.494 3.459 3.217 3.463
Portugal 0.633 0.780 0.538 3.347 3.421 3.170
Slovenia 0.650 0.773 0.462 3.269 3.299 3.088
Sweden 0.847 0.857 0.604 3.428 3.227 3.210
Chinese Taipei 0.804 0.901 0.641 3.017 3.002 3.093
Turkey 0.735 0.893 0.530 3.286 3.245 2.945
United Arab Emirates 0.762 0.888 0.573 3.534 3.460 3.174
Viet Nam 0.622 0.662 0.469 3.794 3.705 3.438
TALIS-PISA link
Australia 0.604 0.827 0.543 3.259 3.340 3.295
Ciudad Autónoma de Buenos Aires (Argentina)
0.724 0.889 0.519 3.258 3.232 3.006
Colombia 0.507 0.929 0.627 3.702 3.455 3.558
Czech Republic 0.641 0.765 0.497 3.279 3.113 2.824
Denmark 0.760 0.980 0.153 3.372 3.288 3.451
Georgia 0.744 0.861 0.571 3.285 3.091 3.036
Malta 0.727 0.858 0.632 3.361 3.426 3.531
Turkey 0.763 0.835 0.614 3.149 3.300 2.925
Viet Nam 0.794 0.895 0.659 3.614 3.641 3.293
1. Data from the participating country/economy was rated as insufficient during the adjudication process.
2. Participating country/economy with late data collection.
Source: OECD, TALIS 2018 database.
Table 11.150. Standardised factor loadings and unstandardised intercepts for
scale T3PCOM
Participating countries/economies Standardised factor loadings Unstandardised intercepts
TC3G27D TC3G27E TC3G27G TC3G27D TC3G27E TC3G27G
ISCED level 2
Alberta (Canada) 0.652 0.919 0.383 2.939 2.558 3.149
Australia1 0.664 0.842 0.355 3.053 2.407 3.092
Austria 0.614 0.762 0.276 2.581 2.428 2.698
Belgium 0.634 0.821 0.315 2.840 2.415 2.752
Flemish Community (Belgium) 0.715 0.886 0.367 2.747 2.532 2.708
Brazil 0.672 0.890 0.412 2.894 2.718 3.411
Bulgaria 0.569 0.941 0.345 2.478 2.388 2.876
Ciudad Autónoma de Buenos Aires (Argentina)
0.627 0.941 0.348 2.467 2.192 2.400
Chile 0.668 0.953 0.373 2.341 2.562 2.836
Colombia 0.720 0.888 0.493 2.790 2.807 3.474
Croatia 0.648 0.860 0.338 2.492 2.400 3.180
Cyprus 0.500 0.872 0.316 2.934 2.470 2.983
Czech Republic 0.437 0.648 0.200 2.483 2.297 2.700
Denmark3 - - - - - -
England (United Kingdom) 0.658 0.844 0.449 3.038 2.717 3.147
Estonia 0.570 0.758 0.304 2.683 2.499 2.928
Finland 0.569 0.785 0.293 2.736 2.266 2.694
France 0.647 0.741 0.299 3.188 2.743 3.051
Georgia 0.761 0.988 0.417 2.384 2.369 2.736

409
TALIS 2018 TECHNICAL REPORT © OECD 2019
Participating countries/economies Standardised factor loadings Unstandardised intercepts
TC3G27D TC3G27E TC3G27G TC3G27D TC3G27E TC3G27G
Hungary 0.621 0.820 0.371 2.788 2.663 3.319
Iceland 0.566 0.942 0.326 2.661 2.258 2.624
Israel 0.599 0.923 0.430 3.055 2.561 2.877
Italy 0.365 0.597 0.237 2.672 2.937 3.530
Japan 0.623 0.800 0.322 2.596 2.713 2.743
Kazakhstan 0.635 0.896 0.394 2.735 2.781 2.902
Korea 0.721 0.968 0.433 2.930 2.800 3.127
Latvia 0.470 0.656 0.241 3.049 3.062 3.375
Lithuania 0.551 0.818 0.311 2.715 2.611 3.274
Malta 0.574 0.826 0.321 3.005 2.525 2.513
Mexico 0.572 0.766 0.241 2.202 2.250 2.567
Netherlands 0.617 0.796 0.309 2.735 2.453 2.607
New Zealand 0.587 0.810 0.434 3.058 2.897 3.288
Norway 0.544 0.855 0.300 2.743 2.381 2.307
Portugal 0.577 0.734 0.369 2.862 2.762 3.610
Romania 0.754 0.973 0.492 2.487 2.428 3.519
Russian Federation 0.691 0.989 0.440 2.669 2.676 3.016
Saudi Arabia 0.647 0.908 0.430 2.646 2.314 3.240
Shanghai (China) 0.734 0.937 0.464 3.129 2.887 3.145
Singapore 0.671 0.896 0.406 3.297 2.625 2.875
Slovak Republic 0.647 0.836 0.319 2.346 2.205 2.881
Slovenia 0.459 0.724 0.266 2.952 2.369 3.382
South Africa2 0.551 0.719 0.746 2.557 2.461 3.108
Spain 0.650 0.858 0.343 2.717 2.358 2.915
Sweden3 - - - - - -
Chinese Taipei 0.634 0.916 0.346 2.736 2.464 2.950
Turkey 0.686 0.918 0.428 2.692 2.463 3.009
United Arab Emirates 0.689 0.940 0.473 2.968 2.833 3.367
United States 0.781 0.948 0.473 2.835 2.607 3.293
Viet Nam 0.707 0.847 0.484 3.103 2.883 3.515
ISCED level 1
Australia1 0.589 0.841 0.375 2.993 2.722 3.162
Flemish Community (Belgium) 0.663 0.806 0.339 2.747 2.532 2.708
Ciudad Autónoma de Buenos Aires (Argentina)
0.607 0.767 0.324 2.467 2.192 2.400
Denmark3 - - - - - -
England (United Kingdom) 0.724 0.911 0.418 3.038 2.717 3.147
France 0.700 0.874 0.361 3.085 2.760 2.880
Japan 0.545 0.698 0.287 2.615 3.004 3.071
Korea 0.748 0.993 0.513 2.930 2.800 3.127
Netherlands1 0.685 0.814 0.383 2.686 2.782 2.677
Spain 0.689 0.957 0.400 2.728 2.585 3.128
Sweden3 - - - - - -
Chinese Taipei 0.720 0.964 0.437 2.856 2.709 3.152
Turkey 0.722 0.962 0.453 2.736 2.617 2.897
United Arab Emirates 0.703 0.958 0.480 2.968 2.833 3.367
Viet Nam 0.714 0.975 0.496 3.188 3.015 3.427
ISCED level 3

410
TALIS 2018 TECHNICAL REPORT © OECD 2019
Participating countries/economies Standardised factor loadings Unstandardised intercepts
TC3G27D TC3G27E TC3G27G TC3G27D TC3G27E TC3G27G
Alberta (Canada) 0.669 0.917 0.399 2.939 2.558 3.149
Brazil 0.711 0.958 0.474 2.894 2.718 3.411
Croatia 0.570 0.707 0.228 2.607 2.232 3.079
Denmark3 - - - - - -
Portugal 0.558 0.739 0.402 2.771 2.587 3.733
Slovenia 0.479 0.667 0.233 3.087 2.282 2.981
Sweden3 - - - - - -
Chinese Taipei 0.647 0.860 0.303 2.857 2.482 2.940
Turkey 0.602 0.990 0.446 2.622 2.298 2.568
United Arab Emirates 0.697 0.942 0.487 2.968 2.833 3.367
Viet Nam 0.640 0.909 0.479 3.071 2.850 3.188
TALIS-PISA link
Australia 0.610 0.892 0.367 2.986 2.425 3.072
Ciudad Autónoma de Buenos Aires (Argentina)
0.611 0.939 0.329 2.666 2.285 2.388
Colombia 0.662 0.948 0.415 2.779 2.699 3.463
Czech Republic 0.627 0.771 0.355 2.377 2.316 2.640
Denmark 0.785 0.873 0.381 3.030 2.801 3.020
Georgia 0.704 0.923 0.348 2.333 2.350 2.526
Malta 0.616 0.862 0.352 3.095 2.563 2.543
Turkey 0.554 0.986 0.372 2.853 2.299 2.436
Viet Nam 0.661 0.986 0.457 3.023 2.826 3.339
1. Data from the participating country/economy was rated as insufficient during the adjudication process.
2. Participating country/economy with late data collection.
3. This participating country/economy was excluded from the scale.
Source: OECD, TALIS 2018 database.
Table 11.151. Standardised factor loadings and unstandardised intercepts for
scale T3PLACSN
Participating countries/economies Standardised factor loadings Unstandardised intercepts
TC3G29B TC3G29K TC3G29L TC3G29B TC3G29K TC3G29L
ISCED level 2
Alberta (Canada) 0.492 0.745 0.786 1.811 1.437 1.378
Australia1 0.568 0.393 0.991 1.858 1.447 1.474
Austria 0.495 0.827 0.853 1.684 1.736 1.696
Belgium 0.559 0.795 0.926 2.568 2.069 2.060
Flemish Community (Belgium) 0.541 0.822 0.931 2.418 1.977 1.905
Brazil 0.575 0.815 0.787 2.776 2.558 2.344
Bulgaria 0.526 0.891 0.900 1.896 1.536 1.599
Ciudad Autónoma de Buenos Aires (Argentina)
0.465 0.733 0.872 2.008 1.546 1.460
Chile 0.567 0.673 0.819 2.105 1.811 1.763
Colombia 0.593 0.755 0.798 3.019 3.036 2.521
Croatia 0.414 0.726 0.774 2.115 1.326 1.394
Cyprus 0.529 0.794 0.935 1.866 1.708 1.564
Czech Republic 0.420 0.557 0.853 2.160 1.799 1.417
Denmark 0.570 0.835 0.838 2.128 1.751 1.843
England (United Kingdom) 0.513 0.734 0.797 1.968 1.455 1.601

411
TALIS 2018 TECHNICAL REPORT © OECD 2019
Participating countries/economies Standardised factor loadings Unstandardised intercepts
TC3G29B TC3G29K TC3G29L TC3G29B TC3G29K TC3G29L
Estonia 0.498 0.743 0.815 2.519 1.657 1.782
Finland 0.319 0.515 0.580 1.872 1.541 1.398
France 0.511 0.513 0.696 2.879 2.324 2.619
Georgia 0.453 0.616 0.658 1.633 1.579 1.687
Hungary 0.438 0.628 0.784 2.129 1.616 1.803
Iceland 0.547 0.803 0.822 1.871 1.968 1.495
Israel 0.595 0.754 0.846 2.324 2.159 2.061
Italy 0.504 0.750 0.842 2.465 2.552 2.285
Japan 0.488 0.624 0.777 2.476 1.762 1.911
Kazakhstan 0.612 0.736 0.827 1.686 2.068 1.541
Korea 0.572 0.758 0.910 1.568 1.848 1.736
Latvia 0.403 0.610 0.767 2.027 1.507 1.537
Lithuania 0.516 0.718 0.832 1.881 1.449 1.730
Malta 0.421 0.694 0.741 2.202 1.736 1.633
Mexico 0.430 0.670 0.740 2.242 1.645 1.781
Netherlands 0.485 0.786 0.889 2.085 1.462 1.419
New Zealand 0.559 0.750 0.928 2.041 1.965 1.709
Norway 0.369 0.479 0.626 1.931 1.758 1.419
Portugal 0.543 0.677 0.790 2.461 2.267 2.115
Romania 0.629 0.898 0.947 2.463 1.776 1.927
Russian Federation 0.469 0.602 0.793 1.760 1.440 1.331
Saudi Arabia 0.641 0.843 0.895 2.627 2.293 2.243
Shanghai (China) 0.548 0.653 0.763 2.078 2.245 1.844
Singapore 0.386 0.709 0.749 2.022 1.244 1.313
Slovak Republic 0.451 0.764 0.856 2.129 1.628 1.587
Slovenia 0.446 0.649 0.865 2.103 1.676 1.574
South Africa2 0.386 0.639 0.644 2.695 2.194 2.221
Spain 0.539 0.736 0.748 2.019 1.795 1.759
Sweden 0.473 0.761 0.796 2.113 1.800 1.649
Chinese Taipei 0.467 0.583 0.651 1.443 2.100 1.868
Turkey 0.435 0.588 0.709 2.200 1.951 1.895
United Arab Emirates 0.649 0.850 0.892 2.426 2.113 1.919
United States 0.491 0.745 0.716 2.042 1.680 1.544
Viet Nam 0.554 0.707 0.842 2.761 2.325 2.256
ISCED level 1
Australia1 0.597 0.783 0.848 1.940 1.517 1.597
Flemish Community (Belgium) 0.594 0.855 0.891 2.418 1.977 1.905
Ciudad Autónoma de Buenos Aires (Argentina)
0.412 0.681 0.823 2.367 1.600 1.481
Denmark 0.576 0.663 0.837 2.128 1.751 1.843
England (United Kingdom) 0.543 0.690 0.792 1.684 1.567 1.485
France 0.414 0.498 0.619 2.879 2.324 2.619
Japan 0.495 0.638 0.788 2.476 1.762 1.911
Korea 0.541 0.690 0.750 1.568 1.848 1.736
Netherlands1 0.537 0.821 0.901 1.983 1.479 1.438
Spain 0.528 0.611 0.812 1.959 2.060 1.635
Sweden 0.512 0.735 0.787 2.113 1.800 1.649
Chinese Taipei 0.440 0.622 0.805 1.694 2.137 1.762
Turkey 0.433 0.636 0.711 2.200 1.951 1.895
United Arab Emirates 0.665 0.849 0.889 2.426 2.113 1.919
Viet Nam 0.610 0.734 0.856 2.761 2.325 2.256

412
TALIS 2018 TECHNICAL REPORT © OECD 2019
Participating countries/economies Standardised factor loadings Unstandardised intercepts
TC3G29B TC3G29K TC3G29L TC3G29B TC3G29K TC3G29L
ISCED level 3
Alberta (Canada) 0.459 0.686 0.854 1.811 1.437 1.378
Brazil 0.558 0.703 0.852 2.776 2.558 2.344
Croatia 0.402 0.654 0.866 1.843 1.436 1.420
Denmark 0.528 0.795 0.891 2.128 1.751 1.843
Portugal 0.562 0.766 0.836 2.461 2.267 2.115
Slovenia 0.497 0.735 0.888 2.103 1.676 1.574
Sweden 0.378 0.653 0.758 2.113 1.800 1.649
Chinese Taipei 0.427 0.715 0.717 1.609 1.894 1.683
Turkey 0.476 0.660 0.782 2.200 1.951 1.895
United Arab Emirates 0.624 0.844 0.900 2.426 2.113 1.919
Viet Nam 0.460 0.578 0.716 2.761 2.325 2.256
TALIS-PISA link
Australia 0.574 0.775 0.802 2.136 1.582 1.712
Ciudad Autónoma de Buenos Aires (Argentina)
0.501 0.759 0.862 2.013 1.533 1.522
Colombia 0.470 0.564 0.720 2.956 2.919 2.442
Czech Republic 0.495 0.661 0.927 2.137 1.842 1.453
Denmark 0.590 0.706 0.864 2.109 1.610 1.810
Georgia 0.577 0.755 0.838 1.697 1.553 1.609
Malta 0.481 0.803 0.840 2.193 1.756 1.640
Turkey 0.529 0.642 0.906 1.991 2.013 1.706
Viet Nam 0.527 0.635 0.729 2.624 2.538 2.234
1. Data from the participating country/economy was rated as insufficient during the adjudication process.
2. Participating country/economy with late data collection.
Source: OECD, TALIS 2018 database.
Table 11.152. Standardised factor loadings and unstandardised intercepts for
scale T3PDELI
Participating countries/economies
Standardised factor loadings Unstandardised intercepts
TC3G30A TC3G30B TC3G30C TC3G30D TC3G30A TC3G30B TC3G30C TC3G30D
ISCED level 2
Alberta (Canada) 0.606 0.738 0.506 0.439 1.876 2.496 1.549 1.720
Australia1 0.719 0.732 0.838 0.862 2.062 2.947 1.928 2.062
Austria 0.529 0.601 0.614 0.656 1.898 2.573 1.768 1.700
Belgium 0.411 0.693 0.628 0.718 2.224 3.156 1.863 2.111
Flemish Community (Belgium) 0.451 0.651 0.756 0.659 2.258 3.272 1.855 2.256
Brazil 0.847 0.728 0.864 0.817 1.974 2.635 1.801 1.977
Bulgaria 0.794 0.694 0.771 0.790 2.161 2.752 1.915 1.709
Ciudad Autónoma de Buenos Aires (Argentina)
0.484 0.855 0.755 0.662 1.579 1.937 1.366 1.376
Chile 0.589 0.805 0.645 0.292 1.487 1.981 1.566 1.174
Colombia 0.402 0.717 0.876 0.896 1.907 2.231 1.663 1.620
Croatia 0.561 0.605 0.698 0.556 1.598 2.081 1.614 1.415
Cyprus 0.689 0.824 0.821 0.711 2.086 2.489 1.738 1.691
Czech Republic 0.669 0.721 0.559 0.441 1.968 2.117 1.542 1.344
Denmark 0.605 0.728 0.711 0.791 1.918 2.214 1.761 2.081
England (United Kingdom) 0.541 0.593 0.801 0.776 2.046 2.634 1.953 1.987
Estonia 0.576 0.683 0.519 0.745 1.828 2.557 1.615 2.085
Finland 0.543 0.838 0.584 0.590 2.301 3.018 2.017 2.112

413
TALIS 2018 TECHNICAL REPORT © OECD 2019
Participating countries/economies
Standardised factor loadings Unstandardised intercepts
TC3G30A TC3G30B TC3G30C TC3G30D TC3G30A TC3G30B TC3G30C TC3G30D
France 0.494 0.625 0.670 0.665 2.009 2.915 1.988 1.757
Georgia 0.611 0.807 0.722 0.396 1.172 1.544 1.220 1.045
Hungary 0.639 0.651 0.722 0.760 2.021 2.303 1.772 1.425
Iceland 0.744 0.649 0.739 0.741 1.806 2.164 1.860 2.022
Israel 0.639 0.853 0.755 0.368 2.071 2.621 2.157 1.423
Italy 0.549 0.681 0.646 0.662 1.502 2.093 1.316 1.433
Japan 0.547 0.713 0.828 0.693 1.364 1.608 1.394 1.265
Kazakhstan 0.476 0.909 0.632 0.381 1.400 1.316 1.184 1.109
Korea 0.697 0.822 0.828 0.634 1.668 1.766 1.581 1.396
Latvia 0.504 0.891 0.516 0.709 1.642 2.360 1.529 1.508
Lithuania 0.455 0.420 0.667 0.689 1.496 2.530 1.416 1.450
Malta 0.740 0.763 0.606 0.792 2.000 2.886 1.926 1.655
Mexico 0.856 0.832 0.879 0.449 1.952 2.320 1.805 1.282
Netherlands 0.708 0.673 0.547 0.798 2.190 2.586 1.638 1.897
New Zealand 0.614 0.639 0.631 0.874 1.880 3.034 1.831 1.955
Norway 0.637 0.564 0.664 0.521 2.009 2.588 1.793 1.967
Portugal 0.715 0.717 0.669 0.755 1.993 2.264 1.846 1.925
Romania 0.591 0.739 0.805 0.518 1.418 2.155 1.501 1.301
Russian Federation 0.520 0.987 0.485 0.637 1.369 1.362 1.185 1.234
Saudi Arabia 0.652 0.838 0.867 0.809 1.598 1.870 1.363 1.370
Shanghai (China) 0.646 0.780 0.605 0.480 1.388 1.346 1.160 1.097
Singapore 0.474 0.661 0.612 0.650 1.877 2.185 1.594 1.481
Slovak Republic 0.541 0.692 0.698 0.647 1.798 2.192 1.610 1.386
Slovenia 0.682 0.674 0.624 0.629 1.878 2.595 1.731 1.634
South Africa2 0.783 0.805 0.835 0.622 2.680 3.000 2.055 1.822
Spain 0.595 0.663 0.753 0.683 1.768 2.172 1.644 1.640
Sweden 0.535 0.483 0.744 0.751 2.251 2.903 1.878 1.992
Chinese Taipei 0.668 0.800 0.765 0.544 1.880 1.901 1.723 1.513
Turkey 0.729 0.787 0.747 0.730 1.788 2.073 1.808 1.385
United Arab Emirates 0.716 0.755 0.684 0.652 1.663 2.125 1.531 1.401
United States 0.771 0.512 0.873 0.587 1.824 2.828 1.690 1.911
Viet Nam 0.675 0.675 0.379 0.300 1.351 1.645 1.141 1.039
ISCED level 1
Australia1 0.582 0.839 0.793 0.861 1.872 2.628 2.060 1.967
Flemish Community (Belgium) 0.473 0.627 0.649 0.824 1.776 2.915 2.056 1.854
Ciudad Autónoma de Buenos Aires (Argentina)
0.606 0.854 0.717 0.626 1.298 1.878 1.589 1.372
Denmark 0.565 0.777 0.794 0.770 1.744 2.347 2.027 2.408
England (United Kingdom) 0.568 0.823 0.752 0.648 1.487 2.075 1.850 1.637
France 0.538 0.713 0.759 0.562 1.477 2.535 1.649 1.394
Japan 0.595 0.656 0.762 0.715 1.350 1.877 1.457 1.252
Korea 0.651 0.629 0.818 0.681 1.302 1.661 1.321 1.187
Netherlands1 0.518 0.438 0.558 0.817 1.680 2.312 1.595 1.488
Spain 0.684 0.562 0.598 0.696 1.255 1.873 1.466 1.359
Sweden 0.627 0.620 0.816 0.801 1.860 2.638 1.964 2.012
Chinese Taipei 0.618 0.747 0.763 0.421 1.693 1.683 1.440 1.187
Turkey 0.630 0.571 0.577 0.677 1.788 2.073 1.808 1.385
United Arab Emirates 0.604 0.822 0.746 0.606 1.576 2.092 1.599 1.307
Viet Nam 0.340 0.977 0.200 0.198 1.117 1.249 1.057 1.014
ISCED level 3
Alberta (Canada) 0.696 0.717 0.625 0.428 1.876 2.496 1.549 1.720

414
TALIS 2018 TECHNICAL REPORT © OECD 2019
Participating countries/economies
Standardised factor loadings Unstandardised intercepts
TC3G30A TC3G30B TC3G30C TC3G30D TC3G30A TC3G30B TC3G30C TC3G30D
Brazil 0.731 0.711 0.824 0.816 1.974 2.635 1.801 1.977
Croatia 0.560 0.706 0.630 0.569 1.720 1.933 1.421 1.444
Denmark 0.472 0.670 0.639 0.845 1.723 1.901 1.358 1.699
Portugal 0.718 0.720 0.671 0.694 1.993 2.264 1.846 1.925
Slovenia 0.640 0.649 0.673 0.630 1.757 2.019 1.311 1.495
Sweden 0.614 0.736 0.775 0.798 1.915 2.227 1.568 1.637
Chinese Taipei 0.699 0.799 0.776 0.596 1.911 1.882 1.747 1.628
Turkey 0.714 0.851 0.777 0.574 1.788 2.073 1.808 1.385
United Arab Emirates 0.657 0.737 0.640 0.654 1.644 2.013 1.484 1.423
Viet Nam 0.658 0.600 0.640 0.560 1.391 1.720 1.207 1.072
TALIS-PISA link
Australia 0.756 0.751 0.834 0.715 2.036 2.920 2.000 2.261
Ciudad Autónoma de Buenos Aires (Argentina)
0.541 0.825 0.707 0.468 1.706 2.031 1.459 1.373
Colombia 0.716 0.828 0.744 0.651 1.809 2.063 1.456 1.426
Czech Republic 0.694 0.566 0.481 0.485 1.926 1.963 1.460 1.264
Denmark 0.497 0.967 0.691 0.604 1.833 2.184 1.663 1.975
Georgia 0.699 0.683 0.890 0.265 1.120 1.466 1.232 1.098
Malta 0.744 0.686 0.600 0.795 2.020 2.828 1.830 1.598
Turkey 0.869 0.832 0.628 0.636 1.385 1.556 1.449 1.133
Viet Nam 0.595 0.751 0.835 0.757 1.329 1.698 1.228 1.134
1. Data from the participating country/economy was rated as insufficient during the adjudication process.
2. Participating country/economy with late data collection.
Source: OECD, TALIS 2018 database.
Innovation: Organisational innovativeness (T3PORGIN)
11.76. Measured items
One scale measured innovation concepts with this question stem:
“How strongly do you agree or disagree with the following statements?” (TC3G28),
which was followed by items regarding school flexibility toward change that were
used to form the scale Organisational innovativeness (T3PORGIN).
The scale is presented in Table 11.153.
11.77. Model improvements
A correlation between items TC3G28A and TC3G28B was added to scale T3PORGIN.
11.78. Scale reliability
Table 11.154 presents the reliability coefficients for scale T3PORGIN. For nearly all
populations, the coefficient is strong, but it is acceptable for the Slovenia ISCED level 2
and Viet Nam ISCED level 3 populations and weak for the Viet Nam ISCED level 2
population.
11.79. Model fits
Table 11.155, which presents the model fit indices for the scale T3PORGIN, shows an
acceptable model fit in all populations except the Malta ISCED level 2 population.

415
TALIS 2018 TECHNICAL REPORT © OECD 2019
11.80. Invariance testing
The measurement invariance testing results for scale T3PORGIN are presented in Table
11.156. The configural models exhibit an acceptable fit for the ISCED levels 1 and 2
populations, with the difference between the configural and metric models greater than the
acceptable cut-off criteria. The scale can therefore be considered configural invariant for
the ISCED 1 and 2 levels. Although the difference between the configural and metric
models for ISCED level 3 level is acceptable based on the cut-off criteria, use of a metric
invariant ISCED level 3 model in the final model revealed that the scale performed very
poorly. The ISCED level 3 level model was consequently relaxed to configural invariant,
resulting in configural models for all ISCED levels for this scale.
11.81. Item parameters
The unstandardised item parameters for T3PORGIN are not reported here because the scale
reached configural invariance and the item parameters were country-specific.
Table 11.157 presents the standardised factor loadings and unstandardised intercepts for
the scale T3PORGIN. Factor loadings for items TC3G28C and TC3G28D are strong in
nearly all populations and of moderate strength in a few populations; there are no weak
factor loadings. Item TC3G28B exhibits not only strong relationships with the latent factor
in most populations, but also moderate factor loadings for more populations in comparison
with the other items in the scale, and weak relationships for the Viet Nam ISCED levels 2
and 3 populations. In addition to exhibiting some strong factor loadings, TC3G28A has,
compared to other items in the scale, the largest number of moderate strength factor
loadings. It also exhibits the largest number of weak relationships among the four items in
the following populations: Kazakhstan, Korea, the Netherlands, Norway, Romania and
Viet Nam ISCED level 2; Korea and the Netherlands ISCED level 1; Viet Nam ISCED
level 3; and the Czech Republic and Georgia TALIS-PISA link.
Table 11.153. Item wording for the innovation scale
T3PORGIN: Organisational innovativeness
TC3G28: How strongly do you agree or disagree with the following statements?
Response options: “Strongly disagree” (1), “Disagree” (2), “Agree” (3), and “Strongly agree” (4).
TC3G28A This school quickly identifies the need to do things differently
TC3G28B This school quickly responds to changes when needed
TC3G28C This school readily accepts new ideas
TC3G28D This school makes assistance readily available for the development of new ideas
Source: OECD, TALIS 2018 database.
Table 11.154. Omega coefficient for the scale on innovation
Participating countries/economies T3PORGIN
Omega coefficient
ISCED level 2
Alberta (Canada) 0.830
Australia1 0.908
Austria 0.832
Belgium 0.792
Flemish Community (Belgium) 0.854
Brazil 0.891

416
TALIS 2018 TECHNICAL REPORT © OECD 2019
Participating countries/economies T3PORGIN
Omega coefficient
Bulgaria 0.885
Ciudad Autónoma de Buenos Aires (Argentina) 0.857
Chile 0.891
Colombia 0.904
Croatia 0.863
Cyprus 0.903
Czech Republic 0.850
Denmark 0.910
England (United Kingdom) 0.846
Estonia 0.801
Finland 0.812
France 0.878
Georgia 0.830
Hungary 0.906
Iceland 0.910
Israel 0.889
Italy 0.916
Japan 0.856
Kazakhstan 0.796
Korea 0.859
Latvia 0.857
Lithuania 0.906
Malta 0.865
Mexico 0.845
Netherlands 0.767
New Zealand 0.893
Norway 0.839
Portugal 0.846
Romania 0.874
Russian Federation 0.852
Saudi Arabia 0.835
Shanghai (China) 0.876
Singapore 0.841
Slovak Republic 0.941
Slovenia 0.642
South Africa2 0.852
Spain 0.823
Sweden 0.852
Chinese Taipei 0.976
Turkey 0.891
United Arab Emirates 0.916
United States 0.874
Viet Nam 0.578
ISCED level 1
Australia1 0.865
Flemish Community (Belgium) 0.785
Ciudad Autónoma de Buenos Aires (Argentina) 0.872
Denmark 0.937
England (United Kingdom) 0.920

417
TALIS 2018 TECHNICAL REPORT © OECD 2019
Participating countries/economies T3PORGIN
Omega coefficient
France 0.874
Japan 0.780
Korea 0.935
Netherlands1 0.850
Spain 0.906
Sweden 0.914
Chinese Taipei 0.964
Turkey 0.908
United Arab Emirates 0.906
Viet Nam 0.746
ISCED level 3
Alberta (Canada) 0.895
Brazil 0.846
Croatia 0.906
Denmark 0.931
Portugal 0.755
Slovenia 0.828
Sweden 0.843
Chinese Taipei 0.904
Turkey 0.887
United Arab Emirates 0.916
Viet Nam 0.640
TALIS-PISA link
Australia 0.891
Ciudad Autónoma de Buenos Aires (Argentina) 0.914
Colombia 0.912
Czech Republic 0.794
Denmark 0.924
Georgia 0.834
Malta 0.857
Turkey 0.899
Viet Nam 0.882
1. Data from the participating country/economy was rated as insufficient during the adjudication process.
2. Participating country/economy with late data collection.
Source: OECD, TALIS 2018 database.
Table 11.155. CFA model-data fit for scale T3PORGIN
Organisational innovativeness
Participating countries/economies CFI TLI RMSEA SRMR
ISCED level 2
Alberta (Canada) 1.000 1.052 0.000 0.001
Australia1 0.982 0.890 0.090 0.021
Austria 0.976 0.856 0.145 0.017
Belgium 0.992 0.953 0.075 0.019
Flemish Community (Belgium) 0.998 0.986 0.051 0.020
Brazil 0.983 0.899 0.115 0.018
Bulgaria 1.000 1.024 0.000 0.007
Ciudad Autónoma de Buenos Aires (Argentina) 1.000 1.050 0.000 0.001

418
TALIS 2018 TECHNICAL REPORT © OECD 2019
Participating countries/economies CFI TLI RMSEA SRMR
Chile 1.000 1.034 0.000 0.001
Colombia 1.000 1.105 0.000 0.002
Croatia 1.000 1.057 0.000 0.001
Cyprus 1.000 1.069 0.000 0.000
Czech Republic 0.990 0.942 0.082 0.012
Denmark 1.000 1.018 0.000 0.005
England (United Kingdom) 0.932 0.590 0.210 0.032
Estonia 1.000 1.009 0.000 0.007
Finland 1.000 1.056 0.000 0.000
France 0.984 0.902 0.148 0.015
Georgia 1.000 1.045 0.000 0.002
Hungary 1.000 1.026 0.000 0.002
Iceland 1.000 1.039 0.000 0.003
Israel 0.994 0.967 0.075 0.012
Italy 1.000 1.027 0.000 0.005
Japan 1.000 1.004 0.000 0.009
Kazakhstan 1.000 1.011 0.000 0.009
Korea 1.000 1.020 0.000 0.014
Latvia 1.000 1.071 0.000 0.008
Lithuania 0.945 0.670 0.215 0.030
Malta3 - - - 0.053
Mexico 1.000 1.046 0.000 0.001
Netherlands 1.000 1.051 0.000 0.008
New Zealand 1.000 1.005 0.000 0.008
Norway 1.000 1.031 0.000 0.011
Portugal 0.998 0.987 0.040 0.009
Romania 1.000 1.056 0.000 0.001
Russian Federation 1.000 1.006 0.000 0.012
Saudi Arabia 0.964 0.781 0.177 0.018
Shanghai (China) 0.992 0.954 0.088 0.011
Singapore 1.000 1.035 0.000 0.005
Slovak Republic 1.000 1.036 0.000 0.000
Slovenia 0.965 0.788 0.130 0.017
South Africa2 1.000 1.055 0.000 0.001
Spain 1.000 1.040 0.000 0.001
Sweden 1.000 1.033 0.000 0.005
Chinese Taipei 0.952 0.713 0.225 0.035
Turkey 1.000 1.005 0.000 0.007
United Arab Emirates 0.998 0.986 0.057 0.007
United States 1.000 1.017 0.000 0.011
Viet Nam 1.000 1.065 0.000 0.006
ISCED level 1
Australia1 0.919 0.517 0.185 0.042
Flemish Community (Belgium) 1.000 1.047 0.000 0.001
Ciudad Autónoma de Buenos Aires (Argentina) 0.968 0.811 0.189 0.022
Denmark 1.000 1.003 0.000 0.004
England (United Kingdom) 1.000 1.005 0.000 0.006
France 0.980 0.882 0.141 0.022
Japan 0.991 0.944 0.077 0.011
Korea 0.964 0.785 0.131 0.007
Netherlands1 1.000 1.041 0.000 0.004
Spain 1.000 1.019 0.000 0.001

419
TALIS 2018 TECHNICAL REPORT © OECD 2019
Participating countries/economies CFI TLI RMSEA SRMR
Sweden 1.000 1.010 0.000 0.005
Chinese Taipei 0.987 0.921 0.099 0.022
Turkey 0.999 0.992 0.029 0.006
United Arab Emirates 1.000 1.005 0.000 0.004
Viet Nam 0.954 0.725 0.189 0.023
ISCED level 3
Alberta (Canada) 1.000 1.035 0.000 0.004
Brazil 1.000 0.997 0.018 0.014
Croatia 1.000 1.027 0.000 0.003
Denmark 0.952 0.715 0.249 0.011
Portugal 0.948 0.686 0.169 0.027
Slovenia 1.000 1.048 0.000 0.006
Sweden 1.000 1.083 0.000 0.000
Chinese Taipei 0.981 0.885 0.158 0.019
Turkey 0.979 0.876 0.098 0.014
United Arab Emirates 0.999 0.994 0.032 0.007
Viet Nam 1.000 1.027 0.000 0.012
TALIS-PISA link
Australia 0.979 0.876 0.202 0.022
Ciudad Autónoma de Buenos Aires (Argentina) 0.972 0.833 0.163 0.015
Colombia 1.000 1.065 0.000 0.002
Czech Republic 1.000 1.086 0.000 0.004
Denmark 0.998 0.989 0.052 0.008
Georgia 0.969 0.812 0.100 0.017
Malta3 - - - 0.051
Turkey 1.000 1.065 0.000 0.004
Viet Nam 0.984 0.903 0.107 0.020
1. Data from the participating country/economy was rated as insufficient during the adjudication process.
2. Participating country/economy with late data collection.
3. As the correction factor for this participating country/economy was negative, only the SRMR is reported.
Source: OECD, TALIS 2018 database.
Table 11.156. Invariance test results for scale T3PORGIN
CFI TLI RMSEA SRMR Δ CFI Δ TLI Δ RMSEA Δ SRMR
Invariance level for ISCED level 2
Configural 0.996 0.976 0.055 0.013
Metric 0.973 0.958 0.073 0.170 0.023 0.018 -0.018 -0.157
Scalar 0.877 0.893 0.117 0.204 0.096 0.065 -0.044 -0.034
Invariance level for ISCED level 1
Configural 0.996 0.974 0.061 0.012
Metric 0.968 0.949 0.086 0.183 0.028 0.025 -0.025 -0.171
Scalar 0.892 0.901 0.120 0.219 0.076 0.048 -0.034 -0.036
Invariance level for ISCED level 3
Configural 0.992 0.952 0.082 0.013
Metric 0.976 0.962 0.073 0.129 0.016 -0.010 0.009 -0.116
Scalar 0.885 0.893 0.122 0.169 0.091 0.069 -0.049 -0.040
Source: OECD, TALIS 2018 database.

420
TALIS 2018 TECHNICAL REPORT © OECD 2019
Table 11.157. Standardised factor loadings and unstandardised intercepts for
scale T3PORGIN
Participating countries/economies
Standardised factor loadings Unstandardised intercepts
TC3G28A TC3G28B TC3G28C TC3G28D TC3G28A TC3G28B TC3G28C TC3G28D
ISCED level 2
Alberta (Canada) 0.606 0.655 0.769 0.851 3.017 3.079 3.038 3.140
Australia1 0.809 0.918 0.693 0.602 3.205 3.118 3.113 3.158
Austria 0.628 0.719 0.834 0.767 3.151 3.135 2.984 3.191
Belgium 0.550 0.748 0.689 0.764 2.941 2.833 2.795 2.886
Flemish Community (Belgium) 0.737 0.845 0.695 0.708 2.942 2.904 2.686 2.802
Brazil 0.696 0.791 0.869 0.871 3.312 3.208 3.199 3.343
Bulgaria 0.685 0.589 0.816 0.908 3.094 3.196 3.142 3.102
Ciudad Autónoma de Buenos Aires (Argentina)
0.574 0.722 0.804 0.863 3.036 3.023 3.184 3.102
Chile 0.746 0.702 0.846 0.893 3.280 3.260 3.197 3.249
Colombia 0.466 0.737 0.912 0.864 3.321 3.307 3.286 3.311
Croatia 0.657 0.761 0.864 0.778 3.125 2.999 3.075 3.045
Cyprus 0.556 0.778 0.917 0.845 3.267 3.237 3.210 3.261
Czech Republic 0.592 0.606 0.739 0.884 3.139 3.114 3.131 3.105
Denmark 0.675 0.666 0.903 0.907 3.169 3.151 3.301 3.343
England (United Kingdom) 0.655 0.789 0.845 0.739 3.361 3.360 3.310 3.284
Estonia 0.566 0.593 0.810 0.766 3.025 3.068 3.150 2.984
Finland 0.623 0.674 0.791 0.765 2.888 3.085 3.044 3.167
France 0.755 0.824 0.857 0.801 2.759 2.763 2.875 2.817
Georgia 0.473 0.559 0.858 0.782 3.040 3.185 3.166 3.177
Hungary 0.535 0.616 0.893 0.912 3.166 3.157 3.351 3.260
Iceland 0.559 0.609 0.925 0.879 3.032 3.172 3.312 3.301
Israel 0.677 0.662 0.872 0.886 3.156 3.169 3.342 3.338
Italy 0.836 0.848 0.866 0.746 2.725 2.780 2.708 2.709
Japan 0.596 0.641 0.824 0.863 2.966 2.999 2.756 2.766
Kazakhstan 0.408 0.650 0.804 0.750 3.024 3.179 3.203 3.262
Korea 0.373 0.665 0.894 0.759 3.306 3.329 3.442 3.472
Latvia 0.592 0.623 0.898 0.693 3.142 3.230 3.139 3.192
Lithuania 0.683 0.525 0.935 0.792 3.291 3.391 3.183 3.250
Malta 0.611 0.815 0.761 0.865 3.227 3.191 3.095 3.209
Mexico 0.603 0.729 0.776 0.844 3.217 3.119 2.903 3.011
Netherlands 0.346 0.603 0.778 0.736 2.974 2.872 2.538 2.812
New Zealand 0.845 0.874 0.747 0.864 3.212 3.217 3.169 3.192
Norway 0.372 0.564 0.861 0.807 2.914 2.966 2.768 2.871
Portugal 0.524 0.631 0.840 0.835 3.079 3.074 3.211 3.161
Romania 0.271 0.452 0.855 0.892 2.831 3.214 3.544 3.487
Russian Federation 0.661 0.696 0.823 0.835 2.977 3.104 2.953 3.010
Saudi Arabia 0.486 0.580 0.821 0.842 3.211 3.402 3.697 3.600
Shanghai (China) 0.765 0.833 0.835 0.832 3.231 3.293 3.209 3.368
Singapore 0.638 0.626 0.848 0.801 3.176 3.250 3.158 3.239
Slovak Republic 0.523 0.494 0.807 0.965 3.151 3.179 3.261 3.263
Slovenia 0.469 0.664 0.594 0.501 3.161 3.235 3.022 3.149
South Africa2 0.541 0.727 0.815 0.850 3.113 3.185 3.241 3.156
Spain 0.559 0.589 0.847 0.763 3.009 3.037 3.117 3.124
Sweden 0.609 0.784 0.835 0.794 3.002 3.000 3.145 3.124
Chinese Taipei 0.461 0.610 0.987 0.775 3.104 3.123 3.113 3.236
Turkey 0.683 0.762 0.892 0.856 3.199 3.267 3.146 3.278

421
TALIS 2018 TECHNICAL REPORT © OECD 2019
Participating countries/economies
Standardised factor loadings Unstandardised intercepts
TC3G28A TC3G28B TC3G28C TC3G28D TC3G28A TC3G28B TC3G28C TC3G28D
United Arab Emirates 0.710 0.759 0.878 0.924 3.396 3.451 3.538 3.497
United States 0.704 0.892 0.631 0.834 3.173 3.133 3.045 3.202
Viet Nam 0.368 0.380 0.428 0.694 3.358 3.369 2.835 3.233
ISCED level 1
Australia1 0.698 0.852 0.860 0.590 3.164 3.127 3.148 3.183
Flemish Community (Belgium) 0.718 0.813 0.653 0.578 2.942 2.904 2.686 2.802
Ciudad Autónoma de Buenos Aires (Argentina)
0.629 0.779 0.794 0.879 3.036 3.023 3.184 3.102
Denmark 0.706 0.679 0.911 0.949 3.169 3.151 3.301 3.343
England (United Kingdom) 0.818 0.853 0.896 0.900 3.361 3.360 3.310 3.284
France 0.678 0.807 0.830 0.836 2.759 2.763 2.875 2.817
Japan 0.547 0.591 0.737 0.788 2.966 2.999 2.756 2.766
Korea 0.400 0.624 0.960 0.830 3.306 3.329 3.442 3.472
Netherlands1 0.382 0.565 0.899 0.708 3.097 3.092 2.864 2.912
Spain 0.581 0.718 0.918 0.868 3.009 3.037 3.117 3.124
Sweden 0.656 0.742 0.908 0.907 3.002 3.000 3.145 3.124
Chinese Taipei 0.468 0.687 0.980 0.805 3.104 3.123 3.113 3.236
Turkey 0.701 0.819 0.836 0.917 3.199 3.267 3.146 3.278
United Arab Emirates 0.673 0.751 0.877 0.910 3.396 3.451 3.538 3.497
Viet Nam 0.452 0.452 0.689 0.795 3.358 3.369 2.835 3.233
ISCED level 3
Alberta (Canada) 0.781 0.877 0.846 0.804 3.017 3.079 3.038 3.140
Brazil 0.623 0.726 0.859 0.759 3.312 3.208 3.199 3.343
Croatia 0.751 0.860 0.877 0.793 3.125 2.999 3.075 3.045
Denmark 0.651 0.649 0.928 0.931 3.169 3.151 3.301 3.343
Portugal 0.522 0.631 0.735 0.724 3.079 3.074 3.211 3.161
Slovenia 0.614 0.854 0.727 0.614 3.161 3.235 3.022 3.149
Sweden 0.538 0.697 0.839 0.812 3.002 3.000 3.145 3.124
Chinese Taipei 0.456 0.675 0.934 0.793 3.104 3.123 3.113 3.236
Turkey 0.710 0.771 0.850 0.880 3.199 3.267 3.146 3.278
United Arab Emirates 0.707 0.782 0.867 0.924 3.396 3.451 3.538 3.497
Viet Nam 0.366 0.403 0.534 0.732 3.358 3.369 2.835 3.233
TALIS-PISA link
Australia 0.787 0.869 0.878 0.729 3.079 3.072 3.057 3.093
Ciudad Autónoma de Buenos Aires (Argentina)
0.492 0.610 0.946 0.745 3.026 3.051 3.240 3.240
Colombia 0.739 0.932 0.716 0.768 3.290 3.330 3.289 3.226
Czech Republic 0.375 0.609 0.817 0.742 3.059 3.125 3.053 2.993
Denmark 0.756 0.781 0.935 0.855 3.148 3.029 3.172 3.247
Georgia 0.413 0.627 0.877 0.708 3.070 3.249 3.127 3.127
Malta 0.619 0.793 0.774 0.852 3.241 3.180 3.090 3.200
Turkey 0.577 0.600 0.920 0.850 3.180 3.264 3.271 3.412
Viet Nam 0.583 0.525 0.794 0.915 3.277 3.325 2.910 3.154
1. Data from the participating country/economy was rated as insufficient during the adjudication process.
2. Participating country/economy with late data collection.
Source: OECD, TALIS 2018 database.

422
TALIS 2018 TECHNICAL REPORT © OECD 2019
Equity and diversity: Diversity beliefs (T3PDIVB)
11.82. Measured items
The scale used to measure equity and diversity issues in schools drew on this question stem:
“In your view, approximately how many teachers in this school would agree with
the following statements?” (TC3G40). The question was followed by items about
student diversity that were used to form the scale Diversity beliefs (T3PDIVB).
The scale is presented in Table 11.158.
11.83. Model improvements
A correlation between items TC3G40A and TC3G40B was added to the scale model
T3PDIVB in order to improve it.
11.84. Scale reliability
The reliability coefficients for scale T3PDIVB, presented in Table 11.159, exhibit strong
reliability in all populations with the exception of the Russian Federation ISCED level 2
population, which exhibited only acceptable reliability.
11.85. Model fits
Table 11.160 shows that the model fit indices for T3PDIVB are acceptable in most
populations, with exceptions observed for the Australia and Netherlands ISCED level 1
populations, and the Australia, Ciudad Autónoma de Buenos Aires (Argentina),
Czech Republic, Denmark, Georgia, Viet Nam and TALIS-PISA link populations.
11.86. Invariance testing
The measurement invariance results for scale T3PDIVB are presented in Table 11.161.
Scalar invariance was achieved in the ISCED level 1 and 2 populations, while the ISCED
level 3 population was configural invariant. Although the difference between the metric
and scalar models in ISCED levels 1 and 2 did not meet the cut-off criteria, all within
country cross-ISCED level measurement invariance tests resulted in scalar models. Also,
because the fit indices are nearly acceptable, the model was deemed scalar invariant for
both the ISCED levels 1 and 2 populations.
11.87. Item parameters
The scale T3PDIVB reached the scalar invariance level for the ISCED level 2 populations.
Table 11.162 presents the unstandardised item parameters (factor loadings and intercepts)
for ISCED level 2.
Table 11.163 presents the standardised factor loadings for scale T3PDIVB. The
unstandardised intercepts are not presented for the countries/economies in this table
because the scale is scalar invariant and the intercepts are the same for all populations (the
values are presented in Table 11.162). The factor loadings for items TC3G40C and
TC3G40D are all above 0.600 in all populations. Additionally, both items TC3G40A and
TC3G40B exhibit strong relationships with the latent construct in nearly all populations.
However, one weak factor loading can be observed in the England (United Kingdom)

423
TALIS 2018 TECHNICAL REPORT © OECD 2019
ISCED level 2 population for item TC3G40A. In summary, the relationship between the
items and the latent construct is strong in nearly all populations.
Table 11.158. Item wording for equity and diversity scale
T3PDIVB: Diversity beliefs
TC3G40: In your view, approximately how many teachers in this school would agree with the following statements?
Response options: “None or almost none” (1), “Some” (2), “Many” (3), “All or almost all” (4).
TC3G40A It is important to be responsive to differences in students’ cultural backgrounds
TC3G40B It is important for students to learn that people from other cultures can have different values
TC3G40C Respecting other cultures is something that children and young people should learn as early as possible
TC3G40D Children and young people should learn that people of different cultures have a lot in common
Source: OECD, TALIS 2018 database.
Table 11.159. Omega coefficient for the equity and diversity scale
Participating countries/economies T3PDIVB
Omega coefficient
ISCED level 2
Alberta (Canada) 0.974
Australia1 0.945
Austria 0.872
Belgium 0.893
Flemish Community (Belgium) 0.899
Brazil 0.941
Bulgaria 0.910
Ciudad Autónoma de Buenos Aires (Argentina) 0.924
Chile 0.964
Colombia 0.920
Croatia 0.929
Cyprus 0.895
Czech Republic 0.850
Denmark 0.939
England (United Kingdom) 0.841
Estonia 0.870
Finland 0.901
France 0.918
Georgia 0.869
Hungary 0.922
Iceland 0.922
Israel 0.904
Italy 0.904
Japan 0.891
Kazakhstan 0.857
Korea 0.955
Latvia 0.933
Lithuania 0.845
Malta 0.937
Mexico 0.872
Netherlands 0.893

424
TALIS 2018 TECHNICAL REPORT © OECD 2019
Participating countries/economies T3PDIVB
Omega coefficient
New Zealand 0.968
Norway 0.904
Portugal 0.901
Romania 0.812
Russian Federation 0.699
Saudi Arabia 0.904
Shanghai (China) 0.941
Singapore 0.773
Slovak Republic 0.867
Slovenia 0.870
South Africa2 0.874
Spain 0.912
Sweden 0.865
Chinese Taipei 0.960
Turkey 0.958
United Arab Emirates 0.903
United States 0.970
Viet Nam 0.906
ISCED level 1
Australia1 0.955
Flemish Community (Belgium) 0.880
Ciudad Autónoma de Buenos Aires (Argentina) 0.939
Denmark 0.910
England (United Kingdom) 0.839
France 0.929
Japan 0.903
Korea 0.904
Netherlands1 0.912
Spain 0.924
Sweden 0.889
Chinese Taipei 0.941
Turkey 0.953
United Arab Emirates 0.912
Viet Nam 0.857
ISCED level 3
Alberta (Canada) 0.924
Brazil 0.945
Croatia 0.867
Denmark 0.925
Portugal 0.885
Slovenia 0.832
Sweden 0.887
Chinese Taipei 0.968
Turkey 0.941
United Arab Emirates 0.906
Viet Nam 0.852
TALIS-PISA link
Australia 0.943
Ciudad Autónoma de Buenos Aires (Argentina) 0.924

425
TALIS 2018 TECHNICAL REPORT © OECD 2019
Participating countries/economies T3PDIVB
Omega coefficient
Colombia 0.906
Czech Republic 0.812
Denmark 0.939
Georgia 0.904
Malta 0.933
Turkey 0.865
Viet Nam 0.884
1. Data from the participating country/economy was rated as insufficient during the adjudication process.
2. Participating country/economy with late data collection.
Source: OECD, TALIS 2018 database.
Table 11.160. CFA model-data fit for scale T3PDIVB
Diversity beliefs
Participating countries/economies CFI TLI RMSEA SRMR
ISCED level 2
Alberta (Canada) 1.000 1.006 0.000 0.000
Australia1 1.000 1.012 0.000 0.415
Austria 0.991 0.944 0.077 0.012
Belgium 0.997 0.979 0.056 0.010
Flemish Community (Belgium) 1.000 1.010 0.000 0.009
Brazil 1.000 1.013 0.000 0.008
Bulgaria 0.970 0.822 0.138 0.021
Ciudad Autónoma de Buenos Aires (Argentina) 0.993 0.957 0.076 0.014
Chile 1.000 1.033 0.000 0.002
Colombia 1.000 1.033 0.000 0.015
Croatia 1.000 1.067 0.000 0.000
Cyprus 0.960 0.761 0.212 0.028
Czech Republic 0.997 0.980 0.057 0.017
Denmark 0.973 0.840 0.169 0.010
England (United Kingdom) 0.998 0.989 0.024 0.015
Estonia 1.000 1.032 0.000 0.001
Finland 1.000 1.031 0.000 0.005
France 1.000 1.027 0.000 0.002
Georgia 0.999 0.996 0.024 0.007
Hungary 0.978 0.869 0.146 0.020
Iceland 1.000 1.002 0.000 0.013
Israel 0.944 0.665 0.204 0.015
Italy 1.000 1.013 0.000 0.008
Japan 0.971 0.825 0.153 0.017
Kazakhstan 0.997 0.982 0.028 0.012
Korea 1.000 1.045 0.000 0.003
Latvia 1.000 1.009 0.000 0.003
Lithuania 0.986 0.916 0.111 0.016
Malta 0.990 0.942 0.121 0.010
Mexico 1.000 1.009 0.000 0.006
Netherlands 1.000 1.038 0.000 0.004
New Zealand 1.000 1.009 0.000 0.003

426
TALIS 2018 TECHNICAL REPORT © OECD 2019
Participating countries/economies CFI TLI RMSEA SRMR
Norway 1.000 1.036 0.000 0.003
Portugal 1.000 1.020 0.000 0.004
Romania 1.000 1.055 0.000 0.003
Russian Federation3 - - - 0.045
Saudi Arabia 1.000 1.017 0.000 0.004
Shanghai (China) 1.000 1.023 0.000 0.003
Singapore 1.000 1.057 0.000 0.010
Slovak Republic 0.992 0.950 0.065 0.007
Slovenia 1.000 1.043 0.000 0.004
South Africa2 0.957 0.971 0.064 0.241
Spain 0.991 0.949 0.057 0.010
Sweden 0.973 0.839 0.097 0.022
Chinese Taipei 1.000 1.036 0.000 0.002
Turkey 0.967 0.800 0.134 0.012
United Arab Emirates 0.999 0.997 0.020 0.006
United States 0.983 0.895 0.103 0.012
Viet Nam 0.997 0.982 0.049 0.007
ISCED level 1
Australia1 0.890 0.918 0.106 0.578
Flemish Community (Belgium) 1.000 1.018 0.000 0.007
Ciudad Autónoma de Buenos Aires (Argentina) 1.000 1.020 0.000 0.006
Denmark 0.949 0.692 0.246 0.021
England (United Kingdom) 0.959 0.754 0.108 0.008
France 1.000 1.056 0.000 0.003
Japan 0.980 0.883 0.143 0.011
Korea 0.988 0.927 0.075 0.013
Netherlands1 0.501 0.667 0.191 1.098
Spain 0.973 0.837 0.101 0.013
Sweden 0.968 0.809 0.114 0.020
Chinese Taipei 0.995 0.973 0.067 0.008
Turkey 0.987 0.920 0.148 0.014
United Arab Emirates 1.000 1.012 0.000 0.001
Viet Nam 1.000 1.015 0.000 0.009
ISCED level 3
Alberta (Canada) 1.000 1.025 0.000 0.016
Brazil 1.000 1.057 0.000 0.001
Croatia 1.000 1.117 0.000 0.005
Denmark 1.000 1.031 0.000 0.013
Portugal 1.000 1.021 0.000 0.002
Slovenia 1.000 1.055 0.000 0.006
Sweden 1.000 1.034 0.000 0.004
Chinese Taipei 1.000 1.016 0.000 0.003
Turkey 0.999 0.991 0.037 0.003
United Arab Emirates 1.000 1.001 0.000 0.006
Viet Nam 0.953 0.718 0.175 0.025
TALIS-PISA link
Australia 0.884 0.923 0.108 0.704
Ciudad Autónoma de Buenos Aires (Argentina) 0.557 0.705 0.164 0.261

427
TALIS 2018 TECHNICAL REPORT © OECD 2019
Participating countries/economies CFI TLI RMSEA SRMR
Colombia 0.915 0.943 0.063 0.498
Czech Republic 0.551 0.701 0.180 0.476
Denmark 0.723 0.816 0.137 0.562
Georgia 0.604 0.703 0.170 0.800
Malta 1.000 1.017 0.000 0.110
Turkey 0.914 0.935 0.082 0.144
Viet Nam 0.605 0.704 0.182 0.227
1. Data from the participating country/economy was rated as insufficient during the adjudication process.
2. Participating country/economy with late data collection.
3. As the correction factor for this participating country/economy was negative, only the SRMR is reported.
Source: OECD, TALIS 2018 database.
Table 11.161. Invariance test results for scale T3PDIVB
CFI TLI RMSEA SRMR Δ CFI Δ TLI Δ RMSEA Δ SRMR
Invariance level for ISCED level 2
Configural 0.992 0.951 0.075 0.013
Metric 0.975 0.961 0.067 0.155 0.017 -0.010 0.008 -0.142
Scalar 0.910 0.921 0.096 0.180 0.065 0.040 -0.029 -0.025
Invariance level for ISCED level 1
Configural 0.988 0.929 0.091 0.011
Metric 0.965 0.945 0.08 0.165 0.023 -0.016 0.011 -0.154
Scalar 0.911 0.919 0.097 0.195 0.054 0.026 -0.017 -0.030
Invariance level for ISCED level 3
Configural 0.999 0.996 0.023 0.010
Metric 0.981 0.970 0.065 0.136 0.018 0.026 -0.042 -0.126
Scalar 0.954 0.957 0.077 0.147 0.027 0.013 -0.012 -0.011
Source: OECD, TALIS 2018 database.
Table 11.162. Unstandardised factor loadings and intercepts for scale T3DIVB for all
participating countries/economies for all populations
T3PDIVB
Unstandardised factor loadings Unstandardised intercepts
TC3G40A 0.482 3.471
TC3G40B 0.500 3.486
TC3G40C 0.525 3.567
TC3G40D 0.526 3.546
Source: OECD, TALIS 2018 database.
Table 11.163. Standardised factor loadings for scale T3PDIVB
Participating countries/economies Standardised factor loadings
TC3G40A TC3G40B TC3G40C TC3G40D
ISCED level 2
Alberta (Canada) 0.812 0.911 0.932 0.979
Australia1 0.870 0.850 0.911 0.916
Austria 0.666 0.716 0.868 0.840
Belgium 0.667 0.768 0.795 0.911
Flemish Community (Belgium) 0.686 0.771 0.765 0.921

428
TALIS 2018 TECHNICAL REPORT © OECD 2019
Participating countries/economies Standardised factor loadings
TC3G40A TC3G40B TC3G40C TC3G40D
Brazil 0.771 0.656 0.948 0.916
Bulgaria 0.615 0.833 0.896 0.884
Ciudad Autónoma de Buenos Aires (Argentina) 0.786 0.763 0.931 0.870
Chile 0.797 0.786 0.937 0.972
Colombia 0.673 0.797 0.900 0.914
Croatia 0.833 0.699 0.906 0.919
Cyprus 0.722 0.722 0.902 0.853
Czech Republic 0.685 0.779 0.819 0.778
Denmark 0.751 0.810 0.941 0.919
England (United Kingdom) 0.440 0.616 0.879 0.739
Estonia 0.708 0.744 0.827 0.863
Finland 0.693 0.758 0.865 0.898
France 0.708 0.799 0.891 0.920
Georgia 0.675 0.740 0.791 0.884
Hungary 0.763 0.893 0.875 0.900
Iceland 0.782 0.857 0.889 0.910
Israel 0.738 0.752 0.898 0.885
Italy 0.777 0.831 0.909 0.808
Japan 0.737 0.805 0.847 0.882
Kazakhstan 0.452 0.464 0.860 0.859
Korea 0.878 0.862 0.957 0.916
Latvia 0.552 0.836 0.936 0.902
Lithuania 0.575 0.688 0.840 0.823
Malta 0.789 0.835 0.957 0.806
Mexico 0.645 0.640 0.861 0.870
Netherlands 0.751 0.789 0.849 0.872
New Zealand 0.849 0.909 0.972 0.943
Norway 0.636 0.637 0.865 0.919
Portugal 0.759 0.738 0.917 0.820
Romania 0.602 0.632 0.791 0.811
Russian Federation 0.494 0.453 0.730 0.657
Saudi Arabia 0.747 0.744 0.901 0.881
Shanghai (China) 0.585 0.687 0.922 0.950
Singapore 0.485 0.531 0.811 0.698
Slovak Republic 0.603 0.693 0.837 0.870
Slovenia 0.664 0.742 0.850 0.849
South Africa2 0.604 0.728 0.870 0.852
Spain 0.678 0.714 0.915 0.893
Sweden 0.672 0.684 0.881 0.785
Chinese Taipei 0.729 0.749 0.972 0.926
Turkey 0.825 0.811 0.967 0.930
United Arab Emirates 0.754 0.729 0.888 0.887
United States 0.829 0.764 0.885 0.982
Viet Nam 0.798 0.795 0.919 0.787
ISCED level 1
Australia1 0.843 0.865 0.952 0.941
Flemish Community (Belgium) 0.714 0.761 0.831 0.863
Ciudad Autónoma de Buenos Aires (Argentina) 0.756 0.686 0.915 0.944
Denmark 0.797 0.849 0.914 0.813
England (United Kingdom) 0.502 0.507 0.844 0.835
France 0.579 0.611 0.946 0.891

429
TALIS 2018 TECHNICAL REPORT © OECD 2019
Participating countries/economies Standardised factor loadings
TC3G40A TC3G40B TC3G40C TC3G40D
Japan 0.732 0.782 0.870 0.902
Korea 0.627 0.847 0.852 0.897
Netherlands1 0.797 0.879 0.826 0.896
Spain 0.801 0.816 0.883 0.924
Sweden 0.710 0.502 0.901 0.853
Chinese Taipei 0.794 0.852 0.939 0.920
Turkey 0.880 0.869 0.949 0.926
United Arab Emirates 0.779 0.750 0.897 0.896
Viet Nam 0.732 0.660 0.863 0.755
ISCED level 3
Alberta (Canada) 0.730 0.879 0.905 0.869
Brazil 0.778 0.795 0.941 0.933
Croatia 0.600 0.640 0.881 0.824
Denmark 0.791 0.869 0.937 0.804
Portugal 0.768 0.806 0.869 0.848
Slovenia 0.650 0.716 0.821 0.786
Sweden 0.770 0.729 0.880 0.834
Chinese Taipei 0.790 0.872 0.957 0.970
Turkey 0.821 0.850 0.926 0.936
United Arab Emirates 0.762 0.788 0.890 0.880
Viet Nam 0.719 0.668 0.837 0.801
TALIS-PISA link
Australia 0.820 0.867 0.924 0.938
Ciudad Autónoma de Buenos Aires (Argentina) 0.789 0.727 0.944 0.806
Colombia 0.741 0.790 0.890 0.892
Czech Republic 0.621 0.742 0.726 0.803
Denmark 0.813 0.871 0.952 0.820
Georgia 0.598 0.825 0.826 0.877
Malta 0.777 0.809 0.955 0.796
Turkey 0.861 0.799 0.811 0.801
Viet Nam 0.634 0.664 0.922 0.660
1. Data from the participating country/economy was rated as insufficient during the adjudication process.
2. Participating country/economy with late data collection.
Source: OECD, TALIS 2018 database.
Excluded scales: Distributed leadership; Diversity practices, school; Diversity
policies, school; Equity beliefs.
Four scales were deleted from the principal population. The reasons for deleting them
varied. The Distributed leadership scale contained items also in the scale Participation
among stakeholders (T3PLEADP), which was considered by experts to more completely
measure the same latent construct. For the scale Diversity practices, school, items were
more closely related than they should be according to the model, resulting in local
dependencies among the items. The scale for Diversity policies, school exhibited both local
dependencies and highly skewed items, which meant that nearly all responses were
observed at one end of the response scale. The items in the fourth scale, Equity beliefs,
were also highly skewed.
The item wording for the scales are presented in the following tables: Table 11.164 for the
scale Distributed leadership, Table 11.165 for the scale Diversity practices, school, Table
11.166 for Diversity policies, school, and Table 11.167 for Equity beliefs.

430
TALIS 2018 TECHNICAL REPORT © OECD 2019
Table 11.164. Item wording for distributed leadership scale
Distributed leadership
TC3G26: How strongly do you agree or disagree with these statements as applied to this school?
Response options: “Strongly disagree” (1), “Disagree” (2), “Agree” (3), “Strongly agree” (4).
TC3G26A This school provides staff with opportunities to actively participate in school decisions
TC3G26B This school provides parents or guardians with opportunities to actively participate in school decisions
TC3G26C This school provides students with opportunities to actively participate in school decisions
Source: OECD, TALIS 2018 database.
Table 11.165. Item wording for diversity practices, school scale
Diversity practices, school
TC3G38: In this school, are the following policies and practices in relation to diversity implemented?
Response options: “Yes” (1), “No” (2)
TC3G38A Supporting activities or organisations that encourage students’ expression of diverse ethnic and cultural identities (e.g. artistic groups)
TC3G38B Organising multicultural events (e.g. cultural diversity day)
TC3G38C Teaching students how to deal with ethnic and cultural discrimination
TC3G38D Adopting teaching and learning practices that integrate global issues throughout the curriculum
Source: OECD, TALIS 2018 database.
Table 11.166. Item wording for diversity policies, school scale
Diversity policies, school
TC3G39: In this school, are the following policies and practices implemented?
Response options: “Yes” (1), “No” (2)
TC3G39A Teaching students to be inclusive of different socio-economic backgrounds
TC3G39B Explicit policies against gender discrimination
TC3G39C Explicit policies against socio-economic discrimination
TC3G39D Additional support for students from disadvantaged backgrounds
Source: OECD, TALIS 2018 database.
Table 11.167. Item wording for equity beliefs scale
Equity beliefs
TC3G41: In your view, approximately how many teachers in this school would agree with the following statements?
Response options: “None or almost none” (1), “Some” (2), “Many” (3), “All or almost all” (4).
TC3G41A Schools should encourage students from different socio-economic backgrounds to work together
TC3G41B Students should learn how to avoid gender discrimination
TC3G41C It is important to treat female and male students equally
TC3G41D It is important to treat students from all socio-economic backgrounds in the same manner
Source: OECD, TALIS 2018 database.

431
TALIS 2018 TECHNICAL REPORT © OECD 2019
References
Asparouhov, T. and B. Muthén (2018), SRMR in Mplus. [22]
Beauducel, A., C. Harms and N. Hilger (2016), “Reliability estimates for three factor score
estimators”, International Journal of Statistics and Probability, Vol. 5/6, pp. 94-107,
http://dx.doi.org/10.5539/ijsp.v5n6p94.
[8]
Brown, T. (2015), Confirmatory Factor Analysis for Applied Research: Second Edition, The
Guilford Press, New York, NY.
[15]
Brown, T. (2006), Confirmatory Factor Analysis for Applied Research, Guilford Press, New
York.
[14]
Chen, F. (2007), “Sensitivity of goodness of fit indexes to lack of measurement invariance”,
Structural Equation Modeling, Vol. 14/3, pp. 464-504.
[16]
Chen, P., T. Cleary and A. Lui (2014), “Examining parents’ ratings of middle-school students’
academic self-regulation using principal axis factoring analysis”, School Psychology
Quarterly, Vol. 30/3, pp. 385-397, http://dx.doi.org/10.1037/spq0000098.
[38]
Cheung, G. (1999), “Testing Factorial Invariance across Groups: A reconceptualization and
proposed new method”, Journal of Management, Vol. 25/1, pp. 1-27.
[23]
Cheung, G. and R. Rensvold (2002), “Evaluating goodness-of-fit indexes for testing
measurement invariance”, Structural Equation Modeling, Vol. 9/2, pp. 233-255,
https://doi.org/10.1207/S15328007SEM0902_5.
[4]
Cheung, G. and R. Rensvold (1998), “Cross-cultural comparisons using non-invariant
measurement items”, Applied Behavioral Science Review, Vol. 6/1, pp. 93-110,
https://doi.org/10.1016/S1068-8595(99)80006-3.
[29]
Davidov, E. (2008), “A cross-country and cross-time comparison of the Human Values
Measurements with the second round of the European Social Survey”, Survey Research
Methods, Vol. 2/1, pp. 33-46.
[24]
Davidov, E. et al. (2014), “Measurement equivalence in cross-national research”, Annual Review
of Sociology, Vol. 40, pp. 55-75.
[27]
Dempster, A., N. Laird and D. Rubin (1977), “Maximum likelihood from incomplete data via the
EM algorithm”, Journal of the Royal Statistical Society: Series B (Methodological),
Vol. 39/1, pp. 1-22, https://doi.org/10.1111/j.2517-6161.1977.tb01600.x.
[34]
DeVellis, R. (2003), Scale Development: Theory and Applications, Sage, Los Angeles, CA. [17]
Gonzalez, E. (2012), “Rescaling sampling weights and selecting mini-samples from large-scale
assessment databases.”, IERI Monograph Series, Vol. 5, pp. 117-134.
[37]

432
TALIS 2018 TECHNICAL REPORT © OECD 2019
Hansen, Y., M. Rosen and J. Gustavson (2006), “Measures of self-reported reading resources,
attitudes and activities based on Latent Variable Modelling”, International Journal of
Research & Method in Education, Vol. 29/2, pp. 221-237.
[28]
He, Q. (2010), Estimating the Reliability of Composite Scores, Ofqual/10/4703, Office of
Qualifications and Examinations Regulation, Coventry, https://dera.ioe.ac.uk/1060/1/2010-
02-01-composite-reliability.pdf.
[9]
Heywood, H. (1931), “On finite sequences of real numbers”, Proceedings of the Royal Society of
London. Series A, Containing Papers of Mathematical and Physical Character, Vol. 134,
pp. 486-501.
[36]
Hoyle, R. (2014), Handbook of Structural Equation Modeling, The Guilford Press, New York,
NY.
[18]
Hu, L. and P. Bentler (1999), “Cutoff criteria for fit indexes in covariance structure analysis:
Conventional criteria versus new alternatives”, Structural Equation Modeling, Vol. 6/1, pp. 1-
55, https://doi.org/10.1080/10705519909540118.
[11]
Lüdtke, O. et al. (2007), “Umgang mit fehlenden Werten in der psychologischen Forschung”,
Psychologische Rundschau, Vol. 58/2, pp. 103-117, http://dx.doi.org/10.1026/0033-
3042.58.2.103.
[33]
Lyubomirsky, S. and H. Lepper (1999), “A measure of subjective happiness: Preliminary
reliability and construct validation.”, Social Indicators Research, Vol. 46/2, pp. 137-155,
http://dx.doi.org/10.1023/A:1006824100041.
[3]
Messick, S. (1995), “Validity of psychological assessment: Validation of inferences from
persons’ responses and performances as scientific inquiry into score meaning”, American
Psychologist, Vol. 50/9, pp. 741-749.
[2]
Muthén, B. (1977), Some results on using summed raw scores and factor scores from
dichotomous items in the estimation of structural equation models, Unpublished Technical
Report, University of Uppsala, Sweden.
[32]
Muthén, L. and B. Muthén (1998-2017), Mplus User’s Guide, Muthén & Muthén, Los Angeles,
CA.
[30]
OECD (2019), TALIS 2018 Results (Volume I): Teachers and School Leaders as Lifelong
Learners, TALIS, OECD Publishing, Paris, https://dx.doi.org/10.1787/1d0bc92a-en.
[1]
OECD (2014), TALIS 2013 Technical Report, OECD, Paris,
http://www.oecd.org/edu/school/TALIS-technical-report-2013.pdf.
[10]
OECD (2010), TALIS 2008 Technical Report, TALIS, OECD Publishing, Paris,
https://dx.doi.org/10.1787/9789264079861-en.
[12]
Schafer, J. and J. Graham (2002), “Missing data: our view of the state of the art”, Psychological
Methods, Vol. 7/2, pp. 147-177, http://dx.doi.org/10.1037/1082-989X.7.2.147.
[35]

433
TALIS 2018 TECHNICAL REPORT © OECD 2019
Schermelleh-Engel, K., H. Moosbrugger and H. Müller (2003), “Evaluating the fit of structural
equation models: Tests of significance and descriptive goodness-of-fit measures”, Methods of
Psychological Research Online, Vol. 8/2, pp. 23-74.
[19]
Schreiber, J. et al. (2006), “Reporting Structural Equation Modeling and Confirmatory Factor
Analysis results: A review”, The Journal of Educational Research, Vol. 99/6, pp. 323-338.
[13]
Skrondal, A. and P. Laake (2001), “Regression among factor scores”, Psychometrika, Vol. 66,
pp. 563-575, https://doi.org/10.1007/BF02296196.
[31]
Steenkamp, J. and H. Baumgartner (1998), “Assessing measurement invariance in cross-national
consumer research”, Journal of Consumer Research, Vol. 25/1, pp. 78-90.
[25]
Steiger, J. (1990), “Structural model evaluation and modification: An interval estimation
approach”, Multivariate Behavioral Research, Vol. 25/2, pp. 173-180.
[20]
Van de Vijver, F. et al. (2019), “Invariance analyses in large-scale studies”, OECD Education
Working Papers, No. 201, OECD Publishing, Paris, https://dx.doi.org/10.1787/254738dd-en.
[26]
Vandenberg, R. and C. Lance (2000), “A review and synthesis of the measurement invariance
literature: Suggestions, practices, and recommendations for organizational research”,
Organizational Research Methods, Vol. 3/1, pp. 4-70.
[5]
Viladrich, C., A. Angulo-Brunet and E. Doval (2017), “A journey around alpha and omega to
estimate internal consistency reliability”, Anales de Psicología, Vol. 33/3, pp. 755-782.
[6]
Yu, C. (2002), Evaluating Cutoff Criteria of Model Fit Indices for Latent Variable Models with
Binary and Continuous Outcomes, unpublished doctoral dissertation, University of
California, Los Angeles.
[21]
Zhang, Z. and K. Yuan (2016), “Robust coefficients alpha and omega and confidence intervals
with outlying observations and missing data: Methods and software”, Educational and
Psychological Measurement, Vol. 76/3, pp. 387-411,
https://doi.org/10.1177/0013164415594658.
[7]
Notes
1 The question specifies to consider only teachers whose main activity is the provision of instruction
to students.
2 Personnel for pedagogical support include: (a) teacher aides or other non-teaching professionals
who provide instruction or support teachers in providing instruction; (b) professional
curricular/instructional specialists; and (c) educational media specialists, psychologists and nurses.
3 School administrative or management personnel include principals, assistant principals and other
management staff whose main activity is administration or management.

434
TALIS 2018 TECHNICAL REPORT © OECD 2019
4 These indices are composed of items assessing decision making process and numbers of resources,
which are not latent constructs and, therefore, not appropriate for CFA.
5 The models used in the scaling procedure account for random measurement error, but also
recognise that variables are measured with certain but not complete precision.
6 A pooled sample is a dataset where all the countries/economies from ISCED level 2 are put together
and analysed as one group. All factor loadings and item intercepts are freely estimated and the latent
variances is fixed to one.
7 Constrained models were used for “insufficient” populations (see Chapter 10 for more details),
that is, countries/economies with late data submission and TALIS-PISA link populations. These
models are based on the parameters of the final scale models (see the section “Scale score
estimation” for further details).
8 For practical reasons, the two most recent versions of Mplus were used (versions 8 and 7.3).
9 The evaluation procedures in the field trial were based on continuous and categorical models so as
to assess the comparability of the results. This procedure was chosen because the majority of TALIS
items are ordinal. However, in both previous cycles (TALIS 2008 and 2013), linear models were
used to estimate complex indices based on ordinal scale items. In TALIS 2018, both models were
used to evaluate the scales, followed by a comparison of their results. The results were very similar
although there were minor differences in terms of the performance and the measurement invariance
level of the scale. Practical challenges related to a possible change in approach (i.e. from continuous
CFA to categorical CFA modelling) between TALIS cycles resulted in the decision to implement
the linear measurement model for TALIS 2018 scaling. This approach is supported by simulation
studies (Van de Vijver et al., 2019[26]).
10 Weighted least square parameter estimates using a diagonal weight matrix with standard errors
and mean- and variance-adjusted chi-square test statistic that use a full weight matrix (Muthén and
Muthén, 1998-2017[30])
11 So that each participating country/economy contributes equally to parameter estimation (that is, a
population should not have more or less influence on parameter estimates due to its size)
countries’/economies’ sampling weights were rescaled to sum up to the same number of teachers
and principals. This way, each participating country/economy makes an equal contribution to the
estimates (Gonzalez, 2012[37]). The teacher and principal weights for each participating
country/economy in each ISCED level were rescaled so that the total sum of the weights (i.e. number
of teachers and principals in the population) was equal to 3,000 and 200 respectively. This way,
participating countries/economies make an equal contribution in parameter estimation regardless of
the sizes of their samples or populations. The SPSS macro provided by Gonzalez (Gonzalez,
2012[37]) was used for rescaling.
12 A more detailed examination of the model parameters (factor loadings, residual variances) was
part of further model analyses.
13 Principal axis factoring (PAF) is a form of EFA that is commonly adopted to examine the internal
factor structure of constructs. Unlike principal component Analysis (PCA), which is a linear
combination of variables, PAF is a measurement model of latent constructs. Oblimin rotation was
chosen over Varimax rotation due to the assumption that the extracted factors within the constructs
in TALIS 2018 are correlated with one another (Brown, 2006[14]; Chen, Cleary and Lui, 2014[38]).
14 Participating countries/economies that did not meet the Technical standards, participating
countries/economies with late data collection, and TALIS-PISA link populations were not included
in this stage of the analysis. For a detailed explanation see the sub-sectionDescription of scales and
their parameters and Table 11.7.
15 Thirteen countries/economies participated at the ISCED level 1, 48 countries/economies at ISCED
level 2, 11 countries/economies at ISCED level 3.

435
TALIS 2018 TECHNICAL REPORT © OECD 2019
16 The measurement parameters describe measurement characteristics of observed variables (items).
Factor loadings indicate the strength of the relationship between the item and the latent factor,
intercepts indicate the predicted values for an item when the value of the latent factor is zero, and
residual variances presents the portion of item variance that is not attributable to variance in the
latent factor.
17 For these models, a minimum number of parameters are constrained for reasons of model
identification. In the analysis, the latent variances was set to one for each group allowing for free
estimation of factor loadings and intercepts.
18 In strict invariance, not only the factor loadings and item intercepts but also the residual variances
of the items have to be equal across groups. This requirement means that that the portion of the item
variance not attributable to variance in the latent construct is the same across groups. However, this
assumption is very hard to meet in practice especially in large-scale assessments where many groups
are compared. In line with previous TALIS cycles, the current cycle did not test these models.
19 To be specific, for a certain ISCED level, p CFA models were created, where p is the number of
countries/economies within that ISCED level.
20 During TALIS 2018, one, two or three models were estimated for each participating
country/economy, in accordance with the number of populations that each participating
country/economy participated in for the current cycle. For example, some participating
countries/economies participated in each of the three ISCED levels, meaning three models were
estimated. Other countries/economies participated in ISCED level 2 and one other, either ISCED
level 1 or ISCED level 3, meaning two models (either ISCED level 2 and ISCED level 1 or ISCED
level 2 and ISCED level 3) were estimated.
21 Configural, metric, and scalar models are in essence nested models; the scalar model is nested in
the metric model, and the metric model is nested in the configural model. Therefore, the χ2 difference
test can be adopted to evaluate which model fits the data best. If the χ2 difference value is significant,
the less restrictive model (the model with more freely estimated parameters) fits the data better than
the nested more restrictive model (the model with fixed/constrained parameters). If the χ2 difference
value is not significant, then both models fit the data equally well. However, because χ2 is sensitive
to sample size, which were particularly large for TALIS, the change of the model fit indices (e.g.,
CFI, TLI, RMSEA, SRMR/WRMR) were used to evaluate the measurement invariance of each
scale.
22 For scale measured with categorical variables, the standardised factor loadings come from the
STDYX standardisation of Mplus, while for scales measured with binary items they come from the
STDY standardisation (Muthén and Muthén, 1998-2017, pp. 799-802[30]).
23 The mean score does not always rise and fall in this way. Certain aggregate scores are observed
much less than others. In this example, with the scale TPERUT, aggregate scores of 1.33, 1.67, 2.33,
2.67, 3.33 and 3.67 are less common resulting in a smaller number of observations for these values.
Therefore, the variance is not very large, an outcome that can result in a mean that is lower or greater
than expected. However, the correlation between the simple average of items scores and factor
scores is still generally strong.
24 Due to the complexity of the final models, which took into account measurement invariance
testing results both cross-country within each ISCED level, and cross-ISCED levels with each
participating country/economy participating in more than one population sample, and the structure
of the large-scale data, multidimensional models needed computing power beyond the limit of
available resources
25 The TALIS 2013 technical report uses the term “calibration sample” to refer to the ISCED level
2 population, which is a different use of the term from the TALIS 2008 technical report, in which it
referred to a random sample of each participating country/economy so that each contributed to the
model parameter estimates equally.

436
TALIS 2018 TECHNICAL REPORT © OECD 2019
26 For example, in relation to teacher job satisfaction, a positive response of “strongly agree” to the
item “The advantages of being a teacher clearly outweigh the disadvantages” is also positive for the
latent construct of job satisfaction. However, a positive response of “strongly agree” to the item “I
regret that I decided to become a teacher” is negatively related to the latent construct, which means
this item would be reverse coded; therefore, a response of “strongly disagree” would now be coded
(i.e. assigned a higher integer) to align with the positive association with the latent construct for this
particular item.
27 The CFA on a pooled sample during the evaluation process was conducted to gain a general
overview of the scale’s performance. The results from this analysis are therefore not presented in
this technical report. In addition, model parameters were used to fix the results from the final scale
modelling for populations that did not meet the technical standards and for those participating
countries/economies submitting data late (see Chapter 10 for more detail). These participating
countries/economies were not considered during model analysis at the country/economy level.
28 In models with three items, the number of the information in the variance covariance matrix equals
the number of parameters being estimated. The fact that the number of degrees of freedom equals
zero (𝑑𝑓 = 0) provides a unique solution to the parameter estimation and means that the models are
just identified. Consequently, models based on three items could not be evaluated with respect to
their fit to the empirical data (because the model fit indices suggest a perfect model fit).
29 The composite scale is evident in the variable labels in the database referred to as “overall”.
30 The complexity of the final mode meant the multidimensional scales could not be processed
because of the resulting lack of computation power.
31 Their data were rated as “insufficient” during the adjudication process. For details, see Chapter 10.
32 The TALIS-PISA link populations were not included into the parameter estimation as it is not part
of the TALIS target populations.
33 Because the models in these populations were specified by fixing the parameters (factor loadings
and intercepts) to be equal to the international parameters, the number of the degrees of freedom
was positive (𝑑𝑓 > 0) and the model fit could therefore be estimated.
34 The weights for the teacher data were slightly altered late in the analysis process. To check the
impact of changes on the invariance testing results, the TALIS Consortium performed invariance
tests for a few scales to ensure that decisions did not change. After confirming that the change only
minimally affected the numeric results, did not affect the model evaluation and invariance testing
results and did not affect the decisions made from such results, the consortium moved on to the final
scale modelling (computing the scale scores). Due to the weights being altered late in the modelling
some of the results are reported with the use of preliminary weights (before the minor alteration), as
indicated by this endnote.

437
TALIS 2018 TECHNICAL REPORT © OECD 2019
Chapter 12. Table production and verification, analyses
This chapter describes the table production process, from developing the table shells up to
the verification of the table results. It provides an overview of conducted analyses, applied
quality rules, software used and the different parties involved in ensuring high-quality
results.
The statistical data for Israel are supplied by and under the responsibility of the relevant Israeli authorities. The
use of such data by the OECD is without prejudice to the status of the Golan Heights, East Jerusalem and Israeli
settlements in the West Bank under the terms of international law.

438
TALIS 2018 TECHNICAL REPORT © OECD 2019
12.1. Introduction
The process and procedures presented in this report and, in particular, this chapter, relate
to the tables of results produced by the International Association for the Evaluation of
Educational Achievement (IEA) Hamburg and the OECD for Volume I of the TALIS 2018
international report (OECD, 2019[1]). Preparation of the tables consisted of two major steps:
(1) the development, review and revision of table shells; and (2) data analysis, table
production and verification. After providing a brief description of the first step, this chapter
focuses on the second step. The chapter also provides an overview of the procedures and
methods applied to estimate population parameters and uses selected but shortened
versions1 of the tables from the report to highlight relevant statistical issues. It furthermore
provides insights into the production and verification of regression tables.
12.2. Responsibilities
The OECD and the TALIS 2018 International Consortium, specifically the IEA and the
Australian Council for Education Research (ACER), shared the development and
production of the tables for the TALIS 2018 international report (OECD, 2019[1]). The
OECD developed the table shells and determined the content and format of the tables on
the basis of the analysis plan produced by the TALIS Consortium, as well as the reporting
plan developed by the OECD and agreed to by the participating countries/economies. The
table shells were then reviewed by the TALIS Consortium for statistical and substantial
soundness and revised by the OECD over multiple rounds.
In a subsequent step, the TALIS Consortium’s IEA Hamburg team conducted the analyses,
populated around 190 tables in collaboration with the OECD and verified/validated
estimates in collaboration with ACER and the OECD. The IEA team members discussed
methodological issues relating to these tables amongst themselves and with the OECD.
Both the IEA team and the OECD considered advice from the Technical Advisory Group
(TAG). The OECD was also responsible for designing and populating an additional 45
tables showing the results of regression analyses. The OECD furthermore noted the
consortium’s recommendations and shared them in the TALIS 2018 analysis plan and
consulted with the TAG. The countries/economies participating in TALIS 2018
participated in the table development and review process via the OECD Secretariat.
12.3. Populating the table shells: General procedures
The process of populating table shells consisted of two major steps. First, the IEA IDB
Analyzer was used to estimate, for each table, all parameters (percentages, means, etc.) and
their respective standard errors.2 Second, R packages3 were used to transfer estimates
resulting from the first step to the appropriate table shell and cell; estimates for the EU total,
the OECD and TALIS averages were computed (see the section OECD average, TALIS
average and EU total below); and the supplementary statistical analyses needed for flagging
estimates4 and quality control (such as the analysis of non-response at item level and the
verification of a minimum sample size) were conducted. The codebook provided in
Annex J of this report includes information on: (1) the variables created and delivered in
the public TALIS 2018 dataset; and (2) the advanced recoded variables generated during
table production.
All tables presented in the TALIS 2018 initial report were structured in a manner similar
to the example shown in Table 12.1, and each accorded with these elements and principles:

439
TALIS 2018 TECHNICAL REPORT © OECD 2019
1. A parameter always appears with its standard errors (SE) (Items 1 and 2,
Table 12.1).
2. The following averages appear (see Items 4 to 6 in Table 12.1, formula presented
in the section on OECD average, TALIS average and EU total) in all tables except
those tables displaying change over time, tables based on the ISCED levels 1 and 3
populations and selected tables featuring data from survey questions that were
co-ordinated national options:
OECD average-30, OECD average-31: average of the OECD countries/
economies participating in TALIS 2018
EU total-23: total of the 23 EU countries/economies participating in TALIS
2018
TALIS average-47, TALIS average-48: average of all the countries/economies
participating in TALIS 2018.
3. Country/economy-specific considerations:
a. “Flemish Comm.” (i.e. Flemish Community): This name, written in italics and
with an indentation, indicates separate adjudication. However, note that data
collected within the Flemish Community of Belgium (Item 3) also contributed
to the estimates for Belgium.
b. Data from countries/economies not meeting the requirements determined in the
technical standards (see Chapter 10 of this technical report): These are reported
below the main body of the table. The affected data did not contribute to the
above-cited averages (see Items 4 to 7 in Table 12.1).
Table 12.1. Type of professional development undertaken by principals
Percentage of principals who participated in the following professional development activities in the previous 12 months:
Courses/seminars about subject matter, teaching methods or pedagogical topics
% (1) SE (2)
Alberta (Canada) 62.2 (11.0)
Austria 82.7 (3.1)
Belgium 78.9 (3.0)
Flemish Comm. (Belgium) (3) 85.8 (3.2)
… … …
… … …
… … …
Turkey 46.9 (4.2)
United Arab Emirates 70.0 (2.0)
United States 73.7 (7.5)
Viet Nam 87.9 (2.6)
OECD average-30 (4) 70.5 (0.8)
EU total-23 (5) 66.0 (1.1)
TALIS average-47 (6) 73.1 (0.6)
Australia (7) 79.7 (4.4)

440
TALIS 2018 TECHNICAL REPORT © OECD 2019
12.4. Estimating standard errors using weights
One of TALIS’s main goals is to generate reliable, valid and comparable population
estimates based on sample data. All parameters presented in the TALIS 2018 international
report are therefore weighted (see, for example, the percentages in Table 12.1). The data
provided by school principals that contributed to the school-based estimates were weighted
by school weights (variable name: SCHWGT), while the results arising out of either teacher
data or combined teacher and school principal data (i.e. school/principal information
merged with teacher records) were weighted by teacher weights (variable name:
TCHWGT).
Because all estimates in the TALIS 2018 international report are based on sample data,
they could only be estimated with a degree of uncertainty. Thus, results from analyses of
these data and the information on the precision of the population estimates must be reported
together. In the TALIS tables, the degree of uncertainty of an estimate is reflected by its
standard error (SE; Item 2 in Table 12.1) and this has the same metric as the estimate.
Fay’s variant of the balanced repeated replication (BRR) technique was used to estimate
the standard errors during the weighting stage. BRR estimates of sampling error can be
computed with the IEA IDB Analyzer.
Chapter 9 of this report gives more information on computing sampling weights and about
the BRR technique. It also describes how to obtain standard errors for differences of
estimates obtained from different samples or from the same sample. Chapter 3 of the TALIS
2018 User Guide to the International Database (OECD, forthcoming[2]) provides details
on using weights for data analysis.
12.5. OECD average, TALIS average and EU total
The formula used to calculate the OECD and TALIS averages was:
�̅̂� =1
𝐶∑𝜃𝑐
𝐶
𝑐=1
where C is the number of countries contributing to the average �̅̂�, 𝑐 is an index that runs
from 1 to C, and 𝜃𝑐 is the estimate for country 𝑐.
The formula used to calculate the standard errors for the OECD and the TALIS averages
was:
𝑠𝑒 (�̅̂�) = √∑ 𝑠𝑒(𝐶𝑐=1 𝜃𝑐 )
2
𝐶2= √
∑ �̂�𝐹𝑎𝑦(𝜃𝑐 )𝐶𝑐=1
𝐶2=1
𝐶√∑�̂�𝐹𝑎𝑦
𝐶
𝑐=1
(𝜃𝑐 ).
Here, C is the number of countries contributing to the average �̅̂�, 𝑐 is an index that runs
from 1 to C, 𝜃𝑐 is the estimate for country 𝑐, and �̂�𝐹𝑎𝑦(�̂�𝑐 ) is the Fay’s BRR estimate for
the variance of that estimate. According to this formula for statistically independent
samples, the standard error of the average 𝑠𝑒 (�̅̂�) is the square root of the sum of the
squared standard errors divided by the squared number of countries.
The formula used to calculate the estimate for the EU total (Table 12.1, Item 5) was:

441
TALIS 2018 TECHNICAL REPORT © OECD 2019
𝐸𝑈 𝑡𝑜𝑡𝑎𝑙 =∑ �̂�𝑐�̂�𝑐 𝐶𝑐=1
∑ �̂�𝑐𝐶𝑐=1
,
where �̂�𝑐 is the estimated population size for country 𝑐, that is, the sum of the appropriate
weights (e.g. for principal-level analyses, the sum of the school weights of country 𝑐), C is
the number of countries contributing to the estimate of the 𝐸𝑈 𝑡𝑜𝑡𝑎𝑙, and 𝜃𝑐 is the
parameter of interest (i.e. a country-specific average of the analysis variable) for country 𝑐.
The formula used to calculate the standard error of the EU total (see Table 12.1, Item 5, SE
column) was:
𝑠𝑒𝐸𝑈 𝑡𝑜𝑡𝑎𝑙√∑ �̂�𝑐
2 𝑠𝑒(𝜃𝑐 )2𝐶
𝑐=1
(∑ �̂�𝑐)𝐶𝑐=1
2
where �̂�𝑐 is the estimated population size for country 𝑐, 𝐶 is the number of countries
contributing to the estimate 𝑠𝑒𝐸𝑈 𝑡𝑜𝑡𝑎𝑙, and 𝜃𝑐 is the parameter of interest (i.e. a country-
specific average of the analysis variable).
While all countries were weighted to equally contribute to the OECD and TALIS averages,
this was not the case for the EU total. Here, each country/economy contributed according
to its estimated population size, meaning that countries/economies with a large estimated
population size (i.e. a high number of teachers or principals) contributed more to the EU
total than did countries/economies with a small population size (i.e. with a low number of
teachers or principals). Thus, the “EU total” is an “average European teacher”, whereas the
OECD or TALIS average is an “average country/economy”.
The Flemish Community of Belgium (see Table 12.1, Item 3) was excluded from
calculations of the OECD average, TALIS average and EU total, as the population was
already included in the estimates for Belgium. Countries/economies for which estimates
are flagged in the table (e.g. because the respective question was not administered) were
not included in the calculation of the OECD average, TALIS average and EU total.
12.6. Estimating percentiles
The IEA IDB Analyzer was used to estimate the percentiles. This procedure had two steps.
Step 1 involved sorting the values and producing a vector of accumulated weighted
frequencies. During Step 2, the first value to exceed the percentile threshold (25th, 50th
and 75th) became the respective percentile value.
12.7. Use of weights in tables featuring analyses of teachers’ and principals’ data
In tables including results derived from both principal and teacher data, the column
displaying results from the principal questionnaire has to be interpreted with caution
because of the estimation algorithm, which required the principal data to be merged with
the teacher data, and the teacher weights then used to conduct the analyses. The principal
data in these tables must, therefore, be viewed as a feature of teachers rather than of the
actual principal population.

442
TALIS 2018 TECHNICAL REPORT © OECD 2019
Box 12.1. Interpretation of results derived from analysis of teachers’ and principals’ data
As an example of how to interpret the results derived from jointly analysing principals’
data with teachers’ data, consider the results displayed in the column labelled “principal”
in Table 12.2. The estimates in this column need to be interpreted as the percentages of
teachers whose principal said that his or her school was “supporting activities or
organisations encouraging students’ expression of diverse ethnic and cultural identities”. It
would, therefore, be incorrect to state that a specific percentage of principals said their
schools were “supporting activities or organisations encouraging students’ expression of
diverse ethnic and cultural identities”.
Table 12.2. School practices related to diversity
12.8. Calculating parameters for the analyses of change over time
Another important TALIS goal is to report change over time. As the third cycle of the
TALIS survey, TALIS 2018 enables data users to look at changes over a ten-year period.
However, this type of analysis poses particular challenges that data users need to consider
when interpreting comparisons across cycles. First, not all countries/economies
participated in all cycles. Second, study questionnaires underwent some modifications,
which means that not all questions remained the same across the three measurement points.
A third consideration is that the context of teaching and learning may have changed
considerably across the ten years in terms of student intake or general societal trends, for
example. This section describes the measures taken to address these challenges.
Percentage of teachers working in a school with diverse ethnic and cultural student background where the following diversity-related practices are implemented:
Supporting activities or organisations encouraging students’ expression of diverse ethnic and cultural identities
According to teachers According to principals
% SE % SE
Alberta (Canada) 75.2 (2.2) 83.9 (5.0)
Austria 50.6 (1.5) 64.8 (3.5)
Belgium 52.1 (1.3) 59.3 (3.1)
Flemish Comm. (Belgium) 47.5 (1.7) 48.6 (4.3)
… … … … …
… … … … …
… … … … …
Turkey 40.8 (1.3) 48.5 (0.9)
United Arab Emirates 88.1 (0.6) 94.4 (0.2)
United States 72.8 (2.5) 90.2 (2.7)
Viet Nam 94.8 (1.2) 93.5 (3.0)
OECD average-30 54.2 (0.4) 61.3 (0.8)
EU total-23 57.0 (0.5) 67.0 (1.2)
TALIS average-47 62.7 (0.3) 69.9 (0.6)

443
TALIS 2018 TECHNICAL REPORT © OECD 2019
Samples in the tables displaying different TALIS cycles were adjusted to represent the
same populations across all cycles, thus ensuring comparability over time. This adjustment
was implemented by using the filter variable TALIS13POP to exclude affected cases from
analyses based on the TALIS 2018 dataset – see also OECD (forthcoming[2]). Chapter 9 of
this report provides the formula for estimating the standard error of the estimated difference
between cycles (i.e. the standard error for the difference between the estimates for two
countries/economies).
A change in the defined target populations across the TALIS cycles also needs to be
considered when comparing findings across them. Whereas in 2008, teachers of special
needs children in regular schools were not part of the target population definition and were
therefore not covered (OECD, 2010, p. 56[3]), these teachers were included in the TALIS
2013 and TALIS 2018 surveys (see Chapter 5). Comparisons of the estimates from TALIS
2008 and the other two cycles (2013 and 2008) therefore need to be made with caution.
Note also that teachers in schools exclusively directed towards teaching students with
special educational needs were excluded from all three cycles.
12.9. Tables based on the results of regression analysis
The OECD was responsible for conducting the regression analyses and for producing the
subsequent 45 tables presenting the regression results. The table shells for these analyses
were designed with the aim of ensuring that the analyses aligned with the plan for reporting
TALIS results.
The regression analyses, which were conducted separately for each participating
country/economy, explored the relationships between different variables. Linear regression
was used in those cases where the dependent (or outcome) variable was considered
continuous. Binary logistic regression was employed if the dependent (or outcome) variable
was a binary variable.
Selection of the independent (or control) variables included in each regression model was
based on theoretical reasoning and, preferably, limited to the most objective measures or
those measures that do not change over time. Controls for teacher characteristics included
teacher’s gender, age, employment status (full-time/part-time) and years of teaching
experience. Controls for class characteristics included variables of classroom composition
(share of students whose first language differed from the language of instruction, low
achievers academically, students with special needs, students with behavioural problems,
students from socio-economically disadvantaged homes, academically gifted students,
immigrant students or students with an immigrant background, refugee students) and class
size.
In the case of the multiple linear regression models, the models’ explanatory power is also
highlighted by the R-squared (R²), which represents the proportion of the observed
variation in the dependent (or outcome) variable that can be explained by the independent
(or control, explanatory) variables.
To ensure the robustness of the regression models, the OECD team used a stepwise
approach to introduce the independent variables into the models. This approach required
each step of the model to be based on the same sample. Consequently, during analysis, the
restricted sample used for the different versions of the same model corresponded to the
sample of the most extended version of the model (i.e. the version with the maximum
number of independent variables). Thus, the restricted sample for each regression model
excluded those observations that had missing values for any of the independent variables.5

444
TALIS 2018 TECHNICAL REPORT © OECD 2019
12.10. Handling of filter-dependent questions
Some questions in the TALIS surveys are meant to be answered by a defined subgroup of
the surveys’ target populations. The respective subgroups are identified by their responses
to filter questions. Consider, for example, Question 37 in the TALIS 2018 principal
questionnaire (variable TC3G37): “In this school, are the following policies and practices
in relation to diversity implemented?”. This question was to be answered only by principals
who gave the answer “Yes” to the preceding filter question (variable TC3G37): “Does this
school include students of more than one cultural or ethnic background?”. In this instance,
TC3G37 is a filter question and TC3G38 is the filter-dependent question.
Estimates involving filter-dependent questions were based only on those respondents who
were filtered in by the preceding corresponding filter question (information on this matter
can be found in the table header of each table that provides the selection criteria for the
filter). The IEA and OECD team implemented this rule by treating cases not meeting the
filter criteria (i.e. observations with logically not applicable codes in the dataset) as missing
values that needed to be ignored in the analyses (more information about the missing codes
can be found in Chapter 8 of this report). If a participant did not answer a filter question,
yet answered a subsequent filter-dependent question, the team included the response to the
filter dependent question in the analyses.
In specific cases, subgroups were defined not only by filter variables but also by other
criteria for interpretative reasons. Information on these criteria is provided in the footnotes
below the tables of the TALIS 2018 international report, TALIS 2018 Results (Volume I):
Teachers and School Leaders as Lifelong Learners (OECD, 2019[1]).
12.11. Annotation rules related to data quality requirements (minimum number of
cases, item non-response)
The annotation scheme shown in Box 12.2 for flagging empty cells in the tables of the
TALIS 2018 international report was developed by the TALIS International Consortium in
collaboration with the OECD and the TAG and it followed the approaches used for the
TALIS 2013 and PISA 2015 international reports.
Box 12.2. Annotation rules relating to data-quality requirements
a The question was not administered in the country/economy because it was optional
or was part of a questionnaire from a TALIS cycle the country/economy did not
participate in. Data are therefore deemed missing data.
c There were too few or no observations to provide reliable estimates and/or to ensure
the confidentiality of respondents, that is, there were fewer than
10 schools/principals and/or 30 teachers with valid data; and/or the item
non-response rate (i.e. ratio of missing or invalid responses to the number of
participants for whom the question was applicable) was above 50%.
m Data were collected but were subsequently, as part of the data-checking process,
removed for technical reasons (e.g. erroneous translation).

445
TALIS 2018 TECHNICAL REPORT © OECD 2019
p Data were collected but not reported for technical reasons (e.g. low participation
rate) as part of the data adjudication process.
w Data were withdrawn or were not collected at the request of the country/economy
concerned.
The first data quality check verified the proportion of participants who answered a given
question (item non-response rule). The item non-response rule was implemented to ensure
that the number of participants who gave a valid answer to a question divided by the number
of participants to whom the question was applicable (refers to filter or CNO)6 was not lower
than 50%. The second data quality check ensured that an estimate was based on at least 30
teachers and 10 principals/schools (minimum sample rule). If a country/economy did not
meet one or both requirements, the analysis was not conducted for that country/economy,
as indicated by the symbol “c” in the relevant table. For example, in the TALIS dataset for
Alberta (Canada), no more than ten principals from privately managed schools gave a valid
answer to the question “Are you female or male?”, which accounts for the “c” for Alberta
(Canada) in the Table 12.3 column titled “privately managed schools”.
Estimated differences that tested significantly different from zero are highlighted in bold
in the tables. More information on statistical testing can be found in the TALIS 2018 and
TALIS Starting Strong Survey 2018 User Guide (OECD, forthcoming[2]).
Table 12.3. Principals’ gender, by school characteristics
12.12. Quality assurance and table verification
To ensure high quality, the results presented in the tables were produced and released
during up to three review and revision rounds. During each release, the TALIS Consortium,
Percentage of female principals
Total
By school type
Publicly managed schools Privately managed schools
% SE % SE % SE
Alberta (Canada) 29.7 (6.7) 29.1 (6.4) c c
Austria 49.9 (3.6) 47.4 (3.6) 64.1 (8.3)
Belgium 43.6 (2.9) 56.2 (4.8) 35.4 (3.7)
Flemish Comm. (Belgium) 40.3 (3.7) 51.0 (7.4) 36.4 (4.2)
… … … … … … …
… … … … … … …
… … … … … … …
Turkey 7.2 (1.2) 5.5 (1.3) 28.4 (1.8)
United Arab Emirates 51.3 (2.1) 53.5 (2.8) 49.8 (3.2)
United States 48.5 (8.5) 38.8 (10.8) 77.5 (9.4)
Viet Nam 28.8 (3.1) 28.8 (3.1) 27.4 (15.1)
OECD average-30 47.3 (0.8) 46.6 (0.9) 50.6 (2.1)
EU total-23 54.0 (1.1) 54.1 (1.4) 54.8 (3.7)
TALIS average-47 48.9 (0.6) 48.6 (0.7) 50.5 (1.7)

446
TALIS 2018 TECHNICAL REPORT © OECD 2019
the OECD and the participating countries/economies verified the results for substantial
plausibility.
To validate and verify the statistical procedures applied by the TALIS Consortium
(implemented with the IEA IDB Analyzer and R), both ACER and the OECD reproduced
all estimates presented in the tables. ACER recalculated the table results using ACER-
developed tools for replicated analysis (Fay-BRR in this case), while the OECD relied on
the repest function in STATA.
Verification encompassed the following activities:
general plausibility checks
different reviewers verifying the variables, sub-settings and recodings several times
over
recalculation of randomly-selected results from each table (usually one or
two randomly-selected columns of a table)
recalculation of all OECD and TALIS averages and the EU totals
comparison of results against the results produced by ACER and the OECD.

447
TALIS 2018 TECHNICAL REPORT © OECD 2019
References
OECD (2019), TALIS 2018 Results (Volume I): Teachers and School Leaders as Lifelong
Learners, TALIS, OECD Publishing, Paris, https://dx.doi.org/10.1787/1d0bc92a-en.
[1]
OECD (2010), TALIS 2008 Technical Report, TALIS, OECD Publishing, Paris,
https://dx.doi.org/10.1787/9789264079861-en.
[3]
OECD (forthcoming), TALIS 2018 and TALIS Starting Strong Survey 2018 User Guide, OECD,
Paris.
[2]
Notes
1 Tables were shortened to highlight important statistical aspects and thus to increase readability.
All footnotes that were not important in the context of this chapter were deleted from the tables, but
can be found in the international report (OECD, 2019[1]). Order and names of countries in Chapter 12
tables match tables in the international report (OECD, 2019[1]) but differ slightly from other tables
in this technical report.
2 The IEA IDB Analyzer is a software application developed by the IEA to perform analysis with
data of international large-scale assessments in education. It provides, via a user interface, SPSS or
SAS syntax that can be run with the respective software (see www.iea.nl/data). Version 4.0.26 of
the IEA IDB Analyzer was used to produce the TALIS 2018 tables.
3 The following R packages were used: data.table, openxlsx. More information on R can be found
at https://www.r-project.org.
4 Box 12.2 of this chapter details the annotation rules relating to data quality requirements and their
associated flagging symbols.
5 Listwise deletion was implemented in the regression analysis.
6 CNO refers to co-ordinated national options or, in other words, to country-specific questions.

448
TALIS 2018 TECHNICAL REPORT © OECD 2019
Annex A. Consortium, experts and consultants
IEA Hamburg (Hamburg, Germany)
Core management
Steffen Knoll (International Study Co-Director Operations)
Ralph Carstens (International Study Co-Director Content)
Viktoria Böhm (International Study Co-ordinator)
Juliane Kobelt (International Study Co-ordinator)
Malgorzata Petersen (International Co-ordination Assistant)
Friederike Westphal (International Study Co-ordinator)
Operations, data management and systems
Alena Becker (International Data Manager)
Christine Busch (Deputy International Data Manager)
Clara Beyer (Research Analyst)
Mark Cockle (Research Analyst)
Olesya Drozd (Research Analyst)
Wolfram Jarchow (Research Analyst)
Philipp Köhme (Research Analyst)
Hannah Kowolik (Research Analyst)
Kamil Kowolik (Research Analyst)
Oriana Mora (Research Analyst)
Adeoye Oyekan (Research Analyst)
Anja Waschk (Senior Research Analyst)
Xiao Sui (Research Analyst)
Anton Gorev (Student Assistant)
Svenja Kalmbach (Student Assistant)
Lena Talihmanidis (Student Assistant)
Nhat Khanh Huy Tran (Student Assistant)

449
TALIS 2018 TECHNICAL REPORT © OECD 2019
Scaling and analysis
Sabine Meinck (Senior Research Analyst)
Agnes Stancel-Piatak (Senior Research Analyst, Team Leader Scaling and Analysis)
Umut Atasever (Research Analyst)
Falk Brese (Senior Research Analyst)
Minge Chen (Research Analyst)
Deana Desa (Research Analyst)
Ann-Kristin Koop (Research Analyst)
Nadine Twele (Research Analyst)
Justin Wild (Research Analyst)
Conrad Baumgart (Student Assistant)
Isbat Ibn Hasat (Student Assistant)
Zarrinigor Nozimova (Student Assistant)
Meeting organisation
Catherine Pfeifer (Meeting Co-ordinator)
Bettina Wietzorek (Meeting Co-ordinator and SharePoint Administrator)
ICT services
Malte Bahrenfuß (ICT Service Manager)
Jan Pohland (ICT Service Provider)
Software development and testing
Meng Xue (Unit Head Software Development)
Limiao Duan (Programmer)
Christian Harries (Programmer)
Majid Iqbal (Tester)
Maike Junod (Programmer)
Deepti Kalamadi (Programmer)
Ievgen Kosievtsov (Programmer)
Kathrin Krämer (Programmer)
Kevin Mo (Programmer)
Marcus Nitschke (Programmer)
Devi Potham Rajendra Prasath (Programmer)
450
TALIS 2018 TECHNICAL REPORT © OECD 2019
Svetoslav Velkov (Tester)
Juan Vilas (Programmer)
Samih Al-areqi (Requirements Engineer and Tester)
Rea Car (Requirements Engineer and Tester)
Elma Cela (Requirements Engineer and Tester)
Michael Jung (Requirements Engineer and Tester)
Ekaterina Mikheeva (Requirements Engineer and Tester)
Lorelia Nithianandan (Requirements Engineer and Tester)
Yasin Afana (Research Analyst)
Tim Daniel (Research Analyst)
Dirk Oehler (Research Analyst)
IEA Amsterdam (Amsterdam, the Netherlands)
Andrea Netten (Director, IEA Amsterdam)
David Ebbs (Senior Research Officer)
Michelle Djekić (Research and Liaison Officer)
Sandra Dohr (Junior Research Officer)
Jan-Philipp Wagner (Junior Research Officer)
Roel Burgers (Financial Director)
Isabelle Gémin (Senior Financial Officer)
Translation verification was performed in co-operation with cApStAn Linguistic Quality
Control, an independent linguistic quality control agency located in Brussels, Belgium. IEA
Amsterdam appointed, contracted and trained independent quality observers to monitor
survey implementation in each participating country/economy.
Statistics Canada (Ottawa, Canada)
Jean Dumais (Sampling Referee)
Yves Morin (Senior Survey Statistician)
Ahalya Sivathayalan (Survey Statistician)
Naïma Gouzi (Survey Statistician)

451
TALIS 2018 TECHNICAL REPORT © OECD 2019
Australian Council for Educational Research (ACER, Melbourne, Australia)
John Ainley (Principal Research Fellow)
Hilary Hollingsworth (Principal Research Fellow)
Eveline Gebhardt (Research Director)
Tim Friedman (Senior Research Fellow)
Renee Kwong (Research Fellow)
Dulce Lay (Research Fellow)
Leigh Patterson (Research Fellow)
Consultants
Hynek Cigler (Masaryk University, Czech Republic)
Eugenio J. Gonzalez (Educational Testing Service, United States)
Plamen Mirazchiyski (International Educational Research and Evaluation Institute,
Slovenia)
Leslie A. Rutkowski (Indiana University Bloomington, United States)
TALIS Expert Groups
Questionnaire Expert Group
Ralph Carstens (IEA Hamburg, Chair)
John Ainley (Australian Council for Educational Research, ex-officio)
Julie Belanger (RAND Europe, United Kingdom, ex-officio liaison to the TALIS Starting
String Survey)
Sigrid Blömeke (Centre for Educational Measurement, CEMO, Norway)
Jean Dumais (Statistics Canada, ex-officio)
Hillary Hollingsworth (Australian Council for Educational Research)
David Kaplan (University of Wisconsin-Madison, United States)
Daniel Mujis (Ofsted; formerly University of Southampton, United Kingdom)
Trude Nilsen (University of Oslo, Norway)
Heather Price (Marian University, United States)
Ronny Scherer (Centre for Educational Measurement, CEMO, and University of Oslo,
Norway)
Fons van de Vijver (University of Tilburg, the Netherlands, ex-officio liaison to PISA 2018
and TAG)

452
TALIS 2018 TECHNICAL REPORT © OECD 2019
Extended Questionnaire Expert Group
Elsebeth Aller (Ministry of Education; formerly Metropolitan University College,
Denmark)
Sarah Howie (University of Stellenbosch, South Africa)
Magdalena Mok (The Education University of Hong Kong, Hong Kong, China)
Susan Seeber (Georg-August-Universität Göttingen, Germany)
Sandy Taut (Educational Quality Agency, State of Bavaria, Germany; formerly Pontificia
Universidad Católica de Chile, Chile)
Technical Advisory Group
Fons van de Vijver (University of Tilburg, the Netherlands, Chair)
Pascal Bressoux (Université Grenoble Alpes, France)
Timothy L. Kennel (US Census Bureau, United States)
Bart Meulemann (University of Leuven, Belgium)
Christian Monseur (University of Liège, Belgium)

453
TALIS 2018 TECHNICAL REPORT © OECD 2019
Annex B. Technical standards
You can find the full technical standards on line at:
www.oecd.org/education/talis/Annex_B-TALIS2018_Technical_report-
Technical_Standards.pdf

454
TALIS 2018 TECHNICAL REPORT © OCDE 2019
Annex C. Sampling forms
Figure A C.1. Sampling Form 1

455
TALIS 2018 TECHNICAL REPORT © OCDE 2019
Figure A C.2. Sampling Form 2

456
TALIS 2018 TECHNICAL REPORT © OCDE 2019
Figure A C.3. Sampling Form 3

457
TALIS 2018 TECHNICAL REPORT © OCDE 2019
Figure A C.4. Sampling Form 4

458
TALIS 2018 TECHNICAL REPORT © OCDE 2019
Figure A C.5. Sampling Form 5

459
TALIS 2018 TECHNICAL REPORT © OCDE 2019
Figure A C.6. Sampling Form ISCED 1

460
TALIS 2018 TECHNICAL REPORT © OCDE 2019
Figure A C.7. Sampling Form ISCED 3
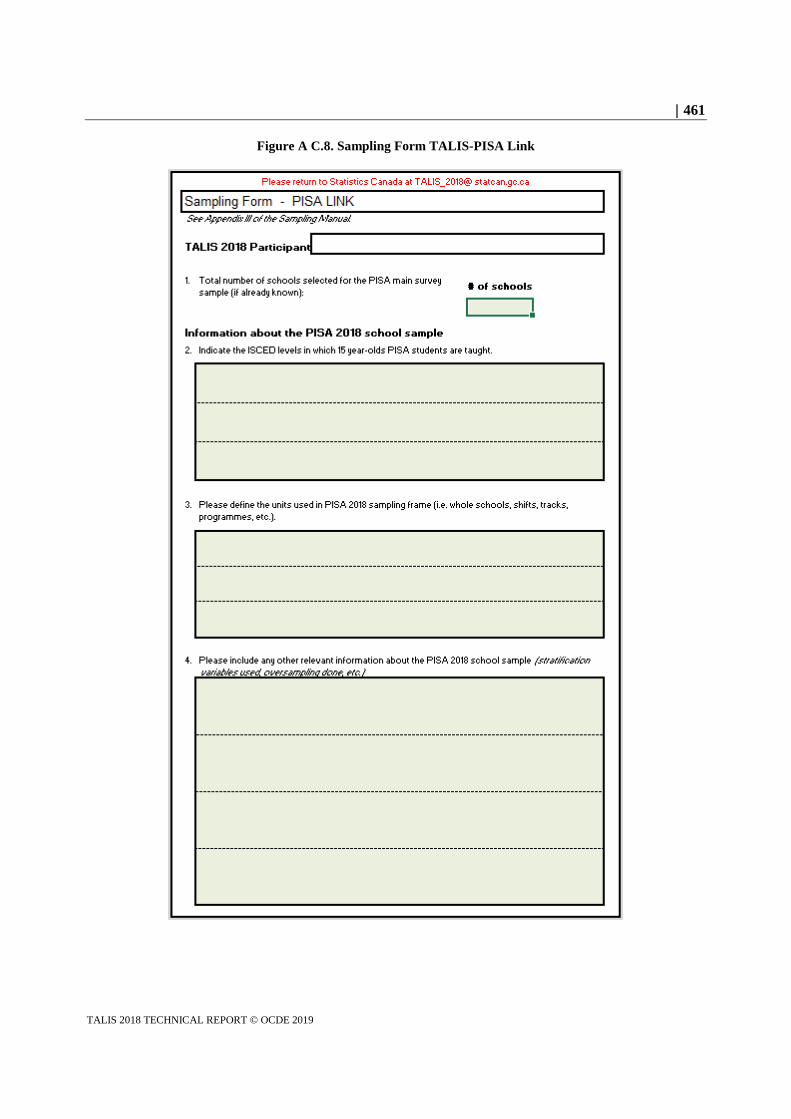
461
TALIS 2018 TECHNICAL REPORT © OCDE 2019
Figure A C.8. Sampling Form TALIS-PISA Link

462
TALIS 2018 TECHNICAL REPORT © OCDE 2019
Figure A C.9. Additional Information

463
TALIS 2018 TECHNICAL REPORT © OECD 2019
Annex D. Target and survey population
The statistical data for Israel are supplied by and under the responsibility of the relevant Israeli authorities. The
use of such data by the OECD is without prejudice to the status of the Golan Heights, East Jerusalem and Israeli
settlements in the West Bank under the terms of international law.

464
TALIS 2018 TECHNICAL REPORT © OECD 2019
Table A D.1. ISCED level 2
Participating country/economy
Population and coverage
Reasons for exclusions Number of
schools Percentage
of total Number of teachers
Percentage of total
Alberta (Canada) Target Population 1 158 100 .. ..
Exclusions: Band-operated schools. These schools operate on First Nations’ reserves and are the responsibility of the federal government rather than the responsibility of Alberta Education
39 3.37 .. ..
Very small schools (fewer than three students in each of Grades 7 to 9)
100 8.64 .. ..
Survey Population 1 019 88 .. ..
Australia Target Population 2 862 100 .. ..
Exclusions: Small schools (fewer than four students)
263 9.19 .. ..
Schools that are geographically remote 32 1.12 .. ..
Small schools that are also geographically remote
31 1.08 .. ..
Survey Population 2 536 88.61 .. ..
Austria Target Population 1 496 100 .. ..
Exclusions: Slovene school where the language of instruction is not German
1 0.07 .. ..
Survey Population 1 495 99.93 .. ..
Belgium Target Population 1 245 100 .. ..
Exclusions: Very small schools (fewer than 20 students at ISCED level 2)
10 0.8 .. ..
Special needs schools 79 6.35 .. ..
Survey Population 1 156 92.85 .. ..
Flemish Community (Belgium)
Target Population 718 100 .. ..
Exclusions: Very small schools (fewer than 20 students at ISCED level 2)
2 0.28 .. ..
Survey Population 716 99.72 .. ..
Brazil Target Population 58 303 100 870 737 100
Exclusions: Schools with fewer than six teachers. Because ISCED level 2 requires at least one teacher for each subject, most of these schools have only one class. The schools that fit this criterion are located in geographically remote areas
4 957 8.5 18 896 2.17
Public-federal schools 38 0.07 1 724 0.2
Survey Population 53 308 91.43 850 117 97.63
Bulgaria Target Population 1 834 100 23 168 100
Exclusions: Schools for students with special education needs
67 3.65 454 1.96
Very small schools 45 2.45 126 0.54
Survey Population 1 722 93.89 22 588 97.5

465
TALIS 2018 TECHNICAL REPORT © OECD 2019
Participating country/economy
Population and coverage
Reasons for exclusions Number of
schools Percentage
of total Number of teachers
Percentage of total
Ciudad Autónoma de Buenos Aires (Argentina)
Target Population 488 100 .. ..
Survey Population 488 100 .. ..
Chile Target Population 6 008 100 51 626 100
Exclusions: Schools with fewer than three teachers 681 11.33 1433 2.78
Schools that are geographically remote 4 0.07 27 0.05
Survey Population 5 323 88.6 50 166 97.17
Colombia Target Population 13 009 100 .. ..
Exclusions: Small schools (fewer than three teachers at ISCED level 2)
322 2.48 .. ..
Schools that are outside the Sistema Integrado de Matricula
15 0.12 .. ..
Survey Population 12 672 97.41 .. ..
Croatia Target Population 860 100 .. ..
Exclusions: National minority schools (Italian, Serbian schools)
11 1.28 .. ..
Survey Population 849 98.72 .. ..
Cyprus1, 2 Target Population 102 100 4 426 100
Exclusions: School that is geographically remote 1 0.98 13 0.29
School where language of instruction is one other than Greek or English
1 0.98 8 0.18
Very small school that has part-time teachers and no head teacher or assistant head teacher
1 0.98 5 0.11
Survey Population 99 97.06 4 400 99.41
Czech Republic Target Population 2 645 100 39 690 100
Exclusions: Schools with a different language of instruction (Polish)
10 0.38 116 0.29
Dancing conservatoire – specific education programmes
5 0.19 122 0.31
Very small schools (fewer than three teachers at ISCED level 2)
14 0.53 11 0.03
Survey Population 2 616 98.9 39 441 99.37
Denmark Target Population 1 721 100 .. ..
Exclusions: Small schools (fewer than 40 students and generally fewer than 5 teachers)
251 14.58 .. ..
Survey Population 1 470 85.42 .. ..
England (United Kingdom)
Target Population 4 345 100 .. ..
Exclusions: International schools 13 0.3 .. ..
Very small schools 57 1.31 .. ..
Schools proposed for closure 17 0.39 .. ..
Survey Population 4 258 98 .. ..
Estonia Target Population 404 100 8 622 100
Exclusions: International schools 4 0.99 34 0.39
Ballet school 1 0.25 21 0.24
Survey Population 399 98.76 8 567 99.36

466
TALIS 2018 TECHNICAL REPORT © OECD 2019
Participating country/economy
Population and coverage
Reasons for exclusions Number of
schools Percentage
of total Number of teachers
Percentage of total
Finland Target Population 722 100 .. ..
Exclusions: International//foreign/immersion schools, where all students are taught in languages other than Finnish or Swedish
8 1.11 .. ..
Survey Population 714 98.89 .. ..
France Target Population 7 203 100 215 940 100
Exclusions: Schools located in overseas French territories (TOM)
79 1.1 1 342 0.62
Schools located in La Réunion and Mayotte (Southern Hemisphere calendar)
103 1.43 5 529 2.56
Private schools under different administration
193 2.68 . .
Survey Population 6 828 94.79 209 069 96.82
Georgia Target Population 2 265 100 42 757 100
Exclusions: Schools where the language of instruction is an excluded minority language
13 0.57 249 0.58
Very small schools 2 0.09 6 0.01
Survey Population 2 250 99.34 42 502 99.4
Hungary Target Population 2 844 100 37 938 100
Exclusions: Very small schools (fewer than three teachers at ISCED level 2)
85 2.99 126 0.33
Survey Population 2 759 97.01 37 812 99.67
Iceland Target Population 142 100 .. ..
Survey Population 142 100 .. ..
Israel Target Population 2 475 100 .. ..
Exclusions: International/foreign schools where the language of instruction is a single minority language
5 0.2 .. ..
Ultra-Orthodox Jewish schools where the language of instruction is Hebrew
1 246 50.34 .. ..
Survey Population 1 224 49.45 .. ..
Italy Target Population 5 783 100 154 071 100
Exclusions: Schools with fewer than three teachers at ISCED level 2
63 1.09 90 0.06
Survey Population 5 720 98.91 153 981 99.94
Japan Target Population 10 426 100 264 356 100
Survey Population 10 426 100 264 356 100
Kazakhstan Target Population 6 424 100 208 254 100
Exclusions: Uzbek, Uighur and Tadjik schools. These regions together account for less than 5% of Kazakhstan’s population. The TALIS questionnaire will be administered in the Kazakh and Russian languages in these schools
30 0.47 1 215 0.58
Schools located in the Baikonur region (special permission is required to enter this territory)
5 0.08 306 0.15

467
TALIS 2018 TECHNICAL REPORT © OECD 2019
Participating country/economy
Population and coverage
Reasons for exclusions Number of
schools Percentage
of total Number of teachers
Percentage of total
Schools with fewer than three teachers at ISCED level 2
2 0.03 5 0
School where the language of instruction is English
1 0.02 60 0.03
Survey Population 6 386 99.41 206 668 99.24
Korea Target Population 3 252 100 69 820 100
Exclusions: Schools with fewer than three teachers at ISCED level 2
7 0.22 17 0.02
Schools that are geographically remote 151 4.64 1073 1.54
Schools with no more than three teachers at ISCED level 2 and schools that are geographically remote
4 0.12 7 0.01
Schools with alternative curricula, teacher licensure and school structure
31 0.95 382 0.55
Survey Population 3 059 94.07 68 341 97.88
Latvia Target Population 695 100 .. ..
Exclusions: International schools (e.g. for diplomats’ children)
2 0.29 .. ..
Special regime (criminal) school 1 0.14 .. ..
Survey Population 692 99.57 .. ..
Lithuania Target Population 960 100 .. ..
Exclusions: International schools where English and French are the languages of instruction and the education system
3 0.31 .. ..
Youth schools. These implement basic education programmes but also have a particular focus on special education (emotionally or socially disadvantaged students)
12 1.25 .. ..
Small schools (fewer than ten students at ISCED level 2)
19 1.98 .. ..
Survey Population 926 96.46 .. ..
Malta Target Population 63 100 3 271 100
Exclusions: Language schools 2 3.17 16 0.49
Survey Population 61 96.83 3 255 99.51
Mexico Target Population 16 763 100 328 649 100
Exclusions: Schools with fewer than three teachers 41 0.24 95 0.03
Survey Population 16 722 99.76 328 554 99.97
Netherlands Target Population 538 100 .. ..
Survey Population 538 100 .. ..
New Zealand Target Population 1 696 100 .. ..
Exclusions: National correspondence school 1 0.06 .. ..
Survey Population 1 695 99.94 .. ..
Norway Target Population 1 154 100 23 542 100
Exclusions: Very small schools (fewer than three teachers)
68 5.89 168 0.71
Sami schools 5 0.43 48 0.2
International schools 15 1.3 216 0.92

468
TALIS 2018 TECHNICAL REPORT © OECD 2019
Participating country/economy
Population and coverage
Reasons for exclusions Number of
schools Percentage
of total Number of teachers
Percentage of total
International schools where the language of instruction is French
2 0.17 31 0.13
Survey Population 1 064 92.2 23 079 98.03
Portugal Target Population 1 273 100 36 912 100
Exclusions: Schools with non-Portuguese curricula 16 1.26 299 0.81
Survey Population 1 257 98.74 36 613 99.19
Romania Target Population 4 776 100 .. ..
Exclusions: Very small schools (fewer than 25 students at ISCED level 2)
88 1.84 .. ..
Survey Population 4 688 98.16 .. ..
Russian Federation
Target Population 41 893 100 760 196 100
Exclusions: Crimean schools 621 1.48 12 462 1.64
Moscow schools 733 1.75 41 541 5.46
Survey Population 40 539 96.77 706 193 92.9
Saudi Arabia Target Population 8 105 100 120 109 100
Exclusions: Schools in the Najran and Jazan regions (near the borders with Yemen where there is war)
767 9.46 9 028 7.52
Private schools. These schools are not being included in TALIS at this stage because their system of education differs from that of the public system
951 11.73 11 075 9.22
Schools with fewer than four teachers 121 1.49 240 0.2
Survey Population 6 266 77.31 99 766 83.06
Shanghai (China) Target Population 662 100 41 705 100
Exclusions: Special schools for students with behavioural problems, including delinquency
12 1.81 340 0.82
Survey Population 650 98.19 41 365 99.18
Singapore Target Population 197 100 12 285 100
Exclusions: Schools where the language of instruction is not English and where teachers would have difficulty responding to the TALIS survey, which is in English
4 2.03 200 1.63
Survey Population 193 97.97 12 085 98.37
Slovak Republic Target Population 1 591 100 24 841 100
Exclusions: Schools with fewer than three teachers at ISCED level 2
10 0.63 20 0.08
Survey Population 1 581 99.37 24 821 99.92
Slovenia Target Population 451 100 9 090 100
Exclusions: Italian basic schools in an ethnically mixed area where the language of instruction is Italian and where the teachers are therefore a separate group of Slovenian teachers
3 0.67 42 0.46
Survey Population 448 99.33 9 048 99.54

469
TALIS 2018 TECHNICAL REPORT © OECD 2019
Participating country/economy
Population and coverage
Reasons for exclusions Number of
schools Percentage
of total Number of teachers
Percentage of total
Spain Target Population 6 954 100 200 193 100
Exclusions: Small schools (fewer than three teachers)
43 0.62 59 0.03
Schools that are geographically remote 2 0.03 42 0.02
Survey Population 6 909 99.35 200 092 99.95
Sweden Target Population 1 768 100 .. ..
Exclusions: Small schools (fewer than six students at ISCED level 2)
49 2.77 .. ..
International schools not following the Swedish curriculum
11 0.62 .. ..
Survey Population 1 708 96.61 .. ..
Chinese Taipei Target Population 939 100 .. ..
Exclusions: Schools with fewer than three teachers 7 0.75 .. ..
Survey Population 932 99.25 .. ..
Turkey Target Population 16 228 100 310 932 100
Survey Population 16 228 100 310 932 100
United Arab Emirates
Target Population 577 100 17 541 100
Exclusions: Private schools 14 2.43 350 2
Survey Population 563 97.57 17 191 98
United States Target Population 63 795 100 .. ..
Exclusions: Schools in detention, hospital and treatment centres
569 0.89 .. ..
Survey Population 63 226 99.11 .. ..
Viet Nam Target Population 10 843 100 303 171 100
Exclusions: Non-Vietnamese international schools 22 0.2 153 0.05
Survey Population 10 821 99.8 303 018 99.95
.. : missing value or not available.
1. Note by Turkey: The information in this document with reference to “Cyprus” relates to the southern part of the Island. There
is no single authority representing both Turkish and Greek Cypriot people on the Island. Turkey recognises the Turkish Republic
of Northern Cyprus (TRNC). Until a lasting and equitable solution is found within the context of the United Nations, Turkey shall
preserve its position concerning the “Cyprus issue”.
2. Note by all the European Union Member States of the OECD and the European Union: The Republic of Cyprus is recognised
by all members of the United Nations with the exception of Turkey. The information in this document relates to the area under the
effective control of the Government of the Republic of Cyprus.

470
TALIS 2018 TECHNICAL REPORT © OECD 2019
Table A D.2. ISCED level 1
Participating country/economy
Population and coverage
Reasons for exclusions Number of schools
Percentage of total
Number of teachers
Percentage of total
Australia Target Population 7 733 100 140 827 100
Exclusions: Small schools 1 106 14.3 2 289 1.63
Schools that are geographically remote 77 1 533 0.38
Small schools that are also geographically remote
40 0.52 119 0.08
Survey Population 6 510 84.18 137 886 97.91
Flemish Community (Belgium)
Target Population 2 238 100 .. ..
Exclusions: Schools with fewer than 20 pupils at ISCED level 1
5 0.22 .. ..
Survey Population 2 233 99.78 .. ..
Ciudad Autónoma de Buenos Aires (Argentina)
Target Population 878 100 .. ..
Survey Population 878 100 .. ..
Denmark Target Population 1 751 100 .. ..
Exclusions: Small schools (fewer than 40 students and generally fewer than 5 teachers)
57 3.26 .. ..
Survey Population 1 694 96.74 .. ..
England (United Kingdom)
Target Population 18 445 100 .. ..
Exclusions: International schools 17 0.09 .. ..
Very small schools 258 1.4 .. ..
Schools proposed for closure 26 0.14 .. ..
Survey Population 18 144 98.37 .. ..
France Target Population 33 929 100 .. ..
Exclusions: Schools located in overseas French territories (TOM)
105 0.31 .. ..
Schools located in La Réunion and Mayotte (Southern Hemisphere calendar)
473 1.39 .. ..
Private schools under different administration
425 1.25 .. ..
Survey Population 32 926 97.04 .. ..
Japan Target Population 20 333 100 385 923 100
Survey Population 20 333 100 385 923 100
Korea Target Population 6 242 100 118 417 100
Exclusions: Schools with fewer than three teachers at ISCED level 1
120 1.92 237 0.2
Schools that are geographically remote 303 4.85 1 809 1.53
Schools with fewer than three teachers at ISCED level 1 and also geographically remote
208 3.33 305 0.26
Survey Population 5 611 89.89 116 066 98.01

471
TALIS 2018 TECHNICAL REPORT © OECD 2019
Participating country/economy
Population and coverage
Reasons for exclusions Number of schools
Percentage of total
Number of teachers
Percentage of total
Netherlands Target Population 6 429 100 111 157 100
Exclusions: Fewer than five teachers 95 1.48 339 0.3
Schools on wheels/boat schools 2 0.03 49 0.04
Survey Population 6 332 98.49 110 769 99.65
Spain Target Population 13 603 100 287 262 100
Exclusions: Small schools 328 2.41 800 0.28
Survey Population 13 275 97.59 286 462 99.72
Sweden Target Population 4 339 100 .. ..
Exclusions: Small schools (fewer than six students at ISCED level 1)
67 1.54 .. ..
International schools not following the Swedish curriculum
11 0.25 .. ..
Survey Population 4 261 98.2 .. ..
Chinese Taipei Target Population 2 656 100 93 713 100
Exclusions: Schools with fewer than three teachers 1 0.04 3 0
Survey Population 2 655 99.96 93 710 100
Turkey Target Population 24 755 100 289 681 100
Survey Population 24 755 100 289 681 100
United Arab Emirates
Target Population 602 100 22 074 100
Exclusions: Private schools 14 2.33 428 1.94
Survey Population 588 97.67 21 646 98.06
Viet Nam Target Population 15 169 100 395 620 100
Exclusions: Non-Vietnamese international schools 26 0.17 685 0.17
Survey Population 15 143 99.83 394 935 99.83
.. : missing value or not available.

472
TALIS 2018 TECHNICAL REPORT © OECD 2019
Table A D.3. ISCED level 3
Participating country/economy
Population and coverage
Reasons for exclusions Number of schools
Percentage of total
Number of Teachers
Percentage of total
Alberta (Canada) Target Population 688 100 .. ..
Exclusions: Band-operated schools. These schools operate on First Nations’ reserves and are the responsibility of the federal government rather than the responsibility of Alberta Education
37 5.38 .. ..
Very small schools (fewer than three students in each of Grades 10 to 12)
45 6.54 .. ..
Survey Population 606 88.08 .. ..
Brazil Target Population 28 815 100 643 204 100
Exclusions: Schools with fewer than six teachers. Because ISCED level 2 requires at least one teacher for each subject, most of these schools have only one class. The schools that fit this criterion are located in geographically remote areas
804 2.79 2 682 0.42
Survey Population 28 011 97.21 640 522 99.58
Croatia Target Population 385 100 .. ..
Exclusions: National minority schools (Italian, Serbian, Hungarian)
6 1.56 .. ..
Survey Population 379 98.44 .. ..
Denmark Target Population 421 100 .. ..
Exclusions: Small schools (fewer than 40 students and generally fewer than 5 teachers)
24 5.7 .. ..
Survey Population 397 94.3 .. ..
Portugal Target Population 871 100 36 849 100
Exclusions: Schools with non-Portuguese curricula
17 1.95 230 0.62
Survey Population 854 98.05 36 619 99.38
Slovenia Target Population 153 100 .. ..
Exclusions: Italian upper secondary schools in an ethnically mixed area where the language of instruction is Italian and where the teachers are therefore a separate group of Slovenian teachers
3 1.96 .. ..
Survey Population 150 98.04 .. ..
Sweden Target Population 1 296 100 .. ..
Exclusions: Small schools (fewer than six students at ISCED level 3)
7 0.54 .. ..
International schools not following the Swedish curriculum
11 0.85 .. ..
Survey Population 1 278 98.61 .. ..

473
TALIS 2018 TECHNICAL REPORT © OECD 2019
Participating country/economy
Population and coverage
Reasons for exclusions Number of schools
Percentage of total
Number of Teachers
Percentage of total
Chinese Taipei Target Population 505 100 .. ..
Exclusions Schools with fewer than three teachers
2 0.4 .. ..
Survey Population 503 99.6 .. ..
Turkey Target Population 9 520 100 325 692 100
Survey Population 9 520 100 325 692 100
United Arab Emirates
Target Population 448 100 13 260 100
Exclusions: Private schools 11 2.46 285 2.15
Survey Population 437 97.54 12 975 97.85
Viet Nam Target Population 2 941 100 167 755 100
Exclusions: Non-Vietnamese international schools
13 0.44 156 0.09
Survey Population 2 928 99.56 167 599 99.91
.. : missing value or not available.

474
TALIS 2018 TECHNICAL REPORT © OECD 2019
Annex E. Characteristics of national samples ISCED levels 1, 2 and 3
You can find the full annex on line at:
www.oecd.org/education/talis/Annex_E-TALIS2018_Technical_Report-
Characteristics_of_national_samples_ISCED_levels1_2_and_3.pdf

475
TALIS 2018 TECHNICAL REPORT © OECD 2019
Annex F. Teacher listing and tracking forms
You can find the full annex on line at:
www.oecd.org/education/talis/Annex_F-TALIS2018_Technical_report-
Teacher_Listing_and_Tracking_Forms.pdf

476
TALIS 2018 TECHNICAL REPORT © OECD 2019
Annex G. Unweighted and weighted participation rates
The statistical data for Israel are supplied by and under the responsibility of the relevant Israeli authorities. The
use of such data by the OECD is without prejudice to the status of the Golan Heights, East Jerusalem and Israeli
settlements in the West Bank under the terms of international law.

477
TALIS 2018 TECHNICAL REPORT © OECD 2019
Table A G.1. Unweighted and weighted participation rates (%) for ISCED level 1 schools
and principals
Participating country/
economy
Unweighted Weighted
Before replacement After replacement Before replacement After replacement
Australia 47.2 74.6 48.8 77.9
Flemish Community (Belgium)
70.0 92.0 69.0 92.2
Ciudad Autónoma de Buenos Aires (Argentina)
85.0 87.5 84.0 86.0
Denmark 56.6 73.2 52.7 72.2
England (United Kingdom) 70.5 84.7 76.4 89.5
France 88.7 91.3 89.3 91.5
Japan 97.0 99.5 97.2 99.5
Korea 78.0 80.5 77.3 78.9
Netherlands 40.7 69.6 39.0 69.6
Spain 98.2 98.2 97.4 97.4
Sweden 84.7 87.4 83.2 86.9
Chinese Taipei 99.5 100.0 99.8 100.0
Turkey 98.8 98.8 99.3 99.3
United Arab Emirates 90.6 90.6 90.6 90.6
Viet Nam 100.0 100.0 100.0 100.0
Table A G.2. Unweighted and weighted participation rates (%) for ISCED level 1 teachers
Participating country/
economy
Unweighted Weighted
Before replacement
After replacement
Teachers in participating
schools
Overall teacher
participation
Before replacement
After replacement
Teachers in participating
schools
Overall teacher
participation
Australia 46.2 71.2 76.5 54.5 48.8 74.0 76.4 56.5
Flemish Community (Belgium)
67.0 88.5 92.0 81.4 66.3 88.5 92.2 81.7
Ciudad Autónoma de Buenos Aires (Argentina)
81.0 83.5 86.9 72.5 79.5 81.9 86.2 70.6
Denmark 58.6 77.8 87.5 68.1 58.4 77.7 87.3 67.8
England (United Kingdom)
66.3 80.0 85.7 68.6 74.3 85.9 85.0 73.1
France 89.2 91.3 90.7 82.8 88.6 91.2 92.1 84.0
Japan 97.0 99.5 98.8 98.3 97.1 99.5 98.7 98.3
Korea 86.0 91.0 91.9 83.6 85.8 90.3 92.0 83.1
Netherlands 39.2 67.0 86.8 58.2 38.7 67.0 87.3 58.5
Spain 99.3 99.5 95.4 95.0 99.3 99.5 94.1 93.6
Sweden 90.0 93.7 78.8 73.8 89.8 93.8 78.6 73.7
Chinese Taipei 99.5 100.0 97.6 97.6 99.9 100.0 97.0 97.0
Turkey 99.4 99.4 98.5 97.9 99.2 99.2 98.4 97.6
United Arab Emirates
99.6 99.6 96.6 96.2 99.7 99.7 96.3 96.0
Viet Nam 100.0 100.0 98.0 98.0 100.0 100.0 98.3 98.3

478
TALIS 2018 TECHNICAL REPORT © OECD 2019
Table A G.3. Unweighted and weighted participation rates (%) for ISCED level 2 schools
and principals
Participating country/
economy
Unweighted Weighted
Before replacement After replacement Before replacement After replacement
Alberta (Canada) 54.4 66.2 46.0 57.8
Australia 49.0 75.7 47.1 75.1
Austria 96.0 100.0 93.1 100.0
Belgium 86.5 95.7 86.0 95.8
Flemish Community (Belgium)
82.5 94.0 81.4 94.0
Brazil 85.1 94.4 88.0 95.4
Bulgaria 97.5 100.0 96.5 100.0
Ciudad Autónoma de Buenos Aires (Argentina)
75.3 80.7 77.5 82.6
Chile 76.9 86.7 78.9 87.6
Colombia 68.8 70.9 66.6 69.6
Croatia 94.9 95.9 95.0 95.6
Cyprus1, 2 88.9 88.9 88.9 88.9
Czech Republic 98.6 98.6 99.0 99.0
Denmark 50.5 71.4 51.5 71.4
England (United Kingdom)
71.9 81.8 70.1 81.8
Estonia 88.2 100.0 88.3 100.0
Finland 100.0 100.0 100.0 100.0
France 97.5 98.0 97.6 98.0
Georgia 91.7 91.7 91.7 91.7
Hungary 91.2 94.3 90.9 93.3
Iceland 74.3 74.3 74.3 74.3
Israel 90.9 93.4 90.9 93.7
Italy 91.2 98.4 92.4 98.6
Japan 91.9 99.0 93.9 99.4
Kazakhstan 99.7 100.0 100.0 100.0
Korea 65.0 75.0 68.1 77.8
Latvia 80.4 91.9 73.4 90.8
Lithuania 100.0 100.0 100.0 100.0
Malta 93.1 93.1 93.1 93.1
Mexico 90.5 96.5 90.6 97.0
Netherlands 56.2 85.6 56.2 85.6
New Zealand 65.1 81.5 71.7 92.0
Norway 67.5 81.0 64.9 80.6
Portugal 97.5 100.0 97.7 100.0
Romania 100.0 100.0 100.0 100.0
Russian Federation 99.1 100.0 99.1 100.0
Saudi Arabia 96.5 96.5 96.2 96.2
Shanghai (China) 100.0 100.0 100.0 100.0
Singapore 97.0 98.8 93.3 97.9
Slovak Republic 84.4 90.5 83.6 90.4
Slovenia 74.7 79.3 74.8 79.3
South Africa 92.3 92.3 91.1 91.1
Spain 98.7 99.2 98.1 98.5
Sweden 85.9 89.1 83.5 88.6
Chinese Taipei 100.0 100.0 100.0 100.0

479
TALIS 2018 TECHNICAL REPORT © OECD 2019
Participating country/
economy
Unweighted Weighted
Before replacement After replacement Before replacement After replacement
Turkey 99.0 99.0 98.9 98.9
United Arab Emirates 91.4 91.4 91.4 91.4
United States 57.5 76.6 63.1 77.6
Viet Nam 100.0 100.0 100.0 100.0
1. Note by Turkey: The information in this document with reference to “Cyprus” relates to the southern part of
the Island. There is no single authority representing both Turkish and Greek Cypriot people on the Island.
Turkey recognises the Turkish Republic of Northern Cyprus (TRNC). Until a lasting and equitable solution is
found within the context of the United Nations, Turkey shall preserve its position concerning the “Cyprus
issue”.
2. Note by all the European Union Member States of the OECD and the European Union: The Republic of
Cyprus is recognised by all members of the United Nations with the exception of Turkey. The information in
this document relates to the area under the effective control of the Government of the Republic of Cyprus.
Table A G.4. Unweighted and weighted participation rates (%) for ISCED level 2 teachers
Participating country/economy
Unweighted Weighted
Before replacement
After replacement
Teachers in participating
schools
Overall teacher
participation
Before replacement
After replacement
Teachers in participating
schools
Overall teacher
participation
Alberta (Canada) 51.8 62.6 83.0 52.0 48.9 60.3 84.2 50.7
Australia 50.3 76.6 77.7 59.6 48.5 75.1 77.5 58.2
Austria 85.9 88.8 84.4 75.0 85.7 88.6 84.3 74.6
Belgium 85.2 94.2 86.2 81.2 86.0 95.1 86.8 82.6
Flemish Community Belgium)
80.0 91.0 84.4 76.8 80.1 91.0 84.2 76.6
Brazil 85.6 94.9 94.6 89.8 89.9 96.6 94.9 91.6
Bulgaria 97.5 100.0 98.1 98.1 97.1 100.0 98.3 98.3
Ciudad Autónoma de Buenos Aires (Argentina)
81.3 86.7 88.6 76.8 80.7 85.2 89.2 76.0
Chile 80.5 91.8 94.1 86.3 82.6 91.5 94.3 86.2
Colombia 73.9 77.4 93.4 72.3 73.1 77.1 93.5 72.1
Croatia 94.9 95.9 87.0 83.5 95.4 96.2 87.0 83.7
Cyprus1 88.9 88.9 90.1 80.1 88.9 88.9 90.1 80.1
Czech Republic 100.0 100.0 93.8 93.8 100.0 100.0 93.8 93.8
Denmark 50.5 71.9 86.8 62.5 51.1 72.0 86.8 62.5
England (United Kingdom)
68.2 77.6 83.1 64.5 72.7 81.5 83.6 68.1
Estonia 88.2 100.0 95.4 95.4 86.6 100.0 95.2 95.2
Finland 100.0 100.0 95.9 95.9 100.0 100.0 96.2 96.2
France 87.9 88.4 87.8 77.6 87.3 87.8 88.1 77.3
Georgia 99.5 99.5 95.8 95.3 99.5 99.5 95.8 95.3
Hungary 94.8 97.9 94.5 92.5 94.9 97.7 95.0 92.8
Iceland 89.7 89.7 75.5 67.7 89.7 89.7 75.5 67.7
Israel 85.3 87.3 84.9 74.2 84.9 86.4 84.9 73.4
Italy 91.7 99.0 93.5 92.5 92.8 99.1 93.8 93.0
Japan 92.4 99.5 99.0 98.5 92.5 99.5 99.0 98.5
Kazakhstan 99.7 100.0 99.7 99.7 100.0 100.0 99.8 99.8
Korea 70.5 81.5 92.2 75.1 69.9 82.5 91.9 75.8
Latvia 79.7 91.2 87.6 79.9 77.1 91.2 87.9 80.2
Lithuania 100.0 100.0 97.4 97.4 100.0 100.0 97.4 97.4

480
TALIS 2018 TECHNICAL REPORT © OECD 2019
Participating country/economy
Unweighted Weighted
Before replacement
After replacement
Teachers in participating
schools
Overall teacher
participation
Before replacement
After replacement
Teachers in participating
schools
Overall teacher
participation
Malta 94.8 94.8 86.5 82.0 92.5 92.5 86.5 80.0
Mexico 90.5 96.5 93.9 90.6 90.4 96.3 94.3 90.8
Netherlands 52.7 79.5 80.5 63.9 56.7 79.5 80.9 64.3
New Zealand 63.4 79.3 79.0 62.6 62.6 79.3 79.6 63.2
Norway 77.0 92.5 82.7 76.5 77.4 92.6 83.2 77.0
Portugal 97.5 100.0 91.9 91.9 97.9 100.0 92.7 92.7
Romania 100.0 100.0 98.3 98.3 100.0 100.0 98.3 98.3
Russian Federation
99.1 100.0 99.8 99.8 98.7 100.0 99.9 99.9
Saudi Arabia 89.9 89.9 85.4 76.8 89.7 89.7 86.0 77.1
Shanghai (China) 100.0 100.0 99.5 99.5 100.0 100.0 99.5 99.5
Singapore 98.2 100.0 99.2 99.2 96.9 100.0 99.1 99.1
Slovak Republic 82.4 88.4 95.0 84.0 82.4 88.9 95.4 84.7
Slovenia 82.7 88.0 91.4 80.5 82.2 88.0 91.5 80.5
South Africa 92.3 92.9 89.7 83.3 92.1 92.4 89.1 82.3
Spain 99.5 100.0 94.6 94.6 99.7 100.0 93.2 93.2
Sweden 90.1 93.8 81.0 76.0 89.1 93.9 81.3 76.3
Chinese Taipei 99.0 99.0 97.2 96.2 98.9 98.9 97.2 96.2
Turkey 99.0 99.0 98.2 97.2 99.0 99.0 98.5 97.5
United Arab Emirates
100.0 100.0 96.0 96.0 100.0 100.0 95.7 95.7
United States 58.4 77.1 89.1 68.7 60.1 76.8 89.6 68.8
Viet Nam 100.0 100.0 96.3 96.3 100.0 100.0 96.1 96.1
1. See notes 1 and 2, Table A G.3.
Table A G.5. Unweighted and weighted participation rates (%) for ISCED level 3 schools
and principals
Participating country/
economy
Unweighted Weighted
Before replacement After replacement Before replacement After replacement
Alberta (Canada) 51.8 59.6 47.0 57.8
Brazil 88.0 97.4 91.4 97.5
Croatia 96.7 96.7 96.6 96.6
Denmark 57.6 69.1 58.3 70.8
Portugal 98.0 99.5 97.2 99.4
Slovenia 69.6 69.6 69.6 69.6
Sweden 91.4 94.1 91.6 93.8
Chinese Taipei 100.0 100.0 100.0 100.0
Turkey 98.0 98.0 97.4 97.4
United Arab Emirates 89.7 89.7 89.7 89.7
Viet Nam 100.0 100.0 100.0 100.0

481
TALIS 2018 TECHNICAL REPORT © OECD 2019
Table A G.6. Unweighted and weighted participation rates (%) for ISCED level 3 teachers
Participating country/economy
Unweighted Weighted
Before replacement
After replacement
Teachers in participating
schools
Overall teacher
participation
Before replacement
After replacement
Teachers in participating
schools
Overall teacher
participation
Alberta (Canada) 49.7 58.0 79.6 46.2 51.6 56.6 80.2 45.4
Brazil 87.0 96.9 94.2 91.3 92.2 97.4 94.5 92.0
Croatia 98.0 98.0 89.5 87.7 97.9 97.9 89.7 87.9
Denmark 65.5 79.9 85.7 68.5 72.2 85.6 84.7 72.4
Portugal 98.0 99.5 91.2 90.7 99.0 99.7 91.3 91.0
Slovenia 80.4 80.4 87.8 70.6 80.4 80.4 87.7 70.5
Sweden 94.6 97.8 80.8 79.1 95.3 97.8 81.7 79.9
Chinese Taipei 98.0 98.0 95.9 94.0 98.1 98.1 95.8 94.1
Turkey 100.0 100.0 97.7 97.7 100.0 100.0 98.0 98.0
United Arab Emirates
99.3 99.3 95.7 95.0 99.0 99.0 95.4 94.5
Viet Nam 100.0 100.0 97.5 97.5 100.0 100.0 97.7 97.7
Table A G.7. Unweighted and weighted participation rates (%) for TALIS-PISA link schools
and principals
Participating country/
economy
Unweighted Weighted
Before replacement After replacement Before replacement After replacement
Australia 66.9 88.5 67.7 88.2
Ciudad Autónoma de Buenos Aires (Argentina)
88.9 95.1 88.9 95.1
Colombia 91.4 94.4 85.5 90.4
Czech Republic 89.6 89.6 90.0 90.0
Denmark 52.7 55.3 52.0 57.8
Georgia 86.1 86.1 85.5 85.5
Malta 94.0 94.0 94.0 94.0
Turkey 96.6 96.6 97.8 97.8
Viet Nam 100.0 100.0 100.0 100.0
Table A G.8. Unweighted and weighted participation rates (%) for TALIS-PISA link
teachers
Participating country/economy
Unweighted Weighted
Before replacement
After replacement
Teachers in participating
schools
Overall teacher
participation
Before replacement
After replacement
Teachers in participating
schools
Overall teacher
participation
Australia 66.9 88.5 92.5 81.9 65.6 88.8 93.4 82.9
Ciudad Autónoma de Buenos Aires (Argentina)
87.7 90.1 85.1 76.7 86.5 88.8 84.4 74.9
Colombia 91.4 95.1 94.6 89.9 90.4 93.9 95.1 89.3
Czech Republic 100.0 100.0 93.2 93.2 100.0 100.0 94.8 94.8
Denmark 63.3 66.7 82.4 54.9 65.8 70.0 85.9 60.2
Georgia 91.7 91.7 94.0 86.2 93.1 93.1 94.3 87.8
Malta 88.0 88.0 88.6 78.0 86.7 86.7 88.6 76.8
Turkey 96.6 96.6 99.4 96.0 97.9 97.9 99.6 97.5
Viet Nam 99.1 99.1 98.5 97.7 99.3 99.3 98.4 97.7

482
TALIS 2018 TECHNICAL REPORT © OECD 2019
Annex H. Questionnaires
You can find the TALIS 2018 questionnaires on line at:
http://www.oecd.org/education/school/talis2018questionnaires.htm

483
TALIS 2018 TECHNICAL REPORT © OECD 2019
Annex I. Construction and validation of scales and indices
Table A I.1. Descriptive statistics of the scaled scores (based on all populations, unweighted)
Mean Standard deviation Lowest score Highest score
Principal scales
T3PACAD 12.12 2.04 0.23 17.06
T3PCOM 10.80 2.15 3.17 16.92
T3PDELI 6.97 2.02 2.28 20.32
T3PDIVB 13.11 1.95 3.64 14.83
T3PJOBSA 13.45 1.95 2.10 17.41
T3PJSENV 13.54 1.98 0.89 16.92
T3PJSPRO 12.04 1.88 2.32 12.04
T3PLACSN 9.38 2.09 4.04 17.36
T3PLEADP 11.99 2.05 0.59 18.11
T3PLEADS 11.23 2.05 3.88 18.36
T3PORGIN 12.45 2.07 0.86 17.66
T3PWLOAD 9.87 1.96 2.50 16.11
Teacher scales
T3CLAIN 12.33 1.99 1.48 16.85
T3CLASM 10.92 1.96 -0.24 15.48
T3COGAC 9.95 2.08 1.71 17.18
T3COLES 9.20 2.16 3.09 17.97
T3COOP 9.97 2.10 2.23 17.89
T3DISC 8.73 2.00 4.21 15.67
T3DIVP 10.68 2.06 4.08 16.55
T3EFFPD 12.41 2.36 5.52 18.72
T3EXCH 10.98 2.04 2.09 16.33
T3JOBSA 12.11 2.03 3.27 16.55
T3JSENV 12.02 2.07 3.11 16.21
T3JSPRO 11.48 2.01 4.10 15.37
T3PDBAR 9.24 2.03 2.57 17.99
T3PDIV 9.93 2.03 4.17 15.04
T3PDPED 9.47 2.01 1.57 16.31
T3PERUT 10.78 1.97 3.60 16.43
T3SATAT 12.73 2.03 2.08 16.08
T3SECLS 12.68 1.99 2.86 17.47
T3SEENG 11.97 1.97 1.53 18.38
T3SEFE 11.23 1.99 2.58 17.87
T3SEINS 12.63 2.01 1.87 18.60

484
TALIS 2018 TECHNICAL REPORT © OECD 2019
Mean Standard deviation Lowest score Highest score
T3SELF 12.73 2.01 0.67 19.45
T3SOCUT 12.23 1.94 1.77 16.13
T3STAKE 11.24 2.08 2.90 16.52
T3STBEH 9.15 1.98 4.08 16.06
T3STUD 13.32 2.07 1.74 17.38
T3TEAM 11.58 2.08 4.94 15.03
T3TPRA 11.43 2.03 -0.60 18.25
T3VALP 8.62 2.05 2.49 17.26
T3WELS 9.36 2.03 4.23 16.54
T3WLOAD 9.20 2.06 3.40 16.38
Note: Participating countries/economies with untrustworthy scale scores were exclude from these averages.
Source: OECD, TALIS 2018 database.

485
TALIS 2018 TECHNICAL REPORT © OECD 2019
Table A I.2. Country-specific invariance levels across ISCED levels within countries that participated in more than one ISCED level:
Principal scales
Participating country/economy
T3PACAD T3PCOM T3PDELI T3PDIVB T3PLACSN T3PLEADP T3PLEADS T3PORGIN T3PWLOAD T3PJOBSA T3PJSENV T3PJSPRO
Alberta (Canada)1 Metric Scalar Scalar Scalar Scalar Scalar Scalar Scalar Scalar Scalar Scalar Scalar
Flemish Community (Belgium)1
Scalar Scalar Metric Scalar Scalar Metric Scalar Scalar Scalar Scalar Scalar Scalar
Brazil2 Scalar Scalar Scalar Scalar Scalar Scalar Scalar Scalar Scalar Scalar Scalar Scalar
Ciudad Autónoma de Buenos Aires
(Argentina)2
Scalar Scalar Metric Scalar Metric Metric Scalar Scalar Metric Configural Scalar Configural
Croatia2 Scalar Metric Metric Scalar Metric Scalar Scalar Scalar Scalar Scalar Scalar Scalar
Denmark Scalar - Metric Scalar Scalar Metric Scalar Scalar Scalar Scalar Scalar Scalar
England
(United Kingdom)1
Scalar Scalar Metric Scalar Metric Scalar Scalar Scalar Scalar Scalar Scalar Scalar
France1 Metric Metric Configural Scalar Scalar Metric Metric Scalar Metric Metric Metric Scalar
Japan1 Scalar Metric Metric Scalar Scalar Metric Scalar Scalar Scalar Scalar Scalar Scalar
Korea1 Scalar Scalar Metric Scalar Scalar Scalar Scalar Scalar Scalar Metric Metric Scalar
Portugal2 Scalar Metric Scalar Scalar Scalar Scalar Scalar Scalar Scalar Scalar Scalar Scalar
Slovenia2 Scalar Metric Metric Scalar Scalar Metric Scalar Scalar Scalar Scalar Scalar Scalar
Spain1 Scalar Metric Metric Scalar Metric Metric Scalar Scalar Scalar Metric Metric Scalar
Sweden Scalar - Metric Scalar Scalar Metric Scalar Scalar - Scalar Scalar* Scalar
Chinese Taipei Scalar Metric Configural Scalar Metric Metric Scalar Scalar Scalar Scalar Scalar Scalar
Turkey Scalar Metric Scalar Scalar Scalar Scalar Scalar Scalar Scalar Scalar Scalar Scalar
United Arab Emirates Scalar Scalar Configural Scalar Scalar Scalar Scalar Scalar Scalar Scalar Scalar Scalar
Viet Nam Scalar Metric Configural Scalar Scalar Scalar Scalar Scalar Scalar Scalar Scalar Scalar
1. Country/economy participated in ISCED levels 1 and 2. 2. Country/economy participated in ISCED levels 2 and 3.
All participating countries/economies that do not have a note participated in ISCED levels 1, 2 and 3.
* The ISCED 3 population for Sweden was not included in the measurement invariance testing for this scale. Note: A dash (-) indicates that the country/economy was excluded from the scale due to model non-convergence in the evaluation steps.
Source: OECD, TALIS 2018 database.

486
TALIS 2018 TECHNICAL REPORT © OECD 2019
Table A I.3. Country-specific invariance levels across ISCED levels within countries that participated in more than one ISCED level:
Teacher scales
Participating countries/economies
T3DISC T3DIVP T3EFFPD T3PDBAR T3PDIV T3PDPED T3PERUT T3SECLS T3SATAT T3SOCUT T3STAKE T3STBEH T3STUD T3COOP T3EXCH T3COLES
Alberta (Canada)1 Scalar Scalar Scalar Scalar Scalar Scalar Scalar Scalar Scalar Scalar Scalar Scalar Scalar Metric Scalar Metric
Flemish Community (Belgium) 1
Metric Scalar Scalar Metric Scalar Scalar Scalar Scalar Metric Scalar Metric Scalar Metric Metric Scalar Metric
Brazil2 Scalar Scalar Scalar Scalar Scalar Scalar Scalar Scalar Scalar Scalar Scalar Scalar Scalar Scalar Scalar Scalar
Ciudad Autónoma de Buenos Aires (Argentina)2
Scalar Scalar Scalar Metric Scalar Scalar Scalar Scalar Scalar Scalar Scalar Scalar Scalar Scalar Scalar Scalar
Croatia2 Scalar Scalar Scalar Scalar Scalar Scalar Scalar Scalar Scalar Scalar Scalar Scalar Scalar Metric Scalar Metric
Denmark Metric Scalar Scalar Metric Metric Metric Scalar Metric Metric Metric Metric Scalar Metric Metric Metric Metric
England (United Kingdom)1
Scalar Scalar Scalar Scalar Metric Scalar Scalar Scalar Scalar Scalar Scalar Metric Scalar Metric Scalar Metric
France1 Metric Scalar Scalar Metric Scalar Scalar Scalar Scalar Metric Scalar Metric Metric Metric Metric Scalar Metric
Japan1 Metric Scalar Scalar Scalar Scalar Scalar Scalar Scalar Scalar Scalar Scalar Scalar Scalar Metric Scalar Metric
Korea1 Metric Scalar Scalar Scalar Scalar Scalar Scalar Scalar Metric Scalar Scalar Metric Scalar Metric Metric Metric
Portugal2 Scalar Scalar Scalar Scalar Scalar Scalar Scalar Scalar Scalar Scalar Scalar Metric Scalar Scalar Scalar Scalar
Slovenia2 Scalar Scalar Scalar Metric Scalar Metric Metric Scalar Scalar Scalar Metric Metric Scalar Metric Scalar Metric
Spain1 Metric Scalar Scalar Metric Scalar Scalar Scalar Scalar Metric Metric Scalar Metric Scalar Metric Metric Scalar
Sweden Scalar Scalar Scalar Scalar Scalar Scalar Scalar Scalar Scalar Metric Metric Scalar Metric Metric Scalar Metric
Chinese Taipei Metric Scalar Scalar Scalar Scalar Scalar Scalar Scalar Scalar Scalar Metric Scalar Scalar Scalar Scalar Scalar
Turkey Scalar Scalar Scalar Scalar Scalar Scalar Scalar Scalar Scalar Scalar Scalar Scalar Scalar Metric Metric Scalar
United Arab Emirates
Scalar Scalar Scalar Scalar Scalar Scalar Scalar Scalar Scalar Scalar Scalar Scalar Scalar Scalar Scalar Scalar
Viet Nam Scalar Scalar Scalar Scalar Metric Scalar Scalar Scalar Metric Scalar Scalar Metric Scalar Metric Scalar Metric
1. Participating country/economy participated in ISCED levels 1 and 2.
2. Participating country/economy participated in ISCED levels 2 and 3.
All participating countries/economies that do not have a note participated in ISCED levels 1, 2 and 3.
Source: OECD, TALIS 2018 database.

487
TALIS 2018 TECHNICAL REPORT © OECD 2019
Table A I.4. Country-specific invariance levels across ISCED levels within countries that participated in more than one ISCED level
(teacher scales continued)
Participating countries/economies
T3TEAM T3VALP T3WELS T3WLOAD T3SELF T3SEENG T3SEFE T3SEINS T3TPRA T3CLAIN T3CLASM T3COGAC T3JOBSA T3JSENV T3JSPRO
Alberta (Canada)1 Scalar Metric Scalar Scalar Scalar Scalar Scalar Scalar Scalar Scalar Scalar Scalar Scalar Scalar Scalar
Flemish Community (Belgium) 1
Scalar Scalar Scalar Scalar Scalar Scalar Scalar Scalar Metric Metric Scalar Metric Scalar Scalar Scalar
Brazil2 Scalar Scalar Scalar Scalar Scalar Scalar Scalar Scalar Scalar Scalar Scalar Scalar Scalar Scalar Scalar
Ciudad Autónoma de Buenos Aires (Argentina)2
Scalar Scalar Scalar Metric Metric Metric Scalar Scalar Metric Metric Metric Metric Scalar Scalar Scalar
Croatia2 Scalar Scalar Scalar Scalar Scalar Scalar Scalar Scalar Scalar Scalar Scalar Scalar Scalar Scalar Scalar
Denmark Scalar Scalar Scalar Metric Metric Metric Metric Metric Metric Metric Metric Metric Scalar Scalar Scalar
England (United Kingdom)1
Scalar Scalar Scalar Metric Metric Metric Metric Scalar Metric Scalar Metric Metric Scalar Scalar Scalar
France1 Scalar Scalar Scalar Metric Metric Metric Scalar Metric Metric Scalar Metric Metric Scalar Scalar Scalar
Japan1 Scalar Scalar Scalar Scalar Scalar Scalar Scalar Scalar Metric Metric Metric Metric Scalar Scalar Scalar
Korea1 Scalar Scalar Scalar Scalar Scalar Scalar Scalar Scalar Metric Metric Metric Metric Scalar Scalar Scalar
Portugal2 Scalar Scalar Scalar Scalar Scalar Scalar Scalar Scalar Metric Scalar Metric Scalar Scalar Scalar Scalar
Slovenia2 Scalar Scalar Scalar Metric Scalar Scalar Scalar Scalar Metric Metric Scalar Scalar Scalar Scalar Scalar
Spain1 Scalar Scalar Scalar Scalar Metric Metric Scalar Scalar Metric Scalar Scalar Metric Scalar Scalar Scalar
Sweden Scalar Scalar Scalar Metric Metric Metric Metric Scalar Metric Metric Scalar Metric Scalar Scalar Scalar
Chinese Taipei Scalar Scalar Scalar Metric Scalar Scalar Scalar Scalar Metric Scalar Scalar Metric Scalar Scalar Scalar
Turkey Scalar Scalar Scalar Scalar Scalar Scalar Scalar Scalar Scalar Scalar Scalar Scalar Scalar Scalar Scalar
United Arab Emirates Scalar Scalar Scalar Scalar Scalar Scalar Scalar Scalar Scalar Scalar Scalar Scalar Scalar Scalar Scalar
Viet Nam Scalar Scalar Scalar Scalar Metric Scalar Metric Scalar Metric Scalar Scalar Metric Scalar Scalar Scalar
1. Participating country/economy participated in ISCED levels 1 and 2.
2. Participating country/economy participated in ISCED levels 2 and 3.
All participating countries/economies that do not have a note participated in ISCED levels 1, 2 and 3.
Source: OECD, TALIS 2018 database.

488
TALIS 2018 TECHNICAL REPORT © OECD 2019
Annex J. Table production and verification, analyses
Recoded variables that are part of the TALIS 2018 public data set
Variable name STRATIO
Description Student-teacher ratio
Procedure Multivariable recode
Missing values Missing if at least one variable is missing.
Source What is the current school enrolment, i.e. the number of students of all grades/ages in this school?
TC3G16
Recoding TC3G16/TC3G13A
For each type of position listed below, please indicate the number of staff (headcount) currently working in this school.
TC3G13A
Variable name TPRATIO
Description Teacher-pedagogical support personnel ratio
Procedure Multivariable recode
Missing values Missing if at least one variable is missing.
Source For each type of position listed below, please indicate the number of staff (headcount) currently working in this school.
TC3G13A, TC3G13B
Recoding TC3G13A/TC3G13B
Please note: if TC3G13B=0, TPRATIO is set to equal TC3G13A.
Variable name TARATIO
Description Teacher-administrative or management personnel ratio
Procedure Multivariable recode
Missing values Missing if at least one variable is missing.
Source For each type of position listed below, please indicate the number of staff (headcount) currently working in this school.
TC3G13A, TC3G13C, TC3G13D Recoding TC3G13A/(TC3G13C+TC3G13D)
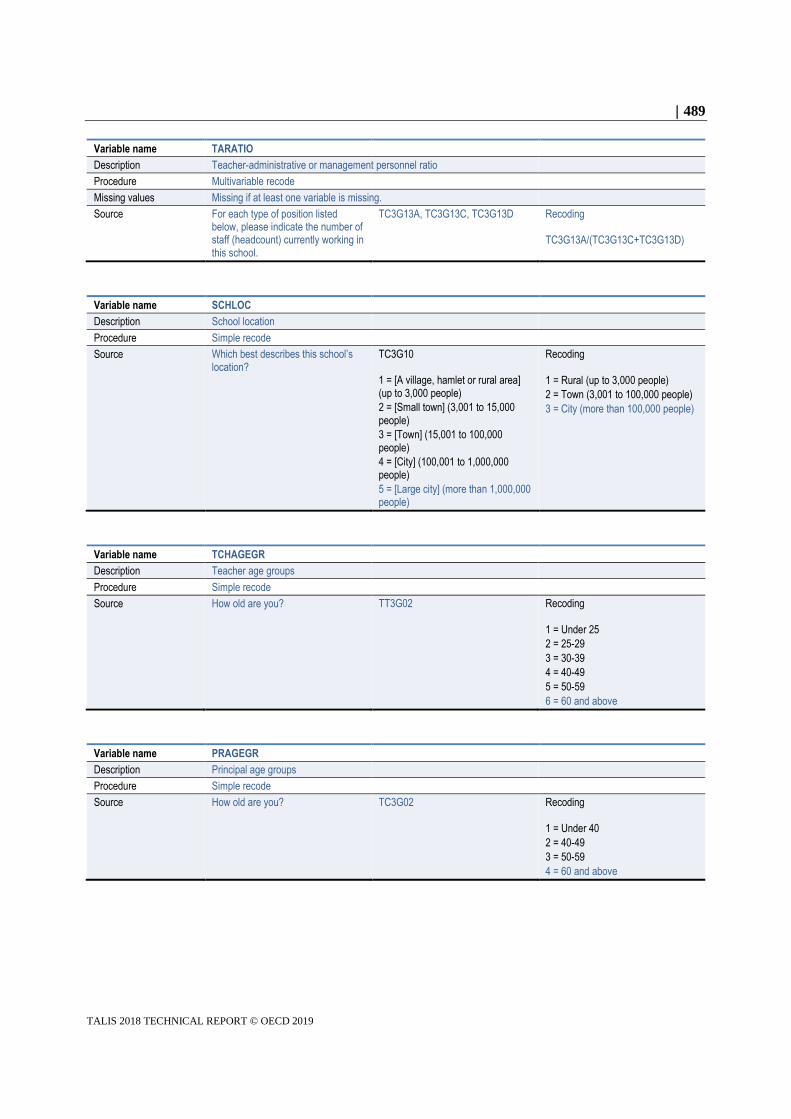
489
TALIS 2018 TECHNICAL REPORT © OECD 2019
Variable name TARATIO
Description Teacher-administrative or management personnel ratio
Procedure Multivariable recode
Missing values Missing if at least one variable is missing.
Source For each type of position listed below, please indicate the number of staff (headcount) currently working in this school.
TC3G13A, TC3G13C, TC3G13D Recoding TC3G13A/(TC3G13C+TC3G13D)
Variable name SCHLOC
Description School location
Procedure Simple recode
Source Which best describes this school’s location?
TC3G10 1 = [A village, hamlet or rural area] (up to 3,000 people)
2 = [Small town] (3,001 to 15,000 people)
3 = [Town] (15,001 to 100,000 people)
4 = [City] (100,001 to 1,000,000 people)
5 = [Large city] (more than 1,000,000 people)
Recoding 1 = Rural (up to 3,000 people)
2 = Town (3,001 to 100,000 people)
3 = City (more than 100,000 people)
Variable name TCHAGEGR
Description Teacher age groups
Procedure Simple recode
Source How old are you? TT3G02
Recoding 1 = Under 25
2 = 25-29
3 = 30-39
4 = 40-49
5 = 50-59
6 = 60 and above
Variable name PRAGEGR
Description Principal age groups
Procedure Simple recode
Source How old are you? TC3G02
Recoding 1 = Under 40
2 = 40-49
3 = 50-59
4 = 60 and above

490
TALIS 2018 TECHNICAL REPORT © OECD 2019
Variable name NENRSTUD
Description Number of enrolled students
Procedure Simple recode
Source What is the current school enrolment, i.e. the number of students of all grades/ages in this school?
TC3G16
Recoding 1 = Under 250
2 = 250-499
3 = 500-749
4 = 750-999
5 = 1,000 and above
Recoded variables that are not part of the TALIS 2018 public data set
Variable name TT3G03_r1
Description Highest level of formal education
Procedure Simple recode
Source What is the highest level of formal education you have completed?
TT3G03 1 = Below <ISCED 2011 Level 3> 2 = <ISCED 2011 Level 3> 3 = <ISCED 2011 Level 4> 4 = <ISCED 2011 Level 5> 5 = <ISCED 2011 Level 6> 6 = <ISCED 2011 Level 7>
7 = <ISCED 2011 Level 8>1
Recoding 1 = Below ISCED Level 5 2 = ISCED Level 5 3 = ISCED Levels 6 and 7 4 = ISCED Level 8
Variable name TT2G10_r1 (TALIS 2013)
Description Highest level of formal education
Procedure Simple recode
Source What is the highest level of formal education you have completed?
TT2G10 (TALIS 2013) 1 = <Below ISCED Level 5> 2 = <ISCED Level 5B> 3 = <ISCED Level 5A> 4 = <ISCED Level 6>1
Recoding 1 = Below ISCED Level 5 2 = ISCED Level 5 3 = ISCED Levels 6 and 7 4 = ISCED Level 8
Variable name BTG07_r1 (TALIS 2008)
Description Highest level of formal education
Procedure Simple recode
Source What is the highest level of formal education that you have completed?
BTG07 (TALIS 2008) 1 = <Below ISCED Level 5> 2 = <ISCED Level 5B> 3 = <ISCED Level 5A Bachelor’s degree> 4 = <ISCED Level 5A Master’s degree> 5 = <ISCED Level 6>1
Recoding 1 = Below ISCED Level 5 2 = ISCED Level 5 3 = ISCED Levels 6 and 7 4 = ISCED Level 8

491
TALIS 2018 TECHNICAL REPORT © OECD 2019
Variable name TC3G03_r1
Description Highest level of formal education
Procedure Simple recode
Source What is the highest level of formal education you have completed?
TC3G03 1 = Below <ISCED 2011 Level 3> 2 = <ISCED 2011 Level 3> 3 = <ISCED 2011 Level 4> 4 = <ISCED 2011 Level 5> 5 = <ISCED 2011 Level 6> 6 = <ISCED 2011 Level 7> 7 = <ISCED 2011 Level 8>1
Recoding 1 = Below ISCED Level 5 2 = ISCED Level 5 3 = ISCED Levels 6 and 7 4 = ISCED Level 8
Variable name TC2G03_r1 (TALIS 2013)
Description Highest level of formal education
Procedure Simple recode
Source What is the highest level of formal education you have completed?
TC2G03 (TALIS 2013) 1 = <Below ISCED Level 5> 2 = <ISCED Level 5B> 3 = <ISCED Level 5A> 4 = <ISCED Level 6>1
Recoding 1 = Below ISCED Level 5 2 = ISCED Level 5 3 = ISCED Levels 6 and 7 4 = ISCED Level 8
Variable name BCG04_r1 (TALIS 2008)
Description Highest level of formal education
Procedure Simple recode
Source What is the highest level of formal education that you have completed?
BCG04 (TALIS 2008) 1 = <Below ISCED Level 5> 2 = <ISCED Level 5B> 3 = <ISCED Level 5A Bachelor’s degree> 4 = <ISCED Level 5A Master’s degree> 5 = <ISCED Level 6>1
Recoding 1 = Below ISCED Level 5 2 = ISCED Level 5 3 = ISCED Levels 6 and 7 4 = ISCED Level 8
Variable name TT3G19A2B2_mulvar_r1
Description No induction activities (formal and informal) at this school
Procedure Multivariable recode
Missing values Missing if at least one variable is missing.
Source Did you take part in any induction activities?
TT3G19A2 = I took part in a formal induction programme. Yes, at this school.
1 = Checked
2 = Not checked TT3G19B2 = I took part in informal induction activities. Yes, at this school.
1 = Checked
2 = Not checked
Recoding 1 = No induction at this school
(if TT3G19A2 = 2 AND
TT3G19B2 = 2) 0 = Other

492
TALIS 2018 TECHNICAL REPORT © OECD 2019
Variable name TT3G19A1B1_mulvar_r1
Description No induction during my first employment
Procedure Multivariable recode
Missing values Missing if at least one variable is missing.
Source Did you take part in any induction activities?
TT3G19A1 = I took part in a formal induction programme. Yes, during my first employment.
1 = Checked
2 = Not checked TT3G19B1 = I took part in informal induction activities. Yes, during my first employment.
1 = Checked
2 = Not checked
Recoding 1 = No induction during my first employment (if TT3G19A1 = 2 AND TT3G19B1 = 2) 0 = Other
Variable name TT3G22AJ_mulvar_r1
Description Participation in professional development activities
Procedure Multivariable recode
Missing values Missing if all variables are missing.
Source During the last 12 months, did you participate in any of the following professional development activities?
TT3G22A, TT3G22B, TT3G22C, ..., TT3G22J 1 = Yes 2 = No
Recoding 1 = Yes 0 = No
Variable name TT3G56AE_mulvar_r1
Description Teachers who have been abroad only as part of their teacher education
Procedure Multivariable recode
Missing values Missing if at least one variable is missing. Not administered does not count as missing; it counts only if all variables are not administered.
Source Have you ever been abroad for professional purposes in your career as a teacher or during your teacher <education or training>?
TT3G56A, TT3G56B, TT3G56C, TT3G56D and TT3G56E
1 = Yes
2 = No
Recoding
1 = Yes (if TT3G56A = 1 AND TT3G56B = 2 AND TT3G56C = 2 AND TT3G56D = 2 AND
TT3G56E = 2)
0 = No
Variable name TC3G21_mulvar_r1
Description Administrative tasks and meetings and leadership tasks and meetings
Procedure Multivariable recode
Missing values Missing if at least one variable is missing.
Source On average throughout the school year, what percentage of time in your role as a principal do you spend on the following tasks in this school?
TC3G21A = _____ % administrative tasks and meetings TC3G21B = _____% leadership tasks and meetings
Recoding TC3G21A+TC3G21B

493
TALIS 2018 TECHNICAL REPORT © OECD 2019
Variable name TC3G07AJ_mulvar_r1
Description Participation in professional development activities
Procedure Multivariable recode
Missing values Missing if all variables are missing.
Source During the last 12 months, did you participate in any of the following professional development activities aimed at you as a principal?
TC3G07A, TC3G07B, TC3G07C, ..., and TC3G07J 1 = Yes 2 = No
Recoding 1 = Yes 0 = No
Variable name TT3G47TC3G38_mulvar_r1
Description Indicator of data records with no logically not applicable codes for either TT3G47 or TC3G38
Procedure Multivariable recode
Missing values Records only included if TT3G47 (teacher data) and TC3G38 (principal data) have data records with no logically not applicable cases.
Source Does this school include students of more than one cultural or ethnic background?
TT3G47 and TC3G38 1 = Yes 2 = No 6 = Not applicable 7 = Not reached 8 = Not administered 9 = Omitted or invalid
Recoding 0 = Record not included 1 = Record included
Note
1 ISCED code 1997 level 5 was split into level 5 (short tertiary), 6 (tertiary, bachelor’s), 7 (tertiary,
master’s) in ISCED code 2011. Therefore, ISCED code 1997 level 6 became ISCED code 2011
level 8 (doctoral or equivalent): http://uis.unesco.org/sites/default/files/documents/international-
standard-classification-of-education-isced-2011-en.pdf (UNESCO-UIS, 2012[1]).

494
TALIS 2018 TECHNICAL REPORT © OECD 2019
References
UNESCO-UIS (2012), International Standard Classification of Education (ISCED) 2011,
UNESCO Institute for Statistics, Montreal,
http://uis.unesco.org/sites/default/files/documents/international-standard-classification-of-
education-isced-2011-en.pdf.
[1]

TALIS 2018 Technical Report
The Teaching and Learning International Survey (TALIS) asks teachers and school leaders about working conditions and learning environments at their schools to help countries face diverse challenges. This technical report details the steps, procedures, methodologies, standards and rules that the TALIS 2018 cycle used to collect high-quality data. The primary purpose of the report is to support readers of the international and subsequent thematic reports, as well as users of the public international database when interpreting results, contextualising information and using the data.
For more information, please contact: [email protected].
Further information about TALIS project can be found at: http://www.oecd.org/education/talis/